the Creative Commons Attribution 4.0 License.
the Creative Commons Attribution 4.0 License.
 | 09 Aug 2023
China Building Rooftop Area: the first multi-annual (2016–2021) and high-resolution (2.5 m) building rooftop area dataset in China derived with super-resolution segmentation from Sentinel-2 imagery
Zeping Liu
Lin Feng
Siqing Lyu
Large-scale and multi-annual maps of building rooftop area (BRA) are crucial for addressing policy decisions and sustainable development. In addition, as a fine-grained indicator of human activities, BRA could contribute to urban planning and energy modeling to provide benefits to human well-being. However, it is still challenging to produce a large-scale BRA due to the rather tiny sizes of individual buildings. From the viewpoint of classification methods, conventional approaches utilize high-resolution aerial images (metric or submetric resolution) to map BRA; unfortunately, high-resolution imagery is both infrequently captured and expensive to purchase, making the BRA mapping costly and inadequate over a consistent spatiotemporal scale. From the viewpoint of learning strategies, there is a nontrivial gap that persists between the limited training references and the applications over geospatial variations. Despite the difficulties, existing large-scale BRA datasets, such as those from Microsoft or Google, do not include China, and hence there are no full-coverage maps of BRA in China yet. In this paper, we first propose a deep-learning method, named the Spatio-Temporal aware Super-Resolution Segmentation framework (STSR-Seg), to achieve robust super-resolution BRA extraction from relatively low-resolution imagery over a large geographic space. Then, we produce the multi-annual China Building Rooftop Area (CBRA) dataset with 2.5 m resolution from 2016–2021 Sentinel-2 images. CBRA is the first full-coverage and multi-annual BRA dataset in China. With the designed training-sample-generation algorithms and the spatiotemporally aware learning strategies, CBRA achieves good performance with a F1 score of 62.55 % (+10.61 % compared with the previous BRA data in China) based on 250 000 testing samples in urban areas and a recall of 78.94 % based on 30 000 testing samples in rural areas. Temporal analysis shows good performance consistency over years and good agreement with other multi-annual impervious surface area datasets. STSR-Seg will enable low-cost, dynamic, and large-scale BRA mapping (https://github.com/zpl99/STSR-Seg, last access: 12 July 2023). CBRA will foster the development of BRA mapping and therefore provide basic data for sustainable research (Liu et al., 2023; https://doi.org/10.5281/zenodo.7500612).
- Article
(29462 KB) - Full-text XML
-
Supplement
(5157 KB) - BibTeX
- EndNote


Building rooftop area has been an essential indicator of human activity (W. Huang et al., 2021), sustainable urbanization (Appolloni et al., 2021; Burke et al., 2021), building energy modeling (Byrne et al., 2015; Chen et al., 2022), urban planning (Nadal et al., 2017), and quick response to natural disasters (Chen et al., 2022; Ge et al., 2023) in recent years. Such a dataset has thus become pivotal in a range of policy decisions by the government, such as arranging the correlation between economic development and demographic growth and how and where to implement public service. However, many regions might lack the kind of information to systematically assess this development in both large geographical regions and long time periods (Burke et al., 2021). In the meantime, satellite remote sensing has been the prominent measure for urban mapping of our earth (X. X. Zhu et al., 2022), especially in developing regions where survey data or human-labeled data are rather difficult to obtain (Ayush et al., 2021b). Compared to the traditional survey-based methods (Kuthanazhi et al., 2016; Jones and Hobbs, 2021), remote sensing could observe large areas at a potentially low cost, thus allowing tracking of the building dynamic of developing regions.
Unlike other datasets containing building information from satellite imagery, such as impervious surface area (ISA) or human settlement footprint (HSF), building rooftop area (BRA) requires a higher spatial resolution for good identification due to the tiny sizes of objects of interest (e.g., residential houses). Typically, ISA (X. Zhang et al., 2022; Huang et al., 2022) and HSF (Marconcini et al., 2020; Qiu et al., 2020) are derived from the imagery with a spatial resolution of decametric level (e.g., 30 or 10 m), while BRA (Liu et al., 2022; Z. Zhang et al., 2022) utilizes high-resolution aerial imagery with a resolution of metric level (e.g., 1 m). However, high-resolution aerial imagery is costly and potentially not publicly available. For example, the price of WorldView-2 is USD 23 per square kilometer (HR Imagery Ordering, 2022). The high data expenditure makes large-scale BRA possible only for large companies, e.g., Google and Microsoft, which have implemented the continental-scale BRA of Africa (Sirko et al., 2021) and global BRA (GlobalMLBuildingFootprints, 2022) using Google Maps and Bing Maps, respectively. To overcome the cost barrier, international efforts utilize open-access Google Earth satellite (GES) images (Liang et al., 2018). Most recently, Z. Zhang et al. (2022) utilized GES imagery and obtained 90-cities-BRA for China at a resolution of 1 m. However, due to the uneven distribution of GES image patches and inconsistent acquisition times, the existing BRA has geospatial inconsistency, limiting its generalization to questions of broad social importance, particularly in large geographic and timescale mapping.
China is a rapidly developing country, with 4.3 % urbanization growth in the past 5 years. According to the National Bureau of Statistics of China, the urbanization rate of China reached 64.72 % in 2021, but the rural population is still large, accounting for 509.79 million people. The “dual-track” society structure indicates that human activity occurs variously in both developed and developing regions of China (Guan et al., 2018). The existing large-scale BRA dataset provided by Microsoft and Google does not include China, while the BRA produced by Z. Zhang et al. (2022) only covers 90 cities in China. In addition, to the best of our knowledge, few of the existing BRAs provide multi-annual results, and such temporal information is of great significance to developing countries such as China.
To foster the development of the observation of human living space and to provide all stakeholders with free access to data to monitor building rooftop dynamics at a national scale and high spatiotemporal resolution, we introduce the China Building Rooftop Area (CBRA) dataset, which reports the pixel-level building rooftops' distribution along with their dynamics, from 2016 to 2021, on a national scale. CBRA is derived from the Sentinel-2 imagery (up to 10 m spatial resolution). To meet the spatial resolution of the BRA needs and to tackle the lack of reliable training references, we propose a deep-learning-based framework, called the Spatio-Temporal aware Super-Resolution Segmentation (STSR-Seg) framework. STSR-Seg can capture the high-resolution context from the Sentinel-2 imagery and the low-resolution land cover data, thus achieving robust spatiotemporal results of the BRA at 2.5 m resolution. With the proposed STSR-Seg, CBRA outperforms the existing BRA in the urban region of China, with overall accuracy and an F1 score of 82.85 % and 62.55 %, respectively. The main contributions are as follows.
-
The free access to CBRA is the first multi-annual (2016–2021) and 2.5 m BRA product at a national scale (e.g., China). CBRA is also the full-coverage BRA dataset in China, including both urban regions and rural regions.
-
CBRA is a spatiotemporal consistency dataset among the existing BRA datasets but generated by Sentinel-2 satellite imagery with a specific acquisition time and location.
-
The proposed STSR-Seg framework could achieve robust spatiotemporal super-resolution output, thus reducing the data expenditure of both the high-resolution imagery and training references for the large-scale BRA applications.
The remainder of this paper is arranged as follows. Section 2 reviews and analyzes the background of our methodology and the building-related datasets. Section 3 introduces the data we used for dataset generation. Section 4 describes the methodology in detail. The following Sect. 5 provides results, evaluations, and analyses of CBRA. Discussions are listed in Sect. 6. Finally, the conclusions are drawn in Sect. 7.
To provide an overview of the involved methodology and dataset, Sect. 2.1 will briefly describe the methodological background. Moreover, the existing building-related products will be reviewed in Sect. 2.2.
2.1 Methodological background
Figure 1 shows an overview of the background of the involved methods and their relations to our methodology. Specifically, we will focus on two fields of deep learning in earth observation, i.e., the super-resolution and semantic segmentation classification methods and the weakly supervised learning algorithms.
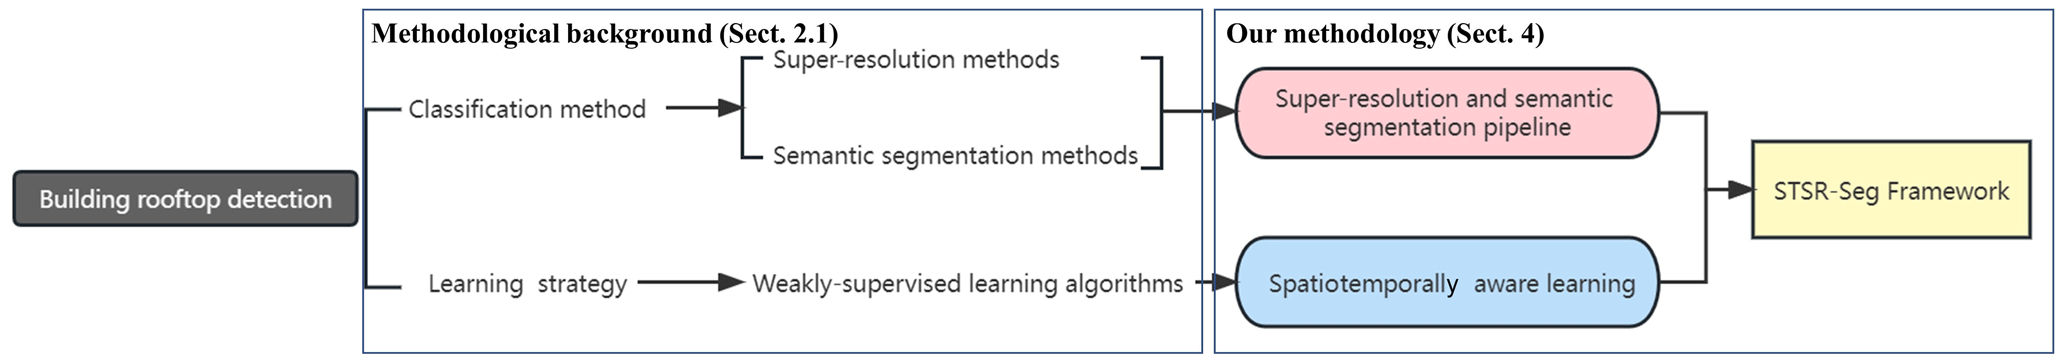
Figure 1An overview of the methodological background and its relation to our proposed methodology.
2.1.1 Super-resolution and semantic segmentation methods
The great success of deep convolutional neural networks (CNNs) in the computer vision field has already revealed a new era for earth observation (Hoeser et al., 2022), like super resolution (SR) and semantic segmentation (SS). Utilizing the SR methods could transfer the low-resolution image to high resolution, thus expanding the cheaper satellite with a coarser resolution to the application demanding high-resolution data (Shermeyer and van Etten, 2019). He et al. (2021) utilize low-resolution and high-resolution image pairs to learn the SR model and map the low-resolution image to the high resolution, while Xu et al. (2021) apply only the high-resolution label, achieving strong performance in the downstream high-resolution tasks. The SS, which is a pixel-wise classification task, also has a lot of applications in earth observation, such as land use mapping (Q. Zhu et al., 2022) and disaster detection (Munawar et al., 2022). Recently, the SR and SS were combined to realize high-spatial-resolution tasks, like building counting (He et al., 2022) and boat detection (Zhang et al., 2019). Such state-of-the-art SR and SS approaches have shown great accuracy in various benchmark datasets and competitions (Wang et al., 2022), and their huge potential in large-scale and time-series building rooftop mapping is ripe for discovery.
2.1.2 Weakly supervised learning algorithms
Remote sensing offers an enormous supply of data provided by the over 1000 satellites currently in orbit. Many downstream tasks, however, are limited by the lack of reliable annotations, which are particularly costly as they often require expert knowledge or expensive ground sensors (Robinson et al., 2019; Manas et al., 2021). In addition, satellite imagery is various in both geography and time. Factors like season and climate pose great generalization challenges to the deep-learning model, while these factors are difficult for human labeling and explicit learning by the model.
Recent years have seen a proliferation of studies to tackle the above challenges, among which the weakly supervised learning algorithm has gained great attention in the earth observation field (Yue et al., 2022). One is the pre-text task-learning algorithm. It is implemented by forcing the model to learn representations of other related tasks simultaneously, e.g., the coordinates of the input imagery (Muhtar et al., 2022) and the nighttime light intensities (Xie et al., 2016). Another is the contrastive learning algorithm, which aims to learn the representations by pulling positive (similar) feature pairs closely in latent space and pushing the negative (dissimilar) feature far away from the positive feature. For example, Manas et al. (2021) and Ayush et al. (2021a) denote the imagery of the same location but at different times as positive, while Yang and Ma (2022) denote the patch in images with the same land cover class as positive and different types as negative. The intuition of the weakly supervised learning algorithm is to learn the representation from other related tasks with easily accessible labeled data or to learn the latent invariance from the observed imagery itself, thus alleviating the limitation of annotations of the downstream tasks.
Due to spatiotemporal variations, there is a shortage of reliable annotations for national-scale and multi-annual building rooftop detection. In the meantime, information such as acquisition time, image location, and land cover data is plentiful in the community. Overall, there are two primary challenges, each with a possible solution.
-
The lack of reliable building rooftop annotations, especially in rural areas, poses a weakly supervised problem – utilizing low-resolution land cover data as supervision, since they could provide the information about “where they possibly have built”.
-
The different acquisition time of imagery makes the image of the same location but at a different time have a different image style, posing a challenge for the model generalization – implementing the contrastive learning algorithm to make the model invariant for the temporal discrepancies.
Based on the above observation, we propose a novel framework (STSR-Seg) where we utilize the state-of-the-art SR and SS approaches and the weakly supervised learning algorithm to achieve robust building rooftop detection in China.
2.2 Building-related products
So far, there have been a lot of studies focused on human living space or the land surface cover from different scales. These studies also give information about buildings. Early efforts usually focused on using very-low-resolution satellite data, e.g., Defense Meteorological Satellite Program (DMSP) and Moderate Resolution Imaging Spectroradiometer (MODIS) data, to produce the Land Use and land Cover Change (LUCC) data (including urban or built cover information) at 100 m to 1 km spatial resolution (Schneider et al., 2003; Tateishi et al., 2011). With the free availability of Landsat and Sentinel satellite data as well as the powerful geospatial cloud platforms (e.g., Google Earth Engine, GEE), more international studies are working towards mapping at a finer spatial resolution (e.g., decametric) over long periods and large geography and providing more detailed building-related products such as the ISA and the HSF. For LUCC, ISA, and HSF, a series of global mapping efforts was witnessed in recent years, such as FROM_GLC (Gong et al., 2013), Global Artificial Impervious Area (GAIA) (Gong et al., 2020a), 10m Global Impervious Surface Area (GISA-10m) (Huang et al., 2022), the Global Human Settlement Layer (GHSL) (Corbane et al., 2021), and World Settlement Footprint (WSF) (Marconcini et al., 2020). The spatial resolution of the aforementioned products ranges from 30 to 10 m, and the period ranges from 40 years to only 1 year (Table 1). These data provide the built cover information or the impervious surface information and are frequently used to conduct building-related studies (Fox et al., 2019). However, due to the resolution gap, these data may contain errors when specific to individual buildings (Fig. 2), which has thus inspired the investigation of BRA that can describe the individual buildings.
However, BRA mapping remains challenging and is not well solved due to the tiny sizes of individual buildings. Typically, BRA demands remote-sensing images with a metric or submetric resolution. Purchasing these images needs a very high data expenditure; hence, large-scale BRA mapping is relatively hampered compared with other aforementioned building-related data. Currently, the open-access large-scale BRA data are from Google (Sirko et al., 2021) and Microsoft (GlobalMLBuildingFootprints, 2022) due to the fact that these companies can afford the high cost of large-scale building mapping. They utilize deep-learning (e.g., semantic segmentation) methods, high-resolution imagery from Google Maps or Bing Maps, and building rooftop ground truths by human labeling to achieve continent-scale mapping (e.g., Africa) and global mapping, respectively. Unfortunately, China is not included in their products.
Recently, Z. Zhang et al. (2022) applied GES images and semantic segmentation methods to detect building rooftops of 90 cities in China in the year 2020. However, the GES images are collected from various kinds of high-resolution satellites and have two potential problems when applied to large-scale mapping: (1) inconsistent geographical offset (illustrated in Fig. S1) and (2) inconsistent acquisition time (e.g., the image is obtained from various satellite sensors with different acquisition times), which results in spatiotemporal inconsistency in the generated product. Also, the product from Z. Zhang et al. (2022b) does not cover the living space of more than 36 % of China's population, e.g., the rural area.
Moreover, China is undergoing rapid urbanization and a rural–urban demographic transition (Guan et al., 2018). A single year of building rooftop distribution may not be sufficient for research about sustainable development. To the best of our knowledge, few of the existing BRAs provide multi-annual mapping on a large scale (e.g., national) or in a developing region (e.g., rural). Therefore, there is an urgent need for BRA over both a large-scale area and a specific time span to support various fine-scale applications.
Overall, the large-scale BRA data are currently limited, especially in China. In addition, there are no simultaneously multi-annual and large-scale BRA data freely available to the public (summarized in Table 1). To this end, we present the CBRA dataset by using the proposed STSR-Seg deep-learning method in this study, which has 2.5 m of spatial resolution and 1 year of temporal resolution ranging from 2016 to 2021.
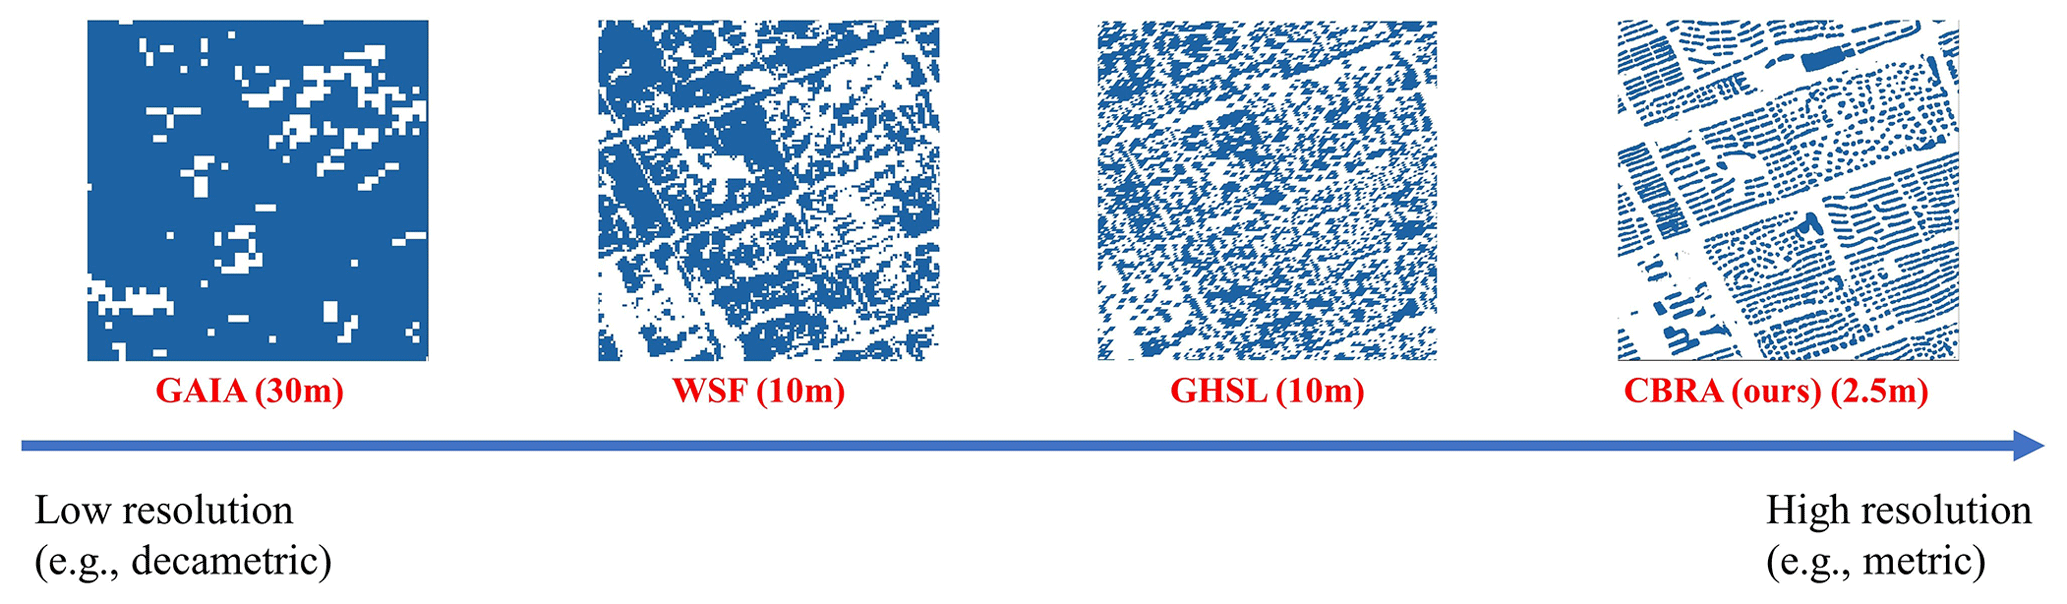
Figure 2An example of the result from several representative building-related datasets (31.093870∘ N, 121.344419∘ E). The GAIA (Gong et al., 2020b) reflects the impervious area (30 m). The WSF (Marconcini et al., 2020) and GHSL (Corbane et al., 2021) are the human settlement data (10 m). CBRA (ours) is the building rooftop area data (2.5 m).
Table 1The recent well-known building-related datasets and the existing large-scale BRA datasets.
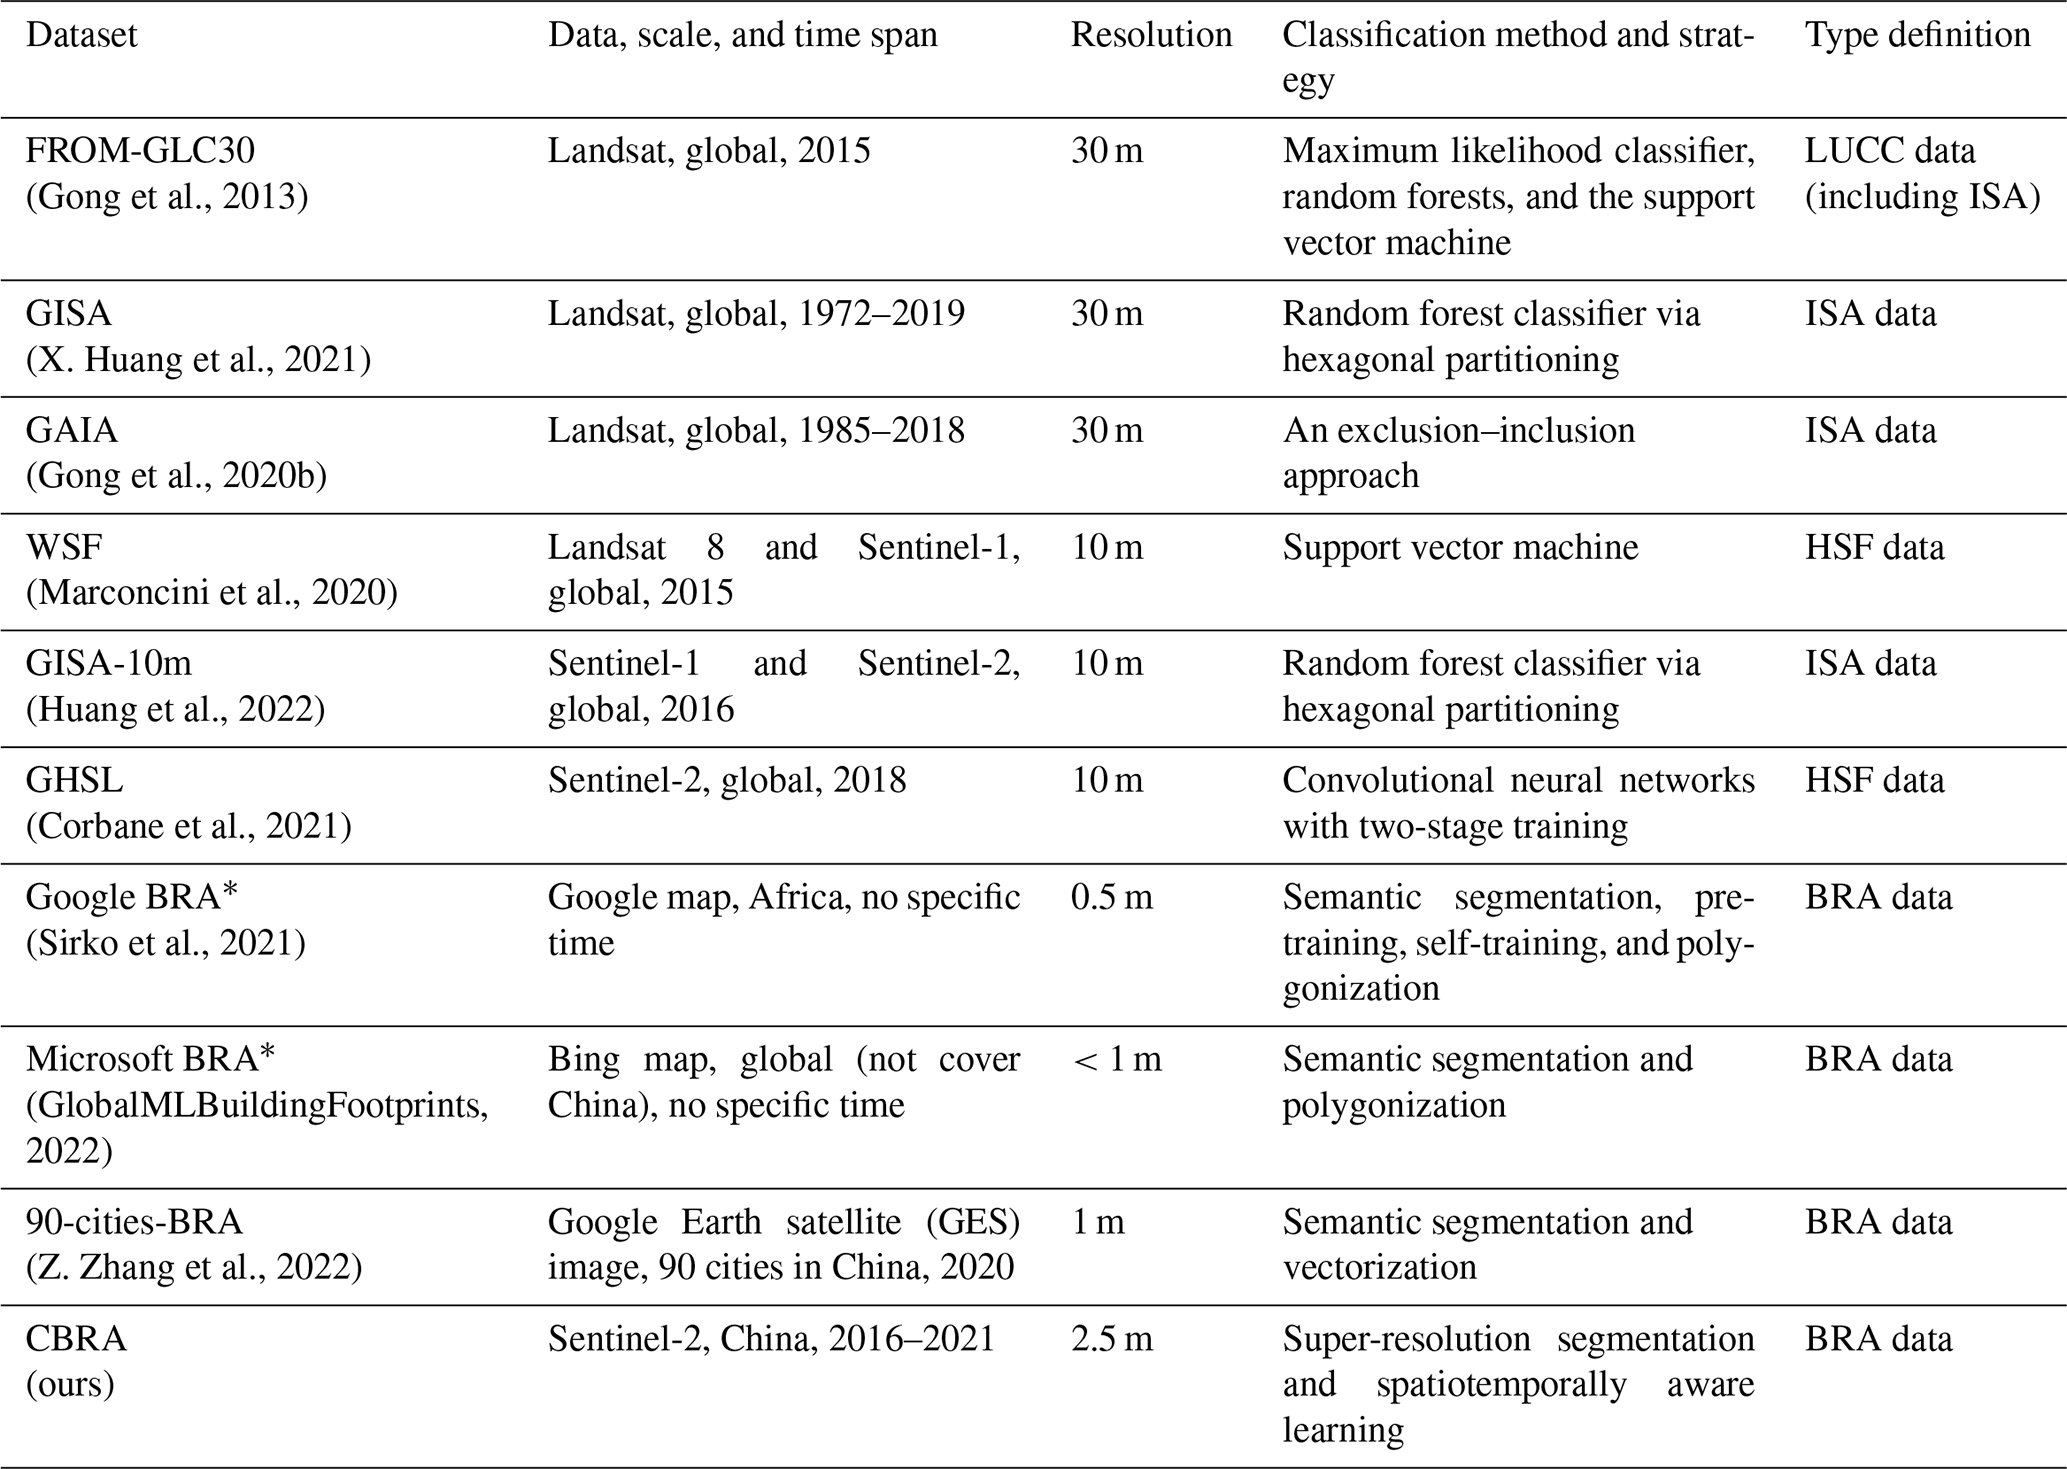
* Results from Google and Microsoft are not specific in time, because the images they collected worldwide do not have consistent acquisition times.
3.1 Satellite imagery
Sentinel-2 optical images are used for the CBRA mapping. Sentinel-2 is an earth observation mission under the European Space Agency (ESA) Copernicus program, including a constellation of two satellites, i.e., Sentinel-2A and Sentinel-2B. The first Sentinel-2 satellite has observed the earth since June 2015, mainly providing four 10 m visible bands (i.e., RGB), the near-infrared (NIR) bands, six 20 m shortwave infrared (SWIR) and red-edge bands, and three 60 m bands (Huang et al., 2022). In this paper, we only utilize the band with 10 m (i.e., RGB and NIR), since the previous study shows that introducing bands with coarser resolution potentially brings degradation in the performance of deep-learning models (Adriano et al., 2021). After the testing and adjustment by the ESA, Sentinel-2 has achieved complete coverage of China since 2016 (Huang et al., 2022). Therefore, we utilize the Level-1C top-of-atmosphere (TOA) reflectance product, which has been conducted with systematic radiometric calibration and geometric and terrain correction by the ESA. To tackle the cloud noise, we utilize the GEE (Gorelick et al., 2017) to filter out the images with more than 20 % clouds and further conduct cloud and shadow removal by the quality bands to get cloud-free pixels. Finally, we perform median composition of the filtered images within 1-year intervals. The number of image tiles for median composition (cloud under 20 %) over China from 2016 to 2021 is shown in Fig. 3. Note that there are several missing images in parts of southwestern China. However, there are few human activities in these regions, and thus the impact on our results is negligible (Table S1).
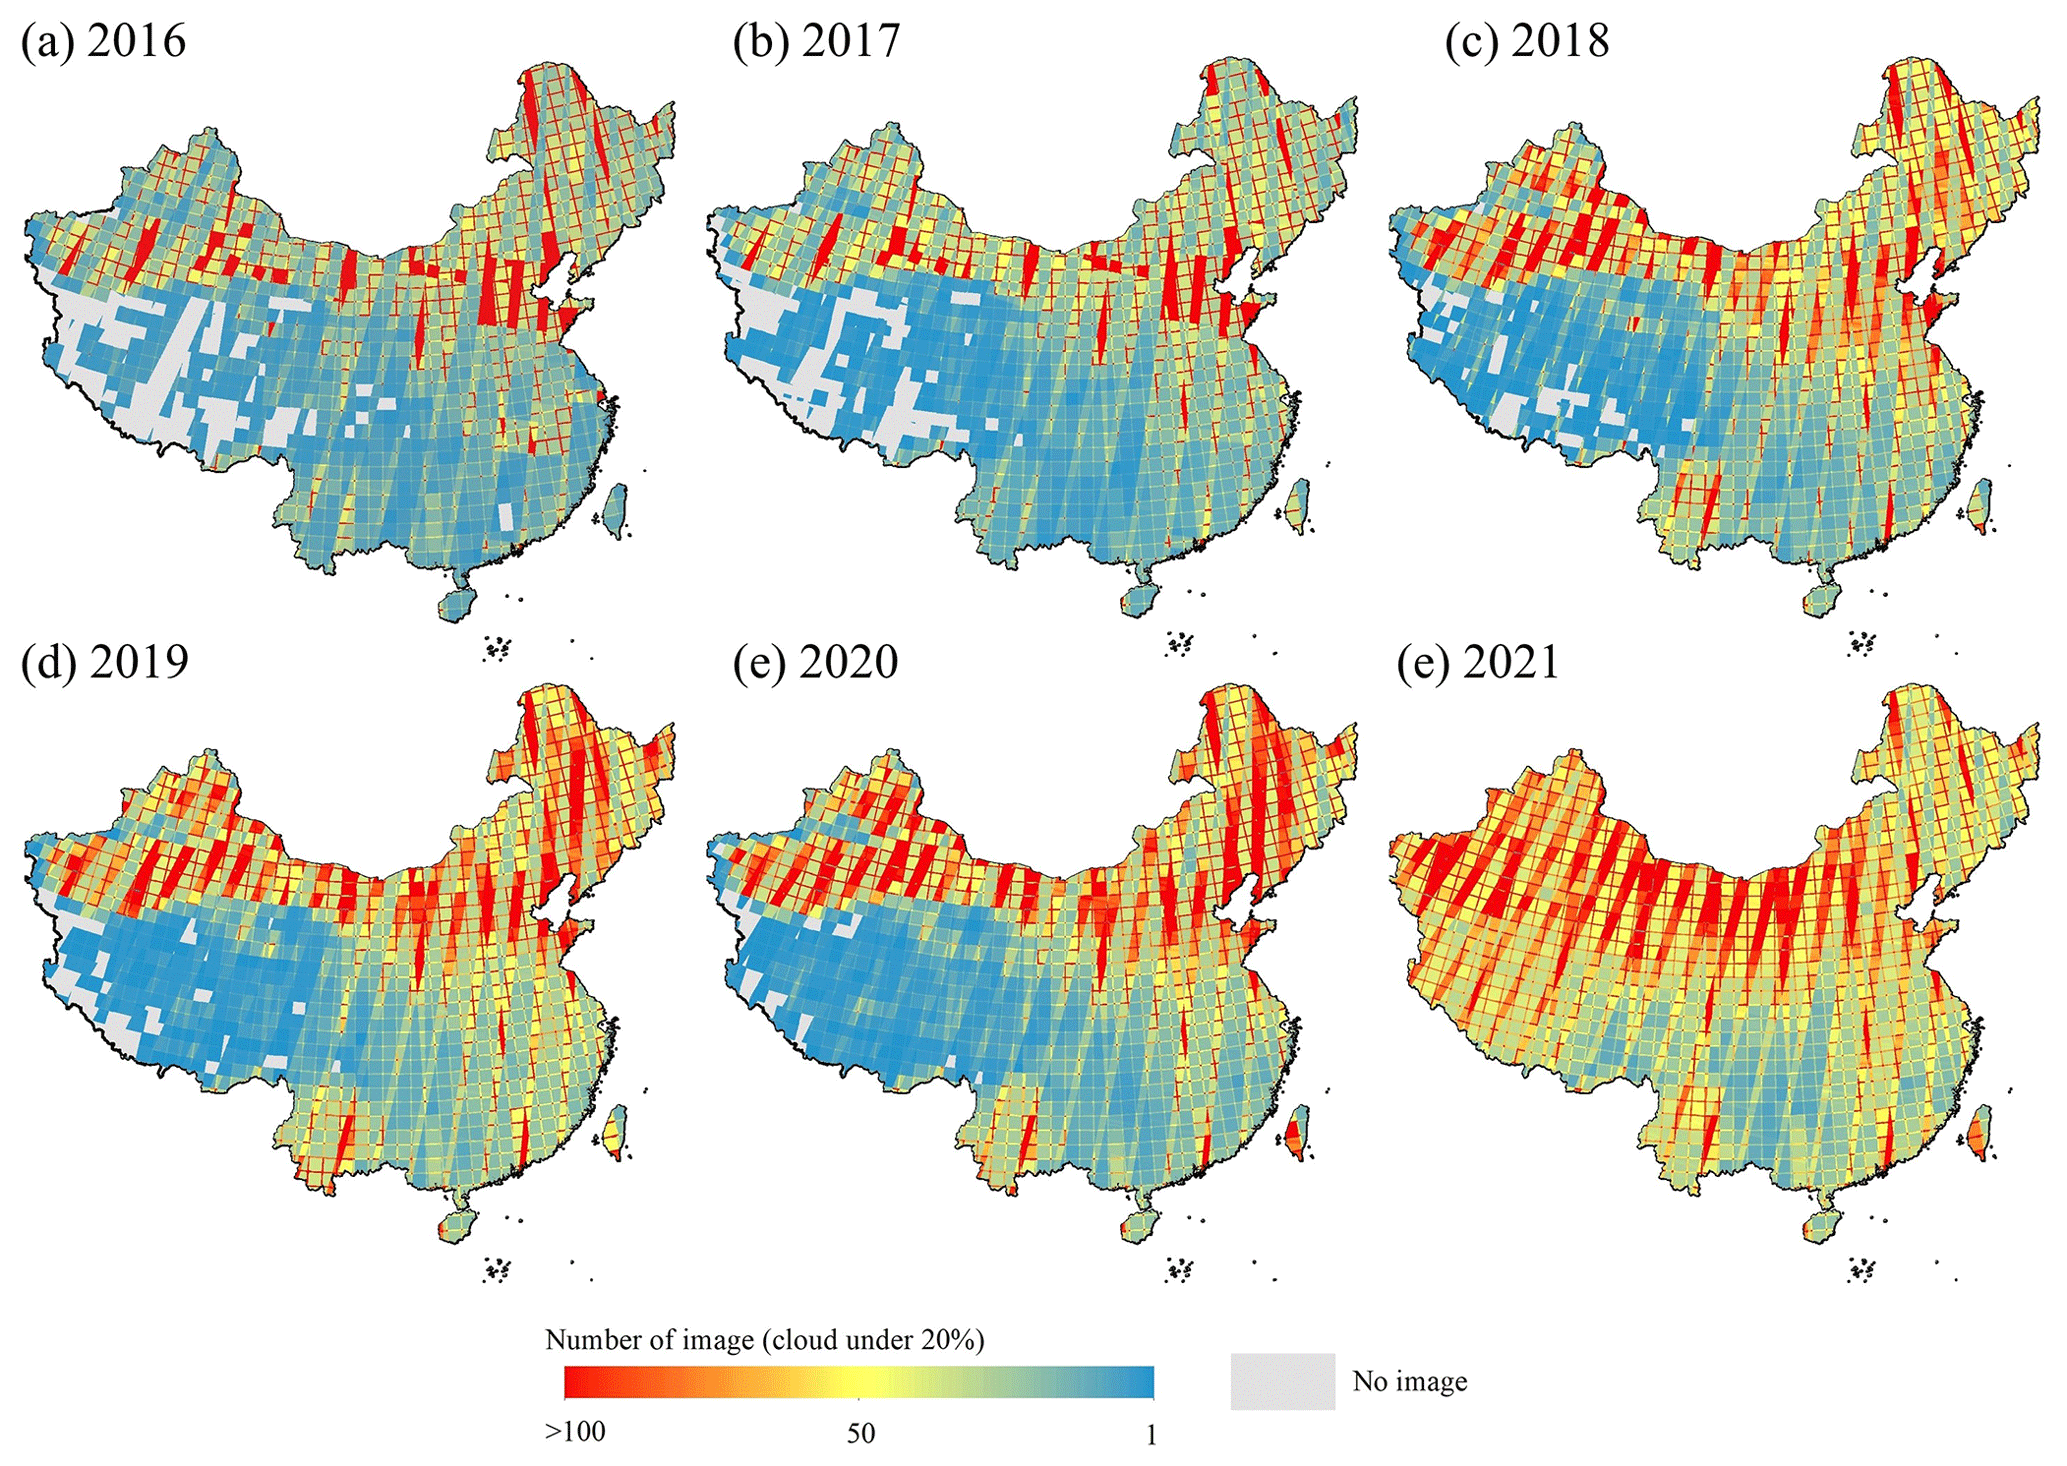
Figure 3Distribution of the Sentinel-2 images (cloud cover under 20 %). Base map © OpenStreetMap contributors 2023. Distributed under the Open Data Commons Open Database License (ODbL) v1.0.
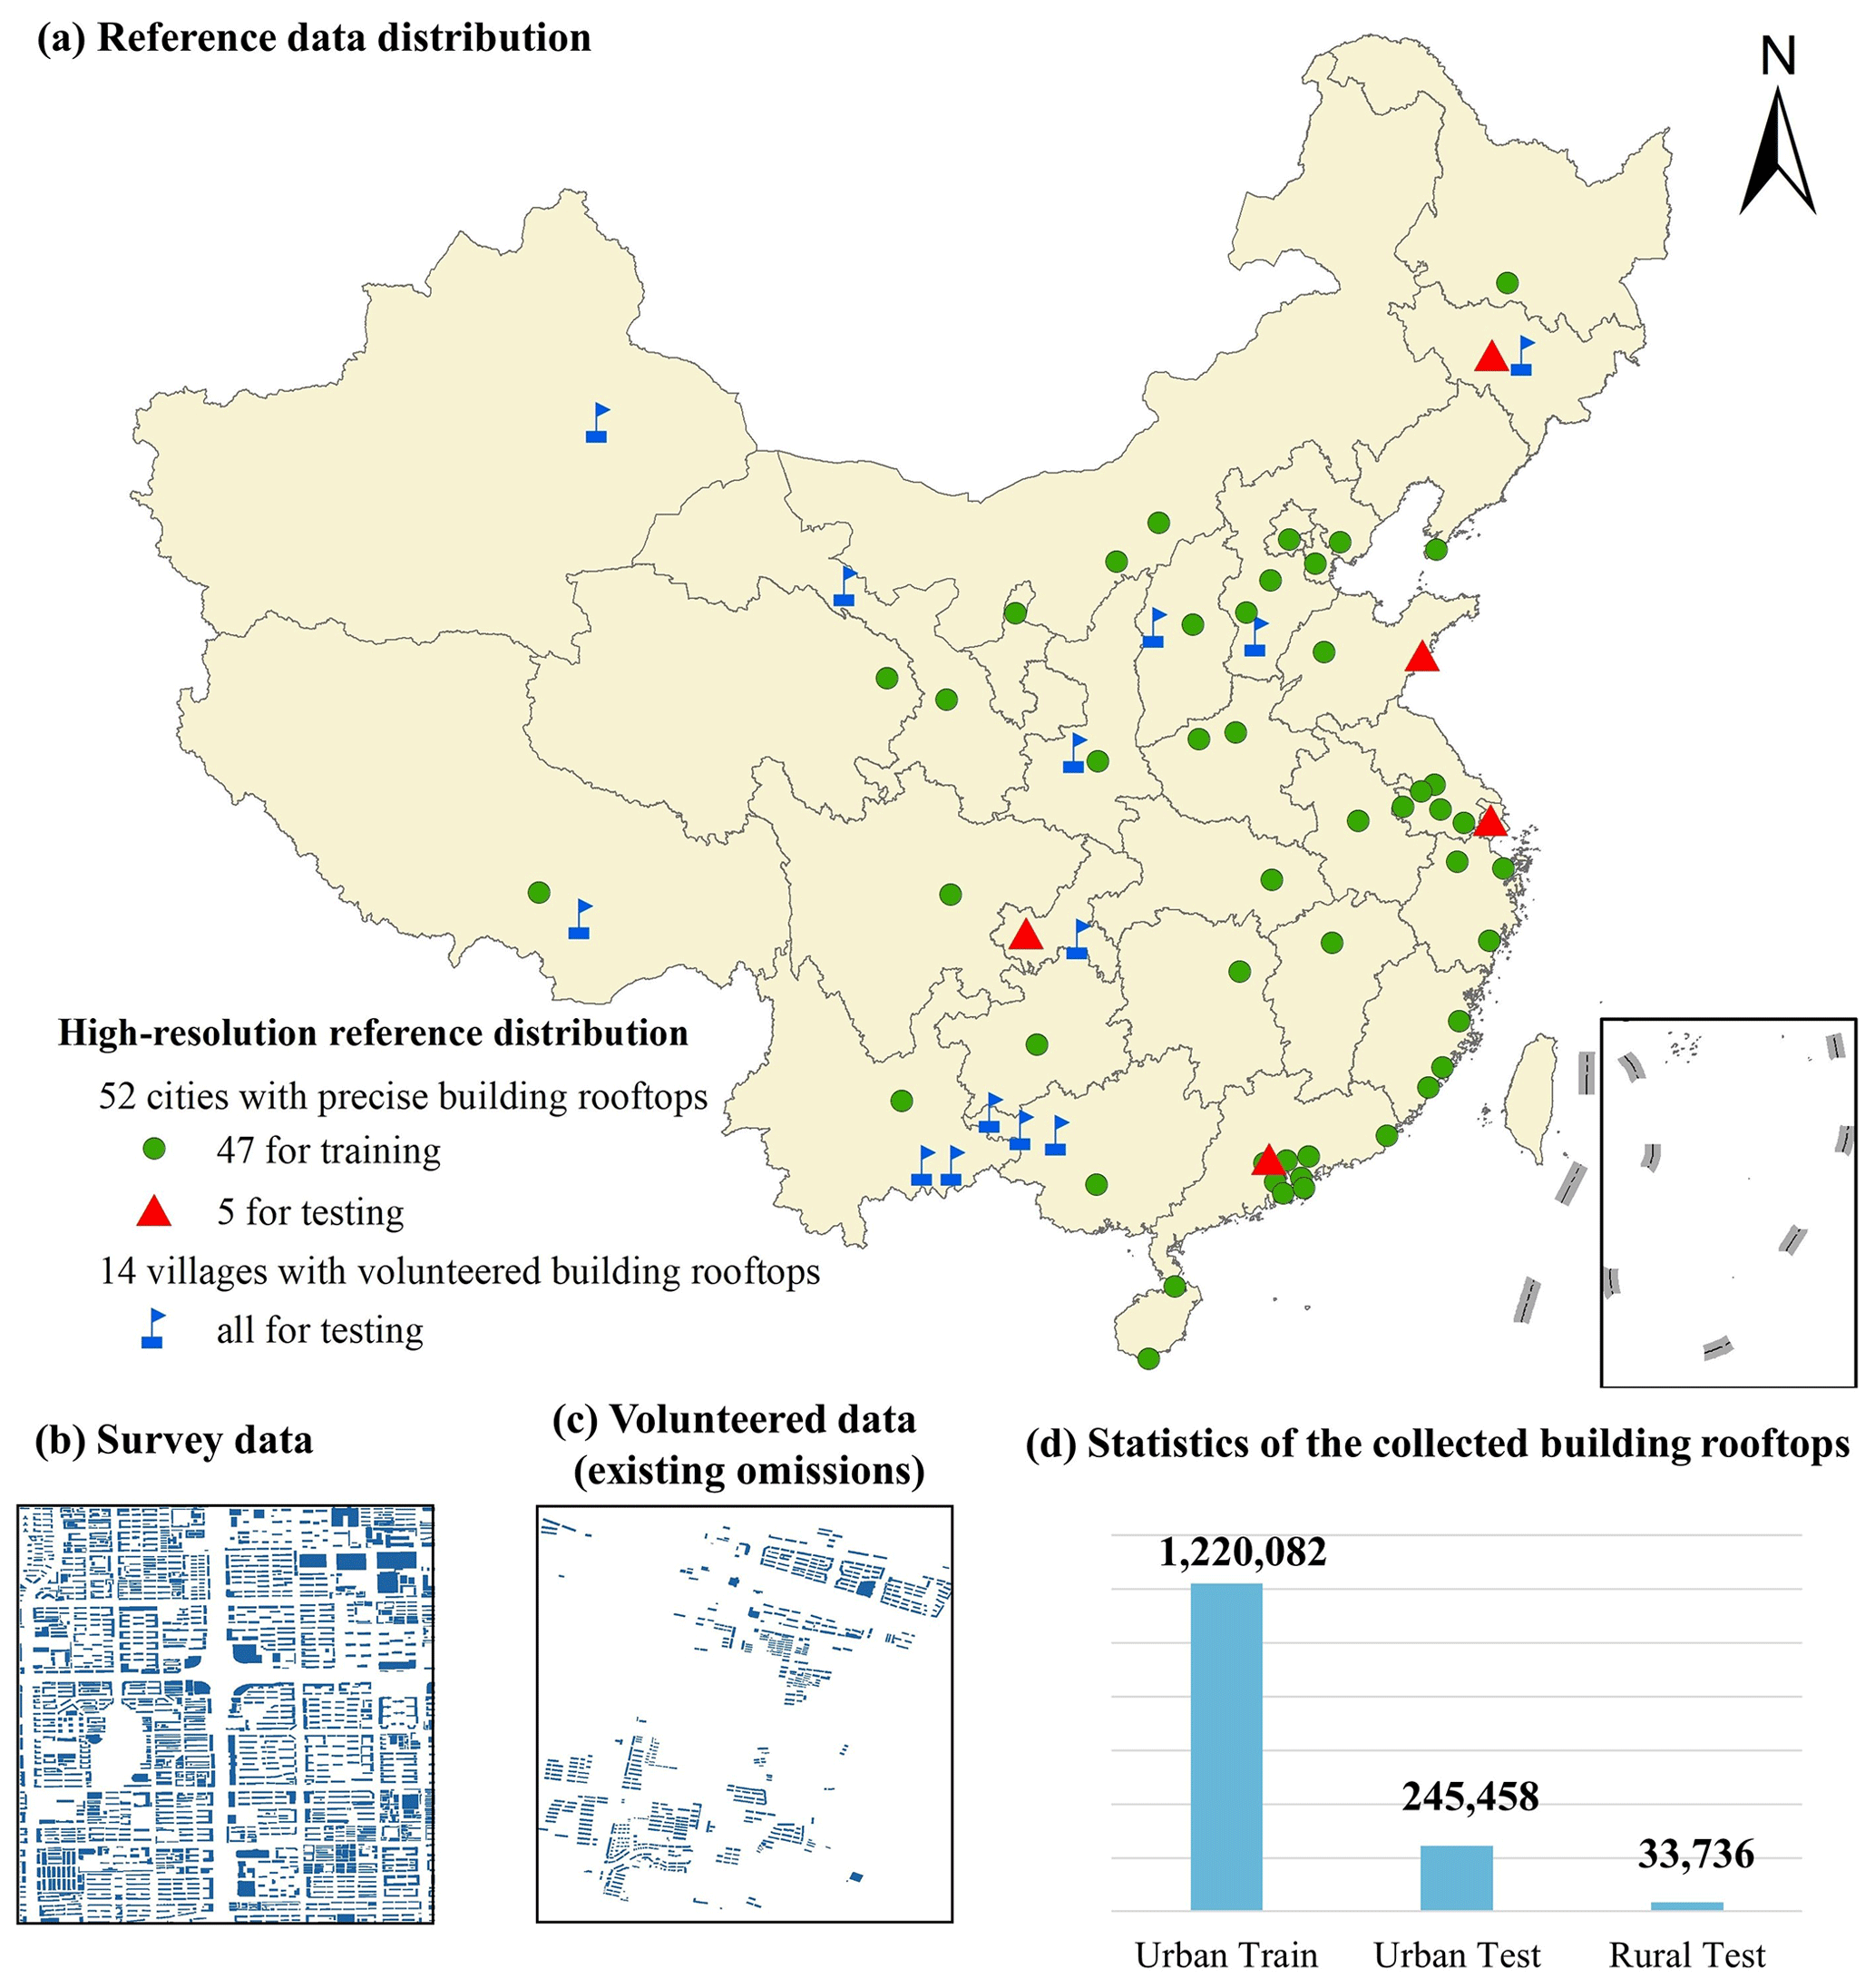
Figure 4Illustration of the collected high-resolution reference. Panel (a) is the high-resolution reference distribution map (base map © OpenStreetMap contributors 2023, distributed under ODbL v1.0). Panels (b) and (c) are real-world examples of the collected survey data (survey data © Tiandi Map) and the volunteered data (volunteered data © OpenStreetMap contributors 2023, distributed under ODbL v1.0), respectively. Panel (d) is the statistic of building rooftops.
3.2 Reference data
For the deep-learning-based method, the supervised information (e.g., reference data) is crucial to the model performance. In this study, we collect three kinds of reference data for training and evaluation, i.e., the survey building rooftop data (2.5 m), the volunteered building rooftop data (2.5 m), and the land cover data (10 m).
The survey data should reflect the precise building rooftop distribution in the region of interest. Hence, in this study, we collect 52 cities' building rooftops for the year 2019 from Tiandi Map, which is sponsored by the National Platform for Common Geospatial Information Service of China (Zhang et al., 2021). We use 47 cities for training (1.22 million buildings) and 5 cities for testing (250 000 buildings), as shown in Fig. 4. To verify the accuracy in the rural area, we collect additional building rooftops of several rural regions from the volunteered geographic information platform, i.e., the Open Street Map (OSM) (Haklay and Weber, 2008). However, there are uneven omissions and errors in the OSM data. To address these issues, we manually correct the data on the ArcGIS software in conjunction with high-resolution images provided by ArcGIS online (Arcgis online, 2022). Despite our efforts, the accuracy of our interpretation is subject to some omissions due to the uncertainty in the acquisition time of the images used. Finally, building rooftops of 14 villages are obtained (30 000 buildings), as shown in Fig. 4.
To improve the geospatial generalization of the deep-learning method (i.e., scaling to all regions of China), we also collect the land cover data over China from 2016 to 2021 from the Dynamic World product (Brown et al., 2022). Dynamic World, as a result of the partnership between Google and the World Resources Institute, is a near-real-time (2–5 d) and 10 m global land cover dataset. It includes 10 land cover types and provides the probability estimates for each type. This paper only focuses on the “built” land cover type for weakly supervised learning. Though the resolution cannot meet the demand of our CBRA (2.5 m), Dynamic World could provide vital information such as “where there might be a building rooftop”. The strategy of sampling Dynamic World as the training reference will be illustrated in Sect. 4.1, and how to use it as reference information for updating the parameter in our model will be clarified in Sect. 4.3.
Figure 5 shows an overview of the methodology workflow, including (a) the training sample generation, i.e., arranging the high-resolution reference, low-resolution reference, and Sentinel-2 imagery; (b) the proposed STSR-Seg framework for detecting the building rooftop area, which is the core of our workflow; (c) the workflow used for BRA data generation based on the trained STSR-Seg framework; and (d) the strategy for dataset evaluation.
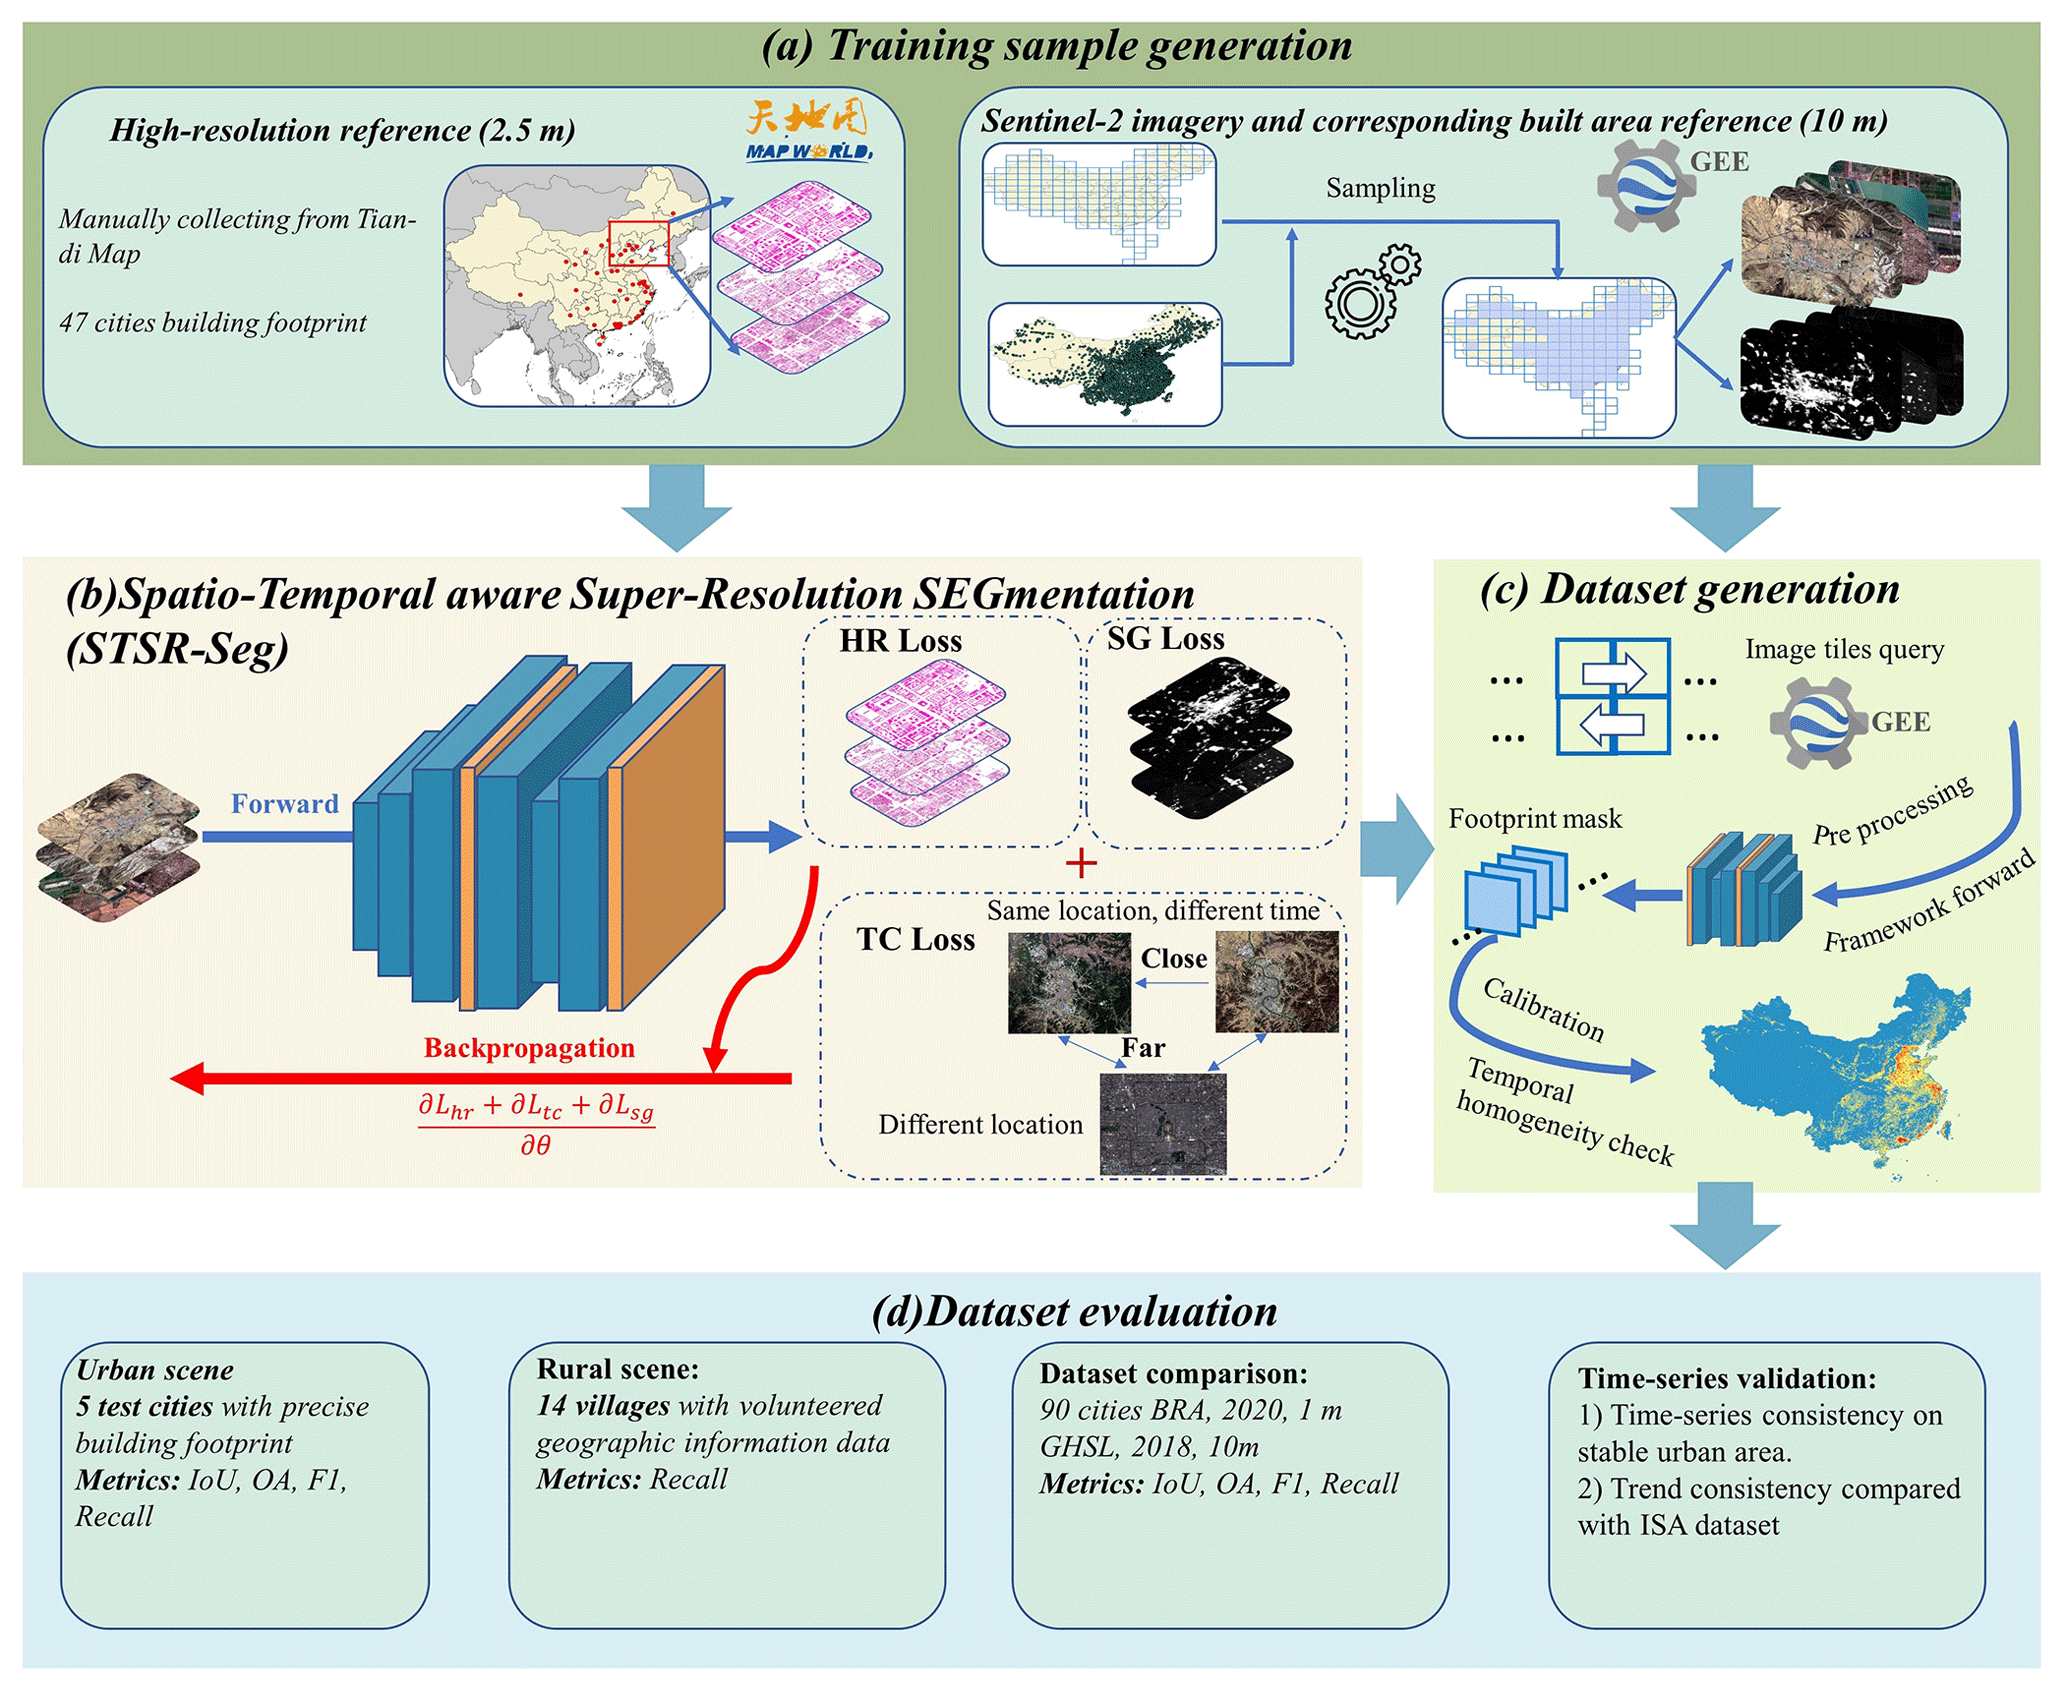
Figure 5The flowchart for CBRA mapping and evaluation. Base map © OpenStreetMap contributors 2023. Distributed under ODbL v1.0. Imagery © ESA. Binary map © Tiandi Map. The possibility map is from the Dynamic World product (Brown et al., 2022).
4.1 Training sample generation
The deep-learning-based method is data-driven, and the training samples are crucial for its generalization performance. As described in Sect. 3, the reference data for training consist of both the high-resolution building rooftop in 47 cities from Tiandi Map and the low-resolution land cover data from the Dynamic World product. For the rooftop data, we can easily pair them with the Sentinel-2 imagery obtained at the same location and time. However, for two reasons, we think it is not a wise choice to use all the available land cover data for 2016–2021 in China or to just uniformly sample a part of the land cover database for training. First and foremost, utilizing all the data or uniform sampling will lead to a large amount of redundancy in supervised information. For example, 13 % of land in China is desert and 23 % is forested. The redundancy of these non-human areas will bring unbalanced categories, thus leading to ineffective model training. Secondly, China covers an area of approximately 9.6×10⁶ km2, and utilizing all of the land cover for training will place a great burden on our computational resources. To work around this, we assume that people mainly live in the vicinity of basic administrative units. We utilize the third level of Chinese administrative divisions, i.e., the county level, for a total of 2844, as the basic units. Hence, the heuristic sampling strategy is as follows.
-
Sample 200 coordinates using the Gaussian distribution spanning a standard deviation of 150 km around each basic unit.
-
For each coordinate, randomly assign 3 reference years over 2016–2021.
-
Check whether the coordinate exists within valid Sentinel-2 tiles for the reference year and with less than 10 % cloud, and then process and download the image patch and the corresponding land cover type. Otherwise, go to step 1.
The number of sampling coordinates and standard deviations employed in the heuristic sampling strategy is based on offline experiments, which thoroughly cover the potential urban areas of China (Fig. S2). It is important to note that only 3 years are randomly sampled from 2016 to 2021 to avoid increasing the dataset and imposing an unmanageable computational burden. Through this approach, the land cover training samples, covering both urban and rural scenes and ranging over various years, are easily and automatically gathered.
Finally, the generated samples may still exhibit redundant information, necessitating their further filtration. Specifically, those samples containing fewer built-up area pixels (i.e., below 10 %) are discarded. In total, we obtain two sets for model training. One is the high-resolution reference set paired with the Sentinel-2 imagery (10 m) and the building rooftop reference (2.5 m). The other is the low-resolution reference set paired with the Sentinel-2 imagery and the corresponding land cover type (10 m). We also assign a corresponding “built” land cover type for each building rooftop reference, as high-resolution references and low-resolution references can be learned collaboratively in our learning strategy.
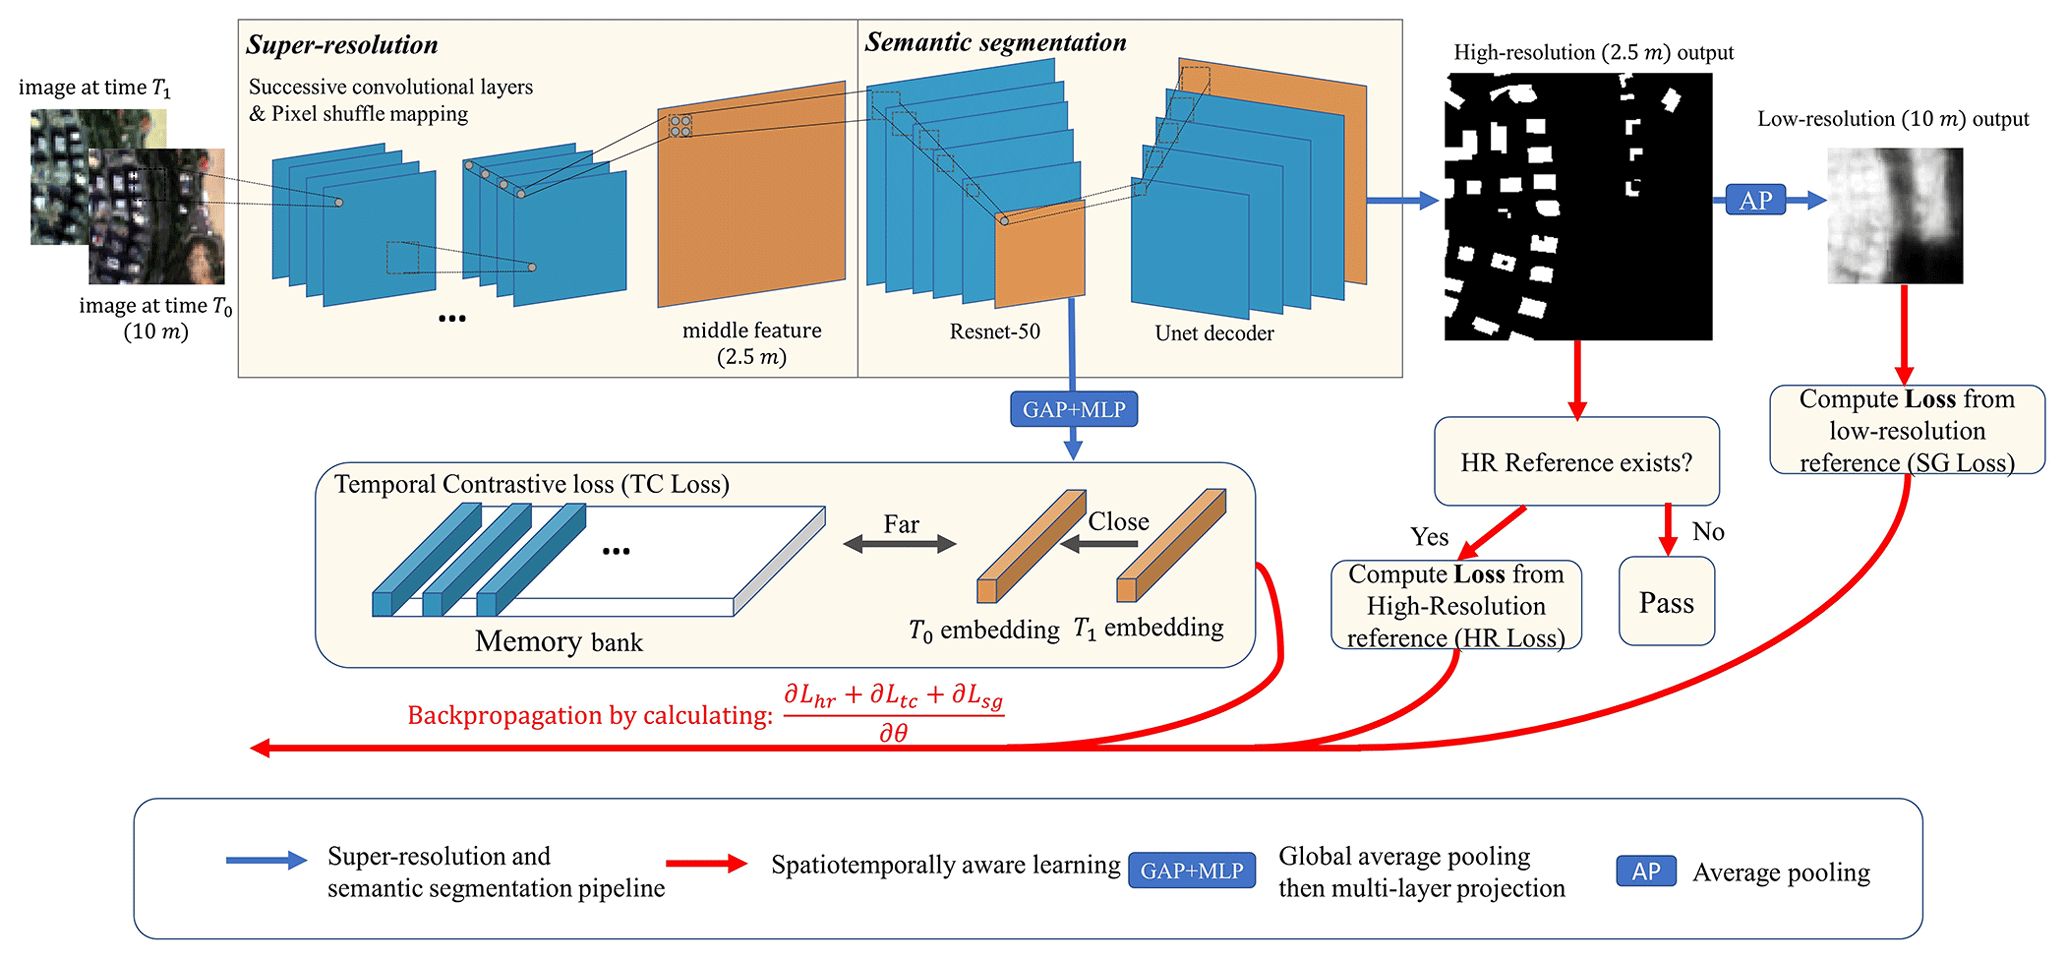
Figure 6The schematic diagram of the STSR-Seg framework. Imagery (left) © ESA.
4.2 Super-resolution and semantic segmentation pipeline
To achieve super-resolution and robust building rooftop prediction, we design the STSR-Seg framework as shown in Fig. 6. STSR-Seg includes two major components: the super-resolution and semantic segmentation pipeline (i.e., the blue forward arrow in Fig. 6) and the spatiotemporally aware learning (i.e., the red arrow in Fig. 6). In this subsection, we will describe the forward pipeline in detail.
We utilize a state-of-the-art method, the Enhanced Deep Super-Resolution network (EDSR) (Lim et al., 2017), to serve as the front component of the framework (i.e., the super-resolution component). Let denote the input imagery, where C, H, and W are the channel, height, and width, respectively. The EDSR first utilizes successive convolutional layers embedded with residual connections to increase the dimension of C. For example, assuming the up-sampling factor is r, the implemented CNN will output the feature with a dimension of . Then, the EDSR enlarges the H and W dimensions by applying the pixel shuffle function and outputs the fine-grained middle feature . In this paper, the up-sampling factor r is 4.
Next, we apply a modified Unet architecture (Ronneberger et al., 2015) to serve as the rear component (i.e., the semantic segmentation component) to obtain high-resolution and pixel-wise rooftop prediction. To enlarge the capacity of the naive Unet, we replace the encoder of the naive Unet with Resnet-50 (He et al., 2016), which is a powerful and widely used residual network. We also replace the final up-sampling layer in the decoder with a deconvolution layer and add a batch normalization layer in each convolutional block of the naive Unet. With the F output by the SR, the modified Unet will predict high-resolution sigmoid confidence of the building rooftop area . To achieve a robust learning strategy, we add an additional global average pooling layer and a fully connected layer in the encoder of Unet (i.e., Resnet-50) and output the temporal representation z∈Rd of the input imagery, where d is the representation dimension. We also add an additional average pooling layer to the high-resolution prediction map Phigh and obtain the low-resolution sigmoid confidence . The overall output of this SR–SS forward pipeline is three-fold, i.e., the , the , and the z. The is what we need to generate the dataset, while the and the z serve to produce auxiliary loss for tuning the model parameter (see Sect. 4.3).
4.3 Spatiotemporally aware learning
In this paper, we regard the large-scale and multi-annual building rooftop mapping as a weakly supervised learning problem, since the survey rooftop reference could only be gathered in a part of urban areas of a certain year as described in Sect. 3.2. To generalize both the temporal (e.g., 2016–2021) and the spatial (e.g., all over China), we design a robust model-learning strategy, i.e., spatiotemporally aware learning. Our spatiotemporally aware learning contains three learning algorithms.
-
The high-resolution loss (HR loss) is a fully supervised loss used to better learn the supervised information from the collected high-resolution survey rooftop reference.
-
The temporal contrast loss (TC loss) is a weakly supervised loss used to allow the model to be invariant to subtle variations over time (e.g., due to image acquisition times).
-
The spatial generalization loss (SG loss) is another weakly supervised loss used to inform the model to generalize the spatial extent where the high-resolution survey rooftop data are not available.
4.3.1 High-resolution learning
STSR-Seg gives a sigmoid confidence map of the building rooftop , and we have the high-resolution rooftop reference . In our HR loss, we firstly calculate the cross-entropy as follows:
Previous work on semantic segmentation has shown that the mixed cross-entropy loss is effective (Iglovikov et al., 2018). Here, we utilize focal Tversky loss (Abraham and Khan, 2019), which is a tunable loss function:
where ε is a constant providing numerical stability and γ is the focal parameter to balance the loss weight between the easy sample () and the hard sample. β is the parameter to control the tradeoff between the importance of false positives (FPs) and false negatives (FNs). In this paper, we set , γ=0.5, and β=0.6. The γ<1 will improve the model convergence by shifting the focus onto the easy sample. Because, in the informal experiment, we find that some hard samples are actually mislabeled in our training set, such a focal parameter will make the model robust to the label noise. In addition, β>0.5 will shift the convergence more onto minimizing FN predictions to improve the recall score of the model. The overall HR loss is given by a weighted sum:
4.3.2 Temporal contrast
Sentinel-2 images at the same location but at different times have very different hues, and the model may fail to predict for images with “unseen” image styles in training samples. To tackle this, we utilize the location a priori and encourage the temporal representation corresponding to pairs of images with the same location but different times to be semantically more similar than typical unrelated pairs (i.e., from other locations), thus making the model remain time-invariant according to the image style. This similarity can be measured by calculating matrix similarity (e.g., the dot product) among the two similar representations z and and the unrelated representation k∈Rd. Here, following the previous contrastive learning framework MoCo (He et al., 2020), we implement InfoNCE as the similarity measure:
where τ is a temperature hyperparameter scaling the distribution of the similarity measurement. For each training step, we assign the anchor image with a random selection of images from other years and obtain the pairing temporal representation z and from Resnet-50. As for the unrelated representation k, we maintain a memory bank to store the representation from N previous steps. The memory bank is a queue structure with a size of N⋅d. The memory bank is first zero-initialized. For each training step, we adopt the first-in–first-out (FIFO) strategy to update the queue by adding the anchor representation z from the previous step and removing the oldest representation. In this paper, the hyperparameter is τ=0.75, N=16, and d=128.
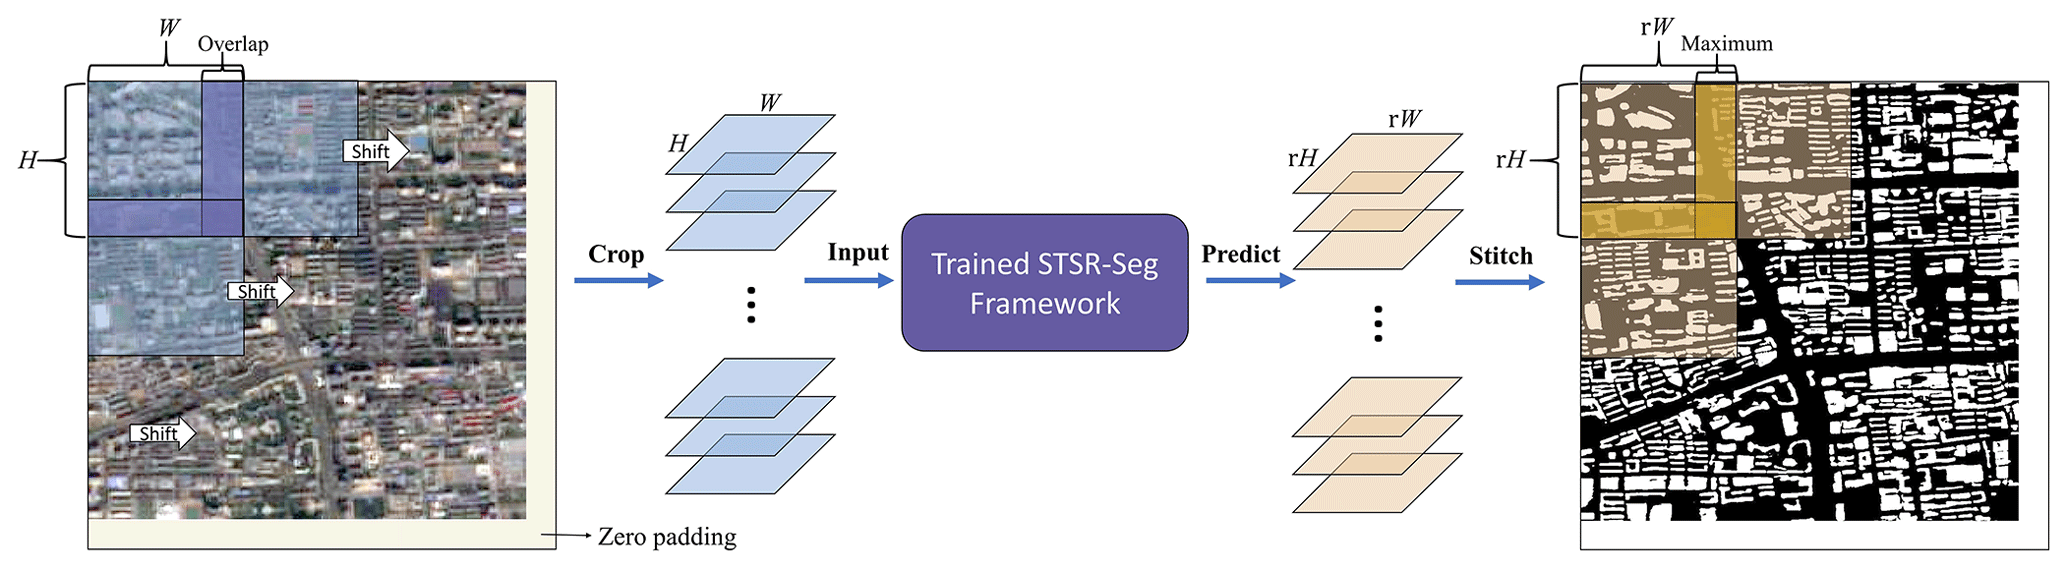
Figure 7Schematic diagram of our dataset-generation workflow. Imagery (left) © ESA.
4.3.3 Spatial generalization
Though the HR loss can provide precise pixel-to-pixel supervision, this information is only available in urban regions (i.e., 47 cities) and is sorely inadequate in other regions of China, e.g., rural regions. This situation inspires us to use additional low-resolution references (e.g., LUCC data) from outside the spatial extent of our collected high-resolution survey data to better inform the model. Given the low-resolution output and the land cover reference Plow, it is intuitive to calculate the cross-entropy loss (Eq. 1), i.e., . Obviously, the is an average aggregation of ; i.e., each pixel in denotes an average 4×4 block in in our experimental setting. The cross-entropy can suppress the prediction score of the background pixel of , i.e., the non-building pixel, and also suppress the corresponding 4×4 pixels in . However, for the foreground pixels, the cross-entropy homogeneously boosts the prediction score for all pixels related to the built area in , introducing errors into like false predictions of roads and city squares. To tackle this, the loss must be interpreted in a softer manner, which means the prediction score should not be uniformly improved.
In the case of BRA mapping, the descriptions of the “built” class in the Dynamic World product (10 m) suggest that it is a mixture of building and other impervious surfaces (Table S2). Therefore, we assume that each low-resolution built land cover determines a known distribution over frequencies of the high-resolution building rooftop (Fig. S3). Inspired by the success of super-resolution loss (Malkin et al., 2018), we utilize a variant of it, which encourages our model to match its to the fixed distributions obtained by the low-resolution reference. Specifically, we assume that the high-resolution building rooftop chr follows the Gaussian distribution in the low-resolution built-up area clr, i.e.,
where μ and σ are the mean and standard deviation, respectively, of the reference Gaussian distribution. They can be statistically obtained from our training set where both the high-resolution and low-resolution references are available, or they can be set manually. Also, due to being derived from by averaging, also follows an estimated Gaussian distribution . Therefore, the loss can be interpreted by the Kullback–Leibler (KL) divergence of these two distributions. This optimization criterion is softer due to the statistical matching rather than the distribution fitting (e.g., the cross-entropy). Finally, we incorporate this metric into the cross-entropy loss function, and our SG loss is formulated by
where μ=0.44 and σ=0.01 are based on the statistic of the high-resolution and low-resolution reference pairs (Fig. S3). The SG loss only utilizes low-resolution references and can be implemented on collected land cover samples covering multiple geographies and years, thus improving the capacity to generalize the vast geospatial mapping.
To sum up, the spatiotemporally aware learning includes three objective functions: (1) the HR loss, providing pixel-to-pixel high-resolution supervision; (2) the TC loss, learning invariance in image differences due to different times; and (3) the SG loss, learning weak information from land cover samples. In the training phase, these losses are weighted to update the model parameters simultaneously:
In our offline experiment, we found that a ratio of balances the three losses effectively in our experiment. The backpropagation pipeline is illustrated in Fig. 6 (red arrow).
4.4 CBRA dataset generation
We first download Sentinel-2 imagery covering China from 2016 to 2021 (Fig. 3) with a fixed grid of 0.10∘ × 0.10∘. To avoid the uneven transition or stitched problem between the splicing gap of the prediction result of cropped smaller images, the rooftop is predicted by the trained model in an expansion style, which consists of five steps as shown in Fig. 7. (1) The size of the downloaded image is expanded to contain an integral number of sliding windows that overlap each other by zero padding. (2) An H×W sliding window is created to extract image patches. During the movement, the window will ensure that the next move overlaps the previous one by 10 % pixels. Then, the image is cropped into smaller image patches with a size of H×W. (3) The cropped images are input into the model, and the sigmoid confidences of the building rooftop are obtained. (4) The maximum value of the overlapping area is calculated at each pixel, and then the confidence map is stitched into one and the zero padding is removed. (5) A threshold value of 0.5 is used to differentiate between candidate foreground pixels (i.e., building rooftop) and background pixels, following common practice (Liu and Tang, 2023).
For the binary mask obtained from the expanding prediction, the intersection is then taken between our prediction and the built area provided by Dynamic World to remove any candidate pixels that do not intersect with the built area. This process will reduce the false positives because our model potentially incorrectly identifies the bare land as the building rooftop. The built area provided by Dynamic World is a possibility estimation ranging from 0 to 1. A low threshold of 0.2 is utilized to distinguish between built and unbuilt areas, as this threshold does not filter out correct prediction results (further discussions in Fig. S4).
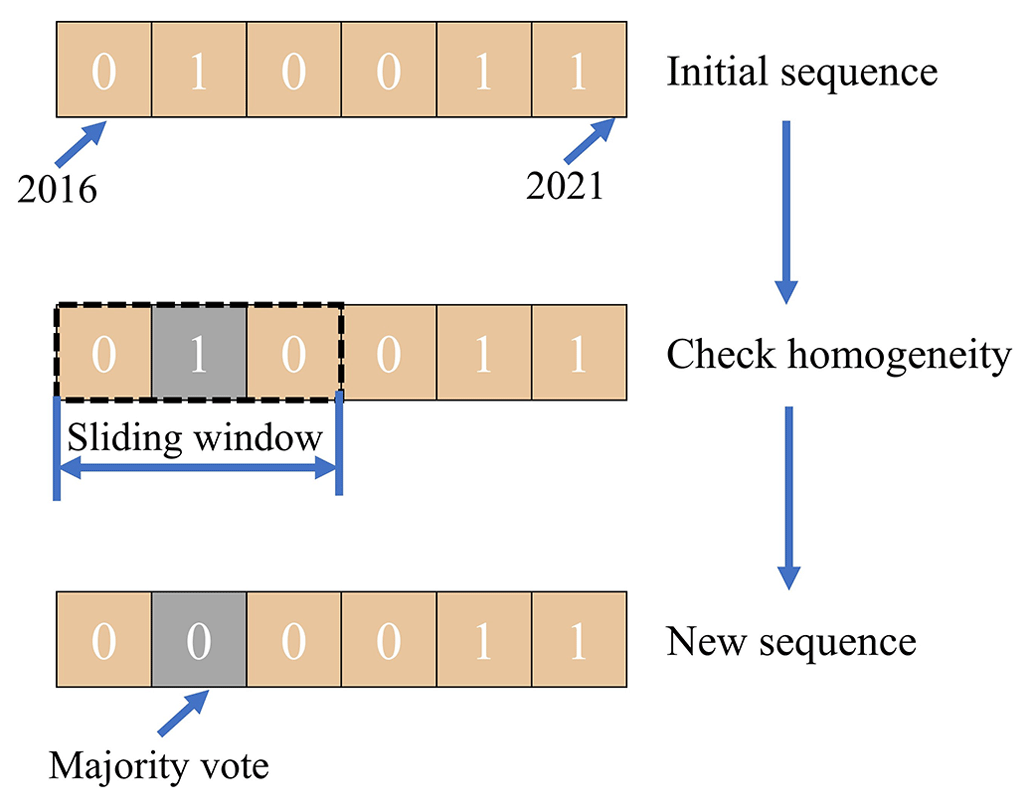
Due to the possible random bias of our method in locating the boundary of building rooftops (outlined in Sect. 6.2), inconsistencies in identification results over time for the same building may occur. To address this issue, a temporal homogeneity check approach has been implemented. Specifically, it is assumed that a building's state does not undergo continuous change over 3 successive years. Building upon the method proposed by Li et al. (2015), a 3×3 sliding window is employed to determine the final pixel value by majority voting as illustrated in Fig. 8. This ensures that the results are comparable in the adjacent years. However, for edge years like 2016 and 2021, they are not checked due to the lack of temporal information.
The implementation is conducted on our local server with a 2× NVIDIA Tesla P40 GPU. The overall dataset-generation pipeline costs about 3 months using Python.
4.5 Accuracy assessment
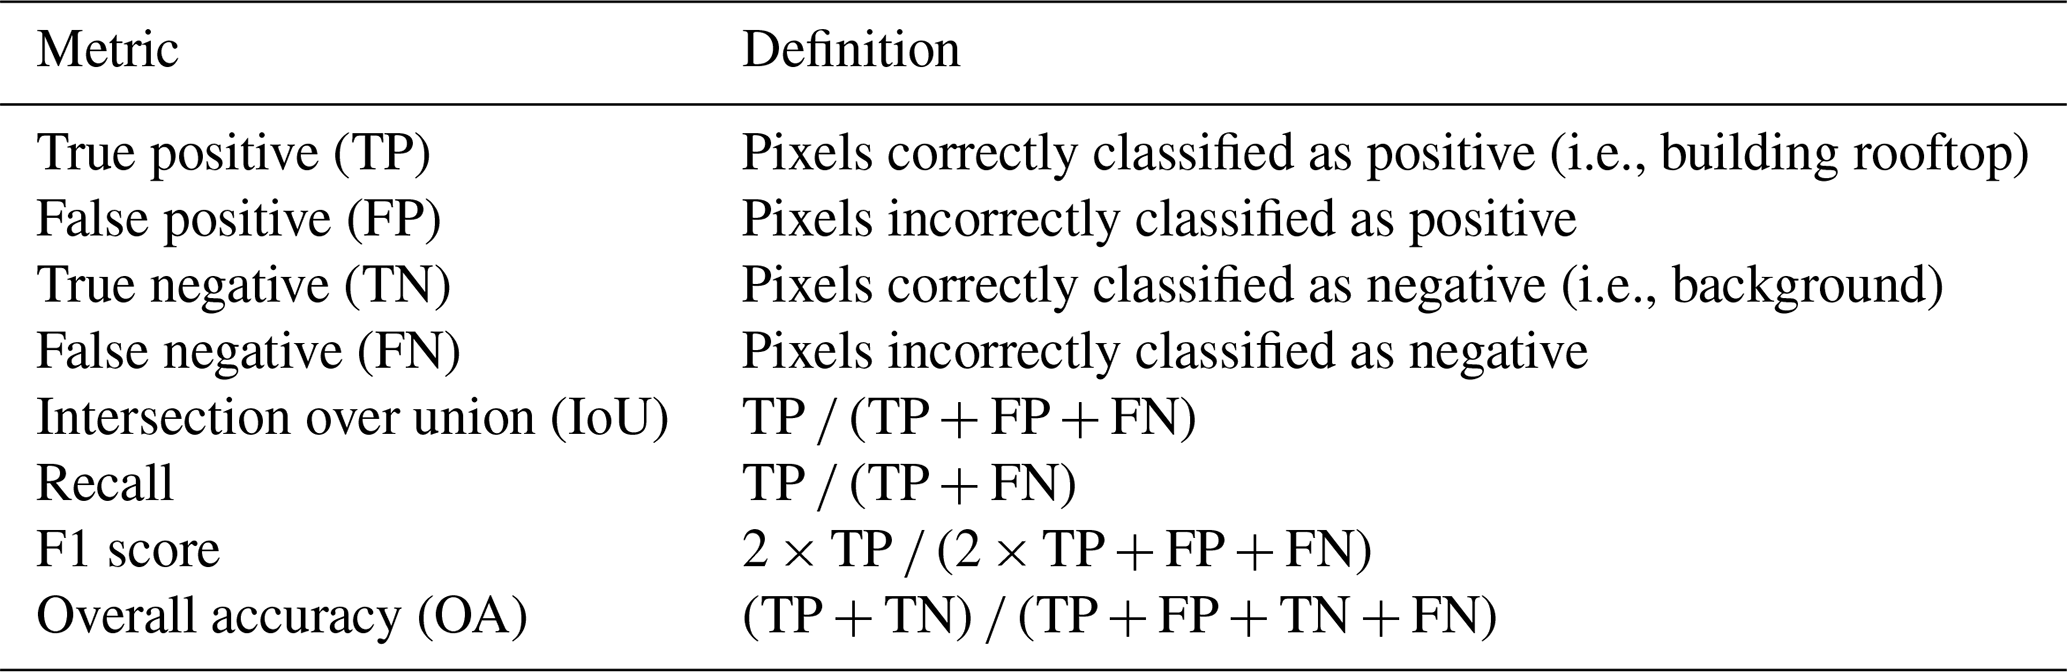
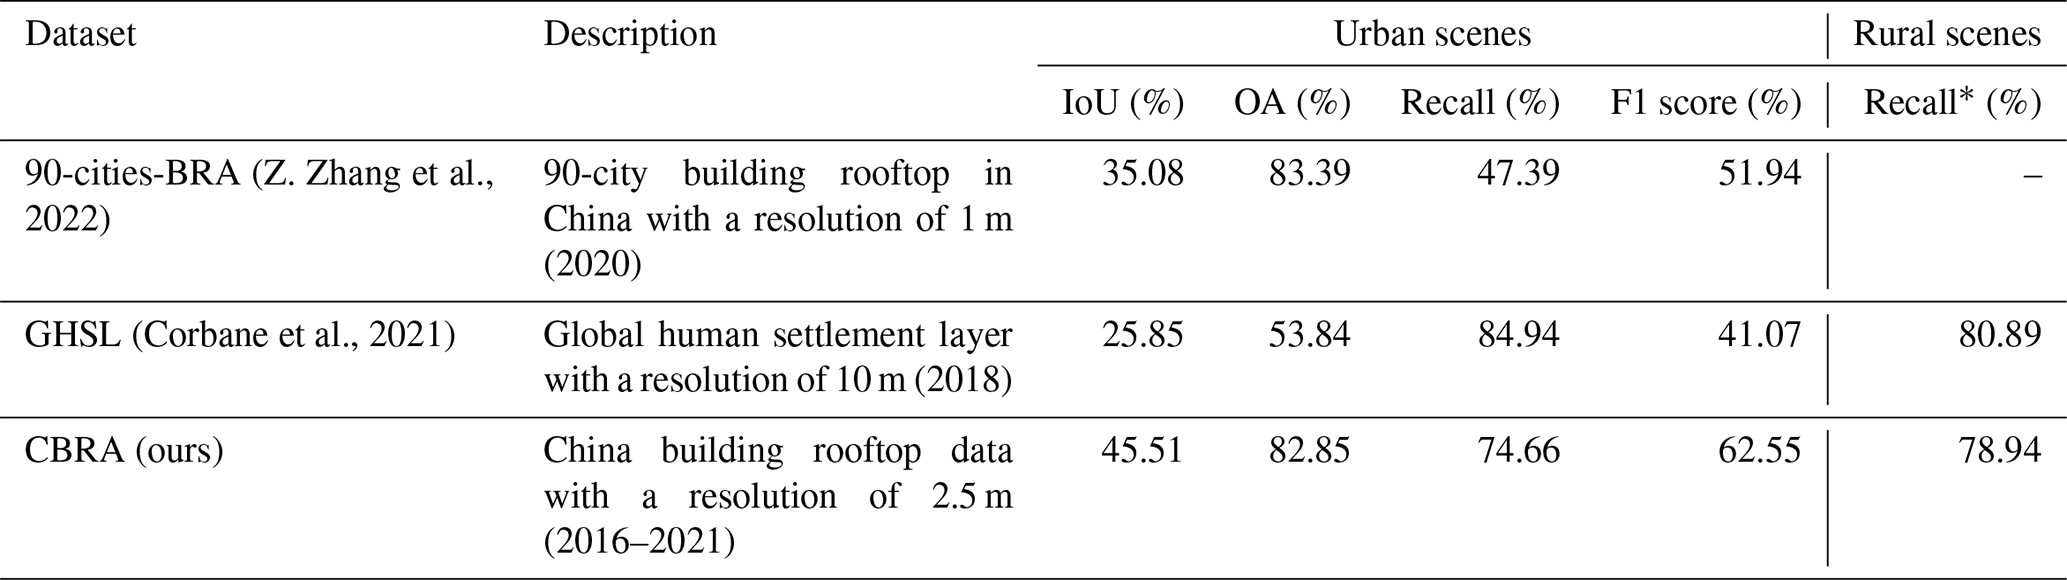
To comprehensively assess the performance of our 2.5 m multi-annual CBRA dataset, the sampled-based approaches and temporal-based approaches are adopted. Firstly, the sample-based approaches utilize five cities (250 000 buildings) with precise building rooftops for testing (Fig. 4). The metrics are listed in Table 2. Accuracy, intersection over union (IoU), recall, and F1 score all range from 0 to 1, and 1 indicates the best classifier. In rural areas, however, there is a lack of reliable high-resolution references. As described in Sect. 3.2, we utilize our manually calibrated OSM data as the reference. There are 14 villages in all (Fig. 4), accounting for 30 000 buildings. Since there are still a few omissions, we only examine the recall in rural areas. Buildings are dynamic and may change each year (van Etten et al., 2021). To ensure the reliability of the evaluation accuracy, we only use the prediction results of the corresponding year for accuracy evaluation; e.g., five cities correspond to 2019 and 14 villages correspond to 2020. As for the dataset comparison, we use two products for comparison: (1) the China 90 cities 1 m building rooftop area dataset (90-cities-BRA) (Z. Zhang et al., 2022) and (2) the 10 m GHSL (Corbane et al., 2021). To the best of our knowledge, 90-cities-BRA is currently the only large-scale and freely accessible building rooftop dataset in China, and it covers 90 cities for 2020, which is also the dataset we can compare in the urban scene at a fair. The GHSL provides the human settlement layer of the globe for 2018, and we mainly use it for the comparison of rural scenes.
Secondly, in the temporal-based approaches, we design two experiments to estimate our performance consistency in a time span. For the first experiment, we assume that the buildings in the old town area of Beijing, Hong Kong SAR, and Macao SAR remain unchanged in the last 6 years; therefore, we test the consistency of the results in terms of evaluation metrics in these regions. For the second experiment, we calculate the correlation coefficient (e.g., R2) of our data with the existing well-known annual impervious surface products. To achieve this, we utilize the 30 m China Land Cover Dataset (CLCD) (Yang and Huang, 2021) and 30 m GAIA (Gong et al., 2020b), ranging from 1990 to 2019 and from 1985 to 2018, respectively.
In addition to evaluating our data, we examine several examples of our poor rooftop extraction result to understand the limitation of our dataset.
Table 2Classification performance metrics calculated in this study.
The implementation configurations of the overall generation pipeline are listed in Table S3. Based on all available Sentinel-2 data in China, we generate the annual 2.5 m resolution CBRA dataset of 2016–2021. To evaluate it, we first use independent testing samples to assess the performance of CBRA in urban and rural areas and compare it with other datasets both qualitatively and quantitatively (Sect. 5.1). Then, we test the time consistency of CBRA by using stable samples and other ISA datasets (Sect. 5.2). Finally, we analyze the BRA in China in 2016–2021 in terms of spatial distribution and temporal change (Sect. 5.3).
5.1 Accuracy assessment using testing samples
5.1.1 Quantitative analysis
The accuracy of CBRA is first assessed via the collected samples from urban scenes and rural scenes. The confusion matrix for building rooftop identification in urban scenes is given in Table 3, and the performance statistics in both urban and rural areas are given in Table 4.
In urban scenes, although CBRA is derived from Sentinel-2 imagery (10 m), it achieves a balanced result in TPs and TNs, with a higher F1-score value of 62.55 % (+10.61 %) compared to the previous 90-cities-BRA, which is derived from high-resolution GES imagery (1 m). In terms of IoU, CBRA obtains a score of 45.51 %, indicating that CBRA has a high classification accuracy for building rooftop pixels. In addition, the overall accuracy (OA) is slightly lower than 90-cities-BRA (−0.54 %): this is due to the several blob-like predictions of CBRA because of relatively low resolution (2.5 m) compared with 90-cities-BRA (1 m), which will be covered in more detail in Sect. 6.2. For recall, CBRA obtains 74.66 %, which is a great improvement (+27.29 %) compared with 90-cities-BRA, mainly because of our robust designation of the STSR-Seg framework. It is noteworthy that solely relying on OA to evaluate the performance of CBRA is inadequate due to the category-unbalanced nature of building rooftop extraction. The OA score may introduce a potential bias into this scenario (Shao et al., 2019; Uhl and Leyk, 2022), and therefore multiple metrics must be utilized when assessing the performance of CBRA.
In rural scenes, there is no publicly available building rooftop dataset in rural areas of China before our CBRA, and hence we compare CBRA with GHSL, which is human settlement layer data (resolution of 10 m), and we only evaluate them in terms of recall. The GHSL is a result of a coarser level compared with the building rooftop (e.g., including impervious surfaces like roads and city squares), thus achieving the highest recall value (80.89 %) in rural scenes. However, CBRA is very close to it (78.94 %), with a gap of only 1.95 %, indicating its reliability in predicting building rooftops in rural areas. Considering the varieties of urban and rural test samples, it should be mentioned that the presented results in Table 4 intend to compare product to product rather than to demonstrate performance differences between urban and rural areas.
Table 3Statistics of the confusion matrix for building rooftop extraction in urban scenes.
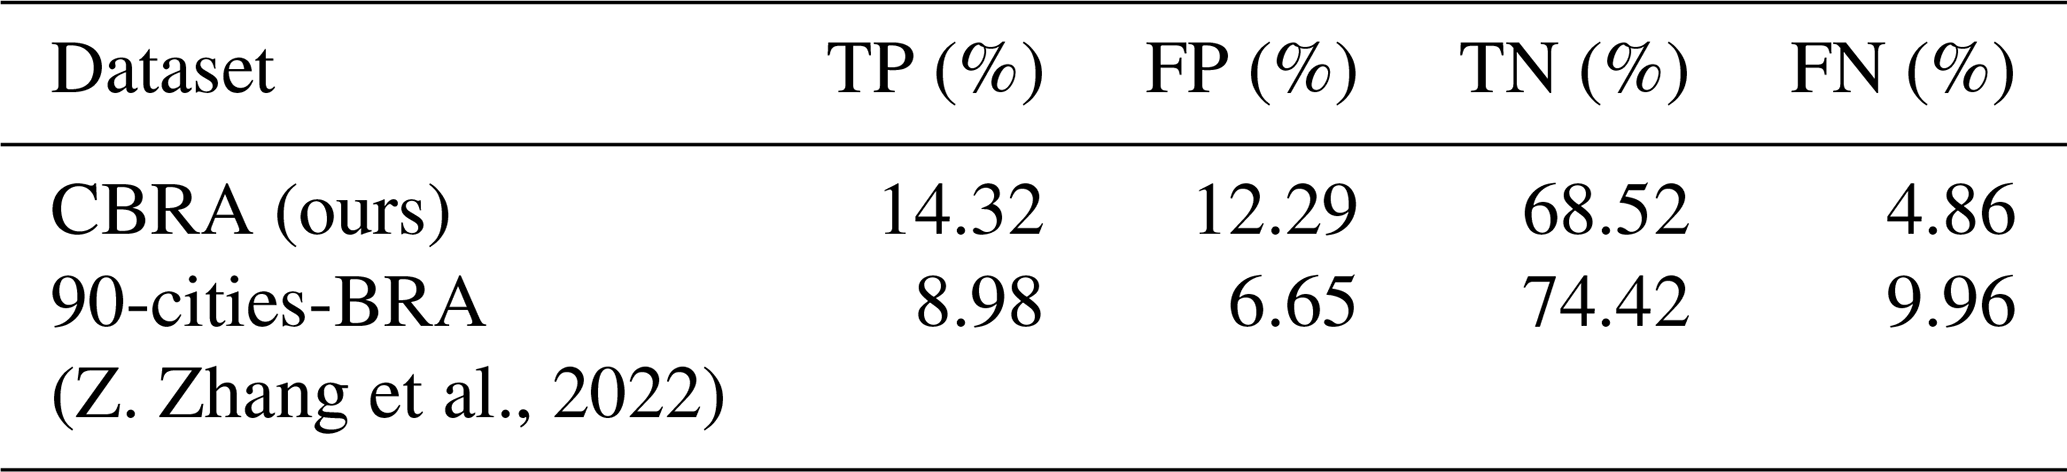
Table 4Performance metrics for building rooftop extraction. Only recall with respect to OSM data is reported in rural areas due to the challenges of accurately calculating other metrics caused by omissions in the OSM data.
* 90-cities-BRA does not include the rural area in China.
5.1.2 Qualitative analysis
To further test the performance of CBRA, we select several examples from our testing set to analyze and compare our results in both urban and rural areas. As shown in Fig. 9, in urban areas, our CBRA and 90-cities-BRA are generally similar in the region where buildings are well separated, e.g., Fig. 9a2 and b2. The difference is mainly in the rooftop details: CBRA ignores several vertices on the boundary, thus achieving blob-like results, which is mainly due to the resolution gap as shown in Fig. 9c1 and d1. In the dense urban areas, especially in the old town where the distance between buildings may be less than 2.5 m, CBRA treats buildings as blocks (e.g., Fig. 9a1). However, CBRA has more complete building rooftops and fewer false predictions of the background (e.g., the road) compared with 90-cities-BRA, as shown in Fig. 9c2 and d2, which explains the smaller value of the FP of CBRA in Table 3. In addition, 90-cities-BRA utilizes the GES images as the data source. Although GES images have a high spatial resolution (e.g., 1 m), GES images are provided by different satellites simultaneously and do not have consistent geographic offsets and acquisition times. CBRA utilizes a super-resolution technique to extract 2.5 m results only from the Sentinel-2 satellite, ensuring the reliability of the geography and the acquisition time as shown in Figs. 10 and 11.
In rural areas, as shown in Fig. 12, CBRA also provides building rooftop areas, while 90-cities-BRA does not include them. Although it is difficult to identify individual buildings from the Sentinel-2 images, CBRA still extracts them, as shown in Fig. 12e and f. Compared to other datasets that provide information related to buildings in rural areas, CBRA is at a significant fine-grained scale, albeit with a greater presence of block areas in rural versus urban environments (Fig. 13).
In summary, CBRA achieves higher performance in extracting building rooftops (TPs) and suppressing the false prediction in the background (FPs), with 62.55 % (+10.61 %) in terms of F1 score compared with 90-cities-BRA. In addition, CBRA has a full coverage of China, including the rural areas at a finer scale rather than other existing full-coverage and thematically related products. However, a decline in accuracy in rural areas, consistent with prior studies (Leyk et al., 2018; Kaim et al., 2022), has been observed. In addition, the temporal coverage of CBRA spans 6 years (2016–2021), which is the first available building rooftop data with a span of time. The temporal information in CBRA will be analyzed in Sect. 5.2.
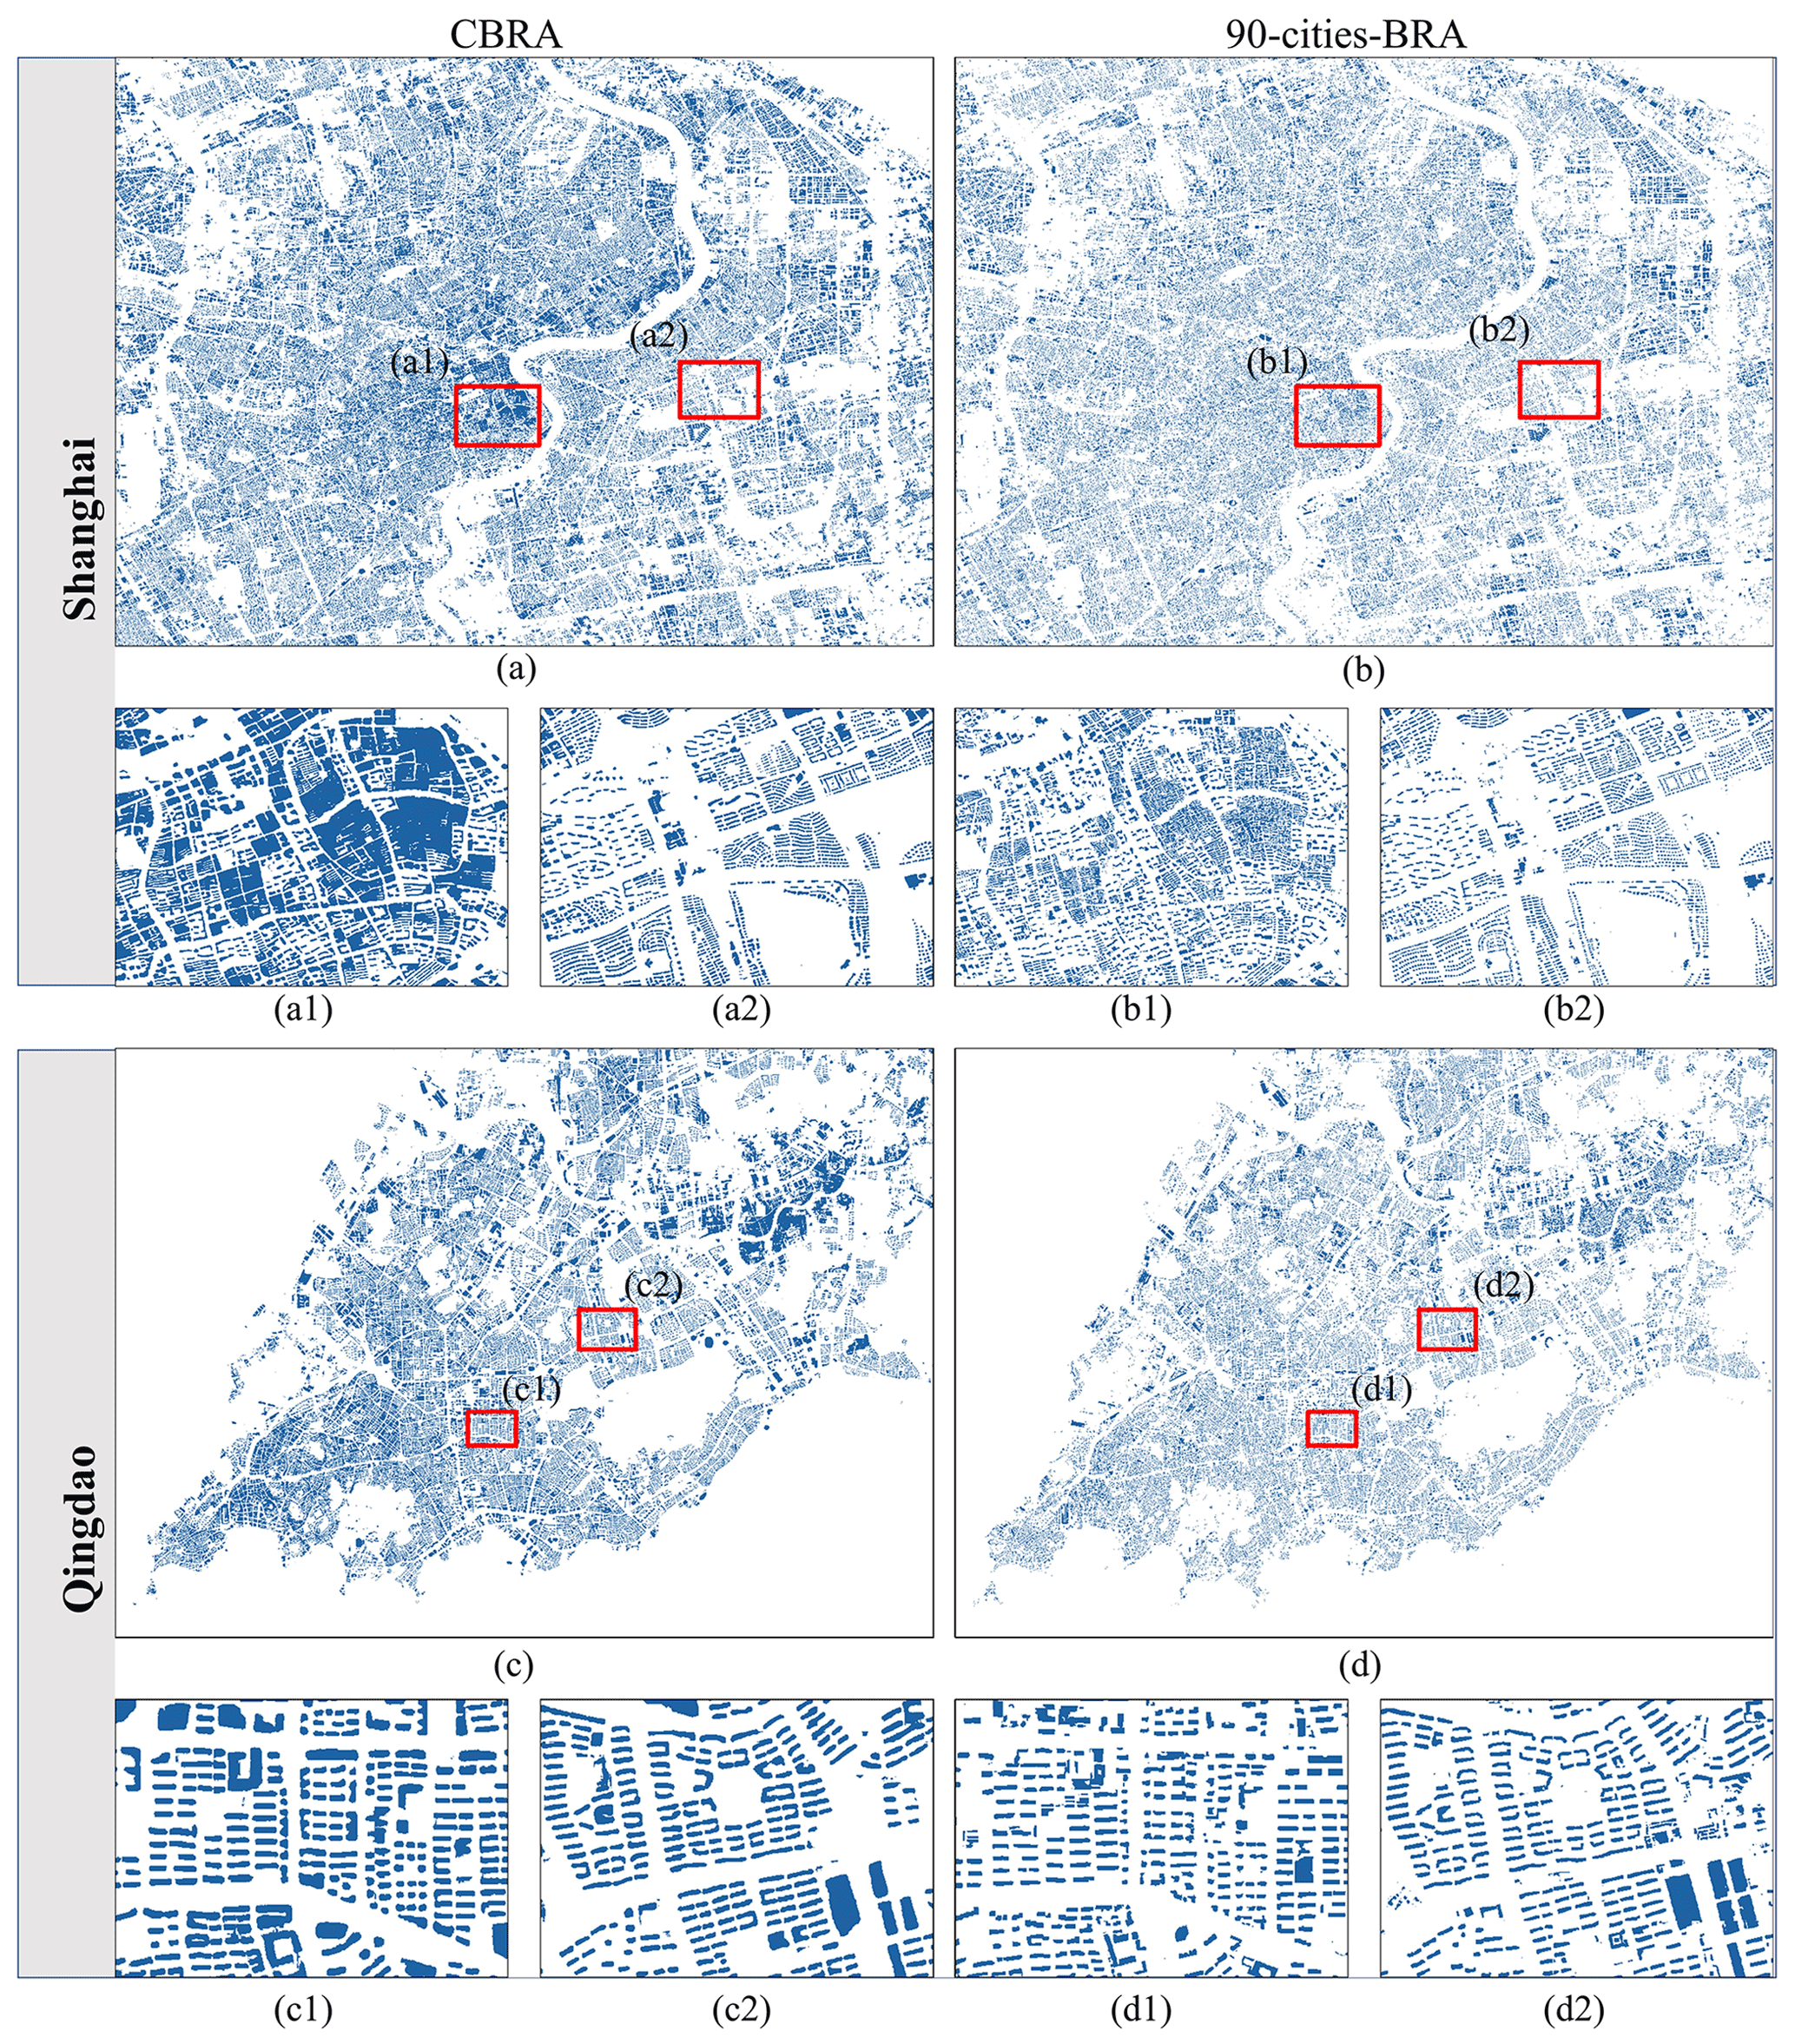
Figure 9Comparison of CBRA and 90-cities-BRA (Z. Zhang et al., 2022) over the sampled urban regions in Shanghai and Qingdao. Panels (a) and (c) are the results of our CBRA. Panels (b) and (d) are results of 90-cities-BRA.
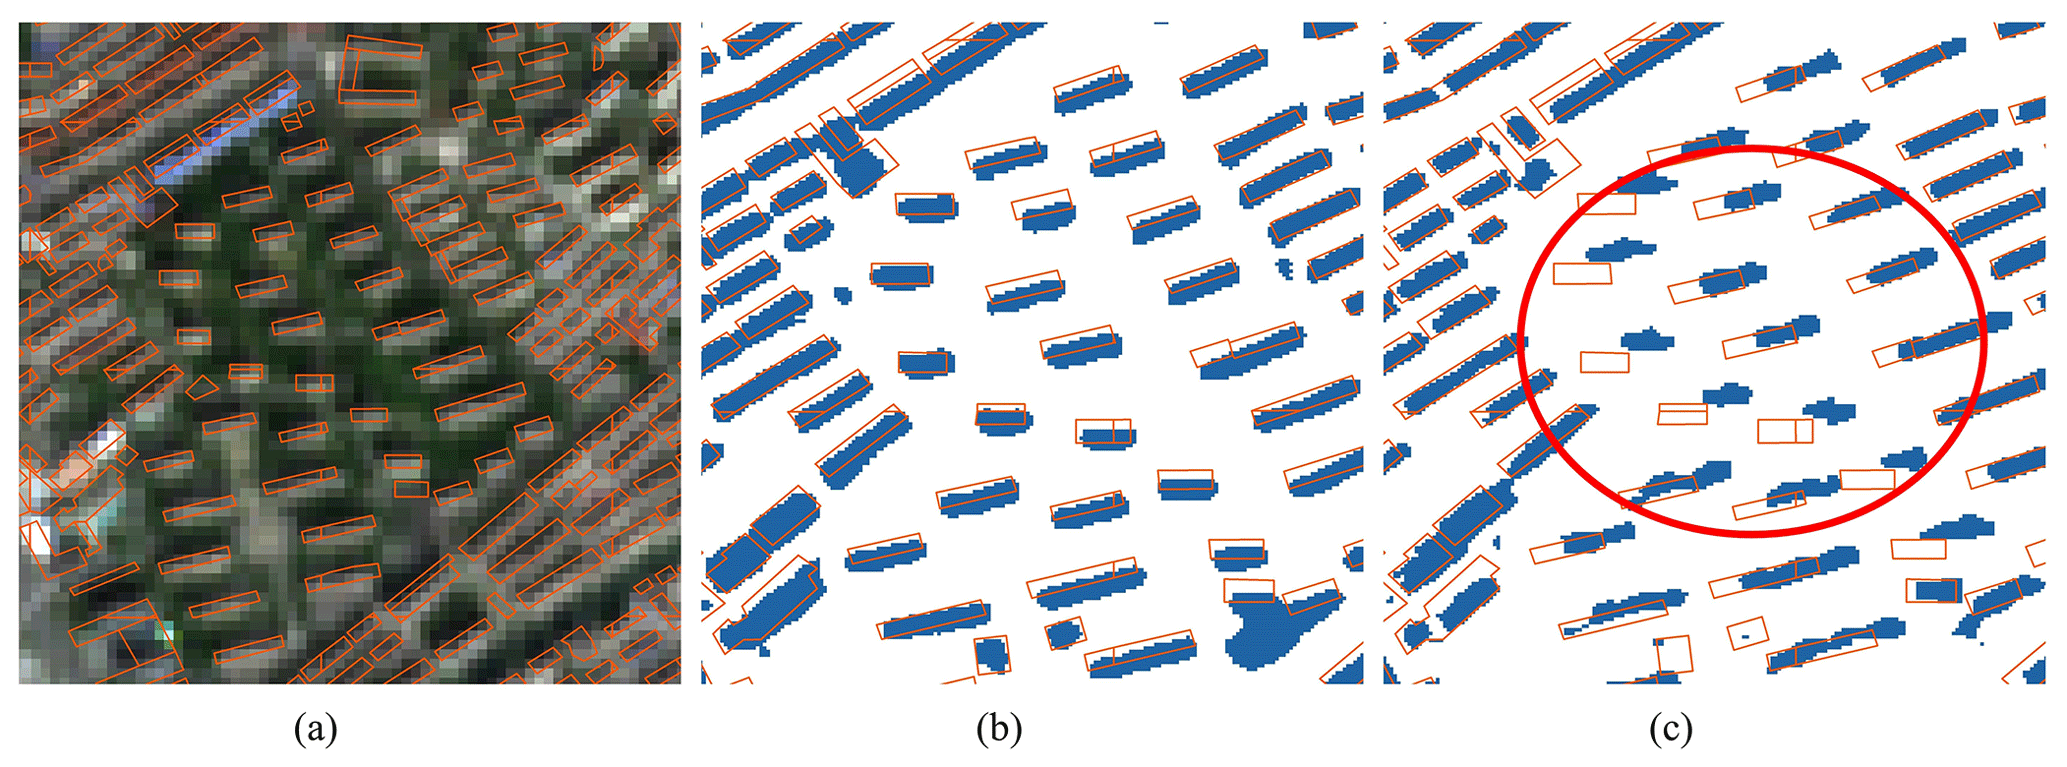
Figure 10Example of the inconsistent geographical offset of the previous dataset (121.531467∘ E, 31.299903∘ N). (a) The Sentinel-2 image with survey rooftop data (imagery © ESA). (b) Result of CBRA. (c) Result of 90-cities-BRA (Z. Zhang et al., 2022). One can observe that the result from 90-cities-BRA has a geographical offset, as the red circle indicates. CBRA uses the imagery only from the Sentinel-2 satellite, ensuring the reliability of the geographical positions.
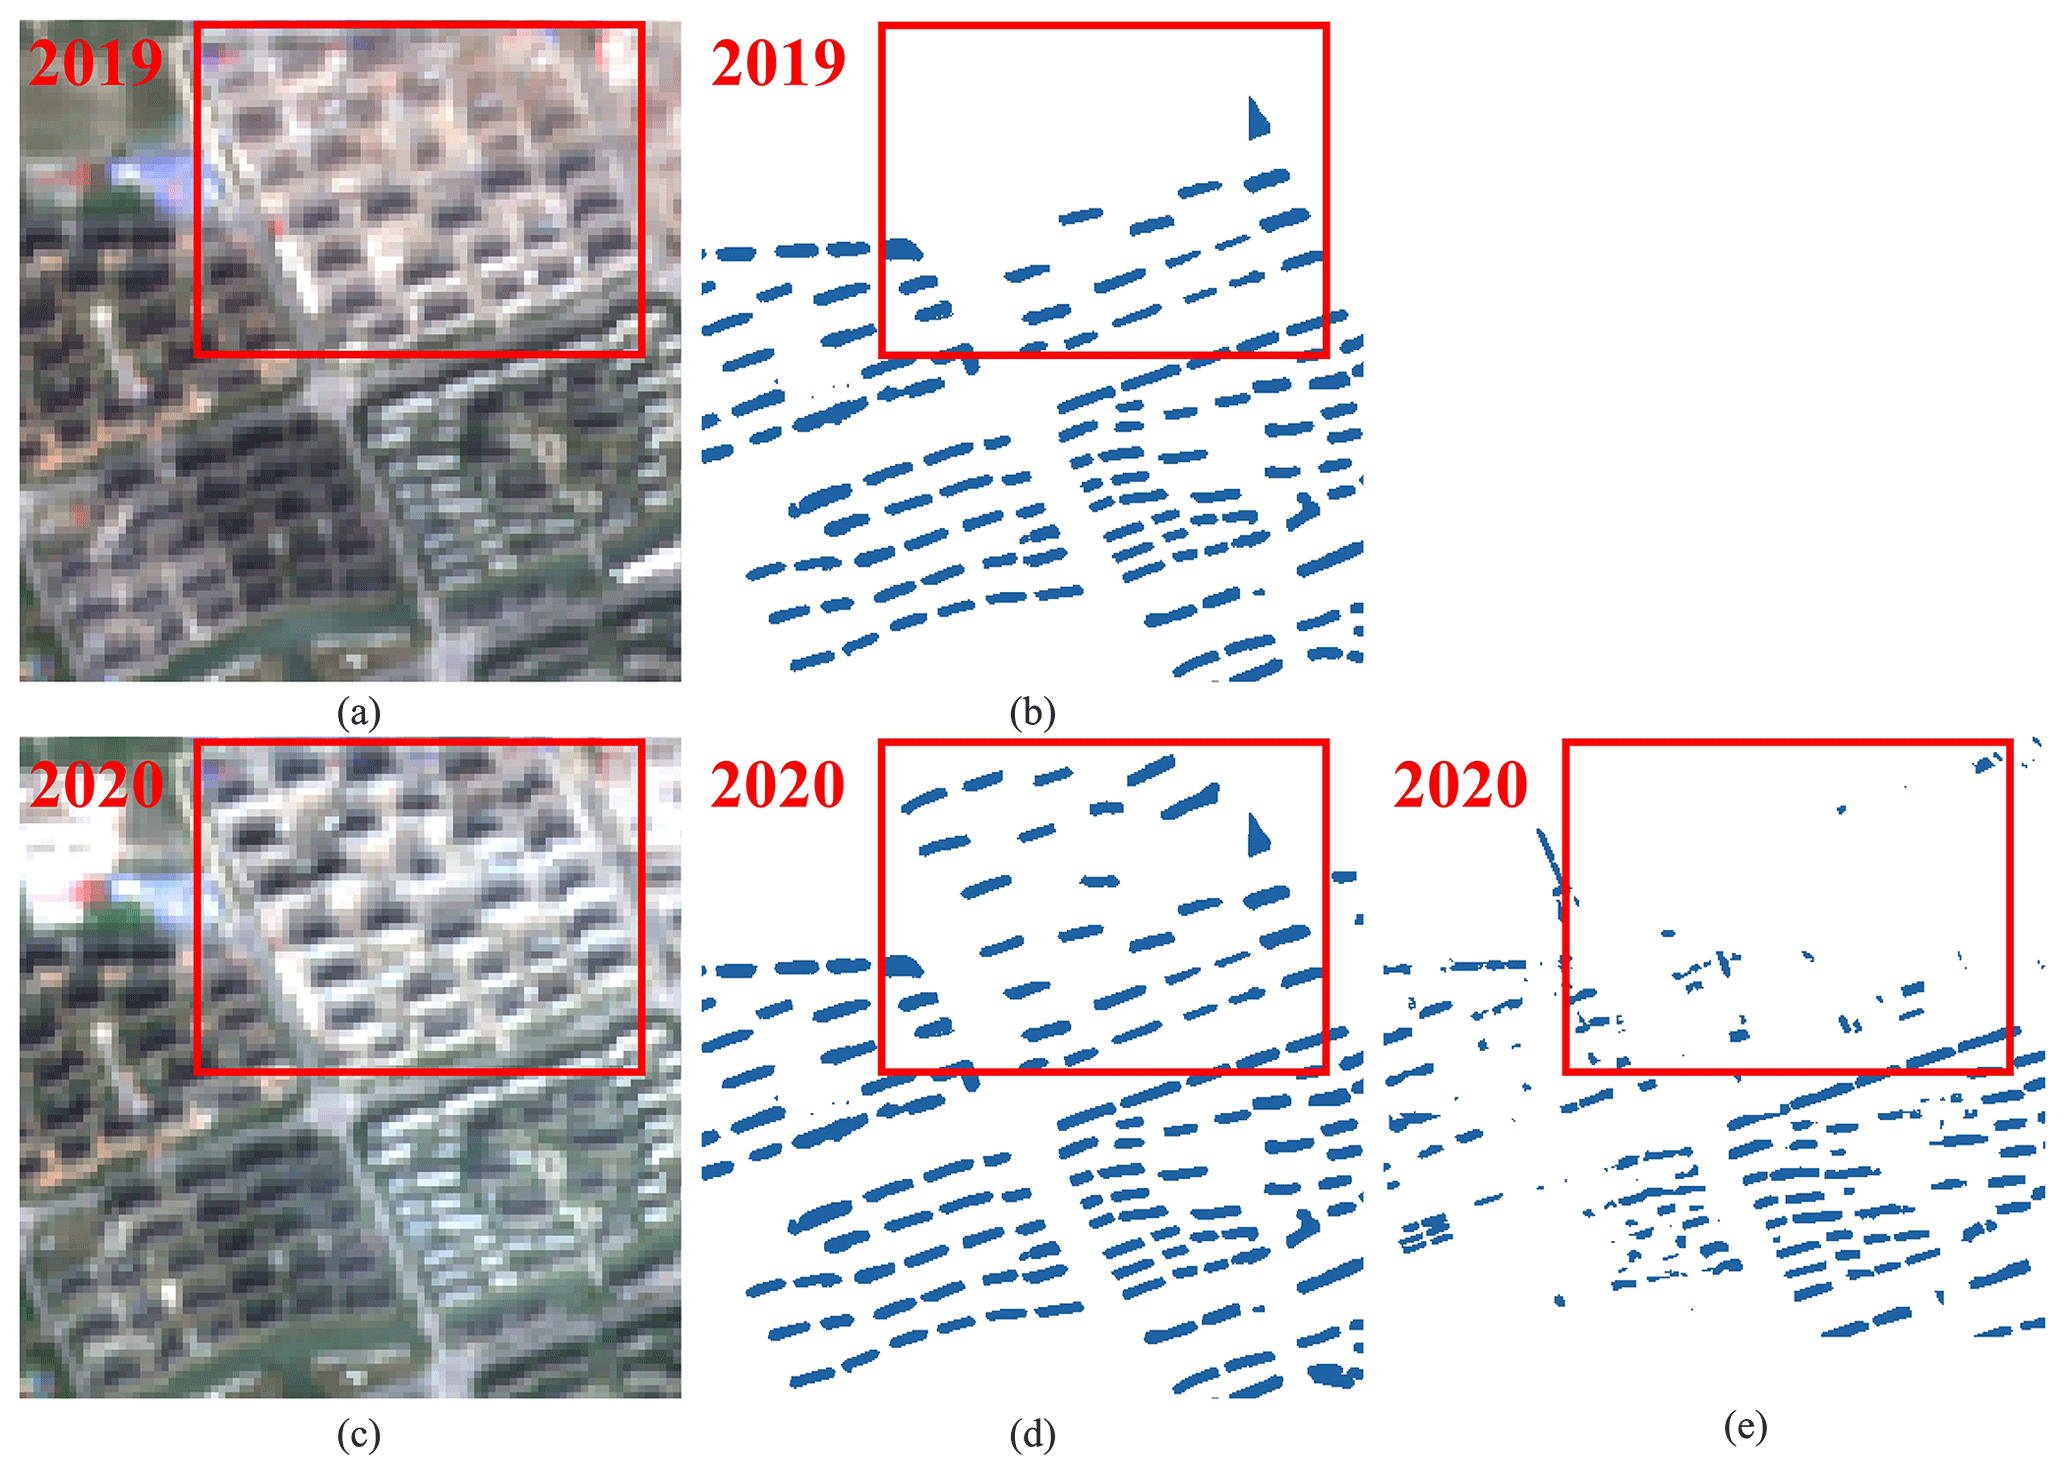
Figure 11Example of the inconsistent acquisition time of the previous dataset (121.341982∘ E, 30.762489∘ N). (a) The Sentinel-2 image in 2019 (imagery © ESA). (b) Result of CBRA in 2019. (c) The Sentinel-2 image in 2020 (imagery © ESA). (d) Result of CBRA in 2020. (e) Result of 90-cities-BRA (Z. Zhang et al., 2022) in 2020. CBRA uses the image with a specific acquisition time, ensuring the reliability of the results in terms of temporal consistency.
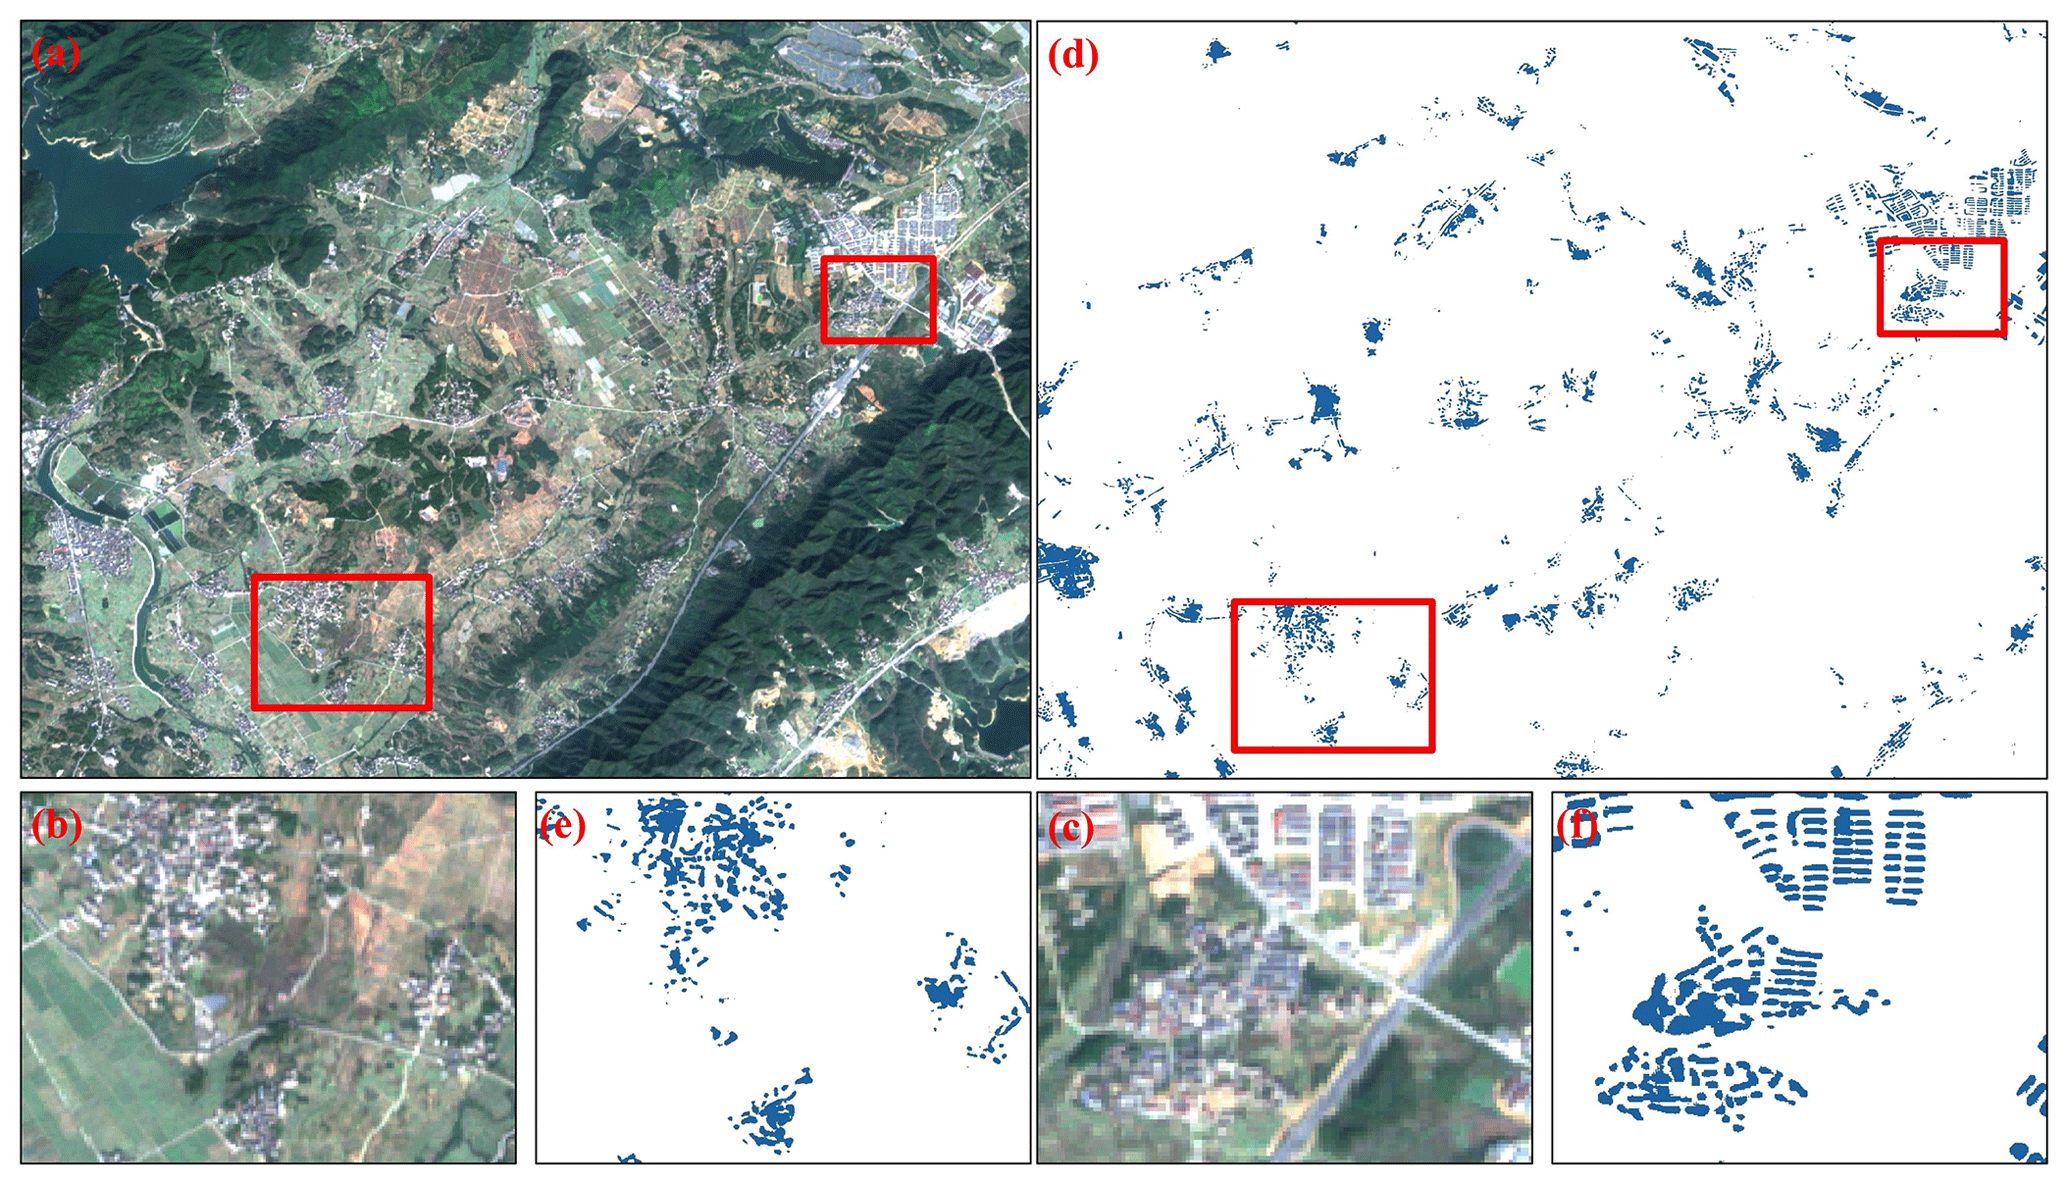
Figure 12Example of the rural area (118.328041∘ E, 28.817881∘ N). (a–c) Sentinel-2 images (imagery © ESA). (d–f) Results of CBRA.
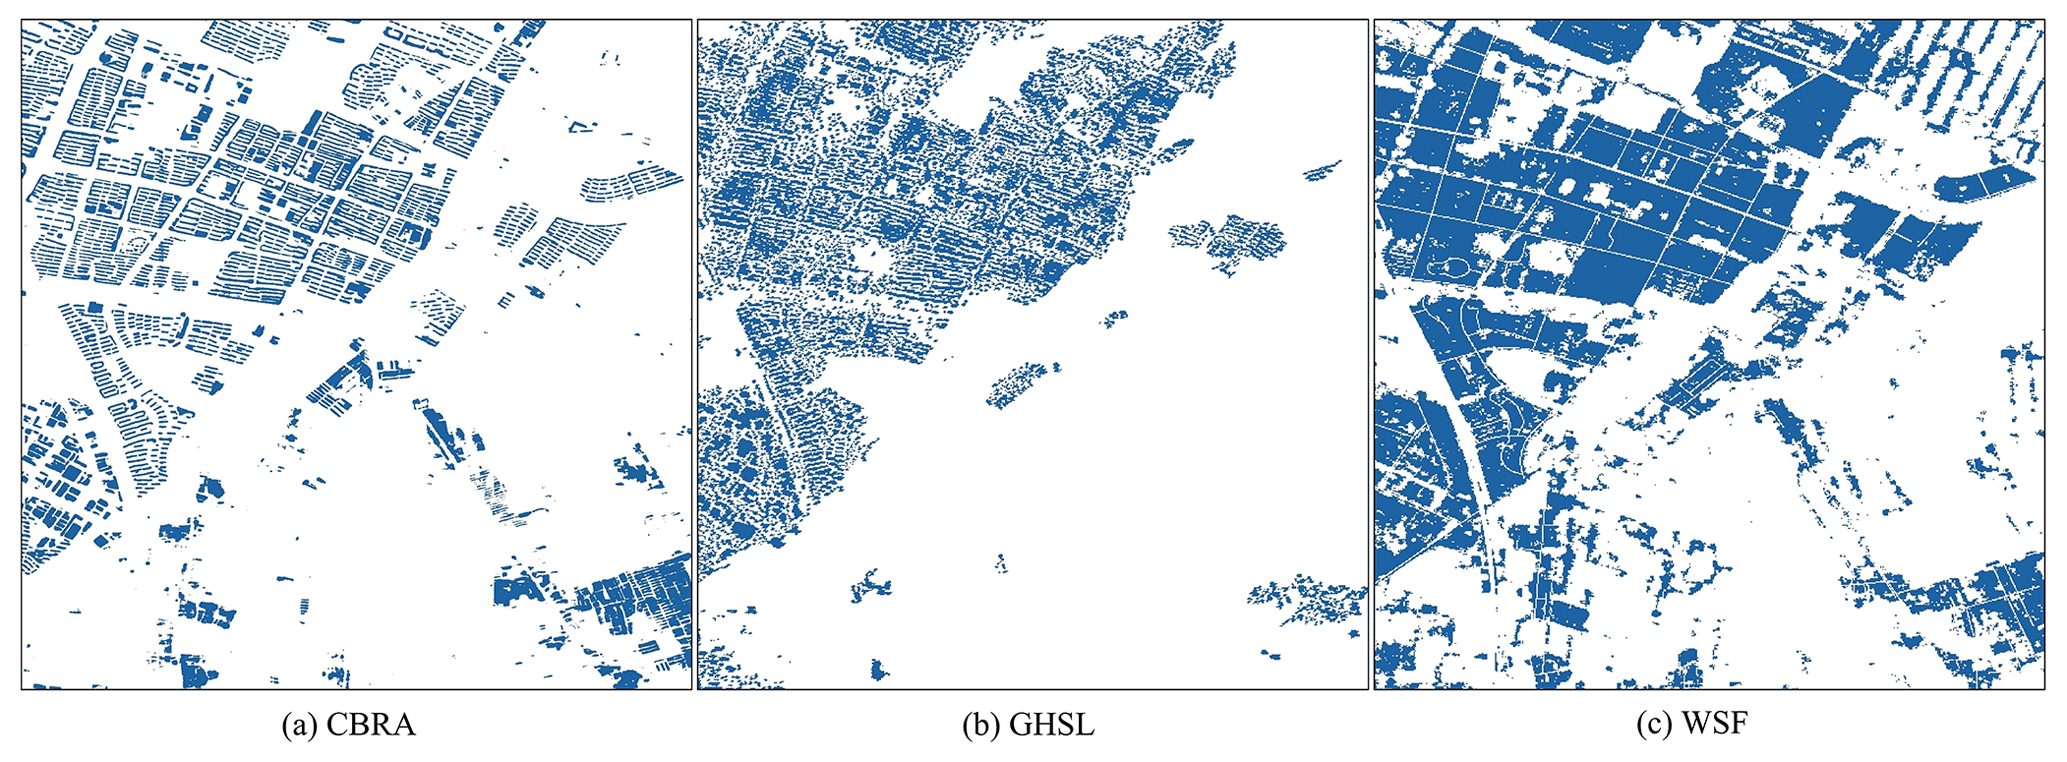
Figure 13Comparison of CBRA and the other datasets over the sampled rural region (106.352257∘ E, 38.533718∘ N). (a) CBRA. (b) GHSL (Corbane et al., 2021). (c) WSF (Marconcini et al., 2020).
5.2 Temporal consistency analysis
To evaluate the temporal characteristics of CBRA, we first test the performance of CBRA in three regions, i.e., the old town of Beijing, Hong Kong SAR, and Macao SAR, where the distribution of the building is almost stable without change based on our a priori knowledge. We utilize the survey rooftop data collected in 2019 to quantitatively demonstrate the accuracy as shown in Fig. 14. Overall, CBRA shows good performance consistency with little variation over 2016–2021. One may observe that the accuracy fluctuates between 2016 and 2017, and there are two potential reasons for this. The first is the relatively long interval between the sampling time of survey data (2019) and the year 2016. The second is that the results for 2016 are not checked by temporal homogeneity due to the lack of temporal information; thus, its reliability is slightly lower compared to other years.
The well-known annual ISA products can provide time span information for the evaluation. Thereby, we compare CBRA with the ISA of CLCD (CLCD-ISA) (Yang and Huang, 2021) and GAIA (Gong et al., 2020b). We calculate fractions of foreground pixels within the 0.10∘ × 0.10∘ spatial grid for each year and then estimate the correlation coefficients (R2) between CLCD-ISA and GAIA to quantitatively demonstrate their agreement. Overall, CBRA shows good consistency with the ISA products over the time span (), indicating the reliability of CBRA (Fig. 15).
Although good agreement has been found between 2016 and 2019, 2020 and 2021 are not checked because the annual ISA products with close resolution are not available for these years. However, the training material for producing CBRA contains Dynamic World (Brown et al., 2022), which is a timely updated product providing built land cover, and CBRA is therefore in very good agreement with it from 2016 to 2021 (), also indicating the reliability of CBRA.
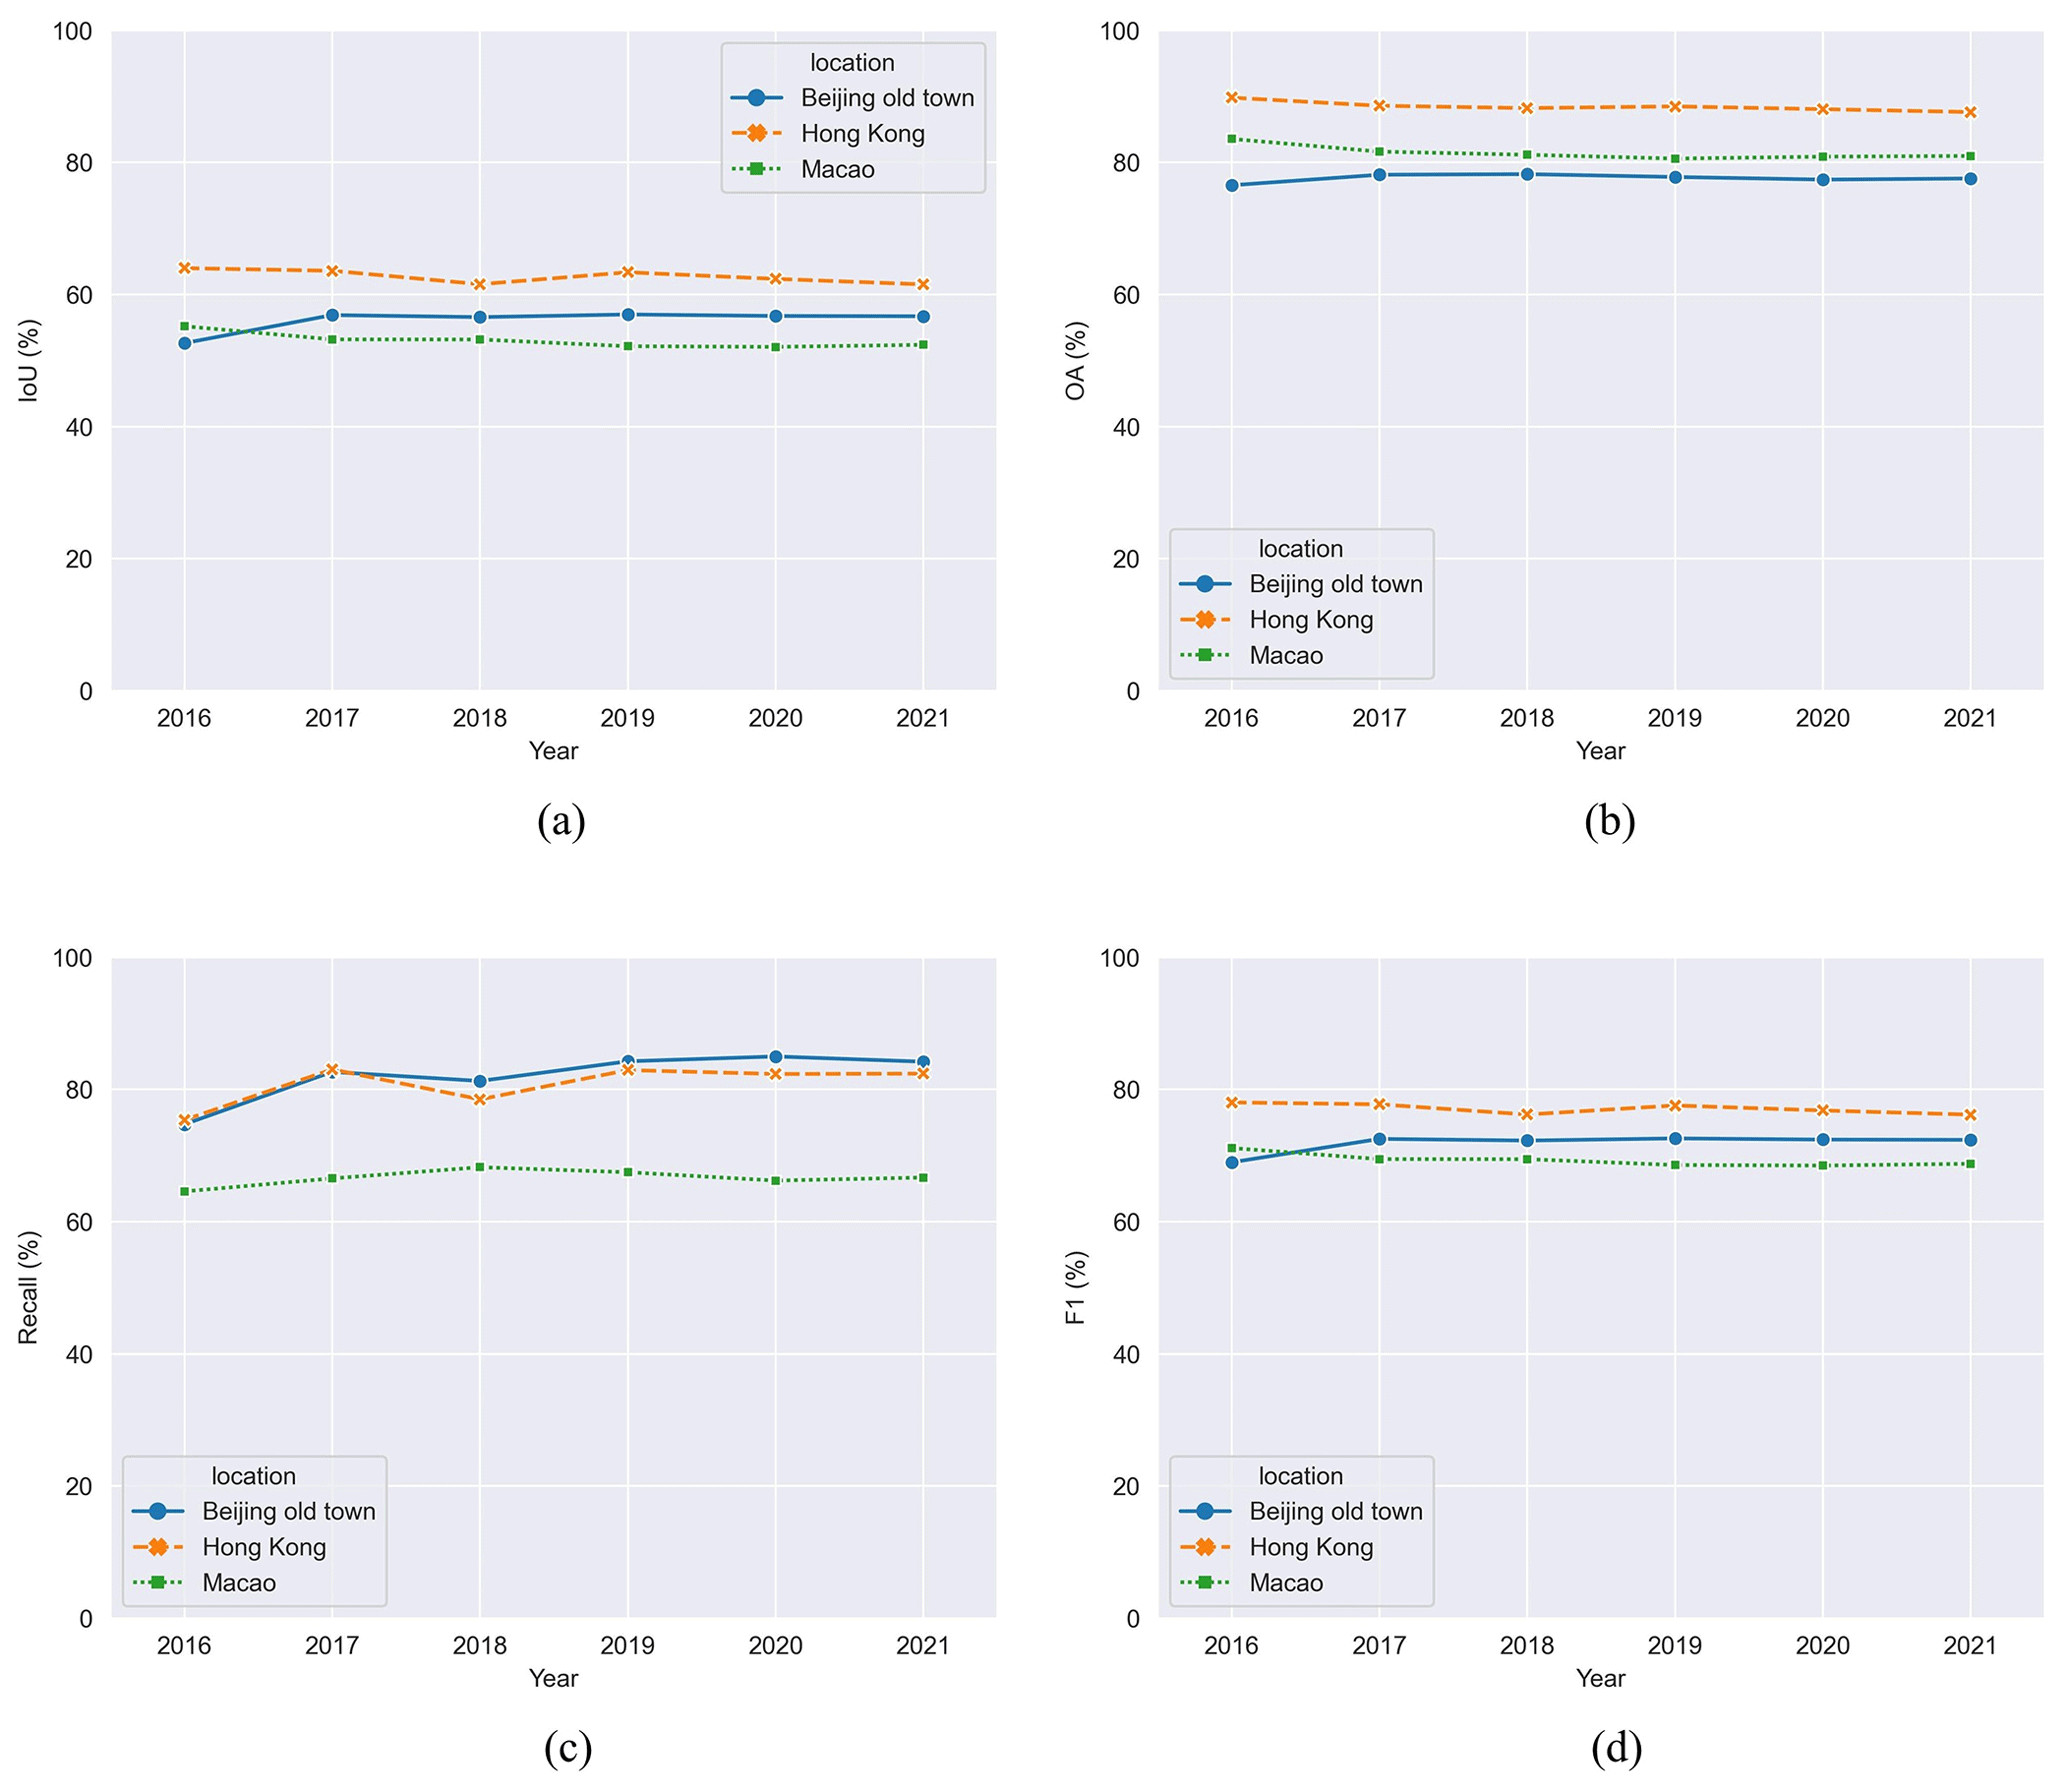
Figure 14Accuracy of CBRA in the building-stable regions over 2016–2021. (a) IoU. (b) OA. (c) Recall. (d) F1 score.
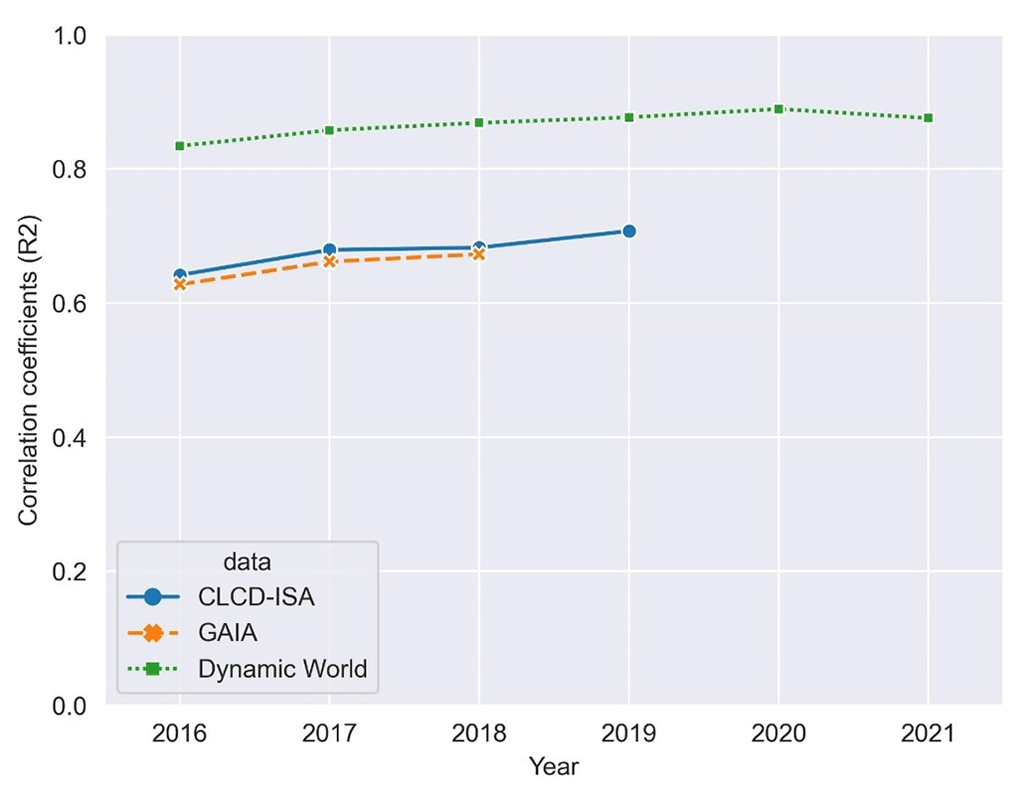
Figure 15The correlation coefficients of the fraction of the foreground pixels between CBRA and two thematically related datasets for each year. The fraction is aggregated within the 0.10∘ × 0.10∘ spatial grid.
5.3 The spatial and temporal characteristics of the China BRA from 2016 to 2021
The statistical result of the average area of building rooftops in China from 2016 to 2021 is shown in Fig. 16. From the perspective of spatial distribution, there are three main city clusters in China: (a) the North China Plain (NCP), (b) the Yangtze River Delta (YRD); and (c) the Greater Bay Area (GBA). The NCP is the largest alluvial plain in China: 19.8 % of the population lives here (280 million out of 1.4 billion) and occupies 30.4 % of the building rooftop areas (27 277 out of 89 826 km2), which indicates more developed primary and secondary industries in the region (more industrial buildings and farm buildings). The YRD is dominated by Shanghai and is one of the regions with the most active economic development, providing 24.1 % of the GDP of China; 16.4 % of the population (236 million) lives here and occupies 16.0 % of the building rooftop area (14 342 km2). The ratios of population and building areas are almost equal, indicating a more developed tertiary industry in the region. The GBA is a city cluster consisting of 11 cities including Guangzhou, Shenzhen, Hong Kong SAR, and Macao SAR and is the largest and most populated urban area in the world; 6.0 % of the population lives here (86 million) but occupies only 3.9 % of the building rooftop areas (3472 km2), indicating that the region has a developed tertiary industry along with a high population density and a tighter housing supply.
Figure 17 quantitatively summarizes BRA and its changes on the three city clusters from 2016 to 2021. Overall, the China BRA has increased over the past 6 years, with more than 110 000 km2 in 2021, which is an increase of 34 000 km2 compared with 2016 (Fig. 17a). In addition, Fig. 17b indicates that the proportion of BRA on the NCP and YRD has obviously increased, while the proportion of the GBA and other regions except these three city clusters slowly declined from 2016 to 2021. Specifically, the proportion of the NCP increased the most, from 27 % to 31 %, while the proportion of other regions clearly decreased, from 53 % to 49 %. The change in the proportion reveals that the urbanization in China is characterized by the concentration of large city clusters. Lastly, Fig. 17c illustrates the statistic of BRA change from 2016 to 2021 and the expansion area on each city cluster, respectively. Specifically, the NCP has the largest increase, with a total of 13 081 km2 (from 20 884 km2 in 2016 to 33 966 km2 in 2021).
The spatial distribution of the temporal changes in building rooftop area in China is shown in Fig. 18. It can be observed that the BRA in developed regions, such as coastal regions, is increasing, while the BRA in less developed regions, such as the northeastern, northwestern, and southwestern regions of China, is decreasing. Figure 18b and c are two examples of building demolition and construction, showing the removal of dense buildings (e.g., shack houses) in the rural area and the establishment of buildings (e.g., apartments) in the urban area, respectively. More comprehensible references about the building change can be found in Figs. S5, S6, and S7. For simplicity, we only show building dynamics in a one-way conversion pattern.
Overall, we establish the relationship between the BRA of China with the natural and economic spatial difference, which also validates the accuracy of CBRA. The analysis of its temporal change reveals the spatiotemporal trends of the BRA in China. Further analysis will be left for exploration in the future.
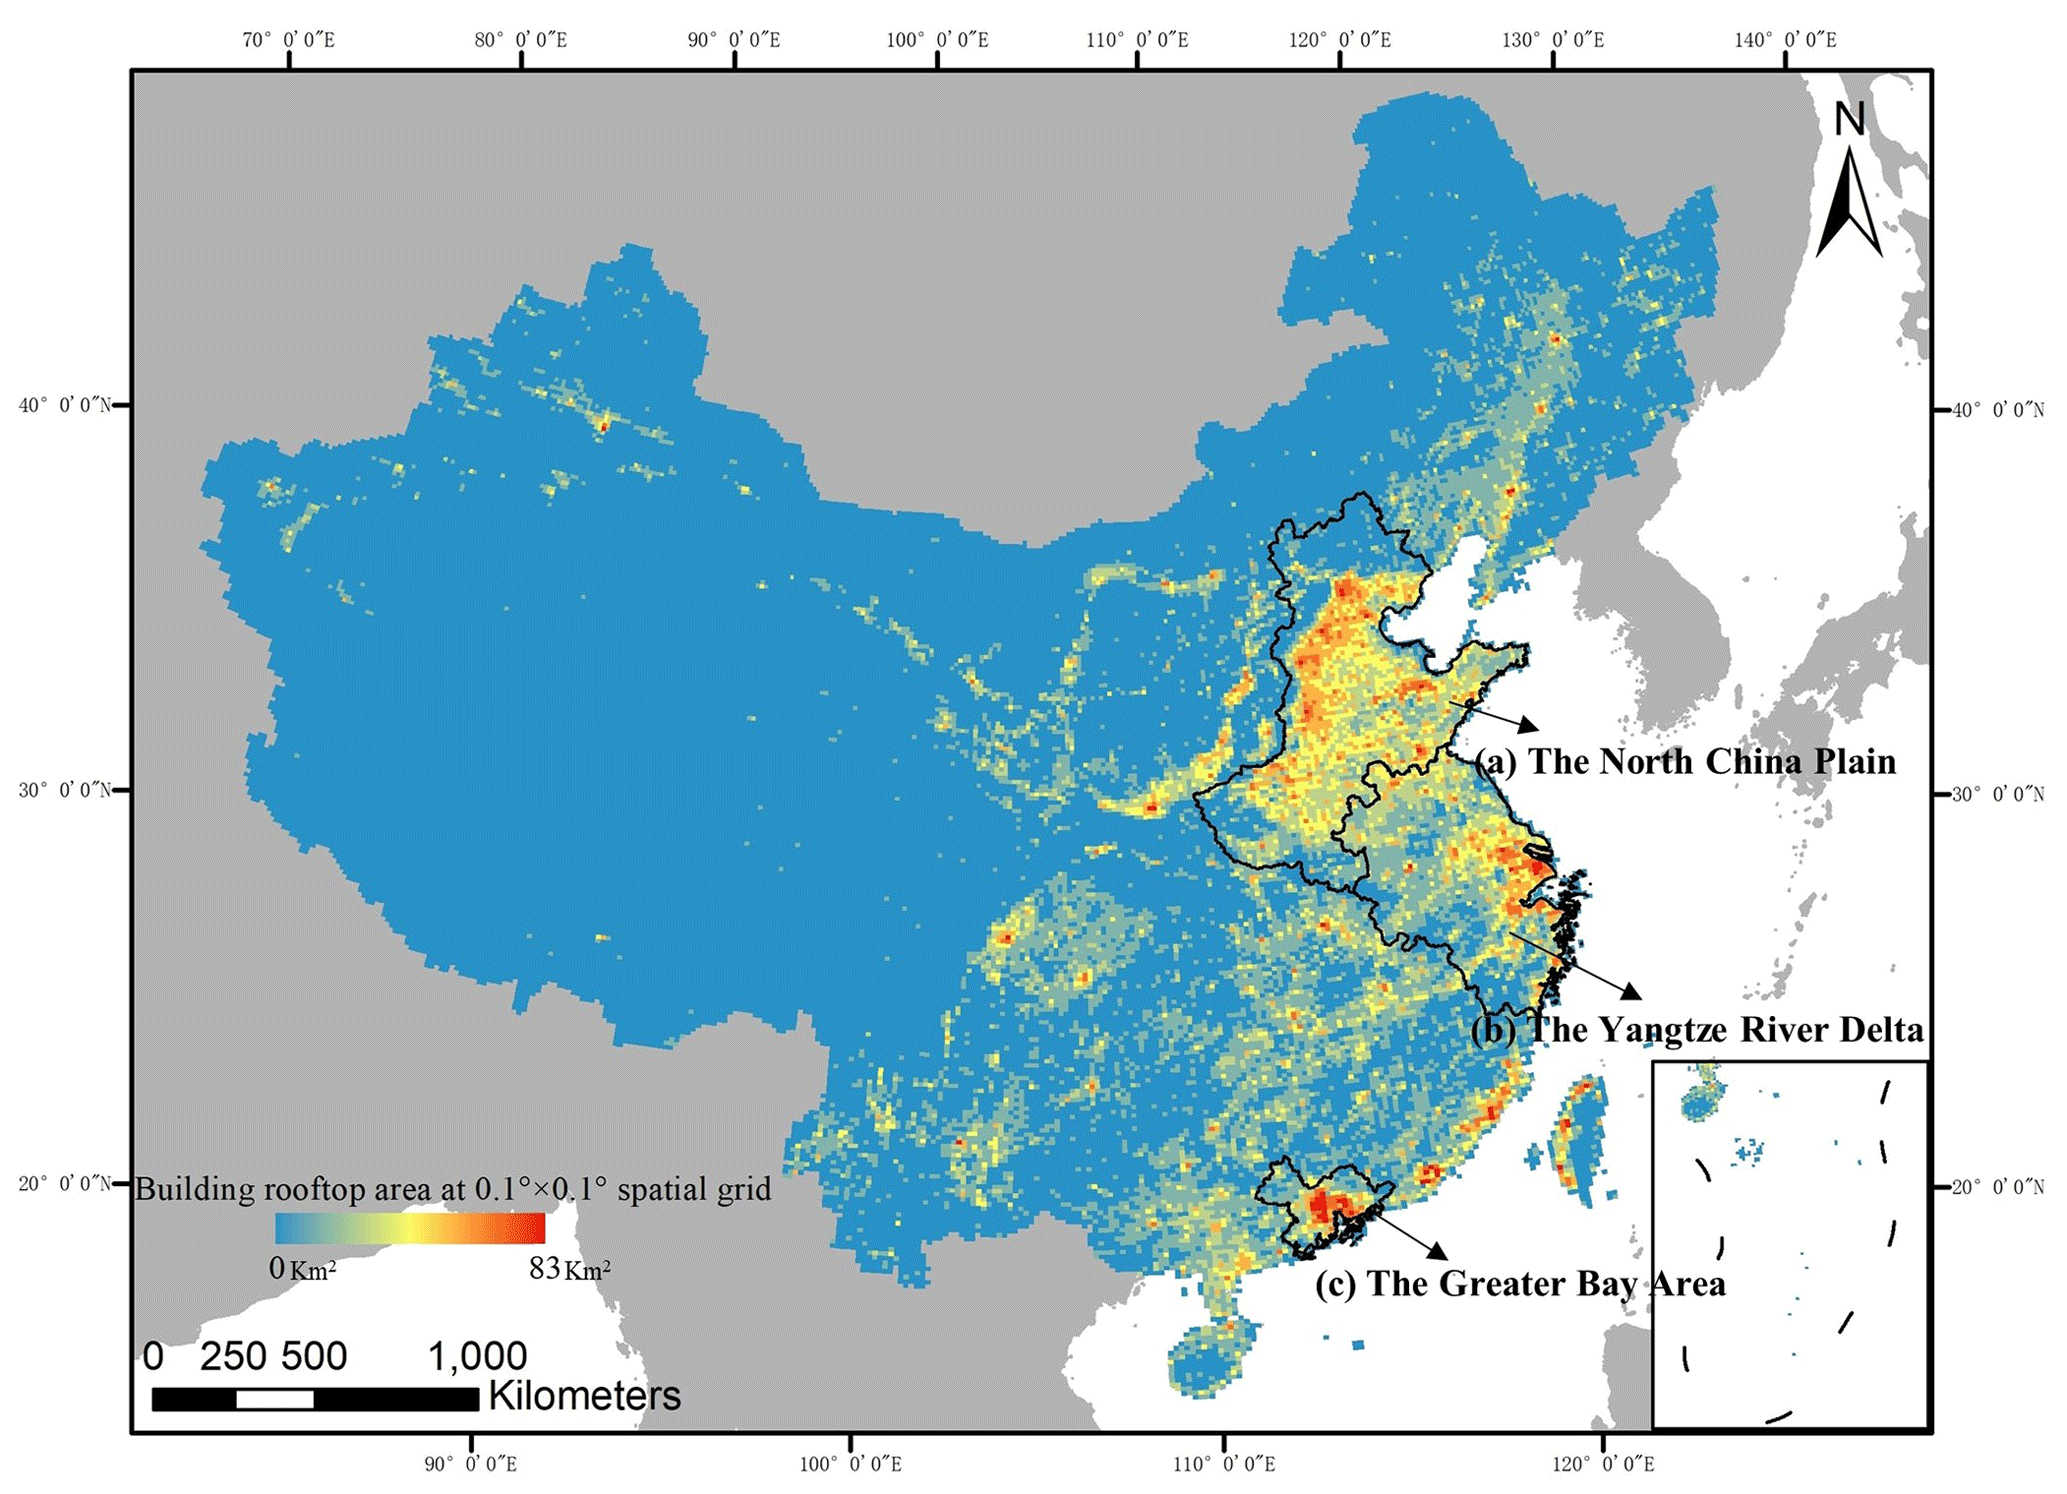
Figure 16The spatial distribution of the average area of building rooftops in China over the period of 2016–2021. The area fraction is aggregated within the 0.10∘ × 0.10∘ spatial grid. Base map © OpenStreetMap contributors 2023. Distributed under ODbL v1.0.
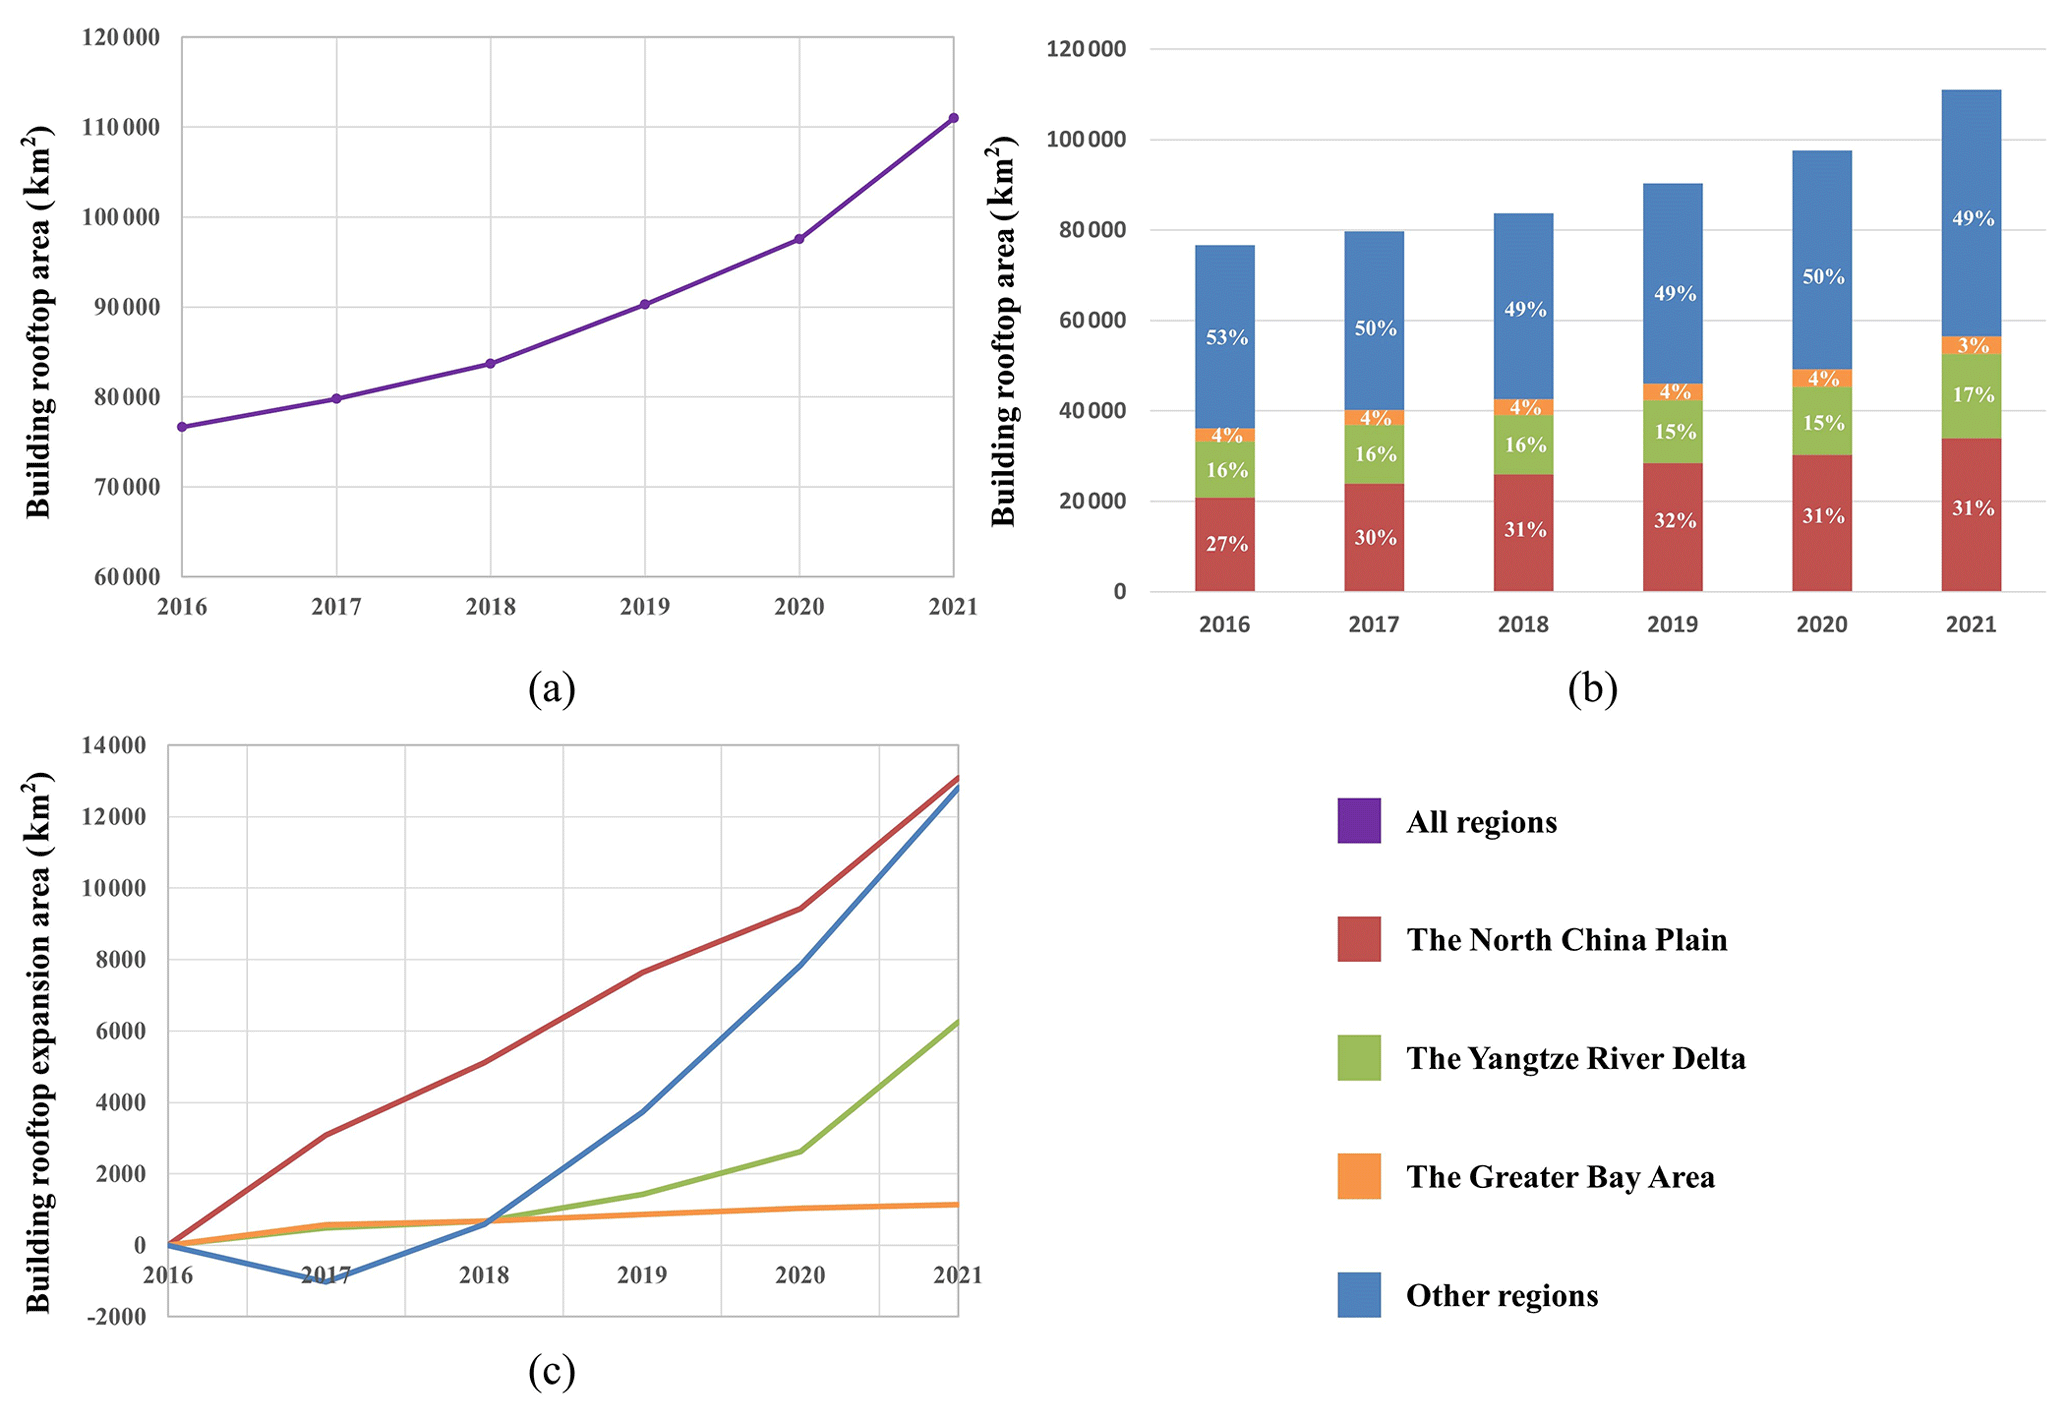
Figure 17The change in the building rooftop area of China and the three biggest city clusters in China (NCP, YRD, and GBA) over the period of 2016–2021. (a) The annual statistic of building rooftop area in China. (b) The proportion of the building rooftop of the biggest city clusters in China and other regions from 2016 to 2021. (c) The increased building rooftop area on each city cluster and other regions.
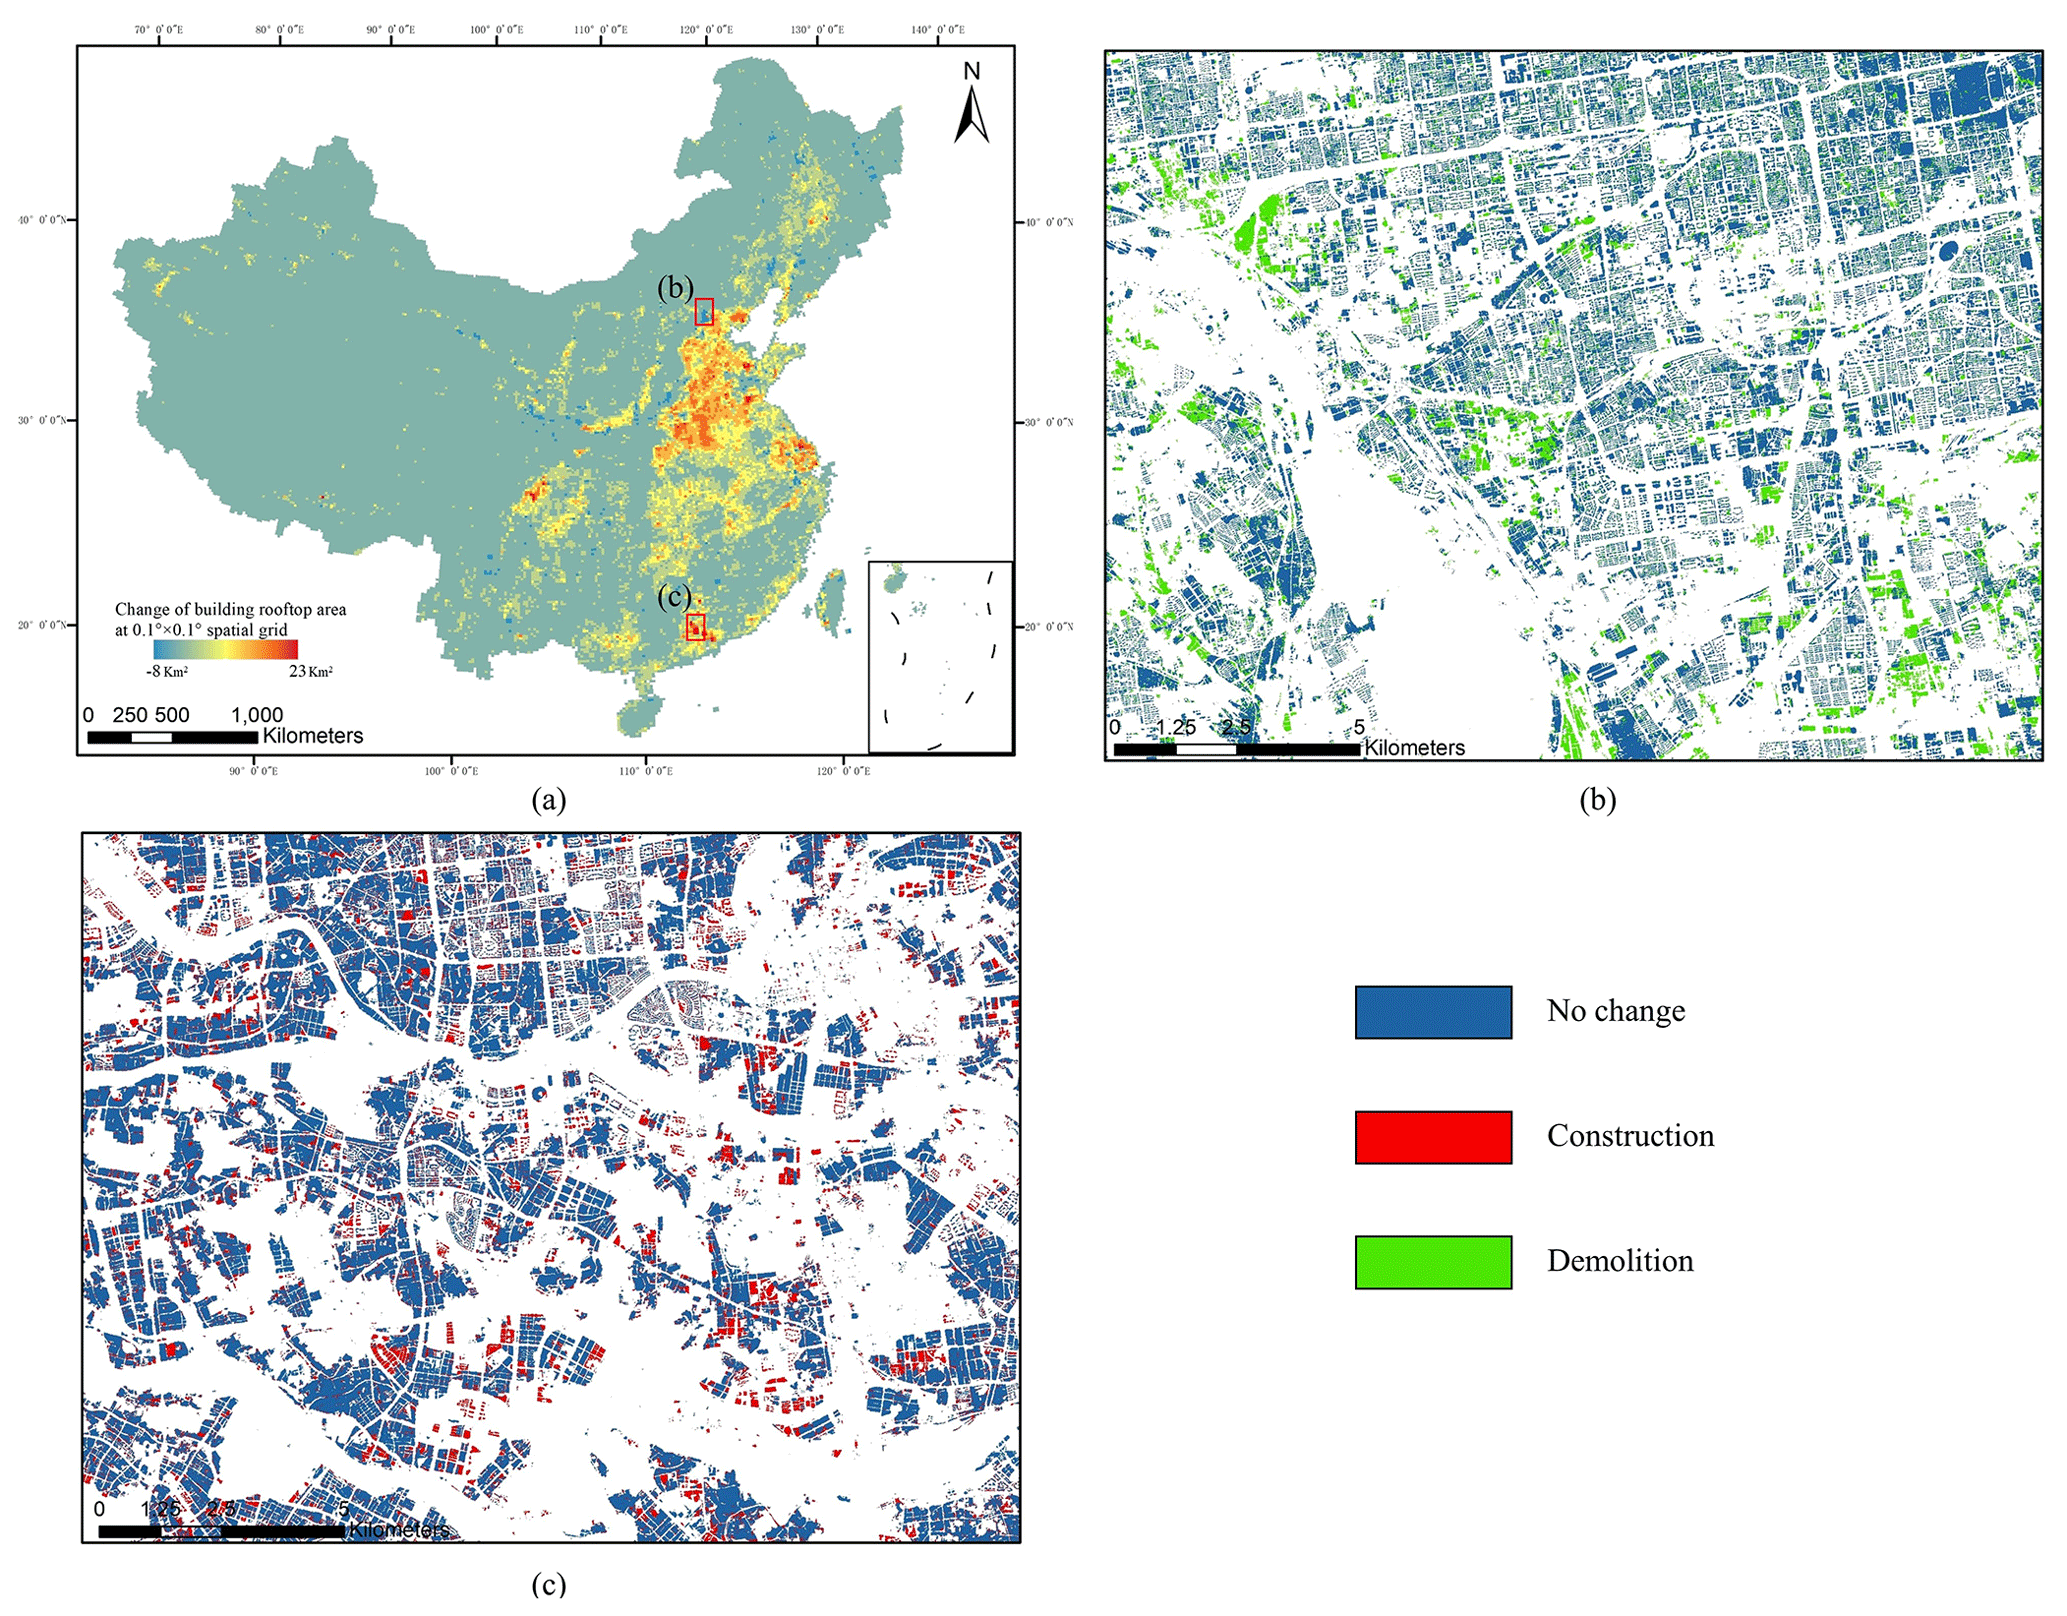
Figure 18(a) The spatial distribution of the annual change in building rooftop area over the period of 2016–2021. The area fraction is aggregated within the 0.10∘ × 0.10∘ spatial grid (base map © OpenStreetMap contributors 2023, distributed under ODbL v1.0). (b) An example of the demolition of the building (116.275761∘ E, 39.844715∘ N) from 2016 to 2021. (c) An example of the construction of the building (113.130952∘ E, 22.948144∘ N) from 2016 to 2021.
6.1 Importance of the spatiotemporally aware learning
In this paper, we develop a deep-learning framework (STSR-Seg) for robust building rooftop extraction. The overall framework contains a super-resolution pipeline for up-sampling the input resolution, a semantic segmentation pipeline for obtaining pixel-wise building rooftop classifications, and the designed spatiotemporally aware learning with three dedicated learning algorithms (i.e., loss functions). Here, we mainly ablate the three dedicated designed learning algorithms to reveal their importance.
The baseline is the naive structure of super-resolution and semantic segmentation pipelines, i.e., EDSR as the super-resolution module, our modified Unet as the semantic segmentation head, and the loss function as only the binary cross-entropy loss (Eq. 1). The results of our ablation experiments are shown in Fig. S8. By disabling each learning strategy in turn from the baseline, we observe the impact on F1 testing performance: SG has the most significant effect, followed by the TC.
The SG loss (Eq. 6) is designed to leverage the information from full-coverage but low-resolution land cover data to achieve larger-scale weak supervision for the model training. Essentially, to achieve the SG loss, one needs to increase the number of training resources and therefore greatly improve the accuracy of our data-driven method (+2.38 % in terms of F1 score). Even when high-resolution references are available, incorporating low-resolution land cover information into the training process through collaboration as supervised information is found to be beneficial (Table S4). In addition, we qualitatively find that using SG loss will prevent the model from falling into unexplained repeated predictions, as shown in Fig. S9. Without utilizing SG loss as supervision, the model can only converge to a limited number of training resources, i.e., the collected data. When applied to a large scale (e.g., national scale), the complexity of the background in remote-sensing images will significantly increase, which causes serious false alarms due to larger intra-class variance, therefore resulting in the unexpected false predictions in Fig. S9. Utilizing SG loss can suppress such false alarms by providing accurate non-building supervision.
The TC loss (Eq. 4) is proposed to keep the model time-invariant, which is essential for generating the multi-annual dataset. As shown in Figs. S10–S12, utilizing TC loss will increase the model capacity to handle time information, especially for suppressing the accuracy gap between the years 2016 and 2017. Among these evaluation metrics, utilizing TC loss brings a greater improvement in recall (Figs. S10c, S11c, and S12c), which indicates that the TC loss will decrease the omissions of the rooftop prediction due to the different image styles of different years, thus improving the robustness of the model. Meanwhile, utilizing TC loss increases the overall performance of our method compared with the baseline (+1.46 % in F1 score).
The HR loss (Eq. 3) is composed of two losses, i.e., the cross-entropy loss (Eq. 1) and the focal Tversky loss (Eq. 2). Here we only ablate the focal Tversky loss in our “+HR loss” setting. Utilizing the focal Tversky loss will bring 0.45 % improvement in terms of F1 score by shifting the model convergence more onto minimizing FN predictions and further suppressing the false predictions of the background.
As a conclusion of the ablation study, the designed learning strategy in the STSR-Seg framework leads to three significant benefits. (1) The SG loss provides enough supervision all over China, thus increasing the geographical robustness of the model. (2) The TC loss keeps the model invariant to time span, increasing the temporal robustness of the model. (3) The HR loss is an optimized loss of the naive cross-entropy loss by introducing the focal Tversky loss. It can slightly improve the overall performance of the model. These advantages are also complementary to each other without conflict when used together.
6.2 Limitations and prospects
Although our STSR-Seg framework is scalable, allowing larger areas to be monitored (e.g., national scale), there remain some limitations to our approach. Specifically, the segmentation results for densely populated residential areas may present certain rooftops as a single block rather than as individual buildings. Our analysis suggests that this occurrence is primarily due to the resolution of the results, which is 2.5 m. Furthermore, the semantic segmentation technique utilized in the approach may introduce some uncertainty at the edges of buildings, resulting in additional pixels (up to 3 px) at the boundary. Consequently, up to 7.5 m of buffering may occur, exacerbating the problem of building adhesion. Examples of this issue are presented in Fig. 19.
In addition, there is a need for further improvement in the delineation of the building boundaries within CBRA. Buildings differ from other objects of interest in that they have regularized boundaries (e.g., polygons made of lines and vertices). However, our dense pixel-to-pixel classification method disregards the morphology of the building, resulting in a blob-like shape. For example, in Table 5, we add a buffer with 1–2 px to the collected reference rooftop data and then use this as a benchmark to calculate the accuracy. It is noted that there is a significant increase in the TP percentage (+4.35 % for 1 px and +6.18 % for 2 px) and by a greater percentage than the increase in the FN (the increase in the FN is due to the excessive number of background pixels considered to be the ground truth). This indicates that the CBRA results suffer from ambiguous localization on the building boundaries.
Table 5Statistics of the confusion matrix for building rooftop extraction in an urban scene. The collected reference is added by the buffer zone on the boundary with 1 and 2 px, respectively.
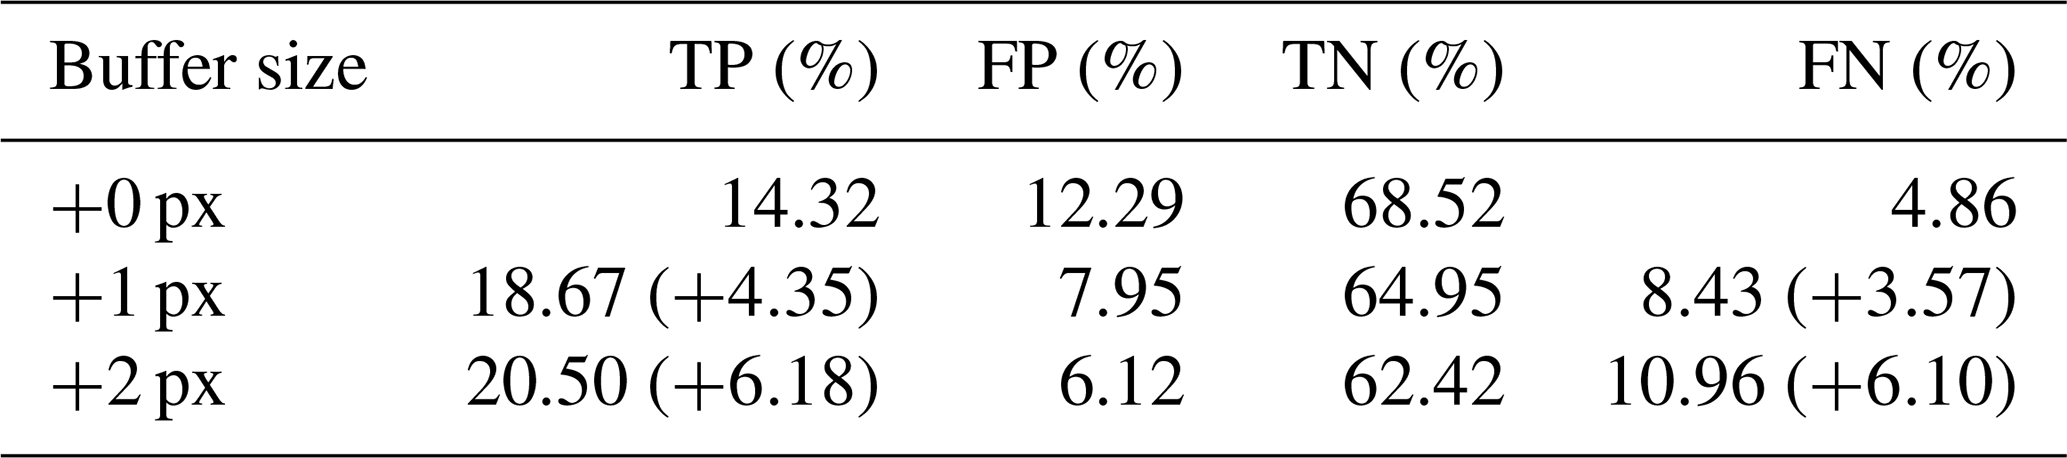
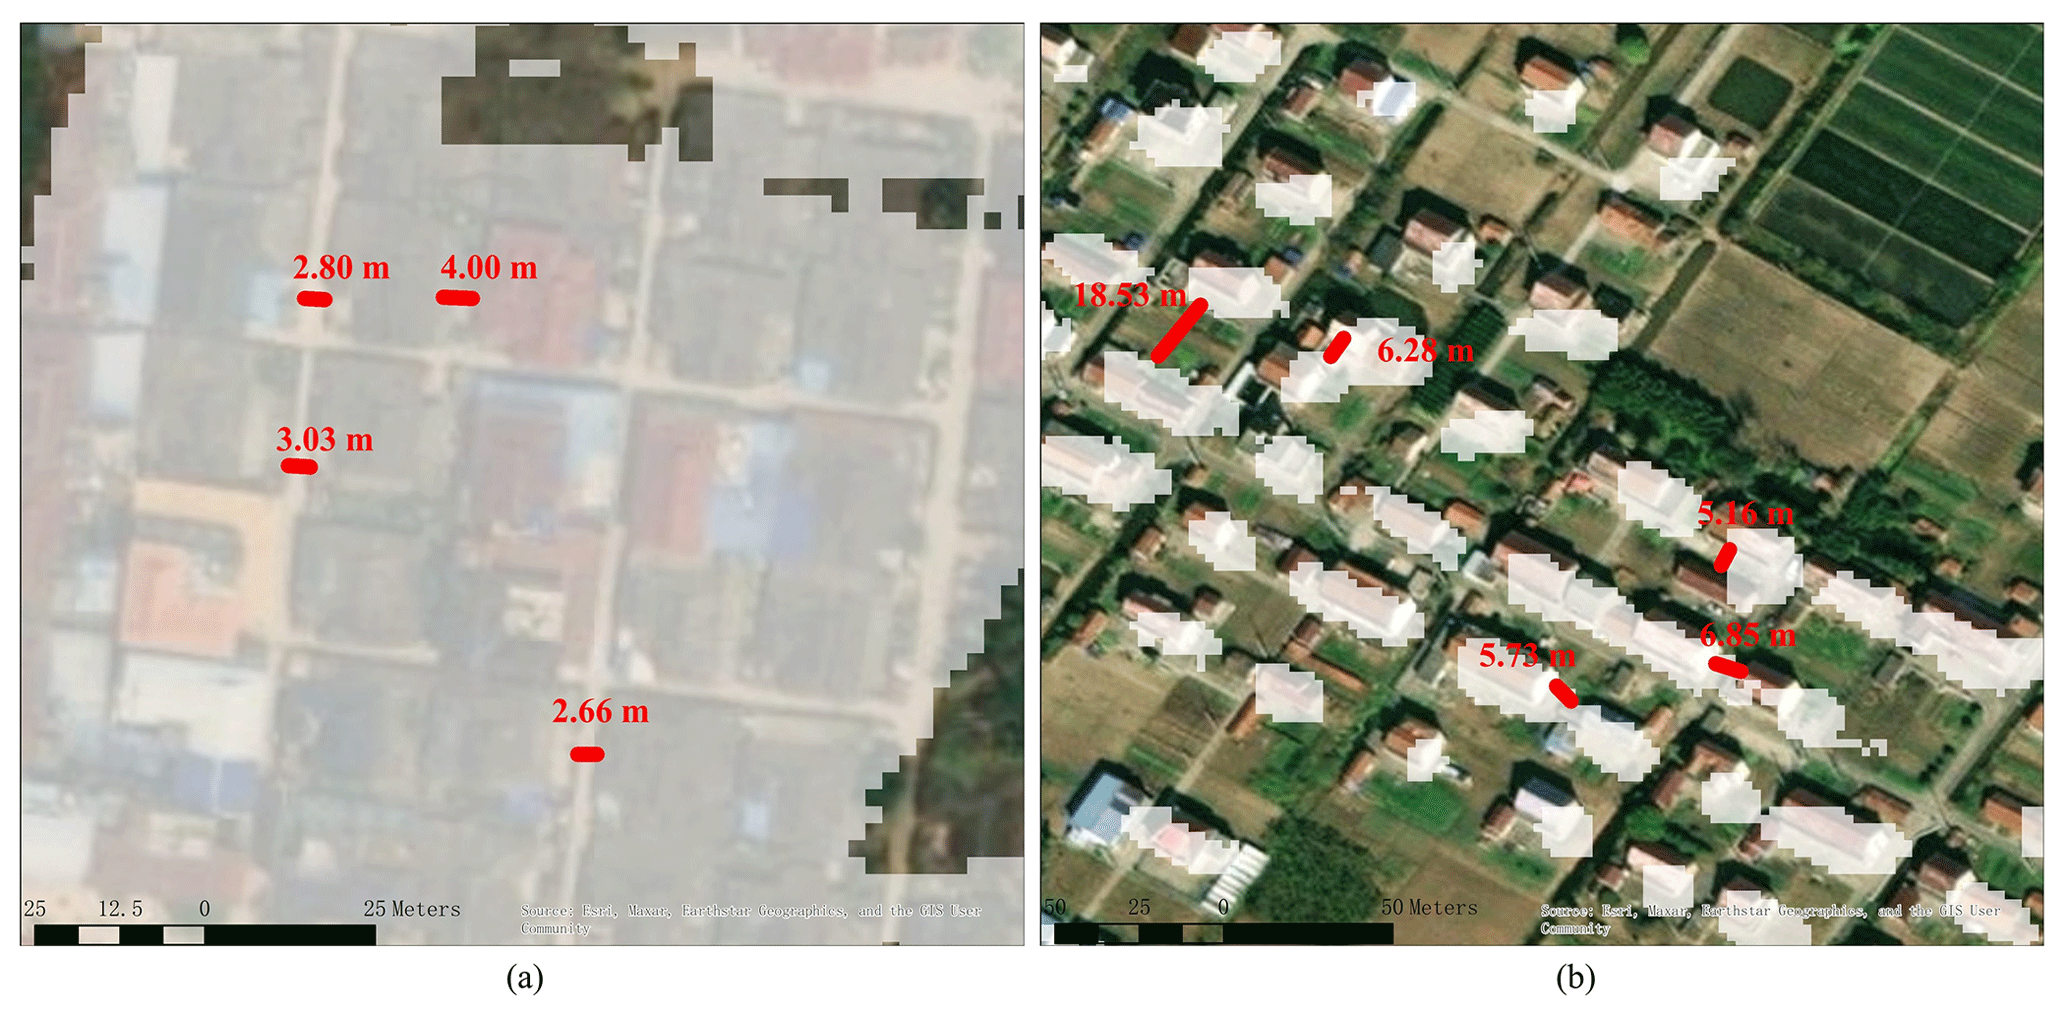
Figure 19Two examples of blob-like areas and the measured distances between adjacent buildings. (a) Densely residential area (101.302089∘ E, 21.298532∘ N). (b) Relatively discrete residential area (121.634662∘ E, 31.746674∘ N). Imagery © 2023 Maxar Technologies.
We have noticed that there have been many studies on the morphology extraction of buildings in recent years, such as instance segmentation methods (Liu et al., 2022; Zhu et al., 2021; W. Huang et al., 2021). We also try to replace our semantic segmentation branch with current instance segmentation methods, e.g., recurrent neural network methods (Liu et al., 2022). However, the results are not good and even fail in our offline experiment, mainly because these methods are designed for very-high-resolution aerial images (submetric level). In addition, the efficiency of these methods is too low to support national-level building mapping.
Many endeavors utilize a postprocessing strategy, e.g., the Douglas–Peucker algorithm, to achieve regularization (Wei et al., 2019; Chen et al., 2020; Zorzi et al., 2021), and such strategies have shown success in building mapping at a relatively small scale (Wei et al., 2019). However, in CBRA, the use of postprocessing will introduce errors due to several block estimations in the densely residential area, as mentioned before. Considering the potential errors by vectorizing, it is hard to provide vector results of CBRA.
CBRA provides full-coverage and multi-annual information on building rooftops for China at 2.5 m spatial resolution, and the proposed STSR-Seg offers an opportunity to obtain high-resolution output by using relatively low-resolution remote-sensing images. However, our findings are constrained by the adhesion of closely located buildings and the blob-like shapes of rooftops. In the near future, we aim to enhance our methodology by designing more powerful model architecture and utilizing multisource data, including synthetic aperture radar (SAR) and other BRA datasets, with the goal of achieving vector outputs.
The source code of STSR-Seg and the dataset-generation pipeline can be found at https://doi.org/10.5281/zenodo.8138988 (Liu et al., 2023b). The 2.5 m multi-annual CBRA dataset from 2016 to 2021 is free to access at https://doi.org/10.5281/zenodo.7500612 (Liu et al., 2023a). CBRA is organized in GeoTIFF (.tif) raster file format with a single band and a GCS_WGS_1984 coordinate system. The pixel values are 0 and 255, with 0 representing the background and 255 representing the building rooftop area. Furthermore, to facilitate the use of the data, CBRA is split into 215 tiles of a 2.5∘ × 2.5∘ spatial grid named “CBRA_year_E/W**N/S**.tif”, where “year” is the sampling year and “E/W**N/S**” indicates the latitude and longitude coordinates found in the upper-left corner of the tile data.
In this study, we propose the robust Spatio-Temporal aware Super-Resolution Segmentation (STSR-Seg) framework for fine-grained spatial-information extraction of BRA from the abundant availability of low-resolution imagery. Specifically, the STSR-Seg framework is built on the super-resolution and semantic segmentation pipeline. Given the input low-resolution image, STSR-Seg first extracts the corresponding high-resolution feature and then achieves pixel-to-pixel classification by the semantic segmentation branch. Considering the lack of reliable building rooftop references in China, we designed spatiotemporally aware learning to enable the model to generalize in both large geographical regions and long time periods. Ablation experiments on the designed learning strategy show the complementary advantage of handling false positives of the complex background and a temporal consistency over a time span as well as an improvement of 4.29 % in terms of the F1 score compared to our baseline method.
The resulting China Building Rooftop Area (CBRA) dataset is the first multi-annual (2016–2021) and full-coverage BRA dataset in China, with 2.5 m spatial resolution. The OA and F1 scores of CBRA exceed 82 % and 62 %, respectively, based on the independent testing samples in urban areas. The intercomparison between CBRA and the previous 90-cities-BRA (Z. Zhang et al., 2022) confirms the superiority of the results obtained in this study. In particular, for the first time, the BRA in rural areas of China is further identified at a fine-grained scale compared with other building-related products. Based on CBRA and other annual ISA datasets, the building rooftop dynamics over a time span are also evaluated and discussed. CBRA completes the BRA in China and will allow for a more comprehensive characterization of climate change, urban planning, and policy decisions combined with other data, such as BRA provided by Google and Microsoft. The proposed STSR-Seg framework can also be applied for large-scale and dynamic high-resolution BRA monitoring without any data expenditure. In the future, we plan to investigate improvements in the BRA accuracy and to extend the spatial coverage to reveal the global BRA dynamics at 2.5 m resolution.
The supplement related to this article is available online at: https://doi.org/10.5194/essd-15-3547-2023-supplement.
HT and ZL conceived the study. ZL performed the investigation. HT and ZL designed the methodology. ZL developed the software. ZL, LF, and SL performed the validation. ZL prepared the original draft of the paper, and HT reviewed it.
The contact author has declared that none of the authors has any competing interests.
Publisher's note: Copernicus Publications remains neutral with regard to jurisdictional claims in published maps and institutional affiliations.
The authors were provided with free access to the Sentinel data by the ESA, the Dynamic World product by Google, the survey rooftop data by Tiandi Map, and the 90-cities-BRA data by Nanjing Normal University. They were also helped through excellent work by the Google Earth Engine team in maintaining the planetary-scale geospatial cloud platform and the Geemap Python package for interactive mapping with Google Earth Engine developed by Qiusheng Wu.
This research has been supported by the National Natural Science Foundation of China (grant nos. 42192584 and 41971280) and by the Key Laboratory of Environmental Change and Natural Disaster of Ministry of Education, Beijing Normal University (project no. 2022-KF-07).
This paper was edited by Xuecao Li and reviewed by three anonymous referees.
Abraham, N. and Khan, N. M.: A novel focal tversky loss function with improved attention u-net for lesion segmentation, in: 2019 IEEE 16th international symposium on biomedical imaging (ISBI 2019), 8–11 April 2019, Venice, Italy, 683–687, 2019.
Adriano, B., Yokoya, N., Xia, J., Miura, H., Liu, W., Matsuoka, M., and Koshimura, S.: Learning from multimodal and multitemporal earth observation data for building damage mapping, ISPRS J. Photogramm. Remote, 175, 132–143, 2021.
Arcgis online: https://www.arcgis.com/home/index.html, last access: 24 November 2022.
Appolloni, E., Orsini, F., Specht, K., Thomaier, S., Sanye-Mengual, E., Pennisi, G., and Gianquinto, G.: The global rise of urban rooftop agriculture: A review of worldwide cases, J. Clean Prod., 296, 126556, https://doi.org/10.1016/j.jclepro.2021.126556, 2021.
Ayush, K., Uzkent, B., Meng, C., Tanmay, K., Burke, M., Lobell, D., and Ermon, S.: Geography-aware self-supervised learning, in: Proceedings of the IEEE/CVF International Conference on Computer Vision, 11–17 October 2021, 10181–10190, 2021a.
Ayush, K., Uzkent, B., Tanmay, K., Burke, M., Lobell, D., and Ermon, S.: Efficient poverty mapping from high resolution remote sensing images, in: Proceedings of the AAAI Conference on Artificial Intelligence, 2–9 February 2021, 12–20, 2021b.
Brown, C. F., Brumby, S. P., Guzder-Williams, B., Birch, T., Hyde, S. B., Mazzariello, J., Czerwinski, W., Pasquarella, V. J., Haertel, R., and Ilyushchenko, S.: Dynamic World, Near real-time global 10 m land use land cover mapping, Sci. Data, 9, 1–17, 2022.
Burke, M., Driscoll, A., Lobell, D. B., and Ermon, S.: Using satellite imagery to understand and promote sustainable development, Science, 371, eabe8628, https://doi.org/10.1126/science.abe8628, 2021.
Byrne, J., Taminiau, J., Kurdgelashvili, L., and Kim, K. N.: A review of the solar city concept and methods to assess rooftop solar electric potential, with an illustrative application to the city of Seoul, Renew. Sustain. Energ. Rev., 41, 830–844, 2015.
Chen, Q., Wang, L., Waslander, S. L., and Liu, X.: An end-to-end shape modeling framework for vectorized building outline generation from aerial images, ISPRS J. Photogramm., 170, 114–126, https://doi.org/10.1016/j.isprsjprs.2020.10.008, 2020.
Chen, J., Tang, H., Ge, J., and Pan, Y.: Rapid Assessment of Building Damage Using Multi-Source Data: A Case Study of April 2015 Nepal Earthquake, Remote Sens.-Basel, 14, 1358, https://doi.org/10.3390/rs14061358, 2022.
Corbane, C., Syrris, V., Sabo, F., Politis, P., Melchiorri, M., Pesaresi, M., Soille, P., and Kemper, T.: Convolutional neural networks for global human settlements mapping from Sentinel-2 satellite imagery, Neural Comput. Appl., 33, 6697–6720, 2021.
Fox, D. M., Youssaf, Z., Adnès, C., and Delestre, O.: Relating imperviousness to building growth and developed area in order to model the impact of peri-urbanization on runoff in a Mediterranean catchment (1964–2014), J. Land Use Sci., 14, 210–224, 2019.
Ge, J., Tang, H., Yang, N., and Hu, Y.: Rapid identification of damaged buildings using incremental learning with transferred data from historical natural disaster cases, ISPRS J. Photogramm. Remote, 195, 105–128, 2023.
GlobalMLBuildingFootprints: https://github.com/microsoft/GlobalMLBuildingFootprints, last access: 21 November 2022.
Gong, P., Wang, J., Yu, L., Zhao, Y., Zhao, Y., Liang, L., Niu, Z., Huang, X., Fu, H., and Liu, S.: Finer resolution observation and monitoring of global land cover: First mapping results with Landsat TM and ETM+ data, Int. J. Remote Sens., 34, 2607–2654, 2013.
Gong, P., Li, X., Wang, J., Bai, Y., Chen, B., Hu, T., Liu, X., Xu, B., Yang, J., and Zhang, W.: Annual maps of global artificial impervious area (GAIA) between 1985 and 2018, Remote Sens. Environ., 236, 111510, https://doi.org/10.1016/j.rse.2019.111510, 2020a.
Gong, P., Li, X., Wang, J., Bai, Y., Chen, B., Hu, T., Liu, X., Xu, B., Yang, J., and Zhang, W.: Annual maps of global artificial impervious area (GAIA) between 1985 and 2018, Remote Sens. Environ., 236, 111510, https://doi.org/10.1016/j.rse.2019.111510, 2020b.
Gorelick, N., Hancher, M., Dixon, M., Ilyushchenko, S., Thau, D., and Moore, R.: Google Earth Engine: Planetary-scale geospatial analysis for everyone, Remote Sens. Environ., 202, 18–27, 2017.
Guan, X., Wei, H., Lu, S., Dai, Q., and Su, H.: Assessment on the urbanization strategy in China: Achievements, challenges and reflections, Habitat. Int., 71, 97–109, 2018.
Haklay, M. and Weber, P.: Openstreetmap: User-generated street maps, IEEE Pervasive Comput., 7, 12–18, 2008.
He, K., Zhang, X., Ren, S., and Sun, J.: Deep residual learning for image recognition, in: Proceedings of the IEEE conference on computer vision and pattern recognition, 26 June–1 July 2016, Las Vegas, Nevada, United States, 770–778, 2016.
He, K., Fan, H., Wu, Y., Xie, S., and Girshick, R.: Momentum contrast for unsupervised visual representation learning, in: Proceedings of the IEEE/CVF conference on computer vision and pattern recognition, 16–18 June 2020, 9729–9738, 2020.
He, Y., Wang, D., Lai, N., Zhang, W., Meng, C., Burke, M., Lobell, D., and Ermon, S.: Spatial-Temporal Super-Resolution of Satellite Imagery via Conditional Pixel Synthesis, Adv. Neural Inf. Process. Syst., 34, 27903–27915, 2021.
He, Y., Zhang, W., Meng, C., Burke, M., Lobell, D. B., and Ermon, S.: Tracking Urbanization in Developing Regions with Remote Sensing Spatial-Temporal Super-Resolution, arXiv preprint, arXiv:2204.01736, 2022.
Hoeser, T., Feuerstein, S., and Kuenzer, C.: DeepOWT: a global offshore wind turbine data set derived with deep learning from Sentinel-1 data, Earth Syst. Sci. Data, 14, 4251–4270, https://doi.org/10.5194/essd-14-4251-2022, 2022.
HR Imagery Ordering: High-Resolution Satellite Imagery Ordering and Analysis Handbook, https://www.aaas.org/resources/high-resolution-satellite-imagery-ordering-and-analysis-handbook, last access: 21 November 2022.
Huang, W., Tang, H., and Xu, P.: OEC-RNN: Object-oriented delineation of rooftops with edges and corners using the recurrent neural network from the aerial images, IEEE T. Geosci. Remote, 60, 1–12, 2021.
Huang, X., Li, J., Yang, J., Zhang, Z., Li, D., and Liu, X.: 30 m global impervious surface area dynamics and urban expansion pattern observed by Landsat satellites: From 1972 to 2019, Sci. China Earth Sci., 64, 1922–1933, 2021.
Huang, X., Yang, J., Wang, W., and Liu, Z.: Mapping 10 m global impervious surface area (GISA-10m) using multi-source geospatial data, Earth Syst. Sci. Data, 14, 3649–3672, https://doi.org/10.5194/essd-14-3649-2022, 2022.
Iglovikov, V., Seferbekov, S., Buslaev, A., and Shvets, A.: Ternausnetv2: Fully convolutional network for instance segmentation, in: Proceedings of the IEEE Conference on Computer Vision and Pattern Recognition Workshops, 19–21 June 2018, Salt Lake City, Utah, United States, 233–237, 2018.
Jones, L. and Hobbs, P.: The application of terrestrial LiDAR for geohazard mapping, monitoring and modelling in the British Geological Survey, Remote Sens.-Basel, 13, 395, https://doi.org/10.3390/rs13030395, 2021.
Kaim, D., Ziółkowska, E., Grădinaru, S. R., and Pazúr, R.: Assessing the suitability of urban-oriented land cover products for mapping rural settlements, Int. J. Geograph. Inf. Sci., 36, 2412–2426, 2022.
Kuthanazhi, V., Jois, S., Jadhav, P., Kumar, K., Magal, A., Pimpalkhare, A., Vasi, J., Kottantharayil, A., Ramamritham, K., and Narayanan, N. C.: Estimating Mumbai's rooftop PV potential through mobilization of IEEE student community, in: 2016 IEEE 43rd Photovoltaic Specialists Conference (PVSC), 5–10 June 2016, Portland, Oregon, United States, 3311–3316, 2016.
Leyk, S., Uhl, J. H., Balk, D., and Jones, B.: Assessing the accuracy of multi-temporal built-up land layers across rural-urban trajectories in the United States, Remote Sens. Environ., 204, 898–917, 2018.
Li, X., Gong, P., and Liang, L.: A 30-year (1984–2013) record of annual urban dynamics of Beijing City derived from Landsat data, Remote Sens. Environ., 166, 78–90, 2015.
Liang, J., Gong, J., and Li, W.: Applications and impacts of Google Earth: A decadal review (2006–2016), ISPRS J. Photogramm. Remote, 146, 91–107, 2018.
Lim, B., Son, S., Kim, H., Nah, S., and Mu Lee, K.: Enhanced deep residual networks for single image super-resolution, in: Proceedings of the IEEE conference on computer vision and pattern recognition workshops, 22–25 July 2023, Hawaii, United States, 136–144, 2017.
Liu, Z. and Tang, H.: Learning Sparse Geometric Features for Building Segmentation from Low-Resolution Remote-Sensing Images, Remote Sens.-Basel, 15, 1741, https://doi.org/10.3390/rs15071741, 2023.
Liu, Z., Tang, H., and Huang, W.: Building Outline Delineation From VHR Remote Sensing Images Using the Convolutional Recurrent Neural Network Embedded With Line Segment Information, IEEE T. Geosci. Remote, 60, 1–13, 2022.
Liu, Z., Tang, H., Feng, L., and Lyu, S.: CBRA: The first multi-annual (2016–2021) and high-resolution (2.5 m) building rooftop area dataset in China derived with Super-resolution Segmentation from Sentinel-2 imagery, Zenodo [data set], https://doi.org/10.5281/ZENODO.7500612, 2023a.
Liu, Z., Tang, H., Feng, L., and Lyu, S.: STSR-Seg (v1.0), Zenodo [code], https://doi.org/10.5281/zenodo.8138988, 2023b.
Malkin, K., Robinson, C., Hou, L., Soobitsky, R., Czawlytko, J., Samaras, D., Saltz, J., Joppa, L., and Jojic, N.: Label super-resolution networks, in: International Conference on Learning Representations, 6–9 May 2018, New Orleans, Louisiana, United States, 2018.
Manas, O., Lacoste, A., Giró-i-Nieto, X., Vazquez, D., and Rodriguez, P.: Seasonal contrast: Unsupervised pre-training from uncurated remote sensing data, in: Proceedings of the IEEE/CVF International Conference on Computer Vision, 11–17 October 2021, 9414–9423, 2021.
Marconcini, M., Metz-Marconcini, A., Üreyen, S., Palacios-Lopez, D., Hanke, W., Bachofer, F., Zeidler, J., Esch, T., Gorelick, N., and Kakarla, A.: Outlining where humans live, the World Settlement Footprint 2015, Sci. Data, 7, 1–14, 2020.
Muhtar, D., Zhang, X., and Xiao, P.: Index Your Position: A Novel Self-Supervised Learning Method for Remote Sensing Images Semantic Segmentation, IEEE T. Geosci. Remote, 60, 1–11, 2022.
Munawar, H. S., Hammad, A. W. A., and Waller, S. T.: Remote Sensing Methods for Flood Prediction: A Review, Sensors, 22, 960, https://doi.org/10.3390/s22030960, 2022.
Nadal, A., Alamús, R., Pipia, L., Ruiz, A., Corbera, J., Cuerva, E., Rieradevall, J., and Josa, A.: Urban planning and agriculture. Methodology for assessing rooftop greenhouse potential of non-residential areas using airborne sensors, Sci. Total Environ., 601, 493–507, 2017.
Qiu, C., Schmitt, M., Geiß, C., Chen, T.-H. K., and Zhu, X. X.: A framework for large-scale mapping of human settlement extent from Sentinel-2 images via fully convolutional neural networks, ISPRS J. Photogramm. Remote, 163, 152–170, 2020.
Robinson, C., Hou, L., Malkin, K., Soobitsky, R., Czawlytko, J., Dilkina, B., and Jojic, N.: Large scale high-resolution land cover mapping with multi-resolution data, in: Proceedings of the IEEE/CVF Conference on Computer Vision and Pattern Recognition, 16–20 June 2019, Long Beach, California, United States, 12726–12735, 2019.
Ronneberger, O., Fischer, P., and Brox, T.: U-net: Convolutional networks for biomedical image segmentation, in: International Conference on Medical image computing and computer-assisted intervention, 5–9 October 2015, Munich, Germany, 234–241, 2015.
Schneider, A., Friedl, M. A., McIver, D. K., and Woodcock, C. E.: Mapping urban areas by fusing multiple sources of coarse resolution remotely sensed data, Photogramm. Eng. Remote Sens., 69, 1377–1386, 2003.
Shao, G., Tang, L., and Liao, J.: Overselling overall map accuracy misinforms about research reliability, Landsc. Ecol., 34, 2487–2492, 2019.
Shermeyer, J. and van Etten, A.: The effects of super-resolution on object detection performance in satellite imagery, in: Proceedings of the IEEE/CVF Conference on Computer Vision and Pattern Recognition Workshops, 15–20 June 2019, Long Beach, California, United States, 2019.
Sirko, W., Kashubin, S., Ritter, M., Annkah, A., Bouchareb, Y. S. E., Dauphin, Y., Keysers, D., Neumann, M., Cisse, M., and Quinn, J.: Continental-scale building detection from high resolution satellite imagery, arXiv preprint, arXiv:2107.12283, 2021.
Tateishi, R., Uriyangqai, B., Al-Bilbisi, H., Ghar, M. A., Tsend-Ayush, J., Kobayashi, T., Kasimu, A., Hoan, N. T., Shalaby, A., and Alsaaideh, B.: Production of global land cover data–GLCNMO, Int. J. Digit. Earth, 4, 22–49, 2011.
Uhl, J. H. and Leyk, S.: A scale-sensitive framework for the spatially explicit accuracy assessment of binary built-up surface layers, Remote Sens. Environ., 279, 113117, https://doi.org/10.1016/j.rse.2022.113117, 2022.
van Etten, A., Hogan, D., Manso, J. M., Shermeyer, J., Weir, N., and Lewis, R.: The multi-temporal urban development spacenet dataset, in: Proceedings of the IEEE/CVF Conference on Computer Vision and Pattern Recognition, 19–25 June 2021, 6398–6407, 2021.
Wang, Y., Bashir, S. M. A., Khan, M., Ullah, Q., Wang, R., Song, Y., Guo, Z., and Niu, Y.: Remote sensing image super-resolution and object detection: Benchmark and state of the art, Expert. Syst. Appl., 197, 116793, https://doi.org/10.1016/j.eswa.2022.116793, 2022.
Wei, S., Ji, S., and Lu, M.: Toward automatic building footprint delineation from aerial images using CNN and regularization, IEEE T. Geosci. Remote, 58, 2178–2189, 2019.
Xie, M., Jean, N., Burke, M., Lobell, D., and Ermon, S.: Transfer learning from deep features for remote sensing and poverty mapping, in: Thirtieth AAAI Conference on Artificial Intelligence, 12–17 February 2016, Phoenix, Arizona, United States, 2016.
Xu, P., Tang, H., Ge, J., and Feng, L.: ESPC_NASUnet: An End-to-End Super-Resolution Semantic Segmentation Network for Mapping Buildings From Remote Sensing Images, IEEE J. Sel. Top. Appl. Earth Obs., 14, 5421–5435, 2021.
Yang, F. and Ma, C.: Sparse and Complete Latent Organization for Geospatial Semantic Segmentation, in: Proceedings of the IEEE/CVF Conference on Computer Vision and Pattern Recognition, 21–24 June, New Orleans, Louisiana, United States, 1809–1818, 2022.
Yang, J. and Huang, X.: The 30 m annual land cover dataset and its dynamics in China from 1990 to 2019, Earth Syst. Sci. Data, 13, 3907–3925, https://doi.org/10.5194/essd-13-3907-2021, 2021.
Yue, J., Fang, L., Ghamisi, P., Xie, W., Li, J., Chanussot, J., and Plaza, A.: Optical remote sensing image understanding with weak supervision: Concepts, methods, and perspectives, IEEE Geosci. Remote Sens. Mag., 10, 250–269, 2022.
Zhang, S., Wu, R., Xu, K., Wang, J., and Sun, W.: R-CNN-based ship detection from high resolution remote sensing imagery, Remote Sens.-Basel, 11, 631, https://doi.org/10.3390/rs11060631, 2019.
Zhang, T., Tang, H., Ding, Y., Li, P., Ji, C., and Xu, P.: FSRSS-Net: High-resolution mapping of buildings from middle-resolution satellite images using a super-resolution semantic segmentation network, Remote Sens.-Basel, 13, 2290, https://doi.org/10.3390/rs13122290, 2021.
Zhang, X., Liu, L., Zhao, T., Gao, Y., Chen, X., and Mi, J.: GISD30: global 30 m impervious-surface dynamic dataset from 1985 to 2020 using time-series Landsat imagery on the Google Earth Engine platform, Earth Syst. Sci. Data, 14, 1831–1856, https://doi.org/10.5194/essd-14-1831-2022, 2022.
Zhang, Z., Qian, Z., Zhong, T., Chen, M., Zhang, K., Yang, Y., Zhu, R., Zhang, F., Zhang, H., and Zhou, F.: Vectorized rooftop area data for 90 cities in China, Sci. Data, 9, 1–12, 2022.
Zhu, Q., Guo, X., Deng, W., Guan, Q., Zhong, Y., Zhang, L., and Li, D.: Land-use/land-cover change detection based on a Siamese global learning framework for high spatial resolution remote sensing imagery, ISPRS J. Photogramm. Remote, 184, 63–78, 2022.
Zhu, X. X., Qiu, C., Hu, J., Shi, Y., Wang, Y., Schmitt, M., and Taubenböck, H.: The urban morphology on our planet–Global perspectives from space, Remote Sens. Environ., 269, 112794, https://doi.org/10.1016/j.rse.2021.112794, 2022.
Zhu, Y., Huang, B., Gao, J., Huang, E., and Chen, H.: Adaptive polygon generation algorithm for automatic building extraction, IEEE T. Geosci. Remote, 60, 1–14, 2021.
Zorzi, S., Bittner, K., and Fraundorfer, F.: Machine-learned regularization and polygonization of building segmentation masks, in: 2020 25th International Conference on Pattern Recognition (ICPR), 3098–3105, 10–15 January 2021, https://doi.org/10.1109/ICPR48806.2021.9412866, 2021.