the Creative Commons Attribution 4.0 License.
the Creative Commons Attribution 4.0 License.
 | 27 Jul 2023
HR-GLDD: a globally distributed dataset using generalized deep learning (DL) for rapid landslide mapping on high-resolution (HR) satellite imagery
Sansar Raj Meena
Lorenzo Nava
Kushanav Bhuyan
Silvia Puliero
Lucas Pedrosa Soares
Helen Cristina Dias
Mario Floris
Filippo Catani
Multiple landslide events occur often across the world which have the potential to cause significant harm to both human life and property. Although a substantial amount of research has been conducted to address mapping of landslides using Earth observation (EO) data, several gaps and uncertainties remain with developing models to be operational at the global scale. The lack of a high-resolution globally distributed and event-diverse dataset for landslide segmentation poses a challenge in developing machine learning models that can accurately and robustly detect landslides in various regions, as the limited representation of landslide and background classes can result in poor generalization performance of the models. To address this issue, we present the High-Resolution Global landslide Detector Database (HR-GLDD), a high-resolution (HR) satellite dataset (PlanetScope, 3 m pixel resolution) for landslide mapping composed of landslide instances from 10 different physiographical regions globally in South and South-East Asia, East Asia, South America, and Central America. The dataset contains five rainfall-triggered and five earthquake-triggered multiple landslide events that occurred in varying geomorphological and topographical regions in the form of standardized image patches containing four PlanetScope image bands (red, green, blue, and NIR) and a binary mask for landslide detection. The HR-GLDD can be accessed through this link: https://doi.org/10.5281/zenodo.7189381 (Meena et al., 2022a, c). HR-GLDD is one of the first datasets for landslide detection generated by high-resolution satellite imagery which can be useful for applications in artificial intelligence for landslide segmentation and detection studies. Five state-of-the-art deep learning models were used to test the transferability and robustness of the HR-GLDD. Moreover, three recent landslide events were used for testing the performance and usability of the dataset to comment on the detection of newly occurring significant landslide events. The deep learning models showed similar results when testing the HR-GLDD at individual test sites, thereby indicating the robustness of the dataset for such purposes. The HR-GLDD is open access and it has the potential to calibrate and develop models to produce reliable inventories using high-resolution satellite imagery after the occurrence of new significant landslide events. The HR-GLDD will be updated regularly by integrating data from new landslide events.
- Article
(9416 KB) - Full-text XML
-
Supplement
(676 KB) - BibTeX
- EndNote


With the increasing impacts of climate change, increased urbanization, and anthropogenic pressure in recent years, the risk from hazards to population, infrastructure, and essential life services has been exacerbated. Landslides are quite ubiquitous and account for approximately 4.9 % of all the natural disasters and 1.3 % of the fatalities in the world (Guha-Sapir et al., 2009). Induced by natural (earthquakes, volcanic eruptions, meteorological events) and anthropogenic triggers (slope modifications, mining, landscape engineering), the increase in the stress of slope materials causes landslides, which can harm numerous elements at risk. Landslides occur heterogeneously in many parts of the world including the Central and South Americas, the Caribbean islands, Asia, Turkey, the European Alps, and East Africa (Froude and Petley, 2018). In the past 15 years, we have seen a high number of events that have inadvertently led to the failure of thousands of slopes, causing damage to essential linear infrastructures and population. Some recent examples are Wenchuan, China (2008); Kedarnath, India (2013); Kaikōura, New Zealand (2016); Jiuzhaigou, China (2017); Dominica (2017); Porgera, Papua New Guinea (2018); Hokkaido, Japan (2018); Belluno, Italy (2018); Haiti (2021); and Sumatra, Indonesia (2022).
These examples indicate that landslide occurrences will probably continue to increase in the short and medium term; therefore, an effective capability of rapid mapping is required to map future event-based landslides. In recent years, state-of-the-art research has been conducted to better understand the impact of natural hazards such as landslides and the cascading effects on the elements at risk. A critical understanding of these complex processes begins with the onset of mapping slope failures. This information about the failed slopes is recorded and is documented in a “landslide inventory”. Landslide inventories include information on the spatial location and extent of the landslides and, if available, also crucial information about (1) the time of occurrence, (2) the triggering event that led slopes to fail, (3) the typology of the landslides based on the accepted standard classifications like Cruden and Varnes (1996) and Hungr et al. (2014), and (4) the volume of the failure. However, regarding rapid mapping of recently occurring landslides, information about the spatial location, distribution, and intersection with affected elements at risk is important.
When it comes to detecting and mapping landslides over remotely sensed images, it is safe to say that a lot of the current literature in the past couple of years has devised and spent time employing artificial intelligence (AI) models to map landslides automatically, arguably, with good results. These AI models can classify remote-sensing images to denote where the landslides are present in the analysed images. However, the core prerequisite for employing AI models is a reliable dataset to be used for training. Recent studies have only focused on mapping landslides with AI but at scales that are small or regional while also claiming that the proposed models can cater towards rapid mapping of landslides at any given time, location, and scale (Liu et al., 2022; Bhuyan et al., 2023; Meena et al., 2021a, b, d, c; Nava et al., 2022a, b, c; Meena et al., 2022b; Soares et al., 2022; Tang et al., 2022; Yang et al., 2022; Yang and Xu, 2022). However, it has seldom been the case that a genuine attempt has been made to map landslides outside the regions which the models are initially trained on and to actually apply the proposed models in capturing and mapping event-based landslides that have recently occurred. Some other works by Prakash et al. (2020) and Ghorbanzadeh et al. (2022) have attempted to collectively detect and map landslides of different countries. These showcase the power of employing AI for mapping landslides. Recently, Bhuyan et al. (2023) made some strides in mapping landslides at larger spatiotemporal scales to provide multi-temporal inventories of some famous events, but more experiments exploring other geographical contexts are required. The core of the studies mentioned also relies heavily on the availability of quantity and quality data for training an AI model. The accessibility of such data can allow a model (1) to identify landslides that were caused by different types of triggers (logically leading to the detection of different types of landslides), (2) to map landslides in different parts of the world that vary geomorphologically, and (3) to improve the applicability of the model to mapping newly occurring landslides triggered by events in recent times. The contemporary works of the current literature bring about a critical discussion about the availability and accessibility of comprehensive and adequate data to effectively train models to detect landslides. Both Prakash et al. (2020) and Ghorbanzadeh et al. (2022) have used open-source Sentinel-2 imagery for multi-site landslide detection; however, considering the fact that the spatial resolution is 10 m, a lot of small landslides are missed or not accurately captured (Meena et al., 2022b, 2021d; Bhuyan et al., 2023). The latter sampled data from four different areas/events with Sentinel-2 imagery (four bands at 10 m spatial resolution, six at 20, and three at 60) and combined the Sentinel-2 imagery with digital elevation model (DEM)-derived data from ALOS-PALSAR. The dataset we propose, instead, is sampled from 10 different areas/events and uses 3 m spatial resolution imagery. Sampling from more areas can provide a more diverse representation of both landslide and background classes, which can improve the robustness of the model when applied to different regions. Moreover, a dataset with more diversity is likely to generalize better to new unseen data than one with limited diversity, making it more suitable for real-world deployment. Sampling from 10 areas also provides better coverage of the geographical region, reducing the risk of missing important features or patterns. Higher spatial-resolution imagery captures more detail, allowing for more accurate identification and segmentation of landslide features. It also allows obtaining a more detailed view, which can be useful to identify small landslides or details that may be difficult to see in lower-resolution imagery. Moreover, it can provide more context for the location, helping to better understand the environment and the relationships between different objects and features. Therefore, the increased detail can result in improved accuracy when classifying features and objects, reducing the risk of misclassification.
To effectively and rapidly map landslides after an event, it is required first to determine the spatial extent of the affected areas. Collecting these data is frequently hazardous since it involves individuals on the ground investigating landslides firsthand during or immediately after the event. With the increased availability of satellite imagery, this task has the potential to be completed not only remotely but also automatically through the use of powerful deep learning algorithms. Currently, adequate high-resolution satellite imagery of landslides is not widely available. To depict the complex and dynamic nature of the landslides, significant numbers of images must be provided. To this purpose, we present the High-Resolution Global landslide Detector Database (HR-GLDD), a large-scale satellite image dataset with assembled landslide inventories. The database currently houses 10 geographical areas and three recently transpired events (see Fig. 1), and we plan to constantly update this database with newer events.
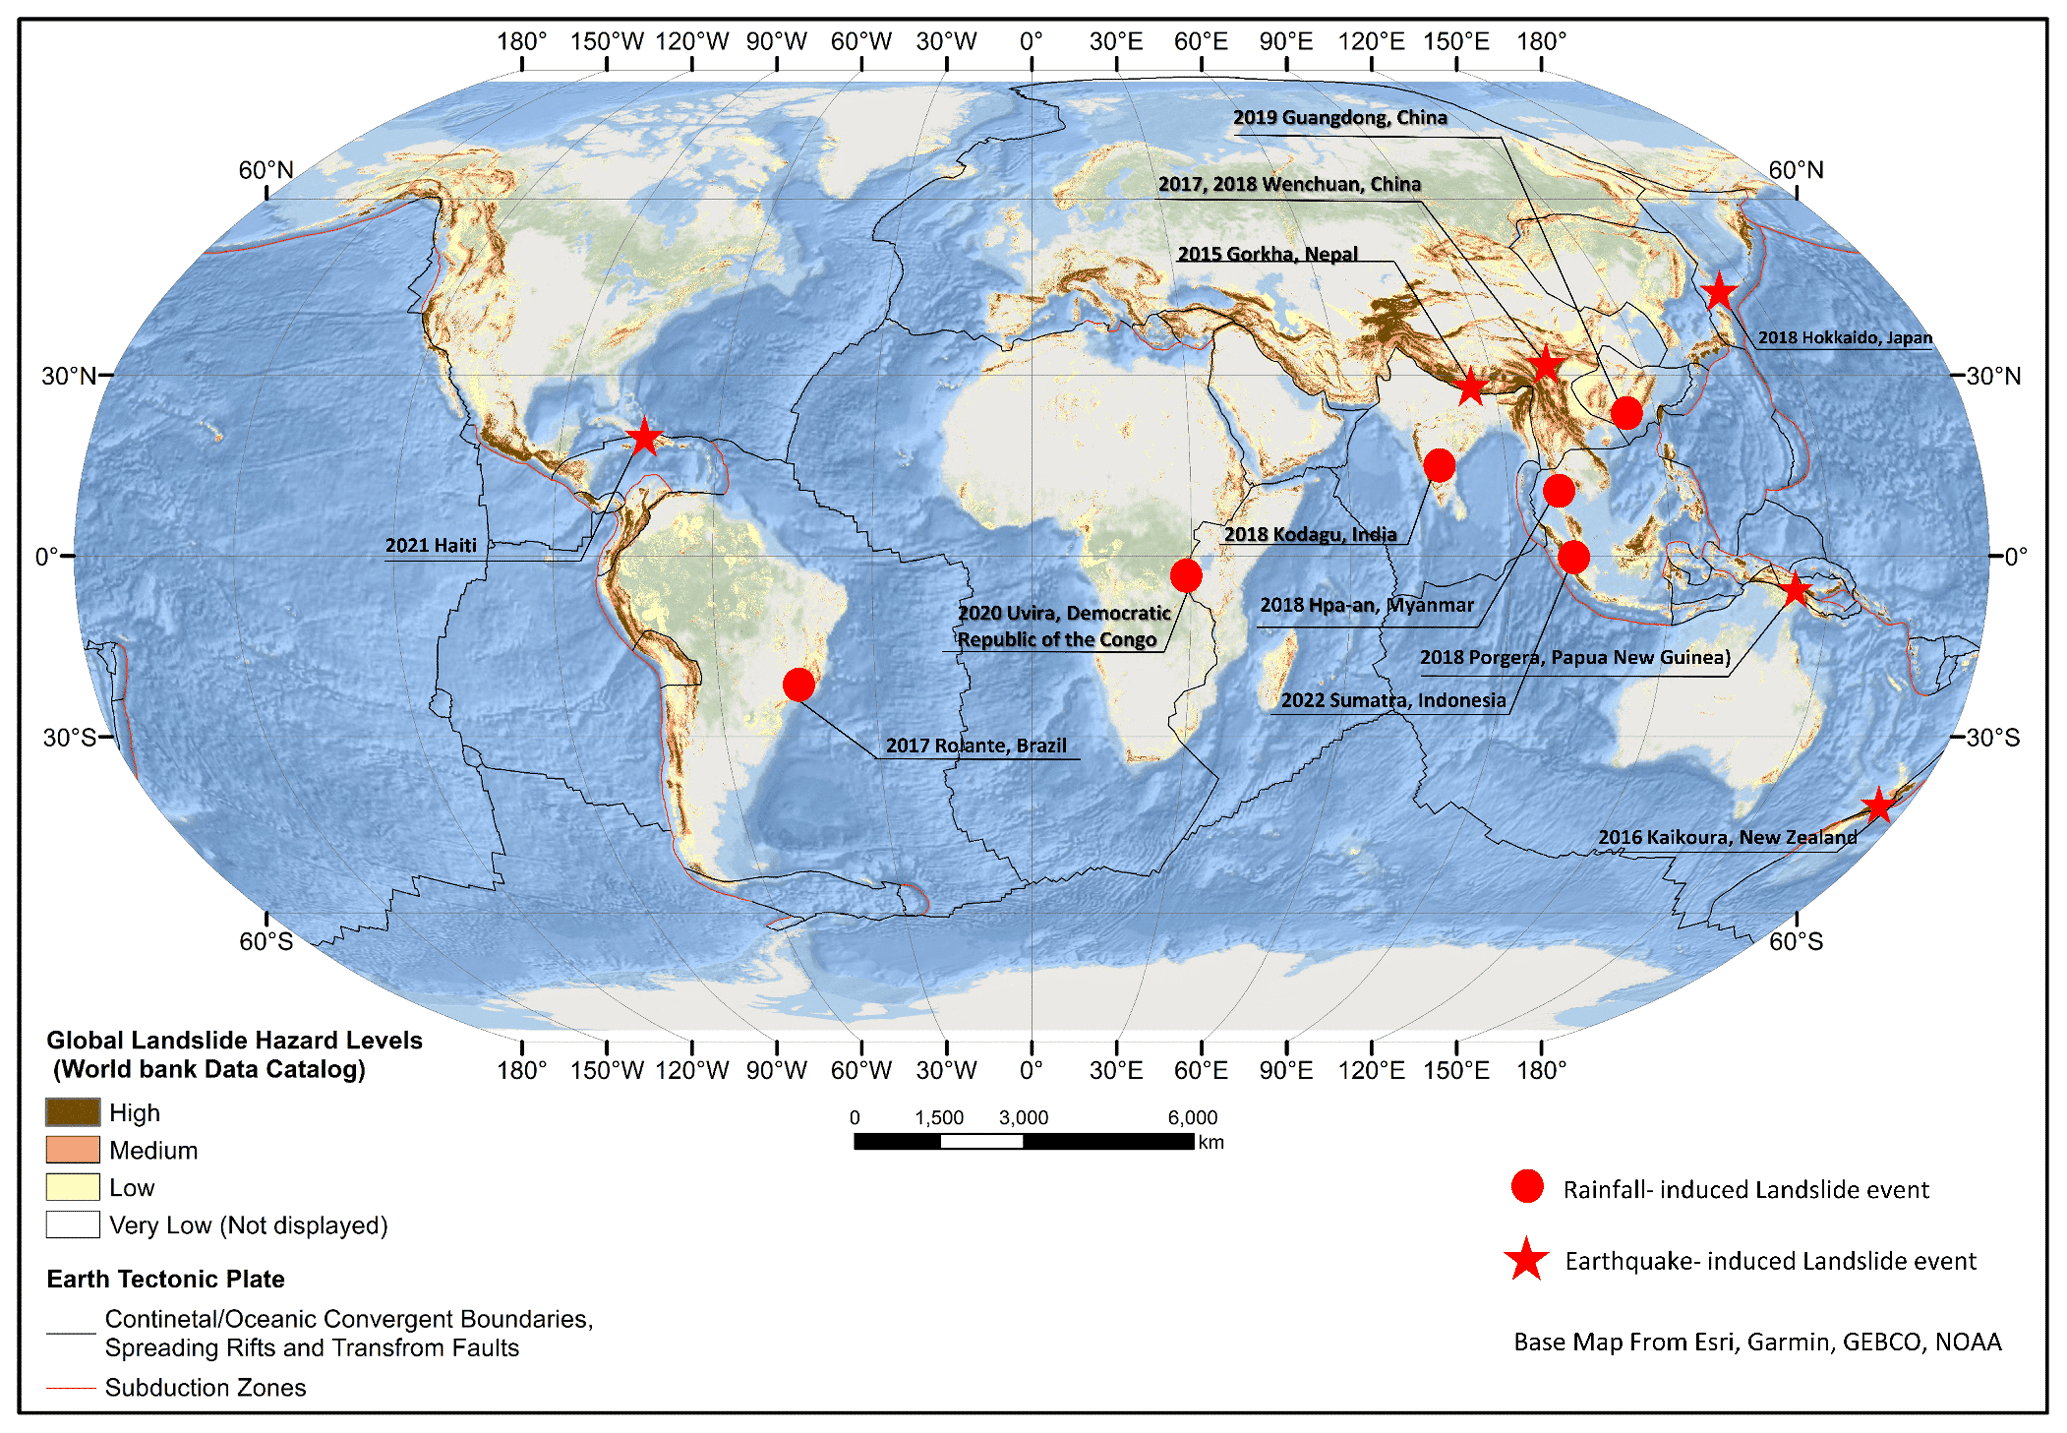
Figure 1Collection of rainfall- and earthquake-induced landslide events present in the HR-GLDD.
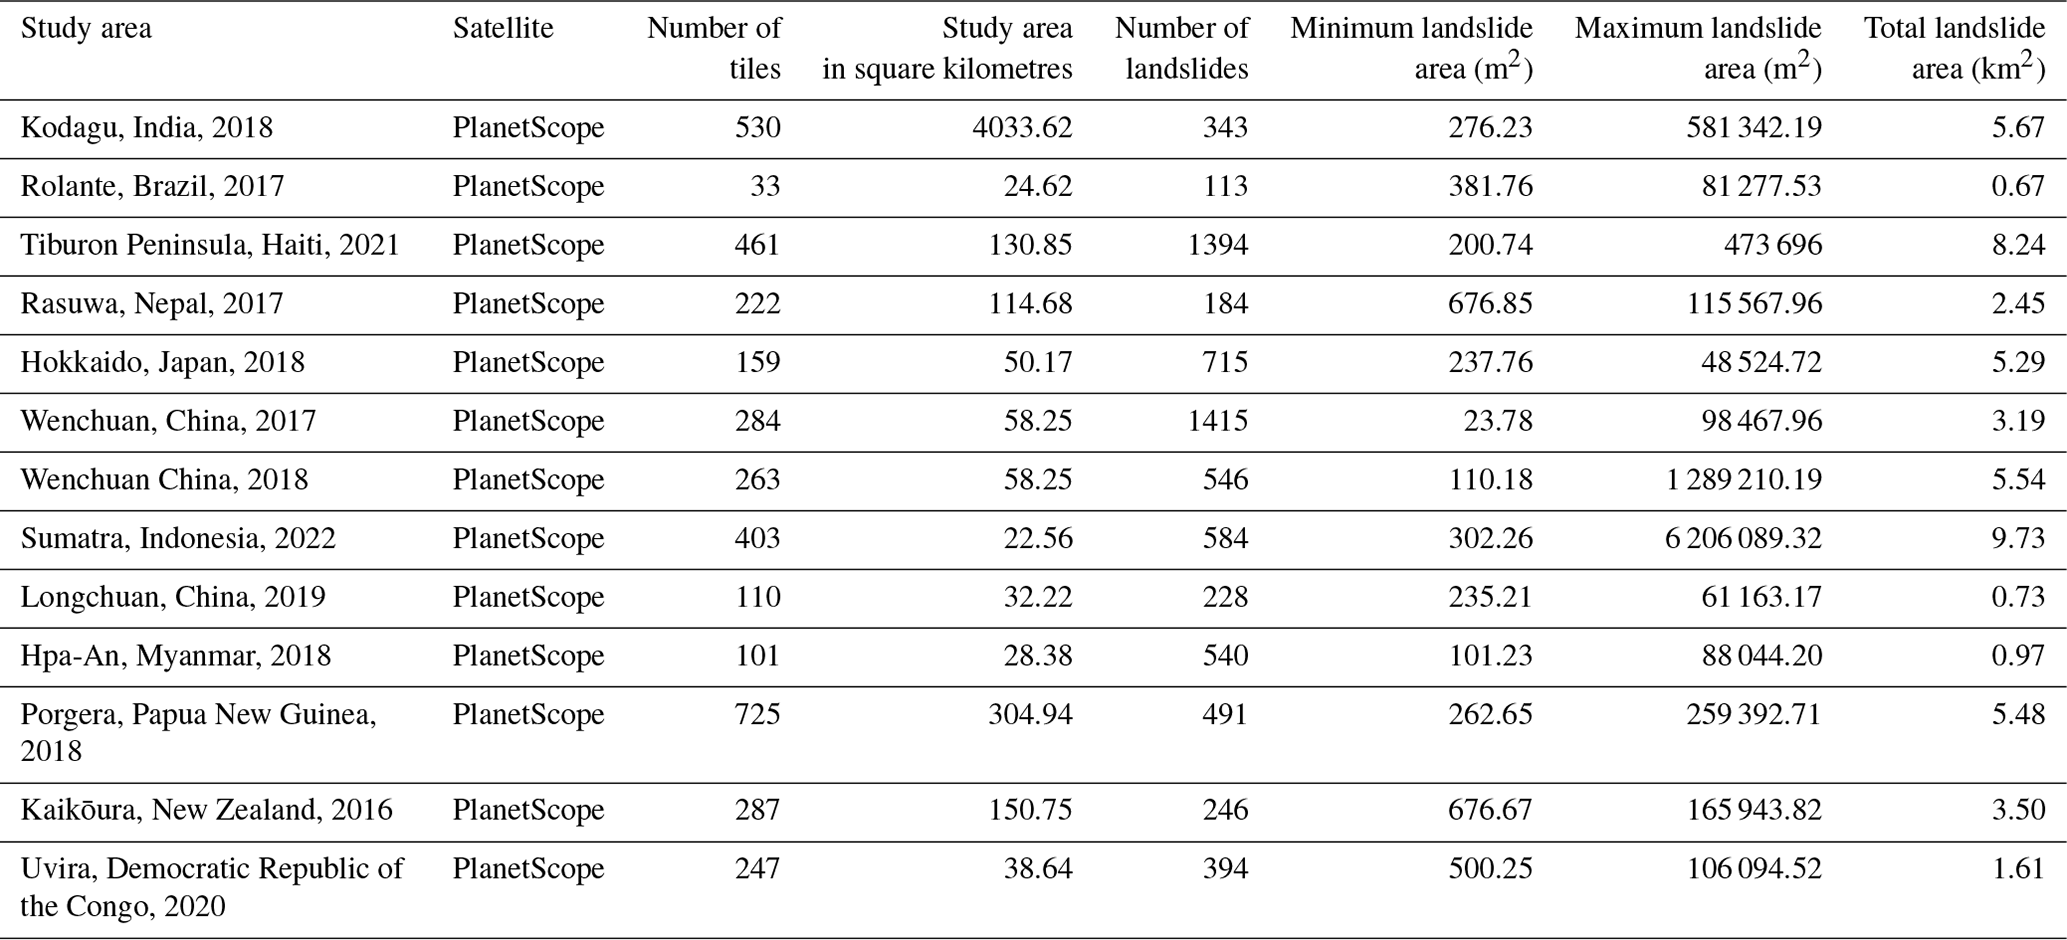
The study areas were chosen based on the variety of triggering events that resulted in the occurrence of the landslides. Because of the availability of very high-resolution (VHR) archived PlanetScope imageries after 2016, the most significant landslide events were considered. The geomorphological diversity of the study sites results in a collection of complex landslide phenomena. We selected the imageries based on the availability of cloud-free conditions in the areas and examined globally archived satellite remote-sensing imageries from PlanetScope from the years between 2017 and 2022 (Table 1). We selected eight study sites across the globe to assemble the database (see Fig. 1). To further test the generalization capabilities of the models trained on the proposed dataset, we choose three recently occurring events: co-seismic landslides in Haiti (August 2021) and rainfall-induced landslides in Indonesia (February 2022) and the Democratic Republic of the Congo (April 2020) (Meena et al., 2022a).
Table 1Number of tiles, satellite information, and landslide statistics for each study area.
2.1 Porgera, Papua New Guinea
Papua New Guinea (PNG), located on the Australian continent, is the eastern half of the New Guinea. This region, characterized by active volcanos, earthquakes, and steep slopes with elevations of up to ∼ 4400 m a.s.l., is part of the Pacific Ocean's “Ring of Fire”. The geological and tectonic makeup divides the island into four tectonic belts: stable platform, fold belt, mobile belt, and Papuan Fold and Thrust belts (Tanyaş et al., 2022b). Particularly in the east, where PNG lies, there exists an accreted Paleozoic structure known as the Tasman Orogen. Due to these unique geotectonic conditions, the area is frequently affected by landslides associated with the occurrence of earthquakes (Tanyaş et al., 2022b). On 25 February 2018, a severe earthquake struck the southern region of the Papuan Fold and Thrust belt (central highlands of PNG), reaching a magnitude of Mw 7.5. This event, the highest magnitude in the region in the past century, caused significant damage to buildings and energy structures while also triggering a massive number of landslides. This 2018 earthquake in PNG instigated over 200 landslides across the affected area, resulting in numerous fatalities and substantial infrastructural damage. The primary causes of these landslides were the intense ground shaking and the region's steep topography. Additional influential factors included soil characteristics, rainfall, and vegetation cover. A deep understanding of these contributing elements can significantly enhance landslide hazard assessments and aid in reducing future risk (Dang et al., 2020; Xu et al., 2020). Characteristics of the landslides included high relief, steep slopes, and weak lithology. An impressive number of 11 600 landslide scars were recorded post-event, with more than half surpassing an area of 50 000 m2 (Tanyaş et al., 2022b). Given these realities, effective strategies for managing landslide hazards in such high-risk areas must be developed and implemented.
2.2 Kodagu, India
Kodagu district is located in Karnataka State, Western Ghats, India. The area is characterized by elevations approximately between 50 and 1750 m a.s.l., metamorphic rocks (e.g. amphibolite, gneiss, and schist), steep slopes, high annual precipitation of about 4000 mm, and the presence of croplands (e.g. coffee, rice, and spices) (Jennifer et al., 2021; Meena et al., 2021d). In August 2018, a rainfall-induced high-magnitude mass movement event occurred in Kodagu; the primary landslide type triggered was debris flow (Meena et al., 2021d). A total of 343 landslides were recorded, including mudflows, rockfalls, and debris flows (Meena et al., 2021d). The event resulted in several instances of damage to land resources and properties and in the loss of human lives (Martha et al., 2019).
2.3 Rolante, Brazil
The Rolante River catchment study area is located in the Rio Grande do Sul state, southern Brazil. The region being part of the Serra Geral geomorphological unit has elevations of up to ∼ 1000 m a.s.l. (Uehara et al., 2020). Moreover, it is characterized by the presence of basaltic rocks and sandstones and annual precipitation thresholds between 1700 and 2000 mm (Soares et al., 2022). On 5 January 2017, a high-magnitude rainfall-induced mass movement event was triggered, and 308 landslides were registered (Gameiro et al., 2021; Quevedo et al., 2020), resulting in several instances of damage to the Rolante municipality.
2.4 Tiburon Peninsula, Haiti
The Tiburon Peninsula study area is located in the western part of Hispaniola (Haiti) with elevations of up to 2300 m a.s.l. The Tiburon Peninsula mainly consists of volcanic rocks such as basalts and sedimentary rocks, namely limestones (Harp et al., 2016). The annual precipitation in the area is more than 1600 mm (Alpert, 1942). On 14 August 2021, the Tiburon Peninsula was struck by a Mw 7.2 earthquake, which was followed by several aftershocks. The strongest one (Mw 5.7) occurred on 15 August 2021. Two days after the mainshock the area was hit by the intense tropical cyclone Grace. The combination of the two events triggered thousands of landslides (Martinez et al., 2021) in the Pic Macaya National Park located in the western part of the peninsula.
2.5 Rasuwa, Nepal
The study area is located in the Rasuwa district (central Nepal) in the higher Himalayas, with altitudes ranging from 904 to 3267 m a.s.l. and an annual average precipitation of 1800–2000 mm (Meena et al., 2022b). The geology includes Proterozoic metamorphic rocks such as amphibolite, gneiss, and schist (Tiwari et al., 2017). The area was struck by the Mw 7.8 Gorkha earthquake on 25 April 2015. The intense seismic sequence produced at least 25 000 landslides (Roback et al., 2018).
2.6 Hokkaido, Japan
The Hokkaido study area is in northern Japan and has a high presence of croplands. The area is characterized by elevations between 50 and 500 m a.s.l.; the geology is composed of Neogene sedimentary rocks, formed by the accumulation of numerous layers formed by materials ejected by the Tarumae volcano during several events over the years (Yamagishi and Yamazaki, 2018; Wang et al., 2019; Zhao et al., 2020). A severe earthquake hit the Hokkaido Iburi-Tobu area in Japan on 6 September 2018. The earthquake registered a magnitude of Mw 6.7 according to the Japan Meteorological Agency (JMA) and its epicentre was at 42.72∘ N and 142.0∘ E (Yamagishi and Yamazaki, 2018), located along the southern frontier of Hokkaido. The event triggered thousands of landslides (∼ 7059) in a concentrated area of 466 km2 (Zhao et al., 2020) and was responsible for 36 deaths.
2.7 Wenchuan, China
The study area is in the Longmenshan region at the eastern margin of the Tibetan Plateau, China. The location is characterized by high elevations of up to 7500 m a.s.l.; the geology consists of lithological units from the Mesozoic, Jurassic, Cretaceous, and Paleozoic and Precambrian formations and three types of Quaternary sedimentary units (Qi et al., 2010; Gorum et al., 2011). The area has been constantly affected by earthquake-induced landslides over the years (e.g. 2017, 2018, 2019, 2021). The 2008 Wenchuan event is one of the most destructive events of mass movements related to earthquakes in the region (Fan et al., 2018). The Wenchuan earthquake hit a magnitude of Mw 7.9. It was responsible for triggering nearly 200 000 landslides (Xu and Xu, 2014) in addition to causing missing and injured persons and thousands of human fatalities in a total area of 31 686.12 km2.
2.8 Sumatra, Indonesia
The investigated area is Mount Talamau (2912 m), which is a compound volcano located in West Pasaman Regency, West Sumatra Province, Indonesia. Geologically, the volcano consists of andesite and basalt rocks belonging to Pleistocene–Holocene age (Fadhila et al., 2019; Basofi et al., 2017). The climate of the area is humid and tropical, and the mean annual precipitation in the West Pasaman area is between 3500 and 4500 mm yr−1 (Ichsandya et al., 2022). The Mw 6.1 earthquake hit West Sumatra on 25 February 2022. This event triggered several landslides in an area of 6 km2, along the eastern and north-eastern flank of the Talamau volcano.
2.9 Longchuan, China
The study area is located in the vicinity of the village of Mibei in Longchuan County, Guangdong Province, China, with elevations of between 180 and 600 m. The area has a subtropical monsoon climate, affected by frequent typhoons and rainstorms from May to October. The average annual precipitation ranges from 1300 to 2500 mm (Bai et al., 2021). The area is composed of completely weathered Paleozoic granite and Quaternary granite residual soil (Bai et al., 2021). Between 10 and 13 June 2019, an intense rainfall event, which was characterized by cumulative rainfall of 270 mm, triggered 327 shallow landslides at between 300 and 400 m of altitude and on slopes ranging from 35 to 45∘ (Feng et al., 2022).
2.10 Hpa-An, Myanmar
The study area is located in Hpa-An district (central Kayin State, south Myanmar) in a tropical and monsoon area with a mean annual precipitation of between 4500 and 5000 mm (Zin and Rutten, 2017) and elevations of up to 1300 m. The area is part of the Shan Plateau sequence, which includes low-grade metamorphosed Precambrian, Paleozoic, and Mesozoic sedimentary rocks. On 28–30 July 2018, Myanmar was hit by an extreme rainfall event which caused a flood in the Bago River basin and triggered 992 landslides in Kayin State alone (Amatya et al., 2022).
2.11 Kaikōura, New Zealand
The 2016 Kaikōura earthquake triggered more than 10 000 landslides in New Zealand, causing extensive damage and disrupting transportation routes (Tanyaş et al., 2022a). The landslides were complex and involved multiple failure mechanisms, including rockfalls, rock avalanches, and debris flows. The intense shaking and steep topography of the region contributed to the landslides. To reduce the potential impact of future earthquakes, it is crucial to improve the understanding of landslide mechanisms and develop effective early warning systems (Massey et al., 2020; Abad et al., 2022).
2.12 Uvira, Democratic Republic of the Congo
The city of Uvira in the Democratic Republic of the Congo experienced devastating landslides in 2020 due to heavy rainfall, poor land management practices, and the steep topography of the region. These landslides caused significant damage to infrastructure and displaced thousands of people. Landslides are a recurring hazard in the Democratic Republic of the Congo (DRC), with an average of 100 occurring annually, and climate change is expected to exacerbate the problem. Efforts to mitigate the risk of landslides can include improved land use practices, early warning systems, and infrastructure designed to withstand landslides. Taking a comprehensive approach is key to minimizing the impact of landslides and protecting at-risk communities (Mokoso et al., 2022; Deijns et al., 2022).
3.1 Dataset description
The dataset created in this study consists of images acquired from the PlanetScope satellites (see Table 1) and landslide inventories collected from the literature. For all the events, landslides were manually delineated due to the unavailability of existing inventories at high resolution. PlanetScope is a constellation of approximately 130 satellites that acquire images of the Earth daily with a 3 m spatial resolution. The sensors acquire the images with eight spectral bands: coastal blue (431–552 nm), blue (465–515 nm), green (547–583 nm), yellow (600–620 nm), red (650–680 nm), red-edge (697–713 nm), and NIR (845–885 nm) (Planet Team, 2019). PlanetScope imagery consists of surface reflectance values and 16 bit images. The images from both sensors are orthorectified and radiometrically corrected by the providers, and we undertook the intra-sensor harmonization process for the red, green, blue, and NIR bands that is offered by PlanetScope.
The dataset was prepared using only the red, green, blue, and NIR bands. The pre-processing phase was based on three steps: generation of binary masks, data sampling, and tile patching (Meena et al., 2022a). We used manual image interpretation to manually delineate landslide polygons. First, the interpreted landslide polygons from each area were rasterized into a binary mask using the Rasterio Python library, where “1” represents the landslides and “0” the background. The satellite imagery, along with the mask, was then sampled and patched into a regular grid that yields patches of 128 × 128 pixels, which corresponds to 14.7 km2 per patch. Since the imbalance between background area and landslides is strong, the images that did not have any landslide-labelled pixels were removed. The proportions for the positive samples of landslides against the non-landslides are 9.96 % and 90.04 %, respectively. Table 1 shows the number of tiles created for each area.
3.2 Design of HR-GLDD
The performance evaluation of the study sites was carried out using metrics and trained using five state-of-the-art U-Net-like models, showcasing the capability and applicability of the High-Resolution Global Landslide Detector Database (HR-GLDD). We used a total of 10 geographically distinct study sites distributed globally, where landslide events were chosen including different triggering mechanisms such as five earthquake-induced and five rainfall-induced landslides. We separately divide the patches into 60 % for training, 20 % for validation, and 20 % for testing the model capabilities. All the sets are then mixed to create a unique dataset composed of equal percentages of patches.
We designed three scenarios to train, predict, and evaluate model performances in order to assess the robustness and applicability of the HR-GLDD. Primarily, we evaluate the model performances on the individual test sets (Meena et al., 2022a). Secondly, we evaluate the performances of the models on the HR-GLDD test set. Moreover, finally, we test on two completely unseen, recently occurring landslide events in Haiti (2021) and Indonesia (2022) (see Fig. 2).
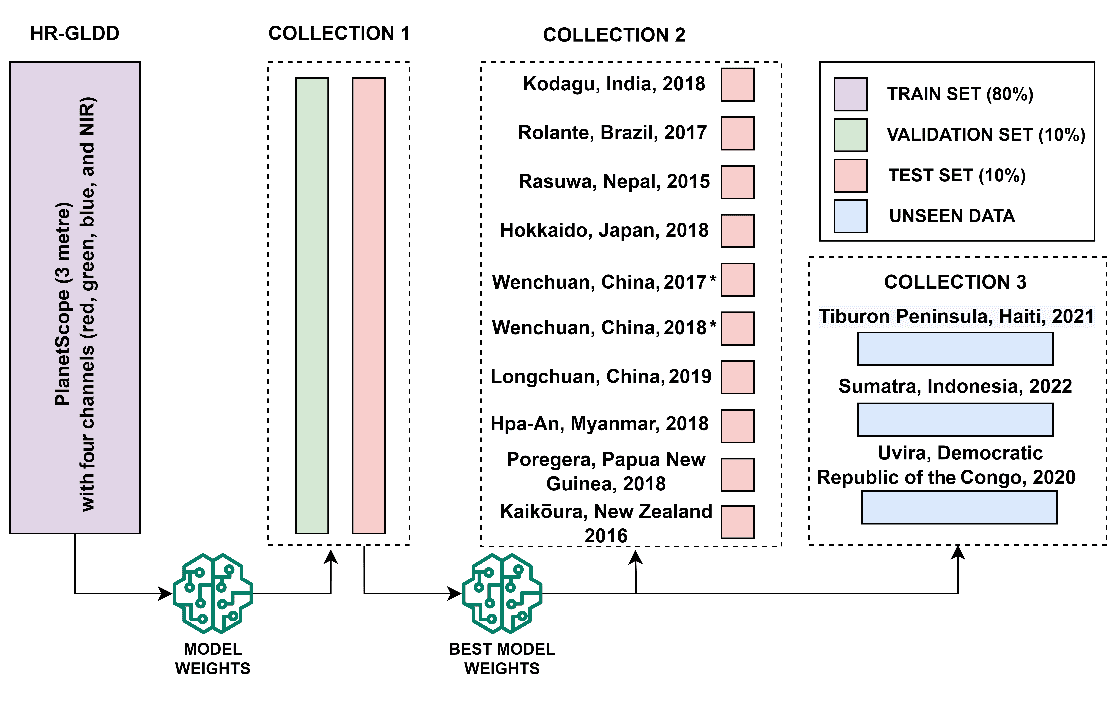
Figure 2Schematic representation of the division of different components of HR-GLDD. Collection 1 refers to the test and validation data separated from the HR-GLDD. Collection 2 refers to the test dataset of individual sites. Asterisks represent two different images for the same event. Collection 3 refers to the data from three recent events for testing purposes. Please note, while the Wenchuan event transpired in 2008, we have utilized images from a considerably later period, specifically those taken in 2017 and 2018. In an attempt to ensure the precision and accuracy of our analysis, we prioritized images with clearest, minimal cloud coverage.
4.1 Model architectures
The proposed dataset is evaluated through several state-of-the-art U-Net like deep learning segmentation models. In the past years, the U-Net (Abderrahim et al., 2020) has been used in several landslide detection applications which yield generally the most reliable results (Bhuyan et al., 2022; Nava et al., 2022a, b; Meena et al., 2022b). Therefore, we decided to use it as a benchmark model when training on the proposed dataset. Moreover, several improved versions of the same are evaluated. We systematically trained the model using a variety of combinations of the hyper-parameter batch size (8, 16, 32, 64), learning rate (, , , ), and the number of filters of the first convolutional layer (8, 16, 32, 64). A description of the employed architectures is given in this section.
-
U-Net. This architecture has been utilized in various semantic segmentation applications, yielding generally outstanding results (Abderrahim et al., 2020). U-Net was employed initially in biomedical picture segmentation (Ronneberger et al., 2015). Low-level representations are captured by a contracting path (encoder), whereas a decoding path captures high-level representations. The encoding path consists of successive convolution blocks and is equivalent to a traditional convolutional neural network (CNN) structure. Two convolutional layers with a 3 × 3 kernel size and a 2 × 2 max-pooling layer are present within every convolutional block. The rectified linear unit (ReLU) activation function is used to activate each convolutional layer. A 2 × 2 max-pooling layer is added to the convolutional block's end in the encoder route to conduct non-linear downsampling, whereas, in the decoder path, a 2 × 2 upsampling layer takes its place. The upsampling layer is positioned right after a 3 × 3 convolutional layer (see Fig. S1). We refer to this combination as learnable up-convolution.
-
Residual U-Net (Res U-Net). Res U-Net (Diakogiannis et al., 2020) follows the same U shape as U-Net, whereas here the above-explained convolutional blocks are replaced by residual blocks. This architecture's goal is to improve the learning capacities of the conventional U-Net as well as mitigate the gradient vanishing effect, especially when dealing with deep neural networks (such as U-Net) (see Fig. S2).
-
Attention U-Net and Attention Res U-Net (Attn-U-Net and Attn-res-U-Net). In the conventional U-Net as well as in the Res U-Net, cascading convolutions have been shown to provide false alerts for tiny objects with high form variability (Oktay et al., 2018). To select pertinent spatial information from low-level maps and therefore alleviate the problem, soft attention gates (AGs) are added (see Figs. S3, S4). The attention gates are built on skip connections, which actively inhibit activations in unnecessary areas, lowering the number of duplicated features (Abraham and Khan, 2019).
-
Attention Deep Supervision Multi-Scale (ADSMS) U-Net. This architecture adopts the Attention U-Net structure, while, in addition, multi-scale image pyramid inputs are fed to the model and a deep supervision strategy is applied (Abraham and Khan, 2019). In practice, multi-scale inputs enable the model to gather those class data, which are more readily available at various sizes. This holds true for both background features and landslides. Lastly, where training data are few and networks are relatively shallow, deep supervision conducts a potent “regularization”. More details about the deep supervision strategy used are available in the following section (see Fig. S5).
4.2 Model training
To train the deep learning (DL) models, we utilized Dice loss (DLc) (Eq. 2) (Milletari et al., 2016) as the loss function:
Equation (1) illustrates a two-class Dice score coefficient (DSC) variation for the landslide class c, where and are the ground truth and predicted labels, respectively. Furthermore, the numerical stability is assured by avoiding division by 0, while N specifies the total number of picture pixels.
As an exception, in the ADSMS U-Net model, every high-dimensional feature representation is regulated by focal Tversky loss to avoid loss over-suppression, while the final output is controlled by the conventional Tversky loss (Eq. 4). The focal Tversky loss is a type of loss function that focuses training on challenging cases, specifically those with a Tversky similarity index (TIc) (Eq. 3) of less than 0.5.
The focal Tversky loss (FTLc) function incorporates the likelihoods of pixels belonging to the landslide class (pic) and the background class () as well as the corresponding ground truth labels (gic and ). It is designed to handle significant class imbalances and can be adjusted by modifying the α and β weights to prioritize recall.
The FTLc function is defined as follows:
where γ ranges between 1 and 3.
This deep supervision strategy, described in Lee et al. (2014), requires intermediate layers to be semantically discriminative at all scales. Furthermore, it contributes to ensuring that the attention unit has the power to change responses to a wide variety of visual foreground material. This strategy is adopted from Abraham and Khan (2019), who propose it along with the ADSMS U-Net architecture. As the loss function optimizer, for all the models, we used a stochastic gradient descent strategy based on an adaptive estimate of first- and second-order moments (Adam), which is useful in problems with uncertain data and sparse gradients (Kingma and Ba, 2014). The precision, recall, F1 score, and intersection over union (IOU) score, the most common accuracy evaluation measures for segmentation models, all of which have been utilized in several landslide detection studies, were used to measure how well the applied DL models performed in detecting landslides. The appropriate combinations of hyper-parameters must be used while training such DL models in order to optimize the model and, therefore, output the best results.
5.1 HR-GLDD evaluation results
The robustness and applicability of the HR-GLDD was tested using the best model weight. We train and calibrate the models using the HR-GLDD. The best weights for each model are selected based on the model performances on the mixed test set of the HR-GLDD dataset. After running the models on the test dataset, a batch size of 16 and an Adam optimizer with a learning rate of resulted in the best model weight. To further evaluate the efficiency and generalization capabilities of the models, we use the model on three unseen datasets to map landslides in the two different geomorphological areas that were recently affected by multiple landslide events. We chose the most recent events: the event which occurred after the Uvira, Democratic Republic of the Congo (DRC), heavy rainfall event of April 2020; the Haiti earthquake in August 2021; and the event in Sumatra, Indonesia, after a heavy rainfall event in February 2022. A total of 247, 461, and 403 unseen image patches were evaluated for DRC, Haiti, and Indonesia, respectively.
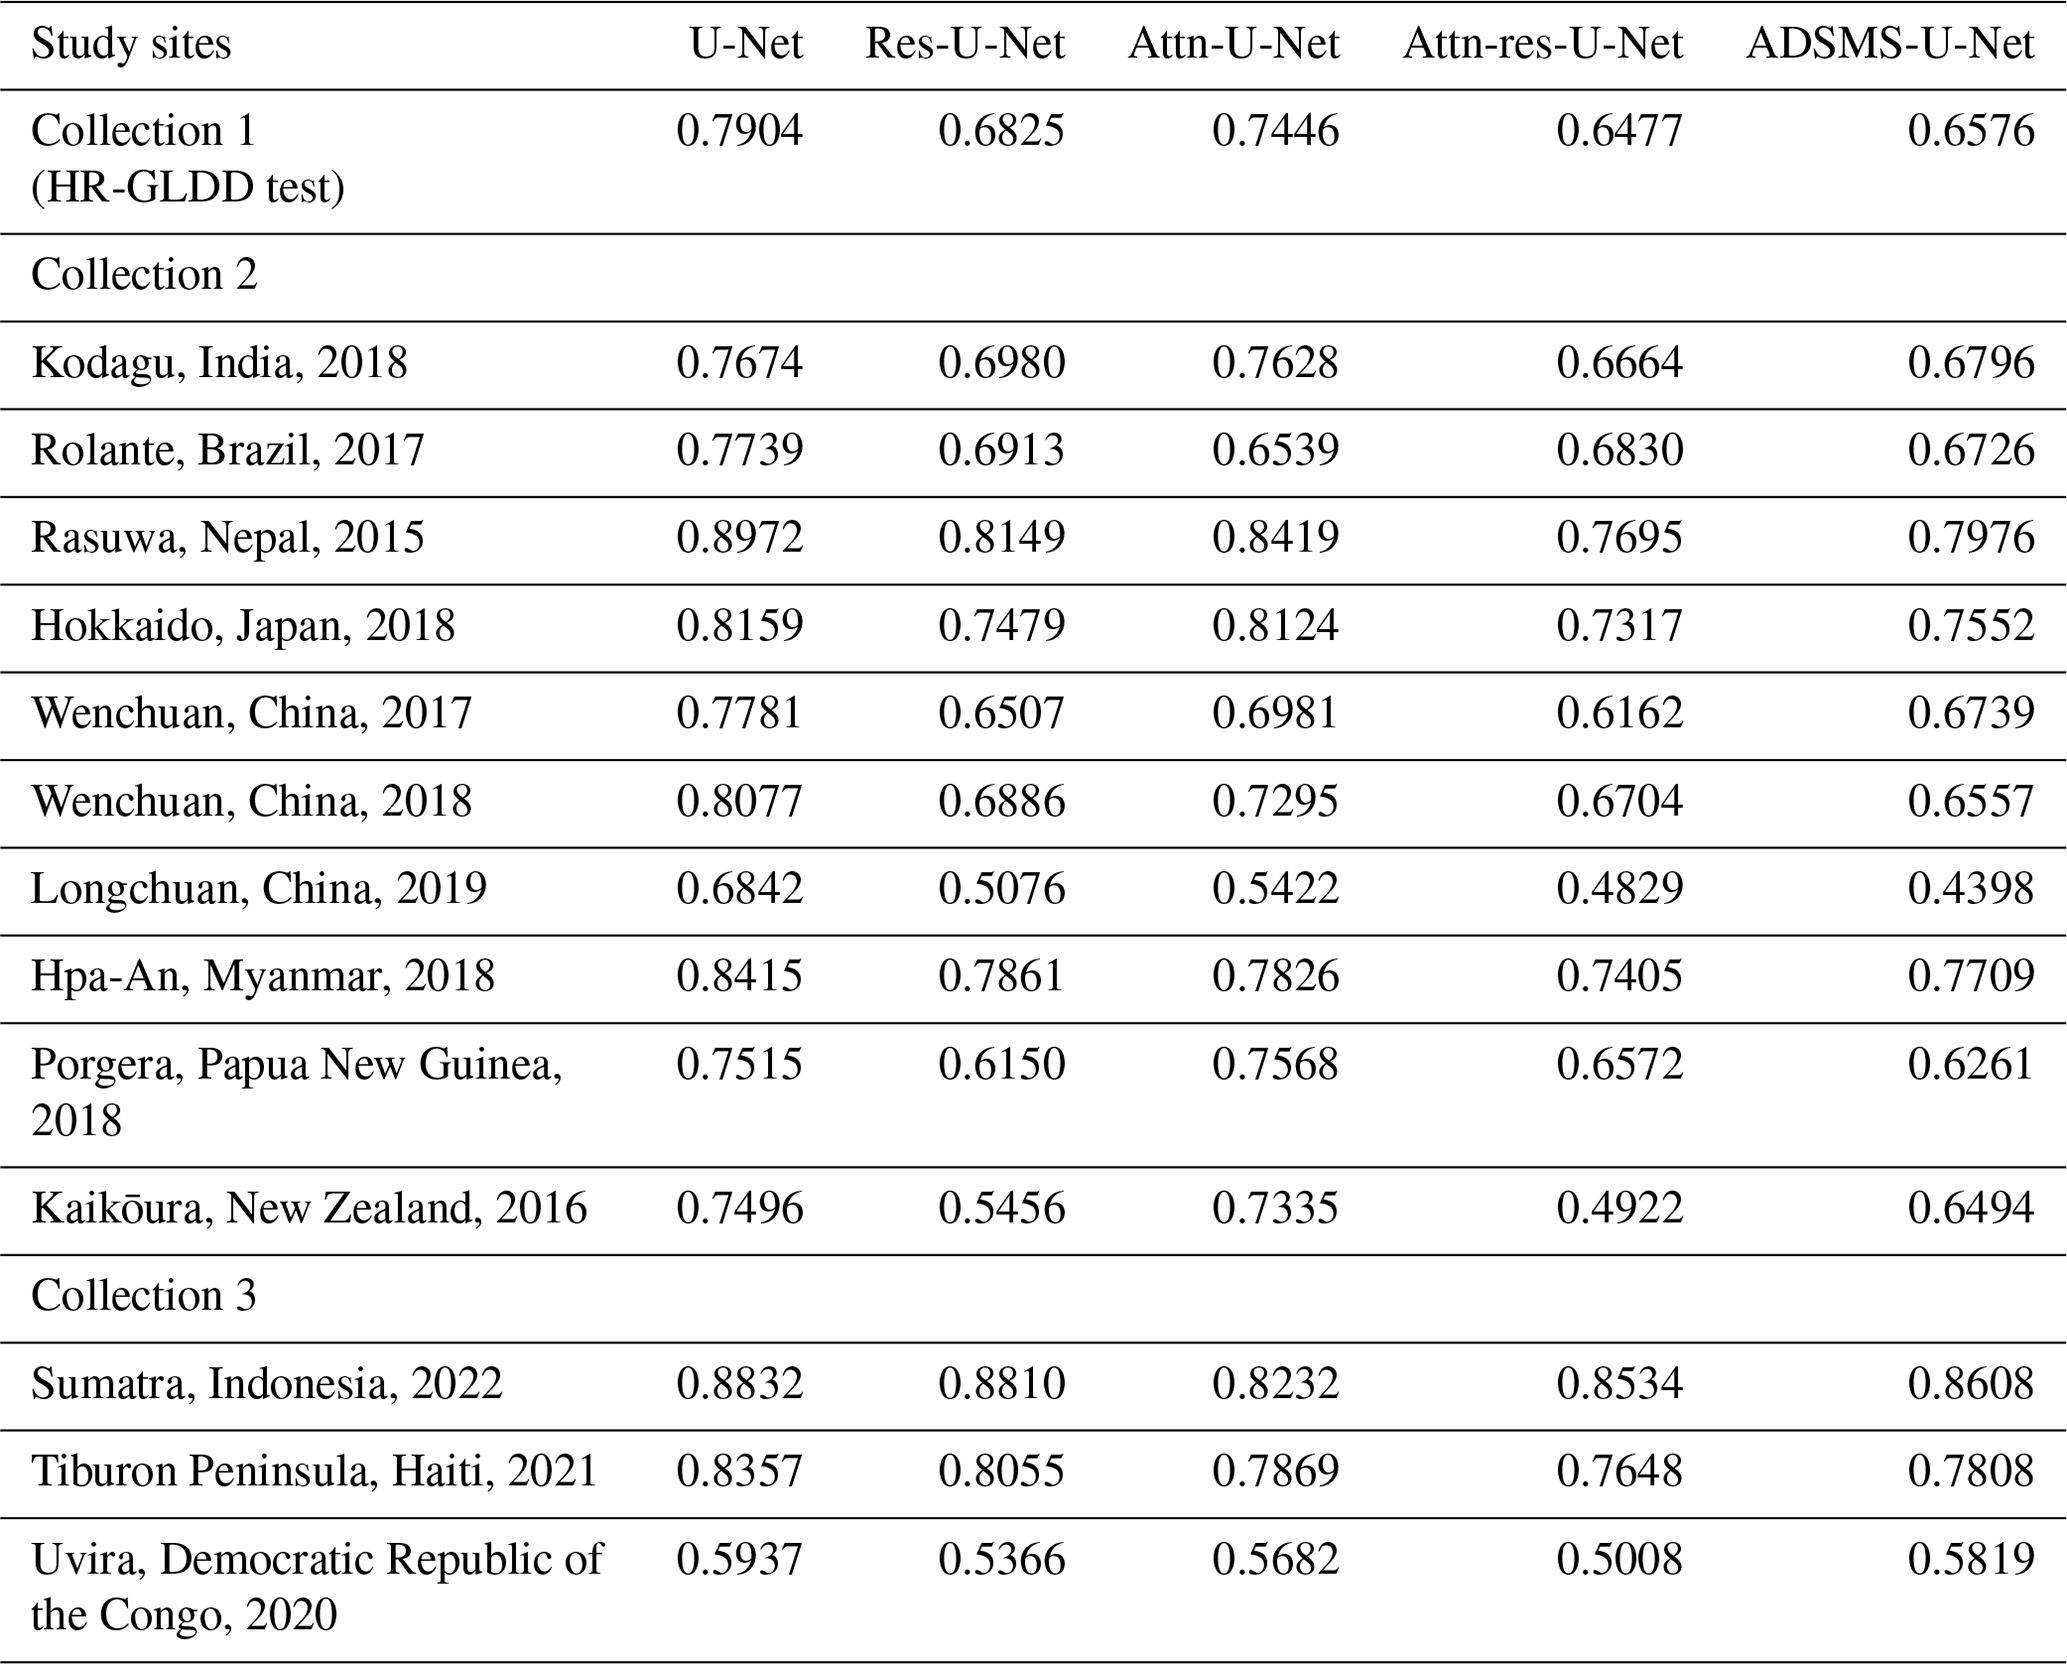
Experimental results for landslide detection by utilizing the HR-GLDD are presented in Table 2. Overall, all the models performed consistently in collections 2 and 3. The F1 score evaluation results for each test case of all the models demonstrate the applicability of the HR-GLDD training dataset for landslide detection results. The average F1 score for the HR-GLDD test dataset (collection 1) across all the models was around 0.7045. Furthermore, the same was observed at the individual test sites in collection 2. We also notice that the precision and recall are well balanced, ranging between 0.6346–0.7661 and 0.6672–0.8121, respectively, indicating stable model predictions. In collection 3, the metrics reveal positive outcomes in terms of mapping the landslides following the respective events, with an average F1 score of 0.5562 for DRC, 0.7947 for Haiti, and 0.8603 for Indonesia. The recall values are higher than the precision values for all the models, resulting in an average F1 score of 0.7045 for collection 3 (see Table 2). Higher values of recall in all models mean that the models were able to identify landslide-labelled pixels. However due to the use of only the optical bands, the spectral signatures of other similar features (such as riverbeds and flat barren areas) were labelled as landslides, which resulted in false predictions, thereby accounting for lower precision.
Table 2F1 scores of different DL models across sites and HR-GLDD test dataset along with three unseen test sites.
In Fig. 3 we chose a single image patch to showcase the predictions of the various models with respect to the referenced ground truth. Despite the differences in the spectral fingerprints of the satellite images for each study site and the events initiated by an earthquake or rainfall, the models were still capable of recognizing landslide features (see Figs. 4, 5, and 6). In particular, we were able to map the recent events in DRC (2020), Haiti (2021), and Indonesia (2022).
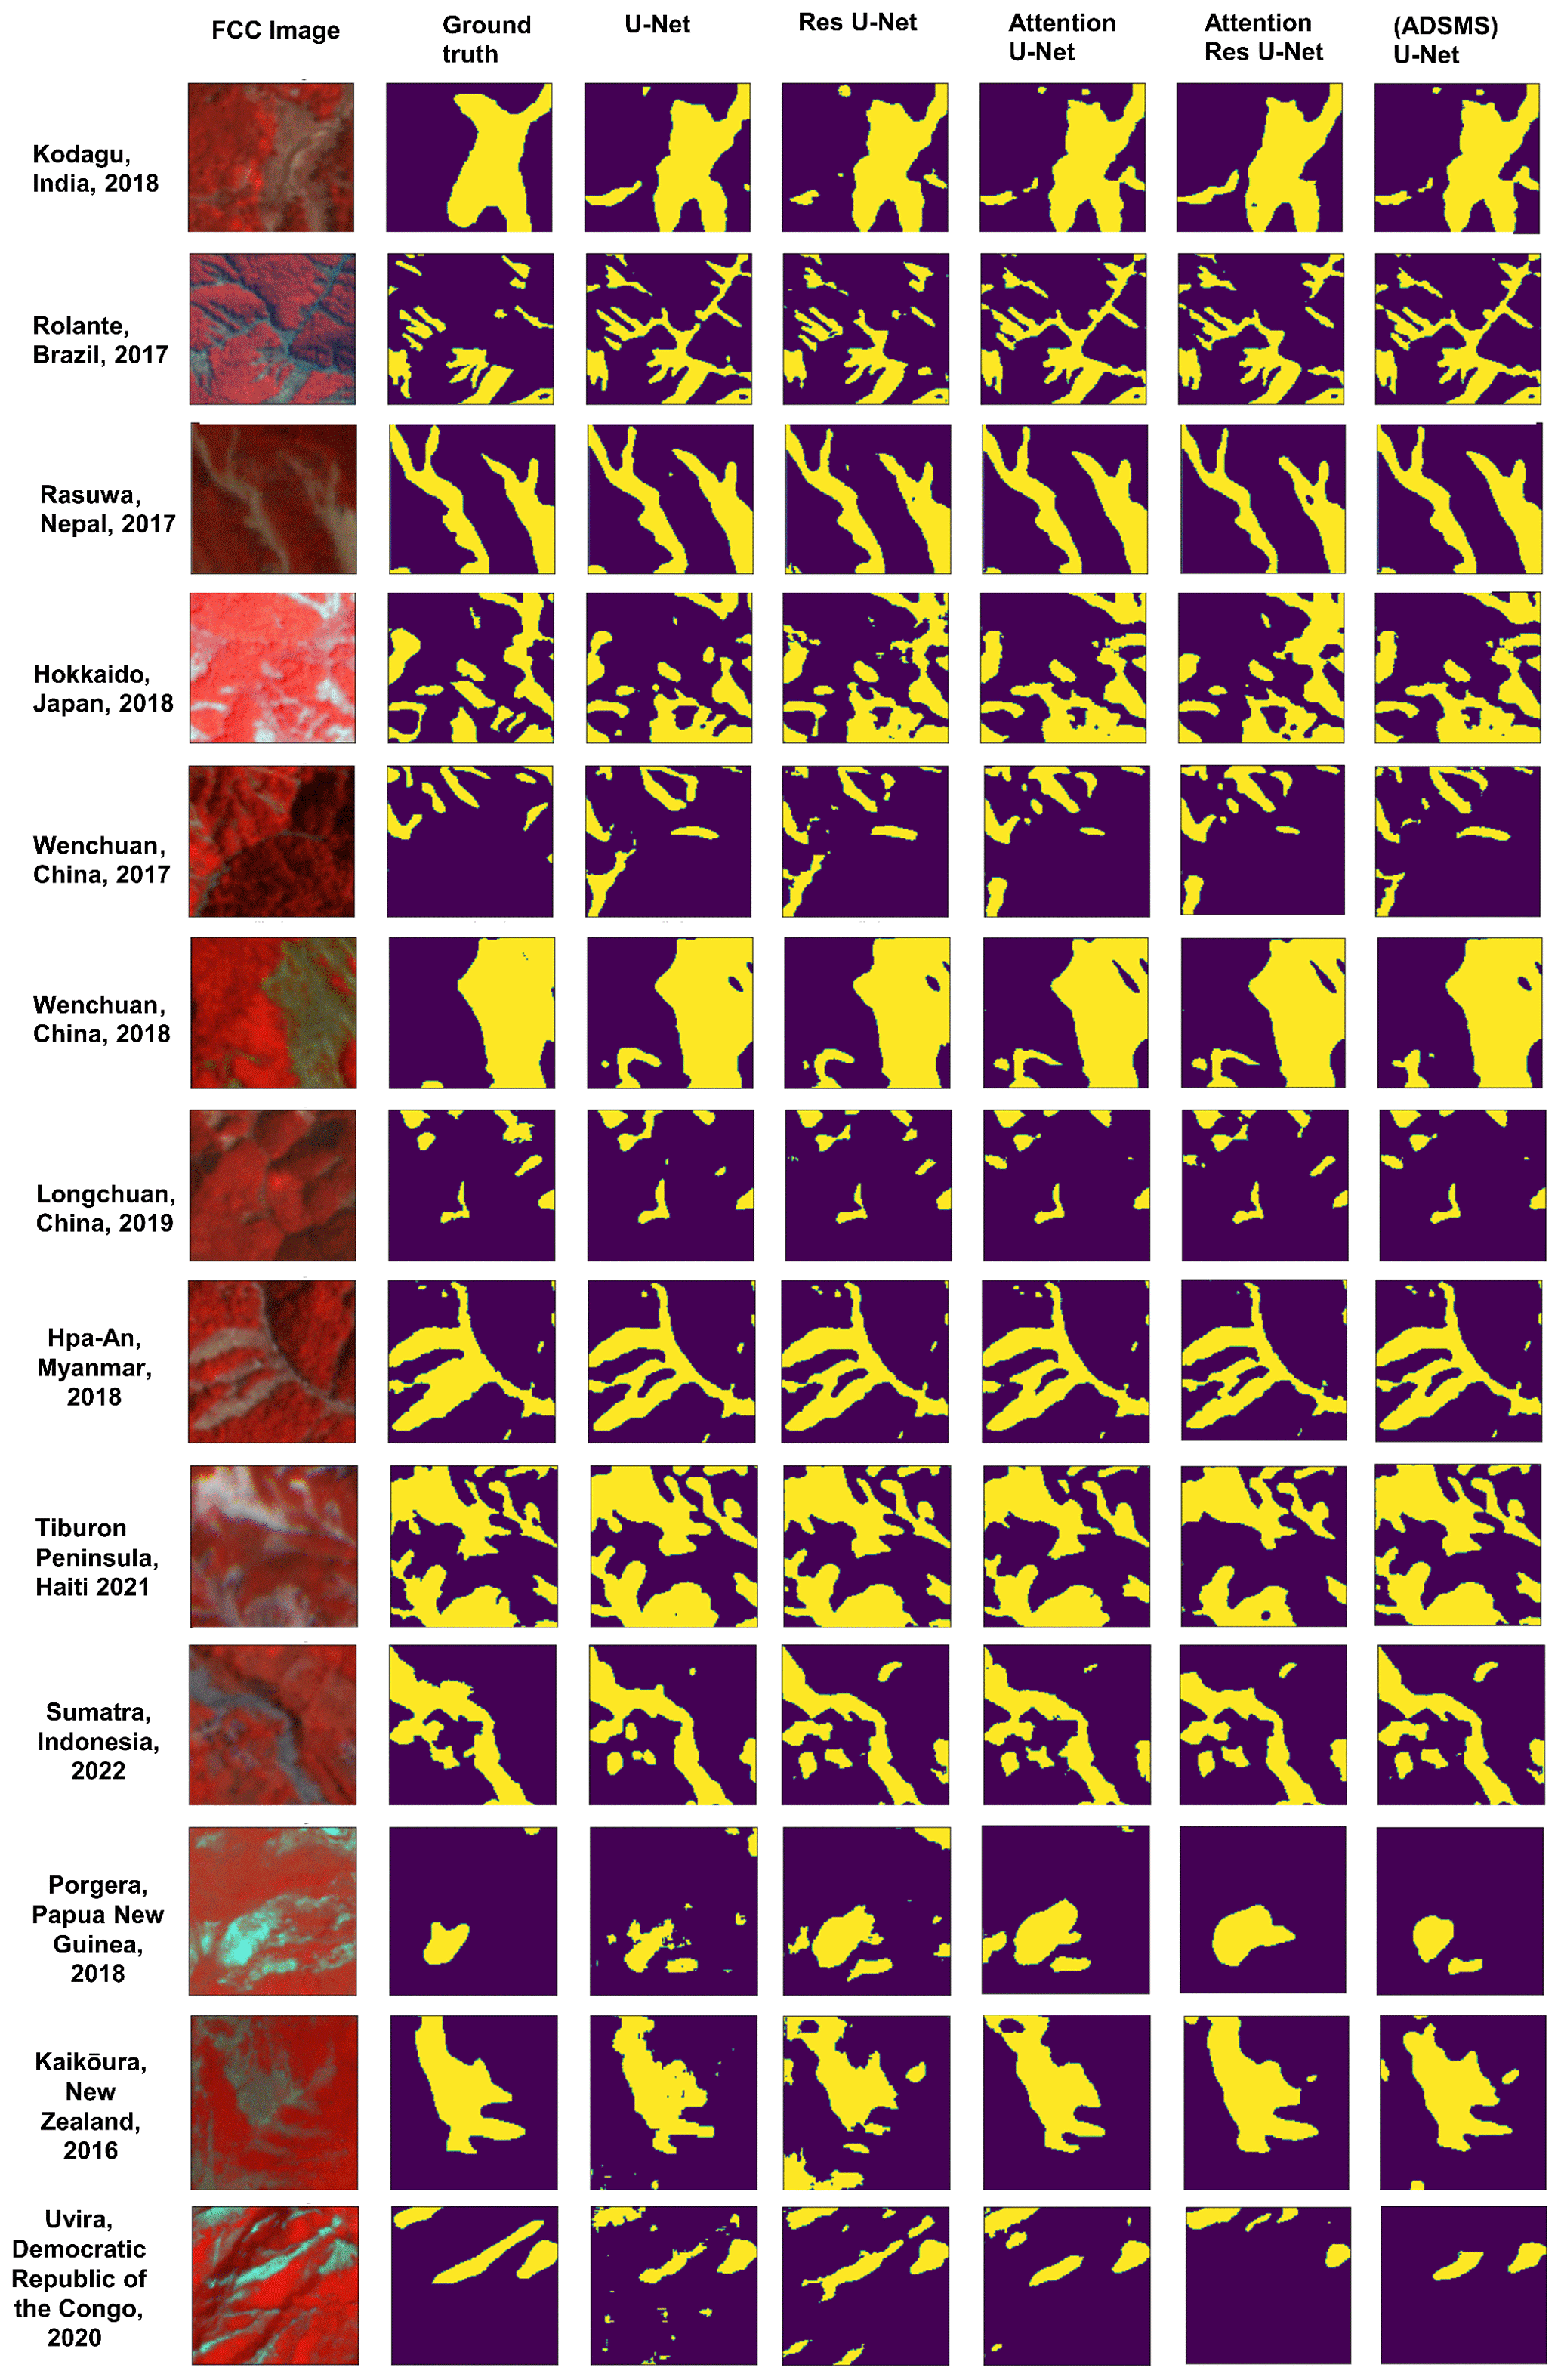
Figure 3Landslide predictions made by the different DL models against the ground truth. The base image is shown as a false colour composite (FCC) to better visualize the scars of the landslides.
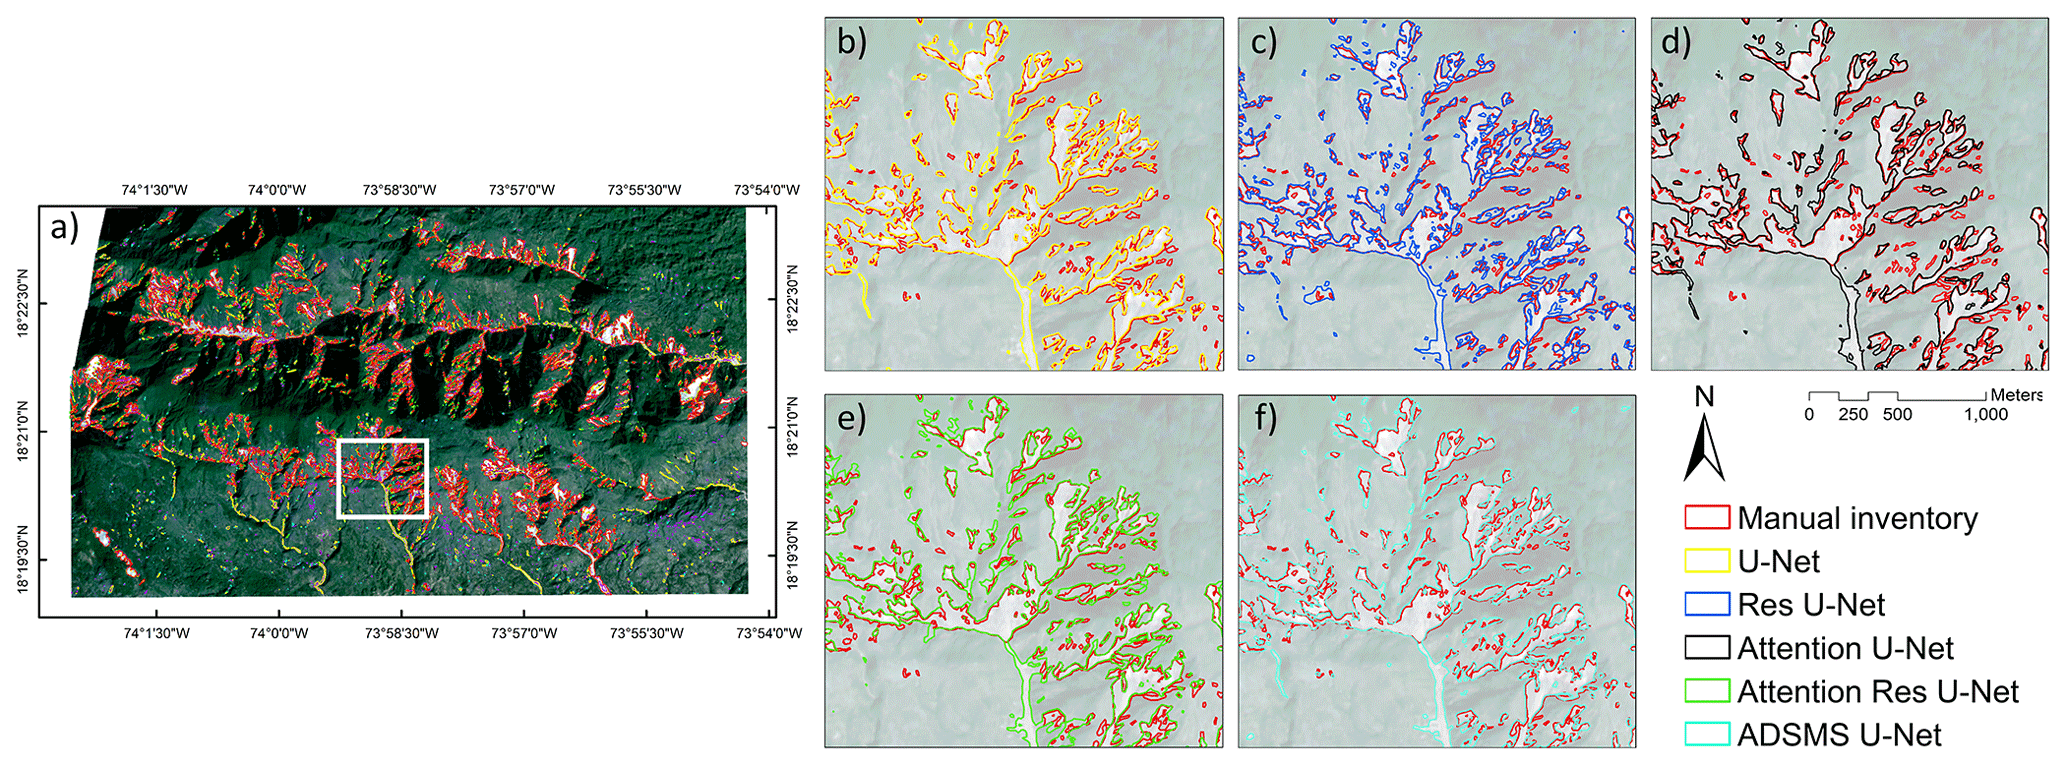
Figure 4Comparison of ground truth landslides with predictions from the DL models for the unseen dataset of Haiti (we utilized various colour coding schemes for the visualization of deep learning (DL)-based landslide detection results, allowing for a visual distinction between polygons generated from manual delineation).
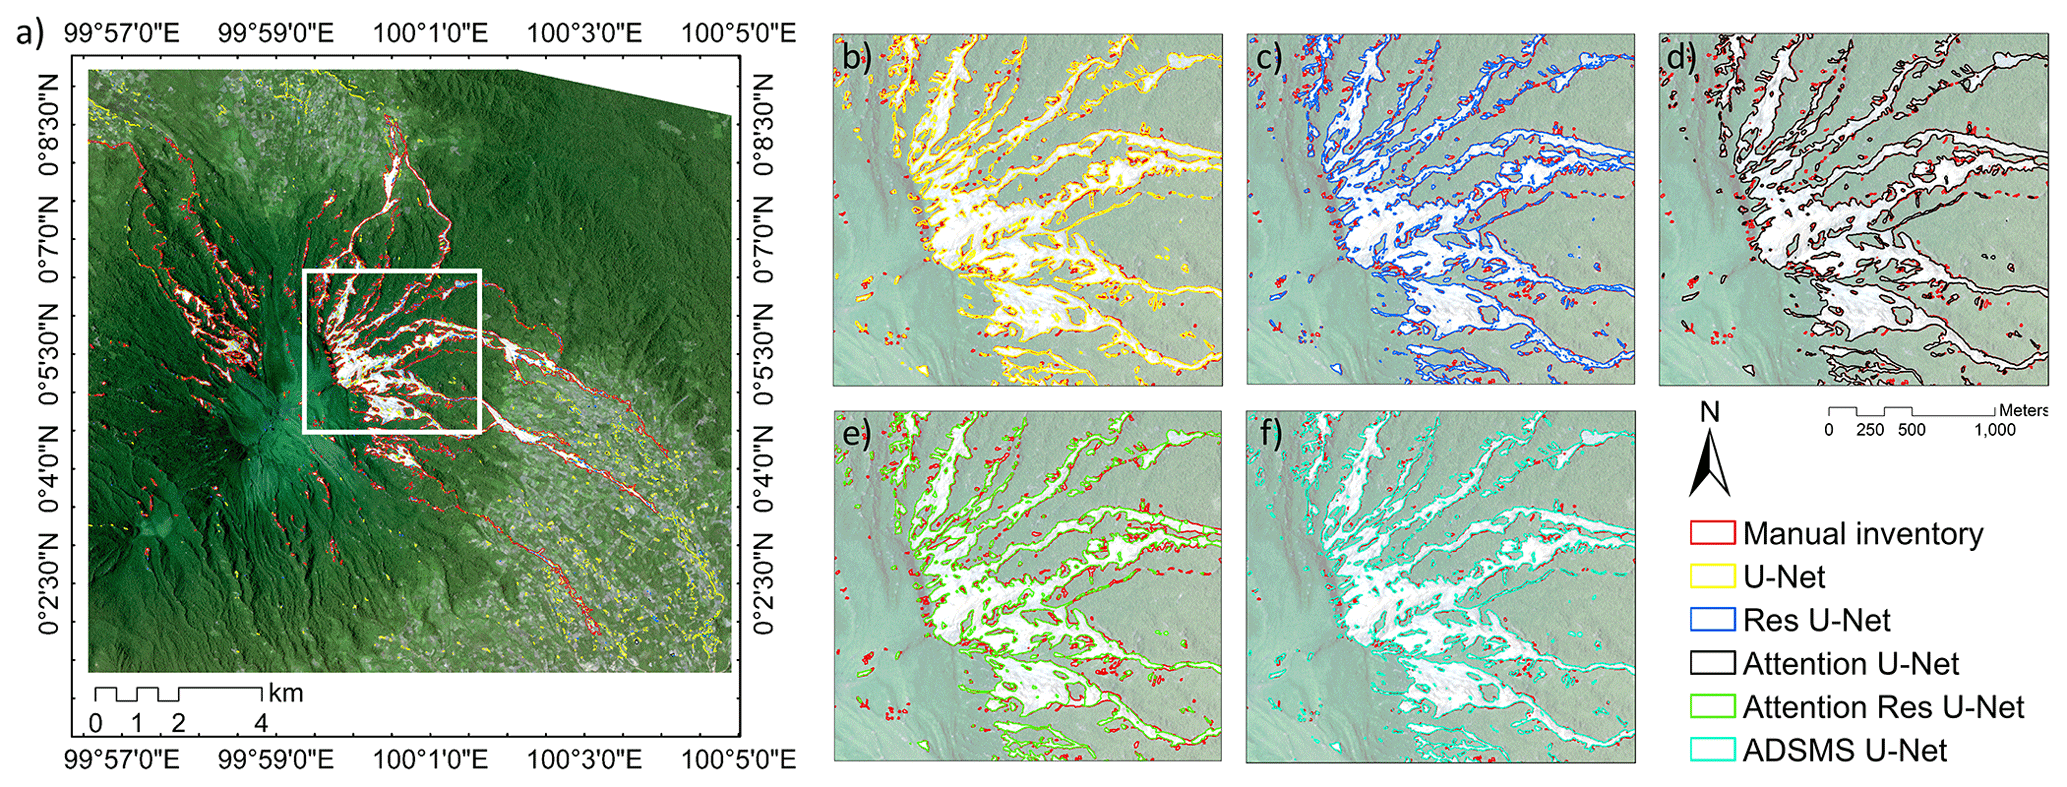
Figure 5Comparison of ground truth landslides with predictions from the DL models for the unseen dataset of Indonesia (we utilized various colour coding schemes for the visualization of deep learning (DL)-based landslide detection results, allowing for a visual distinction between polygons generated from manual delineation).
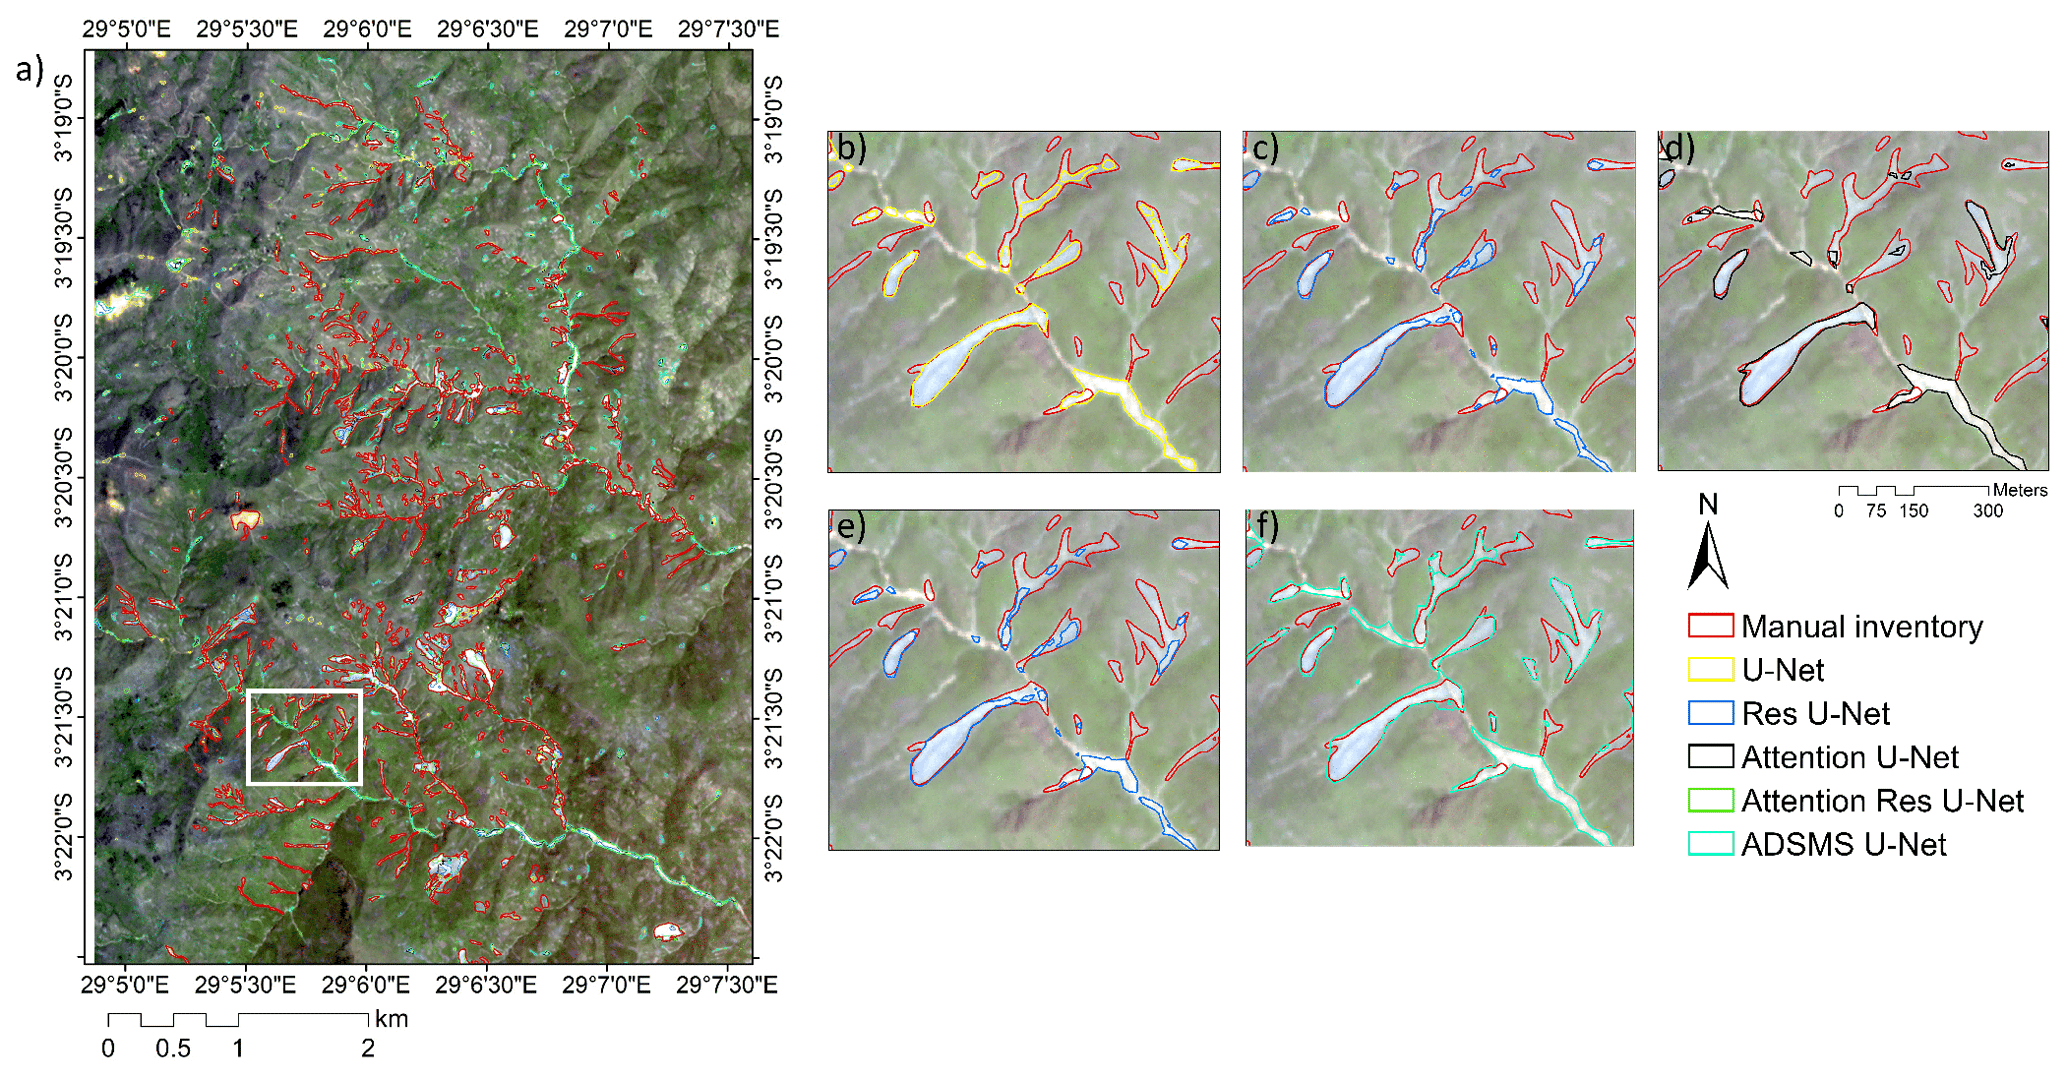
Figure 6Comparison of ground truth landslides with predictions from the DL models for the unseen dataset of DRC (we utilized various colour coding schemes for the visualization of deep learning (DL)-based landslide detection results, allowing for a visual distinction between polygons generated from manual delineation).
6.1 Advantages of using HR images
The spatial resolution of PlanetScope imagery enables the detection of small-size landslides that open-access satellite missions like Sentinel and Landsat frequently miss due to their spatial and temporal resolution (Meena et al., 2022b; Meena et al., 2021d). Moreover, even though Sentinel-2 has additional spectral bands, the lack of improved spatial resolution inhibits precise boundary delineation and landslide localization. The most prominent features of PlanetScope imagery, in addition to its competitive spatial resolution, are its daily temporal resolution and global coverage. Since the satellites have identical sensors, the imageries are orthorectified and image pre-processing is simplified and more accurate. Because PlanetScope imagery provides global coverage, we may extend our study sites to new locations for generating more quality datasets that allow for a better model generalization.
6.2 Quality of HR-GLDD
The quality of any machine learning (ML)/deep learning (DL) model depends on the data that it is trained on, and the HR-GLDD aims to meet this fundamental requirement. To our knowledge, no other quality datasets exist that can accommodate the wide range of landslide-triggering events and topographical diversity needed for efficient model training, as the HR-GLDD is a strong collection of various landslide events caused both by rainfall and earthquakes. The HR-GLDD is designed to calibrate models able to map new events that will occur in the future. The models investigated in our study gave promising and consistent results for two unseen datasets generated by completely different events, indicating a well-prepared, dependable, and resilient dataset. However, there are clear limitations with the HR-GLDD that must be considered. These problems primarily stem from issues with manually delineated polygons and various uncertainties caused by satellite imagery. A number of different variables, including the mapping scale, the date, and the quality of the satellite imagery, affect how accurate an inventory is. The radiometric resolution and cloud coverage are additional variables that affect the generation of manual inventories. Additionally, the haze effect caused by instrument errors hinders model performances. Subjectivity in the landslide polygon boundaries results from the amalgamation problem, which is caused by elements like the investigators' level of experience and the goal of the study.
6.3 Significance of the HR-GLDD
A thorough hazard and risk framework is made possible by quality landslide inventories; however, generating such inventories at large scales takes a large amount of time and resources. This is where such automatic pipelines can truly shine at creating inventories which can be used for the successive phases of a hazard and risk. Local, regional, and national stakeholders may include such inventories in their risk reduction efforts thanks to the availability of inventories produced automatically. Furthermore, this information may serve as the foundation for a legal framework that implements landslide risk. A landslide risk reduction plan is now more crucial than ever given the anticipated rise in worldwide landslide activity brought on by climate change. Higher landslide activity is expected in the future due to a number of factors, including an increase in the frequency and intensity of seismic events, anthropogenic events, heavy precipitation events, rising groundwater levels, storm surges, and a general rise in relative sea level. Therefore, it is essential to comprehend the underlying mechanisms of landslides better and create practical risk reduction techniques to save people's lives and property.
6.4 Automated pipeline for HR-GLDD
At the moment, automated techniques are the only viable solution for mapping vast regions with an accuracy appropriate to operational objectives. Nonetheless, reliable, reproducible, and accurate processes for automating landslide detection across huge data stacks are still absent. As a result, many landslide-affected regions remain unmapped because (1) they are challenging to map using standard methods and (2) using high-resolution imagery is costly and labour-intensive, with a substantial part of the mapping process dependent on human judgement. By overcoming these challenges, automated pipelines that address these issues can considerably reduce the requirement for human involvement and pave the way for the development of reliable real-time mapping and monitoring of natural hazards at continental and global scales. Based on the quality of HR-GLDD, the reliability of automated pipelines, and the rapidly growing availability of HR satellite imagery, we can realistically envision mapping of landslide instances and contribute to generating and updating landslide inventories at large scales, spatially and, potentially, also temporally (Bhuyan et al., 2023).
Providing an expert-based, high-quality, and scientifically validated landslide inventory to scientific communities is essential for frameworks of modelling, landslide prediction, machine learning, and deep learning research. The HR-GLDD dataset has been verified, which increases the availability of much-needed training datasets for automated mapping algorithms. The consistently long time taken to compile landslide inventories manually contrasts with the rise in data accessible for landslide mapping. The development of technologies to successfully automate the procedure is the future direction in landslide inventory mapping. The precedence of a quality dataset is noted where Bhuyan et al. (2023) commented that the need for quality datasets will provide a valuable incentive for training and developing algorithms.
The current dataset is an excellent resource for training and developing future algorithms for this purpose. Automated mapping methods, particularly when combined with publicly available elevation models, can potentially improve our results in future investigations.
The data, working codes, and a document with metadata are freely available at https://doi.org/10.5281/zenodo.7189381 (Meena et al., 2022c) and https://github.com/kushanavbhuyan/HR-GLDD-A-Global-Landslide-Mapping-Data-Repository (last access: 19 July 2023), where data in the format of arrays and model configurations in the framework of TensorFlow can be displayed and used for the reproducibility of our results (Meena et al., 2022a). We also submit the generated landslide inventories in the form of an Environmental Systems Research Institute (ESRI) shapefile. Modules for deep learning can be found at https://www.tensorflow.org/ (Abadi et al., 2016), and original satellite imageries can be found at https://www.planet.com/ (Planet Team, 2019).
Code used to produce data described in this paper, as well as to create figures and tables, can be accessed at https://github.com/kushanavbhuyan/HR-GLDD-A-Global-Landslide-Mapping-Data-Repository. Our data are freely available at https://doi.org/10.5281/zenodo.7189381 (Meena et al., 2022c) as indicated in the section “Data availability”.
Mapping landslides through space is a challenging endeavour. Automated efforts for the same have been explored to some extent, but a transferrable method based on a robust dataset has not yet been investigated. In this paper, we propose a reliable dataset which can be employed by deep learning algorithms to detect new landslides accurately. The predictive capabilities demonstrate the usefulness and application of the dataset to map landslides at large scales. However, the model's predictability must be investigated further in order to identify particular problems to enhance the findings and predictive capabilities for more complicated landscapes. Overall, despite the limitations, the findings are promising, since it is the first time such an HR dataset has been created that caters to a transferable approach of mapping landslides at so many different geomorphological and geographical locations.
The supplement related to this article is available online at: https://doi.org/10.5194/essd-15-3283-2023-supplement.
All the authors contributed equally to the preparation of the paper, from data curation to the review of the final paper.
The contact author has declared that none of the authors has any competing interests.
Publisher’s note: Copernicus Publications remains neutral with regard to jurisdictional claims in published maps and institutional affiliations.
This article is part of the special issue “Benchmark datasets and machine learning algorithms for Earth system science data (ESSD/GMD inter-journal SI)”. It is not associated with a conference.
This research has been supported by the Università degli Studi di Padova through the grant CATA_BIRD2121_01 (project “Towards global landslide models – Upscaling slope hazard forecasts in space and time during weather extremes” led by Filippo Catani).
This paper was edited by Birgit Heim and reviewed by three anonymous referees.
Abad, L., Hölbling, D., Spiekermann, R., Prasicek, G., Dabiri, Z., and Argentin, A.-L.: Detecting landslide-dammed lakes on Sentinel-2 imagery and monitoring their spatio-temporal evolution following the Kaikōura earthquake in New Zealand, Sci. Total Environ., 820, 153335, https://doi.org/10.1016/j.scitotenv.2022.153335, 2022.
Abadi, M., Barham, P., Chen, J., Chen, Z., Davis, A., Dean, J., Devin, M., et al.: TensorFlow: A system for large-scale machine learning, in: 12th USENIX symposium on operating systems design and implementation (OSDI 16), 265–283, 2016 (data available at: https://www.tensorflow.org/, last access: 19 July 2023).
Abderrahim, N. Y. Q., Abderrahim, S., and Rida, A.: Road Segmentation using U-Net architecture, in: 2020 IEEE International conference of Moroccan Geomatics (Morgeo), Casablanca, Morocco, 2020, 1–4, https://doi.org/10.1109/Morgeo49228.2020.9121887, 2020.
Abraham, N. and Khan, N. M.: A Novel Focal Tversky Loss Function With Improved Attention U-Net for Lesion Segmentation, in: 2019 IEEE 16th International Symposium on Biomedical Imaging (ISBI 2019), Venice, Italy, 2019, 683–687, https://doi.org/10.1109/ISBI.2019.8759329, 2019.
Alpert, L.: Rainfall maps of Hispaniola, B. Am. Meteorol. Soc., 23, 423–431, https://www.jstor.org/stable/26256082 (last access: 21 July 2023), 1942.
Amatya, P., Kirschbaum, D., and Stanley, T.: Rainfall-induced landslide inventories for Lower Mekong based on Planet imagery and a semi-automatic mapping method, Geosci. Data J., 9, 315–327, https://doi.org/10.1002/gdj3.145, 2022.
Bai, H., Feng, W., Yi, X., Fang, H., Wu, Y., Deng, P., Dai, H., and Hu, R.: Group-occurring landslides and debris flows caused by the continuous heavy rainfall in June 2019 in Mibei Village, Longchuan County, Guangdong Province, China, Nat. Hazards, 108, 3181–3201, https://doi.org/10.1007/s11069-021-04819-1, 2021.
Basofi, A., Fariza, A., and Dzulkarnain, M. R.: Landslides susceptibility mapping using fuzzy logic: A case study in Ponorogo, East Java, Indonesia, in: 2016 International Conference on Data and Software Engineering (ICoDSE), Denpasar, Indonesia, 2016, 1–7, https://doi.org/10.1109/ICODSE.2016.7936156, 2017.
Bhuyan, K., Van Westen, C., Wang, J., and Meena, S. R.: Mapping and characterising buildings for flood exposure analysis using open-source data and artificial intelligence, Nat. Hazards, https://doi.org/10.1007/s11069-022-05612-4, 2022.
Bhuyan, K., Tanyaş, H., Nava, L., Puliero, S., Meena, S. R., Floris, M., van Westen, C., and Catani, F.: Generating multi-temporal landslide inventories through a general deep transfer learning strategy using HR EO data, Scientific Reports, 13, 162, https://doi.org/10.1038/s41598-022-27352-y, 2023.
Cruden, D. M. and Varnes, D. J.: Landslide Types and Processes, Special Report, Transportation Research Board, National Academy of Sciences, 247, 36–75, 1996.
Dang, V. H., Hoang, N. D., Nguyen, L. M. D., Bui, D. T., and Samui, P.: A novel GIS-Based random forest machine algorithm for the spatial prediction of shallow landslide susceptibility, Forests, 11, 118, https://doi.org/10.3390/f11010118, 2020.
Deijns, A. A. J., Dewitte, O., Thiery, W., d'Oreye, N., Malet, J.-P., and Kervyn, F.: Timing landslide and flash flood events from SAR satellite: a regionally applicable methodology illustrated in African cloud-covered tropical environments, Nat. Hazards Earth Syst. Sci., 22, 3679–3700, https://doi.org/10.5194/nhess-22-3679-2022, 2022.
Diakogiannis, F. I., Waldner, F., Caccetta, P., and Wu, C.: ResUNet-a: A deep learning framework for semantic segmentation of remotely sensed data, ISPRS J. Photogramm., 162, 94–114, https://doi.org/10.1016/j.isprsjprs.2020.01.013, 2020.
Fadhila, A., Fauzi, A., and Rifai, H.: Effectiveness of integrated science (IPA) textbook nested with landslide theme to improve preparedness of students, J. Phys. Conf. Ser., 1185, 012055, https://doi.org/10.1088/1742-6596/1185/1/012055, 2019.
Fan, X., Juang, C. H., Wasowski, J., Huang, R., Xu, Q., Scaringi, G., van Westen, C. J., and Havenith, H.-B.: What we have learned from the 2008 Wenchuan Earthquake and its aftermath: A decade of research and challenges, Eng. Geol., 241, 25–32, https://doi.org/10.1016/j.enggeo.2018.05.004, 2018.
Feng, W., Tang, Y., and Hong, B.: Landslide Hazard Assessment Methods along Fault Zones Based on Multiple Working Conditions: A Case Study of the Lixian–Luojiabu Fault Zone in Gansu Province (China), Sustainability (Switzerland), 14, 8098, https://doi.org/10.3390/su14138098, 2022.
Froude, M. J. and Petley, D. N.: Global fatal landslide occurrence from 2004 to 2016, Nat. Hazards Earth Syst. Sci., 18, 2161–2181, https://doi.org/10.5194/nhess-18-2161-2018, 2018.
Gameiro, S., Riffel, E. S., de Oliveira, G. G., and Guasselli, L. A.: Artificial neural networks applied to landslide susceptibility: The effect of sampling areas on model capacity for generalization and extrapolation, Appl. Geogr., 137, 102598, https://doi.org/10.1016/j.apgeog.2021.102598, 2021.
Ghorbanzadeh, O., Xu, Y., Ghamis, P., Kopp, M., and Kreil, D.: Landslide4sense: Reference benchmark data and deep learning models for landslide detection, arXiv [preprint], https://doi.org/10.48550/arXiv.2206.00515, 1 June 2022.
Gorum, T., Fan, X., van Westen, C. J., Huang, R. Q., Xu, Q., Tang, C., and Wang, G.: Distribution pattern of earthquake-induced landslides triggered by the 12 May 2008 Wenchuan earthquake, Geomorphology, 133, 152–167, https://doi.org/10.1016/j.geomorph.2010.12.030, 2011.
Guha-Sapir, D., Below, R., and Hoyois, P.: EM-DAT: The CRED/OFDA International Disaster Database, Université Catholique de Louvain, Brussels, Belgium, https://www.emdat.be (last access: 15 July 2023), 2009.
Harp, E. L., Jibson, R. W., and Schmitt, R. G.: Map of landslides triggered by the January 12, 2010, Haiti earthquake, Reston, VA, Report 3353, US Geological Survey Scientific Investigations Map, 2016.
Hungr, O., Leroueil, S., and Picarelli, L.: The Varnes classification of landslide types, an update, Landslides, 11, 167–194, 2014.
Ichsandya, D. B., Dimyati, M., Shidiq, I. P. A., Zulkarnain, F., Rahatiningtyas, N. S., Syamsuddin, R. P., and Zein, F. M.: Landslide assessment using interferometric synthetic aperture radar in Pacitan, East Java, International Journal of Electrical and Computer Engineering, 12, 2614–2625, https://doi.org/10.11591/ijece.v12i3.pp2614-2625, 2022.
Jennifer, J. J., Saravanan, S., and Abijith, D.: Application of Frequency Ratio and Logistic Regression Model in the Assessment of Landslide Susceptibility Mapping for Nilgiris District, Tamilnadu, India, Indian Geotechnical Journal, 51, 773–787, https://doi.org/10.1007/s40098-021-00520-z, 2021.
Kingma, D. P. and Ba, J.: Adam: A method for stochastic optimization, arXiv [preprint], https://doi.org/10.48550/arXiv.1412.6980, 22 December 2014.
Lee, C.-Y., Xie, S., Gallagher, P., Zhang, Z., and Tu, Z.: Deeply-supervised nets, arXiv [preprint], https://doi.org/10.48550/arXiv.1409.5185, 18 September 2014.
Liu, Y., Yao, X., Gu, Z., Zhou, Z., Liu, X., Chen, X., and Wei, S.: Study of the Automatic Recognition of Landslides by Using InSAR Images and the Improved Mask R-CNN Model in the Eastern Tibet Plateau, Remote Sensing, 14, 3362, https://doi.org/10.3390/rs14143362, 2022.
Martha, T. R., Roy, P., Khanna, K., Mrinalni, K., and Kumar, K. V.: Landslides mapped using satellite data in the Western Ghats of India after excess rainfall during August 2018, Current Science, 117, 804–812, 2019.
Martinez, S. N., Allstadt, K. E., Slaughter, S. L., Schmitt, R., Collins, E., Schaefer, L. N., and Ellison, S.: Landslides triggered by the August 14, 2021, magnitude 7.2 Nippes, Haiti, earthquake: U.S. Geological Survey Open-File Report 2021–1112, 17 pp., https://doi.org/10.3133/ofr20211112, 2021.
Massey, C., Townsend, D., Jones, K., Lukovic, B., Rhoades, D., Morgenstern, R., Rosser, B., Ries, W., Howarth, J., and Hamling, I.: Volume characteristics of landslides triggered by the Mw 7.8 2016 Kaikōura Earthquake, New Zealand, derived from digital surface difference modeling, J. Geophys. Res-Earth, 125, e2019JF005163, https://doi.org/10.1029/2019JF005163, 2020.
Meena, S., Chauhan, A., Bhuyan, K., and Singh, R. P.: Impact of the Chamoli disaster on flood Plain and water quality along the Himalayan rivers, EGU General Assembly 2021, online, 19–30 Apr 2021, EGU21-16592, https://doi.org/10.5194/egusphere-egu21-16592, 2021a.
Meena, S. R., Chauhan, A., Bhuyan, K., and Singh, R. P.: Chamoli disaster: pronounced changes in water quality and flood plains using Sentinel data, Environ. Earth Sci., 80, 601, https://doi.org/10.1007/s12665-021-09904-z, 2021b.
Meena, S. R., Bhuyan, K., Chauhan, A., and Singh, R. P.: Snow covered with dust after Chamoli rockslide: inference based on high-resolution satellite data, Remote Sens. Lett., 12, 704–714, https://doi.org/10.1080/2150704X.2021.1931532, 2021c.
Meena, S. R., Ghorbanzadeh, O., van Westen, C. J., Nachappa, T. G., Blaschke, T., Singh, R. P., and Sarkar, R.: Rapid mapping of landslides in the Western Ghats (India) triggered by 2018 extreme monsoon rainfall using a deep learning approach, Landslides, 18, 1937–1950, https://doi.org/10.1007/s10346-020-01602-4, 2021d.
Meena, S. R., Nava, L., Bhuyan, K., Puliero, S., Soares, L. P., Dias, H. C., Floris, M., and Catani, F.: HR-GLDD: A globally distributed dataset using generalized DL for rapid landslide mapping on HR satellite imagery, Earth Syst. Sci. Data Discuss. [preprint], https://doi.org/10.5194/essd-2022-350, in review, 2022a.
Meena, S. R., Soares, L. P., Grohmann, C. H., van Westen, C., Bhuyan, K., Singh, R. P., Floris, M., and Catani, F.: Landslide detection in the Himalayas using machine learning algorithms and U-Net, Landslides, 19, 1209–1229, https://doi.org/10.1007/s10346-022-01861-3, 2022b.
Meena, S. R., Nava, L., Bhuyan, K., Puliero, S., Pedrosa Soares, L., Dias, H. C., Floris, M., and Catani, F.: HR-GLDD: A globally distributed high resolution landslide dataset, Zenodo [data set], https://doi.org/10.5281/zenodo.7189381, 2022c.
Milletari, F., Navab, N., and Ahmadi, S.-A.: V-net: Fully convolutional neural networks for volumetric medical image segmentation, in: Fourth International Conference on 3D Vision (3DV), Stanford, CA, USA, 2016, 565–571, https://doi.org/10.1109/3DV.2016.79, 2016.
Mokoso, J. D. D. M., Kavusa, G. K., Milenge, L. W., Sefu, J. A., and Kiswele, P. K.: Hippopotamus amphibius Linnaeus 1758 at Ruzizi River and Lake Tanganyika (Territory of Uvira, South Kivu, DR Congo): population census and conservation implications, Journal of Applied Biosciences, 171, 17795-17811–17795-17811, https://www.ajol.info/index.php/jab/article/view/232603 (last access: 21 July 2023), 2022.
Nava, L., Bhuyan, K., Meena, S. R., Monserrat, O., and Catani, F.: Rapid Mapping of Landslides on SAR Data by Attention U-Net, Remote Sensing, 14, 1449, https://doi.org/10.3390/rs14061449, 2022a.
Nava, L., Monserrat, O., and Catani, F.: Improving Landslide Detection on SAR Data Through Deep Learning, IEEE Geosci. Remote S., 19, 4020405, https://doi.org/10.1109/LGRS.2021.3127073, 2022b.
Nava, L., Cuevas, M., Meena, S. R., Catani, F., and Monserrat, O.: Artisanal and Small-Scale Mine Detection in Semi-Desertic Areas by Improved U-Net, IEEE Geosci. Remote S., 19, 2507905, https://doi.org/10.1109/LGRS.2022.3220487, 2022c.
Oktay, O., Schlemper, J., Folgoc, L. L., Lee, M., Heinrich, M., Misawa, K., Mori, K., McDonagh, S., Hammerla, N. Y., and Kainz, B.: Attention u-net: Learning where to look for the pancreas, arXiv [preprint], https://doi.org/10.48550/arXiv.1804.03999, 11 April 2018.
Planet Team: Education and RESEARCH: Satellite imagery solutions, Planet, https://www.planet.com/ (last access: 24 July 2023), 2019.
Prakash, N., Manconi, A., and Loew, S.: Mapping Landslides on EO Data: Performance of Deep Learning Models vs. Traditional Machine Learning Models, Remote Sensing, 12, 346, https://doi.org/10.3390/rs12030346, 2020.
Qi, S., Xu, Q., Lan, H., Zhang, B., and Liu, J.: Spatial distribution analysis of landslides triggered by 2008.5.12 Wenchuan Earthquake, China, Eng. Geol., 116, 95–108, https://doi.org/10.1016/j.enggeo.2010.07.011, 2010.
Quevedo, R. P., Oliveira, G. G., and Guasselli, L. A.: Mapeamento de Suscetibilidade a Movimentos de Massa a partir de Redes Neurais Artificiais, Anuario do Instituto de Geociencias, 43, 128–138, https://doi.org/10.11137/2020_2_128_138, 2020.
Roback, K., Clark, M. K., West, A. J., Zekkos, D., Li, G., Gallen, S. F., Chamlagain, D., and Godt, J. W.: The size, distribution, and mobility of landslides caused by the 2015 Mw 7.8 Gorkha earthquake, Nepal, Geomorphology, 301, 121–138, 2018.
Ronneberger, O., Fischer, P., and Brox, T.: U-Net: Convolutional Networks for Biomedical Image Segmentation, in: Medical Image Computing and Computer-Assisted Intervention – MICCAI 2015, edited by: Navab, N., Hornegger, J., Wells, W., and Frangi, A., MICCAI 2015, Lecture Notes in Computer Science, vol. 9351, Springer, Cham, https://doi.org/10.1007/978-3-319-24574-4_28, 2015.
Soares, L. P., Dias, H. C., Garcia, G. P. B., and Grohmann, C. H.: Landslide Segmentation with Deep Learning: Evaluating Model Generalization in Rainfall-Induced Landslides in Brazil, Remote Sensing, 14, 2237, https://doi.org/10.3390/rs14092237, 2022.
Tang, X., Tu, Z., Wang, Y., Liu, M., Li, D., and Fan, X.: Automatic Detection of Coseismic Landslides Using a New Transformer Method, Remote Sens., 14, 2884, https://doi.org/10.3390/rs14122884, 2022.
Tanyaş, H., Görüm, T., Fadel, I., Yıldırım, C., and Lombardo, L.: An open dataset for landslides triggered by the 2016 Mw 7.8 Kaikōura earthquake, New Zealand, Landslides, 19, 1405–1420, 2022a.
Tanyaş, H., Hill, K., Mahoney, L., Fadel, I., and Lombardo, L.: The world's second-largest, recorded landslide event: Lessons learnt from the landslides triggered during and after the 2018 Mw 7.5 Papua New Guinea earthquake, Eng. Geol., 297, 106504, https://doi.org/10.1016/j.enggeo.2021.106504, 2022b.
Tiwari, B., Ajmera, B., and Dhital, S.: Geological, topographical, and seismological control on the co-seismic landslides triggered by the 2015 Gorkha earthquake, Geotechnical Frontiers, 234–243, https://doi.org/10.1061/9780784480458.023, 2017.
Uehara, T. D. T., Passos Corrêa, S. P. L., Quevedo, R. P., Körting, T. S., Dutra, L. V., and Rennó, C. D.: Landslide scars detection using remote sensing and pattern recognition techniques: Comparison among artificial neural networks, gaussian maximum likelihood, random forest, and support vector machine classifiers, Revista Brasileira de Cartografia, 72, 665–680, https://doi.org/10.14393/rbcv72n4-54037, 2020.
Wang, F., Fan, X., Yunus, A. P., Siva Subramanian, S., Alonso-Rodriguez, A., Dai, L., Xu, Q., and Huang, R.: Coseismic landslides triggered by the 2018 Hokkaido, Japan (Mw 6.6), earthquake: spatial distribution, controlling factors, and possible failure mechanism, Landslides, 16, 1551–1566, https://doi.org/10.1007/s10346-019-01187-7, 2019.
Xu, C. and Xu, X. W.: Construction of basic earthquake-triggered landslides dataset for several large earthquake events at the beginning of the twenty-first century, Dizhen Dizhi, 36, 90–104, https://doi.org/10.3969/j.issn.0253-4967.2014.01.008, 2014.
Xu, S., Liu, J., Wang, X., Zhang, Y., Lin, R., Zhang, M., Liu, M., and Jiang, T.: Landslide Susceptibility Assessment Method Incorporating Index of Entropy Based on Support Vector Machine: A Case Study of Shaanxi Province, Wuhan Daxue Xuebao (Xinxi Kexue Ban)/Geomatics and Information Science of Wuhan University, 45, 1214–1222, https://doi.org/10.13203/j.whugis20200109, 2020.
Yamagishi, H. and Yamazaki, F.: Landslides by the 2018 Hokkaido Iburi-Tobu Earthquake on September 6, Landslides, 15, 2521–2524, https://doi.org/10.1007/s10346-018-1092-z, 2018.
Yang, Z. and Xu, C.: Efficient Detection of Earthquake−Triggered Landslides Based on U−Net++: An Example of the 2018 Hokkaido Eastern Iburi (Japan) Mw=6.6 Earthquake, Remote Sens., 14, 2826, https://doi.org/10.3390/rs14122826, 2022.
Yang, Z., Xu, C., and Li, L.: Landslide Detection Based on ResU-Net with Transformer and CBAM Embedded: Two Examples with Geologically Different Environments, Remote Sens., 14, 2885, https://doi.org/10.3390/rs14122885, 2022.
Zhao, B., Wang, Y., Feng, Q., Guo, F., Zhao, X., Ji, F., Liu, J., and Ming, W.: Preliminary analysis of some characteristics of coseismic landslides induced by the Hokkaido Iburi-Tobu earthquake (September 5, 2018), Japan, Catena, 189, 104502, https://doi.org/10.1016/j.catena.2020.104502, 2020.
Zin, W. W. and Rutten, M.: Long-term changes in annual precipitation and monsoon seasonal characteristics in Myanmar, Hydrol. Current Res., 8, 1–8, https://doi.org/10.4172/2157-7587.1000271, 2017.
- Abstract
- Introduction
- Study areas
- High-Resolution Global landslide Detector Database (HR-GLDD)
- Methodology
- Results
- Discussions
- Data availability
- Code availability
- Conclusions
- Author contributions
- Competing interests
- Disclaimer
- Special issue statement
- Financial support
- Review statement
- References
- Supplement