the Creative Commons Attribution 4.0 License.
the Creative Commons Attribution 4.0 License.
 | 11 Jul 2023
Mapping global non-floodplain wetlands
Ellen D'Amico
Jay R. Christensen
Heather E. Golden
Qiusheng Wu
Adnan Rajib
Non-floodplain wetlands – those located outside the floodplains – have emerged as integral components to watershed resilience, contributing hydrologic and biogeochemical functions affecting watershed-scale flooding extent, drought magnitude, and water-quality maintenance. However, the absence of a global dataset of non-floodplain wetlands limits their necessary incorporation into water quality and quantity management decisions and affects wetland-focused wildlife habitat conservation outcomes. We addressed this critical need by developing a publicly available “Global NFW” (Non-Floodplain Wetland) dataset, comprised of a global river–floodplain map at 90 m resolution coupled with a global ensemble wetland map incorporating multiple wetland-focused data layers. The floodplain, wetland, and non-floodplain wetland spatial data developed here were successfully validated within 21 large and heterogenous basins across the conterminous United States. We identified nearly 33 million potential non-floodplain wetlands with an estimated global extent of over 16×106 km2. Non-floodplain wetland pixels comprised 53 % of globally identified wetland pixels, meaning the majority of the globe's wetlands likely occur external to river floodplains and coastal habitats. The identified global NFWs were typically small (median 0.039 km2), with a global median size ranging from 0.018–0.138 km2. This novel geospatial Global NFW static dataset advances wetland conservation and resource-management goals while providing a foundation for global non-floodplain wetland functional assessments, facilitating non-floodplain wetland inclusion in hydrological, biogeochemical, and biological model development. The data are freely available through the United States Environmental Protection Agency's Environmental Dataset Gateway (https://gaftp.epa.gov/EPADataCommons/ORD/Global_NonFloodplain_Wetlands/, last access: 24 May 2023) and through https://doi.org/10.23719/1528331 (Lane et al., 2023a).
- Article
(12746 KB) - Full-text XML
- BibTeX
- EndNote


Wetlands are recognized as globally important ecosystems providing functions leading to critical provisioning (e.g., food, freshwater for domestic, agricultural, and industrial use) and regulating services (e.g., flood and drought mitigation, water purification and waste treatment, and habitat; Millennium Ecosystem Assessment, 2005). Despite their functional importance, wetlands are threatened worldwide by myriad anthropogenic disturbances, including sea-level rise (IPCC, 2014), drainage and filling (Davidson, 2014), water abstraction (Liu et al., 2017), consolidation (McCauley et al., 2015), invasive species (Zedler and Kercher, 2004), and changing precipitation and temperature patterns (Winter, 2000). These widespread and globally prevalent alterations to wetlands affect their functioning, resulting in increased downgradient flooding (Golden et al., 2021), modified stream baseflows (Buttle, 2018), reduced pollution mitigation (Evenson et al., 2018a), and habitat loss (Uden et al., 2015).
Watershed-scale wetland management is currently hampered by the paucity of accurate and fine-grained maps of wetland location (Creed et al., 2017; Christensen et al., 2022). However, methods to identify existing aquatic systems, including wetlands, that provide functions at global scales have recently emerged, such as the Landsat-based 30 m global surface water inundation data (Pekel et al., 2016), finer-resolution satellite-based land cover maps (e.g., Zanaga et al., 2021), and groundwater-driven aquatic system characterizations (Fan et al., 2013). In addition, methods utilizing digital elevation models to identify topographic depressions likely to support aquatic systems with characteristic wetland features, such as saturated soils and/or ponded waters, have also regionally proliferated (Wu et al., 2019a, b; Christensen et al., 2022).
These advancements in mapping wetland location, such as those located within the river floodplain or geographically distal from floodplains, allow resource managers to better incorporate wetland biogeochemical, hydrological, and biological functions and concomitantly ecosystem services into their decision-making efforts. For instance, incorporating floodplain wetlands into decision-making advances the wise management and conservation of mapped riparian ecosystems (Tullos, 2018; Kundzewicz et al., 2018). Thus, recognizing the importance of wetlands located within active river floodplains, land-management decisions are being made to quantify the functions and ecosystem services of these wetlands and incorporate them into watershed-scale hydro-ecological decisions (e.g., Makungu and Hughes, 2021; Rajib et al., 2021).
However, non-floodplain wetlands are typically not incorporated into watershed-scale conservation and management planning (e.g., Sullivan et al., 2019), thereby ignoring their contributions to watershed-scale resilience in response to biogeochemical and hydrological disturbances (Rains et al., 2016; Golden et al., 2021; Lane et al., 2023b). Non-floodplain wetlands are abundant inland freshwater wetlands located distally from the floodplains of rivers and lakes (Lane and D'Amico, 2016; Lane et al., 2018). Though typically small (Cohen et al., 2016), high biogeochemical processing rates within non-floodplain wetlands have resulted in these systems being termed bioreactors (Marton et al., 2015). Indeed, a literature review of over 600 articles found that the highest reactivity rates (pollutant mass removal per unit time) were found in the smallest water bodies and wetlands (Cheng and Basu, 2017). Further, the high reactivity of individual non-floodplain wetlands can cumulatively improve downgradient water quality conditions (Golden et al., 2019; Evenson et al., 2021). Non-floodplain wetlands may therefore have an outsized impact on a watershed's water quality.
Non-floodplain wetlands are also important ecosystems affecting water quantity (i.e., for storing and gradually releasing water to downgradient rivers and streams). Specifically, precipitation is captured and stored in non-floodplain wetlands prior to being discharged downgradient. During this storage period, water can infiltrate to recharge aquifers, evaporate or transpire, or eventually “spill” overland and be transported downstream (Jones et al., 2018; Buttle, 2018). These non-floodplain wetland water storage functions attenuate storm flows (Shaw et al., 2012; Fossey and Rousseau, 2016; Blanchette et al., 2022) and recharge groundwaters (Bam et al., 2020), thereby mitigating flood hazards (Mclaughlin et al., 2014) and ameliorating drought conditions by maintaining baseflow (Ameli and Creed, 2019).
Despite the important functions provided by non-floodplain wetlands (Biggs et al., 2017; Chen et al., 2022) a substantive data gap remains: no global maps or datasets exist identifying the geospatial location of non-floodplain wetlands and open waters. Regionally focused efforts, such as the recent work by Lane and D'Amico (2016) and Lane et al. (2023b), mapped the extent of non-floodplain wetlands (also known as geographically isolated wetlands; Leibowitz, 2015; Mushet et al., 2015) across the geospatially data-rich conterminous United States (CONUS; see abbreviation list in Appendix A). They found that 16 %–23 % of freshwater systems were potential non-floodplain wetlands, suggesting a substantial yet hitherto unknown portion of the globe's wetlands are likely also this vulnerable water resource.
Fortunately, geospatial data for identifying aquatic systems, including wetlands, are burgeoning. Global land cover and land use geospatial datasets that include a wetland cover class continue to propagate (Hu et al., 2017a), taking advantage of both lengthy time-series Landsat data (Homer et al., 2020) and recently launched advanced high-resolution satellites and/or satellites equipped with synthetic-aperture radar (SAR; e.g., Sentinel-1, Sentinel-2, and many commercially available platforms; Martinis et al., 2022) and topographic data sources and analyses (e.g., Wu et al., 2019b). Examples include the GlobeLand30 product (Chen et al., 2015), the European Space Agency (ESA) WorldCover 2020 product (Zananga et al., 2021), and the Dynamic World dataset (Brown et al., 2022), as well as consortiums focusing on annual land cover change mapping (e.g., Tsendbazar et al., 2021). Several recent publications review the available wetland-focused datasets, including Hu et al. (2017a, their Table 1), Davidson et al. (2018, their Table S1), Tootchi et al. (2019, their Table 1), and Zhang et al. (2023, their Table 1). We summarize additional emerging global land cover datasets related to surface water and wetlands in Appendix Table B1.
Lehner and Döll (2004) were amongst the first to publish a geospatially explicit global map focusing on wetland extents. Their Global Lakes and Wetlands Database (GLWD) provides 1 km estimates of wetland abundance. More recent and/or higher-resolution wetland-focused datasets have emerged. For instance, Hu et al. (2017b) incorporated precipitation and a topographic wetness index to create a 1 km global wetland dataset, and Tootchi et al. (2019) developed a global map using multi-sourced 500 m composite maps of regularly flooded and groundwater-driven wetlands. The approach by Tootchi et al. (2019) identified small and scattered wetlands. However, they recognized that the limitations inherent in their global product (ca. 500 m per pixel resolution) resulted in omission errors for many wetland systems, especially those smaller than their 500×500 m (25 ha) data resolution. This suggests, and Tootchi et al. (2019) acknowledged, that many (non-floodplain) wetlands were omitted in the Tootchi et al. (2019) 500 m global product. Cohen et al. (2016) determined that non-floodplain wetlands in the CONUS are “unambiguously small”; e.g., their average non-floodplain wetland area was 2.1 ha. Based on the “all-or-nothing” methodological approach in Tootchi et al. (2019), > 12.5 ha of a given 25.0 ha cell (one homogenous pixel) would have to be identified as wetland in their resampling of the finer-scale data – much larger than the average 2.1 ha wetlands found in Cohen et al. (2016).
Concurrent with increasingly available global land cover and wetland data, there is an increasing global focus on deriving floodplain and flood hazard-prone areal extents within river networks based on high-resolution topographic data coupled with hydrologic and/or hydraulic modeling (Tullos, 2018; Kundzewicz et al., 2018). The past decade has seen development of multiple regional to continental flood models that span physically based approaches (e.g., 1-,2-, and 3-D hydrodynamic models) to empirical models (including machine-learning (ML) approaches and statistical models) (see review by Mudashiru et al., 2021). On the global scale, openly accessible global flood models include those reviewed by Hoch and Trigg (2019), namely CaMa-Flood (Catchment-based Macro-scale Floodplain; Yamazaki et al., 2011), GLOFRIS (Global Flood Risk with Image Scenarios; Winsemius et al., 2013), JRC (Joint Research Center; Dottori et al., 2016), CIMA-UNEP (CIMA Research Foundation – United Nations Environmental Programme; Rudari et al., 2015), Fathom (Sampson et al., 2015), and ECMWF (European Centre for Medium-Range Weather Forecasts; Papperberger et al., 2012). For instance, Sampson et al. (2015) created a global 90 m map of flood-prone areas between 60∘ N and 56∘ S using a regional flood-frequency model. More recently, Nardi et al. (2019) published a global floodplain dataset at 250 m resolution that extended from 60∘ N to 60∘ S developed through geomorphic or terrain-based analyses of floodplain elevations and maximum flood-prone areas using a drainage-area scaling variable (Rajib et al., 2021). The evolution of the MERIT (Multi-Error Removed Improved Terrain) Hydro 90 m global hydrography dataset by Yamazaki et al. (2019) and machine-learning approaches (e.g., Zhao et al., 2021) has created additional opportunities to further advance the derivation of global floodplains, with improved identification of flow accumulation area, river-basin shape, and river channel location.
These wetland location and floodplain extent data are critical for watershed-scale sustainable aquatic resource policy decisions (Creed et al., 2017; Golden et al., 2017). The lack of these data can result in disproportionately large model errors and potentially misguided management decisions when non-floodplain wetlands are not incorporated in hydrological and biogeochemical models, ignoring their watershed-scale impacts on flooding, drought, and water quality (Evenson et al., 2018a; Rajib et al., 2020; Golden et al., 2021).
Here, we provide the first global geospatial dataset of non-floodplain wetlands. We incorporate the recent development of a high-resolution global floodplain mapping algorithm based on digital terrain models by Nardi et al. (2019). We couple these spatial floodplain data with higher-resolution modifications to the gridded global wetland and open-water data layers developed by Tootchi et al. (2019) that incorporate the Pekel et al. (2016) satellite-based inundation product, modeled groundwater-driven wetland extent (Fan et al., 2013, and ancillary satellite land cover data from Herold et al., 2015). We test the applicability of our global dataset of non-floodplain wetlands in 21 large and spatial-data rich watersheds spanning nearly 700 000 km2 across the CONUS. This novel global product identifying non-floodplain wetlands provides for the quantification and estimation of the locations and extent of important aquatic systems with abundant hydrological, biogeochemical, and biological functions, filling a noted research gap while delivering useful data for informed natural resource decision-making and management (Creed et al., 2017; Lane et al., 2023b).
Identifying global non-floodplain wetlands required the following steps: (1) determination of global floodplain extent, (2) identification of the global distribution of wetlands, (3) spatial overlay (masking) of floodplains and wetlands to derive a non-floodplain wetland data layer, and (4) data verification and accuracy assessment. Steps 1–3 are outlined in a flow chart given in Fig. 1.
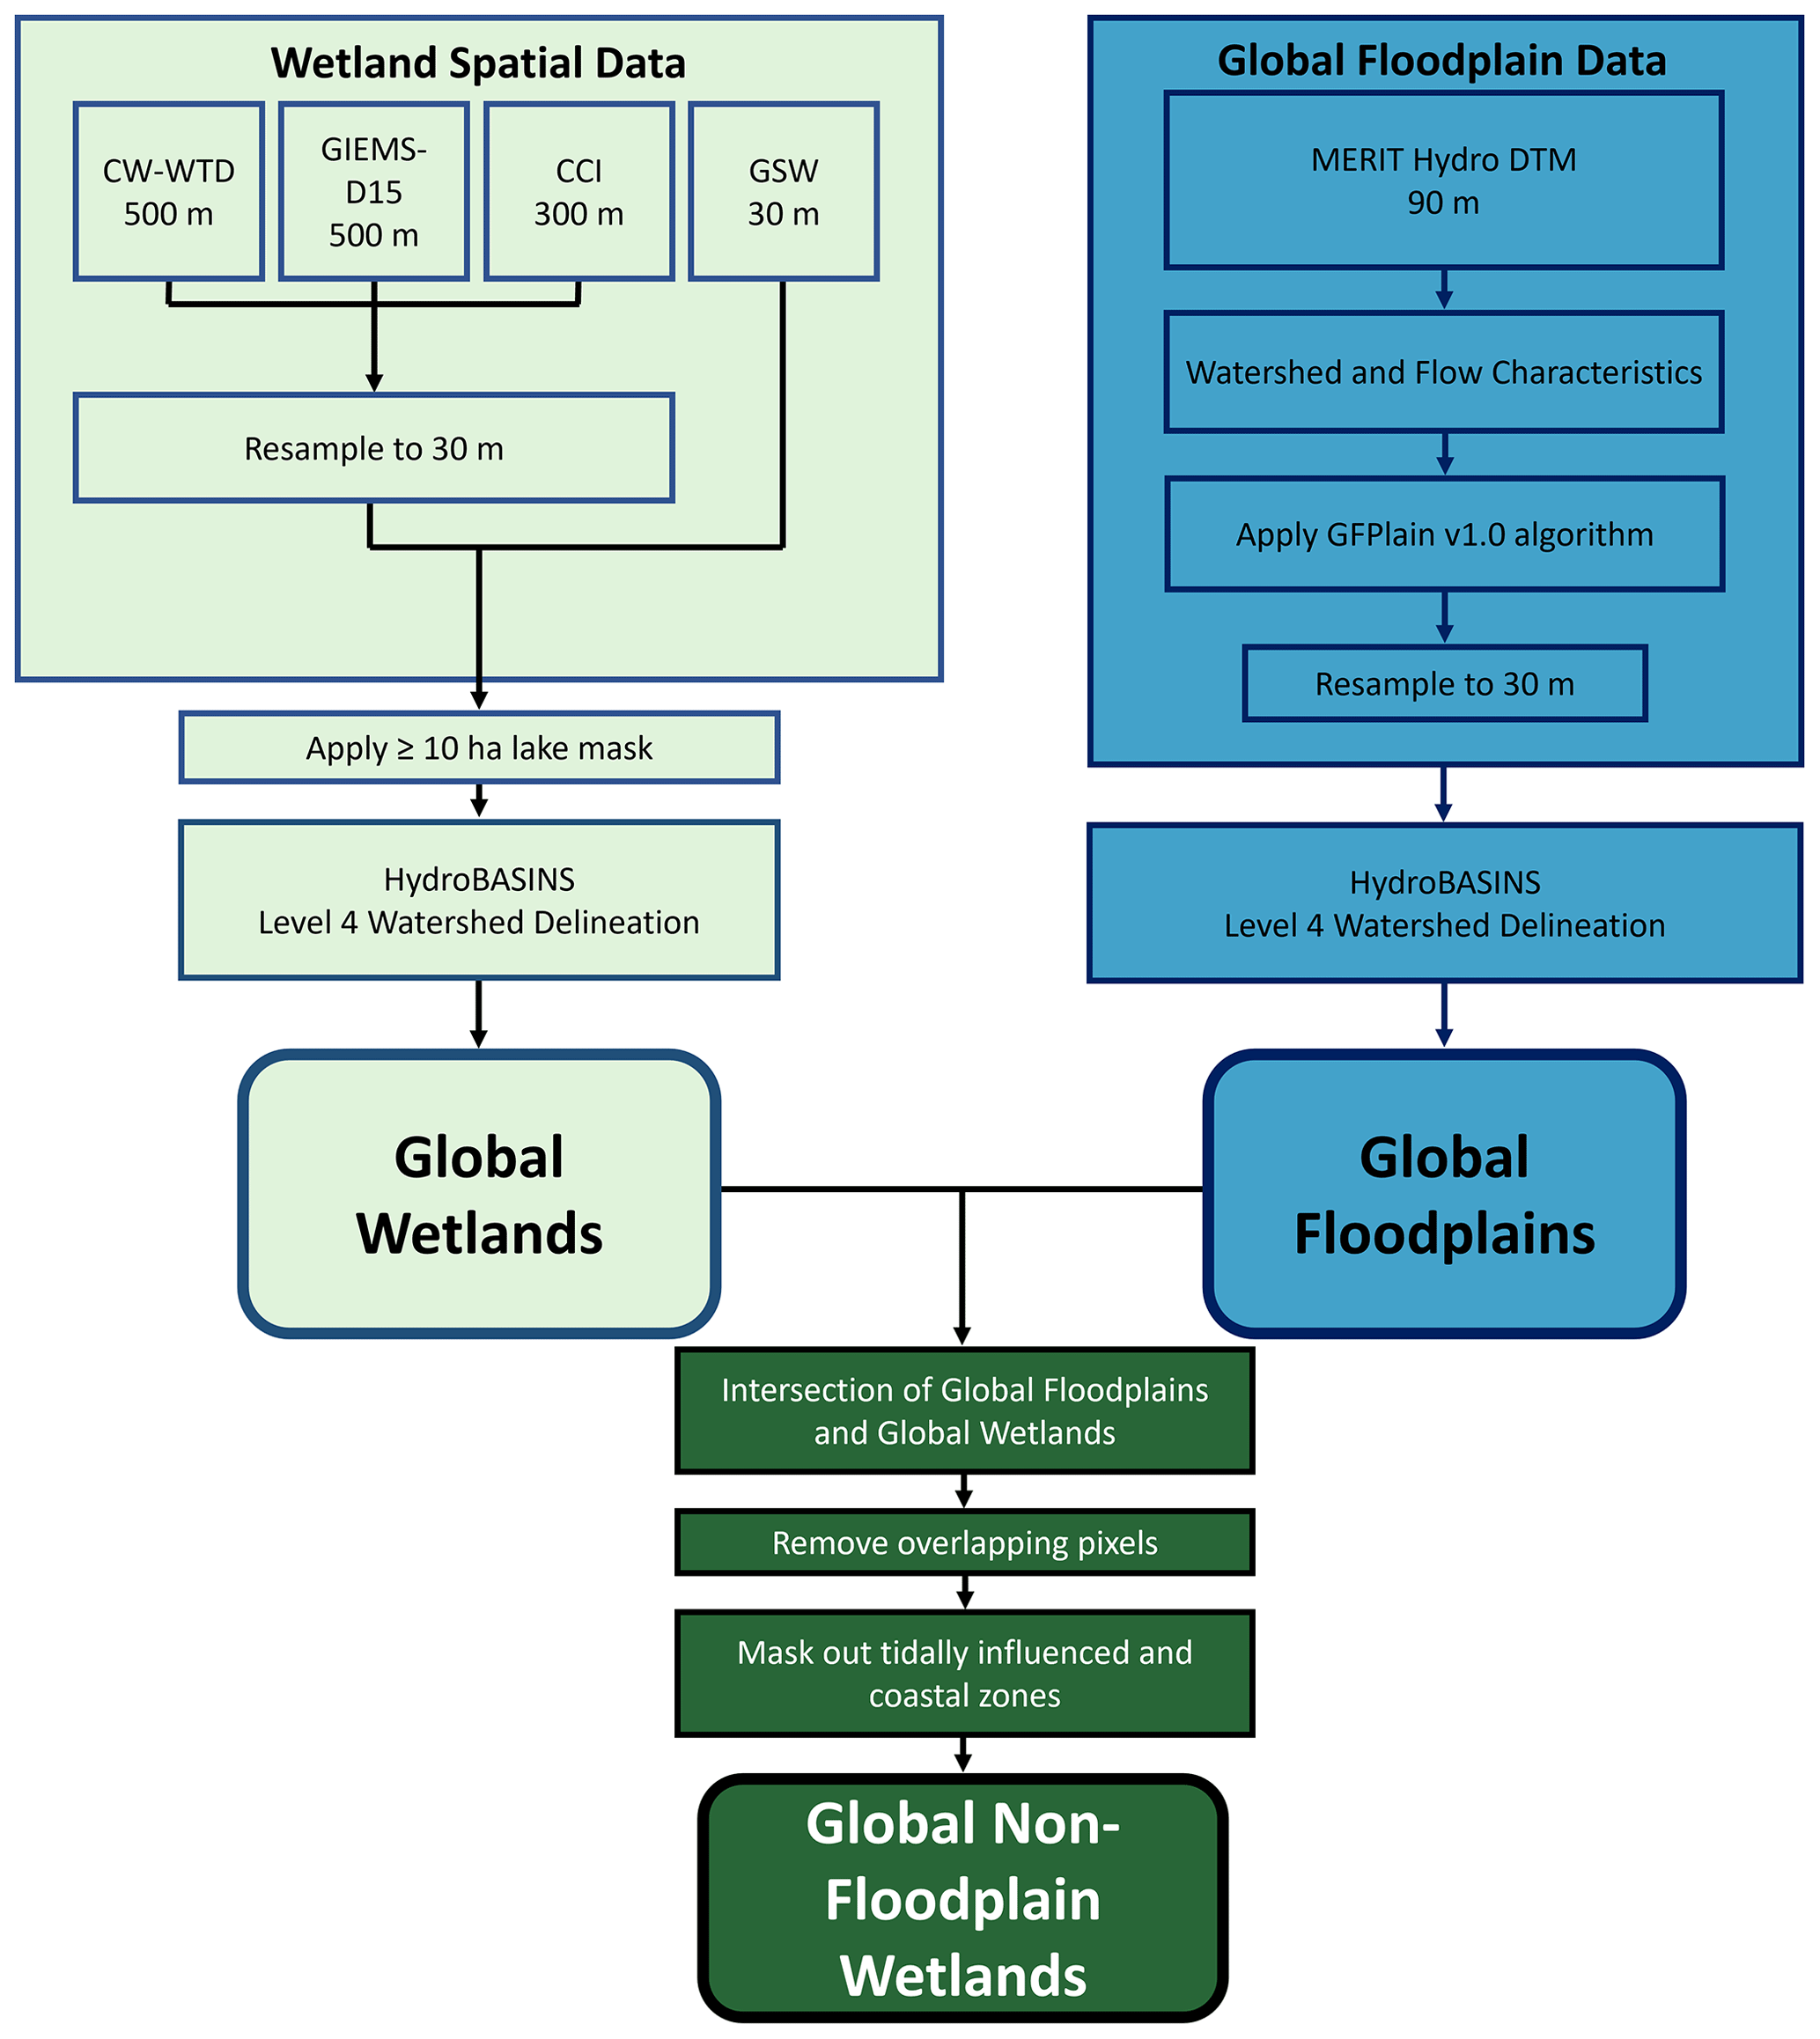
Figure 1Data flow chart identifying the main datasets and processes involved in deriving the Global Floodplain and Global Wetland data layers, as well as the intersection of those data to create the Global Non-Floodplain Wetland data product. Curved boxes represent final products, and abbreviations may be found in the text and Appendix A.
2.1 Global floodplain data
Nardi et al. (2019) combined spaceborne elevation data and terrain analysis with a novel open-source algorithm to delineate the geomorphic floodplains across the globe between 60∘ N and 60∘ S latitudes. Conceptually, Nardi et al. (2019) identified floodplains from surrounding hillslopes as those low-lying landscape features that have been naturally shaped by accumulated geomorphic effects of past flood events. The original Nardi et al. (2019) dataset was limited in its spatial extent (60∘ N–60∘ S) and resolution (250 m); this study sought to delineate global floodplain extent while concurrently identifying floodplain features further up the river network than possible with 250 m pixels. Hence, we utilized the freely available Nardi et al. (2019) GFPlain (Global Floodplain) v1.0 algorithm and coupled this with the MERIT Hydro (Yamazaki et al., 2019), global raster digital terrain model data to develop a higher-resolution (90 m) geomorphic riverine floodplain for the globe, termed hereafter GFPlain90.
The development of GFPlain90 required multiple steps. We first extracted elevation data from MERIT Hydro and reprojected the data in UTM (Universal Transverse Mercator) zones to prevent distortion when using the GFPlain algorithm. We then developed the drainage network, drainage area, flow accumulation, and flow direction data from these data using the established scaling parameters in Nardi et al. (2019; power-law coefficient (a) of 0.01 and dimensionless exponent (b) = 0.30). We established 20 km2 as the minimum contributing-area threshold required to create the drainage network, balancing the development of a global stream-network distribution and extent with computational requirements. We then globally organized the data by HydroBASINS Level 4 basins (Lehner and Grill, 2013). HydroBASINS provides seamless watershed boundaries and subbasin delineations at global scales; there are 1342 Level 4 HydroBASINS globally. The floodplain extent resolution of GFPlain90 was resampled (using nearest neighbor) to 30 m for subsequent performance assessment and overlap analyses with the wetland spatial data. All spatial analyses in this study were conducted using ArcGIS Pro v.2.9.x (ESRI, Redlands, California) and GRASS GIS v 7.4.4 (OSGEO, Beaverton, Oregon).
2.2 Global wetland data
Tootchi et al. (2019) developed a widely used composite global wetland map at ∼ 500 m by combining multiple data sources, including both satellite-based surface water inundation mapping and vegetation classification coupled with model-based approaches capturing important groundwater-driven wetland systems. We specifically used the Tootchi et al. (2019) composite map consisting of both regularly surface-water-flooded wetlands (“regularly flooded wetlands”, RFWs) and groundwater-discharge-maintained wetlands (“groundwater-driven wetlands”, GDWs) as the foundation for our global wetland map. Tootchi et al. (2019) merged the RFW and GDW maps, described below, to form a union product used here that demonstrated a high correlation with available evaluation data, called the composite wetland–water table depth (or CW-WTD).
2.2.1 Original composite wetland data
Regularly flooded wetlands (RFWs) derived by Tootchi et al. (2019) were based on three data sources: 30 m resolution global surface water (GSW) data by Pekel et al. (2016), 300 m Climate Change Initiative (CCI) land cover data by Herold et al. (2015), and 500 m GIEMS-D15 (Global Inundation Extent from Multi-Satellites – Downscaled 15 arcseconds) wetland extent data by Fluet-Chouinard et al. (2015). GSW data used by Tootchi et al. (2019) were developed from Landsat satellite imagery analyses of pixels identified as inundated at least once during the 32-year period of record by Pekel et al. (2016). CCI input wetland data for Tootchi et al. (2019) included both inundated and wetland vegetation-classed pixels assessed during the period 2008–2012 by Herold et al. (2015). For GIEMS-D15, data included were the mean annual maximum extent of pixels identified as wetlands using multi-sensor satellite data by Prigent et al. (2007), downscaled to ∼ 500 m resolution by Fluet-Chouinard et al. (2015). GSW and CCI input data were resampled to ∼ 500 m resolution using an all-or-nothing” approach by Tootchi et al. (2019). This means that a pixel categorization of “wetland” at 500 m resolution was given by Tootchi et al. (2019) only if the majority of resampled finer-resolution input pixels were classed as wetlands. The upward resampling from 30 and 300 to 500 m resulted in a loss of informative spatial data on wetland extent from GSW and CCI data. Tootchi et al. (2019) calculated that RFWs cover approximately 9.7 % of the global land area (excluding lakes (sourced from Messager et al., 2016), Antarctica, and the Greenland ice sheet).
Groundwater-driven wetlands (GDWs in the analysis of Tootchi et al., 2019) used in this study were based on the water table depth estimates by Fan et al. (2013). Fan et al. (2013) developed a 1 km resolution groundwater map based on climate and terrain variables that was validated by over 1 million government-recorded and published observations. Fan et al. (2013) estimated that shallow groundwater influenced nearly 15 % of groundwater-fed surface features, explaining important wetland patterning at global scales (as well as vegetation classes at local and regional scales). A water table depth threshold of ≤ 20 cm was used by Tootchi et al. (2019) to identify groundwater-driven wetlands, and they resampled these data to ∼ 500 m cell resolution. The GDW distribution based on water table depths covered approximately 15 % of the global land mass (including large portions of the Amazon basin, coastal zones, and North American and Siberian peatlands).
Tootchi et al. (2019) created a merged “final” product, called the composite wetland–water table depth (CW-WTD) map, which is based on the union of the RFW and GDW maps. They measured an approximately 3.8 % overlap between the total land pixels identified as wetlands in both the RFW and GDW maps that comprise the CW-WTD, suggesting the different input maps capture different wetland types. At the global scale, Tootchi et al. (2019) reported spatial Pearson correlations between CW-WTD (wetland fractions at 3 arcmin, or ∼ 4.9 km grids) and wetlands within the GLWD (Lehner and Döll, 2004) and Hu et al. (2017b) as r=0.34 and r=0.43, respectively. Tootchi et al. (2019, their Tables 5 and S1) provided additional analysis of the correlations between their global wetland product and existing benchmark data. The total CW-WTD global wetland estimate was ∼ 21.1 % of the land mass or approximately 27.5×10⁶ km2 (excluding large lakes, Antarctica, and the Greenland ice sheet; Tootchi et al., 2019).
2.2.2 Derived global wetland data
To account for the acknowledged limitations of the Tootchi et al. (2019) data and to accurately identify more of the existing small and, specifically, non-floodplain wetlands across the globe (e.g., those < 25 ha), we improved upon and augmented the CW-WTD (Tootchi et al., 2019) global wetland data layer with the 30 m native-resolution GSW (Pekel et al., 2016) and 300 m native-resolution CCI (Herold et al., 2015) data. The inclusive wetland categories of Tootchi et al. (2019) were maintained, namely at least one inundation event over a 32-year range (for GSW data) and CCI pixels defined as “… mixed classes of flooded areas with tree covers, shrubs, or herbaceous covers plus inland water bodies …” (Tootchi et al., 2019, p. 193). However, for our analysis we resampled the 500 m CW-WTD product to 30 m using the nearest-neighbor approach and then added any identified wetland pixel from the CCI data (resampled from 300 to 30 m) and inundated pixel from the GSW data (30 m resolution). Resampling to a finer resolution (as we did in our analysis) does not result in data losses: the same data are retained but are divided into equal, smaller parts. However, moving from a finer resolution to coarser resolution (as in the CW-WTD dataset's all-or-nothing approach) does cause data losses: fine-scale data are necessarily aggregated (often by averaging) to a larger grid cell size, and therefore less information is retained. To compensate for this data loss in the CW-WTD dataset, the finer-resolution GSW (30 m) and CCI (300 m) data were added back into the dataset. This resulted in a novel and encompassing wetland ensemble end product, hereafter termed the “Global Wetland” dataset. This new dataset is inclusive of finer-resolution (30 and 300 m) data, thereby accounting for a wide range of wetland sizes – such as smaller non-floodplain wetlands (Cohen et al., 2016) – that remained unmapped by Tootchi et al. (2019).
2.3 Global non-floodplain wetlands (NFWs)
To identify non-floodplain wetlands specifically, we overlaid our GFPlain90 floodplain data with our mapped Global Wetland data to mask wetland pixels collocated on the floodplain. Then, to avoid tidally influenced wetlands, we conducted a region-group analysis to identify connected pixels abutting coastal shorelines in order to mask wetlands in coastal areas (e.g., those directly abutting the shoreline and spatially connected to tidally influenced areas). We used a four-directional contagion criterion to identify connected pixels (i.e., those connected in cardinal directions). Subsequently, we applied a 1 km buffer to the HydroBASINS (Lehner and Grill, 2013) coastline area and removed from our analyses any wetland region group partially or completely overlain by the 1 km coastline buffer. In addition, Tootchi et al. (2019) removed lake systems (≥ 10 ha) from their wetland-focused data by masking aquatic layers using HydroLAKES (Messager et al., 2016). To avoid including large lakes in our emerging non-floodplain wetland geospatial data, we also applied the HydroLAKES mask and removed lake systems ≥ 10 ha (Messager et al., 2016) from our Global Wetland dataset. Thus, our final global non-floodplain wetland data product (hereafter “Global NFW” dataset) did not include fluvial floodplain wetlands, nor did it include coastal wetland complexes and large open-water lacustrine (lake-like; Cowardin et al., 1979) systems.
2.4 Data verification and assessment
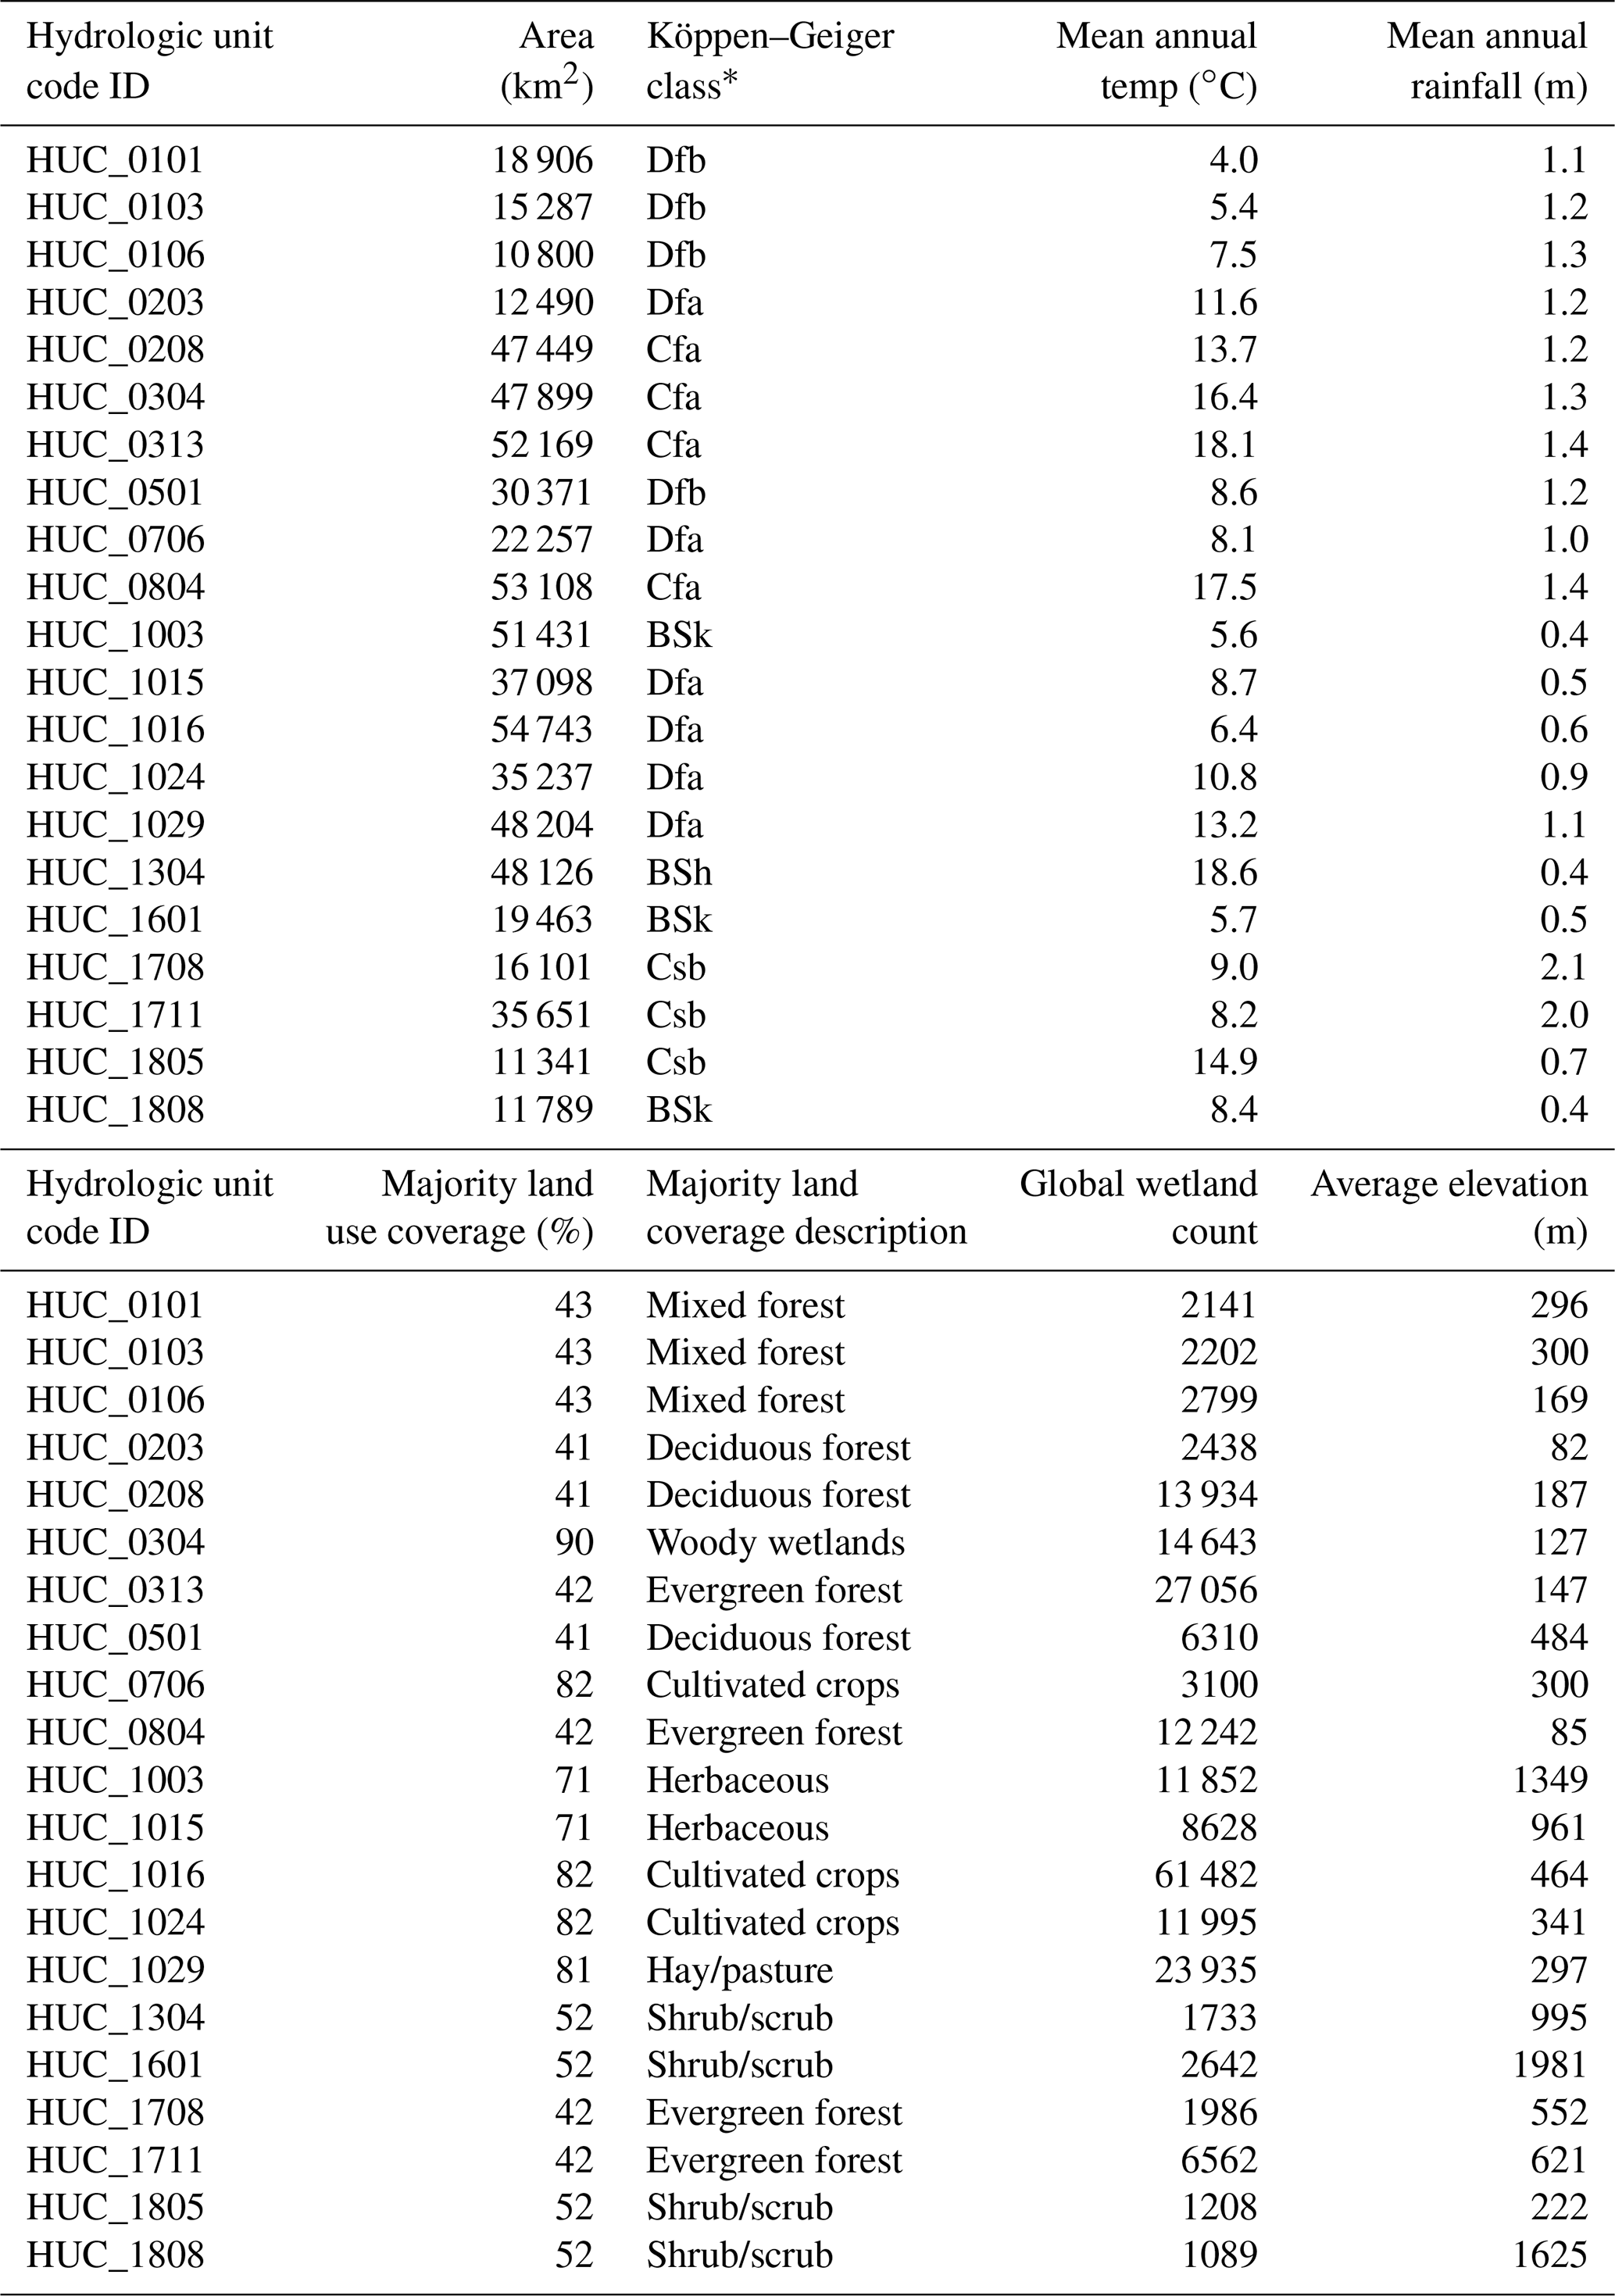
We evaluated the global products developed here through comparison of high-resolution floodplain and wetland extent data from 21 basins representing disparate climatic (according to the Köppen–Geiger classification, Beck et al., 2018), elevation, and land use gradients within the CONUS (Fig. 2; summarized in Table B2). We specifically focused on the CONUS for product assessment because of its wide-ranging data availability and diversity of physiographic and climatic regions.
2.4.1 Verifying floodplain extent
We used a recently developed machine-learning-based 30 m resolution CONUS floodplain dataset (Woznicki et al., 2019) as the benchmark to evaluate our GFPlain90 global floodplain data. Specifically, the ML model by Woznicki et al. (2019) used the US Federal Emergency Management Agency (FEMA) 100-year floodplain (i.e., a 1 % chance of coastal or fluvial flood inundation in a given year; Jakubínský et al., 2021) as the training data and subsequently used soil and topographic characteristic along with land cover to identify potential floodplain grid cells across the CONUS at 30 m resolution. Woznicki et al. (2019) reported that their ML approach correctly identified ∼ 79 % of the FEMA 100-year coastal and fluvial floodplains, providing spatially complete 100-year floodplain coverage totaling 980 450 km2 across the CONUS.
2.4.2 Verifying wetland and non-floodplain wetland extent
We evaluated our inclusive Global Wetland and Global NFW datasets in 21 basins covering ∼ 680 000 km2 (Fig. 2). We contrasted our products to the 2016 National Land Cover Database (NLCD; Dewitz, 2019). The NLCD is a 30 m Landsat satellite-based geospatial product with an overall accuracy of 86 % that incorporates high-resolution aerial imagery of wetland location for model parameterization and calibration (Jin et al., 2019; Wickham et al., 2021). Three NLCD classes were selected for comparison with the Global Wetland product: woody wetlands, emergent herbaceous wetlands, and open water. To assess the relative improvement of our 30 m Global Wetland and Global NFW dataset with the 500 m Tootchi et al. (2019) data, we also contrasted the CW-WTD with the NLCD classes within the verification watersheds. For equal comparisons, following Tootchi et al. (2019) we used the Messager et al. (2016) HydroLAKES to mask out large lake systems (≥ 10 ha) from both the Global Wetland and the NLCD data within the 21 verification watersheds.
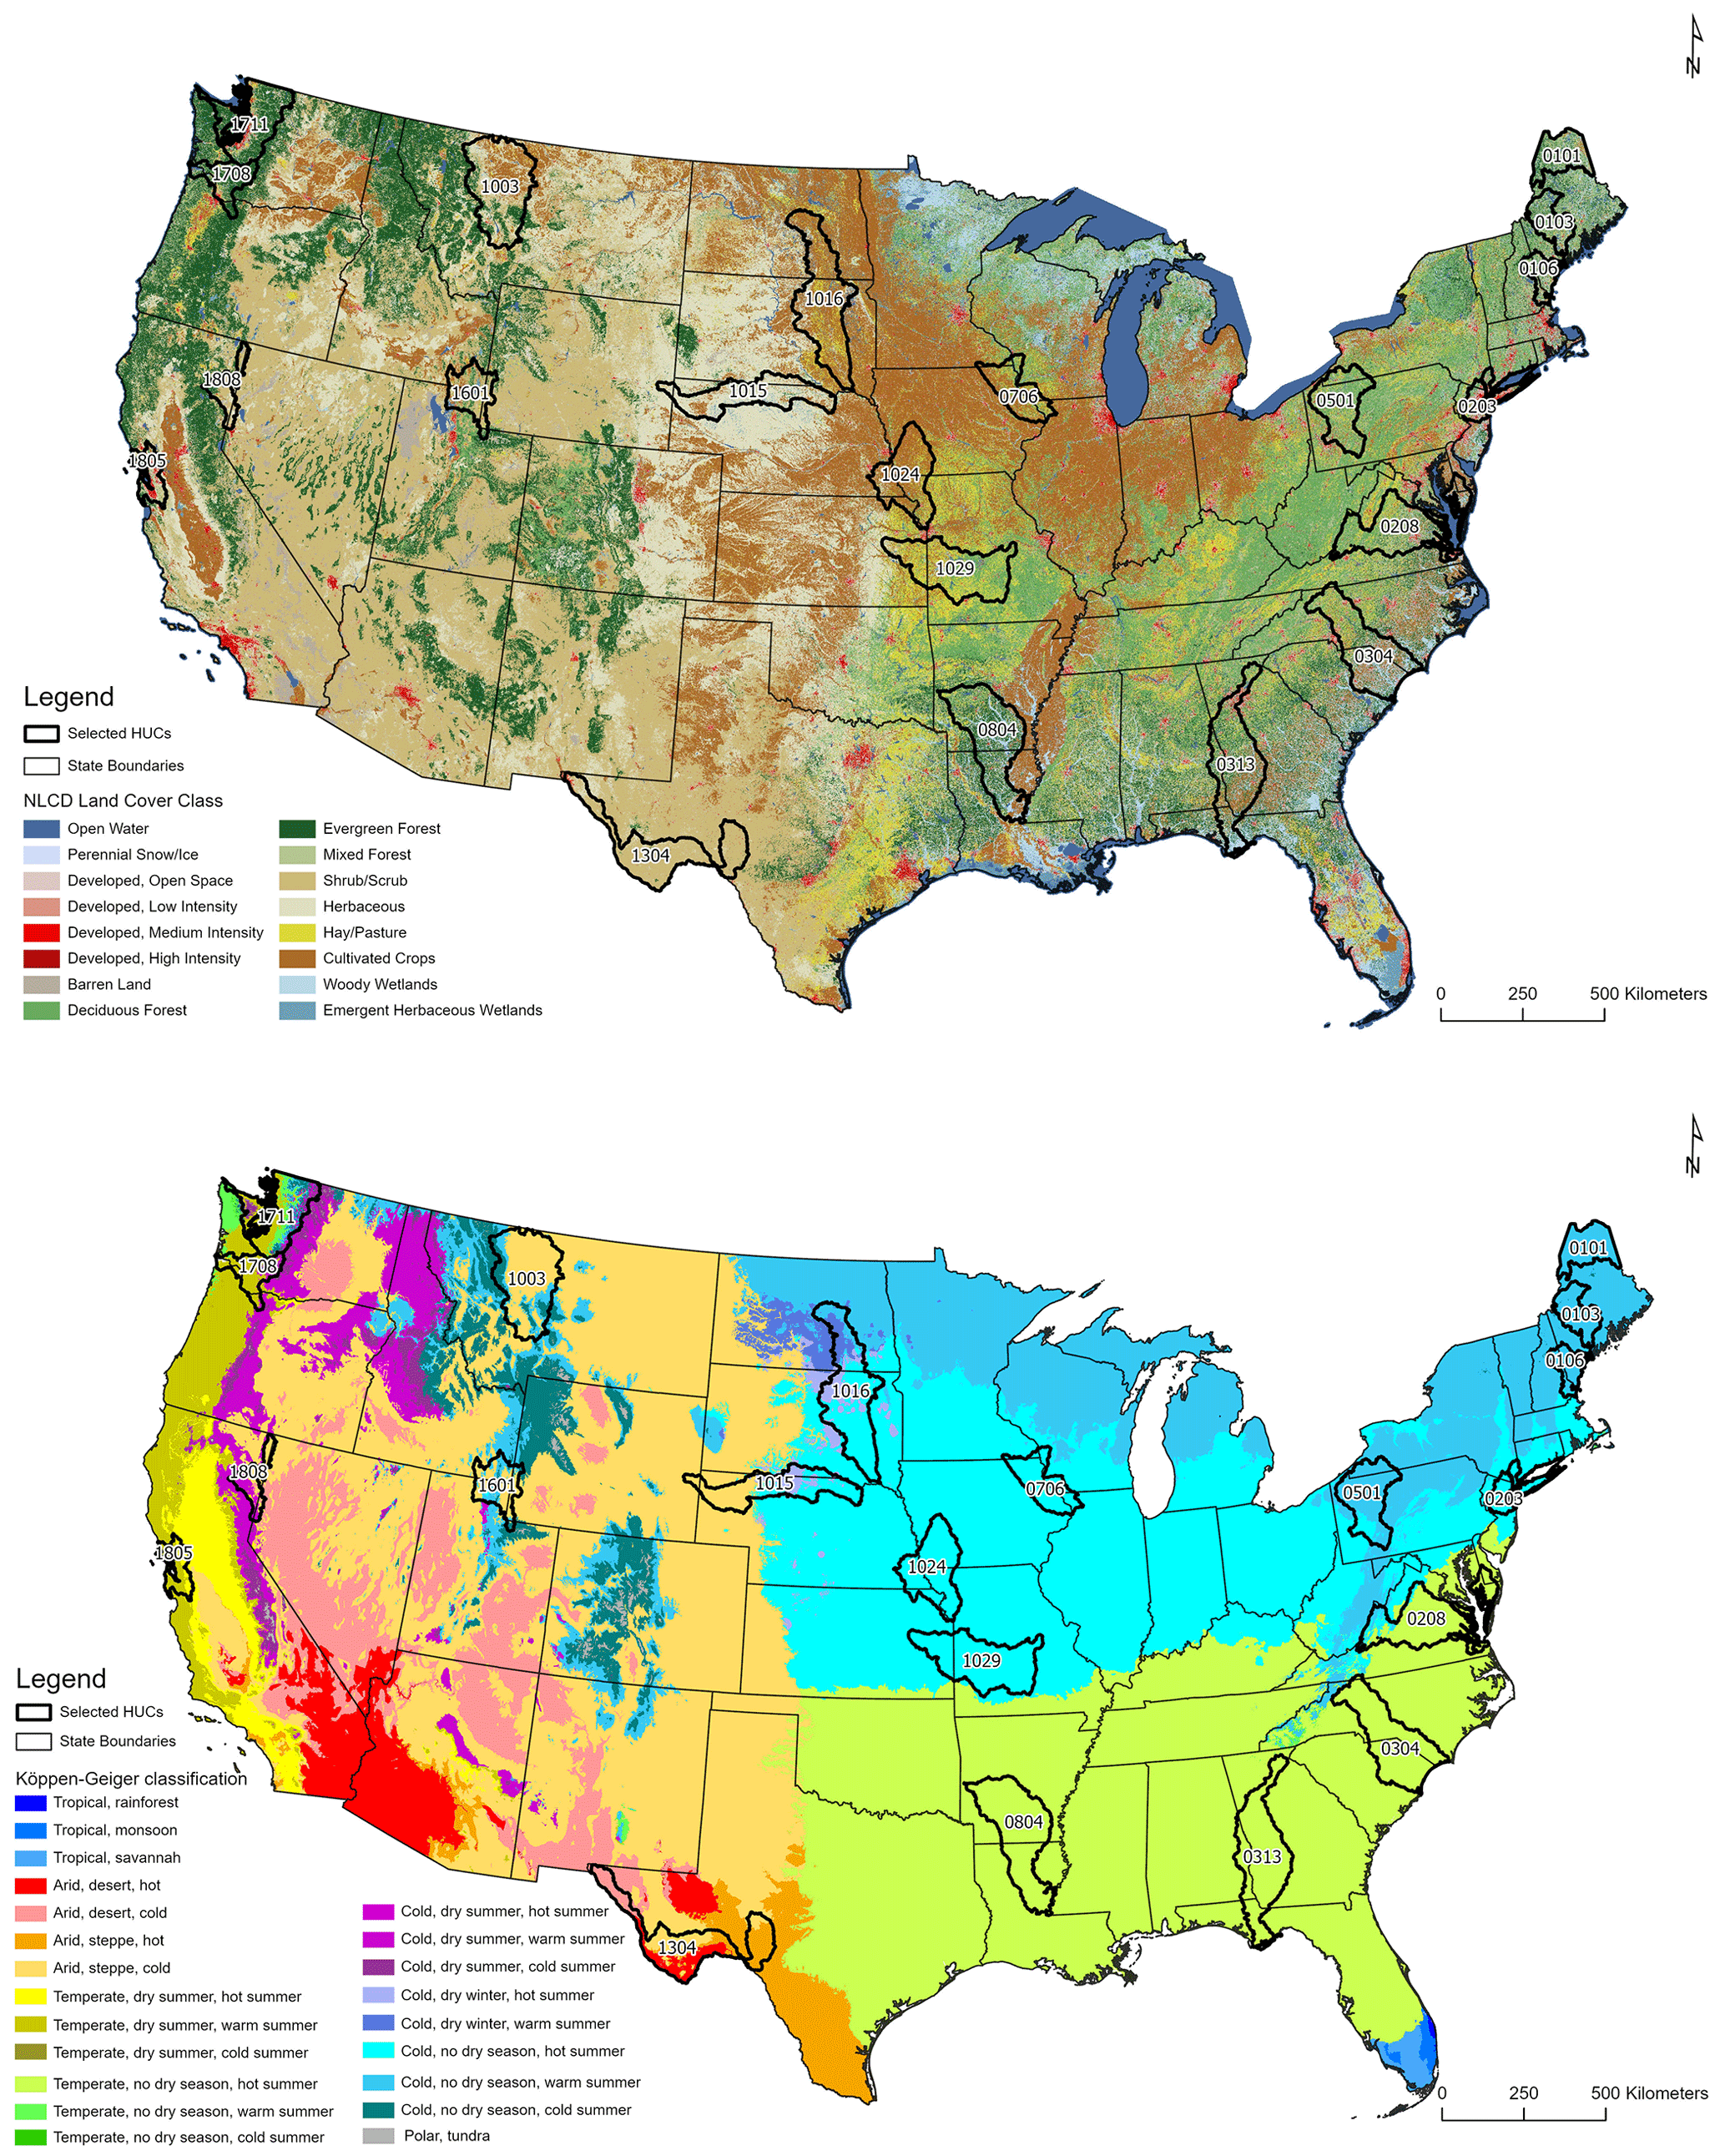
Figure 2A total of 21 validation watersheds were selected from across the CONUS to capture the breadth and extent of land use (top, NLCD, 2019) and climate and physiographic regions (bottom) within the CONUS according to the Köppen–Geiger classification (Beck et al., 2018; also summarized in Table B2). The hydrologic unit code (HUC) classifications are sourced from the USGS Watershed Boundary Dataset (2022a).
2.4.3 Standard performance measures
We evaluated the floodplain and wetland spatial data within the 21 validation watersheds using commonly employed performance measures. Following Wing et al. (2017), we first created a contingency table for our performance assessment (Table 1). As noted, we selected 20 km2 as the minimum contributing area to develop stream networks in our global floodplain analysis, a reasonable area for flow accumulation that balances computational efficiency for global geospatial model development. The dataset from Woznicki et al. (2019), our benchmark floodplain dataset, used a 4.5 km2 contributing area in their high-resolution CONUS analysis. To appropriately compare between datasets of two varying resolutions, we removed stream and river network components from the Woznicki et al. (2019) validation dataset developed with contributing areas < 20 km2, as our model did not discern landscape data at that granularity.
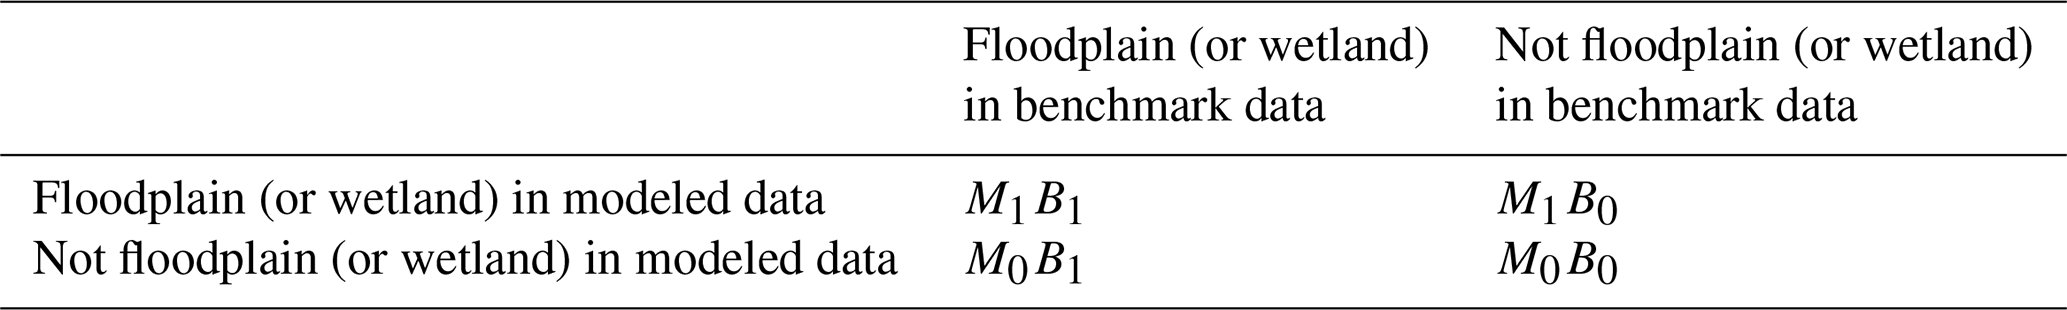
Table 1Contingency table of possible outcomes for each cell used in assessing the performance of either the floodplain or wetland geospatially modeled data. We contrasted published benchmark data from Woznicki et al. (2019) for floodplain extent against modeled GFPlain90 data. Wetland comparisons contrasted NLCD wetlands (Dewitz, 2019; open-water and wetland classes) against both Global Wetland and Global NFW data. The table is modified from Wing et al. (2017). The subscript “1” equates to a positive outcome or overlapping extent for either the modeled (M) or benchmark (B) data, whereas a zero means no data overlap or a negative outcome.
To provide a full assessment of our geospatial modeling performance, we contrasted our GFPlain90 floodplain dataset across the 21 validation watersheds using the approaches described below following Sampson et al. (2015), Wing et al. (2017), and others (e.g., Bates and De Roo, 2000; Alfieri et al., 2014; Sangwan and Merwade, 2015; Jafarzadegan et al., 2018; Woznicki et al., 2019). We first contrasted our GFPlain90 floodplains to the data from Woznicki et al. (2019), our benchmark floodplain data. We then analyzed the watershed-scale comparison of our Global Wetland product versus the NLCD wetlands (combined open-water and wetland classes), our benchmark wetlands data. We followed with a comparison focusing only on our Global NFW data and those NLCD wetlands and open-water pixels that were determined to be non-floodplain systems (i.e., NLCD data that also do not overlap the GFPlain90 data nor coastal waters and with lakes > 10 ha removed). These NLCD wetlands were our benchmark non-floodplain wetland data. Lastly, we assessed the mean and aggregate error bias of our analyses by exploring results at coarser spatial granularity (i.e., 1 km pixel size) along the riverine network (for floodplain assessment) and, for wetland metrics, throughout the entirety of our 21 performance assessment watersheds (Sampson et al., 2015; Wing et al., 2017). The metrics described below and in Table 2 were used in our analyses.
The hit rate (Bates and De Roo, 2000; Horritt and Bates, 2002; Tayefi et al., 2007), also referred to as “recall” (Woznicki et al., 2019) and “correct” (Sangwan and Merwade, 2015), measures how well a geospatial model classification replicates the benchmark data but does not penalize for overprediction. H varies from 0, where there is no overlap between the modeled data and the benchmark data, to 1, where the modeled data completely contain the benchmark data. Precision (Woznicki et al., 2019), also known as “spatial coincidence” (Tootchi et al., 2019), indicates the proportion of the benchmark data that are correctly predicted and mapped in the modeled data. This metric, P, also ranges from 0 to 1, with higher values indicating better performance. The false alarm ratio (Sampson et al., 2015; Wing et al., 2017), also known as the “false discovery ratio”, quantifies modeled data overprediction relative to the benchmark data. F varies from 0 (zero false alarms) to 1 (all false alarms); lower values are considered better performance. The false alarm ratio can also be calculated as 1 minus precision (Woznicki et al., 2019). The critical success index (CSI; Bates and De Roo, 2000; Aronica et al., 2002; Werner et al., 2005; Fewtrell et al., 2008), also known as Jaccard's index (Tootchi et al., 2019) and fit (Sangwan and Merwade, 2015), penalizes for both over- and underprediction, ranging from 0 (no match) to 1 (perfect match). Woznicki et al. (2019) utilized a performance metric, F1, which combines the hit rate (called recall by Woznicki et al., 2019) and precision using their harmonic mean. F1 also varies from 0 to 1, with higher values indicating better performance. Error bias (EB) characterizes the tendency of the model towards under- or overprediction (Sampson et al., 2015). Values of 1 indicate no bias, and indicates underprediction, whereas indicates that the model is tending towards overprediction.
Table 2Performance metrics used in validation assessments of floodplain and wetland data layers. Data for assessment (e.g., M1B1) follow those given in Table 1 and modified from Wing et al. (2017), with the exception of Eqs. (7) and (8) (see text).
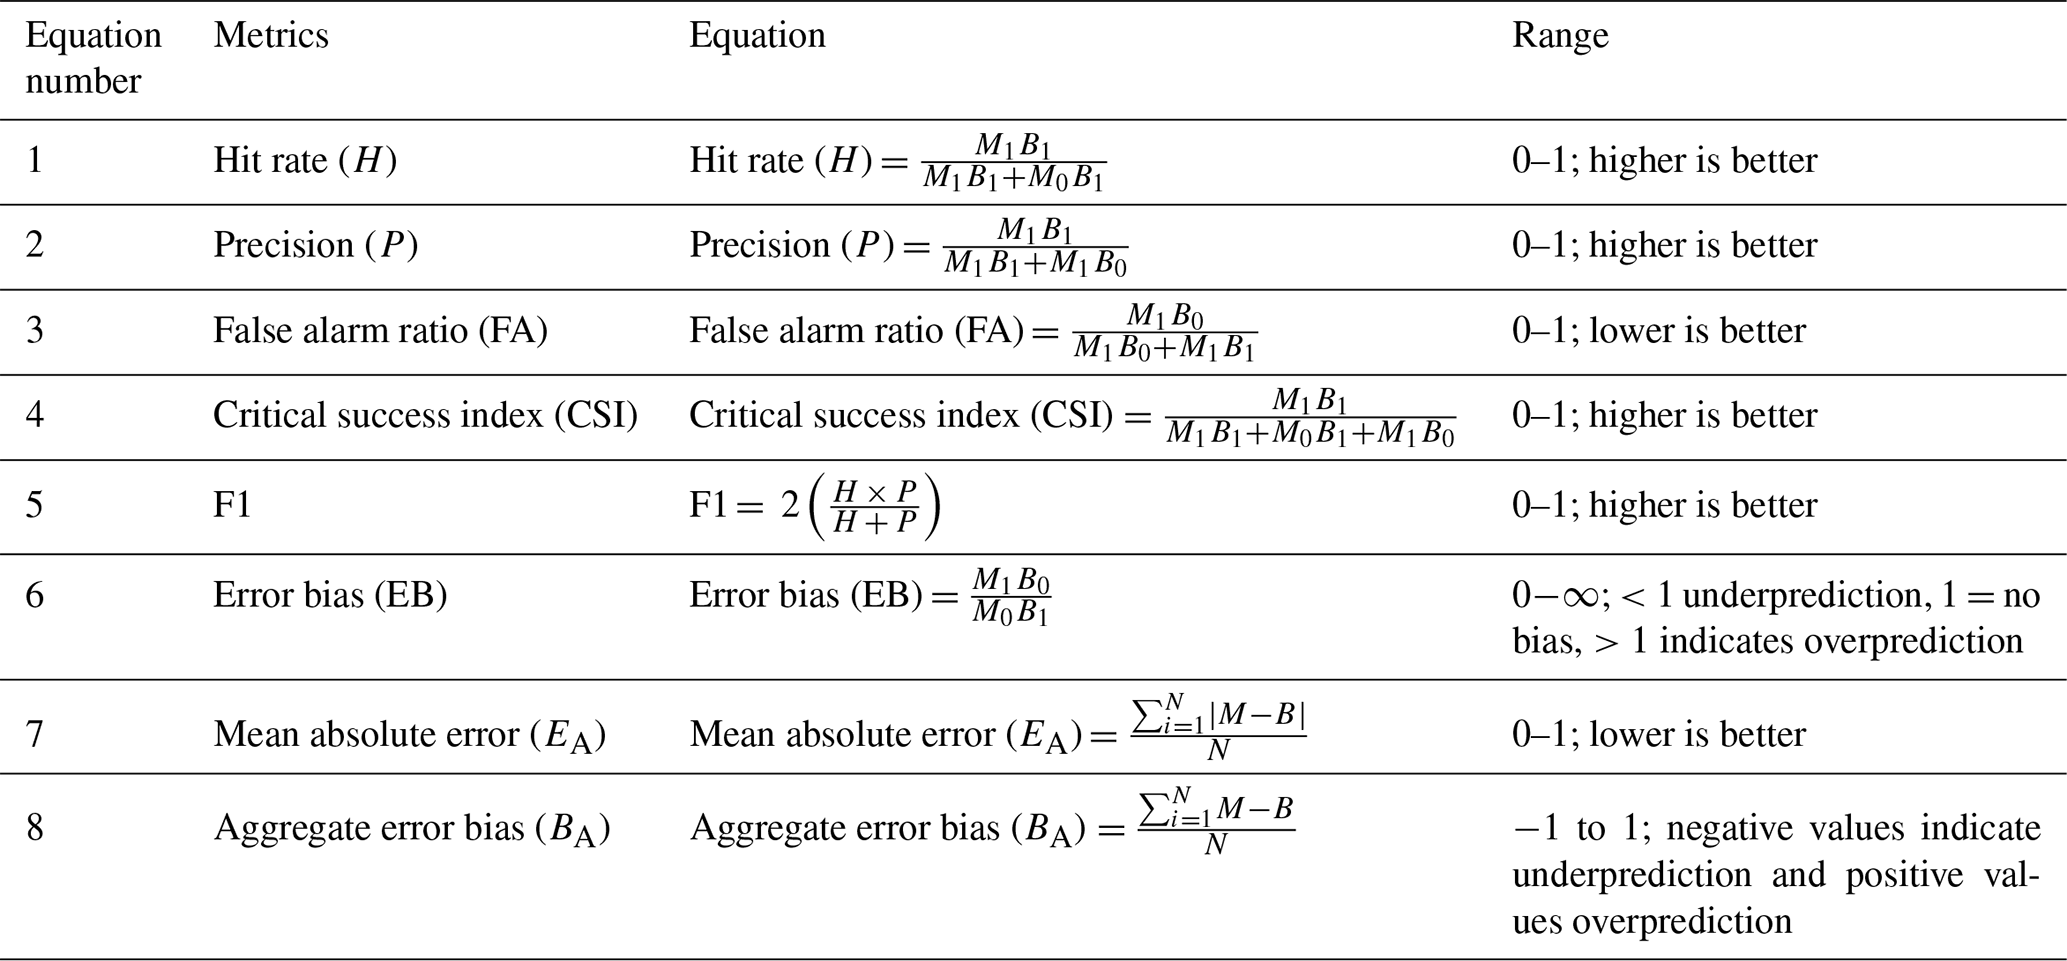
Lastly, two additional metrics were calculated that assessed performance at the 30 arcsec (∼ 1 km) scale. These measures, mean absolute error and aggregate error bias (Sampson et al., 2015; Wing et al., 2017), characterize the data accuracy across large spatial extents. Large spatial extents are areas where 30 m data and overlap accuracy is less a concern than general dataset performance for broad-scale end-user applications (e.g., when coarser, watershed-scale “lumped” hydrologic characterizations of water storage are all that is required). For these metrics, both estimated and benchmark data were resampled to 1 km resolution across the whole of each watershed; values within each 1 km pixel ranged from 0 to 1 and represented the fraction of the 30 m resolution estimates and benchmark data. We assessed floodplain estimates after calculating the fractional abundance comprising each 1 km2 pixel within a 1 km buffer around the floodplain data from Woznicki et al. (2019). We additionally analyzed all wetlands at the watershed scale as well as focusing on non-floodplain wetlands (e.g., wetlands exclusive of the GFPlain90 floodplain or coastal connections, our target aquatic system). In Eqs. (7) and (8) (given in Table 2), M is the area estimated as floodplain (or wetland), B is the benchmark floodplain (or wetland) area, and N is the number of 1 km cells with data. Mean absolute error and error bias were calculated for each of the 21 HUCs, following Wing et al. (2017).
3.1 Floodplain data performance
The GFPlain90 floodplain data (Fig. 3) performed well when contrasted with the 100-year coastal and fluvial floodplain extent data from Woznicki et al. (2019), even though our analyses do not map coastal floodplains. A median hit rate of 0.77 suggests that nearly 80 % of the benchmark floodplain from Woznicki et al. (2019) was similarly captured by the GFPlain90 floodplain data (see Appendix Table B3). In addition, the median false alarm of 0.26 indicates that for every three pixels correctly identified as within the Woznicki et al. (2019) floodplain, one pixel was incorrectly identified as such (i.e., a commission error measure); this is evident in wider GFPlain90 floodplains in lower river reaches than predicted by Woznicki et al. (2019). These performance values are similar to those reported by Woznicki et al. (2019; false alarm 0.22) and Wing et al. (2017; false alarm 0.34–0.37). Critical success index (CSI) scores penalize for overprediction; our median value of 0.53 approximates previously published regional (e.g., Sangwan and Merwade, 2015; CSI values ranging from 0.44–0.89) and continental flood-extent approaches (e.g., Sampson et al., 2015, CSI values from 0.43–0.67; Wing et al., 2017; CSI values between 0.50 and 0.55 reported). Median precision (0.74) and F1 (0.70) values approximate those in the literature as well (e.g., Woznicki et al. (2017) reported values of 0.78 for both). Median error bias values of 1.0 suggest the model neither overestimates nor underestimates floodplain extents (Wing et al., 2017). The mean absolute error of 0.08 reported here indicates an approximate 8 % difference between our GFPlain90 model and that of Woznicki et al. (2017) at the 1 km cell resolution.
3.2 Wetland data performance
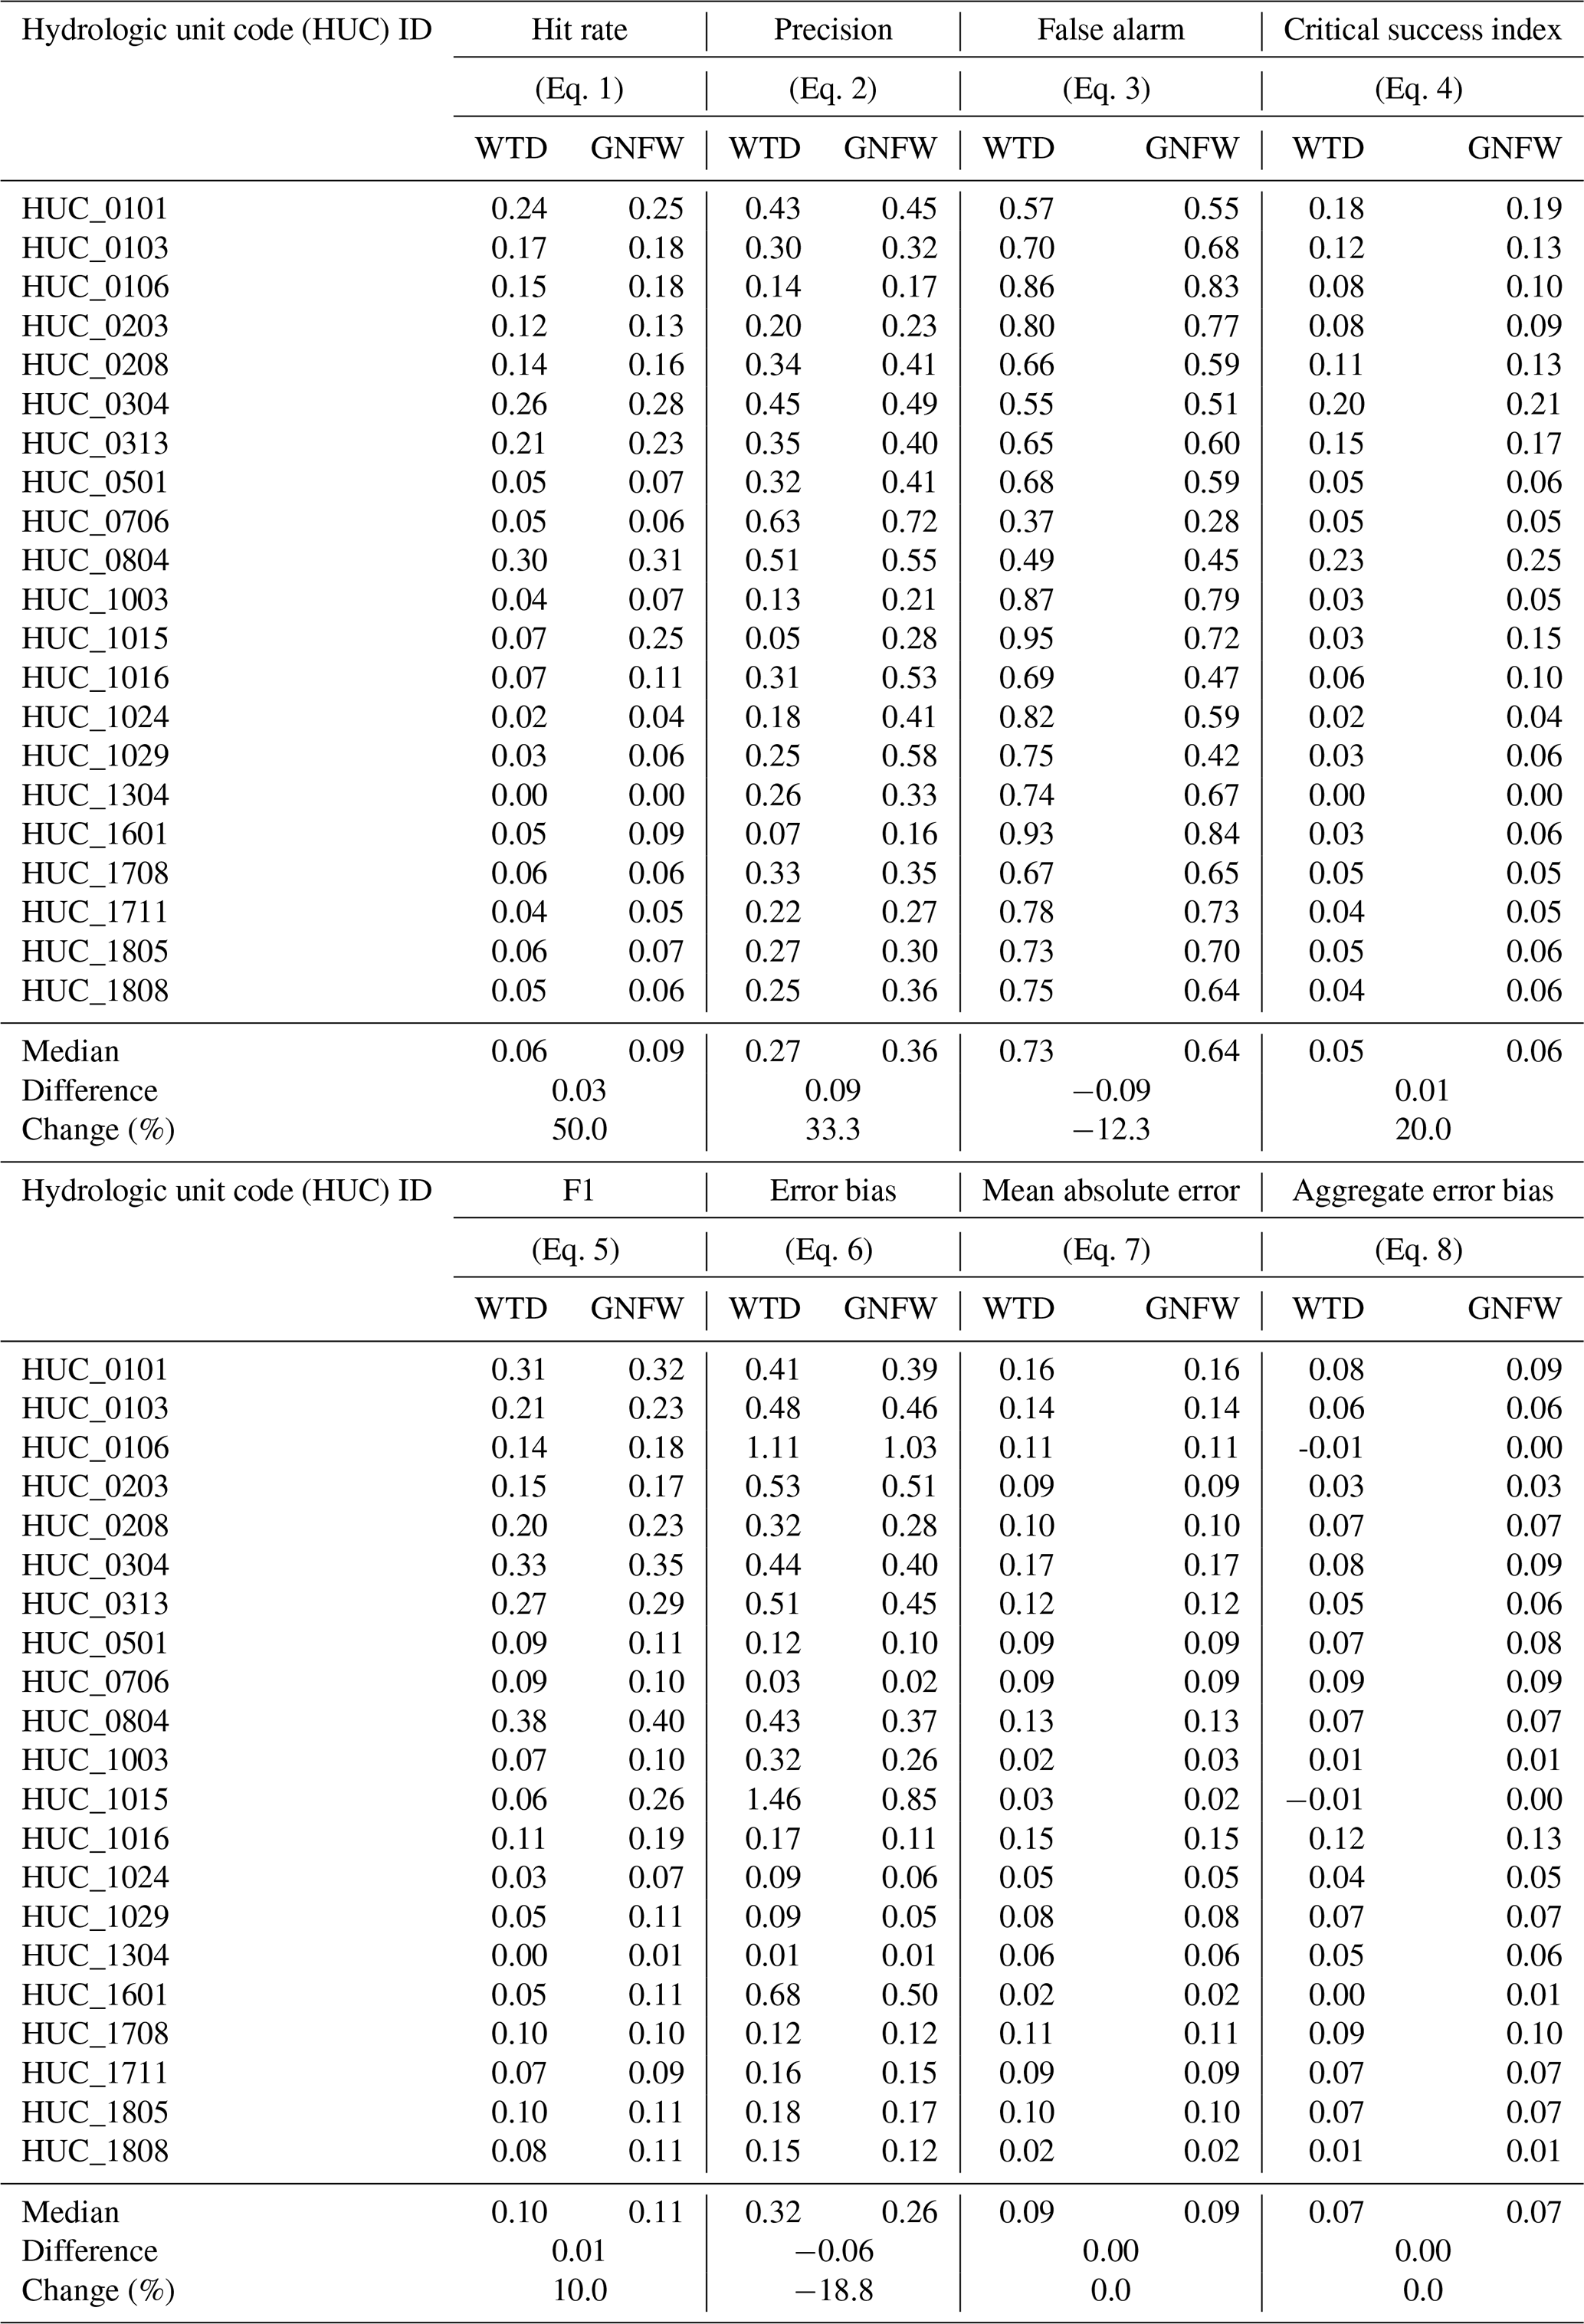
3.2.1 Global Wetland dataset
The novel ensemble Global Wetland approach improved upon the previously published Tootchi et al. (2019) research product, the CW-WTD (Table 3), when contrasted with CONUS data. A median hit rate value of 0.24 indicates that both the inclusive Global Wetland and CW-WTD captured ∼ one-quarter of the high-resolution, 30 m pixel size NLCD wetlands and open waters in the validation dataset. However, across the 21 validation watersheds, the Global Wetland dataset developed here correctly identified more wetlands than the CW-WTD alone, as indicated by an 8 % mean increase in precision, 43 % increase in the critical success index, 38 % increase in F1, a −8 % decrease in the false alarm ratio, and a 21 % decrease in error bias. At coarser, 1 km2 scales, there was a slight decrease in the mean absolute error associated with the Global Wetland data and no difference in aggregate error bias between the data products.
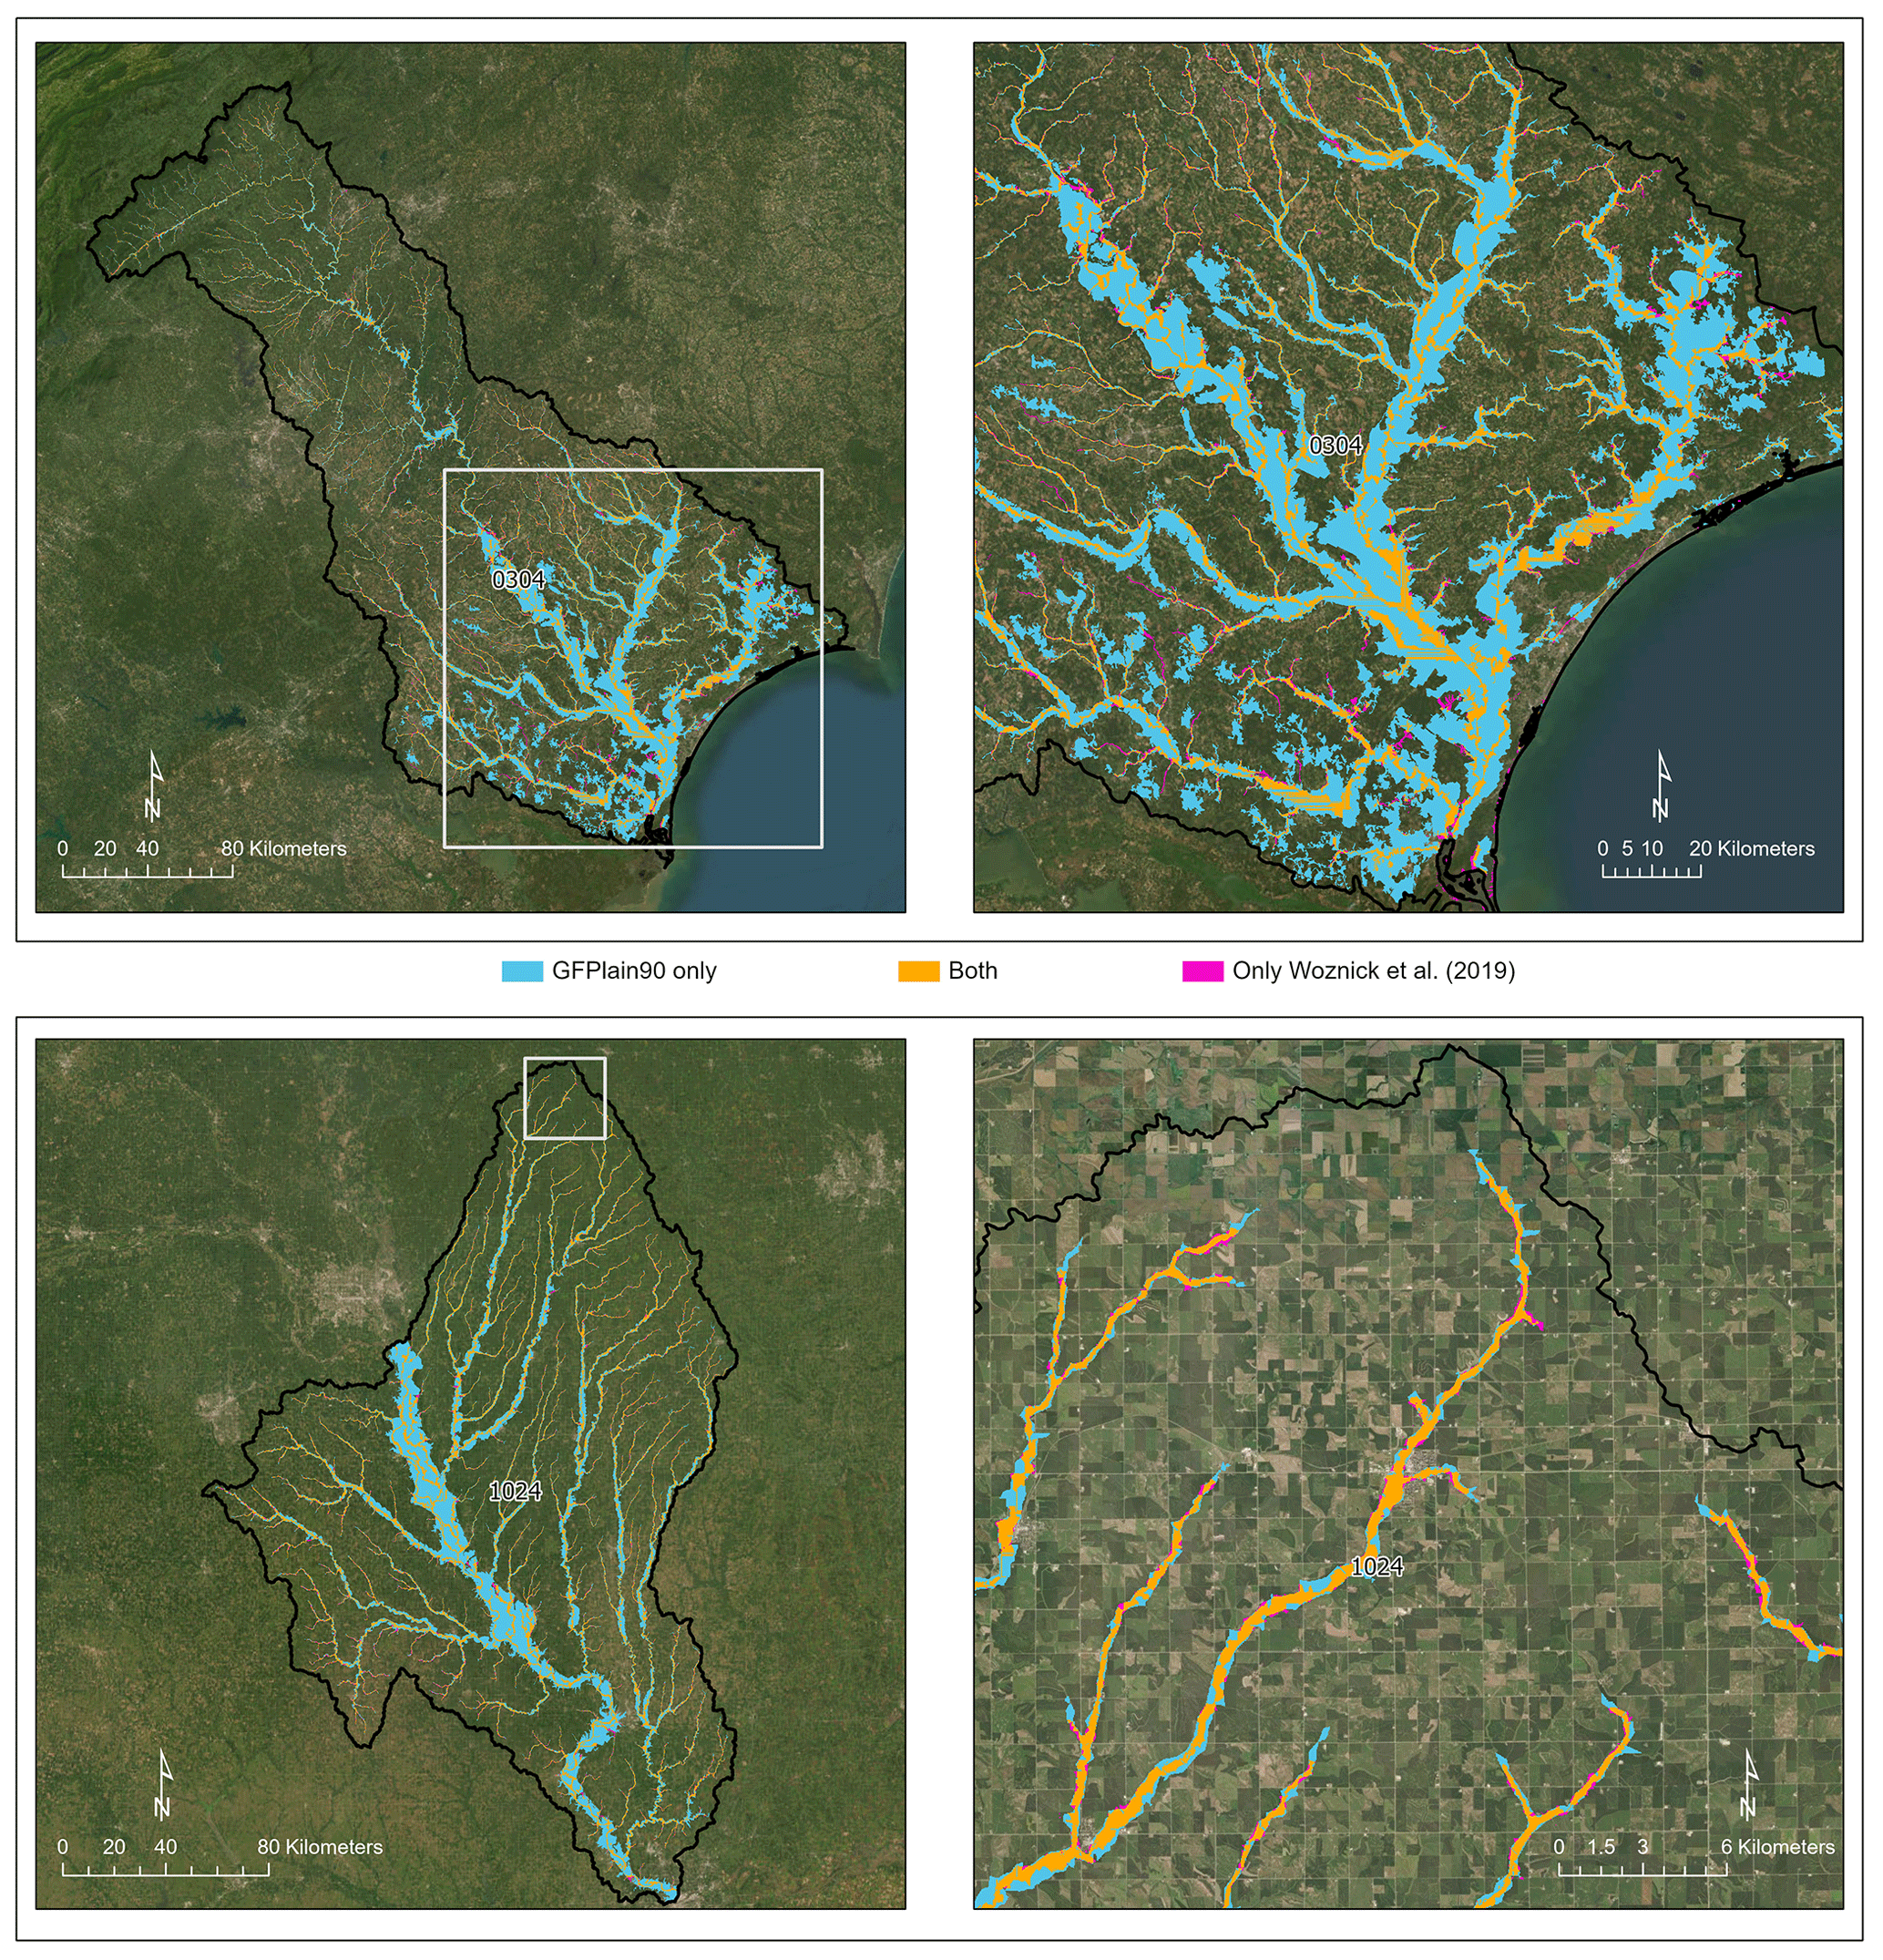
Figure 3The robust performance of GFPlain90 relative to the benchmark floodplain data from Woznicki et al. (2019) is evident in the two rows, with the top panels (HUC_0304) showing different spatial extents of a coastal watershed spanning North and South Carolina, United States, and the bottom two panels showing different spatial extents of a Midwestern US watershed (HUC_1024). The main stem of the river network appeared wider in the GFPlain90 data in both examples, especially in the lower reaches, though the complete network was represented well (i.e., floodplains were identified to the furthest extent of the stream network's headwaters). Satellite imagery is sourced from ESRI (2022).
3.2.2 Global Non-Floodplain Wetland (Global NFW) dataset
Non-floodplain wetland identification using the Global Wetland data (i.e., Global NFW) similarly improved upon the CW-WTD product (Fig. 4). For instance, though the hit rate values were low (e.g., median values ≤ 0.10), underscoring both the difficulty in mapping non-floodplain wetlands and the challenge of assessing performance using high-resolution data, Global NFW analyses correctly identified 50 % more non-floodplain wetlands than the CW-WTD (Table 4, Tootchi et al., 2019). Improvements when focusing on non-floodplain wetlands were found in every category with the Global NFW dataset, demonstrating increased non-floodplain wetland accuracy versus the original CW-WTD across the median metric values for precision, critical success index, F1, false alarms, and error bias (e.g., 33 % increase in precision, 20 % increase in critical success index, 10 % increase in F1 scores, and a 12 % decrease in false alarms and a 19 % decrease in error bias). There was no difference between the datasets for EA and BA, with median values for mean absolute error (median values for both = 0.09) or aggregate error bias (median values for both = 0.07). Thus, at the 1 km2 cell size, there was < 10 % difference between both the CW-WTD and the Global NFW data and the benchmark NLCD non-floodplain wetlands and open waters (with the difference mostly stemming from an increase in identified wetlands with both CW-WTD and Global NFW data, as indicated with the positive aggregate error bias values).
Table 3Spatial performance assessment of both the Global Wetland (abbreviated here as GW) and CW-WTD (abbreviated here as WTD; Tootchi et al., 2019) datasets when contrasted with the benchmark NLCD wetlands (Dewitz, 2019). The first six equations directly assess the spatial concordance and overlap between each spatial dataset and the benchmark (e.g., CW-WTD contrasted with the NLCD), whereas mean absolute error (MAE; Eq. 7) and aggregate error bias (AEB; Eq. 8) are coarser fractional analyses measured throughout each watershed (e.g., the proportional abundance NLCD within each 1 km2 cell is contrasted with the proportional abundance of global wetlands predicted correctly within that cell).
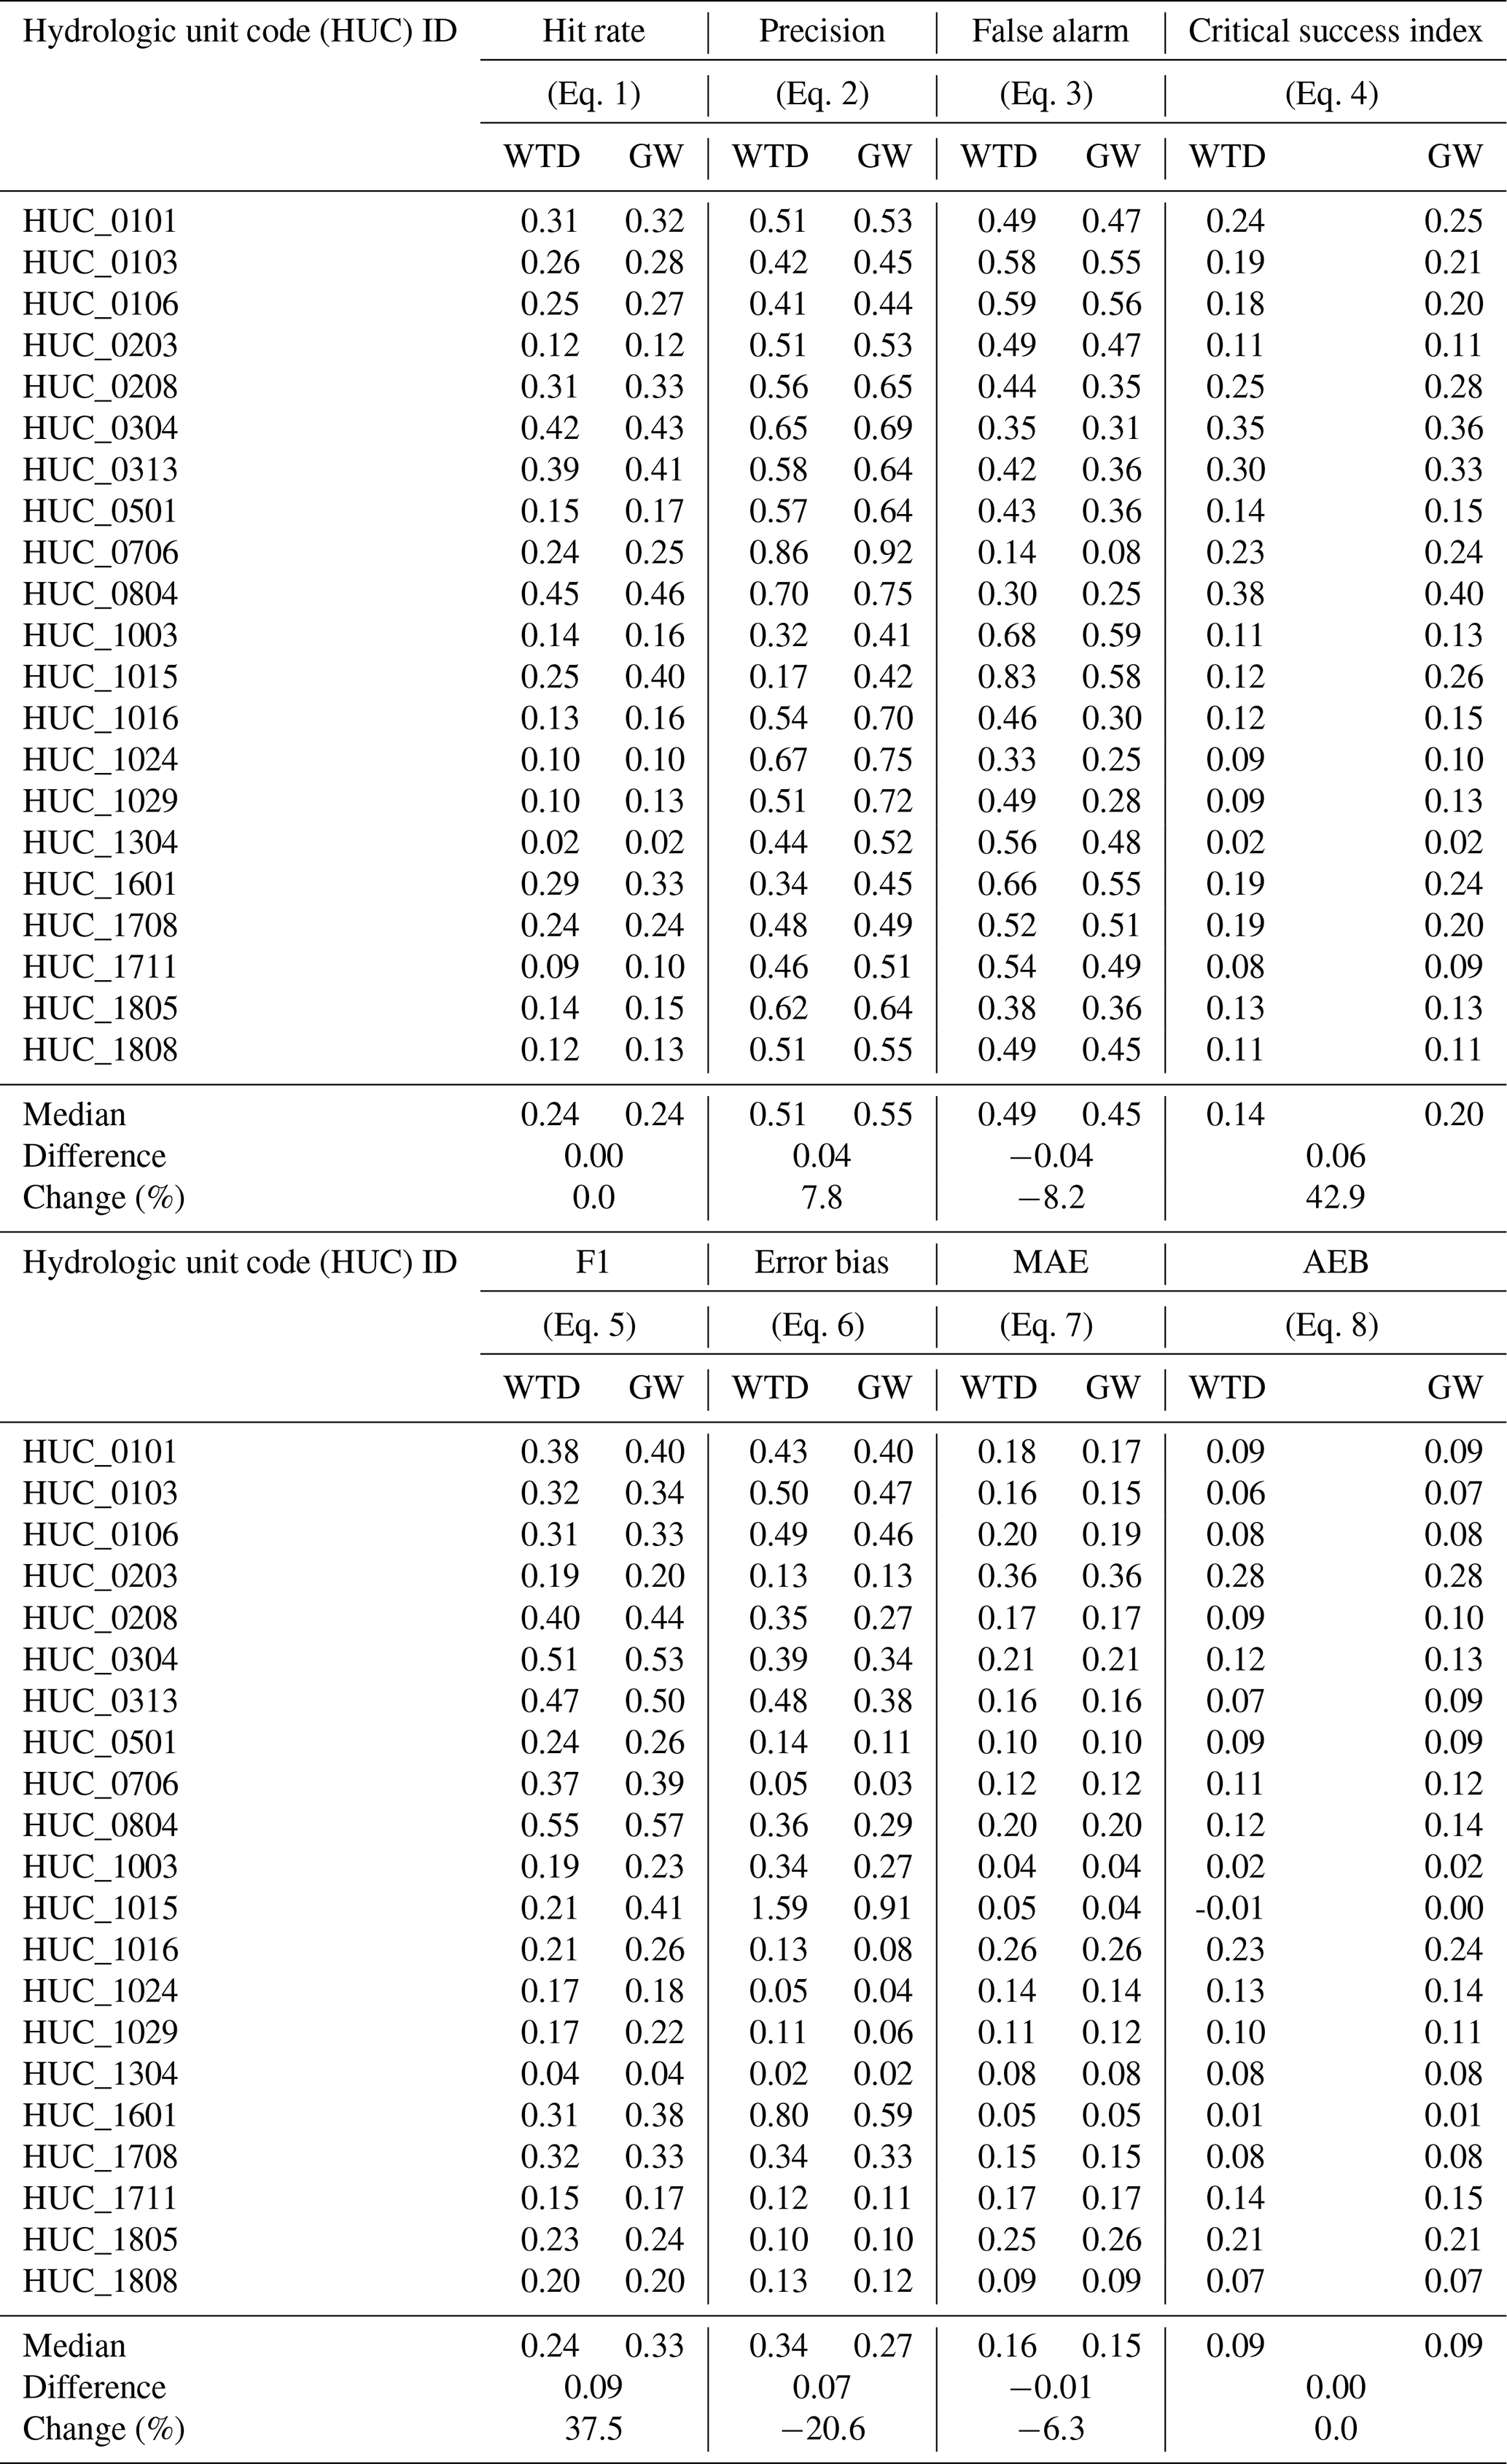
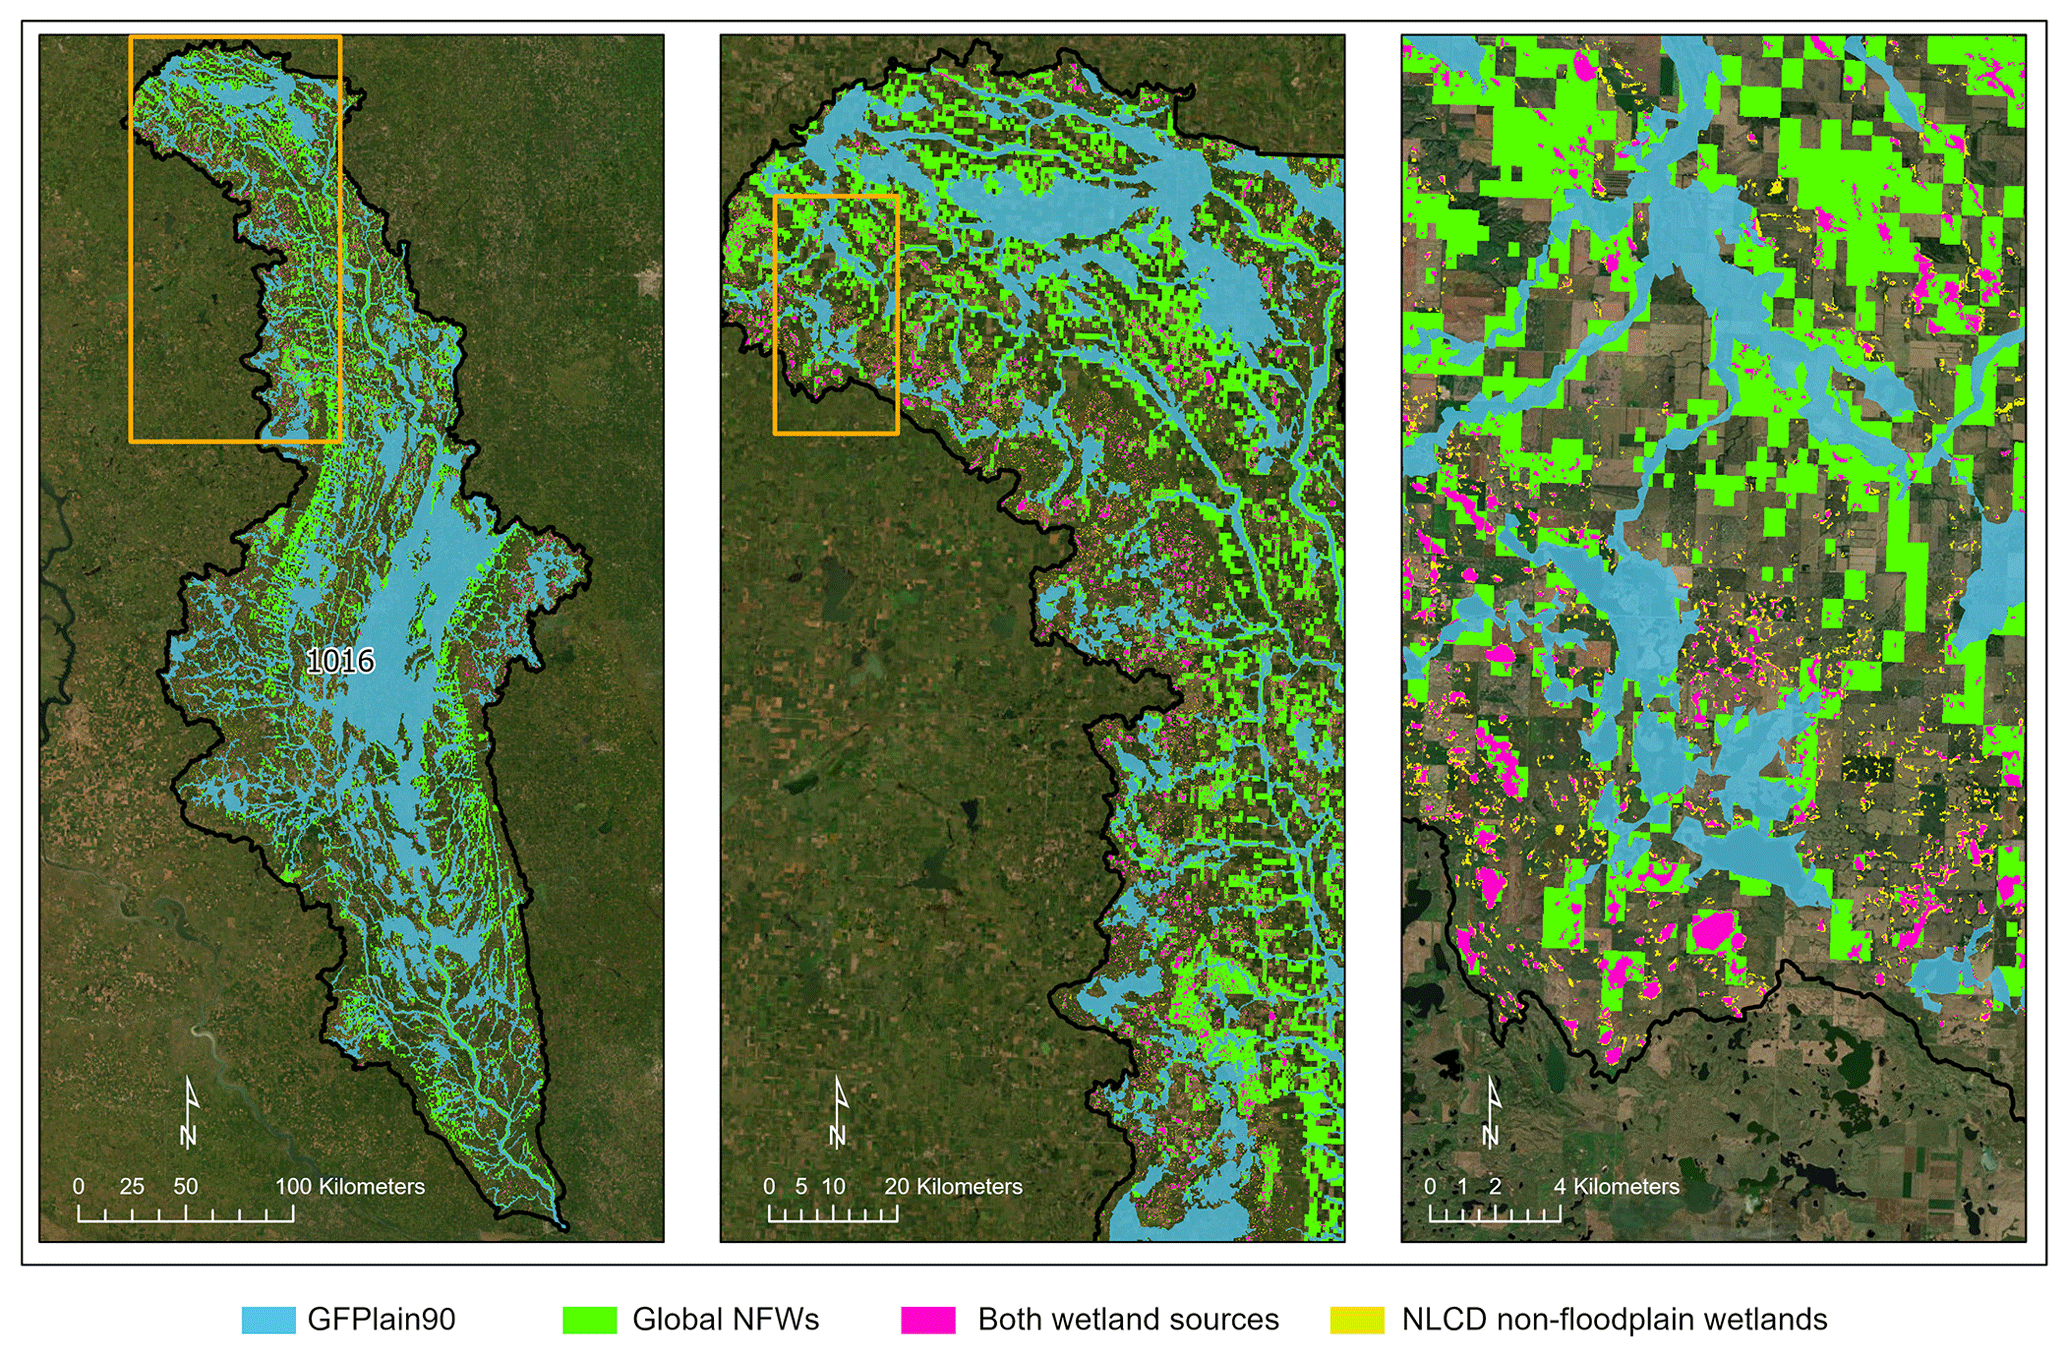
Figure 4Demonstration of the relative accuracy of the Global NFW dataset in identifying non-floodplain wetlands using a Prairie Pothole Region watershed (HUC_1016; see Fig. 2) replete with abundant non-floodplain wetlands. Correctly identified wetlands occur in both wetland sources (magenta color). Omission errors (NLCD non-floodplain wetlands, smaller systems in yellow) and commission errors (Global NFW dataset, green) are evident as a result of the higher resolution of the NLCD validation dataset. Satellite imagery sourced from ESRI (2022). Note the scale increasing from the left panel to the right panel (i.e., the orange box in the first panel is shown in the second panel at a higher resolution, and the box in the second panel is shown in the last panel at an even higher resolution).
Table 4Non-floodplain wetland performance metrics contrasting both the Global NFW (abbreviated here as GNFW) and CW-WTD (abbreviated here as WTD, Tootchi et al., 2019) non-floodplain wetland spatial data with the benchmark NLCD wetlands (Dewitz, 2019). Descriptions of the metrics are the same as in Table 3, though the focus here is on wetlands outside the GFPlain90-derived floodplain.
3.3 Global extent analyses and synthesis
3.3.1 Floodplains
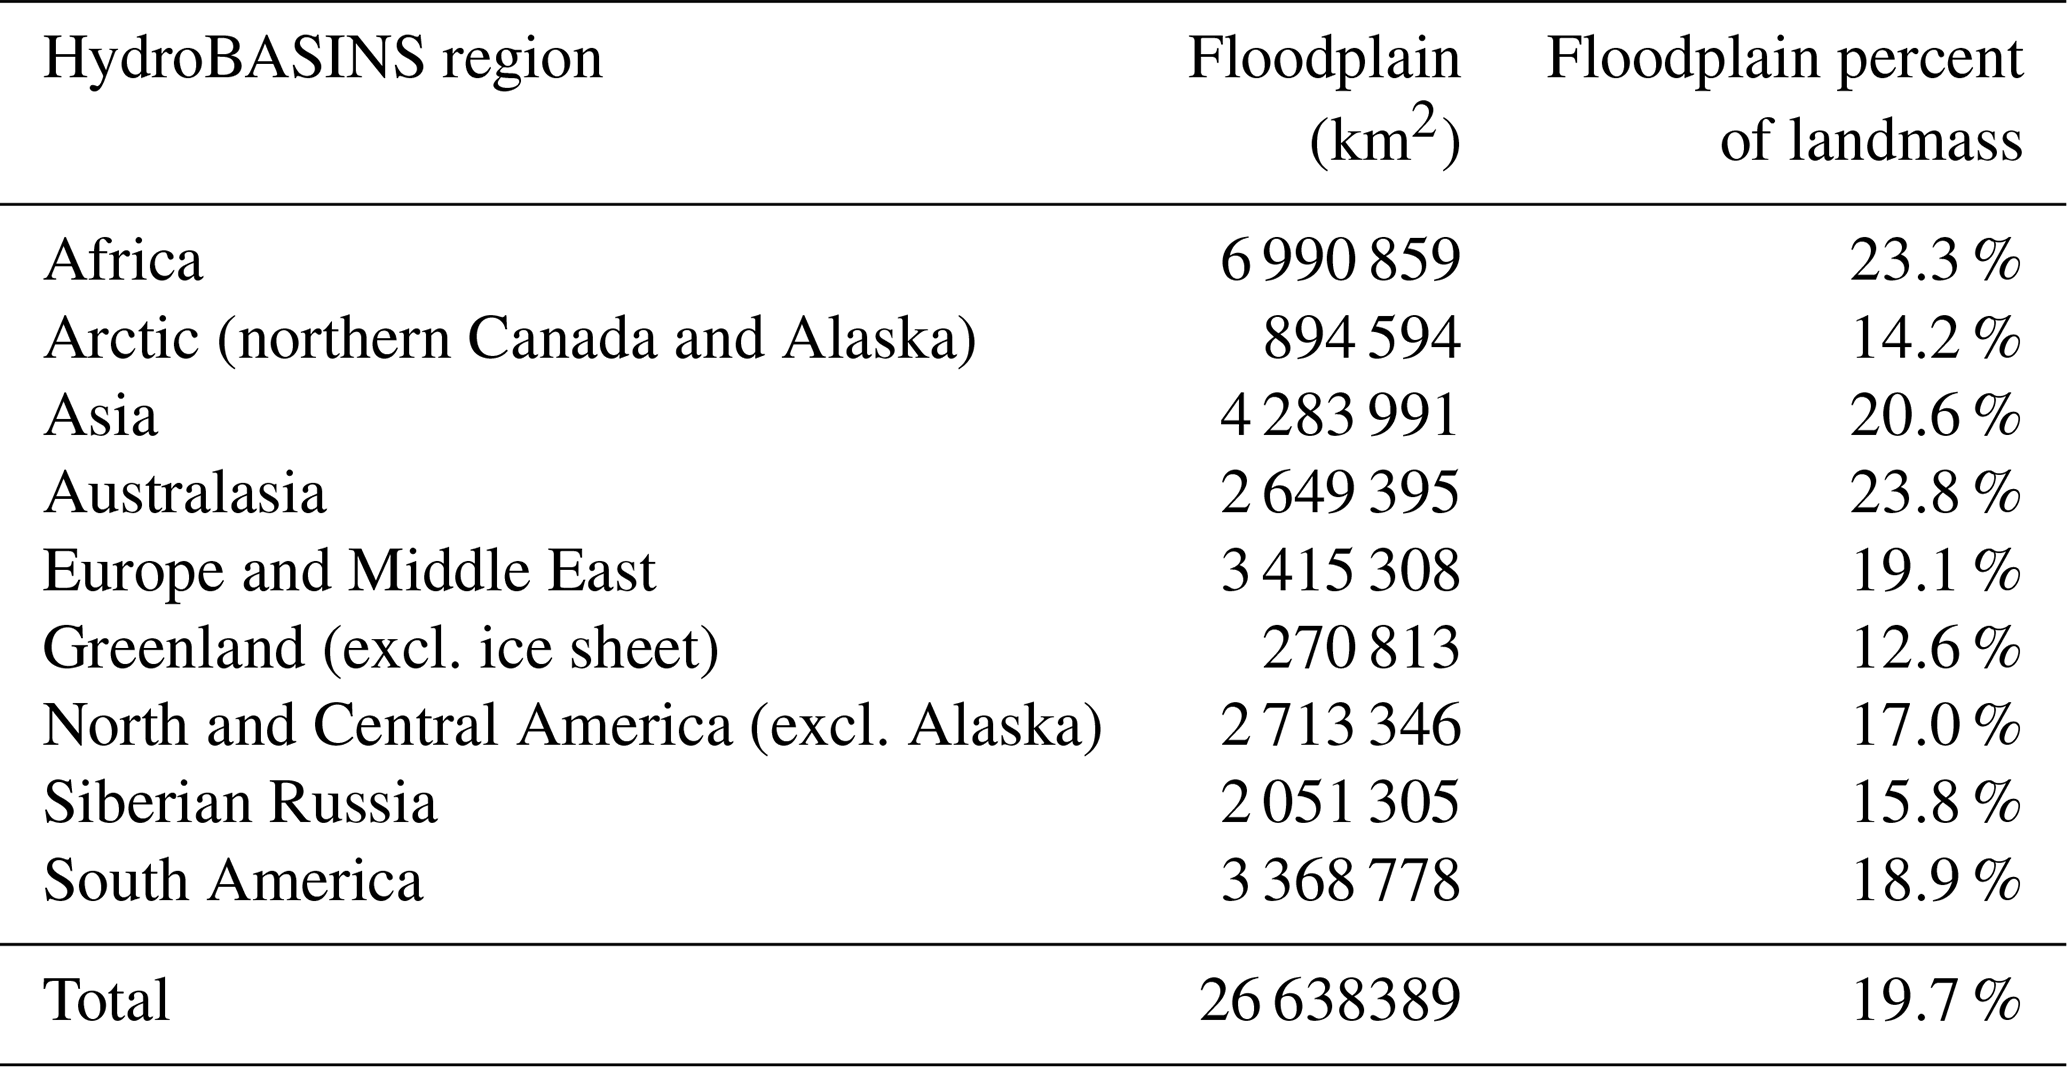
Floodplains were estimated to cover 26.6×10⁶ km2 (Table 5), or 19.7 % of the global landmass. Approximately 23 %–24 % of the African and Australasian land masses were categorized as occurring within a floodplain, the greatest percentage of global areas categorized in this way. Conversely, the Arctic (northern Canada and Alaska) and Greenland (excluding the ice sheet) had the least land mass categorized as floodplain (13 %–14 %). In comparison, Nardi et al. (2019) calculated a global floodplain extent of 13 394 139 km2, using a 250 m pixel size and a 1000 km2 minimum contributing area and bounding their study between 60∘ N and 60∘ S latitudes. Our analyses using the same latitudinal bounds but with a higher-resolution dataset (90 m) and a 20 km2 minimum contributing area identified 24 185 775 km2, an 81 % areal increase (Fig. B1). The relative percent composition of each HydroBASIN that is comprised of GFPlain90 floodplains is given in Fig. 5.
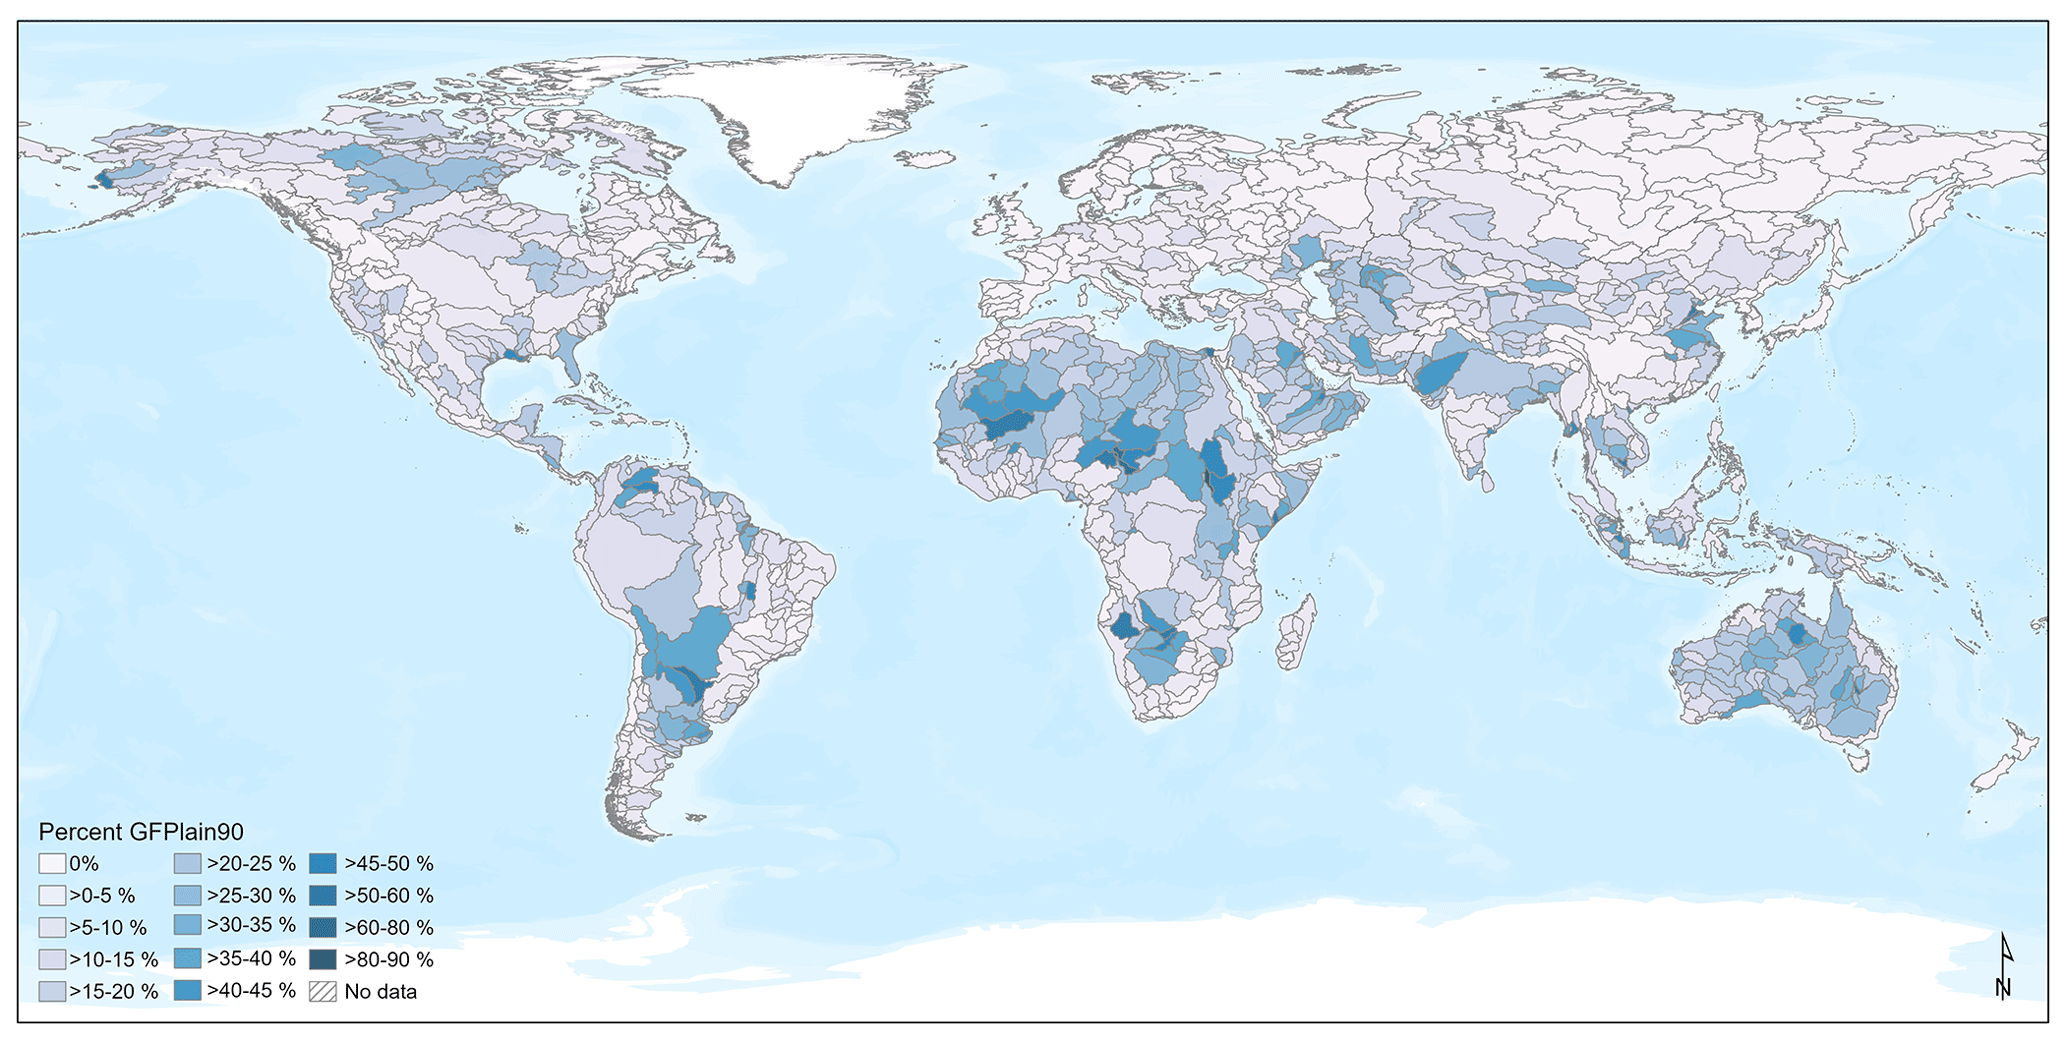
Figure 5Floodplain extents derived from GFPlain90 as a proportion of each of the Level 4 HydroBASINS (Lehrner and Grill, 2013). The data range demonstrated that up to ∼ 90 % of a given watershed was comprised of floodplain area, as evidenced by HydroBASINS in south central Africa and central South America. The basemap layer is from the ESRI World Terrain Base (2022).
Table 5Calculated floodplain area for each HydroBASINS at the global scale. Our analyses found 19.7 % of the landmass occurs within a floodplain.
3.3.2 Wetlands
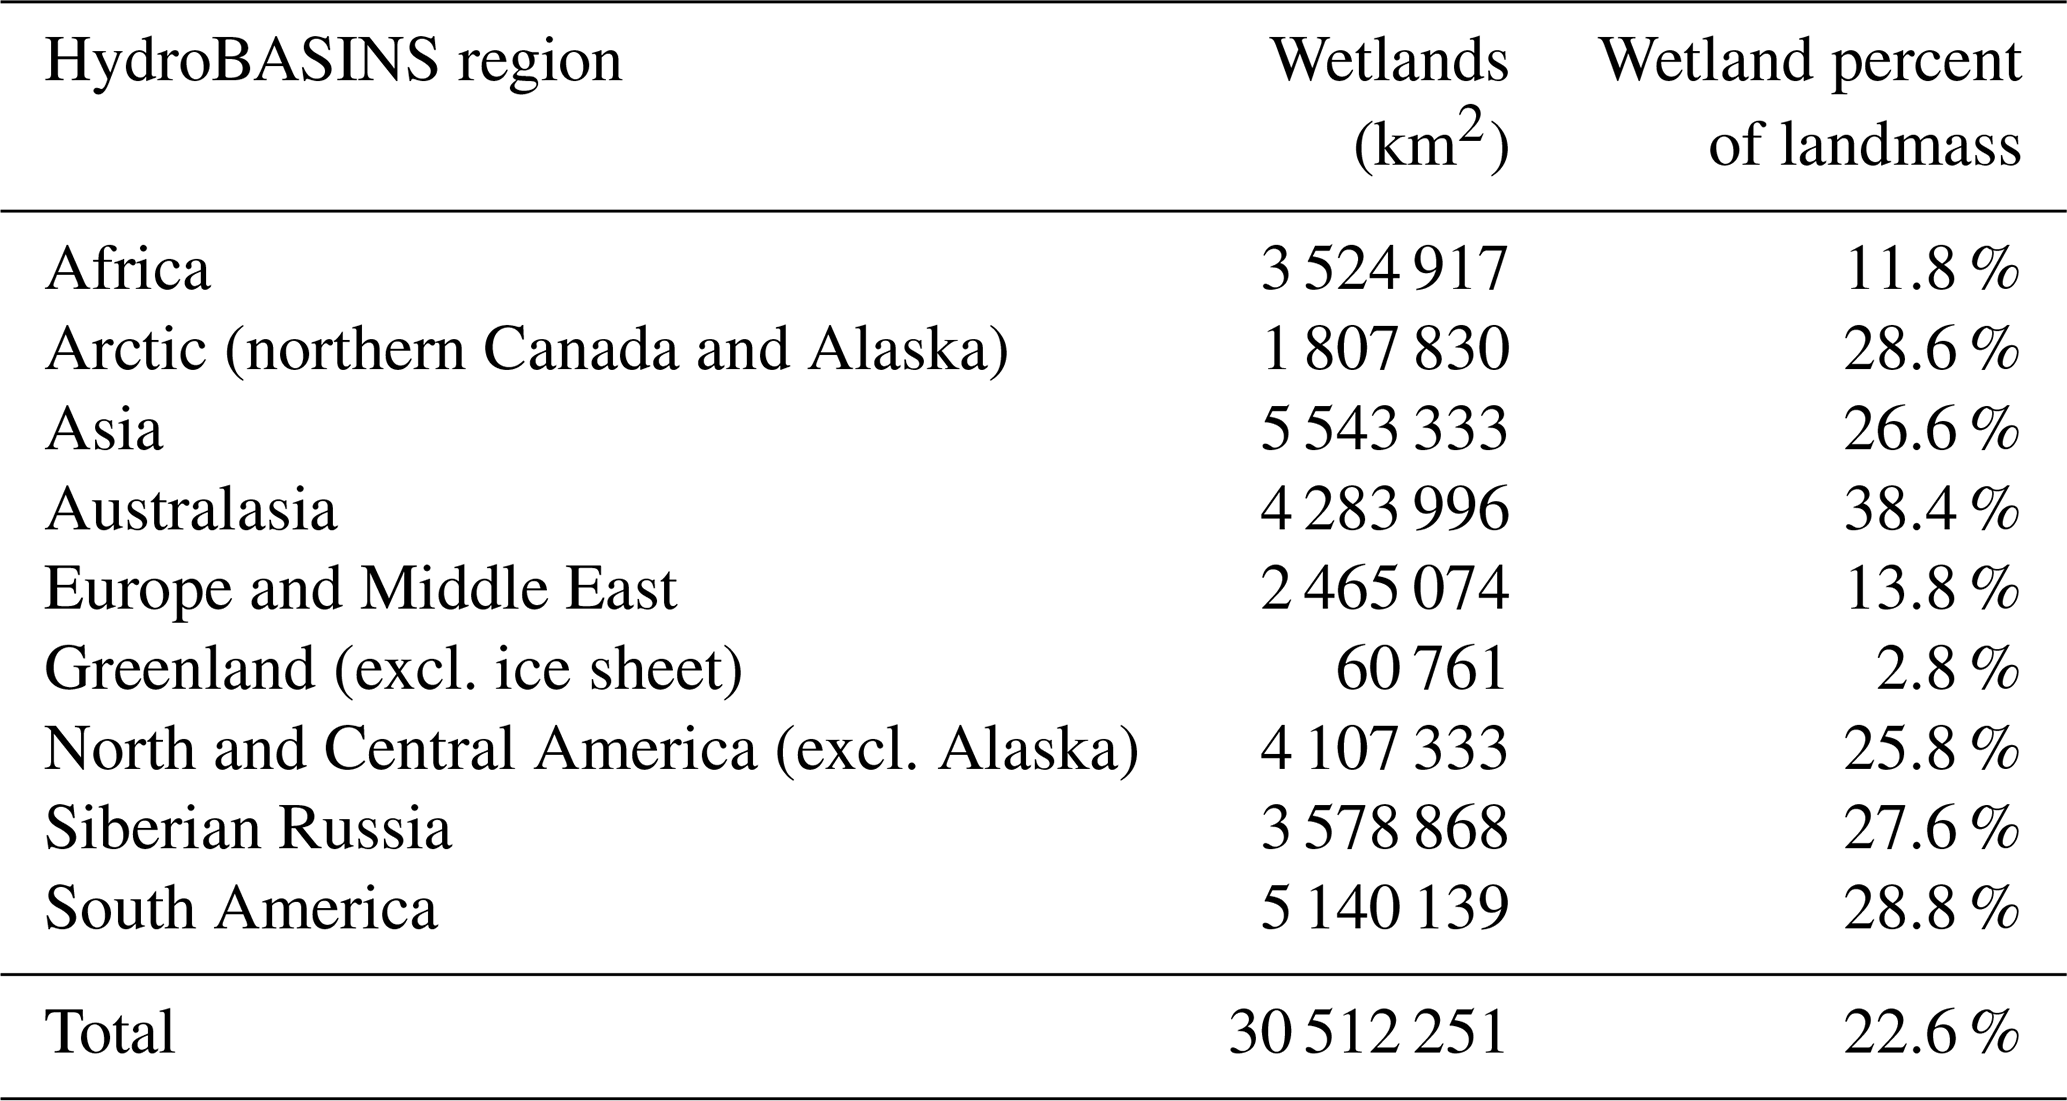
Global Wetland extent covered 30.5×10⁶ km2 (Table 6). With a focus on smaller systems compared to those presented by Tootchi et al. (2019), our Global Wetland dataset identified 11 % more potential global wetlands (3×10⁶ km2 additional wetlands). Australasia had the greatest proportional wetland abundance (see also Zhu et al., 2022), with wetlands covering 38 % of the landmass (driven, in part, by island abundance and fringing estuarine wetlands, Fan et al., 2013). Greenland (3 %) and Africa (12 %) had the least wetlands identified on the land mass.
Table 6Estimated Global Wetland areal extent for each of the nine regional HydroBASINS (Lehner and Grill, 2013). As described in the text, Global Wetland extent incorporates the CW-WTD (Tootchi et al., 2019), CCI (Herold et al., 2015), and GSW (Pekel et al., 2016) data; lakes of ≥ 10 ha have been removed (Messager et al., 2016).
3.3.3 Non-floodplain wetlands (global NFWs)
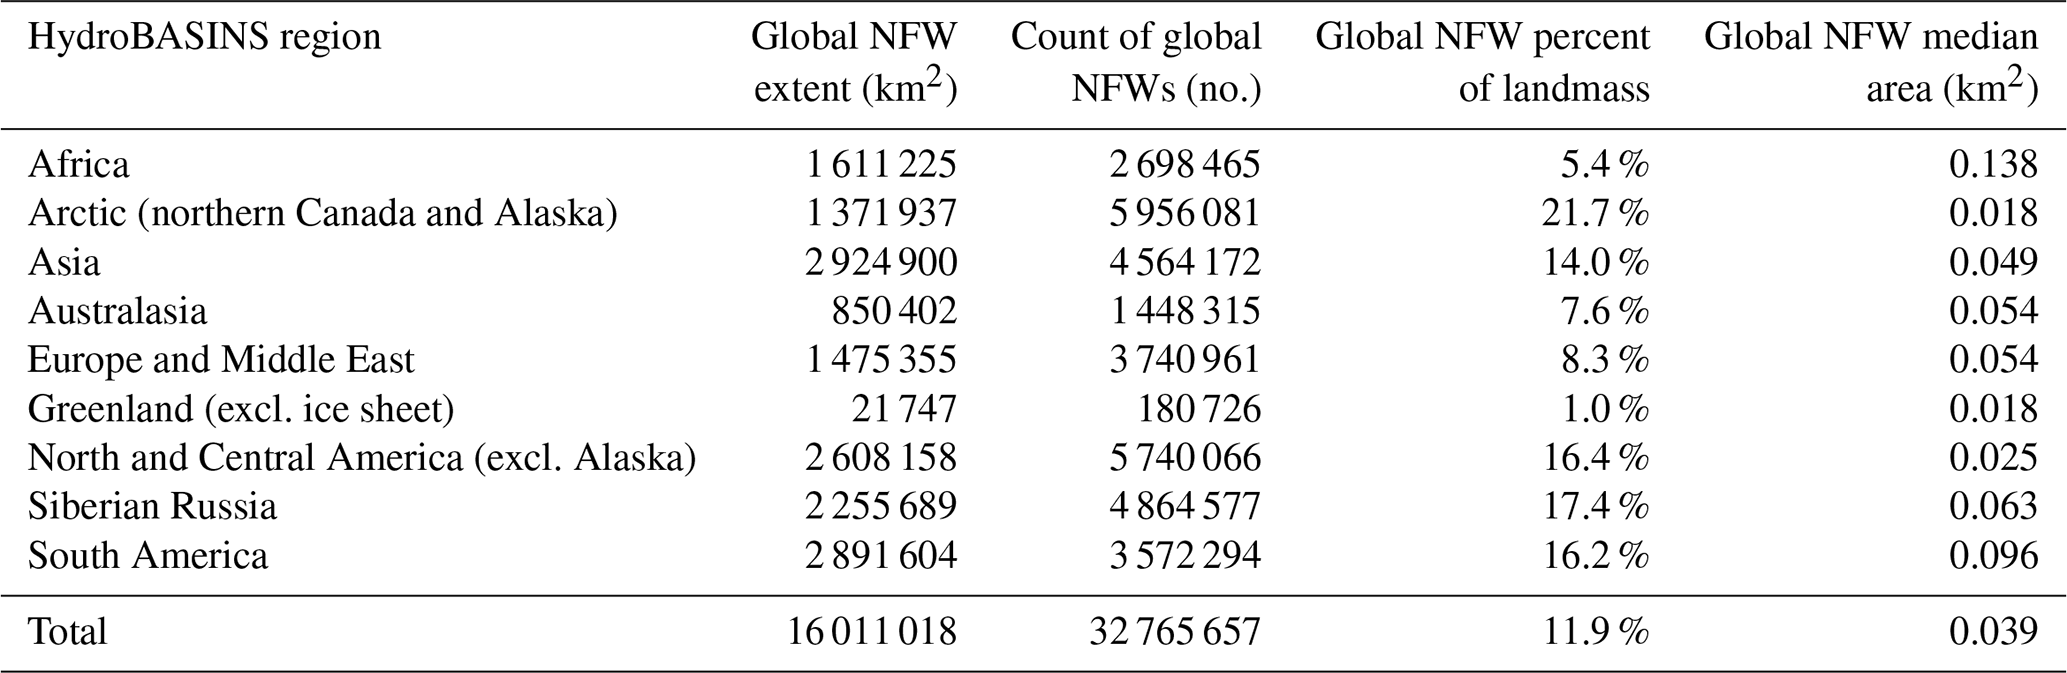
Approximately 16.0×10⁶ km2 of potential non-floodplain wetlands was identified globally (global NFWs, Fig. 6), meaning that 11.9 % of the global landmass is estimated to be covered by non-floodplain wetlands (Table 7). This represents ∼ 53 % of the total global wetlands found in the dataset used in this analysis (see Sect. 2.2.2 above, “Derived global wetland data”). The global distribution of non-floodplain wetlands is widespread, though they were found to comprise a higher proportion of wetlands within more northern HydroBASINS watersheds (i.e., higher abundances in formerly glaciated basins), as demonstrated in Fig. 7. The Arctic portion of northern Canada and Alaska (21.7 %) and Siberian Russia (17.4 %), typically underlain by permafrost and frequently inundated or saturated due to poor drainage evolution (Kremenetski et al., 2003; Robarts et al., 2013; Olefeldt et al., 2021), had the greatest percent of non-floodplain wetlands. Africa (5.4 %) and Greenland (1.0 %, excluding ice sheets) had the least abundance of non-floodplain wetlands. A four-direction region-group (contagion) analysis conducted to identify adjacent pixels considered as contiguous units or non-floodplain wetland systems identified 32.8×10⁶ individual non-floodplain wetlands. Non-floodplain wetlands are typically small aquatic systems (see Table 7): the median size differed across the HydroBASINS regions from 0.018 km2 (1.8 ha) to 0.138 km2 (13.8 ha) with a global median of 0.039 km2 (3.87 ha).
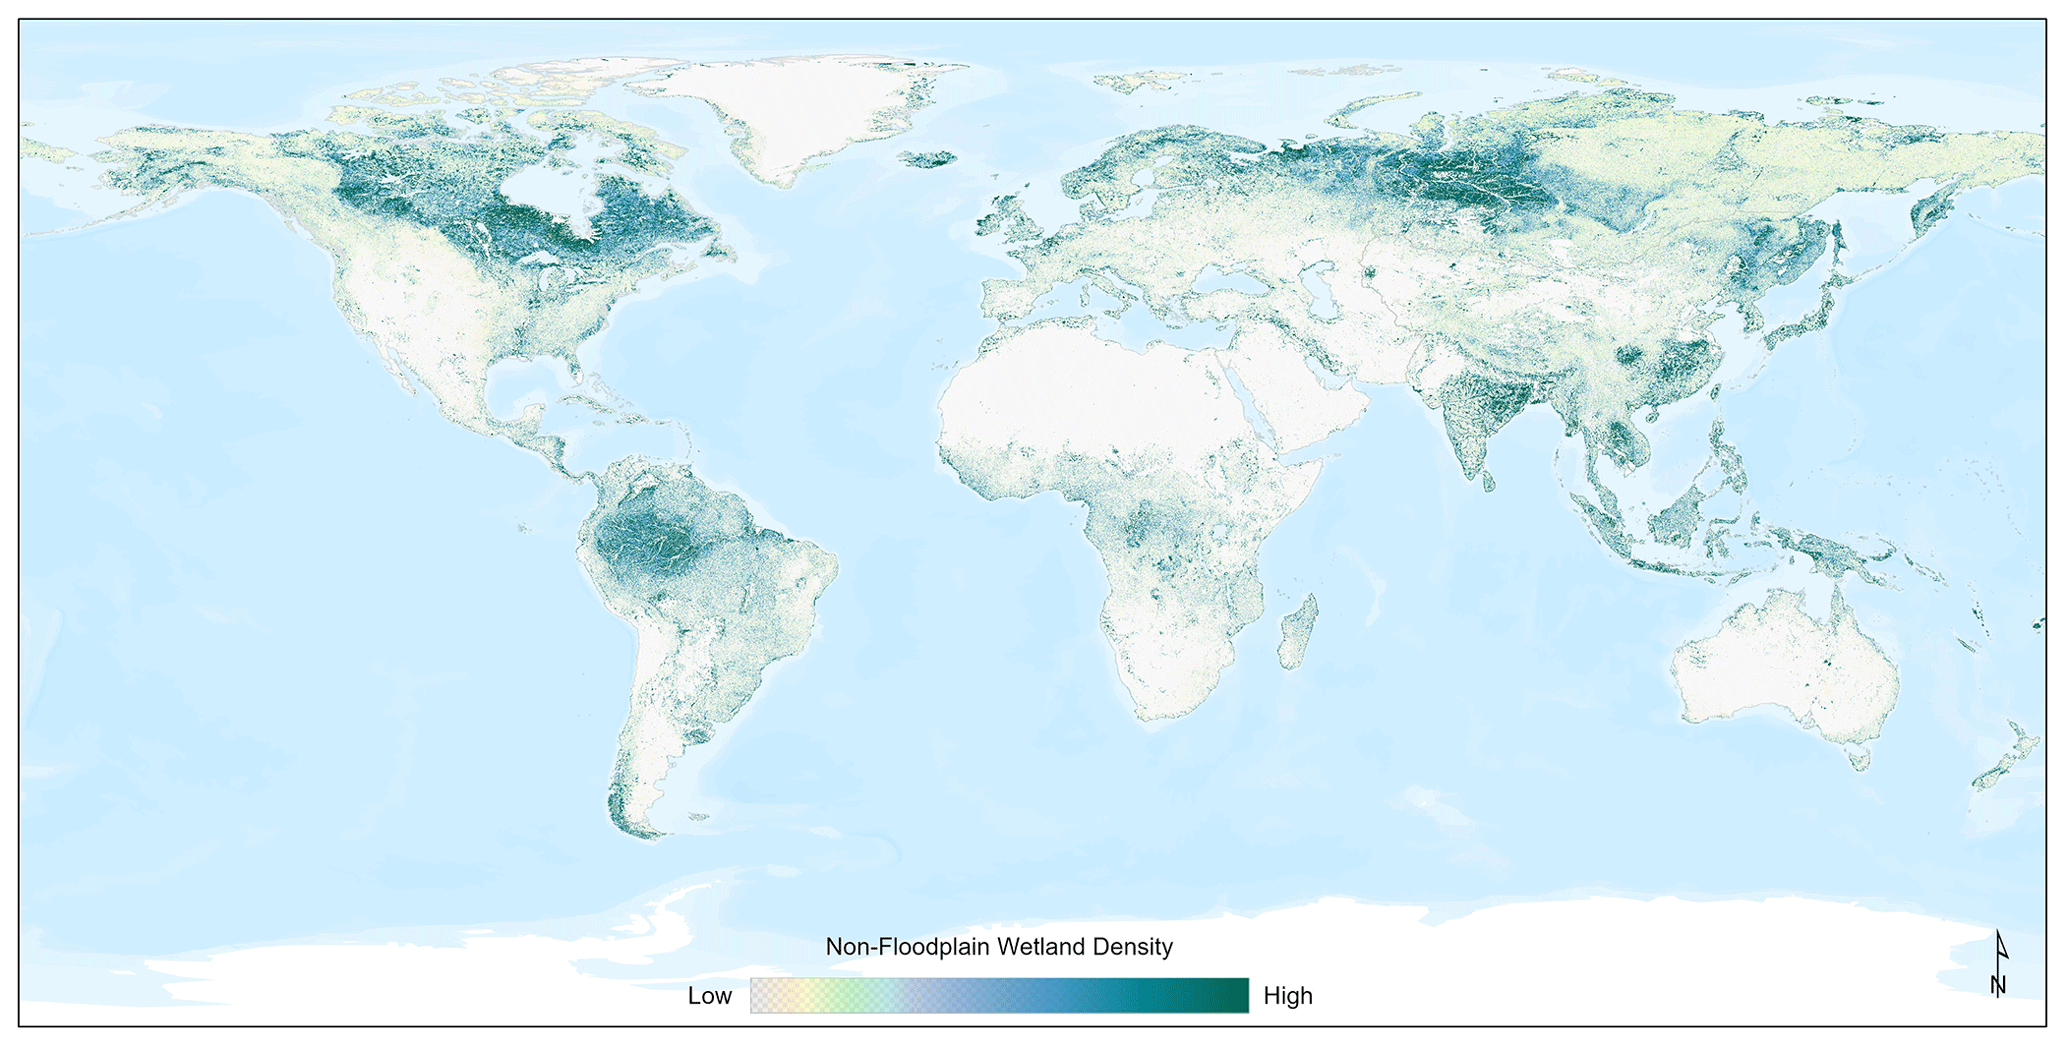
Figure 6Non-floodplain wetlands, global NFWs, are found worldwide, with a greater abundance in formerly glaciated landscapes of northern climates (e.g., northern North America and Siberian Russia) as well as within the Amazon basin (South America). This density map was created using the Focal Statistics tool in ArcGIS Pro 2.9.1. The basemap layer is from the ESRI World Terrain Base (2022).
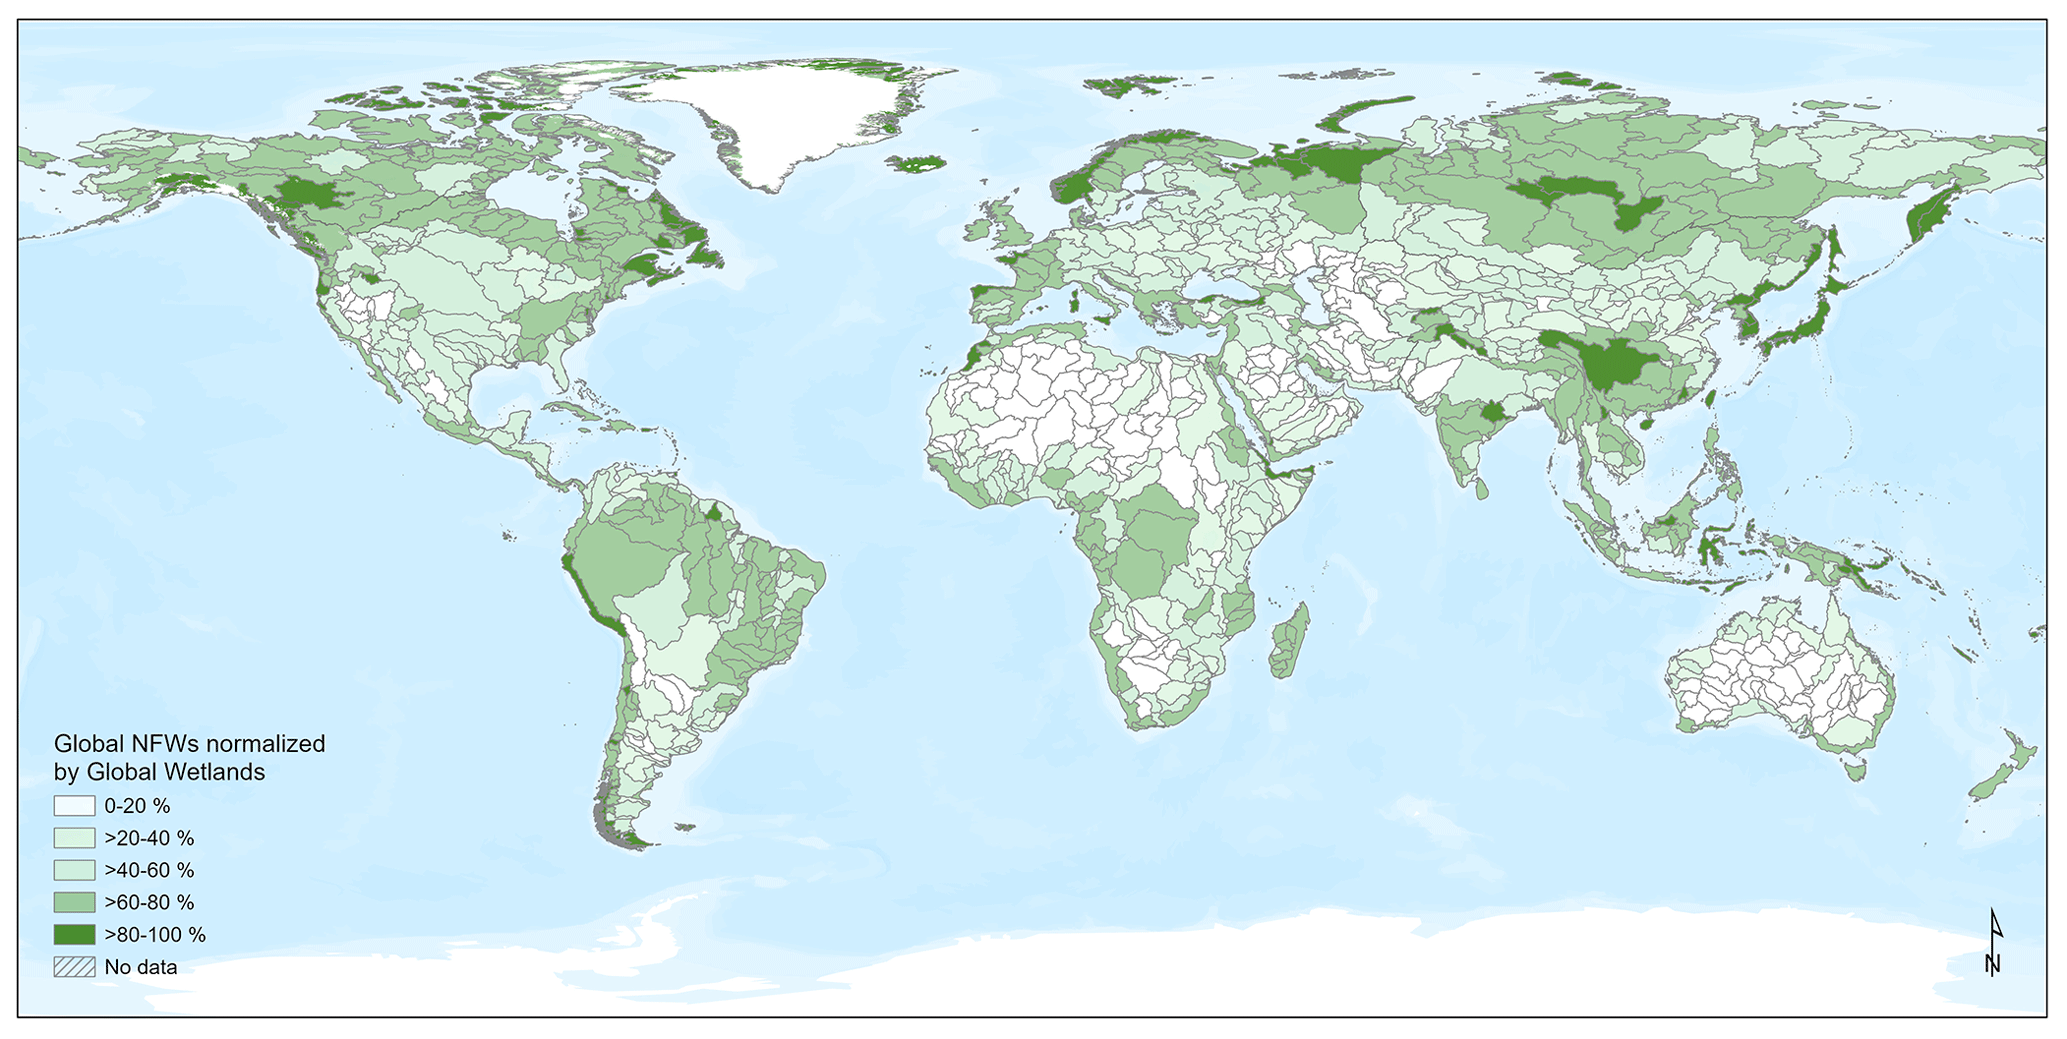
Figure 7The proportion of non-floodplain wetlands, global NFWs, within a given HydroBASINS watershed (Lehner and Grill, 2013), ranging up to 100 %, varied globally. The impacts or effects of non-floodplain wetlands on biological, biogeochemical, and hydrological functions will vary based on their relative abundance, location within the watershed, and hydrologic characteristics (Lane et al., 2018). The basemap layer is from the ESRI World Terrain Base (2022).
Table 7Global NFW data further described by HydroBASINS region.
We report here, for the first time, the global abundance of non-floodplain wetlands, a functionally important and imperiled resource (Creed et al., 2017). Our estimate of 16.0×10⁶ km2 suggests that approximately 53 % of the Earth's wetlands are likely non-floodplain wetland systems. These aquatic systems are small, with a range from 0.018–0.138 km2 (1.8–13.8 ha) across the globe and a global median size of 0.039 km2 (3.87 ha; see Table 7).
The global abundance of non-floodplain wetlands is a reasonable first approximation of the total non-floodplain wetland extent. For instance, non-floodplain wetland estimates in the CONUS were conducted by Lane et al. (2023b) using high-resolution aerial-sourced spatial data layers developed by the National Wetlands Inventory (US Fish and Wildlife Service, various dates). Lane et al. (2023b) reported approximately 23 % of the area of freshwater wetlands to be non-floodplain wetland systems. Yet the CONUS has lost nearly half of its wetlands since the European colonization (Dahl, 1990), with smaller and shallower non-floodplain wetlands likely being disproportionately lost (Van Meter and Basu, 2015; Serran et al., 2017).
Tootchi et al. (2019) – whose data constitute our base input geospatial data layer – calculated that the global wetland extent identified from incorporating both regularly flooded wetland systems (surface water and precipitation-sourced) and groundwater-driven wetland systems (e.g., Fan et al., 2013; Hu et al., 2017b) resulted in approximately 27.5×10⁶ km2 of wetlands, a value towards the higher end of previously published geospatial wetland datasets (Hu et al., 2017a). In their synthesis, Tootchi et al. (2019) explained their values as particularly influenced by groundwater-driven wetlands, especially those in the tropics (10∘ N–10∘ S latitudes; Zhu et al., 2022), following recent studies acknowledging the underestimation of those wetland systems (e.g., Wania et al., 2013; Gumbricht et al., 2017).
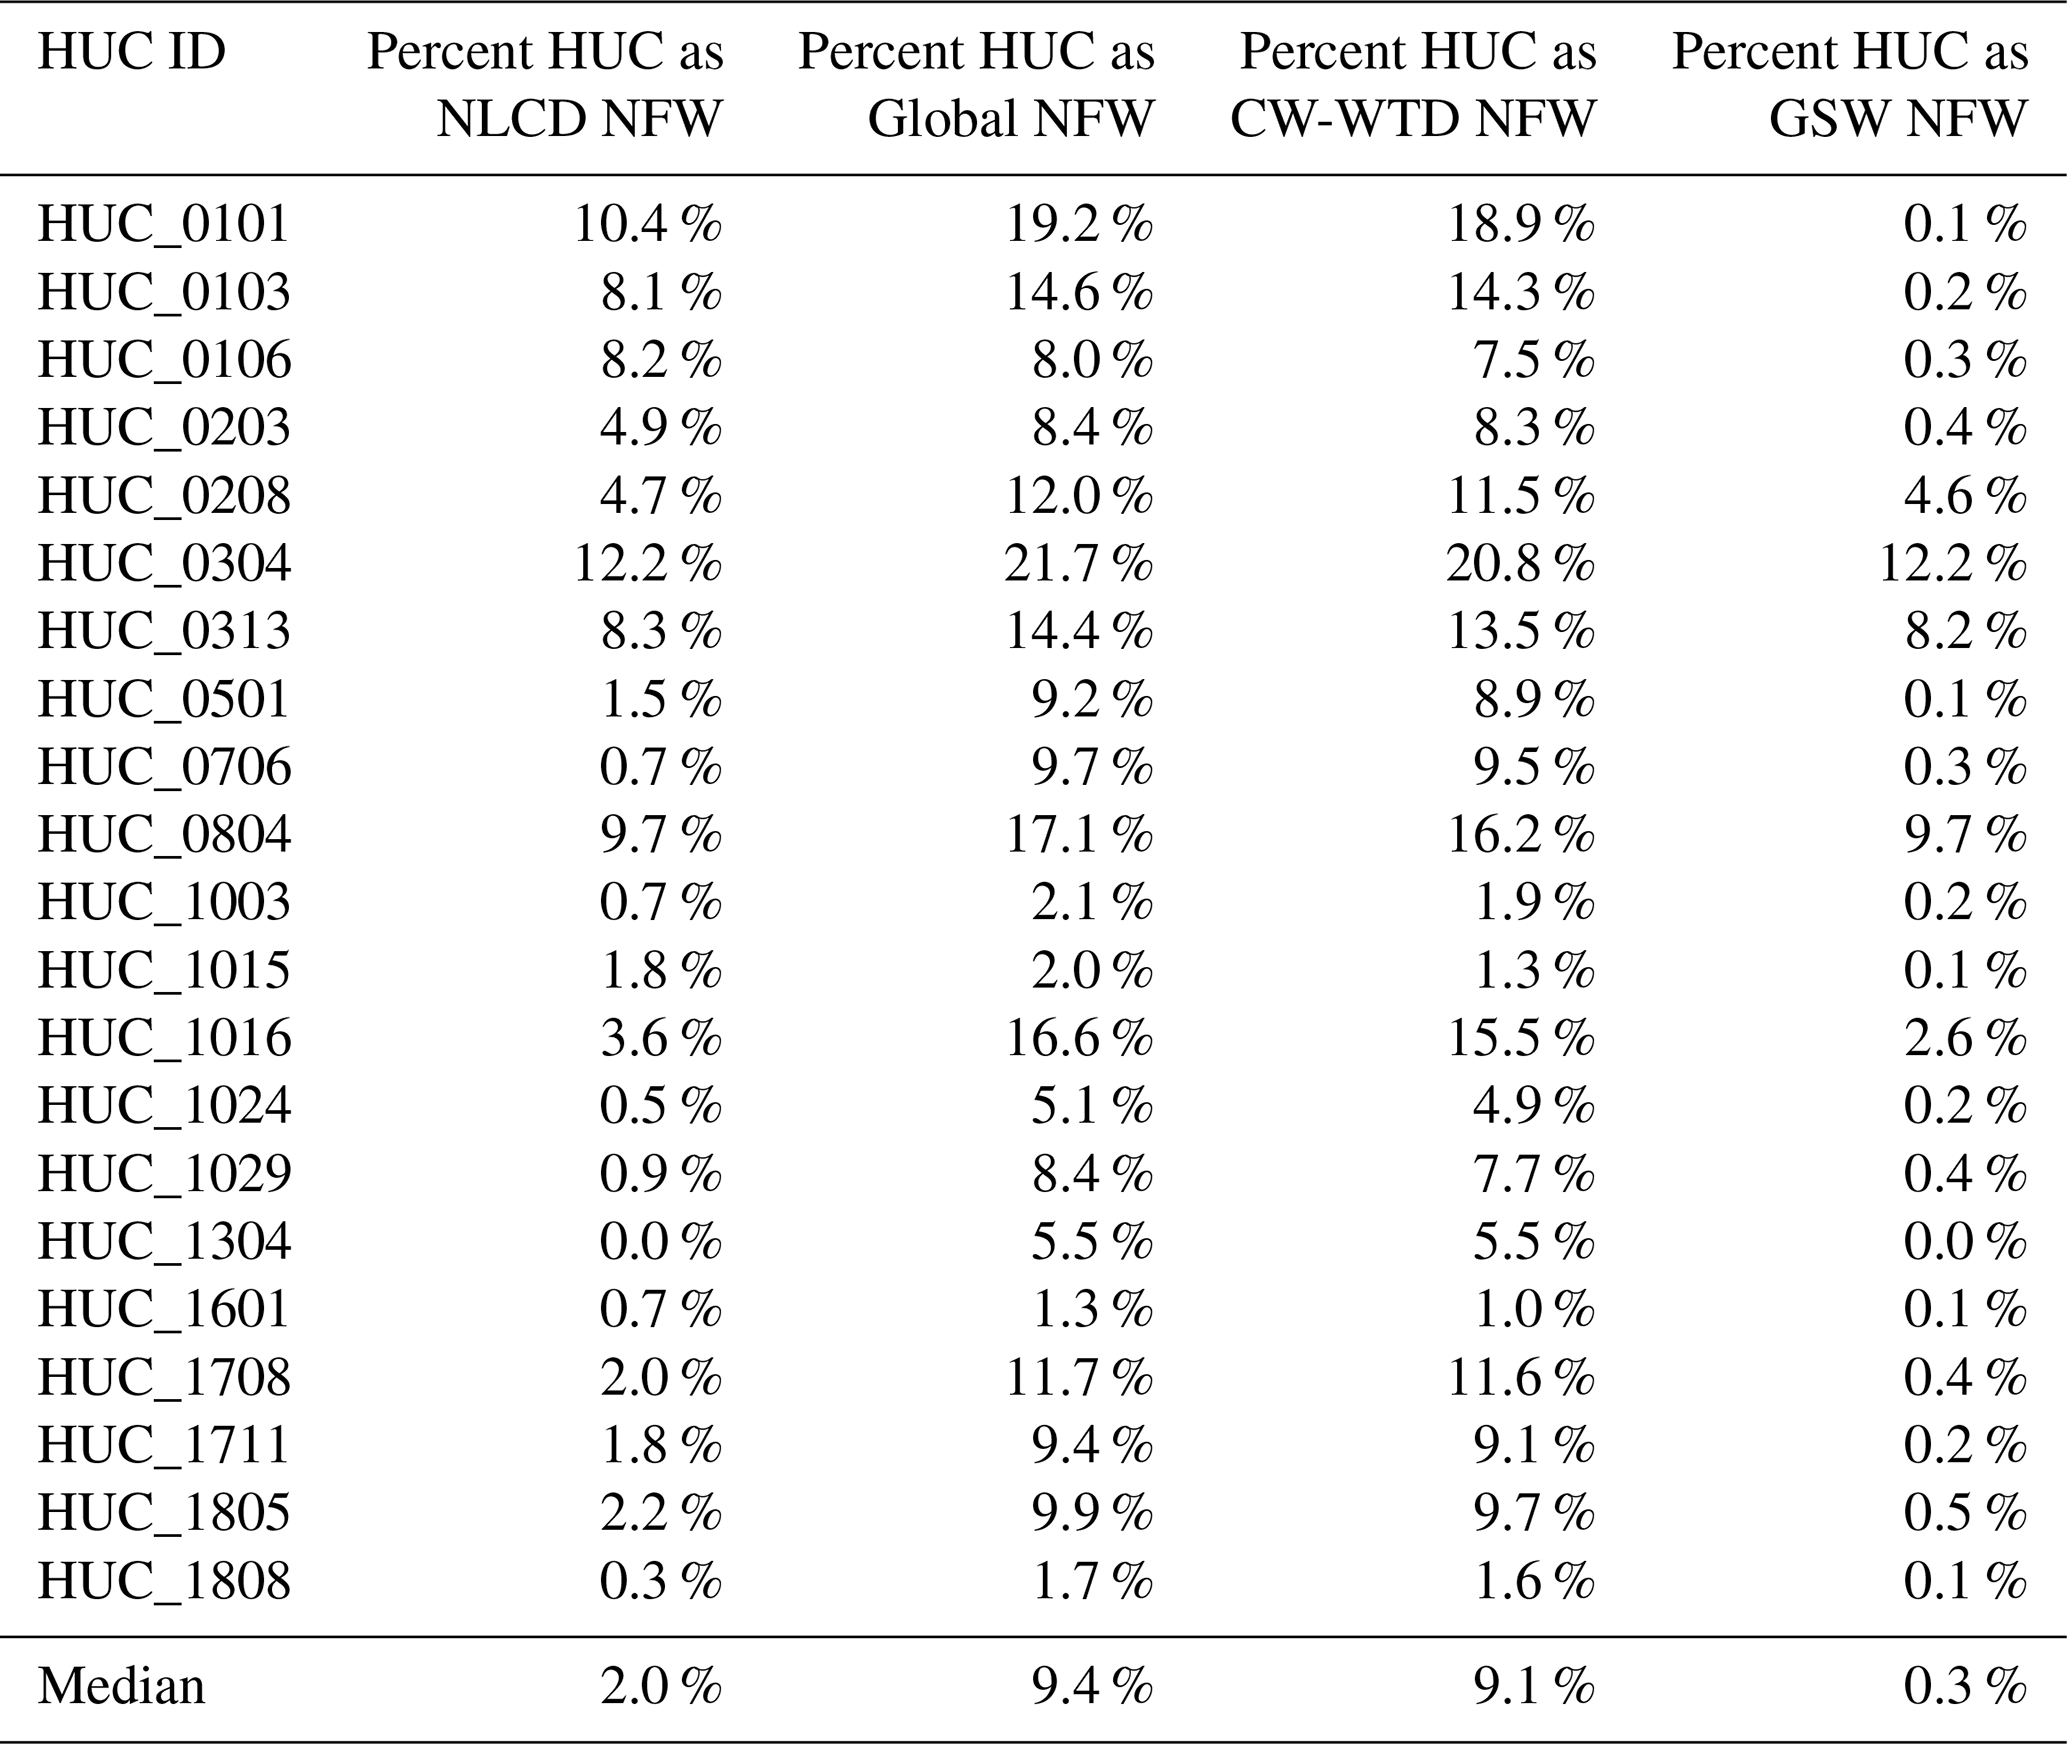
It follows that incorporating additional higher-resolution satellite inundation data (Pekel et al., 2016) as well as groundwater-driven wetland system data (e.g., Fan et al., 2013; Tootchi et al., 2019), as conducted in this study, would similarly maintain the trend towards the higher end in global estimates, as found by Hu et al. (2017b) and Tootchi et al. (2019). This is meted out in the simple contrast between the proportional abundance of non-floodplain wetland systems identified here against the 30 m NLCD data product described above (Dewitz, 2019) across the 21 CONUS watersheds in this study. The calculated median watershed abundance of non-floodplain wetlands in both the Global NFW dataset (9.4 %) and the Tootchi et al. (2019) CW-WTD (9.1 %) dataset from our validation watersheds is nearly 5-fold the abundance of the benchmark data from the NLCD (Table 8). However, this is contrasted with a 7-fold underrepresentation of non-floodplain wetlands as derived from the satellite-based GSW data (Table 8, Pekel et al., 2016). This suggests that our first approximation of global non-floodplain wetland estimates may be high, primarily due to the resolution of the input data layers. However, as we discuss below, additional factors than just resolution are likely at play.
It is apparent that the GSW data alone are insufficient to map non-floodplain wetlands (this study; Vanderhoof and Lane, 2019). Though useful as a satellite-based input data layer, the GSW data by themselves appear inadequate for identifying non-floodplain wetlands because they rely on surface water inundation and ignore saturated wetland systems and those driven by groundwater discharge and upwelling (Winter et al., 1998). Fan et al. (2013) found that groundwater drivers of aquatic system state were important and underrepresented in global datasets. Relying on surface water inundation captured during satellite overflights depends not only on an unobstructed view of the water body (e.g., not obscured by trees) but also fortuitous timing regarding inundation status. For example, in an analysis of non-floodplain wetlands of the CONUS as derived by distance from an aquatic system, Lane and D'Amico (2016) reported that just over 50 % of the non-floodplain wetlands were classified as seasonally or temporarily flooded – meaning that cloud-free and unobscured overflights would only potentially identify these systems at certain inundated times of the year. Additionally, Lane and D'Amico (2016) identified another 6 % of CONUS non-floodplain wetlands as saturated (i.e., wetlands with saturated substrates but with surface water seldom present). These wetlands would not be identified by the GSW data (Pekel et al., 2016), resulting in a further underrepresentation of the global resource. Similarly, Hamunyela et al. (2022), analyzing ∼ 150 000 km2 in southeastern Africa, found that the GSW data underestimated surface water extent (i.e., omission errors) by nearly 65 %. Vanderhoof and Lane (2019) found approximately 42 % omission rates when contrasting the GSW data to surface water extent in non-floodplain wetlands, ranging from 0.2–17.6 ha in area in the Midwestern United States. While the GSW data constitute an outstanding dataset that is continuing to be managed and updated, the GSW data and their derived products have limitations in their stand-alone utility in global non-floodplain wetland analyses.
Table 8A comparison of the non-floodplain wetland distribution within the 21 HUCs contrasting across NLCD (the benchmark data layer, (Dewitz, 2019), Global NFW (this study), CW-WTD (Tootchi et al., 2019), and GSW (Pekel et al., 2016) data. The CW-WTD (at 500 m) and the Global NFW (coupling 500, 300, and 30 m data), derived from the CW-WTD, identified 5-fold the abundance of non-floodplain wetlands, whereas the GSW data underestimated non-floodplain wetlands nearly 7-fold.
While solely using satellite-based surface water data products omits groundwater-driven and saturated wetlands and likely results in non-floodplain wetland underestimations, our Global Wetland data incorporated the finer-resolution CCI (Herold et al., 2015) and GSW (Pekel et al., 2016) products into the base map from Tootchi et al. (2019), substantially improving wetland identification (see Table 3). These improvements, as indicated by performance indices increasing from 10 %–50 % in the derived Global NFW data (see Table 4), support the inclusion of these higher-resolution satellite-based data (Herold et al., 2015; Pekel et al., 2016) with groundwater datasets (Fan et al., 2013), especially when focused on smaller and non-floodplain wetland systems. Similarly, at a coarser scale of 1 km, there was a difference in mean absolute error value of 0.09 (see Table 4) between the Global NFW data and the benchmark NLCD. This ∼ 9 % difference between the two datasets at a 1 km resolution (the former originating at 500 m and the latter at 30 m) further suggests substantive potential utility in these global non-floodplain wetland data for effective natural resource management and decision-making.
Non-floodplain wetlands remain vulnerable waters (Creed et al., 2017; Gardner, 2023), despite the fact that the hydrological, biogeochemical, and biological functions performed by non-floodplain wetlands are increasingly noted in the literature (e.g., Leibowitz, 2003; Creed et al., 2017; Lane et al., 2018, 2023b), incorporated into eco-hydrological models by the scientific community (e.g., Fossey and Rousseau, 2016; Golden et al., 2017, 2021; Leibowitz et al., 2023), and considered by policy makers (e.g., Biggs et al., 2017; Drenkhan et al., 2023). Their global fate has important implications for watershed-scale resilience to changing climatic conditions (McKenna et al., 2017; Lane et al., 2023b) affecting the measured benefits humans receive from biogeochemical processing, stormwater attenuation, and drought mitigation functions provided by non-floodplain wetlands.
Global attention to functions of non-floodplain wetlands has increased in the United States (Marton et al., 2015; Rains et al., 2016; Cohen et al., 2016), Europe (Biggs et al., 2017; Nitzsche et al., 2017; Rodríguez-Rodríguez et al., 2021), Asia (Kam, 2010; Van Meter et al., 2014), Australia (Adame et al., 2019), Africa (Merken et al., 2015; Samways et al., 2020), South America (Rodrigues et al., 2012; Cunha et al., 2019), and elsewhere (see extensive review in Chen et al., 2022). This includes analyses of non-floodplain wetlands both as individual systems (e.g., assessing the functions of a single wetland or wetland complex; Badiou et al., 2018) and agglomerated, watershed-scale functioning systems (e.g., answering questions on the functional contributions of all non-floodplain wetlands at larger spatial extents; Golden et al., 2016; Blanchette et al., 2022). Previous studies found that non-floodplain wetlands are overwhelmingly important contributors to biogeochemical and hydrological functions affecting downgradient (i.e., downstream) water quality and streamflow (e.g., McLaughlin et al., 2014; Marton et al., 2015; Cohen et al., 2016; Rains et al., 2016; Golden et al., 2019; Cheng et al., 2020). Hence, with the development of this publicly available dataset, and subsequent improvements by others, it is hoped that these important aquatic systems will be incorporated into resource management and decision-making across the globe.
Recently, Lane et al. (2023b) identified global-scale geospatial data of the spatial extent and spatial configuration of vulnerable waters – non-floodplain wetlands and headwater stream systems (e.g., ephemeral, intermittent, and perennial low-order waters; Strahler, 1957) – as a critical scientific gap. Discounting their significance in watershed-scale hydrology and nutrient biogeochemistry analyses – as well as their importance in biological processes (Schofield et al., 2018; Smith et al., 2019; Mushet et al., 2019) – affects quantification of the myriad ecosystem services they provide (De Groot, 2006; Colvin et al., 2019). For instance, Golden et al. (2021) provide a tangible example of the functional effects and influence of non-floodplain wetlands once incorporated into watershed-scale hydrologic models (Fig. 8): ignoring non-floodplain wetlands in their model resulted in projected critical flood-stage return intervals (e.g., 50- and 100-year floods) being reached within a given modeled time frame. Conversely, incorporating non-floodplain wetlands and their storage capacities into a river basin model (e.g., Rajib et al., 2020) demonstrated that non-floodplain wetlands significantly attenuate storm flows, for when non-floodplain wetlands are “… integrated into the model, those simulated flood stages are not reached” (Golden et al., 2021, p. 3, emphasis added). The hydrological functions and concomitantly the associated biogeochemical functions (e.g., Marton et al., 2015) of non-floodplain wetlands demand an effective accounting of their spatial extent and configuration, as demonstrated in this novel global dataset.
The data are available on the United State Environmental Protection Agency's Environmental Dataset Gateway (https://doi.org/10.23719/1528331, Lane et al., 2023a) or https://gaftp.epa.gov/EPADataCommons/ORD/Global_NonFloodplain_Wetlands/ (last access: 24 May 2023). Here, we provide global gridded floodplain (90 m, GFPLain90, ∼ /Global_Floodplains), global gridded wetlands (30 m, Global Wetlands, ∼ /Global_Wetlands), and global gridded non-floodplain wetlands (30 m, Global NFWs, ∼ /Global_NFWs) for each of the 1342 HydroBASINS, organized by HydroBASINS region (see, e.g., Table 7).
Noting the challenges in accurately identifying non-floodplain wetlands – including small size, frequent non-perennial hydrological inundation, soil saturation rather than overlying surface water, and canopy or cloud cover obstructing satellite or airborne detection – recommendations for advanced analyses of non-floodplain wetland extent hinge initially on the use of ancillary data sources. For instance, global assessments will be improved through wall-to-wall high-resolution digital elevation models that are used to identify depressions on the landscape (e.g., Wu et al., 2019b). Though not all landscape depressions are non-floodplain wetlands (or wetlands at all), analyses that include depressions may find improved performance when used in combination with vegetation-based assessments or spectral analyses identifying water (DeVries et al., 2017; Evenson et al., 2018b). Similarly, emerging synthetic-aperture-radar-based landscape classifications (e.g., Huang et al., 2018; Martinis et al., 2022; Brown et al., 2022) and both airborne and satellite-borne hyperspectral and advanced analyses, including lidar, as well as analytical capabilities (e.g., machine-learning approaches, object-oriented classifications, Berhane et al., 2018; topographically based models, Xi et al., 2022; see Table B1), hold great promise for improved resolution and performance in identifying non-floodplain wetlands (Christensen et al., 2022).
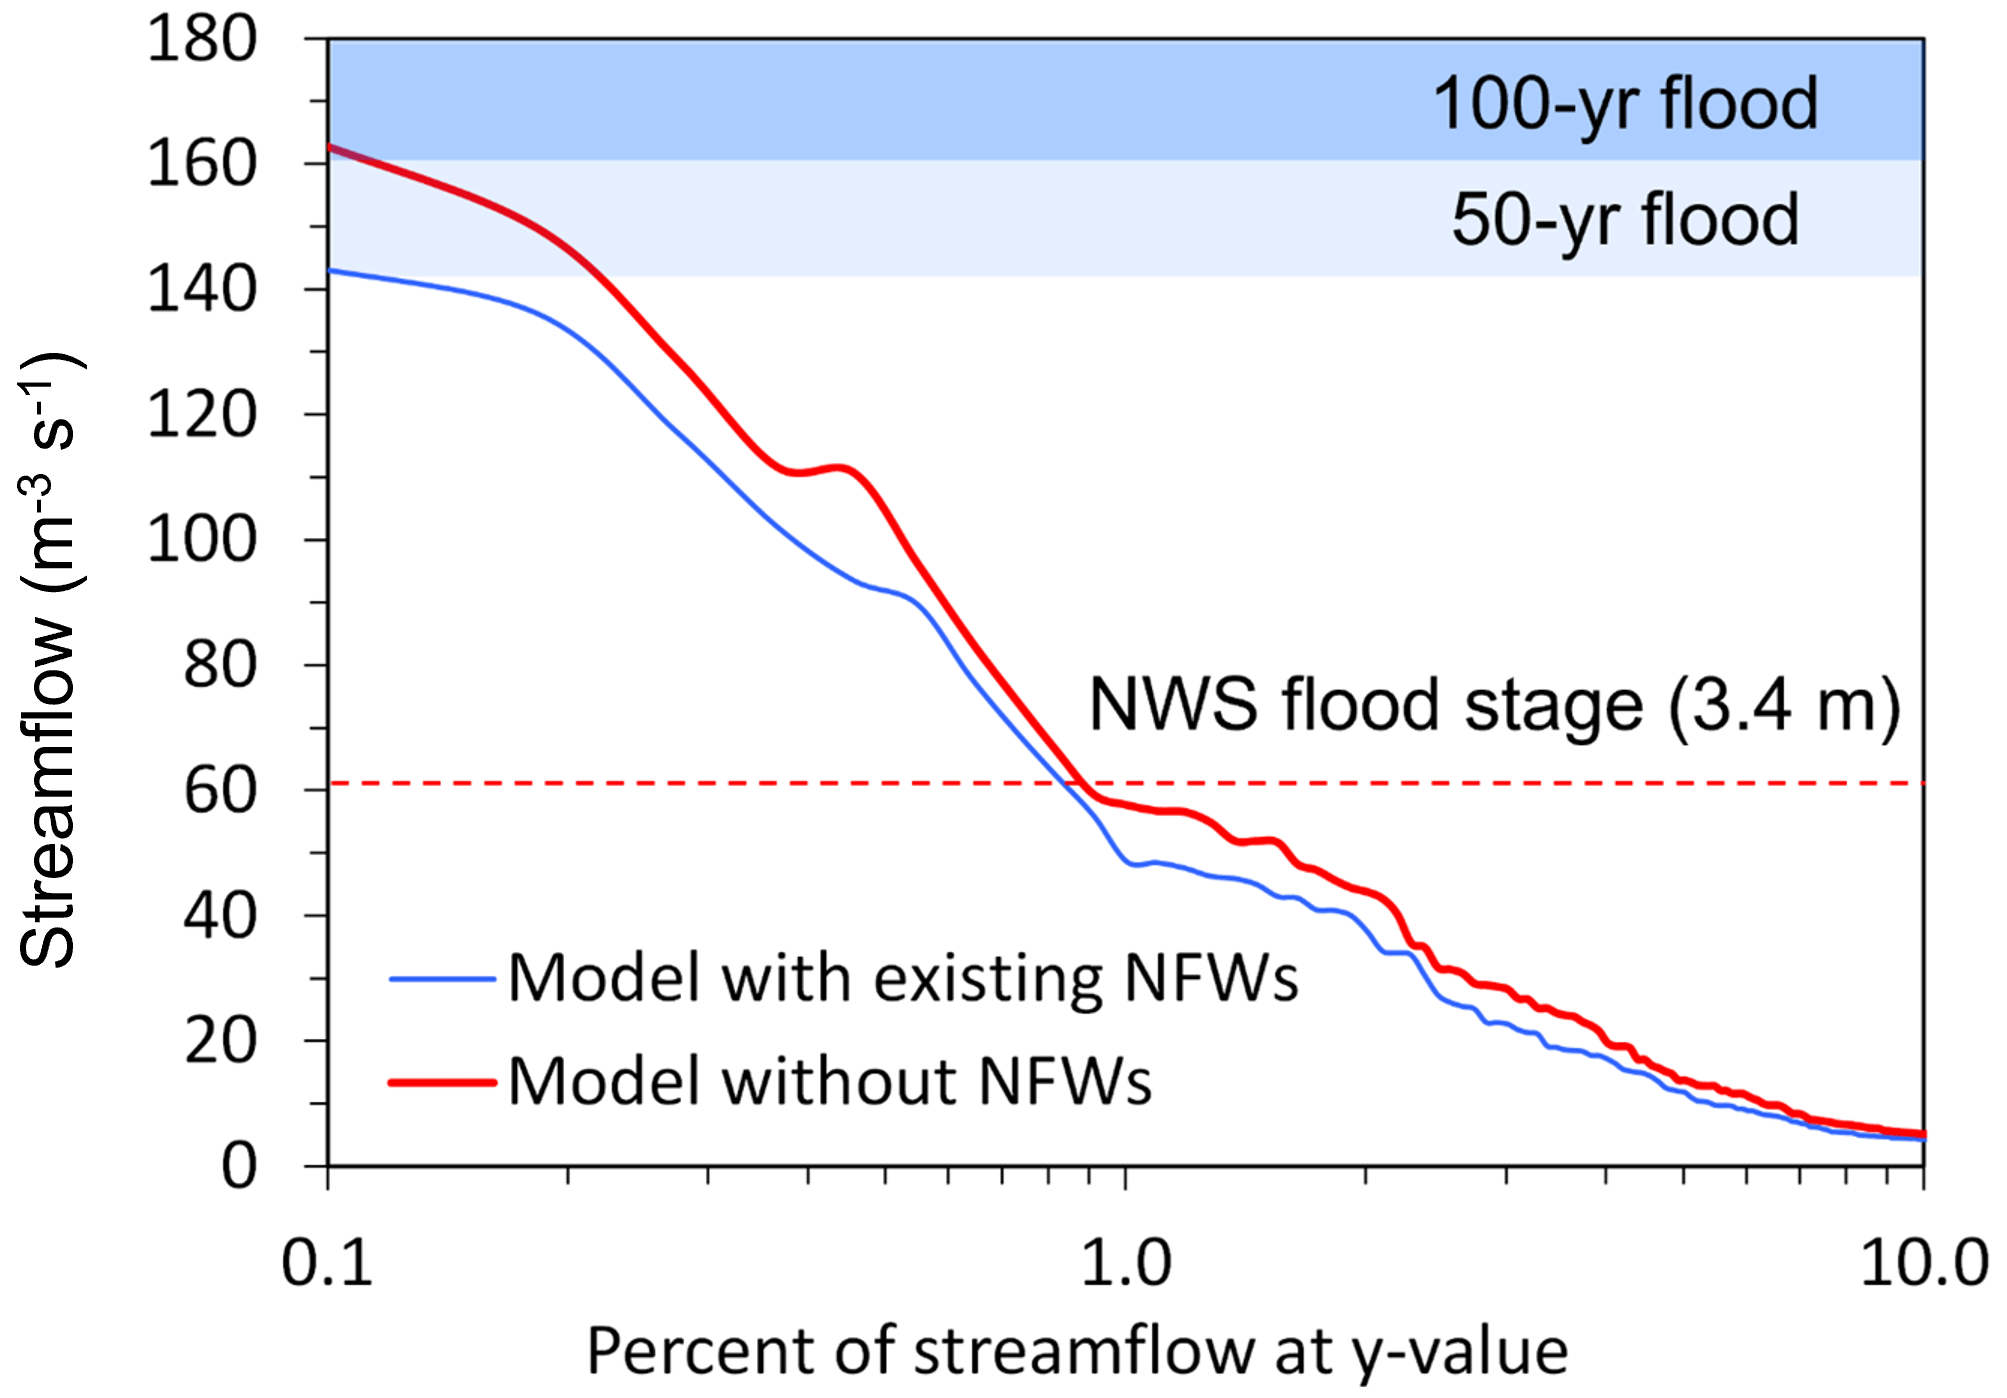
Figure 8Non-floodplain wetlands attenuate storm flows and decrease flooding hazards. In this example from Golden et al. (2021, used by permission under Creative Commons Attribution 4.0 License), incorporating the floodwater storage and attenuation functions of non-floodplain wetlands (NFWs, here) resulted in substantive decreases in flood-stage heights (i.e., modeled stream outcomes incorporating non-floodplain wetlands reached neither 50-year nor 100-year flood extents). The data from Golden et al. (2021) are from USGS Pipestem Creek gage 06469400, draining approximately 1800 km2.
The Global NFW dataset is not perfect, yet it incrementally advances the current understanding of the potential extent of this important aquatic resource. Limitations of the global dataset (see also Sect. 4) include the error propagation and imperfections of the input data layers, including the relatively coarse nature of four of the main input data layers (i.e., the 1000 m groundwater data from Fan et al., 2013, 500 m CW-WTD data from Tootchi et al., 2019, 500 m GIEMS-D15 data from Fluet-Chouinard et al., 2015, and 300 m CCI data from Herold et al., 2015) relative to the target wetland size, as clearly evident in Fig. 4. We additionally acknowledge that omission and commission errors remain within this global data product. For instance, our floodplain-masking process may have inadvertently misassigned pixels derived at 500 m into either non-floodplain or floodplain groups. Though data were not lost when we resampled downwards to 30 m from 500 m, the topological relationships were not necessarily maintained, adding error to the determination of floodplain or non-floodplain pixel status (especially as it relates to those pixels proximate to floodplains). Though imperfect, we suggest Global NFW data should be cautiously incorporated into hydrological, biogeochemical, and biological models to account for the important functions non-floodplain wetlands perform.
Similarly, though this Global NFW dataset constitutes a static data layer, land use, development, and climate changes continue to affect the prevalence of wetlands worldwide. Fluet-Chouinard et al. (2023) recently noted a global wetland loss of 21 % since 1700, with rapid increases from 1950s onwards. Returning to the identification of wetlands and their spatial location vis à vis floodplains, using the preponderance of higher-resolution (i.e., < 30 m) and high-return interval sensors will improve both the spatial and temporal accuracy of these data, decreasing commission and omission errors (e.g., Table 8) while increasing the accurate identification of smaller aquatic features that occasional cease to hold standing water.
The keys to quantifying the functional contributions, ecosystem services, and watershed-scale resilience conferred by non-floodplain wetlands through hydrological, biogeochemical, and biological processes are found through, as a first principle, identifying the spatial extent and configuration of this disappearing and imperiled aquatic system (Creed et al., 2017; Lane et al., 2023b). This novel geospatial dataset, freely available (https://gaftp.epa.gov/EPADataCommons/ORD/Global_NonFloodplain_Wetlands, last access: 24 May 2023, Lane et al., 2023a), provides for sustainable management of an important aquatic resource and advances the global assessment of non-floodplain wetland functions by facilitating non-floodplain wetland inclusion in both existing models and those under development (Golden et al., 2021).
| AEB | Aggregate error bias |
| CaMa-Flood | Catchment-based Macro-scale Floodplain |
| CCI | Climate Change Initiative |
| CIMA-UNEP | CIMA Research Foundation – United Nations Environmental Programme |
| CONUS | Conterminous United States |
| CSI | Critical success index |
| CW-WTD | Composite wetland–water table depth |
| DEM | Digital elevation model |
| EB | Error bias |
| ECMWF | European Centre for Medium-Range Weather Forecasts |
| EPA | Environmental Protection Agency |
| ESA | European Space Agency |
| FA | False alarm |
| FEMA | Federal Emergency Management Agency |
| GDW | Groundwater-driven wetlands |
| GFPlain | Global Floodplain |
| GIEMS-D15 | Global Inundation Extent from Multi-Satellites – Downscaled 15 arcseconds |
| GIS | Geographic information system |
| GLOFRIS | Global Flood Risk with Image Scenarios |
| GLWD | Global Lakes and Wetlands Database |
| GNFW | Global Non-floodplain wetlands |
| GSW | Global surface water |
| GW | Global wetlands |
| H | Hit rate |
| HUC | Hydrologic unit code |
| IPCC | Intergovernmental Panel on Climate Change |
| JRC | Joint Research Center |
| Lidar | Light detection and ranging |
| MAE | Mean absolute error |
| MERIT | Multi-Error Removed Improved Terrain |
| ML | Machine learning |
| NFW | Non-floodplain wetland |
| NLCD | National Land Cover Database |
| P | Precision |
| RFW | Regularly flooded wetland |
| SAR | Synthetic-aperture radar |
| USGS | United States Geological Survey |
| UTM | Universal Transverse Mercator |
| WTD | Water table depth |
Table B1Emerging global land cover datasets related to surface water and wetlands.
Table B2Descriptive characteristics of the 21 verification basins located throughout the CONUS (see Fig. 2). The majority of the Köppen–Geiger classification follows Beck et al. (2018). Climatological data were acquired from the PRISM Climate Group (Parameter-elevation Regressions on Independent Slopes Model; http://prism.oregonstate.edu/, last access: 26 September 2022) using the 30-year annual normals for each watershed. Land use data and descriptions are from the 2019 NLCD (http://www.mrlc.gov/data, last access: 26 September 2022) and represent the land use class with the greatest areal abundance. Average elevation was derived from the USGS National Elevation Dataset (2022b, https://www.usgs.gov/3d-elevation-program, last access: 13 January 2022). Global wetland count is the count of wetlands from the derived Global Wetland database within each watershed after region-grouping the data using a four-direction contagion criterion (i.e., pixels immediately adjacent in any of the four cardinal directions are considered part of a unique, multi-pixel wetland; ArcGIS Pro v.2.9.1, Redlands, California).
* Köppen–Geiger class descriptions (Beck et al., 2018): BSh (arid, steppe, hot), BSk (arid, steppe, cold), Cfa (temperate, no dry season, hot summer), Csb, (temperature, dry season, warm summer), Dfa (cold, no dry season, hot summer), and Dfb (cold, no dry season, warm summer).
Table B3Floodplain performance assessment of the GFPlain90-derived floodplain and the benchmark floodplain from Woznicki et al. (2019). The first six equations directly assess the spatial concordance and overlap between the two datasets, whereas mean absolute error (Eq. 7) and aggregate error bias (Eq. 8) are coarser fractional analyses (i.e., the fraction of a 1 km2 cell predicted correctly) as measured along the riverine network.
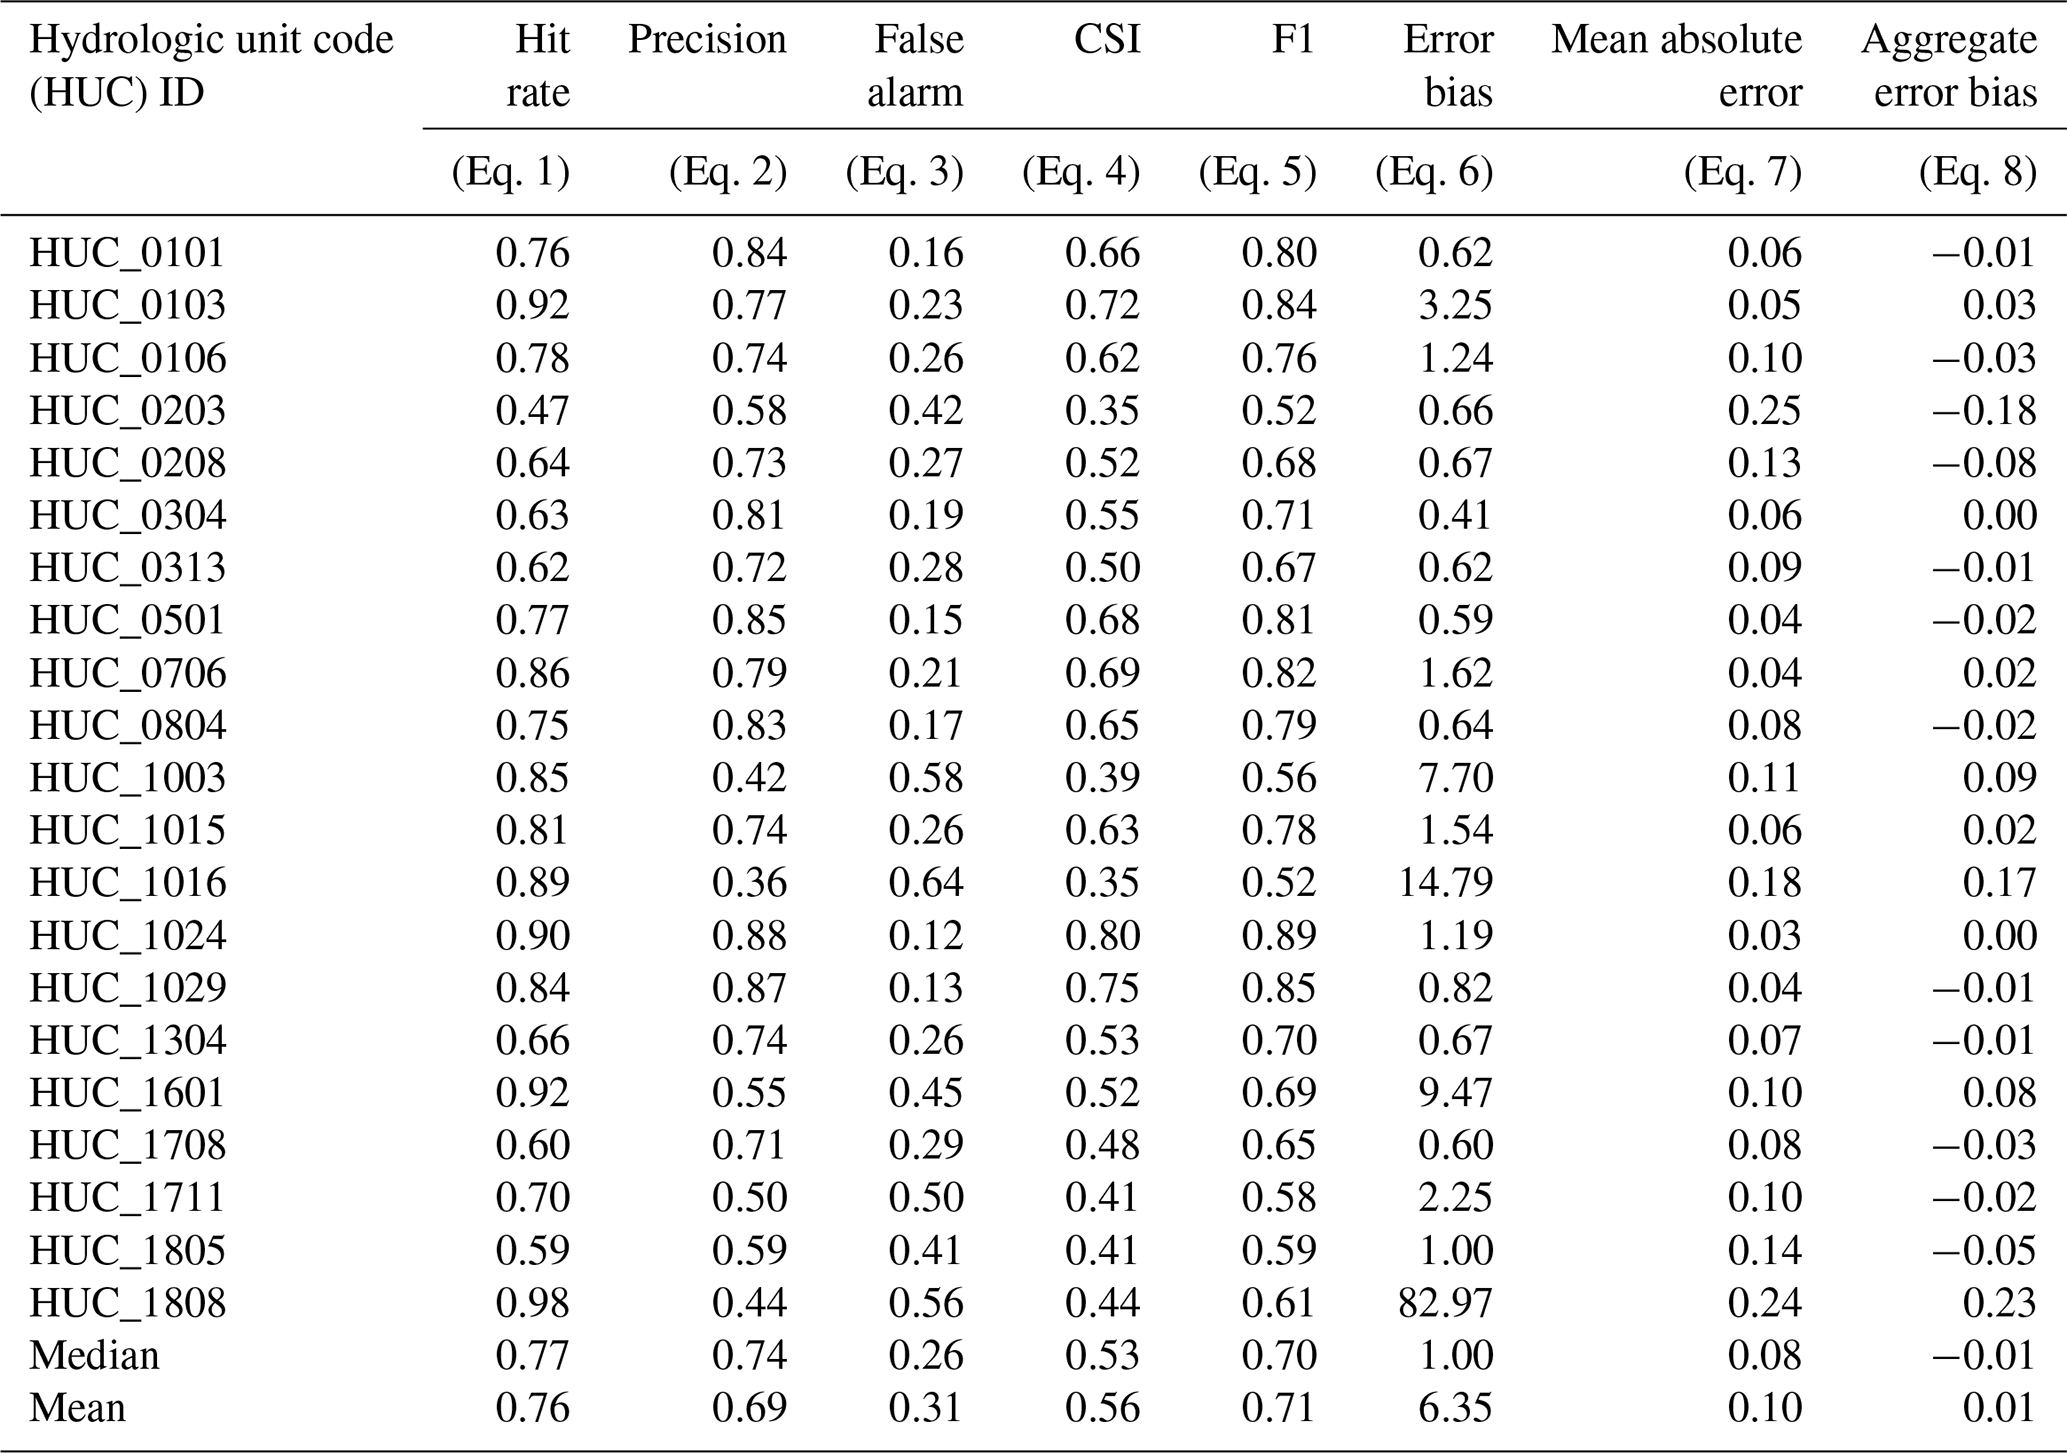
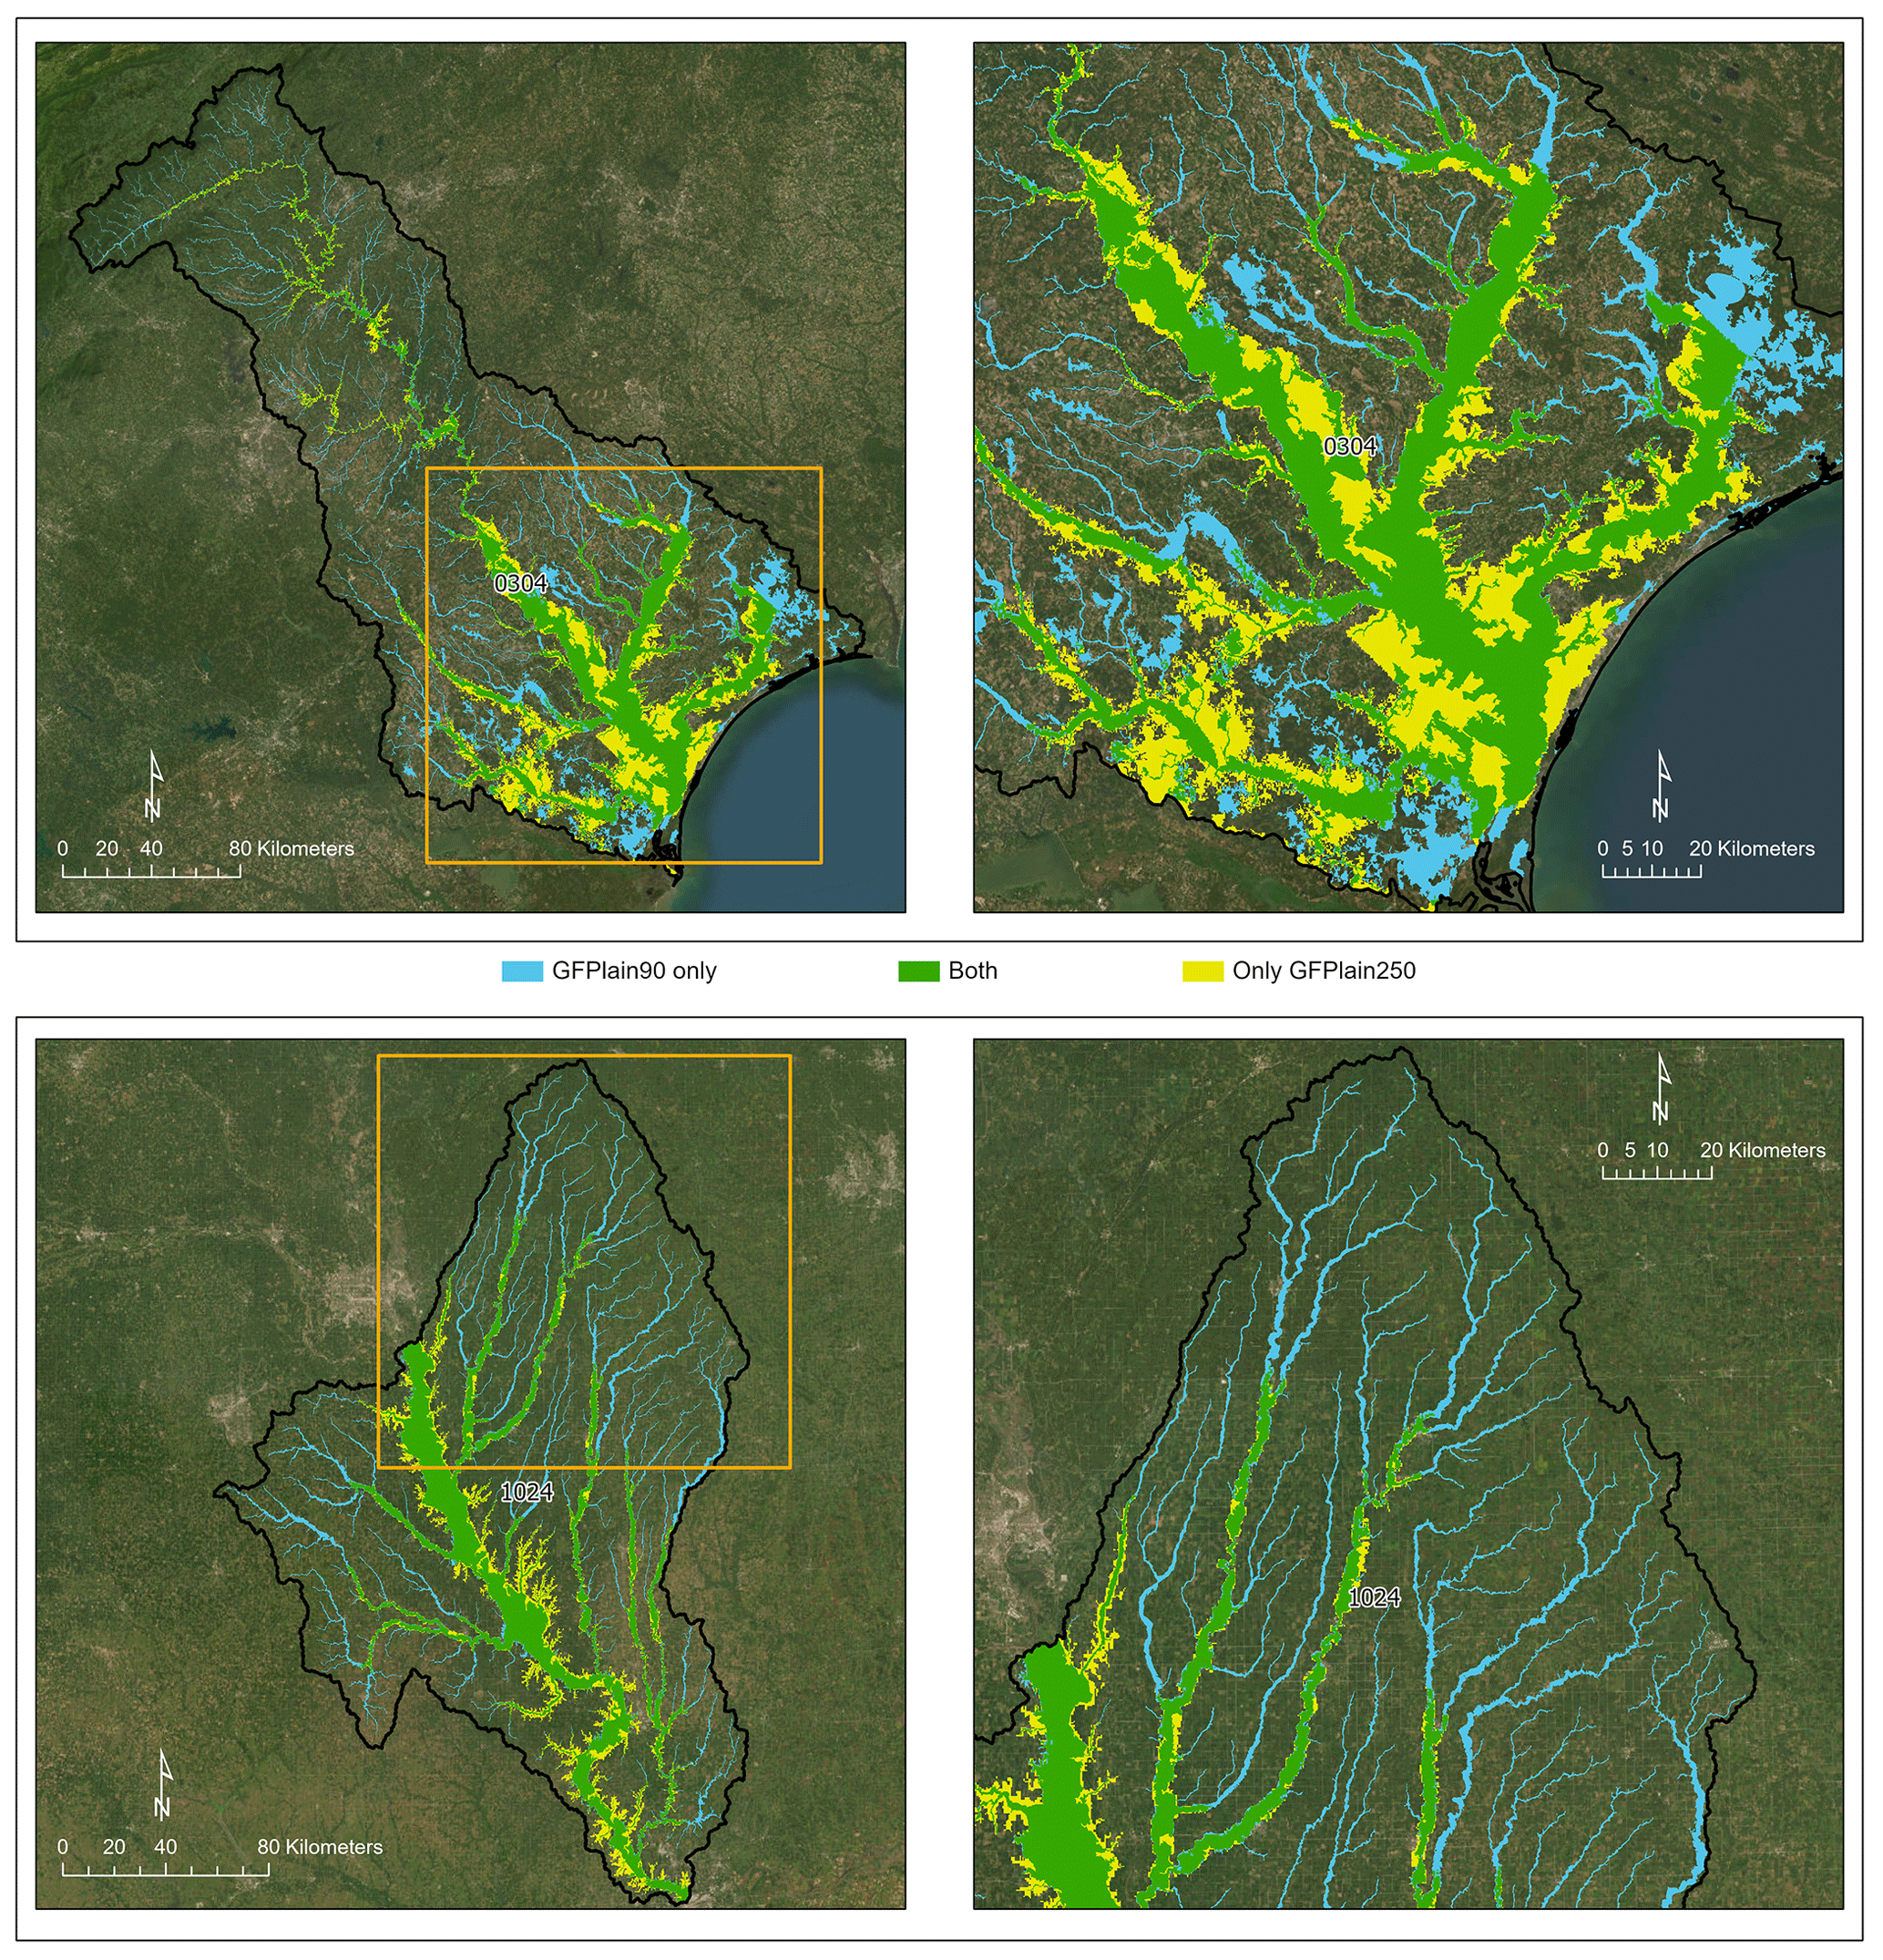
Figure B1Comparison of floodplain extents derived from GFPlain90 (this study) and GFPlain250 (Nardi et al., 2019). The right-hand panels are the inset area outlined in the orange box on the left panels, and the top panels represent an eastern coastal watershed (HUC_0304), whereas the bottom panels are from a Midwestern US watershed (HUC_1024). The full extent of the riverine network is evident in the GFPlain90 dataset, which was derived from 90 m resolution DEMs (digital elevation models) in contrast to the 250 m pixel size of the GFPlain250. Satellite imagery sourced from ESRI (2022).
CRL, JRC, HEG, and ED conceptualized the study, developed the formal analysis, and conducted and/or assisted the data validation. CRL wrote and edited the manuscript, while JRC and HEG reviewed and edited the manuscript. ED also developed the methodology, curated the data, conducted the formal spatial analysis, validated the data, visualized the data, and reviewed and edited the manuscript. QW and AR assisted in methodology development, validated the study outputs, conducted formal analyses, and reviewed and edited the manuscript.
The contact author has declared that none of the authors has any competing interests.
This paper has
been reviewed in accordance with the US Environmental Protection
Agency's peer and administrative review policies and approved for
publication. Mention of trade names or commercial products does
not constitute endorsement or recommendation for use. Statements
in this publication reflect the authors' professional views and opinions
and should not be construed to represent any determination or
policy of the US Environmental Protection Agency.
Publisher's note: Copernicus Publications remains neutral with regard to jurisdictional claims in published maps and institutional affiliations.
We greatly appreciate the scientific contributions and stimulative discussions in the papers led by Ardalan Tootchi, Sean Woznicki, Fernando Nardi, Oliver Wing, Paul Bates, and their co-authors that inspired us to complete these analyses. Jeremy Baynes and John Johnston conducted critical reviews to improve this paper, and their efforts are acknowledged.
This paper was edited by Yuanzhi Yao and reviewed by Michele Ronco and Youjiang Shen.
Adame, M. F., Arthington, A. H., Waltham, N., Hasan, S., Selles, A., and Ronan, M.: Managing threats and restoring wetlands within catchments of the Great Barrier Reef, Australia, Aquat. Conserv., 29, 829–839, https://doi.org/10.1002/aqc.3096, 2019.
Alfieri, L., Salamon, P., Bianchi, A., Neal, J., Bates, P., and Feyen, L.: Advances in pan-European flood hazard mapping, Hydrol. Process., 28, 4067–4077, https://doi.org/10.1002/hyp.9947, 2014.
Ameli, A. A. and Creed, I. F.: Does Wetland Location Matter When Managing Wetlands for Watershed-Scale Flood and Drought Resilience?, J. Ame. Water Resour. Assoc., 55, 529–542, https://doi.org/10.1111/1752-1688.12737, 2019.
Aronica, G., Bates, P. D., and Horritt, M. S.: Assessing the uncertainty in distributed model predictions using observed binary pattern information within GLUE, Hydrol. Process., 16, 2001–2016, https://doi.org/10.1002/hyp.398, 2002.
Badiou, P., Page, B., and Akinremi, W.: Phosphorus Retention in Intact and Drained Prairie Wetland Basins: Implications for Nutrient Export, J. Environ. Qual., 47, 902–913, https://doi.org/10.2134/jeq2017.08.0336, 2018.
Bam, E. K. P., Ireson, A. M., van der Kamp, G., and Hendry, J. M.: Ephemeral Ponds: Are They the Dominant Source of Depression-Focused Groundwater Recharge?, Water Resour. Res., 56, e2019WR026640, https://doi.org/10.1029/2019WR026640, 2020.
Bates, P. D. and De Roo, A. P. J.: A simple raster-based model for flood inundation simulation, J. Hydrol., 236, 54–77, https://doi.org/10.1016/S0022-1694(00)00278-X, 2000.
Beck, H. E., Zimmermann, N. E., McVicar, T. R., Vergopolan, N., Berg, A., and Wood, E. F.: Present and future Köppen-Geiger climate classification maps at 1-km resolution, Sci. Data, 5, 180214, https://doi.org/10.1038/sdata.2018.214, 2018.
Berhane, T., Lane, C., Wu, Q., Autrey, B., Anenkhonov, O., Chepinoga, V., and Liu, H.: Decision-Tree, Rule-Based, and Random Forest Classification of High-Resolution Multispectral Imagery for Wetland Mapping and Inventory, Remote Sensing, 10, 580, https://doi.org/10.3390/rs10040580, 2018.
Biggs, J., von Fumetti, S., and Kelly-Quinn, M.: The importance of small waterbodies for biodiversity and ecosystem services: implications for policy makers, Hydrobiologia, 793, 3–39, https://doi.org/10.1007/s10750-016-3007-0, 2017.
Blanchette, M., Rousseau, A. N., Savary, S., and Foulon, É.: Are spatial distribution and aggregation of wetlands reliable indicators of stream flow mitigation?, J. Hydrol., 608, 127646, https://doi.org/10.1016/j.jhydrol.2022.127646, 2022.
Brown, C. F., Brumby, S. P., Guzder-Williams, B., Birch, T., Hyde, S. B., Mazzariello, J., Czerwinski, W., Pasquarella, V. J., Haertel, R., Ilyushchenko, S., Schwehr, K., Weisse, M., Stolle, F., Hanson, C., Guinan, O., Moore, R., and Tait, A. M.: Dynamic World, Near real-time global 10 m land use land cover mapping, Sci. Data, 9, 251, https://doi.org/10.1038/s41597-022-01307-4, 2022.
Buttle, J. M.: Mediating stream baseflow response to climate change: The role of basin storage, Hydrol. Process., 32, 363–378, https://doi.org/10.1002/hyp.11418, 2018.
Chen, J., Chen, J., Liao, A., Cao, X., Chen, L., Chen, X., He, C., Han, G., Peng, S., Lu, M., Zhang, W., Tong, X., and Mills, J.: Global land cover mapping at 30 m resolution: A POK-based operational approach, ISPRS J. Photogramm., 103, 7–27, https://doi.org/10.1016/j.isprsjprs.2014.09.002, 2015.
Chen, W., Thorslund, J., Nover, D. M., Rains, M. C., Li, X., Xu, B., He, B., Su, H., Yen, H., Liu, L., Yuan, H., Jarsjö, J., and Viers, J. H.: A typological framework of non-floodplain wetlands for global collaborative research and sustainable use, Environ. Res. Lett., 17, 113002, https://doi.org/10.1088/1748-9326/ac9850, 2022.
Cheng, F. Y. and Basu, N. B.: Biogeochemical hotspots: Role of small water bodies in landscape nutrient processing, Water Resour. Res., 53, 5038–5056, https://doi.org/10.1002/2016WR020102, 2017.
Cheng, F. Y., Van Meter, K. J., Byrnes, D. K., and Basu, N. B.: Maximizing US nitrate removal through wetland protection and restoration, Nature, 588, 625–630, https://doi.org/10.1038/s41586-020-03042-5, 2020.
Christensen, J. R., Golden, H. E., Alexander, L. C., Pickard, B. R., Fritz, K. M., Lane, C. R., Weber, M. H., Kwok, R. M., and Keefer, M. N.: Headwater streams and inland wetlands: Status and advancements of geospatial datasets and maps across the United States, Earth-Sci. Rev., 235, 104230, https://doi.org/10.1016/j.earscirev.2022.104230, 2022.
Cohen, M. J., Creed, I. F., Alexander, L., Basu, N. B., Calhoun, A. J. K., Craft, C., D'Amico, E., DeKeyser, E., Fowler, L., Golden, H. E., Jawitz, J. W., Kalla, P., Kirkman, L. K., Lane, C. R., Lang, M., Leibowitz, S. G., Lewis, D. B., Marton, J., McLaughlin, D. L., Mushet, D. M., Raanan-Kiperwas, H., Rains, M. C., Smith, L., and Walls, S. C.: Do geographically isolated wetlands influence landscape functions?, P. Natl. Acad. Sci. USA, 113, 1978–1986, https://doi.org/10.1073/pnas.1512650113, 2016.
Colvin, S. A. R., Sullivan, S. M. P., Shirey, P. D., Colvin, R. W., Winemiller, K. O., Hughes, R. M., Fausch, K. D., Infante, D. M., Olden, J. D., Bestgen, K. R., Danehy, R. J., and Eby, L.: Headwater Streams and Wetlands are Critical for Sustaining Fish, Fisheries, and Ecosystem Services, Fisheries, 44, 73–91, 2019.
Cowardin, L. M., Carter, V., Golet, F. C., and LaRoe, E. T.: Classification of Wetlands and Deepwater habitats of The United States, Fish and Wildlife Service, Washington DCFWS/OBS-79/31, https://www.fws.gov/wetlands/documents/classification-of-wetlands-and-deepwater-habitats-of-the-united-states.pdf (last access: 5 July 2023), 1979.
Creed, I. F., Lane, C. R., Serran, J. N., Alexander, L. C., Basu, N. B., Calhoun, A. J. K., Christensen, J. R., Cohen, M. J., Craft, C., D'Amico, E., DeKeyser, E., Fowler, L., Golden, H. E., Jawitz, J. W., Kalla, P., Kirkman, L. K., Lang, M., Leibowitz, S. G., Lewis, D. B., Marton, J., McLaughlin, D. L., Raanan-Kiperwas, H., Rains, M. C., Rains, K. C., and Smith, L.: Enhancing protection for vulnerable waters, Nat. Geosci., 10, 809–815, https://doi.org/10.1038/ngeo3041, 2017.
Cunha, D. G. F., Magri, R. A. F., Tromboni, F., Ranieri, V. E. L., Fendrich, A. N., Campanhão, L. M. B., Riveros, E. V., and Velázquez, J. A.: Landscape patterns influence nutrient concentrations in aquatic systems: citizen science data from Brazil and Mexico, Freshwater Sci., 38, 365–378, https://doi.org/10.1086/703396, 2019.
Dahl, T. E.: Wetlands – Losses in the United States, 1780's to 1980's, U.S. Department of Interior, Fish and Wildlife Service Washington DC, https://www.fws.gov/wetlands/documents/wetlands-losses-in-the-united-states-1780s-to-1980s.pdf (last access: 5 July 2023), 1990.
Davidson, N. C.: How much wetland has the world lost? Long-term and recent trends in global wetland area, Mar. Freshwater Res., 65, 934–941, https://doi.org/10.1071/MF14173, 2014.
Davidson, N. C., Fluet-Chouinard, E., and Finlayson, C. M.: Global extent and distribution of wetlands: trends and issues, Mar. Freshwater Res., 69, 620–627, 2018.
De Groot, R., Stuip, M., Finlayson, M., and Davidson, N.: Valuing Wetlands: Guidance for Valuing the Benefits Derived from Wetland Ecosystem Services, Ramsar Convention Secretariat, Gland, Switzerland and Secretariat of the Convention on Biological Diversity, Montreal, Canada, Gland, SwitzerlandRamsar Technical Report No. 3/CBD Technical Series No. 27, 2006.
DeVries, B., Huang, C., Lang, M., Jones, J., Huang, W., Creed, I., and Carroll, M.: Automated Quantification of Surface Water Inundation in Wetlands Using Optical Satellite Imagery, Remote Sens., 9, 807, https://doi.org/10.3390/rs9080807, 2017.
Dewitz, J.: National Land Cover Database (NLCD) 2016 Products: U.S. Geological Survey data [data set], https://doi.org/10.5066/P96HHBIE, 2019.
Dottori, F., Salamon, P., Bianchi, A., Alfieri, L., Hirpa, F. A., and Feyen, L.: Development and evaluation of a framework for global flood hazard mapping, Adv. Water Resour., 94, 87–102, https://doi.org/10.1016/j.advwatres.2016.05.002, 2016.
Drenkhan, F., Buytaert, W., Mackay, J. D., Barrand, N. E., Hannah, D. M., and Huggel, C.: Looking beyond glaciers to understand mountain water security, Nat. Sustain., 6, 130–138, https://doi.org/10.1038/s41893-022-00996-4, 2023.
ESA: Worldwide Land Cover Mapping, ESA [data set] https://esa-worldcover.org/en, last access: 22 Deccember 2022a.
ESRI: World Terrain Base, https://www.arcgis.com/home/item.html?id=be2e229ffc864c868a78f5ca68ca5b8e, last access: 22 December 2022.
Evenson, G. R., Golden, H. E., Lane, C. R., McLaughlin, D. L., and D'Amico, E.: Depressional Wetlands Affect Watershed Hydrological, Biogeochemical, and Ecological Functions, Ecol. Appl., 28, 953–966, https://doi.org/10.1002/eap.1701, 2018a.
Evenson, G. R., Jones, C. N., McLaughlin, D. L., Golden, H. E., Lane, C. R., DeVries, B., Alexander, L. C., Lang, M. W., McCarty, G. W., and Sharifi, A.: A watershed-scale model for depressional wetland-rich landscapes, J. Hydrol., 1, 100002, https://doi.org/10.1016/j.hydroa.2018.10.002, 2018b.
Evenson, G. R., Golden, H. E., Christensen, J. R., Lane, C. R., Rajib, A., D'Amico, E., Mahoney, D. T., White, E., and Wu, Q.: Wetland restoration yields dynamic nitrate responses across the Upper Mississippi river basin, Environ. Res. Commun., 3, 095002, https://doi.org/10.1088/2515-7620/ac2125, 2021.
Fan, Y., Li, H., and Miguez-Macho, G.: Global Patterns of Groundwater Table Depth, Science, 339, 940–943, https://doi.org/10.1126/science.1229881, 2013.
Fewtrell, T. J., Bates, P. D., Horritt, M., and Hunter, N. M.: Evaluating the effect of scale in flood inundation modelling in urban environments, Hydrol. Process., 22, 5107–5118, https://doi.org/10.1002/hyp.7148, 2008.
Fluet-Chouinard, E., Lehner, B., Rebelo, L.-M., Papa, F., and Hamilton, S. K.: Development of a global inundation map at high spatial resolution from topographic downscaling of coarse-scale remote sensing data, Remote Sens. Environ., 158, 348–361, https://doi.org/10.1016/j.rse.2014.10.015, 2015.
Fluet-Chouinard, E., Stocker, B. D., Zhang, Z., Malhotra, A., Melton, J. R., Poulter, B., Kaplan, J. O., Goldewijk, K. K., Siebert, S., Minayeva, T., Hugelius, G., Joosten, H., Barthelmes, A., Prigent, C., Aires, F., Hoyt, Davidson, A. M. N., Finlayson, C. M., Lehner, B., Jackson, R. B., and McIntyre, P. B.: Extensive global wetland loss over the past three centuries, Nature, 614, 281–286, 2023.
Fossey, M. and Rousseau, A. N.: Can isolated and riparian wetlands mitigate the impact of climate change on watershed hydrology? A case study approach, J. Environ. Manage., 184, 327–339, https://doi.org/10.1016/j.jenvman.2016.09.043, 2016.
Gardner, R.: What the US Supreme Court decision means for wetlands, Nature, 618, 215, 10.1038/d41586-023-01827-y, 2023.
Golden, H. E., Sander, H. A., Lane, C. R., Zhao, C., Price, K., D'Amico, E., and Christensen, J. R.: Relative effects of geographically isolated wetlands on streamflow: a watershed-scale analysis, Ecohydrol., 9, 21–38, https://doi.org/10.1002/eco.1608, 2016.
Golden, H. E., Creed, I. F., Ali, G., Basu, N. B., Neff, B. P., Rains, M. C., McLaughlin, D. L., Alexander, L. C., Ameli, A. A., Christensen, J. R., Evenson, G. R., Jones, C. N., Lane, C. R., and Lang, M.: Integrating geographically isolated wetlands into land management decisions, Front. Ecol. Environ., 15, 319–327, https://doi.org/10.1002/fee.1504, 2017.
Golden, H. E., Rajib, A., Lane, C. R., Christensen, J. R., Wu, Q., and Mengistu, S.: Non-floodplain Wetlands Affect Watershed Nutrient Dynamics: A Critical Review, Environ. Sci. Technol., 53, 7203–7214, https://doi.org/10.1021/acs.est.8b07270, 2019.
Golden, H. E., Lane, C. R., Rajib, A., and Wu, Q.: Improving global flood and drought predictions: integrating non-floodplain wetlands into watershed hydrologic models, Environ. Res. Lett., 16, 091002, https://doi.org/10.1088/1748-9326/ac1fbc, 2021.
Gumbricht, T., Roman-Cuesta, R. M., Verchot, L., Herold, M., Wittmann, F., Householder, E., Herold, N., and Murdiyarso, D.: An expert system model for mapping tropical wetlands and peatlands reveals South America as the largest contributor, Glob. Change Biol., 23, 3581–3599, https://doi.org/10.1111/gcb.13689, 2017.
Hamunyela, E., Hipondoka, M., Persendt, F., Sevelia Nghiyalwa, H., Thomas, C., and Matengu, K.: Spatio-temporal characterization of surface water dynamics with Landsat in endorheic Cuvelai-Etosha Basin (1990–2021), ISPRS J. Photogramm., 191, 68–84, https://doi.org/10.1016/j.isprsjprs.2022.07.007, 2022.
Herold, M., Groenestijn, A. V., Kooistra, L., Kalogirou, V., and Arino, O.: Land Cover CCI, Product User Guide Version 2.0, https://maps.elie.ucl.ac.be/CCI/viewer/download/ESACCI-LC-Ph2-PUGv2_2.0.pdf (last access: May 2022), 2015.
Hoch, J. M. and Trigg, M. A.: Advancing global flood hazard simulations by improving comparability, benchmarking, and integration of global flood models, Environ. Res. Lett., 14, 034001, https://doi.org/10.1088/1748-9326/aaf3d3, 2019.
Homer, C., Dewitz, J., Jin, S., Xian, G., Costello, C., Danielson, P., Gass, L., Funk, M., Wickham, J., Stehman, S., Auch, R., and Riitters, K.: Conterminous United States land cover change patterns 2001–2016 from the 2016 National Land Cover Database, ISPRS J. Photogramm., 162, 184–199, https://doi.org/10.1016/j.isprsjprs.2020.02.019, 2020.
Horritt, M. S. and Bates, P. D.: Evaluation of 1D and 2D numerical models for predicting river flood inundation, J. Hydrol., 268, 87–99, https://doi.org/10.1016/S0022-1694 (02)00121-X, 2002.
Hu, S., Niu, Z., and Chen, Y.: Global Wetland Datasets: a Review, Wetlands, 37, 807–817, https://doi.org/10.1007/s13157-017-0927-z, 2017a.
Hu, S., Niu, Z., Chen, Y., Li, L., and Zhang, H.: Global wetlands: Potential distribution, wetland loss, and status, Sci. Total Environ., 586, 319–327, https://doi.org/10.1016/j.scitotenv.2017.02.001, 2017b.
Huang, W., DeVries, B., Huang, C., Lang, M., Jones, J., Creed, I., and Carroll, M.: Automated Extraction of Surface Water Extent from Sentinel-1 Data, Remote Sens., 10, 797, https://doi.org/10.3390/rs10050797, 2018.
IPCC: Intergovernmental Panel on Climate Change 2014: Impacts, adaptation, and vulnerability, Cambridge University Press, Cambridge, U.K., ISBN 978-1-107-05807-1, 2014.
Jafarzadegan, K., Merwade, V., and Saksena, S.: A geomorphic approach to 100-year floodplain mapping for the Conterminous United States, J. Hydrol., 561, 43–58, https://doi.org/10.1016/j.jhydrol.2018.03.061, 2018.
Jakubínský, J., Prokopová, M., Raška, P., Salvati, L., Bezak, N., Cudlín, O., Cudlín, P., Purkyt, J., Vezza, P., Camporeale, C., Danìk, J., Pástor, M., and Lepeška, T.: Managing floodplains using nature-based solutions to support multiple ecosystem functions and services, WIREs Water, 8, e1545, https://doi.org/10.1002/wat2.1545, 2021.
Jin, S., Homer, C., Yang, L., Danielson, P., Dewitz, J., Li, C., Zhu, Z., Xian, G., and Howard, D.: Overall Methodology Design for the United States National Land Cover Database 2016 Products, Remote Sens., 11, 2971, https://doi.org/10.3390/rs11242971, 2019.
Jones, C. N., Evenson, G. R., McLaughlin, D. L., Vanderhoof, M. K., Lang, M. W., McCarty, G. W., Golden, H. E., Lane, C. R., and Alexander, L. C.: Estimating restorable wetland water storage at landscape scales, Hydrol. Process., 32, 305–313, https://doi.org/10.1002/hyp.11405, 2018.
Karra, K., Kontgis, C., Statman-Weil, Z., Mazzariello, J. C., Mathis, M., and Brumby, S. P. Global land use/land cover with Sentinel 2 and deep learning, in: 2021 IEEE International Geoscience and Remote Sensing Symposium IGARSS, IEEE, 4704–4707, doi.org/10.1109/IGARSS47720.2021.9553499, 2021.
Kam, S. P.: Valuing the role of living aquatic resources to rural livelihoods in multiple-use, seasonally-inundated wetlands in the Yellow River Basin of China, for improved governance, CGIAR Challenge Program on Water & Food, Colombo, Sri Lanka, https://hdl.handle.net/10568/3859 (last access: 24 May 2023), 2010.
Kremenetski, K. V., Velichko, A. A., Borisova, O. K., MacDonald, G. M., Smith, L. C., Frey, K. E., and Orlova, L. A.: Peatlands of the Western Siberian lowlands: current knowledge on zonation, carbon content and Late Quaternary history, Quaternary Sci. Rev., 22, 703–723, 2003.
Kundzewicz, Z. W., Hegger, D. L. T., Matczak, P., and Driessen, P. P. J.: Opinion: Flood-risk reduction: Structural measures and diverse strategies, P. Natl. Acad. Sci. USA, 115, 12321–12325, https://doi.org/10.1073/pnas.1818227115, 2018.
Lane, C. R. and D'Amico, E.: Identification of Putative Geographically Isolated Wetlands of the Conterminous United States, JAWRA J. Am. Water Resour. As., 52, 705–722, https://doi.org/10.1111/1752-1688.12421, 2016.
Lane, C. R., Leibowitz, S. G., Autrey, B. C., LeDuc, S. D., and Alexander, L. C.: Hydrological, Physical, and Chemical Functions and Connectivity of Non-Floodplain Wetlands to Downstream Waters: A Review, J. Am. Water Resour. As., 54, 346–371, https://doi.org/10.1111/1752-1688.12633, 2018.
Lane, C. R., D'Amico, E., Christensen, J. R., Golden, H. E., Wu, Q., and Rajib, A.: Global non-floodplain wetlands, U.S. EPA Office of Research and Development [data set], https://gaftp.epa.gov/EPADataCommons/ORD/Global_NonFloodplain_Wetlands/ (last access: 24 May 2023) and https://doi.org/10.23719/1528331, 2023a.
Lane, C. R., Creed, I. F., Golden, H. E., Leibowitz, S. G., Mushet, D. M., Rains, M. C., Wu, Q., D'Amico, E., Alexander, L. C., Ali, G. A., Basu, N. B., Bennett, M. G., Christensen, J. R., Cohen, M. J., Covino, T. P., DeVries, B., Hill, R. A., Jencso, K., Lang, M. W., McLaughlin, D. L., Rosenberry, D. O., Rover, J., and Vanderhoof, M. K.: Vulnerable Waters are Essential to Watershed Resilience, Ecosystems, 26, 1–28, https://doi.org/10.1007/s10021-021-00737-2, 2023b.
Lehner, B. and Doll, P.: Development and validation of a global database of lakes, reservoirs and wetlands, J. Hydrol., 296, 1–22, 2004.
Lehner, B. and Grill, G.: Global river hydrography and network routing: baseline data and new approaches to study the world's large river systems, Hydrol. Process., 27, 2171–2186, https://doi.org/10.1002/hyp.9740, 2013.
Leibowitz, S.: Geographically Isolated Wetlands: Why We Should Keep the Term, Wetlands, 35, 997–1003, https://doi.org/10.1007/s13157-015-0691-x, 2015.
Leibowitz, S. G.: Isolated wetlands and their functions: an ecological perspective, Wetlands, 22, 517–531, 2003.
Leibowitz, S. G., Hill, R. A., Creed, I. F., Compton, J. E., Golden, H. E., Weber, M. H., Rains, M. C., Jones, J., C. E., Lee, E. H., Christensen, J. R., Bellmore, R. A., and Lane, C. R.: National hydrologic connectivity classification links wetlands with stream water quality, Nature Water, 1, 370–380, https://doi.org/10.1038/s44221-023-00057-w, 2023.
Liu, D., Cao, C., Chen, W., Ni, X., Tian, R., and Xing, X.: Monitoring and predicting the degradation of a semi-arid wetland due to climate change and water abstraction in the Ordos Larus relictus National Nature Reserve, China, Geomat. Nat. Haz. Risk, 8, 367–383, https://doi.org/10.1080/19475705.2016.1220024, 2017.
Makungu, E. and Hughes, D. A.: Understanding and modelling the effects of wetland on the hydrology and water resources of large African river basins, J. Hydrol., 603, 127039, https://doi.org/10.1016/j.jhydrol.2021.127039, 2021.
Martinis, S., Groth, S., Wieland, M., Knopp, L., and Rättich, M.: Towards a global seasonal and permanent reference water product from Sentinel-1/2 data for improved flood mapping, Remote Sens. Environ., 278, 113077, https://doi.org/10.1016/j.rse.2022.113077, 2022.
Marton, J. M., Creed, I. F., Lewis, D., Lane, C. R., Basu, N., Cohen, M. J., and Craft, C.: Geographically isolated wetlands are important biogeochemical reactors on the landscape, BioScience, 65, 408–418, https://doi.org/10.1093/biosci/biv009, 2015.
McCauley, L. A., Anteau, M. J., van der Burg, M. P., and Wiltermuth, M. T.: Land use and wetland drainage affect water levels and dynamics of remaining wetlands, Ecosphere, 6, art92, https://doi.org/10.1890/ES14-00494.1, 2015.
McKenna, O. P., Mushet, D. M., Rosenberry, D. O., and LaBaugh, J. W.: Evidence for a climate-induced ecohydrological state shift in wetland ecosystems of the southern Prairie Pothole Region, Climatic Change, 145, 273–287, https://doi.org/10.1007/s10584-017-2097-7, 2017.
McLaughlin, D. L., Kaplan;, D. A., and Cohen, M. J.: A significant nexus: Geographically isolated wetlands influence landscape hydrology, Water Resour. Res., 50, 7153–7166, https://doi.org/10.1002/2013WR015002, 2014.
Merken, R., Deboelpaep, E., Teunen, J., Saura, S., and Koedam, N.: Wetland Suitability and Connectivity for Trans-Saharan Migratory Waterbirds, PLOS ONE, 10, e0135445, https://doi.org/10.1371/journal.pone.0135445, 2015.
Messager, M. L., Lehner, B., Grill, G., Nedeva, I., and Schmitt, O.: Estimating the volume and age of water stored in global lakes using a geo-statistical approach, Nat. Commun., 7, 13603, https://doi.org/10.1038/ncomms13603, 2016.
Millennial Ecosystem Assessment: Ecosystems and Human Well-Being: Wetlands and Water Synthesis, World Resources Institute, Washington, D.C., ISBN 1-56973-597-2, 2005.
Mudashiru, R. B., Sabtu, N., Abustan, I., and Balogun, W.: Flood hazard mapping methods: A review, J. Hydrol., 603, 126846, https://doi.org/10.1016/j.jhydrol.2021.126846, 2021.
Mushet, D., Calhoun, A., Alexander, L., Cohen, M., DeKeyser, E., Fowler, L., Lane, C., Lang, M., Rains, M., and Walls, S.: Geographically Isolated Wetlands: Rethinking a Misnomer, Wetlands, 35, 423–431, https://doi.org/10.1007/s13157-015-0631-9, 2015.
Mushet, D. M., Alexander, L. C., Bennett, M., Schofield, K., Christensen, J. R., Ali, G., Pollard, A., Fritz, K., and Lang, M. W.: Differing Modes of Biotic Connectivity within Freshwater Ecosystem Mosaics, J. Am. Water Resour. As., 55, 307–317, https://doi.org/10.1111/1752-1688.12683, 2019.
Nardi, F., Annis, A., Di Baldassarre, G., Vivoni, E. R., and Grimaldi, S.: GFPLAIN250m, a global high-resolution dataset of Earth's floodplains, Sci. Data, 6, 180309, https://doi.org/10.1038/sdata.2018.309, 2019.
National Landcover Database (NLCD): 2019 NLCD Land Cover (CONUS), National Landcover Database (NLCD) [data set], https://www.mrlc.gov/data, last access: 22 December 2022.
Nitzsche, K. N., Kalettka, T., Premke, K., Lischeid, G., Gessler, A., and Kayler, Z. E.: Land-use and hydroperiod affect kettle hole sediment carbon and nitrogen biogeochemistry, Sci. Total Environ., 574, 46–56, https://doi.org/10.1016/j.scitotenv.2016.09.003, 2017.
Olefeldt, D., Hovemyr, M., Kuhn, M. A., Bastviken, D., Bohn, T. J., Connolly, J., Crill, P., Euskirchen, E. S., Finkelstein, S. A., Genet, H., Grosse, G., Harris, L. I., Heffernan, L., Helbig, M., Hugelius, G., Hutchins, R., Juutinen, S., Lara, M. J., Malhotra, A., Manies, K., McGuire, A. D., Natali, S. M., O'Donnell, J. A., Parmentier, F.-J. W., Räsänen, A., Schädel, C., Sonnentag, O., Strack, M., Tank, S. E., Treat, C., Varner, R. K., Virtanen, T., Warren, R. K., and Watts, J. D.: The Boreal–Arctic Wetland and Lake Dataset (BAWLD), Earth Syst. Sci. Data, 13, 5127–5149, https://doi.org/10.5194/essd-13-5127-2021, 2021.
Pappenberger, F., Dutra, E., Wetterhall, F., and Cloke, H. L.: Deriving global flood hazard maps of fluvial floods through a physical model cascade, Hydrol. Earth Syst. Sci., 16, 4143–4156, https://doi.org/10.5194/hess-16-4143-2012, 2012.
Pekel, J.-F., Cottam, A., Gorelick, N., and Belward, A. S.: High-resolution mapping of global surface water and its long-term changes, Nature, 540, 418–422, https://doi.org/10.1038/nature20584, 2016.
Prigent, C., Papa, F., Aires, F., Rossow, W. B., and Matthews, E.: Global inundation dynamics inferred from multiple satellite observations, 1993–2000, J. Geophys. Res.-Atmos., 112, D12107, https://doi.org/10.1029/2006JD007847, 2007.
PRISM Climate Group: Parameter-elevation Regressions on Independent Slopes Model, PRISM Climate Group [data set], http://prism.oregonstate.edu/, last access: 22 December 2022.
Rains, M. C., Leibowitz, S. G., Cohen, M. J., Creed, I. F., Golden, H. E., Jawitz, J. W., Kalla, P., Lane, C. R., Lang, M. W., and McLaughlin, D. L.: Geographically isolated wetlands are part of the hydrological landscape, Hydrol. Process., 30, 153–160, https://doi.org/10.1002/hyp.10610, 2016.
Rajib, A., Golden, H. E., Lane, C. R., and Wu, Q.: Surface depression and wetland water storage improves major river basin hydrologic predictions, Water Resour. Res., 56, e2019WR026561, https://doi.org/10.1029/2019WR026561, 2020.
Rajib, A., Zheng, Q., Golden, H. E., Wu, Q., Lane, C. R., Christensen, J. R., Morrison, R. R., Annis, A., and Nardi, F.: The changing face of floodplains in the Mississippi River Basin detected by a 60-year land use change dataset, Sci. Data, 8, 271, https://doi.org/10.1038/s41597-021-01048-w, 2021.
Robarts, R., Zhulidov, A., and Pavlov, D.: The State of knowledge about wetlands and their future under aspects of global climate change: the situation in Russia, Aquat. Sci., 75, 27–38, https://doi.org/10.1007/s00027-011-0230-7, 2013.
Rodrigues, L. N., Sano, E. E., Steenhuis, T. S., and Passo, D. P.: Estimation of Small Reservoir Storage Capacities with Remote Sensing in the Brazilian Savannah Region, Water Resour. Manage., 26, 873–882, https://doi.org/10.1007/s11269-011-9941-8, 2012.
Rodríguez-Rodríguez, M., Aguilera, H., Guardiola-Albert, C., and Fernández-Ayuso, A.: Climate Influence Vs. Local Drivers in Surface Water-Groundwater Interactions in Eight Ponds of Doñana National Park (Southern Spain), Wetlands, 41, 25, https://doi.org/10.1007/s13157-021-01425-6, 2021.
Rudari, R., Silvestro, F., Campo, L., Rebora, N., Boni, G., and Herold, C.: Improvement of the global flood model for the GAR 2015, United Nations Office for Disaster Risk Reduction (UNISDR), Centro Internazionale in Monitoraggio Ambientale (CIMA), UNEP GRID-Arendal (GRID-Arendal): Geneva, Switzerland, 69, https://www.undrr.org/publication/improvement-global-food-model-gar-2015 (last access: 5 July 2023), 2015.
Sampson, C. C., Smith, A. M., Bates, P. D., Neal, J. C., Alfieri, L., and Freer, J. E.: A high-resolution global flood hazard model, Water Resour. Res., 51, 7358–7381, https://doi.org/10.1002/2015WR016954, 2015.
Samways, M. J., Deacon, C., Kietzka, G. J., Pryke, J. S., Vorster, C., and Simaika, J. P.: Value of artificial ponds for aquatic insects in drought-prone southern Africa: a review, Biodivers. Conserv., 29, 3131–3150, https://doi.org/10.1007/s10531-020-02020-7, 2020.
Sangwan, N. and Merwade, V.: A Faster and Economical Approach to Floodplain Mapping Using Soil Information, J. Am. Water Resour. As., 51, 1286–1304, https://doi.org/10.1111/1752-1688.12306, 2015.
Schofield, K. A., Alexander, L. C., Ridley, C. E., Vanderhoof, M. K., Fritz, K. M., Autrey, B. C., DeMeester, J. E., Kepner, W. G., Lane, C. R., Leibowitz, S. G., and Pollard, A. I.: Biota Connect Aquatic Habitats throughout Freshwater Ecosystem Mosaics, J. Am. Water Resour. As., 54, 372–399, https://doi.org/10.1111/1752-1688.12634, 2018.
Serran, J. N., Creed, I. F., Ameli, A. A., and Aldred, D. A.: Estimating rates of wetland loss using power-law functions, Wetlands, 38, 109–120, https://doi.org/10.1007/s13157-017-0960-y, 2017.
Shaw, D. A., Vanderkamp, G., Conly, F. M., Pietroniro, A., and Martz, L.: The Fill–Spill Hydrology of Prairie Wetland Complexes during Drought and Deluge, Hydrol. Process., 26, 3147–3156, https://doi.org/10.1002/hyp.8390, 2012.
Smith, L. L., Subalusky, A. L., Atkinson, C. L., Earl, J. E., Mushet, D. M., Scott, D. E., Lance, S. L., and Johnson, S. A.: Biological Connectivity of Seasonally Ponded Wetlands across Spatial and Temporal Scales, J. Am. Water Resour. As., 55, 334–353, https://doi.org/10.1111/1752-1688.12682, 2019.
Strahler, A. N.: Quantitative analysis of watershed geomorphology, American Geophysical Union Transactions, 38, 913–920, 1957.
Sullivan, S. M. P., Rains, M. C., and Rodewald, A. D.: Opinion: The proposed change to the definition of “waters of the United States” flouts sound science, P. Natl. Acad. Sci. USA, 116, 11558, https://doi.org/10.1073/pnas.1907489116, 2019.
Tayefi, V., Lane, S. N., Hardy, R. J., and Yu, D.: A comparison of one- and two-dimensional approaches to modelling flood inundation over complex upland floodplains, Hydrol. Process., 21, 3190–3202, https://doi.org/10.1002/hyp.6523, 2007.
Tootchi, A., Jost, A., and Ducharne, A.: Multi-source global wetland maps combining surface water imagery and groundwater constraints, Earth Syst. Sci. Data, 11, 189–220, https://doi.org/10.5194/essd-11-189-2019, 2019.
Tsendbazar, N., Herold, M., Li, L., Tarko, A., de Bruin, S., Masiliunas, D., Lesiv, M., Fritz, S., Buchhorn, M., Smets, B., Van De Kerchove, R., and Duerauer, M.: Towards operational validation of annual global land cover maps, Remote Sens. Environ., 266, 112686, https://doi.org/10.1016/j.rse.2021.112686, 2021.
Tullos, D.: Opinion: How to achieve better flood-risk governance in the United States, P. Natl. Acad. Sci. USA, 115, 3731–3734, https://doi.org/10.1073/pnas.1722412115, 2018.
Uden, D. R., Allen, C. R., Bishop, A. A., Grosse, R., Jorgensen, C. F., LaGrange, T. G., Stutheit, R. G., and Vrtiska, M. P.: Predictions of future ephemeral springtime waterbird stopover habitat availability under global change, Ecosphere, 6, 1–26, https://doi.org/10.1890/ES15-00256.1, 2015.
United States Geological Survey (USGS): Watershed Boundary Dataset, United States Geological Survey (USGS) [data set], https://www.usgs.gov/national-hydrography/access-national-hydrography-products, last access: 22 December 2022a.
United States Geological Survey (USGS): National Elevation Dataset, United States Geological Survey (USGS) [data set], https://www.usgs.gov/3d-elevation-program, last access: 22 December 2022b.
US Fish and Wildlife Service: National Wetlands Inventory, US Fish and Wildlife Service [data set], https://www.fws.gov/program/national-wetlands-inventory/data-download (last access: 24 May 2023), various dates.
Van Meter, K. J. and Basu, N. B.: Signatures of human impact: size distributions and spatial organization of wetlands in the Prairie Pothole landscape, Ecol. Appl., 25, 451–465, https://doi.org/10.1890/14-0662.1, 2015.
Van Meter, K. J., Basu, N. B., Tate, E., and Wyckoff, J.: Monsoon Harvests: The Living Legacies of Rainwater Harvesting Systems in South India, Environ. Sci. Technol., 48, 4217–4225, https://doi.org/10.1021/es4040182, 2014.
Vanderhoof, M. K. and Lane, C. R.: The potential role of very high-resolution imagery to characterise lake, wetland and stream systems across the Prairie Pothole Region, United States, Int. J. Remote Sens., 40, 5768–5798, https://doi.org/10.1080/01431161.2019.1582112, 2019.
Wania, R., Melton, J. R., Hodson, E. L., Poulter, B., Ringeval, B., Spahni, R., Bohn, T., Avis, C. A., Chen, G., Eliseev, A. V., Hopcroft, P. O., Riley, W. J., Subin, Z. M., Tian, H., van Bodegom, P. M., Kleinen, T., Yu, Z. C., Singarayer, J. S., Zürcher, S., Lettenmaier, D. P., Beerling, D. J., Denisov, S. N., Prigent, C., Papa, F., and Kaplan, J. O.: Present state of global wetland extent and wetland methane modelling: methodology of a model inter-comparison project (WETCHIMP), Geosci. Model Dev., 6, 617–641, https://doi.org/10.5194/gmd-6-617-2013, 2013.
Werner, M. G. F., Hunter, N. M., and Bates, P. D.: Identifiability of distributed floodplain roughness values in flood extent estimation, J. Hydrol., 314, 139–157, https://doi.org/10.1016/j.jhydrol.2005.03.012, 2005.
Wickham, J., Stehman, S. V., Sorenson, D. G., Gass, L., and Dewitz, J. A.: Thematic accuracy assessment of the NLCD 2016 land cover for the conterminous United States, Remote Sens. Environ., 257, 112357, https://doi.org/10.1016/j.rse.2021.112357, 2021.
Wing, O. E. J., Bates, P. D., Sampson, C. C., Smith, A. M., Johnson, K. A., and Erickson, T. A.: Validation of a 30 m resolution flood hazard model of the conterminous United States, Water Resour. Res., 53, 7968–7986, https://doi.org/10.1002/2017WR020917, 2017.
Winsemius, H. C., Van Beek, L. P. H., Jongman, B., Ward, P. J., and Bouwman, A.: A framework for global river flood risk assessments, Hydrol. Earth Syst. Sci., 17, 1871–1892, https://doi.org/10.5194/hess-17-1871-2013, 2013.
Winter, T. C.: The Vulnerability of Wetlands to Climate Change: A Hydrologic Landscape Perspective, J. Am. Water Resour. As., 36, 305–311, https://doi.org/10.1111/j.1752-1688.2000.tb04269.x, 2000.
Winter, T. C., Harvey, J. W., Franke, O. L., and Alley, W. M.: Ground Water and Surface Water: A Single Resoure, U.S. Government Printing Office, Washington, DC, https://doi.org/10.3133/cir1139, 1998.
Woznicki, S. A., Baynes, J., Panlasigui, S., Mehaffey, M., and Neale, A.: Development of a spatially complete floodplain map of the conterminous United States using random forest, Sci. Total Environ., 647, 942–953, https://doi.org/10.1016/j.scitotenv.2018.07.353, 2019.
Wu, Q., Lane, C. R., Wang, L., Vanderhoof, M. K., Christensen, J. R., and Liu, H.: Efficient Delineation of Nested Depression Hierarchy in Digital Elevation Models for Hydrological Analysis Using Level-Set Method, J. Am. Water Resour. As., 55, 354–368, https://doi.org/10.1111/1752-1688.12689, 2019a.
Wu, Q., Lane, C. R., Li, X., Zhao, K., Zhou, Y., Clinton, N., DeVries, B., Golden, H. E., and Lang, M. W.: Integrating LiDAR data and multi-temporal aerial imagery to map wetland inundation dynamics using Google Earth Engine, Remote Sens. Environ., 228, 1–13, https://doi.org/10.1016/j.rse.2019.04.015, 2019b.
Xi, Y., Peng, S., Ducharne, A., Ciais, P., Gumbricht, T., Jimenez, C., Poulter, B., Prigent, C., Qiu, C., Saunois, M., and Zhang, Z.: Gridded maps of wetlands dynamics over mid-low latitudes for 1980–2020 based on TOPMODEL, Sci. Data, 9, 347, https://doi.org/10.1038/s41597-022-01460-w, 2022.
Yamazaki, D., Kanae, S., Kim, H., and Oki, T.: A physically based description of floodplain inundation dynamics in a global river routing model, Water Resour. Res., 47, W04501, https://doi.org/10.1029/2010WR009726, 2011.
Yamazaki, D., Ikeshima, D., Sosa, J., Bates, P. D., Allen, G., and Pavelsky, T.: MERIT Hydro: A high-resolution global hydrography map based on latest topography datasets, Water Resour. Res., 55, 5053–5073, https://doi.org/10.1029/2019wr024873, 2019.
Zanaga, D., Van De Kerchove, R., De Keersmaecker, W., Souverijns, N., Brockmann, C., Quast, R., Wevers, J., Grosu, A., Paccini, A., Vergnaud, S., Cartus, O., Santoro, M., Fritz, S., Georgieva, I., Lesiv, M., Carter, S., Herold, M., Li, Linlin, Tsendbazar, N. E., Ramoino, F., and Arino, O.: ESA WorldCover 10 m 2020 v100, Zenodo [data set], https://doi.org/10.5281/zenodo.5571936, 2021.
Zedler, J. B. and Kercher, S.: Causes and consequences of invasive plants in wetlands: Opportunities, opportunists, and outcomes, CRC CR Rev. Plant Sci., 23, 431–452, 2004.
Zhang, X., Liu, L., Zhao, T., Chen, X., Lin, S., Wang, J., Mi, J., and Liu, W.: GWL_FCS30: a global 30 m wetland map with a fine classification system using multi-sourced and time-series remote sensing imagery in 2020, Earth Syst. Sci. Data, 15, 265–293, https://doi.org/10.5194/essd-15-265-2023, 2023.
Zhao, G., Bates, P., Neal, J., and Pang, B.: Design flood estimation for global river networks based on machine learning models, Hydrol. Earth Syst. Sci., 25, 5981–5999, https://doi.org/10.5194/hess-25-5981-2021, 2021.
Zhu, Y., Xu, Y., Deng, X., Kwon, H., and Qin, Z.: Peatland Loss in Southeast Asia Contributing to U.S. Biofuel's Greenhouse Gas Emissions, Environ. Sci. Technol., 56, 13284–13293, https://doi.org/10.1021/acs.est.2c01561, 2022.
- Abstract
- Introduction
- Methodology and data
- Results
- Discussion
- Implications
- Data availability
- Global Non-Floodplain Wetlands: continuing advancements and conclusion
- Appendix A: Abbreviations
- Appendix B: Supplemental tables and figures
- Author contributions
- Competing interests
- Disclaimer
- Acknowledgements
- Review statement
- References