the Creative Commons Attribution 4.0 License.
the Creative Commons Attribution 4.0 License.
 | 11 Jul 2023
A new inventory of High Mountain Asia surging glaciers derived from multiple elevation datasets since the 1970s
Jia Li
Amaury Dehecq
Zhiwei Li
Jianjun Zhu
Glacier surging is an unusual instability of ice flow, and inventories of surging glaciers are important for regional glacier mass balance studies and glacier dynamic studies. Glacier surges in High Mountain Asia (HMA) have been widely reported. However, the completeness of available inventories of HMA surging glaciers is hampered by the insufficient spatial and temporal coverage of glacier change observations or by the limitations of the identification methods. In this study, we established a new inventory of HMA surging glaciers based on glacier surface elevation changes and morphological changes over 4 decades. Three elevation change datasets based on four elevation sources (the KH-9 DEM, NASA DEM, COP30 DEM, and HMA DEM) and long-term Landsat satellite image series were utilized to assess the presence of typical surge features over two time periods (1970s–2000 and 2000–2020). A total of 890 surging and 336 probably or possibly surging glaciers were identified in HMA. Compared to the most recent inventory of surging glaciers in HMA, our inventory incorporated 253 previously unidentified surging glaciers. The number and area of surging glaciers accounted for ∼2.49 % (excluding glaciers smaller than 0.4 km2) and ∼16.59 % of the total glacier number and glacier area in HMA, respectively. Glacier surges were found in 21 of the 22 subregions of HMA (except for the Dzhungarsky Alatau); however, the density of surging glaciers is highly uneven. Glacier surges occur frequently in the northwestern subregions (e.g., Pamir and Karakoram) but less often in the peripheral subregions. The inventory further shows that surge activity is more likely to occur for glaciers with a larger area, longer length, and wider elevation range. Among glaciers with similar areas, the surging ones usually have steeper slopes than non-surging ones. The inventory and elevation change products of identified surging glaciers are available at https://doi.org/10.5281/zenodo.7961207 (Guo et al., 2023).
- Article
(12276 KB) - Full-text XML
- BibTeX
- EndNote


A surge is a glacier instability that translates into an abnormally fast flow over a period of a few months to years (Cogley et al., 2011). A surging glacier exhibits an active phase (surge) and a quiescent phase that may occur at quasi-periodic intervals (Jiskoot, 2011). During a glacier's surging phase, a large volume of ice mass is transported downstream at a higher-than-average speed. In the quiescent phase, a glacier returns to a slow-moving state and gradually regains mass in the reservoir zone.
Previous studies pointed out that surge-type glaciers only represent ∼1 % of total glaciers (Jiskoot, 2011; Sevestre and Benn, 2015). However, glacier surges are far more than an occasional behavior in some specific regions, such as Alaska–Yukon (Clarke et al., 1986), Svalbard (Jiskoot et al., 2000; Farnsworth et al., 2016), and Karakoram–Pamir (Bhambri et al., 2017; Goerlich et al., 2020; Guillet et al., 2022). Glaciers in these regions have experienced heterogeneous mass loss in the past decades (Hugonnet et al., 2021). Understanding how glacier surge activities impact the regional mass balance requires, firstly, the identification of surging glaciers. In recent years, substantial efforts have been made to understand the mechanisms of glacier surges, including models that account for hydrological controls (Kamb, 1987; Fowler, 1987), thermal controls (Fowler et al., 2001; Murray et al., 2003), environmental factors (Hewitt, 2007; Van Wyk de Vries et al., 2022), friction state (Thøgersen et al., 2019; Beaud et al., 2021), and enthalpy (Sevestre and Benn, 2015; Benn et al., 2019). These theories require comprehensive validation by conducting detailed analysis on various glacier samples. To support related investigations, the distribution of surging glaciers is needed as a starting point.
Generally, a surging glacier exhibits one or several of the following changes: extreme increase in flow velocity (by a factor of 10–1000 compared to the usual flow of non-surging glaciers), contrasting elevation change pattern (e.g., thickening in lower reaches and thinning in upper reaches), rapid terminus advance, and surface morphological changes (deformed or looped medial moraines, intense crevassing or shearing at the margins) (Jiskoot, 2011). The identification of surging glaciers can be implemented based on the observation of these changes, e.g., by studying glacier surface morphology (Clarke et al., 1986; Paul, 2015; Farnsworth et al., 2016), terminus position (Copland et al., 2011; Vale et al., 2021), glacier motion (Quincey et al., 2011), or morphological-related indicators (e.g., normalized backscatter difference) (Leclercq et al., 2021). A surge-type glacier, which refers to a glacier that possibly surged prior to the observation period, is generally identified by indirect morphological evidence (without observed changes) (Goerlich et al., 2020). The visual interpretation of glacier surface morphological changes is less calculative but is prone to uncertainties due to the snow cover or the absence of supraglacial moraine deformation (Jacquemart and Cicoira, 2022). To recognize sudden changes in glacier motion, a long-term flow velocity time series is needed (Yasuda and Furuya, 2015; Round et al., 2017). Since the quiescent phase may last for decades and the image sources for estimating flow velocity are limited, the strong changes in glacier motion associated with the surge might be missed. In contrast, the recognition of a specific surface elevation change pattern can be a more reliable way of identifying surging glaciers as it can remain visible for many years before and after a surge (Bolch et al., 2017; Zhou et al., 2018). Besides, digital elevation models (DEMs) can satisfy the required spatio-temporal coverage with comparatively fewer datasets. By combining observations of changes in glacier surface elevation, flow velocity, and morphological features, the identification of surging glaciers could be more efficient and complete (Mukherjee et al., 2017; Goerlich et al., 2020; Guillet et al., 2022). When conducting such studies on a large spatial scale or a long temporal scale, one should select the least time-consuming but most effective identification method. In that case, datasets of elevation change covering many decades can be helpful, especially if this information is combined with other observations such as flow velocity and morphological changes (Guillet et al., 2022).
High Mountain Asia (HMA) is the most densely glacierized region in the world outside the polar regions. Within HMA, several subregions are well known for the concentration of surging glaciers, as well as the differing glacier mass balance in contrast to the common thinning in other glacierized regions (Hewitt, 2005; Gardelle et al., 2013; Farinotti et al., 2020). Inventories of surging or surge-like glaciers have been established for some subregions like the Karakoram (Bhambri et al., 2017), Western Kunlun Shan (Yasuda and Furuya, 2015), Pamir (Goerlich et al., 2020), and Tien Shan (Mukherjee et al., 2017; Zhou et al., 2021). Sevestre and Benn (2015) presented the first global inventory of surging glaciers by reanalyzing historical reports from 1861 to 2013. However, it was compiled from various data sources (publications, reports, etc.) with inconsistent spatio-temporal coverage, which makes it difficult to ensure accuracy and completeness. Vale et al. (2021) identified 137 surging glaciers across HMA by detecting surge-induced terminus changes and morphological changes from Landsat images obtained between 1987 and 2019. This number, however, is smaller than the numbers of previous subregional inventories (Bhambri et al., 2017; Goerlich et al., 2020) because not all glaciers that surge also advance. Guillet et al. (2022) presented a new surging glacier inventory of HMA by identifying multiple glacier change features. In total, 666 surging glaciers were identified across HMA. However, the glacier change observation period is shorter than 2 decades (2000–2018), and therefore some surging glaciers with relatively long repetition cycles may be missed.
In this study, we aimed to build a new inventory to include more surging glaciers within HMA based on glacier surface elevation change observations over 4 decades. A workflow was developed to obtain the historical glacier surface elevation change from multiple DEMs, including the KH-9 DEM (1970s), NASA DEM (2000), COP30 DEM (2011–2014), HMA DEM (2002–late 2016), and previously published elevation change datasets. The preliminary identified surging glaciers were divided into three classes of confidence in terms of surge detection. After that, this elevation-change-based inventory was further completed and corrected by identifying morphological changes in a time series of optical Landsat images between 1986 and 2021. Based on the present inventory, the distribution and geometric characteristics of surging glaciers within HMA were statistically analyzed in order to demonstrate their spatial heterogeneity and geometrical difference from the normal glaciers.
High Mountain Asia consists of the Qinghai–Tibet Plateau and its surrounding regions, including the Karakoram, Pamir, Himalayas, and Tien Shan. According to the updated Glacier Area Mapping for Discharge from the Asian Mountains (GAMDAM2) glacier inventory, HMA hosts 131 819 glaciers, covering a total area of ∼99 817 km2 (Sakai, 2019). The Hindu Kush Himalayan Monitoring and Assessment Programme (HiMAP) divided HMA into 22 subregions (Fig. 4) (Bolch et al., 2019). Different subregions are influenced by different climate regimes, such as the South Asia monsoon, the East Asia monsoons, and the westerlies (Bolch et al., 2012; Maussion et al., 2014). Glacier elevation changes across HMA were found to be heterogeneous in the past decades (Gardelle et al., 2013; Brun et al., 2017; Shean et al., 2020). In particular, glaciers in the Pamir–Karakoram–Western Kunlun region had changes that were slightly positive or close to zero (Hewitt, 2005; Zhou et al., 2017; Farinotti et al., 2020), while those in the Eastern Himalayas and the Nyainqentanglha and Hengduan Shan mountain ranges experienced substantial ice loss (Maurer et al., 2019).
3.1 Elevation data
The NASA DEM is mainly reprocessed from C-band SRTM (Shuttle Radar Topography Mission) data. Among the current global DEMs, the NASA DEM has the shortest source data acquisition period (∼ 11 to 22 February 2000) (Farr et al., 2007). Based on an improved production flow, the NASA DEM has a better performance than the earlier SRTM void-free product in most regions (Crippen et al., 2016). The NASA DEM serves as the reference elevation source because its acquisition time, 2000, is suitable to the division of the elevation change observations into periods before and after the beginning of the 21st century with a moderate time span (1 or 2 decades). Each tile of the product has an extent of 1∘ × 1∘ and a pixel spacing of 1 arcsec (see Fig. 1a). In total, 313 tiles were downloaded from NASA LP DAAC (https://e4ftl01.cr.usgs.gov/MEASURES/NASADEM_HGT.001/, last access: 8 September 2021).
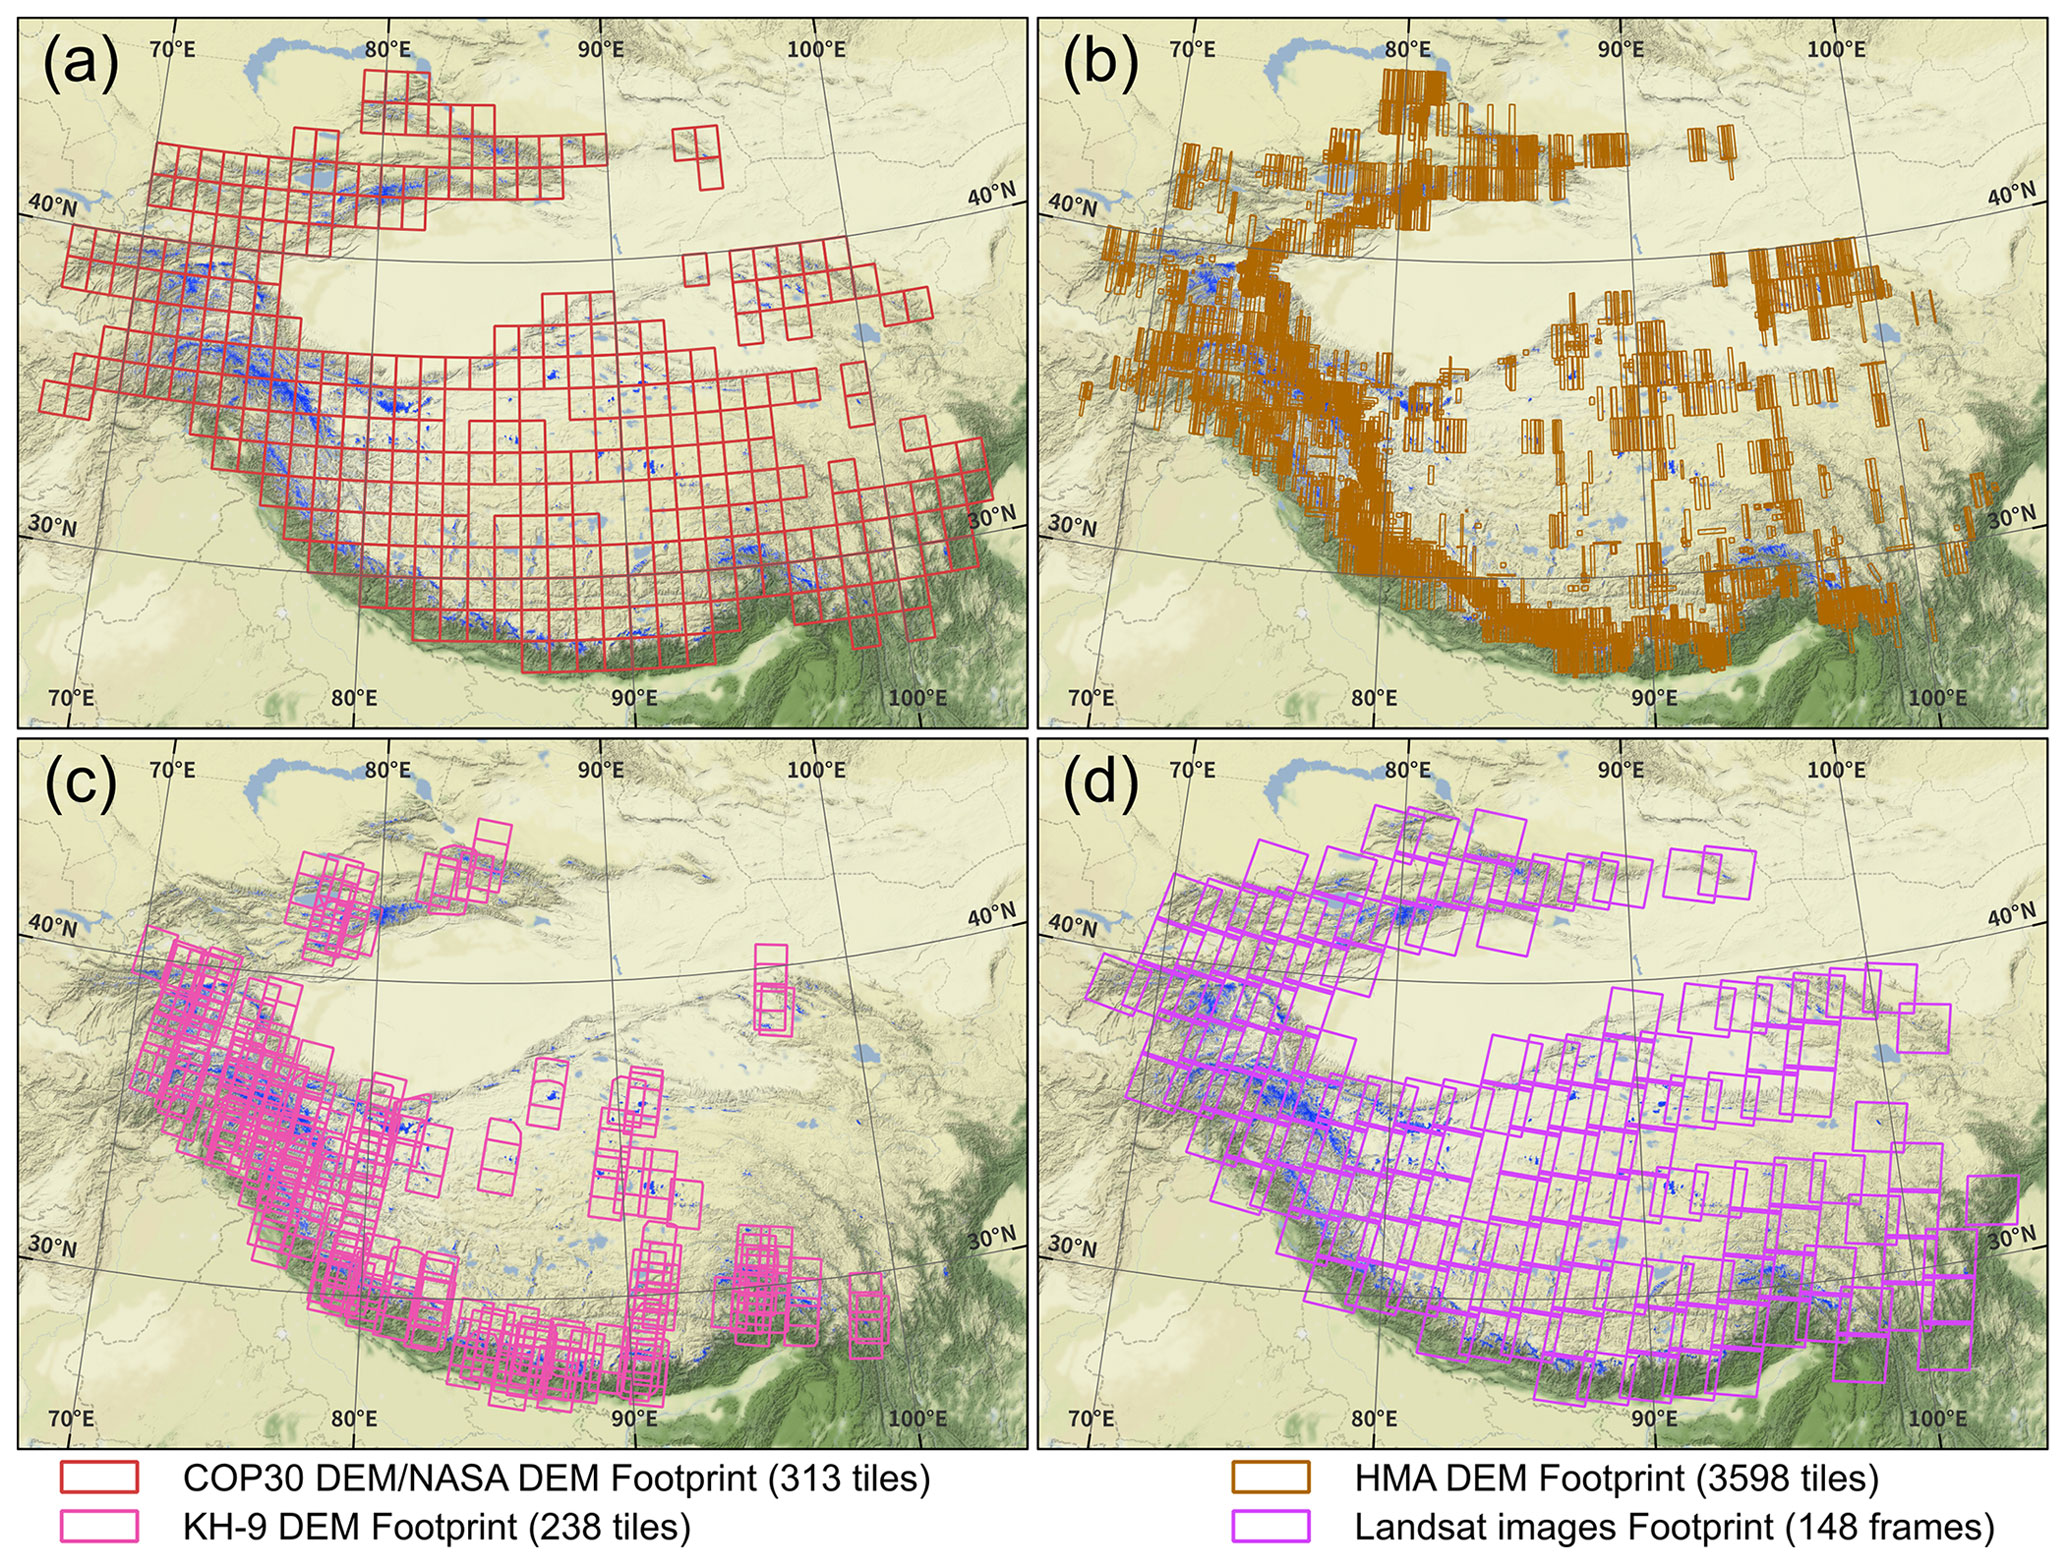
Figure 1Footprints of (a) the COP30 and NASA DEMs, (b) the HMA DEMs, (c) the KH-9 DEMs, and (d) Landsat imageries that were used in this study. The background is rendered from the Esri world physical base map (source: US National Park Service).
Another global DEM we used is the newly released Copernicus DEM GLO-30-DGED (i.e., COP30 DEM). The COP30 DEM was edited from the WorldDEM™, which was generated based on the TanDEM-X mission. The global RMSE of the COP30 DEM is ±1.68 m (AIRBUS, 2020). Several studies have pointed out that this DEM is the most reliable open-access DEM to date (Purinton and Bookhagen, 2021; Guth and Geoffroy, 2021). The source images of the COP30 DEM were mostly acquired between 2011 and 2014, and therefore the COP30 DEM is suitable for representing the surface elevation in the 2010s. Like the NASA DEM, the COP30 DEM has a pixel spacing of 1 arcsec. Each tile of the product has an extent of 1∘ × 1∘. In total, 313 tiles were downloaded through ESA Panda (https://panda.copernicus.eu/web/cds-catalogue/panda, last access: 7 August 2021).
The High Mountain Asia 8 m DEM (HMA DEM) was also utilized in this study. The HMA DEM was generated from very-high-resolution commercial optical satellite stereo images, including WorldView-1/2/3, GeoEye-1, and Quickbird-2 (Shean et al., 2020), through an automated photogrammetry workflow that is integrated with multiple error control processes (Shean et al., 2016). This DEM was originally produced for the mass balance estimation of HMA glaciers, so it covered most of the glacierized regions in HMA. In total, 3598 DEM tiles were downloaded from the National Snow and Ice Data Center (https://nsidc.org/data/HMA_DEM8m_MOS/versions/1, last access: 22 September 2021). About 95 % of the underlying stereo images were acquired between 2010 and 2016 (Fig. 1b). Due to the data voids and inconsistent acquisition time, the HMA DEM was taken as a supplementary elevation source to increase data coverage in the 2010s.
The Hexagon KeyHole-9 (KH-9) imagery was acquired in the 1970s. It is one of the earliest near-global satellite stereo image sources. The KH-9 imagery is characterized by a spatial resolution of 6–9 m, a wide coverage (130 km × 260 km), and a 70 % forward overlap (Surazakov and Aizen, 2010). Many studies have utilized this imagery to estimate historical glacier surface elevation (Holzer et al., 2015; Zhou et al., 2017; Maurer et al., 2019). The KH-9 DEMs used in this study were generated through the automated ASPy pipeline (Dehecq et al., 2020). The methodology, validated in the European Alps and Alaska, achieved a vertical accuracy of ∼5 m (68 % confidence level). For more details on the method of KH-9 DEM generation, we refer to Dehecq et al. (2020). In total, 238 DEMs with a spatial resolution of 48 m were generated from the KH-9 images acquired between 1973 and 1980 (see Fig. 1c). The KH-9 DEMs were utilized to represent the glacier surface elevation in the 1970s.
Several newly published elevation change datasets were also collected to document the surges that occurred between 2000 and 2020 (Brun et al., 2017; Shean et al., 2020; Hugonnet et al., 2021). We mainly used the elevation change results presented by Hugonnet et al. (2021), which has a spatial resolution of 100 m and a temporal interval of 5 years, to extend the observation period to 2020. Through the comparison of the multiple elevation change results, gross errors or false signals in elevation change from either our study or previously published results could be easily detected and removed.
3.2 Optical satellite images
To assist in the identification of surging glaciers, we also analyzed morphological changes associated with surges in multi-temporal optical satellite images. We mainly relied on the 1986–2021 Landsat imagery to capture morphological changes. We acknowledge that, due to the 30 m spatial resolution, not all details of glacier surfaces are visible. We downloaded from the USGS (https://earthexplorer.usgs.gov, last access: 29 September 2022) the false-color composite LandsatLook images with 30 m resolution (geo-referenced) that have good brightness contrast over snow and ice areas. Only images with less than 10 % cloud cover were selected. In total, 7843 LandsatLook images from 148 frames were used (see Fig. 1d). We also utilized the very-high-resolution (VHR) basemaps (Google, Esri, Bing, etc.) as complements for surging feature identification. The fine resolution of these images allows us to visually check the possible morphological features caused by past surges.
3.3 Glacier inventory
In this study, we used the GAMDAM2 glacier inventory (Sakai, 2019) as a template for the inventory of surging glaciers rather than the Randolph Glacier Inventory V6.0 (RGI6.0) (RGI Consortium, 2017). The GAMDAM glacier inventory has included many small glaciers that are missed in RGI6.0 and provides a more accurate glacier extent by also excluding rock outcrops, seasonal snow, and shaded areas (Nuimura et al., 2015). Since the GAMDAM2 inventory only contains the glacier polygon vectors, we calculated the geometric and topographic attributes for each glacier in a way that is similar to that of RGI6.0. The maximum glacier centerline was calculated through the Open Global Glacier Model (OGGM) (Maussion et al., 2019). The attributes were used to analyze the geometric characteristics of surging glaciers.
4.1 Estimation of glacier surface elevation change
The four kinds of DEMs have different coordinate references, vertical references, and data formats. Firstly, all DEMs were converted to float GeoTIFF format. For datasets with quality files (the NASA DEM and the COP30 DEM), the DEMs were preprocessed to mask out the pixels of low quality. Pixels in the COP30 DEM with height errors larger than 2.5 m or within the attached water body mask were excluded. The NASA DEM was directly masked with the attached water mask file. Subsequently, the coordinate system, map projection, and vertical reference of all DEMs tiles were set as the WGS84 coordinate system, an Albers equal-area projection customized for HMA regions (Shean et al., 2020), and the WGS84 ellipsoid. The reprojection was performed using cubic resampling. The glacier surface elevation changes during 2000–2010s were derived by subtracting the NASA DEM from the COP30 DEM and HMA DEM, and those during 1970s–2000 were derived by subtracting the KH-9 DEM from the NASA DEM.
An automated DEM differencing workflow for large-scale glacier surface elevation change estimation was developed based on the demcoreg package presented by Shean et al. (2019). The workflow integrates multiple DEM co-registration approaches, such as a polynomial fit of tilt error, and other adaptive outlier removal approaches that were operated based on observations over stable regions. Hence, a mask that excluded the water bodies and glacierized regions was generated in advance. Before differencing, the two DEMs need to be co-registered because a small geolocation shift can result in considerable elevation change errors in high-mountain regions. The efficient analytical DEM co-registration method presented by Nuth and Kääb (2011) was used to eliminate a relative geolocation shift (horizontal and vertical) between DEMs. This method assumes that the geolocation shift vectors of all DEM pixels are identical. However, for the global DEM products like the NASA DEM and the COP30 DEM, a DEM tile was usually merged from multiple DEM patches, and the geolocation shift vectors at different parts of the DEM tile may be different. In view of this problem, we developed a block-wise version of the analytical DEM co-registration method to reduce the impacts of the non-uniform geolocation errors of a DEM tile. Each DEM tile was divided into m×n blocks, and DEM shifts were estimated for each block. Then, the m×n groups of shift parameters were merged into one group of shift parameters through a cubic interpolation. Technically, the estimated shift parameters become increasingly representative as the block size decreases. However, the fitting of shift parameters requires a certain number of samples. The final block size was set to 300 × 300 pixels to reach the best balance between the representativeness and estimation accuracy of the shift parameters. Besides, we found that the block-wise co-registration method could result in wrong fitting of shift parameters over flat regions. To deal with this, a threshold of mean slope (10∘) was set to classify the DEMs into the flat and the hilly terrain, and the original global co-registration method (Nuth and Kääb, 2011) was applied to the flat areas.
Due to the residual orbital error of satellite images, the elevation difference (dH) maps often showed planimetric trends. This type of systematic error was corrected by subtracting from the elevation change a quadratic polynomial model which was fitted to the observations in assumed stable regions (Li et al., 2017). Besides, due to the jitter of the SAR (synthetic aperture radar) antenna and optical-mapping camera, the elevation difference maps often showed stripes (i.e., band-like artifacts) (Yamazaki et al., 2017). To eliminate the stripes, the elevation difference map was converted to the frequency domain through a fast-Fourier-transform method. Since the cyclic values have a high frequency in the power spectral density map, a threshold of frequency was set to separate the stripe components from the normal elevation differences. The de-striping was completed after the backward transformation. Finally, pixels for which the elevation difference was larger than 3 times the standard deviation of all pixels were considered to be outliers and removed.
The radar penetration into snow and ice can result in elevation biases of several tens of meters over glaciers. We adopted a two-step procedure to reduce the radar penetration bias in the final elevation change results. First, we used the DEM differencing workflow mentioned above to subtract the NASA DEM from the SRTM-X DEM. The elevation differences over the glacierized area were regarded as the penetration difference between X bands and C bands. Secondly, we fitted a polynomial function of degree 3 to the relationship between glacial elevation difference and altitude, which accounts for the fact that penetration increases at higher altitudes, in drier snow and ice conditions. The estimated radar penetration biases were removed from the COP30 DEM–NASA DEM difference over glaciers. For the dH results calculated by differencing the NASA DEM and optical DEMs (e.g., the HMA and KH-9 DEM), the penetration difference of X and C bands was multiplied by 2 to account for the fact that the penetration depth of the C band is approximately twice that of the X band in dry snow (Rott et al., 1993; Abdel Jaber et al., 2019; Fan et al., 2023) and was then subtracted from the related results.
In total, our elevation change observations covered ∼92 % of the total glacier area within HMA in 2000–2020 and ∼77 % in 1970s–2000. Gaps in observations were mainly due to (1) data voids and incomplete coverage of the original DEMs tile, which was the main cause for the KH-9 DEMs and HMA DEM related results, and (2) gross error removal during the elevation change calculations, which led to the scattered holes in the COP30-DEM-related results.
4.2 Surging glacier identification
The identification of surging glaciers in this study was divided into three steps. First, we generated a raw inventory of surging glaciers through the qualitative interpretation of multi-temporal elevation changes. Then, the visual identification of morphological changes was carried out for the identified surging and surge-like glaciers. This procedure can further confirm the surges or correct the false identifications based on glacier elevation changes (Guillet et al., 2022). The identified results were checked again by careful inspection of VHR images and by comparing them with existing surging glacier inventories. Besides, the surging tributaries were separated from the non-surging glacier trunk at this step.
4.2.1 Identification through elevation changes
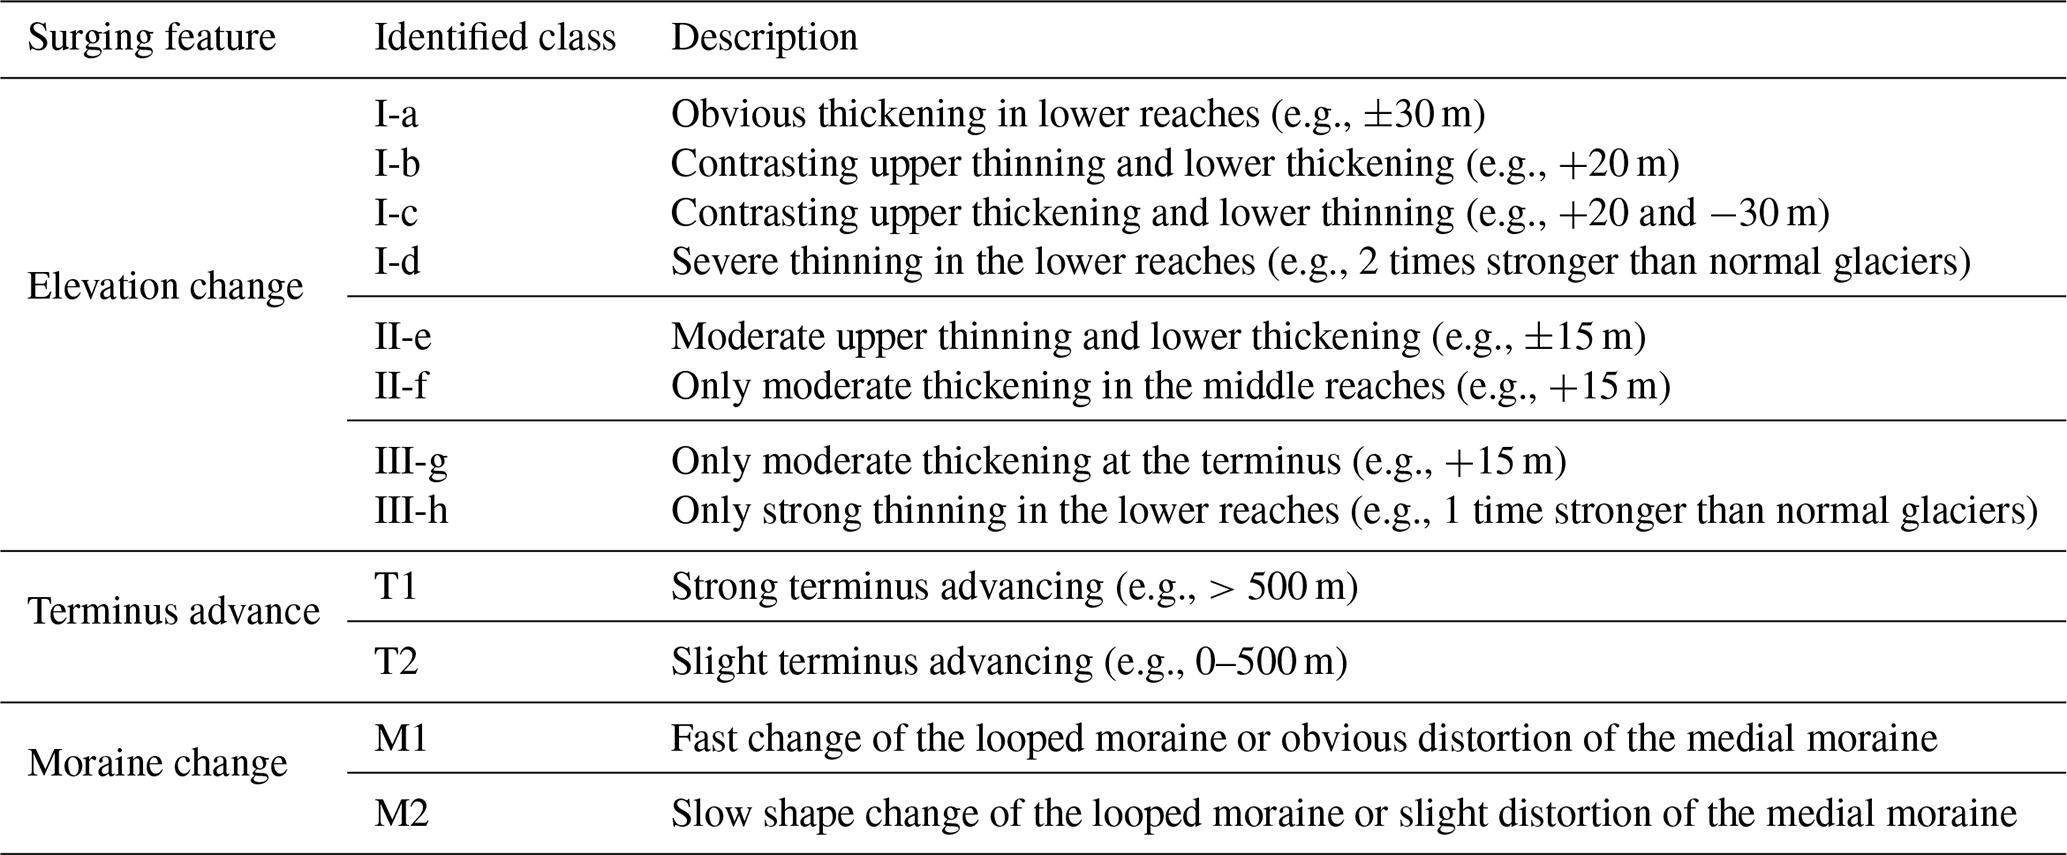
A typical glacier surge cycle can be divided into three phases (Jiskoot, 2011): (1) the build-up phase, characterized by remarkable thickening in the upper reaches; (2) the active phase, characterized by remarkable thinning in the upper reaches and thickening in the lower reaches; (3) the post-surge phase, characterized by strong down-wasting in the lower reaches. The classical method of identifying surging glaciers is to recognize the combination of marked upper thinning and lower thickening in the longitudinal direction. However, to distinguish the surging glaciers in the build-up or post-surge phase, careful comparison with surrounding glaciers is required, which is difficult to carry out with a mathematical index. In this study, we established a three-class indicator to distinguish the surge possibility through the visual recognition of continuous glacier elevation changes over an area larger than 0.04 km2 that are higher than the thresholds listed below:
- I.
Verified.
- a.
There is obvious thickening in lower reaches (e.g., +30 m).
- b.
There is contrasting upper thinning (e.g., −20 m) and lower thickening (e.g., +20 m).
- c.
There is contrasting upper thickening (e.g., +20 m) and lower thinning (e.g., −30 m).
- d.
There is severe thinning in the lower reaches (2 times stronger than that of the normal glaciers or comparable to the ablation of adjacent verified surging glaciers).
- a.
- II.
Probable.
- e.
There is moderate upper thinning (e.g., −15 m) and lower thickening (e.g., +15 m).
- f.
There is only moderate thickening in the middle reaches (e.g., +15 m).
- e.
- III.
Possible.
- g.
There is only moderate thickening at the terminus (e.g., +15 m).
- h.
There is only strong thinning in the lower reaches (1 time stronger than adjacent normal glaciers).
- g.
Note that the specific values of elevation change mentioned above were for information only. Because of the diversity in the regional elevation change patterns under different climate or topographic conditions, the thresholds may vary spatially.
The identification of surging glaciers was conducted separately in the two observation periods (1970s–2000 and 2000–2020). The sub-inventory covering the period 1970s–2000 was generated based on the dH results of the NASA DEM − KH-9 DEM. For the sub-inventory covering the period 2000–2020, the dH datasets contain the COP30 DEM − NASA DEM, HMA DEM − NASA DEM, and three previously published elevation change datasets from Brun et al. (2017), Shean et al. (2020), and Hugonnet et al. (2021). Within each observation period, each glacier was labeled with its possibility level of surging and elevation change pattern in the attribute table. For example, the label I-c means this glacier was classified as a verified surging glacier because contrasting upper-thickening and lower-thinning patterns were observed in the corresponding period. Figure 2 shows an example of a surging glacier identification result.
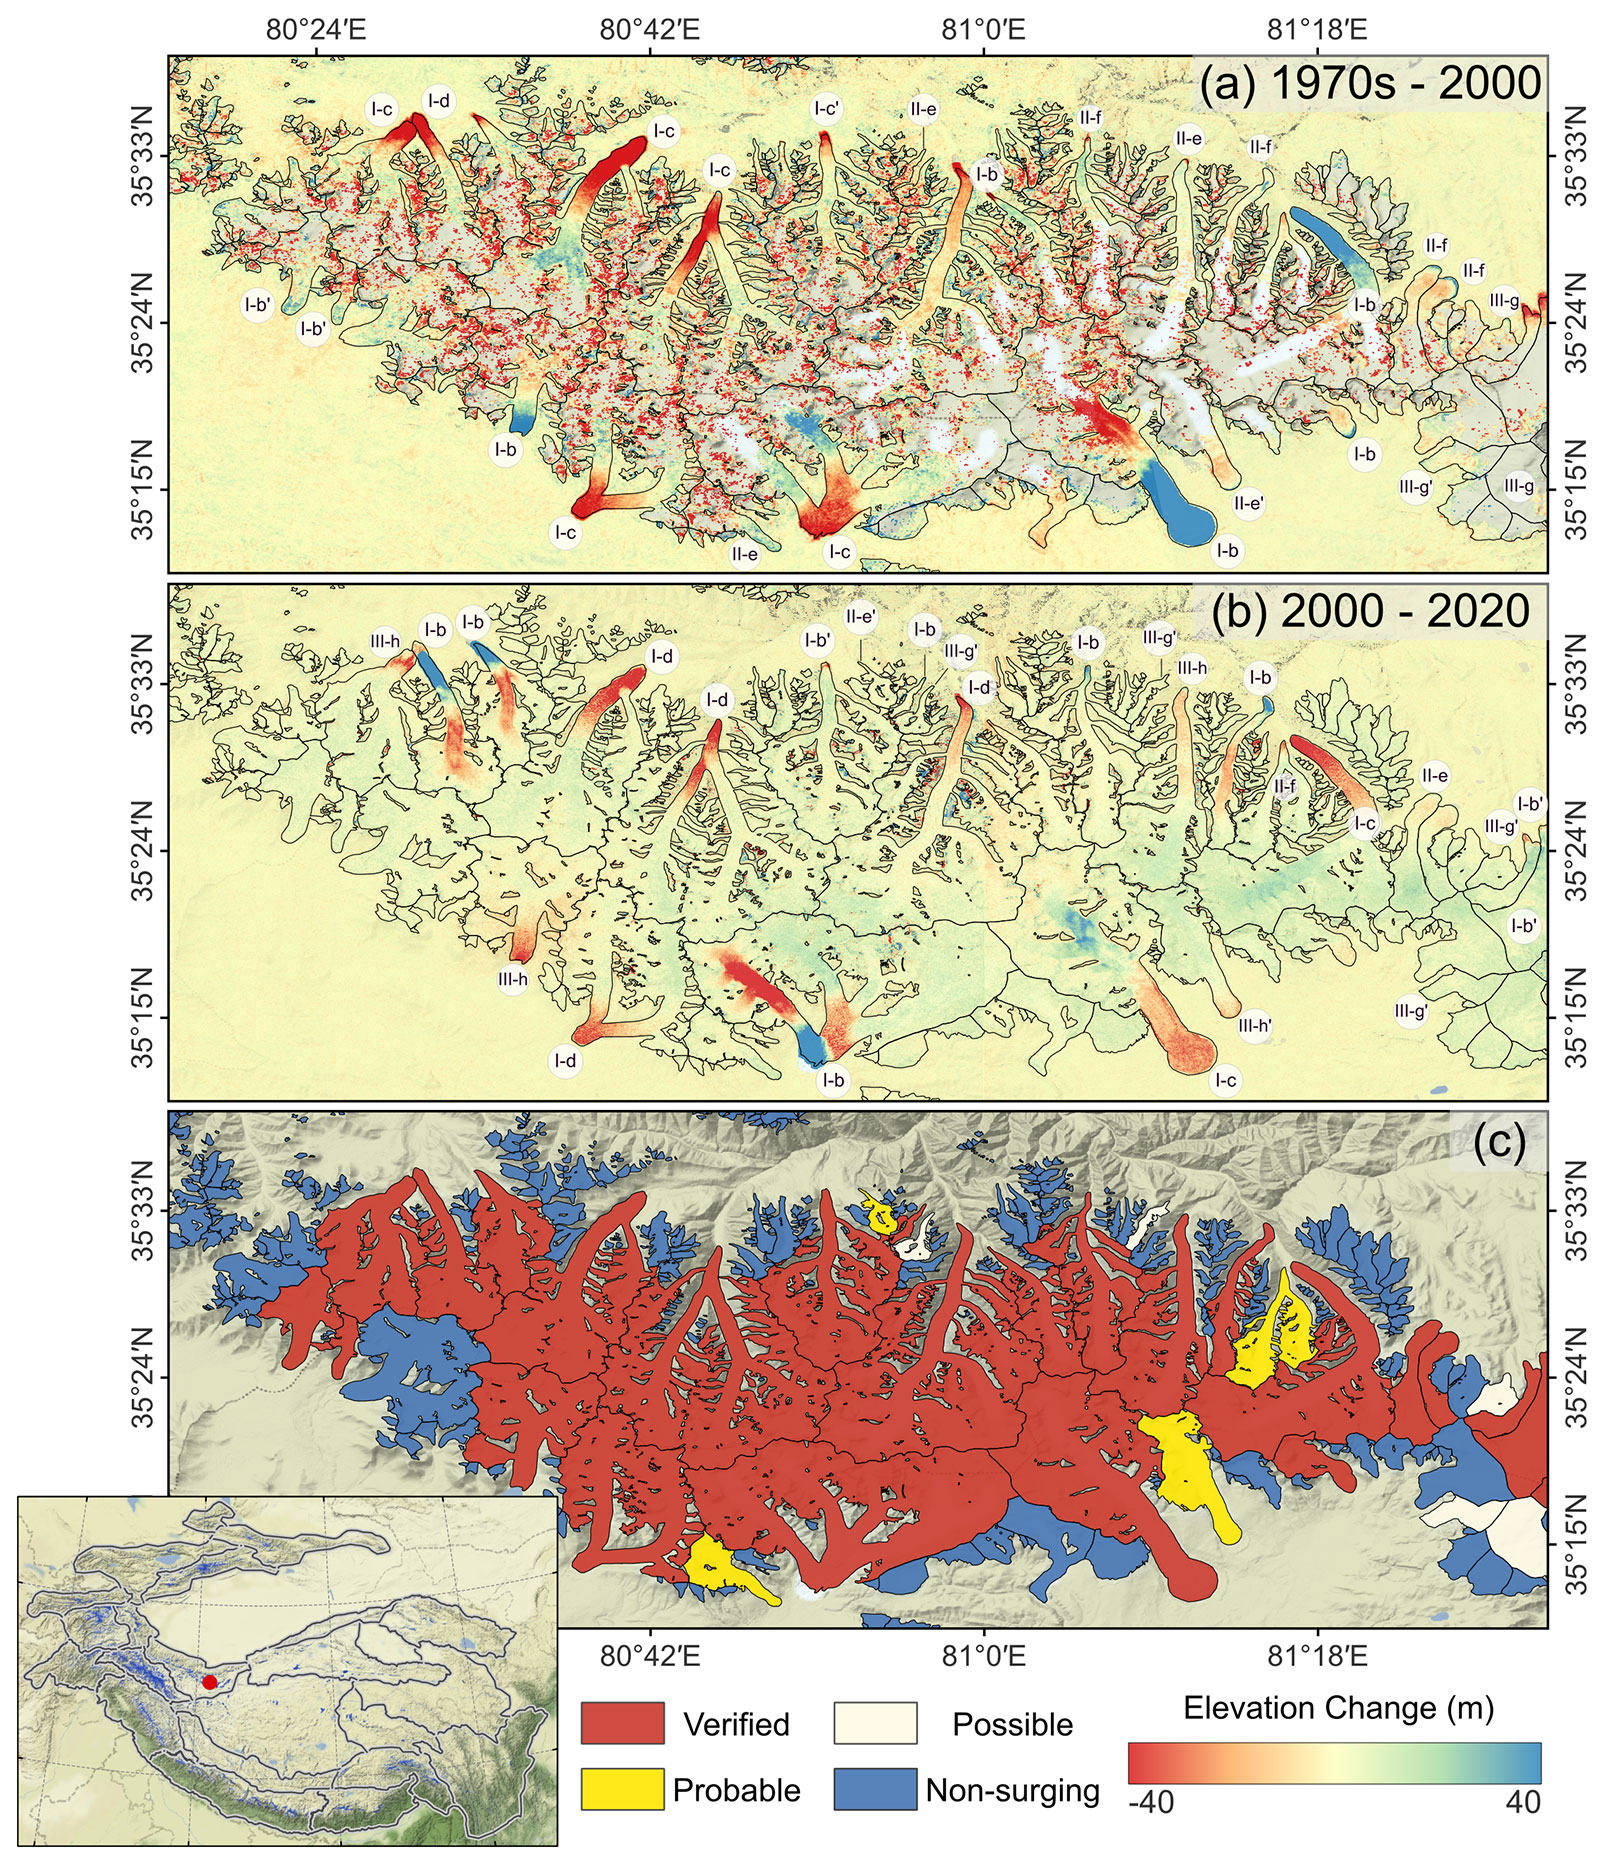
Figure 2An example of derived elevation change maps during (a) 1970s–2000, (b) 2000–2020, and (c) the surging glacier identification results. Black curves are glacier outlines. The labels in panels (a) and (b) represent the identified classes based on the elevation change patterns (the criteria of identification are elaborated upon in Sect. 4.2.1 and Table 1). The subscript ′ in the labels indicates that the surging glacier is identified by combining other elevation change maps. The red circle in the inset panel denotes the location of the area in the main panel (Western Kunlun Shan). The background is the shaded relief of the COP30 DEM (source: ESA).
Table 1Criteria for identifying surging glaciers based on changes in elevation and morphological features.
4.2.2 Identification through morphological changes
Long-term Landsat images (acquired between 1986 and 2021) were utilized to investigate the morphological changes of the three types of potential surging glaciers identified from elevation change. Within each Landsat acquisition frame, all Landsatlook images of different dates (acquired from 1986 to 2021) were merged into an animated time series image. Based on the animated image, we are able to identify morphological changes. Due to the moderate resolution of Landsat images, only three types of feature changes were utilized as criteria for identifying glacier surges: terminus position change, looped-moraine changes, and medial-moraine changes. Similarly, we assigned a two-level index to each morphological change to indicate our confidence in the identification, which was defined as follows:
- 1.
Terminus advance.
- T1.
There is strong terminus advancing (e.g., over 500 m).
- T2.
There is slight terminus advancing (e.g., 0–500 m).
- T1.
- 2.
Looped- or medial-moraine change.
- M1.
There is fast formation or vanishment of the looped moraine or obvious distortion of the medial moraine.
- M2.
There is slow formation or vanishment of the looped moraine or slight shape changes of the existing looped moraine or slight distortion of the medial moraine.
- M1.
Each of the three kinds of morphological changes was individually qualified and labeled in the attribute table. All criteria used for identifying surging glaciers were listed in Table 1.
4.2.3 Generation of surging glacier inventory
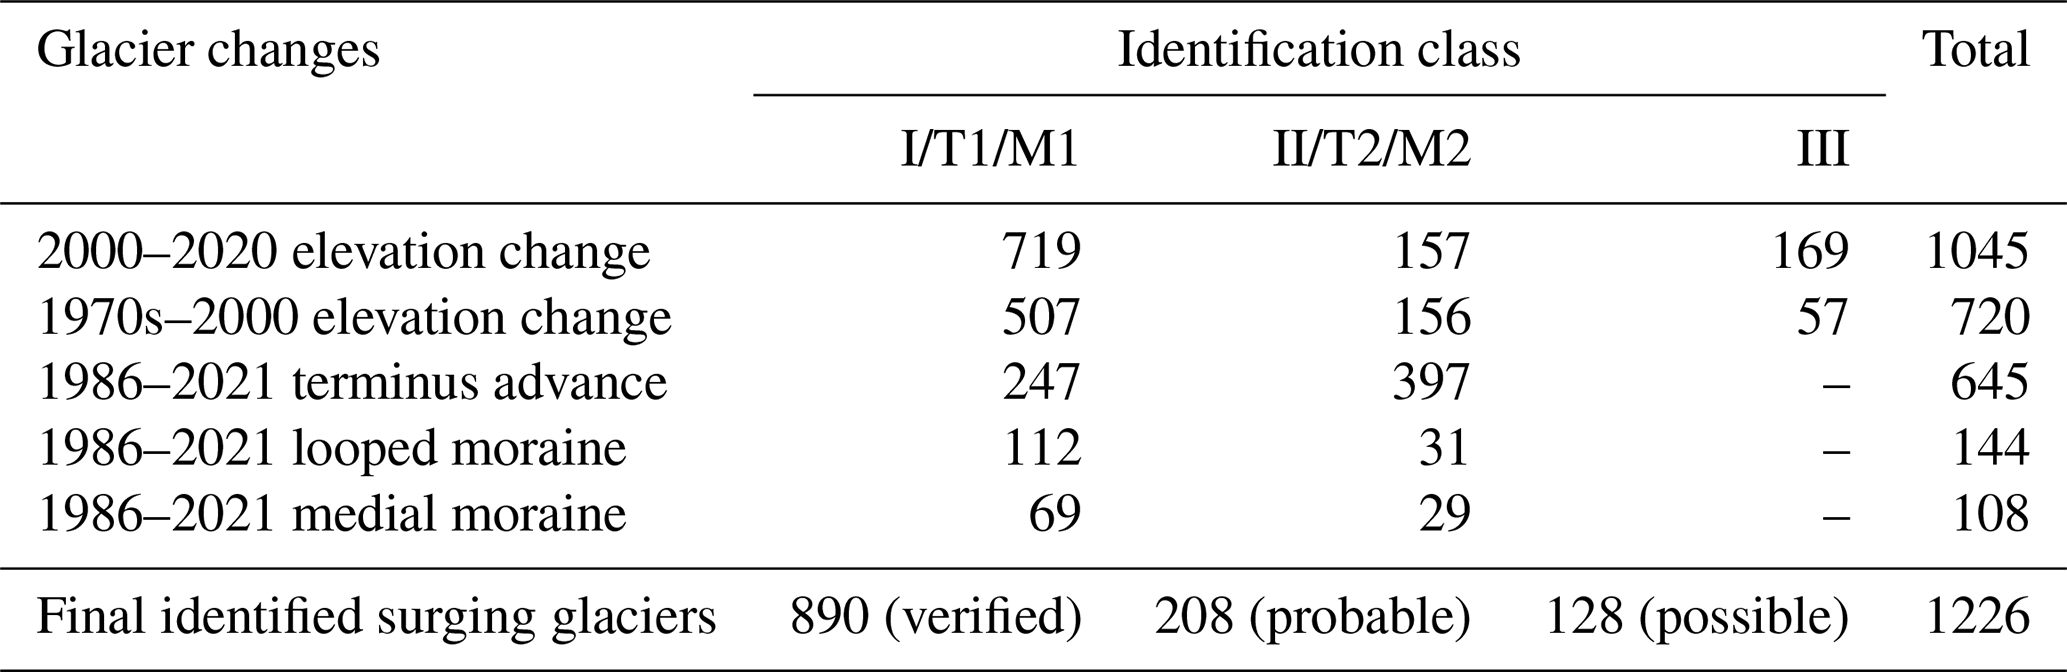
Through the above identification steps, in total, five indicators were compiled to describe the changes of possible surging glaciers. The two sub-inventories based on elevation change maps (Sect. 4.2.1) were first merged following the principle of possibility; i.e., if a glacier was identified as a surging glacier in both periods but was associated with different indicators, its indicator in the final inventory was taken from the indicator that had a higher possibility. The possibility of indicators follows the order of verified > probable > possible. For example, a glacier identified as a verified surging glacier in the period 1970s–2000 and identified as a probable surging glacier in the period 2000–2010s was classified as a verified surging glacier. This intermediate inventory was further merged with the inventory based on morphological indicators to determine the final indicator of surge possibility. The probable or possible class was changed to a class with higher possibility (e.g., from probable to verified) only if an obvious morphological change was observed (i.e., T1 type of terminus advancing or M1 type of looped- or medial-moraine change).
We think the advancing glaciers usually have the following features: (1) they are only thickened in a small area at the terminus, without contrasting upper thinning, and (2) the advancing distance is relatively short (Lv et al., 2019, 2020; Goerlich et al., 2020). These features correspond to the III-g type of elevation change and the T1 type of terminus advance. Therefore, if a glacier only shows these two kinds of changes, it will be qualified as an advancing glacier rather than a surging glacier.
For glaciers in which a tributary surged but the main trunk did not show any features of a surge, such as the Biafo, Fedchenko, or Panmah glaciers (Hewitt, 2007; Goerlich et al., 2020; Bhambri et al., 2022), we separated the surging tributary from the trunk. A tributary will be considered to be an individual surging glacier under the following conditions: the transition of contrasting elevation change is located in this tributary, and the mass contributed by this tributary to the glacier trunk is relatively small. In that case, we manually edited the outline to separate the tributary from the glacier complex. This kind of surge was also marked by the attribute trib_surge.
In the final step, we inspected the identified surging glaciers using VHR imagery. The inspection aimed to remove wrong identifications caused by some false signals, such as the severe lower thinning in a lake-terminating glacier and remarkable surface heightening caused by nearby landslides. We also refined our inventory after careful comparison with inventories presented by Guillet et al. (2022), Goerlich et al. (2020), and Bhambri et al. (2017).
4.3 Estimation of the uncertainty
The reliability of surging glacier identification is directly related to the accuracy of glacier surface elevation change. Assuming the uncertainties in elevation difference are similar over glacierized and stable areas, we evaluated the uncertainties of glacier elevation difference based on elevation difference observations in stable areas, whose true values are zero. Here, we adopted the normalized median absolute deviation (NMAD) as the indicator of the uncertainty of elevation difference, which is less sensitive to outliers and can be deemed to be a better proxy of the standard deviation for dH in mountainous area (Höhle and Höhle, 2009; Li et al., 2017). The NMAD is calculated as follows:
where Δh is the elevation difference, and the subscript i denotes the index of the pixel.
In this study, uncertainties in glacier elevation change are caused by uncertainties in the elevation difference and in the penetration depth. Since the penetration depth was also estimated from a DEM difference (SRTM-X DEM − NASA-DEM), its uncertainty can also be evaluated through the NMAD. Assuming that these two kinds of uncertainties are uncorrelated, the uncertainty of the glacier elevation change is estimated through the error propagation law:
where elev_diff means the elevation difference, and pene means the penetration depth difference between C-band and X-band SRTM. The coefficient n is the factor between the C- and X-band penetration depth, which is 1 for the results of COP30 DEM – NASA DEM and 2 for the results of KH-9 or HMA DEM – NASA DEM.
5.1 Identified surging glaciers
A total of 1226 surge-related glaciers across the HMA were identified based on the elevation changes and morphological changes. The identified surge-related glaciers consisted of 890 verified surging ones, 208 probable ones, and 128 possible ones. A total of 175 surging tributaries were identified in 86 glacier complexes. When merging the identification results of the two periods, we found that a considerable proportion of identified surging glaciers were simultaneously recognized in both periods. This makes our inventory more reliable since a surging glacier could exhibit different kinds of changes in different periods. For example, 26 probable and 51 possible surging glaciers identified during 2000–2020 turned out to be verified surging glaciers during 1970s–2000. Meanwhile, 60 probable and 21 possible surging glaciers identified during 1970s–2000 turned out to be verified surging glaciers during 2000–2020. Due to the almost-complete coverage of elevation change observations, we were able to classify almost all glaciers in HMA. Table 2 shows the number of surging glaciers identified from two periods of elevation changes and morphological changes. Due to the incomplete coverage of KH-9 DEMs, 103 identified surging glaciers have no observations during the period 1970s–2000. The data voids in KH-9 DEMs may be one of the reasons why fewer surging glaciers were identified in this period. In the following text, the probable and possible classes were deemed to be surge-like glaciers, and only the verified surging glaciers were used for analysis and comparison throughout the rest of this study.
5.2 Distribution of surging glaciers
Surging glaciers were identified in 21 subregions of HMA (except for the Dzhungarsky Alatau); however, the spatial density of identified surging glaciers varies between different subregions (Fig. 3). Glacier surges are common in the northwestern regions, sporadic in the inner regions, and scarce in the peripheral regions. Figure 4 and Table 2 show the ratios of surging glacier number and area in each subregion. Considering the area of the smallest identified surging glacier is 0.42 km2, we only counted glaciers larger than 0.40 km2 in the glacier number ratio. When conducting statistical analysis, the surge-like glaciers were excluded from the dataset. Besides, a surging tributary was regarded as an individual glacier. The number (890) and area (16 556.42 km2) of identified surging glaciers accounted for ∼2.49 % and ∼16.59 % of the total glacier number and glacier area in HMA, respectively.
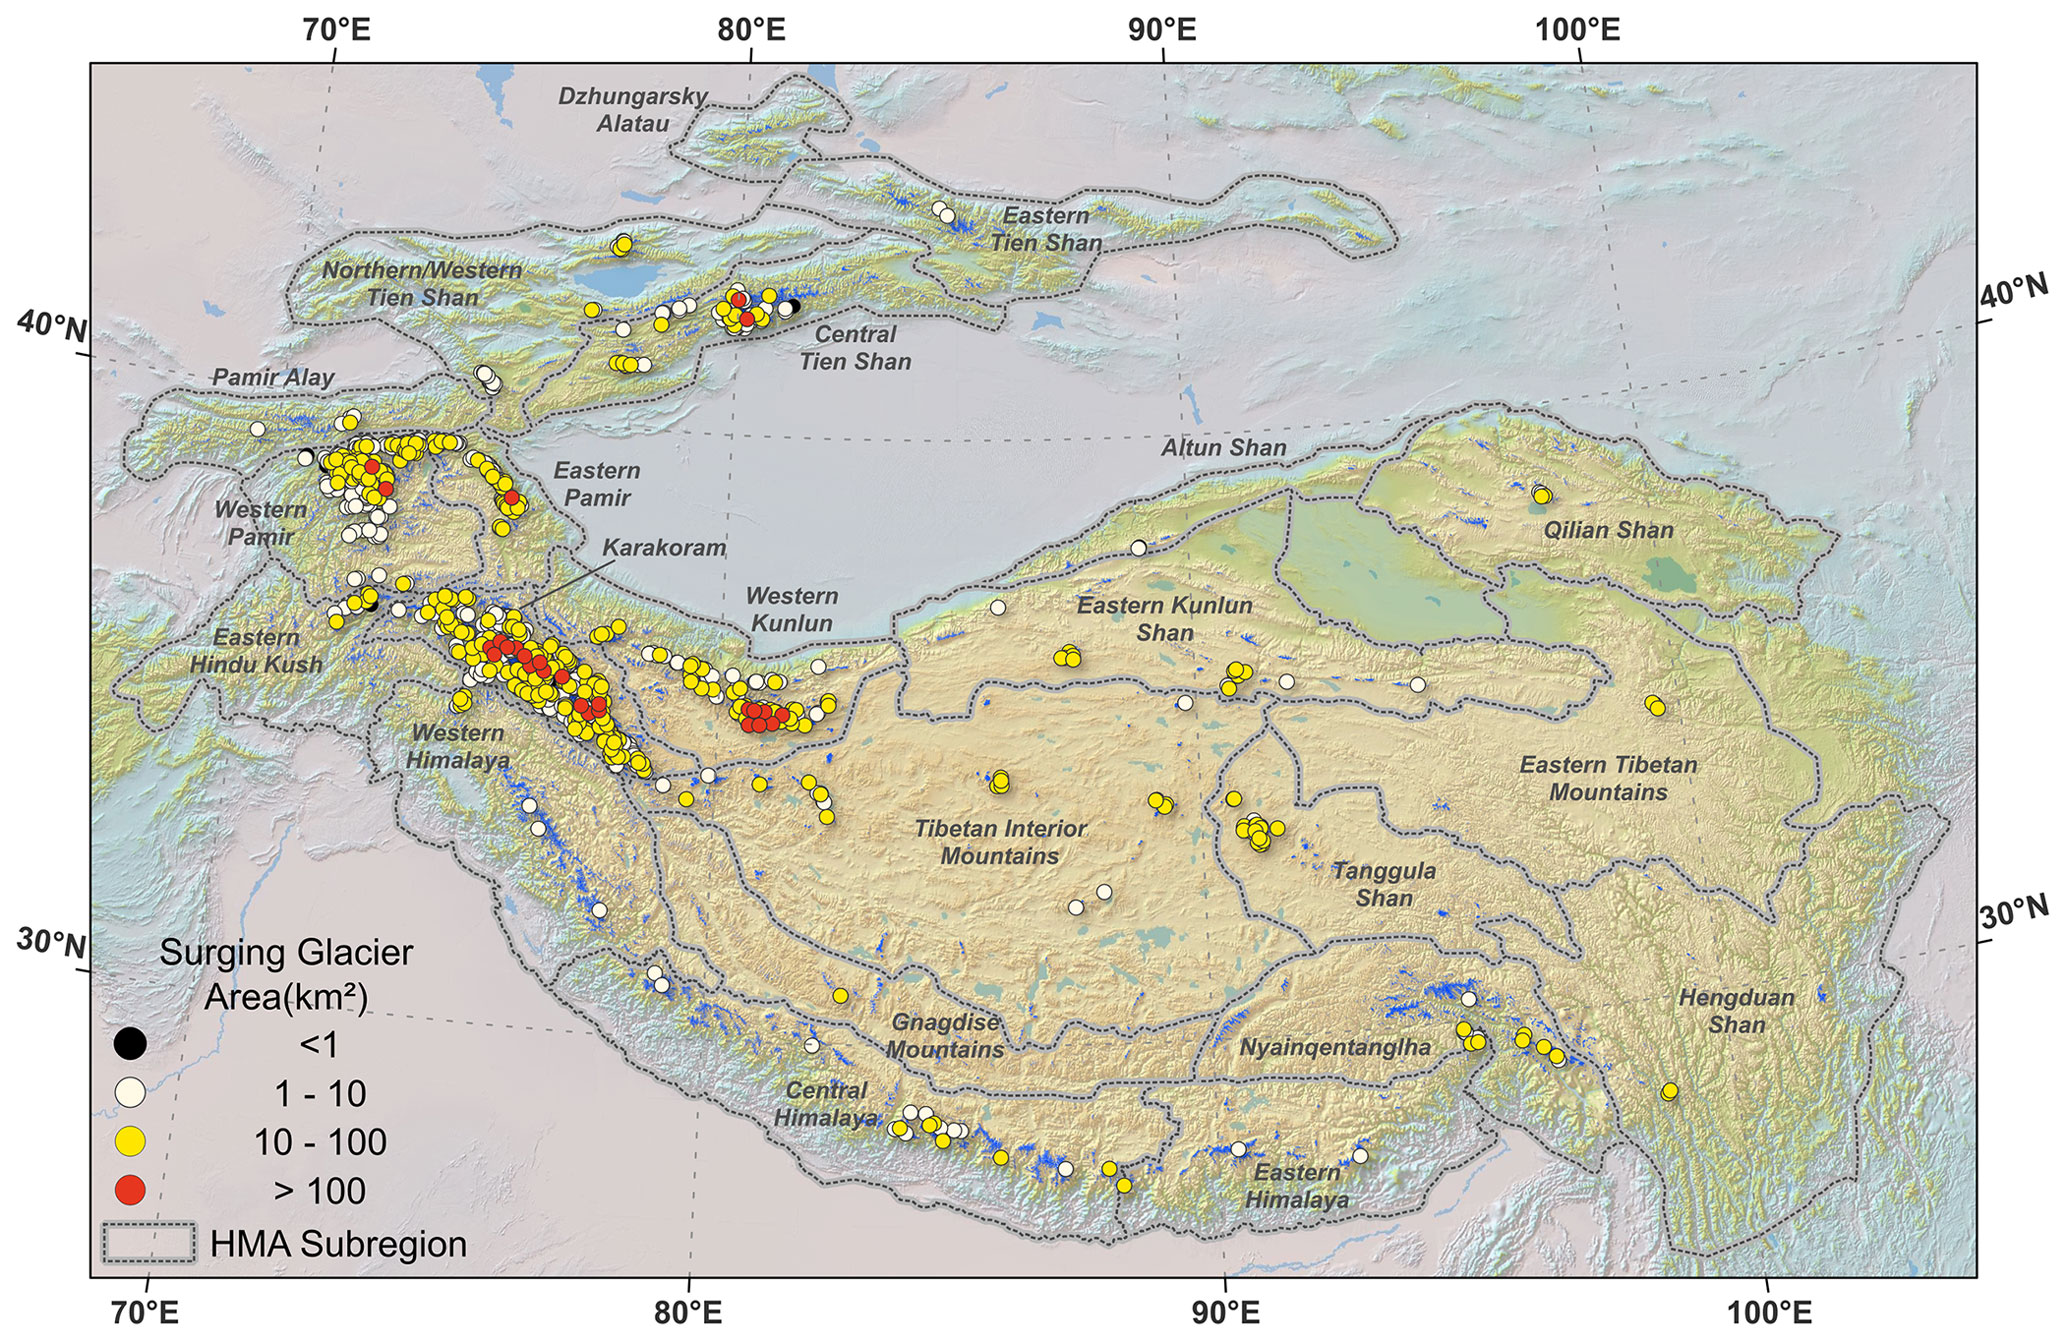
Figure 3Overview of the distribution of identified surging glaciers in 22 subregions of HMA. The background is the shaded relief of SRTM DEM (source: USGS).
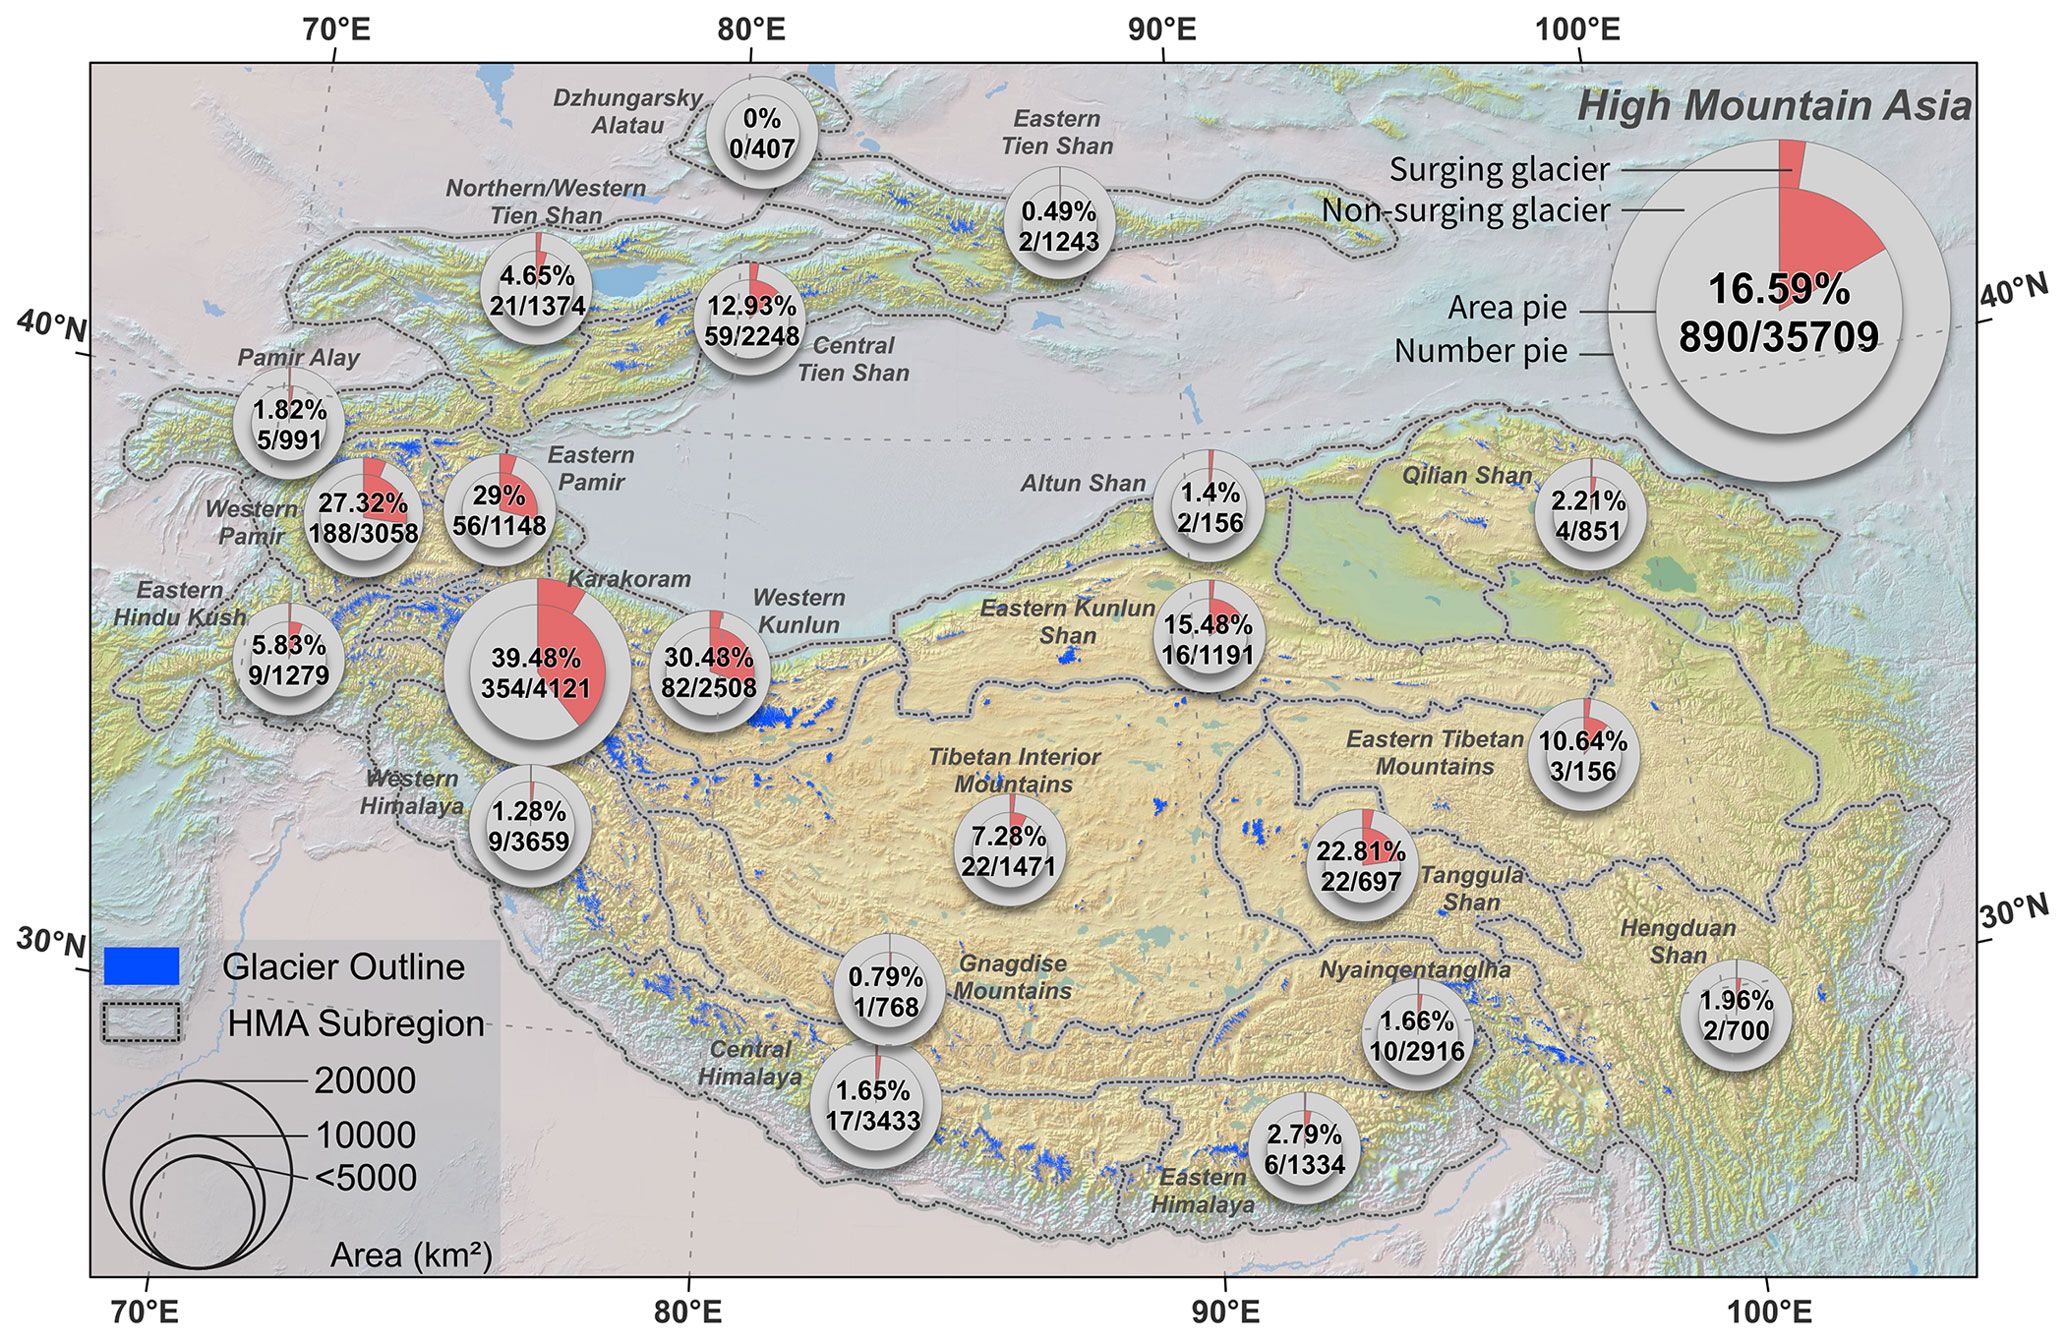
Figure 4Distribution of surging glaciers in the 22 subregions of HMA. The double-level pie chart represents the ratios of surging glacier number and area in each subregion. The inner pie denotes the area ratio labeled by a percentage, and the outer pie denotes the number ratio labeled by a fraction (only glaciers larger than 0.4 km2 are considered). The background is the shaded relief of SRTM DEM (source: USGS).
As shown in Table 3, among the 22 subregions, the Karakoram is the largest cluster of surging glaciers. In total, 354 surging and 128 surge-like glaciers were identified in the Karakoram. The number and area of verified surging glaciers in the Karakoram accounted for 39.80 % and 47.90 % of the total identified surging glaciers within HMA. We found that more than half of the tributary surges (101) occurred in the Karakoram, where large glaciers are much more developed than in other regions. In the Karakoram, although surging glaciers account for only 8.59 % of the total glacier number, their area occupied 39.48 % of the total glacierized area. The Pamirs, composed of the Eastern Pamir, Western Pamir, and Pamir Alay, host 249 surging glaciers and 128 surge-like glaciers. About 27.74 % of the glacier area in the Eastern and Western Pamir belongs to surging glaciers. We also found 28 surging tributaries in 15 glacier complexes in the Pamirs. Surging glaciers are also common in the Western Kunlun. In total, 82 surging and 47 surge-like glaciers were identified in the Western Kunlun, representing 30.48 % of the total glacier area. The Central Tien Shan has the fourth-largest surging glacier area. In total, 59 surging glaciers were identified in the Central Tien Shan, covering 12.93 % of the total glacier area. The Karakoram, Pamirs, Western Kunlun, and Central Tien Shan host ∼83 % of the surging glaciers across HMA. Figure 5 shows the distribution of identified surging and surge-like glaciers in these four regions.
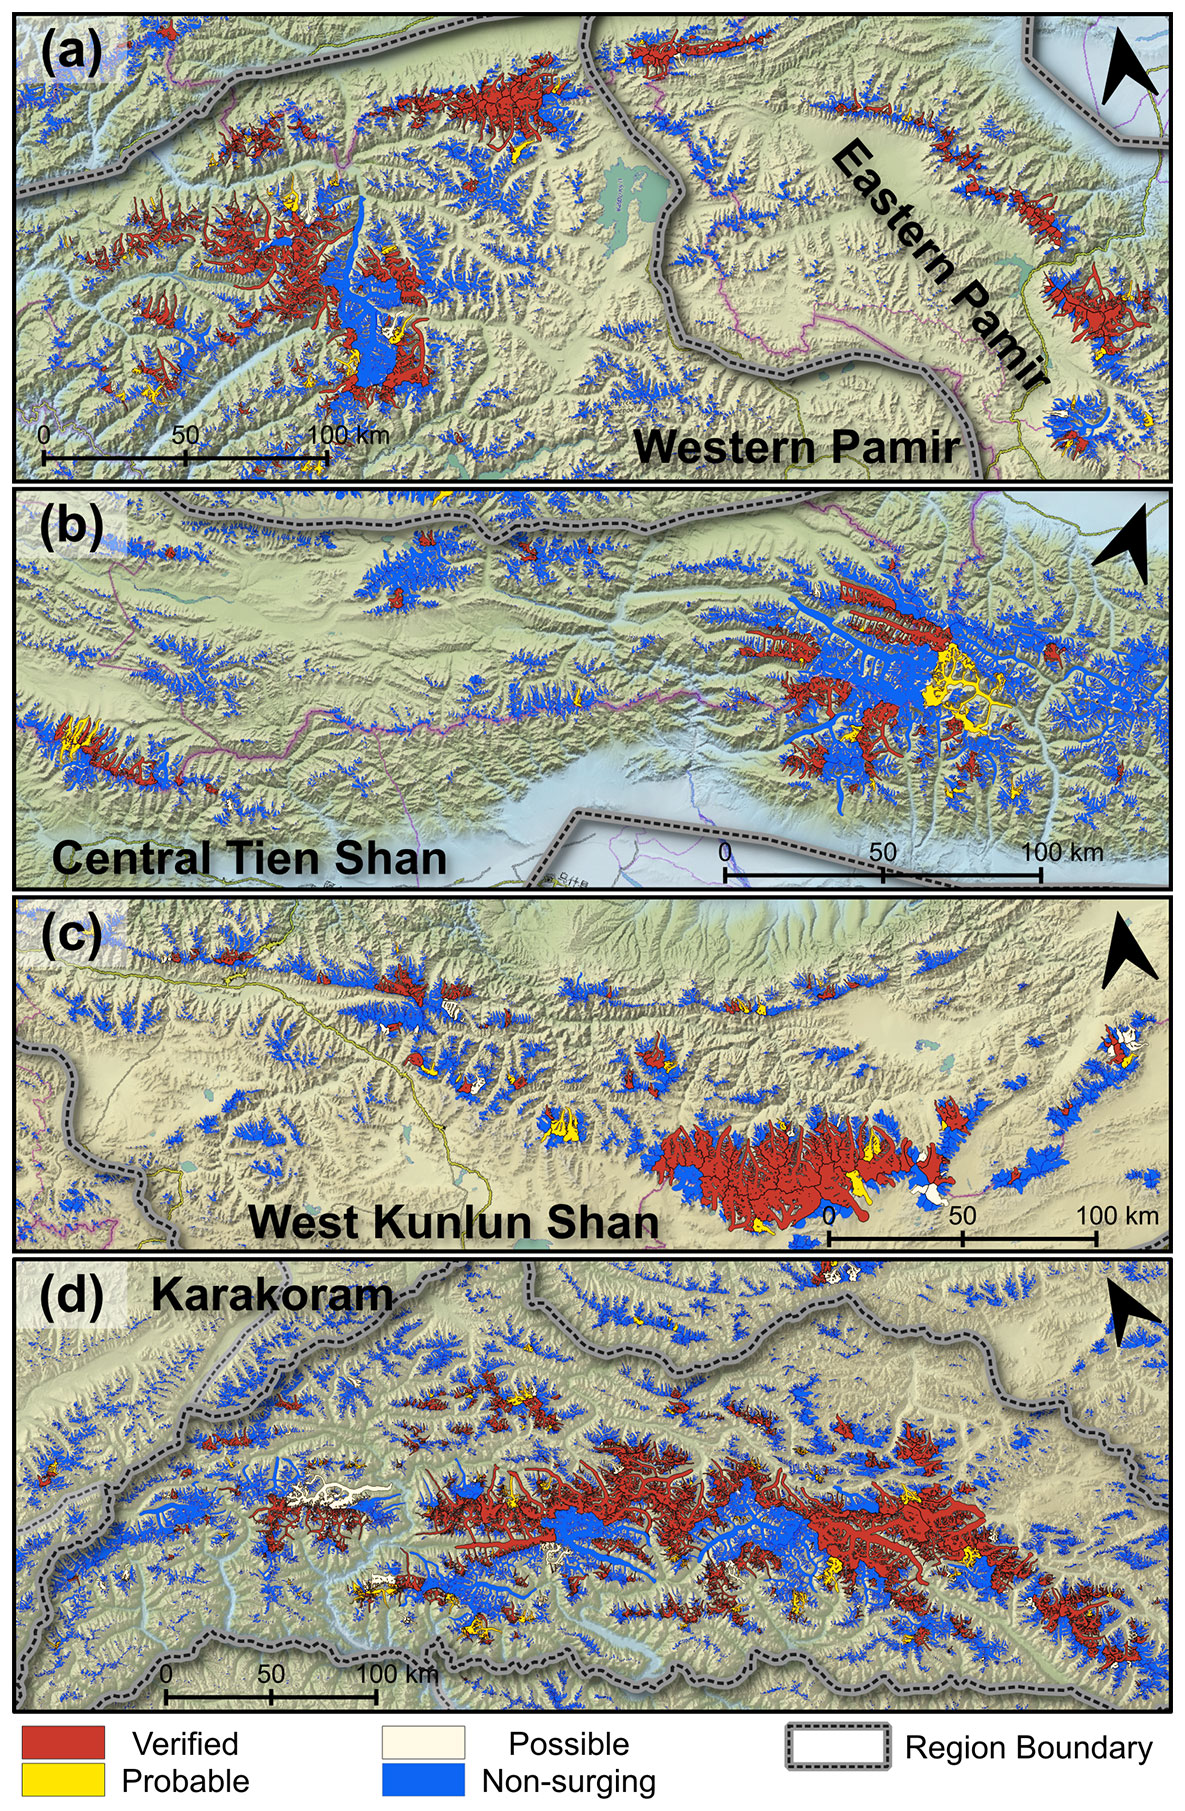
Figure 5Results of surging glacier identification in (a) the Pamirs, (b) Central Tien Shan, (c) Western Kunlun Shan, and (d) Karakoram. The background is the shaded relief of SRTM DEM (source: USGS).
Within interior HMA subregions (including the Tibetan Interior Mountains, Eastern Kunlun Shan, and Tanggula Shan), identified surging glaciers represent less than 2 % of the total number but nearly 15 % of the total glacier area. Glacier surges in these regions occurred in a few watersheds. Similar localized surging glacier clusters were also found in the Nyainqentanglha, Northern and Western Tien Shan, and Central Himalayas, but the corresponding area ratios are much lower. In these regions, our inventory covers dozens of surging glaciers, which were rarely reported before. Figure 6 shows some samples of identified surging glaciers in these regions.
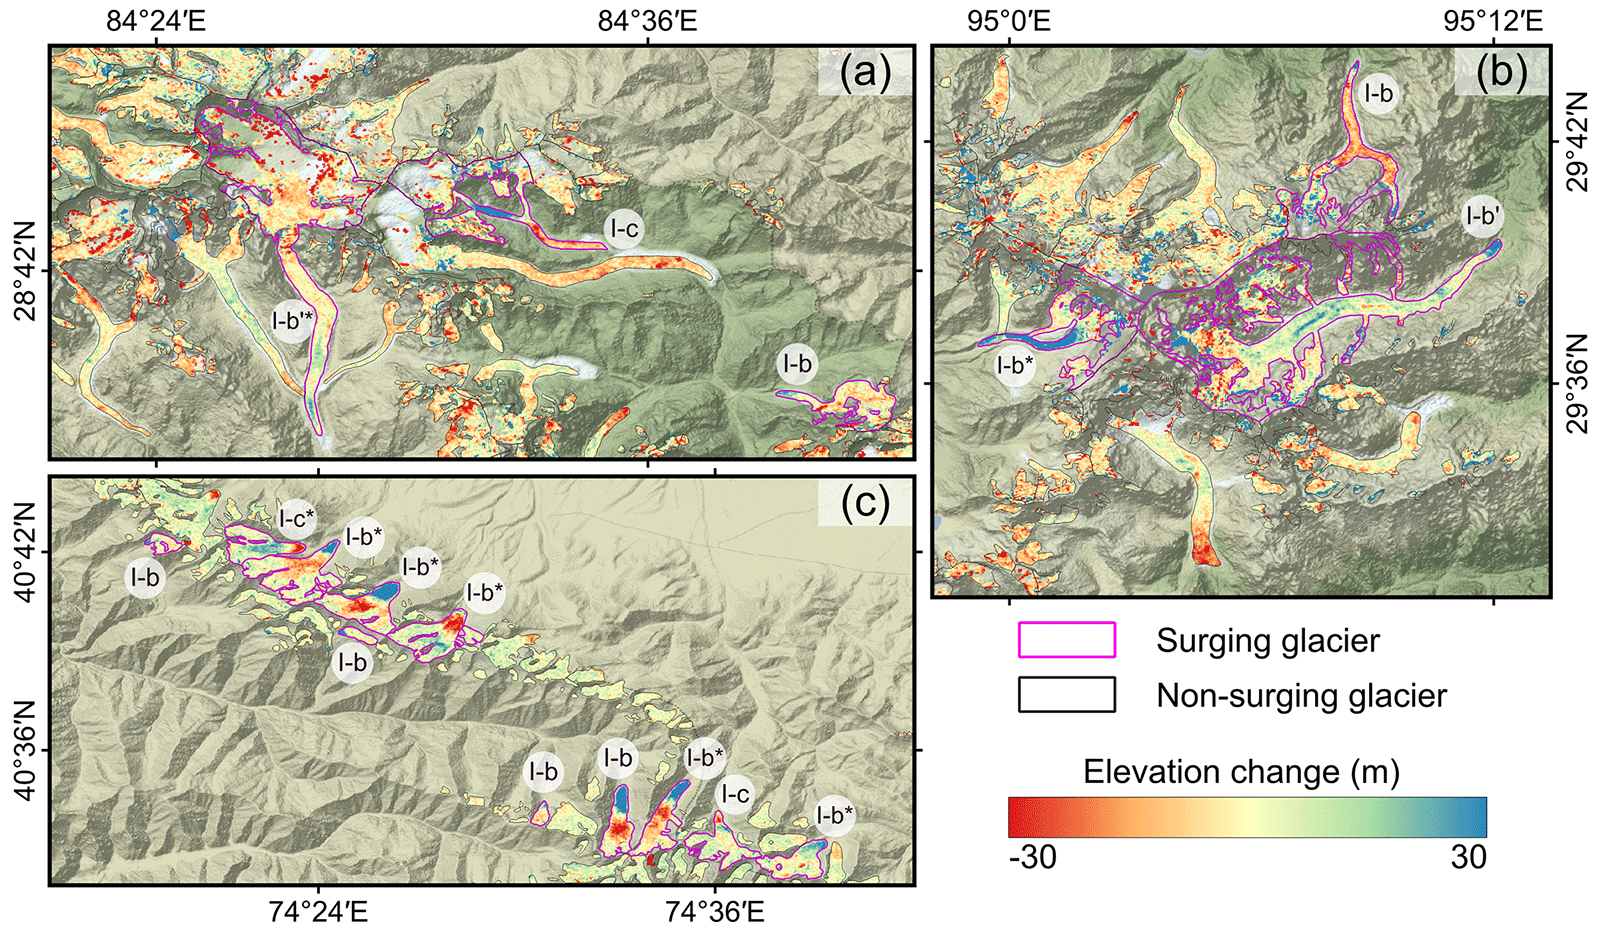
Figure 6Elevation change map of identified surging glacier samples in (a) Central Himalayas (1970s–2000), (b) Nyainqentanglha (1970s–2000), and (c) Northern and Western Tien Shan (2000–2020). The labels in panels (a) and (b) represent the identified classes based on the elevation change pattern (the criteria of identification are elaborated upon in Sect. 4.2.1 and Table 1). The subscripts ∗ and ′ indicate that the identified class of the glacier is determined by combining morphological changes and other elevation change maps, respectively. The background is the shaded relief of SRTM DEM (source: USGS).
5.3 Geometric characteristics of surging glaciers
In this part, only the surging glaciers and non-surging glaciers are taken for analysis. The surge-like glaciers are not included. All glacier samples in the surging and non-surging classes are larger than 0.40 km2.
Table 3Results of surging glacier identification in 22 subregions of HMA. Only glaciers larger than 0.4 km2 were considered in the glacier-number-related values.
* The value of the ratio only considered the number and area of verified surging glaciers.
We divided all glaciers into nine classes according to their area and calculated the ratios of surging glacier number and area in each class. As shown in Fig. 7 and Table 4, surging glaciers were found in all classes. Both the ratios of surging glacier area and number became increasingly high as the glacier size increased, except for the last class. Surging glaciers with an area of 1–50 km2 occupy 82 % of all surging glaciers. For the three classes in which glaciers are larger than 50 km2, the ratios of surging glacier area and number were about 52 % and 54 %, respectively. In particular, two of six very large glaciers (the Siachen glacier and the Hispar glacier) surged during our observation periods.
Figure 7Illustration of the number and area ratios of surging glaciers for different area classes.
Table 4The number and area ratios of surging glaciers in all glaciers for different area classes.
When comparing the geometric characteristics of the surging glaciers and non-surging glaciers, we selected samples in the following way: for each surging glacier, we selected 10 non-surging glacier samples that have the closest area but from an arbitrary region, and then we randomly sampled 3 out of the 10 selected non-surging glaciers. This is to minimize the discrepancy resulting from the sample differences. There are two reasons for doing so. First, the gap between the sample numbers is huge (∼35 000 non-surging vs. 890 surging). Second, a high proportion of non-surging glaciers is made up of very small glaciers. The final selected 890 × 3 non-surging glaciers formed the reference group.
Figure 8 illustrates the comparisons between the basic geometric properties of surging and non-surging glaciers. The sampling strategy mentioned above was also utilized here. If we directly compare the surging glaciers with all non-surging glaciers, we will find that surging glaciers generally have a larger area, wider elevation range (i.e., the highest glacier surface elevation minus the lowest), and longer flow line (Fig. 8a–c). Taking the median values as the candidates, the quantitative comparisons are 7.3 km2 (surging) vs. 0.87 km2 (non-surging) for glacier area, 1534 m vs. 642 m for elevation range, and 6695 m vs. 1854 m for maximum glacier length, respectively. In terms of mean surface slope and median elevation, the values of the surging glaciers are less spread out than those of the non-surging glaciers. However, the median values of the two kinds of glaciers are very close (see Fig. 8d and e). If we took the non-surging glaciers in the reference group for comparison, the discrepancies between the two kinds of groups in terms of these geometric properties became much more different. As shown in Fig. 9a, the similar boxplots of the reference group and surging glacier samples proved that our sampling strategy successfully corrected the bias in area between surging and non-surging glaciers. The gaps between the surging and non-surging glaciers (reference group) in the glacier area (7.3 km2 vs. 7.0 km2), elevation range (1534 m vs. 1180 m), and glacier length (6695 m vs. 5560 m) are much smaller. More importantly, the mean slope of the glaciers in the reference group becomes smaller than that of the surging glaciers.
Figure 8The comparison between the boxplots of geometric properties of non-surging glaciers (top), non-surging glaciers in the reference group (center), and surging glaciers (bottom). (a) Natural logarithm of area, (b) elevation range, (c) natural logarithm of length, (d) mean surface slope, and (e) median elevation. Glaciers smaller than 0.4 km2 were excluded from the non-surging glacier class.
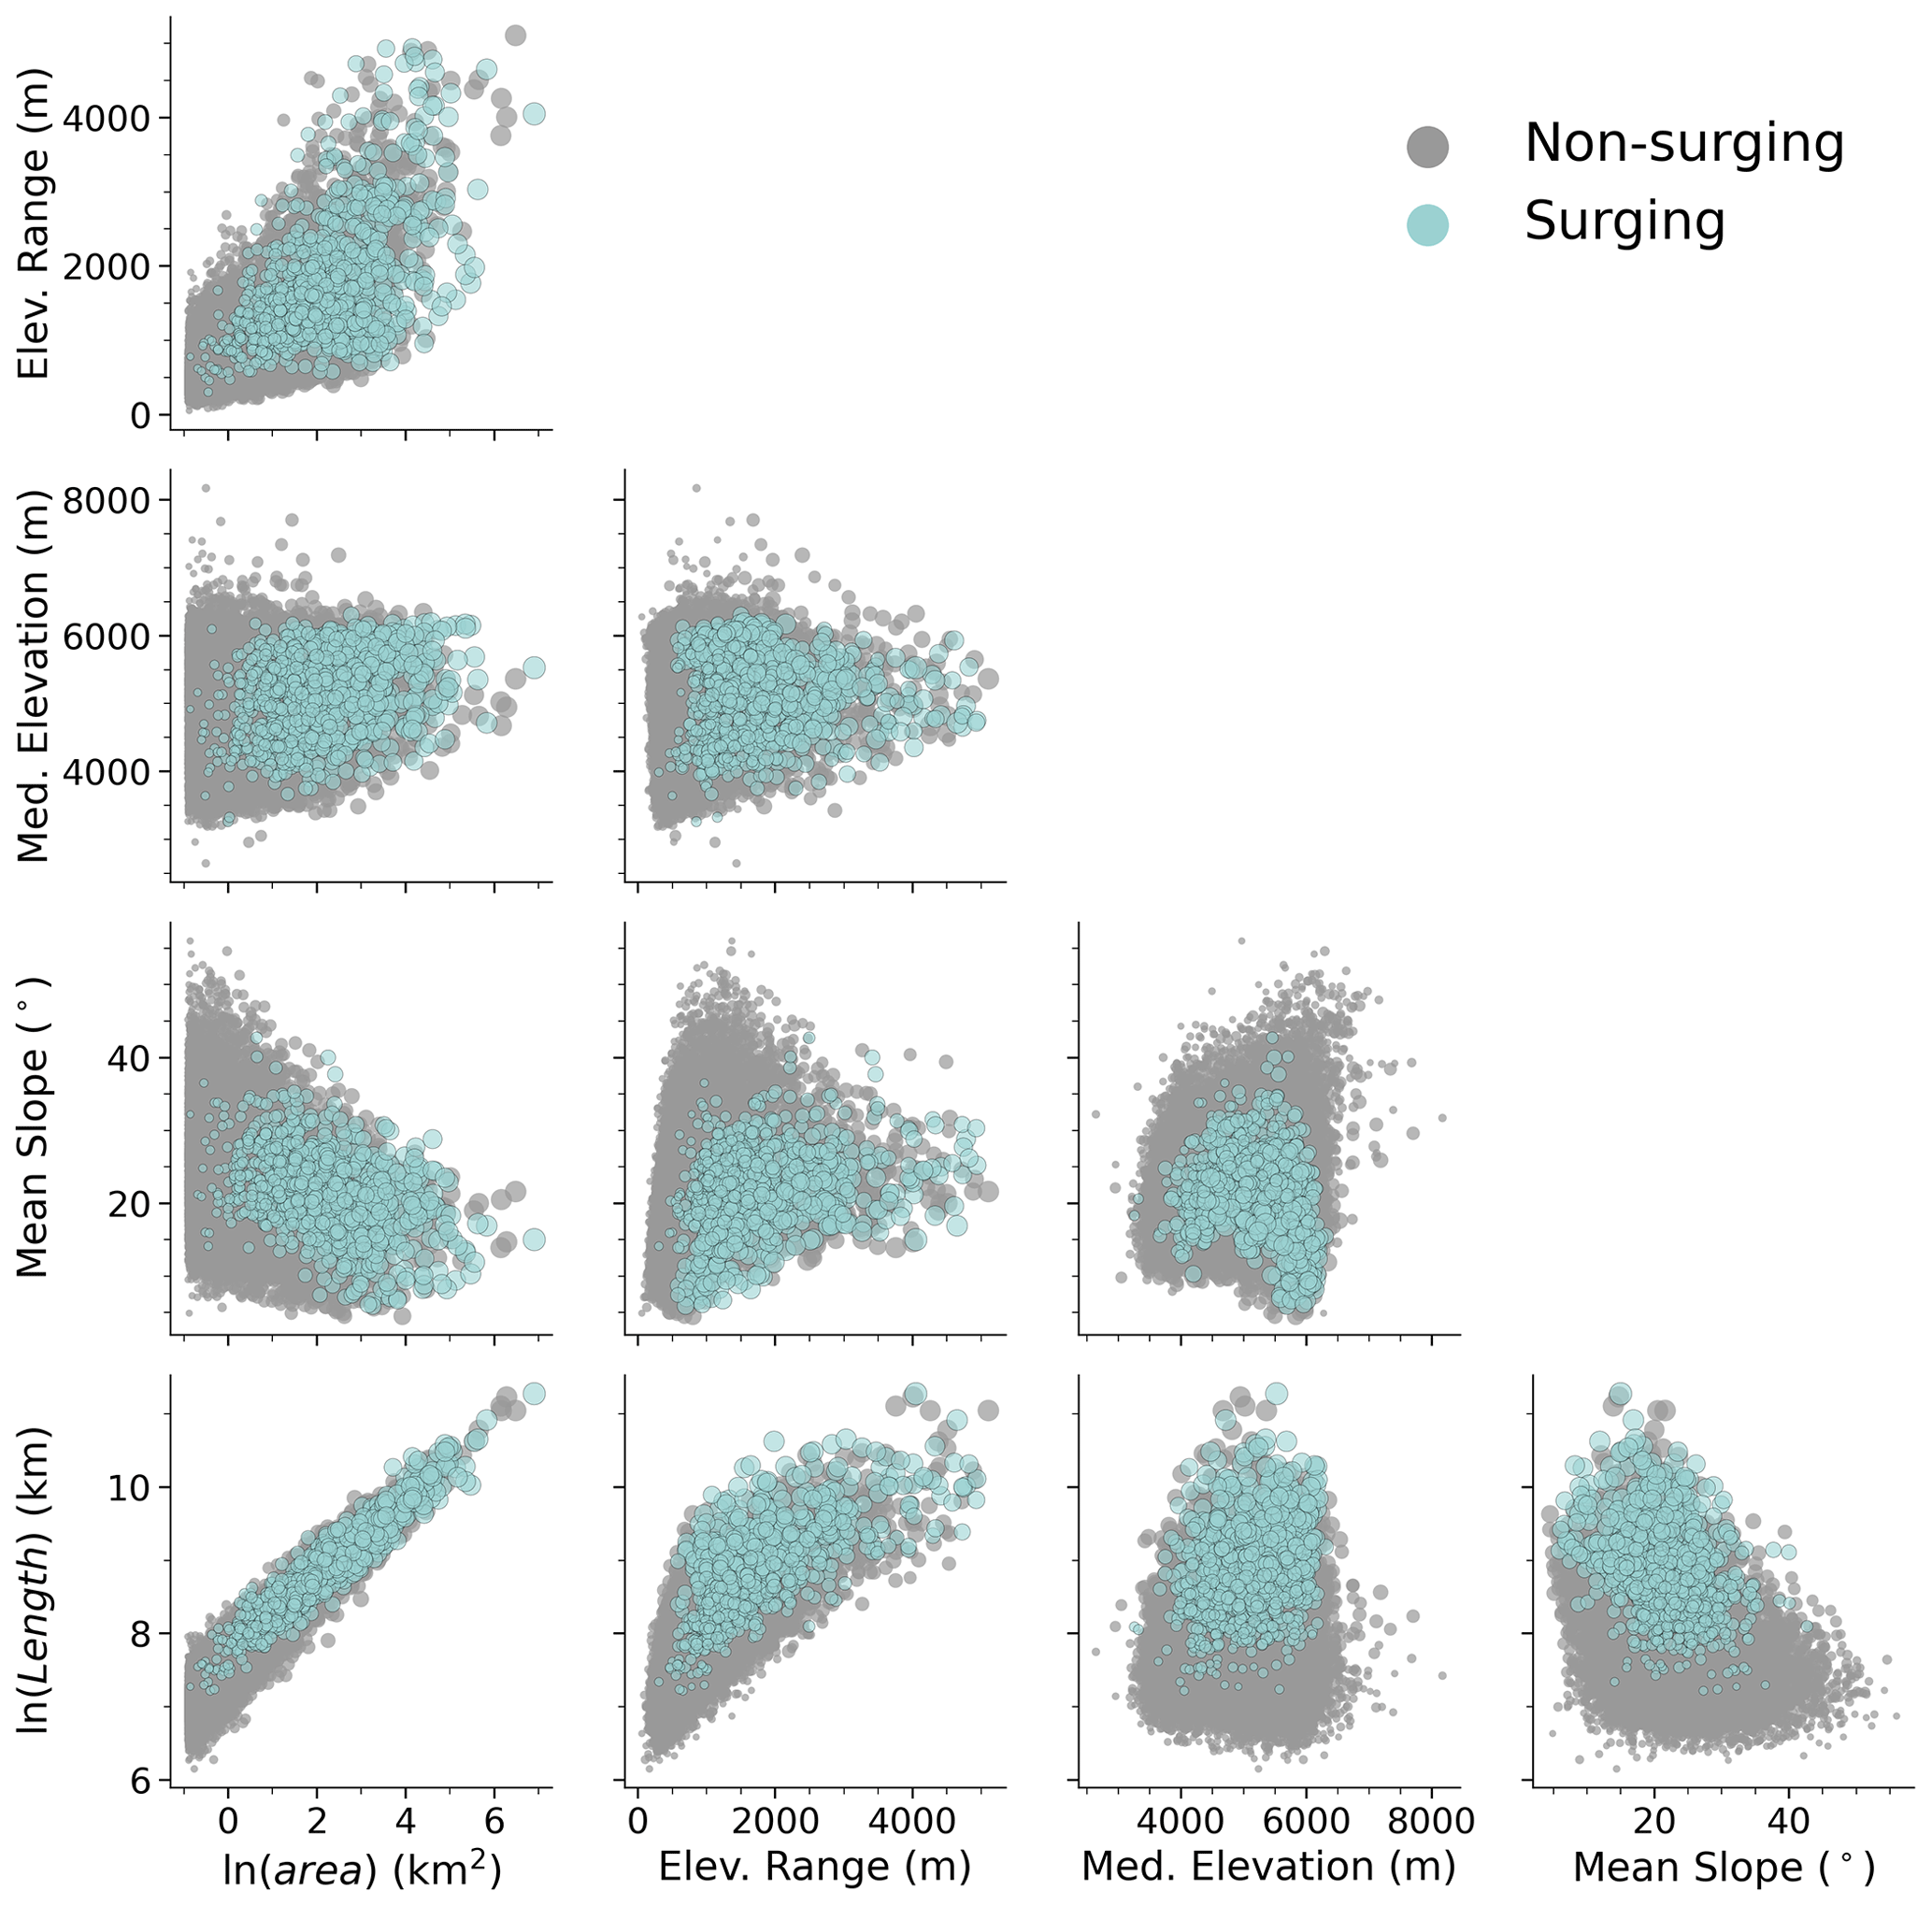
Figure 9Bivariate scatterplots of geometric properties of non-surging and surging glaciers. The larger dots represent larger glaciers. Glaciers smaller than 0.4 km2 were excluded in the non-surging glacier class.
The correlation between different glacier geometric properties was analyzed through the bivariate scatterplots (see Fig. 9). Among the glacier area, glacier length, and glacier surface elevation range, any two of them have an apparent positive correlation. The glacier mean slope has a moderate correlation with glacier area, length, and elevation range as they are auto-correlated. By contrast, glacier median elevation has little correlation with these parameters. The correlation of any two geometric properties makes little difference between surging and non-surging glaciers. All variables mentioned above are embedded in the attribute table of the published inventory. Detailed descriptions of these variables can be found in Table 5.
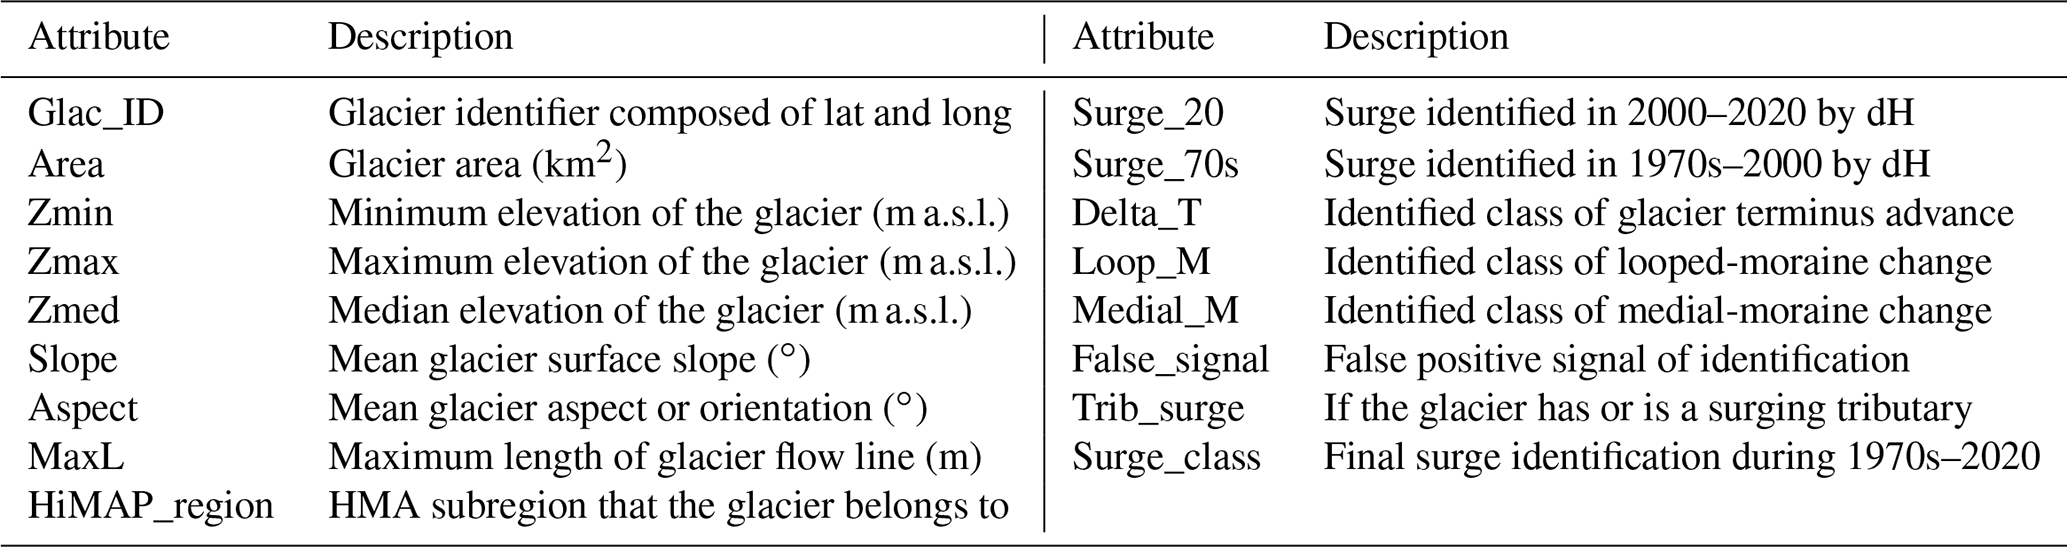
Table 5Attribute information in the present surging glacier inventory.
6.1 Uncertainty analysis
Figure 10 shows the uncertainties in four kinds of elevation difference observations and three kinds of glacier elevation change observations. The four kinds of elevation difference observations include three kinds of DEM difference observations and one kind of radar penetration depth difference observation. The uncertainties in glacier elevation change originated from the DEM difference and from the radar penetration depth difference. For each kind of elevation difference observation, the average uncertainty (NMAD) is generally smaller than 4.50 m, and the uncertainty of the penetration depth difference is the smallest. Due to the large distortion in the KH-9 images, the NASA DEM – KH-9 DEM results had the highest uncertainties. In general, the uncertainties of our elevation change results are acceptable. Compared with the typical surface elevation change resulting from a glacier surge (tens to hundreds of meters), the uncertainties are very small. For example, a large uncertainty in the KH-9 DEM, the related elevation change observation (say 8.00 m) is only about half of the threshold we used for identifying a possible surging glacier.
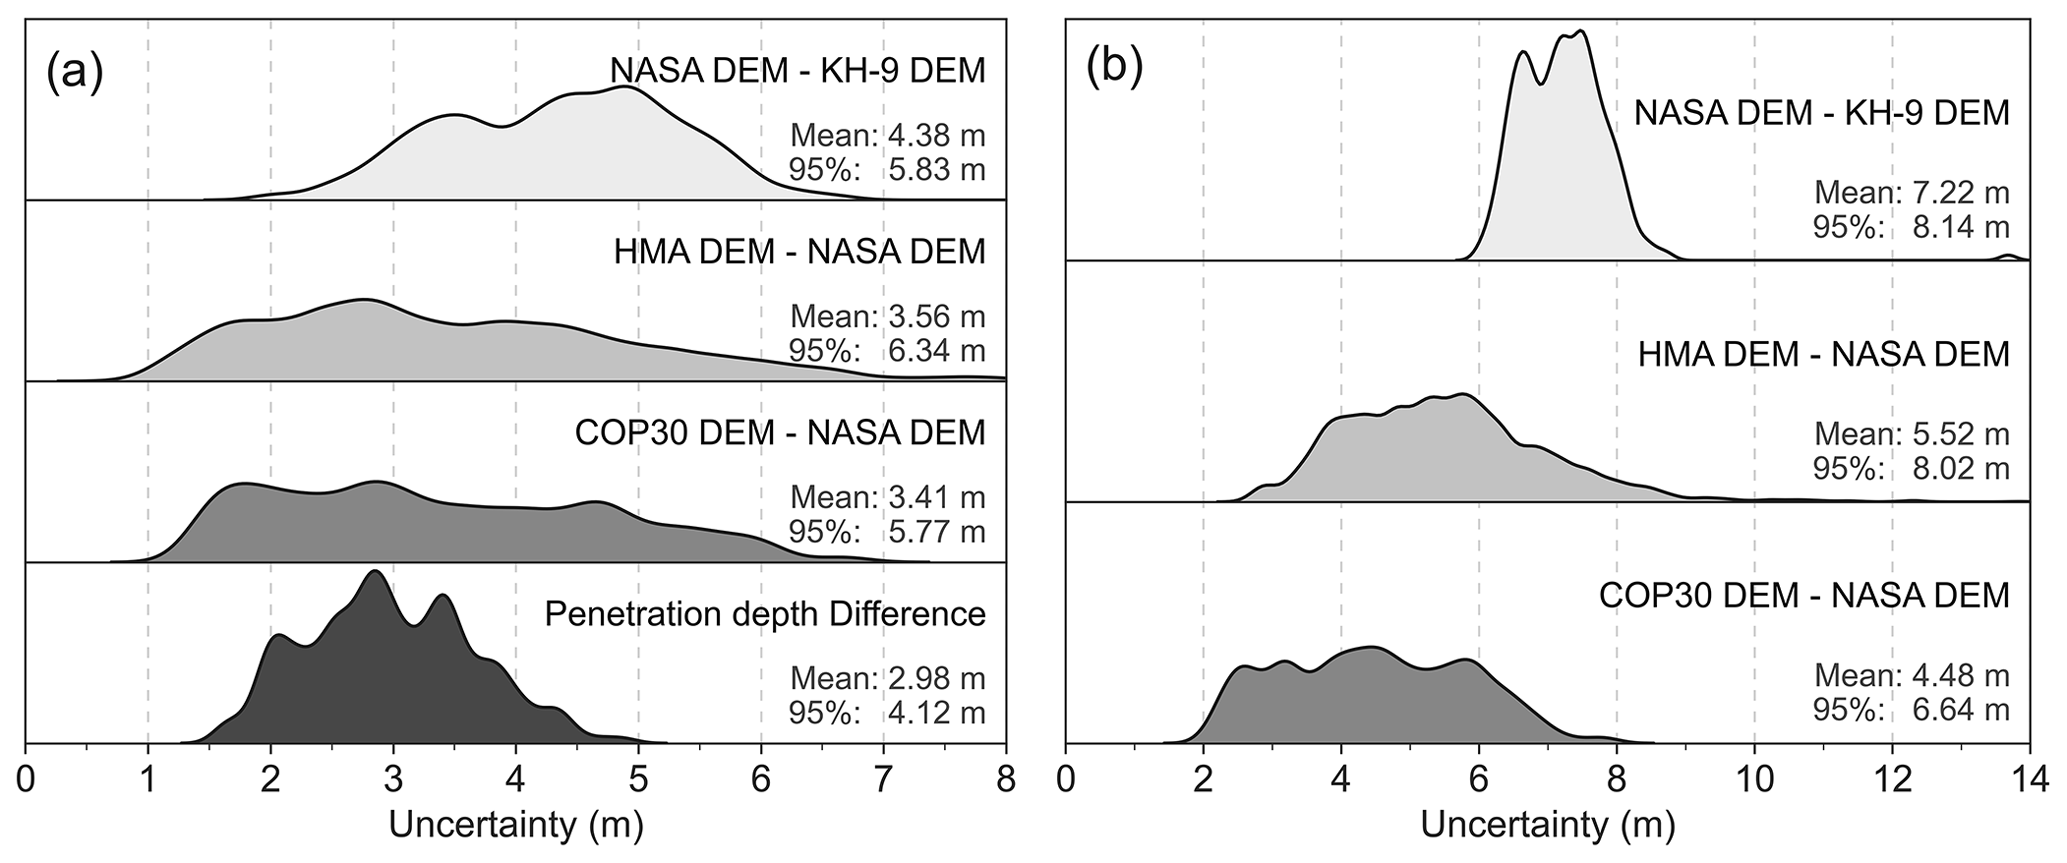
Figure 10The distribution of uncertainties in (a) four kinds of elevation difference observations and (b) three kinds of glacier elevation change observations. In each category, the shaded area denotes the density distribution of the uncertainties in corresponding observations.
In order to illustrate the impact of topography on the uncertainty, we calculated the NMAD of the COP30 DEM – NASA DEM difference over stable regions within different slope ranges (0–55∘). As shown in Fig. 11, the uncertainties in elevation difference observations increase as the terrain becomes steeper. Uncertainties over very steep regions (slope >40∘) can be 2 times larger than over flat terrain (slope <10∘). Therefore, dH observations over crests, horns, and heads of glaciers generally have relatively large errors. In such regions, stereo-optical images suffer from serious distortion and sometimes have very low brightness contrast due to snow cover; in the meantime, SAR images are affected by shadows and layover (Pieczonka and Bolch, 2015). However, the terrain of the main glacier bodies where surges usually occur is gentler, and therefore the uncertainties of glacier surface elevation changes should be much lower than the thresholds that we used for identifying surges. Besides, the relatively large errors in dH maps are discontinuous in space, while the elevation changes used for identifying surges are spatially continuous. Hence, the uncertainty of glacier elevation change has no substantial impact on the identification of glacier surges.
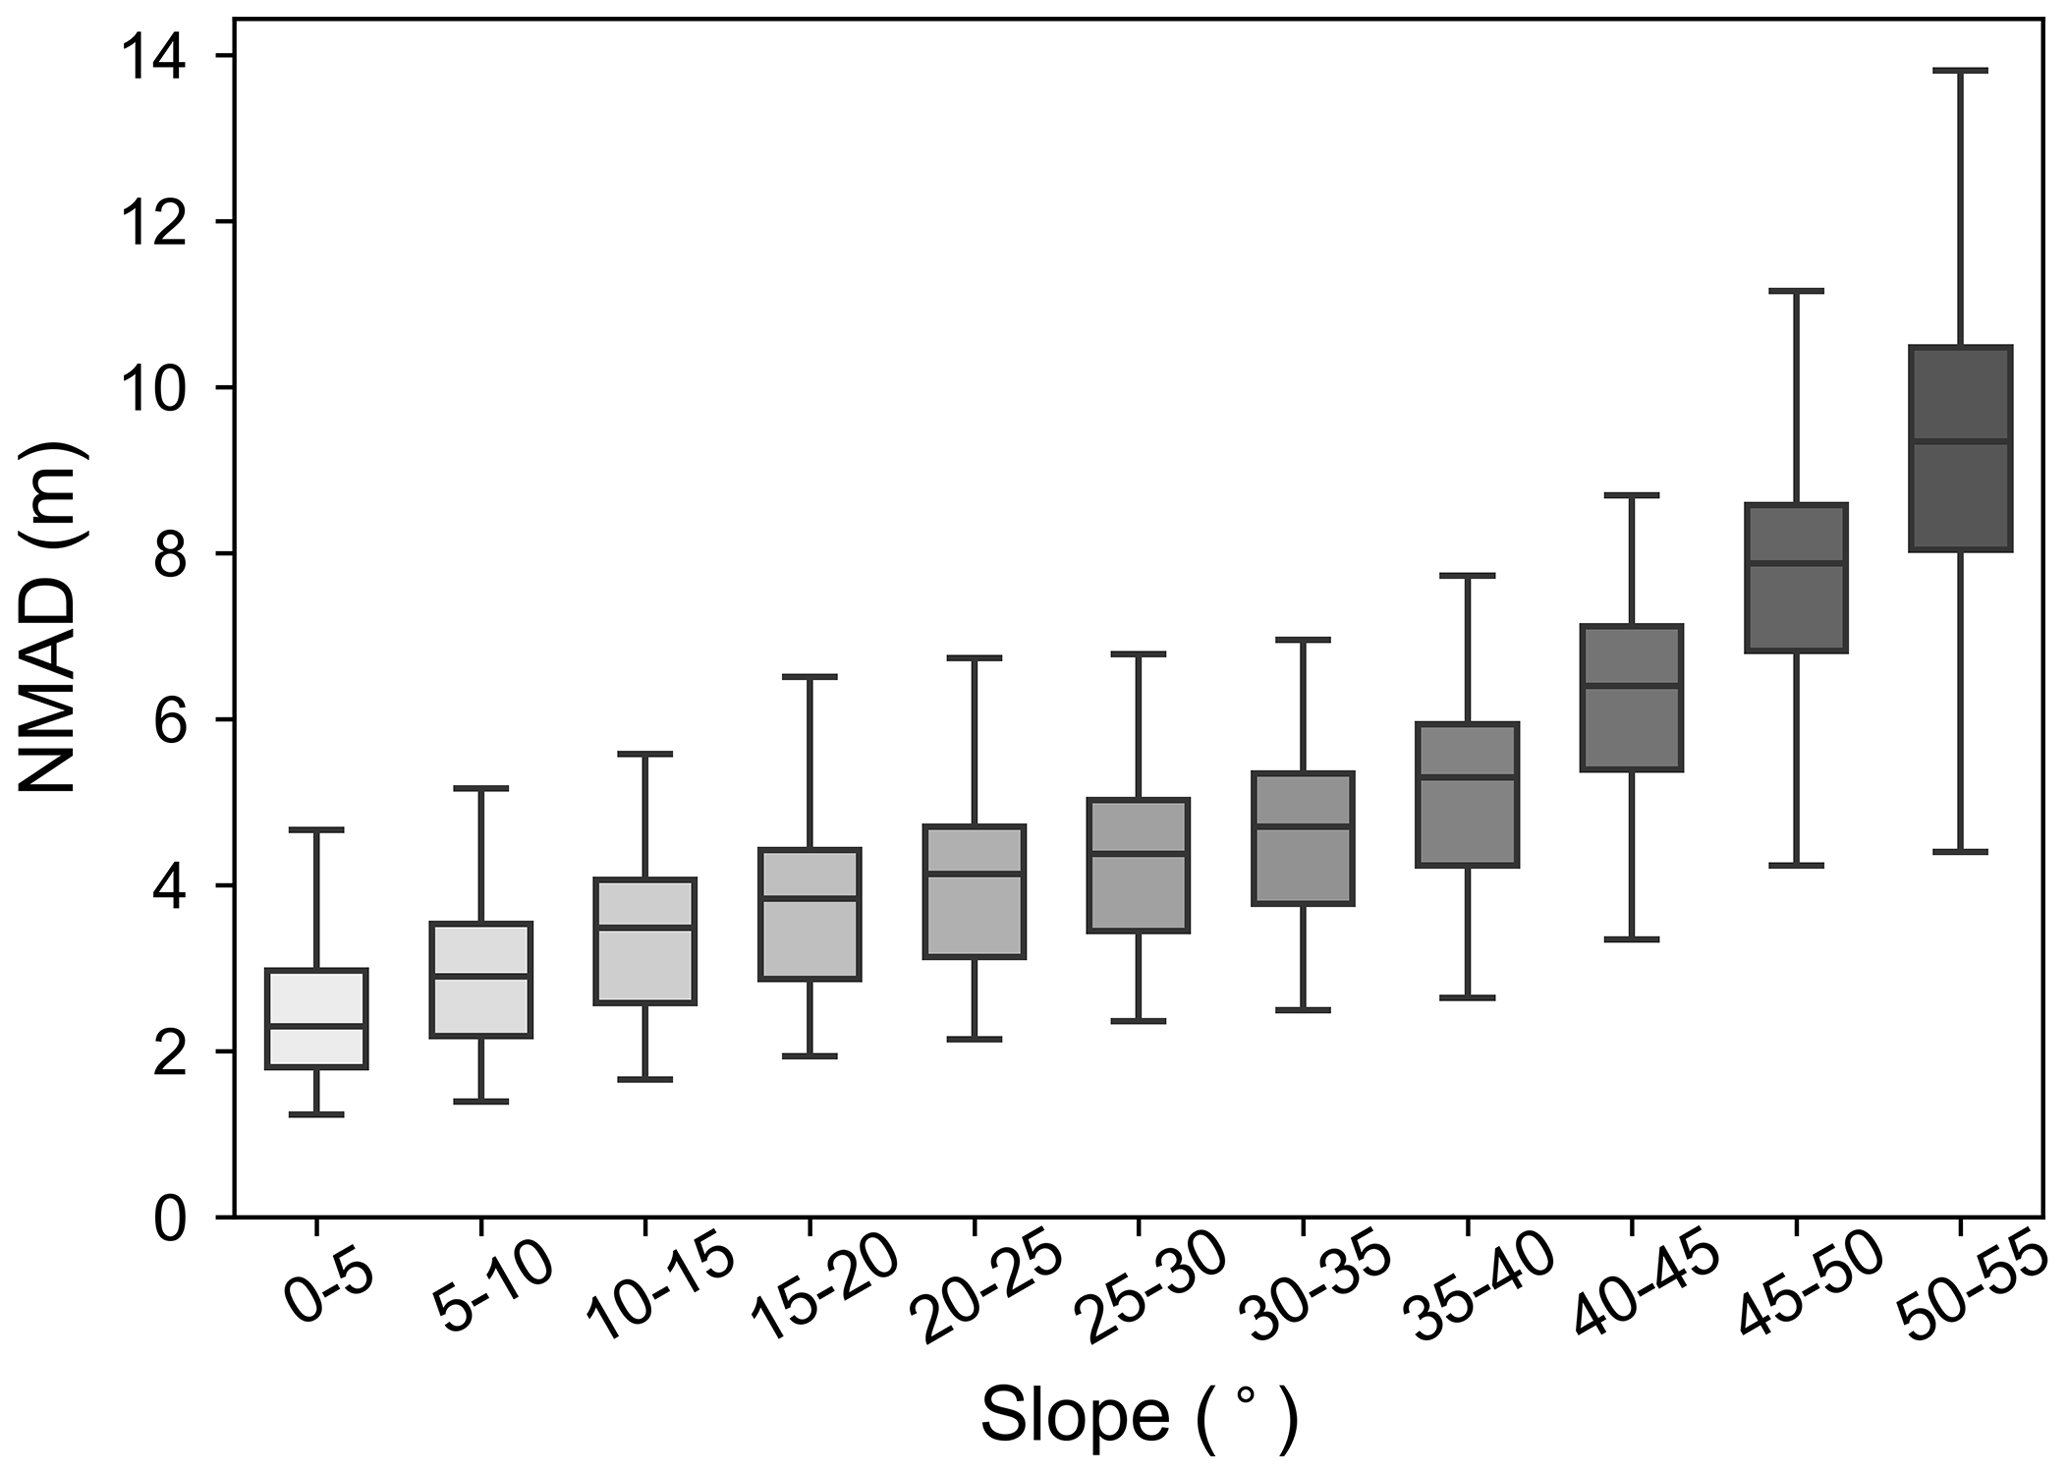
Figure 11The distribution of NMAD of COP30 DEM – NASA DEM difference over stable regions within different slope ranges. The box denotes the interquartile range (IQR, i.e., 75th percentile–25th percentile) in each group. The horizontal line in the box denotes the median value in each group. The upper and lower line represents the range between the minimum value (25th percentile − 1.5 IQR) and the maximum value (75th percentile + 1.5 IQR).
Similarly to previous studies (Sevestre and Benn, 2015; Goerlich et al., 2020), the surging glacier identification in this study was completed through a manual qualitative interpretation. It is difficult to provide a quantitative index to represent the uncertainty of surge identification. However, we have assigned a three-class indicator to represent the surge likelihood, which could aid that to a degree.
6.2 Characteristics of surging glaciers
The comparisons between geometric characteristics of surging and non-surging glaciers show that surge activity is more likely to occur in the glacier with a larger area, wider elevation range, and longer length (Figs. 7 and 8), which is consistent with previous studies (Barrand and Murray, 2006; Jiskoot, 2011; Sevestre and Benn, 2015; Mukherjee et al., 2017; Guillet et al., 2022).
Several studies have demonstrated that surging glaciers tend to have a shallower slope (Jiskoot et al., 2000; Guillet et al., 2022). However, we argue that this rule was concluded from an unbalanced comparison as non-surging glaciers have a higher proportion of small glaciers than surging glaciers. Meanwhile, the inverse relationship between the glacier slope and length (Clarke, 1991; Sevestre and Benn, 2015) may not apply to very small glaciers (i.e., smaller than 1 km2). As shown in Figs. 9d and 10, among the non-surging glaciers, the small ones occupy a high proportion, and their mean slopes have strong variability. Thus, we can conclude that steeper glaciers are more likely to surge when the comparison is restricted to similar areas. As for the glacier median elevation, since it is almost uncorrelated to the glacier area, glacier length, glacier elevation range, and glacier mean slope (see Fig. 9), it can be deemed to be an irregular glacier index. However, among glaciers that have similar areas, steeper glaciers generally have a lower median elevation. That is why the median elevation of surging glaciers is slightly smaller than that of non-surging glaciers (Fig. 8e).
These comparisons could now lead to a conclusion as follows: the surging glaciers are generally longer and have a larger elevation range than non-surging glaciers since they have more mass storage. However, when glaciers are similar in area, a steeper surface slope is more likely to lead to surge.
The spatial distribution of surging glaciers in HMA presents a strong heterogeneity. About 83 % of identified surging glaciers are located in the northwestern region, including the Central Tien Shan, Pamirs, Karakoram, and Western Kunlun, and they occupy about 87 % of the total identified surging glacier area (see Fig. 4 and Table 3). As discussed above, larger glaciers are more likely to surge. The northwest regions generally hold larger glaciers and therefore hold more surging glaciers. In other subregions, large glaciers are usually concentrated in some great ice fields, such as the Geladandong, Puruogangri, and Xinqingfeng. Surging glaciers in these subregions are usually clustered in a few watersheds.
6.3 Comparison with previous surging glacier inventories
Guillet et al. (2022) presented a comprehensive surging glacier inventory of HMA for the period 2000–2018 from a multi-factor remote sensing approach. Prior to the comparison, we generated an inventory based on the RGI6.0, as Guillet et al. (2022) did. Guillet et al. (2022) identified 666 surging glaciers, covering 19.5 % of the total glacier area. We identified 890 surging glaciers (809 if represented by RGI6.0 polygons), covering 16.59 % of the total glacier area. We attributed the lower area ratio of surging glaciers to two reasons. First, in our inventory, the surging tributaries were separated from the non-surging trunks. Second, many outcrop rocks and shaded areas are excluded from the GAMDAM2 glacier areas (Sakai, 2019), which would lower our surging-area ratio but make the result more accurate. If we assign our identified surging glaciers to the RGI6.0 polygons without tributary separation, the surging-area ratio would be larger (20.25 %).
Within our inventory, 556 surging and 62 surge-like glaciers were also identified by Guillet et al. (2022), and the discrepancy of identifications mostly occurred on small glaciers. If only the period 2000–2020 was considered, 657 surging glaciers were identified by us, which is very close to the amount (666) of Guillet et al. (2022). For the period 1970s–2000, we found 151 surging and 101 surge-like glaciers that were not identified by Guillet et al. (2022). Overall, we have newly identified 253 surging and 248 surge-like glaciers. We owed the new findings to the longer observation period and multiple elevation change observations. However, 47 surging glaciers presented by Guillet et al. (2022) were missed in this study, and 62 surge-like glaciers in our new inventory were identified as surging glaciers by Guillet et al. (2022). We checked the glaciers not included in our inventory but included in the inventory of Guillet et al. (2022), as well as those included in our inventory but not included in Guillet et al. (2022)'s inventory, and this step helped us to find 21 more surging glaciers. We attribute this to the missing criterion of flow velocities, which could capture some small surges without obvious elevation change or morphological change. Besides, the DEMs used in this study were suffering from data voids and incomplete spatial coverage, especially for the KH-9 DEM, which could result in a relatively conservative identification.
Multiple studies have identified surging glaciers in the Karakoram based on different data sources. For example, Bhambri et al. (2017) identified 221 surging and surge-like glaciers (counting tributaries of a glacier system as individual glaciers) based on glacier morphological changes detected from space-borne optical images acquired from 1972 to 2016, in situ observations, and archive photos dating back to the 1840s. However, the boundary used by Bhambri et al. (2017) to define the extent of Karakoram is much smaller than that used in our inventory. A much smaller group of surging glaciers (88) was identified by Copland et al. (2011) based on a similar method and the data acquired between 1960 and 2013. Rankl et al. (2014) identified 101 surging glaciers in the Karakoram by detecting changes in glacier surface velocity and terminus position between 1976 and 2012. The results of Guillet et al. (2022) should be more reliable than previous ones because more criteria were used for identifying surging glaciers. Compared with previous inventories, our inventory includes more surging glaciers in the Karakoram (354). Among the 223 surging glaciers in the Karakoram identified by Guillet et al. (2022), 203 were identified as surging glaciers and 12 were identified as surge-like glaciers in this study, which means only 8 surging glaciers presented by Guillet et al. (2022) were not included in our inventory. The high coincidence between the two inventories indicates that our surging glacier identification result is reliable. In total, we have newly identified 101 surging and 101 surge-like glaciers in this region.
Based on the method of glacier terminus change monitoring in the Google Earth Engine, Vale et al. (2021) identified changes in the terminus of 137 surging glaciers. In total, 127 verified surging and 6 surge-like glaciers in our inventory were included in their inventory; i.e., only four glaciers were missed in this study. We found that these four missing surging glaciers had slight terminus advancing (<200 m) during long surging periods (>10 years). The very slow and slight terminus advance is difficult to identify through visual interpretation.
In the Pamirs, Sevestre and Benn (2015) identified 820 surge-type glaciers based on publications and reports, but Goerlich et al. (2020) reported only 186 surging glaciers based on observations of glacier flow velocity, elevation change, etc. We found that, if Goerlich et al. (2020) applied the GAMDAM2 glacier polygons used in this study, the number of identified surging glaciers would be 182. Among the 182 surging glaciers identified by Goerlich et al. (2020), 153 were identified as surging glaciers and 15 were identified as surge-like glaciers in our study. Although 14 surging glaciers are missed in this study, our inventory contains another 94 surging and 44 surge-like glaciers. The main cause for the discrepancy is that the glacier elevation change observations before 2000 used by Goerlich et al. (2020) only cover a small part of the Western Pamir. In this region, our inventory shared 193 surging glaciers with Guillet et al. (2022)'s inventory, and 185 of them were identified during the period 2000–2020, which also manifests a high coincidence of the two results.
In the Western Kunlun, Yasuda and Furuya (2015) reported 9 surging glaciers in the main range only based on changes in the glacier flow velocity and terminus position of 31 glaciers, and another 9 surging glaciers were found in the northwestern part of the Western Kunlun Shan by Chudley and Willis (2019). A larger number (60) was found by Guillet et al. (2022). However, our inventory includes even more surging (82) and surge-like (47) glaciers in the Western Kunlun Shan. For the period 2000–2020, we identified 61 surging glaciers, which is very close to the number presented by Guillet et al. (2022). In the Central Tien Shan, Mukherjee et al. (2017) identified 39 surge-type (including 9 surging and 13 very probable surging) glaciers through the analysis of changes in surface elevation and morphology from 1964 to 2014, whereas 79 (59 surging and 20 surge-like) were identified in our study. The insufficient coverage of elevation change observation (only covering the western part of the Central Tien Shan) may be the main reason for the discrepancy in identification results. Guillet et al. (2022) identified 54 surging glaciers during 2000–2018, from which 36 were confirmed in our inventory.
The presented inventory and the multi-temporal elevation change results used to identify surging glaciers are freely available at https://doi.org/10.5281/zenodo.7961207 (Guo et al., 2023). The inventory contains glacier outlines and manually defined center points of surging glaciers with geometric attributes and is distributed in GeoPackage (.gpkg) and Esri shapefile (.shp) formats. The glacier polygons are compiled from the GAMDAM2 glacier inventory. In total, eight fields are integrated into the attributes table to describe the surging information of the corresponding glacier, as mentioned in Sect. 5.3. The description of each field in the attribute table is listed in Table 5. The DEM differences (COP30 DEM – NASA DEM, HMA DEM – NASA DEM, and NASA DEM – KH-9 DEM) are compressed into individual zip files, respectively. The elevation change results of surging glaciers were divided into multi-temporal 1∘ × 1∘ tiled GeoTIFF grids. The metadata file is stored in a text file (README.txt), which contains the dataset descriptions and details of the attribute information of the inventory.
The code used for the elevation change estimation is available at https://github.com/TristanBlus/dem_coreg. This code was developed based on the demcoreg package (Shean et al., 2019, https://doi.org/10.5281/zenodo.3243481).
This study presents a new inventory of surging glaciers across the entire HMA range. For the surge identification, we relied on glacier surface elevation changes derived from multiple elevation sources and complementarily on optical satellite images for assessing morphological changes. In total, 890 surging and 336 probably or possibly surging glaciers were identified in the new inventory. Through the analysis of geometric parameters, we found that surging glaciers generally have a greater area, length, and elevation range than non-surging glaciers. However, the differences are smaller when taking the glacier size distribution into account. When considering glaciers of similar areas, the steeper ones are more likely to surge. Benefiting from the long period and wide coverage of surface elevation change observations, our study newly identified 253 surging and 248 surge-like glaciers in HMA compared to the previous inventory (Guillet et al., 2022). However, our inventory does not provide the surge duration period and the maximum flow velocity, which are useful to describe the dynamic process of each glacier surge activity. Improvements should be made by combining multi-criteria identification methods. Considering the fact that glacier surges are more widespread than we thought, the inventory presented in this study still needs further improvement.
JL and LG conceived this study and wrote the paper. LG developed the processing flow, complied the inventory, and drew the figures with support from JL. AD generated the KH-9 DEM. AD, ZL, and XL helped with the analysis of the results and the discussions, as well as the editing of the paper. ZL, JL, and JZ provided funding acquisition. All the authors have contributed and agreed to the published version of the paper.
The contact author has declared that none of the authors has any competing interests.
Publisher’s note: Copernicus Publications remains neutral with regard to jurisdictional claims in published maps and institutional affiliations.
This article is part of the special issue “Extreme environment datasets for the three poles”. It is not associated with a conference.
The authors express their gratitude to all the institutions that provided the open-source datasets used in this study: the NASA DEM from LP DAAC (https://e4ftl01.cr.usgs.gov/MEASURES/NASADEM_HGT.001/, last access: 8 September 2021), the Copernicus DEM from the European Space Agency (ESA) (https://spacedata.copernicus.eu/collections/copernicus-digital-elevation-model, last access: 7 August 2021), the HMA DEM processed by David Shean from the National Snow and Ice Data Center (NSIDC) (https://nsidc.org/data/HMA_DEM8m_MOS/versions/1, last access: 22 September 2021), the Randolph Glacier Inventory version 6.0 (https://doi.org/10.7265/4m1f-gd79, RGI Consortium, 2017), and the updated GAMDAM glacier inventory (https://doi.org/10.1594/PANGAEA.891419, Sakai, 2018) presented by Akiko Sakai. The authors also appreciate the valuable comments from Frank Paul, Grégoire Guillet, and the anonymous referee.
This work was supported by the Strategic Priority Research Program of Chinese Academy of Sciences (grant no. XDA20100101), the National Natural Science Fund for Distinguished Young Scholars (grant no. 41925016), the Hunan Key Laboratory of Remote Sensing of Ecological Environment in Dongting Lake Area (grant no. 2021-010), the National Natural Science Foundation of China (grant no. 41904006), the Fundamental Research Funds for the Central Universities of Central South University (grant no. 2021zzts0265).
This paper was edited by Georg Veh and reviewed by Gregoire Guillet, Frank Paul, and one anonymous referee.
Abdel Jaber, W., Rott, H., Floricioiu, D., Wuite, J., and Miranda, N.: Heterogeneous spatial and temporal pattern of surface elevation change and mass balance of the Patagonian ice fields between 2000 and 2016, The Cryosphere, 13, 2511–2535, https://doi.org/10.5194/tc-13-2511-2019, 2019.
AIRBUS: Copernicus Digital Elevation Model Validation Report, AIRBUS Defence and Space GmbH, 17–20, 2020.
Barrand, N. E. and Murray, T.: Multivariate Controls on the Incidence of Glacier Surging in the Karakoram Himalaya, Arct. Antarct. Alp. Res., 38, 489–498, https://doi.org/10.1657/1523-0430(2006)38[489:MCOTIO]2.0.CO;2, 2006.
Beaud, F., Aati, S., Delaney, I., Adhikari, S., and Avouac, J.-P.: Surge dynamics of Shisper Glacier revealed by time-series correlation of optical satellite images and their utility to substantiate a generalized sliding law, The Cryosphere, 16, 3123–3148, https://doi.org/10.5194/tc-16-3123-2022, 2021.
Benn, D. I., Fowler, A. C., Hewitt, I., and Sevestre, H.: A general theory of glacier surges, J. Glaciol., 65, 701–716, https://doi.org/10.1017/jog.2019.62, 2019.
Bhambri, R., Hewitt, K., Kawishwar, P., and Pratap, B.: Surge-type and surge-modified glaciers in the Karakoram, Sci. Rep.-UK, 7, 15391, https://doi.org/10.1038/s41598-017-15473-8, 2017.
Bhambri, R., Hewitt, K., Haritashya, U. K., Chand, P., Kumar, A., Verma, A., Tiwari, S. K., and Rai, S. K.: Characteristics of surge-type tributary glaciers, Karakoram, Geomorphology, 403, 108161, https://doi.org/10.1016/j.geomorph.2022.108161, 2022.
Bolch, T., Kulkarni, A., Kaab, A., Huggel, C., Paul, F., Cogley, J. G., Frey, H., Kargel, J. S., Fujita, K., Scheel, M., Bajracharya, S., and Stoffel, M.: The State and Fate of Himalayan Glaciers, Science, 336, 310–314, https://doi.org/10.1126/science.1215828, 2012.
Bolch, T., Pieczonka, T., Mukherjee, K., and Shea, J.: Brief communication: Glaciers in the Hunza catchment (Karakoram) have been nearly in balance since the 1970s, The Cryosphere, 11, 531–539, https://doi.org/10.5194/tc-11-531-2017, 2017.
Bolch, T., Shea, J. M., Liu, S., Azam, F. M., Gao, Y., Gruber, S., Immerzeel, W. W., Kulkarni, A., Li, H., Tahir, A. A., Zhang, G., and Zhang, Y.: Status and Change of the Cryosphere in the Extended Hindu Kush Himalaya Region, in: The Hindu Kush Himalaya Assessment, edited by: Wester, P., Mishra, A., Mukherji, A., and Shrestha, A. B., Springer International Publishing, Cham, 209–255, https://doi.org/10.1007/978-3-319-92288-1_7, 2019.
Brun, F., Berthier, E., Wagnon, P., Kääb, A., and Treichler, D.: A spatially resolved estimate of High Mountain Asia glacier mass balances from 2000 to 2016, Nat. Geosci., 10, 668–673, https://doi.org/10.1038/ngeo2999, 2017.
Chudley, T. R. and Willis, I. C.: Glacier surges in the north-west West Kunlun Shan inferred from 1972 to 2017 Landsat imagery, J. Glaciol., 65, 1–12, https://doi.org/10.1017/jog.2018.94, 2019.
Clarke, G. K. C.: Length, width and slope influences on glacier surging, J. Glaciol., 37, 236–246, https://doi.org/10.3189/S0022143000007255, 1991.
Clarke, G. K. C., Schmok, J. P., Ommanney, C. S. L., and Collins, S. G.: Characteristics of surge-type glaciers, J. Geophys. Res.-Sol. Ea., 91, 7165–7180, https://doi.org/10.1029/JB091iB07p07165, 1986.
Cogley, J. G., Arendt, A. A., Bauder, A., Braithwaite, R. J., Hock, R., J, B., R., Jansson, P., Kaser, G., Moller, M., Nicholson, L., Rasmussen, L. A., and Zemp, M.: Glossary of glacier mass balance and related terms, IACS Contribution No. 2, UNESCO, Paris, https://doi.org/10.5167/uzh-53475, 2011.
Copland, L., Sylvestre, T., Bishop, M. P., Shroder, J. F., Seong, Y. B., Owen, L. A., Bush, A., and Kamp, U.: Expanded and Recently Increased Glacier Surging in the Karakoram, Arct. Antarct. Alp. Res., 43, 503–516, 2011.
Crippen, R., Buckley, S., Agram, P., Belz, E., Gurrola, E., Hensley, S., Kobrick, M., Lavalle, M., Martin, J., Neumann, M., Nguyen, Q., Rosen, P., Shimada, J., Simard, M., and Tung, W.: NASADEM GLOBAL ELEVATION MODEL: METHODS AND PROGRESS, Int. Arch. Photogramm. Remote Sens. Spatial Inf. Sci., XLI-B4, 125–128, https://doi.org/10.5194/isprs-archives-XLI-B4-125-2016, 2016.
Dehecq, A., Gardner, A. S., Alexandrov, O., McMichael, S., Hugonnet, R., Shean, D., and Marty, M.: Automated Processing of Declassified KH-9 Hexagon Satellite Images for Global Elevation Change Analysis Since the 1970s, Front. Earth Sci., 8, 566802, https://doi.org/10.3389/feart.2020.566802, 2020.
Fan, Y., Ke, C.-Q., Zhou, X., Shen, X., Yu, X., and Lhakpa, D.: Glacier mass-balance estimates over High Mountain Asia from 2000 to 2021 based on ICESat-2 and NASADEM, J. Glaciol., 69, 500–512, https://doi.org/10.1017/jog.2022.78, 2023.
Farinotti, D., Immerzeel, W. W., Kok, R., Quincey, D. J., and Dehecq, A.: Manifestations and mechanisms of the Karakoram glacier Anomaly, Nat. Geosci., 13, 8–16, https://doi.org/10.1038/s41561-019-0513-5, 2020.
Farnsworth, W. R., Ingólfsson, Ó., Retelle, M., and Schomacker, A.: Over 400 previously undocumented Svalbard surge-type glaciers identified, Geomorphology, 264, 52–60, https://doi.org/10.1016/j.geomorph.2016.03.025, 2016.
Farr, T. G., Rosen, P. A., Caro, E., Crippen, R., Duren, R., Hensley, S., Kobrick, M., Paller, M., Rodriguez, E., Roth, L., Seal, D., Shaffer, S., Shimada, J., Umland, J., Werner, M., Oskin, M., Burbank, D., and Alsdorf, D.: The Shuttle Radar Topography Mission, Rev. Geophys., 45, RG2004, https://doi.org/10.1029/2005RG000183, 2007.
Fowler, A. C.: A theory of glacier surges, J. Geophys. Res., 92, 9111–9120, https://doi.org/10.1029/JB092iB09p09111, 1987.
Fowler, A. C., Murray, T., and Ng, F. S. L.: Thermally controlled glacier surging, J. Glaciol., 47, 527–538, https://doi.org/10.3189/172756501781831792, 2001.
Gardelle, J., Berthier, E., Arnaud, Y., and Kääb, A.: Region-wide glacier mass balances over the Pamir-Karakoram-Himalaya during 1999–2011, The Cryosphere, 7, 1263–1286, https://doi.org/10.5194/tc-7-1263-2013, 2013.
Goerlich, F., Bolch, T., and Paul, F.: More dynamic than expected: an updated survey of surging glaciers in the Pamir, Earth Syst. Sci. Data, 12, 3161–3176, https://doi.org/10.5194/essd-12-3161-2020, 2020.
Guillet, G., King, O., Lv, M., Ghuffar, S., Benn, D., Quincey, D., and Bolch, T.: A regionally resolved inventory of High Mountain Asia surge-type glaciers, derived from a multi-factor remote sensing approach, The Cryosphere, 16, 603–623, https://doi.org/10.5194/tc-16-603-2022, 2022.
Guo, L., Li, J., Dehecq, A., Li, Z., Li, X., and Zhu, J.: A new inventory of High Mountain Asia surging glaciers derived from multiple elevation datasets since the 1970s, Version 2, Zenodo [data set], https://doi.org/10.5281/zenodo.7961207, 2023.
Guth, P. L. and Geoffroy, T. M.: LiDAR point cloud and ICESat-2 evaluation of 1 second global digital elevation models: Copernicus wins, T. GIS, 25, 2245–2261, https://doi.org/10.1111/tgis.12825, 2021.
Hewitt, K.: The Karakoram Anomaly? Glacier Expansion and the `Elevation Effect', Karakoram Himalaya, Mt. Res. Dev., 25, 332–340, https://doi.org/10.1659/0276-4741(2005)025[0332:TKAGEA]2.0.CO;2, 2005.
Hewitt, K.: Tributary glacier surges: an exceptional concentration at Panmah Glacier, Karakoram Himalaya, J. Glaciol., 53, 181–188, https://doi.org/10.3189/172756507782202829, 2007.
Höhle, J. and Höhle, M.: Accuracy assessment of digital elevation models by means of robust statistical methods, ISPRS J. Photogramm., 64, 398–406, https://doi.org/10.1016/j.isprsjprs.2009.02.003, 2009.
Holzer, N., Vijay, S., Yao, T., Xu, B., Buchroithner, M., and Bolch, T.: Four decades of glacier variations at Muztagh Ata (eastern Pamir): a multi-sensor study including Hexagon KH-9 and Pléiades data, The Cryosphere, 9, 2071–2088, https://doi.org/10.5194/tc-9-2071-2015, 2015.
Hugonnet, R., McNabb, R., Berthier, E., Menounos, B., Nuth, C., Girod, L., Farinotti, D., Huss, M., Dussaillant, I., Brun, F., and Kääb, A.: Accelerated global glacier mass loss in the early twenty-first century, Nature, 592, 726–731, https://doi.org/10.1038/s41586-021-03436-z, 2021.
Jacquemart, M. and Cicoira, A.: Hazardous Glacier Instabilities: Ice Avalanches, Sudden Large-Volume Detachments of Low-Angle Mountain Glaciers, and Glacier Surges, in: Treatise on Geomorphology, Elsevier, 330–345, https://doi.org/10.1016/B978-0-12-818234-5.00188-7, 2022.
Jiskoot, H.: Glacier Surging, in: Encyclopedia of Snow, Ice and Glaciers, edited by: Singh, V. P., Singh, P., and Haritashya, U. K., Springer Netherlands, Dordrecht, 415–428, https://doi.org/10.1007/978-90-481-2642-2_559, 2011.
Jiskoot, H., Murray, T., and Boyle, P.: Controls on the distribution of surge-type glaciers in Svalbard, J. Glaciol., 46, 412–422, https://doi.org/10.3189/172756500781833115, 2000.
Kamb, B.: Glacier surge mechanism based on linked cavity configuration of the basal water conduit system, J. Geophys. Res., 92, 9083–9100, https://doi.org/10.1029/JB092iB09p09083, 1987.
Leclercq, P. W., Kääb, A., and Altena, B.: Brief communication: Detection of glacier surge activity using cloud computing of Sentinel-1 radar data, The Cryosphere, 15, 4901–4907, https://doi.org/10.5194/tc-15-4901-2021, 2021.
Li, J., Li, Z., Zhu, J., Li, X., Xu, B., Wang, Q., Huang, C., and Hu, J.: Early 21st century glacier thickness changes in the Central Tien Shan, Remote Sens. Environ., 192, 12–29, https://doi.org/10.1016/j.rse.2017.02.003, 2017.
Lv, M., Guo, H., Lu, X., Liu, G., Yan, S., Ruan, Z., Ding, Y., and Quincey, D. J.: Characterizing the behaviour of surge- and non-surge-type glaciers in the Kingata Mountains, eastern Pamir, from 1999 to 2016, The Cryosphere, 13, 219–236, https://doi.org/10.5194/tc-13-219-2019, 2019.
Lv, M., Guo, H., Yan, J., Wu, K., Liu, G., Lu, X., Ruan, Z., and Yan, S.: Distinguishing Glaciers between Surging and Advancing by Remote Sensing: A Case Study in the Eastern Karakoram, Remote Sens., 12, 2297, https://doi.org/10.3390/rs12142297, 2020.
Maurer, J. M., Schaefer, J. M., Rupper, S., and Corley, A.: Acceleration of ice loss across the Himalayas over the past 40 years, Science Advances, 5, eaav7266, https://doi.org/10.1126/sciadv.aav7266, 2019.
Maussion, F., Scherer, D., Mölg, T., Collier, E., Curio, J., and Finkelnburg, R.: Precipitation Seasonality and Variability over the Tibetan Plateau as Resolved by the High Asia Reanalysis, J. Climate, 27, 1910–1927, https://doi.org/10.1175/JCLI-D-13-00282.1, 2014.
Maussion, F., Butenko, A., Champollion, N., Dusch, M., Eis, J., Fourteau, K., Gregor, P., Jarosch, A. H., Landmann, J., Oesterle, F., Recinos, B., Rothenpieler, T., Vlug, A., Wild, C. T., and Marzeion, B.: The Open Global Glacier Model (OGGM) v1.1, Geosci. Model Dev., 12, 909–931, https://doi.org/10.5194/gmd-12-909-2019, 2019.
Mukherjee, K., Bolch, T., Goerlich, F., Kutuzov, S., Osmonov, A., Pieczonka, T., and Shesterova, I.: Surge-Type Glaciers in the Tien Shan (Central Asia), Arct. Antarct. Alp. Res., 49, 147–171, https://doi.org/10.1657/AAAR0016-021, 2017.
Murray, T., Strozzi, T., Luckman, A., Jiskoot, H., and Christakos, P.: Is there a single surge mechanism? Contrasts in dynamics between glacier surges in Svalbard and other regions, J. Geophys. Res., 108, 2237, https://doi.org/10.1029/2002JB001906, 2003.
Nuimura, T., Sakai, A., Taniguchi, K., Nagai, H., Lamsal, D., Tsutaki, S., Kozawa, A., Hoshina, Y., Takenaka, S., Omiya, S., Tsunematsu, K., Tshering, P., and Fujita, K.: The GAMDAM glacier inventory: a quality-controlled inventory of Asian glaciers, The Cryosphere, 9, 849–864, https://doi.org/10.5194/tc-9-849-2015, 2015.
Nuth, C. and Kääb, A.: Co-registration and bias corrections of satellite elevation data sets for quantifying glacier thickness change, The Cryosphere, 5, 271–290, https://doi.org/10.5194/tc-5-271-2011, 2011.
Paul, F.: Revealing glacier flow and surge dynamics from animated satellite image sequences: examples from the Karakoram, The Cryosphere, 9, 2201–2214, https://doi.org/10.5194/tc-9-2201-2015, 2015.
Pieczonka, T. and Bolch, T.: Region-wide glacier mass budgets and area changes for the Central Tien Shan between ∼ 1975 and 1999 using Hexagon KH-9 imagery, Global Planet. Change, 128, 1–13, https://doi.org/10.1016/j.gloplacha.2014.11.014, 2015.
Purinton, B. and Bookhagen, B.: Beyond Vertical Point Accuracy: Assessing Inter-pixel Consistency in 30 m Global DEMs for the Arid Central Andes, Front. Earth Sci., 9, 758606, https://doi.org/10.3389/feart.2021.758606, 2021.
Quincey, D. J., Braun, M., Glasser, N. F., Bishop, M. P., Hewitt, K., and Luckman, A.: Karakoram glacier surge dynamics, Geophys. Res. Lett., 38, L18504, https://doi.org/10.1029/2011GL049004, 2011.
Rankl, M., Kienholz, C., and Braun, M.: Glacier changes in the Karakoram region mapped by multimission satellite imagery, The Cryosphere, 8, 977–989, https://doi.org/10.5194/tc-8-977-2014, 2014.
RGI Consortium: Randolph Glacier Inventory - A Dataset of Global Glacier Outlines, Version 6, National Snow and Ice Data Center (NSIDC) [dataset], https://doi.org/10.7265/4M1F-GD79, 2017.
Rott, H., Sturm, K., and Miller, H.: Active and passive microwave signatures of Antarctic firn by means of field measurements and satellite data, Ann. Glaciol., 17, 337–343, https://doi.org/10.3189/S0260305500013070, 1993.
Round, V., Leinss, S., Huss, M., Haemmig, C., and Hajnsek, I.: Surge dynamics and lake outbursts of Kyagar Glacier, Karakoram, The Cryosphere, 11, 723–739, https://doi.org/10.5194/tc-11-723-2017, 2017.
Sakai, A.: Brief communication: Updated GAMDAM glacier inventory over high-mountain Asia , The Cryosphere, 13, 2043–2049, https://doi.org/10.5194/tc-13-2043-2019, 2019.
Sakai, A.: GAMDAM glacier inventory for High Mountain Asia: Central Asia in ArcGIS (shapefile) format, PANGAEA [data set], https://doi.org/10.1594/PANGAEA.891419, 2018.
Sevestre, H. and Benn, D. I.: Climatic and geometric controls on the global distribution of surge-type glaciers: implications for a unifying model of surging, J. Glaciol., 61, 646–662, https://doi.org/10.3189/2015JoG14J136, 2015.
Shean, D., Bhushan, S., Lilien, D., and Meyer, J.: dshean/demcoreg: Zenodo DOI release, Version v1.0.0, Zenodo [code], https://doi.org/10.5281/zenodo.3243481, 2019.
Shean, D. E., Alexandrov, O., Moratto, Z. M., Smith, B. E., Joughin, I. R., Porter, C., and Morin, P.: An automated, open-source pipeline for mass production of digital elevation models (DEMs) from very-high-resolution commercial stereo satellite imagery, ISPRS J. Photogramm., 116, 101–117, https://doi.org/10.1016/j.isprsjprs.2016.03.012, 2016.
Shean, D. E., Bhushan, S., Montesano, P., Rounce, D. R., Arendt, A., and Osmanoglu, B.: A Systematic, Regional Assessment of High Mountain Asia Glacier Mass Balance, Front. Earth Sci., 7, 363, https://doi.org/10.3389/feart.2019.00363, 2020.
Surazakov, A. and Aizen, V.: Positional Accuracy Evaluation of Declassified Hexagon KH-9 Mapping Camera Imagery, Photogramm. Eng. Remote S., 76, 603–608, https://doi.org/10.14358/PERS.76.5.603, 2010.
Thøgersen, K., Gilbert, A., Schuler, T. V., and Malthe-Sørenssen, A.: Rate-and-state friction explains glacier surge propagation, Nat. Commun., 10, 2823, https://doi.org/10.1038/s41467-019-10506-4, 2019.
Vale, A. B., Arnold, N. S., Rees, W. G., and Lea, J. M.: Remote Detection of Surge-Related Glacier Terminus Change across High Mountain Asia, Remote Sens.-Basel, 13, 1309, https://doi.org/10.3390/rs13071309, 2021.
Van Wyk de Vries, M., Wickert, A. D., MacGregor, K. R., Rada, C., and Willis, M. J.: Atypical landslide induces speedup, advance, and long-term slowdown of a tidewater glacier, Geology, 50, 806–811, https://doi.org/10.1130/G49854.1, 2022.
Yamazaki, D., Ikeshima, D., Tawatari, R., Yamaguchi, T., O'Loughlin, F., Neal, J. C., Sampson, C. C., Kanae, S., and Bates, P. D.: A high-accuracy map of global terrain elevations, Geophys. Res. Lett., 44, 5844–5853, https://doi.org/10.1002/2017GL072874, 2017.
Yasuda, T. and Furuya, M.: Dynamics of surge-type glaciers in West Kunlun Shan, Northwestern Tibet, J. Geophys. Res.-Earth, 120, 2393–2405, https://doi.org/10.1002/2015JF003511, 2015.
Zhou, S., Yao, X., Zhang, D., Zhang, Y., Liu, S., and Min, Y.: Remote Sensing Monitoring of Advancing and Surging Glaciers in the Tien Shan, 1990–2019, Remote Sens.-Basel, 13, 1973, https://doi.org/10.3390/rs13101973, 2021.
Zhou, Y., Li, Z., and Li, J.: Slight glacier mass loss in the Karakoram region during the 1970s to 2000 revealed by KH-9 images and SRTM DEM, J. Glaciol., 63, 331–342, https://doi.org/10.1017/jog.2016.142, 2017.
Zhou, Y., Li, Z., Li, J., Zhao, R., and Ding, X.: Glacier mass balance in the Qinghai–Tibet Plateau and its surroundings from the mid-1970s to 2000 based on Hexagon KH-9 and SRTM DEMs, Remote Sens. Environ., 210, 96–112, https://doi.org/10.1016/j.rse.2018.03.020, 2018.