the Creative Commons Attribution 4.0 License.
the Creative Commons Attribution 4.0 License.
 | 04 Apr 2023
Twenty-meter annual paddy rice area map for mainland Southeast Asia using Sentinel-1 synthetic-aperture-radar data
Chunling Sun
Hong Zhang
Ji Ge
Jingling Jiang
Lijun Zuo
Chao Wang
Over 90 % of the world's rice is produced in the Asia–Pacific region. Synthetic-aperture radar (SAR) enables all-day and all-weather observations of rice distribution in tropical and subtropical regions. The complexity of rice cultivation patterns in tropical and subtropical regions makes it difficult to construct a representative data-relevant rice crop model, increasing the difficulty in extracting rice distributions from SAR data. To address this problem, a rice area mapping method for large regional tropical or subtropical areas based on time-series Sentinel-1 SAR data is proposed in this study. Based on the analysis of rice backscattering characteristics in mainland Southeast Asia, the combination of spatiotemporal statistical features with good generalization ability was selected and then input into the U-Net semantic segmentation model, combined with WorldCover data to reduce false alarms, finally the 20 m resolution rice area map of five countries in mainland Southeast Asia in 2019 was obtained. The proposed method achieved an accuracy of 92.20 % on the validation sample set, and the good agreement was obtained when comparing our rice area map with statistical data and other rice area maps at the national and provincial levels. The maximum coefficient of determination R2 was 0.93 at the national level and 0.97 at the provincial level. These results demonstrate the advantages of the proposed method in rice area mapping with complex cropping patterns and the reliability of the generated rice area maps. The 20 m annual paddy rice area map for mainland Southeast Asia is available at https://doi.org/10.5281/zenodo.7315076 (Sun et al., 2022b).
- Article
(15722 KB) - Full-text XML
- BibTeX
- EndNote


Sustainable Development Goal 2, “Zero Hunger”, was set by the United Nations in 2015 (Desa, 2016): the dual pressure of population and environment threatens the sustainability of global food security (Faostat, 2010; Godfray et al., 2010). Rice feeds more than half of the world's population as a staple food and is a major crop for world food security (Kuenzer and Knauer, 2012). Asia is the largest rice-producing region in the world (Chen et al., 2012), and Southeast Asia accounts for 40 % of global rice exports (Yuan et al., 2022). High-precision rice-planting area maps are the basis for monitoring rice growth and forecasting yields, the cornerstone for the government, planners and policymakers to formulate reasonable policies and the guarantee of global food security (Mosleh et al., 2015; Laborte et al., 2017; Clauss et al., 2018; Jin et al., 2018; Yu et al., 2020; Hoang-Phi et al., 2021).
Remote-sensing technology plays a crucial role in rice growth monitoring and distribution mapping (Weiss et al., 2020; Zhao et al., 2021; Tsokas et al., 2022). Rice area mapping at the national scale usually uses medium- and low-resolution optical remote-sensing data, such as MODIS and Landsat data. Some researchers used MODIS multitemporal data to produce rice area maps of China with resolutions of 500, 500, 250 and 500 m, respectively (Xiao et al., 2005; Sun et al., 2009; Clauss et al., 2016; Qiu et al., 2022). Guan et al. (2016) produced rice area maps of Vietnam at 500 m resolution using MODIS time-series data in 2010. The National Agricultural Statistics Service (NASS) released the state-based Crop Data Layer (CDL), a 30 m resolution crop distribution map product for the entire continental United States, using multisource medium-resolution remote-sensing data (Landsat, IRS-p6, DEIMOS-1, etc.) (Johnson and Mueller, 2010). Luo et al. (2020) and Wei et al. (2022) used Landsat time-series data to produce 1 km and 30 m resolution rice data sets for China, respectively. Recently the Sentinel-2 satellite sensor opened up new possibilities for paddy rice monitoring. Liu et al. (2022) obtained medium-resolution rice area maps of China using Sentinel-2 time-series data in 2020.
At the continental scale, MODIS time-series data were frequently used to map the distribution of rice cultivation (Dong et al., 2016a, b). Xiao et al. (2006), Gumma et al. (2011a, b, 2014) and Bridhikitti and Overcamp (2012) produced low- and medium-resolution rice area maps for several South and Southeast Asian countries using MODIS data at the 500 m spatial resolution, respectively. Nelson and Gumma (2015) extracted the 500 m spatial-resolution general rice extent map in Asia from 2000 to 2012 using MODIS data. Using MODIS time-series data, Zhang et al. (2017) generated rice acreage maps for China and India from 2000 to 2015. Han et al. (2022) used MODIS data to complete 500 m annual rice maps for the Asian monsoon region from 2000 to 2020. Satellite pour l'Observation de la Terre (SPOT) data were also used for continent-wide rice area mapping. Manjunath et al. (2015) used 2009–2010 multitemporal SPOT vegetation (VGT) normalized difference vegetation index (NDVI) data to produce 1 km resolution rice area maps for South and Southeast Asia.
Most of the rice in the world is distributed in hot and rainy areas. Optical data are easily obscured by clouds, which poses a challenge for rice area extraction in humid and subhumid climates with abundant water resources such as Southeast Asia (Liu et al., 2019; Sun et al., 2021). Compared with traditional optical remote sensing, synthetic-aperture radar (SAR) is an active microwave radar with the advantages of all day and all weather, is weather-independent, can penetrate clouds and is very sensitive to the geometric structure and dielectric properties of crops (Huang et al., 2017; Orynbaikyzy et al., 2019; Sun et al., 2022a). In recent years, free SAR data represented by Sentinel-1 data have been widely used in rice mapping over large regions. Singha et al. (2019) obtained seasonal rice maps at 10 m resolution for Bangladesh and northeastern India using time-series Sentinel-1 vertical–horizontal polarization (VH) data for 2017. Pan et al. (2021) used 2016–2020 Sentinel-1 VH data to produce 10 m spatial-resolution double-season rice maps for nine provinces in southern China. Xu et al. (2021) used time-series Sentinel-1 VH data to obtain a 20 m rice area map for Thailand in 2019.
To take full advantage of multisource remote-sensing data, some researchers combined optical and SAR time-series data in the large-scale rice mapping studies (Thenkabail et al., 2009; Zhang et al., 2018; You and Dong, 2020). Phan et al. (2021) used Sentinel-1/Sentinel-2 and Landsat data to produce the first Vietnam land use/land cover annual data set with 30 m resolution from 1990 to 2020. Han et al. (2021) obtained 500 m resolution rice maps from 2017 to 2019 in Northeast and Southeast Asia using Sentinel-1 and MODIS time-series data.
At present, large-scale rice mapping methods based on remote-sensing data can be divided into two categories: one is the combination of phenological information and remote-sensing images, and the other is the combination of time-series data and machine learning relying on image information. The phenology-based approach refers to the extraction of rice by defining phenological indicators or identifying rice-growing stages by combining the time-series data covering the rice growth cycle and the analysis of the rice phenological calendar (Nelson et al., 2014; Chen et al., 2016; Nguyen and Wagner, 2017; Liu et al., 2018; Xin et al., 2020; Ni et al., 2021). The growing stages such as transplanting, heading and maturity are most often used to extract rice. Shew and Ghosh (2019) combined vegetation indices extracted from Landsat time-series data with a rule-based algorithm for growing stages to map a 30 m dry-season rice map of Bangladesh from 2014 to 2018. Li et al. (2020) extracted the minimum and maximum values of permanent water backscatter coefficients and three thresholds of phenological characteristics, namely, the date of the beginning of the season, date of maximum backscatter during the peak growing season and length of the vegetative stage from 402 scenes of Sentinel-1 data in 2017 to map rice paddies in the Mun River basin, Thailand. Kang et al. (2022) completed a 10 m resolution rice map of Cambodia from Sentinel-1 (2015) and Sentinel-2 (2015–2017) time-series data using three key rice phenological periods in the dry and rainy seasons, respectively.
However, the phenology-based methods rely too much on human intervention and are not suitable for rice area extraction with complex cropping cycles. The approaches based on the combination of time-series data and machine-learning method refer to the direct use of time series as the input features for machine learning (Ndikumana et al., 2018; Chang et al., 2020; Mansaray et al., 2021; Yang et al., 2021). Machine-learning methods are used to extract rice information by mining fixed relationships across growth periods of rice (Yang et al., 2019; You et al., 2021). Torbick et al. (2017) used Sentinel-1, Landsat-8 and PALSAR-2 time-series data and a random-forest algorithm to map the rice-planting area and planting intensity of Myanmar with 20 m resolution in 2015. Inoue et al. (2020) developed a 30 m resolution map of paddy rice in Japan for 2018 using Sentinel-1 SAR data and Sentinel-2 data with the conventional decision tree methods. Wei et al. (2021) completed rice area mapping for the Arkansas River basin, USA, by entering dual-polarized Sentinel-1 data from 2017 to 2019 into a modified U-Net model. Soh et al. (2022) used Sentinel-1 and Sentinel-2 time-series data and a K-means clustering method to map rice in West Malaysia.
The climate in tropical or subtropical regions such as Southeast Asia is suitable for rice growth throughout the year, increasing the difficulty in extracting information on the distribution of rice areas. First, it is difficult to obtain accurate phenological information, as the climate in Southeast Asia is hot and humid for rice growth and the timing of rice seeding and transplanting is more flexible (Xu et al., 2021). Thus, it is difficult to determine effective phenological indicators and to accurately identify rice-growing stages. Second, rice cultivation patterns in Southeast Asia are too complex to construct a representative rice growth model (Kang et al., 2022). This poses obstacles for rice area extraction methods that utilize time-fixed relationships in time-series data.
Current publicly downloadable remote-sensing data-based rice products for Southeast Asia include the Asian rice map (International Rice Research Institute – IRRI – rice data, 500 m) (Nelson and Gumma, 2015), Vietnam-wide annual land use/land cover data sets from 1990 to 2020 (VLUCDs, 30 m) (Phan et al., 2021), annual paddy rice maps for Northeast and Southeast Asia from 2017 to 2019 (NESEA-Rice10, 10 m) (Han et al., 2021) and annual rice in the Asian monsoon region from 2000 to 2020 (500 m) (Han et al., 2022). Except for Vietnam's VLUCD, the source data for the public rice maps in Southeast Asia were mainly MODIS. Rice area maps using MODIS data contained a large number of mixed pixels due to low spatial resolution (Dong et al., 2015; Shew and Ghosh, 2019), which affected the accuracy of rice area maps.
Therefore, in this study, to meet the requirements of high-precision rice area mapping in Southeast Asia, the objectives accomplished using Sentinel-1 time-series data are as follows.
A new feature-extraction method is proposed by analyzing the time-series backscattering variation of rice in mainland Southeast Asia. The method does not need to summarize the general evolutionary model from rice backscatter coefficients with diverse cultivation patterns. Using three simple but effective temporal statistical features defined in this study, it is possible to capture features that provide key information about the rice-growth process. This study provides a new idea for rice area mapping methods in tropical or subtropical regions.
A deep combination of the above features and the U-Net model will be used to fully exploit the pixel-level semantic features to complete the annual rice area mapping of five Southeast Asian countries in 2019, enriching the available Southeast Asian rice area maps and providing supporting information for the scientific community and scientific decision-making.
The rest of the paper is organized as follows. Section 2 describes the study area and the data information used. Sect. 3 presents the rice area mapping scheme. Sect. 4 presents the rice area mapping results and accuracy assessment. Sect. 5 discusses the results. Sect. 6 gives the data addresses, and Sect. 7 draws conclusions.
2.1 Study area
Approximately 90 % of the world's rice is grown on 140 million hectares of land in Asia. The rice production in mainland Southeast Asia accounts for about 15 % of the world's rice production (Fao, 2020). The study area is five countries in mainland Southeast Asia, namely, Myanmar, Thailand, Laos, Cambodia and Vietnam, as shown in Fig. 1. These countries have more land under rice cultivation than any other crop, and Vietnam and Thailand are the two largest rice exporters in the world (Yuan et al., 2022). Indeed, changes in rice production in these countries could destabilize international rice markets and have a clear impact on global food security.
Southeast Asia has a tropical monsoon climate with an average annual temperature of 20–27 ∘C and abundant rainfall. Therefore, rice can be grown at any time of the year. Agricultural systems in Southeast Asia are dominated by rainfed lowland rice and irrigated lowland rice (Kuenzer and Knauer, 2012). Under suitable irrigation conditions, rice can be harvested two to three times per year.

Figure 1Location of the study area. The Sentinel-1 data with orbit frame 99-16 were used for the training samples, and the rice and non-rice flags show the distribution of the validation sample set. The base map is from Esri.
2.2 Data source
2.2.1 Satellite imagery and auxiliary data
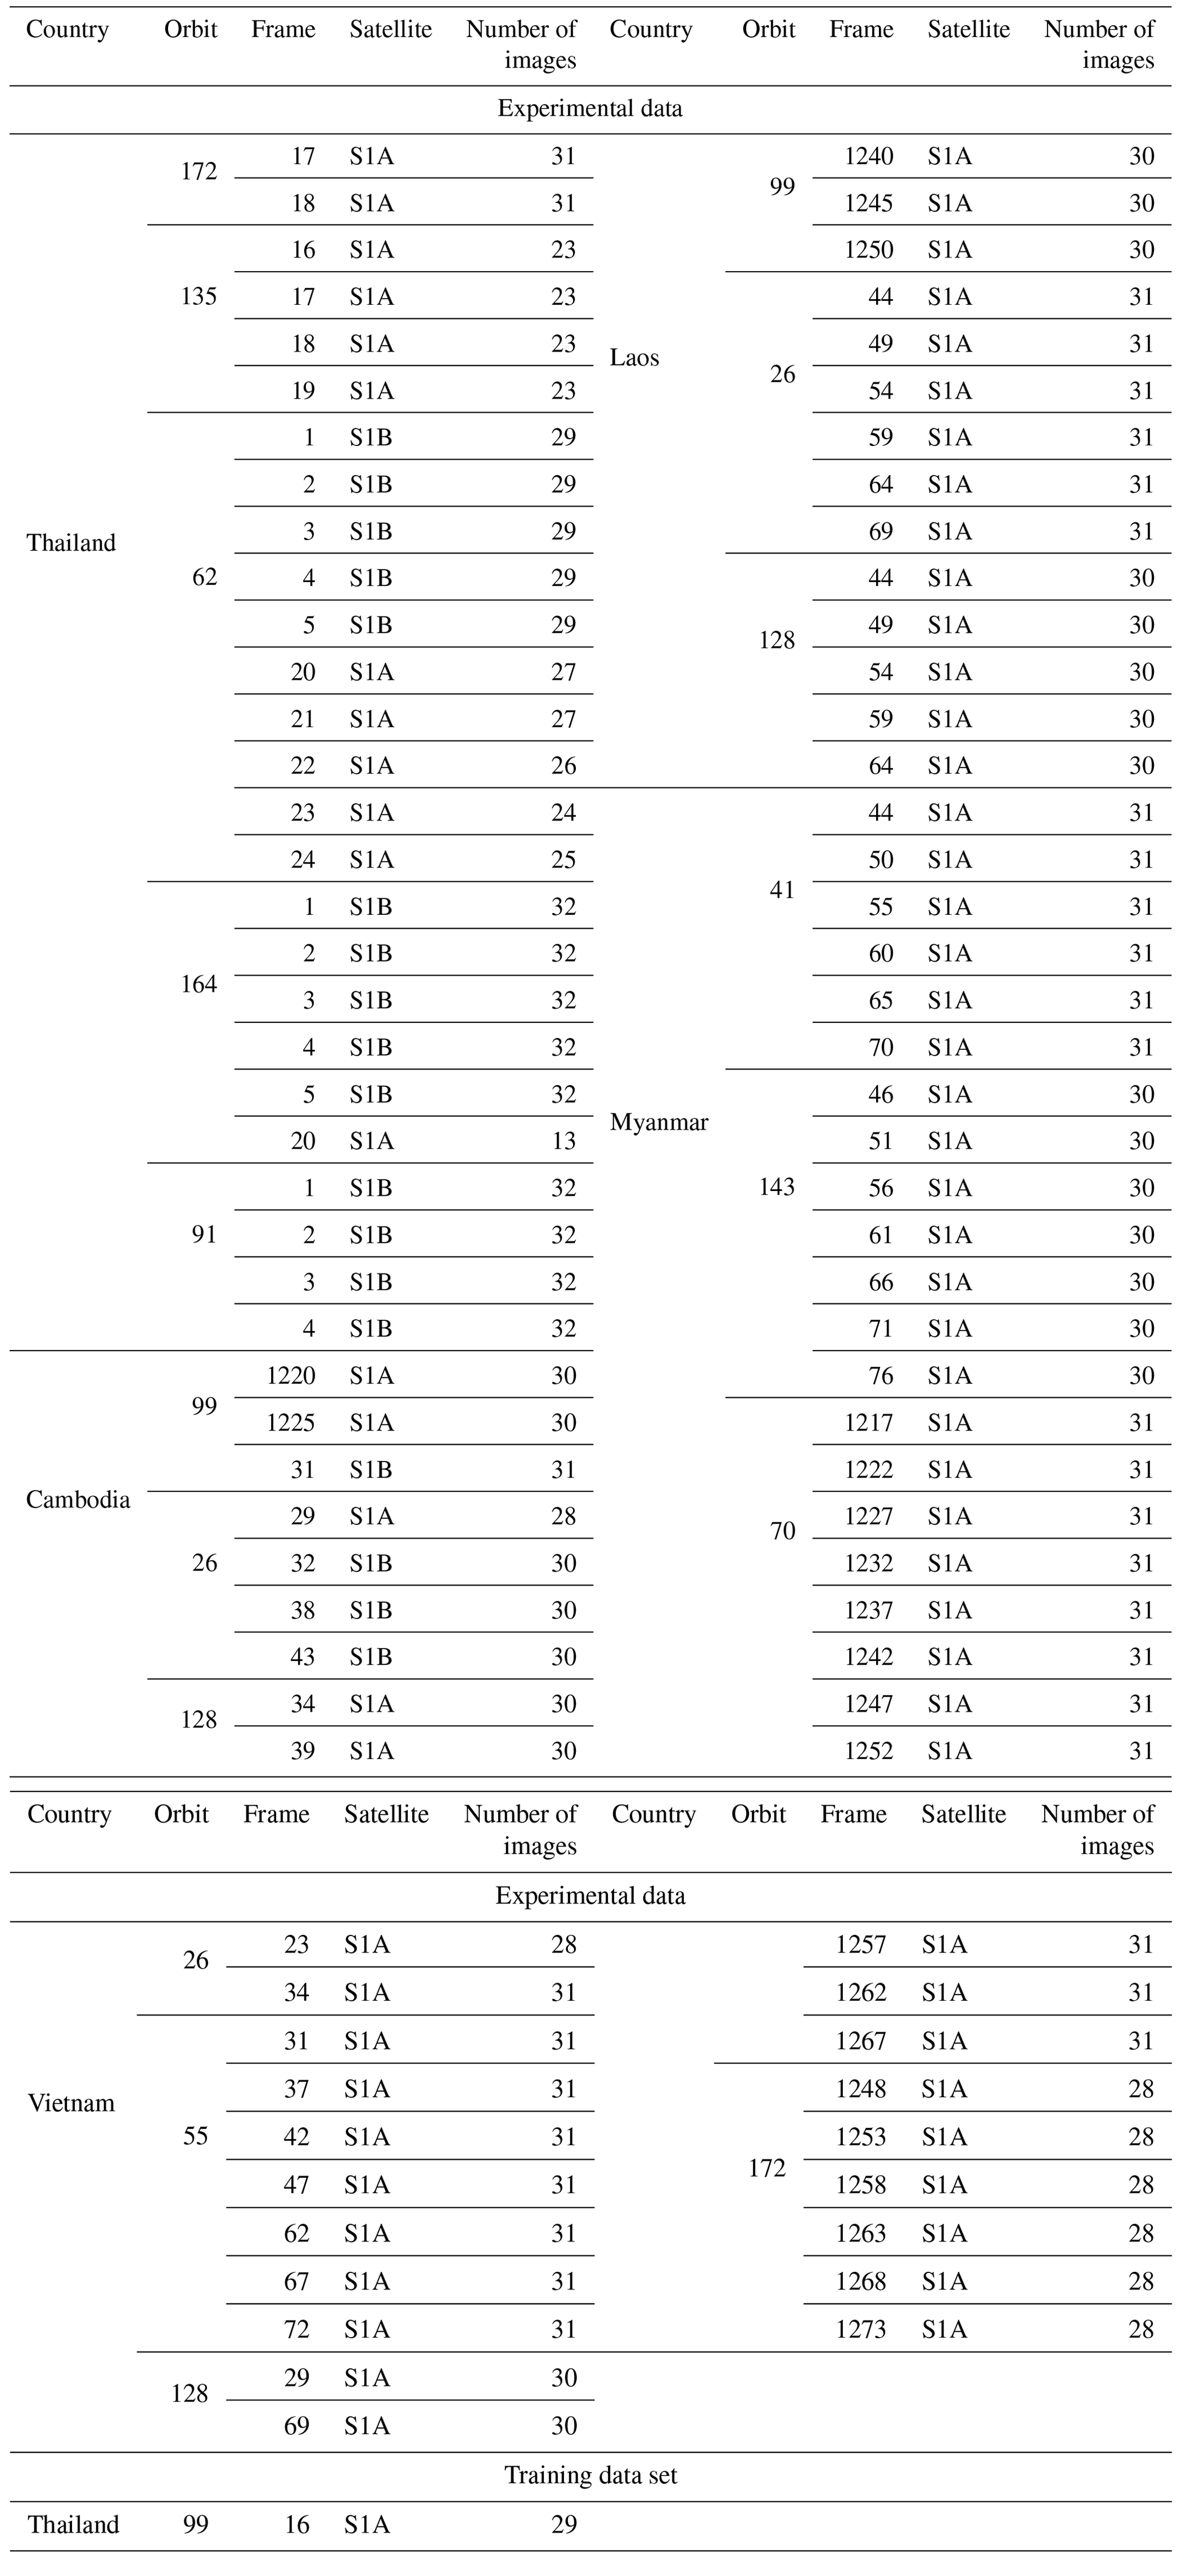
The European Space Agency (ESA) provides a free data source for global land cover monitoring through Sentinel-1A, launched in 2014, and Sentinel-1B, launched in 2016 (Torres et al., 2012). The Sentinel-1 satellites carry a C-band (5.405 GHz) synthetic-aperture radar with a 12 d revisit period. In this study, the 2019 dual-polarized (VV/VH) ground-range-detected (GRD) products in interferometric wide-swath (IW) mode were downloaded from the Alaska Satellite Facility (ASF) website. In total, 12 tracks, 90 frames and 2665 scenes of data were acquired. Details are shown in Table 1.
The digital elevation model (DEM) and land use/land cover product were also collected. The Shuttle Radar Topography Mission (SRTM) 3 s DEM product was used for terrain correction of SAR data. WorldCover data were used to reduce false alarms caused by water and woodland. WorldCover is a global land cover product produced by the ESA and several scientific institutions using Sentinel-1 and Sentinel-2 data (Zanaga et al., 2021). It provides information on 11 land cover types for 2020 with a resolution of 10 m and an overall accuracy of 80.7 % for the Asian region.
2.2.2 Agricultural statistics
The statistical yearbooks of each country were collected to compile annual census data of rice-harvested areas at different administrative levels in these countries. The administrative levels include national and subnational levels (state, province or regions, uniformly represented by province in this study). The unit of area in the statistical data is uniformly converted to hectares (ha).
2.2.3 Available rice maps based on remote-sensing data
From the perspective of resolution and coverage area, two publicly downloadable rice maps were selected for comparison.
(1) VLUCDs
Researchers from the Japan Aerospace Exploration Agency (JAXA) produced the first 30 m resolution VLUCDs using multiple sources of data (including Landsat and Sentinel-1/Sentinel-2) and a random forest algorithm (Phan et al., 2021). The VLUCDs contain annual land cover products for 1990–2020, including a primary classification (10 different categories of primary land cover, including rice) and a secondary classification (18 different categories of secondary primary land cover, including rice). The rice layer was extracted from the 2019 annual land cover products for comparison.
(3) Rice data of Asia from IRRI rice data
IRRI is an international agricultural research and training organization with its headquarters in Los Baños, Laguna, in the Philippines, and offices in 17 countries. IRRI is 1 of 15 agricultural research centers in the world that form the Consultative Group for International Agricultural Research (CGIAR), a global partnership of organizations engaged in research on food security. IRRI is also the largest nonprofit agricultural research center in Asia. IRRI produced a 500 m resolution map of the general distribution of rice in Asia from 2001 to 2012 using MODIS time-series data (Nelson and Gumma, 2015) that is freely available to the public.
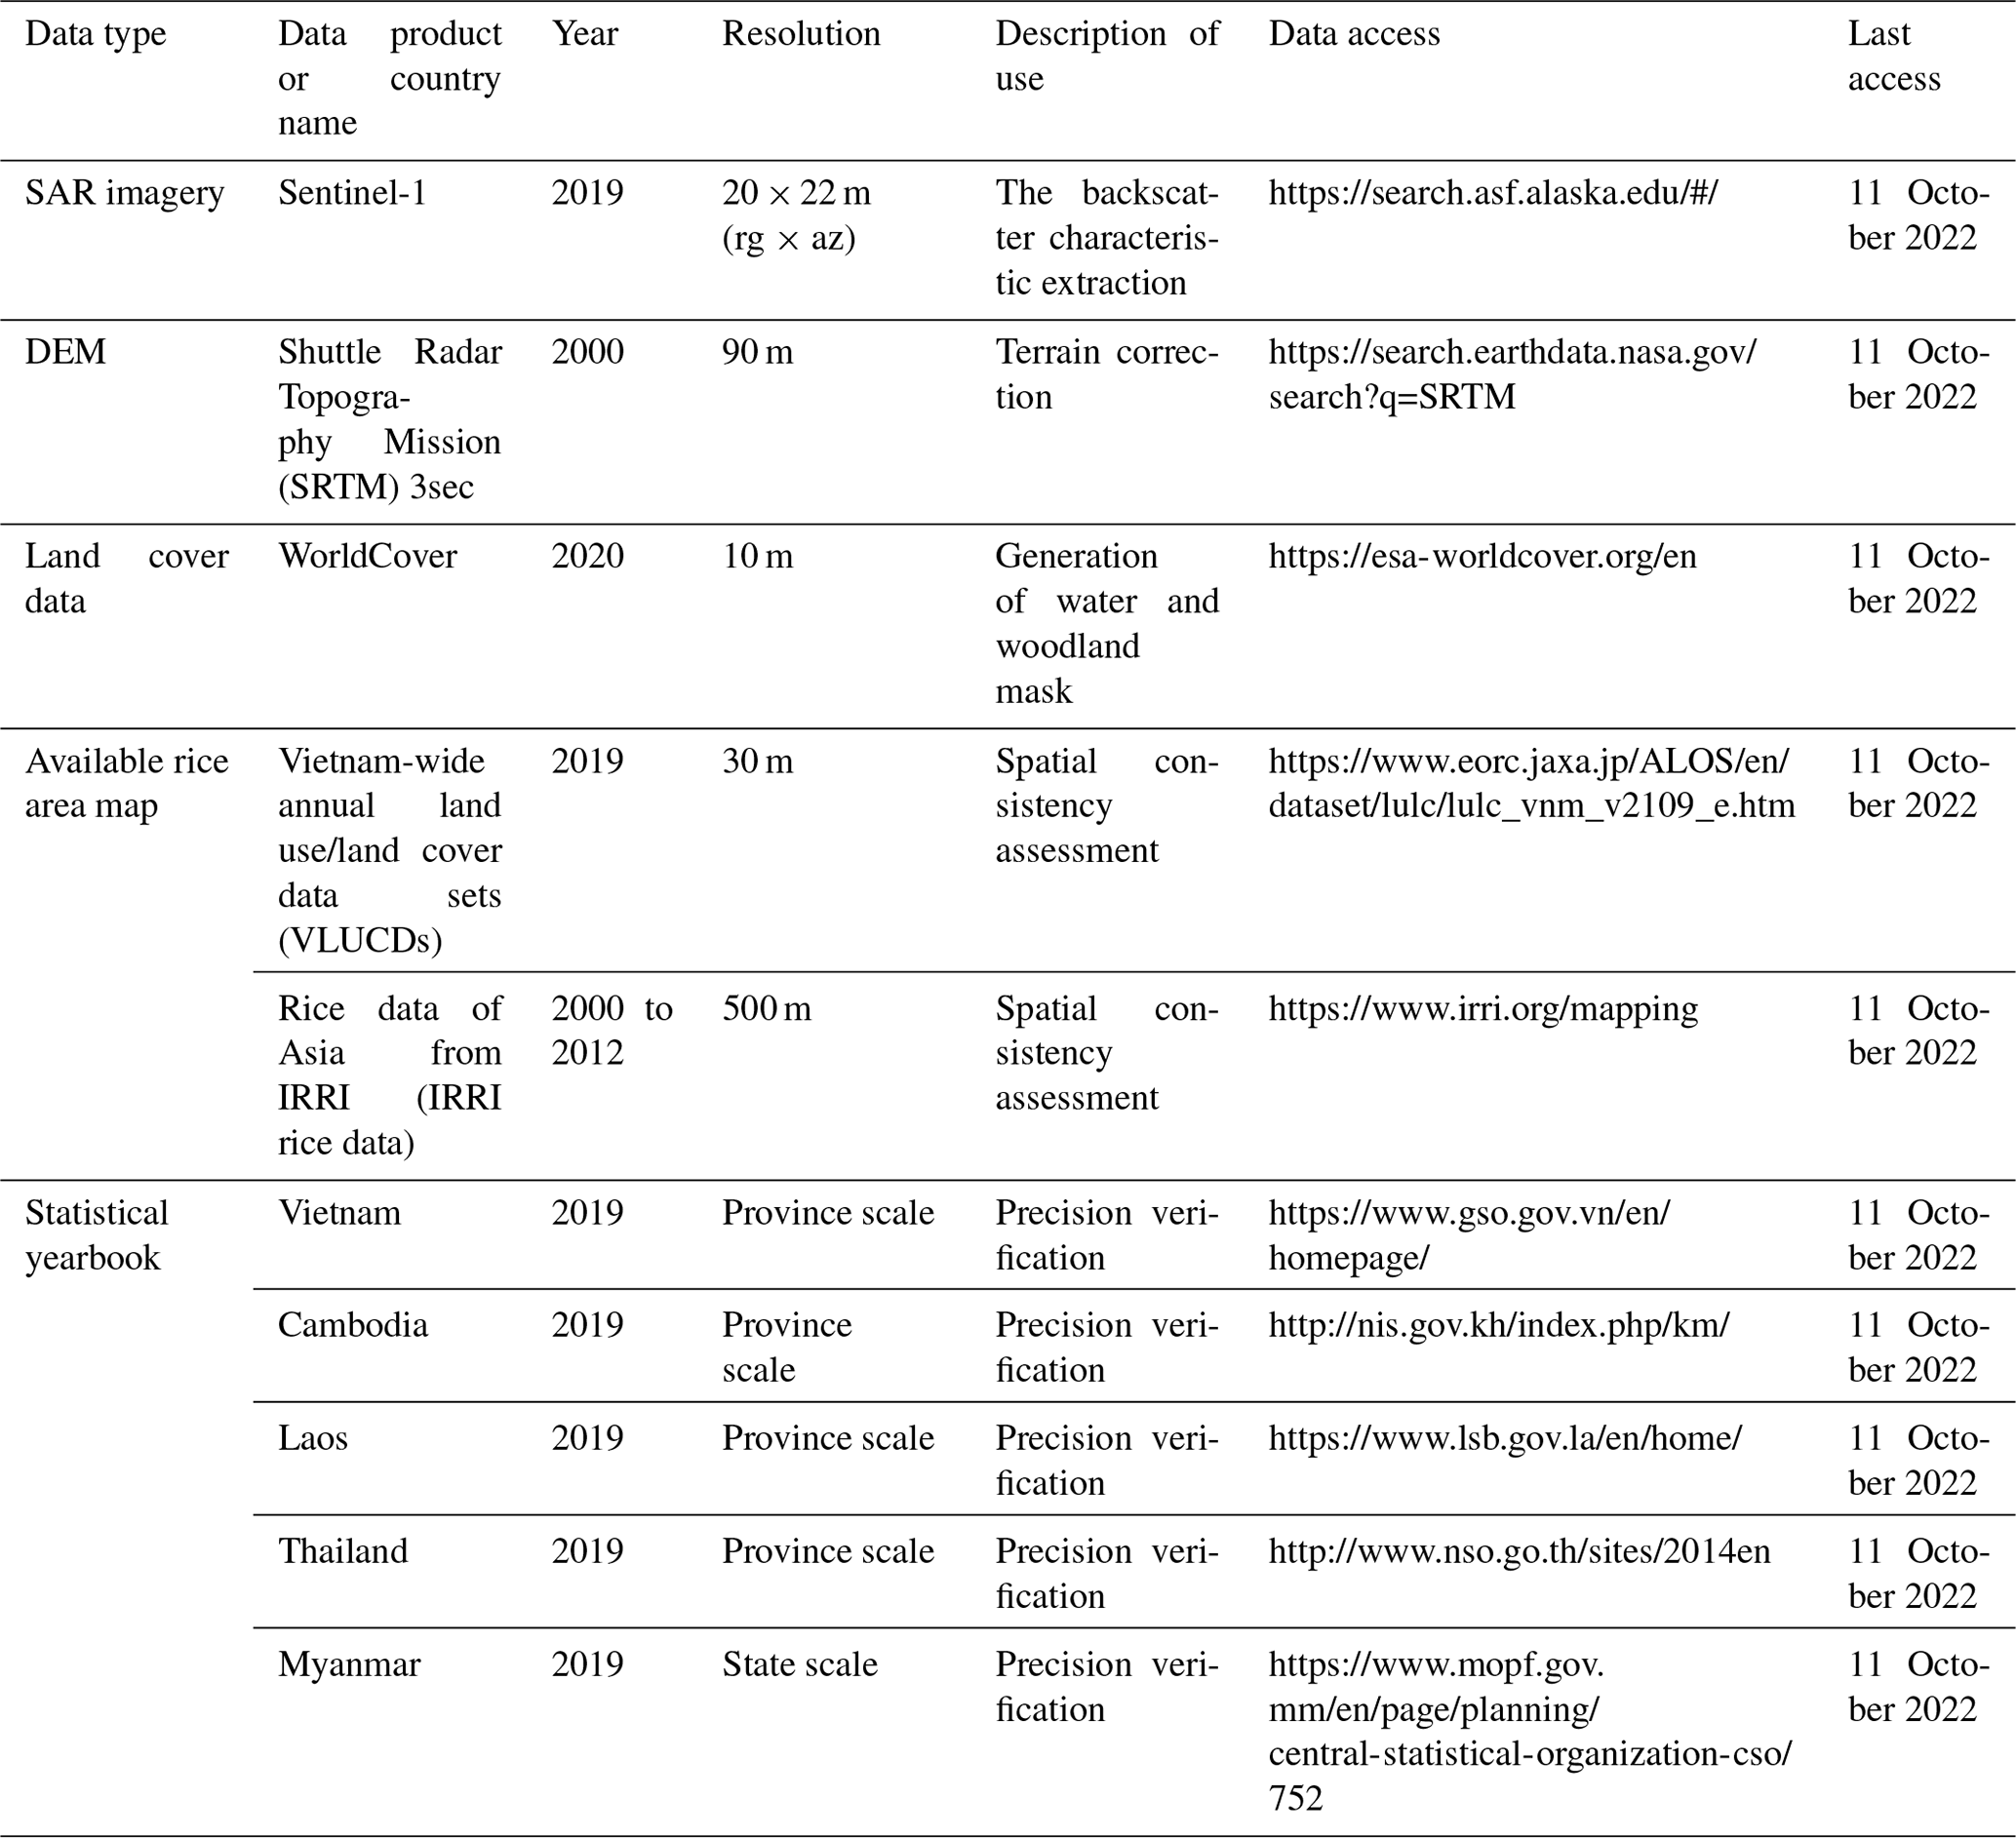
Table 2 shows details of the SAR data, auxiliary data, available rice maps, land cover data and statistics used in the study.
The flowchart of this study is shown in Fig. 2. First, the Sentinel-1 time-series images were preprocessed. Then, key features in the rice-growth process are extracted from the time-series SAR data. To make full use of the pixel-level semantics of the features, the extracted features were fed into the U-Net model to obtain rice area extraction results with spatial details. Finally, to reduce false alarms from water bodies and non-rice vegetation, the results were postprocessed using masks generated based on high-precision land cover products to obtain the annual rice area map of five Southeast Asian countries.
3.1 Preprocessing
The Sentinel-1 time-series data were preprocessed using the Sentinel Application Platform (SNAP) software (Filipponi, 2019). SNAP is a common architecture for all Sentinel toolboxes. ESA and ESRIN provide the SNAP user tool free of charge to the earth observation community.
The steps were as follows. (1) Orbit correction: this operation refines the inaccurate orbit-state vectors provided in the metadata of a SAR product with the precise orbit files which are available days to weeks after the generation of the product. (2) Thermal-noise removal: because SARs are contaminated by additive thermal noise, this step is introduced to mitigate thermal-noise effects. (3) Radiometric calibration: this process provides the image in which the pixel values can be directly related to the radar backscatter of the image. (4) Co-registration: this step co-registers multitemporal intensity images. (5) Terrain correction: this process converts SAR data from the slant or ground-range projection to geographic coordinate projection and corrects the distortion effects that occurred during the acquisition (overlay, shading). (6) Multitemporal speckle noise filtering: this operation reduces speckles, which degrade the quality of the image and make interpretation of features more difficult. (7) Converting values to decibels: this step converts the multitemporal intensity map to sigma 0 (σ0) on the decibel (dB) scale using a logarithmic transformation. The final σ0 images with 20 m resolution in the WGS84 geographic coordinate system were obtained.
3.2 Feature extraction
As described in many previous studies (Singha et al., 2019; Chang et al., 2020; Crisóstomo De Castro Filho et al., 2020; Sun et al., 2022a), VH polarization was more sensitive to the flooding period of rice than VV polarization and has been more widely used for rice area extraction. Therefore, Sentinel-1 VH polarization time-series data were selected in this study. To analyze the time-series characteristics of the backscattering coefficients of rice and other land cover types in the study area, representative sample plots of four typical land cover types (rice, water bodies, buildings and non-rice vegetation) were selected. Based on Google Earth data and other land cover data, four rice regions that belong to different cropping systems were chosen. The average VH polarization time-series data of these land cover types were calculated, as shown in Fig. 3.
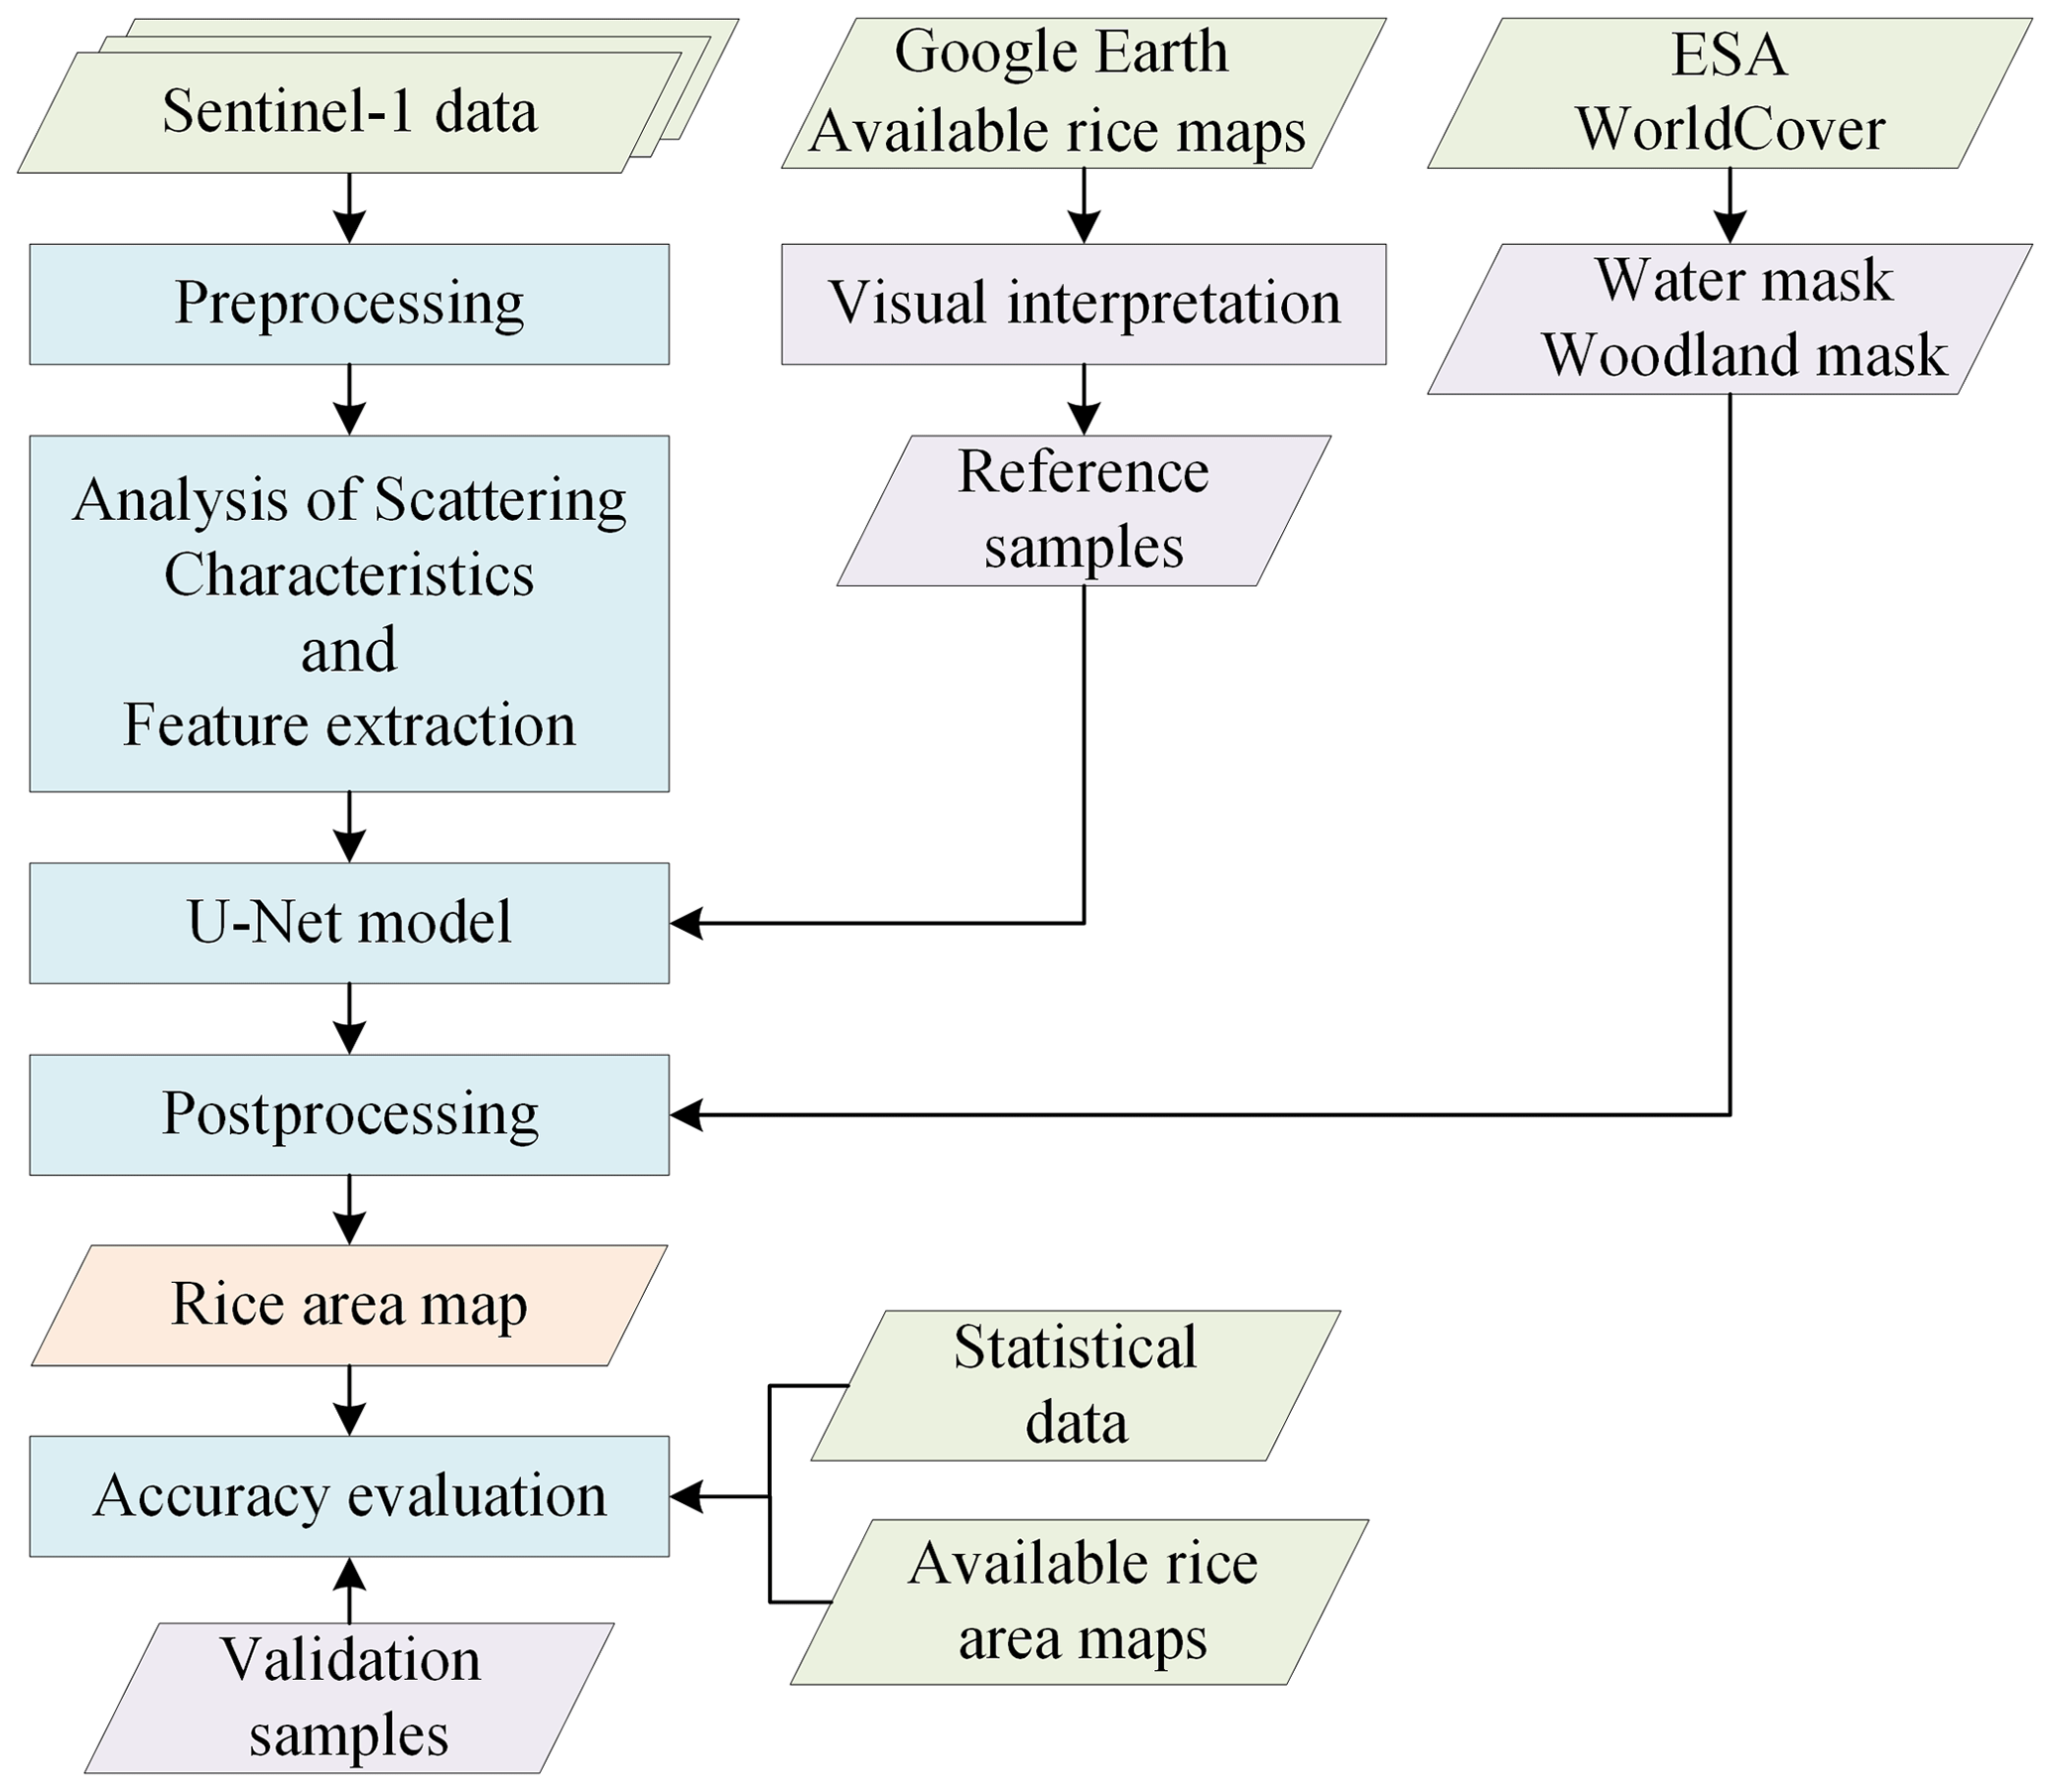
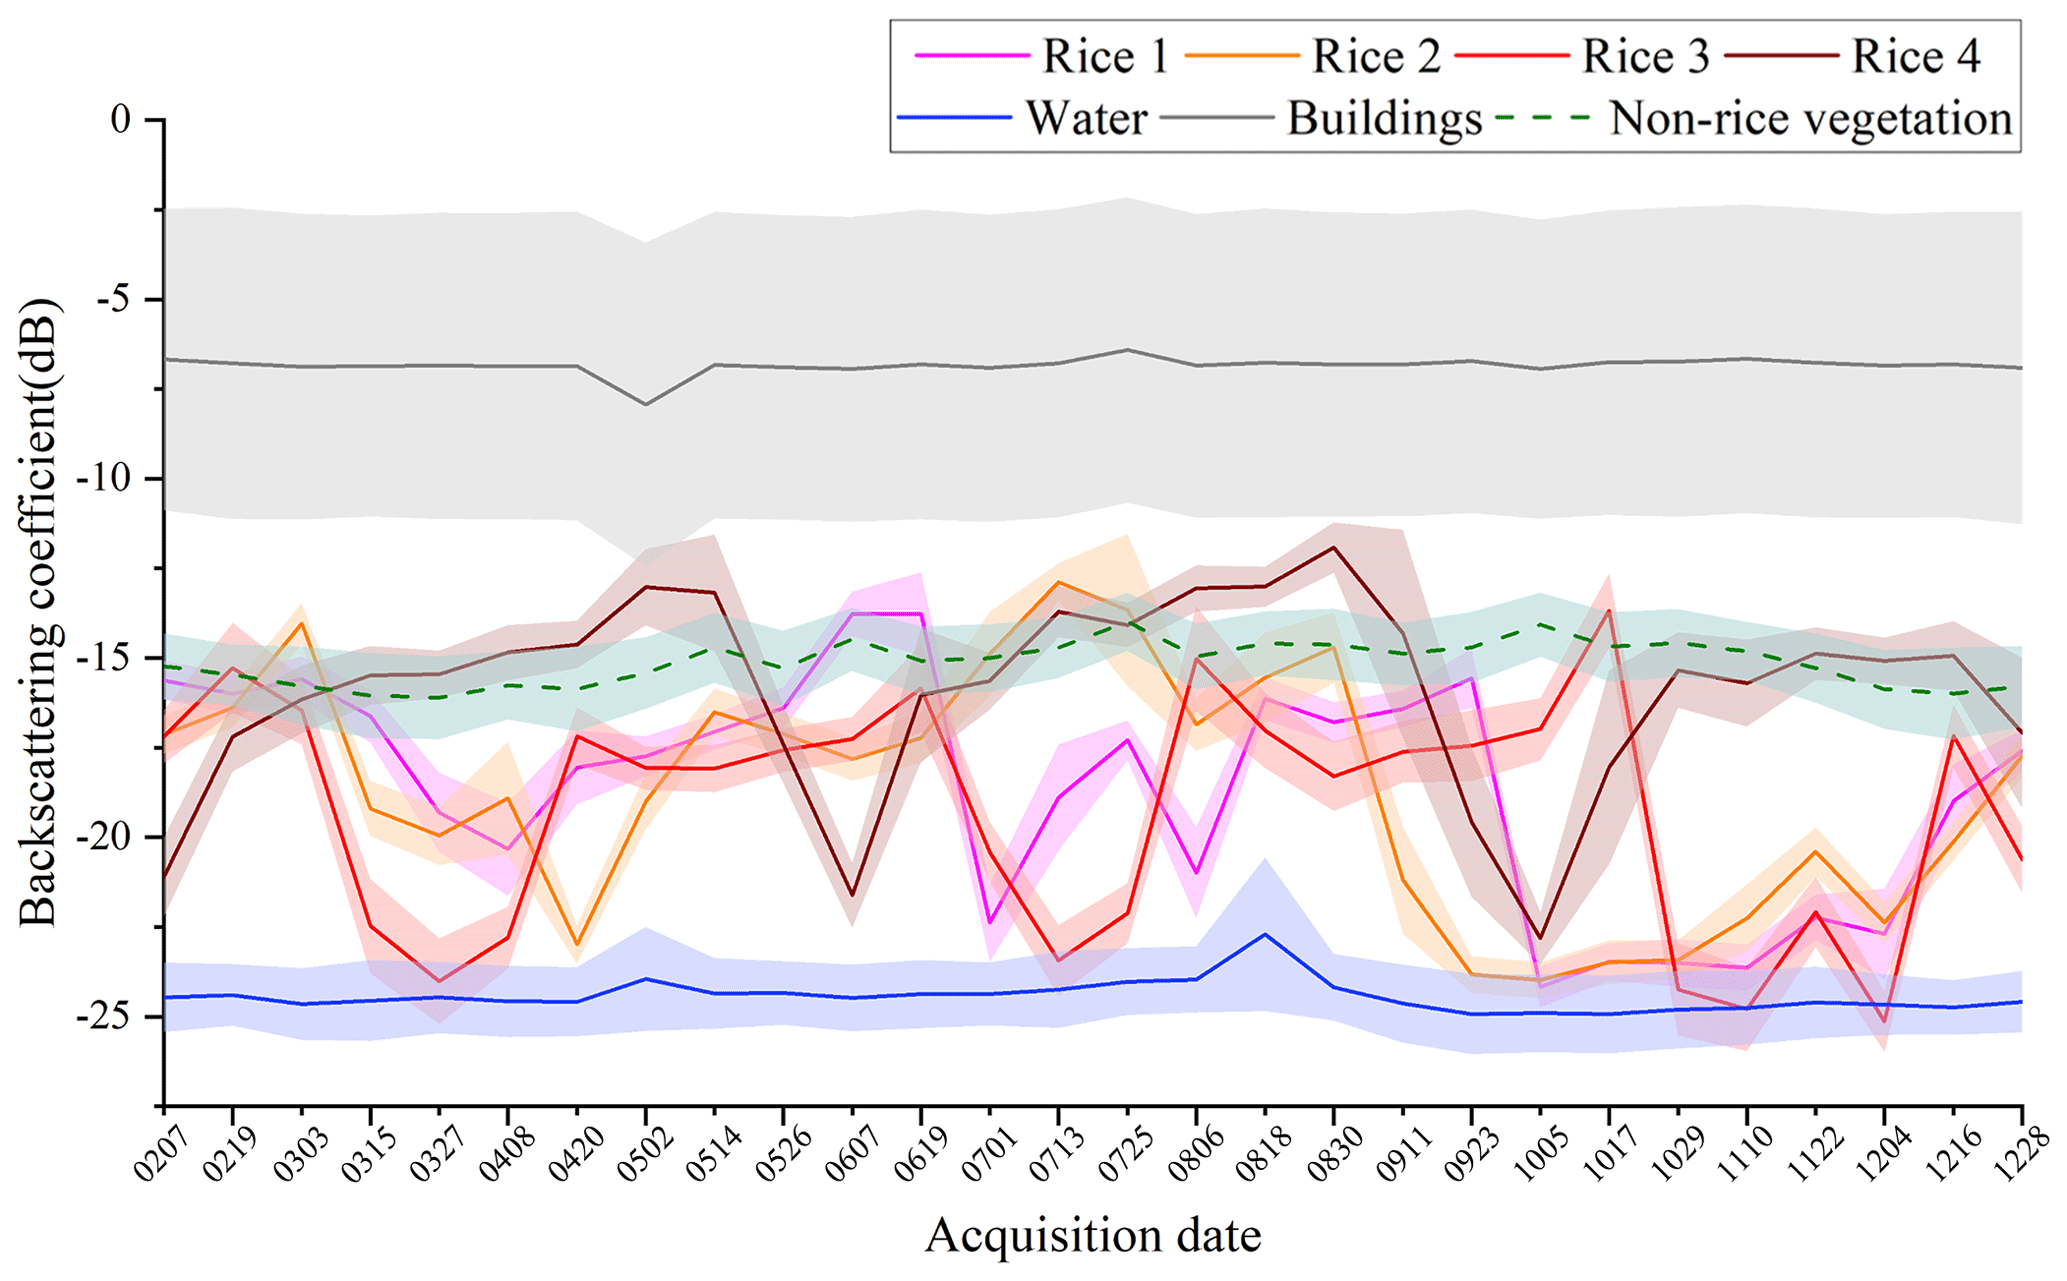
Figure 3The average VH polarization backscattering coefficient curve of typical land covers (the shaded areas refer to the standard deviation calculated from the sample points).
In Fig. 3, the backscattering coefficients of water bodies were small, as they exhibited single-specular scattering, and their return power was lower than that of other land covers. In contrast, buildings exhibited double bounce and their return powers were much stronger, leading to larger backscattering coefficients. The scattering process of radar waves of non-rice vegetation was more complicated, and the backscattering coefficients of non-rice vegetation were between buildings and water bodies. For different kinds of rice samples, the curve fluctuations were significant, due to the effects of flooding and multiseason planting patterns. However, generally, their backscattering intensities ranged between buildings and water bodies.
More specifically, during the observation period, two seasons of rice were planted in the land parcel of Rice 1, the first from April to July and the second from August to October. The land parcel of Rice 2 was planted with only one season of rice, from April to September. The land parcel of Rice 3 was planted with two seasons of rice: the first season was from March to July and the second season was from July to October. The land parcel of Rice 4 was planted with three seasons of rice: the first season was from February to June, the second season was from June to October and only part of the third season (October–December) was observed. It can be seen that the time steps of each growing season for the selected Rice 1–Rice 4 were inconsistent. In fact, the high heterogeneity of rice backscattering coefficients in Southeast Asia is caused by the high heterogeneity in climate and topography. This makes the backscatter coefficient curves of the rice growth cycle more diverse and does not allow us to summarize a generalized model of rice evolution. Therefore, it will be difficult to accomplish the rice field extraction task using a direct reliance on the fixed relationship between phenology and time.
Through a large number of comparative experimental analyses and combined with our previous research work (Xu et al., 2021), three time-series statistical features that can describe the most significant SAR characteristics during rice growth were selected for rice area mapping in the study area, namely, the sharpness of the change in σ0 (), the minimum value of the backscatter coefficients in the time series () and the maximum value of backscatter coefficients in the time series ().
The interaction between the crop canopy and microwave radiation varies with time during plant growth. In contrast, the backscattering coefficients of non-crops, such as water bodies, buildings and woodland, are more stable. Therefore, the sharpness of the change in σ0 with time will be a key factor in distinguishing cropland from other land cover types. is given by the following equation.
where is the number of images.
During the flooding stage, the backscattering characteristics of rice are significantly different from other crops that do not require extensive irrigation and are close to that of water. Therefore, this study identified the flooding stage by calculating the minimum value of the backscatter coefficient in the time-series images to distinguish rice from other crops. is given by Eq. (2).
The seasonal backscattering variation exhibited by water bodies can interfere with the identification of rice. In contrast to the seasonal variation of water bodies, the backscatter coefficient of rice shows a substantial increase during the growth process. Therefore, false alarms generated by water bodies can be reduced by identifying the maximum value of backscatter coefficients in the time-series images. is given by the following equation.
A pseudo-color image is synthesized in the order of R: , G: and B: shown in Fig. 4. Due to the higher and and lower of rice, the color of rice in the pseudo-color composite image is mainly purplish red and sometimes red or dark blue. Compared to other land covers, water bodies have lower , and . Therefore, water bodies are black in the pseudo-color image. Land covers with less variation in backscatter intensity, such as settlement and non-rice vegetation, generally have smaller and higher . Therefore, the colors of these land covers are usually yellow or green in the pseudo-color image.
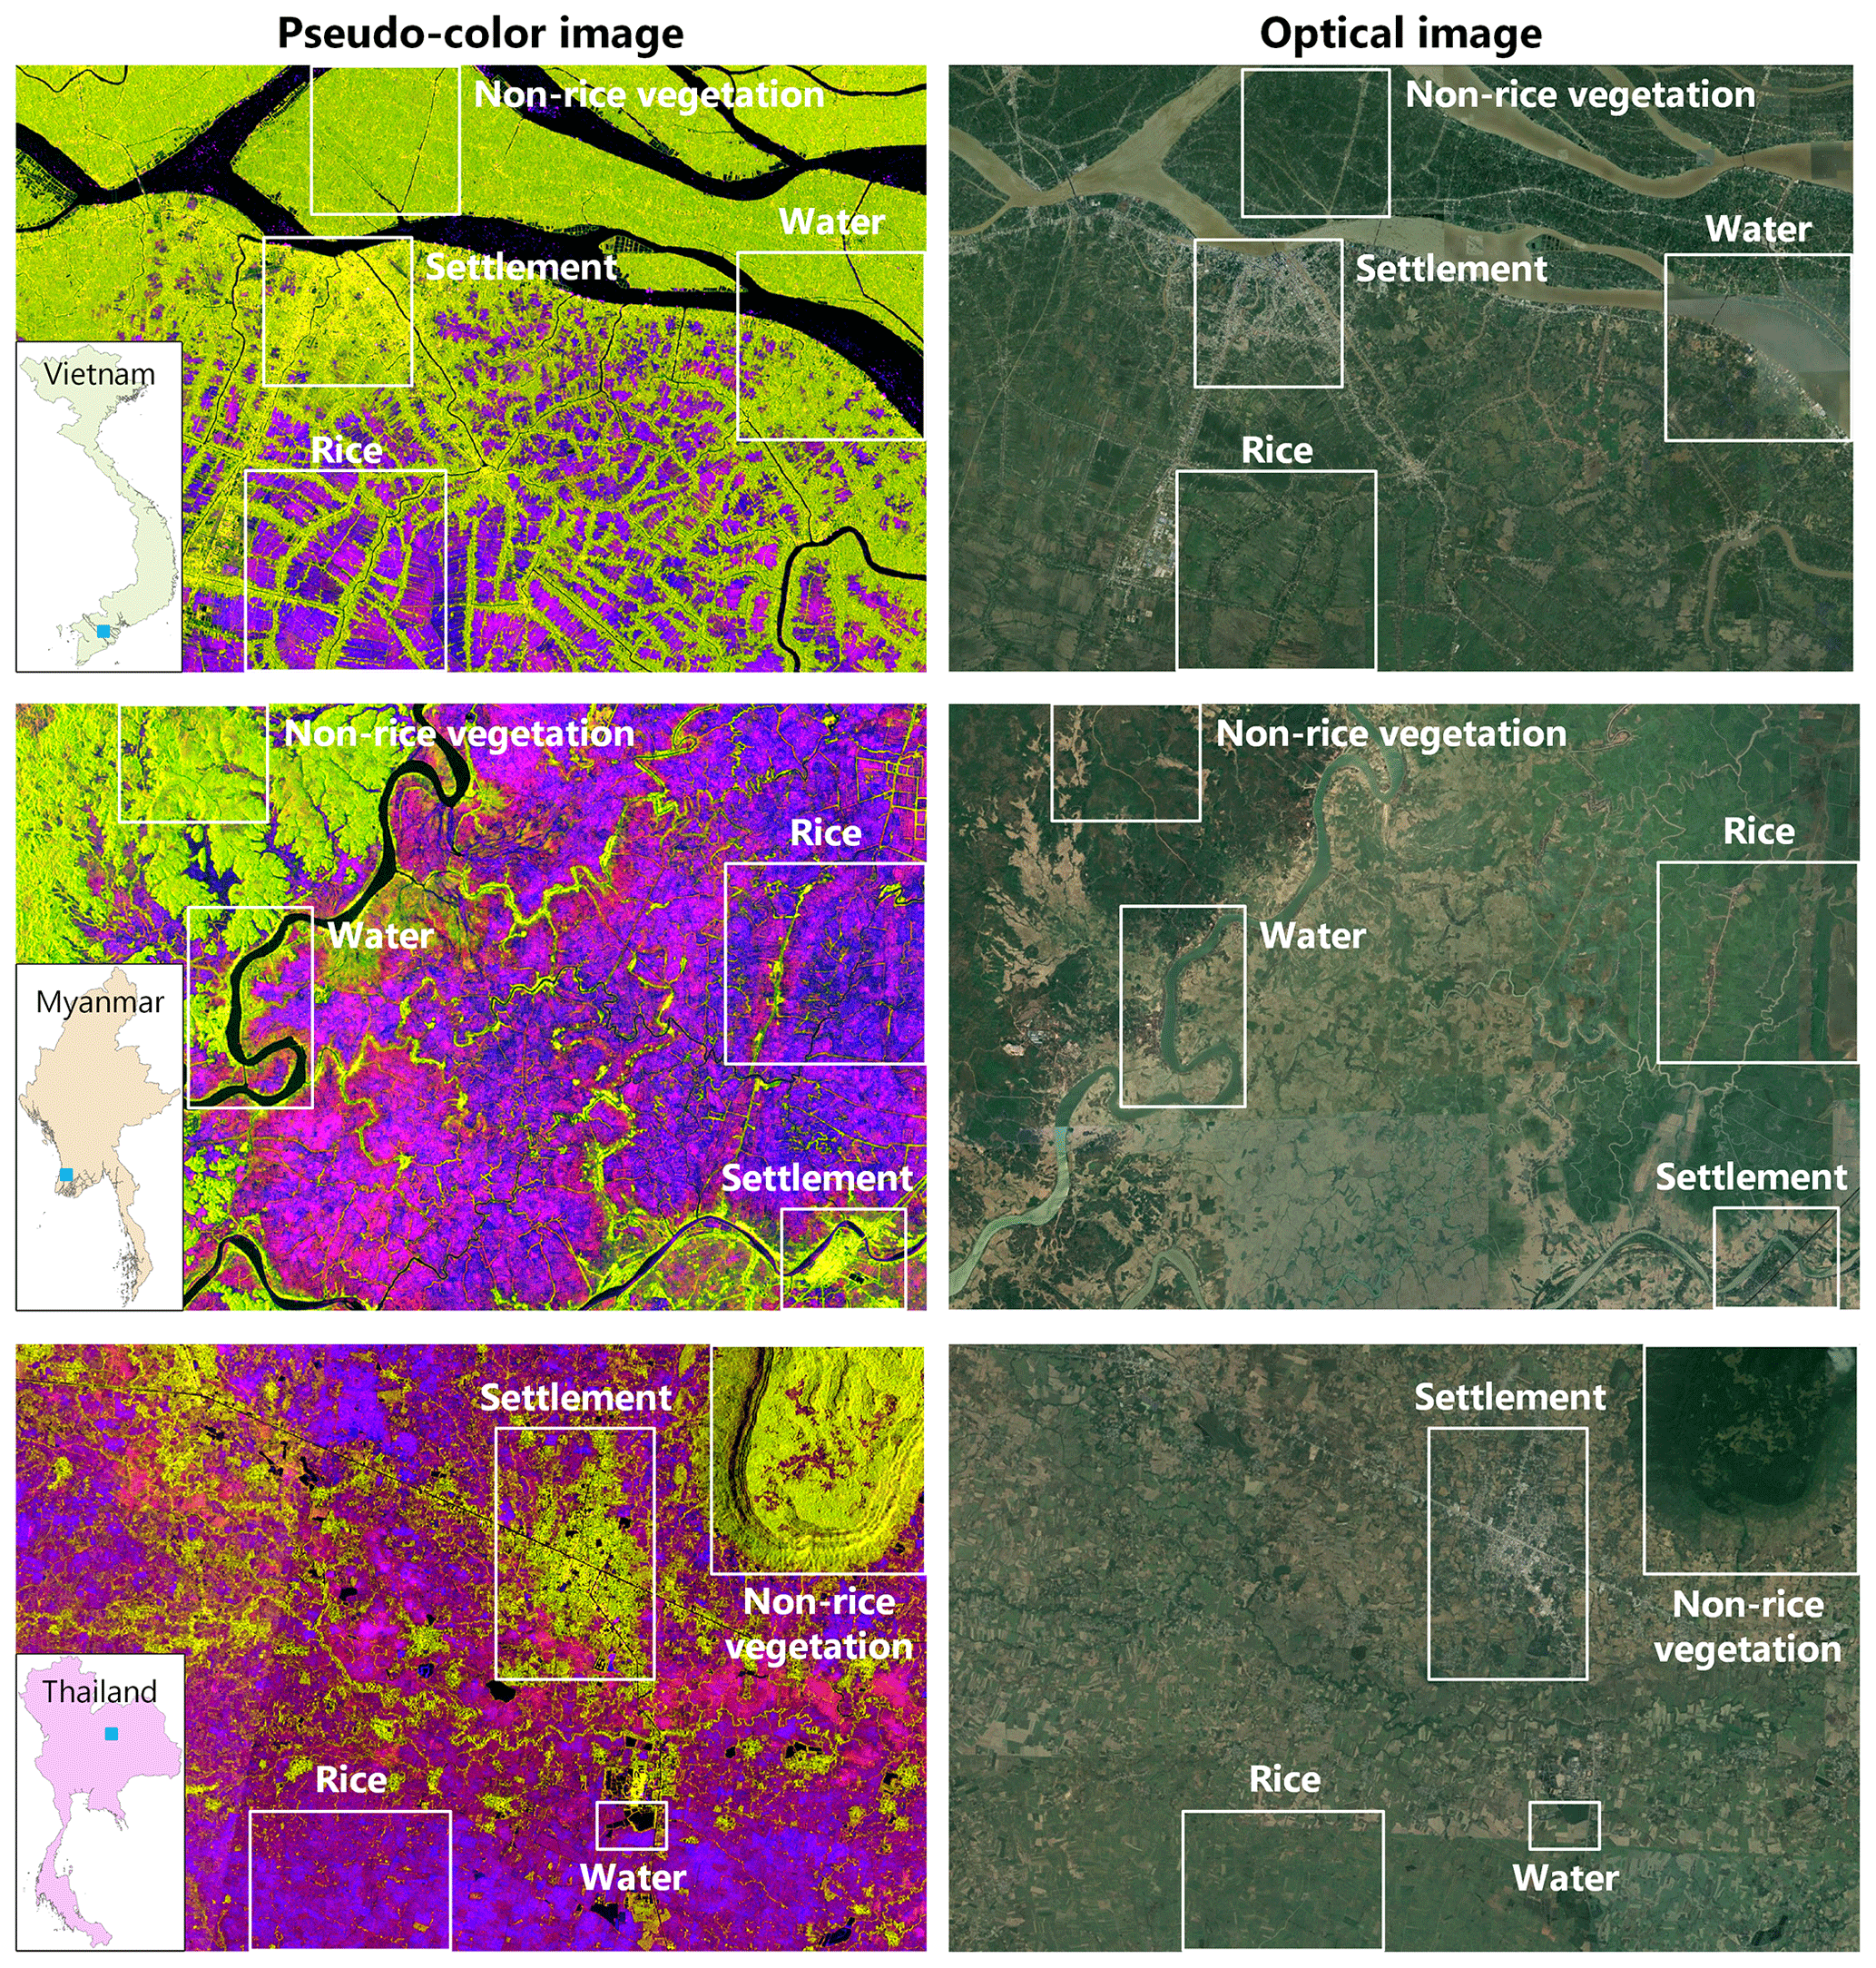
Figure 4The pseudo-color image synthesized from three SAR feature parameters (R: ; G: ; B: ) and the corresponding optical image from © Google Earth.
3.3 Training and validation sets
The above analysis shows that the rice and non-rice land covers of these Southeast Asian countries have consistent features in the pseudo-color image; i.e., the model trained by one scene was applicable for all other scenes with good transferability. Therefore, a training data set generated from the orbit-frame 99-16 images of Thailand from a previous work (Xu et al., 2021) was used, as shown in Fig. 1. A sliding window with a pixel size of 224×224 was used to slice the training images into image patches with 50 % overlap. The training data set consisted of 15 659 image patches with a pixel size of 224×224. A validation sample set for accuracy evaluation was collected using auxiliary data such as Google Earth optical images and other rice maps. The validation samples were divided into two categories, rice and non-rice: the number of samples is shown in Table 3, and their distribution is shown in Fig. 1.

3.4 U-Net model
In this paper high-precision rice area mapping was accomplished using the U-Net model. U-Net is a classical semantic segmentation model widely used in biomedical image segmentation and remote sensing (Wei et al., 2019; Xu et al., 2021; Lin et al., 2022). It outputs semantically labeled pixel-by-pixel images corresponding to the input image while extracting high-level semantic features so that the spatial details of the input image can be maintained (Ronneberger et al., 2015). A SAR image covers a large spatial area, which includes multiple ground objects with complex and rich semantic information; rice fields are spatially characterized by a continuous and large distribution. Therefore, U-Net is used to fully combine the spatial and semantic information in SAR images to achieve high-precision rice area extraction.
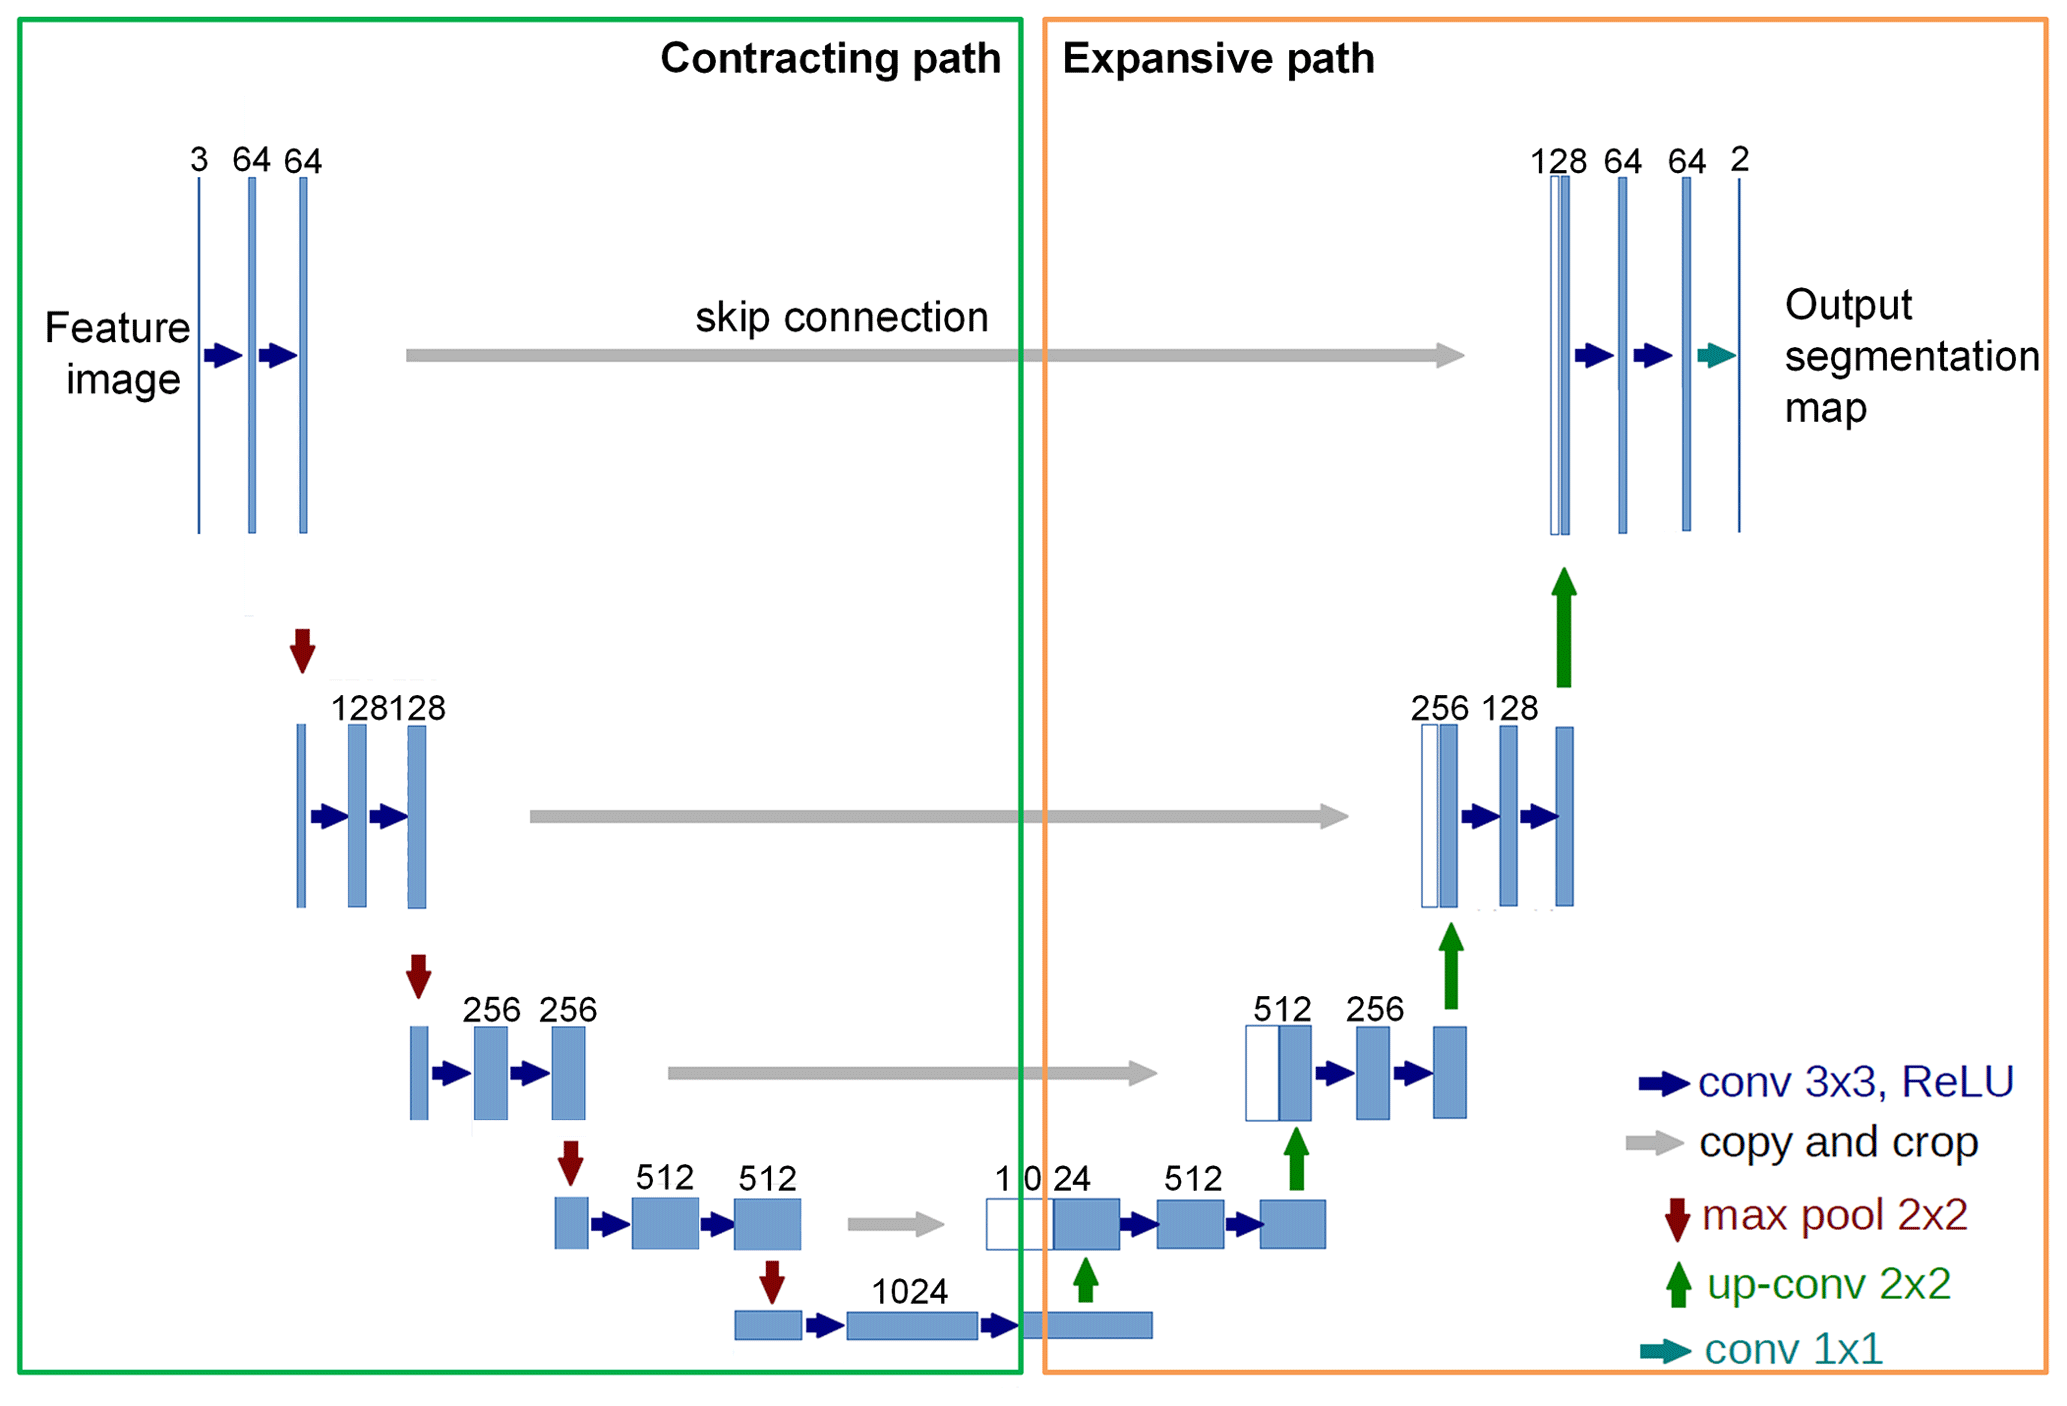
The structure of the U-Net model is shown in Fig. 5. U-Net consists of an encoder (contracting path) and a decoder (expansive path). The encoder is used for feature extraction, and the decoder is used to restore the size of the input image. U-Net has 23 convolutional layers, including 18 3×3 convolutional layers, 4 2×2 convolutional layers and 1 1×1 convolutional layer. The encoder part consists of five downsampling units, where each unit consists of two 3×3 convolutional layers and a 2×2 max-pooling layer. The output of the downsampling unit is input to the next downsampling unit by max pooling. The decoder contains four upsampling units, each of which consists of two 3×3 convolutional layers and a 2×2 deconvolutional layer. In the final stage of the decoder, the feature vector of the last upsampling unit is converted into a probability mapping by the 1×1 convolutional layer. The dimension of the probability mapping is 2, and the pixel value indicates the probability that the pixel belongs to rice and non-rice.
Meanwhile, thanks to the U-shaped structure and skip connection, each downsampling is cascaded with the corresponding upsampling, and this fusion of features at different scales is greatly helpful for upsampling in recovering pixels. Specifically, the shallow downsampling multiplier is small and the feature map has more detailed rice spatial distribution features (low-level spatial features), while the deep downsampling multiplier is large and the information is heavily condensed with large spatial loss. However, the high-level semantic features obtained from deep downsampling help in the determination of rice regions. When the high-level and low-level features are fused, it helps to improve the segmentation accuracy.
To solve the problem of uneven data distribution, we added a batch-normalization (BN) layer (Ioffe and Szegedy, 2015) before each convolutional layer. The BN layer allows the input data to follow the same distribution to achieve regularization of the model.
3.5 Postprocessing
In rice area mapping, water bodies (e.g., rivers and lakes) can confuse the flooding signal of rice. In addition, non-rice vegetation may cause some disturbances due to weather effects.
Therefore, as drawn from many studies (Cué La Rosa et al., 2019; Sun et al., 2021), water body masks and woodland masks produced by WorldCover were used to reduce false alarms of rice field extraction results to some extent.
3.6 Accuracy evaluation
In this study, several strategies were used to evaluate our rice map product, including accuracy assessments based on validation sets and comparisons with statistical data and other rice maps at the national and provincial levels. First, common accuracy metrics based on the validation set were calculated to measure the classification effectiveness of the model, including accuracy, precision, recall and Kappa (Congalton, 1991; Vapnik, 1999; Mchugh, 2012).
TP denotes the number of pixels correctly classified as rice, TN denotes the number of pixels correctly classified as non-rice, FP denotes the number of pixels misclassified as rice among non-rice pixels, FN denotes the number of pixels misclassified as non-rice among rice pixels and Pe is the desired accuracy.
Second, the spatial consistency of rice field extraction results with statistical data and other rice maps was compared at the national and provincial levels. The coefficient of determination (R2) of the rice area map with statistical data and other rice area maps was calculated using the following equation (Draper and Smith, 1998).
n is the total number of administrative units, xi is the area of extracted rice, is its corresponding mean value, ki is the area of statistical data or other rice maps and is its corresponding mean value.
The 2019 rice area map for mainland Southeast Asia using Sentinel-1 SAR data was shown in Fig. 6. According to the extraction result, the main rice-producing areas in Myanmar are located in the Ayeyarwady, Bago and Yangon delta regions, which are crossed by river systems. In addition, Mandalay, Sagaing and Magwayue in the northern arid mountainous region also play an important role in rice production. Thailand's rice fields are concentrated in the central plains, north and northeast. The main rice-producing areas in Laos are located in the central and southern lowland areas. Many of the major rice-producing provinces are located along the Mekong River, such as Borikhamxay, Khammouane, Savannakhet, Salavan and Champasak. Rice fields in Cambodia are concentrated in the Tonlé Sap Lake basin and the southern Mekong River basin. In Vietnam, the representative rice-planting areas are the Mekong delta and the Red River delta.
Next, the rice area map was evaluated as comprehensively as possible from three different scales. First, the validation sample set introduced in the previous section was used to evaluate the accuracy of rice area mapping from the methodological level. Second, at the national level, the rice area maps were compared with statistical data on rice-harvested area and other available rice area maps, respectively. Finally, at the provincial level, more detailed comparisons were made with statistical data and other provincial rice area maps to measure the spatial consistency between the extracted rice distribution and these data.
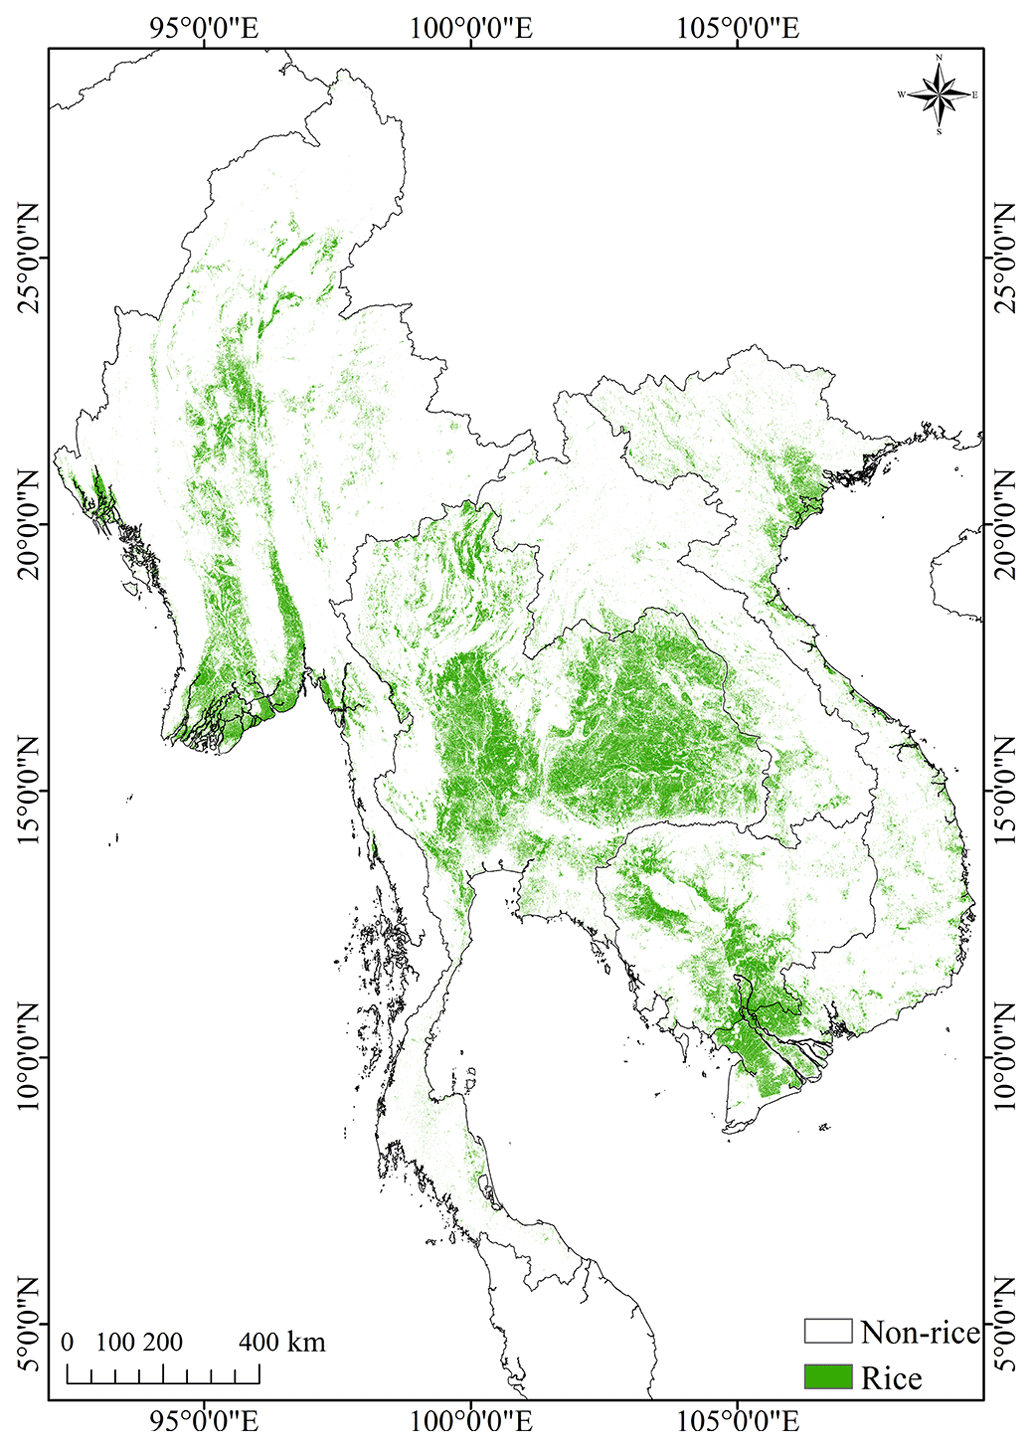
Figure 6Twenty-meter resolution rice area map of five countries in mainland Southeast Asia in 2019.
4.1 Accuracy based on the validation set
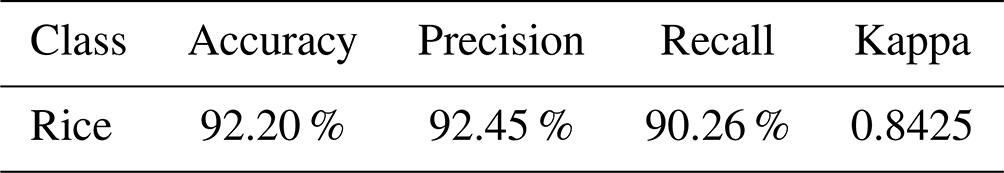
The accuracies of the rice area map based on the validation sample set are shown in Table 4. Among them, the accuracy was as high as 92.20 %, and the Kappa was 0.8425, which proved that the proposed method had a good classification performance. The precision was 92.45 %, indicating that the method could effectively reduce the false alarms in the rice area extraction results. Therefore, these precision metrics illustrated that the rice mapping results were in good agreement with the validation samples. This also further demonstrated the capability of the proposed method for rice area mapping in large tropical regions.
Table 4Accuracy of the rice area map based on the validation set.
4.2 Comparison with statistical data and other rice area maps at the national scale
Figure 7 showed the comparison of the extracted rice area with statistical data and the IRRI rice data at the national-level scale for five Southeast Asian countries. As seen from the figure, the extraction results were consistent with both statistical data and IRRI rice data. Most points were distributed in the vicinity of the 1:1 line. In contrast, the extraction result was more consistent with IRRI, R2 could reach 0.93 and R2 with statistical data was 0.78.
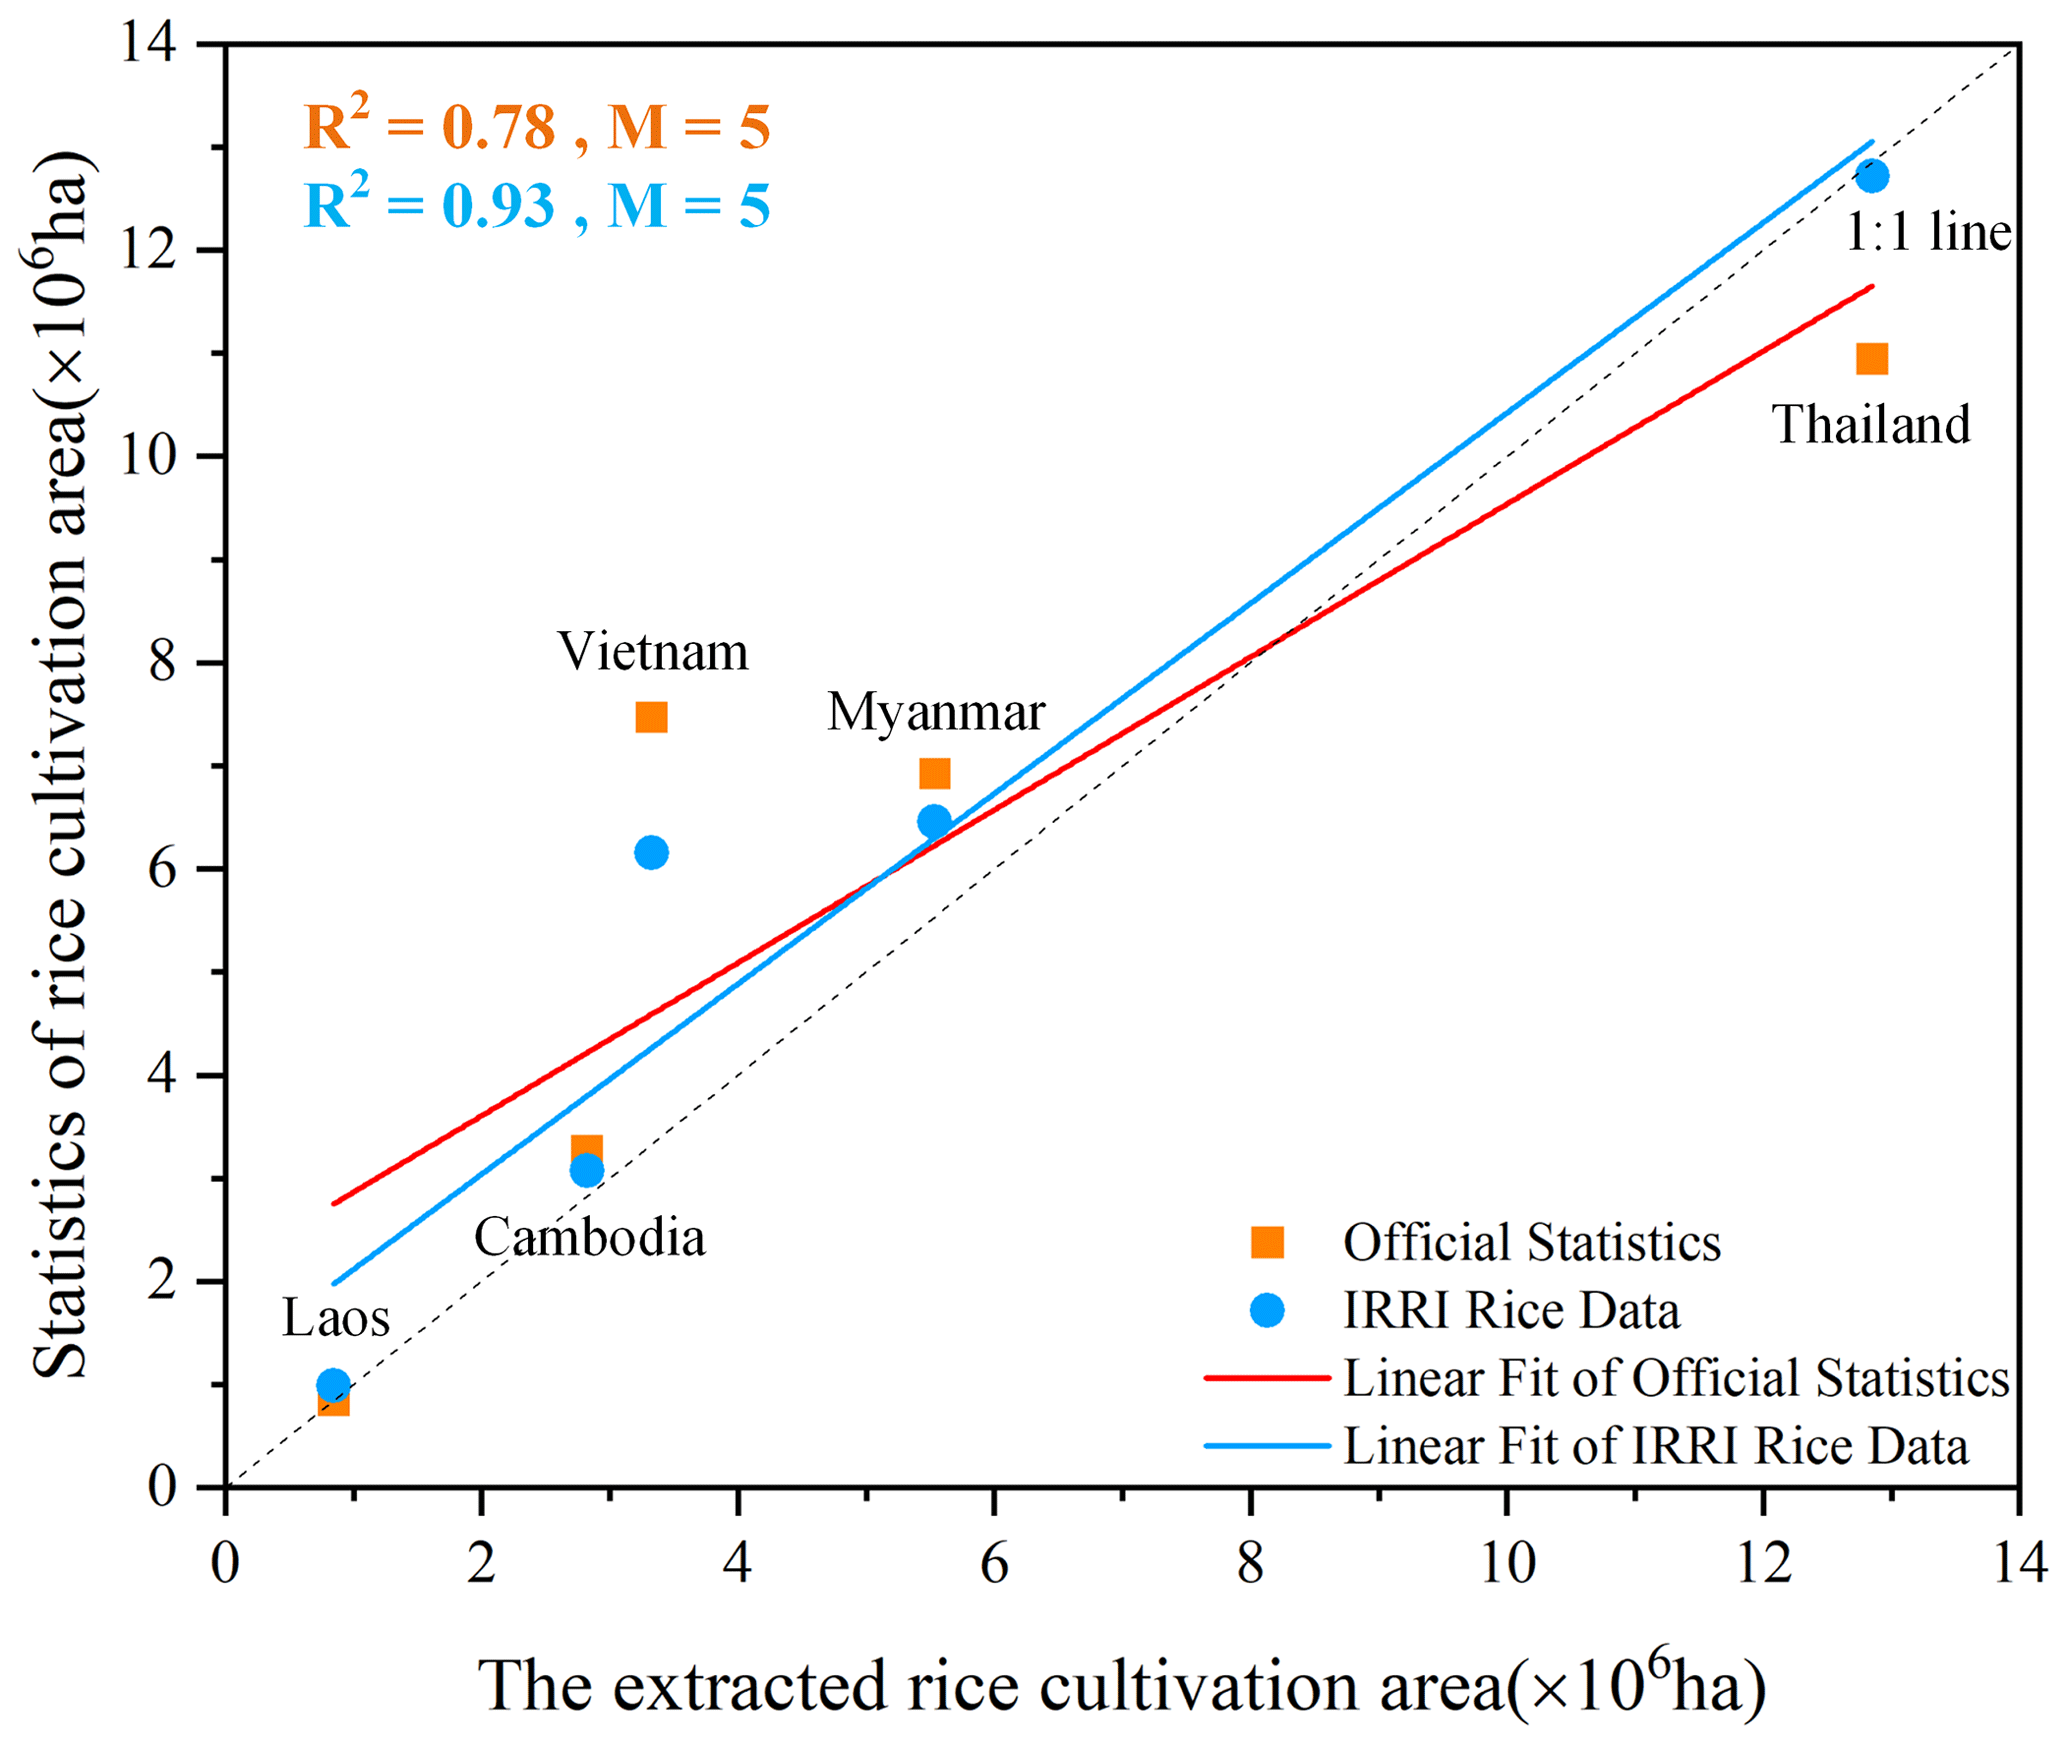
Figure 7Comparison of the extracted rice area with the statistical rice-harvested area and IRRI data set at a national-level scale. M is the number of countries.
Table 5Statistics, other rice area maps and the extracted rice area for five Southeast Asian countries.
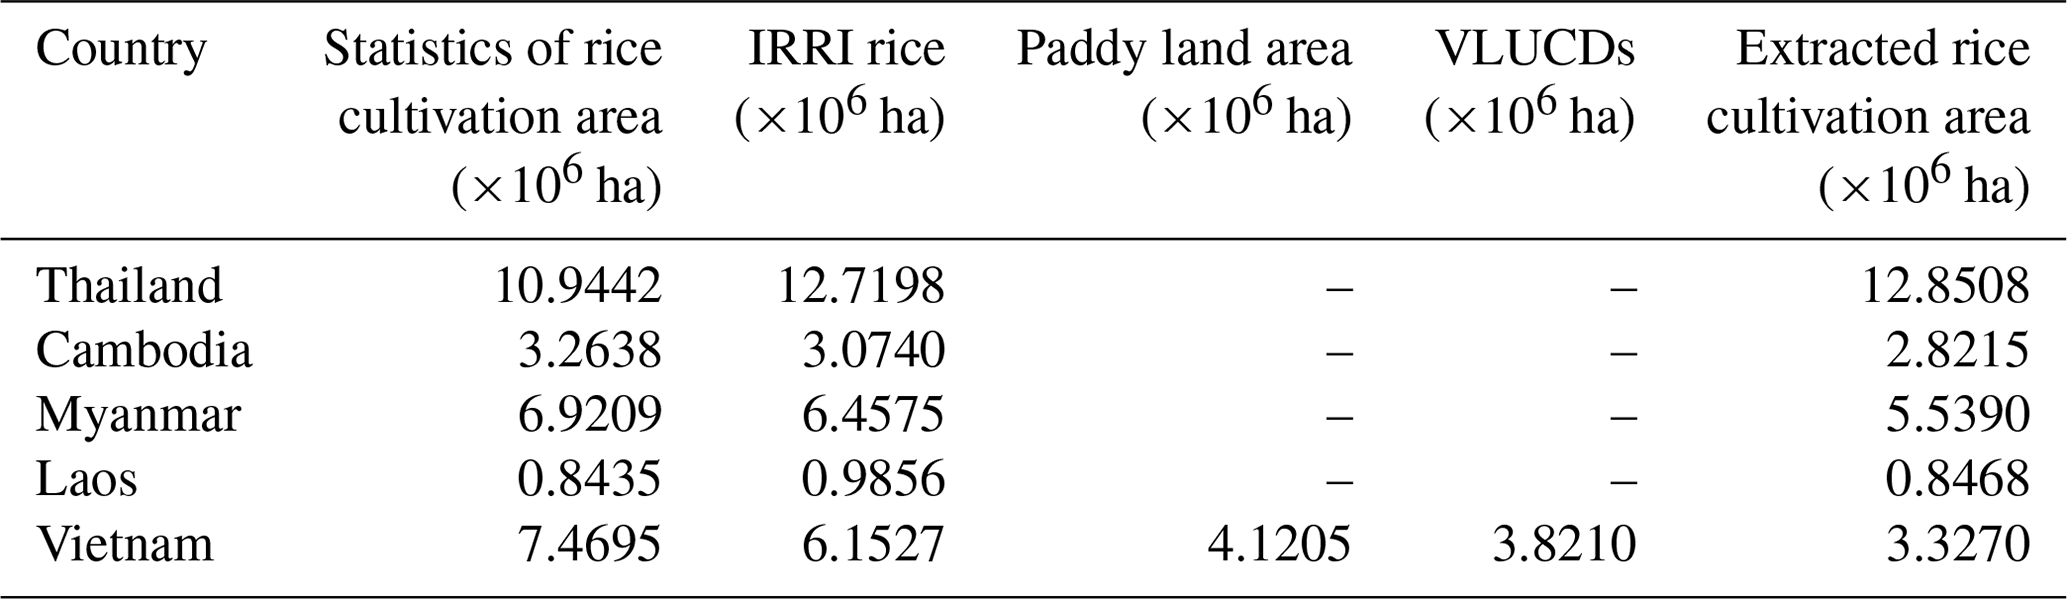
Table 5 showed the statistical area of rice, the area of other rice area maps and the area of rice extraction for five Southeast Asian countries. As shown in Fig. 7 and Table 5, compared with IRRI rice data, the extraction area of Cambodia, Laos and Thailand was close to that of IRRI, while that of Myanmar and Vietnam was slightly lower. Compared with the statistical data, the extraction areas of Cambodia and Laos were in good agreement with the statistical data. The extraction areas of rice in Myanmar and Vietnam were lower, while those in Thailand were slightly higher.
It could be seen that the statistics of rice-harvested area were much higher than the area of rice extracted from Vietnam. The statistical data were the total rice harvest areas in different growing seasons each year, but the extracted rice area was the land area where rice was planted. In Vietnam, there are three seasons of rice, namely, spring rice, fall rice and winter rice, while the harvested areas of spring rice and fall rice are comparable, and the harvested area of winter rice is smaller. In this way, part of the statistical data of rice harvest area is repeated and accounts for a large proportion of the area, resulting in a larger rice-statistical area than the extracted rice area. Although other countries also have multiple rice seasons, the areas of rice in the main season are large, while that in the other seasons is small, so the area proportion calculated repeatedly is small. The extracted rice area was closer to the paddy land area in the statistical yearbook of Vietnam and the VLUCD, indicating that the extraction result was reliable.
4.3 Comparison with statistical data and other rice area maps at the provincial scale
Figure 8 shows the comparison of the extracted rice area with the statistical data of rice-harvested area and IRRI rice data at the provincial scale for five Southeast Asian countries. The available rice maps contain a 500 m resolution rice map of mainland Southeast Asia (IRRI rice data) and a 30 m resolution rice map of Vietnam (VLUCD) (see Sect. 2.2.3 for details). In general, the rice area extraction results were in good agreement with the statistical area, IRRI data and VLUCDs. Among them, the R2 ranged from 0.82 to 0.88 with statistical data and from 0.83 to 0.97 with IRRI, as shown in Fig. 8.
As shown in Fig. 8a and b, the rice-planting areas in Thailand and Cambodia extracted by our method had a good correlation with the statistical data and IRRI data at the provincial scale. The R2 was distributed in the range of 0.83–0.88. There were no provinces with large deviations.
In Fig. 8c, in Myanmar, the R2 between the extracted area of rice and the statistical data and IRRI rice data was 0.83 and 0.84, respectively. However, the extracted rice area of Ayeyarwady province was significantly lower than that of the statistical data and IRRI data. The extraction results of Ayeyarwady were compared with the IRRI data, as shown in Fig. 9. As reported by Han et al. (2021), due to the influence of mixed pixels, the IRRI data divide too many rivers and too much non-rice vegetation into rice. The extracted rice area map retains the details of rivers and roads.
The R2 of the extracted rice area in Laos with statistical data was 0.82, and the highest agreement with IRRI data was 0.97, as shown in Fig. 8d. For the same reason as Ayeyarwady province, the rice-extraction area in Savannakhet province was lower than the IRRI data because the details of rivers and roads were preserved in the extraction results.
Different from the other subfigures, Vietnam added data-comparison results with 30 m VLUCDs. The extraction results in Vietnam correlated well with the statistical data, VLUCDs and IRRI data, with all R2 values greater than 0.80, as shown in Fig. 8e. The area of rice extraction in Vietnam was in higher agreement with the VLUCD (R2 of 0.87) than with statistics (R2 of 0.86) and IRRI rice data (R2 of 0.83). Most of the points of VLUCDs were distributed on the 1:1 line.
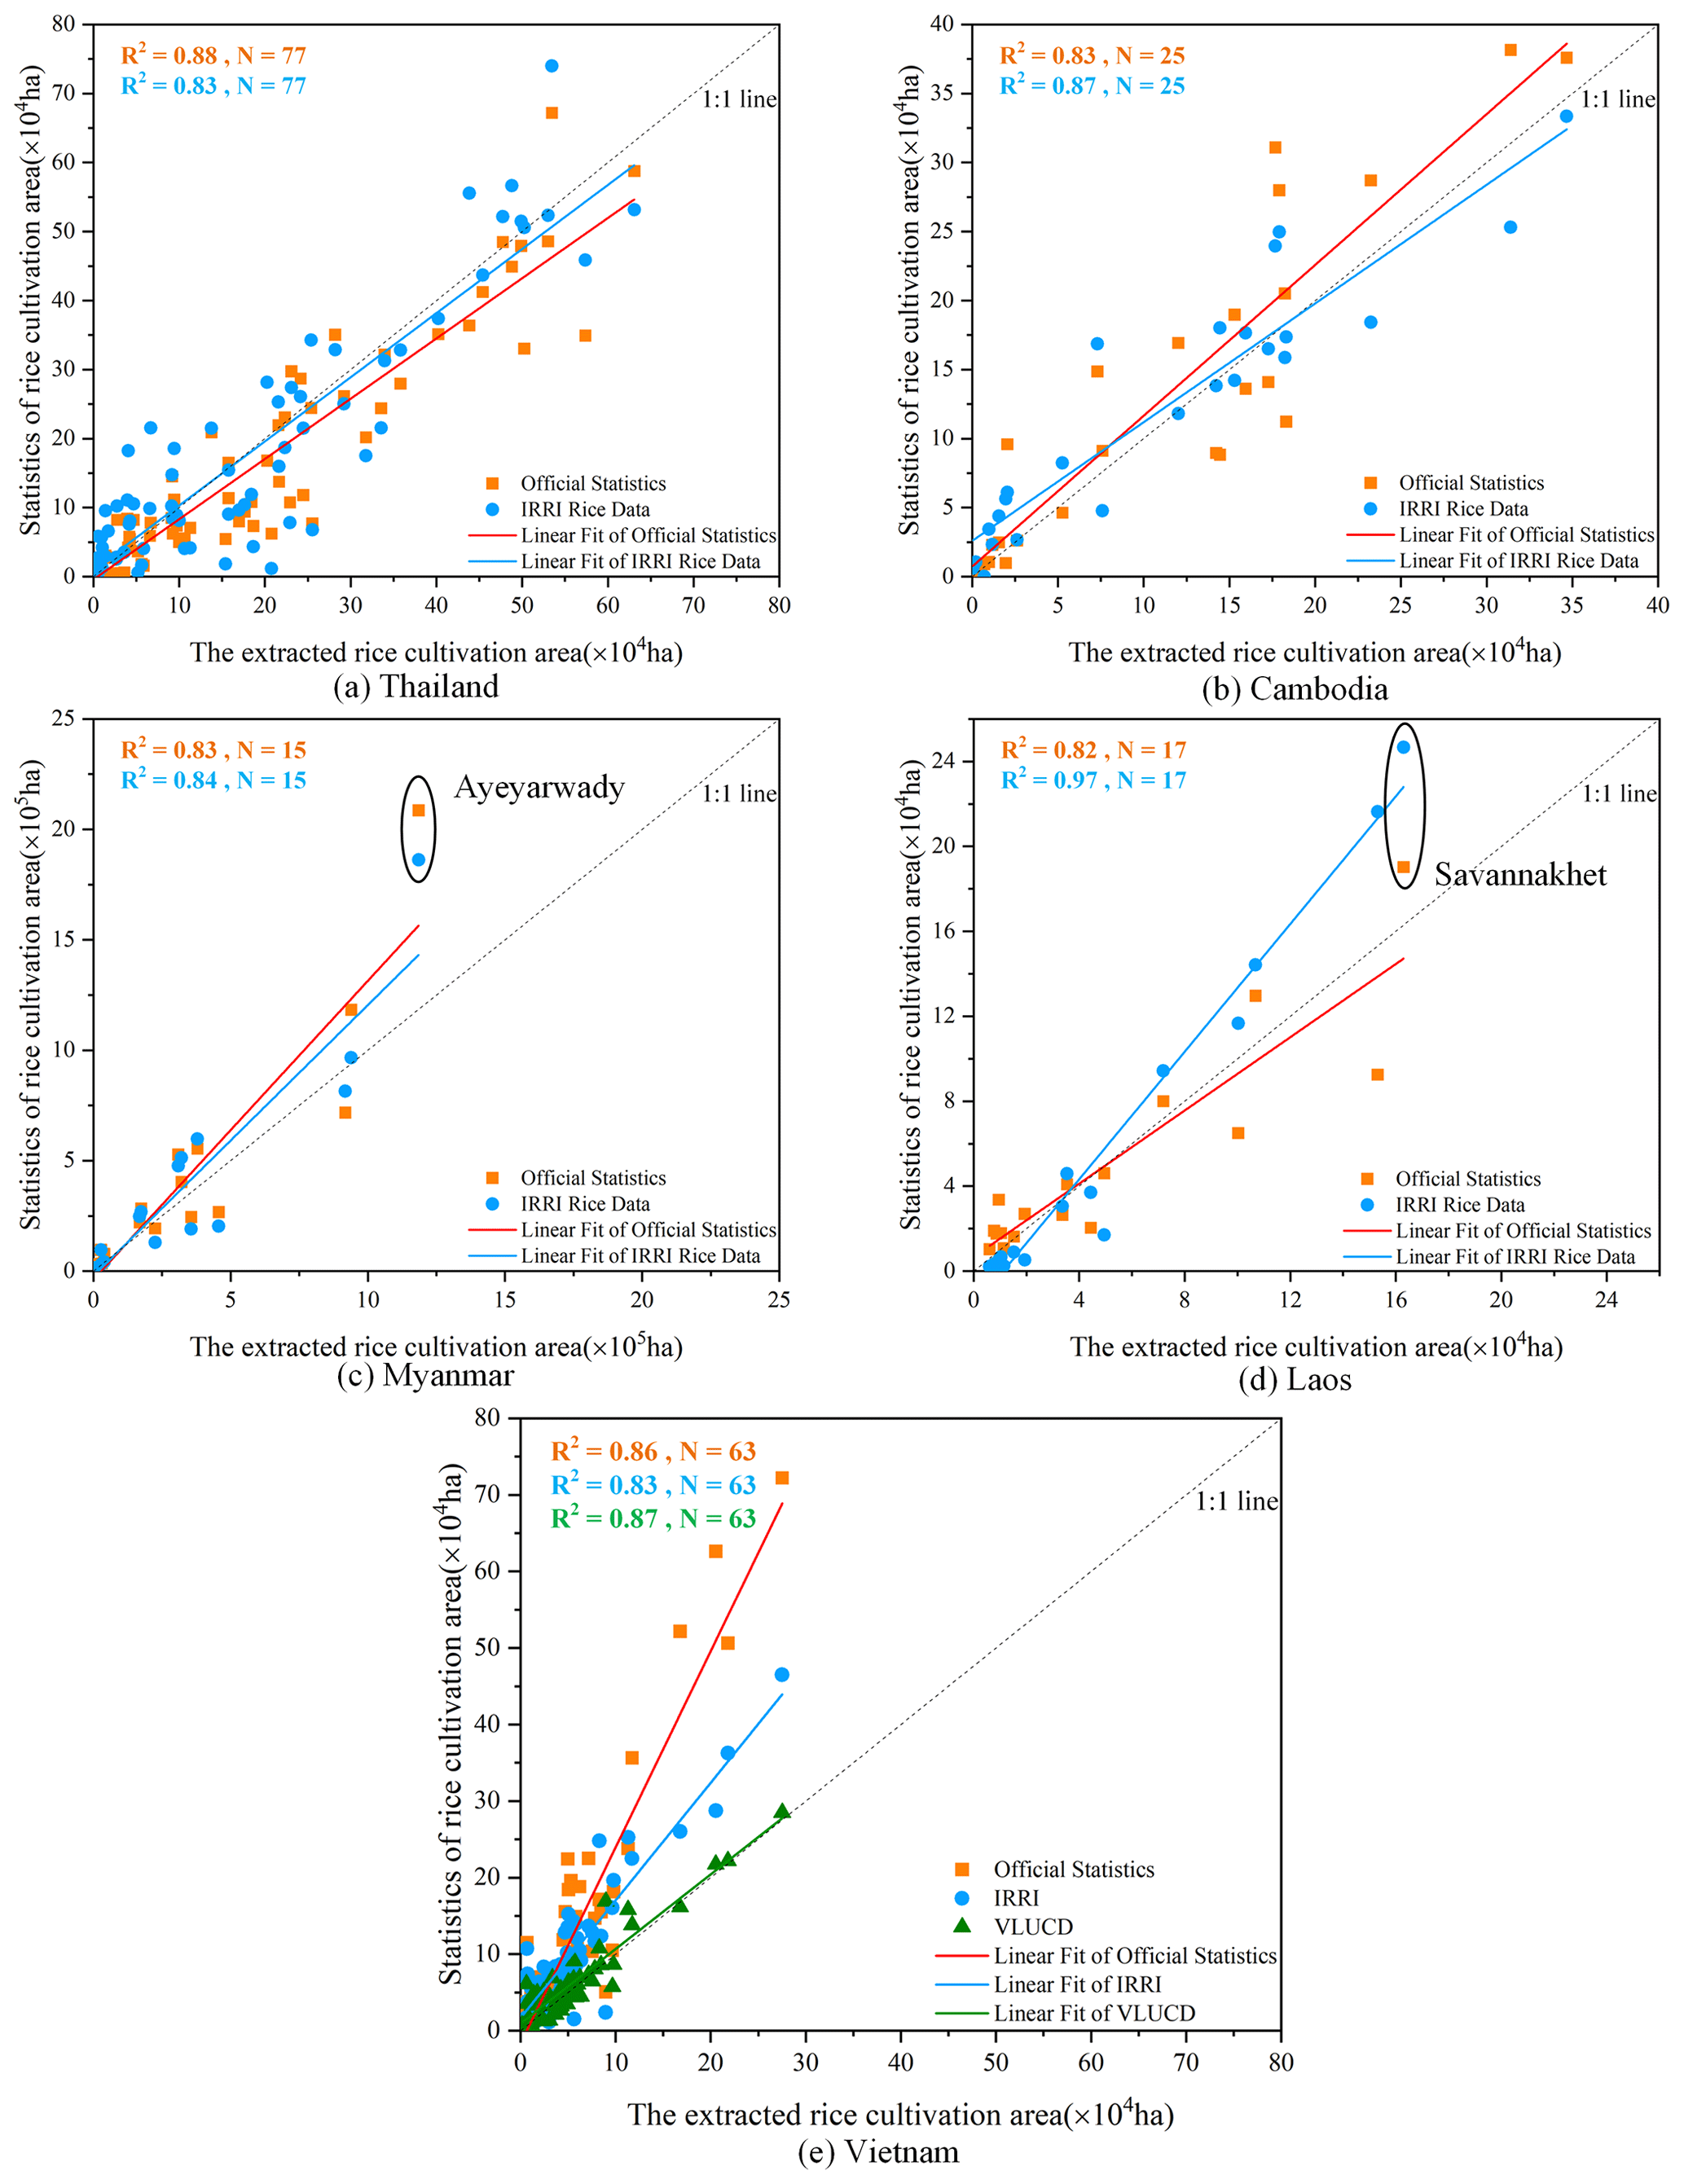
Figure 8Comparison of the extracted rice area with the statistical rice-harvested area and IRRI data set at the provincial scale. N is the number of provinces in each country.
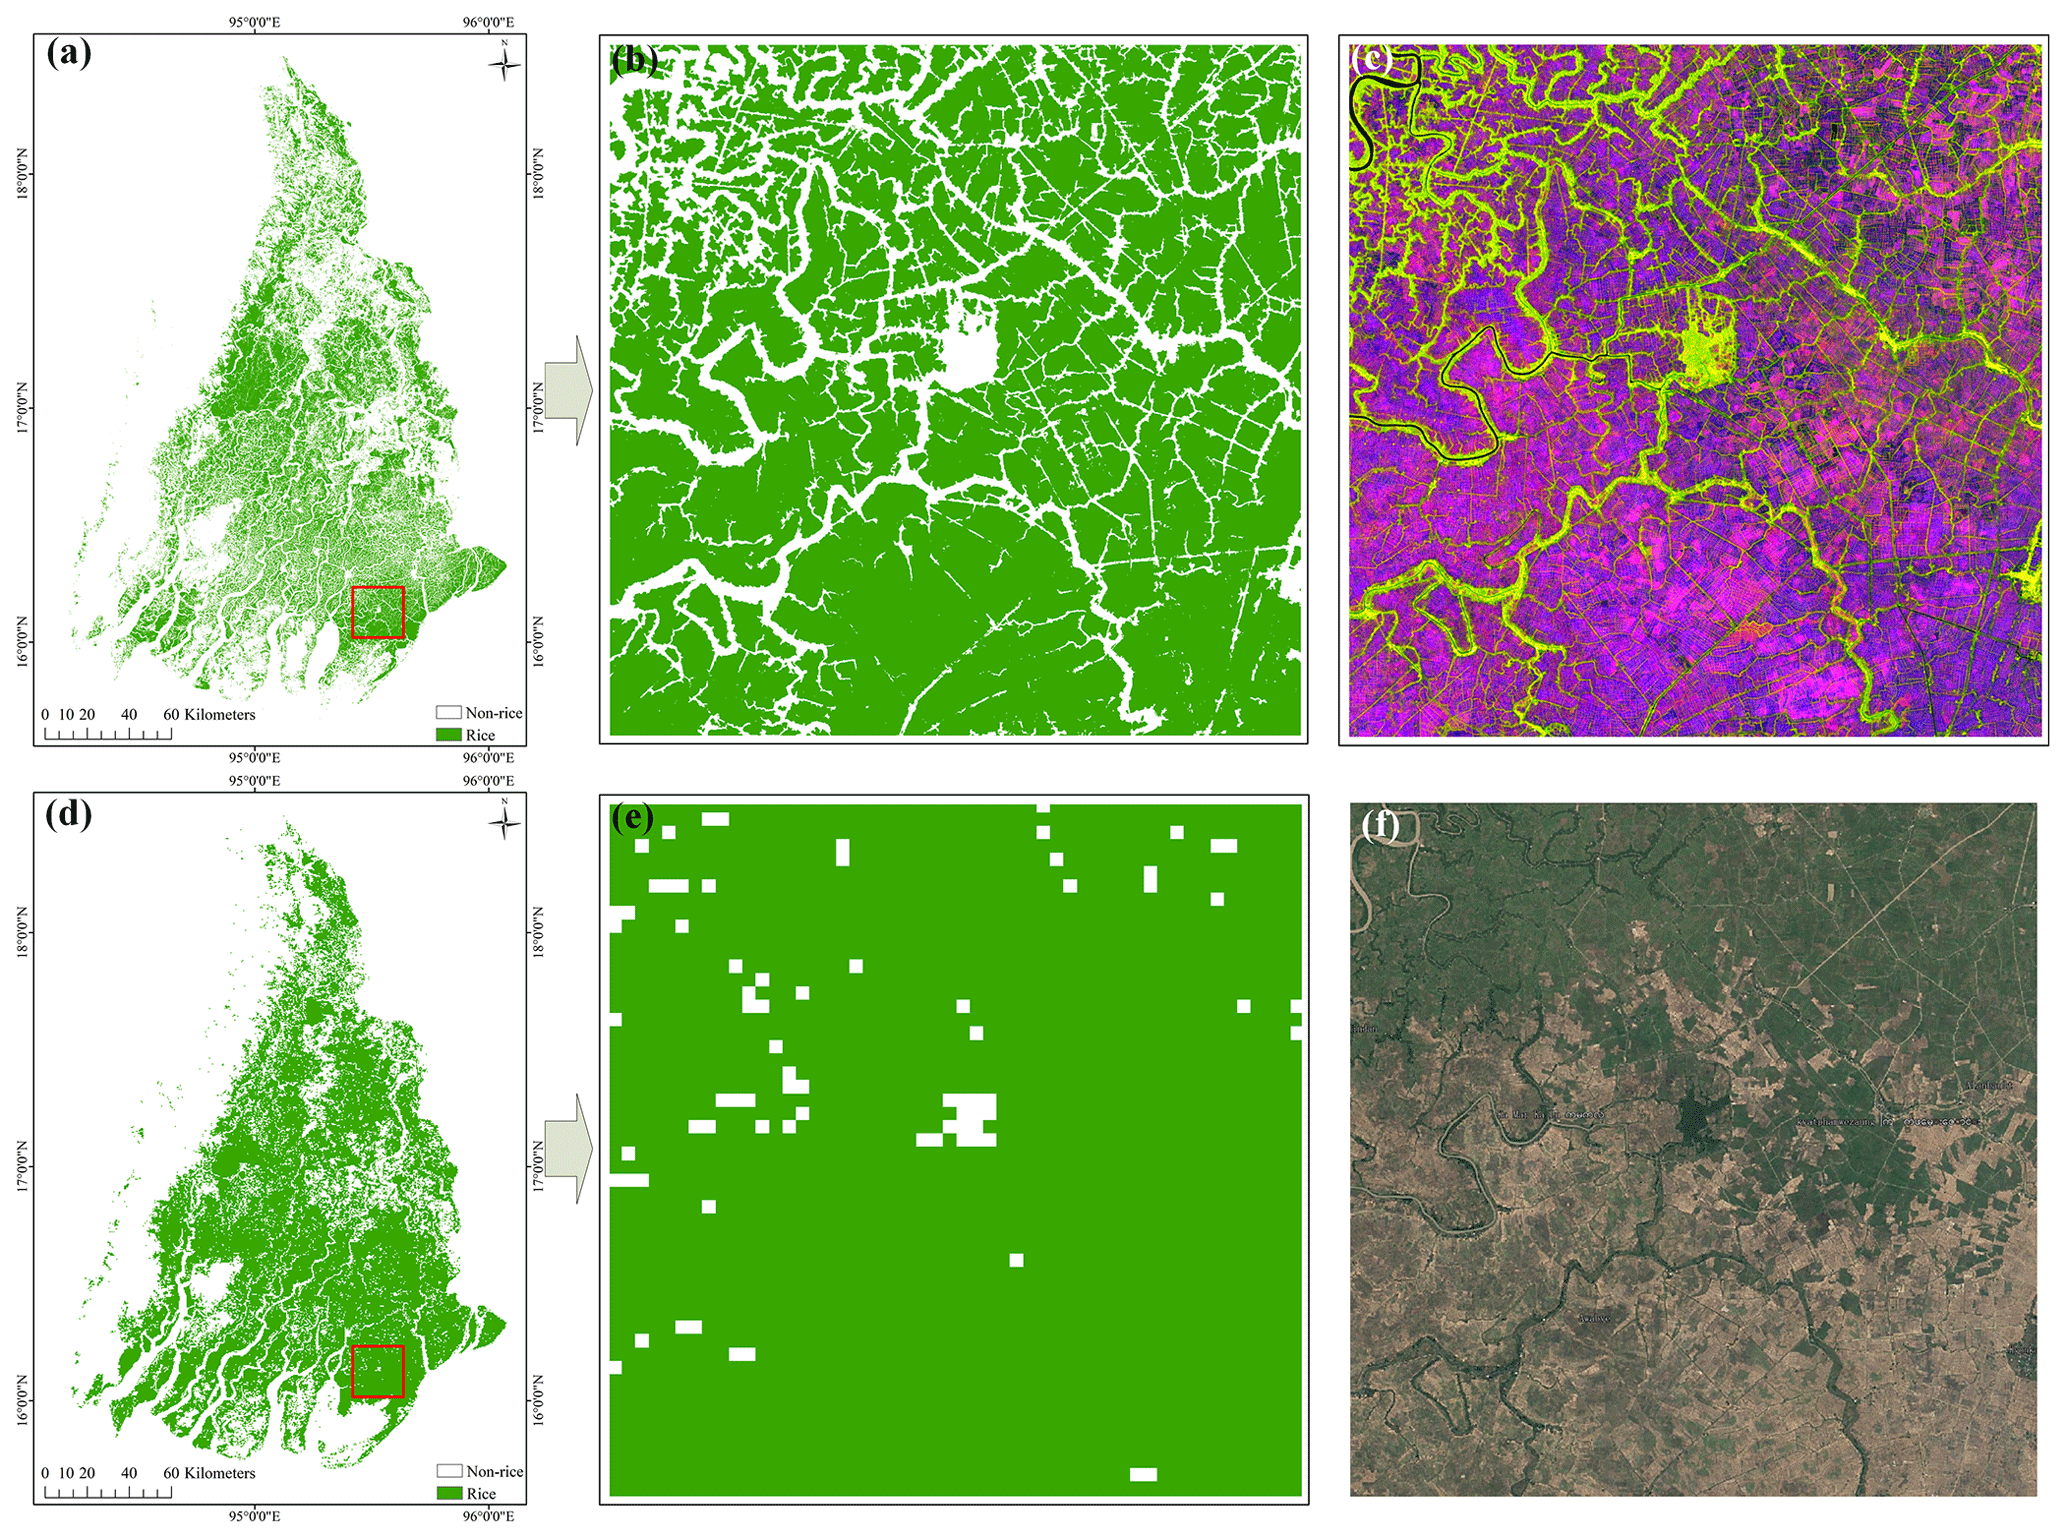
Figure 9Comparison of our extracted rice area map of Ayeyarwady Province with IRRI data: (a) our rice area extraction result; (b) the enlarged view of the red box in panel (a); (c) the pseudo-color image of SAR features corresponding to panel (b); (d) IRRI rice data; (e) the enlarged view of the red box in panel (d); (f) the optical image (© Google Earth) corresponding to panel (e).
In this study, annual rice area maps for five Southeast Asian countries in 2019 were generated using temporal features extracted based on Sentinel-1 SAR time series and an improved U-Net model. Accuracy, precision and recall based on the validation set exceeded 90 %, with a Kappa of 0.8425. Accuracy evaluation of rice mapping showed that the proposed temporal features were able to portray the unique growth characteristics of rice, and the improved U-Net model was able to suppress the false alarms of sporadic distribution caused by complex topography. The proposed method has superior capability in mapping rice distribution in large tropical regions.
The rice area extraction results were compared with statistical data from the national and provincial levels in Sect. 4.2 and 4.3. The results of multiple comparisons show that our rice area extraction results are in high agreement with the statistical data. However, there were also minor inconsistencies. A possible reason is that the statistical cycle is not strictly aligned with the SAR data collection cycle. The rice area extracted in this study is the total area of all fields that have been planted with rice in a year. Most agricultural statistics record the total area of rice planted in different growing seasons on an annual basis or even from one month of one year to the next. In addition, the statistical methods may cause errors in the statistics. The well-organized rice-growing seasons were mainly considered in all statistics, and the random and irregular planting behavior of individual farmers was inevitably ignored. Considering the data collection conditions and statistical errors, it is understandable that the extracted rice map differs from the official statistics.
The comparison results between rice area products extracted based on different remote-sensing data showed that our rice area extraction results were in good agreement with the available rice products at the national and provincial levels. To fully demonstrate the reliability of the rice extraction results, three subregions from the rice map were selected for comparison in Thailand and Vietnam, as shown in Fig. 10. As mentioned in other literature (Dong et al., 2015; Han et al., 2021), the MODIS-based IRRI rice map with 500 m resolution contains a large number of mixed image elements, and thus misclassification exists in rice area maps. The spatial distribution characteristics of our rice area map were generally consistent with those of the IRRI data, and our rice area map retained more details with fewer mixed pixels. In addition, our rice area map also had better agreement with the spatial distribution and detailed information of rice from VLUCDs. Overall, comparisons based on the validation set, statistical data and other rice area map products confirmed the reliability of our rice area map.
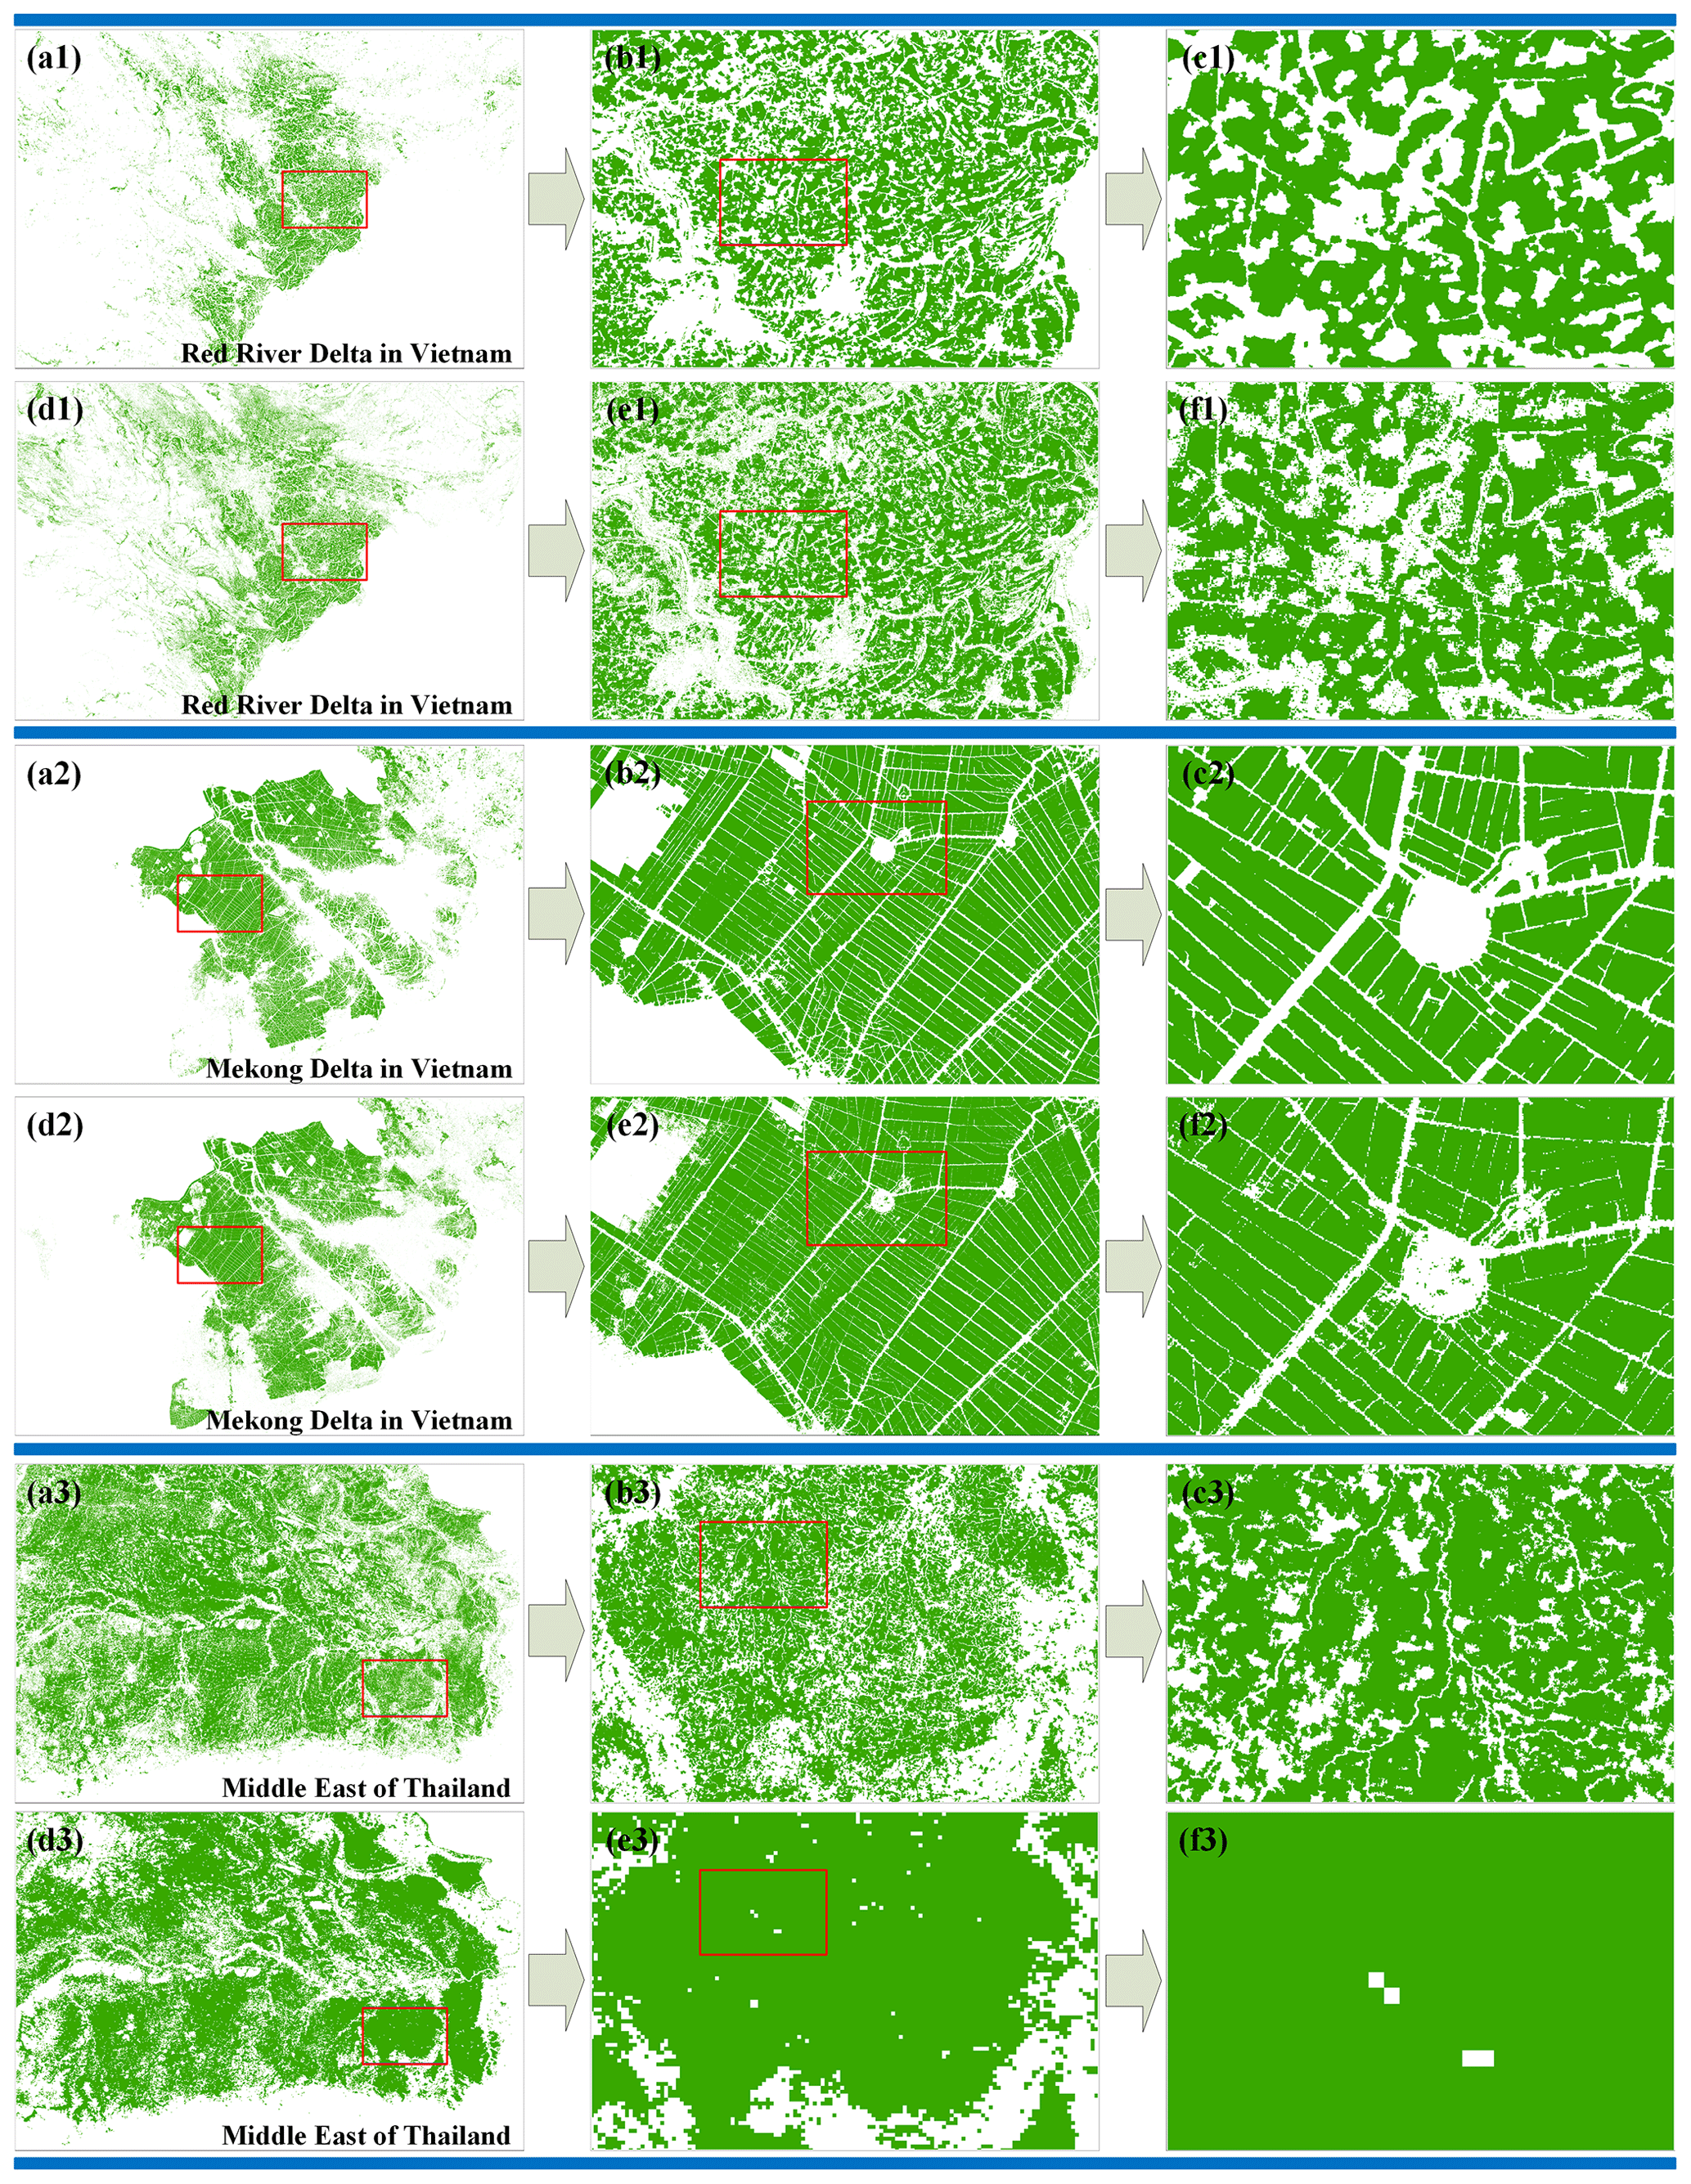
Figure 10Comparison of our rice area map with available rice area products in typical regions. Our extraction results (a1–c1, a2–c2, a3–c3); VLUCD rice map (d1–f1, d2–f2); IRRI rice data (d3–f3). The figures in the second column show the enlarged views of the red boxes in the figures of the first column, and the figures in the third column show the enlarged views of the red boxes in the figures of the second column.
In the study, the temporal features along rivers and wetlands are more similar to paddy rice and have similar colors in the feature pseudo-color image, which can easily be misclassified as rice. The backscattered information of scattered rice fields is subject to interference from topography and surrounding non-rice land cover, resulting in missed detection. Improvements can be made in future studies using water masks extracted from higher-precision land cover data or by adding more negative samples.
The 20 m annual paddy rice area map for mainland Southeast Asia can be accessed in the Zenodo data set from the following DOI: https://doi.org/10.5281/zenodo.7315076 (Sun et al., 2022b). The spatial reference system of the data set is EPSG:4326(WGS84).
Ending hunger and malnutrition is essential, and rice plays a critical role. Satellite-based remote sensing offers the most practical means of monitoring rice cultivation in mainland Southeast Asia. Questions remain, however, as to appropriate timing, number of satellite observations, spatial resolution of satellite imagery and effective data-processing methods for rice distribution and production information.
To perform large-scale rice area mapping in tropical and subtropical regions, an efficient rice area mapping method based on time-series SAR features and a deep-learning model is proposed. A 20 m spatial-resolution rice area map of mainland Southeast Asia was produced using the 2019 Sentinel-1 time-series data and the proposed rice area mapping method. The accuracy of the proposed method in the validation sample set was 92.20 %. Our rice area map correlated significantly with statistical data and was consistent with other rice area maps. These results demonstrate the advantages of the proposed method for rice area mapping with complex cropping patterns. The rice area map we produced will provide data support for agricultural resource studies, such as yield prediction and agricultural management.
CS and HZ: conceptualization, methodology, software; HZ: validation, formal analysis; CS and LX: investigation; JJ and JG: resources, data curation; CS and HZ: writing – original draft preparation; HZ, LX, JG and LZ: writing – review and editing; LX and JG: visualization; HZ and CW: supervision, project administration. All the authors have read and agreed to the published version of the manuscript.
The contact author has declared that none of the authors has any competing interests.
Publisher's note: Copernicus Publications remains neutral with regard to jurisdictional claims in published maps and institutional affiliations.
The authors would like to thank the ESA and the EU Copernicus program for providing the Sentinel-1 SAR data.
This research was funded by the National Natural Science Foundation of China (grant nos. 41971395, 41930110 and 42001278) and the Strategic Priority Research Program of the Chinese Academy of Sciences (grant no. XDA19090119).
This paper was edited by Nophea Sasaki and reviewed by two anonymous referees.
Bridhikitti, A. and Overcamp, T. J.: Estimation of Southeast Asian rice paddy areas with different ecosystems from moderate-resolution satellite imagery, Agr. Ecosyst. Environ., 146, 113–120, https://doi.org/10.1016/j.agee.2011.10.016, 2012.
Chang, L., Chen, Y.-T., Chan, Y.-L., and Wu, M.-C.: A Novel Feature for Detection of Rice Field Distribution Using Time Series SAR Data, IGARSS 2020–2020 IEEE International Geoscience and Remote Sensing Symposium, 26 September–2 October 2020, Waikoloa, HI, USA, 4866–4869, https://doi.org/10.1109/igarss39084.2020.9323278, 2020.
Chen, C. F., Son, N. T., and Chang, L. Y.: Monitoring of rice cropping intensity in the upper Mekong Delta, Vietnam using time-series MODIS data, Adv. Space Res., 49, 292–301, https://doi.org/10.1016/j.asr.2011.09.011, 2012.
Chen, C. F., Son, N. T., Chen, C. R., Chang, L. Y., and Chiang, S. H.: Rice Crop Mapping Using Sentinel-1a Phenological Metrics, Int. Arch. Photogramm., XLI-B8, 863–865, https://doi.org/10.5194/isprsarchives-XLI-B8-863-2016, 2016.
Clauss, K., Yan, H., and Kuenzer, C.: Mapping Paddy Rice in China in 2002, 2005, 2010 and 2014 with MODIS Time Series, Remote Sens.-Basel, 8, 434, https://doi.org/10.3390/rs8050434, 2016.
Clauss, K., Ottinger, M., Leinenkugel, P., and Kuenzer, C.: Estimating rice production in the Mekong Delta, Vietnam, utilizing time series of Sentinel-1 SAR data, Int. J. Appl. Earth Obs., 73, 574–585, https://doi.org/10.1016/j.jag.2018.07.022, 2018.
Congalton, R. G.: A review of assessing the accuracy of classifications of remotely sensed data, Remote Sens. Environ., 37, 35–46, https://doi.org/10.1016/0034-4257(91)90048-B, 1991.
Crisóstomo de Castro Filho, H., Abílio de Carvalho Júnior, O., Ferreira de Carvalho, O. L., Pozzobon de Bem, P., dos Santos de Moura, R., Olino de Albuquerque, A., Rosa Silva, C., Guimarães Ferreira, P. H., Fontes Guimarães, R., and Trancoso Gomes, R. A.: Rice Crop Detection Using LSTM, Bi-LSTM, and Machine Learning Models from Sentinel-1 Time Series, Remote Sens.-Basel, 12, 2655, https://doi.org/10.3390/rs12162655, 2020.
Cué La Rosa, L. E., Queiroz Feitosa, R., Nigri Happ, P., Del'Arco Sanches, I., and Ostwald Pedro da Costa, G. A.: Combining Deep Learning and Prior Knowledge for Crop Mapping in Tropical Regions from Multitemporal SAR Image Sequences, Remote Sens.-Basel, 11, 2029, https://doi.org/10.3390/rs11172029, 2019.
Desa, U.: Transforming our world: The 2030 agenda for sustainable development, https://sustainabledevelopment.un.org/post2015/transformingourworld/publication (last access: 29 March 2023), 2016.
Dong, J., Xiao, X., Kou, W., Qin, Y., Zhang, G., Li, L., Jin, C., Zhou, Y., Wang, J., Biradar, C., Liu, J., and Moore, B.: Tracking the dynamics of paddy rice planting area in 1986–2010 through time series Landsat images and phenology-based algorithms, Remote Sens. Environ., 160, 99–113, https://doi.org/10.1016/j.rse.2015.01.004, 2015.
Dong, J., Xiao, X., Menarguez, M. A., Zhang, G., Qin, Y., Thau, D., Biradar, C., and Moore III, B.: Mapping paddy rice planting area in northeastern Asia with Landsat 8 images, phenology-based algorithm and Google Earth Engine, Remote Sens. Environ., 185, 142–154, https://doi.org/10.1016/j.rse.2016.02.016, 2016a.
Dong, J., Xiao, X., Zhang, G., Menarguez, M., Choi, C., Qin, Y., Luo, P., Zhang, Y., and Moore, B.: Northward expansion of paddy rice in northeastern Asia during 2000–2014, Geophys. Res. Lett., 43, 3754–3761, https://doi.org/10.1002/2016GL068191, 2016b.
Draper, N. R. and Smith, H.: Applied regression analysis, John Wiley & Sons, https://doi.org/10.1002/bimj.19690110613, 1998.
FAO: World rice production (Crops > Items > Rice, paddy): https://www.fao.org/faostat/en/#data/QCL (last access: 7 November 2022), 2020.
FAOSTAT: Statistical Database of the Food and Agricultural Organization of the United Nations, https://www.fao.org/statistics/en/ (last access: 29 March 2023), 2010.
Filipponi, F.: Sentinel-1 GRD Preprocessing Workflow, Proceedings, 18, 11, https://doi.org/10.3390/ECRS-3-06201, 2019.
Godfray, H. C., Beddington, J. R., Crute, I. R., Haddad, L., Lawrence, D., Muir, J. F., Pretty, J., Robinson, S., Thomas, S. M., and Toulmin, C.: Food security: the challenge of feeding 9 billion people, Science, 327, 812–818, https://doi.org/10.1126/science.1185383, 2010.
Guan, X., Huang, C., Liu, G., Meng, X., and Liu, Q.: Mapping rice cropping systems in Vietnam using an NDVI-based time-series similarity measurement based on DTW distance, Remote Sens.-Basel, 8, 19, https://doi.org/10.3390/rs8010019, 2016.
Gumma, M. K., Nelson, A., Thenkabail, P. S., and Singh, A. N.: Mapping rice areas of South Asia using MODIS multitemporal data, J. Appl. Remote Sens., 5, 053547, https://doi.org/10.1117/1.3619838, 2011a.
Gumma, M. K., Gauchan, D., Nelson, A., Pandey, S., and Rala, A.: Temporal changes in rice-growing area and their impact on livelihood over a decade: A case study of Nepal, Agr. Ecosyst. Environ., 142, 382–392, https://doi.org/10.1016/j.agee.2011.06.010, 2011b.
Gumma, M. K., Thenkabail, P. S., Maunahan, A., Islam, S., and Nelson, A.: Mapping seasonal rice cropland extent and area in the high cropping intensity environment of Bangladesh using MODIS 500 m data for the year 2010, ISPRS J. Photogramm., 91, 98–113, https://doi.org/10.1016/j.isprsjprs.2014.02.007, 2014.
Han, J., Zhang, Z., Luo, Y., Cao, J., Zhang, L., Cheng, F., Zhuang, H., Zhang, J., and Tao, F.: NESEA-Rice10: high-resolution annual paddy rice maps for Northeast and Southeast Asia from 2017 to 2019, Earth Syst. Sci. Data, 13, 5969–5986, https://doi.org/10.5194/essd-13-5969-2021, 2021.
Han, J., Zhang, Z., Luo, Y., Cao, J., Zhang, L., Zhuang, H., Cheng, F., Zhang, J., and Tao, F.: Annual paddy rice planting area and cropping intensity datasets and their dynamics in the Asian monsoon region from 2000 to 2020, Agr. Syst., 200, 103437, https://doi.org/10.1016/j.agsy.2022.103437, 2022.
Hoang-Phi, P., Nguyen-Kim, T., Nguyen-Van-Anh, V., Lam-Dao, N., Le-Van, T., and Pham-Duy, T.: Rice yield estimation in An Giang province, the Vietnamese Mekong Delta using Sentinel-1 radar remote sensing data, IOP C. Ser. Earth Env., 652, 012001, https://doi.org/10.1088/1755-1315/652/1/012001, 2021.
Huang, X., Wang, J., Shang, J., Liao, C., and Liu, J.: Application of polarization signature to land cover scattering mechanism analysis and classification using multi-temporal C-band polarimetric RADARSAT-2 imagery, Remote Sens. Environ., 193, 11–28, https://doi.org/10.1016/j.rse.2017.02.014, 2017.
Inoue, S., Ito, A., and Yonezawa, C.: Mapping Paddy fields in Japan by using a Sentinel-1 SAR time series supplemented by Sentinel-2 images on Google Earth Engine, Remote Sens.-Basel, 12, 1622, https://doi.org/10.3390/rs12101622, 2020.
Ioffe, S. and Szegedy, C.: Batch Normalization: Accelerating Deep Network Training by Reducing Internal Covariate Shift, ArXiv [preprint], abs/1502.03167, https://doi.org/10.48550/arXiv.1502.03167, 2015.
Jin, X., Kumar, L., Li, Z., Feng, H., Xu, X., Yang, G., and Wang, J.: A review of data assimilation of remote sensing and crop models, Eur. J. Agron., 92, 141–152, https://doi.org/10.1016/j.eja.2017.11.002, 2018.
Johnson, D. M. and Mueller, R.: The 2009 cropland data layer, Photogramm. Eng. Rem. S., 76, 1201–1205, 2010.
Kang, J., Yang, X., Wang, Z., Huang, C., and Wang, J.: Collaborative Extraction of Paddy Planting Areas with Multi-Source Information Based on Google Earth Engine: A Case Study of Cambodia, Remote Sens.-Basel, 14, 1823, https://doi.org/10.3390/rs14081823, 2022.
Kuenzer, C. and Knauer, K.: Remote sensing of rice crop areas, Int. J. Remote Sens., 34, 2101–2139, https://doi.org/10.1080/01431161.2012.738946, 2012.
Laborte, A. G., Gutierrez, M. A., Balanza, J. G., Saito, K., Zwart, S. J., Boschetti, M., Murty, M. V. R., Villano, L., Aunario, J. K., Reinke, R., Koo, J., Hijmans, R. J., and Nelson, A.: RiceAtlas, a spatial database of global rice calendars and production, Sci. Data, 4, 170074, https://doi.org/10.1038/sdata.2017.74, 2017.
Li, H., Fu, D., Huang, C., Su, F., Liu, Q., Liu, G., and Wu, S.: An Approach to High-Resolution Rice Paddy Mapping Using Time-Series Sentinel-1 SAR Data in the Mun River Basin, Thailand, Remote Sens.-Basel, 12, 3959, https://doi.org/10.3390/rs12233959, 2020.
Lin, C., Zhong, L., Song, X.-P., Dong, J., Lobell, D. B., and Jin, Z.: Early-and in-season crop type mapping without current-year ground truth: Generating labels from historical information via a topology-based approach, Remote Sens. Environ., 274, 112994, https://doi.org/10.1016/j.rse.2022.112994, 2022.
Liu, C.-A., Chen, Z.-x., Shao, Y., Chen, J.-s., Hasi, T., and Pan, H.-z.: Research advances of SAR remote sensing for agriculture applications: A review, J. Integr. Agr., 18, 506–525, https://doi.org/10.1016/s2095-3119(18)62016-7, 2019.
Liu, R., Zhang, G., Dong, J., Zhou, Y., You, N., He, Y., and Xiao, X.: Evaluating Effects of Medium-Resolution Optical Data Availability on Phenology-Based Rice Mapping in China, Remote Sens.-Basel, 14, 3134, https://doi.org/10.3390/rs14133134, 2022.
Liu, Z., Hu, Q., Tan, J., and Zou, J.: Regional scale mapping of fractional rice cropping change using a phenology-based temporal mixture analysis, Int. J. Remote Sens., 40, 2703–2716, https://doi.org/10.1080/01431161.2018.1530812, 2018.
Luo, Y., Zhang, Z., Li, Z., Chen, Y., Zhang, L., Cao, J., and Tao, F.: Identifying the spatiotemporal changes of annual harvesting areas for three staple crops in China by integrating multi-data sources, Environ. Res. Lett., 15, 074003, https://doi.org/10.1088/1748-9326/ab80f0, 2020.
Manjunath, K., More, R. S., Jain, N., Panigrahy, S., and Parihar, J.: Mapping of rice-cropping pattern and cultural type using remote-sensing and ancillary data: A case study for South and Southeast Asian countries, Int. J. Remote Sens., 36, 6008–6030, https://doi.org/10.1080/01431161.2015.1110259, 2015.
Mansaray, L. R., Kabba, V. T. S., Zhang, L., and Bebeley, H. A.: Optimal multi-temporal Sentinel-1A SAR imagery for paddy rice field discrimination; a recommendation for operational mapping initiatives, Remote Sensing Applications: Society and Environment, 22, 100533, https://doi.org/10.1016/j.rsase.2021.100533, 2021.
McHugh, M. L.: Interrater reliability: the kappa statistic, Biochem. Medica, 22, 276–282, https://doi.org/10.11613/BM.2012.031, 2012.
Mosleh, M. K., Hassan, Q. K., and Chowdhury, E. H.: Application of remote sensors in mapping rice area and forecasting its production: a review, Sensors-Basel, 15, 769–791, https://doi.org/10.3390/s150100769, 2015.
Ndikumana, E., Ho Tong Minh, D., Baghdadi, N., Courault, D., and Hossard, L.: Deep Recurrent Neural Network for Agricultural Classification using multitemporal SAR Sentinel-1 for Camargue, France, Remote Sens.-Basel, 10, 1217, https://doi.org/10.3390/rs10081217, 2018.
Nelson, A. and Gumma, M. K.: A map of lowland rice extent in the major rice growing countries of Asia, IRRI [data set], http://irri.org/our-work/research/policy-and-markets/mapping.37 (last access: 11 October 2022), 2015.
Nelson, A., Setiyono, T., Rala, A., Quicho, E., Raviz, J., Abonete, P., Maunahan, A., Garcia, C., Bhatti, H., Villano, L., Thongbai, P., Holecz, F., Barbieri, M., Collivignarelli, F., Gatti, L., Quilang, E., Mabalay, M., Mabalot, P., Barroga, M., Bacong, A., Detoito, N., Berja, G., Varquez, F., Wahyunto, Kuntjoro, D., Murdiyati, S., Pazhanivelan, S., Kannan, P., Mary, P., Subramanian, E., Rakwatin, P., Intrman, A., Setapayak, T., Lertna, S., Minh, V., Tuan, V., Duong, T., Quyen, N., Van Kham, D., Hin, S., Veasna, T., Yadav, M., Chin, C., and Ninh, N.: Towards an Operational SAR-Based Rice Monitoring System in Asia: Examples from 13 Demonstration Sites across Asia in the RIICE Project, Remote Sens.-Basel, 6, 10773–10812, https://doi.org/10.3390/rs61110773, 2014.
Nguyen, D. B. and Wagner, W.: European Rice Cropland Mapping with Sentinel-1 Data: The Mediterranean Region Case Study, Water, 9, 392, https://doi.org/10.3390/w9060392, 2017.
Ni, R., Tian, J., Li, X., Yin, D., Li, J., Gong, H., Zhang, J., Zhu, L., and Wu, D.: An enhanced pixel-based phenological feature for accurate paddy rice mapping with Sentinel-2 imagery in Google Earth Engine, ISPRS J. Photogramm., 178, 282–296, https://doi.org/10.1016/j.isprsjprs.2021.06.018, 2021.
Orynbaikyzy, A., Gessner, U., and Conrad, C.: Crop type classification using a combination of optical and radar remote sensing data: a review, Int. J. Remote Sens., 40, 6553–6595, https://doi.org/10.1080/01431161.2019.1569791, 2019.
Pan, B., Zheng, Y., Shen, R., Ye, T., Zhao, W., Dong, J., Ma, H., and Yuan, W.: High Resolution Distribution Dataset of Double-Season Paddy Rice in China, Remote Sens.-Basel, 13, 4609, https://doi.org/10.3390/rs13224609, 2021.
Phan, D. C., Trung, T. H., Truong, V. T., Sasagawa, T., Vu, T. P. T., Bui, D. T., Hayashi, M., Tadono, T., and Nasahara, K. N.: First comprehensive quantification of annual land use/cover from 1990 to 2020 across mainland Vietnam, Sci. Rep.-UK, 11, 9979, https://doi.org/10.1038/s41598-021-89034-5, 2021.
Qiu, B., Hu, X., Chen, C., Tang, Z., Yang, P., Zhu, X., Yan, C., and Jian, Z.: Maps of cropping patterns in China during 2015–2021, Sci. Data, 9, 479, https://doi.org/10.1038/s41597-022-01589-8, 2022.
Ronneberger, O., Fischer, P., and Brox, T.: U-Net: Convolutional Networks for Biomedical Image Segmentation, ArXiv [preprint], abs/1505.04597, https://doi.org/10.48550/arXiv.1505.04597, 2015.
Shew, A. M. and Ghosh, A.: Identifying Dry-Season Rice-Planting Patterns in Bangladesh Using the Landsat Archive, Remote Sens.-Basel, 11, 1235, https://doi.org/10.3390/rs11101235, 2019.
Singha, M., Dong, J., Zhang, G., and Xiao, X.: High resolution paddy rice maps in cloud-prone Bangladesh and Northeast India using Sentinel-1 data, Sci. Data, 6, 26, https://doi.org/10.1038/s41597-019-0036-3, 2019.
Soh, N. C., Shah, R. M., Giap, S. G. E., Setiawan, B. I., and Minasny, B.: High-Resolution Mapping of Paddy Rice Extent and Growth Stages across Peninsular Malaysia Using a Fusion of Sentinel-1 and 2 Time Series Data in Google Earth Engine, Remote Sens.-Basel, 14, 1875, https://doi.org/10.3390/rs14081875, 2022.
Sun, C., Zhang, H., Xu, L., Wang, C., and Li, L.: Rice Mapping Using a BiLSTM-Attention Model from Multitemporal Sentinel-1 Data, Agriculture, 11, 977, https://doi.org/10.3390/agriculture11100977, 2021.
Sun, C., Zhang, H., Ge, J., Wang, C., Li, L., and Xu, L.: Rice Mapping in a Subtropical Hilly Region Based on Sentinel-1 Time Series Feature Analysis and the Dual Branch BiLSTM Model, Remote Sens.-Basel, 14, 3213, https://doi.org/10.3390/rs14133213, 2022a.
Sun, C., Zhang, H., Xu, L., Ge, J., Jiang, J., Zuo, L., and Wang, C.: 20 m Annual Paddy Rice Map for Mainland Southeast Asia Using Sentinel-1 SAR Data (1), Zenodo [data set], https://doi.org/10.5281/zenodo.7315076, 2022b.
Sun, H.-S., Huang, J.-F., Huete, A. R., Peng, D.-L., and Zhang, F.: Mapping paddy rice with multi-date moderate-resolution imaging spectroradiometer (MODIS) data in China, J. Zhejiang Univ.-Sc. A, 10, 1509–1522, https://doi.org/10.1631/jzus.A0820536, 2009.
Thenkabail, P. S., Biradar, C. M., Noojipady, P., Dheeravath, V., Li, Y., Velpuri, M., Gumma, M., Gangalakunta, O. R. P., Turral, H., and Cai, X.: Global irrigated area map (GIAM), derived from remote sensing, for the end of the last millennium, Int. J. Remote Sens., 30, 3679–3733, https://doi.org/10.1080/01431160802698919, 2009.
Torbick, N., Chowdhury, D., Salas, W., and Qi, J.: Monitoring Rice Agriculture across Myanmar Using Time Series Sentinel-1 Assisted by Landsat-8 and PALSAR-2, Remote Sens.-Basel, 9, 119, https://doi.org/10.3390/rs9020119, 2017.
Torres, R., Snoeij, P., Geudtner, D., Bibby, D., Davidson, M., Attema, E., Potin, P., Rommen, B., Floury, N., and Brown, M.: GMES Sentinel-1 mission, Remote Sens. Environ., 120, 9–24, https://doi.org/10.1016/j.rse.2011.05.028, 2012.
Tsokas, A., Rysz, M., Pardalos, P. M., and Dipple, K.: SAR data applications in earth observation: An overview, Expert Syst. Appl., 205, 117342, https://doi.org/10.1016/j.eswa.2022.117342, 2022.
Vapnik, V. N.: An overview of statistical learning theory, IEEE T Neural Networ., 10, 988–999, https://doi.org/10.1109/72.788640, 1999.
Wei, J., Cui, Y., Luo, W., and Luo, Y.: Mapping Paddy Rice Distribution and Cropping Intensity in China from 2014 to 2019 with Landsat Images, Effective Flood Signals, and Google Earth Engine, Remote Sens.-Basel, 14, 759, https://doi.org/10.3390/rs14030759, 2022.
Wei, P., Chai, D., Lin, T., Tang, C., Du, M., and Huang, J.: Large-scale rice mapping under different years based on time-series Sentinel-1 images using deep semantic segmentation model, ISPRS J. Photogramm., 174, 198–214, https://doi.org/10.1016/j.isprsjprs.2021.02.011, 2021.
Wei, S., Zhang, H., Wang, C., Wang, Y., and Xu, L.: Multi-Temporal SAR Data Large-Scale Crop Mapping Based on U-Net Model, Remote Sens.-Basel, 11, 68, https://doi.org/10.3390/rs11010068, 2019.
Weiss, M., Jacob, F., and Duveiller, G.: Remote sensing for agricultural applications: A meta-review, Remote Sens. Environ., 236, 111402, https://doi.org/10.1016/j.rse.2019.111402, 2020.
Xiao, X., Boles, S., Liu, J., Zhuang, D., Frolking, S., Li, C., Salas, W., and Moore III, B.: Mapping paddy rice agriculture in southern China using multi-temporal MODIS images, Remote Sens. Environ., 95, 480–492, https://doi.org/10.1016/j.rse.2004.12.009, 2005.
Xiao, X., Boles, S., Frolking, S., Li, C., Babu, J. Y., Salas, W., and Moore III, B.: Mapping paddy rice agriculture in South and Southeast Asia using multi-temporal MODIS images, Remote Sens. Environ., 100, 95–113, https://doi.org/10.1016/j.rse.2005.10.004, 2006.
Xin, F., Xiao, X., Dong, J., Zhang, G., Zhang, Y., Wu, X., Li, X., Zou, Z., Ma, J., Du, G., Doughty, R. B., Zhao, B., and Li, B.: Large increases of paddy rice area, gross primary production, and grain production in Northeast China during 2000–2017, Sci. Total Environ., 711, 135183, https://doi.org/10.1016/j.scitotenv.2019.135183, 2020.
Xu, L., Zhang, H., Wang, C., Wei, S., Zhang, B., Wu, F., and Tang, Y.: Paddy Rice Mapping in Thailand Using Time-Series Sentinel-1 Data and Deep Learning Model, Remote Sens.-Basel, 13, 3994, https://doi.org/10.3390/rs13193994, 2021.
Yang, L., Wang, L., Huang, J., Mansaray, L. R., and Mijiti, R.: Monitoring policy-driven crop area adjustments in northeast China using Landsat-8 imagery, Int. J. Appl. Earth Obs., 82, 101892, https://doi.org/10.1016/j.jag.2019.06.002, 2019.
Yang, L., Huang, R., Huang, J., Lin, T., Wang, L., Mijiti, R., Wei, P., Tang, C., Shao, J., Li, Q., and Du, X.: Semantic Segmentation Based on Temporal Features: Learning of Temporal-Spatial Information From Time-Series SAR Images for Paddy Rice Mapping, IEEE T. Geosci. Remote, 60, 4403216, https://doi.org/10.1109/tgrs.2021.3099522, 2021.
You, N. and Dong, J.: Examining earliest identifiable timing of crops using all available Sentinel 1/2 imagery and Google Earth Engine, ISPRS J. Photogramm., 161, 109–123, https://doi.org/10.1016/j.isprsjprs.2020.01.001, 2020.
You, N., Dong, J., Huang, J., Du, G., Zhang, G., He, Y., Yang, T., Di, Y., and Xiao, X.: The 10 m crop type maps in Northeast China during 2017–2019, Sci. Data, 8, 41, https://doi.org/10.1038/s41597-021-00827-9, 2021.
Yu, Q., You, L., Wood-Sichra, U., Ru, Y., Joglekar, A. K. B., Fritz, S., Xiong, W., Lu, M., Wu, W., and Yang, P.: A cultivated planet in 2010 – Part 2: The global gridded agricultural-production maps, Earth Syst. Sci. Data, 12, 3545–3572, https://doi.org/10.5194/essd-12-3545-2020, 2020.
Yuan, S., Stuart, A. M., Laborte, A. G., Rattalino Edreira, J. I., Dobermann, A., Kien, L. V. N., Thúy, L. T., Paothong, K., Traesang, P., Tint, K. M., San, S. S., Villafuerte, M. Q., Quicho, E. D., Pame, A. R. P., Then, R., Flor, R. J., Thon, N., Agus, F., Agustiani, N., Deng, N., Li, T., and Grassini, P.: Southeast Asia must narrow down the yield gap to continue to be a major rice bowl, Nature Food, 3, 217–226, https://doi.org/10.1038/s43016-022-00477-z, 2022.
Zanaga, D., Van De Kerchove, R., De Keersmaecker, W., Souverijns, N., Brockmann, C., Quast, R., Wevers, J., Grosu, A., Paccini, A., and Vergnaud, S.: ESA WorldCover 10 m 2020 v100, Zenodo, https://doi.org/10.5281/zenodo.5571936, 2021.
Zhang, G., Xiao, X., Biradar, C. M., Dong, J., Qin, Y., Menarguez, M. A., Zhou, Y., Zhang, Y., Jin, C., Wang, J., Doughty, R. B., Ding, M., and Moore, B., 3rd: Spatiotemporal patterns of paddy rice croplands in China and India from 2000 to 2015, Sci. Total Environ., 579, 82–92, https://doi.org/10.1016/j.scitotenv.2016.10.223, 2017.
Zhang, X., Wu, B., Ponce-Campos, G., Zhang, M., Chang, S., and Tian, F.: Mapping up-to-Date Paddy Rice Extent at 10 M Resolution in China through the Integration of Optical and Synthetic Aperture Radar Images, Remote Sens.-Basel, 10, 1200, https://doi.org/10.3390/rs10081200, 2018.
Zhao, R., Li, Y., and Ma, M.: Mapping Paddy Rice with Satellite Remote Sensing: A Review, Sustainability, 13, 503, https://doi.org/10.3390/su13020503, 2021.