the Creative Commons Attribution 4.0 License.
the Creative Commons Attribution 4.0 License.
 | 25 Feb 2022
Full-coverage 1 km daily ambient PM2.5 and O3 concentrations of China in 2005–2017 based on a multi-variable random forest model
Runmei Ma
Jie Ban
Qing Wang
Yayi Zhang
Yang Yang
Shenshen Li
Wenjiao Shi
Zhen Zhou
Jiawei Zang
The health risks of fine particulate matter (PM2.5) and ambient ozone (O3) have been widely recognized in recent years. An accurate estimate of PM2.5 and O3 exposures is important for supporting health risk analysis and environmental policy-making. The aim of our study was to construct random forest models with high-performance and estimate daily average PM2.5 concentration and O3 daily maximum of 8 h average concentration (O3-8 hmax) of China in 2005–2017 at a spatial resolution of 1 km × 1 km. The model variables included meteorological variables, satellite data, chemical transport model output, geographic variables and socioeconomic variables. Random forest model based on 10-fold cross-validation was established, and spatial and temporal validations were performed to evaluate the model performance. According to our sample-based division method, the daily, monthly and yearly estimations of PM2.5 from test datasets gave average model-fitting R2 values of 0.85, 0.88 and 0.90, respectively; these R2 values were 0.77, 0.77 and 0.69 for O3-8 hmax, respectively. The meteorological variables and their lagged values can significantly affect both PM2.5 and O3-8 hmax estimations. During 2005–2017, PM2.5 concentration exhibited an overall downward trend, while ambient O3 concentration experienced an upward trend. Whilst the spatial patterns of PM2.5 and O3-8 hmax barely changed between 2005 and 2017, the temporal trend had spatial characteristics. The dataset is accessible to the public at https://doi.org/10.5281/zenodo.4009308 (Ma et al., 2021a), and the shared dataset of Chinese Environmental Public Health Tracking (CEPHT, 2022) is available at https://cepht.niehs.cn:8282/developSDS3.html.
- Article
(5780 KB) - Full-text XML
-
Supplement
(2021 KB) - BibTeX
- EndNote


Air pollution is becoming a main concern of modern society due to various health risks. According to the latest Global Burden of Disease (GBD) report, air pollution has caused approximately 6.67 million deaths (95 % uncertainty intervals: 5.90–7.49 million) and ranked fourth on the global list of death-related risk factors in 2019 (Health Effects Institute, 2020; Murray et al., 2020). Ambient fine particulate matter (PM2.5) and ambient ozone (O3) have been identified and proven to be related to many health outcomes. China is known to be one of the countries with the most serious air pollution in the world. Strict pollution control measures (including the Air Pollution Prevention and Control Action Plan and Three-Year Action Plan To Fight Air Pollution) were enacted by the Chinese government to control and reduce air pollution since 2013. The implementation of these measures has resulted in a markable drop of emissions and PM2.5 concentration. However, the occasional pollution events, as well as the short development history of air quality monitoring network, have brought many difficulties to accurately capture the temporal and spatial patterns of PM2.5 and O3 concentrations. Therefore, it is difficult to develop a complete decision-making basis for handling air pollution. In addition, there are gaps in epidemiological studies linking air pollutants to health outcomes, due to the lack of accurate measurements of PM2.5 and ambient O3 concentrations. To this end, an accurate estimate of PM2.5 and O3 exposures is essential to support health risk analysis and environmental policy-making.
Suitable model variables and advanced estimation method are important to achieve accurate modeling. Basically, PM2.5 is jointly affected by both natural conditions and human activities over space and time, e.g., aerosol optical depth (AOD), meteorological conditions, geographic factors and human-related features (Wei et al., 2021), while O3 is a secondary pollutant, which is produced by a series of complex photochemical reactions on the basis of precursors including nitrogen oxides (NOx) and volatile organic compounds (VOCs) under the action of high temperature and strong radiation. These complex characteristic puts forward higher requirements on the ability of the modeling method to handle multi-variable and capture the non-linear relationships between variables and air pollutants. Many models have been developed to estimate the spatiotemporal distribution of PM2.5 and O3 concentrations in China. Machine-learning approaches (e.g., random forest (RF), extreme gradient boosting and deep belief network models) can mine useful information from a large amount of input data and explore the nonlinear relationship as well as bring a better performance in modeling work (Chen et al., 2018, 2019; Di et al., 2017; Li et al., 2017; Wei et al., 2019; Zhan et al., 2018). However, most of these estimation datasets cannot balance long time series and high spatiotemporal resolution. Besides, there is no long-term estimation dataset for both PM2.5 and O3 concentrations with high temporal and spatial resolution for supporting epidemiological research. Therefore, by incorporating multi-source data into random forest models, this study makes an attempt to estimate the high-resolution (1 km × 1 km) ambient PM2.5 and O3 concentrations of China in 2005–2017.
The model variables of this study include meteorological variables, geographical variables, socioeconomic variables, satellite data and chemical transport model output in 2013–2017. Daily average PM2.5 and O3 daily maximum of 8 h average concentration (O3-8 hmax) monitoring data of 1479 sites in 2013–2017 were obtained (Figs. 1; S1 and S2 in the Supplement). A 1 km × 1 km standard grid is created across the country (35.55∘ N to 43.12∘ N, and 112.95∘ E to 120.35∘ E) with a total of 9495025 grid cells. The coordinate system of the grid is WGS-84, and the projection of the grid is the Albers conical equal-area projection. We construct high-performance random forest models (temporal resolution: daily; spatial resolution: 1 km × 1 km) and estimate the grid daily average PM2.5 concentration and O3-8 hmax concentration of China in 2005–2017.
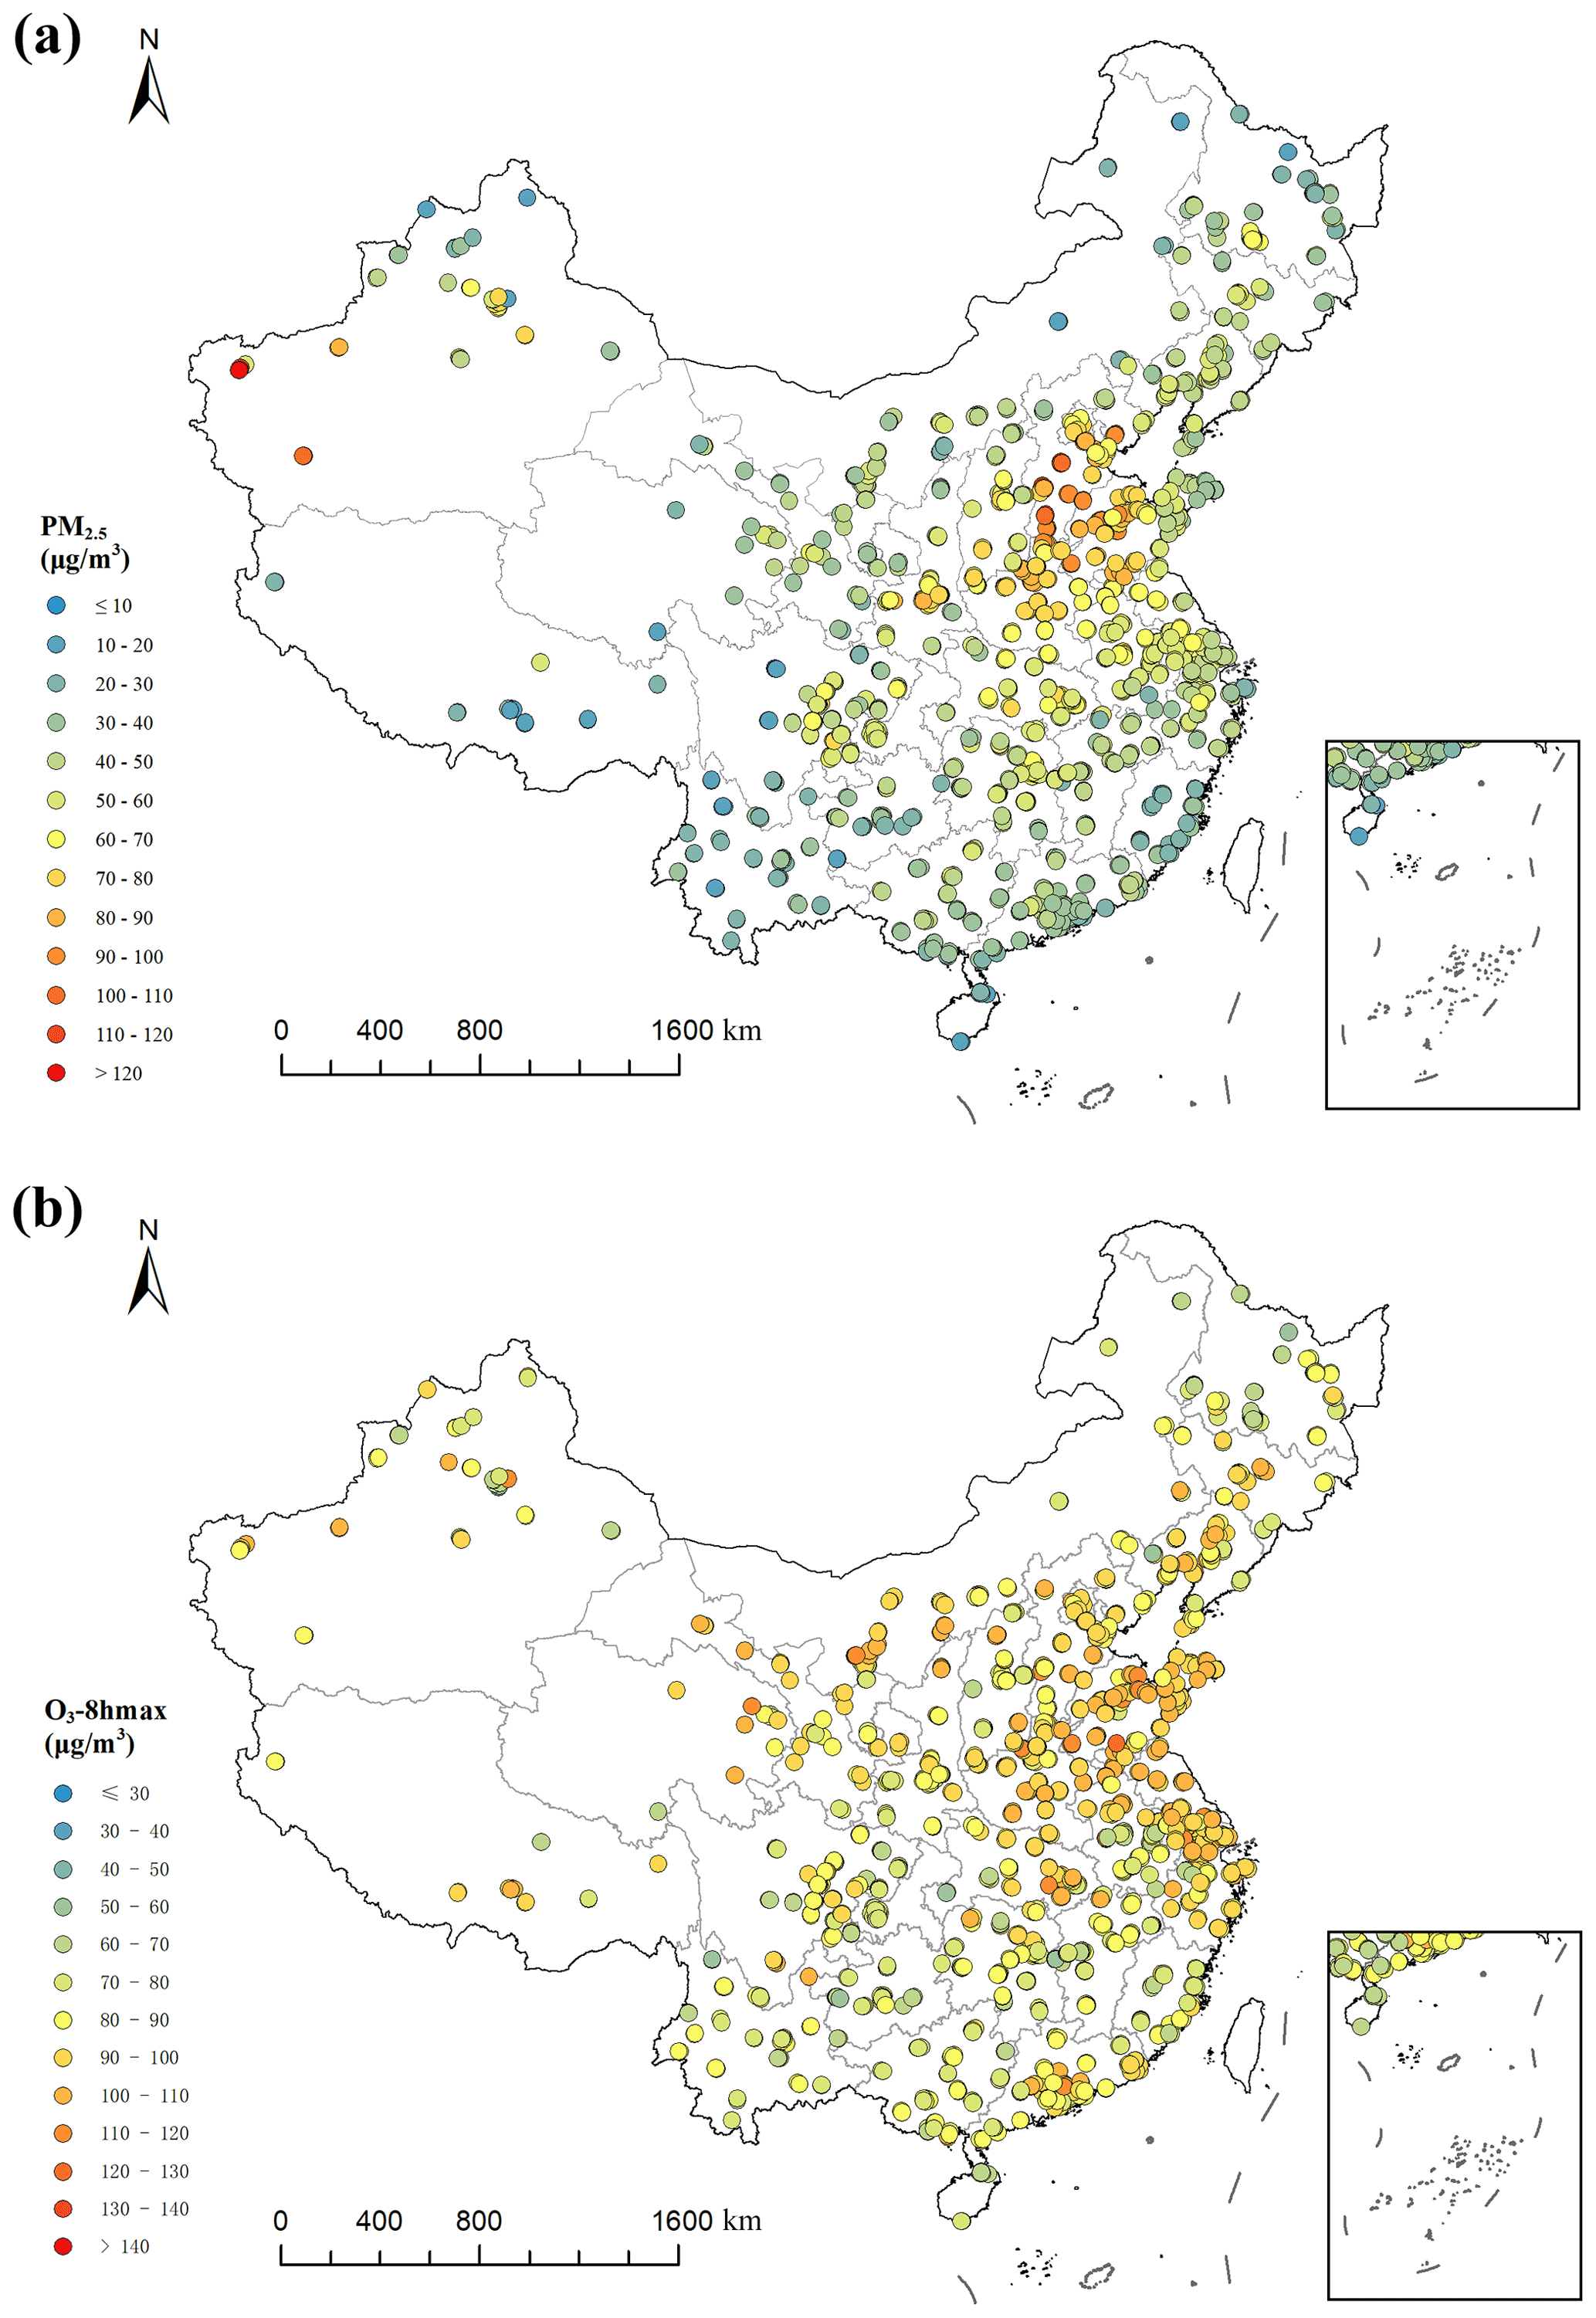
Figure 1Station distribution in China and average ground monitoring concentration based on the available data of PM2.5 (a) and O3-8 hmax (b) from 2013 to 2017.
2.1 Dataset
The model variables used in this study mainly include Aqua AOD for PM2.5 modeling, GEOS-Chem chemical transport model output for O3 modeling and some variables shared by PM2.5 and O3: 13 meteorological variables (includes boundary layer height, surface pressure, 2 m dew point temperature, evaporation, albedo, low cloud cover, medium cloud cover, high cloud cover, total precipitation, 10 m U wind component, 10 m V wind component, 2 m surface temperature and surface solar radiation downwards) and their lag 1 and lag 2, geographic and socioeconomic variables, such as the digital elevation model (DEM), normalized difference vegetation index (NDVI), population, gross domestic product (GDP), road network and dummy variables (includes season, month, and province). A more detailed description of the model variables is given in Table S1 in the Supplement. The processing method has been described in detail in our earlier studies (Ma et al., 2021b; Zhao et al., 2019). Briefly, most of the model variables are processed into 1 km × 1 km resolution based on the standard grid using interpolation methods (such as inverse distance weighted and bilinear algorithm) in ArcGIS 10.2 and Python 2.7. AOD is processed by ENVI 5.3+IDL and extracted into standard grid using ArcPy, and then the inverse-distance-weighted interpolation is carried out to obtain the 1 km × 1 km resolution data. For the long-term variables, the corresponding monthly and annual level value is assigned to each day. Subsequent modeling work was carried out based on the dataset covering monitoring data and all variables.
2.2 Random forest model
Random forest is an ensemble machine learning method consisting of many individual decision trees growing from bagged data, and its prediction is the result of the voting process (Breiman, 2001). The RF algorithm primarily integrates learning principles, trains several individual learners and finally forms a strong learner through a certain combination strategy; through multiple rounds of training, multiple prediction results are obtained, and the final results are obtained after average aggregation.
The random forest models are established using the 10-fold cross-validation method. First, this method randomly divides the modeling dataset into 10 parts, then nine of them are used for modeling, and the remaining one is used for estimation and is compared with observations. The verification is repeated until every part is predicted. In this way, the modeling and verification of estimation are repeated 10 times in total, and the average values of the 10 runs are taken as the final result, i.e., the CV-R2. The formulae of the models are as follows:
where PM2.5 i,j and O3-8 hmaxi,j are the PM2.5 and O3-8 hmax concentrations on day i in grid cell j; METEi,j represents 13 meteorological variables on day i in grid cell j, and lag 1 METEi,j and lag 2 METEi,j represent the corresponding 1 d lag and 2 d lag values, respectively; GEOSi,j and AODi,j are the GEOS-Chem model output and AOD value on day i in grid cell j; LDj, ROADj, NDVIj, ELEj, GDPj and POPj are the land use coverage, length of a variety of roads, NDVI, elevation, GDP and population in grid cell j, respectively; and SEASONi, MONi and PROj are the season and month of day i and the province of grid cell j, respectively.
In general, the random forest parameters that need to be adjusted include n_estimators (number of decision trees) and the max_depth (maximum depth of the trees). Unlike the previous methods of manually adjusting parameters, the parameters of random forest were optimized using GridSearchCV, which can realize a cross-validated grid search over a parameter grid. After GridSearchCV, we set max_depth as 36 and n_estimators as 200 for PM2.5 modeling. For O3-8 hmax modeling, we set max_depth as 54 and n_estimators as 200.
2.3 Validation method
To comprehensively verify the model performance, we construct the main models using sample-based division method. Models using spatial-based and temporal-based division method are further constructed to test the model performance on a spatial and temporal scale.
The dataset was randomly divided into the training set (90 % of the records) and test set (10 % of the records) by using the sample-based division method. We construct the main model using the training set with a 10-fold cross-validation. Since the data in the test set are not used in the main model, true model performance can be verified. The coefficient of determination (R2) of the main model on the test set (test-R2) and the verification indicators of model uncertainty, the root mean square error (RMSE) and mean absolute error (MAE) are calculated for the PM2.5 and O3-8 hmax model, respectively. The monthly and yearly test-R2 values are also calculated.
For the spatial verification, 90 % of the monitoring stations are randomly selected. The monitoring data of these stations are used as the training set, and the monitoring data of remaining stations are used as the testing set. For the temporal verification, 90 % of dates in 2013–2017 are randomly selected, and the data in theses dates are used as the training set; the data in the remaining 10 % of the dates in 2013–2017 are used as the testing set. After that, the test-R2, RMSE and MAE are calculated.
2.4 Estimation of daily PM2.5 and ambient O3 of China from 2005 to 2017
Based on the final models of PM2.5 and O3-8 hmax, we estimate the gridded daily average PM2.5 concentration and O3-8 hmax concentration of China in 2005–2017. The spatial pattern and temporal trend of PM2.5 and O3-8 hmax concentrations are analyzed and compared with other modeling products.
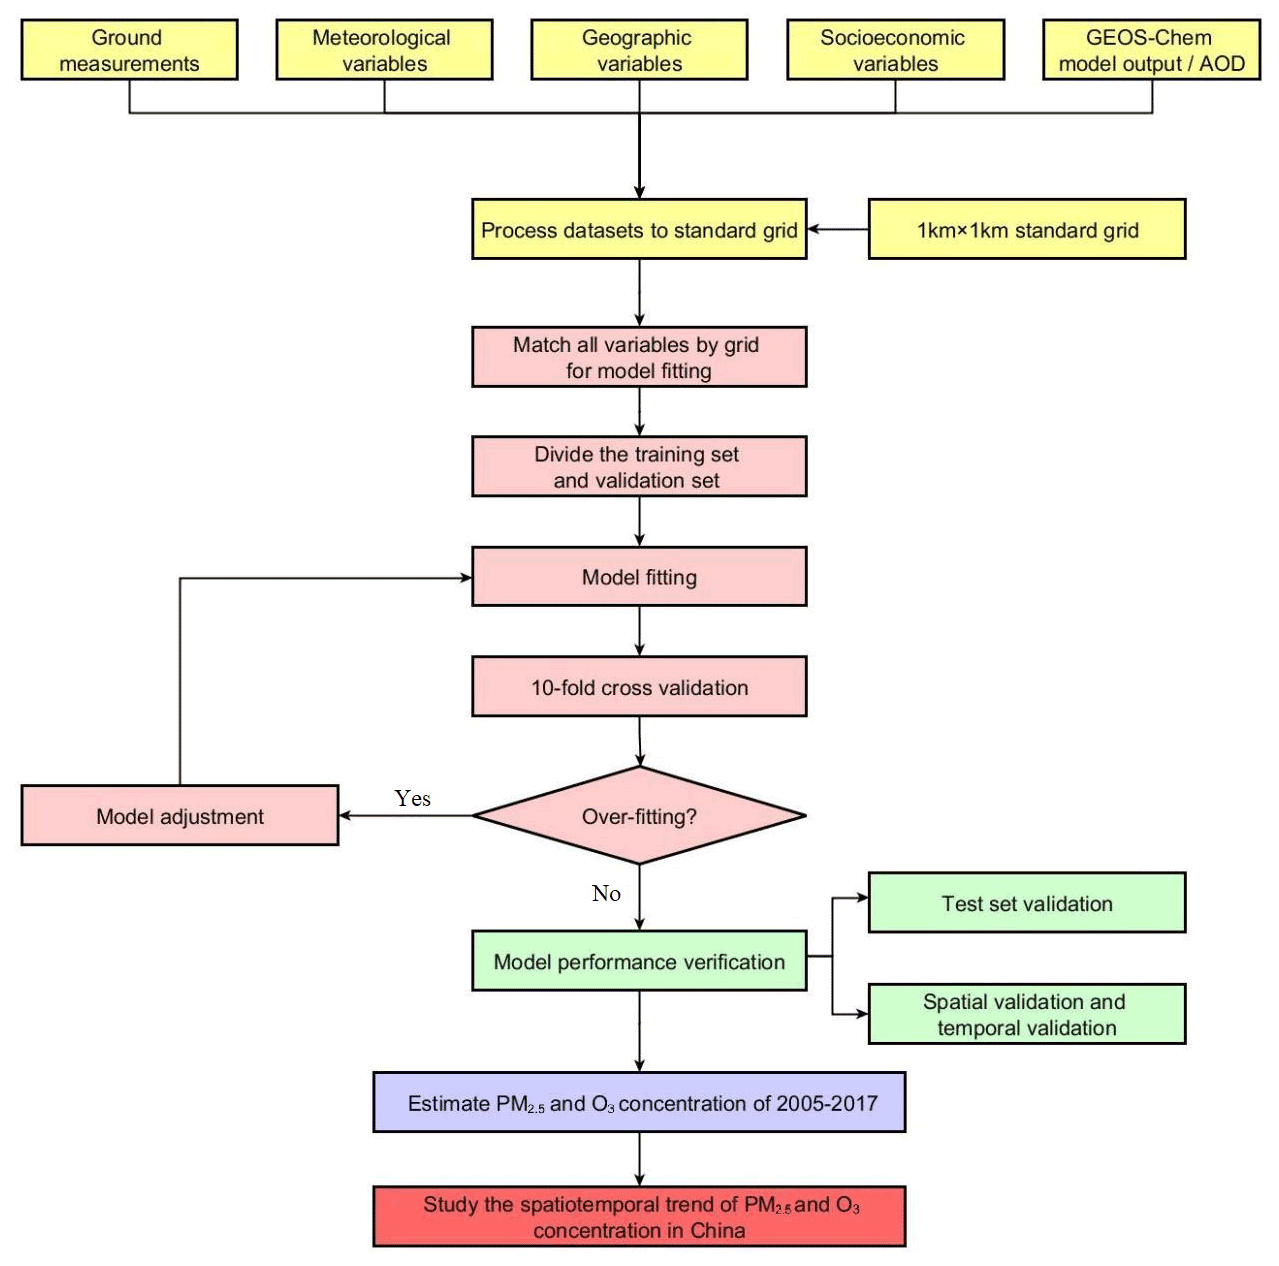
The modeling and estimations are performed in Python 2.7.13 using the scikit-learn 0.20.3 and GridSearchCV packages. The workflow of this study is displayed in Fig. 2.
A total of 981 744 monitoring data records were used in the final model-fitting dataset. The mean ± standard deviation of PM2.5 and ambient O3 concentrations in 2013–2017 were 59.60 ± 45.85 and 86.72 ± 47.73 µg m−3, respectively. The results of descriptive analysis for variables included in PM2.5 and O3-8 hmax model are shown in Table S2.
3.1 Model fitting and validation
The cross-validation results indicate that the estimated PM2.5 and O3-8 hmax concentrations matched reasonably with the observed PM2.5 and O3-8 hmax concentrations, with high fitted test-R2 values. According to our sample-based division method, the test-R2 values of the estimated daily, monthly and yearly PM2.5 concentrations were 0.85, 0.88 and 0.90, respectively (Fig. 3). Likewise, the test-R2 values of the estimated daily, monthly and yearly O3-8 hmax concentrations were 0.77, 0.77 and 0.69, respectively (Fig. 4). The RMSE and MAE for PM2.5 in daily level were 17.72 and 9.37 µg m−3; for O3-8 hmax, the values were 23.10 and 15.43 µg m−3. The model performance is comparable to previous studies (Di et al., 2017; Li and Cheng, 2021; Liu et al., 2020; Wei et al., 2021, 2020, 2019). At the provincial/city level, the model performance of PM2.5 estimations of Shanghai, Beijing, Hubei, Hebei and Sichuan ranked in the top five with relatively high test-R2 (≥ 0.90), while those of Tibet, Qinghai, Gansu, Anhui and Yunnan were less accurate with relatively low test-R2 values (< 0.70). The model performance of O3-8 hmax estimations of Beijing, Chongqing, Shanghai, Tianjin and Henan ranked in the top five with relatively high test-R2 values (≥ 0.83), while those of Gansu, Anhui, Heilongjiang, Guizhou and Tibet were poorer with relatively low test-R2 values (< 0.62) (Table S3).
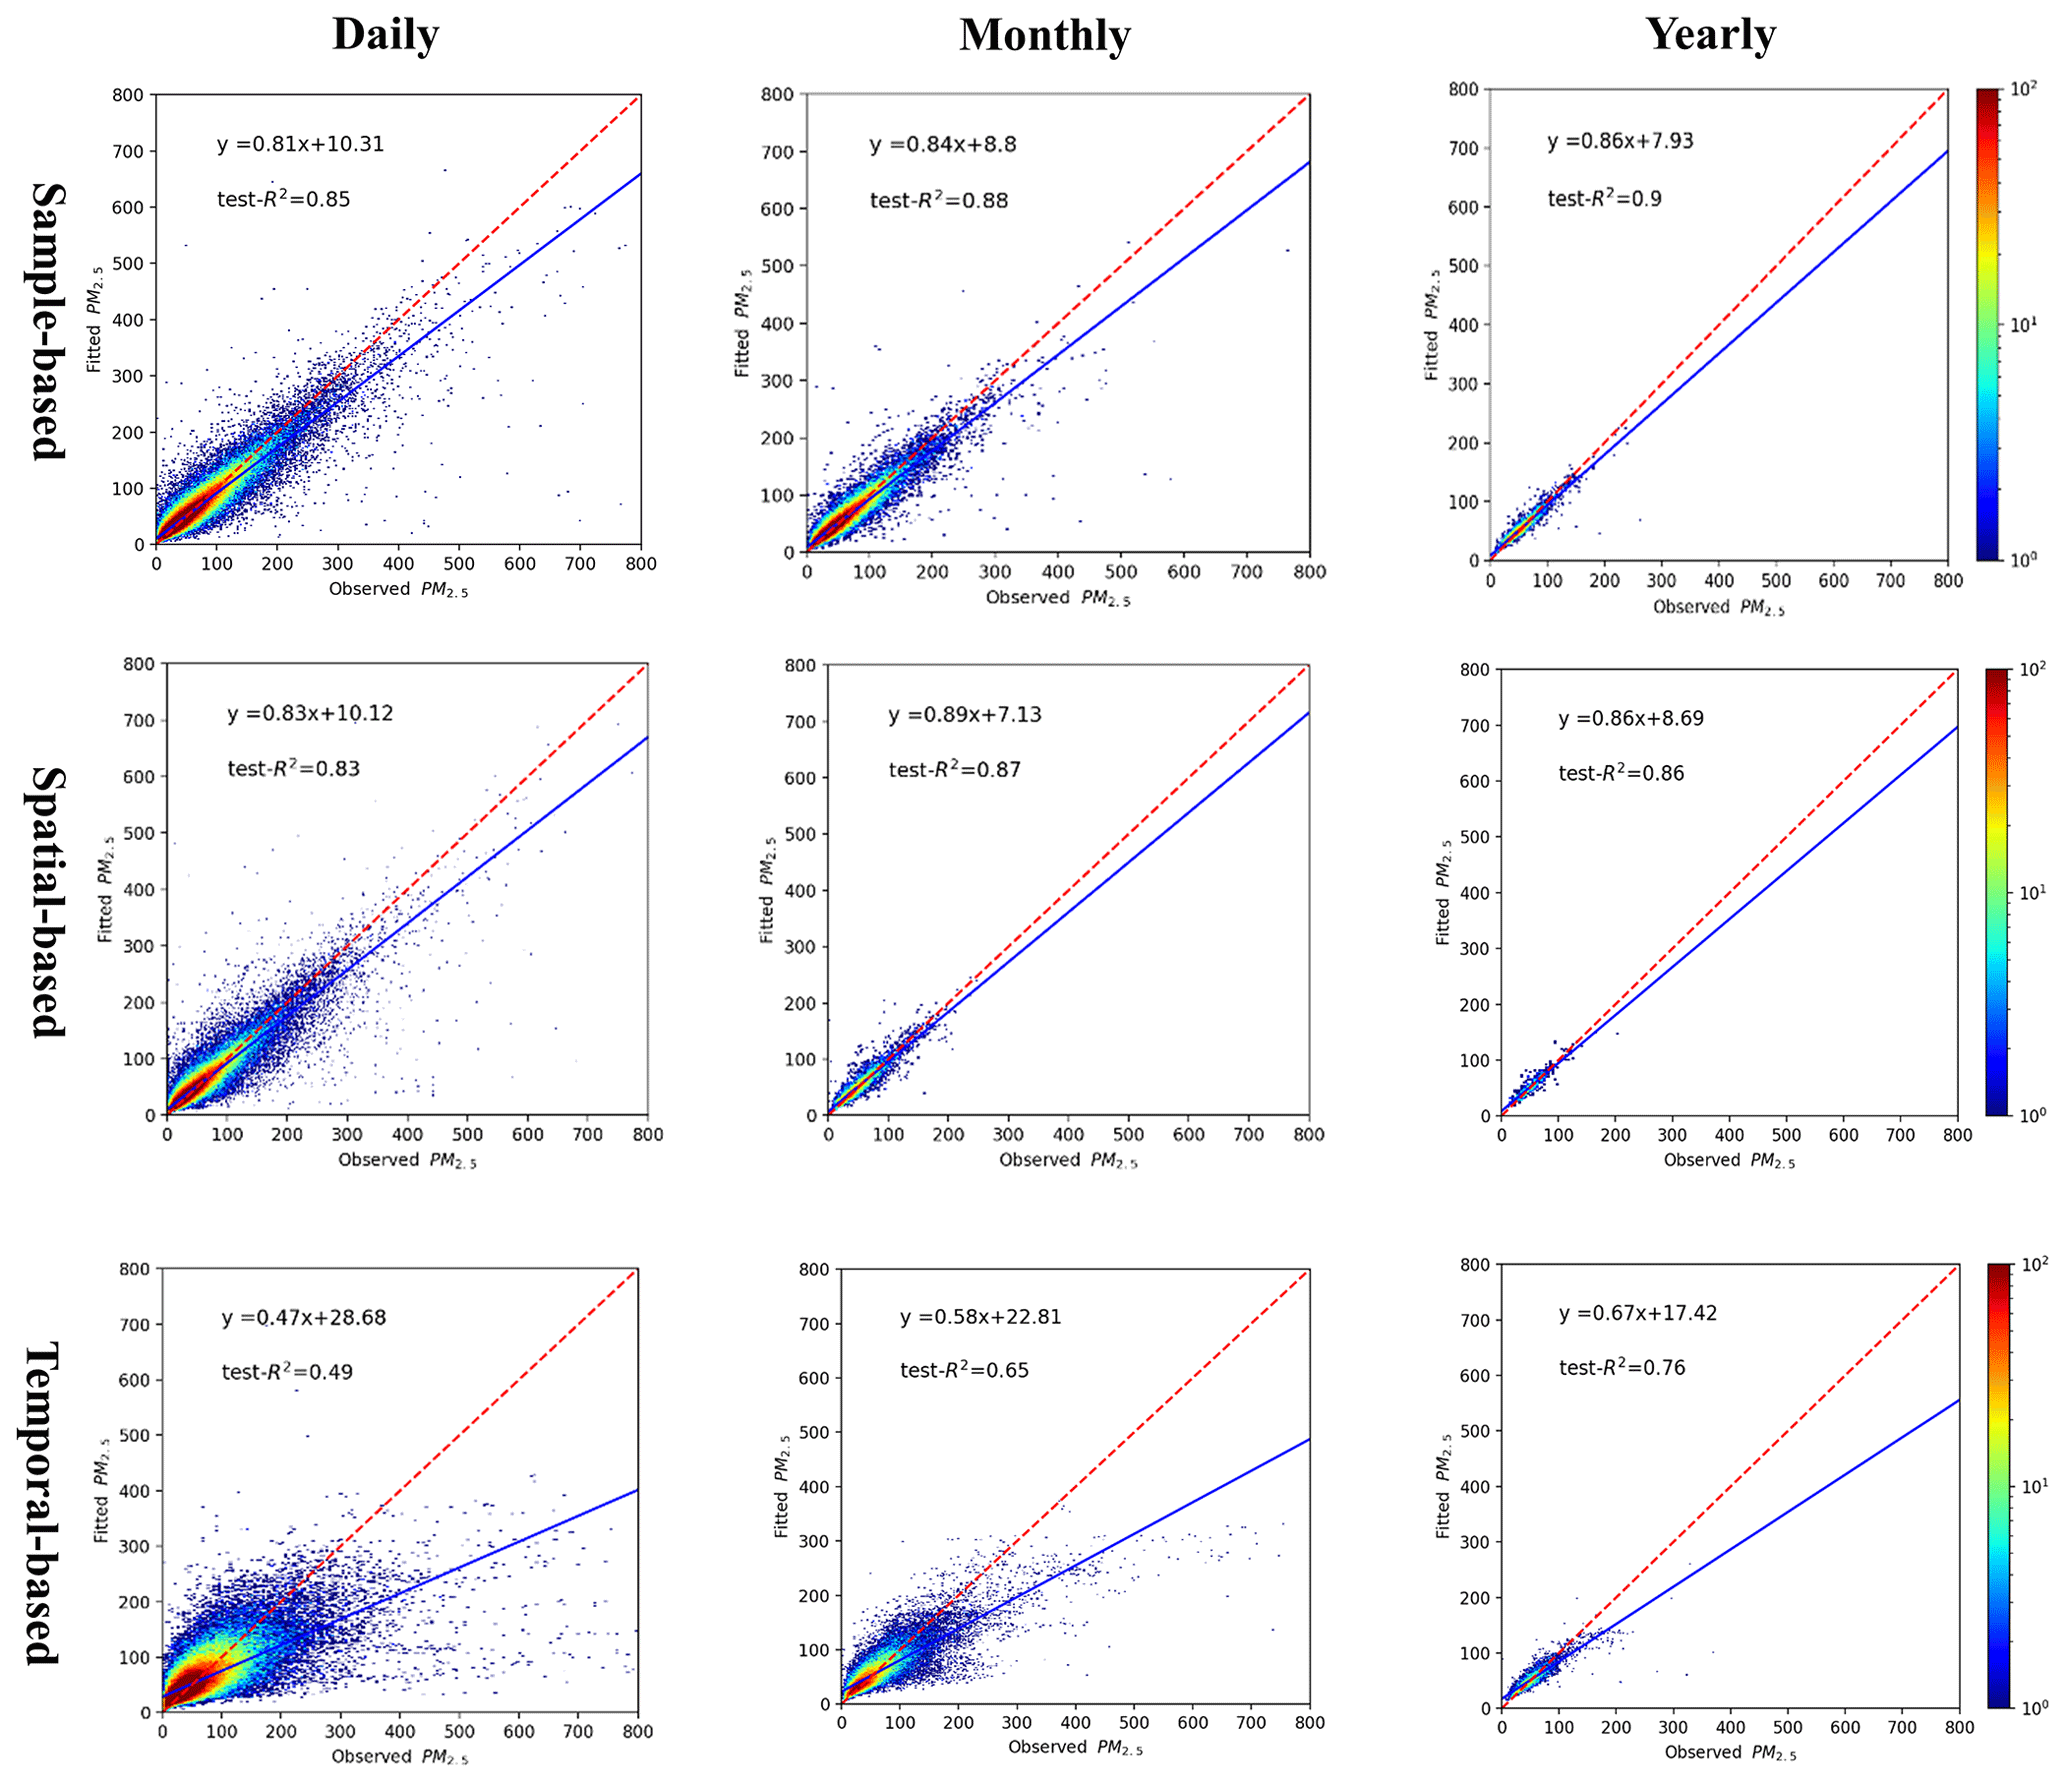
Figure 3The density plot of PM2.5 model. From left to right are the different temporal scales: daily, monthly and yearly; from top to bottom are the different validation methods: sample-based, spatial-based and temporal-based.
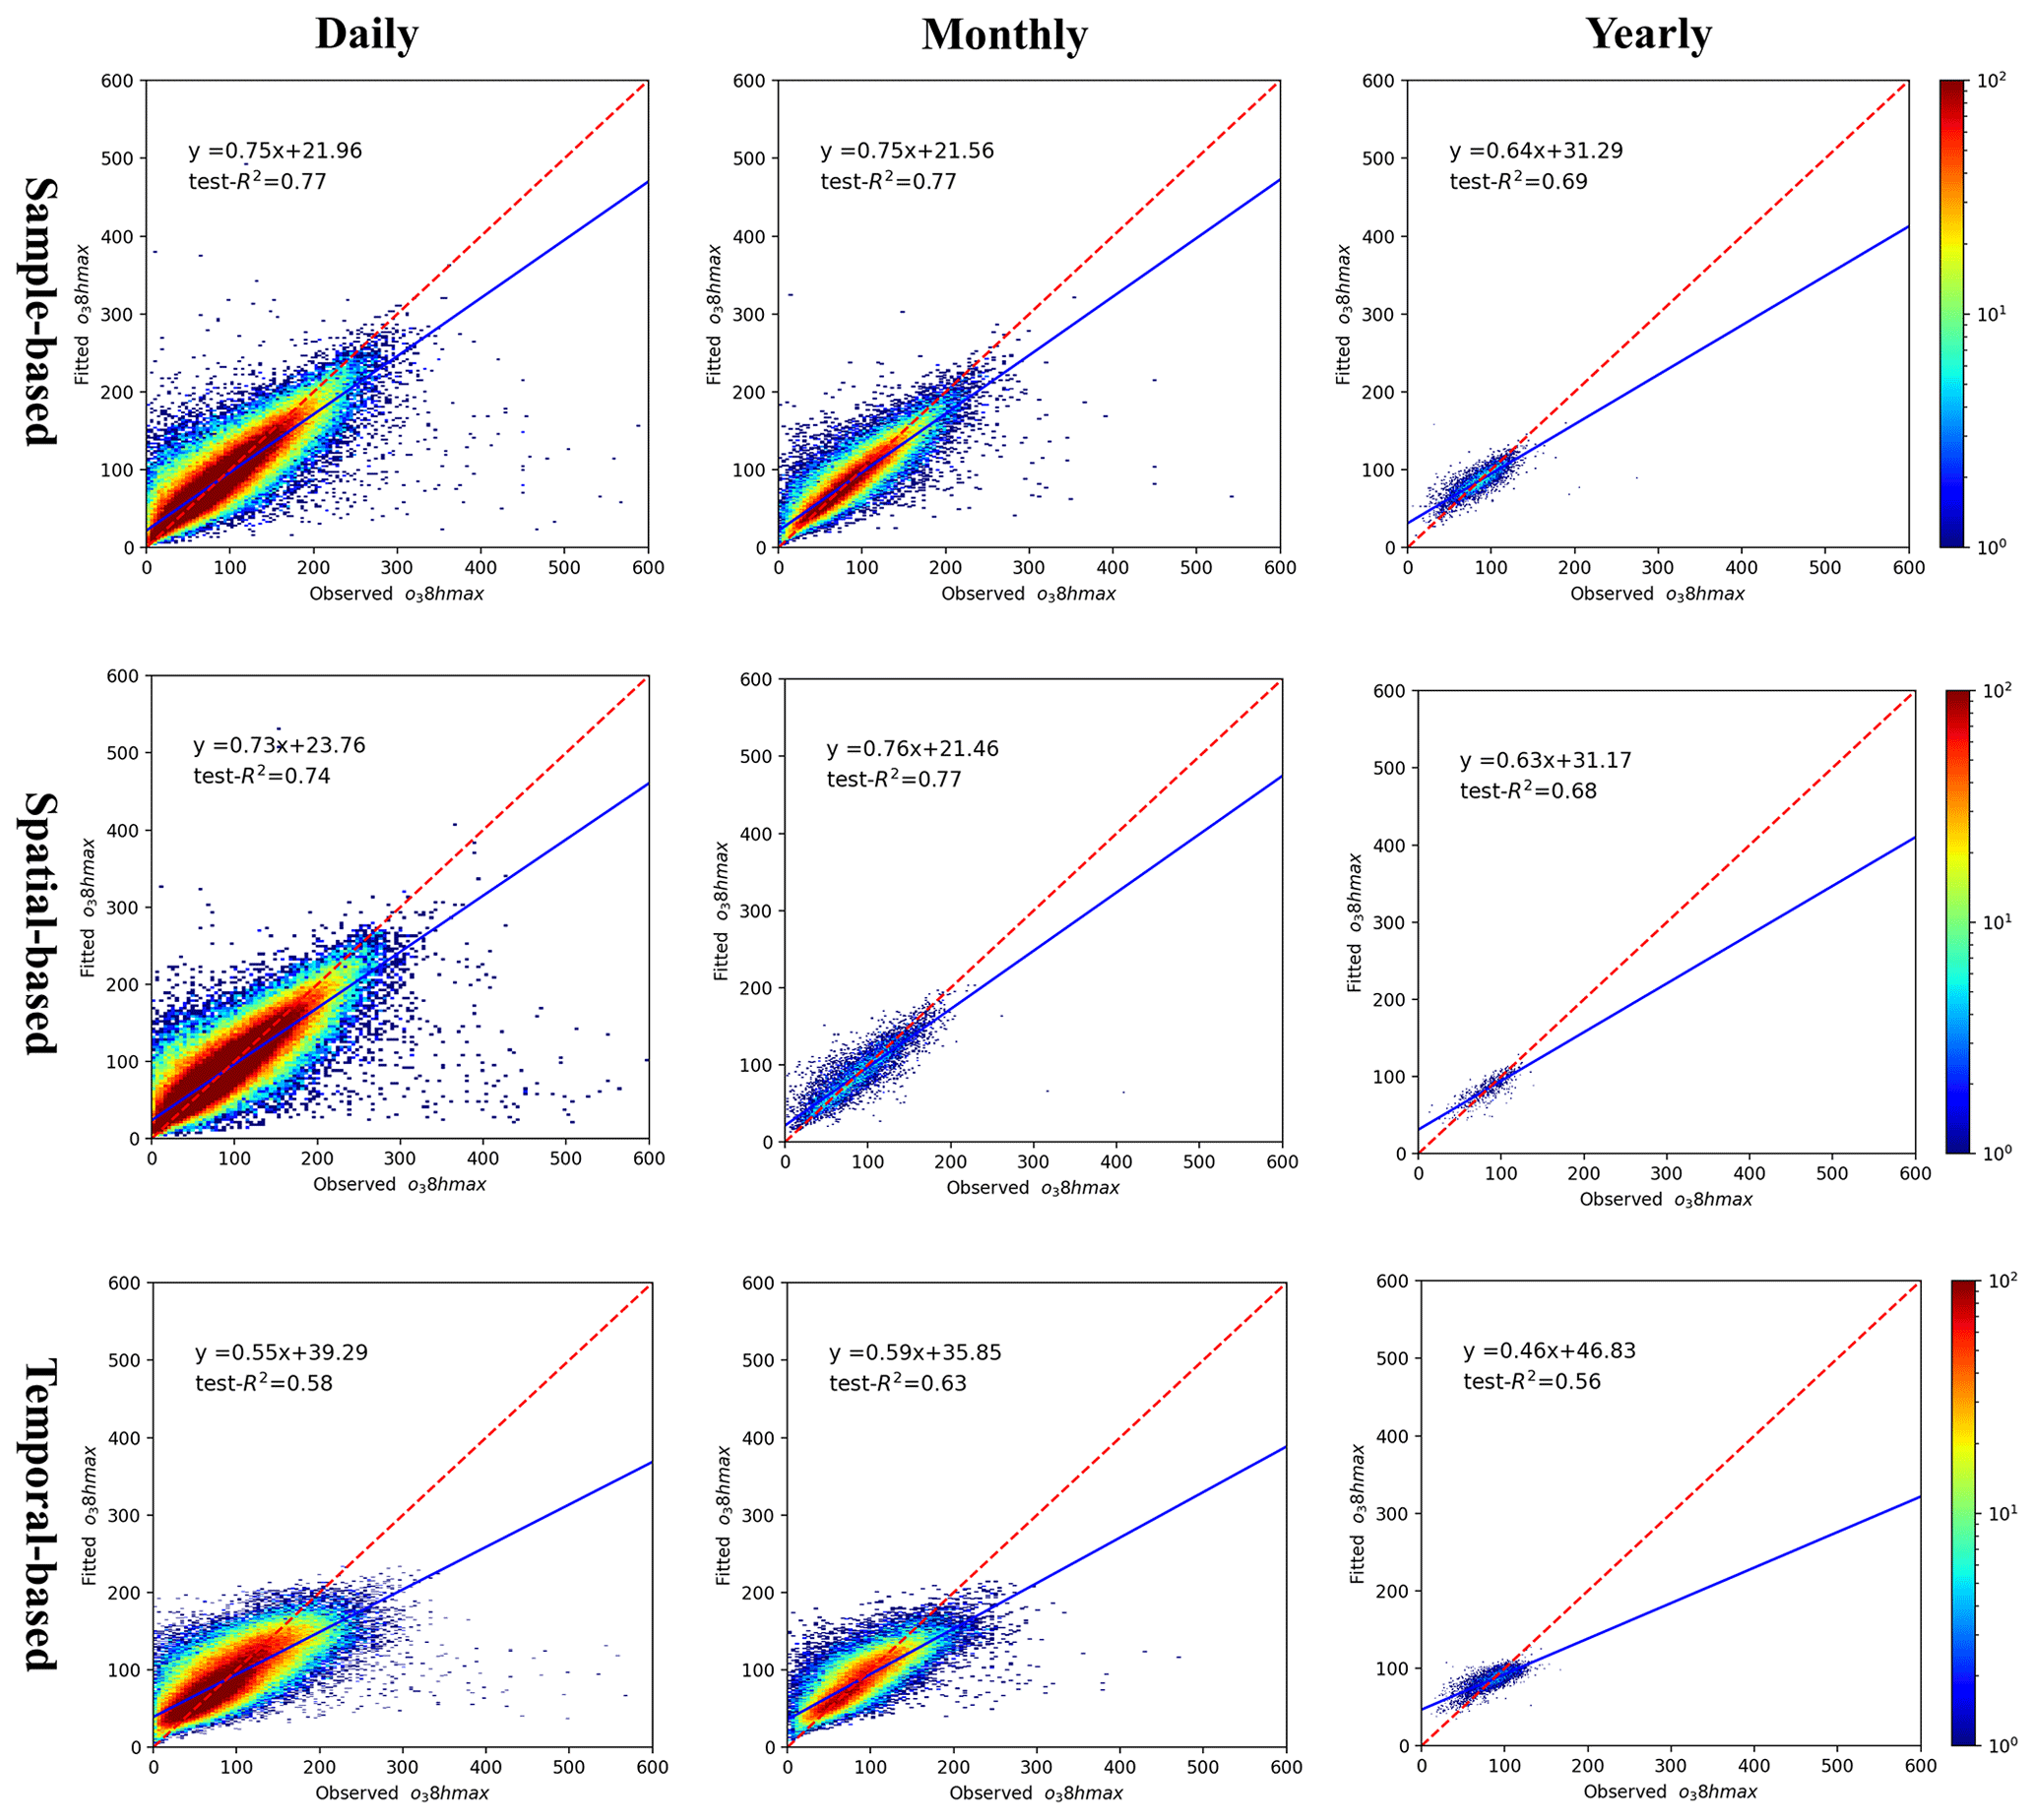
Figure 4The density plot of O3-8 hmax model. From left to right are the different temporal scales: daily, monthly and yearly; from top to bottom are the different validation methods: sample-based, spatial-based and temporal-based.
The spatial and temporal test-R2 of our models explained the uncertainty to some content (Figs. 3 and 4). The spatial test-R2 values for daily, monthly and yearly PM2.5 estimation were 0.83, 0.87 and 0.85, respectively, while those of daily, monthly and yearly O3-8 hmax estimations were 0.74, 0.77 and 0.68, respectively. The relatively high spatial test-R2 demonstrates the reasonable performance of our models in areas without monitoring stations. The temporal test-R2 values of daily, monthly and yearly PM2.5 estimations were 0.49, 0.65 and 0.76, respectively, while those of daily, monthly and yearly O3-8 hmax estimations were 0.58, 0.63 and 0.56, respectively. These results indicate the uncertainty of our models when modeling data in the historical period, although the performance is among the best compared with previous studies. The simulation accuracy is a universal issue in the present studies of air pollutant concentrations in the historical period without monitoring data. Further efforts are need to improve the model performance of historical estimations.
3.2 Feature importance
The feature importance of the variables in our random forest models is presented in Tables S4-1 and S4-2. Similar to previous studies (Chen et al., 2018; Zhan et al., 2018), the meteorological factors and their lagged values can significantly affect both PM2.5 and O3-8 hmax modeling. Moreover, the specific features for PM2.5 and O3, AOD and GEOS-Chem output, also demonstrated high importance in modeling work.
For PM2.5 modeling work (Table S4-1), the meteorological variables (boundary layer height, evaporation, 2 m dew point temperature) and their lagged effect were among the top 10 important factors, totaling 33.6 % in modeling work. The lagged effects greatly contributed to PM2.5 modeling. For example, the lag 1 boundary layer height ranked first (17.2 %) in our study, which is similar to previous studies (Zhao et al., 2019). The interpolated AOD (5.6 %), DEM (4.9 %) and season (3.7 %) also demonstrated high importance, which showed crucial effects of satellite data, terrain distribution characteristics in the study area and study period on PM2.5 modeling. The relative contributions of land use, NDVI, population density, road length and GDP are negligible (the importance scores less than 1 %). Unlike DEM, these factors are subjected to the influence of socioeconomic status in study area. In the future study, the integration of these factors with a higher temporal resolution might change its contribution to the estimation.
The feature importance of ambient O3 is consistent with its formation and dissipation mechanism: surface solar radiation downwards and its lagged effect according for 39.2 % in modeling work (Table S4-2). Other meteorological factors (2 m temperature, boundary layer height, 10 m V wind component and low cloud cover) according for totaling 9.54 % importance scores. Our analysis also suggests the high importance of GEOS-Chem model (7.2 %), altitude (1.9 %), and dummy factors including year (2.2 %) and province (1.6 %) in O3 modeling. By contrast, the relative contributions of land use, NDVI and road length are negligible (the importance scores less than 1 %). The high importance rank of population and GDP might be attributed to the relatively high sensitivity of O3 to anthropogenic emission sources (compared to PM2.5).
3.3 The spatial characteristics and temporal trend of PM2.5 and ambient O3 of China from 2005 to 2017
During 2005–2017, PM2.5 showed an overall downward trend, while ambient O3 showed an upward trend in recent years (Figs. 5, S3–S6). Relative to 2005, PM2.5 concentration has increased by 2.60 µg m−3 in 2013. Nevertheless, after the implementation of the Air Pollution Prevention and Control Action Plan, a strict pollution control measure, PM2.5 concentration has declined by 11.041 µg m−3 in 2017 (relative to 2013). This has resulted in a downward trend of PM2.5 concentration in 2005–2017: PM2.5 concentration in 2017 has decreased by 8.44 µg m−3 relative to 2005 (Figs. 5 and S3). In key pollution areas, with the implementation of various air pollution prevention and control policies, PM2.5 levels in the Beijing–Tianjin–Hebei region have dropped the most, but the overall concentration levels are still higher than those in the Yangtze River Delta and Pearl River Delta (Fig. S4). For O3-8 hmax, the upward trend barely changed. Relative to 2005, O3-8 hmax concentrations in 2013 and 2017 have increased by 0.39 and 7.83 µg m−3, respectively. The upward trend during 2005–2017 was mostly due to the significant changes between 2013 and 2017: relative to 2013, the O3-8 hmax concentration has increased by 7.44 µg m−3 in 2017 (Figs. 5 and S5). The Beijing–Tianjin–Hebei region has shown an obvious upward trend since 2013, while the Pearl River Delta region change trend is not obvious (Fig. S6). During the strict pollution control period, VOC emissions were not effectively controlled, which could be one of the main reasons. Therefore, integrated management of VOCs and NOx in key industries and areas is important.
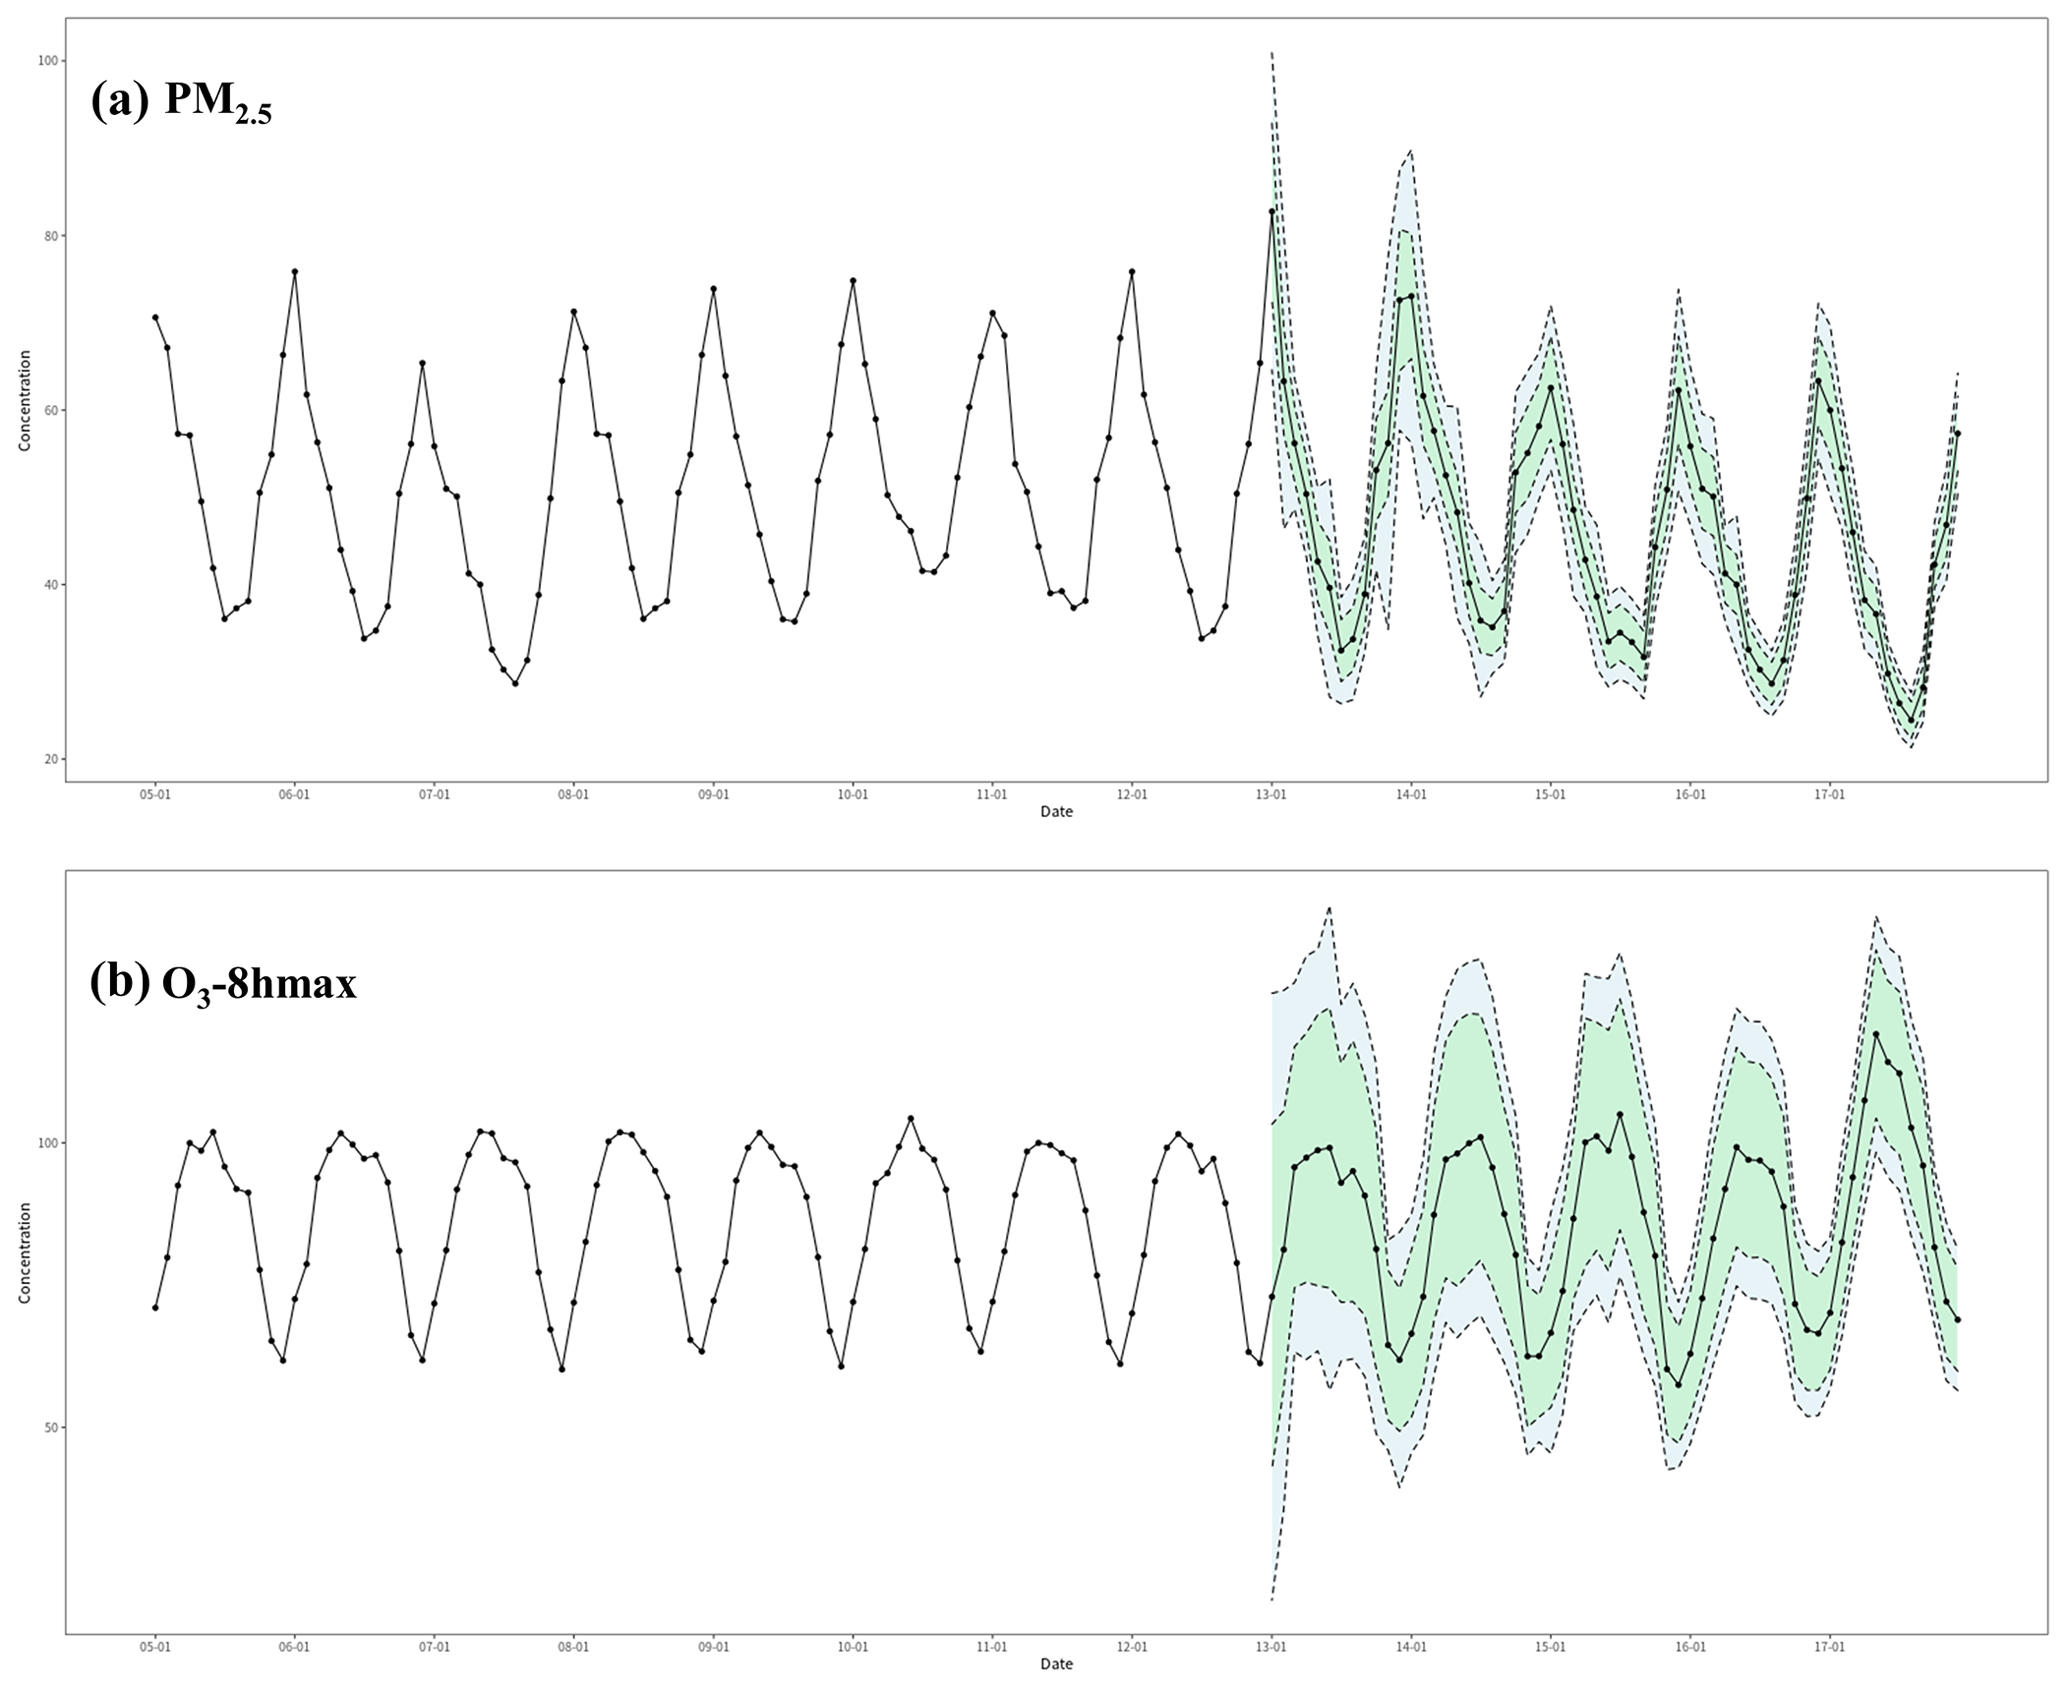
Figure 5The temporal trend of PM2.5 and O3-8 hmax concentration in China from 2005–2017. The black dots represent the monthly average PM2.5 and O3-8 hmax concentration from 2005 to 2017, the blue color band represents the range of the monthly average PM2.5 and O3-8 hmax concentration plus or minus the RMSE value from 2013–2017 (period with monitoring data), and the green color band represents the range of the monthly average PM2.5 and O3-8 hmax concentration plus or minus the MAE value from 2013–2017 years.
The seasonal distributions of PM2.5 and O3-8 hmax concentrations were obvious during 2005–2017 (Figs. S7 and S8). The lowest seasonal PM2.5 concentration occurred in summer, with an average concentration of 33.6 ± 11.39 µg m−3, and the highest seasonal PM2.5 concentration occurred in winter, with an average concentration of 57.4 ± 21.76 µg m−3. In winter, temperature inversion occurs frequently, and the thickness of the mixed layer is low, which is not conducive to the diffusion of pollutants, which leads to the accumulation of PM2.5 near the ground (Sun et al., 2014). In contrast, the lowest seasonal O3-8 hmax concentration was in winter, with an average concentration of 72.65 ± 6.28 µg m−3; the highest seasonal O3-8 hmax concentration was in summer, with an average concentration of 97.44 ± 13.58 µg m−3. Temperatures and solar radiation conditions in summer increase the incidence of severe O3 pollution events, which is consistent with its formation and dissipation mechanism.
The PM2.5 concentrations in the Beijing–Tianjin–Hebei, Chengdu–Chongqing and Xinjiang regions are higher than other regions, followed by the central China. The PM2.5 concentrations in the southwestern regions (Yunnan and Tibet) and western part of Sichuan Province are the lowest, followed by the inner-north regions and the south and southeastern regions (Figs. 6, S3 and S4; Table S5). The O3-8 hmax concentrations in the Bohai Rim, Yangtze River Delta, Pearl River Delta, and other economically developed regions like southern Xinjiang, Inner Mongolia, and northeastern Gansu are relatively high (Figs. 6, S5 and 6; Table S5). This spatial pattern barely changed during 2005–2017 (Figs. S3 and S5), but the temporal trend showed spatial characteristics (Figs. 6; S4 and S6). For PM2.5 concentration, the key pollution areas were severely polluted during 2005–2013. The air pollution control measures of these regions were strict during 2013–2017; thus, the decline was obvious, especially for the Beijing–Tianjin–Hebei region. For O3-8 hmax concentration, the growth rate was not obvious (except for the eastern part of Hubei Province) during 2005–2013. However, after 2013, there was a clear upward trend across the country, especially in the northern China.
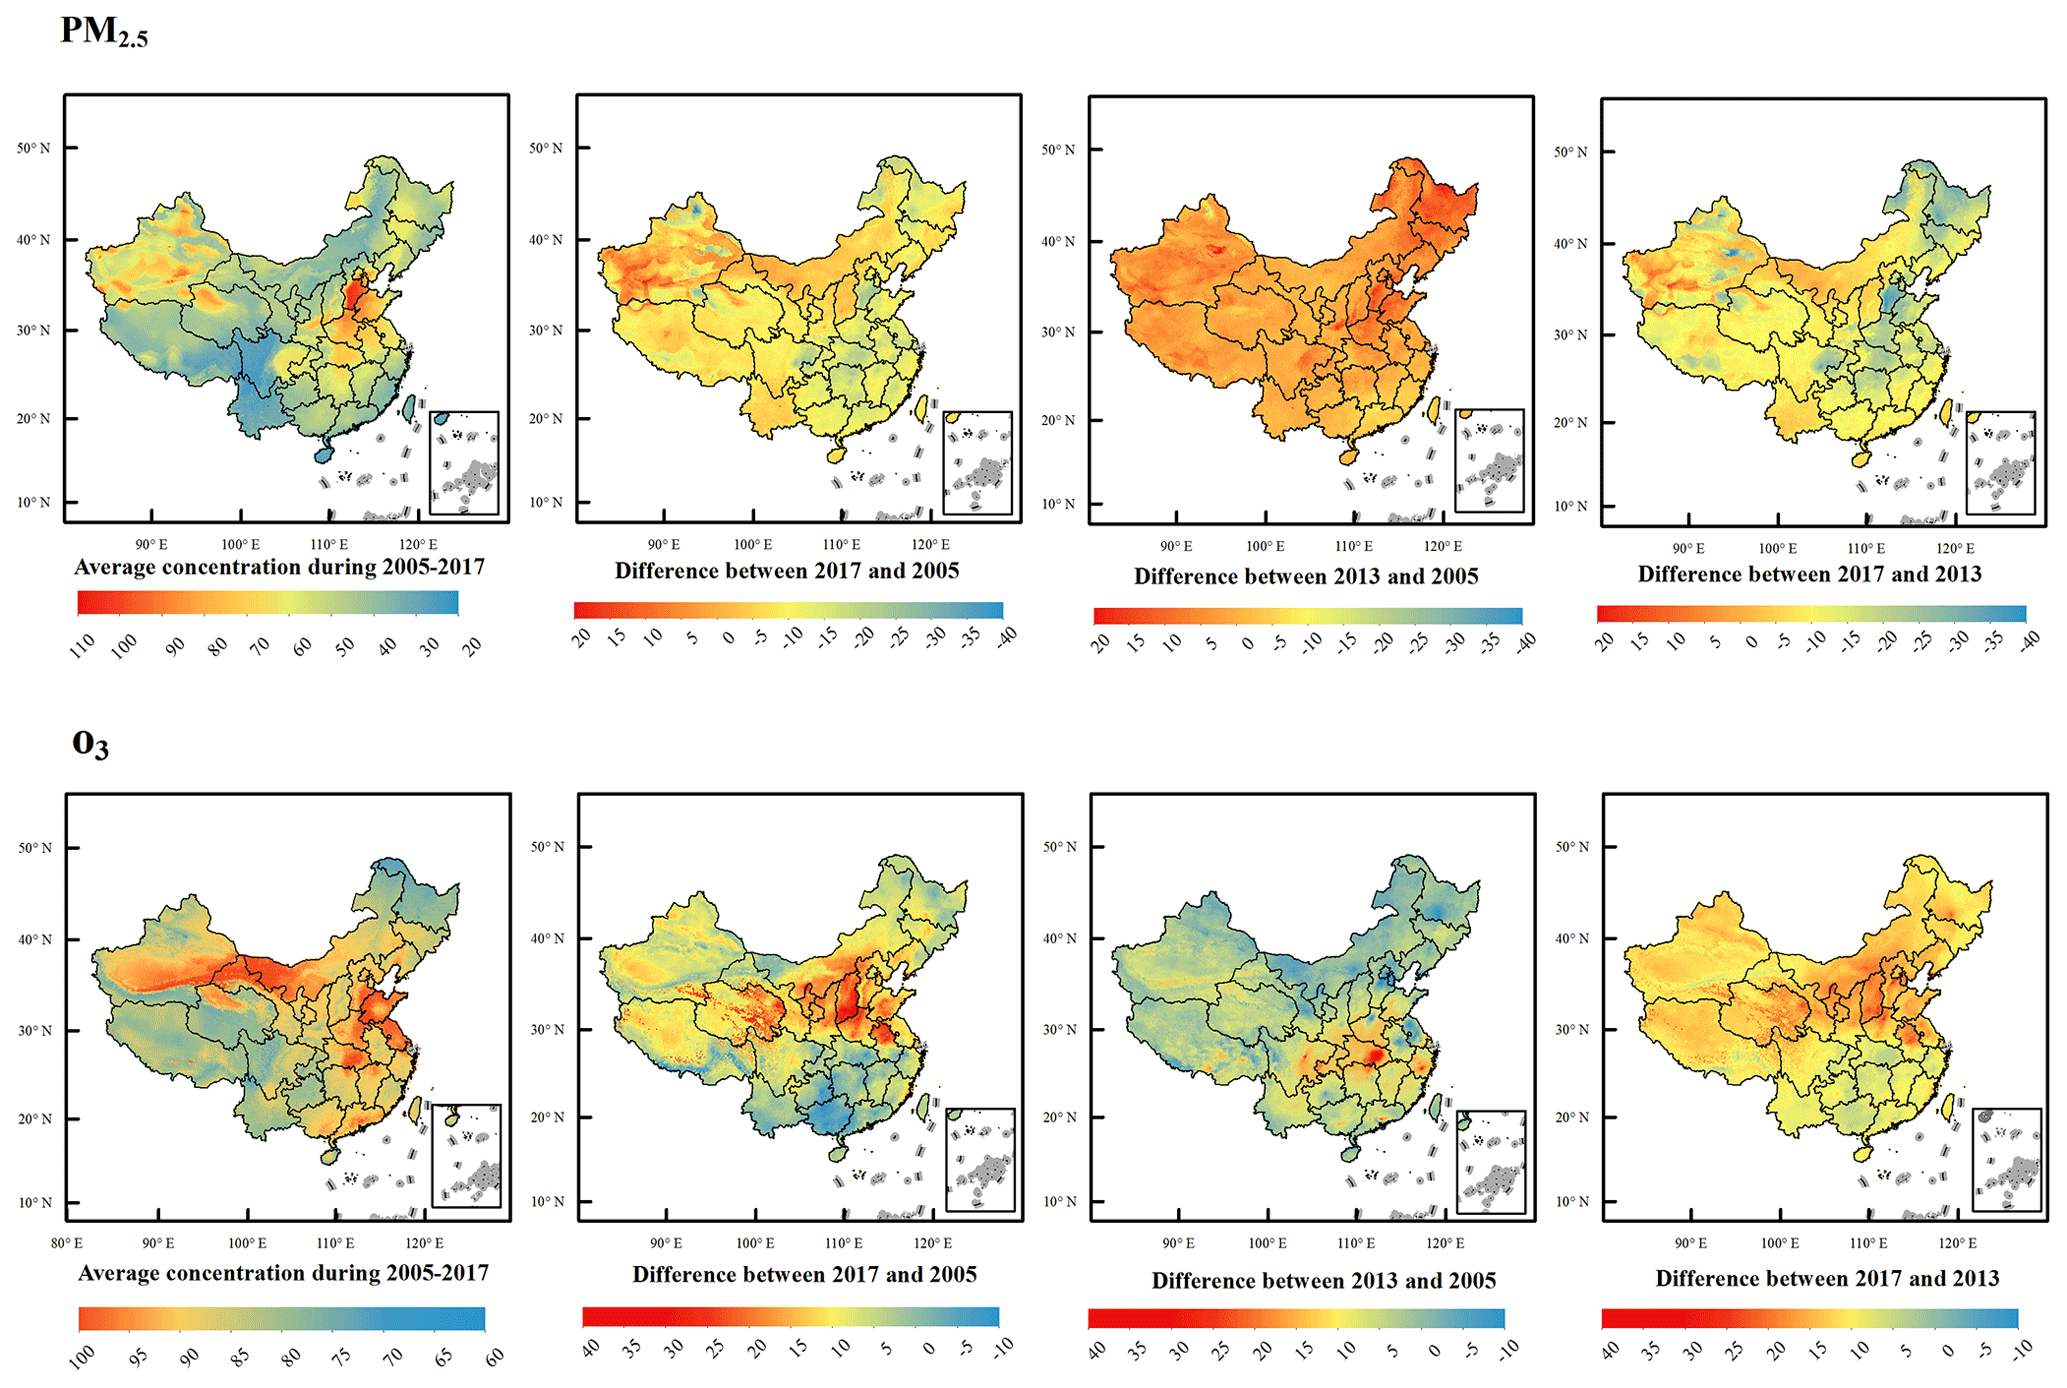
Figure 6Estimated annual mean and difference of PM2.5 and O3-8 hmax concentration in China during 2005 to 2017. The first row shows maps of PM2.5-related indicators, and the second row shows maps of O3-8 hmax related indicators. From left to right are the average concentrations during 2005–2017, the difference between 2017 and 2005, the difference between 2013 and 2005, and the difference between 2017 and 2013.
3.4 Evaluation of the PM2.5 and O3 concentration products with comparison with other products
Our estimation datasets include the PM2.5 and O3-8 hmax concentration data of China in 2005–2017 with a spatial resolution of 1 km × 1 km resolution. With high spatial and temporal resolutions, our validation results are comparable with other modeling work (see Table S6). Considering the future application in epidemiological research, our estimation datasets would be useful: for acute effects studies, the high spatial resolution would effectively reduce exposure errors; for chronic effects studies, long-term exposure data are essential for the development of cohort studies.
Nevertheless, our estimation datasets also contain some limitations. First, we did not use emission data in our model limited by coarse resolution. However, the newly published high-resolution emission inventory of China (http://meicmodel.org/, last access: 18 February 2022) may be utilized in future estimation studies to improve accuracy. Second, our modeling still has spatial and temporal uncertainties. In areas where monitoring sites are sparsely distributed, such as western China, it may be difficult to accurately capture the association between air pollution concentrations and variables. The model validation of the historical period is also limited. Third, the interpolation process of model features inevitably introduces systematic errors. Therefore, more high-quality and high-resolution basic data would be needed in the future.
The estimated PM2.5 and O3 data are freely accessible at https://doi.org/10.5281/zenodo.4009308 (Ma et al., 2021a), and the shared dataset of Chinese Environmental Public Health Tracking (CEPHT, 2022) is available at https://cepht.niehs.cn:8282/developSDS3.html.
We constructed random forest models for simulating of daily average PM2.5 and O3-8 hmax concentrations of China during 2005–2017, with a feature list and comparable model performance. The estimation dataset would be useful for supporting both long-term and short-term epidemiological studies. The model can be further used for simulating daily concentrations of longer time period. The key findings are summarized as follows. First, the RF model proved its superiority in our study and can be further used in the future estimation of air pollutant concentration. Second, meteorological data are the most sensitive to PM2.5 and O3 modeling. For PM2.5 modeling work, boundary layer height, evaporation, 2 m dew point temperature and its lagged effects showed the highest sensitivity. For O3 modeling work, surface solar radiation downwards and its lagged effect were the most sensitive. Third, PM2.5 concentration has trended downward in China, and the key polluted areas during 2005–2013 were effectively controlled during 2013–2017. O3 concentration has trended upward in China, especially in the northern China during 2013–2017.
The supplement related to this article is available online at: https://doi.org/10.5194/essd-14-943-2022-supplement.
TL designed the research and guided the method construction; RM implemented the research and wrote the original manuscript; JB and QW developed the methods and revised the original manuscript; YZ, ZZ, and JZ visualized the results; YY, SL, and WS guided the data processing method and collected and processed the data; and all co-authors revised the manuscript and contributed to the writing.
The contact author has declared that neither they nor their co-authors have any competing interests.
Publisher's note: Copernicus Publications remains neutral with regard to jurisdictional claims in published maps and institutional affiliations.
This work was funded by grants from the National Natural Science Foundation of China (grant nos. 92043301 and 42071433).
This paper was edited by Bo Zheng and reviewed by Tao Xue and one anonymous referee.
Breiman, L.: Random forest, Mach. Learn., 45, 5–32, https://doi.org/10.1023/A:1010933404324, 2001.
Chen, G., Li, S., Knibbs, L. D., Hamm, N. A. S., Cao, W., Li, T., Guo, J., Ren, H., Abramson, M. J., and Guo, Y.: A machine learning method to estimate PM2.5 concentrations across China with remote sensing, meteorological and land use information, Sci. Total Environ., 636, 52–60, https://doi.org/10.1016/j.scitotenv.2018.04.251, 2018.
Chen, Z.-Y., Zhang, T.-H., Zhang, R., Zhu, Z.-M., Yang, J., Chen, P.-Y., Ou, C.-Q., and Guo, Y.: Extreme gradient boosting model to estimate PM2.5 concentrations with missing-filled satellite data in China, Atmos. Environ., 202, 180–189, https://doi.org/10.1016/j.atmosenv.2019.01.027, 2019.
Chinese Environmental Public Health Tracking (CEPHT): China CDC Key Laboratory of Environment and Population Health, National Institute of Environmental Health, Chinese Center for Disease Control and Prevention, https://cepht.niehs.cn:8282/developSDS3.html, last access: 18 February 2022.
Di, Q., Rowland, S., Koutrakis, P., and Schwartz, J.: A hybrid model for spatially and temporally resolved ozone exposures in the continental United States, J. Air Waste Manage., 67, 39–52, https://doi.org/10.1080/10962247.2016.1200159, 2017.
Health Effects Institute: State of Global Air 2020, Special Report, Boston, MA: Health Effects Institute, 2020.
Li, T. and Cheng, X.: Estimating daily full-coverage surface ozone concentration using satellite observations and a spatiotemporally embedded deep learning approach, Int. J. Appl. Earth Obs., 101, 102356, https://doi.org/10.1016/j.jag.2021.102356, 2021.
Li, T., Shen, H., Yuan, Q., Zhang, X., and Zhang, L.: Estimating Ground-Level PM2.5 by Fusing Satellite and Station Observations: A Geo-Intelligent Deep Learning Approach: Deep Learning for PM Estimation, Geophys. Res. Lett., 44, 11985–11993, https://doi.org/10.1002/2017GL075710, 2017.
Liu, R., Ma, Z., Liu, Y., Shao, Y., Zhao, W., and Bi, J.: Spatiotemporal distributions of surface ozone levels in China from 2005 to 2017: A machine learning approach, Environ. Int., 142, 105823, https://doi.org/10.1016/j.envint.2020.105823, 2020.
Ma, R., Ban, J., Wang, Q., Zhang, Y., and Li, T.: Full-coverage 1 km daily ambient PM2.5 and O3 concentrations of China in 2005–2017 based on multi-variable random forest model, Zenodo [data set], https://doi.org/10.5281/zenodo.4009308, 2021a.
Ma R., Ban J., Wang Q., Zhang, Y., Yang, Y., He, M., Z., Li, S., Shi, W., and Li, T.: Random Forest Model based Fine Scale Spatiotemporal O3 Trends in the Beijing-Tianjin-Hebei region in China, 2010 to 2017. Environ. Pollut., 10159, 116635, https://doi.org/10.1016/j.envpol.2021.116635, 2021b.
Murray, C. J. L., Aravkin, A. Y., Zheng, P., Abbafati, C., Abbas, K. M., Abbasi-Kangevari, M., Abd-Allah, F., Abdelalim, A., Abdollahi, M., Abdollahpour, I., Abegaz, K. H., Abolhassani, H., Aboyans, V., Abreu, L. G., Abrigo, M. R. M., Abualhasan, A., Abu-Raddad, L. J., Abushouk, A. I., Adabi, M., Adekanmbi, V., Adeoye, A. M., Adetokunboh, O. O., Adham, D., Advani, S. M., Agarwal, G., Aghamir, S. M. K., Agrawal, A., Ahmad, T., Ahmadi, K., Ahmadi, M., Ahmadieh, H., Ahmed, M. B., Akalu, T. Y., Akinyemi, R. O., Akinyemiju, T., Akombi, B., Akunna, C. J., Alahdab, F., Al-Aly, Z., Alam, K., Alam, S., Alam, T., Alanezi, F. M., Alanzi, T. M., Alemu, B. wassihun, Alhabib, K. F., Ali, M., Ali, S., Alicandro, G., Alinia, C., Alipour, V., Alizade, H., Aljunid, S. M., Alla, F., Allebeck, P., Almasi-Hashiani, A., Al-Mekhlafi, H. M., Alonso, J., Altirkawi, K. A., Amini-Rarani, M., Amiri, F., Amugsi, D. A., Ancuceanu, R., Anderlini, D., Anderson, J. A., Andrei, C. L., Andrei, T., Angus, C., Anjomshoa, M., Ansari, F., Ansari-Moghaddam, A., Antonazzo, I. C., Antonio, C. A. T., Antony, C. M., Antriyandarti, E., Anvari, D., Anwer, R., Appiah, S. C. Y., Arabloo, J., Arab-Zozani, M., Ariani, F., Armoon, B., Ärnlöv, J., Arzani, A., Asadi-Aliabadi, M., Asadi-Pooya, A. A., Ashbaugh, C., Assmus, M., Atafar, Z., Atnafu, D. D., Atout, M. M. W., Ausloos, F., Ausloos, M., Ayala Quintanilla, B. P., Ayano, G., Ayanore, M. A., Azari, S., Azarian, G., Azene, Z. N., Badawi, A., Badiye, A. D., Bahrami, M. A., Bakhshaei, M. H., Bakhtiari, A., Bakkannavar, S. M., Baldasseroni, A., Ball, K., Ballew, S. H., Balzi, D., Banach, M., Banerjee, S. K., Bante, A. B., Baraki, A. G., Barker-Collo, S. L., Bärnighausen, T. W., Barrero, L. H., Barthelemy, C. M., Barua, L., Basu, S., Baune, B. T., Bayati, M., Becker, J. S., Bedi, N., Beghi, E., Béjot, Y., Bell, M. L., Bennitt, F. B., Bensenor, I. M., Berhe, K., Berman, A. E., Bhagavathula, A. S., Bhageerathy, R., Bhala, N., Bhandari, D., Bhattacharyya, K., Bhutta, Z. A., Bijani, A., Bikbov, B., Bin Sayeed, M. S., Biondi, A., Birihane, B. M., Bisignano, C., Biswas, R. K., Bitew, H., Bohlouli, S., Bohluli, M., Boon-Dooley, A. S., Borges, G., Borzì, A. M., Borzouei, S., Bosetti, C., Boufous, S., Braithwaite, D., Breitborde, N. J. K., Breitner, S., Brenner, H., Briant, P. S., Briko, A. N., Briko, N. I., Britton, G. B., Bryazka, D., Bumgarner, B. R., Burkart, K., Burnett, R. T., Burugina Nagaraja, S., Butt, Z. A., Caetano dos Santos, F. L., Cahill, L. E., Cámera, L. L. A., Campos-Nonato, I. R., Cárdenas, R., Carreras, G., Carrero, J. J., Carvalho, F., Castaldelli-Maia, J. M., Castañeda-Orjuela, C. A., Castelpietra, G., Castro, F., Causey, K., Cederroth, C. R., Cercy, K. M., Cerin, E., Chandan, J. S., Chang, K.-L., Charlson, F. J., Chattu, V. K., Chaturvedi, S., Cherbuin, N., Chimed-Ochir, O., Cho, D. Y., Choi, J.-Y. J., Christensen, H., Chu, D.-T., Chung, M. T., Chung, S.-C., Cicuttini, F. M., Ciobanu, L. G., Cirillo, M., Classen, T. K. D., Cohen, A. J., Compton, K., Cooper, O. R., Costa, V. M., Cousin, E., Cowden, R. G., Cross, D. H., Cruz, J. A., Dahlawi, S. M. A., Damasceno, A. A. M., Damiani, G., Dandona, L., Dandona, R., Dangel, W. J., Danielsson, A.-K., Dargan, P. I., Darwesh, A. M., Daryani, A., Das, J. K., Das Gupta, R., das Neves, J., Dávila-Cervantes, C. A., Davitoiu, D. V., De Leo, D., Degenhardt, L., DeLang, M., Dellavalle, R. P., Demeke, F. M., Demoz, G. T., Demsie, D. G., Denova-Gutiérrez, E., Dervenis, N., Dhungana, G. P., Dianatinasab, M., Dias da Silva, D., Diaz, D., Dibaji Forooshani, Z. S., Djalalinia, S., Do, H. T., Dokova, K., Dorostkar, F., Doshmangir, L., Driscoll, T. R., Duncan, B. B., Duraes, A. R., Eagan, A. W., Edvardsson, D., El Nahas, N., El Sayed, I., El Tantawi, M., Elbarazi, I., Elgendy, I. Y., El-Jaafary, S. I., Elyazar, I. R., Emmons-Bell, S., Erskine, H. E., Eskandarieh, S., Esmaeilnejad, S., Esteghamati, A., Estep, K., Etemadi, A., Etisso, A. E., Fanzo, J., Farahmand, M., Fareed, M., Faridnia, R., Farioli, A., Faro, A., Faruque, M., Farzadfar, F., Fattahi, N., Fazlzadeh, M., Feigin, V. L., Feldman, R., Fereshtehnejad, S.-M., Fernandes, E., Ferrara, G., Ferrari, A. J., Ferreira, M. L., Filip, I., Fischer, F., Fisher, J. L., Flor, L. S., Foigt, N. A., Folayan, M. O., Fomenkov, A. A., Force, L. M., Foroutan, M., Franklin, R. C., Freitas, M., Fu, W., Fukumoto, T., Furtado, J. M., Gad, M. M., Gakidou, E., Gallus, S., Garcia-Basteiro, A. L., Gardner, W. M., Geberemariyam, B. S., Gebreslassie, A. A. A. A., Geremew, A., Gershberg Hayoon, A., Gething, P. W., Ghadimi, M., Ghadiri, K., Ghaffarifar, F., Ghafourifard, M., Ghamari, F., Ghashghaee, A., Ghiasvand, H., Ghith, N., Gholamian, A., Ghosh, R., Gill, P. S., Ginindza, T. G. G., Giussani, G., Gnedovskaya, E. V., Goharinezhad, S., Gopalani, S. V., Gorini, G., Goudarzi, H., Goulart, A. C., Greaves, F., Grivna, M., Grosso, G., Gubari, M. I. M., Gugnani, H. C., Guimarães, R. A., Guled, R. A., Guo, G., Guo, Y., Gupta, R., Gupta, T., Haddock, B., Hafezi-Nejad, N., Hafiz, A., Haj-Mirzaian, Arvin, Haj-Mirzaian, Arya, Hall, B. J., Halvaei, I., Hamadeh, R. R., Hamidi, S., Hammer, M. S., Hankey, G. J., Haririan, H., Haro, J. M., Hasaballah, A. I., Hasan, M. M., Hasanpoor, E., Hashi, A., Hassanipour, S., Hassankhani, H., Havmoeller, R. J., Hay, S. I., Hayat, K., Heidari, G., Heidari-Soureshjani, R., Henrikson, H. J., Herbert, M. E., Herteliu, C., Heydarpour, F., Hird, T. R., Hoek, H. W., Holla, R., Hoogar, P., Hosgood, H. D., Hossain, N., Hosseini, M., Hosseinzadeh, M., Hostiuc, M., Hostiuc, S., Househ, M., Hsairi, M., Hsieh, V. C., Hu, G., Hu, K., Huda, T. M., Humayun, A., Huynh, C. K., Hwang, B.-F., Iannucci, V. C., Ibitoye, S. E., Ikeda, N., Ikuta, K. S., Ilesanmi, O. S., Ilic, I. M., Ilic, M. D., Inbaraj, L. R., Ippolito, H., Iqbal, U., Irvani, S. S. N., Irvine, C. M. S., Islam, M. M., Islam, S. M. S., Iso, H., Ivers, R. Q., Iwu, C. C. D., Iwu, C. J., Iyamu, I. O., Jaafari, J., Jacobsen, K. H., Jafari, H., Jafarinia, M., Jahani, M. A., Jakovljevic, M., Jalilian, F., James, S. L., Janjani, H., Javaheri, T., Javidnia, J., Jeemon, P., Jenabi, E., Jha, R. P., Jha, V., Ji, J. S., Johansson, L., John, O., John-Akinola, Y. O., Johnson, C. O., Jonas, J. B., Joukar, F., Jozwiak, J. J., Jürisson, M., Kabir, A., Kabir, Z., Kalani, H., Kalani, R., Kalankesh, L. R., Kalhor, R., Kanchan, T., Kapoor, N., Karami Matin, B., Karch, A., Karim, M. A., Kassa, G. M., Katikireddi, S. V., Kayode, G. A., Kazemi Karyani, A., Keiyoro, P. N., Keller, C., Kemmer, L., Kendrick, P. J., Khalid, N., Khammarnia, M., Khan, E. A., Khan, M., Khatab, K., Khater, M. M., Khatib, M. N., Khayamzadeh, M., Khazaei, S., Kieling, C., Kim, Y. J., Kimokoti, R. W., Kisa, A., Kisa, S., Kivimäki, M., Knibbs, L. D., Knudsen, A. K. S., Kocarnik, J. M., Kochhar, S., Kopec, J. A., Korshunov, V. A., Koul, P. A., Koyanagi, A., Kraemer, M. U. G., Krishan, K., Krohn, K. J., Kromhout, H., Kuate Defo, B., Kumar, G. A., Kumar, V., Kurmi, O. P., Kusuma, D., La Vecchia, C., Lacey, B., Lal, D. K., Lalloo, R., Lallukka, T., Lami, F. H., Landires, I., Lang, J. J., Langan, S. M., Larsson, A. O., Lasrado, S., Lauriola, P., Lazarus, J. V., Lee, P. H., Lee, S. W. H., LeGrand, K. E., Leigh, J., Leonardi, M., Lescinsky, H., Leung, J., Levi, M., Li, S., Lim, L.-L., Linn, S., Liu, Shiwei, Liu, Simin, Liu, Y., Lo, J., Lopez, A. D., Lopez, J. C. F., Lopukhov, P. D., Lorkowski, S., Lotufo, P. A., Lu, A., Lugo, A., Maddison, E. R., Mahasha, P. W., Mahdavi, M. M., Mahmoudi, M., Majeed, A., Maleki, A., Maleki, S., Malekzadeh, R., Malta, D. C., Mamun, A. A., Manda, A. L., Manguerra, H., Mansour-Ghanaei, F., Mansouri, B., Mansournia, M. A., Mantilla Herrera, A. M., Maravilla, J. C., Marks, A., Martin, R. V., Martini, S., Martins-Melo, F. R., Masaka, A., Masoumi, S. Z., Mathur, M. R., Matsushita, K., Maulik, P. K., McAlinden, C., McGrath, J. J., McKee, M., Mehndiratta, M. M., Mehri, F., Mehta, K. M., Memish, Z. A., Mendoza, W., Menezes, R. G., Mengesha, E. W., Mereke, A., Mereta, S. T., Meretoja, A., Meretoja, T. J., Mestrovic, T., Miazgowski, B., Miazgowski, T., Michalek, I. M., Miller, T. R., Mills, E. J., Mini, G., Miri, M., Mirica, A., Mirrakhimov, E. M., Mirzaei, H., Mirzaei, M., Mirzaei, R., Mirzaei-Alavijeh, M., Misganaw, A. T., Mithra, P., Moazen, B., Mohammad, D. K., Mohammad, Y., Mohammad Gholi Mezerji, N., Mohammadian-Hafshejani, A., Mohammadifard, N., Mohammadpourhodki, R., Mohammed, A. S., Mohammed, H., Mohammed, J. A., Mohammed, S., Mokdad, A. H., Molokhia, M., Monasta, L., Mooney, M. D., Moradi, G., Moradi, M., Moradi-Lakeh, M., Moradzadeh, R., Moraga, P., Morawska, L., Morgado-da-Costa, J., Morrison, S. D., Mosapour, A., Mosser, J. F., Mouodi, S., Mousavi, S. M., Mousavi Khaneghah, A., Mueller, U. O., Mukhopadhyay, S., Mullany, E. C., Musa, K. I., Muthupandian, S., Nabhan, A. F., Naderi, M., Nagarajan, A. J., Nagel, G., Naghavi, M., Naghshtabrizi, B., Naimzada, M. D., Najafi, F., Nangia, V., Nansseu, J. R., Naserbakht, M., Nayak, V. C., Negoi, I., Ngunjiri, J. W., Nguyen, C. T., Nguyen, H. L. T., Nguyen, M., Nigatu, Y. T., Nikbakhsh, R., Nixon, M. R., Nnaji, C. A., Nomura, S., Norrving, B., Noubiap, J. J., Nowak, C., Nunez-Samudio, V., Oţoiu, A., Oancea, B., Odell, C. M., Ogbo, F. A., Oh, I.-H., Okunga, E. W., Oladnabi, M., Olagunju, A. T., Olusanya, B. O., Olusanya, J. O., Omer, M. O., Ong, K. L., Onwujekwe, O. E., Orpana, H. M., Ortiz, A., Osarenotor, O., Osei, F. B., Ostroff, S. M., Otstavnov, N., Otstavnov, S. S., Øverland, S., Owolabi, M. O., P A, M., Padubidri, J. R., Palladino, R., Panda-Jonas, S., Pandey, A., Parry, C. D. H., Pasovic, M., Pasupula, D. K., Patel, S. K., Pathak, M., Patten, S. B., Patton, G. C., Pazoki Toroudi, H., Peden, A. E., Pennini, A., Pepito, V. C. F., Peprah, E. K., Pereira, D. M., Pesudovs, K., Pham, H. Q., Phillips, M. R., Piccinelli, C., Pilz, T. M., Piradov, M. A., Pirsaheb, M., Plass, D., Polinder, S., Polkinghorne, K. R., Pond, C. D., Postma, M. J., Pourjafar, H., Pourmalek, F., Poznańska, A., Prada, S. I., Prakash, V., Pribadi, D. R. A., Pupillo, E., Quazi Syed, Z., Rabiee, M., Rabiee, N., Radfar, A., Rafiee, A., Raggi, A., Rahman, M. A., Rajabpour-Sanati, A., Rajati, F., Rakovac, I., Ram, P., Ramezanzadeh, K., Ranabhat, C. L., Rao, P. C., Rao, S. J., Rashedi, V., Rathi, P., Rawaf, D. L., Rawaf, S., Rawal, L., Rawassizadeh, R., Rawat, R., Razo, C., Redford, S. B., Reiner, R. C., Reitsma, M. B., Remuzzi, G., Renjith, V., Renzaho, A. M. N., Resnikoff, S., Rezaei, Negar, Rezaei, Nima, Rezapour, A., Rhinehart, P.-A., Riahi, S. M., Ribeiro, D. C., Ribeiro, D., Rickard, J., Rivera, J. A., Roberts, N. L. S., Rodríguez-Ramírez, S., Roever, L., Ronfani, L., Room, R., Roshandel, G., Roth, G. A., Rothenbacher, D., Rubagotti, E., Rwegerera, G. M., Sabour, S., Sachdev, P. S., Saddik, B., Sadeghi, E., Sadeghi, M., Saeedi, R., Saeedi Moghaddam, S., Safari, Y., Safi, S., Safiri, S., Sagar, R., Sahebkar, A., Sajadi, S. M., Salam, N., Salamati, P., Salem, H., Salem, M. R. R., Salimzadeh, H., Salman, O. M., Salomon, J. A., Samad, Z., Samadi Kafil, H., Sambala, E. Z., Samy, A. M., Sanabria, J., Sánchez-Pimienta, T. G., Santomauro, D. F., Santos, I. S., Santos, J. V., Santric-Milicevic, M. M., Saraswathy, S. Y. I., Sarmiento-Suárez, R., Sarrafzadegan, N., Sartorius, B., Sarveazad, A., Sathian, B., Sathish, T., Sattin, D., Saxena, S., Schaeffer, L. E., Schiavolin, S., Schlaich, M. P., Schmidt, M. I., Schutte, A. E., Schwebel, D. C., Schwendicke, F., Senbeta, A. M., Senthilkumaran, S., Sepanlou, S. G., Serdar, B., Serre, M. L., Shadid, J., Shafaat, O., Shahabi, S., Shaheen, A. A., Shaikh, M. A., Shalash, A. S., Shams-Beyranvand, M., Shamsizadeh, M., Sharafi, K., Sheikh, A., Sheikhtaheri, A., Shibuya, K., Shield, K. D., Shigematsu, M., Shin, J. I., Shin, M.-J., Shiri, R., Shirkoohi, R., Shuval, K., Siabani, S., Sierpinski, R., Sigfusdottir, I. D., Sigurvinsdottir, R., Silva, J. P., Simpson, K. E., Singh, J. A., Singh, P., Skiadaresi, E., Skou, S. T. S., Skryabin, V. Y., Smith, E. U. R., Soheili, A., Soltani, S., Soofi, M., Sorensen, R. J. D., Soriano, J. B., Sorrie, M. B., Soshnikov, S., Soyiri, I. N., Spencer, C. N., Spotin, A., Sreeramareddy, C. T., Srinivasan, V., Stanaway, J. D., Stein, C., Stein, D. J., Steiner, C., Stockfelt, L., Stokes, M. A., Straif, K., Stubbs, J. L., Sufiyan, M. B., Suleria, H. A. R., Suliankatchi Abdulkader, R., Sulo, G., Sultan, I., Szumowski, Ł., Tabarés-Seisdedos, R., Tabb, K. M., Tabuchi, T., Taherkhani, A., Tajdini, M., Takahashi, K., Takala, J. S., Tamiru, A. T., Taveira, N., Tehrani-Banihashemi, A., Temsah, M.-H., Tesema, G. A., Tessema, Z. T., Thurston, G. D., Titova, M. V., Tohidinik, H. R., Tonelli, M., Topor-Madry, R., Topouzis, F., Torre, A. E., Touvier, M., Tovani-Palone, M. R. R., Tran, B. X., Travillian, R., Tsatsakis, A., Tudor Car, L., Tyrovolas, S., Uddin, R., Umeokonkwo, C. D., Unnikrishnan, B., Upadhyay, E., Vacante, M., Valdez, P. R., van Donkelaar, A., Vasankari, T. J., Vasseghian, Y., Veisani, Y., Venketasubramanian, N., Violante, F. S., Vlassov, V., Vollset, S. E., Vos, T., Vukovic, R., Waheed, Y., Wallin, M. T., Wang, Y., Wang, Y.-P., Watson, A., Wei, J., Wei, M. Y. W., Weintraub, R. G., Weiss, J., Werdecker, A., West, J. J., Westerman, R., Whisnant, J. L., Whiteford, H. A., Wiens, K. E., Wolfe, C. D. A., Wozniak, S. S., Wu, A.-M., Wu, J., Wulf Hanson, S., Xu, G., Xu, R., Yadgir, S., Yahyazadeh Jabbari, S. H., Yamagishi, K., Yaminfirooz, M., Yano, Y., Yaya, S., Yazdi-Feyzabadi, V., Yeheyis, T. Y., Yilgwan, C. S., Yilma, M. T., Yip, P., Yonemoto, N., Younis, M. Z., Younker, T. P., Yousefi, B., Yousefi, Z., Yousefinezhadi, T., Yousuf, A. Y., Yu, C., Yusefzadeh, H., Zahirian Moghadam, T., Zamani, M., Zamanian, M., Zandian, H., Zastrozhin, M. S., Zhang, Y., Zhang, Z.-J., Zhao, J. T., Zhao, X.-J. G., Zhao, Y., Zhou, M., Ziapour, A., Zimsen, S. R. M., Brauer, M., Afshin, A., and Lim, S. S.: Global burden of 87 risk factors in 204 countries and territories, 1990–2019: a systematic analysis for the Global Burden of Disease Study 2019, Lancet 396, 1223–1249, https://doi.org/10.1016/S0140-6736(20)30752-2, 2020.
Sun, F., Zhang, D., Sun, R., Dong, X., Wang, X., Wang, Z., and Cheng, N.: Typical Heavy Pollution Episode Analysis on PM2.5 in Winter of Beijing, Environmental Monitoring in China, 6, 1–12, 2014 (in Chinese).
Wei, J., Huang, W., Li, Z., Xue, W., Peng, Y., Sun, L., and Cribb, M.: Estimating 1- km-resolution PM2.5 concentrations across China using the space-time random forest approach, Remote Sens. Environ., 231, 111221, https://doi.org/10.1016/j.rse.2019.111221, 2019.
Wei, J., Li, Z., Cribb, M., Huang, W., Xue, W., Sun, L., Guo, J., Peng, Y., Li, J., Lyapustin, A., Liu, L., Wu, H., and Song, Y.: Improved 1 km resolution PM2.5 estimates across China using enhanced space–time extremely randomized trees, Atmos. Chem. Phys., 20, 3273–3289, https://doi.org/10.5194/acp-20-3273-2020, 2020.
Wei, J., Li, Z., Lyapustin, A., Sun, L., Peng, Y., Xue, W., Su, T., and Cribb, M.: Reconstructing 1 km-resolution high-quality PM2.5 data records from 2000 to 2018 in China: spatiotemporal variations and policy implications, Remote Sens. Environ., 252, 112136, https://doi.org/10.1016/j.rse.2020.112136, 2021.
Zhan, Y., Luo, Y., Deng, X., Grieneisen, M. L., Zhang, M., and Di, B.: Spatiotemporal prediction of daily ambient ozone levels across China using random forest for human exposure assessment, Environ. Pollut., 233, 464–473, https://doi.org/10.1016/j.envpol.2017.10.029, 2018.
Zhao, C., Wang, Q., Ban, J., Liu, Z., Zhang, Y., Ma, R., Li, S. and Li, T. : Estimating the daily PM2.5 concentration in the Beijing-Tianjin-Hebei region using a random forest model with a 0.01° × 0.01° spatial resolution, Environ. Int., 134, 105297, https://doi.org/10.1016/j.envint.2019.105297, 2019.