the Creative Commons Attribution 4.0 License.
the Creative Commons Attribution 4.0 License.
 | 22 Dec 2022
High-resolution water level and storage variation datasets for 338 reservoirs in China during 2010–2021
Youjiang Shen
Dedi Liu
Liguang Jiang
Karina Nielsen
Jiabo Yin
Jun Liu
Peter Bauer-Gottwein
Reservoirs and dams are essential infrastructure in water management; thus, information of their surface water area (SWA), water surface elevation (WSE), and reservoir water storage change (RWSC) is crucial for understanding their properties and interactions in hydrological and biogeochemical cycles. However, knowledge of these reservoir characteristics is scarce or inconsistent at the national scale. Here, we introduce comprehensive reservoir datasets of 338 reservoirs in China, with a total of 470.6 km3 storage capacity (50 % Chinese reservoir storage capacity). Given the scarcity of publicly available gauged observations and operational applications of satellites for hydrological cycles, we utilize multiple satellite altimetry missions (SARAL/AltiKa, Sentinel-3A and Sentinel-3B, CroySat-2, Jason-3, and ICESat-2) and imagery data from Landsat and Sentinel-2 to produce a comprehensive reservoir dataset on the WSE, SWA, and RWSC during 2010–2021. Validation against gauged measurements of 93 reservoirs demonstrates the relatively high accuracy and reliability of our remotely sensed datasets. (1) Across gauge comparisons of RWSC, the median statistics of the Pearson correlation coefficient (CC), normalized root mean square error (NRMSE), and root mean square error (RMSE) are 0.89, 11 %, and 0.021 km3, with a total of 91 % validated reservoirs (83 of 91) having good RMSE from 0.002 to 0.31 km3 and NRMSE values smaller than 20 %. (2) Comparisons of WSE retracked by six satellite altimeters and gauges show good agreement. Specifically, the percentages of reservoirs having good and moderate RMSE values smaller than 1.0 m for CryoSat-2 (validated in 30 reservoirs), SARAL/AltiKa (9), Sentinel-3A (34), Sentinel-3B (25), Jason-3 (11), and ICESat-2 (26) are 77 %, 75 %, 79 %, 87 %, 81 %, and 82 %, respectively. By taking advantages of six satellite altimeters, we are able to densify WSE observations across spatiotemporal scales. Statistically, around 96 % of validated reservoirs (71 of 74) have RMSE values below 1.0 m, while 57 % of reservoirs (42 of 74) have good data quality with RMSE values below 0.6 m. Overall, our study fills such a data gap with regard to comprehensive reservoir information in China and provides strong support for many aspects such as hydrological processes, water resources, and other studies. The dataset is publicly available on Zenodo at https://doi.org/10.5281/zenodo.7251283 (Shen et al., 2021).
- Article
(10721 KB) - Full-text XML
-
Supplement
(1636 KB) - BibTeX
- EndNote


Reservoirs and dams are essential infrastructure in water management that alter the natural river flows to provide services such as flood control, hydroelectricity generation, and irrigation (Intralawan et al., 2018; Zhu et al., 2020). Largely mandated by the Flood Control Act of 1950, more than 98 000 reservoirs and dams have been constructed in China, with a total water capacity of around 932 km3 (MWR, 2016). The boom of dam impoundment will continue for the next few decades in the context of climate warming and human activities (Lehner et al., 2011; Gutenson et al., 2020). Understanding the role of reservoirs and dams in the hydrological cycles has become increasingly important (Buccola et al., 2016; Marx et al., 2017; Chaudhari et al., 2018; Busker et al., 2019). Our review of the literature suggests that a combination of data and river models is the core to understanding the impacts of reservoirs on hydrological cycles. However, most studies on reservoirs have been significantly limited due to data scarcity. Despite progress in process-based models with new reservoir schemes and higher spatial resolution (Shin et al., 2019; Dang et al., 2020), most of them had approximated the reservoir releases just through storage–release equations and were routed downstream with river routing mechanisms (e.g., Zhao et al., 2016; Zajac et al., 2017; Pokhrel et al., 2018; Yassin et al., 2019; Boulange et al., 2021). Acknowledging such approximations, we intend to contribute to the relevant studies by introducing remotely sensed reservoir datasets that can be applied as constraints to calibrate models or be directly used for reservoir analysis. Our study plans to fill such a data gap, i.e., to develop the remotely sensed reservoir datasets including the surface water area (SWA), water surface elevation (WSE), and reservoir water storage change (RWSC) of 338 reservoirs in China.
Due to the absence of observational records describing the multitude of reservoir characteristics, remote sensing techniques have been developed to monitor reservoirs and have characterized reservoir across the globe (Gao et al., 2012; Duan and Bastiaanssen, 2013). Satellite missions have been used to offer reliable reservoir estimates such as SWA, WSE, and RWSC (Zhang et al., 2014; Wang et al., 2020; Zhang et al., 2020; Shen et al., 2022). WSE can be acquired by satellite laser or radar altimetry missions such as Sentinel-3A/B, CryoSat-2, Jason-1/2/3, and ICESat-1/2 (e.g., Wingham et al., 2006; Donlon et al., 2012; Zhang et al., 2011; Song et al., 2013; Jiang et al., 2020). SWA can be derived from synthetic-aperture radar (SAR) or optical images from, e.g., MODIS, Landsat-MSS/TM/OLI, and Sentinel-1/2 (e.g., Goumehei et al., 2019; Weekley and Li, 2019), and RWSC can be calculated by two methods, where one is using WSE and SWA from satellite altimeters and images, and the other one is using imagery-based SWA and a digital elevation model (DEM). The core of these two methods is to construct the hypsometry relationships, i.e., area–elevation (A–E) curves from the overlapping records of WSE and SWA or DEM (Bonnema et al., 2016; Vu et al., 2022). There have been studies and online databases producing the remotely sensed datasets for inland reservoirs and/or lakes at regional/global scales (Birkett et al., 2011; Crétaux et al., 2011; Gao et al., 2012; Zhang et al., 2014; Khandelwal et al., 2017; Getirana et al., 2018; Busker et al., 2019; Yao et al., 2019; Zhao and Gao, 2018; Li et al., 2020; Tortini et al., 2020). We have listed the studies and databases in Table 1 to summarize the progress of remotely sensed data of reservoirs. Obviously, there is a data gap with regard to comprehensive reservoir information in China (Table A1). Records of a few reservoirs are available from these databases or previous studies (Table A1). Taking reservoir water level as an example, approximately 30 Chinese reservoirs are available from three datasets (i.e., Hydroweb, G-REALM, and DAHITI). Therefore, studies dynamically incorporating various satellites into a comprehensive reservoir dataset at a national scale can fill the data gap.
With this motivation in mind, we further identified some limitations of the studies listed in Table 1. Most of them just focus on developing a single reservoir dataset (WSE, SWA, RWSC, or A–E relationships) for a few reservoirs across the globe (Gao et al., 2012; Mu et al., 2020; Zhang et al., 2014). For example, Yao et al. (2019) constructs the long-term area time series for 428 reservoirs and lakes at a bi-monthly scale by recovering inundation areas from contaminated Landsat-based images. The remotely sensed products had often not been extensively validated by ground-observed data, which are usually not publicly available, with the exception of a few studies with scarce in situ observations (Bonnema and Hossain, 2019). Khandelwal et al. (2017) mapped the global areal extent and temporal variations in reservoirs at 500 m spatial resolution with 8 d intervals from 2000 to 2015. Altimetric water level time series from 94 reservoirs were used to validate their area datasets due to the lack of in situ measurements. Tortini et al. (2020) provides a global dataset of SWA, WSE, and storage change over 347 lakes/reservoirs, but the results are validated at only one lake. Moreover, the remotely sensed datasets (e.g., lake/reservoir storage variations by Busker et al., 2019, or RWSC by Avisse et al., 2017) are not publicly available. A geostatistical approach has also been adopted to estimate RWSC with a surface water area during 1985–2005 (Fang et al., 2019). There are critical limitations shown as wide confidence intervals and high uncertainties due to its simplifications. There are several databases offering the time series of altimetry-derived WSE and/or imagery-based SWA estimates for big reservoirs across the globe. They are Hydroweb (Crétaux et al., 2011), G-REALM (Birkett et al., 2011), DAHITI (Schwatke et al., 2015), the Bluedot Observatory, ReaLSAT (Khandelwal et al., 2022a), and others. These databases incorporated more altimetric information and provided datasets at a higher temporal resolution. For example, Hydroweb first provided altimetry-derived water level time series on lakes and rivers from different satellite missions. Unlike Hydroweb, G-REALM focuses on some of the world's largest reservoirs and/or lakes. Within a rather unprecedented framework of online web application, the Bluedot Observatory allows exploring and generating imagery-based SWA time series of reservoirs and/or lakes on demand. As already mentioned, records of a few reservoirs in China are available. Whether reservoir WSE or SWA time series from these databases have a good agreement with one another and gauged measurements is not systematically evaluated, which can be shown in this study.
In light of the above, our objective is to fill this research gap with regard to comprehensive reservoir information in China, thus supporting process-based models to better understand systematic reservoir effects. To densify reservoir observations, multiple satellite altimetry missions (i.e., Sentinel-3A/B, SARAL/AltiKa, CroySat-2, Jason-3, and ICESat-2) and imagery data from Landsat and Sentinel-2 are utilized to develop high-resolution remotely sensed reservoir datasets, including SWA, WSE, and RWSC of 338 reservoirs in China during 2010–2021, with a total of 470.6 km3 water capacity (50 % reservoir water capacity in China). To validate the remotely sensed results, the in situ observations of 93 reservoirs are used for evaluation, thereby bringing a good level of confidence in the quality of the datasets. Users are free to access the datasets, in an easily readable file format that allows researchers quickly to handle our datasets, at https://doi.org/10.5281/zenodo.7251283 (Shen et al., 2021).
The results of this study align with the efforts to understand the role of reservoirs in hydrological cycles but that are significantly limited due to data scarcity. Moreover, a growing interest in using remote sensing data in the hydrological cycle is expected; thus, knowing the accuracy of the remote sensing data is a prerequisite. Although previous studies assessed satellite altimeters in retrieving reservoir water levels (Shu et al., 2021), knowledge is still limited as to the evaluations of different altimeters for a large sample of reservoirs, which can be shown in this study. Overall, our unique contribution lies in the unique and novel remotely sensed datasets to fill a data gap with regard to comprehensive reservoir information in China and to benefit studies involving many fields such as hydrological processes, water resources, and other studies.
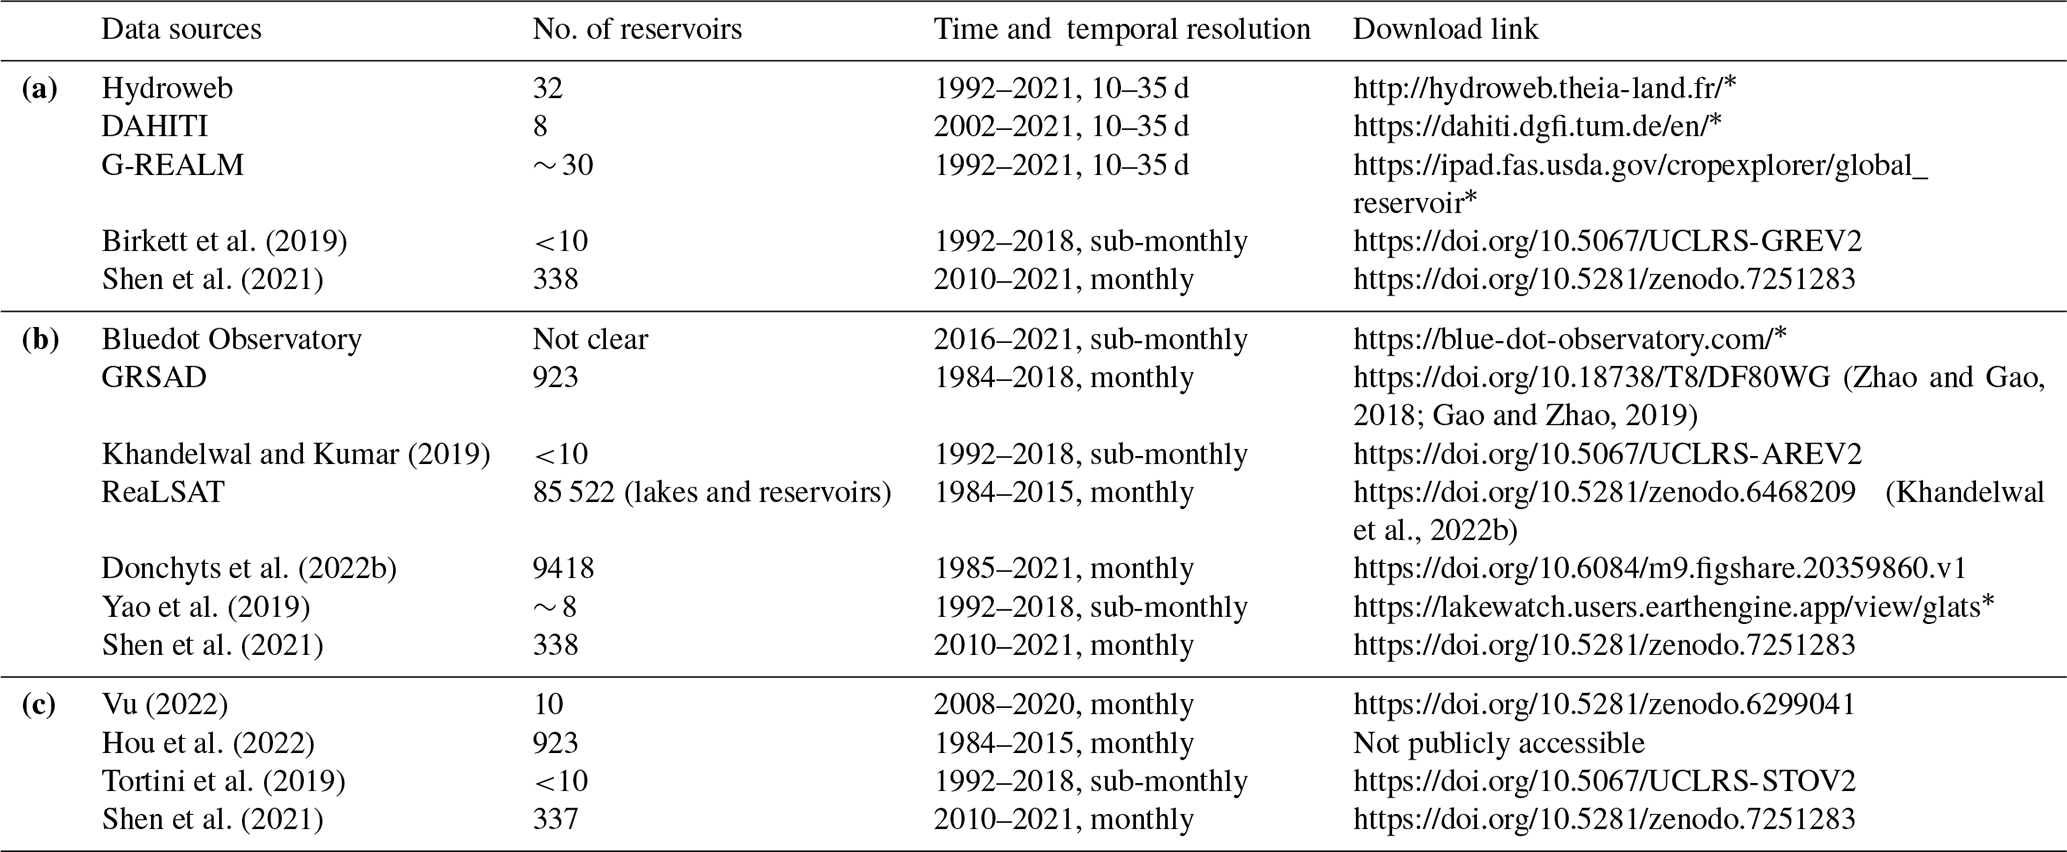
Table 1Summary of recent studies and databases producing the remotely sensed data on WSE, SWA, and RWSC and the hypsometric curve of reservoirs.
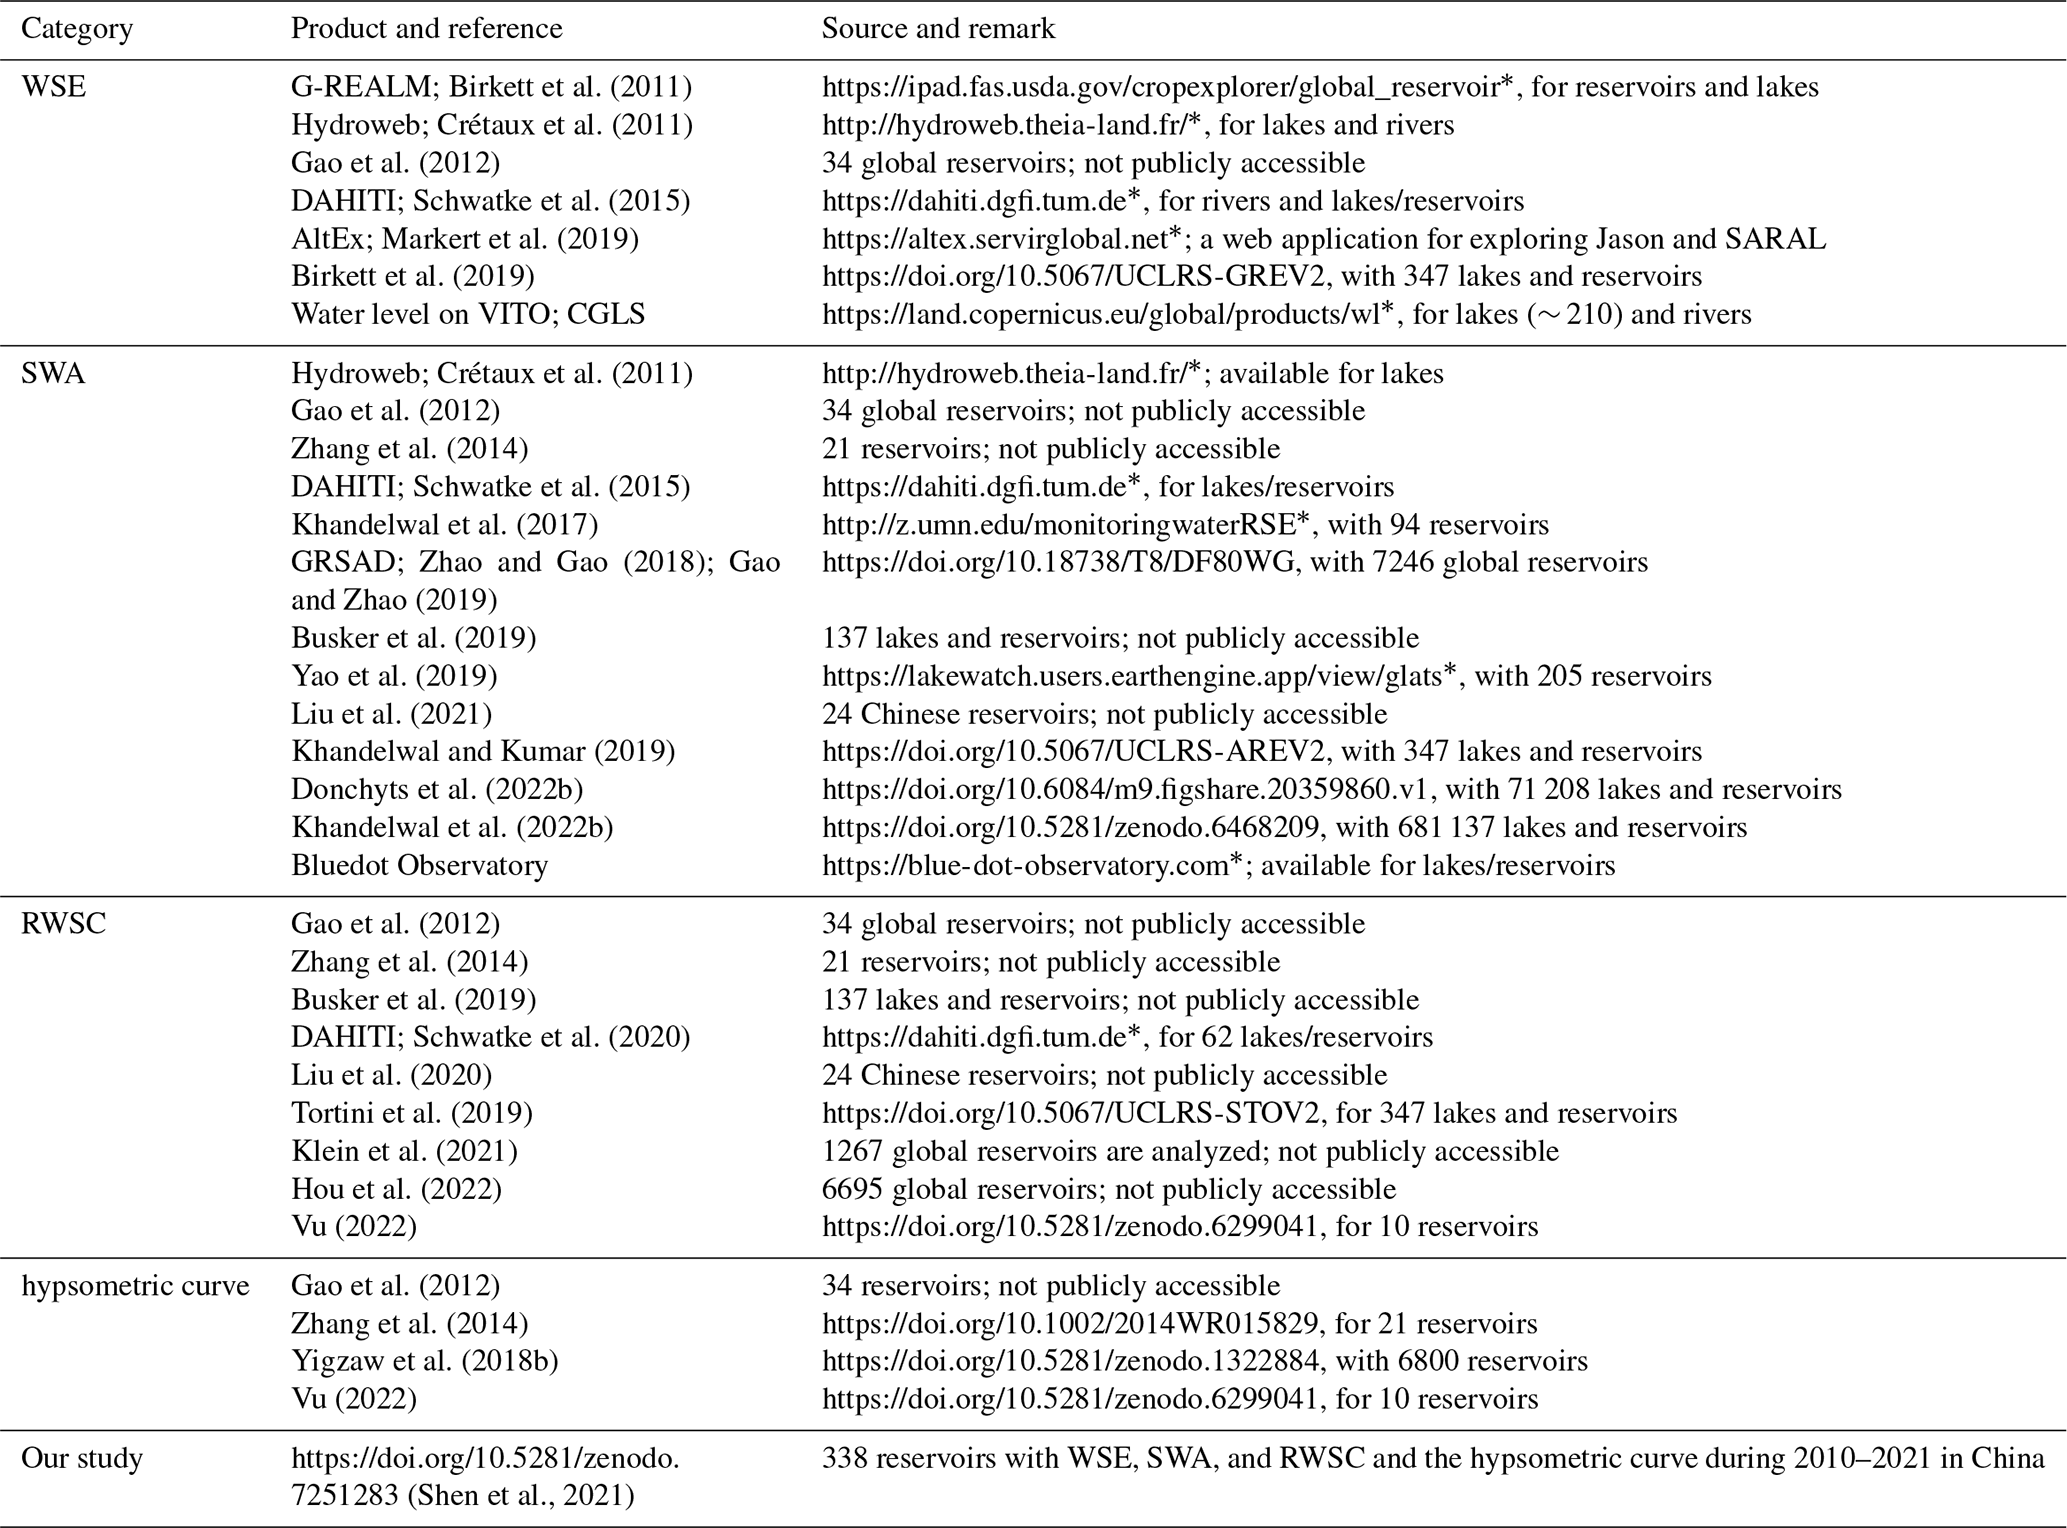
* Last access: 15 October 2022. Abbreviations are as follows: Global Reservoir and Dam database (GRanD), Database for Hydrological Time Series of Inland Waters (DAHITI), Global Reservoirs and Lakes Monitor (G-REALM), Global Reservoir Surface Area Dataset (GRSAD).
China has an enormous network of reservoirs across different geographical landscapes. In this study, we selected all reservoirs for which geographical information is available from the GRanD database (http://globaldamwatch.org/grand/, last access: 15 October 2022, Lehner et al., 2011). The GRanD provides an extensive number of attributes for reservoir shapefiles, including the geolocations of dams (i.e., latitude and longitude), extents and areas of reservoirs, dam heights, storage capacity, and more. We found that there is a considerable variation in the regulation capacity, water area, storage capacity, main function, and installed capacity to generate hydropower. Figure 1 shows the spatial distribution of the final retained reservoirs and the coverage of both altimetry passes and in situ gauges as a reference for validation. Most reservoirs are densely grouped over eastern and middle China. These in situ gauges provide a good test bed to evaluate the performance of each altimetry measurement over diverse reservoirs. We obtained daily water level and storage data spanning 2015–May 2021 for 93 reservoirs from the local watershed agency (http://113.57.190.228:8001/web/Report/BigMSKReport, last access: 15 October 2022) and National Hydrological Information Centre for validation (http://xxfb.mwr.cn/index.html, last access: 15 October 2022). All records follow strict quality controls, and the time series cover different periods. Data from May 2018 to June 2019 are missing for nearly all 93 reservoirs. A total of 49 reservoirs cover the period of 2015–May 2021, while the remaining reservoirs cover the period of July 2019–May 2021. Each reservoir has a storage capacity more than 40 ×106 m3, with a total water capacity of 189.2 km3. Detailed information about reservoirs with in situ data can be found in the Supplement (Fig. S1).
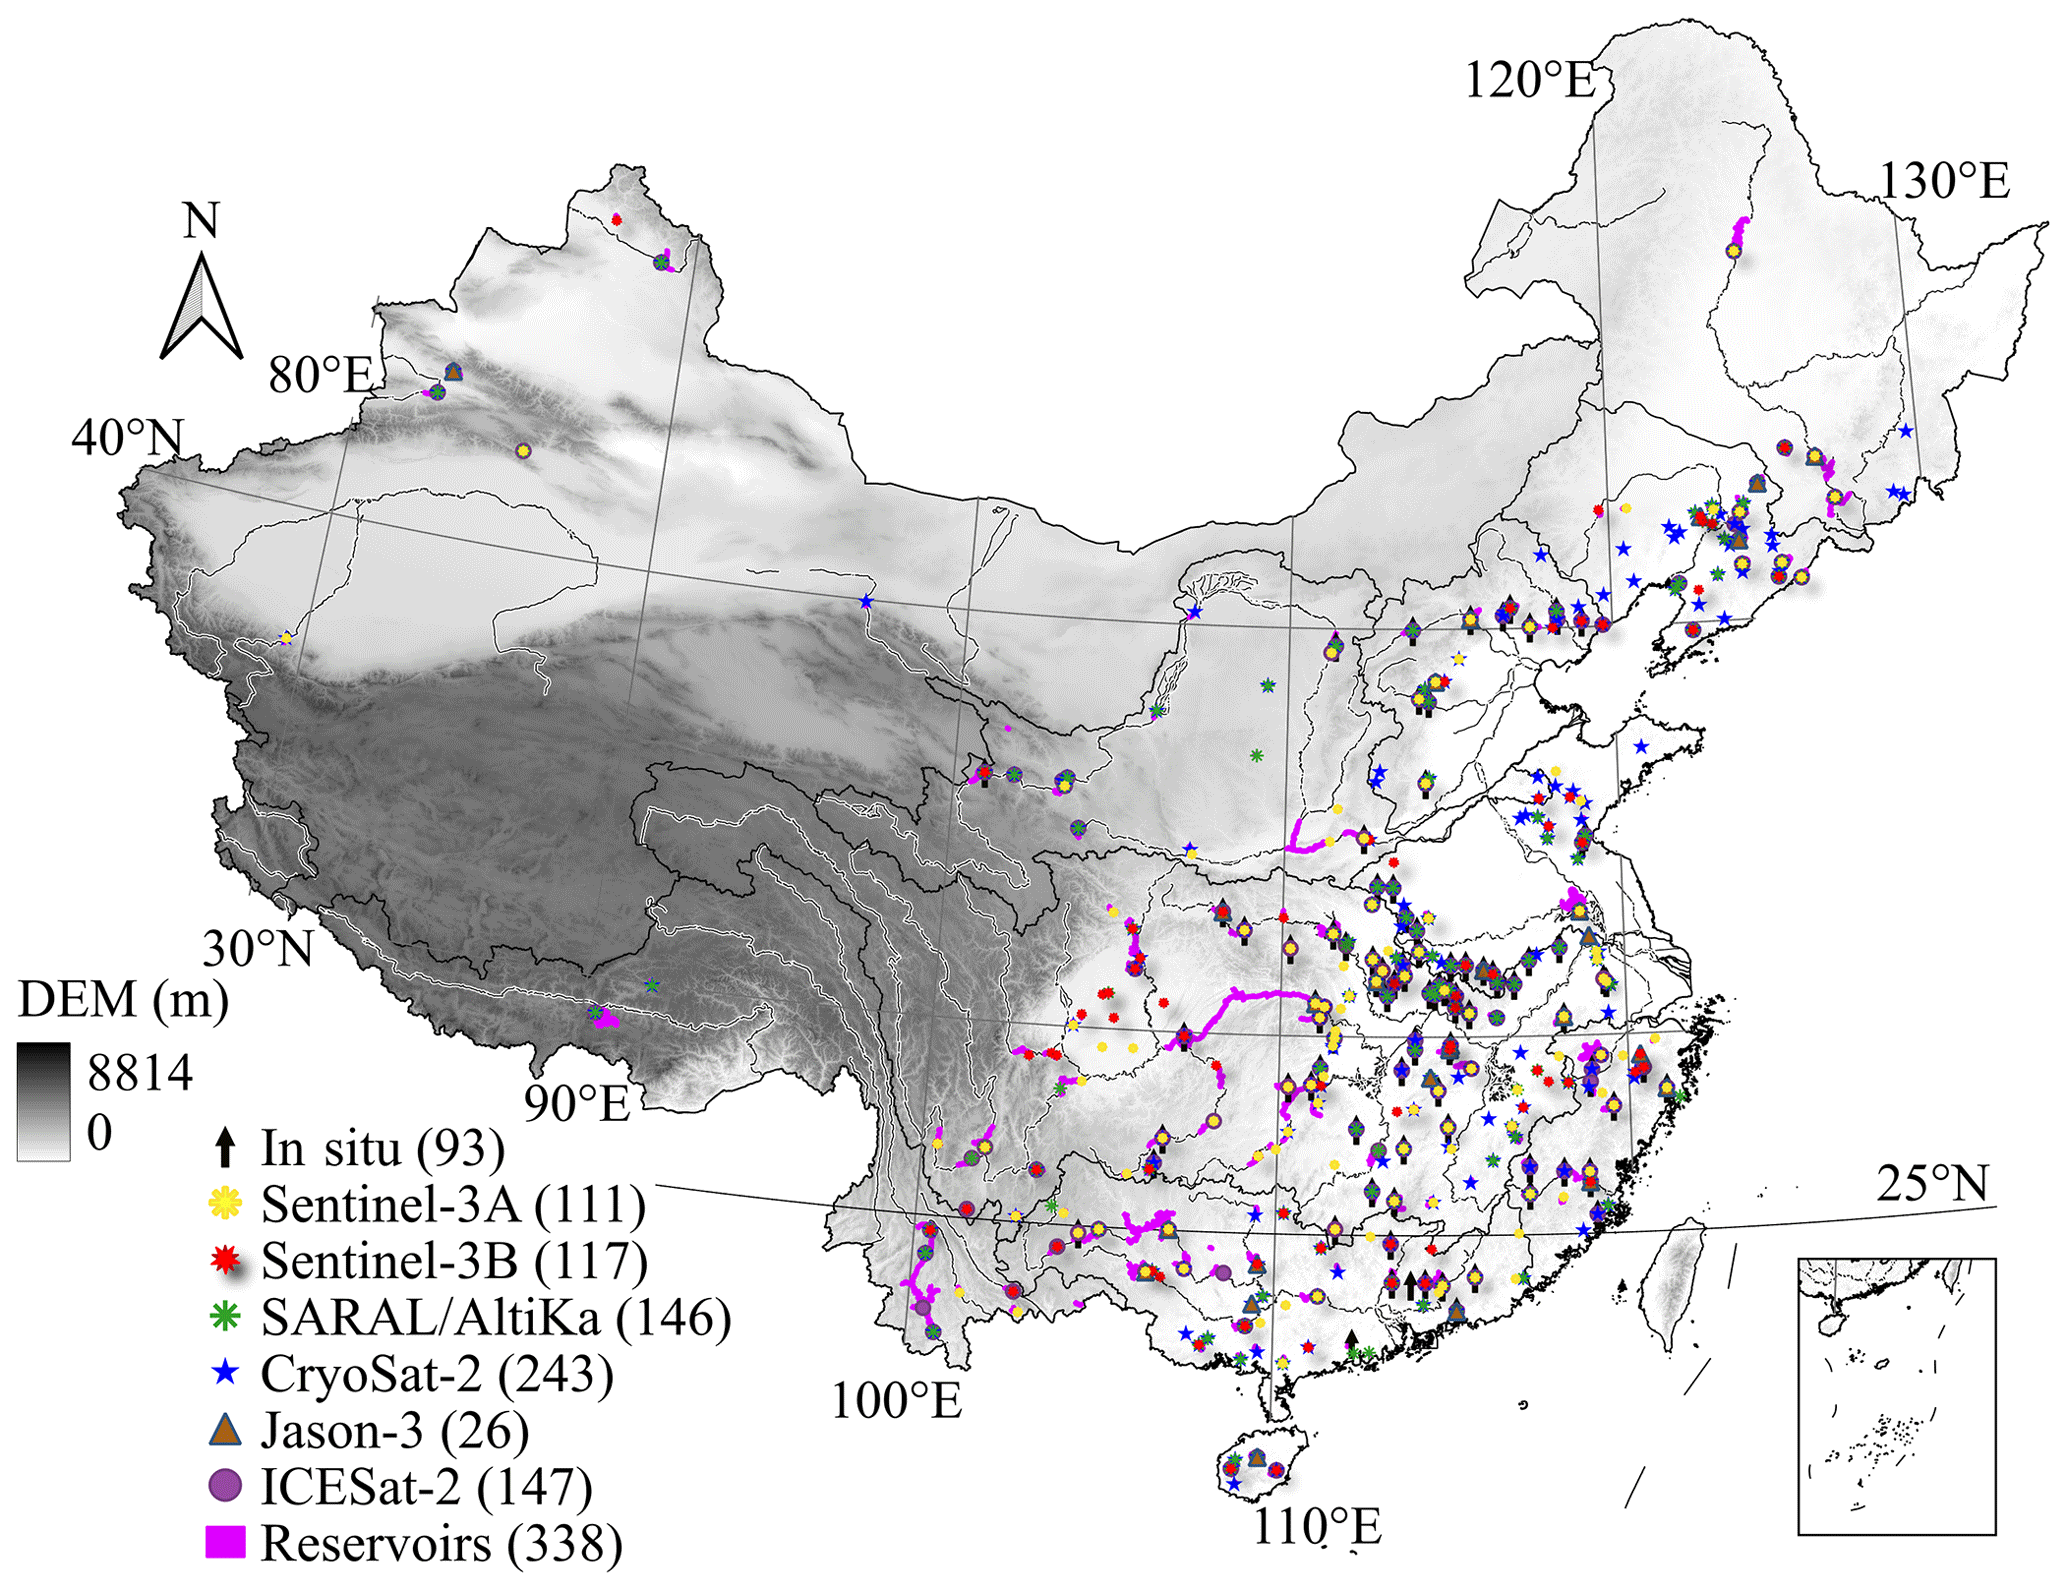
Figure 1Map of the reservoirs covered by multiple source satellite altimeters and stages. A total of 338 reservoirs are finally retained in our datasets. For more details, please refer to Sect. 3.
2.1 Satellite radar altimetry
We collect satellite altimetry-derived WSE measurements from CroySat-2, Sentinel-3A/B, SARAL/AltiKa, Jason-3, and ICESat-2. For readers to have a broad understanding of these missions, the main features are summarized below, while detailed information is available in the official user books (European Space Agency and Mullard Space Science Laboratory, 2012; Dinardo et al., 2018). CryoSat-2 (CS2), launched in April 2010, carries a synthetic-aperture, interferometric radar altimeter. It operates in three modes, i.e., low-resolution mode, synthetic-aperture mode, and synthetic-aperture interferometric mode. The baseline C level 1b dataset are from the ESA (European Space Agency; https://science-pds.cryosat.esa.int/, last access: 15 October 2022), which provides 20 Hz measurements, including waveforms, position, corrections, interferometric-phase difference, etc. These waveforms were retracked with the primary peak center of gravity (PPCOG) and narrow primary peak threshold retracker, with a 50 % (NPPTr[0.5]) and 80 % (NPPTr[0.8]) threshold, algorithms (Jain et al., 2015). SARAL/AltiKa, launched in 2013, carries the first altimeter operating in the Ka-band frequency, which enables a higher spatial resolution and leads to higher data availability (CNES, 2016). Note that SARAL/AltiKa left its repetitive orbit with a repeat cycle of 35 d in July 2016 and switched to a drifting geodetic orbit with subcycles of 15–17 d with 1002 passes (Bonnefond et al., 2018). We downloaded their Geophysical Data Records (GDRs) from CNES (Centre national d'études spatiales) AVISO+ (Archiving, Validation and Interpretation of Satellite Oceanographic data; ftp://avisoftp.cnes.fr/AVISO/pub/, last access: 15 October 2022). The records provide 40 Hz ranges retracked using the Ice-1 and Ice-2 algorithms, and we also implemented the PPCOG, NPPTr[0.5] and NPPTr[0.8] algorithms to derive WSE. Sentinel-3 consists of the constellations of two satellites, i.e., Sentinel-3A (S3A) and Sentinel-3B (S3B), which were launched in February 2016 and April 2018, respectively. It is the first radar altimeter measuring in SAR mode at a global scale with an open-loop tracking system (Biancamaria et al., 2018). It, therefore, potentially facilitates more water level measurements at a higher precision and accuracy. We only used Ku-band SAR measurements with an open-loop tracking mode and downloaded the level 2 enhanced-measurement datasets from https://scihub.copernicus.eu/dhus/ (last access: 15 October 2022). These contain 20 Hz measurements with waveforms, altitude, position, corrections, and ranges retracked by the Ocean algorithm. We also implemented the PPCOG, NPPTr[0.5], and NPPTr[0.8] algorithms, and the traditional offset center of gravity (OCOG) algorithms to derive the water level. Jason-3, equipped with the Poseidon-3B altimeter, was launched in February 2016. It has an across-track resolution of 315 km at the Equator, potentially offering altimetric data at a low spatial resolution but a high temporal resolution of 10 d. The GDRs of Jason-3 were downloaded from CNES AVISO+ (ftp://avisoftp.cnes.fr/AVISO/pub/, last access: 15 October 2022) and contain the ranges retracked by OCOG and the Ocean and Adapt algorithms. ICESat-2, launched in 2018, is carrying the Advanced Topographic Laser Altimeter System (ATLAS) and can provide detailed measurements of inland waters at an approximate track resolution of 70 cm. We used the ALT13 products in the study (Rebold et al., 2021, https://icesat-2.gsfc.nasa.gov/science/data-products, last access: 15 October 2022). All altimetry data are then referenced to the EGM2008 (Pavlis et al., 2012) geoid model. The source and version of each altimetry product are listed in Table 2.
Table 2Summary of altimetry datasets used in this study.
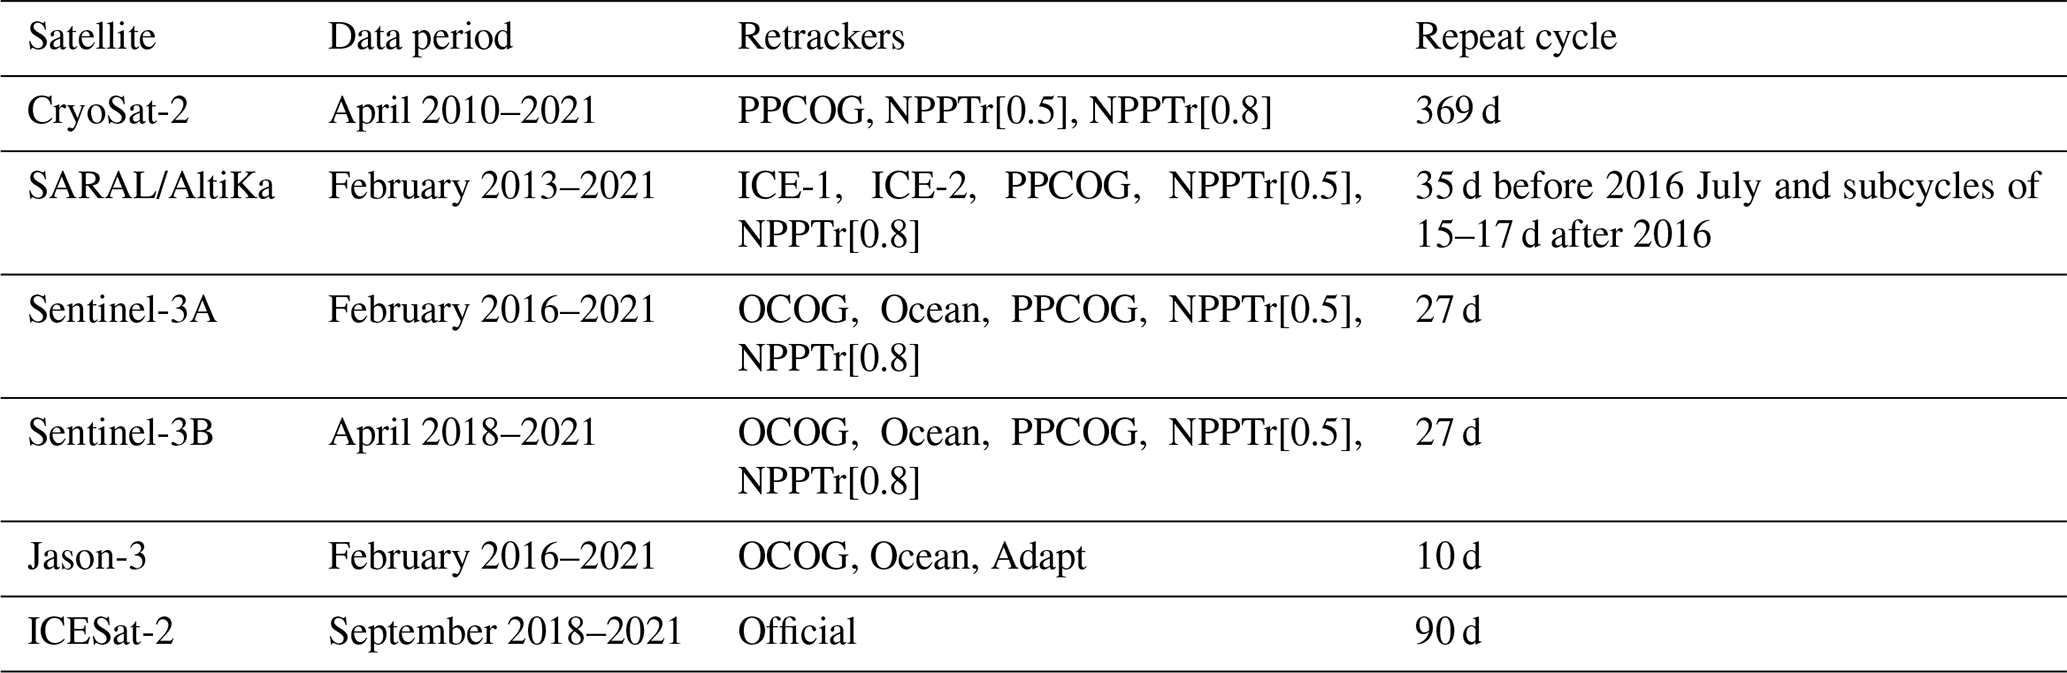
Note that PPCOG refers to the primary peak center of gravity algorithm. NPPTr[0.5] and NPPTr[0.8] refer to the narrow primary peak threshold retracker, with a 50 % and 80 % threshold-level algorithm, respectively. OCOG refers to the traditional offset center of gravity algorithm.
The flowchart of constructing reservoir water level time series is provided in Appendix B (Fig. B1). It contains three steps. First, we picked valid satellite altimetric measurements by selecting the correct ground tracks and valid footprints falling on reservoirs. This was done by masking the altimetry data from the GRanD polygons of reservoirs. Second, we constructed the reservoir point water level measurements via the following equations:
where Halt refers to the altitude of satellite, Ngeo is the height of the EGM2008 geoid, and Rrange is the range that measures the distance from water to satellite. Rtrac is the range to the nominal bin of the waveform, and Rretrac denotes the retracking correction. Ratm and Rgeo are the atmospheric corrections (wet tropospheric, dry tropospheric, and ionospheric corrections) and the geophysical corrections (solid Earth, pole, and ocean loading tides). These corrections are taken from their products. Third, to construct reservoir water level time series, the following sub-steps are carried out:
-
Altimetry-derived WSE are pre-selected based on the water occurrence map (occurrence >10 %, set 80 % for CroySat-2) of the Global Surface Water Explorer (https://global-surface-water.appspot.com/, last access: 15 October 2022).
-
We removed outliers for each pass (i.e., two deviations away from the median value) using the median of absolute deviation (Jiang et al., 2019).
-
Outliers are identified and discarded by comparing with Shuttle Radar Topography Mission (SRTM) DEM, i.e., 20 m away from DEM (set to 40 m for reservoirs with large fluctuations).
-
The remaining WSE measurements are applied to construct time series based on the R package tsHydro, available at https://github.com/cavios/tshydro (last access: 15 October 2022). This package efficiently estimates the along-track water level in the case of outlying measurements (Nielsen et al., 2015).
As a result of the above steps, we generated standard-measurement (SM) reservoir water level time series products from each satellite altimetry with different retracking algorithms (Fig. B1). In general, SM products have a relatively low resolution determined by the spatial sampling pattern and repetitive period of a satellite altimeter. For example, Sentinel-3A spaced its ground tracks 104 km apart at the Equator, thus only potentially offering altimetric measurements for 194 GRanD reservoirs in China, while CryoSat-2 can visit 873 GRanD reservoirs in China but has a repeat period of 369 d. To cope with the limitation of the opposing spatial sampling and temporal resolution of single altimeter and obtain an enhanced-resolution water level product, we merged single-satellite SM products from multiple sources (i.e., CryoSat-2, S3A, S3B, SARAL/AltiKa, ICESat-2, and Jason-3) for a reservoir, if available, and generated enhanced-measurement (EM) reservoir water level time series products. Notably, we select the SM products from each satellite with the best retracking algorithm in terms of the root mean square error (RMSE) compared to in situ water level or the default retracking algorithm time series to densify time series. To remove inter-satellite systematic biases, two approaches are used. The first one is applied to satellites with enough overlapping periods by directly removing their mean water level differences, and the second one is to use the remotely sensed reservoir area time series as an anchor of biased time series to estimate the inter-satellite relevant bias. We used the Gauss–Helmert adjustment scheme to minimize the 2-D cost function in surface area–water level coordinates (Fig. B1).
To evaluate the performance of both SM and EM altimetric products, we calculate the RMSE values against in situ water level. The RMSE is a standard error metric in this field and calculated by comparing water level anomalies between gauges and satellites.
2.2 Surface area datasets
In this study, we applied the new algorithm developed by Donchyts et al. (2022a) to leverage freely accessible Landsat and Sentinel-2 images to generate reservoir water area time series. The Google Earth Engine (GEE) code for this water mapping algorithm is available at https://github.com/global-water-watch/research-reservoir-water-dynamics (last access: 15 October 2022) and was applied individually to each reservoir and every satellite image intersecting a given reservoir to map accurate reservoir water. This algorithm can efficiently address several challenges associated with optical Landsat satellites, such as contamination from clouds and limitations of previous algorithms that reclassify contaminated pixels as water. Donchyts et al. (2022a) demonstrated the algorithm's good performance in mapping reservoir water areas by comparing the areas with in situ water level/storage in 768 reservoirs of varying size and geographic regions. Here, we detail how this algorithm addresses the challenges from optical images and generates a water area time series. First, we selected the cloudy satellite images that intersect with a given reservoir shapefile. Second, we used the global cloud frequency dataset (Wilson and Jetz, 2016) to identify the cloudiest images that are fully covered by clouds and corrected the remaining images using the following steps. Third, we computed the NDWI (normalized difference water index) spectral water index. Fourth, we detected land/water edges based on the Canny edge detector algorithm (Donchyts et al., 2016) and defined sampling areas for pixels around the land/water edges. Fifth, we determined the optimal threshold based on the Otsu thresholding algorithm (Markert et al., 2020), using a sample of NDWI spectral index values within the region determined in the previous step, to obtain a water mask. Next, we eliminated incorrectly detected water (water pixels detected as non-water) by sampling the surface water occurrence along water edges and obtained the final gap-filled water mask by clipping surface water occurrence at a given occurrence value and combining it with the water mask. Last, reservoir water area time series from the final gap-filled water mask are filtered with a quantile-based temporal outlier filtering algorithm to remove the remaining errors. Detailed procedures and flowcharts can be found in Donchyts et al. (2022a).
After these steps, we generated a monthly reservoir water area time series for 338 reservoirs. To analyze the performance of our products, the reservoir time series are compared with the in situ water level time series, the altimetric water level time series (SM and EM product; see Sect. 2.1), and two similar existing products from GRSAD (Zhao and Gao, 2018) and ReaLSAT (Khandelwal et al., 2022; Table 1). The CC, rRMSE (relative RMSE), and rBIAS (relative bias) are used as indicators of data quality.
2.3 Reservoir storage variation estimation
Monthly reservoir storage variation estimation is based on two common approaches. One is to use the water level and water areas from satellite altimeters and images, while another one is to use imagery-based water areas and a DEM (digital elevation model). The core of these two approaches is to construct the A–E relationships from the overlapping records of the water level and areas or DEM. Here, we assume that the A–E relationships can be described by five hypsometric relationships (i.e., linear, power, exponential, polynomial, and logarithmic relationships). Parameters of the relationships are derived by minimizing the residual sum of squares (RSSs) using an ordinary least squares (OLSs) regression. The curves were compared based on their R2 values, and the one with the best performance is served as the hypsometry relationship of the reservoir. For reservoirs with enough overlapping water level and area records from satellites, we performed the following procedures (Fig. B2).
-
We estimate the monthly WSE by directly averaging all measurements within each month.
-
We generate the scatterplot of monthly area and water level data pairs and eliminate errors in the scatterplot.
-
We generate the A–E relationship through OLS approaches.
-
We apply the derived relationship to estimate WSE from SWA for periods when WSE is unavailable and inverse the function to estimate SWA from WSE for periods when SWA is unavailable (e.g., the month with large contamination ratio).
-
We use Eq. (3) to determine the monthly RWSC estimation during 2010–2021.
Regarding the DEM-based approached, we generated the water-area-level-storage model based on SRTM 90m DEM and reservoir shapefile (Vu et al., 2022) and then calculated RWSC by combining the imagery-based water areas and reconstructed area-level-storage model (Fig. B2). After these steps, two types of reservoir storage variations are contained in our product. To assess the data quality, we use the RMSE, Pearson correlation coefficient (CC), and normalized root mean square error (NRMSE) as indicators of data quality. The generated RWSC were compared with in situ observation of 93 reservoirs.
3.1 Dataset description
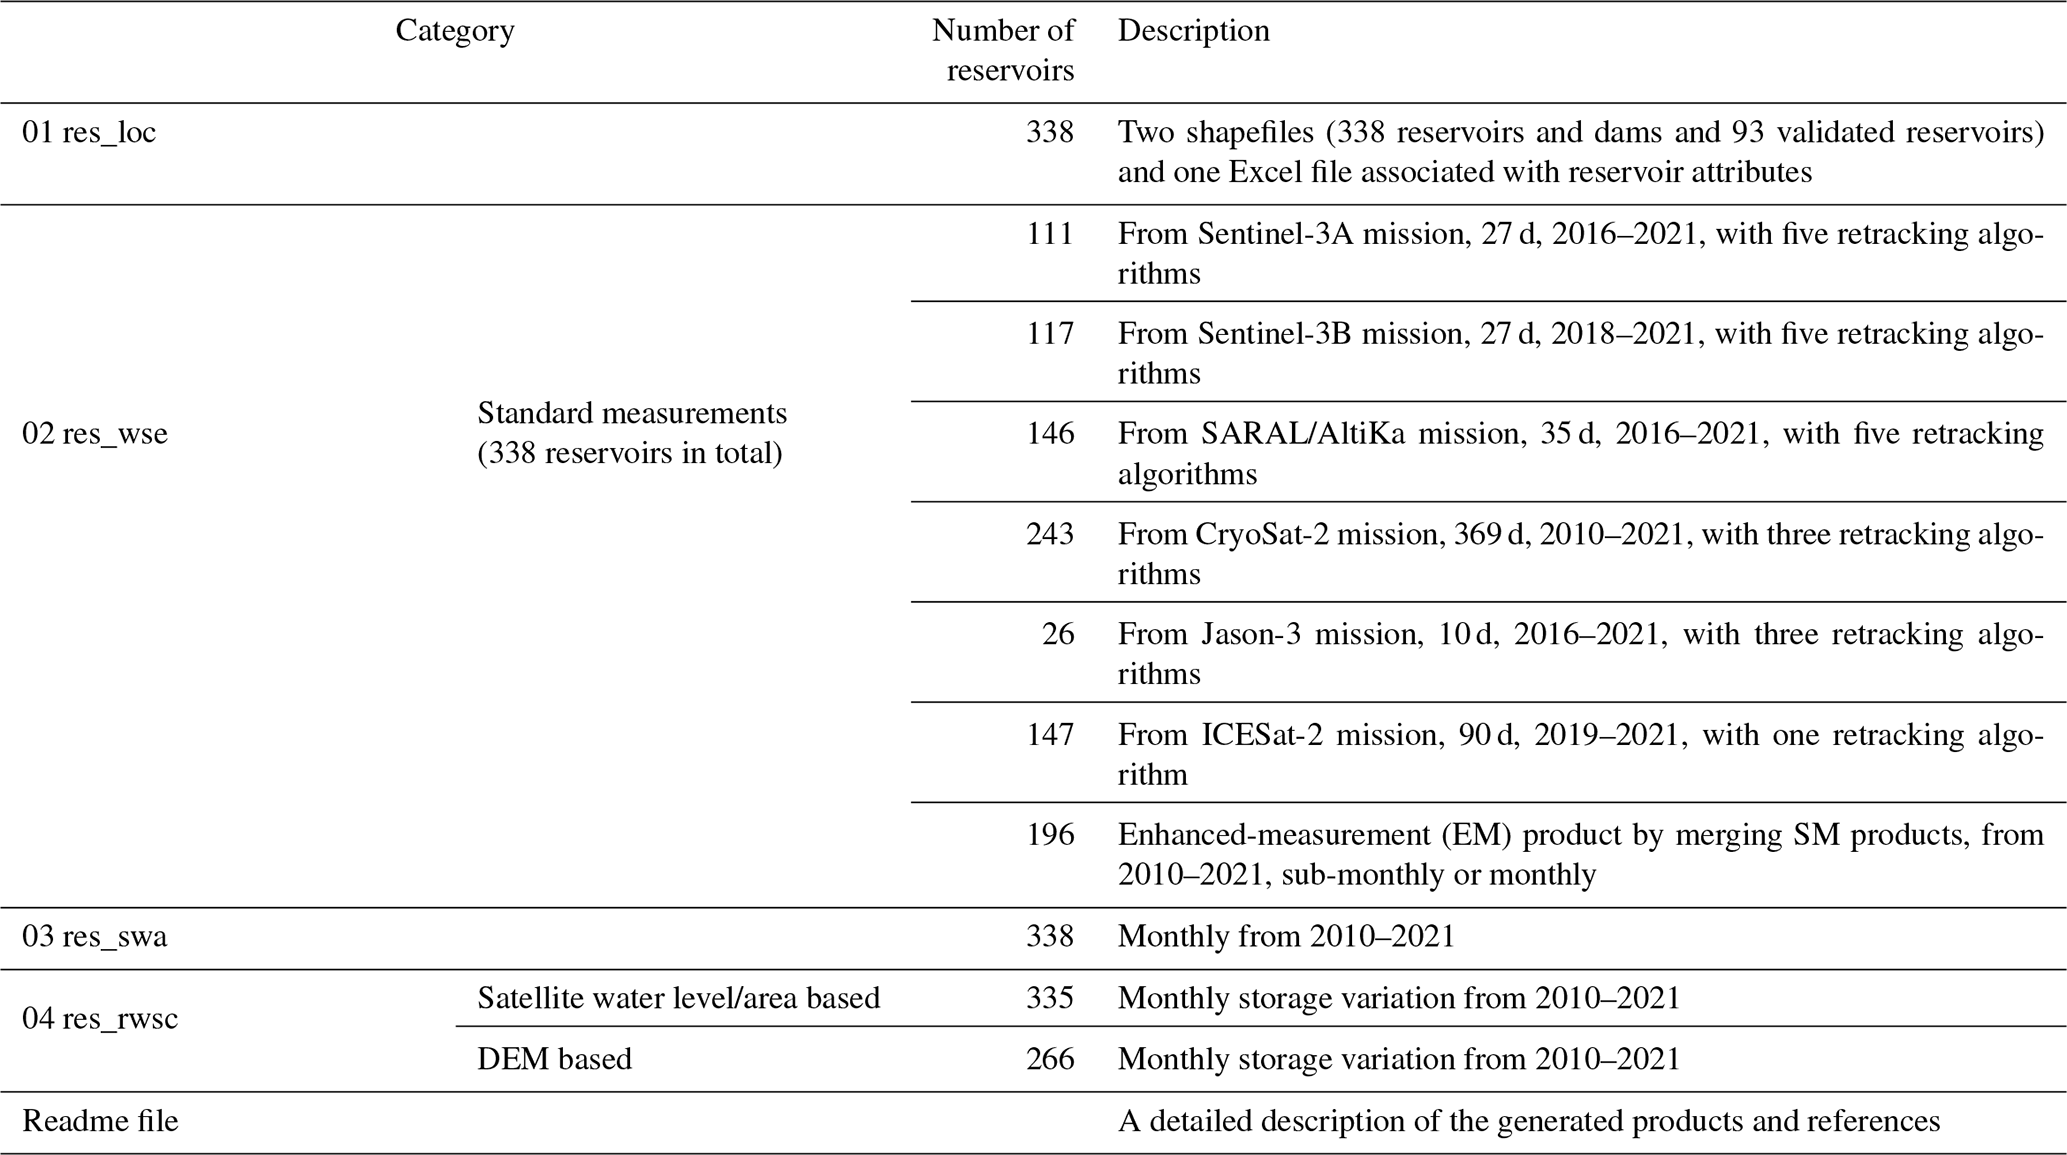
In this study, we generated the remotely sensed reservoir datasets for 338 Chinese reservoirs, with a total of 470.6 km3 storage capacity (50 % reservoir water capacity in China). The geographical distributions of these reservoirs are represented in Fig. 1, and summarized information on the components of the datasets is shown in Table 3. By synthesizing information from various data sources, the remotely sensed datasets (WSE, SWA, and RWSC) of 338 Chinese reservoirs were calculated during 2010–2021 and are publicly available at https://doi.org/10.5281/zenodo.7251283 (Shen et al., 2021). The files provided are (i) the reservoir shapefiles, (ii) the time series of SWA, WSE, and RWSC, and (iii) a readme file. In the directory of 01_res_loc, we provide two ESRI shapefiles (the location of 338 reservoirs and 93 reservoirs with in situ observations for validation) and one Excel file of their associated attributes. In the directory of 02_res_wse, we provide the time series of reservoir water surface elevation in two modes (i.e., standard measurement and enhanced measurement), with their comprehensive evaluation reports and figures in the PDF and Excel files. The standard measurement (SM) products are individual measurements from each satellite altimeter with different retracking algorithms, while the enhanced-measurement (EM) products are the densified water level observations from multiple sources, if available. In the directory of 03_res_swa, we provide the reservoir monthly area time series. In the directory of 04_res_rwsc, we provide the time series of RWSC in two modes (i.e., DEM based and water area and water level from satellites) and A–E curves, with their comprehensive evaluation reports, regression statistics, and figures in PDF and Excel files. Different levels of data are provided in an easily readable file format, showing that our remotely sensed datasets have clear patterns and can capture the seasonal filling and emptying of reservoirs very well. For more details, please refer to the following sections and the Supplement.
3.2 Reservoir water level product
We provided reservoir WSE time series in two modes, namely SM (standard-measurement) and EM (enhanced-measurement) products extracted from six satellite altimeters (i.e., Sentinel-3A (S3A), Sentinel-3B (S3B), SARAL/AltiKa (SAL), CryoSat-2 (CS2), Jason-3 (J3), and ICESat-2 (IC2)). In total, 921 reservoirs are visited by the six altimetry missions over China during the CryoSat-2 era, providing basic WSE information. After removing outliers, constructing and combining the time series, and conducting a visual inspection, we finally retain 338 reservoirs that have enough valid measurements. Note that most reservoirs are removed due to the insufficient altimetry data points rather than other reasons. Out of 338 reservoirs, most reservoirs are visited by two drifting altimeters (i.e., 243 and 146 reservoirs by CryoSat-2 (CS2) and SARAL/AltiKa), while Sentinel-3A (S3A), Sentinel-3B (S3B), and Jason-3 (J3) cover 111, 117, and 26 reservoirs, respectively (Fig. 1). To evaluate the data quality, we followed the normal practice in the field by comparing WSE anomalies between satellites and gauges by removing the mean value due to the unknown local vertical data. Due to the missing observations of most reservoirs with in situ records for the period of May 2018 to July 2019, we evaluate reservoirs where the overlapped WSE observations between satellites and stages are larger than eight, resulting in a total of 74 reservoirs with an average of 20 data points for validation (34 by S3A, 23 by S3B, 9 by SAL, 27 by CS2, 11 by J3, 26 by IC2, and 74 by the EM product). The performance of remotely sensed results is considered moderate and even good based on visual inspection of time series, statistical assessment, and reported accuracies from previous publications (Villadsen et al., 2016). In the next two paragraphs, we will show the data availability of SM and EM products and how well these remotely sensed results agree with gauged records.
Figure 2 shows the performance of six altimeters in terms of RMSE of retracked WSE with different retracking algorithms. No significant difference is observed in terms of RMSE values among these retrackers, although they are performing differently. In most cases, all retrackers retrieve WSE consistently. Interestingly, all retrackers consistently perform poorly for some reservoirs, although the reservoir areas are relatively large (Fig. S2). Appropriately, the OCOG algorithm is more robust over most reservoirs for Jason-3. It should be noted that, when merging SM products for a reservoir, the observations from the retracker that has the smallest RMSE are applied.
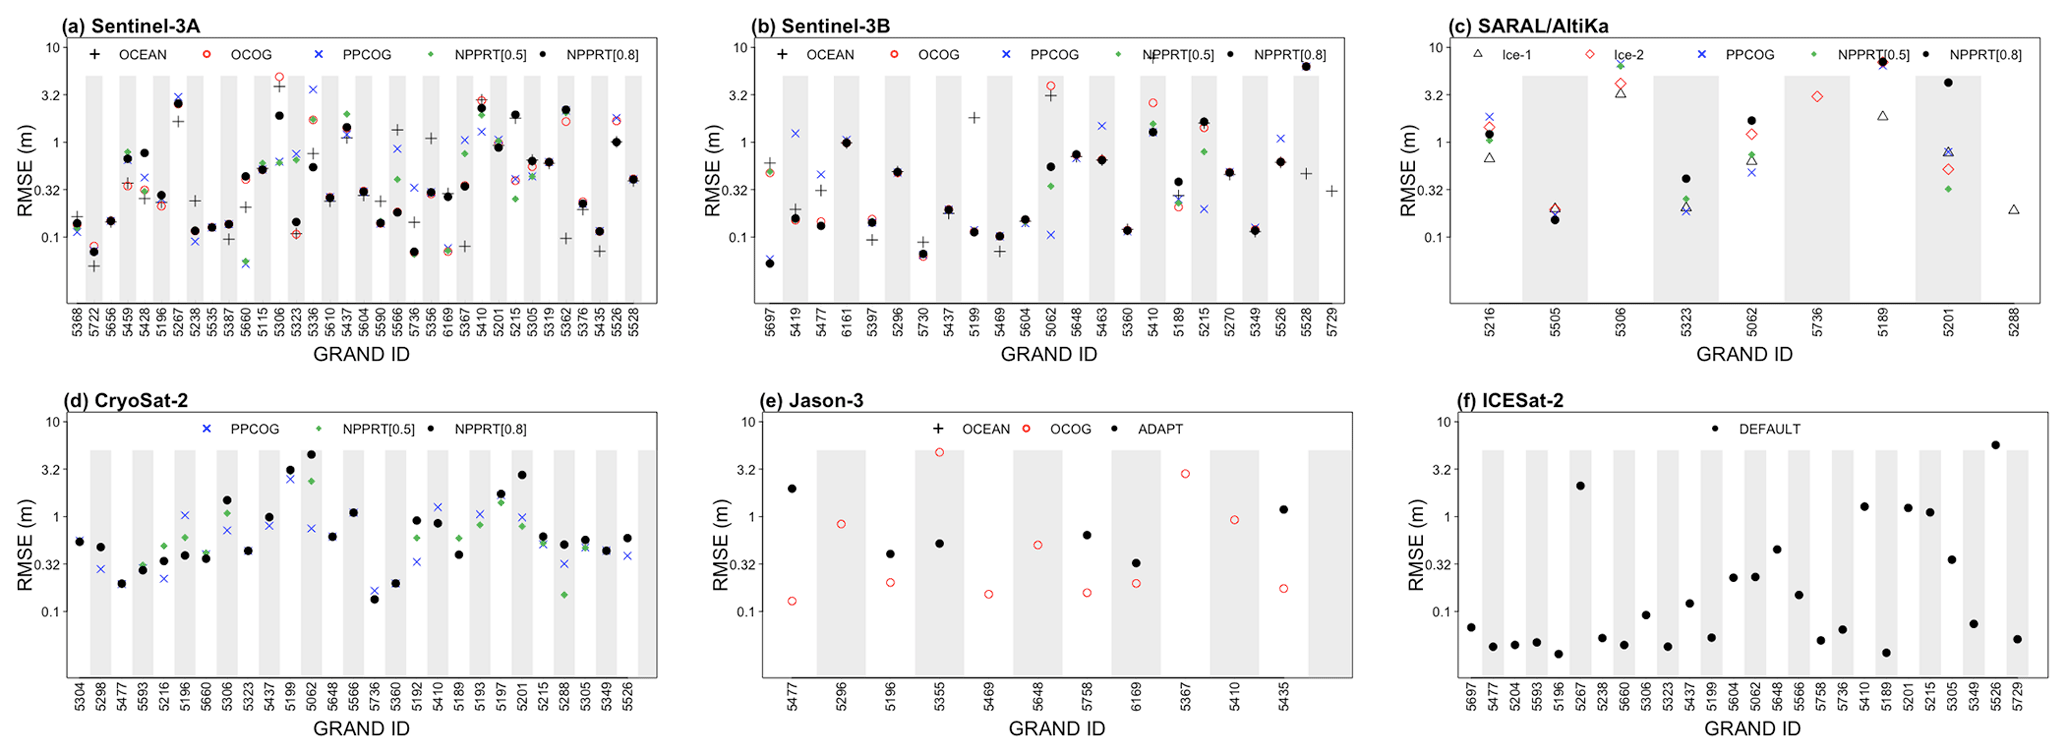
Figure 2Comparison of the different retracking algorithms (three for CryoSat-2 and Jason-3 and one for ICESat-2) of six altimeters at validated reservoirs. Logarithmic scales are used for the y axis. The x axis refers to the reservoir GRanD IDs. For some reservoirs, occasionally, there are no useable data delivered by one specific retracking algorithm, and therefore no RMSE is available.
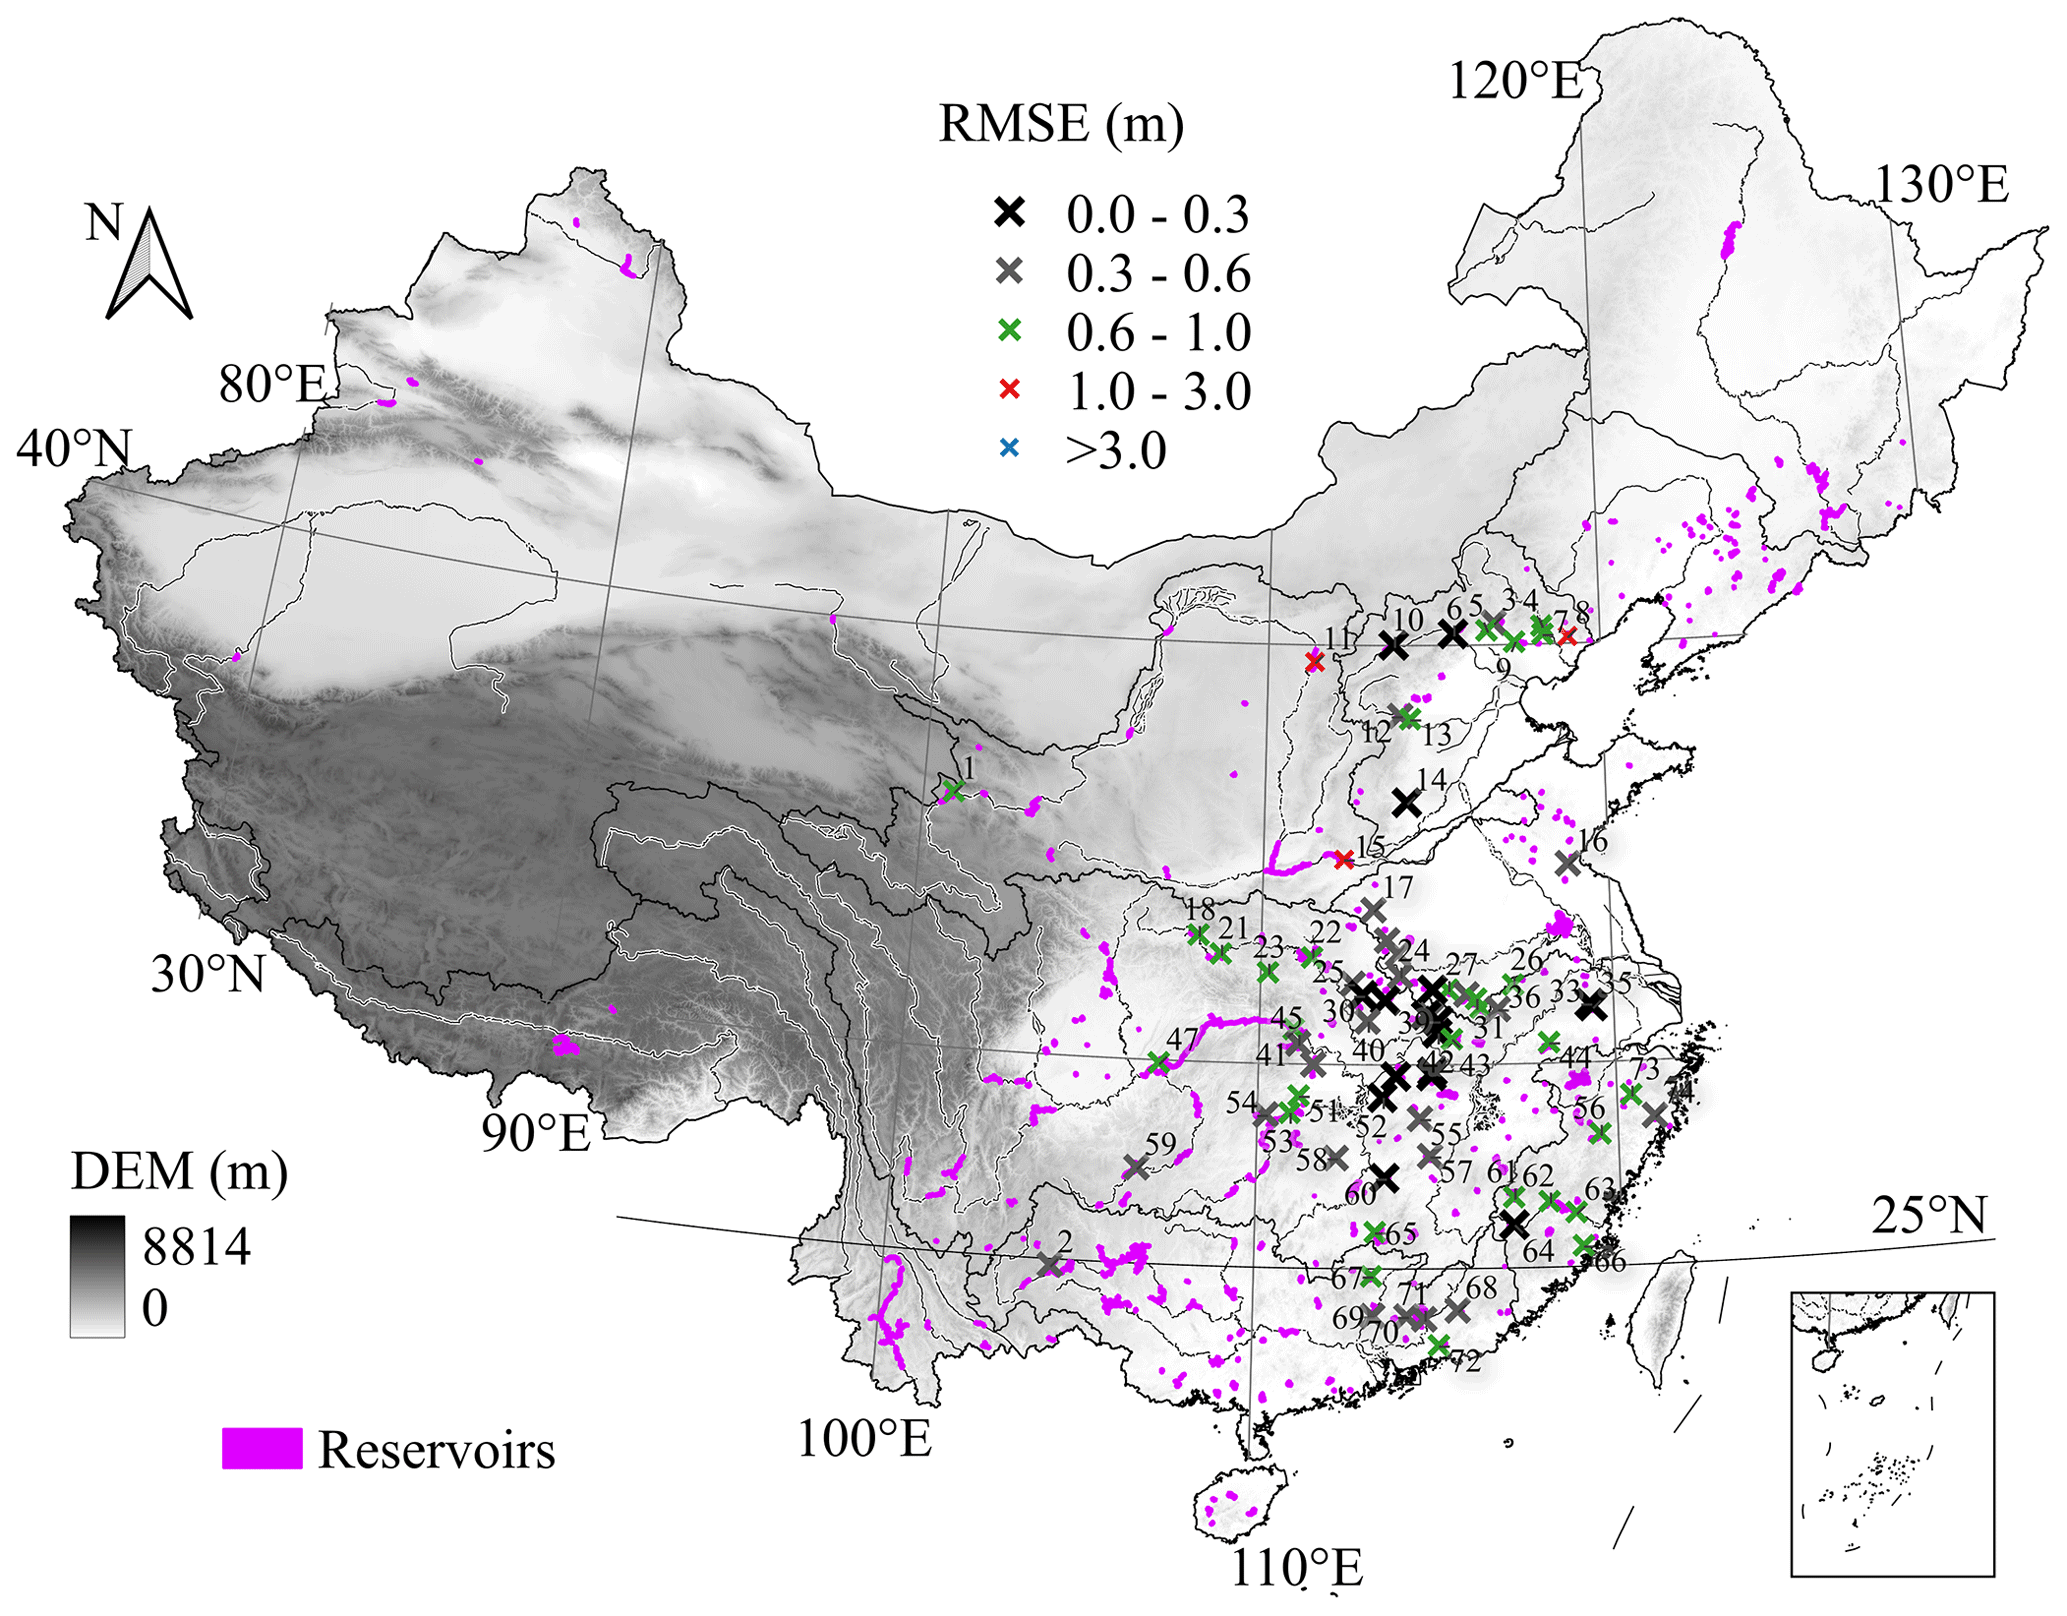
Figure 3Performance of the enhanced-measurement products in terms of the RMSE of 74 reservoirs. For the validated reservoir ID, please refer to the Supplement.
Taking the observations from the retracker that has the smallest RMSE, we merge all observations for a specific reservoir from multiple sources, if available. Figure 3 shows the performance of merged WSE observations (i.e., EM products) in terms of RMSE values. Individually, the values of the RMSE reveal that all altimetry missions can deliver useful water level measurements for reservoirs (Fig. 2). Specifically, percentages of reservoirs having very good RMSE values smaller than 0.3 m, moderate RMSE values ranging from 0.3 to 1.0 m, and relatively poor RMSE values over 1.0 m for each altimeter are 50 %, 29 %, and 21 % (S3A validated in 34 reservoirs), 48 %, 39 %, and 13 % (S3B 25), 38 %, 37 %, and 25 % (SAL 9), 23 %, 54 %, and 23 % (CS2 30), 55 %, 27 %, and 18 % (J3 11), and 73 %, 8 %, and 19 % (IC2 26), respectively. After merging observations from multiple sources, if available, a total of 74 reservoirs are evaluated; 42 reservoirs have a good agreement with in situ data with a RMSE value below 0.6 m, among which 17 reservoirs have a very good data quality with a RMSE value smaller than 0.3 m. Another 29 reservoirs have a moderate RMSE value from 0.6 to 1.0 m. Around 4 % have relatively poor performance in terms of RMSE values, regardless of the reservoir area. Some of them are located on the tributaries of the Yellow River and the Yangtze River. To demonstrate the data availability and reservoir water level time series provided in our SM and EM products, a selected number of example reservoirs presenting different areal sizes are shown in Figs. 4 and 5, respectively. All single-altimetric time series capture the dynamics of reservoir water level well, resulting in an improved temporal resolution of the EM water level time series. For the remaining reservoirs with no in situ observations available, we give the SD (standard deviation) estimates that quantify the accuracy of the water level along the track at the level of individual data points. Detailed evaluation reports and PDF files representing the water level time series for each reservoir are available in the datasets. By taking advantage of six satellite altimetry missions, we are able to densify WSE observations in most cases.

Figure 4The reservoir water level data availability of SM (standard-measurement) and EM (enhanced-measurement) products in addition to the number of satellite altimeter EM products.

Figure 5Illustration of SM (standard-measurement) and EM (enhanced-measurement) reservoir water level time series at a selected sample of reservoirs with a varying area size. Time series for other reservoirs are all available in the datasets.
Note that the remotely sensed datasets developed by previous studies discussed in the introduction to this paper are unavailable to, or do not, match the coverage of any reservoirs in our dataset. Nonetheless, we compare 27 reservoirs of our dataset with three databases from G-REALM, DAHITI, and Hydroweb and notice that our remotely sensed dataset is comparable (Figs. 6 and C1). If in situ observations available, the time series from different sources are compared against in situ measurements, and the RMSE values are calculated. Otherwise, the CC values of the WSE estimates of online database and our dataset are calculated. Across seven gauge comparisons (Fig. 6d–j), G-REALM, DAHITI, Hydroweb, and our dataset are similar and show close agreement with the in situ measurements. Nonetheless, there are some differences. For the Three Gorges, Xiaolangdi, and Shiquan reservoirs (Fig. 6d–f), our dataset can be less noisy and better represent the dynamics in the water level, with lower RMSE values than other sources. In case of the other four reservoirs (Fig. 6g–j), the RMSE values of our dataset are slightly higher than those of Hydroweb but still fall within satisfactory results below 0.60 m. It is worth noting that the time series of our dataset are much denser than those from Hydroweb and show clearer patterns (Fig. C1). The results of the 21 reservoirs without in situ observations indicate that all time series show dynamics of reservoir water level very well, highlighting the critical contribution of both the existing datasets and our dataset. In most cases, our dataset shows good agreement with measurements from others, with CC values >0.9. Nonetheless, there are some differences. Systematic biases are in these databases for the geoid issue (Fig. 6j). In addition, some large discrepancies can be found in certain reservoirs, e.g., the Shuifeng reservoir (Fig. 6c) did not show a clear fluctuation pattern as captured by G-REALM, for the periods in 2020 between our dataset and Hydroweb at the Fengman reservoir (Fig. 6b). Our datasets are denser than Hydroweb over most reservoirs (Fig. C1) and can be less noisy. These advantages would benefit the continuity and accuracy of the remotely sensed WSE and RWSC. Overall, this section demonstrated that performance of our datasets approximates accuracy of existing global altimetry datasets.
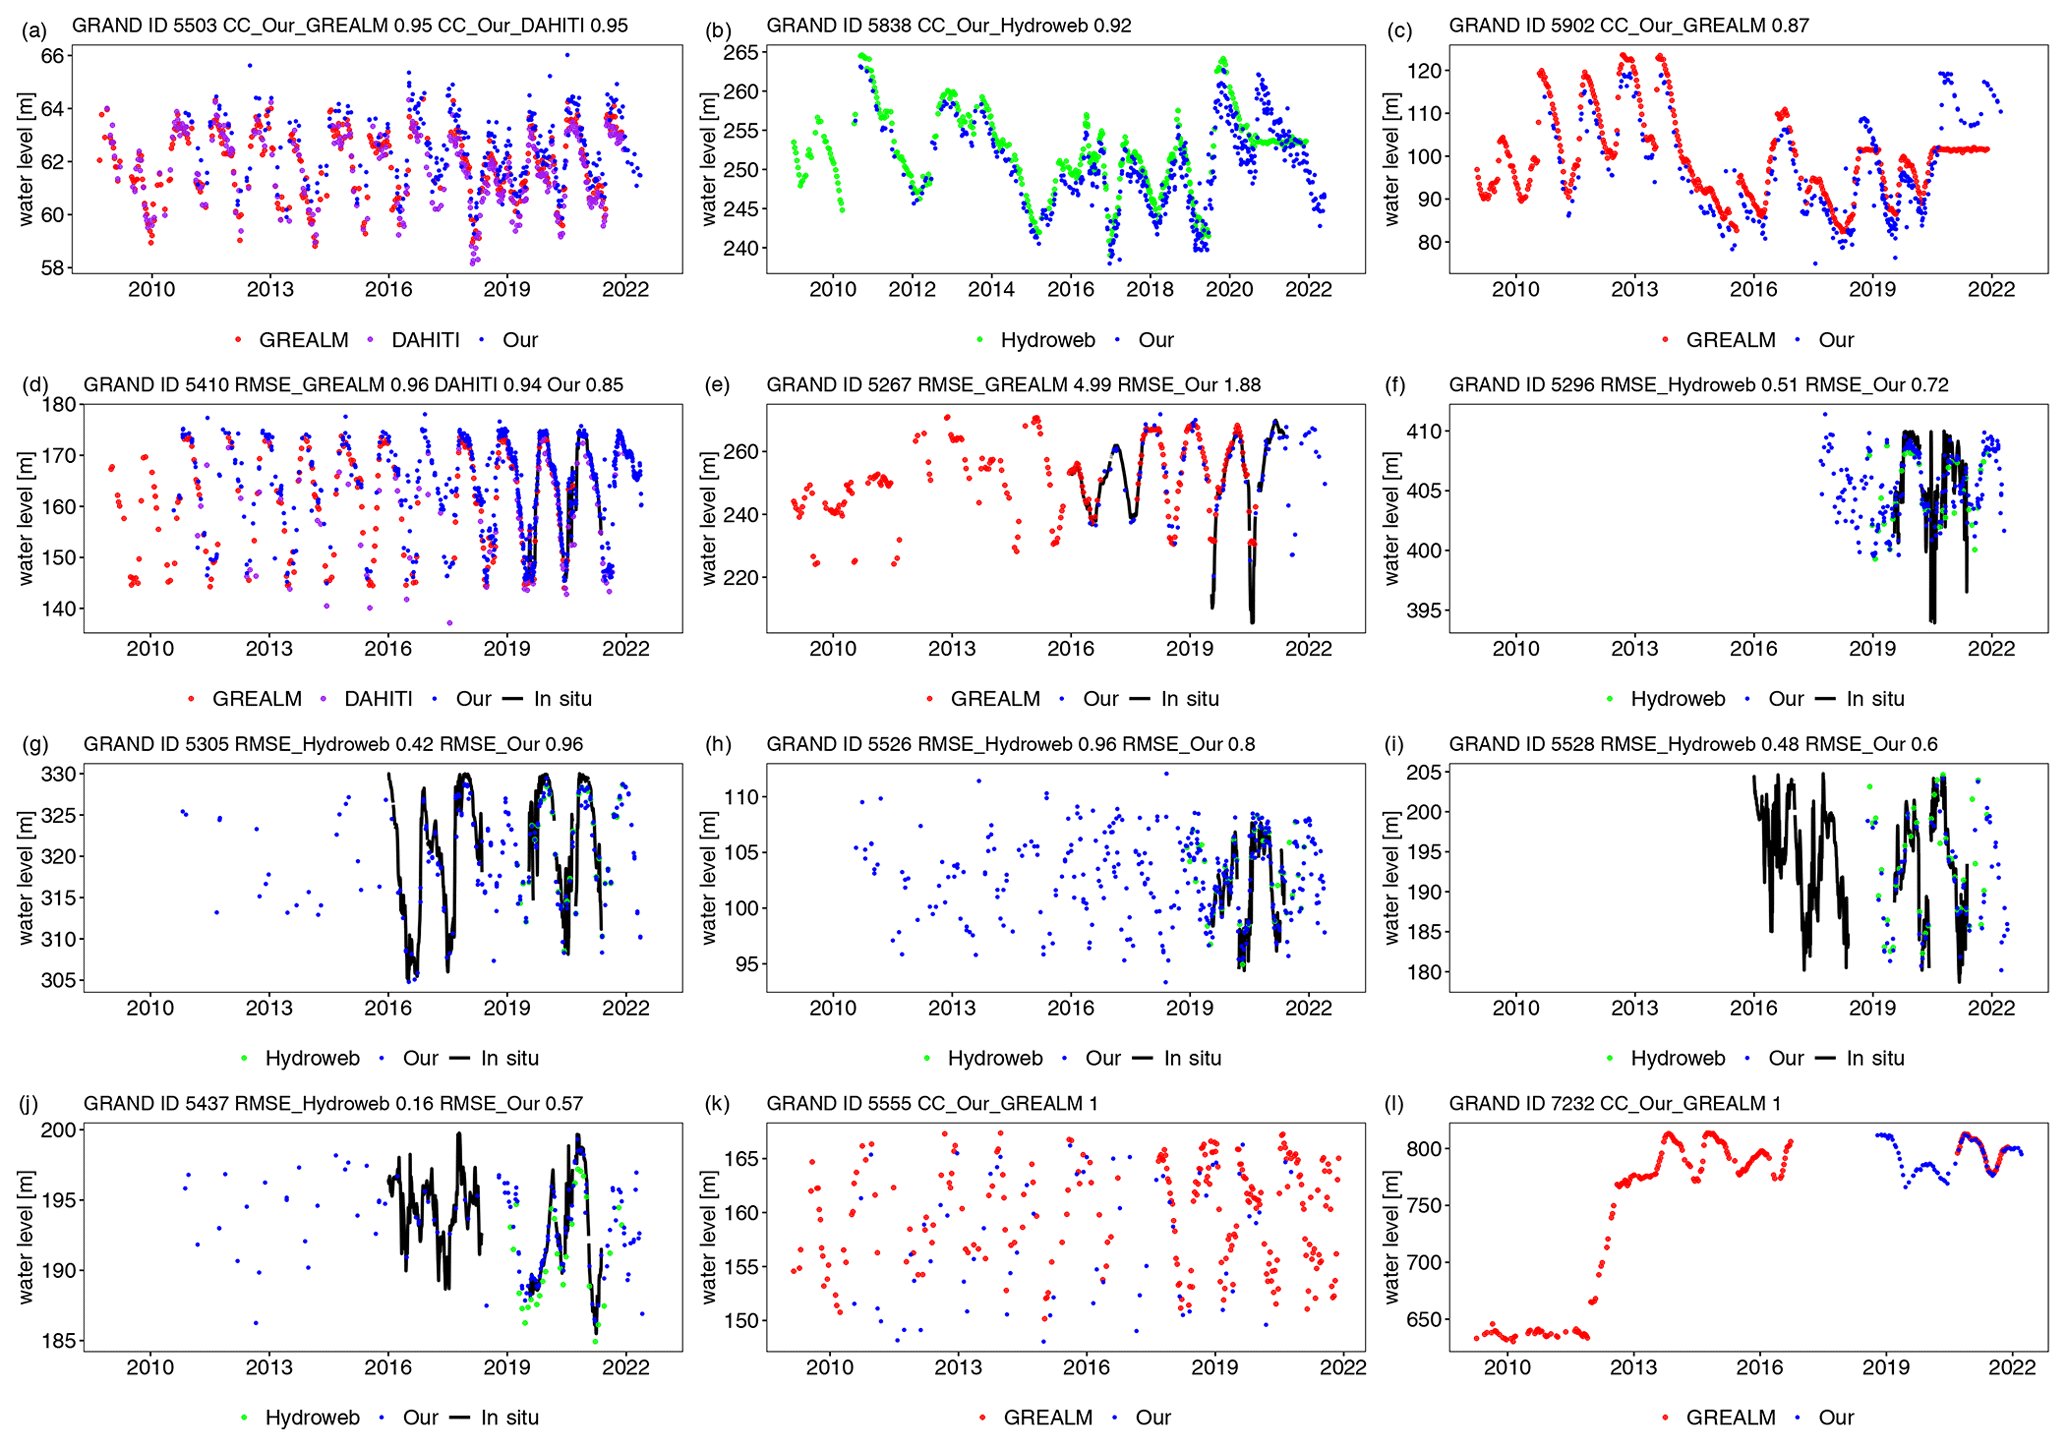
Figure 6Multiproduct evaluation at p27 reservoirs (15 reservoirs are shown in Fig. C1). DAHITI is plotted in black, G-REALM in red, Hydroweb in green, our dataset in blue, and in situ records with a black line. RMSE values are given when in situ observations are available; otherwise, CC values are given at the top of each subplot. Panels (a)–(l) are the Zhelin, Fengman, Shuifeng, Three Gorges, Xiaolangdi, Shiquan, Ankang, Wuqiangxi, Fengtan, Geheyan, Zhexi, and Nuozhadu reservoirs, respectively.
3.3 Reservoir water area product
Monthly reservoir SWA time series are provided for 338 reservoirs during 2010–2021 and are compared with water level time series (in situ and altimetric measurements) and the water level of two other, similar areal datasets. The SWA time series show good agreement with in situ water level observations in 93 reservoirs. Approximately 80 % have good CC values exceeding 0.5, among which 48 reservoirs show very good agreement, with a CC value >0.8. Compared to our altimetric standard measurements, we found that reservoir SWA and altimetric products generally show a good agreement, with CC values higher than 0.5 for 70 % of 323 validated reservoirs, among which 139 reservoirs have very good agreement, with a CC value >0.8. Compared to our altimetric enhanced measurements, reservoir SWA and altimetric products also show a good agreement, with CC values higher than 0.5 for 73 % of 196 validated reservoirs, among which 62 reservoirs show very good agreement, with a CC value >0.8. In addition, two similar areal datasets (Table 1), i.e., GRSAD (Zhao and Gao, 2018) and ReaLSAT (Khandelwal et al., 2022), were used for cross validation. GRSAD provides monthly SWA values for global 7246 reservoirs during 1984–2020 (updated version 3) extracted from the Landsat-based images (Pekel et al., 2016) and the correction of contamination from terrain shadows, clouds, and cloud shadows. The datasets were validated over nine reservoirs with in situ water level/storage observations and compared with the synthetic data from cloud–clear Landsat images, showing a good performance of the algorithm for repairing contaminated optical images for more reliable SWA estimates. ReaLSAT used a machine learning method (i.e., ordering-based information transfer) to process optical images for generating monthly SWA values over 681 137 global lakes/reservoirs from 1984 to 2015. It should be noted that GRSAD used the existing reservoir shapefiles from GRanD database to generate SWA values, while ReaLSAT generated new lake polygons from surface water occurrence data. Based on all the compared reservoirs available, we found that our SWA time series show good agreement to values in GRSAD (median CC value of 0.64, rBIAS = −9 %, rRMSE = 26 %, and n = 338) and ReaLSAT (median CC value = 0.68, rBIAS = −10 %, rRMSE = 22 %, and n = 47) datasets. Overall, these comparisons (Fig. 7) above suggest a good level of trustworthiness in our SWA time series.
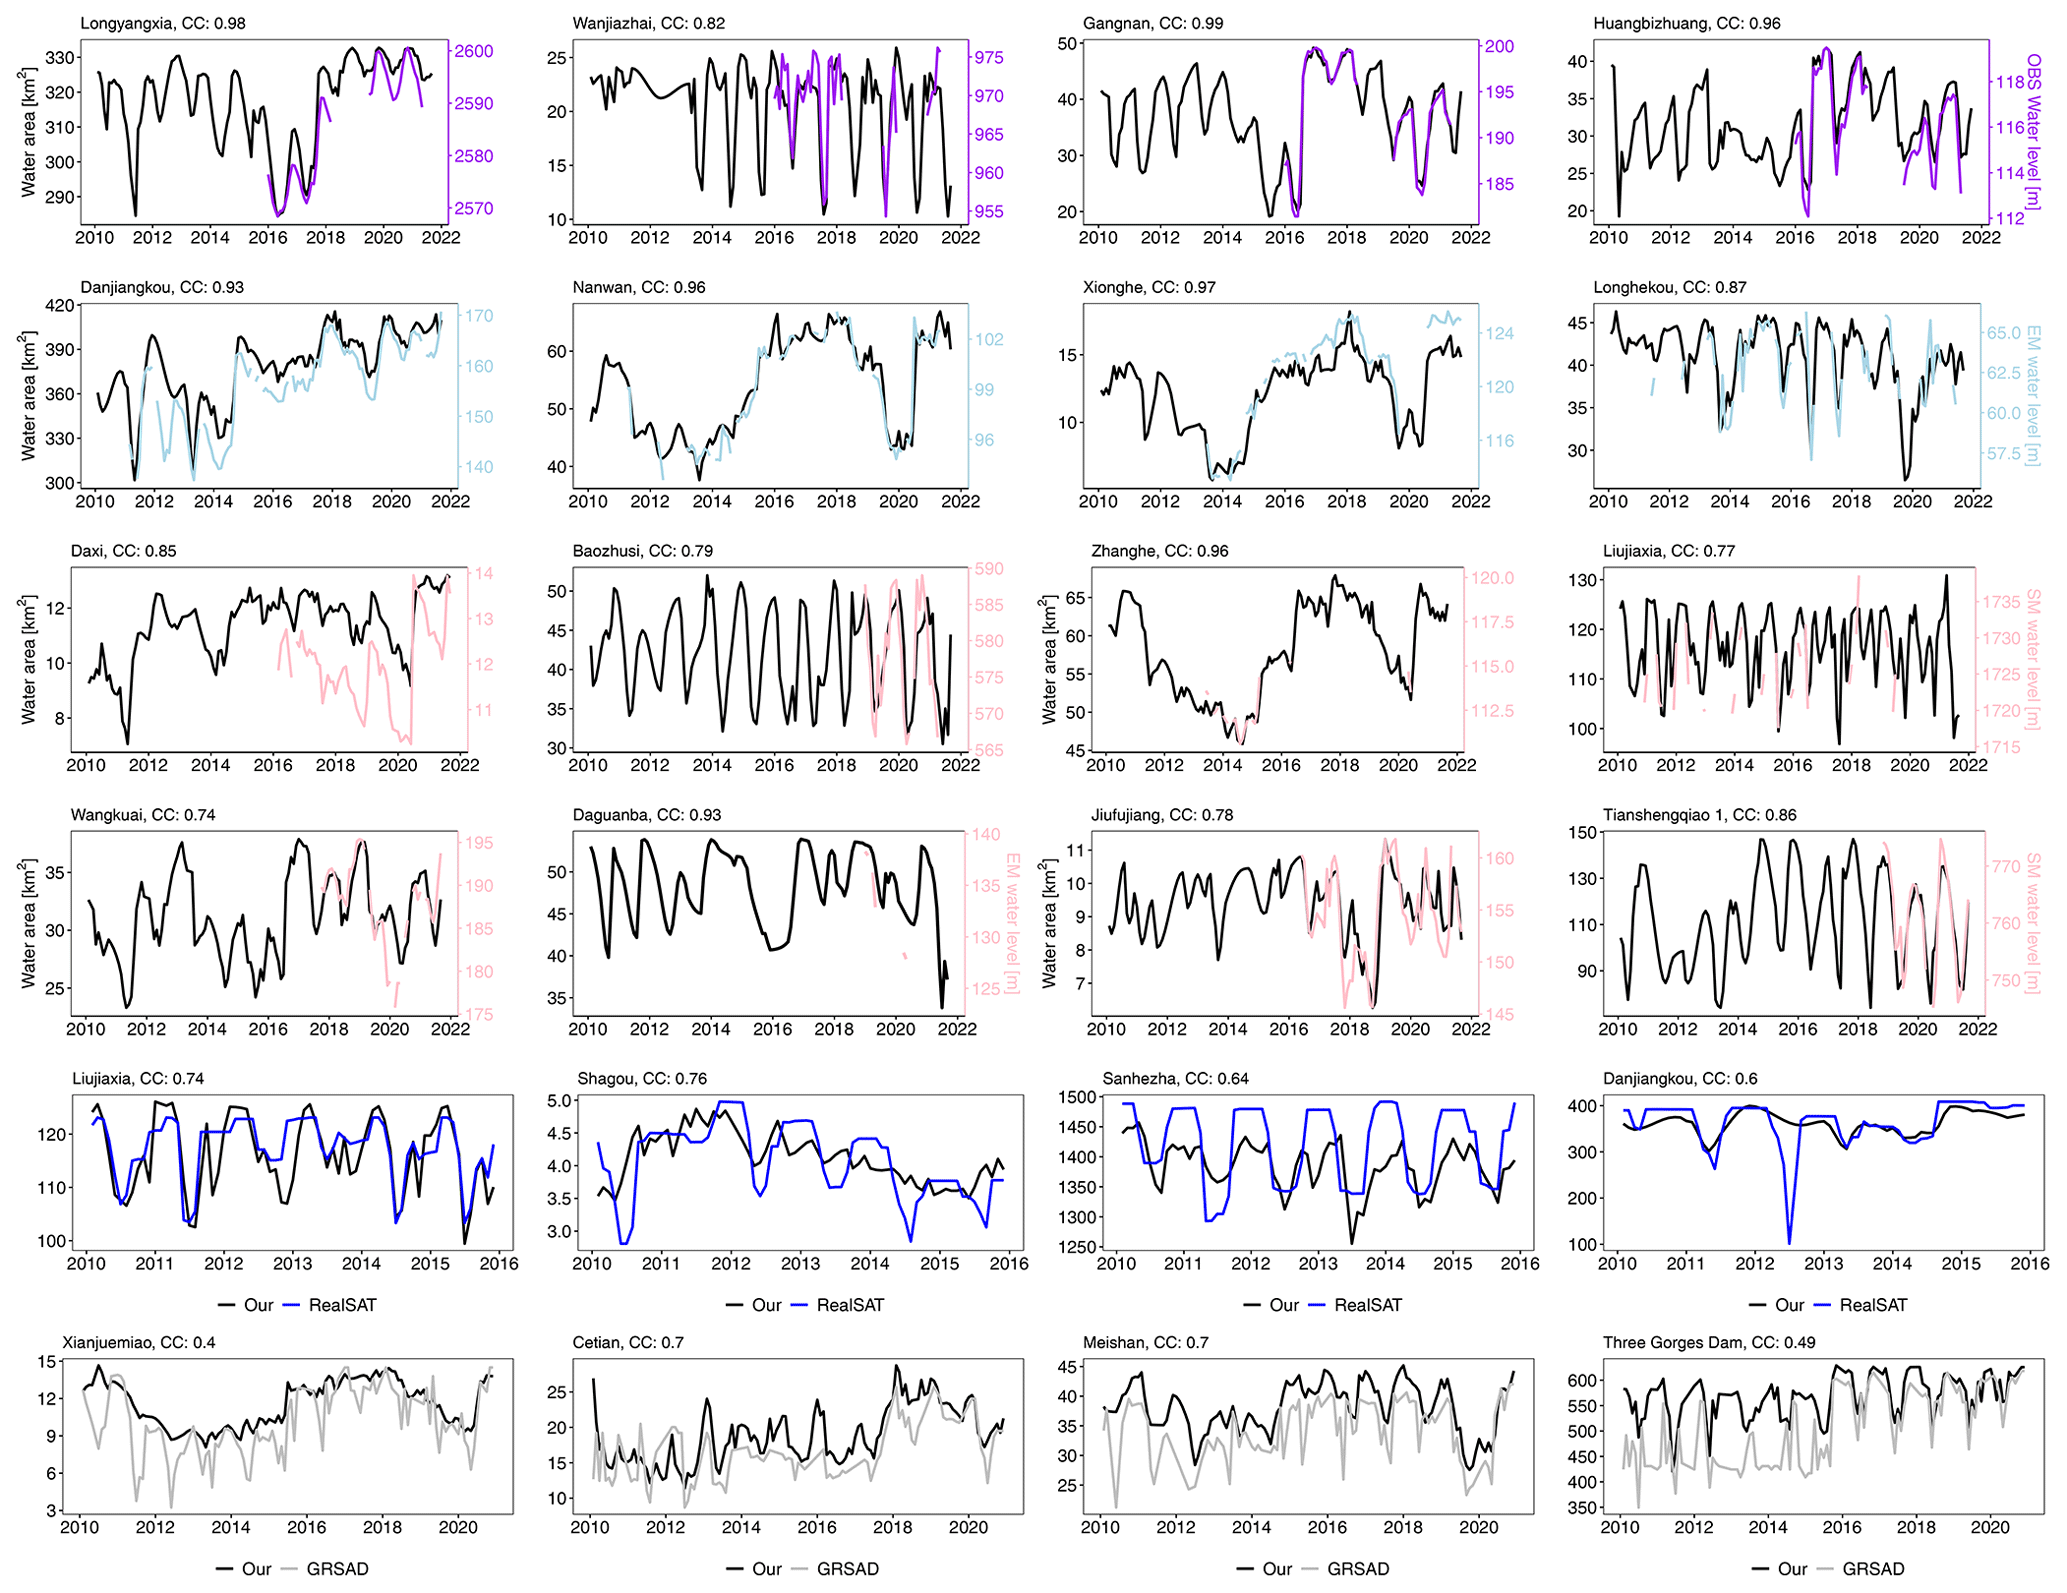
Figure 7Illustration of reservoir water area time series against in situ water level, altimetric water level from standard measurement and enhanced measurement, and GRSAD and ReaLSAT area time series at a selected sample of reservoirs with varying area size. The time series for other reservoirs are all available in the datasets.
3.4 Reservoir storage variation product
We provided monthly RWSC time series from 2010 to 2021 in two modes. One is to use WSE and SWA from satellite altimeters and images, while another one is to use satellite SWA and the area–storage model developed by DEM. After excluding reservoirs without insufficient WSE–SWA data pairs to establish the A–E relationships and conducting a visual inspection of time series, we finally retained 337 reservoirs with RWSC time series, among which 335 reservoirs have RWSC estimates derived from the first method, while 266 reservoirs have RWSC estimates derived from the DEM-based method. To evaluate the data quality, we compared with in situ storage data of 91 reservoirs and calculated three error statistical metrics (i.e., RMSE, normalized root mean square error (NRMSE), and CC). The A–E curves derived from satellite WSE and SWA data are evaluated based on their R2 values. We notice that 69 % of the reservoirs with A–E curves could be better explained by a second-order polynomial function, while 13 % and 16 % reservoirs with A–E relationships are assumed to give a power and exponential function (Fig. 8f, h). A total of 283 of 335 reservoirs (84 %) have moderate R2 values >0.5, among which 107 reservoirs show very good agreement with R2 values >0.8. Nevertheless, 15 % has relatively poor performance in terms of R2 values. Overall, our A–E curves are reliable and lay a good foundation for RWSC estimates. Across gauge comparisons of RWSC, the median statistics of CC, NRMSE, and RMSE are 0.89, 11 %, and 0.021 km3. Around 91 % of reservoirs (83 of 91) show good data quality, with a NRMSE value below 20 % and a RMSE value ranging from 0.002 to 0.31 km3. The lowest NRMSE is 4 % at the Gangnan reservoir, which displays high CC and low RMSE values. Regarding the DEM-based RWSC estimates, the results are becoming worse, with the median statistics of CC, NRMSE, and RMSE at 0.56, 20 %, and 0.03 km3. The errors can be attributed to the inaccuracy of the area–storage model developed by DEM. It should be noted that these types of RWSC estimates are served as an alternative product. Figure 8 shows examples of RWSC for some selected small, medium, and large reservoirs located in different climate zones. A closer examination in Fig. 9 seems to indicate that almost all remotely sensed RWSC estimates show similar patterns to the observations, i.e., both positive or negative, despite some large discrepancies when capturing peak values. Nonetheless, there are some differences. Some reservoirs with good NRMSE and RMSE values show poor performance in terms of the CC value, e.g., the Baiguishan reservoir (CC of 0.38, NRMSE of 16 %, and RMSE of 0.03 km3), which experiences relatively significant surface water dynamics. The moderately poor performance of 20 reservoirs (7 %) in terms of high NRMSE/RMSE and low CC values (CC <0.4) is likely associated with their poor performances from the remotely sensed WSE and SWA. Overall, we used in situ observations of 91 reservoirs as an important reference to validate RWSC dataset, thus bringing a good level of confidence in our data quality.
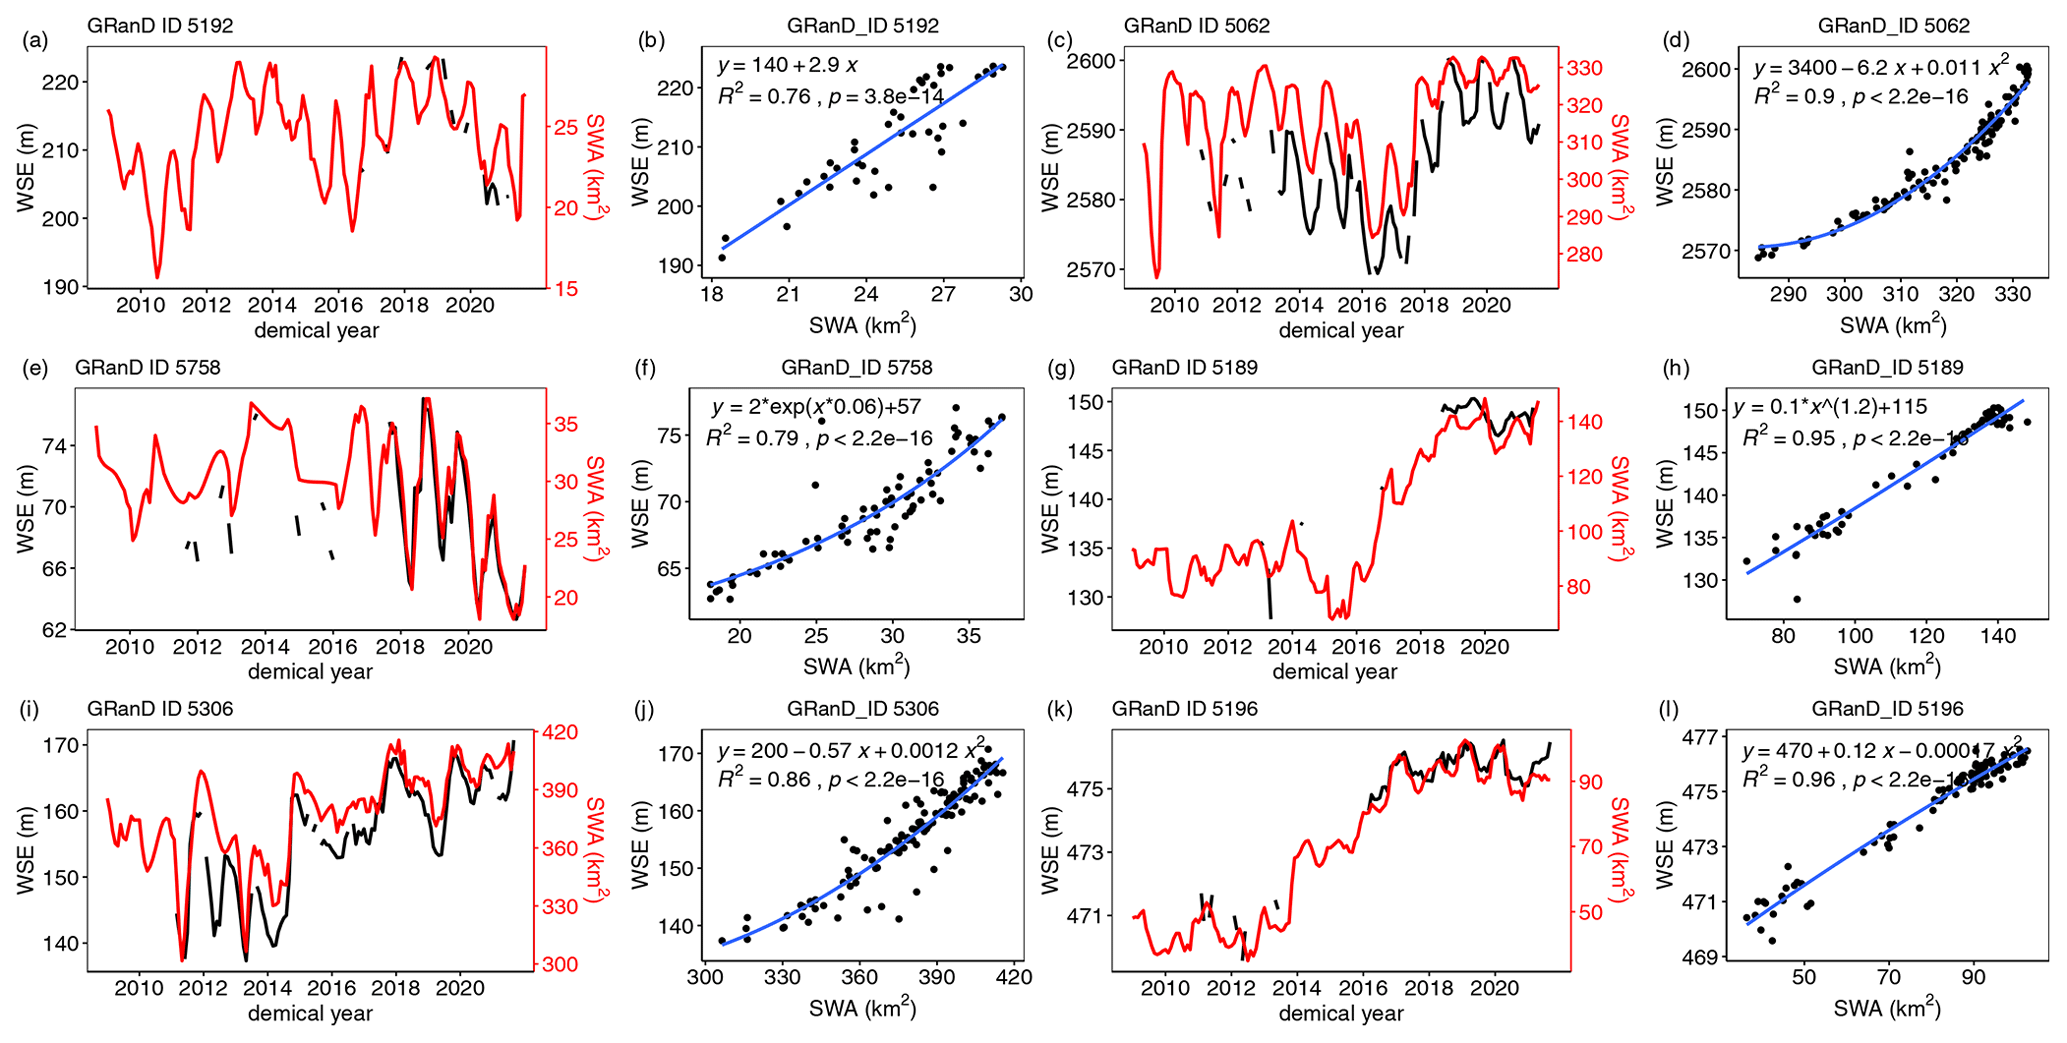
Figure 8Illustration of A–E relationships constructed by satellite WSE and SWA and their associated time series at six reservoirs. Panels (a)–(k) are the Panjiakou, Longyangxia, Baipenzhu, Miyun, Danjiangkou, and Guanting reservoirs, respectively. Note that the time series of WSE and SWA and associated established A–E relationships of the remaining reservoirs are available in our datasets.
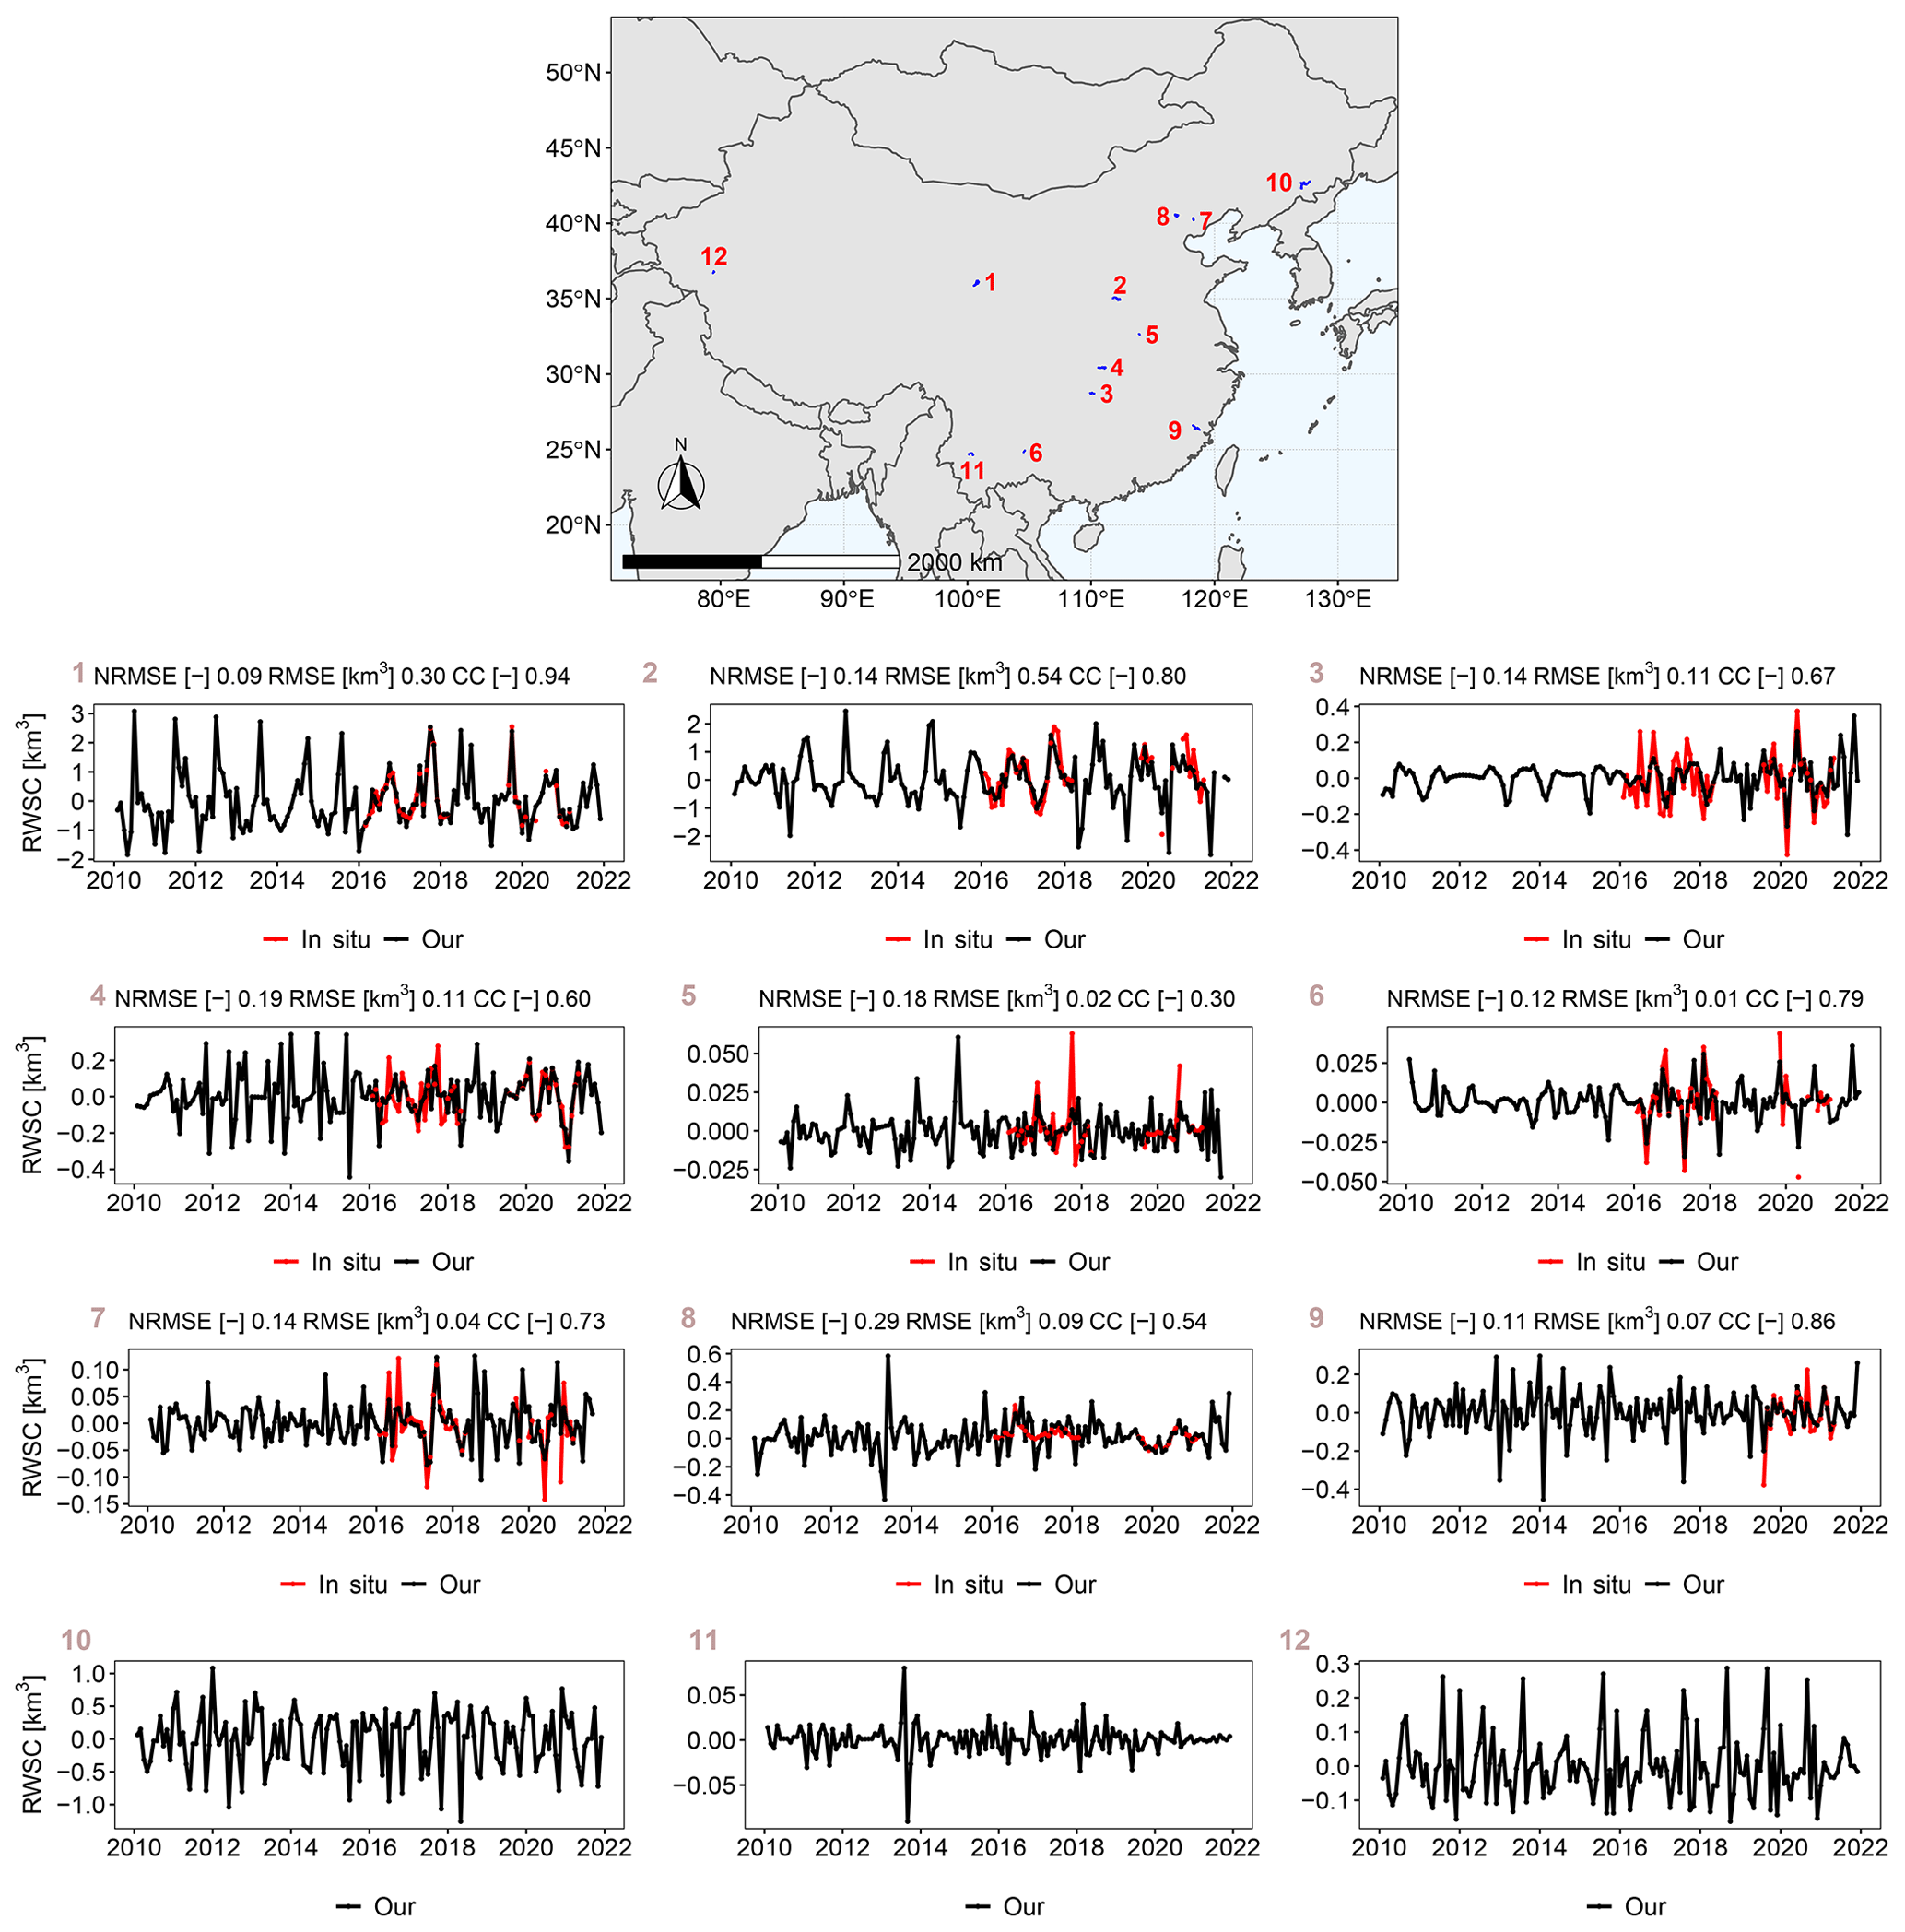
Figure 9Illustration of the time series of the remotely sensed RWSC of 12 reservoirs. NRMSE, RMSE (km3), and CC values (if available) are given at the top of each subplot. The time series of the remotely sensed RWSC of the remaining reservoirs (validated or not validated) are available in our datasets.
As explained earlier, our motivation is to develop remotely sensed reservoir datasets that can be applied as constraints to calibrate models or be directly used for reservoir studies (Yigzaw et al., 2018a; Shin et al., 2019, 2020). One example of the most interesting scientific work that can be done with our datasets is to estimate how hydrographs in China have changed because of reservoir regulation. In order to do that, we need to combine inflow modeling with reservoir storage changes to estimate reservoir release. Figure 10 demonstrates the flowchart of combining the process-based models or lumped models with our remotely sensed RWSC datasets to achieve this goal. Recent studies started adopting this framework to assess the effect of dams and reservoirs on streamflow regulation, and/or downstream flood inundation (Gutenson et al., 2020; Zhong et al., 2020; Tavakoly et al., 2021). Here, following the normal but simple practices (Bonnema and Hossain 2019; Han et al., 2020), we estimate reservoir release using our remotely sensed RWSC dataset and inflow simulated by a calibrated lumped hydrological model (i.e., GR4J, Génie Rural à 4 paramètres Journalier model), to demonstrate the potential of our datasets to help achieve this goal (Fig. 10). This experiment is carried out at the Ankang reservoir, which has a water capacity of 2.58 km3 and a water extent of 58 km2, located in the Han River. The basin-averaged precipitation from high-quality Global Precipitation Measurement (GPM) Final products and potential evaporation are used to run the model. The Oudin approach is used to calculate the potential evaporation and requires temperature from ERA5-Land products for calculation (Oudin et al., 2005). The model is precalibrated based on 10-year historical reservoir inflows (2001–2007 for calibration and 2008–2010 for validation). The Shuffled Complex Evolution (SCE-UA) is employed to calibrate the hydrological model through maximizing the Kling–Gupta efficiency (KGE) value. Then, we simulate the reservoir inflow during 2010–2020 in combination with our RWSC for the release estimates. The values of KGE and streamflow hydrographs reveal that the model performs well with KGE >0.68 during both calibration and validation periods. The simulated releases show good agreements to the observations, with KGE exceeding 0.90 and NRMSE below 0.04. We compare the reservoir inflow and release simulations and notice that flow regimes at the Ankang reservoir have been substantially altered (Fig. 11f). In conclusion, our RWSC dataset can be applied to the reservoir release simulation, achieving satisfactory streamflow simulations. However, some limitations can be seen in our case study. First, reservoir evaporation and precipitation are neglected for the tested reservoir with humid climate conditions. We suggest that these variables should be considered using high-quality satellite datasets such as evapotranspiration (ET) products or model simulations. Second, the case study cannot provide a big picture of reservoir regulations on streamflow at national scale. Similar studies should be done at the remaining reservoirs to achieve this goal. Acknowledging such limitations, we argue that the datasets could help achieve the blueprint application by introducing the key components (e.g., RWSC) of reservoirs at a national scale.

Figure 10Schematic representation of integration between models and our datasets for reservoir release application. Normally, streamflow at the node (i.e., the dam) should be replaced with regulated flow (i.e., reservoir outflow) and routed downstream by a routing model such as the RAPID model. The remotely sensed RWSC and inflow simulated by hydrological models are introduced to the reservoir model, i.e., the mass balance equation.
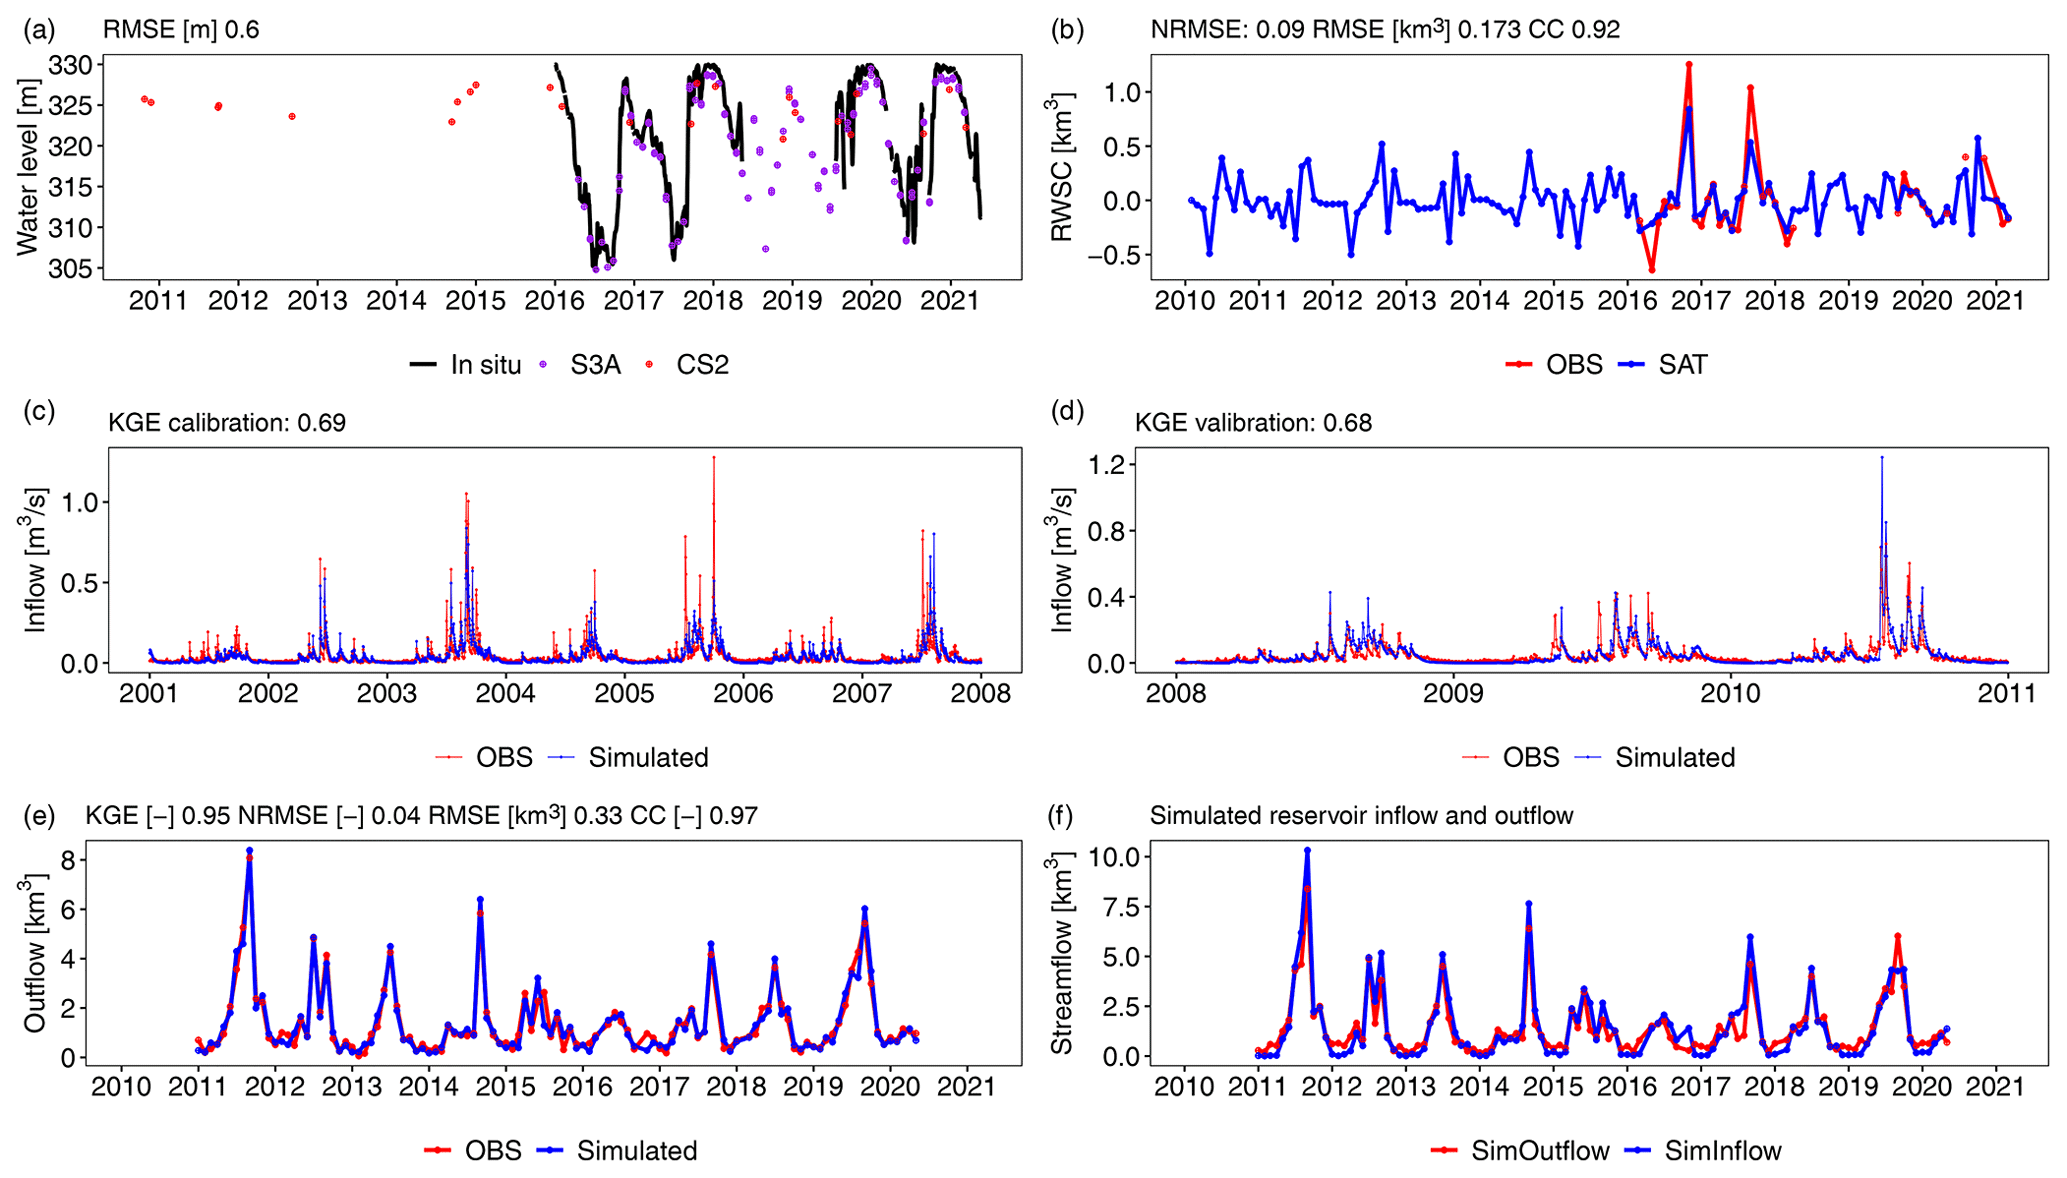
Figure 11Case study at the Ankang reservoir. Panels (a) and (b) are the evaluation of the remotely sensed WSE and RWSC. Panels (c) and (d) denote the streamflow hydrographs simulated by GR4J model during calibration and validation periods. Panel (e) represents the comparison of model-simulated outflows and gauged records. Panel (f) shows streamflow regulation by reservoirs. Note that only historical inflow records before 2010 are available in this study.
The datasets can benefit other applications across multiple disciplines in addition to the areas described above. We highlight three areas for future applications. First, the RWSC can be used to develop a reservoir storage forecast system (Tiwari and Mishra, 2019) at 1–3-month lead that can be valuable for water resource management in China. Second, the datasets can be joined with hydrological and climate datasets to synthesize the changes in water quantity and quality. For example, the datasets could be combined with carbon dioxide emissions from the China Carbon Monitor (https://cn.carbonmonitor.org/, last access: 15 October 2022) to address questions that how changes in reservoir storage may co-vary with changes in carbon dioxide emissions. Third, the datasets can be extended to include other countries and thousands of small reservoirs in the context of booming satellites such as the Surface Water and Ocean Topography mission that detects smaller waterbodies (Biancamaria et al., 2016).
All the generated remotely sensed reservoir datasets are archived and available at https://doi.org/10.5281/zenodo.7251283 (Shen et al., 2021). They are distributed with a CC-BY license. The authors acknowledge the following data centers for providing original data:
-
CryoSat-2 data for the baseline C level 1b dataset from ESA (https://science-pds.cryosat.esa.int/, last access: 15 October 2022)
-
SARAL/AltiKa and Jason-3 data from CNES AVISO+ (ftp://avisoftp.cnes.fr/AVISO/pub/, last access: 15 October 2022)
-
Reservoir and dam data from the GRanD database (http://globaldamwatch.org/grand/, last access: 15 October 2022)
-
Sentinel-3 level 2 data from Copernicus Open-Access Hub (https://scihub.copernicus.eu/dhus/, last access: 15 October 2022)
-
Daily water level and storage data for 93 reservoirs from the local watershed agency (http://113.57.190.228:8001/web/Report/BigMSKReport, last access: 15 October 2022) and National Hydrological Information Centre (http://xxfb.mwr.cn/index.html, last access: 15 October 2022)
-
ICESat-2 ALT08 products (https://nsidc.org/data/atl08/, last access: 15 October 2022).
In this study, we utilize six satellite altimetry missions from SARAL/AltiKa, Sentinel-3 A/B, CroySat-2, Jason-3, and ICESat-2, in combination with water area data from Landsat and Sentinel-2 images, to develop high-resolution reservoir datasets of WSE, SWA, and RWSC. The resulting datasets include 338 reservoirs with a total of 470.6 km3 water storage accounting for 50 % reservoir capacity in China. The remotely sensed results are validated against gauged measurements of 93 reservoirs. (1) The comparisons indicate the relatively high reliability and accuracy of monthly RWSC estimations, with 91 % reservoirs (83 of 91) having good RMSE values from 0.002 to 0.31 km3 and NRMSE values <20 %. For RWSC, the median statistics of CC, NRMSE, and RMSE are 0.89, 11 %, and 0.021 km3. (2) Satisfactory results and good agreement can be found between the WSE retracked by six altimeters and gauges. Individually, the percentages of reservoirs having good data quality with RMSE values below 0.3 m, moderate RMSE values from 0.3 to 1.0 m, and relatively poor RMSE values over 1.0 m for each altimeter are 50 %, 29 %, and 21 % (S3A validated in 34 reservoirs), 48 %, 39 %, and 13 % (S3B 25), 38 %, 37 %, and 25 % (SARAL/AltiKa 9), 23 %, 54 %, and 23 % (CS2 30), 55 %, 27 %, and 18 % (Jason-3 11), and 73 %, 8 %, and 19 % (ICESat-2 26), respectively. After merging WSE observations from multiple sources, if available, a total of 73 of 74 (96 %) reservoirs have good and moderate data quality with a RMSE value below 1.0 m, among which 42 reservoirs show good RMSE values below 0.6 m, and 17 reservoirs show very good RMSE values <0.3 m. By taking advantage of four missions, we are able to densify WSE observations in most cases. Nonetheless, for reservoirs accounting for the remaining 50 % water storage capacity, current satellite altimetry missions are not able deliver enough useful observations or detect these reservoirs given by their sparse altimetric ground tracks and are, therefore, not included in our products. Developing more general algorithms with better performance regardless of the reservoir's attributes and using satellite altimetric data with a higher temporal resolution (e.g., Surface Water and Ocean Topography mission; Biancamaria et al., 2016) will be the subject of future studies. Overall, our study fills such a data gap by incorporating various satellites into a comprehensive reservoir dataset at a national scale. We envision that this dataset can be immediately applied to some scientific areas, as described in Sect. 4, and can provides strong support for many aspects such as hydrological processes and water management studies.
Table A1Providers of water level (a), area (b), and storage variation (c) time series for Chinese reservoirs.
* Last access: 15 October 2022.
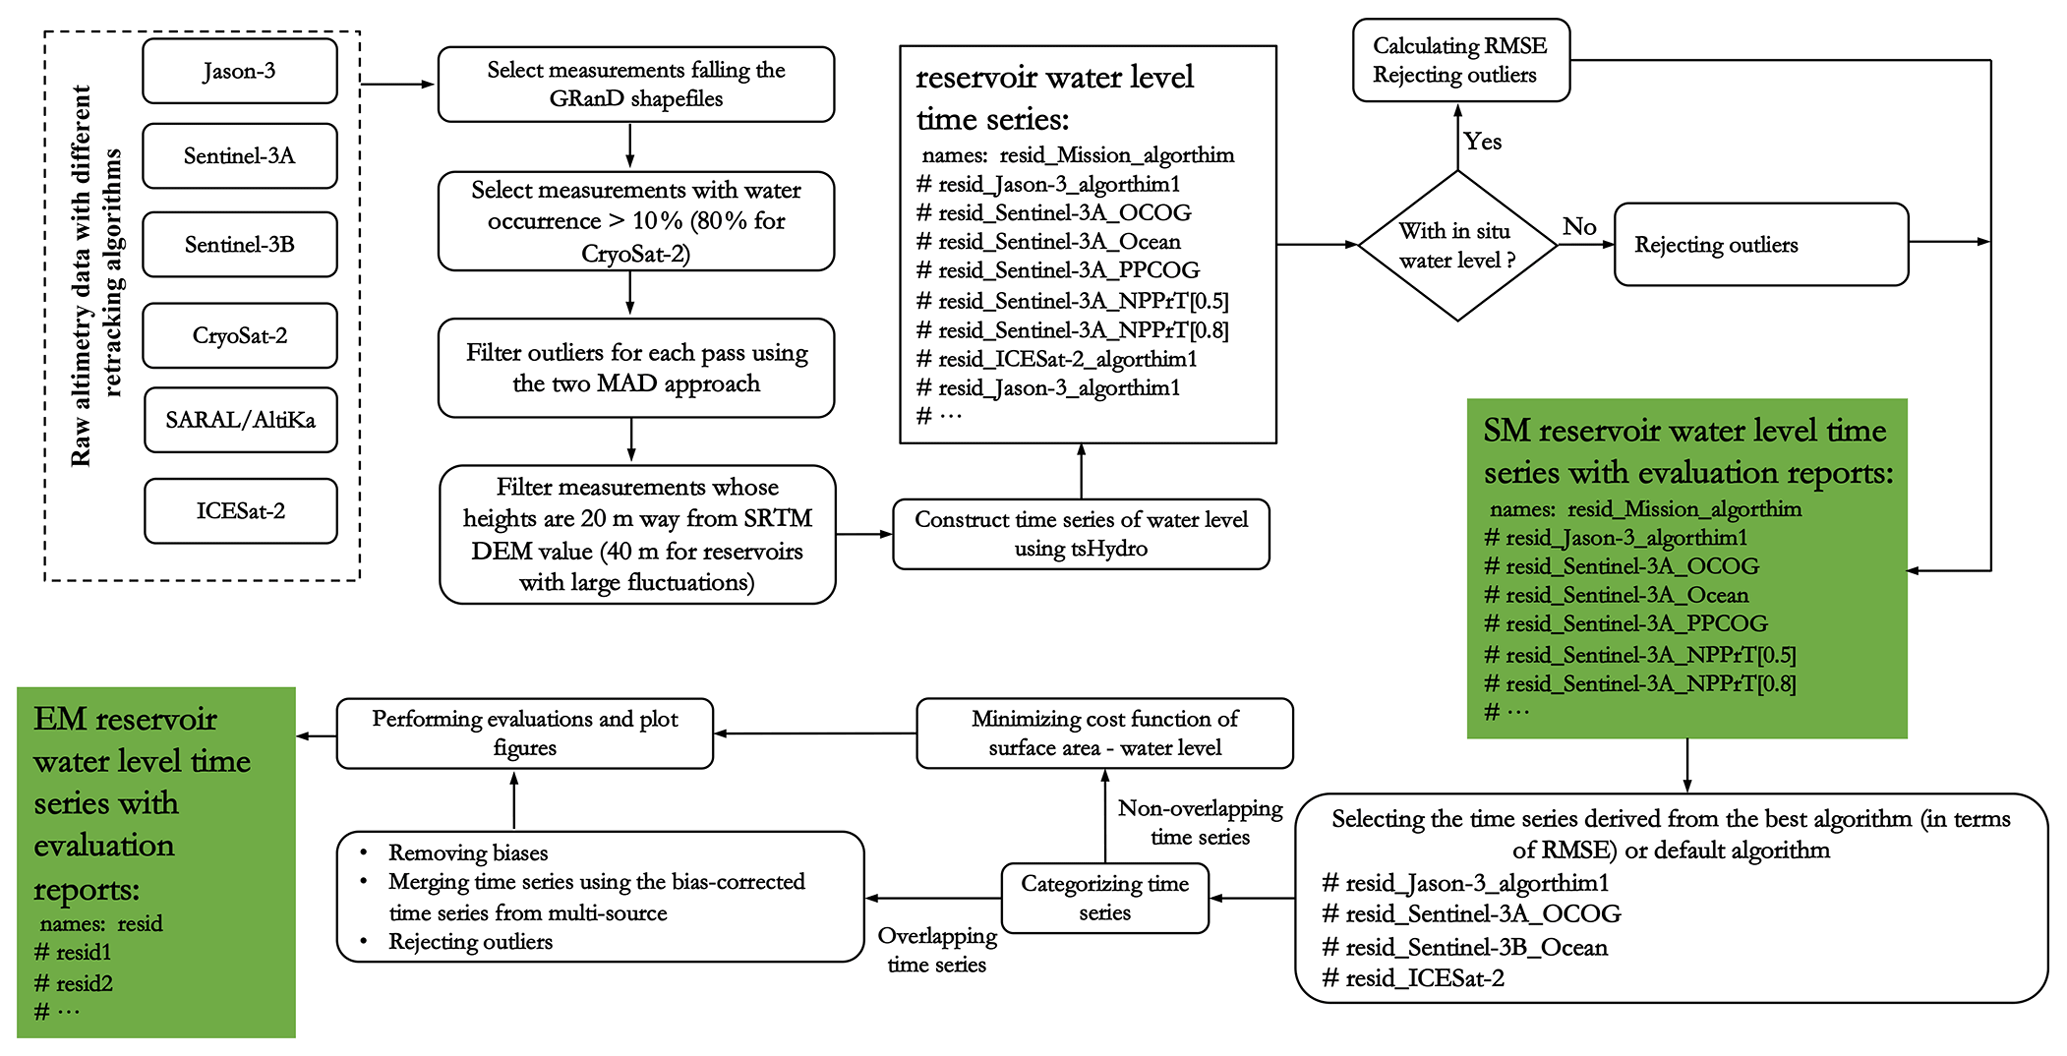
Figure B1Flowchart of obtaining SM (standard-measurement) and EM (enhanced-measurement) altimetric water level time series over reservoirs.
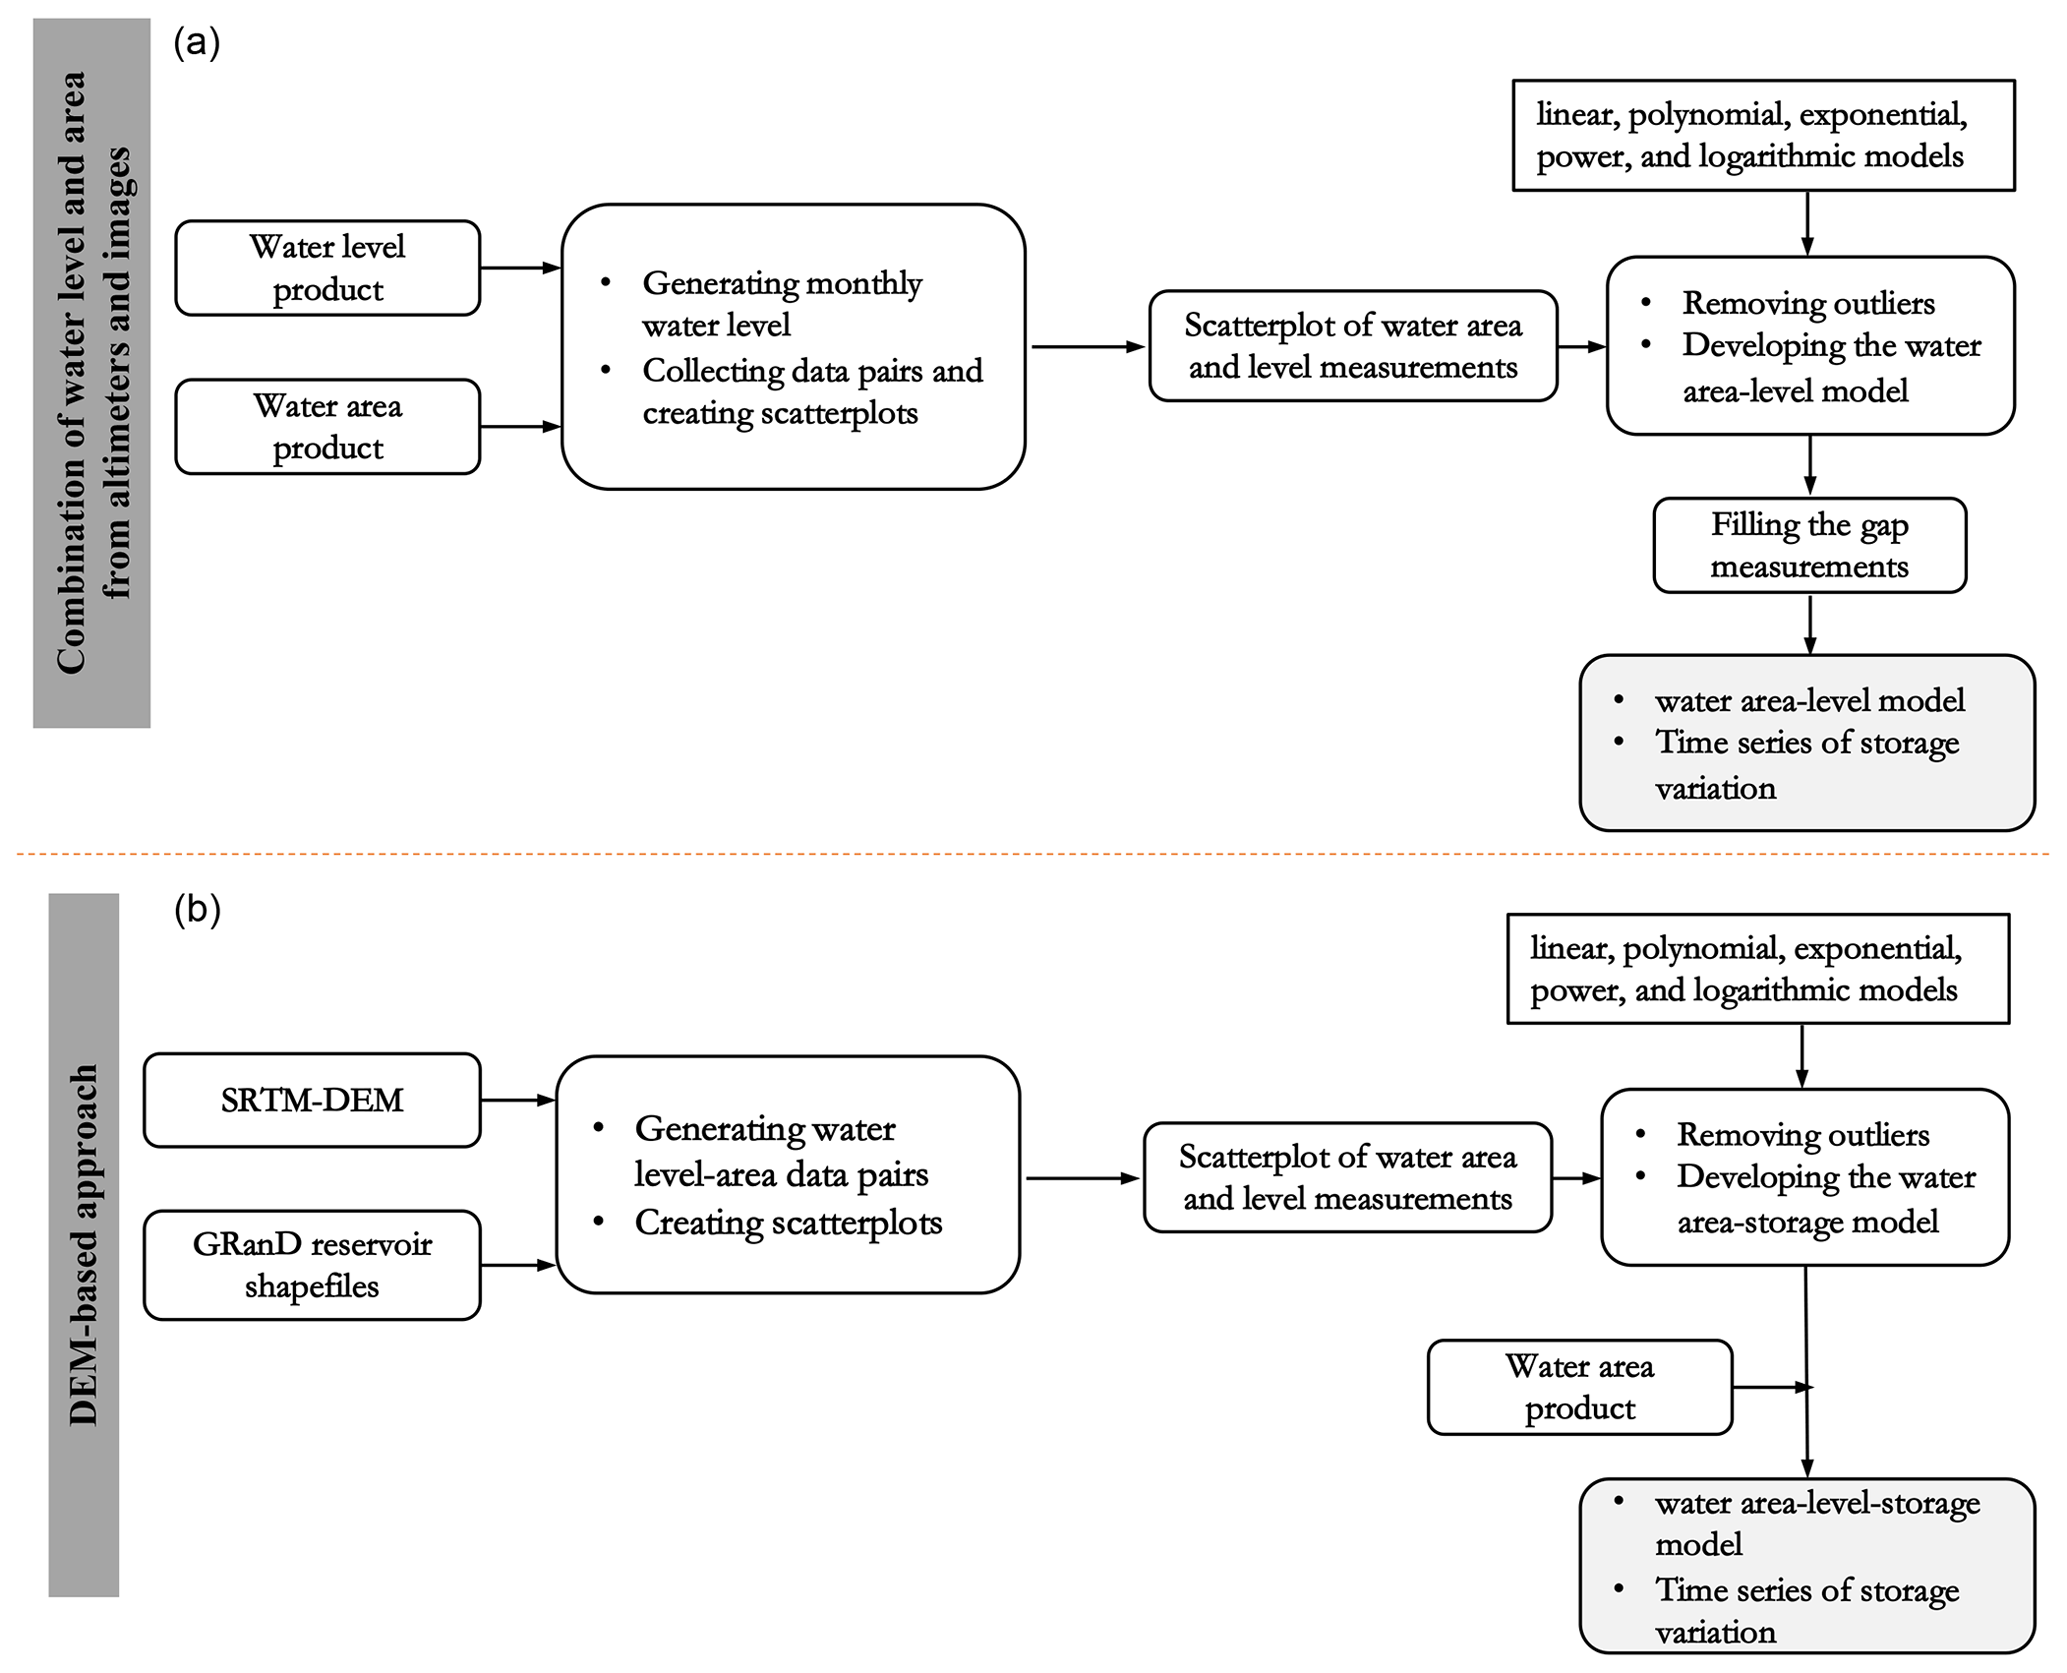
Figure B2Flowchart of obtaining water storage variation using reservoir water area from satellite imagery and water level from satellite altimetry (a). Flowchart of obtaining water storage variation using surface water area from satellite imagery and SRTM DEM (b).
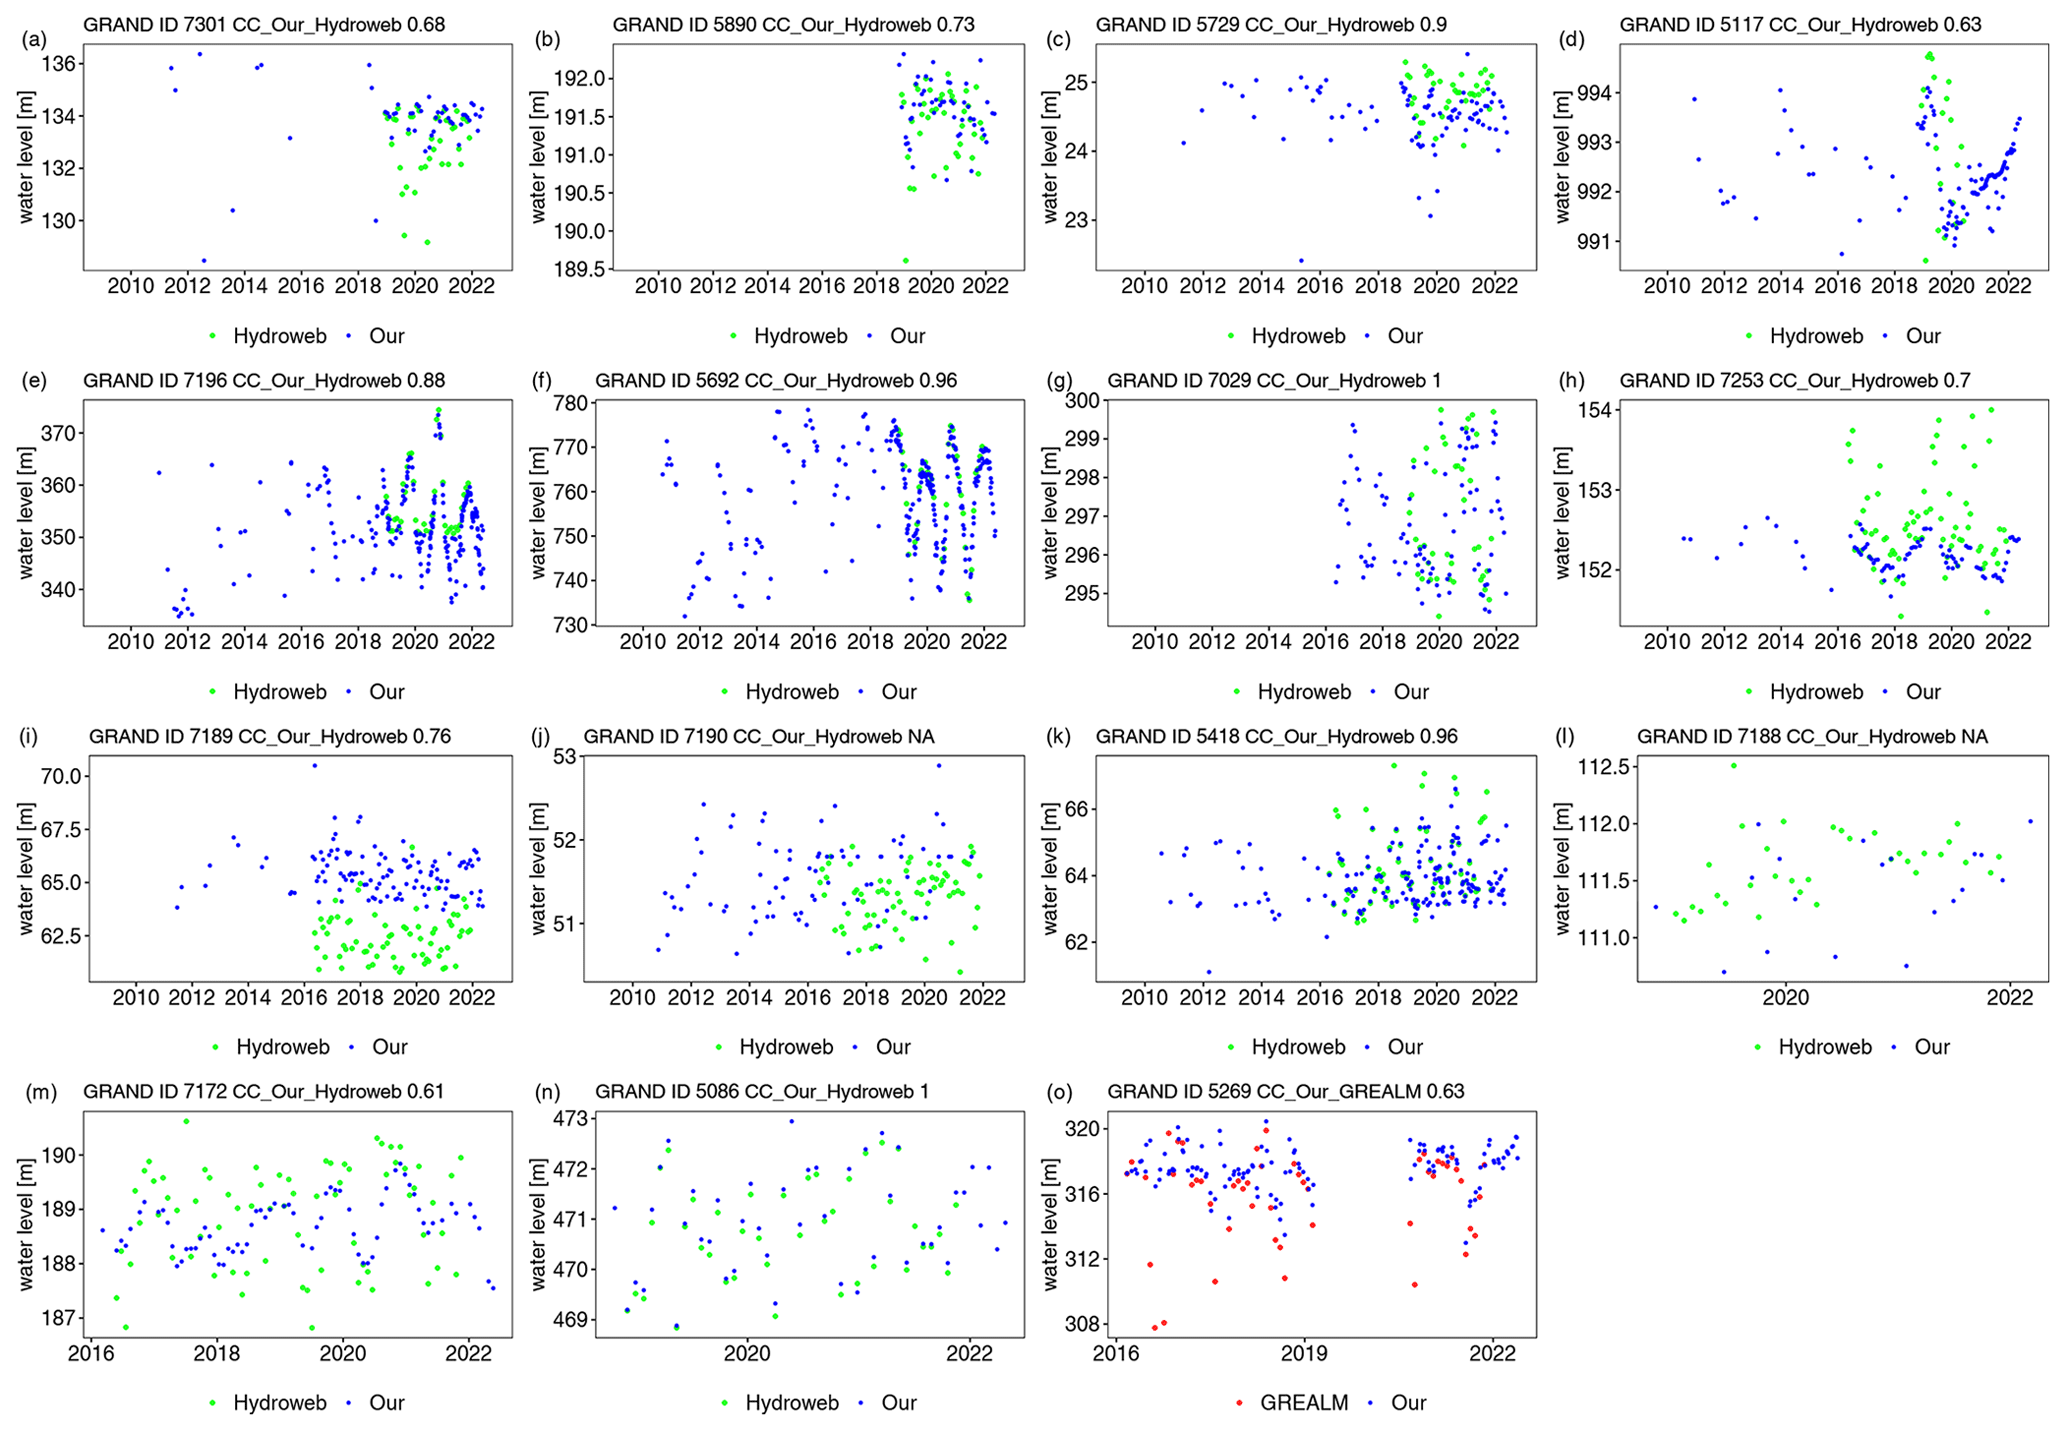
Figure C1DAHITI is plotted in black, G-REALM in red, Hydroweb in green, our dataset in blue, and in situ records with a black line. RMSE values are given when in situ observations are available; otherwise, CC values are given at the top of each subplot.
The supplement related to this article is available online at: https://doi.org/10.5194/essd-14-5671-2022-supplement.
YS and DL initiated the investigation. YS, DL, LJ, and JY designed the research. YS processed the data and created the figures. KN initially extracted and processed the altimetry data. JL initially extracted data from Hydroweb. PBG reviewed the paper. YS prepared the paper, with contributions from all co-authors.
The contact author has declared that none of the authors has any competing interests.
Publisher's note: Copernicus Publications remains neutral with regard to jurisdictional claims in published maps and institutional affiliations.
This research has been supported by the National Key Research and Development Project of China (grant no. 2022YFC3202803), the National Natural Science Foundation of China (grant nos. 51879194 and 51579183), and the Danida Fellowship Centre (grant no. 18-M01-DTU).
This paper was edited by David Carlson and reviewed by Stefano Galelli and two anonymous referees.
Avisse, N., Tilmant, A., Müller, M. F., and Zhang, H.: Monitoring small reservoirs' storage with satellite remote sensing in inaccessible areas, Hydrol. Earth Syst. Sci., 21, 6445–6459, https://doi.org/10.5194/hess-21-6445-2017, 2017.
Biancamaria, S., Lettenmaier, D. P., and Pavelsky, T. M.: The SWOT mission and its capabilities for land hydrology, Surv. Geophys., 37, 307–337, https://doi.org/10.1007/s10712-015-9346-y, 2016.
Biancamaria, S., Schaedele, T., Blumstein, D., Frappart, F., Boy, F., DesjonqueÌres, J. D., Pottier, C., Blarel, F., and Niño, F.: Validation of Jason-3 tracking modes over French rivers, Remote Sens. Environ., 209, 77–89, https://doi.org/10.1016/j.rse.2018.02.037, 2018.
Birkett, C., Reynolds, C., Beckley, B., and Doorn, B.: From research to operations: the USDA global reservoir and lake monitor, in: Coastal Altimetry, Springer, Berlin, Heidelberg, 19–50, https://doi.org/10.1007/978-3-642-12796-0_2, 2011.
Birkett, C., Ricko, M., and Yang, X.: PRESWOT_HYDRO_L_GREALM_LAKE_HEIGHT_V2. Ver. 2. PO.DAAC, CA, USA [data set], https://doi.org/10.5067/UCLRS-GREV2, 2019.
Bonnefond, P., Verron, J., Aublanc, J., Babu, K. N., Bergé-Nguyen, M., Cancet, M., Chaudhary, A., Crétaux, J.-F., Frappart, F., Haines, B. J., Laurain, O., Ollivier, A., Poisson, J.-C., Prandi, P., Sharma, R., Thibaut, P., and Watson, C.: The Benefits of the Ka-Band as Evidenced from the SARAL/AltiKa Altimetric Mission: Quality Assessment and Unique Characteristics of AltiKa Data, Remote Sens., 10, 83, https://doi.org/10.3390/rs10010083, 2018.
Bonnema, M. and Hossain, F.: Assessing the potential of the Surface Water and Ocean Topography Mission for reservoir monitoring in the Mekong River basin, Water Resour. Res., 55, 444–461, https://doi.org/10.1029/2018WR023743, 2019.
Bonnema, M., Sikder, S., Miao, Y., Chen, X., Hossain, F., Pervin, I. A., Mahbubur Rahman, S. M., and Lee, H.: Understanding satellite-based monthly-to-seasonal reservoir outflow estimation as a function of hydrologic controls, Water Resour. Res., 52, 4095–4115, https://doi.org/10.1002/2015WR017830, 2016.
Boulange, J., Hanasaki, N., Yamazaki, D., and Pokhrel, Y.: Role of dams in reducing global flood exposure under climate change, Nat. Commun., 12, 417, https://doi.org/10.1038/s41467-020-20704-0, 2021.
Buccola, N. L., Risley, J. C., and Rounds, S. A.: Simulating future water temperatures in the north Santiam River, Oregon, J. Hydrol., 535, 318–330, https://doi.org/10.1016/j.jhydrol.2016.01.062, 2016.
Busker, T., de Roo, A., Gelati, E., Schwatke, C., Adamovic, M., Bisselink, B., Pekel, J.-F., and Cottam, A.: A global lake and reservoir volume analysis using a surface water dataset and satellite altimetry, Hydrol. Earth Syst. Sci., 23, 669–690, https://doi.org/10.5194/hess-23-669-2019, 2019.
Chaudhari, S., Felfelani, F., Shin, S., and Pokhrel, Y.: Climate and anthropogenic contributions to the desiccation of the second largest saline lake in the twentieth century, J. Hydrol., 560, 342–353, https://doi.org/10.1016/j.jhydrol.2018.03.034, 2018.
CNES: SARAL/AltiKa Products Handbook, https://www.aviso.altimetry.fr/fileadmin/documents/data/tools/SARAL_Altika_products_handbook.pdf (last access: 17 December 2021), 2016.
Crétaux, J.-F., Jelinski, W., Calmant, S., Kouraev, A., Vuglinski, V., Bergé-Nguyen, M., Gennero, M.-C., Nino, F., Del Rio, R. A., Cazenave, A., and Maisongrande, P.: SOLS: a lake database to monitor in the Near Real Time water level and storage variations from remote sensing data, Adv. Space Res., 47, 1497–1507, https://doi.org/10.1016/j.asr.2011.01.004, 2011.
Dang, T. D., Chowdhury, A. F. M. K., and Galelli, S.: On the representation of water reservoir storage and operations in large-scale hydrological models: implications on model parameterization and climate change impact assessments, Hydrol. Earth Syst. Sci., 24, 397–416, https://doi.org/10.5194/hess-24-397-2020, 2020.
Dinardo, S., Fenoglio-Marc, L., Buchhaupt, C., Becker, M., Scharroo, R., Fernandes, M. J., and Benveniste, J.: Coastal SAR and PLRM altimetry in German Bight and West Baltic Sea, Adv. Space Res., 62, 1371–1404, https://doi.org/10.1016/j.asr.2017.12.018, 2018.
Donchyts, G., Baart, F., Winsemius, H., Gorelick, N., Kwadijk, J., and van de Giesen, N.: Earth's surface water change over the past 30 years, Nat. Clim. Change, 6, 810–813, https://doi.org/10.1038/nclimate3111, 2016.
Donchyts, G., Winsemius, H., Baart, F., Dahm, R., Schellekens, J., Gorelick, N., Iceland, C., and Schmeier, S.: High-resolution surface water dynamics in Earth's small and medium-sized reservoirs, Sci. Rep., 12, 13776, https://doi.org/10.1038/s41598-022-17074-6, 2022a.
Donchyts, G., Winsemius, H., Baart, F., Dahm, R., Schellekens, J., Gorelick, N., et al.: Supplementary materials for the High-resolution surface water dynamics in Earth’s small and medium-sized reservoirs, figshare [data set], https://doi.org/10.6084/m9.figshare.20359860.v1, 2022b.
Donlon, C., Berruti, B., Buongiorno, A., Ferreira, M.-H., Féménias, P., Frerick, J., Goryl, P., Klein, U., Laur, H., Mavrocordatos, C., Nieke, J., Rebhan, H., Seitz, B., Stroede, J., and Sciarra, R.: The Global Monitoring for Environment and Security (GMES) Sentinel-3 mission, Remote Sens. Environ., 120, 37–57, https://doi.org/10.1016/j.rse.2011.07.024, 2012.
Duan, Z. and Bastiaanssen, W. G. M.: Estimating water volume variations in lakes and reservoirs from four operational satellite altimetry databases and satellite imagery data, Remote Sens. Environ., 134, 403–416, https://doi.org/10.1016/j.rse.2013.03.010, 2013.
European Space Agency, Mullar Space Science Laboratory: CryoSat-2 Product Handbook, https://earth.esa.int/documents/10174/125272/CryoSat-Baseline-D-Product-Handbook (last access: 17 December 2021), 2012.
Fang, Y., Li, H., Wan, W., Zhu, S., Wang, Z., Hong, Y., and Wang, H.: Assessment of water storage change in China's lakes and reservoirs over the last three decades, Remote Sens., 11, 1467, https://doi.org/10.3390/rs11121467, 2019.
Gao, H. and Zhao, G.: Global Reservoir Surface Area Dataset (GRSAD), V3, Texas Data Repository [data set], https://doi.org/10.18738/T8/DF80WG, 2019.
Gao, H., Birkett, C., and Lettenmaier, D. P.: Global monitoring of large reservoir storage from satellite remote sensing, Water Resour. Res., 48, W09504, https://doi.org/10.1029/2012WR012063, 2012.
Getirana, A., Jung, H. C., and Tseng, K.-H.: Deriving three dimensional reservoir bathymetry from multi-satellite datasets, Remote Sens. Environ., 217, 366–374, https://doi.org/10.1016/j.rse.2018.08.030, 2018.
Goumehei, E., Tolpekin, V., Stein, A., and Yan, W.: Surface water body detection in polarimetric SAR data using contextual complex wishart classification, Water Resour. Res., 55, 7047–7059, https://doi.org/10.1029/2019WR025192, 2019.
Gutenson, J. L., Tavakoly, A. A., Wahl, M. D., and Follum, M. L.: Comparison of generalized non-data-driven lake and reservoir routing models for global-scale hydrologic forecasting of reservoir outflow at diurnal time steps, Hydrol. Earth Syst. Sci., 24, 2711–2729, https://doi.org/10.5194/hess-24-2711-2020, 2020.
Han, Z., Long, D., Huang, Q., Li, X., Zhao, F., and Wang, J.: Improving reservoir outflow estimation for ungauged basins using satellite observations and a hydrological model, Water Resour. Res., 56, e2020WR027590, https://doi.org/10.1029/2020WR027590, 2020.
Hou, J., van Dijk, A. I. J. M., Beck, H. E., Renzullo, L. J., and Wada, Y.: Remotely sensed reservoir water storage dynamics (1984–2015) and the influence of climate variability and management at a global scale, Hydrol. Earth Syst. Sci., 26, 3785–3803, https://doi.org/10.5194/hess-26-3785-2022, 2022.
Intralawan, A., Wood, D., Frankel, R., Costanza, R., and Kubiszewski, I.: Tradeoff analysis between electricity generation and ecosystem services in the lower Mekong Basin, Ecosyst. Serv., 30, 27–35, https://doi.org/10.1016/j.ecoser.2018.01.007, 2018.
Jain, M., Andersen, O. B., Dall, J., and Stenseng, L.: Sea surface height determination in the Arctic using Cryosat-2 SAR data from primary peak empirical retrackers, Adv. Space Res., 55, 40–50, https://doi.org/10.1016/j.asr.2014.09.006, 2015.
Jiang, L., Andersen, O. B., Nielsen, K., Zhang, G., and Bauer-Gottwein, P.: Influence of local geoid variation on water surface elevation estimates derived from multi-mission altimetry for Lake Namco, Remote Sens. Environ., 221, 65–79, https://doi.org/10.1016/j.rse.2018.11.004, 2019.
Jiang, L., Nielsen, K., Dinardo, S., Andersen, O. B., and Bauer-Gottwein, P.: Evaluation of Sentinel-3 SRAL SAR altimetry over Chinese rivers, Remote Sens. Environ., 237, 111546, https://doi.org/10.1016/j.rse.2019.111546, 2020.
Khandelwal, A. and Kumar, V.: PRESWOT_HYDRO_L3_LAKE_RESEVOIR_AREA_V2, Ver. 2, PO.DAAC, CA, USA [data set], https://doi.org/10.5067/UCLRS-AREV2, 2019.
Khandelwal, A., Karpatne, A., Marlier, M. E., Kim, J., Lettenmaier, D. P., and Kumar, V.: An approach for global monitoring of surface water extent variations in reservoirs using MODIS data, Remote Sens. Environ., 202, 113–128, https://doi.org/10.1016/j.rse.2017.05.039, 2017.
Khandelwal, A., Karpatne, A., Ravirathinam, P. Ghosh, R., Wei. Z., Dugan, H. A., Hanson, P. C., and Kumar, V.: ReaLSAT, a global dataset of reservoir and lake surface area variations, Sci. Data, 9, 356, https://doi.org/10.1038/s41597-022-01449-5, 2022a.
Khandelwal, A., Karpatne, A., Wei, Z., Ghosh, R., Dugan, H., Hanson, P., and Kumar, V.: ReaLSAT, a global dataset of reservoir and lake surface area variations (1.4), Zenodo [data set], https://doi.org/10.5281/zenodo.6468209, 2022b.
Klein, I., Mayr, S., Gessner, U., Hirner, A., and Kuenzer, C.: Water and hydropower reservoirs: High temporal resolution time series derived from MODIS data to characterize seasonality and variability, Remote Sens. Environ., 253, 112207, https://doi.org/10.1016/j.rse.2020.112207, 2021.
Lehner, B., Liermann, C. R., Revenga, C., Vörösmarty, C., Fekete, B., Crouzet, P., Döll, P., Endejan, M., Frenken, K., Magome, J., Nilsson, C., Robertson, J. C., Rödel, R., Sindorf, N., and Wisseret, D.: High-resolution mapping of the world's reservoirs and dams for sustainable river-flow management, Front. Ecol. Environ., 9, 494–502, https://doi.org/10.1890/100125, 2011.
Li, Y., Gao, H., Zhao, G., and Tseng, K. H.: A high-resolution bathymetry dataset for global reservoirs using multi-source satellite imagery and altimetry, Remote Sens. Environ., 244, 111831, https://doi.org/10.1016/j.rse.2020.111831, 2020.
Liu, J., Jiang, L., Zhang, X., Druce, D., Kittel, C. M. M., Tøttrup, C., and Bauer-Gottwein, P.: Impacts of water resources management on land water storage in the North China Plain: Insights from multi-mission earth observations, J. Hydrol., 603, 126933, https://doi.org/10.1016/j.jhydrol.2021.126933, 2021.
Markert, K. N., Pulla, S. T., Lee, H., Markert, A. M., Anderson, E. R., Okeowo, M. A., and Limaye, A. S.: AltEx: An open source web application and toolkit for accessing and exploring altimetry datasets, Environ. Modell. Softw., 117, 164–175, https://doi.org/10.1016/j.envsoft.2019.03.021, 2019.
Markert, K. N., Markert, A. M., Mayer, T., Nauman, C., Haag, A., Poortinga, A., Bhandari, B., Thwal, N. S., Kunlamai, T., Chishtie, F., Kwant, M., Phongsapan, K., Clinton, N., Towashiraporn, P., and Saah, D.: Comparing sentinel-1 surface water mapping algorithms and radiometric terrain correction processing in southeast asia utilizing google earth engine, Remote Sens., 12, 2469, https://doi.org/10.3390/rs12152469, 2020.
Marx, A., Dusek, J., Jankovec, J., Sanda, M., Vogel, T., van Geldern, R., Hartmann, J., and Barth, J. A. C.: A review of CO2 and associated carbon dynamics in headwater streams: A global perspective, Rev. Geophys., 55, 560–585, https://doi.org/10.1002/2016RG000547, 2017.
Mu, M., Tang, Q., Han, S., Liu, X., and Cui, H.: Using GRanD database and surface water data to constrain area–storage curve of reservoirs, Water, 12, 1242, https://doi.org/10.3390/w12051242, 2020.
MWR: Hydrologic Data Yearbook, Ministry of Water Resources (MWR), ISBN 9771009737167, 2016.
Nielsen, K., Stenseng, L., Andersen, O. B., Villadsen, H., and Knudsen, P.: Validation of CryoSat-2 SAR mode based lake levels, Remote Sens. Environ., 171, 162–170, https://doi.org/10.1016/j.rse.2015.10.023, 2015.
Oudin, L., Hervieu, F., Michel, C. Perrin, C., Andréassian, V., Anctil, F., and Loumagne, C.: Which potential evapotranspiration input for a lumped rainfall-runoff model? Part 2-Towards a simple and efficient potential evapotranspiration model for rainfall-runoff modelling, J. Hydrol., 303, 290–306, https://doi.org/10.1016/j.jhydrol.2004.08.026, 2005.
Pavlis, N. K., Holmes, S. A., Kenyon, S. C., and Factor, J. K.: The development and evaluation of the Earth Gravitational Model 2008 (EGM2008), J. Geophys. Res.-Sol. Ea., 117, B04406, https://doi.org/10.1029/2011JB008916, 2012.
Pekel, J.-F., Cottam, A., Gorelick, N., and Belward, A. S.: High-resolution mapping of global surface water and its long-term changes, Nature, 540, 418–422, https://doi.org/10.1038/nature20584, 2016.
Pokhrel, Y., Shin, S., Lin, Z., Yamazaki, D., and Qi, J.: Potential disruption of flood dynamics in the lower Mekong River Basin Due to upstream flow regulation, Sci. Rep., 8, 17767, https://doi.org/10.1038/s41598-018-35823-4, 2018.
Rebold, T. W., Luthcke, S. B., Pennington, T. A., Syed, A., Beall, J. L., and Sabaka, T. J.: ICESat-2 Constraint Analysis and Monitoring System (CAMS), Earth Space Sci., 8, e2020EA001497, https://doi.org/10.1029/2020EA001497, 2021.
Schwatke, C., Dettmering, D., Bosch, W., and Seitz, F.: DAHITI – an innovative approach for estimating water level time series over inland waters using multi-mission satellite altimetry, Hydrol. Earth Syst. Sci., 19, 4345–4364, https://doi.org/10.5194/hess-19-4345-2015, 2015.
Schwatke C., Dettmering D., and Seitz F.: Volume variations of small inland water bodies from a combination of satellite altimetry and optical imagery, Remote Sens., 12, 1606, https://doi.org/10.3390/rs12101606, 2020.
Shen, Y., Liu, D., Jiang, L., Nielsen, K., Yin, J., Liu, J., and Bauer-Gottwein, P.: Data of essd-2021-470, Zenodo [data set], https://doi.org/10.5281/zenodo.7251283, 2021.
Shen, Y., Liu, D., Jiang, L., Tøttrup, C., Druce, D., Yin, J., Nielsen, K., Bauer-Gottwein, P., Wang, J., and Zhao X.: Estimating reservoir release using multi-source satellite datasets and hydrological modeling techniques, Remote Sens., 14, 815, https://doi.org/10.3390/rs14040815, 2022.
Shin, S., Pokhrel, Y., and Miguez-Macho, G.: High-resolution modeling of reservoir release and storage dynamics at the continental scale, Water Resour. Res., 55, 787–810, https://doi.org/10.1029/2018WR023025, 2019.
Shin, S., Pokhrel, Y., Yamazaki, D., Huang, X., Torbick, N., Qi, J., Pattanakiat, S., Ngo-Duc, T., and Nguyen, T. D.: High resolution modeling of river-floodplain-reservoir inundation dynamics in the Mekong River Basin, Water Resour. Res., 56, e2019WR026449, https://doi.org/10.1029/2019wr026449, 2020.
Shu, S., Liu, H., Beck, R. A., Frappart, F., Korhonen, J., Lan, M., Xu, M., Yang, B., and Huang, Y.: Evaluation of historic and operational satellite radar altimetry missions for constructing consistent long-term lake water level records, Hydrol. Earth Syst. Sci., 25, 1643–1670, https://doi.org/10.5194/hess-25-1643-2021, 2021.
Song, C., Huang, B., and Ke, L.: Modeling and analysis of lake water storage changes on the Tibetan Plateau using multi-mission satellite data, Remote Sens. Environ., 135, 25–35, https://doi.org/10.1016/j.rse.2013.03.013, 2013.
Tavakoly, A. A., Gutenson, J. L., Lewis, J. W., Follum, M. L., Rajib, A., LaHatte, W. C., and Hamilton, C. O.: Direct integration of numerous dams and reservoirs outflow in continental scale hydrologic modeling, Water Resour. Res., 57, e2020WR029544, https://doi.org/10.1029/2020WR029544, 2021.
Tiwari, A. D. and Mishra, V.: Prediction of reservoir storage anomalies in India, J. Geophy. Res.-Atmos., 124, 3822–3838, https://doi.org/10.1029/2019JD030525, 2019.
Tortini, R., Noujdina, N., Yeo, S., Khandelwal, A., Kumar, V., Birkett, C., Ricko, M., Yang, X., and Lettenmaier, D.: PRESWOT_HYDRO_L4_LAKE_STORAGE_TIME_SERIES_V2, Ver. 2, PO.DAAC, CA, USA [data set], https://doi.org/10.5067/UCLRS-STOV2, 2019.
Tortini, R., Noujdina, N., Yeo, S., Ricko, M., Birkett, C. M., Khandelwal, A., Kumar, V., Marlier, M. E., and Lettenmaier, D. P.: Satellite-based remote sensing data set of global surface water storage change from 1992 to 2018, Earth Syst. Sci. Data, 12, 1141–1151, https://doi.org/10.5194/essd-12-1141-2020, 2020.
Villadsen, H., Deng, X., Andersen, O. B., Stenseng, L., Nielsen, K., and Knudsen, P.: Improved inland water levels from SAR altimetry using novel empirical and physical retrackers, J. Hydrol., 537, 234–247, https://doi.org/10.1016/j.jhydrol.2016.03.051, 2016.
Vu, D. T.: Codes and Data of Satellite Observations Reveal 13 Years of Reservoir Filling Strategies, Operating Rules, and Hydrological Alterations in the Upper Mekong River Basin, Zenodo [data set], https://doi.org/10.5281/zenodo.6299041, 2022.
Vu, D. T., Dang, T. D., Galelli, S., and Hossain, F.: Satellite observations reveal 13 years of reservoir filling strategies, operating rules, and hydrological alterations in the Upper Mekong River basin, Hydrol. Earth Syst. Sci., 26, 2345–2364, https://doi.org/10.5194/hess-26-2345-2022, 2022.
Wang, X., Xiao, X., Zou, Z., Dong, J., Qin, Y., Doughty, R. B., Menarguez, M. A., Chen, B., Wang, J., Ye, H, Ma, J., Zhong, Q., Zhao, B., and Li, B.: Gainers and losers of surface and terrestrial water resources in China during 1989–2016, Nat. Commun., 11, 3471, https://doi.org/10.1038/s41467-020-17103-w, 2020.
Weekley, D. and Li, X.: Tracking multidecadal lake water dynamics with Landsat imagery and topography/bathymetry, Water Resour. Res., 55, 8350–8367, https://doi.org/10.1029/2019WR025500, 2019.
Wilson, A. M. and Jetz, W.: Remotely sensed high-resolution global cloud dynamics for predicting ecosystem and biodiversity distributions, PLoS Biol., 14, e1002415, https://doi.org/10.1371/journal.pbio.1002415, 2016.
Wingham, D. J., Francis, C. R., Baker, S., Bouzinac, C., Brockley, D., Cullen, R., de Chateau-Thierry, P., Laxon, S. W., Mallow, U., Mavrocordatos, C., Phalippou, L., Ratier, G., Rey, L., Rostan, F., Viau, P., and Wallis, D. W.: CryoSat: A mission to determine the fluctuations in Earth's land and marine ice fields, Adv. Space Res., 37, 841–871, https://doi.org/10.1016/j.asr.2005.07.027, 2006.
Yao, F., Wang, J., Wang, C., and Crétaux, J.-F.: Constructing long-term high-frequency time series of global lake and reservoir areas using Landsat imagery, Remote Sens. Environ., 232, 111210, https://doi.org/10.1016/j.rse.2019.111210, 2019.
Yassin, F., Razavi, S., Elshamy, M., Davison, B., Sapriza-Azuri, G., and Wheater, H.: Representation and improved parameterization of reservoir operation in hydrological and land-surface models, Hydrol. Earth Syst. Sci., 23, 3735–3764, https://doi.org/10.5194/hess-23-3735-2019, 2019.
Yigzaw, W., Li, H. Y., Demissie, Y., Hejazi, M. I., Leung, L. R., Voisin, N., and Payn, R.: A new global storage-area-depth data set for modeling reservoirs in land surface and earth system models, Water Resour. Res., 54, 10–372, https://doi.org/10.1029/2017WR022040, 2018a.
Yigzaw, W., Li, H., Demissie, Y., Hejazi, M. I., Leung, L.-y. R., Voisin, N., and Payn, R.: Global Reservoir Geometry Database, Zenodo [data set], https://doi.org/10.5281/zenodo.1322884, 2018b.
Zajac, Z., Revilla-Romero, B., Salamon, P., Burek, P., Hirpa, F. A., and Beck, H.: The impact of lake and reservoir parameterization on global streamflow simulation, J. Hydrol., 548, 552–568, https://doi.org/10.1016/j.jhydrol.2017.03.022, 2017.
Zhang, G., Xie, H., Kang, S., Yi, D., and Ackley, S. F.: Monitoring lake level changes on the Tibetan Plateau using ICESat altimetry data (2003–2009), Remote Sens. Environ., 115, 1733–1742, https://doi.org/10.1016/j.rse.2011.03.005, 2011.
Zhang, S., Gao, H., and Naz, B. S.: Monitoring reservoir storage in South Asia from multisatellite remote sensing, Water Resour. Res., 50, 8927–8943, https://doi.org/10.1002/2014WR015829, 2014.
Zhang, X., Jiang, L., Kittel, C. M. M., Yao, Z., Nielsen, K., Liu, Z., Wang, R., Liu, J., Andersen, O. B., and Bauer-Gottwein, P.: On the performance of Sentinel-3 altimetry over new reservoirs: Approaches to determine onboard a priori elevation, Geophys. Res. Letters, 47, e2020GL088770, https://doi.org/10.1029/2020GL088770, 2020.
Zhao, G. and Gao, H.: Automatic Correction of Contaminated Images for Assessment of Reservoir Surface Area Dynamics, Geophys. Res. Letters, 45, 6092–6099, https://doi.org/10.1029/2018GL078343, 2018.
Zhao, G., Gao, H., Naz, B. S., Kao, S. C., and Voisin, N.: Integrating a reservoir regulation scheme into a spatially distributed hydrological model, Adv. Water Resour., 98, 16–31, https://doi.org/10.1016/j.advwatres.2016.10.014, 2016.
Zhong, R., Zhao, T., and Chen, X.: Hydrological model calibration for dammed basins using satellite altimetry information, Water Resour. Res., 56, e2020WR027442, https://doi.org/10.1029/2020WR027442, 2020.
Zhu, J., Song, C., Wang, J., and Ke, L.: China's inland water dynamics: The significance of water body types, P. Natl. Acad. Sci. USA, 117, 13876–13878, https://doi.org/10.1073/pnas.2005584117, 2020.
- Abstract
- Introduction
- Data and methods
- Results and discussion
- Applications
- Data availability
- Conclusions
- Appendix A: Data sources of satellite-based reservoir water level, area, and storage variation for Chinese reservoirs.
- Appendix B: The flowcharts of the proposed method for generating reservoir water level and storage variation products
- Appendix C: Multiproduct evaluation at 15 reservoirs
- Author contributions
- Competing interests
- Disclaimer
- Financial support
- Review statement
- References
- Supplement