the Creative Commons Attribution 4.0 License.
the Creative Commons Attribution 4.0 License.
 | 06 Oct 2022
SGD-SM 2.0: an improved seamless global daily soil moisture long-term dataset from 2002 to 2022
Qiang Zhang
Taoyong Jin
Meiping Song
Fujun Sun
The drawbacks of low-coverage rate in global land inevitably exist in satellite-based daily soil moisture products because of the satellite orbit covering scopes and the limitations of soil moisture retrieving models. To solve this issue, Zhang et al. (2021a) generated seamless global daily soil moisture (SGD-SM 1.0) products for the years 2013–2019. Nevertheless, there are still several shortages in SGD-SM 1.0 products, especially in temporal range, sudden extreme weather conditions and sequential time-series information. In this work, we develop an improved seamless global daily soil moisture (SGD-SM 2.0) dataset for the years 2002–2022, to overcome the above-mentioned shortages. The SGD-SM 2.0 dataset uses three sensors, i.e. AMSR-E, AMSR2 and WindSat. Global daily precipitation products are fused into the proposed reconstructing model. We propose an integrated long short-term memory convolutional neural network (LSTM-CNN) to fill the gaps and missing regions in daily soil moisture products. In situ validation and time-series validation testify to the reconstructing accuracy and availability of SGD-SM 2.0 (R: 0.672, RMSE: 0.096, MAE: 0.078). The time-series curves of the improved SGD-SM 2.0 are consistent with the original daily time-series soil moisture and precipitation distribution. Compared with SGD-SM 1.0, the improved SGD-SM 2.0 outperforms on reconstructing accuracy and time-series consistency. The SGD-SM 2.0 products are recorded in https://doi.org/10.5281/zenodo.6041561 (Zhang et al., 2022).
- Article
(10209 KB) - Full-text XML
- Companion paper
- BibTeX
- EndNote


Surface soil moisture acts as a significant part of global hydrology and meteorology, especially for forecasting drought and flood disasters (Wigneron et al., 1999; Long et al., 2014; Brocca et al., 2018). In recent years, satellite-based soil moisture retrieving data have rapidly progressed in both global and daily monitoring (Shi et al., 2006; Dorigo et al., 2012, 2021; Al Bitar et al., 2017), e.g. AMSR-E, AMSR2 and WindSat global daily soil moisture products and so on (Fan et al., 2004). These quantitative products have been widely utilised for global and long-term hydrological analysis and forecasting (Chen et al., 2021; Todd-Brown et al., 2022).
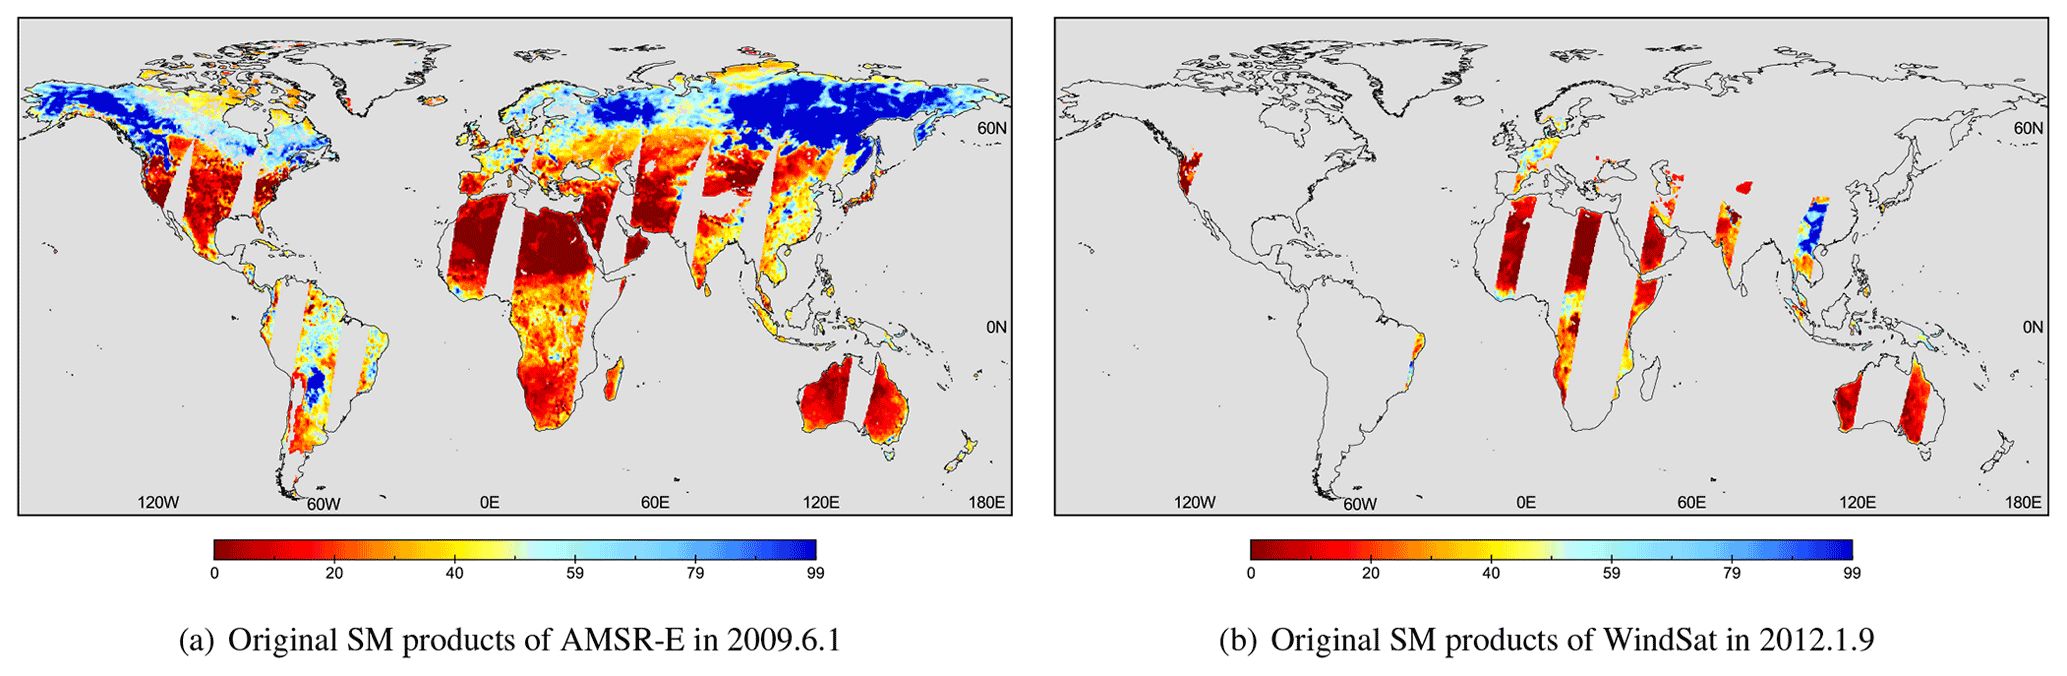
However, because of the limitations of soil moisture retrieving models and satellite orbital covering scopes, the obtained daily soil moisture products are fragmentary and incomplete (Shi et al., 2002; Enenkel et al., 2016; Meng et al., 2021). As shown in Fig. 1a and b, plenty of gap regions exist in these soil moisture products. Actually, the land coverage rate is only approximately 20 % to 80 % in daily AMSR-E, AMSR2 and WindSat quantitative products (Long et al., 2019; Bogena et al., 2022).
To settle this adverse effect for global soil moisture applications, most works adopted the temporal averaging operation such as monthly, quarterly or yearly averaging (Schaffitel et al., 2020; Guevara et al., 2021; Wang et al., 2021). This strategy could usually acquire full-coverage soil moisture products via averaging abundant daily products. Nevertheless, the temporal averaging operation is also a two-edged sword. Firstly, it directly replaces daily temporal resolution with low-frequency temporal resolution (Rebel et al., 2012; Long et al., 2020; Zhang et al., 2021), which greatly lowers the utilisation of daily soil moisture products. Secondly, a temporal averaging operation disregards the specific spatial distribution of daily products and neglects the sequential time-series changing characteristic (Zeng et al., 2015a; Wang et al., 2021; Zhan et al., 2015). In other words, a monthly, quarterly or yearly averaging strategy degrades the original characteristics for daily soil moisture products.
To address this issue, Zhang et al. (2021a) generated a seamless, global, daily soil moisture (named SGD-SM 1.0) dataset from 2013 to 2019. The spatial resolution is denoted as a 0.25∘ grid (about 25 km). The SGD-SM 1.0 dataset relies on the deep spatio-temporal partial convolutional model to fill the gaps or missing regions in daily soil moisture products. Thereafter, three validations are performed to verify the reliability of SGD-SM 1.0 products. Relevant quantitative indexes (R, RMSE and MAE) and results demonstrate that SGD-SM 1.0 products can be extended for global, daily and full-coverage soil moisture measurements (Zhang et al., 2021a).
The SGD-SM 1.0 dataset maintains the original high-frequency daily temporal resolution and effectively enhances the utilisation of global daily soil moisture products. However, several weaknesses and limitations also exist in SGD-SM 1.0. Based on SGD-SM 1.0 and the above-mentioned considerations, we develop an improved seamless global daily soil moisture (SGD-SM 2.0) dataset for the years 2002–2022 in this work. Compared with SGD-SM 1.0, the main improvements and contributions of SGD-SM 2.0 are listed below:
-
The SGD-SM 1.0 dataset only uses a single sensor (AMSR2), and the temporal range is insufficient with only 7 years. While global soil moisture analysis and applications generally need longer-term and more multi-sensors products, the application range of SGD-SM 1.0 is still limited. Compared with SGD-SM 1.0, SGD-SM 2.0 uses three passive microwave sensors (AMSR-E, WindSat and AMSR2). The temporal range of SGD-SM 2.0 is extended to 20 years from 2002 to 2022. The application scope of SGD-SM 2.0 could be enlarged through these long-term soil moisture products.
-
The SGD-SM 1.0 dataset ignores the daily extreme weather conditions. If sudden precipitation occurs in 1 d, SGD-SM 1.0 usually performs poor under this scenario. The main reason is that SGD-SM 1.0 relies on the internal spatio-temporal correlation, which does not consider the external environmental factors. Compared with SGD-SM 1.0, SGD-SM 2.0 introduces the global daily precipitation products into the reconstructing framework. Through fusing auxiliary precipitation data, SGD-SM 2.0 could lead in the daily extreme weather information for gap-filling.
-
Although SGD-SM 1.0 employs 3-D partial convolutional neural network (CNN) to exploit both spatial and temporal features, it is still insufficient for utilising sequential time-series information. For daily soil moisture products, how to effectively reconstruct gaps and missing regions through interrelated temporal information is significant. Compared with SGD-SM 1.0, SGD-SM 2.0 develops an integrated long short-term memory convolutional neural network (LSTM-CNN) to fill the gaps and missing regions in these daily products. The proposed LSTM-CNN model could simultaneously utilise recurrent time-series information and spatial information.
-
Compared with SGD-SM 1.0 products, SGD-SM 2.0 products outperform on R (0.688), RMSE (0.094) and MAE (0.077). In addition, the time-series curves of the improved SGD-SM 2.0 products are more consistent with the original daily time-series soil moisture values. Benefiting from the data fusion of daily precipitation information, the proposed LSTM model can extract time-series features for filling the gaps and missing regions in daily soil moisture products. Therefore, SGD-SM 2.0 can be utilised effectively for global hydrology monitoring and analysis at fine (daily) temporal resolution.
The outline of this work is arranged as follows. Section 2 provides a description of products and data used in this work. Section 3 gives the methodology of the proposed reconstructing framework for SGD-SM 2.0. Section 4 lists the experimental results of SGD-SM 2.0 products. Section 5 discusses the comparisons between SGD-SM 1.0 and SGD-SM 2.0, especially regarding reconstructing accuracy and time-series consistency. Finally, the conclusion and outlook are summarised in Sect. 6.
In this work, we simultaneously fuse satellite-based soil moisture products and precipitation products to generate the SGD-SM 2.0 dataset. The in situ soil moisture sites are employed to validate the reconstructing precision of SGD-SM 2.0. These in situ data are downloaded from the International Soil Moisture Network (ISMN). Detailed descriptions are listed below.
2.1 Satellite-based soil moisture products
The AMSR-E, AMSR2 and WindSat global daily soil moisture products are utilised from 2002 to 2022. These three sensors are onboarded at the Aqua satellite, GCOM-W1 and Coriolis satellite, respectively (Nepal et al., 2021). The AMSR-E, AMSR2 and WindSat products are all passive sensors for soil moisture retrieving. The spatial resolution is a 0.25∘ grid (about 25 km) in all these products, as depicted in Fig. 1a–c. The retrieving model adopts the land parameter retrieval model (LPRM) for AMSR-E, WindSat and AMSR2 products (McColl et al., 2017). We select the descending orbit (nighttime) and 6.9 GHz band for all these soil moisture products. These datasets are all recorded in the GES DISC website. These three products provide the original information for using SGD-SM 2.0. The proposed reconstructing model acquires the gap masks and relies on the valid spatio-temporal soil moisture information from these three products to fill the gaps and missing regions.
The time-series range of the AMSR-E sensor starts from 19 June 2002 and ends on 4 October 2011 (Njoku et al., 2003; Shi et al., 2008). The time-series range of the WindSat sensor starts from 1 February 2003 and ends on 2 August 2012. The time-series range of the AMSR2 sensor starts from 3 July 2012 and continues to the current date (Zeng et al., 2020). In consideration of the low-coverage rate in the WindSat dataset, we only use WindSat global daily products from 5 October 2011 to 2 July 2012 for acquiring sequential daily products. These recorded AMSR-E, WindSat and AMSR2 global daily products are all employed as the initial input of the proposed LSTM-CNN model for generating SGD-SM 2.0 products. The daily coverage rate curves of these three global quantitative products are depicted in Fig. 2a–c, respectively.
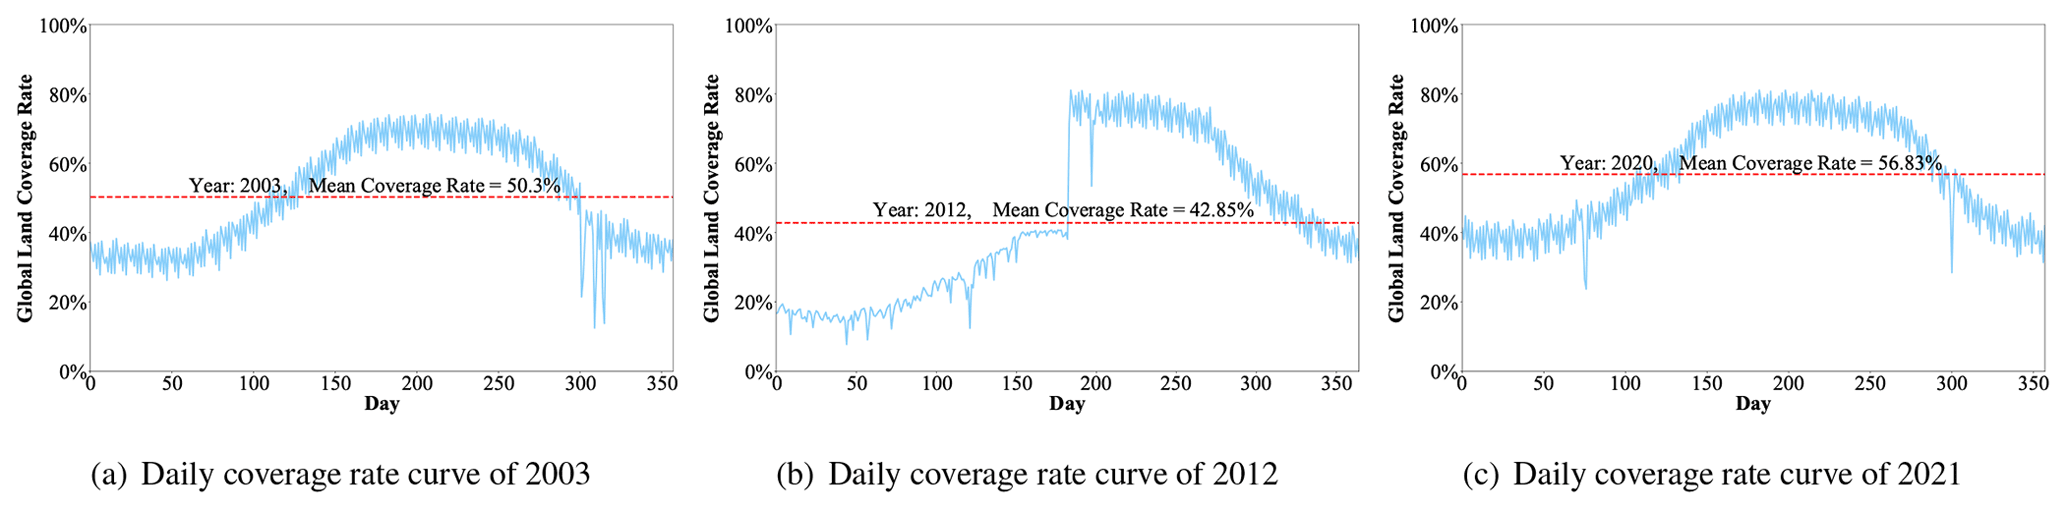
Figure 2Daily coverage rate curves of AMSR-E, WindSat and AMSR2 soil moisture products in 2002, 2012, and 2021, respectively.
2.2 Precipitation products
Precipitation usually has a high correlation with soil moisture in the corresponding regions (Pellarin et al., 2009; Brocca et al., 2014a; Sun and Fu, 2021). Therefore, we fuse the precipitation products into the proposed SGD-SM 2.0 dataset to improve the reconstructing accuracy. The Integrated Multi-satellitE Retrievals for GPM (IMERG) global daily precipitation V6 products are employed for the years 2002–2022 (Massari et al., 2020). These precipitation products are derived from multiple precipitation-relevant satellite passive microwave sensors, as portrayed in Fig. 3a. The spatial resolution is denoted as a 0.1∘ grid (about 10 km) in IMERG level 3 global daily final precipitation products. To keep the uniformity with soil moisture products, the spatial downsampling operation is carried out for the original IMERG precipitation products from 0.1 to 0.25∘. We then normalise these precipitation values via linear transformation for use in the reconstructing model. These precipitation products were all downloaded from GES DISC (Brocca et al., 2019; Berg et al., 2021; Škrk et al., 2021).
2.3 In situ soil moisture data
In situ soil moisture sites are significant for testifying to the satellite-based products (Brocca et al., 2014b; Gruber et al., 2020). These sites provide high-precision surface soil moisture values. Relying on in situ data, the quantitative indexes could be derived for the proposed SGD-SM 2.0 dataset. The ISMN unites global in situ surface data, which have been widely applied for hydrology and soil moisture validation (Dorigo et al., 2011, 2013, 2021; Wigneron et al., 2013). We select 124 stations from the ISMN from 2002 to 2022 and match them with corresponding soil moisture products in SGD-SM 2.0 (Zhang et al., 2020). The selected criteria include three points:
-
The in situ soil moisture sites are downloadable through the given website.
-
The in situ soil moisture sites are continuous for the long-term observation, at least 1 year.
-
The spatial distribution of these in situ sites covers various continents, land use and soil types.
The spatial distribution of these selected in situ data is displayed in Fig. 3b. These in situ soil moisture data are public and can be downloaded from https://ismn.geo.tuwien.ac.at/en/ (last access: 13 January 2022). The in situ validation results of SGD-SM 2.0 and the reconstructing accuracy comparisons with SGD-SM 1.0 are provided in Sects. 4.2 and 5.1, respectively.
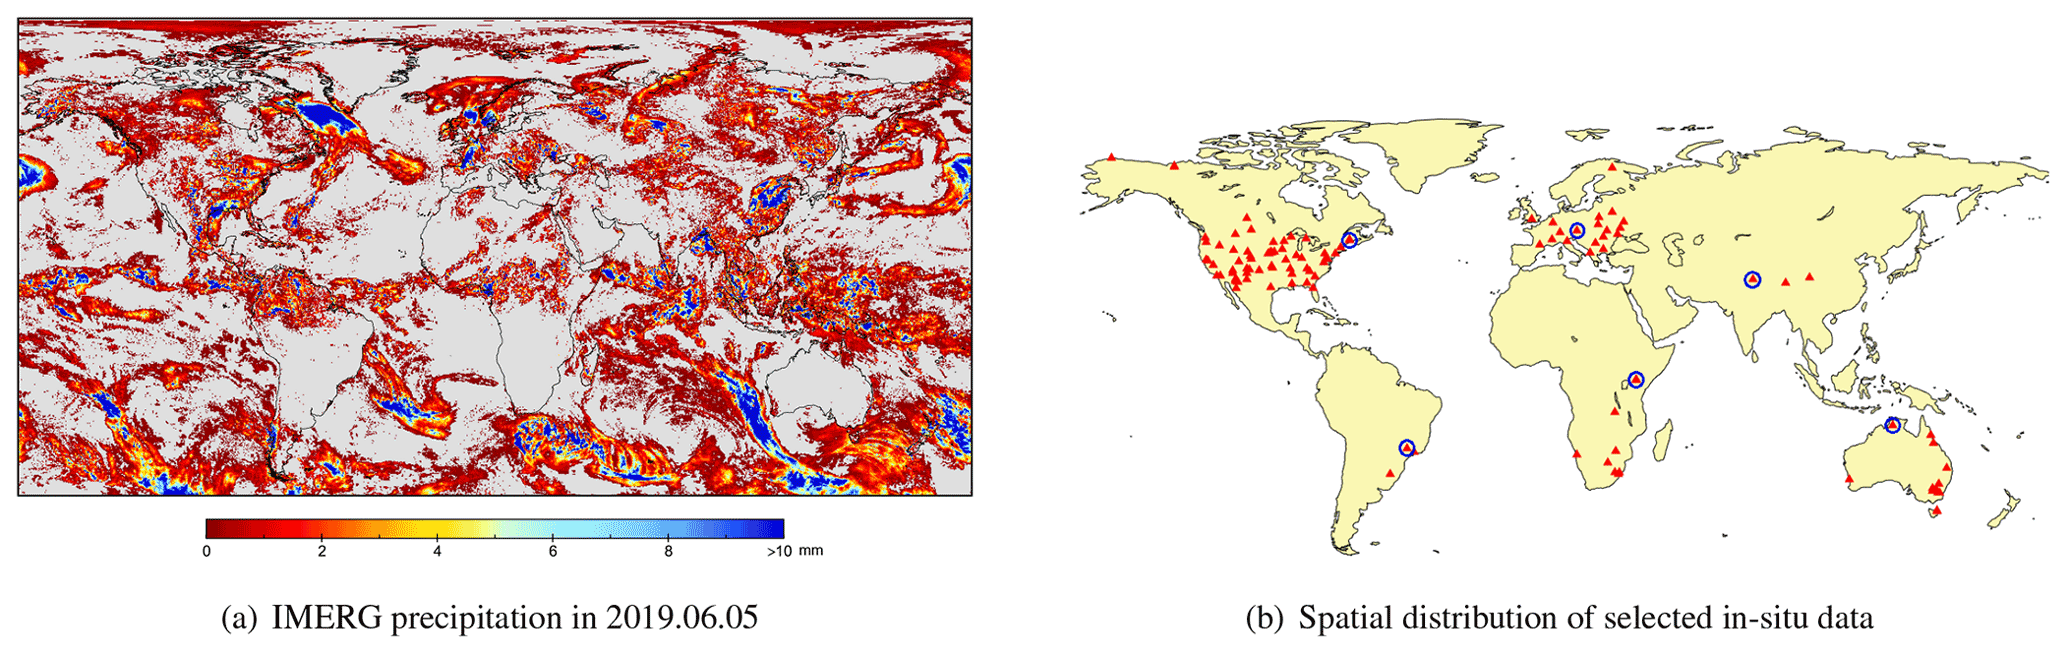
Figure 3IMERG global daily precipitation and selected in situ data.
The schematic representation of the proposed work is depicted in Fig. 4. Different from SGD-SM 1.0, we simultaneously fuse global daily precipitation products with global daily soil moisture products into SGD-SM 2.0. An integrated long short-term memory convolutional neural network (LSTM-CNN) reconstructing model is developed to fill the gaps and missing regions in global daily soil moisture products. Finally, we recursively generate the seamless daily soil moisture products in the SGD-SM 2.0 dataset. Detailed descriptions of the proposed LSTM-CNN reconstructing model, training and optimisation are stated below.
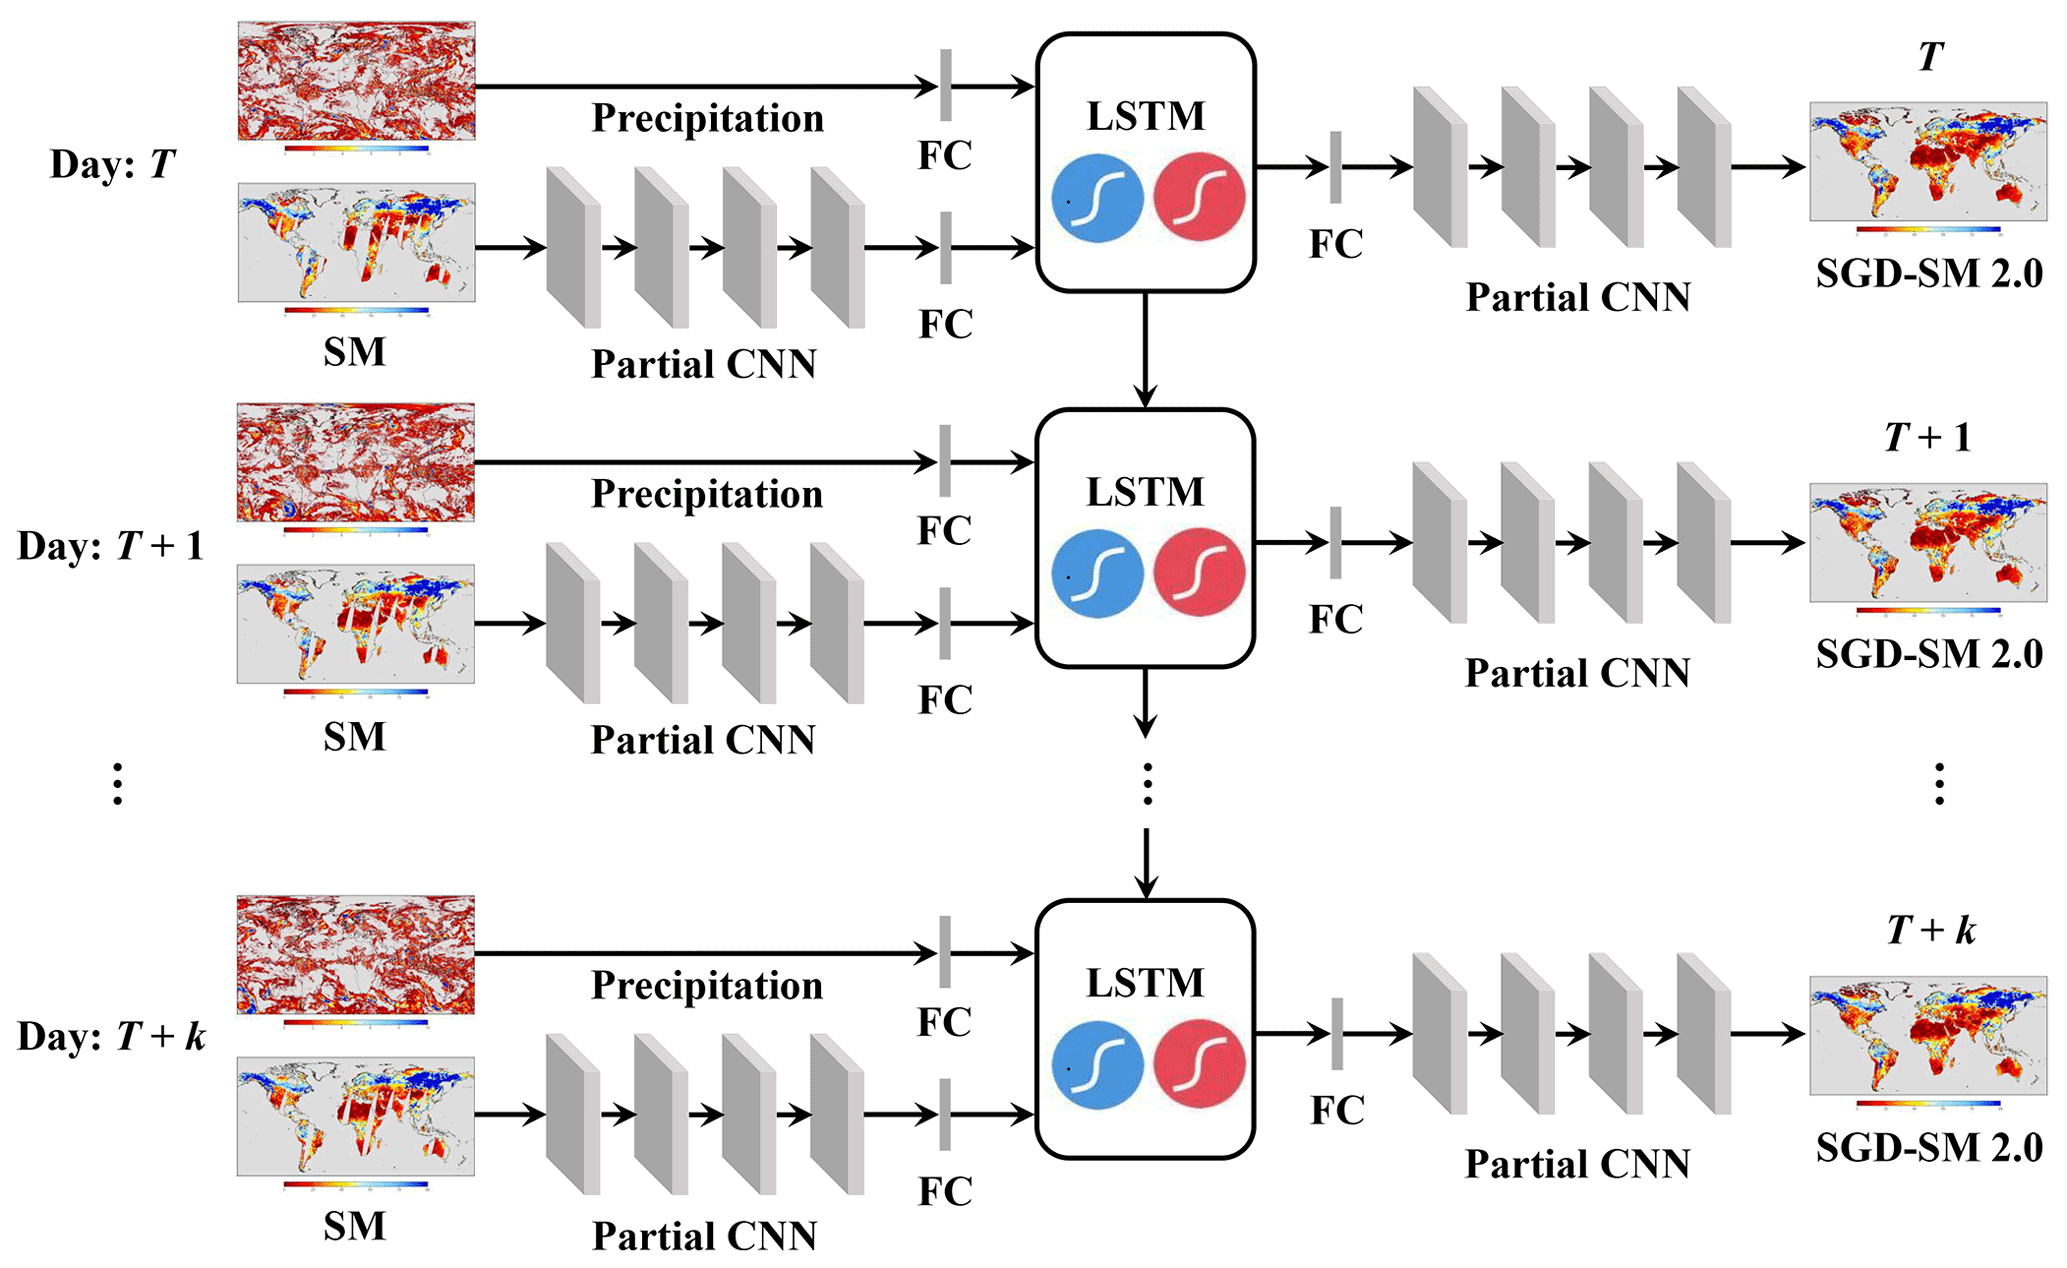
Figure 4Schematic representation of the proposed framework to generate SGD-SM 2.0 products.
3.1 LSTM-CNN reconstructing model
As shown in Fig. 4, the original global daily soil moisture product on date T (AMSR-E, WindSat or AMSR2) and its corresponding global daily precipitation product are utilised as the input data of the proposed framework. Firstly, the precipitation data on date T are transformed as the vector value PT through a full-connected (FC in Fig. 4) layer. We employ the partial convolutional neural network (Partial CNN in Fig. 4) to extract the spatial feature of soil moisture product on date T. Different from the common CNN (Yuan et al., 2019), partial CNN can effectively acquire the spatial information within valid regions and eliminate the invalid information within gaps or soil moisture missing regions (Zhang et al., 2018a). We applied a partial CNN for generating the SGD-SM 1.0 dataset. Due to its effectiveness on incomplete soil moisture products, the partial CNN is also used in this work for generating the SGD-SM 2.0 dataset. The formula of a partial CNN in this work is determined as follows:
where M denotes the mask of its corresponding soil moisture product S; 0 and 1 refer to the invalid and valid points in the mask M. The trainable weighted and offset arguments in the partial CNN are denoted by W and b, respectively; and ⊗ represents the dot product operation to exclude the invalid information in gaps or missing regions through mask data. Subsequently, the current mask M needs to be regenerated under the below paradigm: if the partial convolution can generate at least one valid value of the output result, we need to mark this location as a valid value in the new masks. The regenerated mask formula is defined as follows (Zhang et al., 2020):
where L(m,n) stands for Earth land in position (m, n). It should be noted that the Earth land mask includes six continents and neglects all regions of Antarctica and most regions of Greenland. The main reason is that these omitted regions are perennially covered with snowy or frozen land (Zhao et al., 2021).
After four partial CNN layers in Fig. 4, an FC layer is also acted on in the feature maps of the soil moisture product, with the result of vector value ST:
Then, the two vectors, ST and PT, of soil moisture and precipitation products are simultaneously imported into the LSTM model in Fig. 4. The architecture of the LSTM model within the proposed framework is displayed in Fig. 5.
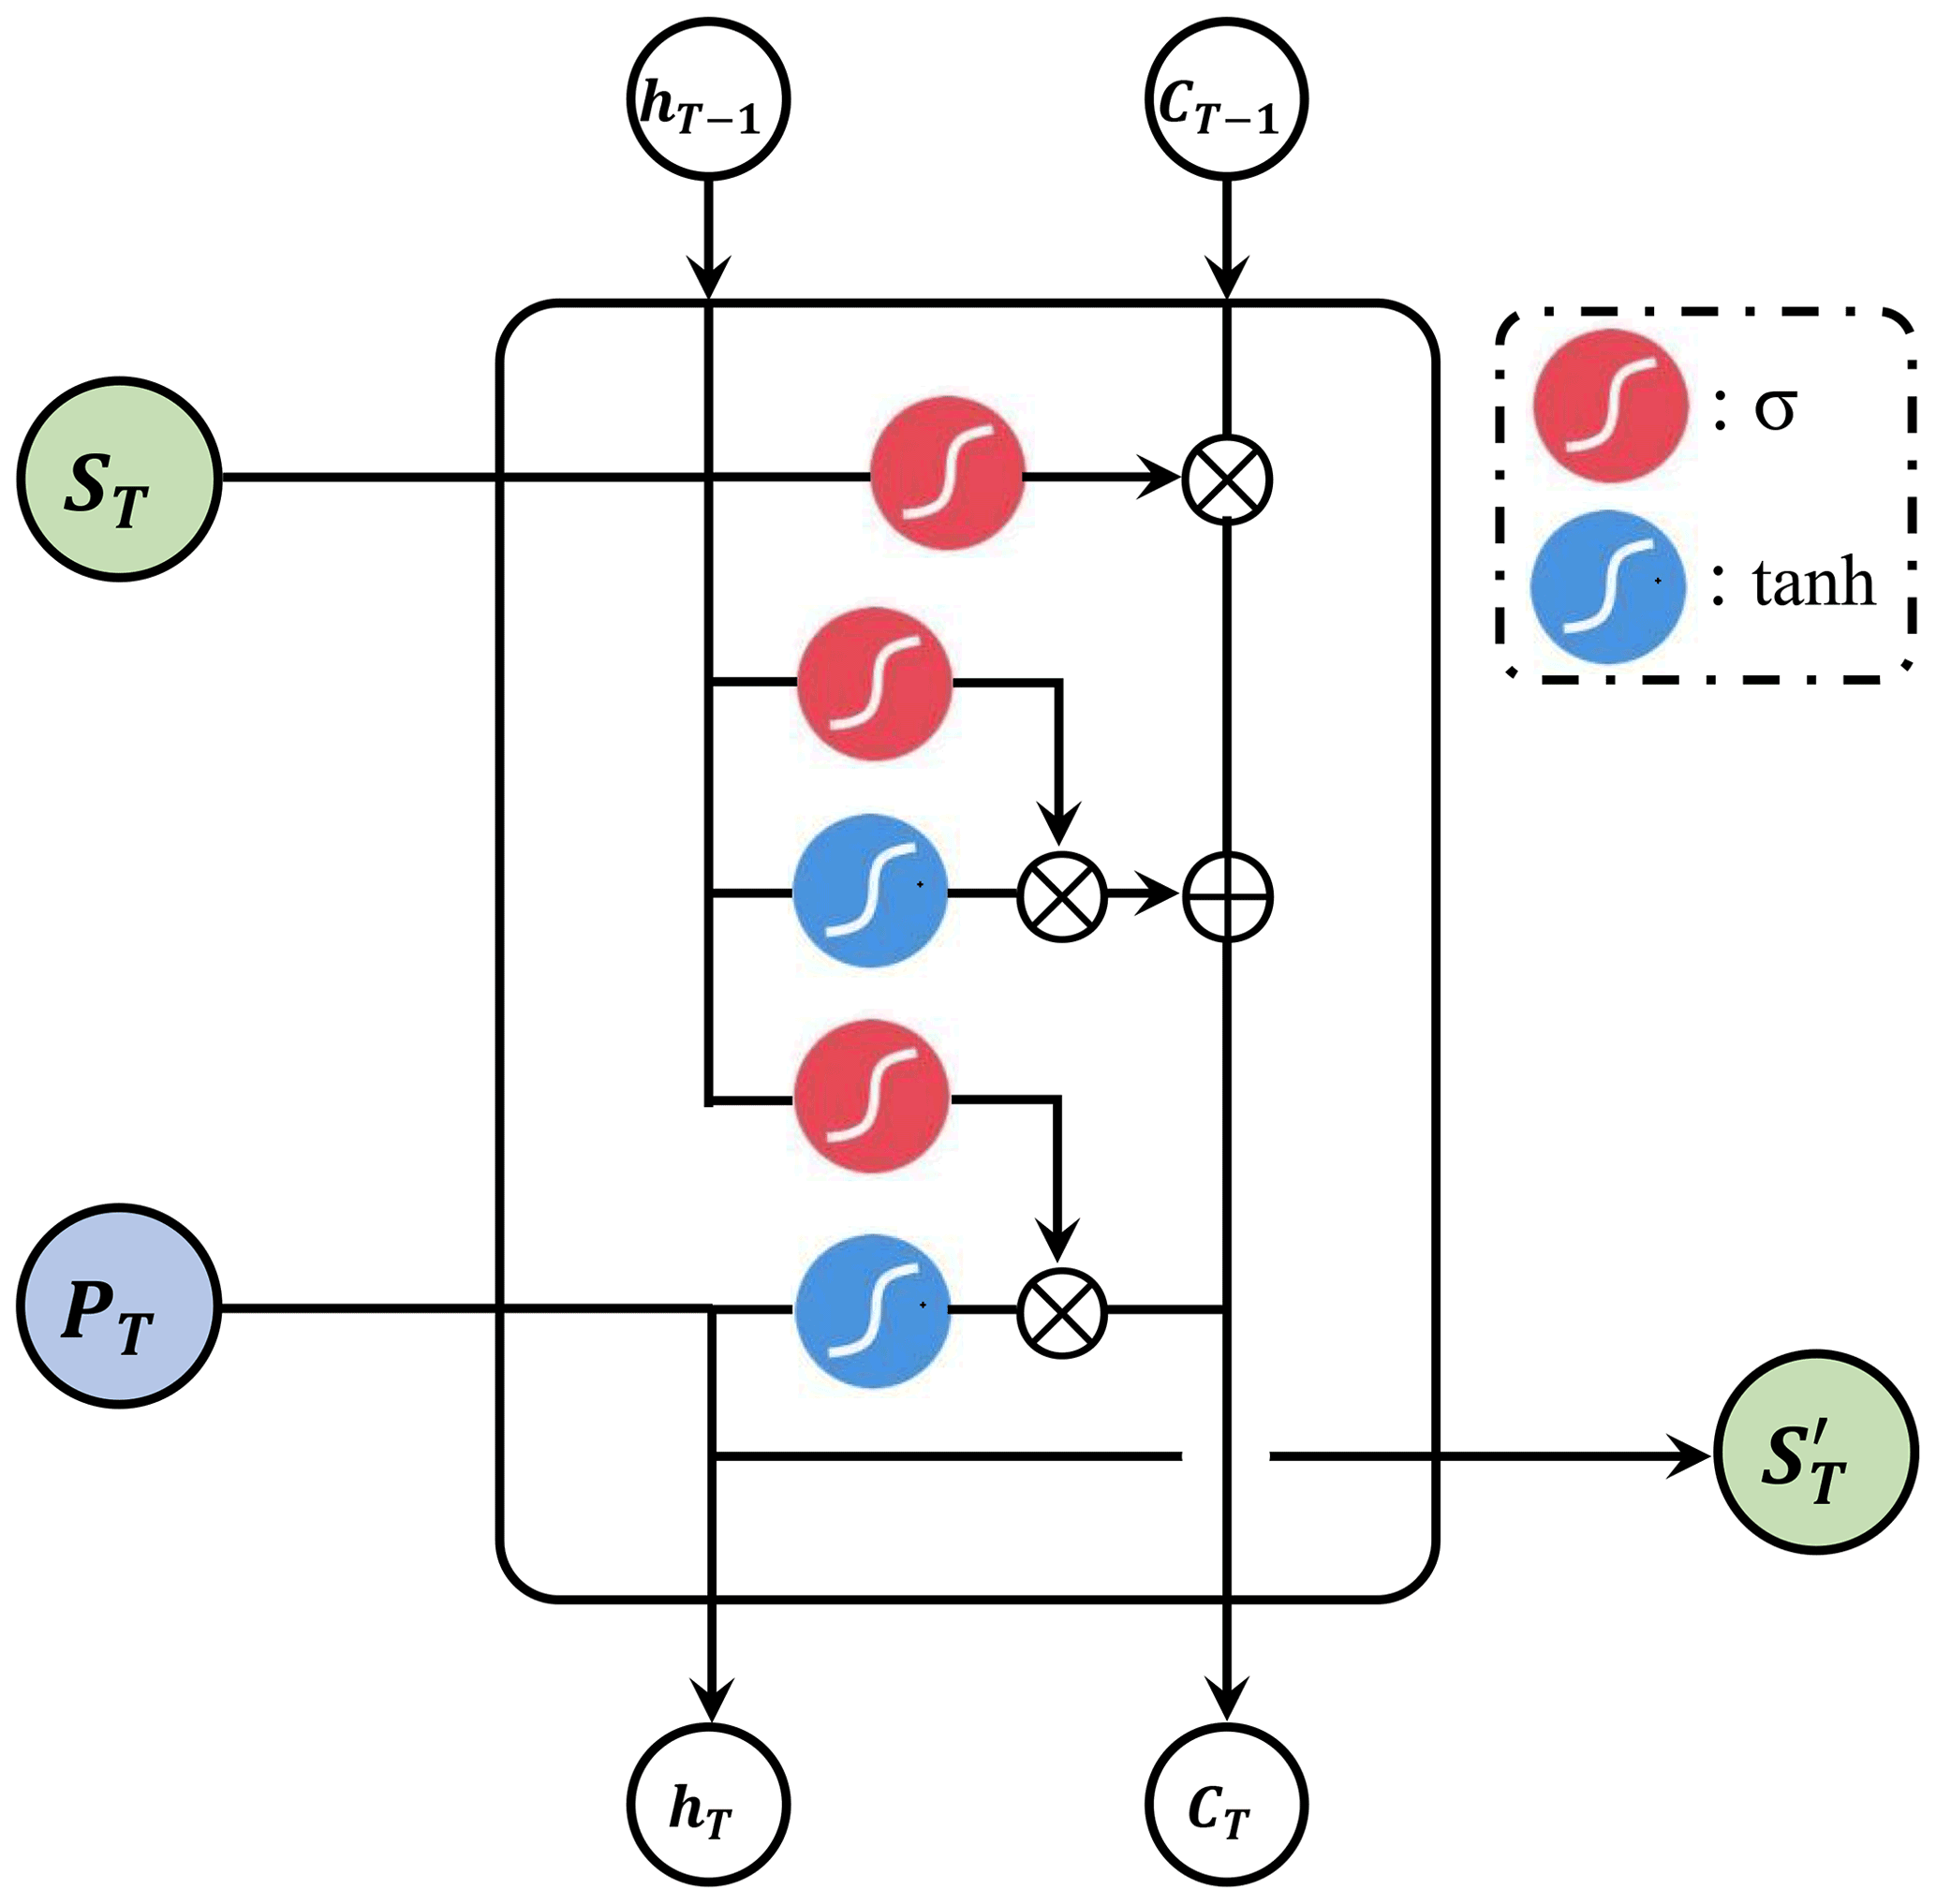
As depicted in Fig. 5, soil moisture information ST, corresponding precipitation information PT, previous long-term memory information CT−1, and previous short-term memory information hT−1 are simultaneously imported into the LSTM model. The output values in the LSTM are the regenerated soil moisture information , current long-term memory information CT, and current short-term memory information hT. It should be noted that current LSTM information on date T is the previous LSTM information on next date T+1, respectively. For memory information h0 and C0, these vectors are initialised with zero elements. The LSTM is composed of three gates, i.e. oblivious gate, input gate and output gate to control the memory information state (Zhang et al., 2021b).
-
Oblivious gate. This gate determines which information needs to be discarded in the short-term memory state. It is carried out by the sigmoid unit σ between the soil moisture information ST and previous long-term memory information CT−1:
where the sigmoid unit σ is defined below:
In the sigmoid unit σ, 0 means fail and 1 means pass for current information. Through checking the soil moisture information ST and previous long-term memory information CT−1, it generates a vector between 0 and 1. This variable determines which information is retained or discarded in the short-term memory state.
-
Input gate. This gate determines which new information is added to the long-term memory state. Firstly, we use hT−1 and ST to determine which information needs to be updated through the sigmoid operation in Eq. (6):
Then the new candidate long-term memory information, is generated through the tanh unit in Eq. (7):
where the tanh unit is defined as:
-
Output gate. In this gate, we need to output current long-term memory information CT from previous CT−1 and candidate long-term memory information :
After updating current long-term memory information CT, the regenerated soil moisture information is output through previous short-term memory hT−1, soil moisture information ST, and corresponding precipitation information PT:
Besides, we need to output current short-term memory information hT for the next date T+1 as follows:
Later, the regenerated soil moisture information is transformed by an FC layer in the right of Fig. 4. Thereafter, four partial CNN layers are performed to generate the final SGD-SM 2.0 product on date T. Through the consecutive time-series strategy, we recursively reconstruct the daily soil moisture products in SGD-SM 2.0.
3.2 Training and optimisation
To generate the reliable and high-precision SGD-SM 2.0 dataset, the way in which to train and optimise the proposed LSTM-CNN model is extremely crucial in this work. The training stage needs huge numbers of sample labels to optimise the trainable parameters in the proposed partial CNN and LSTM in Figs. 4 and 5, respectively. The sample labels adopt a patch-selecting strategy. We select sequential time-series daily soil moisture patches with k=7 in the reconstructing framework. The spatial sizes of these 7 d soil moisture patches are all set as 40×40. These time-series 7 d soil moisture patches are all complete, without gaps or data missing regions from the original soil moisture products. Then, we randomly select 30 000 mask patches with the spatial size of 40×40. Each soil moisture patch is simulated with missing regions via these mask patches. In this way, we acquire 30 000 training samples from the original 2002–2022 soil moisture products. Each training sample includes four variables: the simulated 7 d soil moisture patches, the complete 7 d soil moisture patches, the corresponding mask patches, and the corresponding precipitation patches. These variables are simultaneously imported into the LSTM-CNN reconstructing model, as shown in Fig. 4.
For the partial CNN in the proposed framework, we set the convolutional filter size as 3×3 in all the partial CNN layers (Xiao et al., 2022a). The last partial CNN layer outputs just one feature map and the other partial CNN layers output 64 feature maps (Xiao et al., 2022b). The rectified linear unit (ReLU) is utilised after each partial CNN layer. For the LSTM model in the proposed framework, we set the dimension of long and short-term memory vectors CT and hT as 2048.
For the network optimisation, we adopt the same strategy with the global–local function (Zhang et al., 2021a) in SGD-SM 1.0. The global soil moisture uniformity and local soil moisture heterogeneity are both taken into consideration in the proposed LSTM-CNN reconstructing model. Different from SGD-SM 1.0, we simultaneously fill the gaps and missing regions in the time-series 7 d soil moisture patches. Detailed definitions of the global–local function are determined as follows:
where ML represents the global land mask (including six continents and neglecting all regions of Antarctica and most regions of Greenland); α stands for the balancing parameter to equilibrate the local loss and global loss (Zhang et al., 2020). Empirically, this ratio is fixed as 0.1 in the training and optimisation stage.
In terms of the hyperparameters and operations of the proposed framework, related explanations are listed below. The batch size of the LSTM-CNN reconstructing model is set as 128 (Zhang et al., 2018a). The whole epoch number is confirmed, determined as 500 (1 epoch denotes that all the samples in the training set have been utilised for the neural network optimisation at one time). The inceptive learning rate is started at 0.005 (Zhang et al., 2018b). It gradually decreases through multiplying a damping factor (equal to 0.5) every 100 epochs (Zhang et al., 2019). On software configuration, the LSTM-CNN model is carried out on the PyTorch 1.8.1 framework. We use Python 3.7 language, PyCharm platform and the Windows 10 environment to generate seamless global daily soil moisture products. On hardware configuration, we employ a NVIDIA Titan X (Pascal) GPU, Inter E5-2609v3 CPU, and 16 GB DDR4 RAM to execute the proposed LSTM-CNN model.
The released SGD-SM 2.0 products are recorded in https://doi.org/10.5281/zenodo.6041561 (Zhang et al., 2022). The SGD-SM 2.0 dataset starts from 23 June 2002 and ends on 5 February 2022. The initial and reconstructing global daily soil moisture products have been stored with individual NetCDF4 (*.nc) documents. Because part of the daily soil moisture products is missing at GES DISC, these products are also neglected in the proposed SGD-SM 2.0 dataset (7115 files). In this section, the experimental results of the SGD-SM 2.0 dataset are given in Sect. 4.1. Later, we carry out the in situ validation and time-series validation of SGD-SM 2.0 in Sect. 4.2 and 4.3, respectively.
4.1 Experimental results
As shown in Figs. 6 and 7, the original SM and SGD-SM 2.0 results are given on 10, 20 and 30 September 2002 and on 10, 20 and 30 June 2020, respectively.
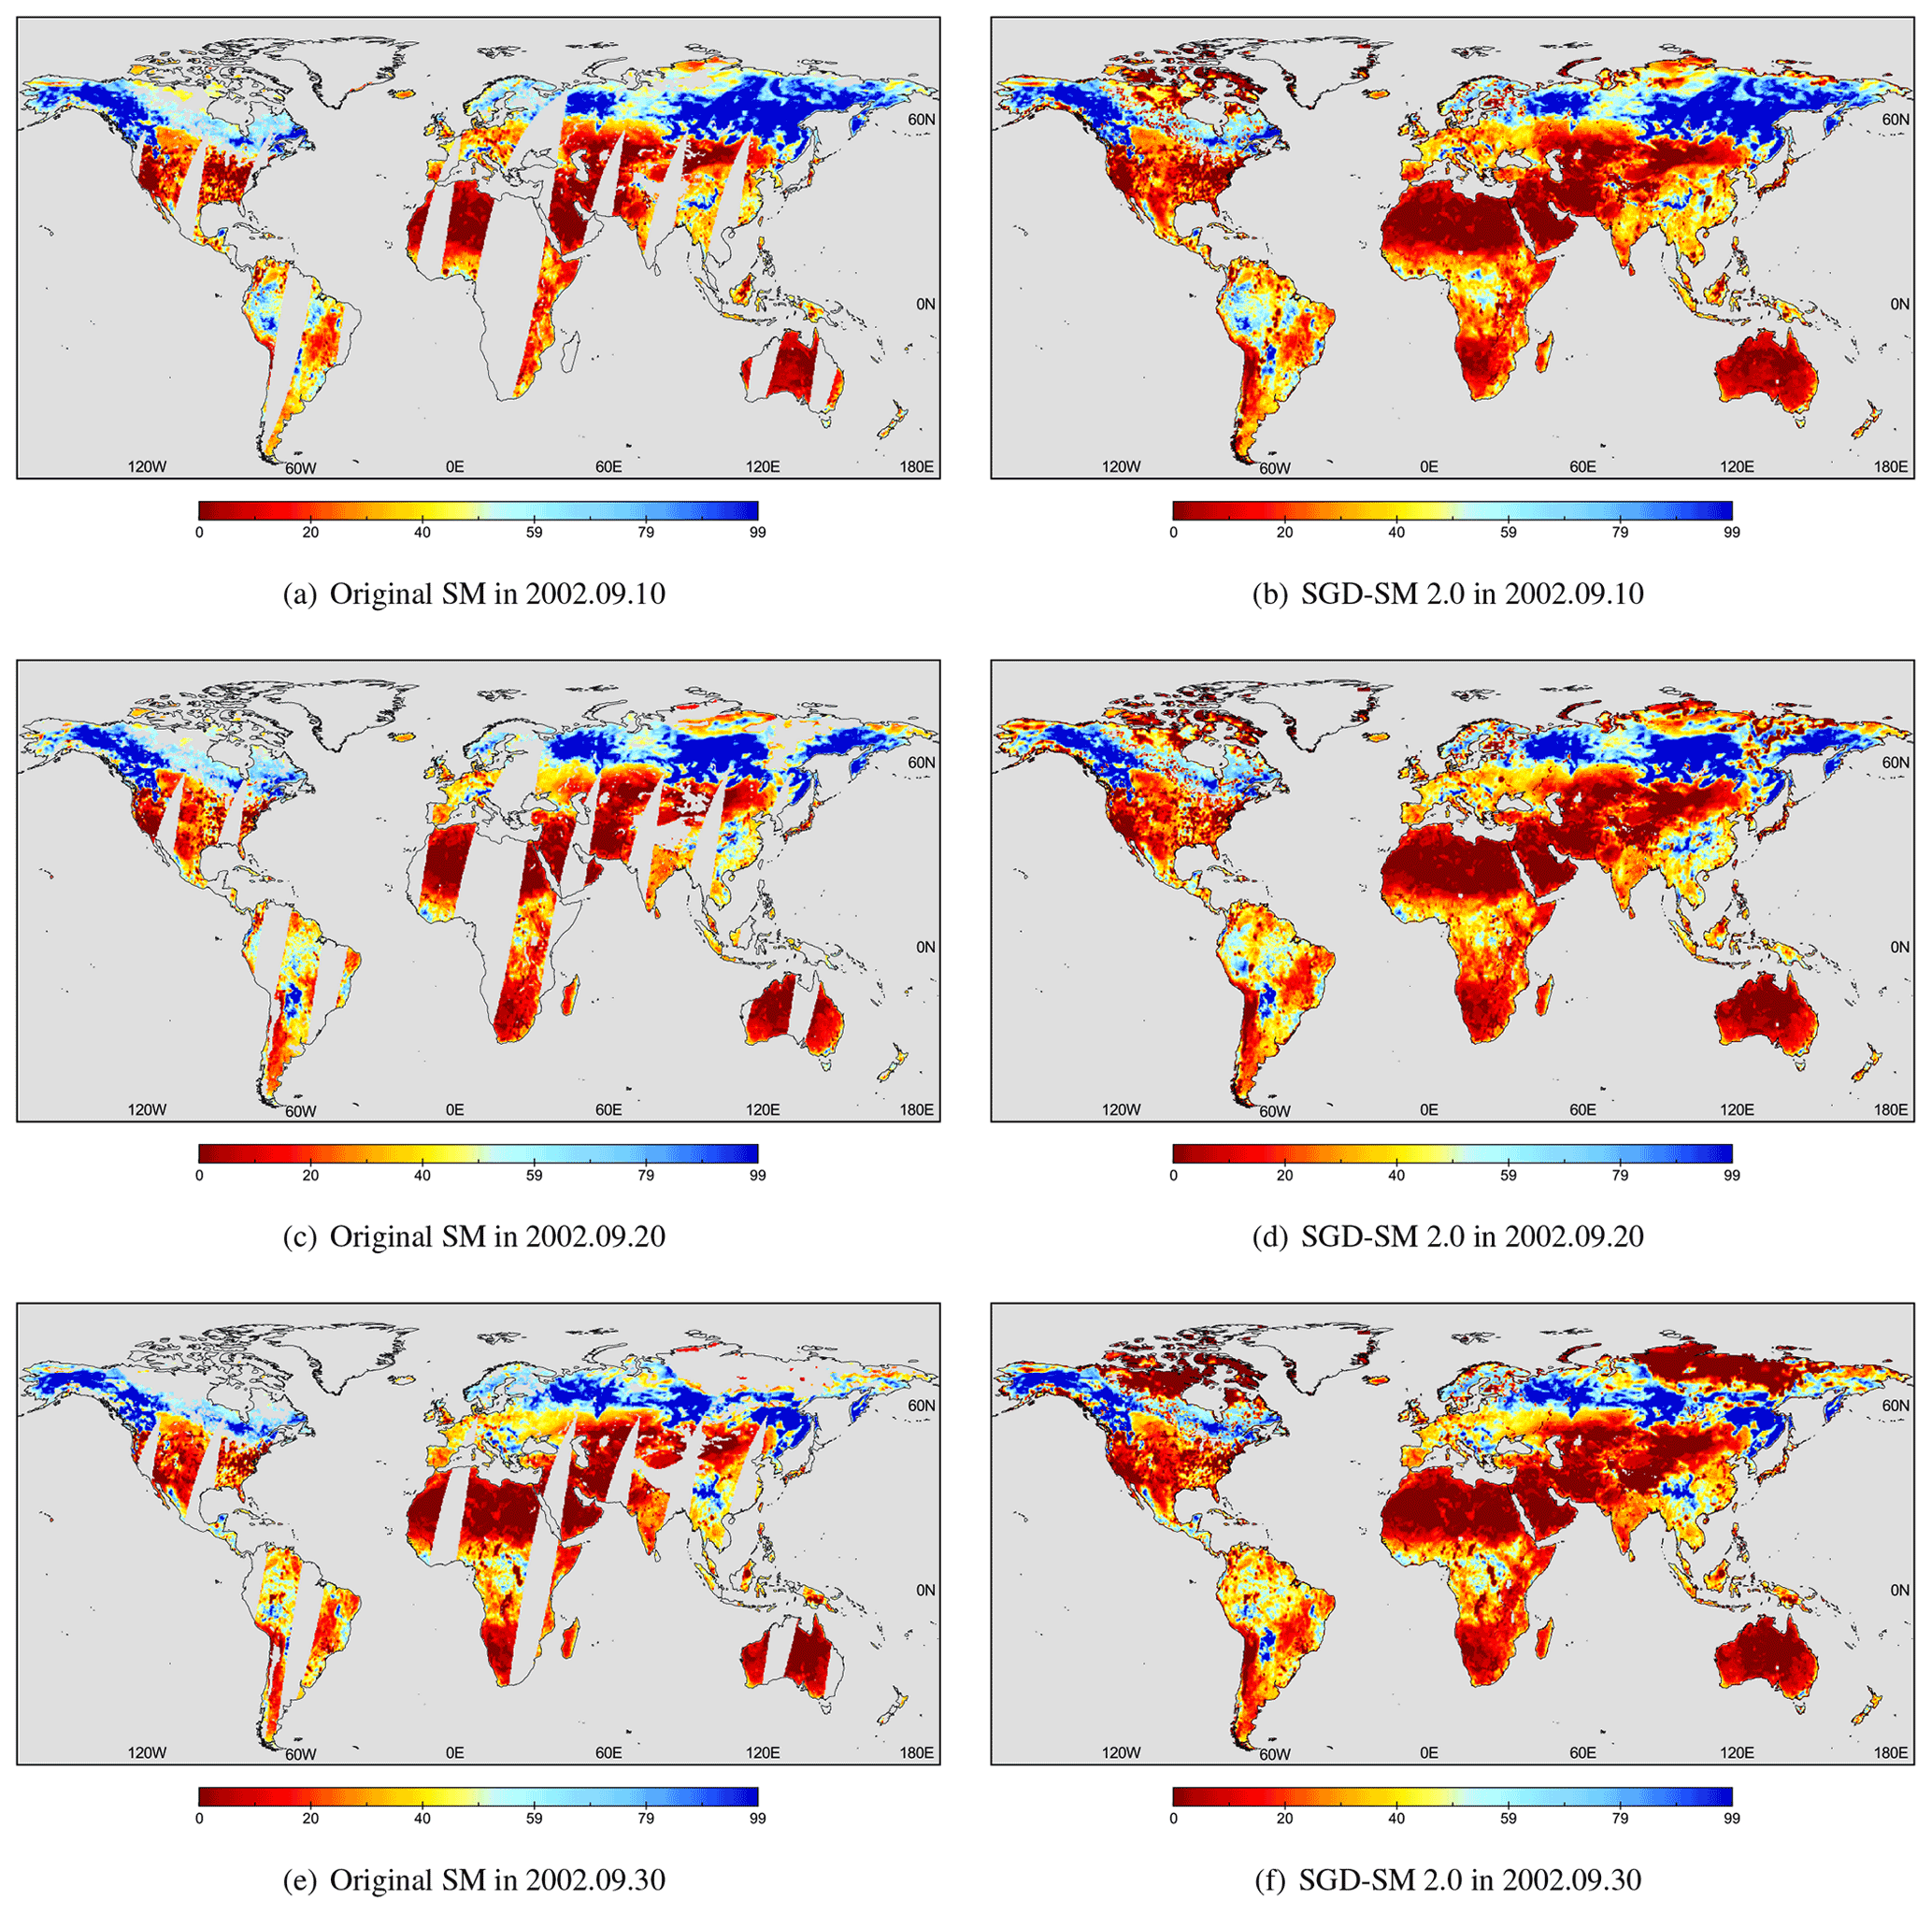
Figure 6Original SM and proposed SGD-SM 2.0 results on 10, 20 and 30 September 2002.
For comparison purposes, the left lines are the original global daily products and the right lines are the reconstructed SGD-SM 2.0 products in Figs. 6 and 7. It should be noted that we neglect all regions in Antarctica and most regions in Greenland because of the perpetual frozen soil. Clearly, gaps and missing regions are filled through the proposed framework in Sect. 3.
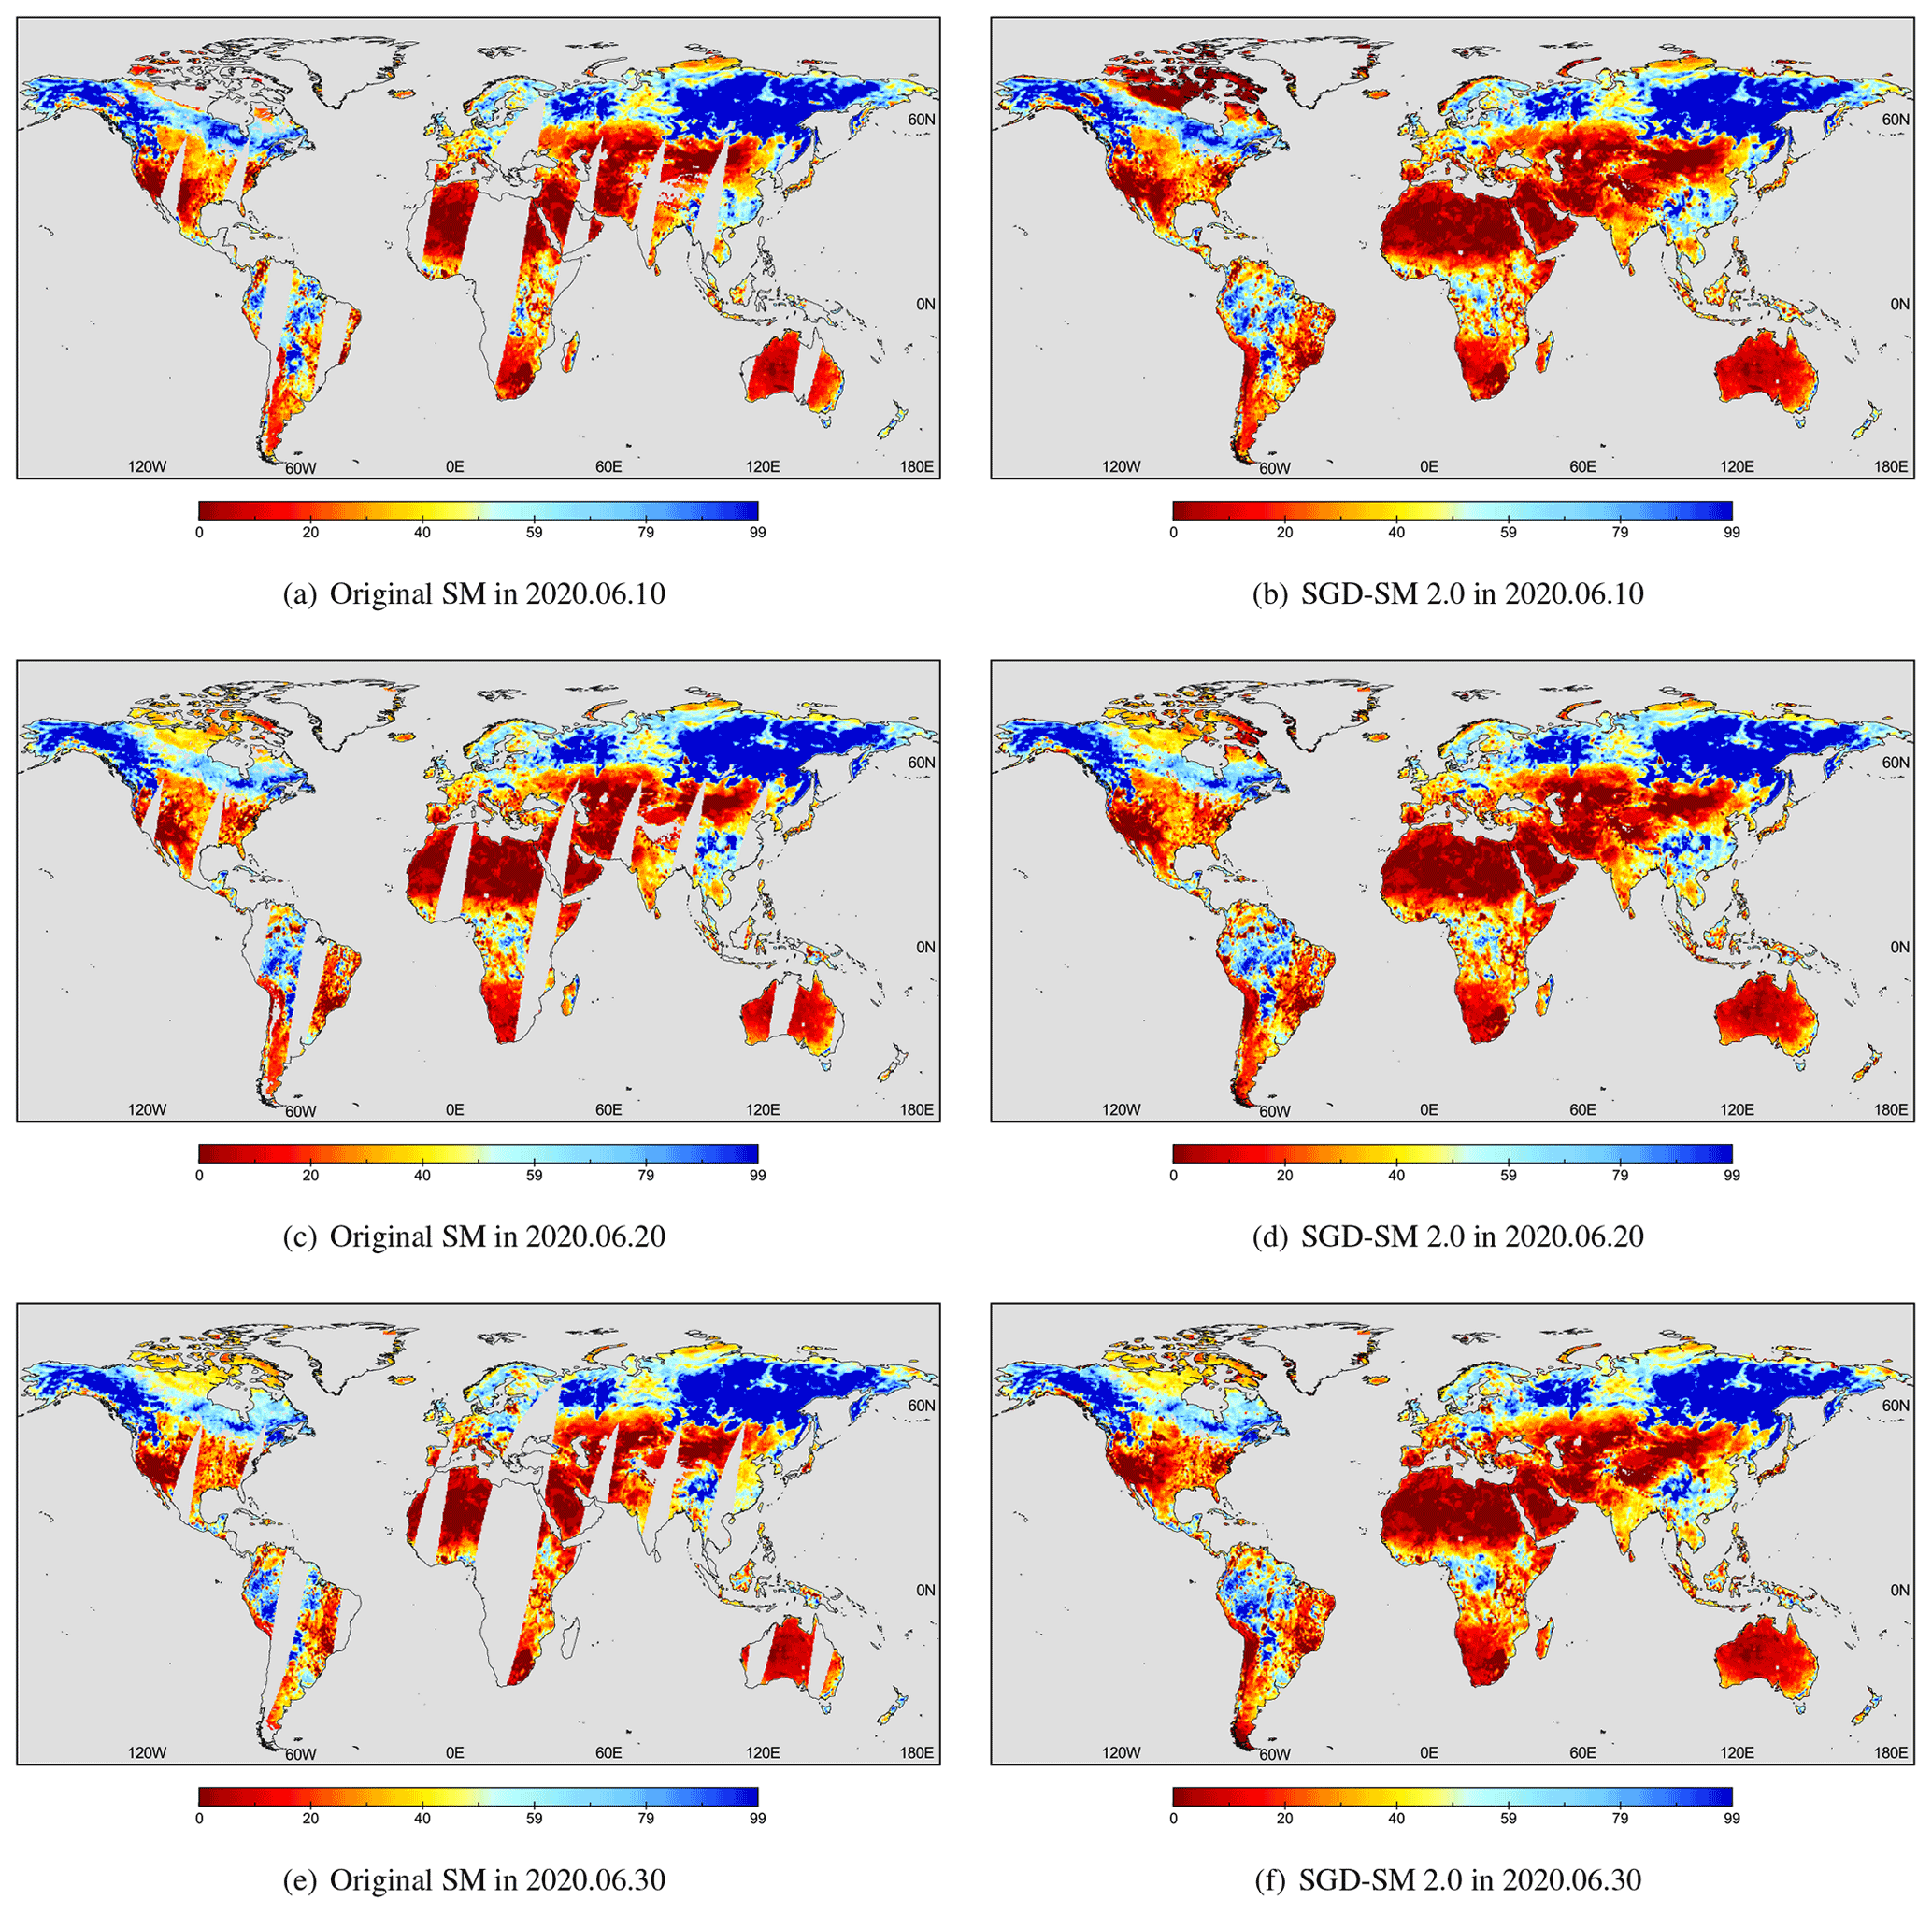
Figure 7Original SM and proposed SGD-SM 2.0 results on 10, 20 and 30 June 2020.
From the spatial perspective, the proposed SGD-SM 2.0 dataset performs both global soil moisture uniformity and local soil moisture heterogeneity in Figs. 6 and 7. It ensures the spatial consistency, especially for the gap regions with the adjoining soil moisture regions. Beyond that, the reconstructed regions in SGD-SM 2.0 do not reflect distinct patch or border effects. This also testifies to the powerful ability of the partial CNN in the proposed framework, which can effectively exclude the invalid information in gaps or missing soil moisture regions.
From the temporal perspective, the proposed SGD-SM 2.0 dataset utilises the complementary and sequential time-series soil moisture information. By fusing global daily precipitation products, SGD-SM 2.0 can consider the sporadic extreme weather conditions for a single day. In addition, by means of the LSTM model, the consistent temporal information can be recovered and preserved in Figs. 6 and 7.
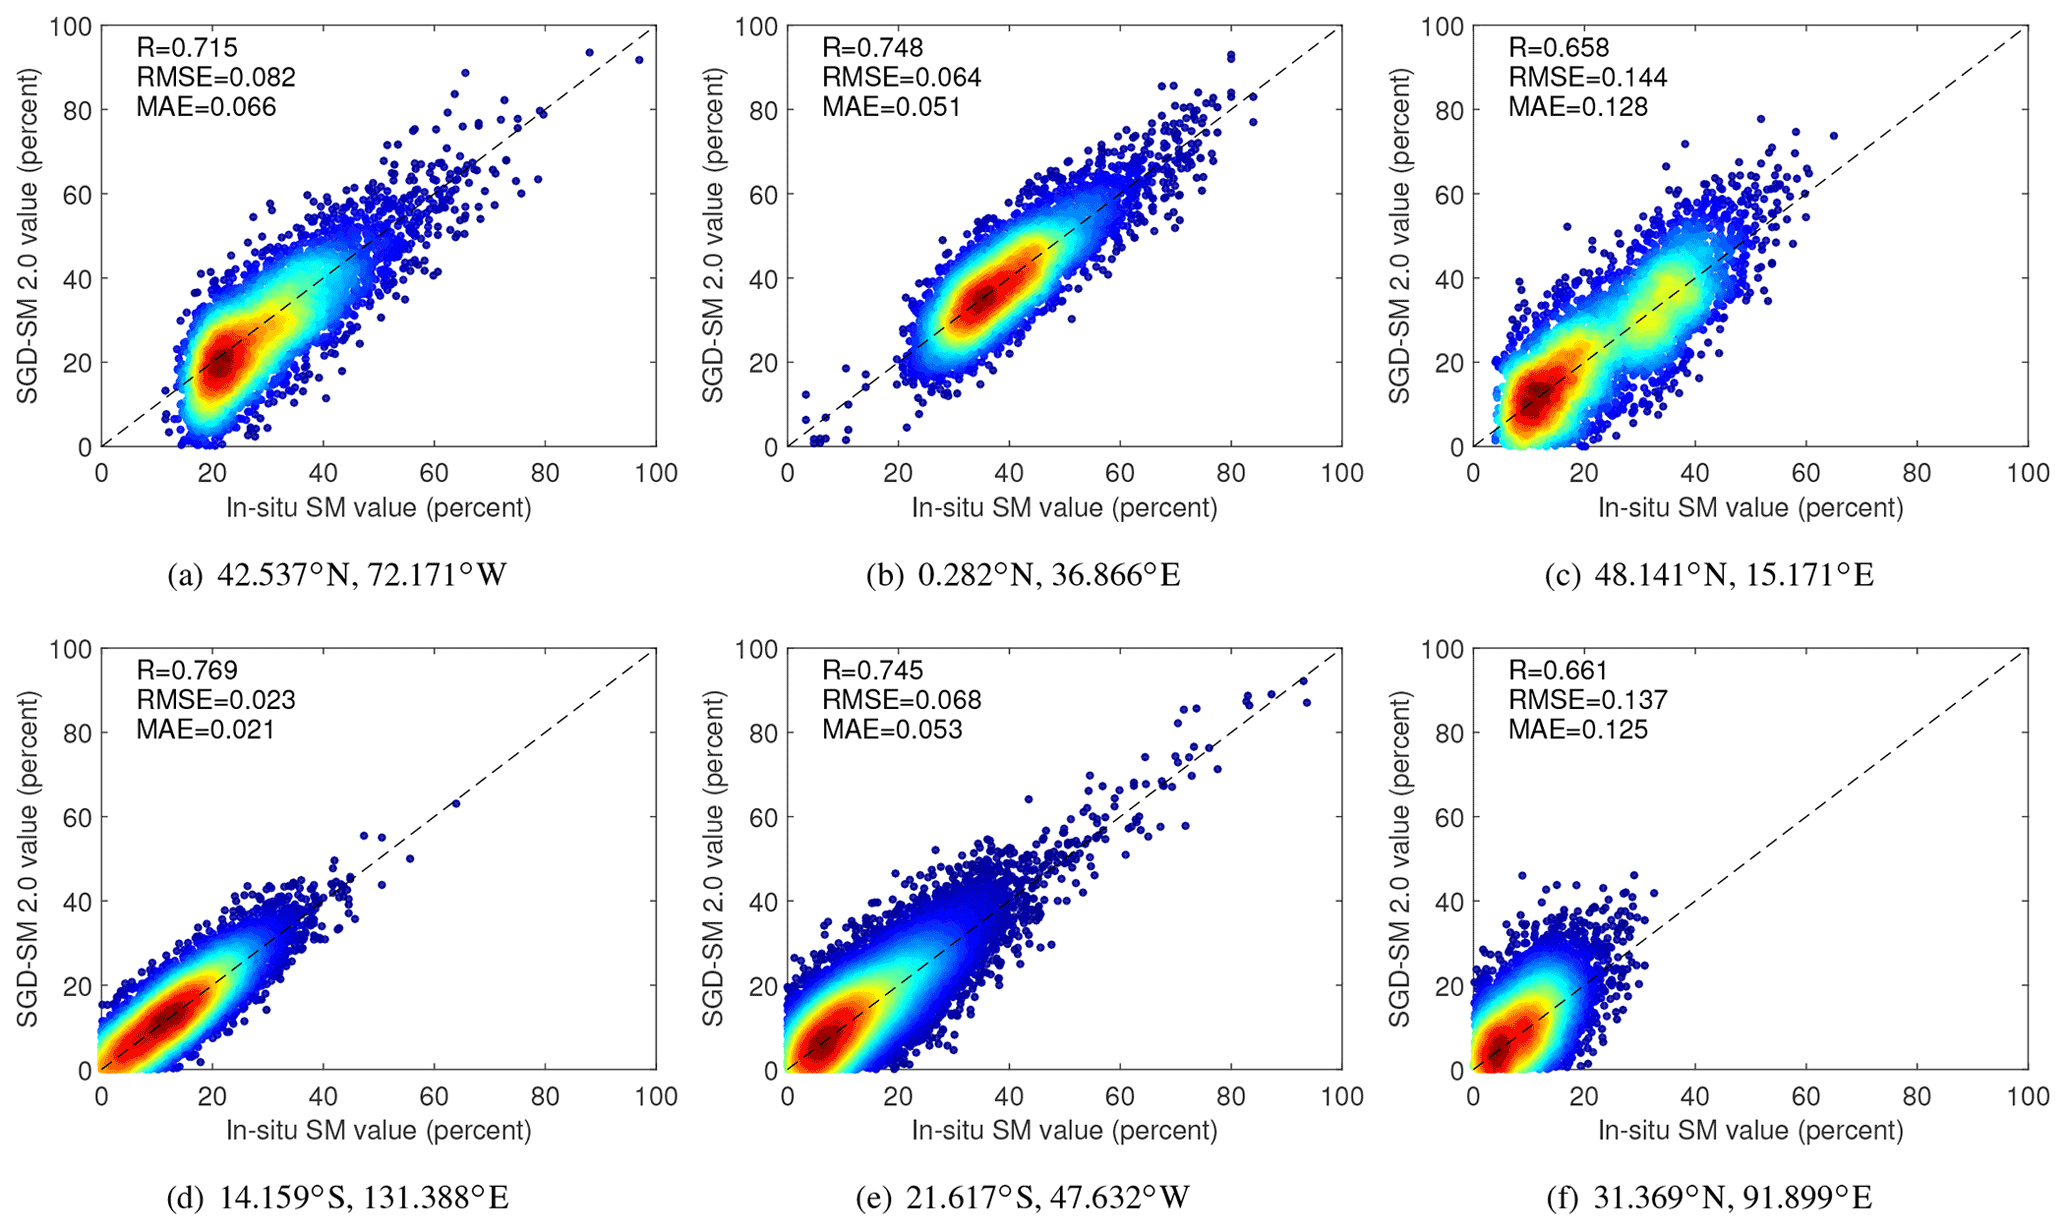
Figure 8Scatters of six in situ sites (horizontal coordinate refers to the in situ data; vertical coordinate denotes the reconstructing data).
4.2 In situ validation
In situ validation is the most reliable method to measure the accuracy and availability of the proposed SGD-SM 2.0 dataset (Walker et al., 2004; Draper et al., 2009; Zeng et al., 2015b). In this work, we choose 124 in situ surface (0–5 cm depth) soil moisture sites from the ISMN, as shown in Fig. 3b. The selected in situ values are limited from 2002 to 2022. We match the hourly in situ values with the descending products. In consideration of validation reliability, we choose the two neighbouring in situ values that correspond with the observation time of soil moisture products. We then average them as the ground-truth data.
As portrayed in Fig. 8, the scatters of six in situ soil moisture sites (marked as blue circles in Fig. 3b: 42.537∘ N, 72.171∘ W; 0.282∘ N, 36.866∘ E; 48.141∘ N, 15.171∘ E; 14.159∘ S, 131.388∘ E; 21.617∘ S, 47.632∘ W; 31.369∘ N, 91.899∘ E) are displayed to demonstrate the reconstructing accuracy of SGD-SM 2.0. The horizontal coordinate refers to in situ data. Accordingly, the vertical coordinate denotes reconstructing data in gaps or missing soil moisture regions. The time range is limited from 2002 to 2022. The R indicators of these sites are varied from 0.658 to 0.769 in Fig. 8a–f. The RMSE and MAE indicators of these sites are varied from 0.023 to 0.144 and from 0.021 to 0.128, respectively in Fig. 8a–f.
Table 1Comparisons between the original SM and SGD-SM 2.0 products (from 2002 to 2022) in the 124 selected in situ sites.
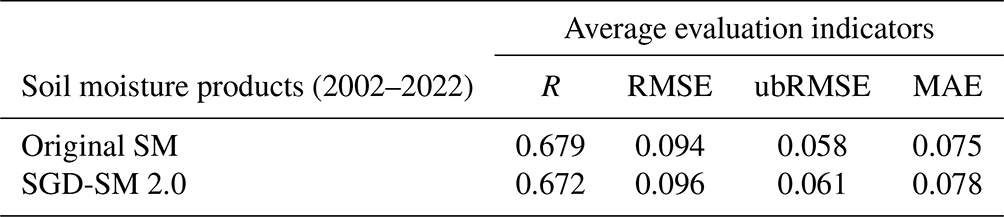
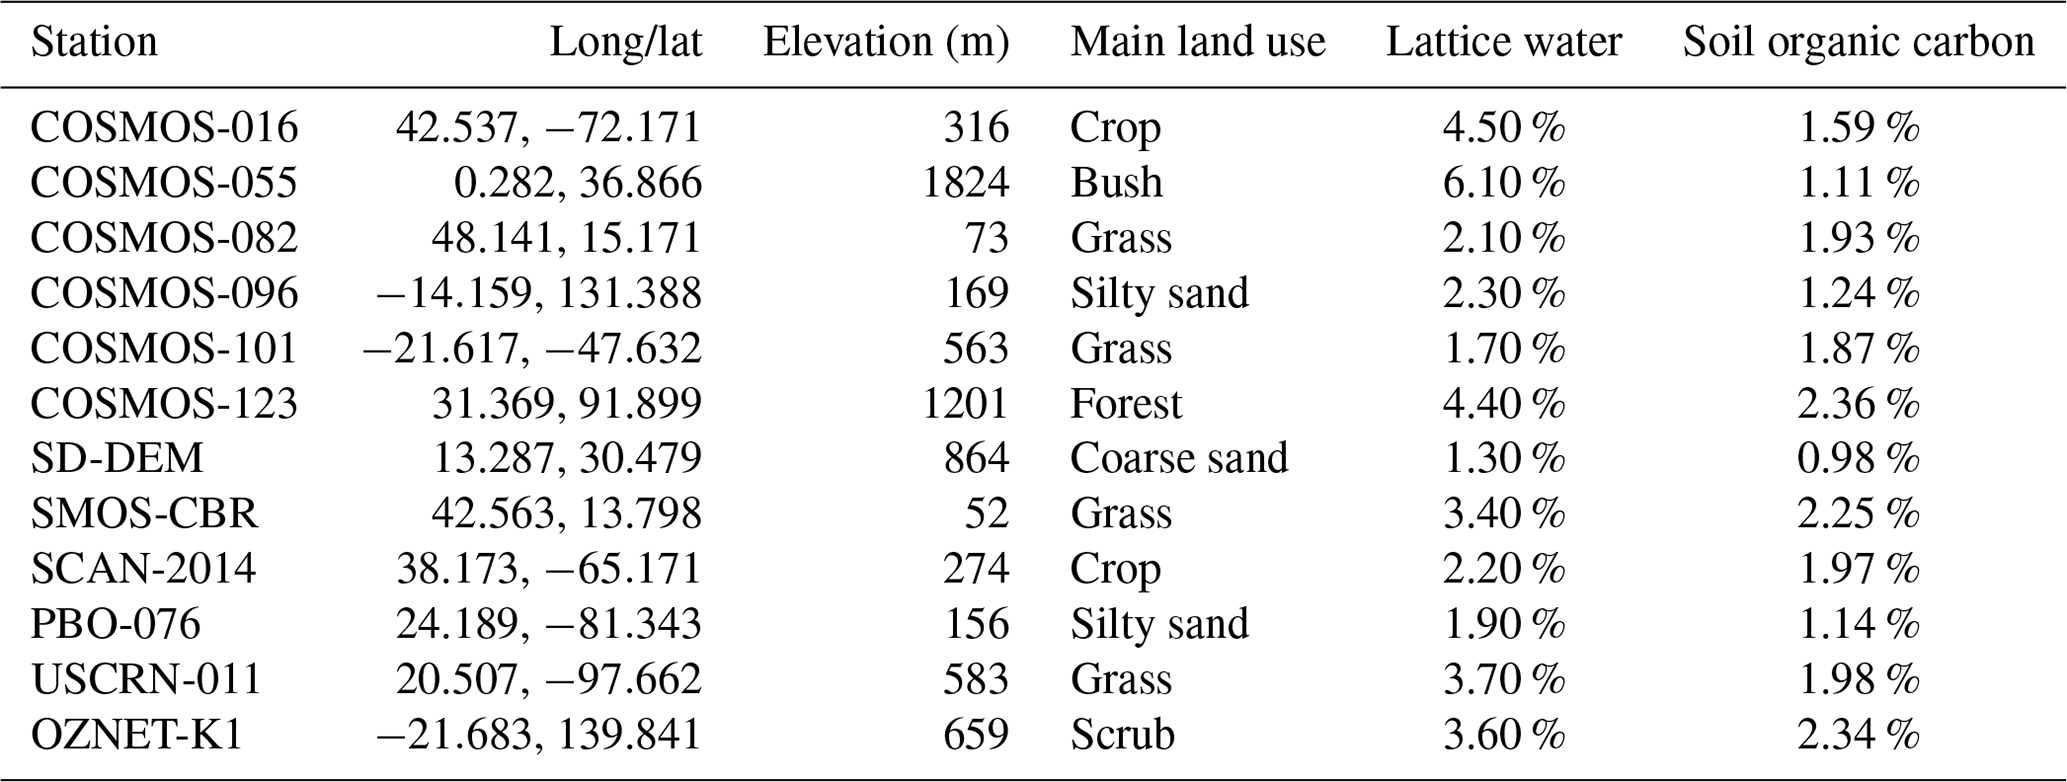
In all 124 selected in situ sites, Table 1 compares the original products with the SGD-SM 2.0 products. The average evaluation indicators (R, RMSE, and MAE) of the original SM (SGD-SM 2.0) products are 0.679 (0.672), 0.094 (0.096) and 0.075 (0.078), respectively. Generally, the precision of SGD-SM 2.0 products performs similar with incipient products. The diversities of those indicators are few between the original and reconstructed SGD-SM 2.0 products in Table 1. To a certain extent, in situ validation testifies to the reconstructed accuracy and validity of the SGD-SM 2.0 products. These 124 selected soil moisture stations from the ISMN (2002–2022) are shown in Table 2 for validating SGD-SM 2.0. Besides, basic information about the representative in situ soil moisture sites (taking partial sites as examples, including COSMOS, SD-DEM, SMOS-CBR, SCAN, PBO, USCRN and OZNET networks) is listed in Table 3. As the example, it includes the name of the station, country, longitude/latitude, main land use, lattice water, and soil organic carbon.
Table 2124 selected soil moisture stations from the ISMN (2002–2022) for validating SGD-SM 2.0.
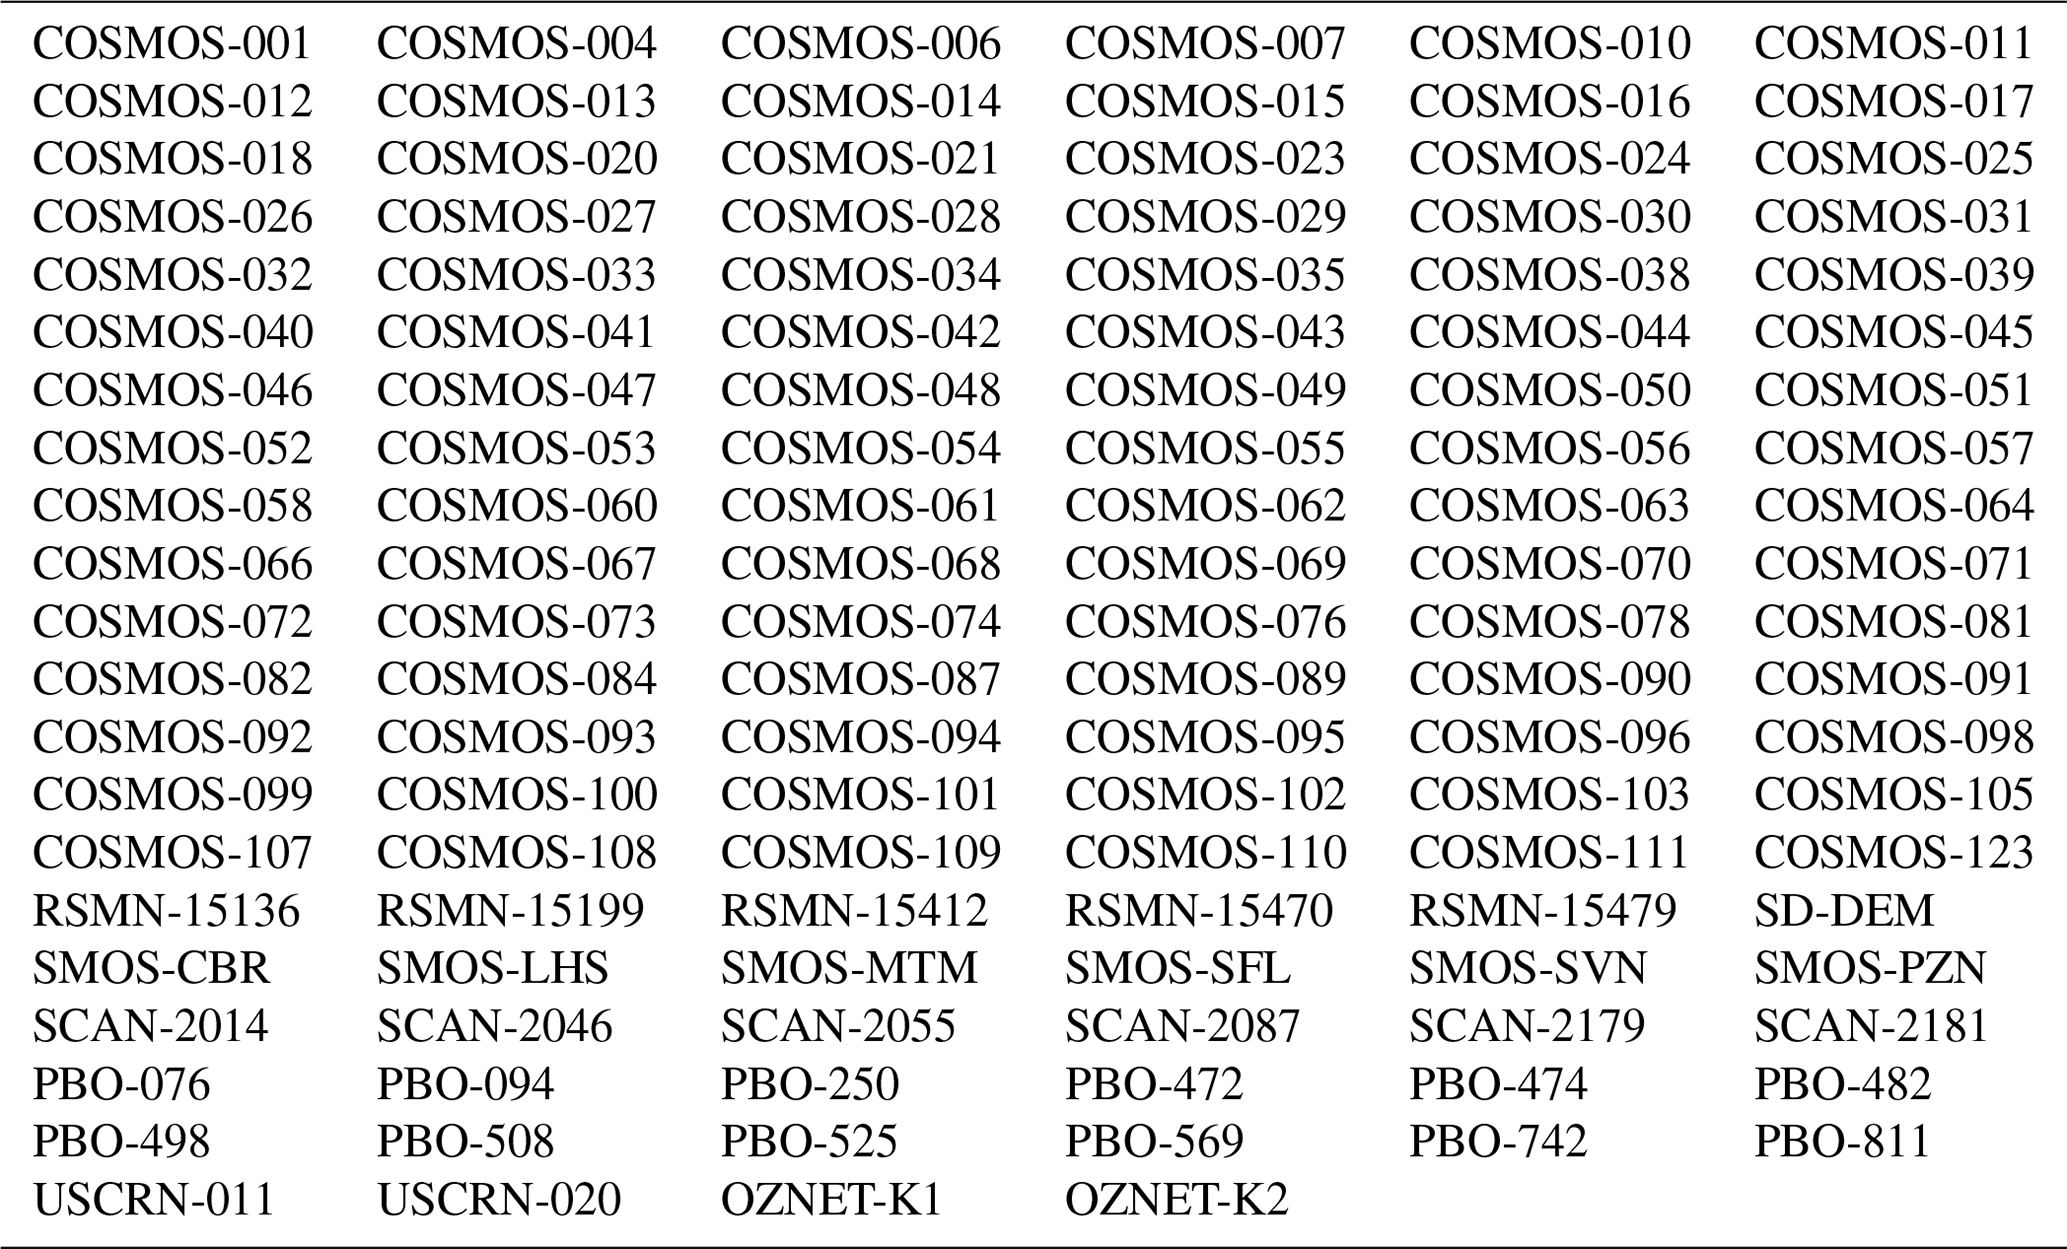
Table 3Basic information about the in situ soil moisture sites (taking partial sites as examples).
4.3 Time-series validation
Long-term daily soil moisture products usually reflect typical time-series continuity (Wang et al., 2022; Seneviratne et al., 2010). Therefore, we can utilise this characteristic to validate the reliability of SGD-SM 2.0 products. As listed in Figs. 9 and 10, 2 time-series daily original/SGD-SM 2.0 results of 2003–2018 and 2005–2020, are given in the location (10.125∘ S, 42.625∘ W) and the location (38.375∘ N, 117.125∘ E), respectively. The blue dots refer to the existing valid values in Figs. 9 and 10. The red dots stand for the SGD-SM 2.0 values in Figs. 9 and 10, which also represents the invalid gaps or missing soil moisture regions. The vertical coordinate denotes the percent of soil moisture product in original and SGD-SM 2.0 products. The horizontal coordinate denotes the annual date number between 2003 and 2020.
As depicted in Figs. 9a–d and 10a–d, a majority of the reconstructed SGD-SM 2.0 values (in invalid gaps or missing soil moisture regions) can distinctly embody the time-series continuity. In the two locations of different years, original soil moisture values and corresponding adjacent SGD-SM 2.0 values perform fore-and-aft consistency. If current valid soil moisture values behave high or low, their neighbouring SGD-SM 2.0 values also accord with them in Figs. 9 and 10. This time-series validation manifests the reliability of the proposed framework and validity of our improved SGD-SM 2.0 products. Generally, the proposed SGD-SM 2.0 products are able to ensure the time-series continuity in daily temporal resolution. This point is greatly important for reconstructing long-term products. Benefiting from the utilisation of temporal information, the proposed LSTM model can extract and transmit time-series features for filling the gaps and missing data regions in daily soil moisture products. Therefore, SGD-SM 2.0 can be effectively applied for global hydrology monitoring analysis at fine-temporal scale, rather than the traditional monthly or yearly averaging operation. The former preserves the original daily temporal resolution, while the latter sacrifices this daily temporal resolution. This validation exactly demonstrates the above significance of the proposed SGD-SM 2.0 dataset.
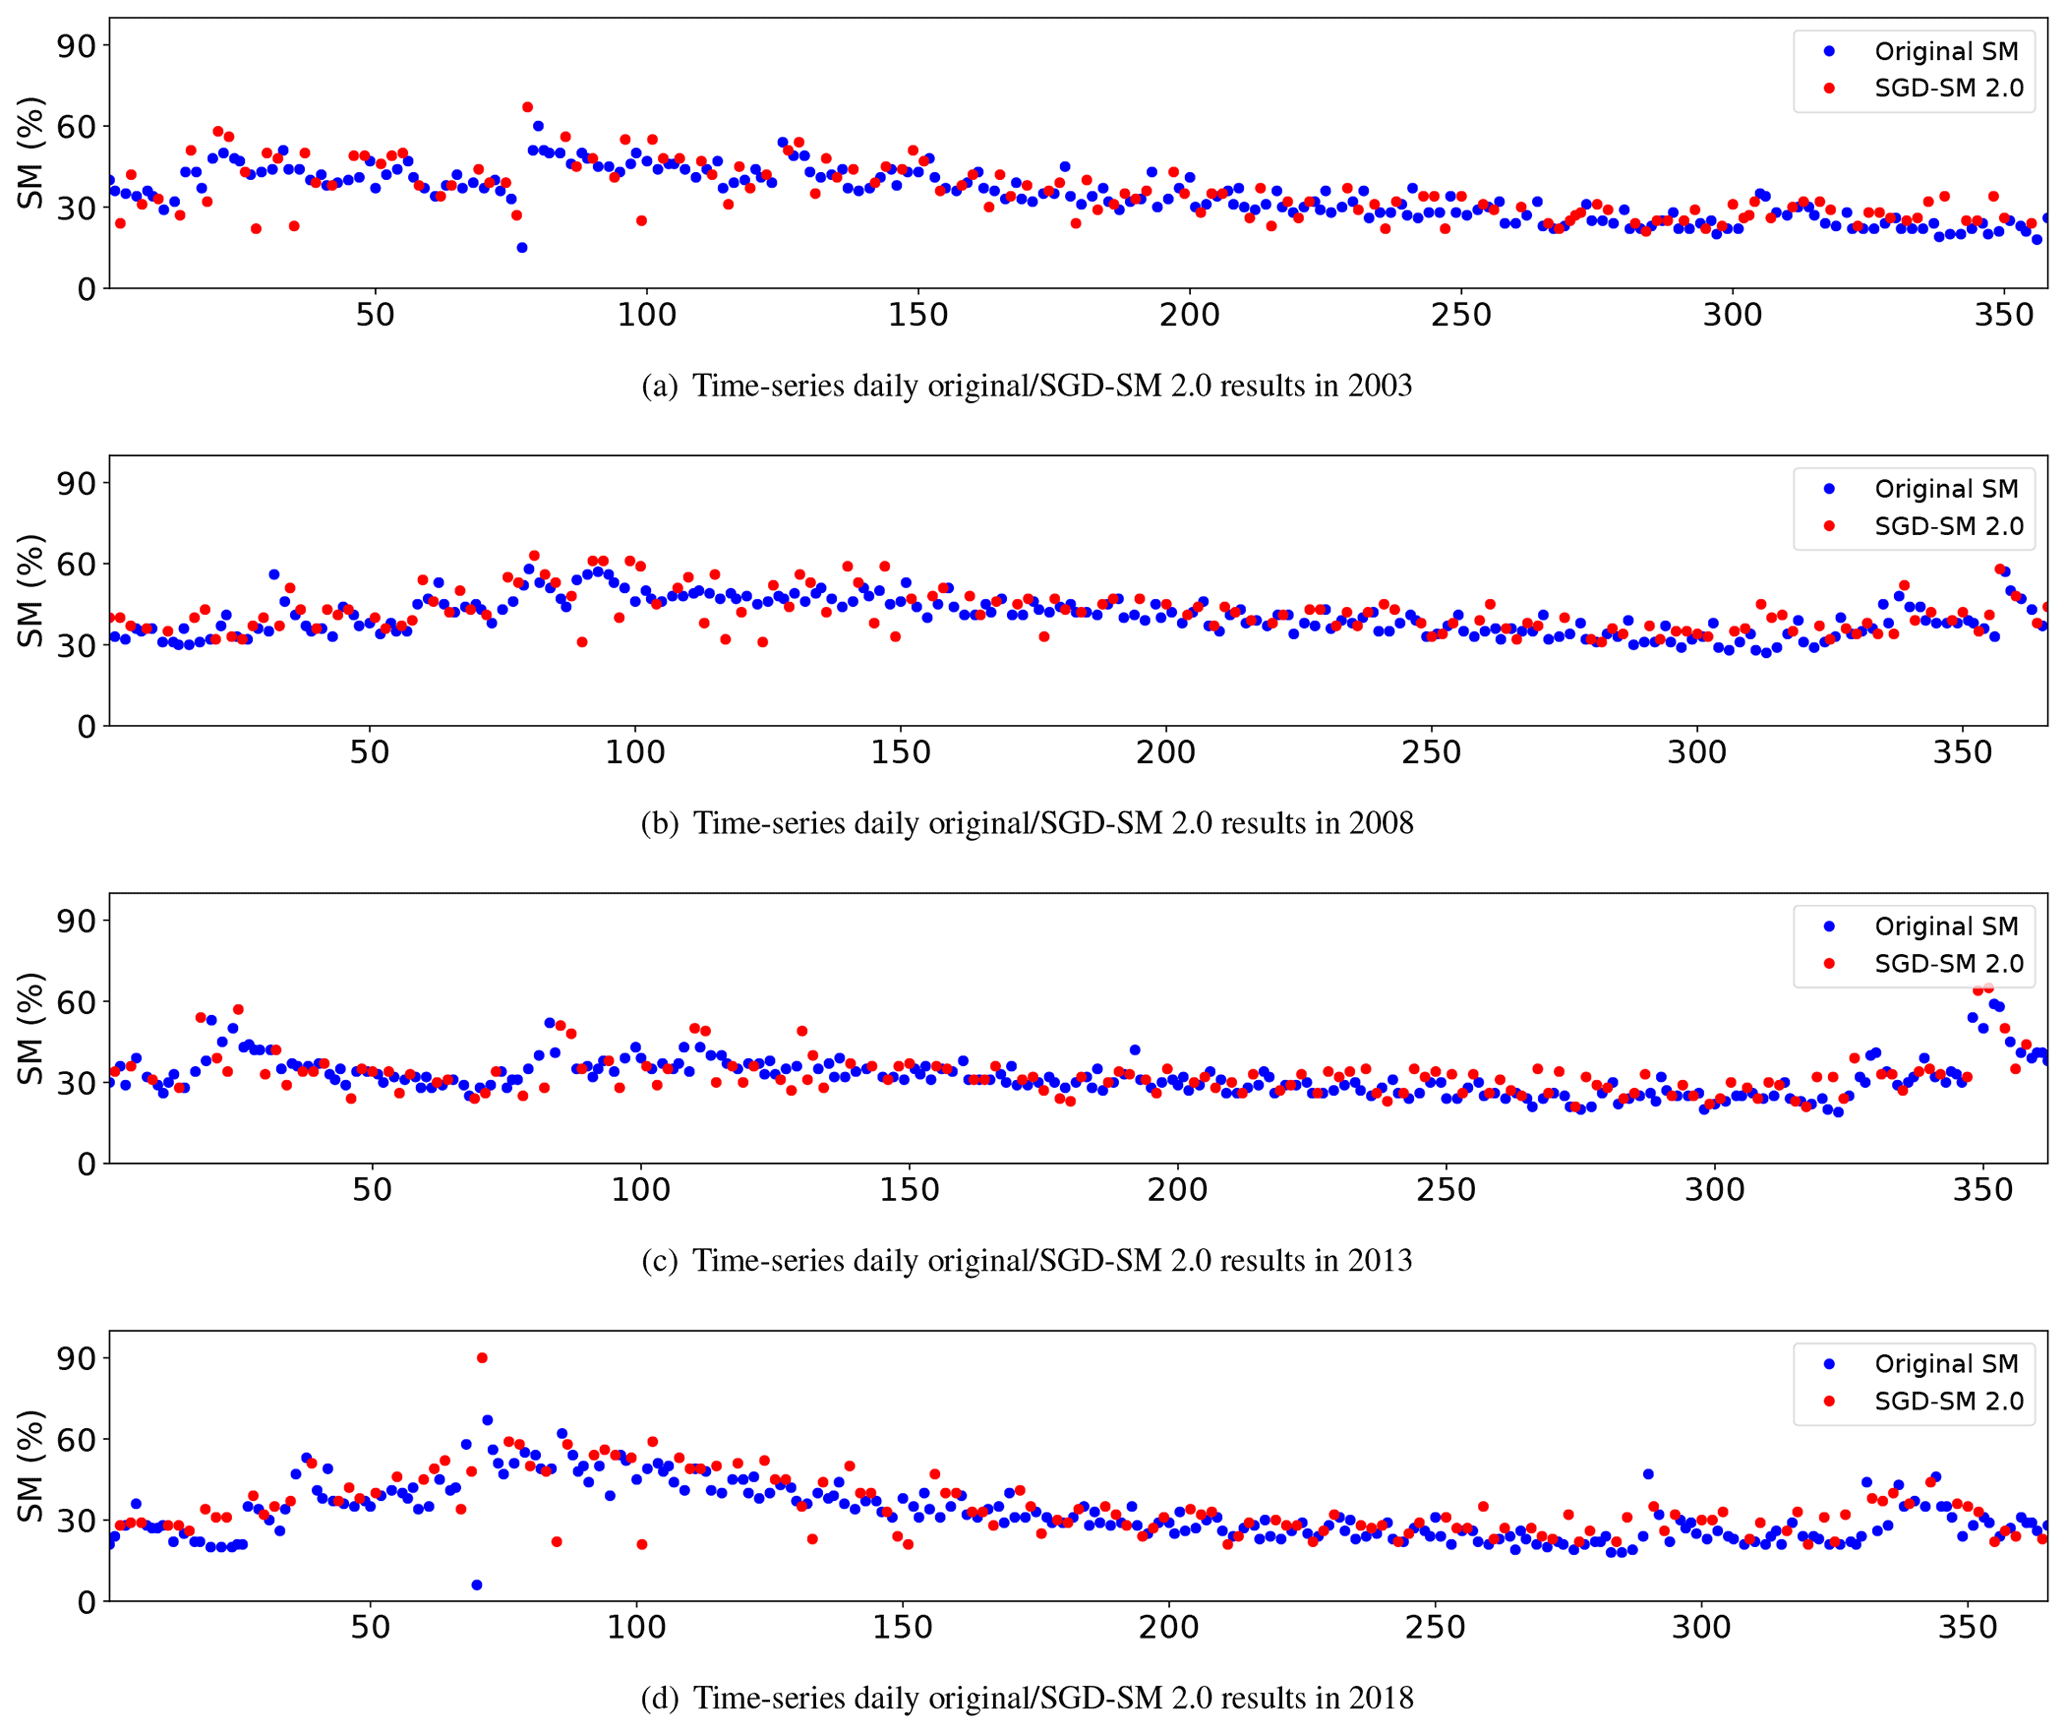
Figure 9Time-series daily original/SGD-SM 2.0 results of the location (10.125∘ S, 42.625∘ W) in 2003, 2008, 2013 and 2018.
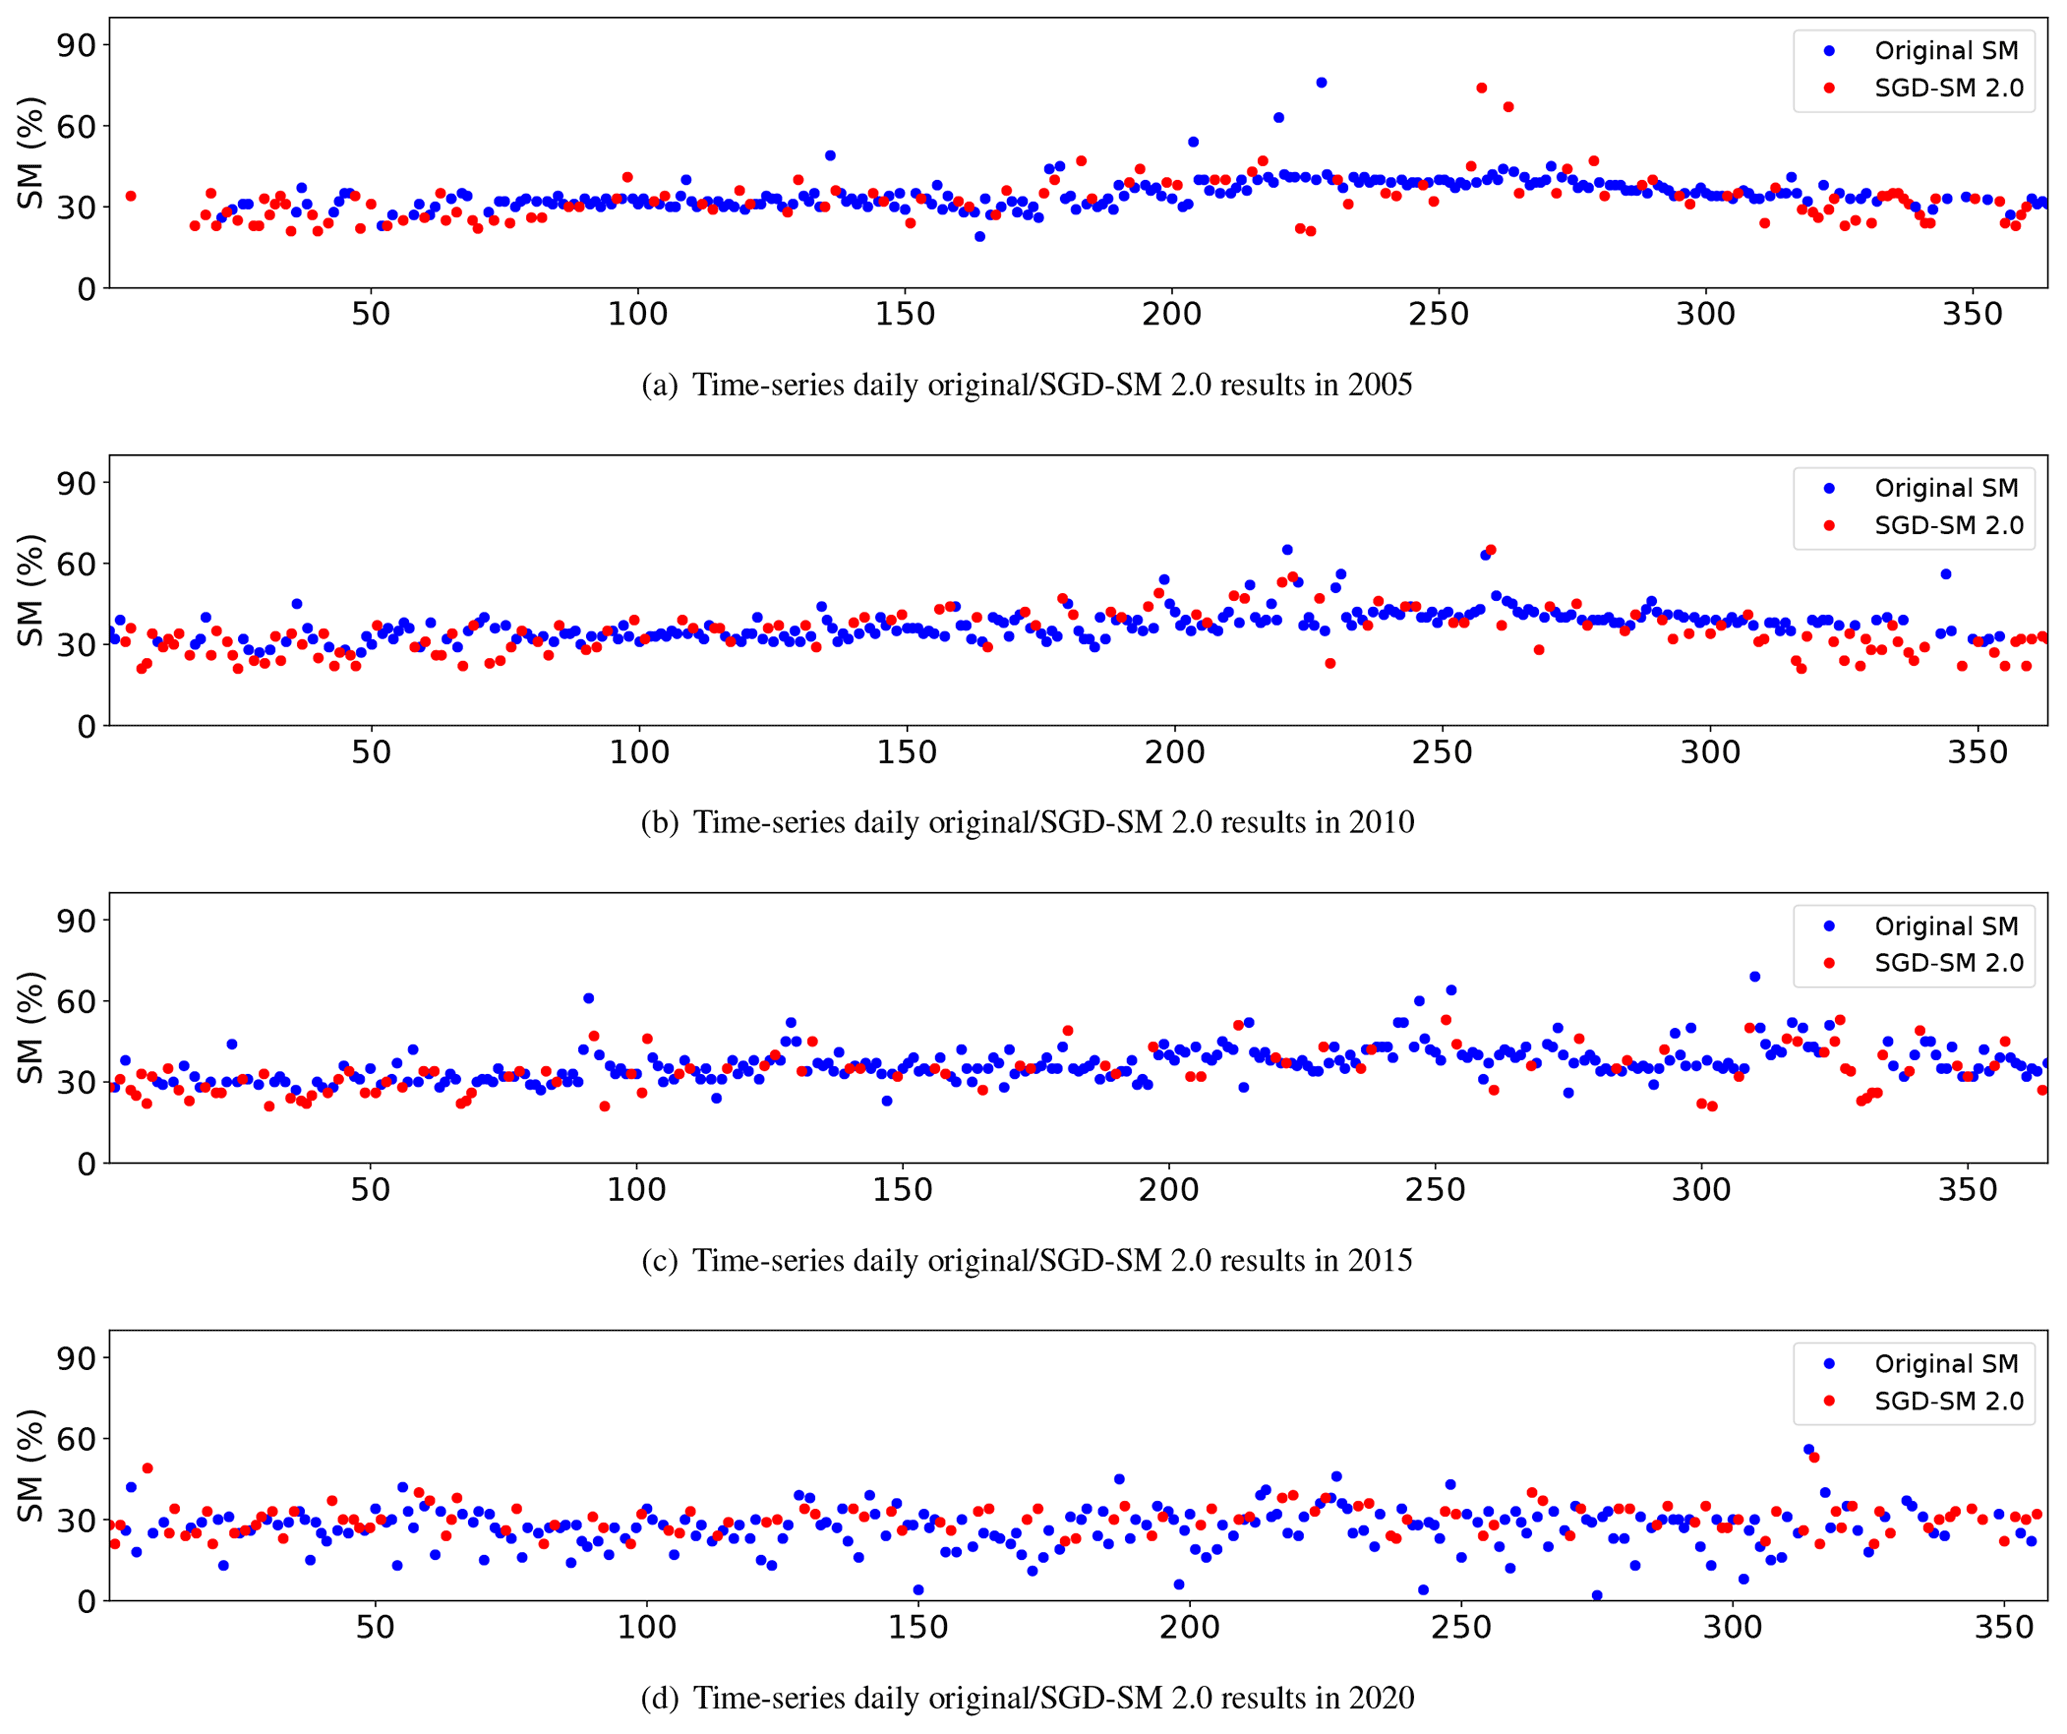
Figure 10Time-series daily original/SGD-SM 2.0 results of the location (38.375∘ N, 117.125∘ E) in 2005, 2010, 2015 and 2020.
In this section, we compare the proposed SGD-SM 2.0 dataset with the previous SGD-SM 1.0 dataset, from the perspectives of reconstructing accuracy and time-series consistency. In contrast with SGD-SM 1.0, we fuse the global daily precipitation products into the reconstructing framework. In addition, the LSTM-CNN model is developed to fill the gaps and missing regions in SGD-SM 2.0 global daily soil moisture products. Detailed comparisons between the SGD-SM 1.0 and SGD-SM 2.0 datasets are displayed below.
5.1 Reconstructing accuracy
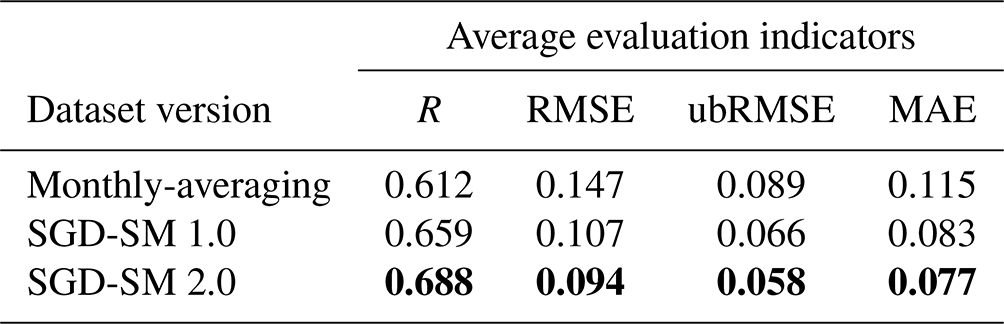
For ensuring the same time scope with SGD-SM 1.0, we choose the part of SGD-SM 2.0 from 2013 to 2019. The average evaluation indicators (R, RMSE, and MAE) of monthly-averaging, SGD-SM 1.0 and SGD-SM 2.0 datasets in selective 124 in situ sites are contrasted in Table 4.
Compared with monthly-averaging and SGD-SM 1.0 products, SGD-SM 2.0 products outperform on R (0.688), RMSE (0.094) and MAE (0.077). The main reason is that SGD-SM 1.0 ignores the sudden extreme weather conditions for 1 d. If a sudden precipitation occurs in 1 d, while there are no abnormalities before and after this day, SGD-SM 1.0 usually behaves with poor performance under this condition. Accordingly, SGD-SM 2.0 introduces the global daily precipitation products into the reconstructing framework. Through fusing auxiliary precipitation information, SGD-SM 2.0 products can consider the sudden extreme weather conditions for a single day in global daily soil moisture products. The comparisons validate the effectiveness of this point in Table 4.
Table 4Comparisons between the SGD-SM 1.0 and SGD-SM 2.0 products (from 2013 to 2019) through selected 124 in situ sites. The best indexes are marked as bold format.
5.2 Time-series consistency
Except the reconstructing accuracy, time-series consistency is also significant for seamless products (Wang et al., 2021). As portrayed in Fig. 11a and b, we simultaneously depict time-series daily original soil moisture, SGD-SM 1.0/2.0, and precipitation results of the location (48.875∘ N, 140.375∘ E) in 2013, respectively. The blue dots refer to existing valid values in Fig. 11. The red dots stand for the SGD-SM 1.0/2.0 values in Fig. 11, which also represents the invalid gaps or missing soil moisture regions. The left vertical coordinate denotes the percent of soil moisture product in the original and SGD-SM 1.0/2.0 products. The right vertical coordinate refers to the daily precipitation value (unit: mm) by the IMERG precipitation products.
Compared with SGD-SM 1.0, SGD-SM 2.0 outperforms on time-series consistency in Fig. 11a and b. The reconstructed SGD-SM 2.0 dots behave more consecutively around their adjacent original SM dots than SGD-SM 1.0. A discrete problem in Fig. 11a exists in SGD-SM 1.0, to some degree. Benefiting from the data fusion of daily precipitation information, the proposed LSTM model can extract time-series features for filling the gaps and missing regions in daily soil moisture products. Therefore, SGD-SM 2.0 can be utilised effectively for global hydrology monitoring analysis at fine (daily) temporal resolution.
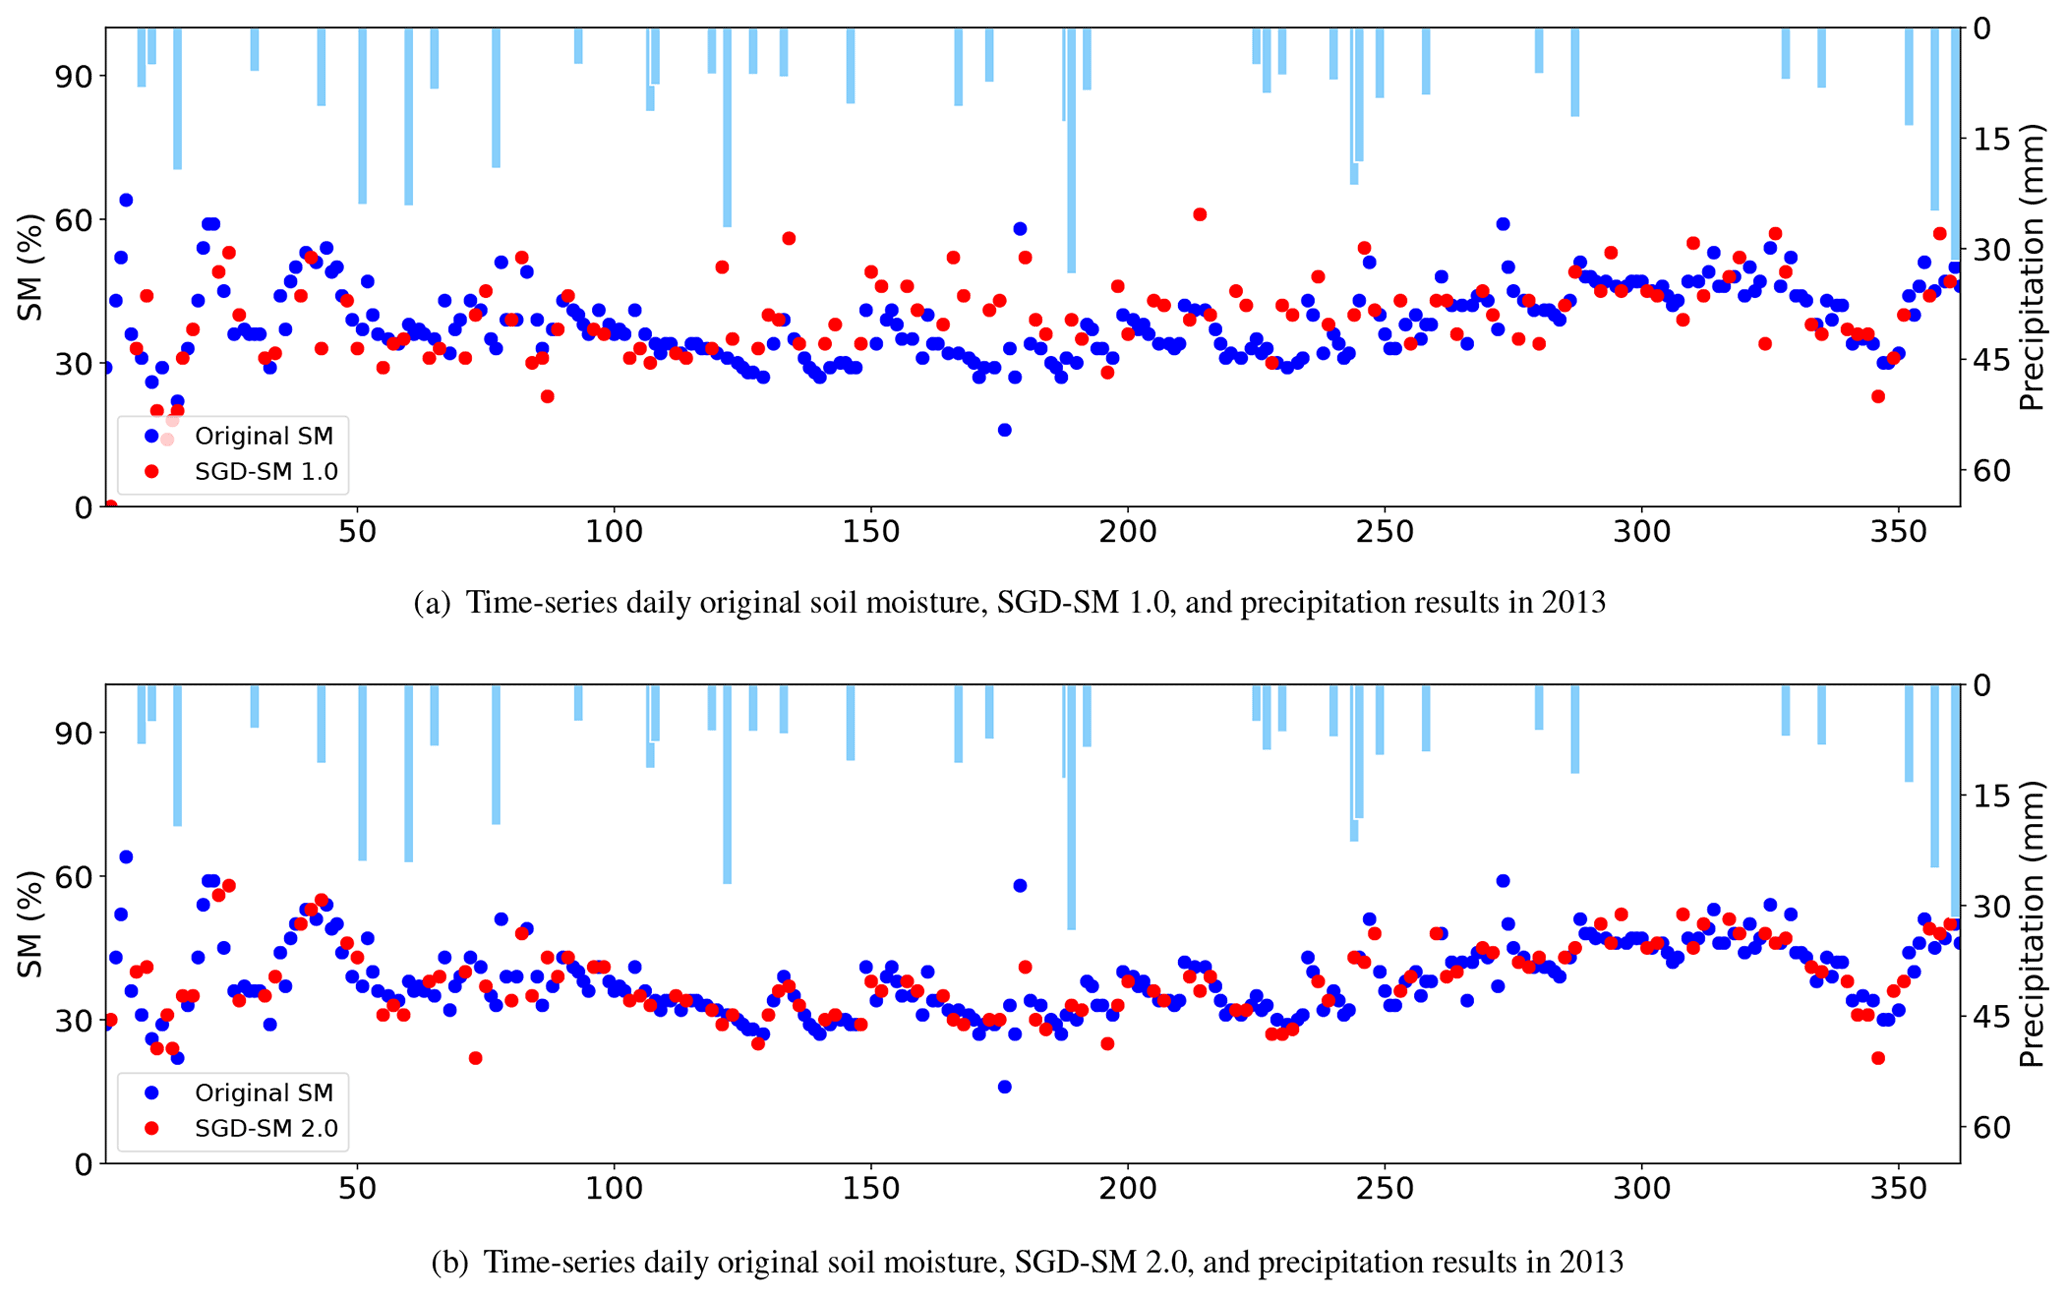
Figure 11Time-series daily original soil moisture, SGD-SM 1.0/2.0, and precipitation results at location (48.875∘ N, 140.375∘ E) in 2013.
5.3 Uncertainty analysis
The uncertainty of SGD-SM 2.0 and the proposed model could be classified into three types: (1) the errors of original AMSR-E/WindSat/AMSR2 products; (2) the meteorological factors; (3) the generalisation of the proposed reconstructing model.
-
The errors of original AMSR-E/WindSat/AMSR2 products. The proposed SGD-SM product is generated based on original AMSR-E/WindSat/AMSR2 products. Errors also exist in these passive soil moisture products (i.e. above 0.8 m3 m−3), due to the satellite sensor imaging and soil moisture retrieval algorithm. As shown in Table 1, the R, RMSE and MAE evaluation indexes of the original products are 0.679, 0.094 and 0.075, respectively. These errors are also inevitably transmitted into the generated SGD-SM 2.0 products. In other words, SGD-SM 2.0 absolutely trusts the initial satellite-based SM values without any hesitation.
-
The meteorological factors. The proposed method relies on the temporal continuity and spatial consistency for daily soil moisture gap-filling. Nevertheless, if the unusual meteorology occurs in a single day, such as precipitation and snowfall, it may disturb the above-mentioned assumption and influence the reconstructing effects. This uncertainty can be noticed in time-series validation, especially for the rainy season. Although we fuse the daily precipitation products into the proposed model in SGD-SM 2.0, it still cannot adequately reflect the emergency meteorological factors such as brief precipitation.
-
The generalisation of proposed reconstructing model. In this work, we train the proposed LSTM-CNN model through selecting complete soil moisture patches all over the world. In addition, the simulated masks are also chosen from the daily soil moisture products. However, differences between the training data and testing data still exist, such as land covering type and mask size. This uncertainty may disturb the generalisation of the proposed LSTM-CNN model for SGD-SM 2.0, to some degree.
The proposed SGD-SM 2.0 dataset can be acquired from https://doi.org/10.5281/zenodo.6041561 (Zhang et al., 2022).
In this paper, we generate an improved seamless global daily soil moisture (SGD-SM 2.0) dataset from 2002 to 2022. Compared with the previous SGD-SM 1.0, the temporal range of SGD-SM 2.0 is extended to 20 years from 2002 to 2022. The SGD-SM 2.0 dataset fuses the global daily precipitation products with global daily soil moisture products. In addition, the SGD-SM 2.0 dataset develops an integrated LSTM-CNN model to fill the gaps and missing regions. In situ validation and time-series validation testify to the soil moisture time-series of SGD-SM 2.0 products (R: 0.672, RMSE: 0.096, MAE: 0.078). In contrast with SGD-SM 1.0, the time-series curves of the improved SGD-SM 2.0 products are consistency with the original daily time-series soil moisture values.
In our future work (SGD-SM 3.0), we will fuse multi-source data such as global land cover products and land surface temperature into the reconstructed framework. More spatio-temporal models will be exploited to generate the prospective products. In addition, we will introduce the outlier filtering strategy to exclude this initial soil moisture exception information (above 80 % volume. Identifying outliers by comparing the soil moisture data product with the porosity information from the global soil database SoilGrid will also be utilised in SGD-SM 3.0.
QZ presented the algorithm and carried out the experimental results. QY, TJ and MS polished the entire manuscript. FS downloaded soil moisture products and precipitation products in this work. All authors checked and gave related comments for this work.
The contact author has declared that none of the authors has any competing interests.
Publisher's note: Copernicus Publications remains neutral with regard to jurisdictional claims in published maps and institutional affiliations.
This work was supported in part by the National Natural Science Foundation of China under grant no. 41922008, 61971319 and 61971082. We appreciatively acknowledge GES DISC and ISMN for releasing related products and in situ sites.
This work was supported in part by the National Natural Science Foundation of China under grants 41922008, 61971319 and 61971082.
This paper was edited by Giulio G.R. Iovine and reviewed by four anonymous referees.
Al Bitar, A., Mialon, A., Kerr, Y. H., Cabot, F., Richaume, P., Jacquette, E., Quesney, A., Mahmoodi, A., Tarot, S., Parrens, M., Al-Yaari, A., Pellarin, T., Rodriguez-Fernandez, N., and Wigneron, J.-P.: The global SMOS Level 3 daily soil moisture and brightness temperature maps, Earth Syst. Sci. Data, 9, 293–315, https://doi.org/10.5194/essd-9-293-2017, 2017.
Berg, P., Almén, F., and Bozhinova, D.: HydroGFD3.0 (Hydrological Global Forcing Data): a 25 km global precipitation and temperature data set updated in near-real time, Earth Syst. Sci. Data, 13, 1531–1545, https://doi.org/10.5194/essd-13-1531-2021, 2021.
Bogena, H. R., Schrön, M., Jakobi, J., Ney, P., Zacharias, S., Andreasen, M., Baatz, R., Boorman, D., Duygu, M. B., Eguibar-Galán, M. A., Fersch, B., Franke, T., Geris, J., González Sanchis, M., Kerr, Y., Korf, T., Mengistu, Z., Mialon, A., Nasta, P., Nitychoruk, J., Pisinaras, V., Rasche, D., Rosolem, R., Said, H., Schattan, P., Zreda, M., Achleitner, S., Albentosa-Hernández, E., Akyürek, Z., Blume, T., del Campo, A., Canone, D., Dimitrova-Petrova, K., Evans, J. G., Ferraris, S., Frances, F., Gisolo, D., Güntner, A., Herrmann, F., Iwema, J., Jensen, K. H., Kunstmann, H., Lidón, A., Looms, M. C., Oswald, S., Panagopoulos, A., Patil, A., Power, D., Rebmann, C., Romano, N., Scheiffele, L., Seneviratne, S., Weltin, G., and Vereecken, H.: COSMOS-Europe: a European network of cosmic-ray neutron soil moisture sensors, Earth Syst. Sci. Data, 14, 1125–1151, https://doi.org/10.5194/essd-14-1125-2022, 2022.
Brocca, L., Ciabatta, L., Massari, C., Moramarco, T., Hahn, S., Hasenauer, S., Kidd, R., Dorigo, W., Wagner, W., and Levizzani, V.: Soil as a natural rain gauge: Estimating global rainfall from satellite soil moisture data, J. Geophys. Res.-Atmos., 119, 5128–5141, https://doi.org/10.1002/2014JD021489, 2014a.
Brocca, L., Zucco, G., Mittelbach, H., Moramarco, T., and Seneviratne, S. I.: Absolute versus temporal anomaly and percent of saturation soil moisture spatial variability for six networks worldwide, Water Resour. Res., 50, 5560–5576, https://doi.org/10.1002/2014WR015684, 2014b.
Brocca, L., Tarpanelli, A., Filippucci, P., Dorigo, W., Zaussinger, F., Gruber, A., and Fernández-Prieto, D.: How much water is used for irrigation? A new approach exploiting coarse resolution satellite soil moisture products, Int. J. Appl. Earth Obs., 73C, 752–766, https://doi.org/10.1016/j.jag.2018.08.023, 2018.
Brocca, L., Filippucci, P., Hahn, S., Ciabatta, L., Massari, C., Camici, S., Schüller, L., Bojkov, B., and Wagner, W.: SM2RAIN–ASCAT (2007–2018): global daily satellite rainfall data from ASCAT soil moisture observations, Earth Syst. Sci. Data, 11, 1583–1601, https://doi.org/10.5194/essd-11-1583-2019, 2019.
Chen, Y., Feng, X., and Fu, B.: An improved global remote-sensing-based surface soil moisture (RSSSM) dataset covering 2003–2018, Earth Syst. Sci. Data, 13, 1–31, https://doi.org/10.5194/essd-13-1-2021, 2021.
Dorigo, W., de Jeu, R., Chung, D., Parinussa, R., Liu, Y., Wagner, W., and Fernández-Prieto, D.: Evaluating global trends (1988–2010) in harmonized multi-satellite surface soil moisture, Geophys. Res. Lett., 39, 1–7, https://doi.org/10.1029/2012GL052988, 2012.
Dorigo, W., Himmelbauer, I., Aberer, D., Schremmer, L., Petrakovic, I., Zappa, L., Preimesberger, W., Xaver, A., Annor, F., Ardö, J., Baldocchi, D., Bitelli, M., Blöschl, G., Bogena, H., Brocca, L., Calvet, J.-C., Camarero, J. J., Capello, G., Choi, M., Cosh, M. C., van de Giesen, N., Hajdu, I., Ikonen, J., Jensen, K. H., Kanniah, K. D., de Kat, I., Kirchengast, G., Kumar Rai, P., Kyrouac, J., Larson, K., Liu, S., Loew, A., Moghaddam, M., Martínez Fernández, J., Mattar Bader, C., Morbidelli, R., Musial, J. P., Osenga, E., Palecki, M. A., Pellarin, T., Petropoulos, G. P., Pfeil, I., Powers, J., Robock, A., Rüdiger, C., Rummel, U., Strobel, M., Su, Z., Sullivan, R., Tagesson, T., Varlagin, A., Vreugdenhil, M., Walker, J., Wen, J., Wenger, F., Wigneron, J. P., Woods, M., Yang, K., Zeng, Y., Zhang, X., Zreda, M., Dietrich, S., Gruber, A., van Oevelen, P., Wagner, W., Scipal, K., Drusch, M., and Sabia, R.: The International Soil Moisture Network: serving Earth system science for over a decade, Hydrol. Earth Syst. Sci., 25, 5749–5804, https://doi.org/10.5194/hess-25-5749-2021, 2021.
Dorigo, W. A., Wagner, W., Hohensinn, R., Hahn, S., Paulik, C., Xaver, A., Gruber, A., Drusch, M., Mecklenburg, S., van Oevelen, P., Robock, A., and Jackson, T.: The International Soil Moisture Network: a data hosting facility for global in situ soil moisture measurements, Hydrol. Earth Syst. Sci., 15, 1675–1698, https://doi.org/10.5194/hess-15-1675-2011, 2011.
Dorigo, W. A., Xaver, A., Vreugdenhil, M., Gruber, A., Hegyiová, A., Sanchis-Dufau, A. D., Zamojski, D., Cordes, C., Wagner, W., and Drusch, M.: Global automated quality control of in situ soil moisture data from the international soil moisture network, Vadose Zone J., 12, 1–21, https://doi.org/10.2136/vzj2012.0097, 2013.
Draper, C., Walker, J., Steinle, P., De Jeu, R., and Holmes, T. R: An evaluation of AMSR–E derived soil moisture over Australia, Remote Sens. Environ., 113, 703–710, https://doi.org/10.1016/j.rse.2008.11.011, 2009.
Enenkel, M., Reimer, C., Dorigo, W., Wagner, W., Pfeil, I., Parinussa, R., and De Jeu, R.: Combining satellite observations to develop a global soil moisture product for near-real-time applications, Hydrol. Earth Syst. Sci., 20, 4191–4208, https://doi.org/10.5194/hess-20-4191-2016, 2016.
Fan, Y. and van den Dool, H.: Climate prediction center global monthly soil moisture data set at 0.5° resolution for 1948 to present, J. Geophys. Res., 109, D10102, https://doi.org/10.1029/2003JD004345, 2004.
Gruber, A., De Lannoy, G., Albergel, C., Al-Yaari, A., Brocca, L., Calvet, J. C., and Wagner, W.: Validation practices for satellite soil moisture retrievals: What are (the) errors?, Remote Sens. Environ., 244, 111806, https://doi.org/10.1016/j.rse.2020.111806, 2020.
Guevara, M., Taufer, M., and Vargas, R.: Gap-free global annual soil moisture: 15 km grids for 1991–2018, Earth Syst. Sci. Data, 13, 1711–1735, https://doi.org/10.5194/essd-13-1711-2021, 2021.
Long, D., Shen, Y., and Sun, A.: Drought and flood monitoring for a large karst plateau in Southwest China using extended GRACE data, Remote Sens. Environ., 155, 145–160, https://doi.org/10.1016/j.rse.2014.08.006, 2014.
Long, D., Bai, L., and Yan, L.: Generation of spatially complete and daily continuous surface soil moisture of high spatial resolution, Remote Sens. Environ., 233, 111364, https://doi.org/10.1016/j.rse.2019.111364, 2019.
Long, D., Yang W. T., Scanlon, B. R., Zhao, J. S., Liu, D. G., Burek, P., Pan, Y., You, L. Z., and Wada, Y.: South-to-North water diversion stabilizing Beijing’s groundwater levels, Nat. Commun., 11, 1863‒-1880, https://doi.org/10.1038/s41467-020-17428-6, 2020.
Massari, C., Brocca, L., Pellarin, T., Abramowitz, G., Filippucci, P., Ciabatta, L., Maggioni, V., Kerr, Y., and Fernandez Prieto, D.: A daily 25 km short-latency rainfall product for data-scarce regions based on the integration of the Global Precipitation Measurement mission rainfall and multiple-satellite soil moisture products, Hydrol. Earth Syst. Sci., 24, 2687–2710, https://doi.org/10.5194/hess-24-2687-2020, 2020.
McColl, K. A., Alemohammad, S. H., and Akbar, R.: The global distribution and dynamics of surface soil moisture, Nat. Geosci., 10, 100–104, https://doi.org/10.1038/NGEO2868, 2017.
Meng, X., Mao, K., Meng, F., Shi, J., Zeng, J., Shen, X., Cui, Y., Jiang, L., and Guo, Z.: A fine-resolution soil moisture dataset for China in 2002–2018, Earth Syst. Sci. Data, 13, 3239–3261, https://doi.org/10.5194/essd-13-3239-2021, 2021.
Nepal, S., Pradhananga, S., Shrestha, N. K., Kralisch, S., Shrestha, J. P., and Fink, M.: Space–time variability in soil moisture droughts in the Himalayan region, Hydrol. Earth Syst. Sci., 25, 1761–1783, https://doi.org/10.5194/hess-25-1761-2021, 2021.
Njoku, E., Jackson, T., Lakshmi, V., Chan, T., and Nghiem, S.: Soil moisture retrieval from AMSR-E, IEEE T. Geosci. Remote, 41, 215–229, https://doi.org/10.1109/TGRS.2002.808243, 2003.
Pellarin, T., Tran, T., Cohard, J.-M., Galle, S., Laurent, J.-P., de Rosnay, P., and Vischel, T.: Soil moisture mapping over West Africa with a 30-min temporal resolution using AMSR-E observations and a satellite-based rainfall product, Hydrol. Earth Syst. Sci., 13, 1887–1896, https://doi.org/10.5194/hess-13-1887-2009, 2009.
Rebel, K. T., de Jeu, R. A. M., Ciais, P., Viovy, N., Piao, S. L., Kiely, G., and Dolman, A. J.: A global analysis of soil moisture derived from satellite observations and a land surface model, Hydrol. Earth Syst. Sci., 16, 833–847, https://doi.org/10.5194/hess-16-833-2012, 2012.
Schaffitel, A., Schuetz, T., and Weiler, M.: A distributed soil moisture, temperature and infiltrometer dataset for permeable pavements and green spaces, Earth Syst. Sci. Data, 12, 501–517, https://doi.org/10.5194/essd-12-501-2020, 2020.
Seneviratne, S., Corti, T., Davin, E., Hirschi, M., Jaeger, E., Lehner, I., and Teuling, A.: Investigating soil moisture–climate interactions in a changing climate: A review, Earth-Sci. Rev., 99, 125–161, https://doi.org/10.1016/j.earscirev.2010.02.004, 2010.
Shi, J., Chen, K. S., Li, Q., Jackson, T. J., O'Neill, P. E., and Tsang, L.: A parameterized surface reflectivity model and estimation of bare-surface soil moisture with L-band radiometer, IEEE T. Geosci. Remote, 40, 2674–2686, https://doi.org/10.1109/TGRS.2002.807003, 2002.
Shi, J., Jiang, L., Zhang, L., Chen, K. S., Wigneron, J. P., Chanzy, A., and Jackson, T. J.: Physically based estimation of bare-surface soil moisture with the passive radiometers, IEEE T. Geosci. Remote, 44, 3145–3153, https://doi.org/10.1109/TGRS.2006.876706, 2006.
Shi, J., Jackson, T., Tao, J., Du, J., Bindlish, R., Lu, L., and Chen, K. S.: Microwave vegetation indices for short vegetation covers from satellite passive microwave sensor AMSR-E, Remote Sens. Environ., 112, 4285–4300, https://doi.org/10.1016/j.rse.2008.07.015, 2008.
Škrk, N., Serrano-Notivoli, R., Čufar, K., Merela, M., Črepinšek, Z., Kajfež Bogataj, L., and de Luis, M.: SLOCLIM: a high-resolution daily gridded precipitation and temperature dataset for Slovenia, Earth Syst. Sci. Data, 13, 3577–3592, https://doi.org/10.5194/essd-13-3577-2021, 2021.
Sun, L. and Fu, Y.: A new merged dataset for analyzing clouds, precipitation and atmospheric parameters based on ERA5 reanalysis data and the measurements of the Tropical Rainfall Measuring Mission (TRMM) precipitation radar and visible and infrared scanner, Earth Syst. Sci. Data, 13, 2293–2306, https://doi.org/10.5194/essd-13-2293-2021, 2021.
Todd-Brown, K. E. O., Abramoff, R. Z., Beem-Miller, J., Blair, H. K., Earl, S., Frederick, K. J., Fuka, D. R., Guevara Santamaria, M., Harden, J. W., Heckman, K., Heran, L. J., Holmquist, J. R., Hoyt, A. M., Klinges, D. H., LeBauer, D. S., Malhotra, A., McClelland, S. C., Nave, L. E., Rocci, K. S., Schaeffer, S. M., Stoner, S., van Gestel, N., von Fromm, S. F., and Younger, M. L.: Reviews and syntheses: The promise of big diverse soil data, moving current practices towards future potential, Biogeosciences, 19, 3505–3522, https://doi.org/10.5194/bg-19-3505-2022, 2022.
Walker, J., Willgoose, G., and Kalma, J.: In situ measurement of soil moisture: a comparison of techniques, J. Hydrol., 293, 85–99, https://doi.org/10.1016/j.jhydrol.2004.01.008, 2004.
Wang, M., Wigneron, J. P., Sun, R., Fan, L., Frappart, F., Tao, S., and Ciais, P.: A consistent record of vegetation optical depth retrieved from the AMSR-E and AMSR2 X-band observations, Int. J. Appl. Earth Obs., 105, 102609, https://doi.org/10.1016/j.jag.2021.102609, 2021.
Wang, Q., Ding, X., Tong, X., and Atkinson, P. M.: Spatio-temporal spectral unmixing of time-series images, Remote Sens. Environ., 259, 112407, https://doi.org/10.1016/j.rse.2021.112407, 2021.
Wang, Q., Wang, L., Zhu, X., Ge, Y., Tong, X., and Atkinson, P. M.: Remote sensing image gap filling based on spatial-spectral random forest, Science of Remote Sensing, 5, 100048, https://doi.org/10.1016/j.srs.2022.100048, 2022.
Wang, Y., Mao, J., Jin, M., Hoffman, F. M., Shi, X., Wullschleger, S. D., and Dai, Y.: Development of observation-based global multilayer soil moisture products for 1970 to 2016, Earth Syst. Sci. Data, 13, 4385–4405, https://doi.org/10.5194/essd-13-4385-2021, 2021.
Wigneron, J. P., Olioso, A., Calvet, J. C., and Bertuzzi, P.: Estimating root zone soil moisture from surface soil moisture data and soil‐vegetation‐atmosphere transfer modeling, Water Resour. Res., 35, 3735–3745, https://doi.org/10.1029/1999WR900258, 1999.
Wigneron, J. P., Calvet, J. C., Pellarin, T., Van de Griend, A. A., Berger, M., and Ferrazzoli, P.: Retrieving near-surface soil moisture from microwave radiometric observations: current status and future plans, Remote Sens. Environ., 85, 489–506, https://doi.org/10.1016/S0034-4257(03)00051-8, 2013.
Xiao, Y., Su, X., Yuan, Q., Liu, D., Shen, H., and Zhang, L.: Satellite video super-resolution via multiscale deformable convolution alignment and temporal grouping projection, IEEE T. Geosci. Remote, 60, 1–19, https://doi.org/10.1109/TGRS.2021.3107352, 2022a.
Xiao, Y., Yuan, Q., He, J., Zhang, Q., Sun, J., Su, X., Wu, J., and Zhang, L.: Space-time super-resolution for satellite video: A joint framework based on multi-scale spatial-temporal transformer, Int. J. Appl. Earth Obs., 108, 102731, https://doi.org/10.1016/j.jag.2022.102731, 2022b.
Yuan, Q., Zhang, Q., Li, J., Shen, H., and Zhang, L.: Hyperspectral image denoising employing a spatial–spectral deep residual convolutional neural network, IEEE T. Geosci. Remote, 57, 1205–1218, https://doi.org/10.1109/TGRS.2018.2865197, 2019.
Zeng, J., Li, Z., Chen, Q., Bi, H. Y., Qiu, J. X., and Zou, P. F.: Evaluation of remotely sensed and reanalysis soil moisture products over the Tibetan Plateau using in-situ observations, Remote Sens. Environ., 163, 91–110, https://doi.org/10.1016/j.rse.2015.03.008, 2015a.
Zeng, J., Li, Z., Chen, Q., and Bi, H.: Method for soil moisture and surface temperature estimation in the Tibetan Plateau using spaceborne radiometer observations, IEEE Geosci. Remote S., 12, 97–101, https://doi.org/10.1109/LGRS.2014.2326890, 2015b.
Zeng, J., Chen, K., Cui, C., and Bai, X.: A physically based soil moisture index from passive microwave brightness temperatures for soil moisture variation monitoring, IEEE T. Geosci. Remote, 58, 2782–2795, https://doi.org/10.1109/TGRS.2019.2955542, 2020.
Zhang, P., Zheng, D., van der Velde, R., Wen, J., Zeng, Y., Wang, X., Wang, Z., Chen, J., and Su, Z.: Status of the Tibetan Plateau observatory (Tibet-Obs) and a 10-year (2009–2019) surface soil moisture dataset, Earth Syst. Sci. Data, 13, 3075–3102, https://doi.org/10.5194/essd-13-3075-2021, 2021.
Zhang, Q., Yuan, Q., Zeng, C., Li, X., and Wei, Y.: Missing data reconstruction in remote sensing image with a unified spatial-temporal-spectral deep convolutional neural network, IEEE T. Geosci. Remote, 56, 4274–4288, https://doi.org/10.1109/TGRS.2018.2810208, 2018a.
Zhang, Q., Yuan, Q., Li, J., Yang, Z., and Ma, X.: Learning a dilated residual network for SAR image despeckling, Remote Sens., 196, 1–18, https://doi.org/10.3390/rs10020196, 2018b.
Zhang, Q., Yuan, Q., Li, J., Li, Z., Shen, H., and Zhang, L.: Thick cloud and cloud shadow removal in multitemporal imagery using progressively spatio-temporal patch group deep learning, ISPRS J. Photogramm., 162, 148–160, https://doi.org/10.1016/j.isprsjprs.2020.02.008, 2020.
Zhang, Q., Yuan, Q., Li, J., Wang, Y., Sun, F., and Zhang, L.: Generating seamless global daily AMSR2 soil moisture (SGD-SM) long-term products for the years 2013–2019, Earth Syst. Sci. Data, 13, 1385–1401, https://doi.org/10.5194/essd-13-1385-2021, 2021a.
Zhang, Q., Yuan, Q., Li, Z., Sun, F., and Zhang, L.: Combined deep prior with low-rank tensor SVD for thick cloud removal in multitemporal images, ISPRS J. Photogramm., 176, 125–137, https://doi.org/10.1016/j.isprsjprs.2020.04.010, 2021b.
Zhang, Q., Yuan, Q., and Jin, T.: SGD-SM 2.0, Zenodo [data set], https://doi.org/10.5281/zenodo.6041561, 2022.
Zhan, W., Pan, M., Wanders, N., and Wood, E. F.: Correction of real-time satellite precipitation with satellite soil moisture observations, Hydrol. Earth Syst. Sci., 19, 4275–4291, https://doi.org/10.5194/hess-19-4275-2015, 2015.
Zhang, Q., Yuan, Q., Li, J., Liu, X., Shen, H., and Zhang, L.: Hybrid noise removal in hyperspectral imagery with spatial-spectral gradient network, IEEE T. Geosci. Remote, 57, 7317–7329, https://doi.org/10.1109/TGRS.2019.2912909, 2019.
Zhao, T., Shi, J., Entekhabi, D., Jackson, T. J., Hu, L., Peng, Z., Yao, P., Li, S., and Kang, C. S.: Retrievals of soil moisture and vegetation optical depth using a multi-channel collaborative algorithm, Remote Sens. Environ., 257, 112321, https://doi.org/10.1016/j.rse.2021.112321, 2021.