the Creative Commons Attribution 4.0 License.
the Creative Commons Attribution 4.0 License.
 | 01 Sep 2022
A new global dataset of mountain glacier centerlines and lengths
Dahong Zhang
Gang Zhou
Wen Li
Xiaojun Yao
Shimei Wei
The length of a glacier is a key determinant of its geometry and is an important parameter in glacier inventories and modeling; glacier centerlines are the lines along which the main flow of glaciers takes place and, thus, are crucial inputs for many glaciological applications. In this study, the centerlines and maximum lengths of global glaciers were extracted using a self-designed automatic extraction algorithm based on the latest global glacier inventory data, digital elevation model (DEM), and European allocation theory. The accuracy of the dataset was evaluated through random visual assessments and comparisons with the Randolph Glacier Inventory (RGI) version 6.0. A total of 8.25 % of the outlines of the RGI were excluded, including 10 764 erroneous glacier polygons, 7174 ice caps, and 419 nominal glaciers. A total of 198 137 glacier centerlines were generated, accounting for 99.74 % of the input glaciers. The accuracy of glacier centerlines was 89.68 %. A comparison between the dataset and the previous dataset suggested that most glacier centerlines were slightly longer than those in RGI v6.0, meaning that the maximum lengths of some glaciers had been likely underestimated in the past. The constructed dataset comprises 17 sub-datasets, including global glacier centerlines, maximum lengths, and DEMs, all of which can be found at https://doi.org/10.11922/sciencedb.01643 (Zhang and Zhang, 2022).
- Article
(23005 KB) - Full-text XML
-
Supplement
(10402 KB) - BibTeX
- EndNote


Mountain glaciers are shrinking rapidly (Hugonnet et al., 2021), altering regional hydrology (Pritchard, 2019), raising global sea levels (WCRP Global Sea Level Budget Group, 2018), and increasing the risk of natural hazards (Shukla and Sen, 2021; Zheng et al., 2021), and they are among the most climate-sensitive constituents of the world's natural water towers (Immerzeel et al., 2019). Under the influence of global climate change, studies on glacier area changes (Sommer et al., 2020; Li et al., 2021), ice thickness (Farinotti et al., 2019), mass balance (Zemp et al., 2019; Vargo et al., 2020; Wu et al., 2021; Mankoff et al., 2021), ice velocity field (Thogersen et al., 2019; Solgaard et al., 2021; Franke et al., 2022), the impact of debris cover (Scherler et al., 2018; Shukla et al., 2020; Herreid and Pellicciotti, 2020), glacier meltwater (Noel et al., 2020), sediment release (Aciego et al., 2015; Li et al., 2019), and related hazards (Zhou et al., 2021b; Stuart-Smith et al., 2021; Kääb et al., 2021) are essential for global water resources supply assessment and disaster prevention and reduction.
The most noticeable distinction between glaciers and other natural ice bodies is their property of moving towards lower altitudes under the influence of gravity. Glacier flow lines correspond to a glacier's motion trajectories, and the main flow line is the key trajectory. Due to the lack of glacier velocity field data, the main flow lines cannot be obtained on a large scale. The glacier centerline, generated via the axis line method (Le Bris and Paul, 2013; Machguth and Huss, 2014; Kienholz et al., 2014; Zhang et al., 2021), is typically used to represent the main flow line. The glacier centerline is a critical parameter for analyzing the ice velocity field (Heid and Kääb, 2012; Melkonian et al., 2017), estimating glacier volumes (Li et al., 2012; Gao et al., 2018), and developing glacier models (Oerlemans, 1997; Sugiyama et al., 2007; Maussion et al., 2019).
Glacier length usually refers to the maximum length of a glacier centerline (main flow line) and represents the longest motion trajectory of a glacier, which is among the key determinants of glacier geometry and a basic parameter of glacier inventories (RGI Consortium, 2017) and modeling (Maussion et al., 2019). Glacier length fluctuations can be used to quantify glacier changes (Zhou et al., 2021a), such as by identifying glacier advancement, surge, or retreat. Glacier length fluctuations (e.g., Leclercq et al., 2014) have also been used to study the relationships with changes in glacier area (Winsvold et al., 2014) and the geometric structure of a glacier (Herla et al., 2017), estimate glacier volume in combination with the glacier area (Lüthi et al., 2010), and reconstruct annual averaged surface temperatures over the past 400 years on hemispherical and global scales (Leclercq and Oerlemans, 2011).
A complete global inventory of glacier outlines (RGI Consortium, 2017) was created following the Fifth Assessment Report of the Intergovernmental Panel on Climate Change (IPCC AR5). There are three types of automatic and semi-automatic methods that have been proposed to meet the demand for large-scale acquisitions of glacier lengths. First, there are typical hydrological analysis methods (Schiefer et al., 2008), but they result in lengths that are longer than equivalent maximum distances taken along typical longitudinal centerline profiles. The second type is a simplified algorithm based on the skeleton theory (Le Moine and Gsell, 2015), but it has not been widely used. Third, there are centerline methods based on the axis concept proposed by Le Bris and Paul (2013) and first applied to calculating global glacier length by Machguth and Huss (2014). However, with this type of algorithm, the glacier centerlines tend to be noticeably deflected by their tributaries (Le Bris and Paul, 2013). The cost grid–least cost route approach of Kienholz et al. (2014), based on the axis concept, is more accurate but also more labor intensive and time-consuming, which limits its application to global glaciers. The tradeoff function approach of Machguth and Huss (2014), which is based on the axis concept, has been applied to almost all global mountain glaciers but excludes the centerlines of the branches of glaciers. Despite many attempts to overcome these limitations in recent years (Yao et al., 2015; Yang et al., 2016; Ji et al., 2017; Hansen et al., 2020; Xia, 2020; Zhang et al., 2021), to date, global datasets of the centerline and length of mountain glaciers are rare. Based on our recent study on successfully extracting the glacier centerline using the Euclidean allocation method (Zhang et al., 2021), we aim to combine publicly available digital elevation data into one global digital elevation model (DEM), at 30 m resolution and extending from 90∘ N to 90∘ S, to check and correct the global glacier outlines and obtain a new graphic dataset of the centerline and length of global mountain glaciers.
The glacier dataset used in this study was the Randolph Glacier Inventory version 6.0 (RGI v6.0; http://www.glims.org/RGI/randolph60.html, last access: 15 November 2021) released via the Global Land Ice Measurements from Space initiative (GLIMS), which is a globally complete collection of digital glacier outlines, excluding ice sheets (Pfeffer et al., 2014). RGI v6.0 includes 216 502 global glaciers (215 547 glaciers described in the product handbook), with a total area of 705 738.793 km2 (RGI Consortium, 2017). All glaciers can be divided into 19 first-order glacier regions (Radiæ and Hock, 2010), which were used in our study (Fig. 1).
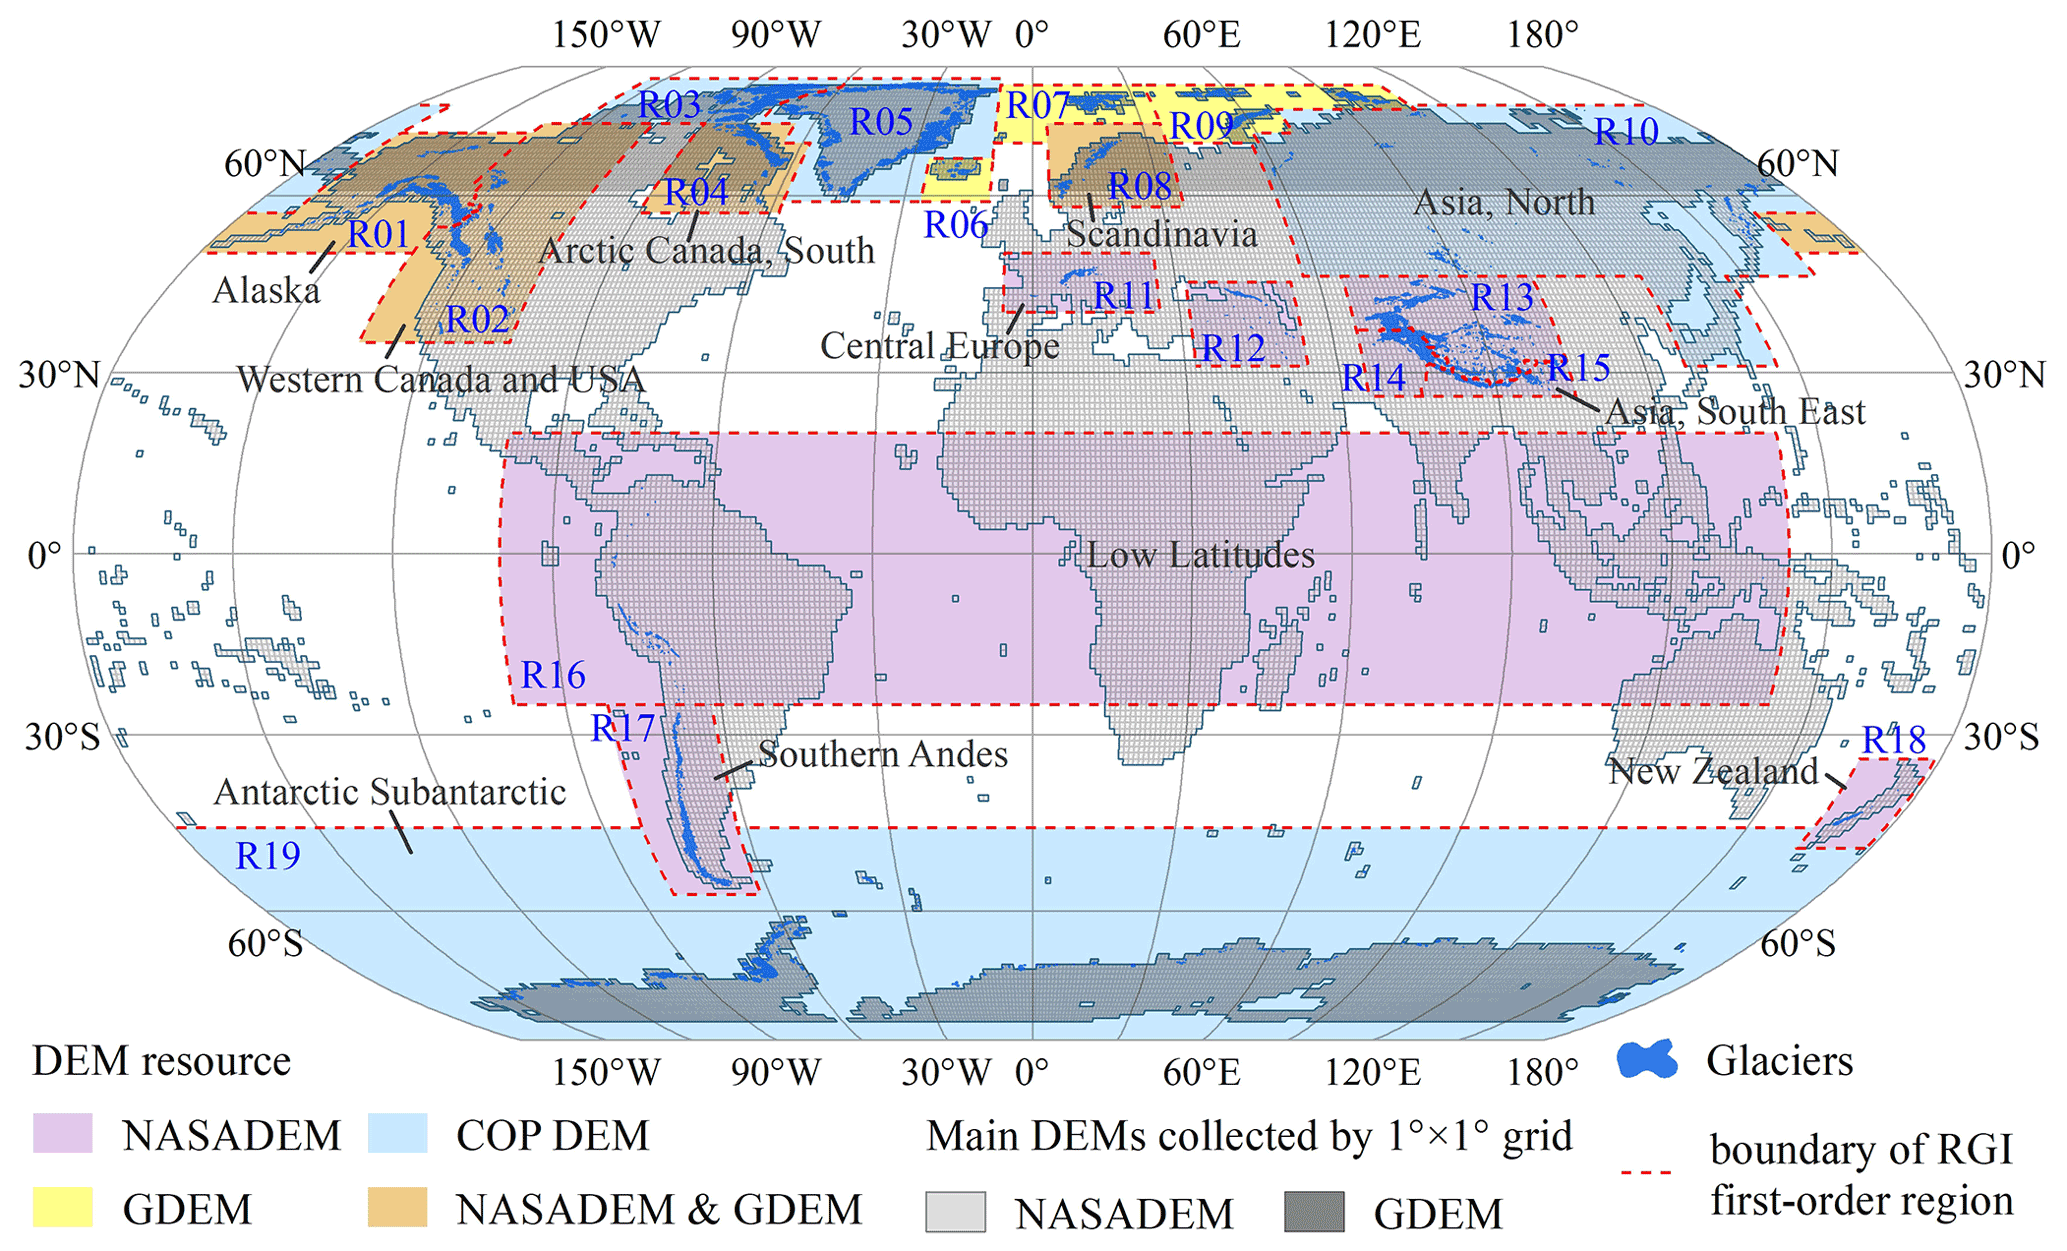
Figure 1Distribution of global glaciers, first-order glacier regions, and digital elevation models (DEMs) used. The background is the global DEM grid () covered by NASADEM and GDEM. GDEM and COP DEM represent the ASTER GDEM v3 and the Copernicus DEM, respectively. Note: R01 – Alaska; R02 – western Canada and USA; R03 – Arctic Canada, north; R04 – Arctic Canada, south; R05 – Greenland periphery; R06 – Iceland; R07 – Svalbard and Jan Mayen; R08 – Scandinavia; R09 – Russian Arctic; R10 – northern Asia; R11 – central Europe; R12 – Caucasus and Middle East; R13 – Asia, central; R14 – Asia, southwest; R15 – South Asia, east; R16 – low latitudes; R17 – southern Andes; R18 – New Zealand; R19 – Antarctica and Subantarctic.
In total, five DEM products (Table 1) were used in this study. The National Aeronautics and Space Administration (NASA) DEM (NASADEM; https://lpdaac.usgs.gov/news/release-nasadem-data-products/, last access: 17 November 2021) was released by the Land Processes Distributed Active Archive Center (LP DAAC) in January 2020. NASADEM is the reprocessed version of the NASA Shuttle Radar Topography Mission (SRTM) data (Farr et al., 2007), with a low mean absolute error (MAE; Carrera-Hernández, 2021) and improved root mean square error (RMSE; Uuemaa et al., 2020). Serving the zonal extent of (56∘ S, 61∘ N), NASADEM was used as the preferred DEM in this study because of its superior performance. The Advanced Spaceborne Thermal Emission and Reflection Radiometer (ASTER) is a 14-channel imaging instrument that has been operating on the Terra satellite of NASA since 1999. The ASTER Global Digital Elevation Model (GDEM) version 3 (https://lpdaac.usgs.gov/news/nasa-and-meti-release-aster-global-dem-version-3/, last access: 17 November 2021; Abrams et al., 2020) was released by Japan's Ministry of Economy, Trade, and Industry (METI) and NASA in July 2019. Using the Ice, Cloud, and Land Elevation Satellite (ICESat) Geoscience Laser Altimeter System (GLAS) data, Carabajal and Boy (2016) found that ASTER GDEM v3 displayed smaller means, similar medians, and less scatter than the ASTER GDEM v2 in Greenland and Antarctica. ASTER GDEM v3 was used as the second priority DEM to cover the zonal extents of (56, 83∘ S) and (61, 83∘ N).
NASADEM and ASTER GDEM v3 do not cover all glacierized regions, as they are missing parts of the polar regions and the Kamchatka Peninsula. Because of their high temporal and spatial resolutions at high latitudes, the Reference Elevation Model of Antarctica (REMA; Howat et al., 2019) and ArcticDEM (https://www.pgc.umn.edu/data/arcticdem/, last access: 17 November 2021) were preferred as the supplementary data of our preliminary studies in these glacier regions. Nevertheless, ArcticDEM and REMA were found to be inadequate because of insufficient coverage and sporadic data. Some other DEMs in high-latitude areas (Fan et al., 2022; Zhang et al., 2022) were also not considered because their spatial resolutions are very different from that required in this study. Therefore, the wide-coverage Copernicus DEM (https://spacedata.copernicus.eu/web/cscda/cop-dem-faq, last access: 17 November 2021) was finally selected as the supplementary dataset for glacier regions not entirely covered by NASADEM and ASTER GDEM v3. The Copernicus DEM was released in November 2020. The accuracy assessment undertaken by its development team (the product handbook) comparing TanDEM-X/WorldDEM data (TanDEM-X is a TerraSAR-X add-on for digital elevation measurements; TerraSAR-X is an X-band satellite imaging radar Earth observation satellite) with ICESat GLAS reference points found an absolute vertical accuracy of approximately 10 m at the periphery of Antarctica and Greenland. In summary, NASADEM, ASTER GDEM v3, and Copernicus DEM were compiled to create a 30 m DEM that covered the study area completely.
Table 1All DEMs collected in this study.
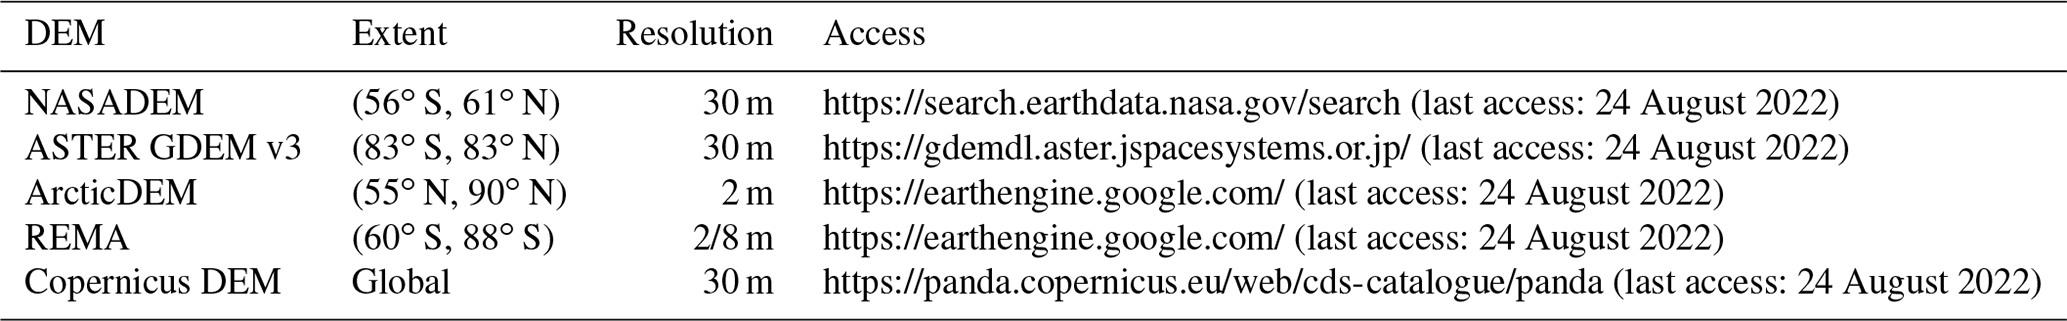
Note that the interval in the “Extent” column represents all landmasses within the zonal range, although not all areas within the range may be covered.
In addition, graphical data (Machguth and Huss, 2014) of the glacier length in *.xy format (the Universal Transverse Mercator, UTM, projection), which correspond to the attribute of the glacier maximum length (Lmax) in RGI v6.0, were collected in high-mountain Asia (HMA) area. Because these data were obtained from an unofficial source, we could not access their documentation and recovered only the coordinates of points matching some of the glaciers in RGI v6.0. The registration of the *.xy file depends on matching its filename with the feature identity document (FID) of the glacier polygon of RGI v6.0 in the same glacier area. The glacier lengths (MHMLDS) of successful registration were used as the graphical validation data for this study.
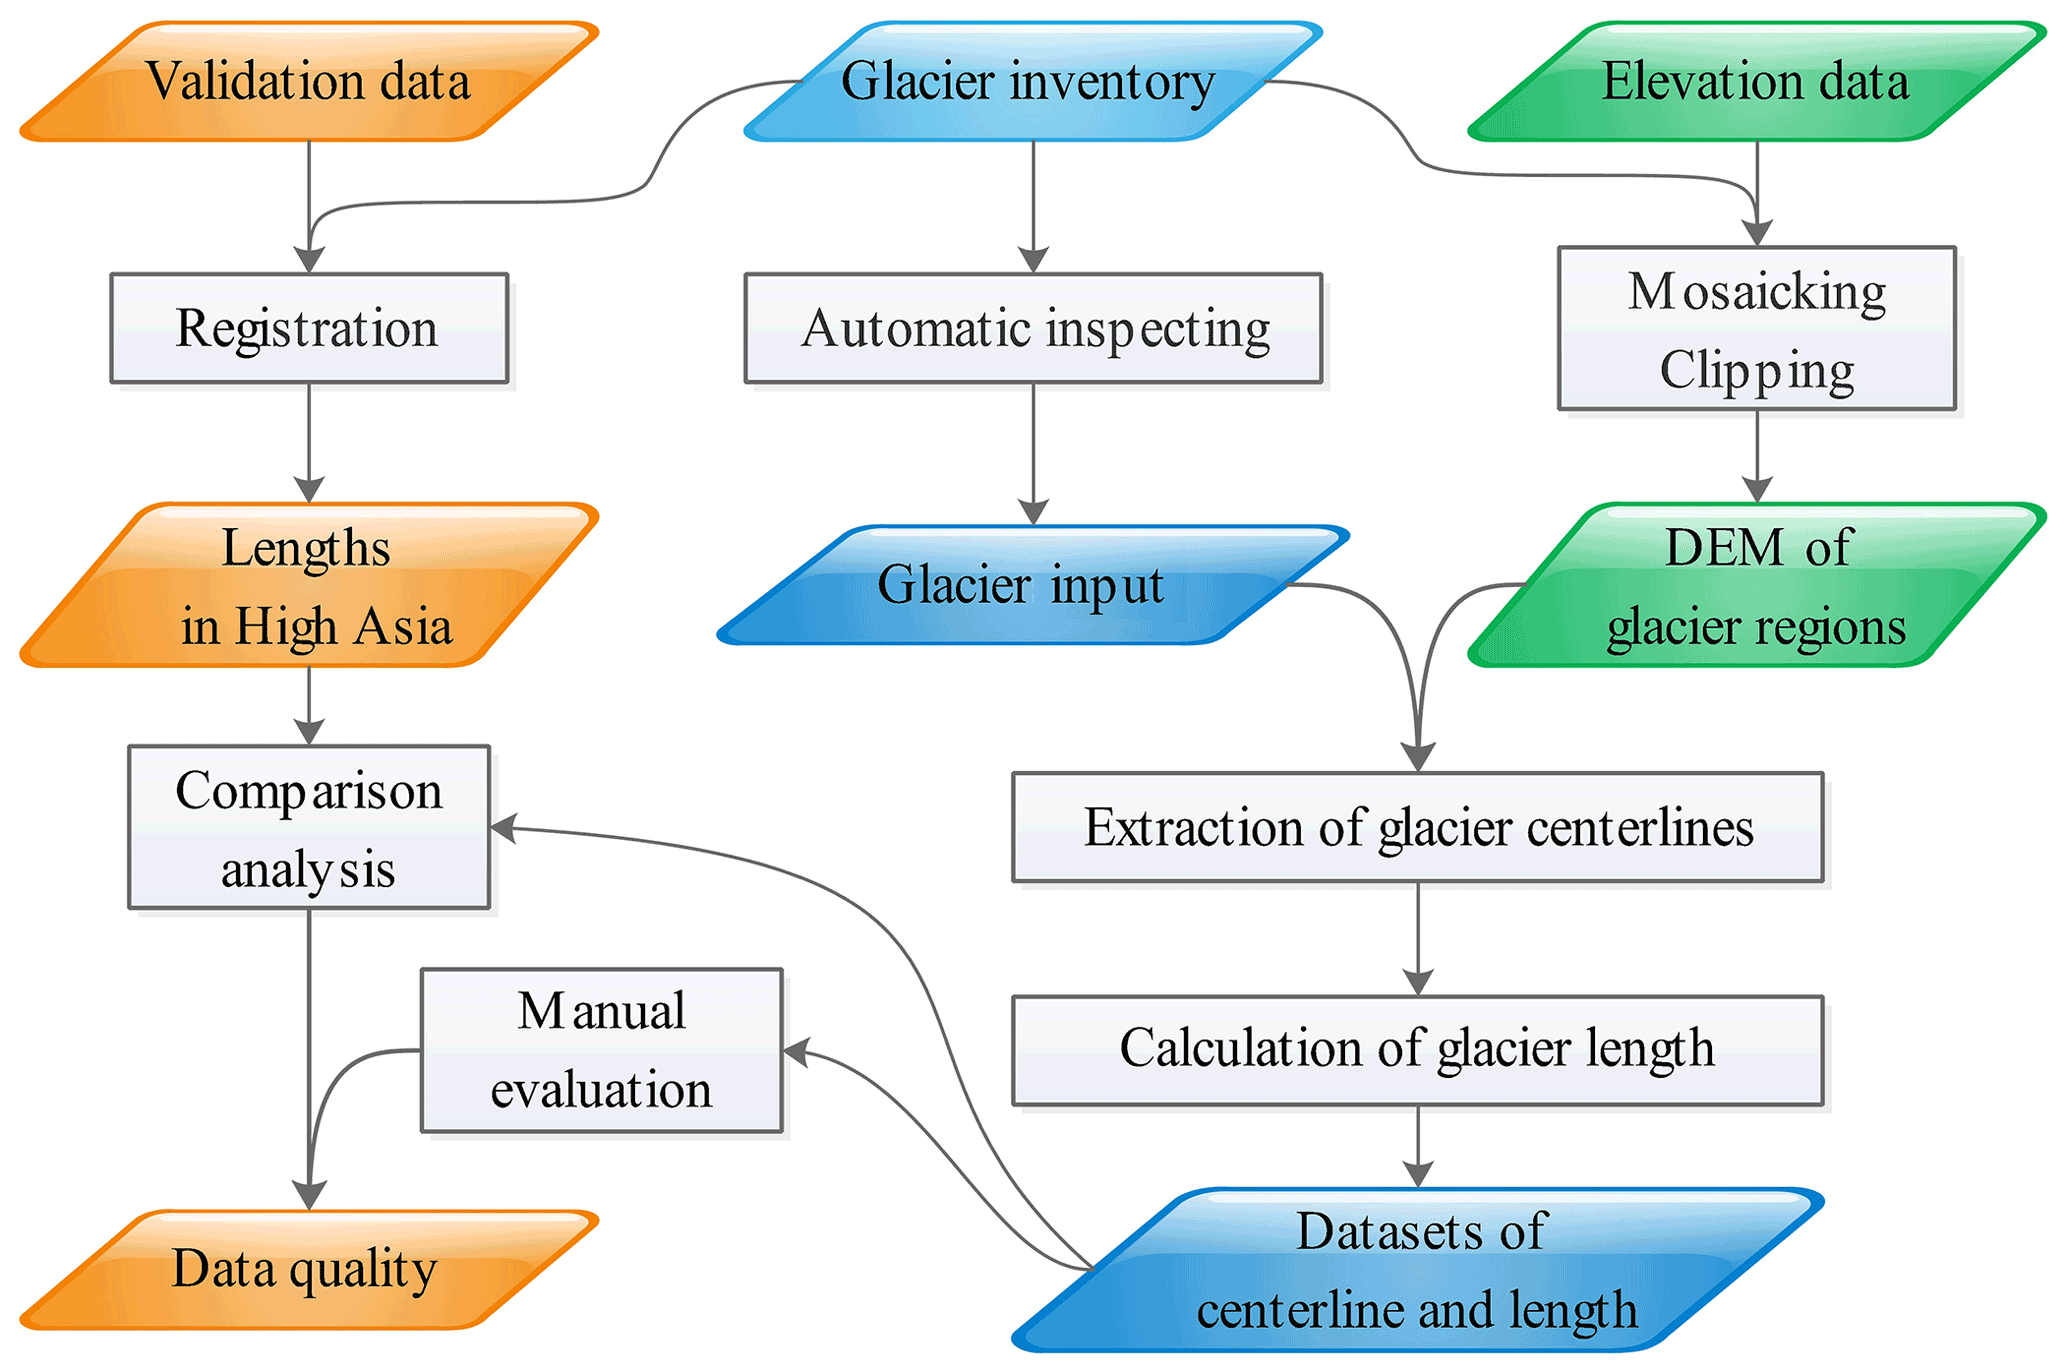
3.1 Outline of workflow
This study relied on the following two key input datasets: the global glacier inventory and the compiled global glacier elevation. An outline of the workflow for establishing a new dataset of global graphic glacier centerlines and lengths is shown in Fig. 2. The process was divided into six parts, i.e., (1) design an algorithm to check all glacier outlines and exclude defective glacier polygons, (2) buffer glaciers to produce a mask containing global glaciers and their buffers, (3) mosaic the compiled global DEMs according to the mask in step 2 to prepare the global glacier elevation data, (4) determine the automatic extraction parameters of global glacier centerlines by repeated testing in each region, (5) input the global DEM, glacier outline dataset, and all parameters into the designed automatic extraction software (Zhang et al., 2021) to generate global centerlines and lengths, and (6) verify and compare with existing centerline results to evaluate the accuracy of the new datasets.
3.2 Illustration of key methods
3.2.1 Pre-processing of glacier outlines
This study had strict requirements for glacier outlines, and therefore, all glacier complexes were divided into individual glaciers prior to the centerline extraction. However, because of the limited semi-automatic glacier segmentation approach (Kienholz et al., 2013) and the high-priority strategy of completeness of coverage adopted by RGI v6.0 (RGI Consortium, 2017), some glaciers were not supported by our algorithm. These unsupported glaciers included three categories, namely glacier complexes with/without inaccurate segmentation (Fig. 3a–b), erroneous glacier outlines (Fig. 3c) resulting from the vectorization, and flawed glaciers (Fig. 3d–f) generated by the automatic extraction algorithm. For the third category, we designed an identification algorithm to mark and screen them (described in the last paragraph of this section). The flaws in these glacier outlines were mainly caused by topological errors of polylines/polygons, such as unclosed, sawtooth, and overlapping polygons. The first two categories did not affect the algorithm's normal operation; however, the extraction accuracy is not always guaranteed. We could not identify the source of the problem at the time of the study, and a solution is needed to improve the quality of the global glacier inventory.
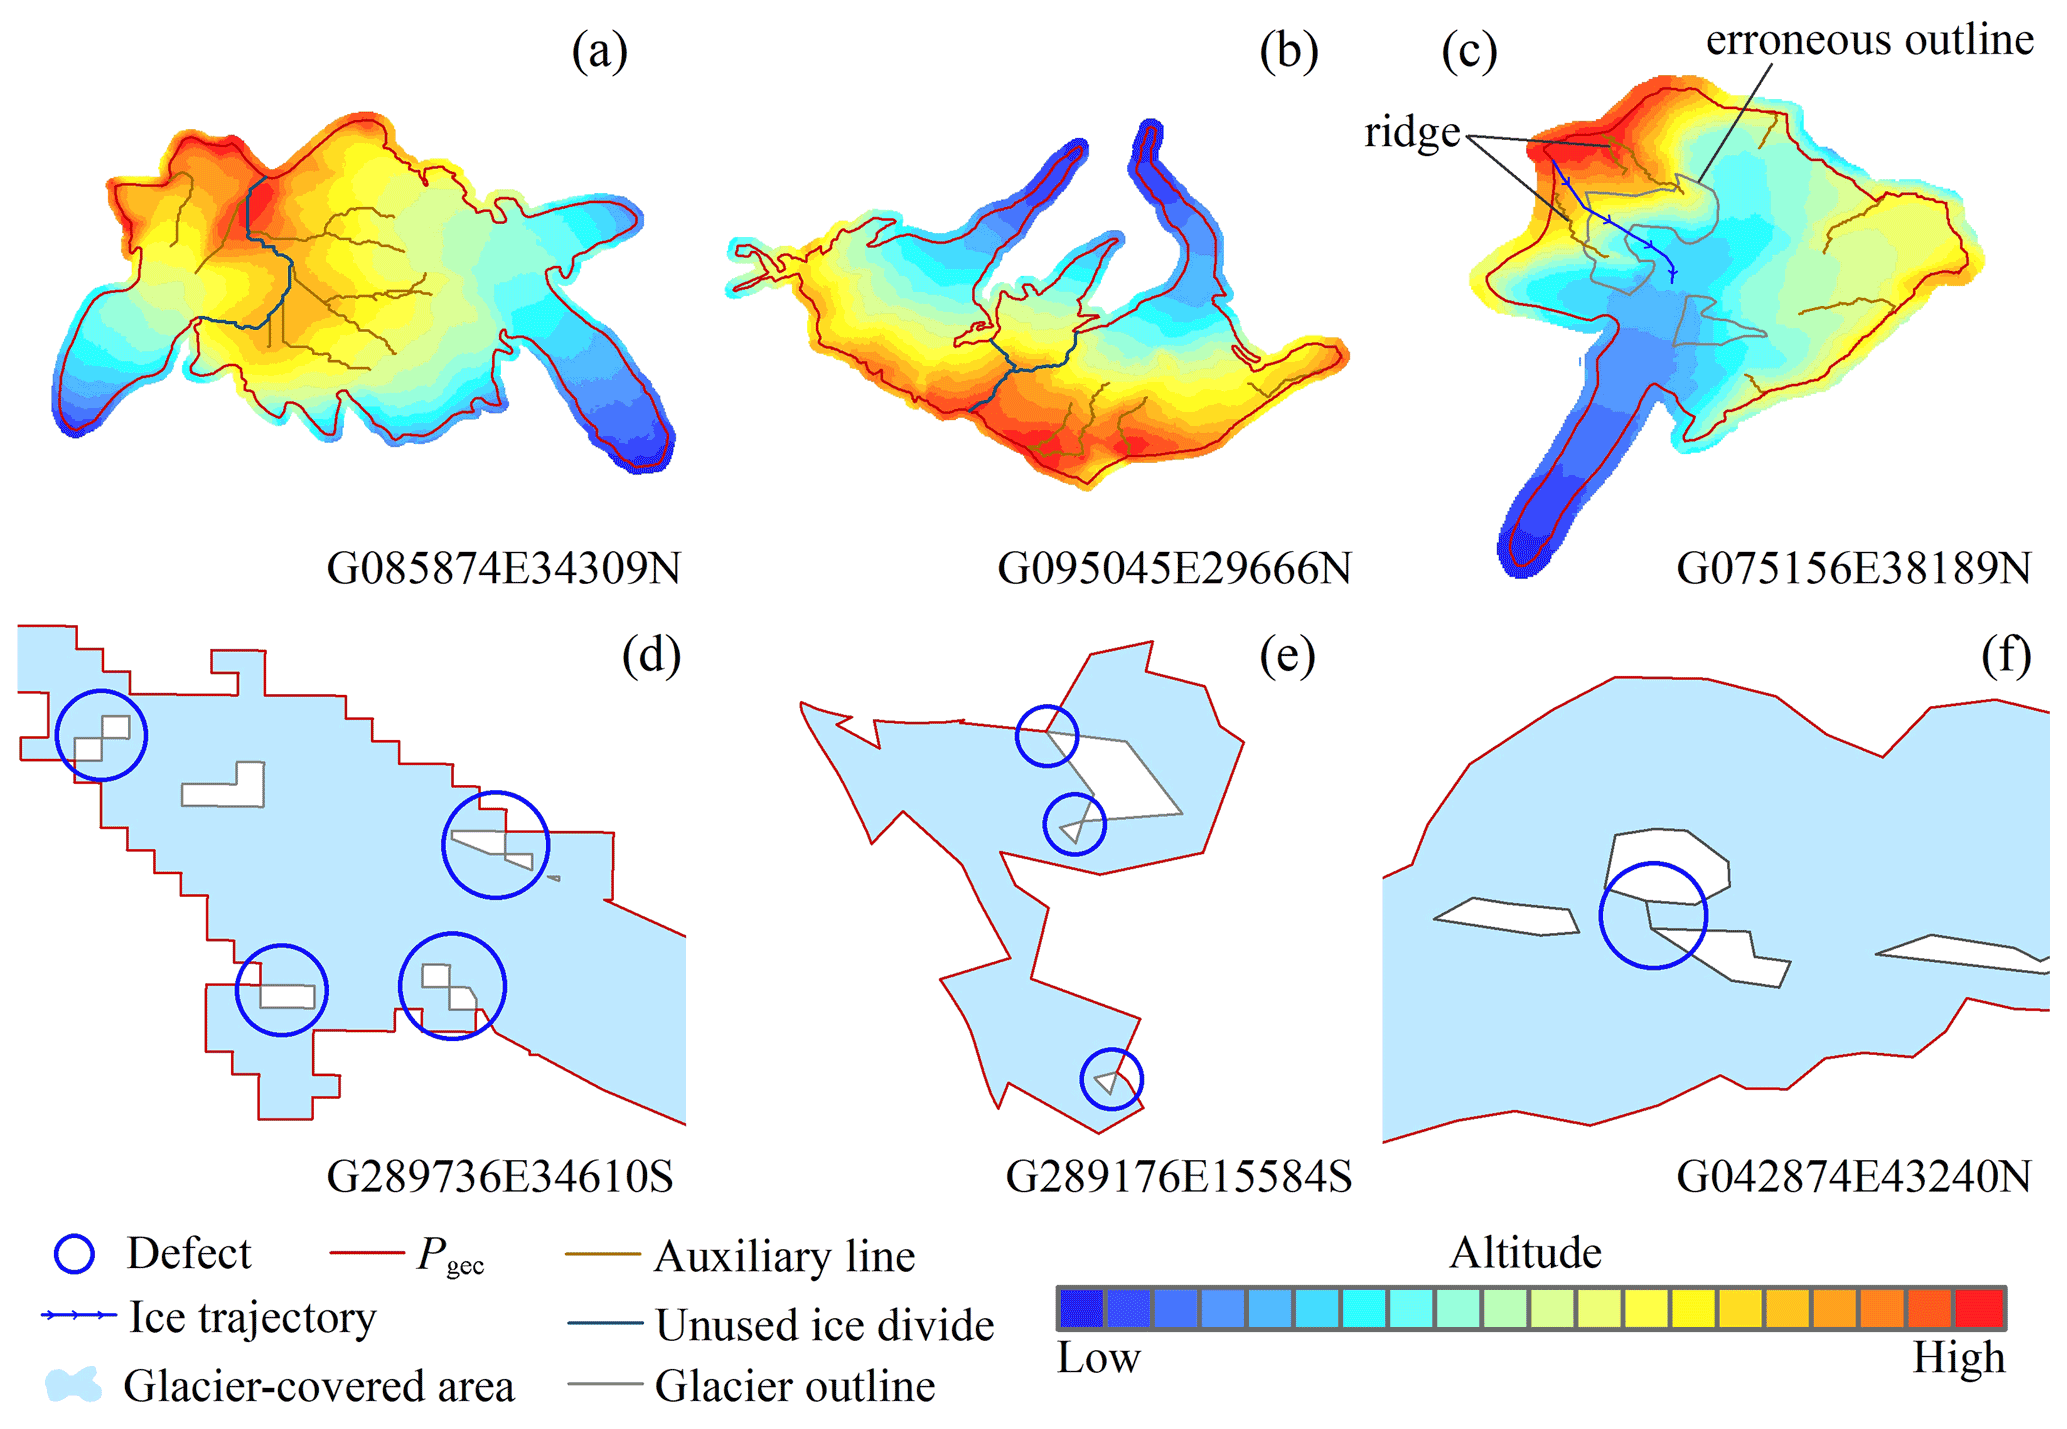
Figure 3Schematic of three types of flawed glacier outlines. (a–b) Glacier complexes with/without inaccurate segmentation. (c) Erroneous glacier outline caused by vectorization. (d–f) Common problems in flawed glaciers, with defects in the automatic algorithm, defects in post-processing, and artificial errors. The auxiliary line represents lower-grade ice divides in an individual glacier, which is part of the ridge lines.
In this study, we defined the external contour of a glacier (Pgec), namely the polygon corresponding to the longest closed polyline of the glacier, to reduce the storage of DEMs and improve the efficiency of batch processing. The buffer masks of all glaciers (buffer distance of approximately 100 m) were generated by their Pgec to meet the requirement for the extent of input DEMs to be slightly larger than the Pgec. The buffer masks generated initially were partially broken because there were overlaps or gaps between adjacent polygons of the buffer zone; thus, polygons with a perimeter of less than 12 times the buffer mask distances of each region were removed.
The third category of flawed glaciers (Fig. 3d–f) was identified by obtaining Pgec. The most common error type was a glacier outline with two or more closed polylines with the same endpoint. These flawed glacier outlines were identified by assessing whether there were multiple polylines sharing endpoints after converting the glacier from a polygon to a polyline. However, these outlines did not include the unclosed types. There were a few glacier outlines that appeared to be closed polylines but had geometric flaws such as non-coinciding head and tail endpoints of the polylines.
3.2.2 Preparation of input datasets
All the data associated with the dataset production were processed in units of first-order glacier regions. The input glacier outlines excluded all the defective glacier outlines. Similarly, the nominal glaciers (represented by an ellipse) and ice caps remarked in RGI v6.0 were also treated, which were distinguished by two attributes, i.e., status (nominal glacier) and form (ice cap). The inspection of glacier outlines show that there are 10 764 defective glacier outlines (FGODS) in RGI v6.0, accounting for approximately 4.97 % of the total (216 502; Table 2). After excluding nominal glaciers (461) and ice caps (7174), 198 646 glaciers remained as input glacier outlines (IGODS), accounting for 91.75 % of the global mountain glaciers.
Table 2Pre-processing results of different glacier regions and information of input datasets.
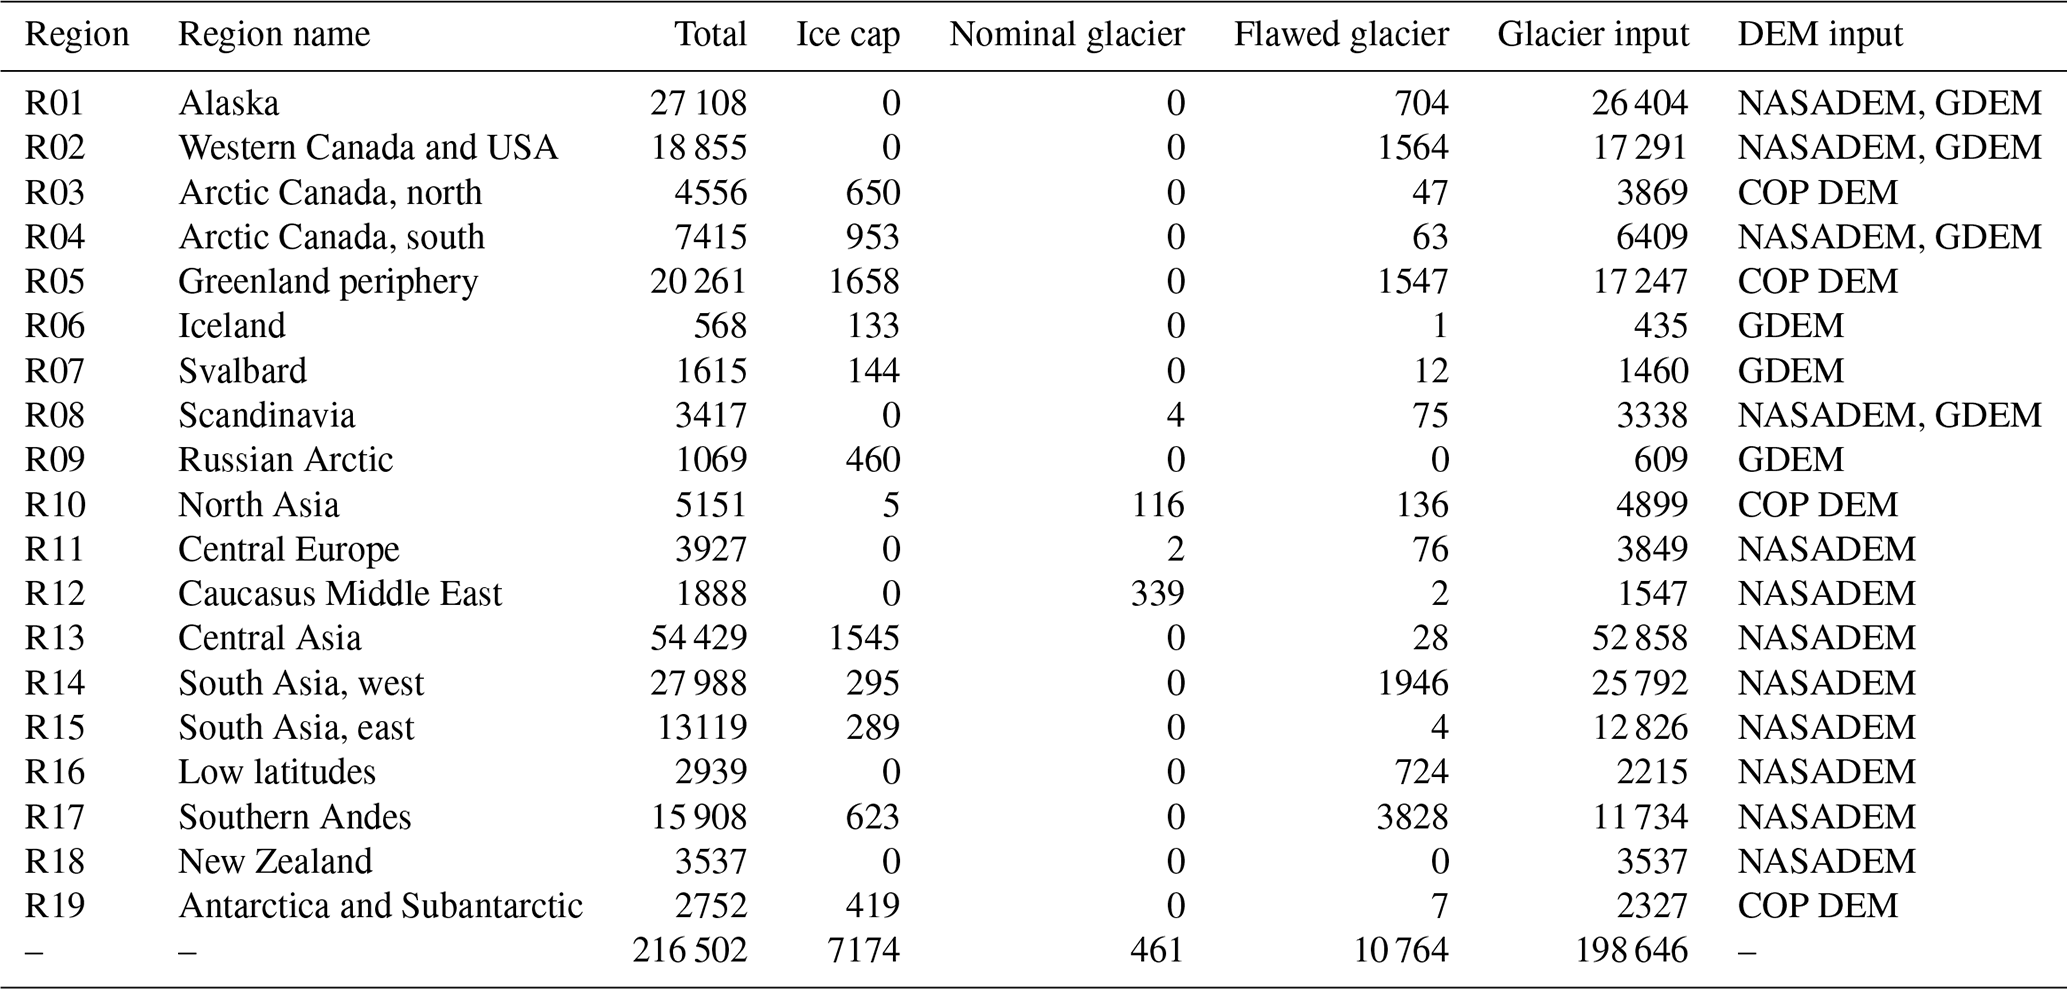
Note that GDEM and COP DEM refer to ASTER GDEM v3 and Copernicus DEM, respectively.
The Pgec of all glaciers in RGI v6.0 comprises the global glacier external contour dataset (GGECDS), which generated the global mountain glacier's buffer mask dataset (GGBMDS). The collected DEMs were extracted using GGBMDS, and 43 035 DEM tiles were generated. They were then mosaicked according to different first-order glacier regions to generate a global glacier elevation dataset (GGEDS). The details of the two input datasets are presented in Table 2.
3.2.3 Generation of centerline and glacier length
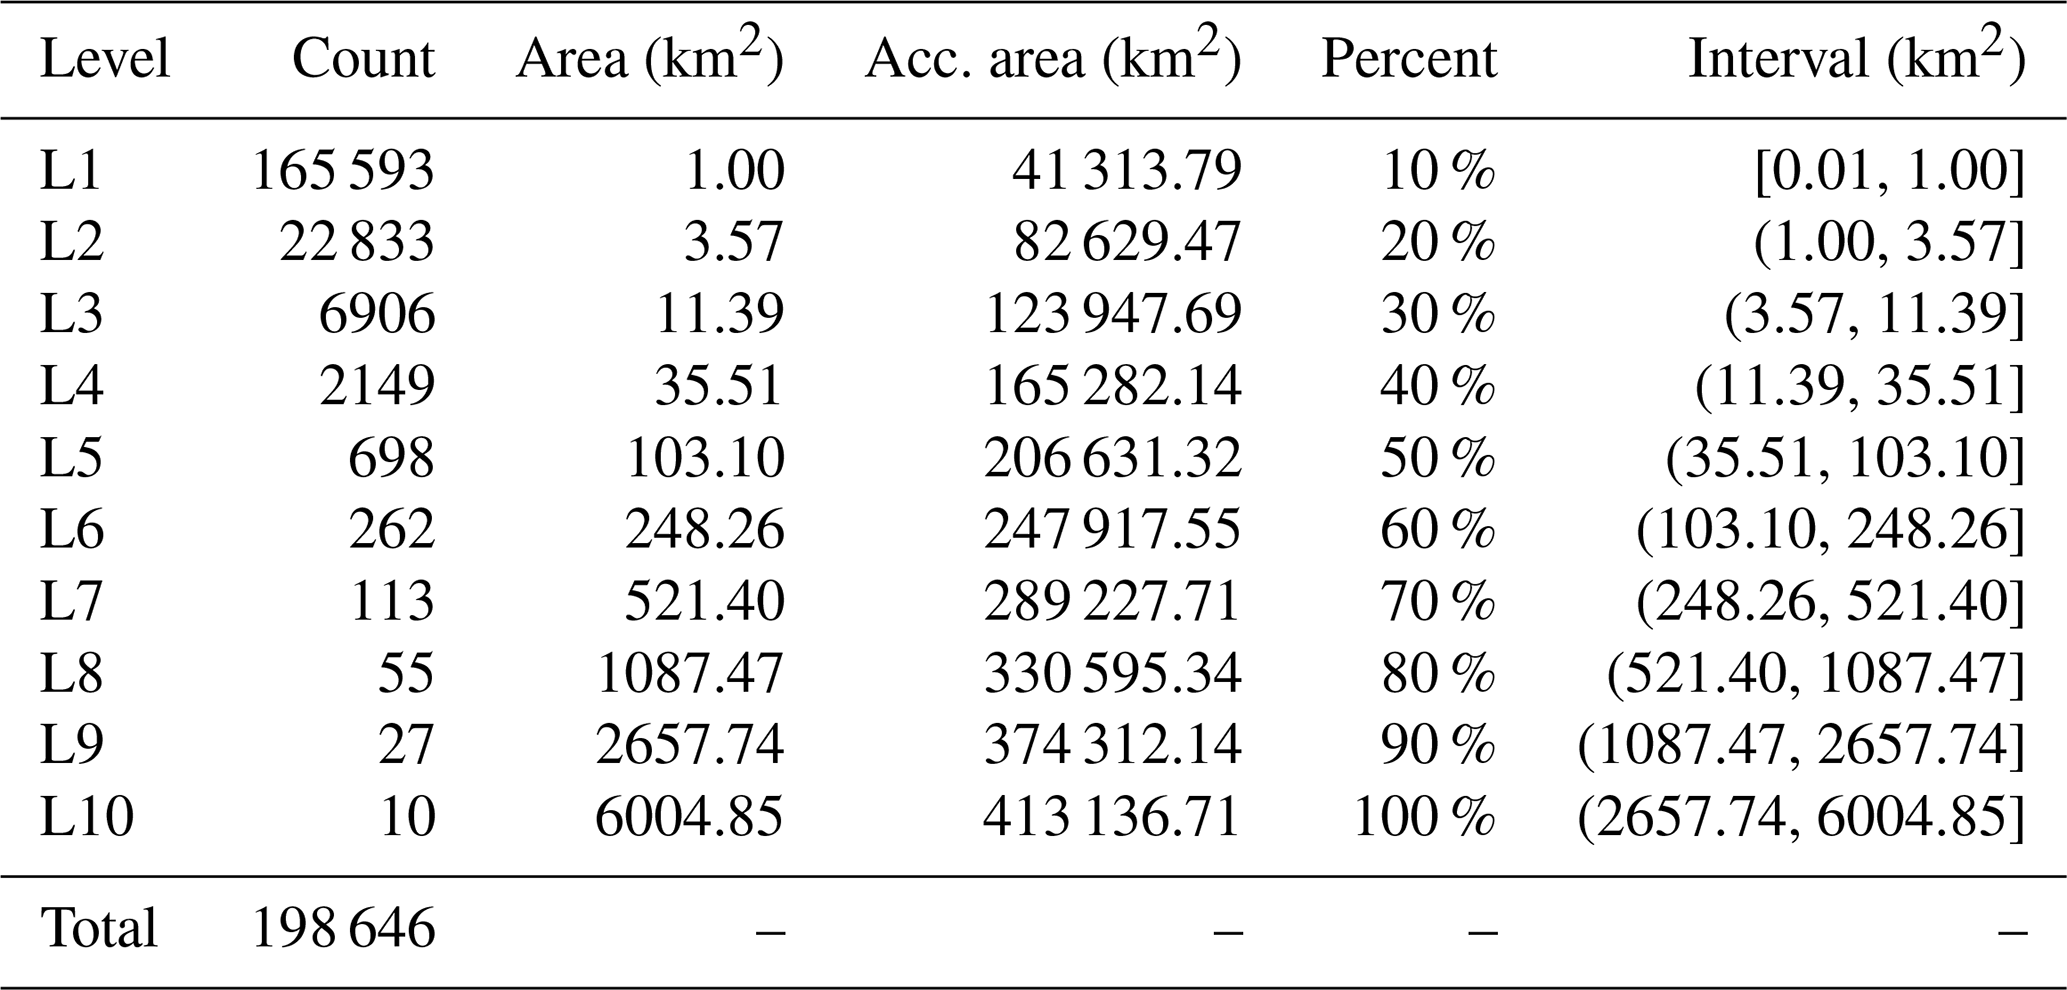
Glacier centerlines and lengths were automatically extracted with the GlacierCenterlines_Py27 (update to version 5.2.1) tool, which is based on the axis concept and Euclidean allocation (Zhang et al., 2021). The principle is briefly explained as follows: the highest and lowest points of the external outline of a glacier were extracted as two endpoints that divide the glacier outline into two parts. In the glacier polygon, points that have the equal shortest distances to the two parts were identified as other vertices. The line formed by two endpoints and these other vertices was regarded as the glacier centerline. The maximum length of glaciers was calculated using an algorithm similar to the critical path. The updated contents focused on formulating the parameterization scheme (Appendix A; Table A1) for extracting global glacier centerlines and repairing some newly discovered bugs, such as a dead cycle in the process of auxiliary line extraction. All glacier outlines included in the IGODS were divided into 10 levels based on the proportion of cumulative area after ranking the area of all input glacier polygons from small to large (Table 3). The Albers projection (see the Supplement for detailed parameter files) with WGS1984 was used as a unified projection coordinate system for each glacier region. The empirical values of the other parameters were determined in repeated attempts, and their values were significantly correlated with the glacier scale. The generated glacier centerlines were merged according to the glacier regions. Then, the graphics and attribute information of glacier length were exported as corresponding independent Esri shapefiles. In addition, other data associated with the dataset production were exported, such as the segmentation results of glacier outlines, the lengths in the accumulation and ablation region of each glacier, the lowest points, the local highest points (Pmax), the extracted failed glacier outlines, and logs.
3.2.4 Accuracy assessment
A random assessment was prioritized to assess the accuracy of the extracted centerlines. We randomly selected 100 glaciers in each of the 19 glacier regions, obtaining a total of 1900 glacier centerlines. These glacier centerlines were divided into three first-level categories (Zhang et al., 2021), namely correct (I), inaccurate (II), and incorrect (III). Type II mostly contained glaciers with accurate glacier maximum lengths but missing, redundant, or unreasonable branches of glacier centerlines. When calculating the dataset accuracy, types I and II were regarded as correct, and only type III was considered incorrect. Finally, the proportion of type III glaciers in the sample was counted, and the valuation result (R) was calculated using Eq. (1):
where NG is the total number of glacier centerlines, and Si and are the verification accuracy and the number of glaciers in the ith glacier region (i=1, 2, 3, …, 18, 19), respectively.
This study's maximum glacier lengths (GLmax) were compared with the Lmax (Machguth and Huss, 2014) in RGI v6.0 using linear correlation and ratio analysis. The correlations between GLmax and Lmax were established according to different glacier regions and glacier levels, and the length ratio Rr (Eq. 2) was calculated as follows:
In addition, considering the differences between the graphics, we also collected the graph data of the glacier length extracted by Machguth and Huss (2014). Considering the limited availability of the data (obtained R13–R15), we only compared two glacier-covered regions in the Himalayas, namely Mount Qomolangma and Kangchenjunga (the world's third-highest mountain) and their surrounding areas.
4.1 Centerline and length of glaciers
Taking the IGODS, GGEDS, and other model parameters (Appendix A; Table A1) as input data, 198 137 glacier centerlines were automatically generated using the centerline extraction tool of GlacierCenterlines_Py27 v5.2.1, with an overall success rate of 99.74 %. The number and proportion of flawed glacier outlines, nominal glaciers, ice caps, input glacier outlines, and extraction results for distinct glacier regions are shown in Fig. 4.
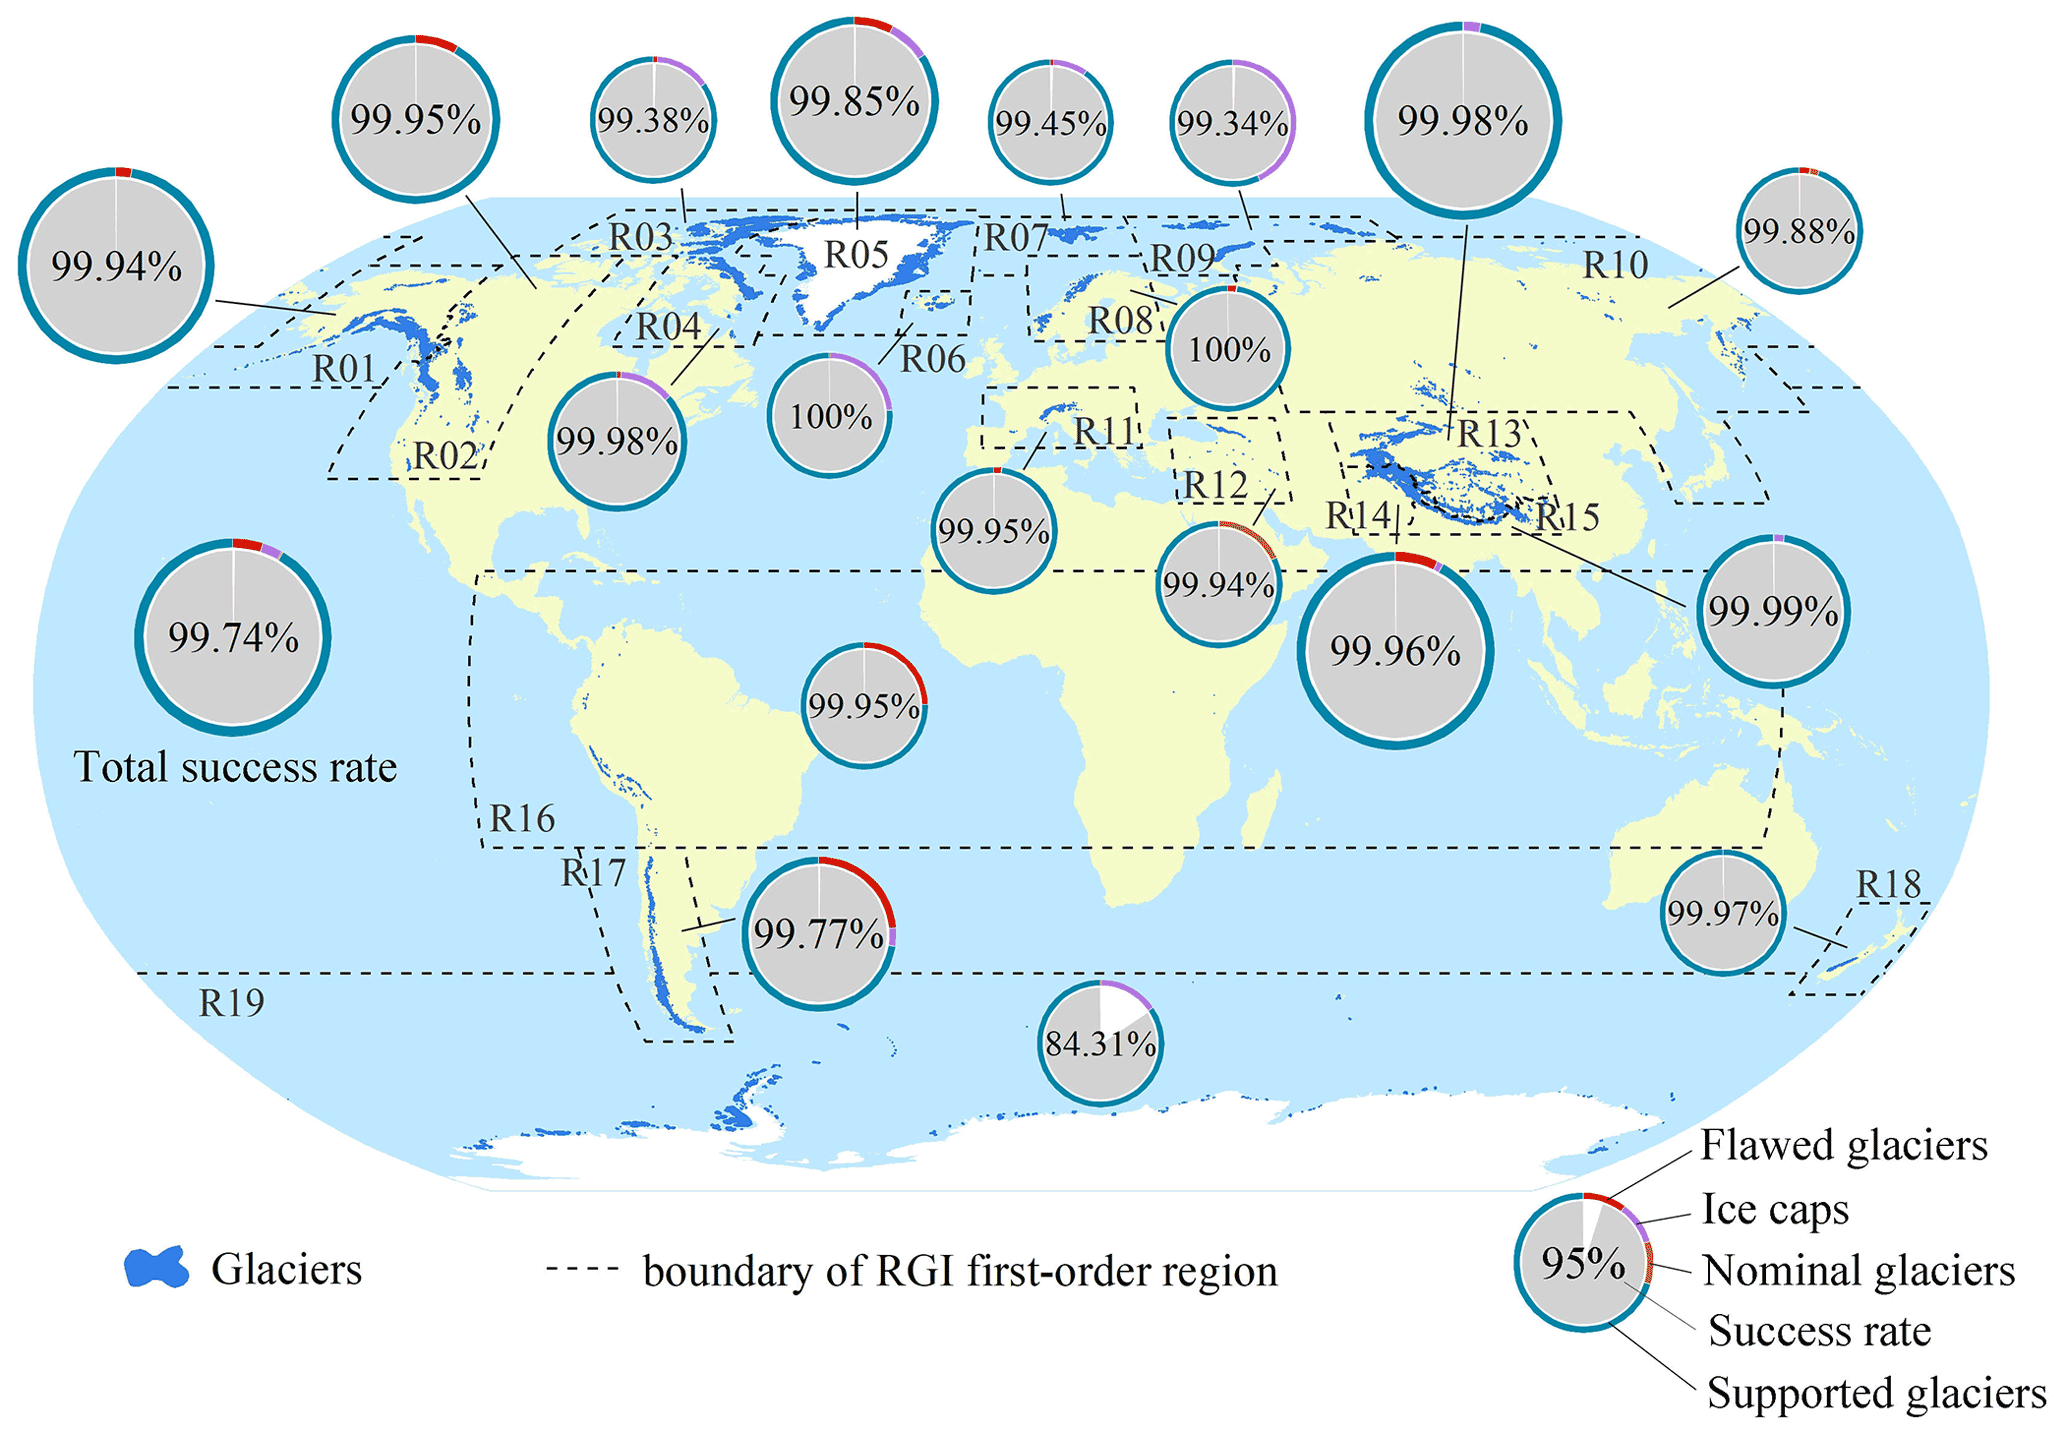
Figure 4Extraction of glacier centerlines in different glacier regions. The pie charts indicate the proportions of input glaciers and of the three types of excluded glaciers in the region. The pie charts represent the correct rate, which is the proportion of correctly extracted glaciers. The size of the pie chart represents the grade of the glaciers in the region.
Except for Antarctica and the Subantarctic (R19), the success rate of extracting glacier centerlines in other glacier regions was greater than 99 %, which indicates that the automatic extraction algorithm for glacier centerlines is robust. A small number of glacier outlines with falsely closed boundaries and unidentified ice caps were the main reasons for the failure of the automatic extraction of glacier centerlines; however, it is difficult to establish rules for accurately identifying these glacier polygons. In total, 510 unsuccessful glacier outlines were identified, of which Antarctica and the Subantarctic (R19) accounted for 71.57 %, the southern Andes (R17) and Greenland periphery (R05) for 5.29 % and 5.1 %, respectively, Arctic Canada, north (R03), and Alaska (R01) for 4.71 % and 2.94 %, respectively, and other glacier regions for less than 2 %.
Overall, the global glacier centerline dataset (GGCLDS) constructed in this study contained 91.52 % of the total glaciers in RGI v6.0. The lengths of each branch of the glacier centerline were derived, and the longest branch lengths of the glacier centerline were defined as the glacier maximum length (GLmax), which were used to form the global glacier maximum length dataset (GGMLDS). The average centerline length of all branches of a glacier is called the glacier mean length (GLmean). In addition, the median glacier altitude was regarded as the equilibrium line altitude (ELA; Machguth and Huss, 2014). The part with GLmax that was higher than ELA was regarded as the length of the glacier accumulation zone (GLacc), and the part that was lower than ELA was regarded as the length of the glacier ablation zone (GLabl), which formed the glacier accumulation zonal length dataset (GACLDS) and glacier ablation zone length dataset (GABLDS). The key process data corresponding to GGCLDS were also output to form the glacier outline segmentation results (GOSRDS), lowest points (GLPDS), local highest points (GLHPDS), and unsuccessful glacier outlines (GUGODS). The fields involved in all datasets are listed in Table 4.
Table 4Description of the attributes contained in all datasets.

Note that Char. is for character, int. is for integer, and (m) is the unit in meters.
The glacier outlines of RGI v6.0 without centerlines obtained in this study were limited by the quality of the glacier polygons, which mainly correspond to the flawed glacier outlines (FGODS) and the identified ice caps in RGI v6.0 (Table 2). Among the FGODS (10 764), the southern Andes (R17) had the most, followed by southwestern Asia (R14), western Canada and USA (R02), and Greenland periphery (R05), with slightly more than 1500, and low latitudes (R16) and Alaska (R01), with slightly more than 700. There were 451 in other glacier regions, including two regions with 0 defective glacier outlines, the Russian Arctic (R09), and New Zealand (R18). Among the ice caps (7174) identified by RGI v6.0, slightly more than 1500 were in R05 and central Asia (R13), between 500 and 1000 in the Arctic Canada, south (R04), Arctic Canada north (R03), and the southern Andes (R17), and fewer than 500 were in other glacier regions. Nominal glaciers (461) existed in three glacial regions, i.e., Caucasus Middle East (R12), northern Asia (R10), and Scandinavia (R08).
4.2 Data validation
4.2.1 Random assessment results
The evaluation results using random samples from the glacier centerline dataset suggested that the average verification accuracy of the glacier centerline dataset was 89.68 %. There were significant differences across the accuracies of the 19 glacier regions around the world (Fig. 5). Among them, R11, R15 and R10, R09, and R19 had the highest (98 %), second highest (95 %), second lowest (78 %), and lowest (50 %) accuracies, respectively. In terms of types, the average proportions of types I and II were 83.53 % and 6.16 %, respectively. The proportions of type I in R07 and R09 were relatively low, at 79 % and 73 %, respectively, and the lowest in R19 was only 50 %. Type II had the highest proportion in R19 at 16 %, followed by R07 (10 %). Moreover, type II accounted for more than 5 % in seven regions, including R11, R13, R17, R18, R16, R01, and R06.
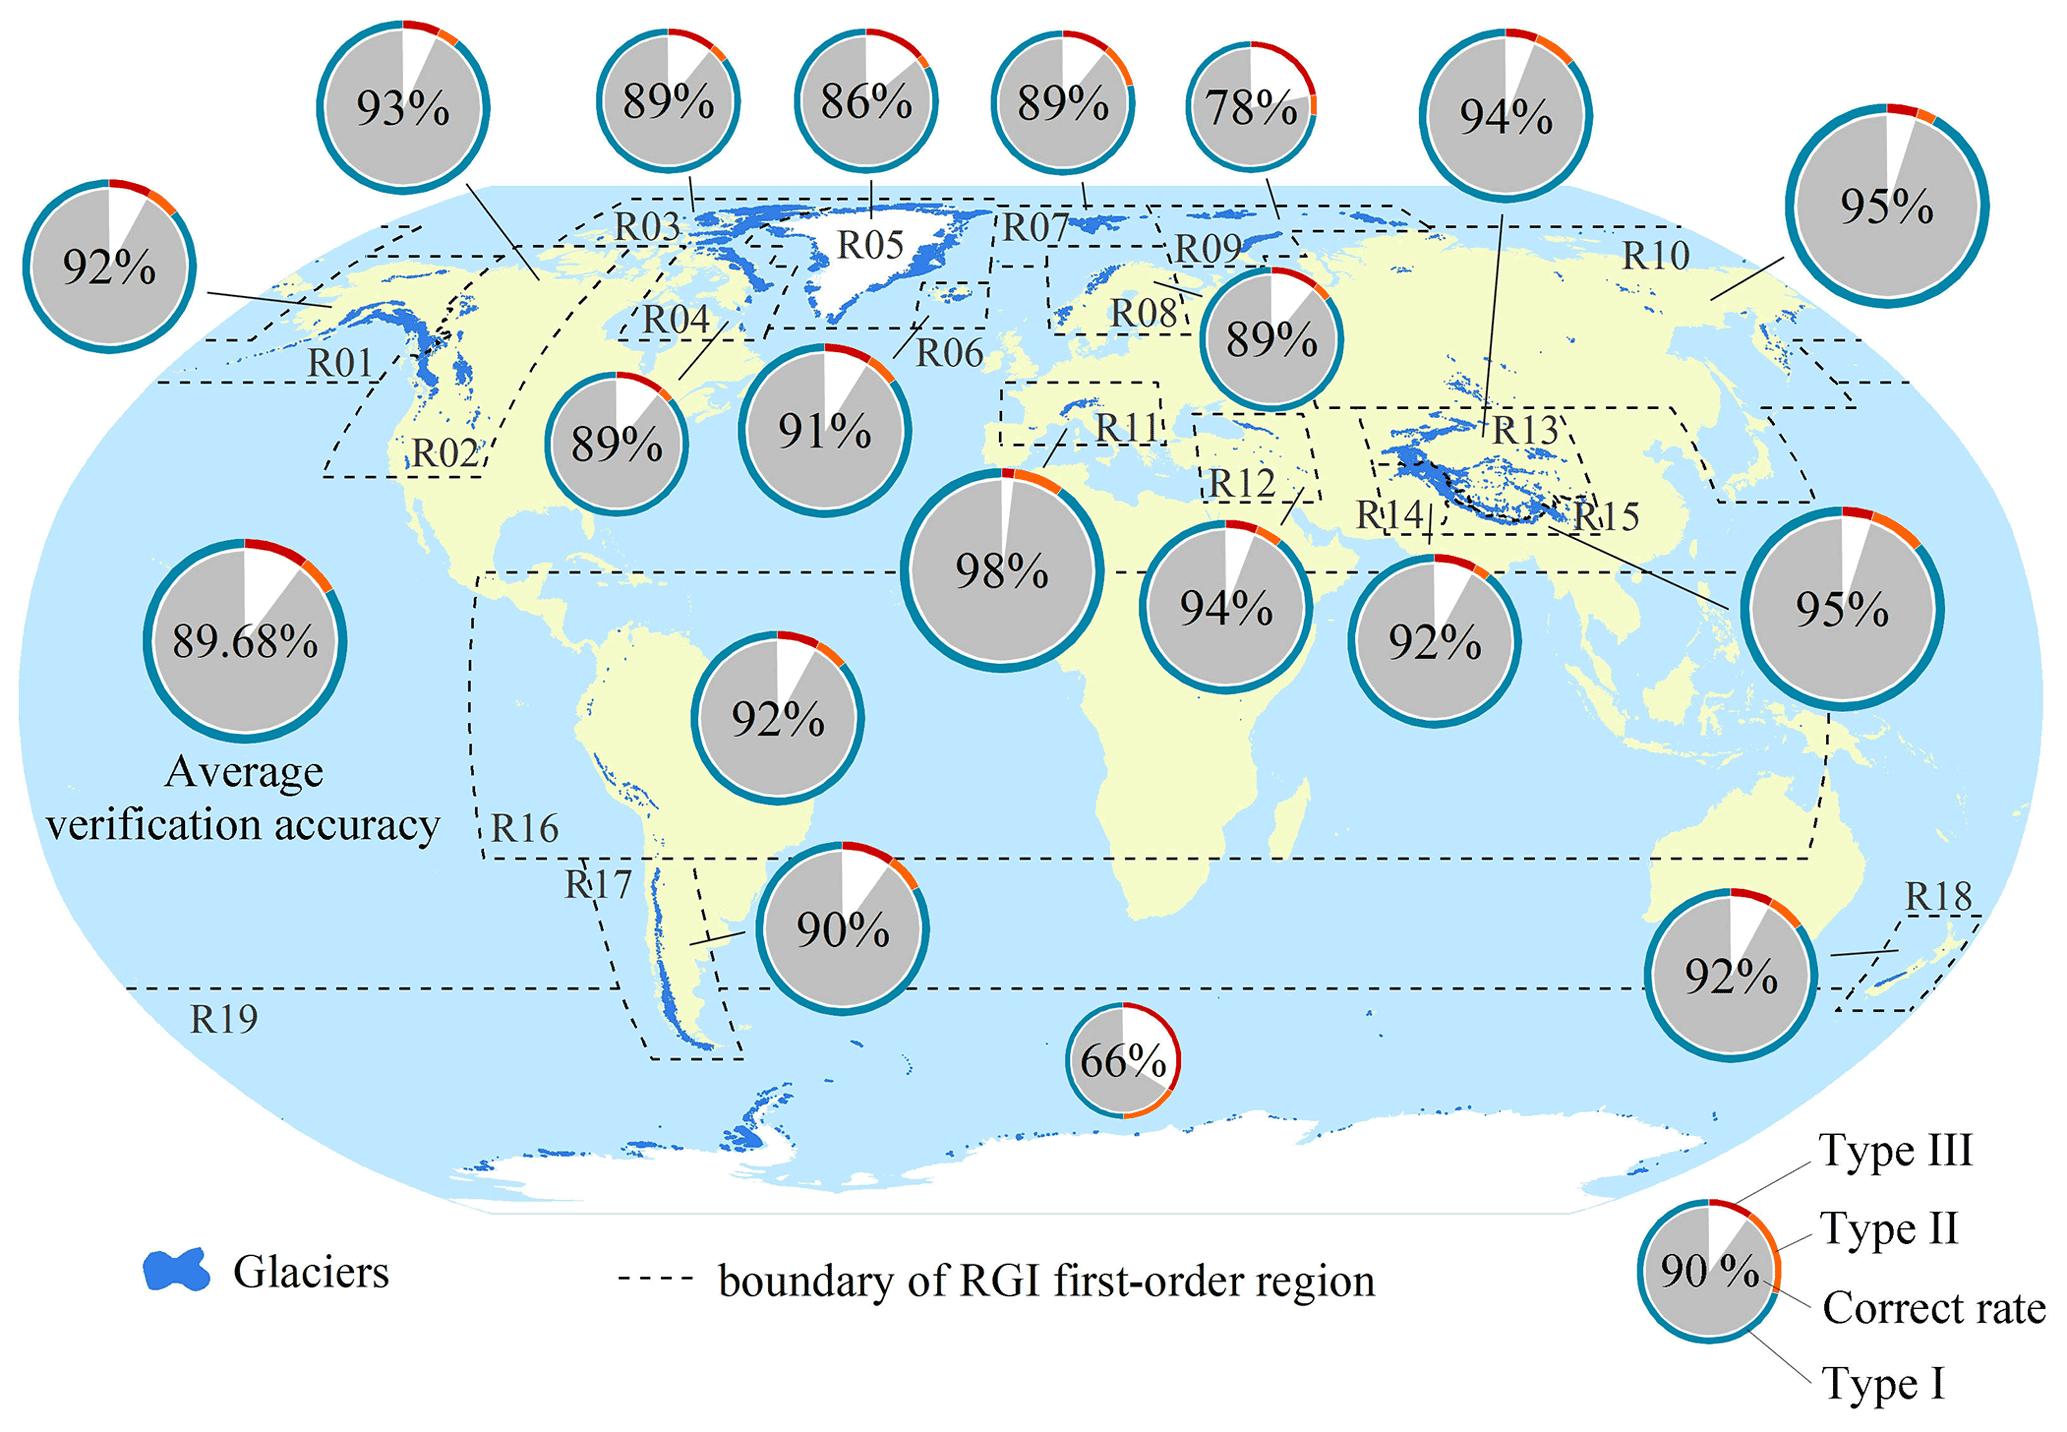
Figure 5Statistical chart of random evaluation results. The pie charts show the proportion of each type with the total number of samples in the region. The pie charts show the correct rate, which is the proportion of types I and II in each region. The size of the pie chart represents the grade of the correct rate in the region. Types I, II, and III (see Sect. 3.2.4) are correct, inaccurate, and incorrect centerlines, respectively.
The above results indicate that, in addition to the three glacier regions of R07, R09, and R19, the random samples of the glacier centerline dataset show excellent performance in terms of accuracy, particularly in R02, R12, and R14. The unmarked ice cap and local low-quality DEM were the main reasons for the poor quality of the glacier centerlines in R07 and R09. Owing to glacier complexes and low-altitude differences in low-quality DEMs at the glacier tongues, the glacier centerlines obtained in R19 were of poor quality but were included for completeness.
4.2.2 Comparison with previous results
We compared the glacier lengths (GLmax) automatically obtained in this study with those (Lmax) obtained by Machguth and Huss (2014; Fig. 6). After eliminating 5408 glaciers with the Lmax value of −9 (missing value), the length values of the other 192 728 glaciers in the global glacier length dataset were compared directly. The GLmax and Lmax were generally comparable (Fig. 6a). The glaciers in grades L4–L10 showed excellent agreement, while those of L1–L3 determined the linear correlation coefficient owing to their large number. There were approximately 35 000 glaciers with a length ratio (Rr) between GLmax and Lmax that was greater than 1.55, and these were excluded from the histogram in Fig. 6b because there was a high probability that the length of at least one of the two datasets was wrong. The peak value of the histogram of Rr is in the interval 1.05–1.15, and Rr in the interval 0.95–1.25 accounts for 64.55 % (Fig. 6b). The glacier length GLmax determined in this study was generally 10 % longer than Lmax, which suggests that the glacier centerline lengths were probably underestimated in previous studies. In addition, the length ratio of glacier L1 was the highest, and the median value was high (Fig. 6c). The Rr values of glaciers L4–L10 fluctuated greatly. The Rr distributions of glaciers L2 and L3 were relatively concentrated. The reason for this is that the length of glacier L1 was affected by the DEM, while glaciers L4–L10 were mainly impacted by differences in glacier scale and the accuracy of the auxiliary line.
Figure 6Comparison between longest centerlines calculated in this study and by Machguth and Huss (2014). (a) Linear regression of maximum length for all input glaciers (IGODS), determined as GLmax, calculated in this study, and Lmax, obtained in Machguth and Huss (2014). (b) Histogram of the length ratio (Rr; ) for distinct grades of glaciers. (c) Box plots of length ratio (Rr) for different scales of glaciers.
Comparisons between GLmax and Lmax for each first-order glacier region and all random samples are shown in Appendix B. The fit between GLmax and Lmax was better in seven glacier regions, including R01, R04, R07, and R12–R15, in which the R2 was larger than 0.95 (Fig. B1). The Rr in R17 (R2=0.8174), R05 (R2=0.8136), and R03 (R2=0.6311) were lower, whereas that in R19 (R2=0.5487) was the worst. The R2 values of the other eight glacier regions were between 0.85 and 0.95. The histograms (Fig. B2) suggest that GLmax and Lmax fitted well in R04, R06, R07, R09, and R12–R15 because they had recognizable single peak values. The peak values of R03, R05, R17, and R19 were not prominent, and the proportion of glaciers with Rr>1.55 was extremely high, further increasing the uncertainty in glacier length estimates in these four regions. R01, R07, R08, R11–R15, and R18 performed well in the box plot (Fig. B3), whereas the results for R09 were not good. Moreover, the fit of all random samples was poor (Fig. B1; R2=0.7547), the peak value was more prominent (Fig. B2), and the length ratio distribution of glaciers of different grades was relatively scattered (Fig. B3). In general, the glacier lengths of R07 and R12–R15 were the closest, while there were significant differences in R03, R05, R17, and R19.
Furthermore, the graphic results, which were collected for the maximum length of glaciers in parts of HMA (Machguth and Huss, 2014), were used to compare with those in this study. There were two parts of R15 shown, which were Mount Qomolangma and its surrounding area (Fig. 7a) and Kangchenjunga and its surrounding area (Fig. 7b). A visual comparison suggested that the extraction approach used in this study was robust (Fig. 7a) and that its sensitivity to topography was lower than that of Machguth and Huss (2014; Fig. 7b). Large differences in glacier length extraction schemes are present only in a few glaciers or in certain types of glaciers, such as slope glaciers and ice caps.
4.2.3 Uncertainties and possibilities for improvement
Although we compared the two current global length datasets, it is still difficult to accurately characterize the dataset's quality in this study. For glaciers for which centerlines were not provided in this dataset, users need to update the corresponding glacier outlines and could use the automatic extraction tool provided in this study to generate their centerlines, including the defective glacier outlines (FGODS), nominal glaciers, and ice caps of the RGI v6.0. Specifically, the centerlines of the FGODS rely on the glacier outlines that meet the requirements of this study. These glacier outlines include glacier inventory data from other sources or the FGODS that were repaired by some algorithm or manual process. Nominal glaciers are similar to FGODS and also require users to obtain corresponding glacier outlines. Automatic approaches to dividing ice caps from glacial complexes into individual glaciers are currently limited, and data users can only use their own criteria to separate the ice caps and then use our tool to generate the centerlines. In addition, prioritizing the coverage of this dataset, we designed a geometry-based algorithm to repair FGODS and provided users with their centerlines in the form of a supplementary dataset. Corresponding codes and results can be seen in sub-datasets CODES and SUP_220707.
The automatic extraction algorithm in this study is more suitable for single-outlet glaciers, particularly valley glaciers; it is not suitable for ice caps, flat-top glaciers, and tidal glaciers, which tend to be widely distributed in the Antarctic, Subantarctic, and northern Canadian Arctic, among other areas. In short, the uncertainties in this dataset probably come from the centerlines of some slope glaciers and the ice caps that are not identified in RGI v6.0 or a few centerlines with unpredictable quality due to the input data, such as the incorrect glacier polygons and erroneous DEMs. In future work, improved glacier inventories and more accurate DEMs will contribute to improving centerline quality. Furthermore, optimizing the automatic glacier segmentation approach, the DEM-based extraction algorithm of glacier feature lines, and the centerline tradeoff algorithm will also likely further improve the accuracy of glacier centerlines. In addition, centerline accuracy will probably benefit from further improving the classification type of each glacier in the glacier inventory.
Figure 7Visual comparison of the longest centerlines calculated in this study and by Machguth and Huss (2014) for two glacier-covered regions in the Himalayas, covering Mount Qomolangma (a) and Kangchenjunga (b, the world's third-highest mountain) and their surrounding areas. In the background is the DEM used for the calculation.
The global glacier centerline dataset (GGCLDS), global glacier maximum length dataset (GGMLDS), and other relevant datasets are available at https://doi.org/10.11922/sciencedb.01643 (Zhang and Zhang, 2022). All 17 sub-datasets of this dataset are listed in Table 5.
Table 5Description of the sub-datasets contained in this dataset.

In this study, a new global dataset of glacier centerlines was constructed, and the maximum length was calculated based on the global glacier inventory (RGI v6.0) and global glacier region DEM (GGEDS, composed of NASADEM, ASTER GDEM v3, and Copernicus DEM). A total of 198 137 glacier centerlines were generated, accounting for 99.74 % of the imported glaciers (IGODS) and 91.52 % of the global glacier inventory. The overall extraction accuracy of these glacier centerlines (GGCLDS) used in a random self-assessment was 89.68 %. The glacier length (GLmax) obtained in this study was, on average, approximately 10 % longer than that of Lmax. Nevertheless, our method showed an improved ability to obtain the maximum length, and we believe that the resulting errors were controllable. Furthermore, the pre-processing algorithm we designed accurately identified 10 764 erroneous glacier polygons from RGI v6.0, which formed the defective glacier dataset (FGODS).
The global dataset contains 17 sub-datasets, including two basic input datasets (IGODS and GGEDS), two key result datasets (GGCLDS and GGMLDS), four process datasets, six derived result datasets, and three supplementary datasets. Ice caps, nominal glaciers, and erroneous glacier polygons were eliminated from most sub-datasets, accounting for approximately 8.25 % of the total RGI v6.0. The poor status of these glacier polygons did not support the automatic extraction of glacier centerlines, which needs to be improved in future work. Inevitably, some defects in the algorithm or datasets will also need to be addressed in future research. For instance, the glacial regions (R19 and R03) had the worst results but were nevertheless added to the dataset to prioritize data coverage integrity. The global glacier DEM dataset (GGEDS), global glacier external outline dataset (GGECDS), and global glacier buffer mask datasets (GGBMDS) cover all glaciers in RGI v6.0. Accordingly, they will help design more efficient automated extraction algorithms to produce datasets containing all types of glacier centerlines and lengths worldwide, which is our next goal.
Model parameters resulting from the central Asian Glacier and extended to worldwide calculations are listed in Table A1.
Table A1Parameterization scheme for extracting global glacier centerlines.
Note that the calculation method for each parameter is detailed in Zhang et al. (2021). Pmax and L refer to the local highest points and grades of the glacier, respectively.
A comparison between longest centerlines calculated in this study and by Machguth and Huss (2014) for all samples and different first-order glacier regions of RGI v6.0. The linear regression of the two lengths, histogram of the length ratio (Rr), and box plots of Rr for glaciers of different grades in these regions are shown in Figs. B1, B2, and B3, respectively.

Figure B1Linear regressions for different glacier regions between the glacier length (GLmax) calculated in this study and the glacier length (Lmax) calculated by Machguth and Huss (2014).
Figure B2Histograms of the length ratio (Rr; ) of distinct glacier grades in glacier-covered regions and all samples.
Figure B3Box plots of the length ratio (Rr; ) of glaciers of distinct grades in every glacier-covered region and whole sample.
The Supplement consists of the following three parts: (1) GlacierCenterlines_Py27 (version 5.2.1), the updated automatic extraction tool of glacier centerlines in this study, which fixed some defects compared with version 5.2.0 (https://doi.org/10.5194/tc-151955-2021-supplement). (2) Other_parameters_T1.txt is the parameter file for extracting the global glacier centerlines. (3) The parameter files (file format *.prj) of the projected coordinate systems (Albers) of 19 glacier regions used in this study can be viewed with a text viewer and directly imported into ArcGIS software for further analysis. The supplement related to this article is available online at: https://doi.org/10.5194/essd-14-3889-2022-supplement.
All authors contributed to writing and editing the paper. DZ processed the data, performed all calculations, created all figures, and wrote most of the paper. SZ contributed significantly to the development of the analyses, figures, and writing. XY contributed to the development of the data production strategy and writing. GZ and WL contributed to the initial data production. SW participated in writing Sect. 4.
The contact author has declared that none of the authors has any competing interests.
Publisher's note: Copernicus Publications remains neutral with regard to jurisdictional claims in published maps and institutional affiliations.
This article is part of the special issue “Extreme environment datasets for the three poles”. It is not associated with a conference.
We thank the editors, two reviewers, and community scholars, for their valuable comments that improved the paper. The authors would especially like to thank GLIMS, for releasing the RGI v6.0, LP DAAC, for releasing the NASADEM, METI and NASA, for jointly releasing the ASTER GDEM v3, and the European Space Agency (ESA), for providing the Copernicus DEM. This work would not have been possible without the support of open-access data.
This research has been funded by the Second Tibetan Plateau Scientific Expedition and Research Program (STEP; grant no. 2019QZKK0201) and China National Natural Science Foundation (grant nos. 41730751 and 42171124).
This paper was edited by Min Feng and reviewed by Wang xin and one anonymous referee.
Abrams, M., Crippen, R., and Fujisada, H.: ASTER Global Digital Elevation Model (GDEM) and ASTER Global Water Body Dataset (ASTWBD), Remote Sensing, 12, 1156, https://doi.org/10.3390/rs12071156, 2020.
Aciego, S. M., Stevenson, E. I., and Arendt, C. A.: Climate versus geological controls on glacial meltwater micronutrient production in southern Greenland, Earth Planet. Sc. Lett., 424, 51–58, https://doi.org/10.1016/j.epsl.2015.05.017, 2015.
Carabajal, C. C. and Boy, J. P.: Evaluation of Aster Gdem V3 Using Icesat Laser Altimetry, Int. Arch. Photogramm., XLI-B4, 117–124, https://doi.org/10.5194/isprsarchives-XLI-B4-117-2016, 2016.
Carrera-Hernández, J. J.: Not all DEMs are equal: An evaluation of six globally available 30 m resolution DEMs with geodetic benchmarks and LiDAR in Mexico, Remote Sens. Environ., 261, 112474, https://doi.org/10.1016/j.rse.2021.112474, 2021.
Fan, Y., Ke, C.-Q., and Shen, X.: A new Greenland digital elevation model derived from ICESat-2 during 2018–2019, Earth Syst. Sci. Data, 14, 781–794, https://doi.org/10.5194/essd-14-781-2022, 2022.
Farinotti, D., Huss, M., Fürst, J. J., Landmann, J., Machguth, H., Maussion, F., and Pandit, A.: A consensus estimate for the ice thickness distribution of all glaciers on Earth, Nat. Geosci., 12, 168–173, https://doi.org/10.1038/s41561-019-0300-3, 2019.
Farr, T. G., Rosen, P. A., Caro, E., Crippen, R., Duren, R., Hensley, S., Kobrick, M., Paller, M., Rodriguez, E., Roth, L., Seal, D., Shaffer, S., Shimada, J., Umland, J., Werner, M., Oskin, M., Burbank, D., and Alsdorf, D.: The Shuttle Radar Topography Mission, Rev. Geophys., 45, 1–33, https://doi.org/10.1029/2005rg000183, 2007.
Franke, S., Jansen, D., Binder, T., Paden, J. D., Dörr, N., Gerber, T. A., Miller, H., Dahl-Jensen, D., Helm, V., Steinhage, D., Weikusat, I., Wilhelms, F., and Eisen, O.: Airborne ultra-wideband radar sounding over the shear margins and along flow lines at the onset region of the Northeast Greenland Ice Stream, Earth Syst. Sci. Data, 14, 763–779, https://doi.org/10.5194/essd-14-763-2022, 2022.
Gao, Y. P., Yao, X. J., Liu, S. Y., Qi, M. M., Gong, P., An, L. N., Li, X. F., and Duan, H. Y.: Methods and future trend of ice volume calculation of glacier, Arid Land Geography, 41, 1204–1213, 2018.
Hansen, K., Hasenstab, K., and Schwartzman, A.: Estimating Mountain Glacier Flowlines by Local Linear Regression Gradient Descent, IEEE T. Geosci. Remote, 59, 10022–10034, https://doi.org/10.1109/tgrs.2020.3035513, 2020.
Heid, T. and Kääb, A.: Repeat optical satellite images reveal widespread and long term decrease in land-terminating glacier speeds, The Cryosphere, 6, 467–478, https://doi.org/10.5194/tc-6-467-2012, 2012.
Herla, F., Roe, G. H., and Marzeion, B.: Ensemble statistics of a geometric glacier length model, Ann. Glaciol., 58, 130–135, https://doi.org/10.1017/aog.2017.15, 2017.
Herreid, S. and Pellicciotti, F.: The state of rock debris covering Earth's glaciers, Nat. Geosci., 13, 621–627, https://doi.org/10.1038/s41561-020-0615-0, 2020.
Howat, I. M., Porter, C., Smith, B. E., Noh, M.-J., and Morin, P.: The Reference Elevation Model of Antarctica, The Cryosphere, 13, 665–674, https://doi.org/10.5194/tc-13-665-2019, 2019.
Hugonnet, R., McNabb, R., Berthier, E., Menounos, B., Nuth, C., Girod, L., Farinotti, D., Huss, M., Dussaillant, I., Brun, F., and Kaab, A.: Accelerated global glacier mass loss in the early twenty-first century, Nature, 592, 726–731, https://doi.org/10.1038/s41586-021-03436-z, 2021.
Immerzeel, W. W., Lutz, A. F., Andrade, M., Bahl, A., Biemans, H., Bolch, T., Hyde, S., Brumby, S., Davies, B. J., Elmore, A. C., Emmer, A., Feng, M., Fernández, A., Haritashya, U., Kargel, J. S., Koppes, M., Kraaijenbrink, P. D. A., Kulkarni, A. V., Mayewski, P. A., Nepal, S., Pacheco, P., Painter, T. H., Pellicciotti, F., Rajaram, H., Rupper, S., Sinisalo, A., Shrestha, A. B., Viviroli, D., Wada, Y., Xiao, C., Yao, T., and Baillie, J. E. M.: Importance and vulnerability of the world's water towers, Nature, 577, 364–369, https://doi.org/10.1038/s41586-019-1822-y, 2019.
Ji, Q., Yang, T.-b., He, Y., Qin, Y., Dong, J., and Hu, F.-s.: A simple method to extract glacier length based on Digital Elevation Model and glacier boundaries for simple basin type glacier, J. Mt. Sci., 14, 1776–1790, https://doi.org/10.1007/s11629-016-4243-5, 2017.
Kääb, A., Jacquemart, M., Gilbert, A., Leinss, S., Girod, L., Huggel, C., Falaschi, D., Ugalde, F., Petrakov, D., Chernomorets, S., Dokukin, M., Paul, F., Gascoin, S., Berthier, E., and Kargel, J. S.: Sudden large-volume detachments of low-angle mountain glaciers – more frequent than thought?, The Cryosphere, 15, 1751–1785, https://doi.org/10.5194/tc-15-1751-2021, 2021.
Kienholz, C., Hock, R., and Arendt, A. A.: A new semi-automatic approach for dividing glacier complexes into individual glaciers, J. Glaciol., 59, 925–937, https://doi.org/10.3189/2013JoG12J138, 2013.
Kienholz, C., Rich, J. L., Arendt, A. A., and Hock, R.: A new method for deriving glacier centerlines applied to glaciers in Alaska and northwest Canada, The Cryosphere, 8, 503–519, https://doi.org/10.5194/tc-8-503-2014, 2014.
Le Bris, R. and Paul, F.: An automatic method to create flow lines for determination of glacier length: A pilot study with Alaskan glaciers, Comput. Geosci., 52, 234–245, https://doi.org/10.1016/j.cageo.2012.10.014, 2013.
Le Moine, N. and Gsell, P.-S.: A graph-based approach to glacier flowline extraction: An application to glaciers in Switzerland, Comput. Geosci., 85, 91–101, https://doi.org/10.1016/j.cageo.2015.09.010, 2015.
Leclercq, P. W. and Oerlemans, J.: Global and hemispheric temperature reconstruction from glacier length fluctuations, Clim. Dynam., 38, 1065–1079, https://doi.org/10.1007/s00382-011-1145-7, 2011.
Leclercq, P. W., Oerlemans, J., Basagic, H. J., Bushueva, I., Cook, A. J., and Le Bris, R.: A data set of worldwide glacier length fluctuations, The Cryosphere, 8, 659–672, https://doi.org/10.5194/tc-8-659-2014, 2014.
Li, H., Ng, F., Li, Z., Qin, D., and Cheng, G.: An extended “perfect-plasticity” method for estimating ice thickness along the flow line of mountain glaciers, J. Geophys. Res.-Earth, 117, F01020, https://doi.org/10.1029/2011jf002104, 2012.
Li, X., Ding, Y., Hood, E., Raiswell, R., Han, T., He, X., Kang, S., Wu, Q., Yu, Z., Mika, S., Liu, S., and Li, Q.: Dissolved Iron Supply from Asian Glaciers: Local Controls and a Regional Perspective, Global Biogeochem. Cy., 33, 1223–1237, https://doi.org/10.1029/2018gb006113, 2019.
Li, Y., Li, F., Shangguan, D., and Ding, Y.: A new global gridded glacier dataset based on the Randolph Glacier Inventory version 6.0, J. Glaciol., 67, 773–776, https://doi.org/10.1017/jog.2021.28, 2021.
Lüthi, M. P., Bauder, A., and Funk, M.: Volume change reconstruction of Swiss glaciers from length change data, J. Geophys. Res., 115, F04022, https://doi.org/10.1029/2010jf001695, 2010.
Machguth, H. and Huss, M.: The length of the world's glaciers – a new approach for the global calculation of center lines, The Cryosphere, 8, 1741–1755, https://doi.org/10.5194/tc-8-1741-2014, 2014.
Mankoff, K. D., Fettweis, X., Langen, P. L., Stendel, M., Kjeldsen, K. K., Karlsson, N. B., Noël, B., van den Broeke, M. R., Solgaard, A., Colgan, W., Box, J. E., Simonsen, S. B., King, M. D., Ahlstrøm, A. P., Andersen, S. B., and Fausto, R. S.: Greenland ice sheet mass balance from 1840 through next week, Earth Syst. Sci. Data, 13, 5001–5025, https://doi.org/10.5194/essd-13-5001-2021, 2021.
Maussion, F., Butenko, A., Champollion, N., Dusch, M., Eis, J., Fourteau, K., Gregor, P., Jarosch, A. H., Landmann, J., Oesterle, F., Recinos, B., Rothenpieler, T., Vlug, A., Wild, C. T., and Marzeion, B.: The Open Global Glacier Model (OGGM) v1.1, Geosci. Model Dev., 12, 909–931, https://doi.org/10.5194/gmd-12-909-2019, 2019.
Melkonian, A. K., Willis, M. J., and Pritchard, M. E.: Satellite-derived volume loss rates and glacier speeds for the Juneau Icefield, Alaska, J. Glaciol., 60, 743–760, https://doi.org/10.3189/2014JoG13J181, 2017.
Noel, B., Jakobs, C. L., van Pelt, W. J. J., Lhermitte, S., Wouters, B., Kohler, J., Hagen, J. O., Luks, B., Reijmer, C. H., van de Berg, W. J., and van den Broeke, M. R.: Low elevation of Svalbard glaciers drives high mass loss variability, Nat. Commun., 11, 4597, https://doi.org/10.1038/s41467-020-18356-1, 2020.
Oerlemans, J.: A flowline model for Nigardsbreen, Norway: projection of future glacier length based on dynamic calibration with the historic record, Ann. Glaciol., 24, 382–389, https://doi.org/10.1017/S0260305500012489, 1997.
Pfeffer, W. T., Arendt, A. A., Bliss, A., Bolch, T., Cogley, J. G., Gardner, A. S., Hagen, J.-O., Hock, R., Kaser, G., Kienholz, C., Miles, E. S., Moholdt, G., Mölg, N., Paul, F., Radiæ, V., Rastner, P., Raup, B. H., Rich, J., and Sharp, M. J.: The Randolph Glacier Inventory: a globally complete inventory of glaciers, J. Glaciol., 60, 537–552, https://doi.org/10.3189/2014JoG13J176, 2014.
Pritchard, H. D.: Asia's shrinking glaciers protect large populations from drought stress, Nature, 569, 649–654, https://doi.org/10.1038/s41586-019-1240-1, 2019.
Radiæ, V. and Hock, R.: Regional and global volumes of glaciers derived from statistical upscaling of glacier inventory data, J. Geophys. Res., 115, F01010, https://doi.org/10.1029/2009jf001373, 2010.
RGI Consortium: Randolph Glacier Inventory – A Dataset of Global Glacier Outlines: Version 6.0: Technical Report, Global Land Ice Measurements from Space, Colorado, USA, https://doi.org/10.7265/N5-RGI-60, 2017.
Scherler, D., Wulf, H., and Gorelick, N.: Global Assessment of Supraglacial Debris-Cover Extents, Geophys. Res. Lett., 45, 11798–11805, https://doi.org/10.1029/2018gl080158, 2018.
Schiefer, E., Menounos, B., and Wheate, R.: An inventory and morphometric analysis of British Columbia glaciers, Canada, J. Glaciol., 54, 551–560, 2008.
Shukla, A., Garg, S., Mehta, M., Kumar, V., and Shukla, U. K.: Temporal inventory of glaciers in the Suru sub-basin, western Himalaya: impacts of regional climate variability, Earth Syst. Sci. Data, 12, 1245–1265, https://doi.org/10.5194/essd-12-1245-2020, 2020.
Shukla, T. and Sen, I. S.: Preparing for floods on the Third Pole, Science, 372, 232–234, https://doi.org/10.1126/science.abh3558, 2021.
Solgaard, A., Kusk, A., Merryman Boncori, J. P., Dall, J., Mankoff, K. D., Ahlstrøm, A. P., Andersen, S. B., Citterio, M., Karlsson, N. B., Kjeldsen, K. K., Korsgaard, N. J., Larsen, S. H., and Fausto, R. S.: Greenland ice velocity maps from the PROMICE project, Earth Syst. Sci. Data, 13, 3491–3512, https://doi.org/10.5194/essd-13-3491-2021, 2021.
Sommer, C., Malz, P., Seehaus, T. C., Lippl, S., Zemp, M., and Braun, M. H.: Rapid glacier retreat and downwasting throughout the European Alps in the early 21(st) century, Nat. Commun., 11, 3209, https://doi.org/10.1038/s41467-020-16818-0, 2020.
Stuart-Smith, R. F., Roe, G. H., Li, S., and Allen, M. R.: Increased outburst flood hazard from Lake Palcacocha due to human-induced glacier retreat, Nat. Geosci., 14, 85–90, https://doi.org/10.1038/s41561-021-00686-4, 2021.
Sugiyama, S., Bauder, A., Zahno, C., and Funk, M.: Evolution of Rhonegletscher, Switzerland, over the past 125 years and in the future : application of an improved flowline model, Ann. Glaciol., 46, 268–274, 2007.
Thogersen, K., Gilbert, A., Schuler, T. V., and Malthe-Sorenssen, A.: Rate-and-state friction explains glacier surge propagation, Nat. Commun., 10, 2823, https://doi.org/10.1038/s41467-019-10506-4, 2019.
Uuemaa, E., Ahi, S., Montibeller, B., Muru, M., and Kmoch, A.: Vertical Accuracy of Freely Available Global Digital Elevation Models (ASTER, AW3D30, MERIT, TanDEM-X, SRTM, and NASADEM), Remote Sensing, 12, 3482, https://doi.org/10.3390/rs12213482, 2020.
Vargo, L. J., Anderson, B. M., Dadiæ, R., Horgan, H. J., Mackintosh, A. N., King, A. D., and Lorrey, A. M.: Anthropogenic warming forces extreme annual glacier mass loss, Nat. Clim. Change, 10, 856–861, https://doi.org/10.1038/s41558-020-0849-2, 2020.
WCRP Global Sea Level Budget Group: Global sea-level budget 1993–present, Earth Syst. Sci. Data, 10, 1551–1590, https://doi.org/10.5194/essd-10-1551-2018, 2018.
Winsvold, S. H., Andreassen, L. M., and Kienholz, C.: Glacier area and length changes in Norway from repeat inventories, The Cryosphere, 8, 1885–1903, https://doi.org/10.5194/tc-8-1885-2014, 2014.
Wu, K., Liu, S., Jiang, Z., Liu, Q., Zhu, Y., Yi, Y., Xie, F., Ahmad Tahir, A., and Saifullah, M.: Quantification of glacier mass budgets in the Karakoram region of Upper Indus Basin during the early twenty-first century, J. Hydrol., 603, 127095, https://doi.org/10.1016/j.jhydrol.2021.127095, 2021.
Xia, W.: An Automatic Extraction Method of Glacier Length Based on Voronoi Algorithm – A Pilot Study in the Sanjiangyuan Region, M.S. thesis, Northwest University, China, https://doi.org/10.27405/d.cnki.gxbdu.2020.000585, 2020.
Yang, B. Y., Zhang, L. X., Gao, Y., Xiang, Y., Mou, N. X., and Suo, L. D. B.: An integrated method of glacier length extraction based on Gaofen satellite data, Journal of Glaciology and Geocryology, 38, 1615–1623, https://doi.org/10.7522/j.issn.1000-0240.2016.0189, 2016.
Yao, X. J., Liu, S. Y., Zhu, Y., Gong, P., An, L. N., and Li, X. F.: Design and implementation of an automatic method for deriving glacier centerlines based on GIS, Journal of Glaciology and Geocryology, 37, 1563–1570, 2015.
Zemp, M., Huss, M., Thibert, E., Eckert, N., McNabb, R., Huber, J., Barandun, M., Machguth, H., Nussbaumer, S. U., Gartner-Roer, I., Thomson, L., Paul, F., Maussion, F., Kutuzov, S., and Cogley, J. G.: Global glacier mass changes and their contributions to sea-level rise from 1961 to 2016, Nature, 568, 382–386, https://doi.org/10.1038/s41586-019-1071-0, 2019.
Zhang, B., Wang, Z., An, J., Liu, T., and Geng, H.: A 30-year monthly 5 km gridded surface elevation time series for the Greenland Ice Sheet from multiple satellite radar altimeters, Earth Syst. Sci. Data, 14, 973–989, https://doi.org/10.5194/essd-14-973-2022, 2022.
Zhang, D. and Zhang, S.: A new global dataset of mountain glacier centerline and length, Science Data Bank [data set], https://doi.org/10.11922/sciencedb.01643, 2022.
Zhang, D., Yao, X., Duan, H., Liu, S., Guo, W., Sun, M., and Li, D.: A new automatic approach for extracting glacier centerlines based on Euclidean allocation, The Cryosphere, 15, 1955–1973, https://doi.org/10.5194/tc-15-1955-2021, 2021.
Zheng, G., Allen, S. K., Bao, A., Ballesteros-Cánovas, J. A., Huss, M., Zhang, G., Li, J., Yuan, Y., Jiang, L., Yu, T., Chen, W., and Stoffel, M.: Increasing risk of glacial lake outburst floods from future Third Pole deglaciation, Nat. Clim. Change, 11, 411–417, https://doi.org/10.1038/s41558-021-01028-3, 2021.
Zhou, S., Yao, X., Zhang, D., Zhang, Y., Liu, S., and Min, Y.: Remote Sensing Monitoring of Advancing and Surging Glaciers in the Tien Shan, 1990–2019, Remote Sensing, 13, 1973, https://doi.org/10.3390/rs13101973, 2021a.
Zhou, Y., Li, X., Zheng, D., Li, Z., An, B., Wang, Y., Jiang, D., Su, J., and Cao, B.: The joint driving effects of climate and weather changes caused the Chamoli glacier-rock avalanche in the high altitudes of the India Himalaya, Science China Earth Sciences, 64, 1909–1921, https://doi.org/10.1007/s11430-021-9844-0, 2021b.