the Creative Commons Attribution 4.0 License.
the Creative Commons Attribution 4.0 License.
 | 26 Nov 2021
A high-accuracy rainfall dataset by merging multiple satellites and dense gauges over the southern Tibetan Plateau for 2014–2019 warm seasons
Kunbiao Li
Mohd Yawar Ali Khan
Ran Xu
Zhihua He
Long Yang
Hui Lu
Yingzhao Ma
Tibetan Plateau (TP) is well known as Asia's water tower from where many large rivers originate. However, due to complex spatial variability in climate and topography, there is still a lack of a high-quality rainfall dataset for hydrological modeling and flood prediction. This study therefore aims to establish a high-accuracy daily rainfall product through merging rainfall estimates from three satellites, i.e., GPM-IMERG, GSMaP and CMORPH, based on a high-density rainfall gauge network. The new merged daily rainfall dataset with a spatial resolution of 0.1∘ focuses on warm seasons (10 June–31 October) from 2014 to 2019. Statistical evaluation indicated that the new dataset outperforms the raw satellite estimates, especially in terms of rainfall accumulation and the detection of ground-based rainfall events. Hydrological evaluation in the Yarlung Zangbo River basin demonstrated high performance of the merged rainfall dataset in providing accurate and robust forcings for streamflow simulations. The new rainfall dataset additionally shows superiority to several other products of similar types, including MSWEP and CHIRPS. This new rainfall dataset is publicly accessible at https://doi.org/10.11888/Hydro.tpdc.271303 (Li and Tian, 2021).
- Article
(3049 KB) - Full-text XML
-
Supplement
(438 KB) - BibTeX
- EndNote


Precipitation, linking atmospheric and hydrological processes, serves as a crucial component of the water cycle (Eltahir and Bras, 1996; Trenberth et al., 2003). Gridded precipitation datasets become more and more popular with the advent of satellite precipitation measurement. The most famous satellite gridded precipitation datasets include the Tropical Rainfall Measuring Mission (TRMM) (Huffman et al., 2007) and its successor the Integrated Multi-satellite Retrievals for Global Precipitation Measurement mission (GPM-IMERG) (Hou et al., 2014), the Global Satellite Mapping of Precipitation (GSMaP) (Ushio et al., 2009), the Climate Prediction Center (CPC) MORPHing technique (CMORPH) (Joyce et al., 2004), etc. These products have been successfully applied in various hydrometeorological studies and water resources management practices (Kidd and Levizzani, 2011; Jiang et al., 2012; Tong et al., 2014; Yang et al., 2015; Sun et al., 2016; Wang et al., 2017).
However, all existing precipitation datasets show insufficient accuracy in high mountainous regions (Derin et al., 2016, 2018, 2019; Zhang and Anagnostou, 2019), which hinders our understanding of climate and hydrological processes over these areas. This can be attributed to the complex physical nature of electromagnetic transmission and precipitation-forming processes (Hong et al., 2007; Bitew and Gebremichael, 2010; Dinku et al., 2010) and harsh environments in high mountains that lead to very limited deployment of in situ rain gauges with insufficient representation of ground observations for training satellite-based precipitation retrieval algorithms. For instance, the Tibetan Plateau (TP) as the roof of the world is surrounded by imposing mountain ranges with an average elevation exceeding 4000 m. It generates several large rivers in Asia and provides invaluable freshwater resources for more than 1.4 billion people living downstream (Immerzeel et al., 2010). However, this vast plateau has a very limited number of precipitation gauges across its 2.5×10⁶ km2 area. The precipitation gauge network operated by the China Meteorological Agency (CMA) contains only 86 gauges over the entire TP (Fig. 1). These gauges are essential to correct satellite precipitation datasets. For example, the GPM-IMERG “Final” Run dataset uses the Global Precipitation Climatology Centre (GPCC) database, and GSMaP_Gauge and the CMORPH use the NOAA Climate Prediction Center (CPC) database. Although both GPCC and CPC databases received data through the Global Telecommunication System (GTS), only part of the abovementioned gauges in the TP were utilized (Xie et al., 2007; Becker, 2013). Previous evaluations over the TP indicated that most products present dependence on topography to varying degrees, and products adjusted by gauge observations show better performance than satellite-only products (Gao et al., 2013; Lu and Yong, 2018). Therefore, a better spatial coverage of rain gauges is critical to correct satellite products in high mountains.
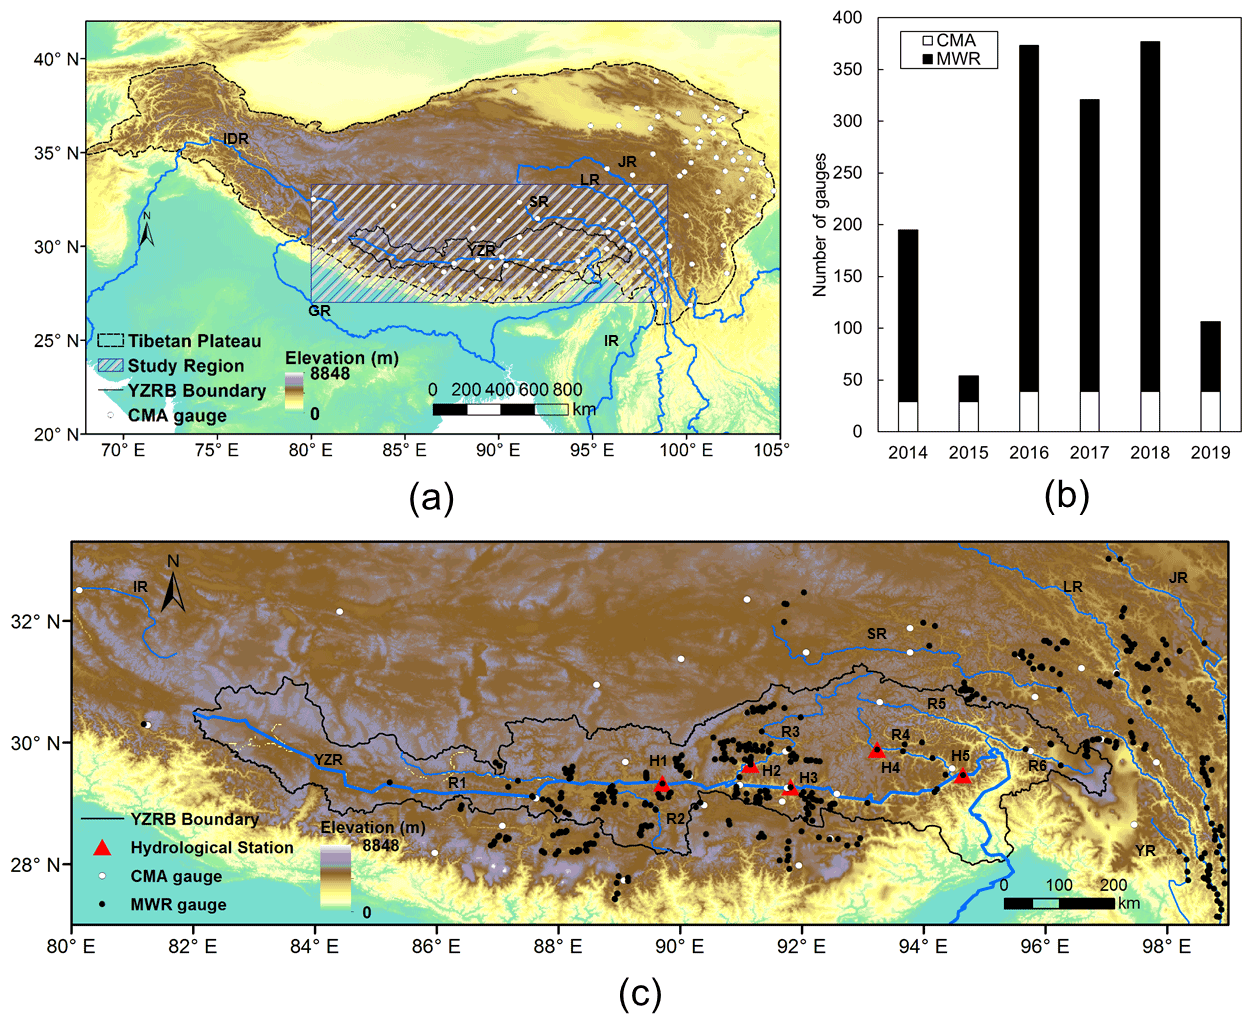
Figure 1(a) The location and topography of the TP and the spatial distributions of CMA gauges. (b) Numbers of ground gauges installed by CMA and MWR in the southern TP during 2014–2019, (c) locations of CMA and MWR rain gauges and main hydrological stations in the southern TP. The names of hydrological stations are labeled as follows: H1 – Yangcun, H2 – Lhasa, H3 – Nugesha, H4 – Gongbujiangda, H5 – Nuxia. The names of tributary rivers are labeled as follows: R1 – Duoxiong Zangbo, R2 – Nianchu River, R3 – Lhasa River, R4 – Niyang River, R5 – Yigong Zangbo, R6 – Parlung Zangbo.
In 2014, the Ministry of Water Resources of China (MWR) launched the flash flood monitoring and alarming campaign. A large number of rain gauges are now accessible over the TP, especially in the southern TP. There are 440 new rain gauges totally involved in 6 years and have been available since 2014, independent of the existing CMA precipitation gauge network (Fig. 1). These gauges provide measurements of precipitation in the liquid phase (i.e., rainfall) at the event timescale. A couple of recent studies have demonstrated the utility of this rain gauge network (Xu et al., 2017; He et al., 2017; Tian et al., 2018; Wang et al., 2020). For instance, Xu et al. (2017) evaluated the performance of TRMM and GPM and the dependence on topography and rainfall intensity based on the network. Their results demonstrated that the data quality of this dense gauge network is strictly controlled, serving as the currently highest gauge density for satellite product evaluation on the TP. Wang et al. (2020) used the gauge data to validate their reproduced precipitation dataset. However, there is not a merging product that assimilates the observations from this dense rain gauge network. This is apparently a unique opportunity to improve the performance of existing satellite-based precipitation datasets for its highest density and quality.
This study aims to provide a high-accuracy rainfall dataset by merging all available ground gauges and three good-quality satellite precipitation datasets over the southern TP for the warm seasons (10 June–31 October) from 2014 to 2019. The remainder of this paper is organized as follows: Sect. 2 describes the study area and the source data. Section 3 provides details of the data merging method and the methods adopted to evaluate the quality of dataset. Results are presented in Sect. 4. The data availability and summary are provided in Sects. 5 and 6, respectively.
2.1 Southern Tibetan Plateau
The Tibetan Plateau, known as the Asian water tower, mainly covers parts of China, India, Myanmar, Bhutan, Nepal and Pakistan. Various climate systems affect the plateau, including westerly winds in winter and the Indian monsoon in summer (Yao et al., 2012). Many large Asian rivers originate from this vast area, including the Yellow River, Yangtze River, Yarlung Zangbo River (YZR), Jinsha River (JR), Lancang River (LR), Salween River (SR), Irrawaddy River (IR), Ganges River (GR) and Indus River (IDR). This study is focused on the southern part of the TP (Fig. 1), including the upper YZR basin (YZRB) as a major basin.
2.2 Ground gauged rainfall
We combined two rain gauge networks managed by MWR and CMA to obtain a high-quality ground reference dataset up to date. The number of rain gauges is presented in Fig. 1b and varies across different years. The spatial distribution of all gauges is presented in Fig. 1c. The gauges are mainly located in the middle reaches of the YZRB and the eastern part of the study area. Despite the high density, we can see these rain gauges are not evenly distributed across the space. This makes satellite rainfall products over varying altitudes and aspects important. Daily rainfall observations during the warm seasons of 2014–2019 were accumulated from the original event-scale measurements. The total number of the CMA and MWR gauges ranges from 53 in 2015 to 377 in 2018, forming the densest rain gauge network up till now.
The CMA gauge data have been widely demonstrated as reliable and accurate in previous studies (Zhai et al., 2005; Su et al., 2020; He et al., 2020). Gauge data used in this study have been manufactured under strict quality control procedures, including an (1) internal consistency check, (2) extreme values check (0–85 mm h−1) and (3) spatial consistency check (Ren et al., 2010). Rain gauges with erroneous values (e.g., enormously large values) were discarded from the entire records. In cold seasons there are many missing values, and only few gauges meet the requirements of the strict quality control method. So the warm seasons from 10 June to 31 October were selected as the study period to maintain the high quality of the outcome rainfall dataset, while gauged rainfall data are continuously collected to update our merged rainfall data.
2.3 Satellite precipitation datasets
Three satellite precipitation products were chosen for the data merging procedure (Lu and Yong, 2018; Derin et al., 2019; Tang et al., 2020), including GPM-IMERG “Final” Run (hereafter referred to as IMERG) from the National Aeronautics and Space Administration (NASA) (https://disc.gsfc.nasa.gov/, last access: 20 May 2021), the GSMaP_Gauge (hereafter referred to as GSMaP) from the Japan Aerospace Exploration Agency (JAXA) (http://sharaku.eorc.jaxa.jp, last access: 20 May 2021), and the CMORPH v1.0 from NOAA CPC (ftp://ftp.cpc.ncep.noaa.gov/precip/CMORPH_V1.0/, last access: 20 May 2021). Spatial resolutions and temporal frequency of the satellite datasets are listed in Table 1. To be consistent, IMERG and GSMaP data were accumulated to daily scale (08:00–08:00 LT, i.e., UTC+8), and CMORPH was bilinearly interpolated to a grid resolution of 0.1∘.
Table 1Multiple-satellite precipitation datasets used in this study.
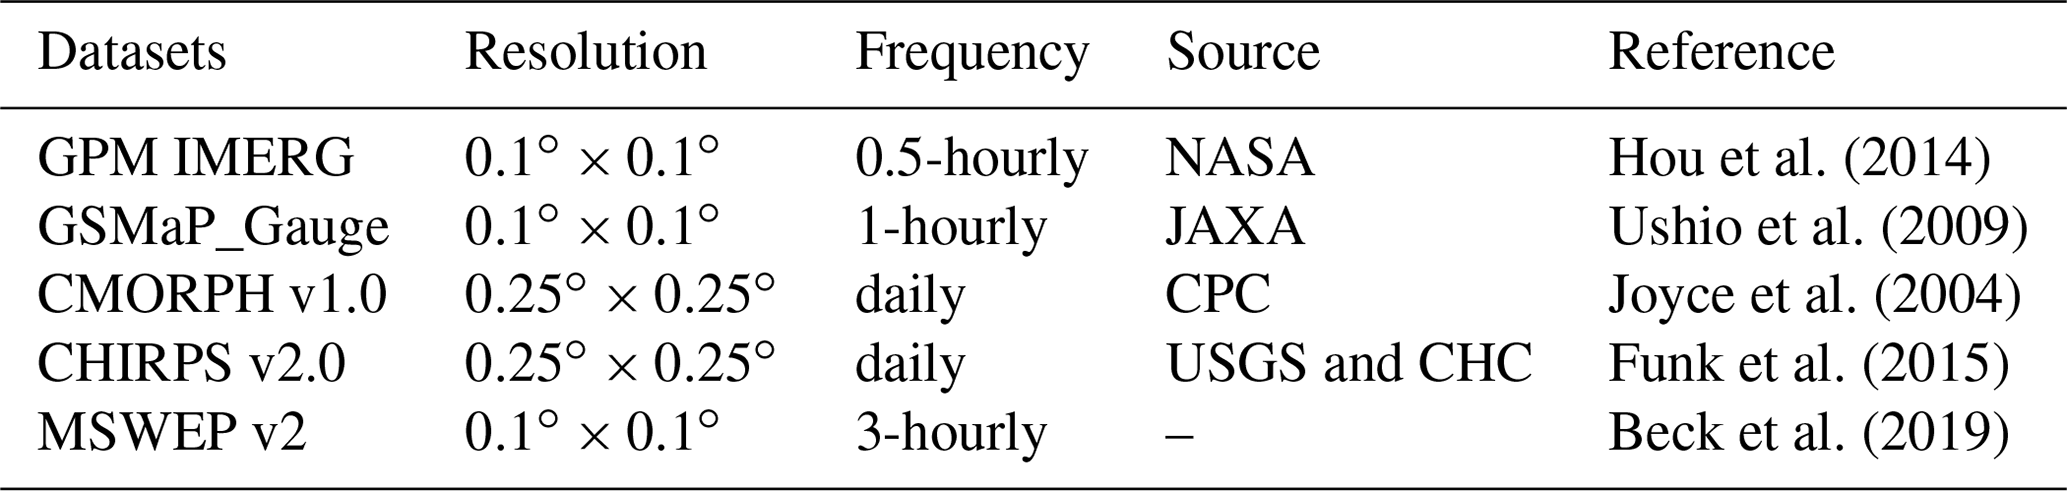
The merged dataset was further compared with two popular merged rainfall datasets of Climate Hazards Group InfraRed Precipitation with Stations (CHIRPS) (Funk et al., 2015) and Multi-Source Weighted-Ensemble Precipitation (MSWEP) (Beck et al., 2019). CHIRPS, from the US Geological Survey (USGS) and Climate Hazards Center (CHC), was originated by merging CHPClim, thermal infrared, TRMM3B42, NOAA CFSv2 precipitation data and ground observation precipitation data. MSWEP was merged from multiple datasets, including CPC, GPCC, CMORPH, GSMaP-MVK, GPM-IMERG, ERA5 and JRA-55. CHIRPS and MSWEP showed great potential in rainfall estimates in previous studies (Liu et al., 2019).
We used the dynamic Bayesian model averaging (DBMA) method (Ma et al., 2018a) to merge the satellite datasets with in situ rain gauges. To evaluate the quality of the new dataset, we carried out statistical and hydrological evaluations and comparisons with CHIRPS and MSWEP in the southern TP.
3.1 Dynamic Bayesian model averaging method
The DBMA method developed by Ma et al. (2018a) was utilized in this work. A flow chart of the merging method is shown in Fig. 2. In the first step, a training dataset was formed by selecting samples from the ground gauged data and three original satellite datasets. The training period was set as 40 d. Increasing the length of the training period did not lead to obvious improvement of the merging method (Ma et al., 2018a). In the second step, the training dataset was transformed by the Box–Cox Gaussian distribution, and the optimal weights for each of the original satellite datasets on a specific grid where a ground gauge is located on each training day were estimated by a logarithmic likelihood equation and the optimal expectation algorithm. In the third step, an ordinary kriging interpolation method was applied to spatially interpolate the daily weights onto grids with no gauges. Finally, posterior spatiotemporal weights were used to obtain the final merged rainfall dataset. The DBMA-merged data have been proven in Ma et al. (2018b) to outperform original satellite data during 2007–2012 over the TP.
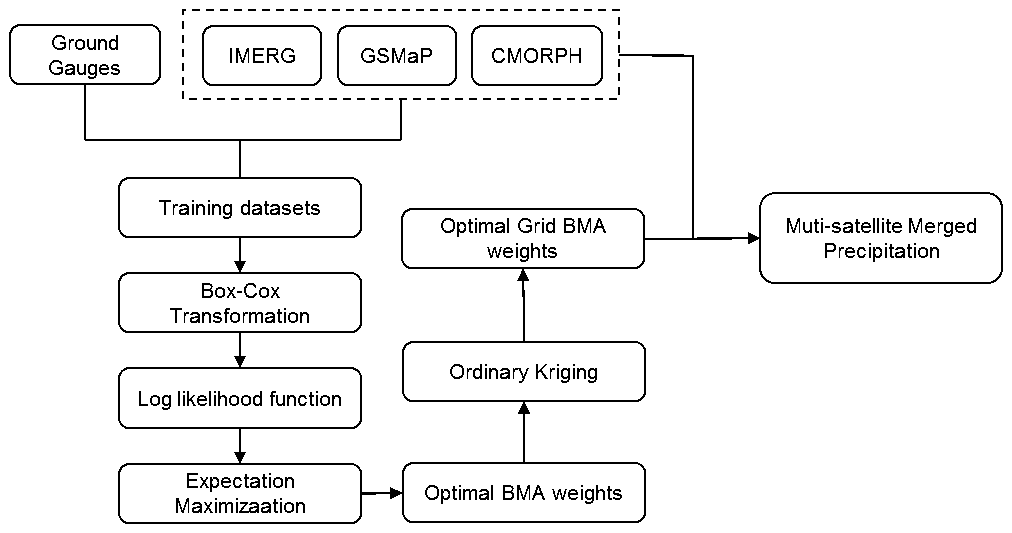
Figure 2Flowchart of the DBMA merging method (adapted from Ma et al., 2018a).
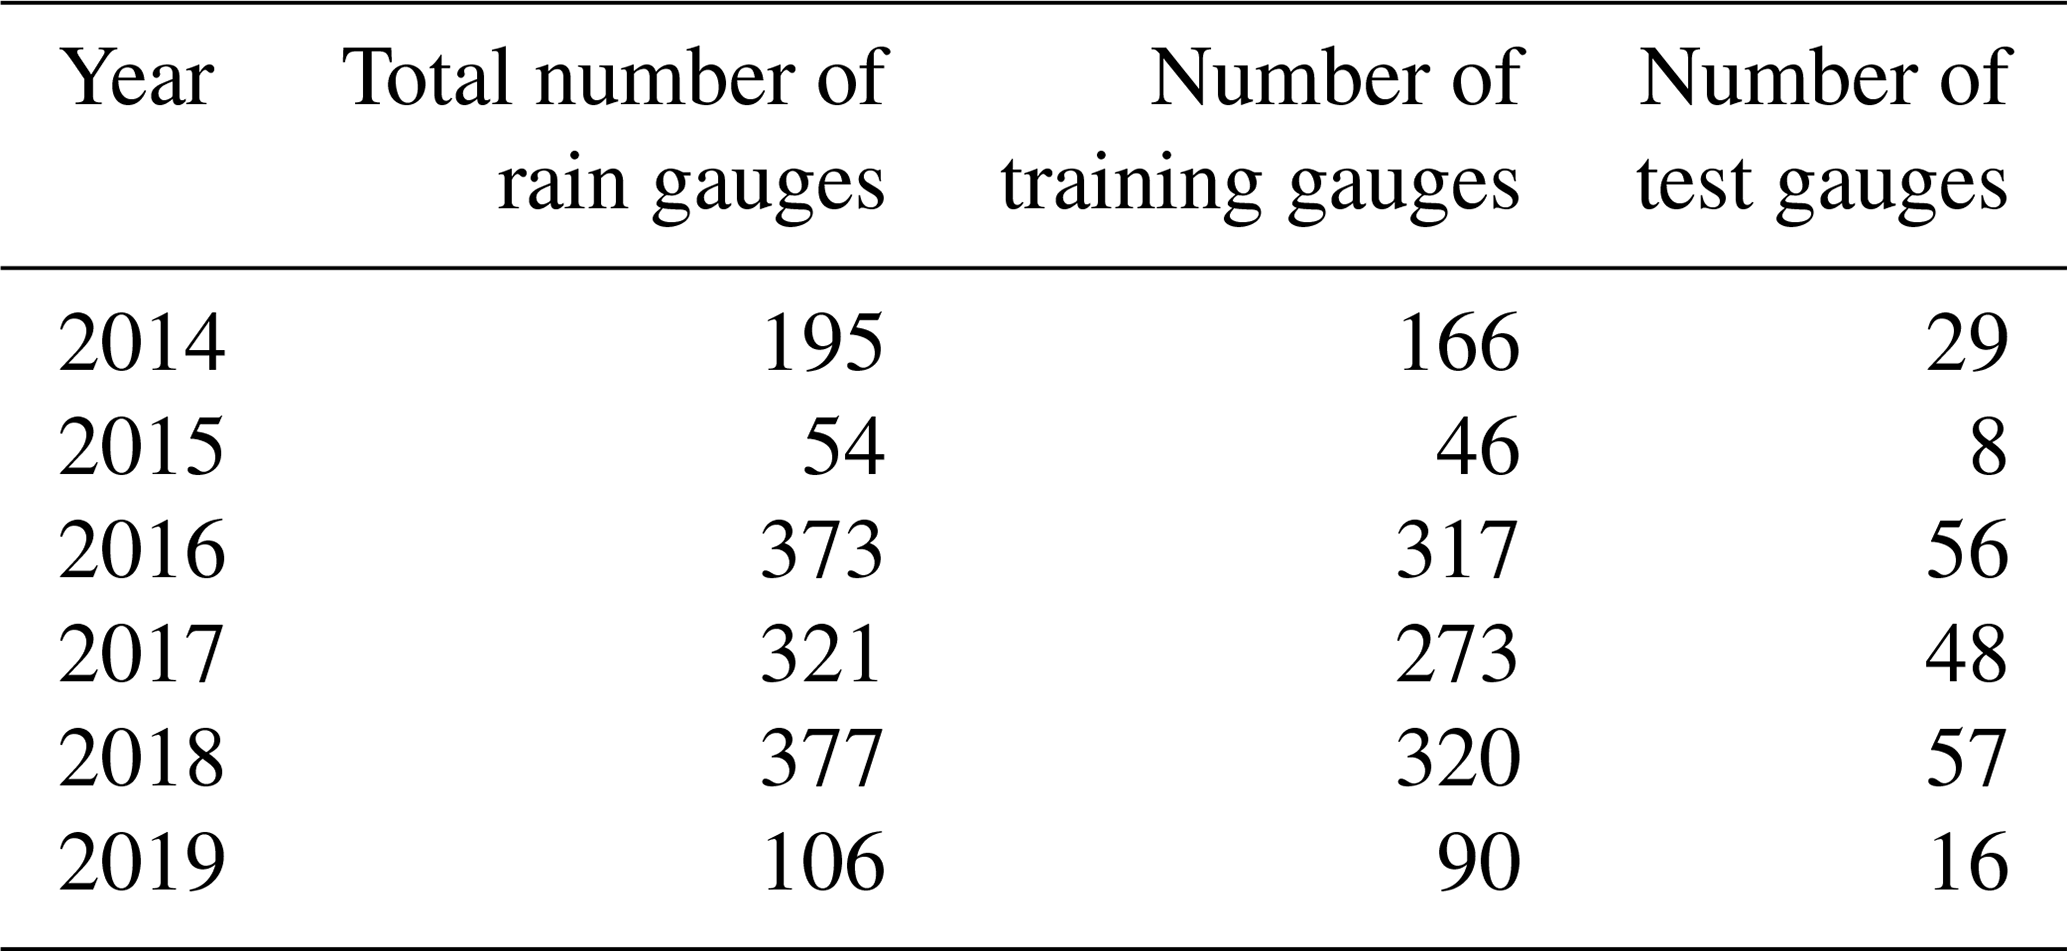
For statistical evaluation of the merged data against ground gauges, around 85 % of the gauges were randomly selected to form a training gauge set for the merging approach in each year during 2014–2019, and the remaining 15 % were used for testing. The training method DBMA of 40 d was only conducted in the training dataset. Table 2 lists the numbers of training and test gauges in each of the warm seasons. The spatial distributions of gauges in each year are presented in Fig. S1 in the Supplement. Data from all gauges were involved in the training procedure of the final version of the merged data.
Table 2Number of rain gauges for training and testing in 2014–2019.
3.2 Statistical evaluation
Performance of the multiple datasets was statistically evaluated by comparing with ground observations on the corresponding satellite grids. Relative bias (RB) and normalized root mean square error (RMSE) were adopted to measure the amount difference between the gridded rainfall and the gauged rainfall. The correlation coefficient (CC) was used to evaluate the consistency between satellite estimates and gauge observations. The skill of rainfall data on detecting rainfall occurrence (rainfall events higher than zero) was evaluated through a set of metrics (similarly to Wilks, 2011), i.e., the probability of detection (POD), assessing how good the multiple rainfall datasets are at detecting the occurrence of rainfall; false alarm ratio (FAR), measuring how often the gridded rainfall datasets detect rainfall when there actually is not rainfall; and critical success index (CSI), measuring the ratio of rainfall events that are correctly detected by the gridded datasets to the total number of observed or detected events. Equations for the above metrics are shown in Table 3.
Table 3Statistical indices that were used to assess the performance of the gridded rainfall datasets.

For the equations listed in Table 3, n is the total number of gridded product data and gauge observation data, i is the ith satellite product datum and gauge observation datum, Gi means gauge observation, and is the average of gauge observation. Si and are gridded estimates and their average, respectively; a represents hit (i.e., event was detected to occur and observed to occur), b represents false alarm (i.e., event was detected to occur but not observed to occur), and c represents miss (i.e., event was not detected to occur but observed to occur).
The triple collocation (TC) technique provides a platform for quantifying the root mean square errors of three products that estimate the same geophysical variable (Stoffelen, 1998). Roebeling et al. (2012) successfully applied the TC technique to estimate errors in three rainfall products across Europe. An extended triple collocation (ETC) introduced in McColl et al. (2014), which is able to estimate errors and correlation coefficients with respect to an unknown target, was used in this study to compare the performance of the DBMA-merged data and two previous merged datasets of CHIRPS and MSWEP.
3.3 Hydrological evaluation
In addition to the statistical assessments against rain gauges, hydrological assessment was used as a tool to test the performance of merged rainfall datasets on forcing hydrological modeling in the study area (similarly see Yong et al., 2012, 2014; Xue et al., 2013; Li et al., 2015). In this section, a semi-distributed hydrological model developed by Tian (2006), namely the Tsinghua Hydrological Model based on Representative Elementary Watershed (THREW), was adopted for the hydrological assessment of rainfall datasets in the YZRB. The YZRB has a drainage area of approximately 240 480 km2 within China's boarder. The basin elevation ranges from 143 to 7261 m, with an average of around 4600 m. YZR is one of the most important transboundary rivers in South Asia and the highest river in the world, which is characterized by a dynamic fluvial regime with an exceptional physiographic setting spreading along the eastern Himalayan region (Goswami, 1985). Due to complex terrain and strongly varying elevation, the YZRB is under control of a variety of climate systems, such as the semi-arid plateau climate prevailing in the upper and middle reaches and the mountainous subtropical and tropical climates prevailing in the lower reaches. In the cold upper reaches, the mean annual rainfall is less than 300 mm. In the warm middle reaches, the mean annual rainfall falls between 300 and 600 mm.
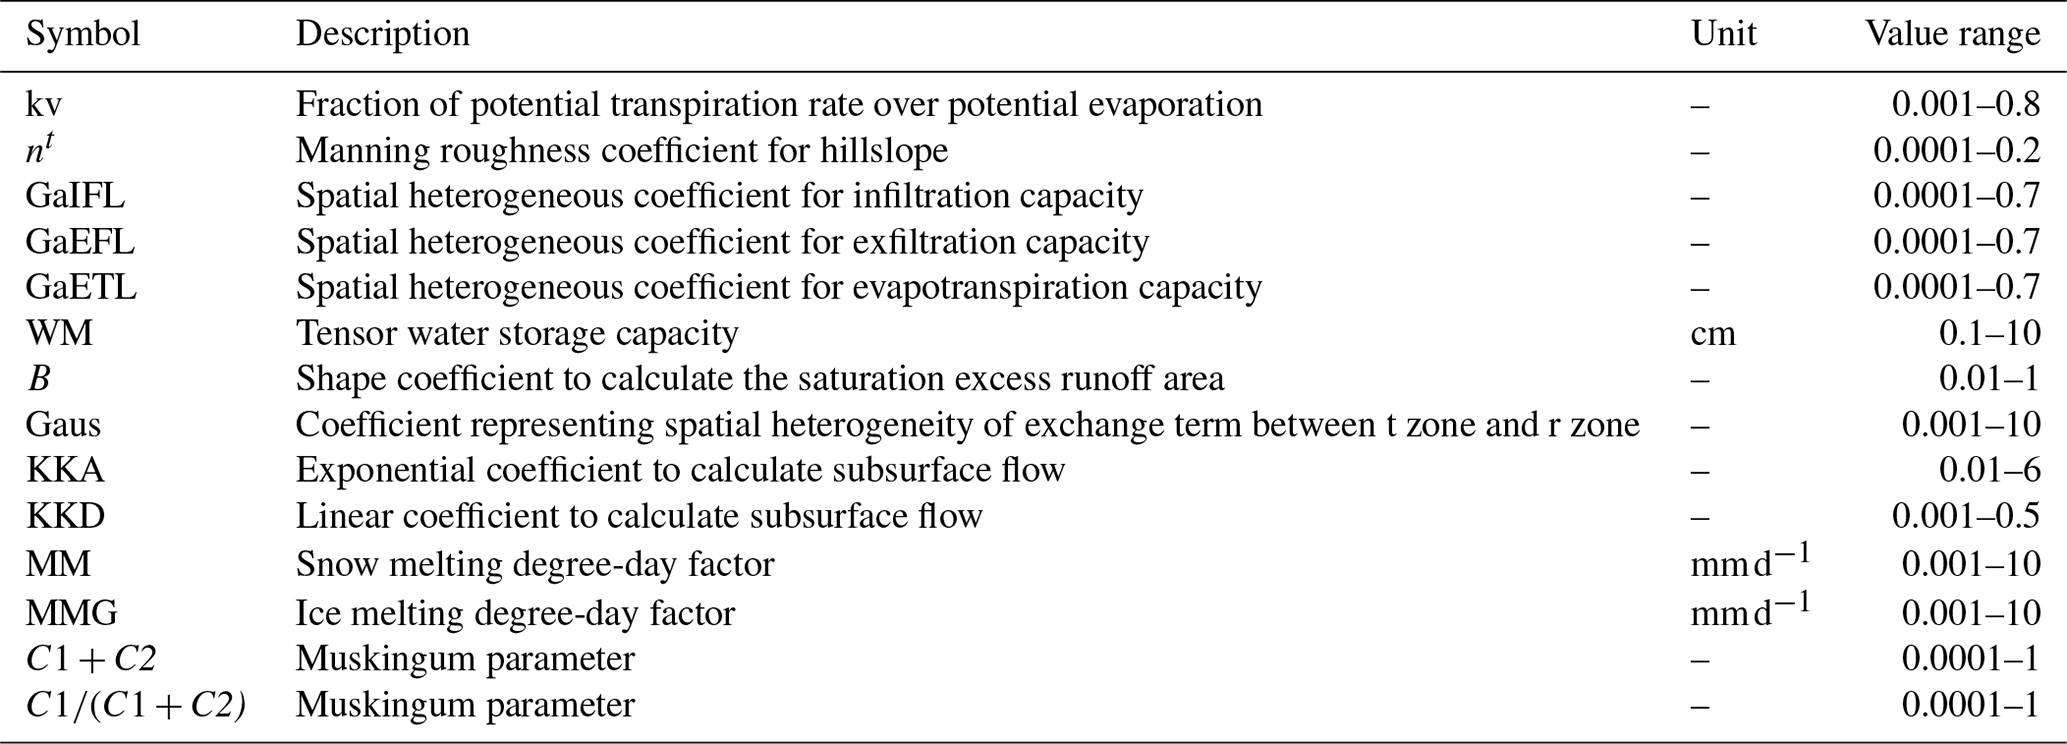
The whole basin area above the Nuxia hydrological station was divided into 63 representative elementary watersheds (REWs). Model parameters were calibrated by daily discharges measured at the Nuxia station. The calibration period is scheduled to run in the warm seasons from 10 June to 31 October in 2014–2017, encompassing a period length of 576 d. The validation period includes two warm seasons in 2018 and 2019 with a total duration of 288 d. Descriptions of the calibrated model parameters can be found in Table 4. An automatic algorithm pySOT developed by Eriksson et al. (2019) was used to optimize the parameter values based on an objective function of Nash–Sutcliffe efficiency coefficient (NSE) (Nash and Sutcliffe, 1970) in Eq. (7). To conduct a continuous hydrological simulation in the study period, the datasets of daily grid-based precipitation over China (Zhao et al., 2014) were used as model inputs in the non-warm seasons when merged rainfall is not available.
where N is the total number of days in the evaluation period, and and represent the observed and simulated runoff on the nth day, respectively. represents the average of observed runoff in the evaluation period.
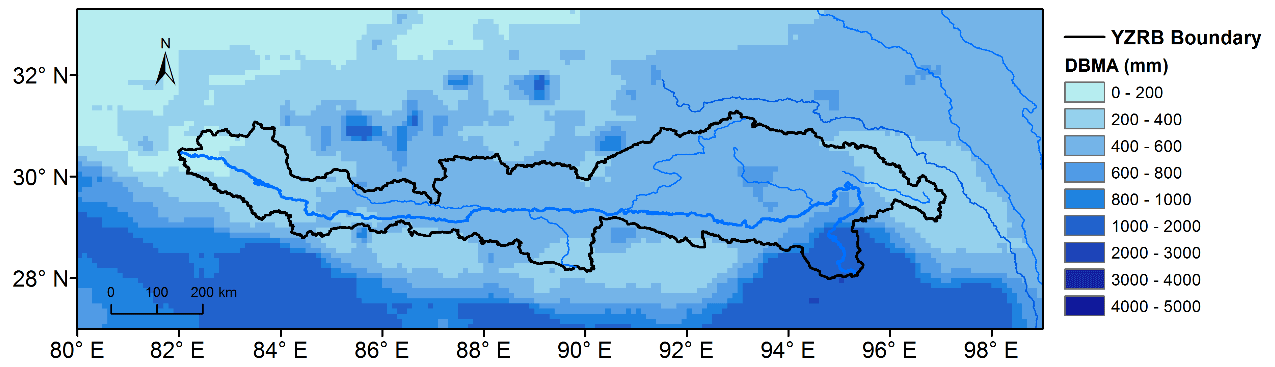
Figure 3Spatial pattern of mean rainfall over six warm seasons in 2014–2019 of the DBMA-merged data in the southern TP.
4.1 Spatiotemporal patterns
Based on the merging method, a new daily rainfall dataset with a spatial resolution of in the warm seasons from 10 June to 31 October (144 d in each year) in 2014–2019 (864 d in 6 years) was generated. Figure 3 presents the spatial pattern of the mean rainfall over the six warm seasons of the merged data in the southern TP. It is shown that extremely high summer rainfall centers concentrate in the southeast and southwest of the study area, which is known as a world-famous heavy rainfall center (see Biskop et al., 2016; Bookhagen and Burbank, 2006; Kumar et al., 2010).
In addition, Fig. 4 compares the time series of average daily weight and rainfall over the YZRB basin derived from the DBMA-merged data and the original satellite datasets. As expected, the DBMA-merged daily rainfall in general fall in the envelope ranges of the three satellite datasets. Merged data are closer to CMORPH in June, September and October while showing equal closeness to all three source satellite data in July and August. It indicates that CMORPH is closer to the in situ gauges than IMERG at basin scale when the rainfall value is small, especially for light-rainfall events with less than 2 mm of rainfall, but this difference tends to be small for heavy-rainfall events.
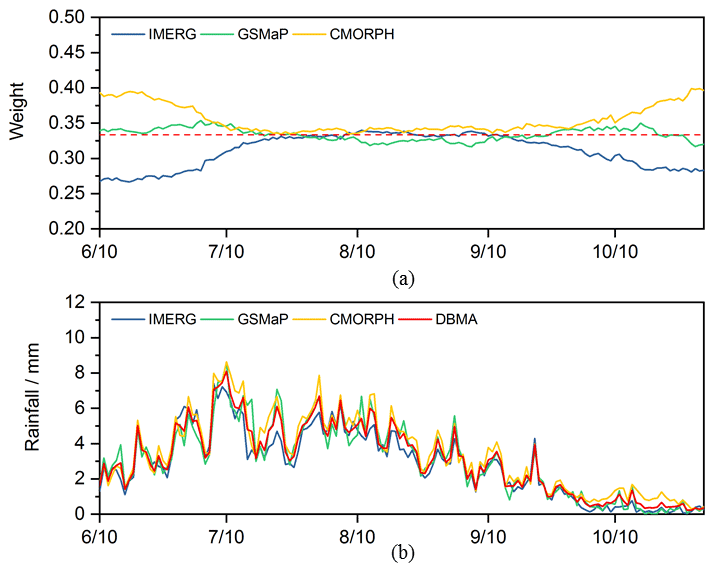
Figure 4Seasonal variations in basin-averaged (a) weights and (b) rainfall estimates of the multiyear daily values of IMERG, GSMaP, CMORPH and DBMA.
4.2 Statistical evaluation
Figure 5 shows the statistical evaluation of the merged and original datasets in the warm seasons. The statistical indices were calculated for three gauge groups including the training gauges, the test gauges and all gauges at different elevation bands. The datasets in general presented comparable performance for the training and test gauge groups, indicating that the sampling procedure of ground gauges is adequately random. The comparable performance of merged data in the training and test gauge groups demonstrated robustness of the merging method for varying gauges. In terms of RSME, CC and POD, the DBMA-merged data show much better performance in all gauge groups and elevation bands than the original satellite datasets. The smallest RSME of merged data indicates that the total rainfall amount of the merged data during the evaluation period showed the lowest difference from the total amount of gauged rainfall. The highest CC and POD highlight the best consistency between merged data and ground gauge data on days when most regions in the basin were rainy. The RB of DBMA-merged data is at an intermediate level among the satellite datasets as it is the weighted average of those three datasets. The higher FAR and lower CSI of DBMA-merged data could be attributed to the fact that the merging method detected rainfall events when the rainfall estimate is higher than zero in any one of the three satellite datasets and thus resulted in overestimated rainfall occurrence. The overestimated rainfall occurrence might have small effects on the estimation of rainfall amount as most of the false alarm events were tiny. It is noteworthy that the performance of the merged data shows smaller variance across elevation bands than that of the original satellite datasets. This is most likely benefiting from the spatially dynamic optimal weights for the original satellite data. However, the merged data presented the largest difference from gauged data at the altitudes of 3000–3500 m because there are far fewer gauges in this elevation zone.
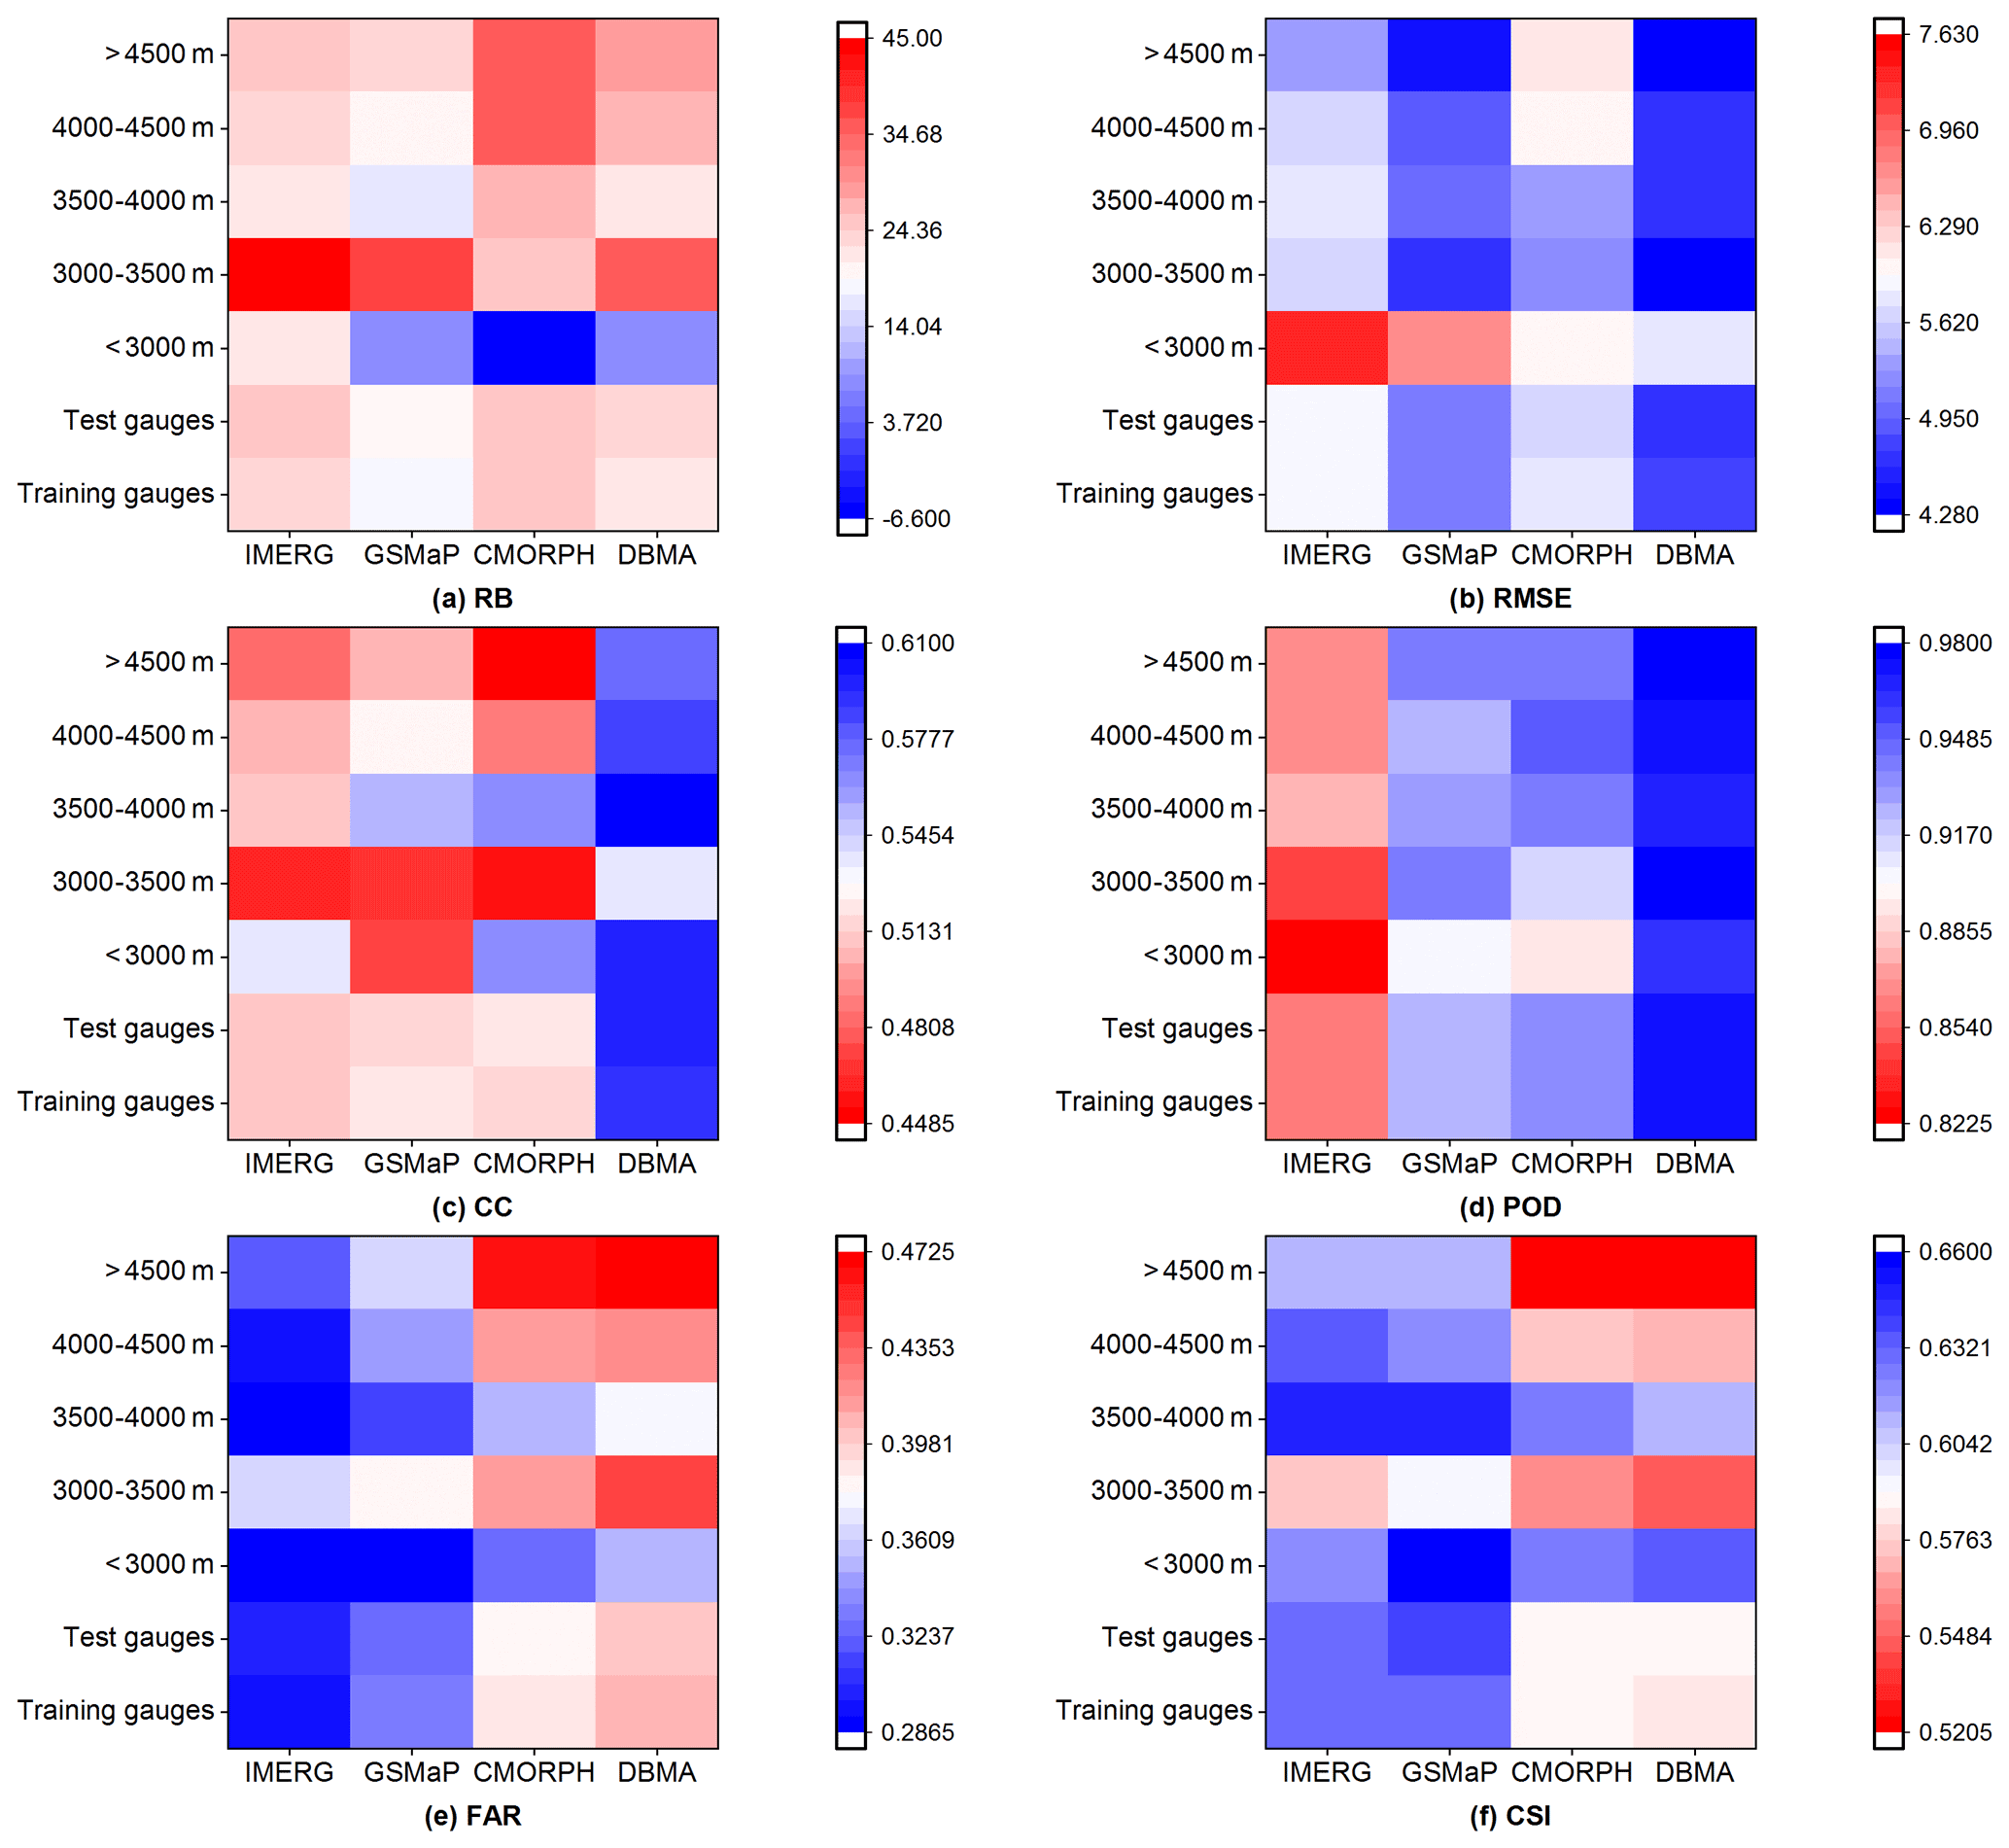
Figure 5Comparisons of the statistical indices of (a) RB, (b) RMSE, (c) CC, (d) POD, (e) FAR and (f) CSI for training gauges, test gauges and all gauges at five elevation bands.
Figure 6 shows the CC of different datasets for specific gauges. The merged data present higher CC values in regions that are densely gauged, i.e., the middle reaches of the YZRB and the eastern part of the study region, which can be expected as the dense ground gauges provided strongly informative benchmark likelihoods for the estimation of satellite data weights. For most of the gauges (Fig. 6a), the merged data presented higher CC values than the IMERG data, which is consistent with Fig. 5c. In contrast, the merged data showed a reduced CC compared to GSMaP and CMORPH for more gauges (Fig. 6b and c), indicating that involving IMERG data in the merging procedure for these gauges leads to deteriorated consistence performance.
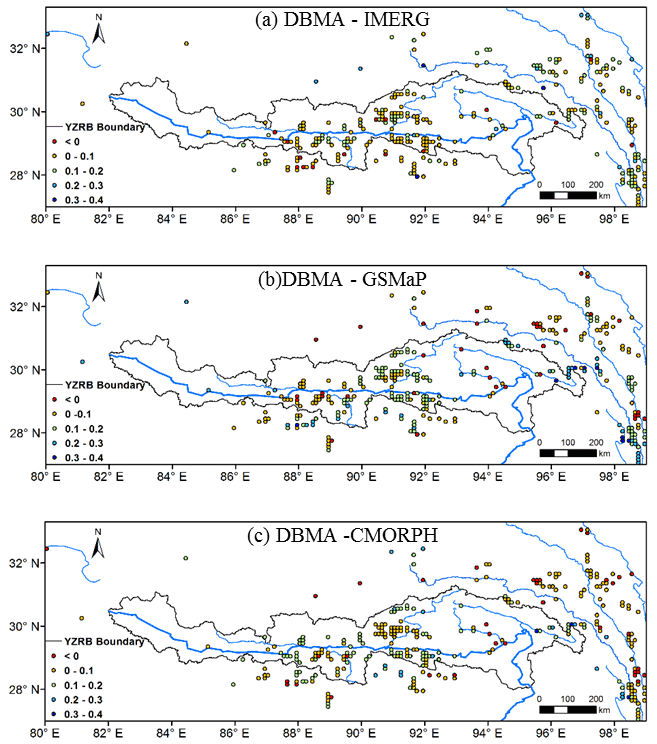
Figure 6Spatial distributions of CC difference between (a) DBMA and IMERG, (b) DBMA and GSMaP, and (c) DBMA and CMORPH.
4.3 Hydrological evaluation
4.3.1 Hydrological simulation
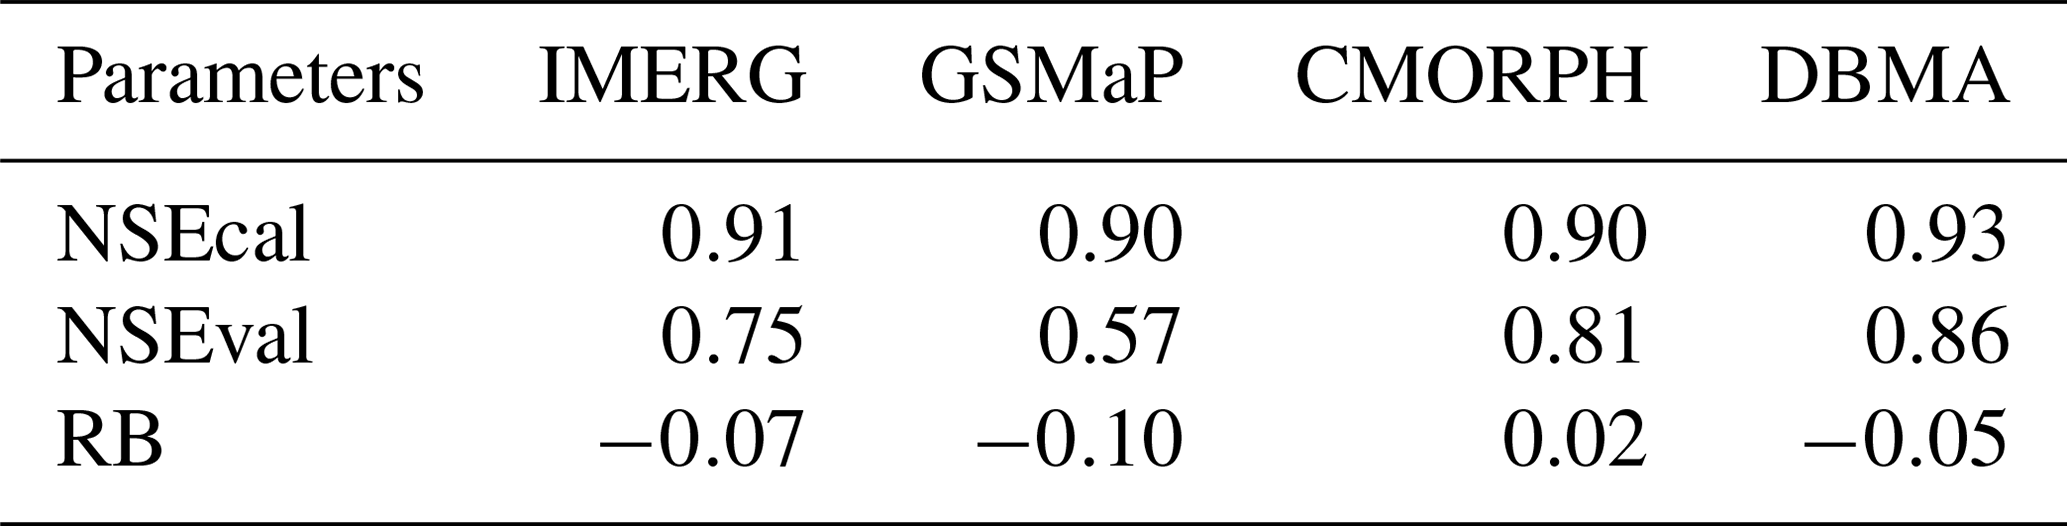
Performance of the THREW model forced by different rainfall datasets is compared in Table 5, including NSE in the calibration period (NSEcal), NSE in the validation period (NSEval) and RB. The DBMA-merged dataset achieved the best runoff simulation among all rainfall inputs, with NSE reaching 0.93 and 0.86 in the calibration and validation period, respectively, indicating an excellent agreement between simulated and observed hydrographs. Both IMERG and GSMaP underestimated the measured daily discharge, but the DBMA-merged dataset improved such underestimations (see RB values in Table 4).
Table 5Evaluation metrics of hydrological simulations forced by IMERG, GSMaP, CMORPH and DBMA.
4.3.2 Uncertainty analysis
The automatic algorithm pySOT was run 200 times to investigate the modeling uncertainty caused by parameter calibration. Figure 7 presents the distributions of NSE values estimated by the ensemble parameter sets of the merged and original rainfall forces. It is shown that streamflow simulated by the DBMA data at the Nuxia station presented higher NSEs and smaller uncertainty ranges than that simulated by the original satellite datasets, indicating that streamflow simulations driven by the merged dataset showed stronger robustness and were less affected by uncertainty in parameter calibration.
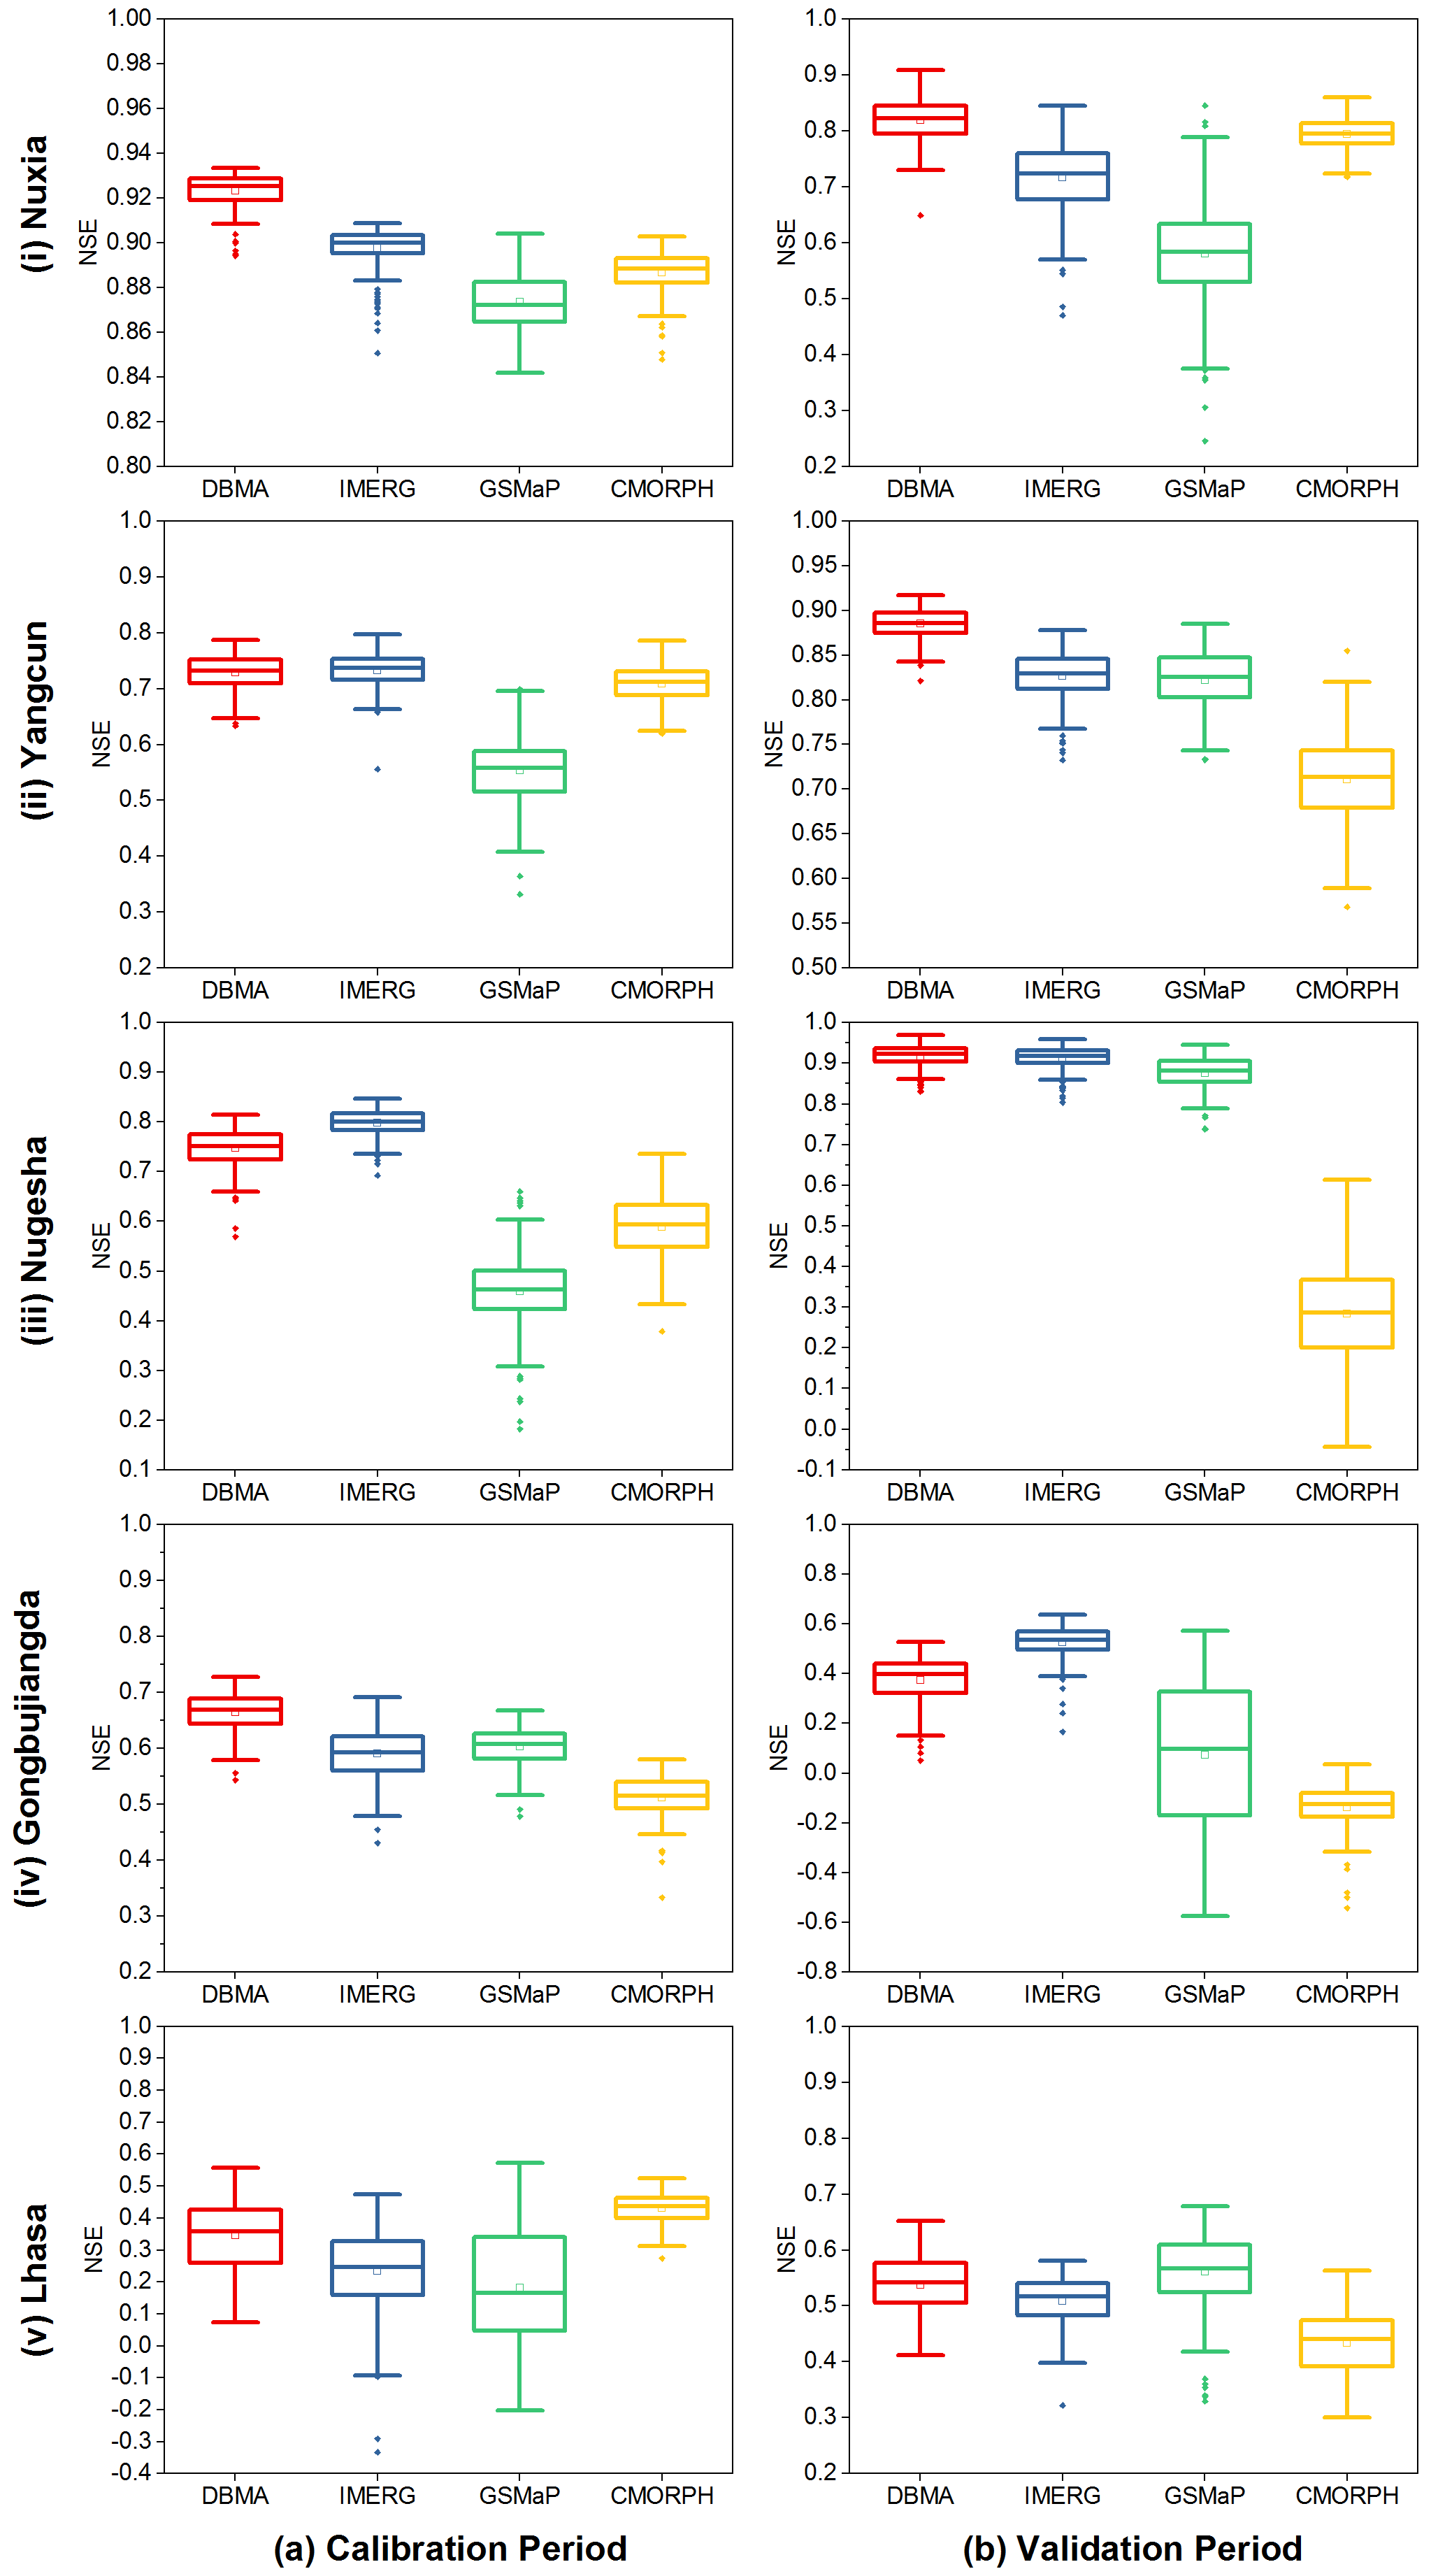
Figure 7Runoff simulations at Nuxia, Yangcun, Nugesha, Gongbujiangda and Lhasa stations forced by multiple rainfall inputs.
In addition to the Nuxia hydrological station, model performance when simulating streamflow at the interior hydrological stations of Yangcun, Nugesha, Gongbujiangda and Lhasa (Fig. 1) was evaluated in Fig. 7. It shows that the IMERG-forced simulations presented poor NSE outliers lower than zero at the Lhasa station in spite of their good performance at the Yangcun and Nugesha stations; the GSMaP-forced simulations presented large uncertainty ranges in the calibration period at Nugesha and Lhasa and in the validation period at Nuxia and Gongbujiangda; the CMORPH-forced simulations showed the worst performance in the validation period at the interior hydrological stations, despite their sound performance in the calibration period at Yangcun and Nugesha. In comparison to the satellite datasets, the DBMA-forced simulations tend to perform consistently better, with smaller uncertainties at all the hydrological stations, which can be attributed to the fact that the merged data incorporated the advantages of different datasets in different regions and temporal periods and thus better captured the spatial variability in rainfall inputs in sub-basins.
4.4 Comparisons with other datasets
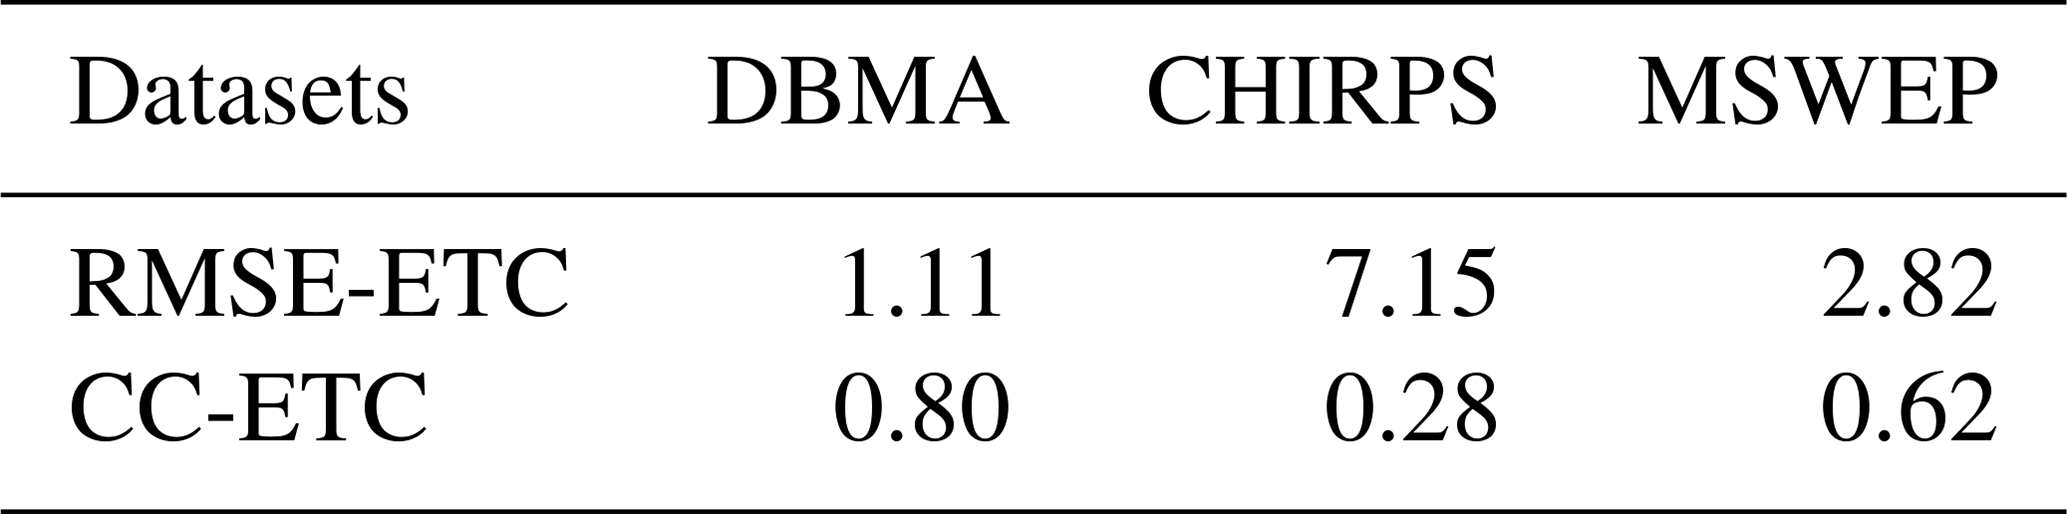
To avoid interference of ground gauge data merged in the DBMA dataset, the ETC method introduced in Sect. 3.2 was applied to compare the three merged datasets in Table 6. The RMSE and CC of DBMA calculated by ETC were 1.11 and 0.80, respectively, both of which are obviously superior compared to the corresponding values estimated by CHIRPS and MSWEP, indicating that DBMA data are closer to the true value of rainfall in the study region.
Table 6Statistical RMSE and CC of merged datasets calculated by the ETC method.
Runoff simulations forced by the three merged datasets during 10 June 2014 to 31 October 2019 estimated by the corresponding optimal parameter sets are presented in Fig. 8. Note that the daily runoff is normalized as Eq. (8) for data security reasons. Simulation by the CHIRPS data presented the lowest performance, with NSE values of 0.75 and 0.78 in the calibration and validation periods, respectively. The DBMA-forced simulation showed the highest performance with NSE values of 0.93 and 0.86 in the calibration and validation periods, followed by the MSWEP-forced simulation, which estimated NSE values of 0.9 in the calibration period and 0.76 in the validation period. The performance of streamflow forced by the merged datasets are consistent with the agreements between the merged rainfall estimates and ground truth shown in Table 6.

The high-accuracy rain dataset by merging multiple satellites and dense ground gauges over the southern Tibetan Plateau for the warm seasons in 2014–2019 is freely accessible at the National Tibetan Plateau Data Center (https://doi.org/10.11888/Hydro.tpdc.271303; Li and Tian, 2021).
We collated ground-based rainfall observations from a dense gauge network over the southern TP. The gauged data provide crucial ground references of measured rainfall. Based on this rain gauge network and three satellite rainfall datasets of IMERG, GSMaP and CMORPH, a merged rainfall dataset in six warm seasons from 10 June to 31 October during 2014–2019 over the southern TP was established. The DBMA method was used to estimate weights varying in space and time of the three satellite datasets for the merged data. The merged rainfall dataset presented improved performance when representing the total amount of rainfall and detecting the occurrence of gauged rainfall events and provides a more reliable forcing for hydrological simulations in the YZRB compared to the original satellite datasets. Comparisons with previous merged rainfall datasets of CHIRPS v2.0 and MSWEP v2 that used relatively sparse rain gauges in the study area demonstrated high values of the newly installed rain gauges for providing a robust ground reference for the merging of current satellite datasets. Our results indicated that the merged datasets can meet the critical needs of accurate forcing inputs for the simulations of warm-season floods and the robustness calibration of hydrological models. Based on these high-accuracy rainfall data and reliable hydrological modeling, much further research in this region then could be conducted, for example, fluvial sediment transport modeling through coupling sediment and hydrology, validation and correction of precipitation from a global climate model, and future runoff projections based on reliable modeling calibration in history.
The supplement related to this article is available online at: https://doi.org/10.5194/essd-13-5455-2021-supplement.
FT and KL designed the research. KL, RX and YM developed the approach and datasets. KL downloaded the datasets and performed most of the computation and analysis work. LY, ZH, HL and MYAK contributed to the revising of the paper.
The contact author has declared that neither they nor their co-authors have any competing interests.
Publisher's note: Copernicus Publications remains neutral with regard to jurisdictional claims in published maps and institutional affiliations.
Ground gauge data from the hydrological bureau of MWR are acknowledged here.
This research has been financially supported by the National Natural Science Foundation of China (grant no. 92047301) and National Key R&D Program of China (grant no. 2018YFC1508102).
This paper was edited by Ge Peng and reviewed by two anonymous referees.
Beck, H. E., Wood, E. F., Pan, M., Fisher, C. K., Miralles, D. G., van Dijk, A. I. J. M., and Adler, R. F.: MSWEP V2 Global 3-Hourly 0.1∘ Precipitation: Methodology and Quantitative Assessment, B. Am. Meteorol. Soc., 100, 473–500, https://doi.org/10.1175/bams-d-17-0138.1, 2019.
Becker, A., Finger, P., Meyer-Christoffer, A., Rudolf, B., Schamm, K., Schneider, U., and Ziese, M.: A description of the global land-surface precipitation data products of the Global Precipitation Climatology Centre with sample applications including centennial (trend) analysis from 1901–present, Earth Syst. Sci. Data, 5, 71–99, https://doi.org/10.5194/essd-5-71-2013, 2013.
Biskop, S., Maussion, F., Krause, P., and Fink, M.: Differences in the water-balance components of four lakes in the southern-central Tibetan Plateau, Hydrol. Earth Syst. Sci., 20, 209–225, https://doi.org/10.5194/hess-20-209-2016, 2016.
Bitew, M. M. and Gebremichael, M.: Evaluation through independent measurements: Complex terrain and humid tropical region in Ethiopia, Satellite rainfall applications for surface hydrology, Springer, Dordrecht, 205–214, https://doi.org/10.1007/978-90-481-2915-7_12, 2010.
Bookhagen, B. and Burbank, D. W.: Topography, relief, and TRMM-derived rainfall variations along the Himalaya, Geophys. Res. Lett., 33, L08405, https://doi.org/10.1029/2006gl026037, 2006.
Derin, Y., Anagnostou, E., Anagnostou, M. N., Kalogiros, J., Casella, D., Marra, A. C., Panegrossi, G., and Sano, P.: Passive Microwave Rainfall Error Analysis Using High-Resolution X-Band Dual-Polarization Radar Observations in Complex Terrain, IEEE T. Geosci. Remote, 56, 2565–2586, https://doi.org/10.1109/tgrs.2017.2763622, 2018.
Derin, Y., Anagnostou, E., Berne, A., Borga, M., Boudevillain, B., Buytaert, W., Chang, C., Chen, H., Delrieu, G., Hsu, Y. C., Lavado-Casimiro, W., Manz, B., Moges, S., Nikolopoulos, E. I., Sahlu, D., Salerno, F., Rodriguez-Sanchez, J., Vergara, H. J., and Yilmaz, K.: Evaluation of GPM-era Global Satellite Precipitation Products over Multiple Complex Terrain Regions, Remote Sens., 11, 2936, https://doi.org/10.3390/rs11242936, 2019.
Dinku, T. C., Stephen, J., and Ceccato, P.: Comparison of CMORPH and TRMM-3B42 over mountainous regions of Africa and South America, Satellite rainfall applications for surface hydrology, Springer, Dordrecht, 193–204, https://doi.org/10.1007/978-90-481-2915-7_11, 2010.
Eltahir, E. A. and Bras, R. L.: Precipitation recycling, Rev. Geophys., 34, 367–378, https://doi.org/10.1029/96RG01927, 1996.
Eriksson, D., Bindel, D., and Shoemaker, C. A.: pySOT and POAP: An event-driven asynchronous framework for surrogate optimization, arXiv [preprint], arXiv:1908.00420, 30 July 2019.
Funk, C., Peterson, P., Landsfeld, M., Pedreros, D., Verdin, J., Shukla, S., and Michaelsen, J.: The climate hazards infrared precipitation with stations – a new environmental record for monitoring extremes, Scientific Data, 2, 150066, https://doi.org/10.1038/sdata.2015.66, 2015.
Gao, Y. C. and Liu, M. F.: Evaluation of high-resolution satellite precipitation products using rain gauge observations over the Tibetan Plateau, Hydrol. Earth Syst. Sci., 17, 837–849, https://doi.org/10.5194/hess-17-837-2013, 2013.
Goswami, D. C.: Brahmaputra River, Assam, India: Physiography, basin denudation, and channel aggradation, Water Resour. Res., 21, 959–978, https://doi.org/10.1029/WR021i007p00959, 1985.
He, J., Yang, K., Tang, W., Lu, H., Qin, J., Chen, Y., and Li, X.: The first high-resolution meteorological forcing dataset for land process studies over China, Scientific Data, 7, 1–11, https://doi.org/10.1038/s41597-020-0369-y, 2020.
He, Z., Yang, L., Tian, F., Ni, G., Hou, A., and Lu, H.: Intercomparisons of Rainfall Estimates from TRMM and GPM Multisatellite Products over the Upper Mekong River Basin, J. Hydrometeorol., 18, 413–430, https://doi.org/10.1175/jhm-d-16-0198.1, 2017.
Hong, Y., Gochis, D., Cheng, J.-t., Hsu, K.-l., and Sorooshian, S.: Evaluation of PERSIANN-CCS Rainfall Measurement Using the NAME Event Rain Gauge Network, J. Hydrometeorol., 8, 469–482, https://doi.org/10.1175/jhm574.1, 2007.
Hou, A. Y., Kakar, R. K., Neeck, S., Azarbarzin, A. A., Kummerow, C. D., Kojima, M., and Iguchi, T.: The Global Precipitation Measurement Mission, B. Am. Meteorol. Soc., 95, 701–722, https://doi.org/10.1175/bams-d-13-00164.1, 2014.
Hou, S., Tian, F., Yang, L., Hu, H., and Hou, A.: How Does the Evaluation of the GPM IMERG Rainfall Product Depend on Gauge Density and Rainfall Intensity?, J. Hydrometeorol., 19, 339–349, https://doi.org/10.1175/jhm-d-17-0161.1, 2018.
Huffman, G. J., Bolvin, D. T., Nelkin, E. J., Wolff, D. B., Adler, R. F., Gu, G., Hong, Y., Bowman, K. P., and Stocker, E. F.: The TRMM Multisatellite Precipitation Analysis (TMPA): Quasi-global, multiyear, combined-sensor precipitation estimates at fine scales, J. Hydrometeorol., 8, 38–55, https://doi.org/10.1175/JHM560.1, 2007.
Immerzeel, W. W., Van Beek, L. P., and Bierkens, M. F.: Climate change will affect the Asian water towers, Science, 328, 1382–1385, https://doi.org/10.1126/science.1183188, 2010.
Jiang, S., Ren, L., Hong, Y., Yong, B., Yang, X., Yuan, F., and Ma, M.: Comprehensive evaluation of multi-satellite precipitation products with a dense rain gauge network and optimally merging their simulated hydrological flows using the Bayesian model averaging method, J. Hydrol., 452–453, 213–225, https://doi.org/10.1016/j.jhydrol.2012.05.055, 2012.
Joyce, R. J., Janowiak, J. E., Arkin, P. A., and Xie, P.: CMORPH: A Method that Produces Global Precipitation Estimates from Passive Microwave and Infrared Data at High Spatial and Temporal Resolution, J. Hydrometeorol., 5, 487–503, 2004.
Kidd, C. and Levizzani, V.: Status of satellite precipitation retrievals, Hydrol. Earth Syst. Sci., 15, 1109–1116, https://doi.org/10.5194/hess-15-1109-2011, 2011.
Kumar, V., Jain, S. K., and Singh, Y.: Analysis of long-term rainfall trends in India, Hydrolog. Sci. J., 55, 484–496, https://doi.org/10.1080/02626667.2010.481373, 2010.
Li, K. and Tian, F.: A High-Accuracy Rainfall Dataset by Merging Multi-Satellites and Dense Gauges over Southern Tibetan Plateau (2014–2019 Warm Seasons), National Tibetan Plateau Data Center [data set], https://doi.org/10.11888/Hydro.tpdc.271303, 2021.
Li, Z., Yang, D., Gao, B., Jiao, Y., Hong, Y., and Xu, T.: Multiscale hydrologic applications of the latest satellite precipitation products in the Yangtze River Basin using a distributed hydrologic model, J. Hydrometeor., 16, 407–426, https://doi.org/10.1175/JHM-D-14-0105.1, 2015.
Liu, J., Shangguan, D., Liu, S., Ding, Y., Wang, S., and Wang, X.: Evaluation and comparison of CHIRPS and MSWEP daily-precipitation products in the Qinghai-Tibet Plateau during the period of 1981–2015, Atmos. Res., 230, 104634, https://doi.org/10.1016/j.atmosres.2019.104634, 2019.
Lu, D. and Yong, B.: Evaluation and Hydrological Utility of the Latest GPM IMERG V5 and GSMaP V7 Precipitation Products over the Tibetan Plateau, Remote Sens., 10, 2022, https://doi.org/10.3390/rs10122022, 2018.
Ma, Y., Hong, Y., Chen, Y., Yang, Y., Tang, G., Yao, Y., Long, D., Li, C., Han, Z., and Liu, R.: Performance of optimally merged multisatellite precipitation products using the dynamic Bayesian model averaging scheme over the Tibetan Plateau, J. Geophys. Res.-Atmos., 123, 814–834, https://doi.org/10.1002/2017JD026648, 2018a.
Ma, Y., Yang, Y., Han, Z., Tang, G., Maguire, L., Chu, Z., and Hong, Y.: Comprehensive evaluation of ensemble multi-satellite precipitation dataset using the dynamic bayesian model averaging scheme over the Tibetan Plateau, J. Hydrol., 556, 634–644, https://doi.org/10.1016/j.jhydrol.2017.11.050, 2018b.
McColl, K. A., Vogelzang, J., Konings, A. G., Entekhabi, D., Piles, M., and Stoffelen, A.: Extended triple collocation: Estimating errors and correlation coefficients with respect to an unknown target, Geophys. Res. Lett., 41, 6229–6236, https://doi.org/10.1002/2014gl061322, 2014.
Nash, J. E. and Sutcliffe, J. V.: River flow forecasting through conceptual models part I – A discussion of principles, J. Hydrol., 10, 282–290, https://doi.org/10.1016/0022-1694(70)90255-6, 1970.
Ren, Z. H., Zhao, P., Zhang, Q., Zhang, Z. F., Cao, L. J., Yang, Y. R., and Chen, Z.: Quality control procedures for hourly precipitation data from automatic weather stations in China, Meteor. Mon., 36, 123–132, 2010.
Roebeling, R. A., Wolters, E. L. A., Meirink, J. F., and Leijnse, H.: Triple Collocation of Summer Precipitation Retrievals from SEVIRI over Europe with Gridded Rain Gauge and Weather Radar Data, J. Hydrometeorol., 13, 1552–1566, https://doi.org/10.1175/jhm-d-11-089.1, 2012.
Stoffelen, A.: Toward the true near-surface wind speed: Error modeling and calibration using triple collocation, J. Geophys. Res.-Oceans, 103, 7755–7766, https://doi.org/10.1029/97jc03180, 1998.
Su, Y., Zhao, C., Wang, Y., and Ma, Z.: Spatiotemporal Variations of Precipitation in China Using Surface Gauge Observations from 1961 to 2016, Atmosphere, 11, 303, https://doi.org/10.3390/atmos11030303, 2020.
Sun, R., Yuan, H., Liu, X., and Jiang, X.: Evaluation of the latest satellite–gauge precipitation products and their hydrologic applications over the Huaihe River basin, J. Hydrol., 536, 302–319, https://doi.org/10.1016/j.jhydrol.2016.02.054, 2016.
Tang, G., Clark, M. P., Papalexiou, S. M., Ma, Z., and Hong, Y.: Have satellite precipitation products improved over last two decades? A comprehensive comparison of GPM IMERG with nine satellite and reanalysis datasets, Remote Sens. Environ., 240, 111697, https://doi.org/10.1016/j.rse.2020.111697, 2020.
Tian, F., Hou, S., Yang, L., Hu, H., and Hou, A.: How does the evaluation of the GPM IMERG rainfall product depend on gauge density and rainfall intensity?, J. Hydrometeorol., 19, 339–349, https://doi.org/10.1175/JHM-D-17-0161.1, 2018.
Tong, K., Su, F., Yang, D., and Hao, Z.: Evaluation of satellite precipitation retrievals and their potential utilities in hydrologic modeling over the Tibetan Plateau, J. Hydrol., 519, 423–437, https://doi.org/10.1016/j.jhydrol.2014.07.044, 2014.
Tian, F., Hu, H., Lei, Z., and Sivapalan, M.: Extension of the Representative Elementary Watershed approach for cold regions via explicit treatment of energy related processes, Hydrol. Earth Syst. Sci., 10, 619–644, https://doi.org/10.5194/hess-10-619-2006, 2006.
Trenberth, K. E., Dai, A., Rasmussen, R. M., and Parsons, D. B.: The changing character of preacipitation, B. Am. Meteorol. Soc., 84, 1205–1218, https://doi.org/10.1175/BAMS-84-9-1205, 2003.
Ushio, T., Sasashige, K., Kubota, T., Shige, S., Okamoto, K. I., Aonashi, K., Inoue, T., Takahashi, N., Iguchi, T., Kachi, M., Oki, R., Morimoto, T., and Kawasaki, Z.-I.: A Kalman Filter Approach to the Global Satellite Mapping of Precipitation (GSMaP) from Combined Passive Microwave and Infrared Radiometric Data, J. Meteorol. Soc. Jpn., 87A, 137–151, https://doi.org/10.2151/jmsj.87A.137, 2009.
Wang, Y., Wang, L., Li, X., Zhou, J., and Hu, Z.: An integration of gauge, satellite, and reanalysis precipitation datasets for the largest river basin of the Tibetan Plateau, Earth Syst. Sci. Data, 12, 1789–1803, https://doi.org/10.5194/essd-12-1789-2020, 2020.
Wang, Z., Zhong, R., Lai, C., and Chen, J.: Evaluation of the GPM IMERG satellite-based precipitation products and the hydrological utility, Atmos. Res., 196, 151–163, https://doi.org/10.1016/j.atmosres.2017.06.020, 2017.
Wilks, D. S.: Statistical Methods in the Atmospheric Sciences, vol. 100, Academic Press, Oxford, 2011.
Xie, P., Chen, M., Yang, S., Yatagai, A., Hayasaka, T., Fukushima, Y., and Liu, C.: A gauge-based analysis of daily precipitation over East Asia, J. Hydrometeorol., 8, 607–626, https://doi.org/10.1175/JHM583.1, 2007.
Xu, R., Tian, F., Yang, L., Hu, H., Lu, H., and Hou, A.: Ground validation of GPM IMERG and TRMM 3B42V7 rainfall products over southern Tibetan Plateau based on a high-density rain gauge network, J. Geophys. Res.-Atmos., 122, 910–924, https://doi.org/10.1002/2016jd025418, 2017.
Xue, X., Hong, Y., Limaye, A. S., Gourley, J. J., Huffman, G. J., Khan, S. I., Dorji, C., and Chen, S.: Statistical and hydrological evaluation of TRMM-based Multi-satellite Precipitation Analysis over the Wangchu Basin of Bhutan: Are the latest satellite precipitation products 3B42V7 ready for use in ungauged basins?, J. Hydrol., 499, 91–99, https://doi.org/10.1016/j.jhydrol.2013.06.042, 2013.
Yang, D., Li, Z., Gao, B., Jiao, Y., Hong, Y., and Xu, T.: Multiscale Hydrologic Applications of the Latest Satellite Precipitation Products in the Yangtze River Basin using a Distributed Hydrologic Model, J. Hydrometeorol., 16, 407–426, https://doi.org/10.1175/jhm-d-14-0105.1, 2015.
Yao, T., Thompson, L. G., Mosbrugger, V., Zhang, F., Ma, Y., Luo, T., Xu, B., Yang, X., Joswiak, D. R., Wang, W., Joswiak, M. E., Devkota, L. P., Tayal, S., Jilani, R., and Fayziev, R.: Third pole environment (TPE), Environmental Development, 3, 52–64, 2012.
Yong, B., Hong, Y., Ren, L.-L., Gourley, J. J., Huffman, G. J., Chen, X., and Khan, S. I.: Assessment of evolving TRMM-based multisatellite real-time precipitation estimation methods and their impacts on hydrologic prediction in a high latitude basin, J. Geophys. Res., 117, D09108, https://doi.org/10.1029/2011jd017069, 2012.
Yong, B., Chen, B., Gourley, J. J., Ren, L., Hong, Y., Chen, X., Wang, W., Chen, S., and Gong, L.: Intercomparison of the Version-6 and Version-7 TMPA precipitation products over high and low latitudes basins with independent gauge networks: Is the newer version better in both real-time and post-real-time analysis for water resources and hydrologic extremes?, J. Hydrol., 508, 77–87, https://doi.org/10.1016/j.jhydrol.2013.10.050, 2014.
Zhai, P., Zhang, X., Wan, H., and Pan, X.: Trends in total precipitation and frequency of daily precipitation extremes over China, J. Climate, 18, 1096–1108, https://doi.org/10.1175/JCLI-3318.1, 2005.
Zhang, X. and Anagnostou, E. N.: Evaluation of numerical weather model-based satellite precipitation adjustment in tropical mountainous regions, J. Hydrometeorol., 20, 431–445, https://doi.org/10.1175/JHM-D-18-0008.1, 2019.
Zhao, Y., Zhu, J., and Xu, Y.: Establishment and assessment of the grid precipitation datasets in China for recent 50 years, J. Meteor. Sci., 34, 414–420, 2014.