the Creative Commons Attribution 4.0 License.
the Creative Commons Attribution 4.0 License.
 | 18 Nov 2021
Refined burned-area mapping protocol using Sentinel-2 data increases estimate of 2019 Indonesian burning
David L. A. Gaveau
Adrià Descals
Mohammad A. Salim
Douglas Sheil
Sean Sloan
Many nations are challenged by landscape fires. A confident knowledge of the area and distribution of burning is crucial to monitor these fires and to assess how they might best be reduced. Given the differences that arise using different detection approaches, and the uncertainties surrounding burned-area estimates, their relative merits require evaluation. Here we propose, illustrate, and examine one promising approach for Indonesia where recurring forest and peatland fires have become an international crisis.
Drawing on Sentinel-2 satellite time-series analysis, we present and validate new 2019 burned-area estimates for Indonesia. The corresponding burned-area map is available at https://doi.org/10.5281/zenodo.4551243 (Gaveau et al., 2021a). We show that >3.11 million hectares (Mha) burned in 2019. This burned-area extent is double the Landsat-derived official estimate of 1.64 Mha from the Indonesian Ministry of Environment and Forestry and 50 % more that the MODIS MCD64A1 burned-area estimate of 2.03 Mha. Though we observed proportionally less peatland burning (31 % vs. 39 % and 40 % for the official and MCD64A1 products, respectively), in absolute terms we still observed a greater area of peatland affected (0.96 Mha) than the official estimate (0.64 Mha). This new burned-area dataset has greater reliability than these alternatives, attaining a user accuracy of 97.9 % (CI: 97.1 %–98.8 %) compared to 95.1 % (CI: 93.5 %–96.7 %) and 76 % (CI: 73.3 %–78.7 %), respectively. It omits fewer burned areas, particularly smaller- (<100 ha) to intermediate-sized (100–1000 ha) burns, attaining a producer accuracy of 75.6 % (CI: 68.3 %–83.0 %) compared to 49.5 % (CI: 42.5 %–56.6 %) and 53.1 % (CI: 45.8 %–60.5 %), respectively. The frequency–area distribution of the Sentinel-2 burn scars follows the apparent fractal-like power law or Pareto pattern often reported in other fire studies, suggesting good detection over several magnitudes of scale. Our relatively accurate estimates have important implications for carbon-emission calculations from forest and peatland fires in Indonesia.
- Article
(8293 KB) - Full-text XML
-
Supplement
(638 KB) - BibTeX
- EndNote


Accurate burned-area maps are key to characterising landscape fires, clarifying emissions, and identifying the probable causes. Such information is needed to target interventions; to assess policies and practices intended to reduce or control fires, such as law enforcement and restoration of fire-prone degraded lands; and to measure progress towards international climate commitments (Sloan et al., 2021). Here, we focus on Indonesia where recurring forest and peatland fires have become an international crisis (Tacconi, 2016). These concerns arise from the large carbon emissions associated with these fires and the impact of associated aerosol emissions for human health in the wider region (Van der Werf et al., 2008; Marlier et al., 2013). Although fires have occurred locally in Southeast Asia for millennia, they are increasingly frequent in Indonesia's disturbed forests and deforested peatlands (Field et al., 2009; Gaveau et al., 2014). The causes and motivations of fire use can be complex (Dennis et al., 2005), but many are lit to create or maintain agricultural land (Gaveau et al., 2014; Adrianto et al., 2020). Most fires occur during drier months (July to October), and the threats are greatly heightened during years of anomalously low rainfall (Sloan et al., 2017; Field et al., 2016). During 2015, a strong El Niño-induced drought year, fires burned an estimated 2.6 Mha according to official estimates (Sipongi, 2020). Although 2015 burning was approximately half as extensive as that in 1997, the most severe El Niño and fire season on record (Fanin and Werf, 2017), about 50 % more peatlands burned (Fanin and Werf, 2017). The 2015 fires emitted between 0.89 and 1.5 billion tonnes of CO2 equivalent (Huijnen et al., 2016; Lohberger et al., 2018; Van Der Werf et al., 2017), representing about half of Indonesia's greenhouse gas emissions for that year (Gütschow et al., 2019). In Palangkaraya, the capital city of Central Kalimantan Province, daily average particulate matter (PM10) concentrations often reached 1000 to 3000 µg m−3, amongst the worst sustained air quality ever recorded worldwide (Wooster et al., 2018). Over half a million people suffered respiratory problems in the aftermath, and between 12 000 and 100 000 premature deaths were estimated (Koplitz et al., 2016; Crippa et al., 2016). Other impacts include loss and degradation of habitats with high conservation values and the associated consequences for impacted wildlife (Harrison et al., 2016).
In response to the catastrophic 2015 fires, the Indonesian government instituted several ambitious schemes including fire bans enforced by dedicated command posts (Sloan et al., 2021) and a national program of peatland restoration (Carmenta et al., 2021). Despite the investment in these approaches and measures, and initial success, severe burning struck Indonesia again in late 2019. While Sloan et al. (2021) suggest that 2019 fire activity was lower than expected given the severe drought conditions, the total number of MODIS active-fire detections in late 2019 on peatlands was still amongst the greatest recorded since 2001 (Sloan et al., 2021). However, counts of active-fire detections do not provide estimates of area burned (Tansey et al., 2008), and for 2019 such estimates remain uncertain.
Those wishing to assess and monitor burned areas have various approaches to consider. Several global burned-area products generated using coarse-resolution satellites (> 250 m) can be applied over Indonesia. These include the FireCCI41 product derived from Envisat-MERIS (Alonso-Canas and Chuvieco, 2015), the FireCCI51 and MCD64A1 products derived from Terra And Aqua MODIS (Giglio et al., 2018; Lizundia-Loiola et al., 2020), the FireCCILT11 product derived from AVHRR (Otón et al., 2021), and the C3SBA10 product derived from Sentinel-3 (Lizundia-Loiola et al., 2021). Currently, MCD64A1 (collection 6), based on MODIS 500 m bands, is considered one of the most accurate global products (Chuvieco et al., 2019), with omission and commission errors of 40 % and 22 % globally for the “burned” class (Giglio et al., 2018). This validation is based on independent globally distributed, visually interpreted reference satellite data, however none over Indonesia. These coarse-resolution datasets generally omit small-scale fires and, thus, the reported burned area is underestimated (Ramo et al., 2021). This has motivated research in the use of medium-resolution satellites (10 to 30 m) such as Sentinel-1 (Lohberger et al., 2018, in Indonesia), Sentinel-2 (Chuvieco et al., 2018, in sub-Saharan Africa), and the Landsat constellation (Hawbaker et al., 2020, in North America) to produce more detailed burned-area maps. Lohberger et al. (2018) reported 4.6 Mha burned in 2015 in Indonesia, nearly double the estimate of 2.6 Mha from the Indonesian Ministry of Environment and Forestry (MOEF), using visual interpretations of time-series Landsat 8 imagery (Sipongi, 2020).
For the year 2019, MOEF (hereafter “official estimate”) estimated that 1.64 Mha burned (Sipongi, 2020), while MCD64A1 (collection 6) indicated 2.03 Mha. The MCD64A1 product omits smaller fires because of the coarse 500 m spatial resolution and thus likely overlooked many localised events. The Landsat imagery underlying the official estimates is, while at a finer scale, observed every 16 d at best (typically much less due to cloud and smoke), meaning that many burns may remain undetected. Also, smaller-scale and/or dispersed fire activity may be underestimated, considering the challenges of their visual interpretation and delineation. Visual interpretation entails a manual delineation of burn perimeters, which yields accurate results for large burn mapping at local scales but is time consuming at large spatial scales, particularly when mapping small fires. A thorough accuracy assessment is also not available for the official burned-area products. Given the uncertain errors around burned-area estimates, and the differences between them, the accuracy and merits of different mapping approaches over Indonesia require formal examination.
Here, we present new and validated 2019 burned-area estimates for Indonesia using a time series of the atmospherically corrected surface reflectance multispectral images (level 2A product) taken by the Sentinel-2A and B satellites. With higher spatial resolution (20 m) and more frequent observations (5 d revisit time), the Sentinel-2A and B satellites offer relatively comprehensive and accurate burned-area mapping (Huang et al., 2016; Ramo et al., 2021). We used the Google Earth Engine (Gorelick et al., 2017), thus permitting wide application. We also developed an independent reference dataset to compare the accuracy of our estimate against the official and MCD64A1 burned-area maps. Given the lack of objectively distributed ground truthing, we sought ways to extract reference sites by visually detecting a smoke plume, burn, or heat source (flaming front or hotspot) from the archive of original Sentinel-2 images. Finally, we examined differences in terms of burn size frequency distributions among these three burned-area estimates to examine spatial patterns.
2.1 Summary of methods
A burned area is identified by alteration of vegetation cover and structure along with deposits of char and ash. We mapped such areas using a change-detection approach, i.e. by comparing Sentinel-2 infrared signals recorded before and after a burning event (Liu et al., 2020). We analysed a time series of the normalised burned-area ratio (see Sect. 2.2) to assemble two national composite images depicting the spectral condition of vegetation shortly before and shortly after a disturbance (Fig. 1). These composites represent a convenient way to capture the entire burned landscape stored in just two image files. Although we refer to these images as “pre- and post-fire composites”, they also capture damage due to other causes, for example a cutting event (e.g. mechanical conversion agriculture, timber plantation, roads, population centres, mining, or natural timber harvesting), a disease impacting the vegetation, strong winds, floods, or landslides (Gaveau et al., 2021b). After the production of the pre- and post-fire composites, we used a “random forest” classification model (see Sect. 2.3) trained on visually identified pairs of pre- and post-fire pixels to confirm if the spectral changes indicating vegetation damage corresponded to a burning event. Third, three independent interpreters assembled a reference dataset by visually identifying burns in the original time-series Sentinel-2 images. Fourth, we assessed our burned-area map, as well as the official and MCD64A1 burned-area maps, against the reference dataset to gauge the reliability and accuracy of the three burned-area products. Finally, we tested whether, and how, the three burned-area estimates differed in their tendencies to incorporate burns of different sizes.
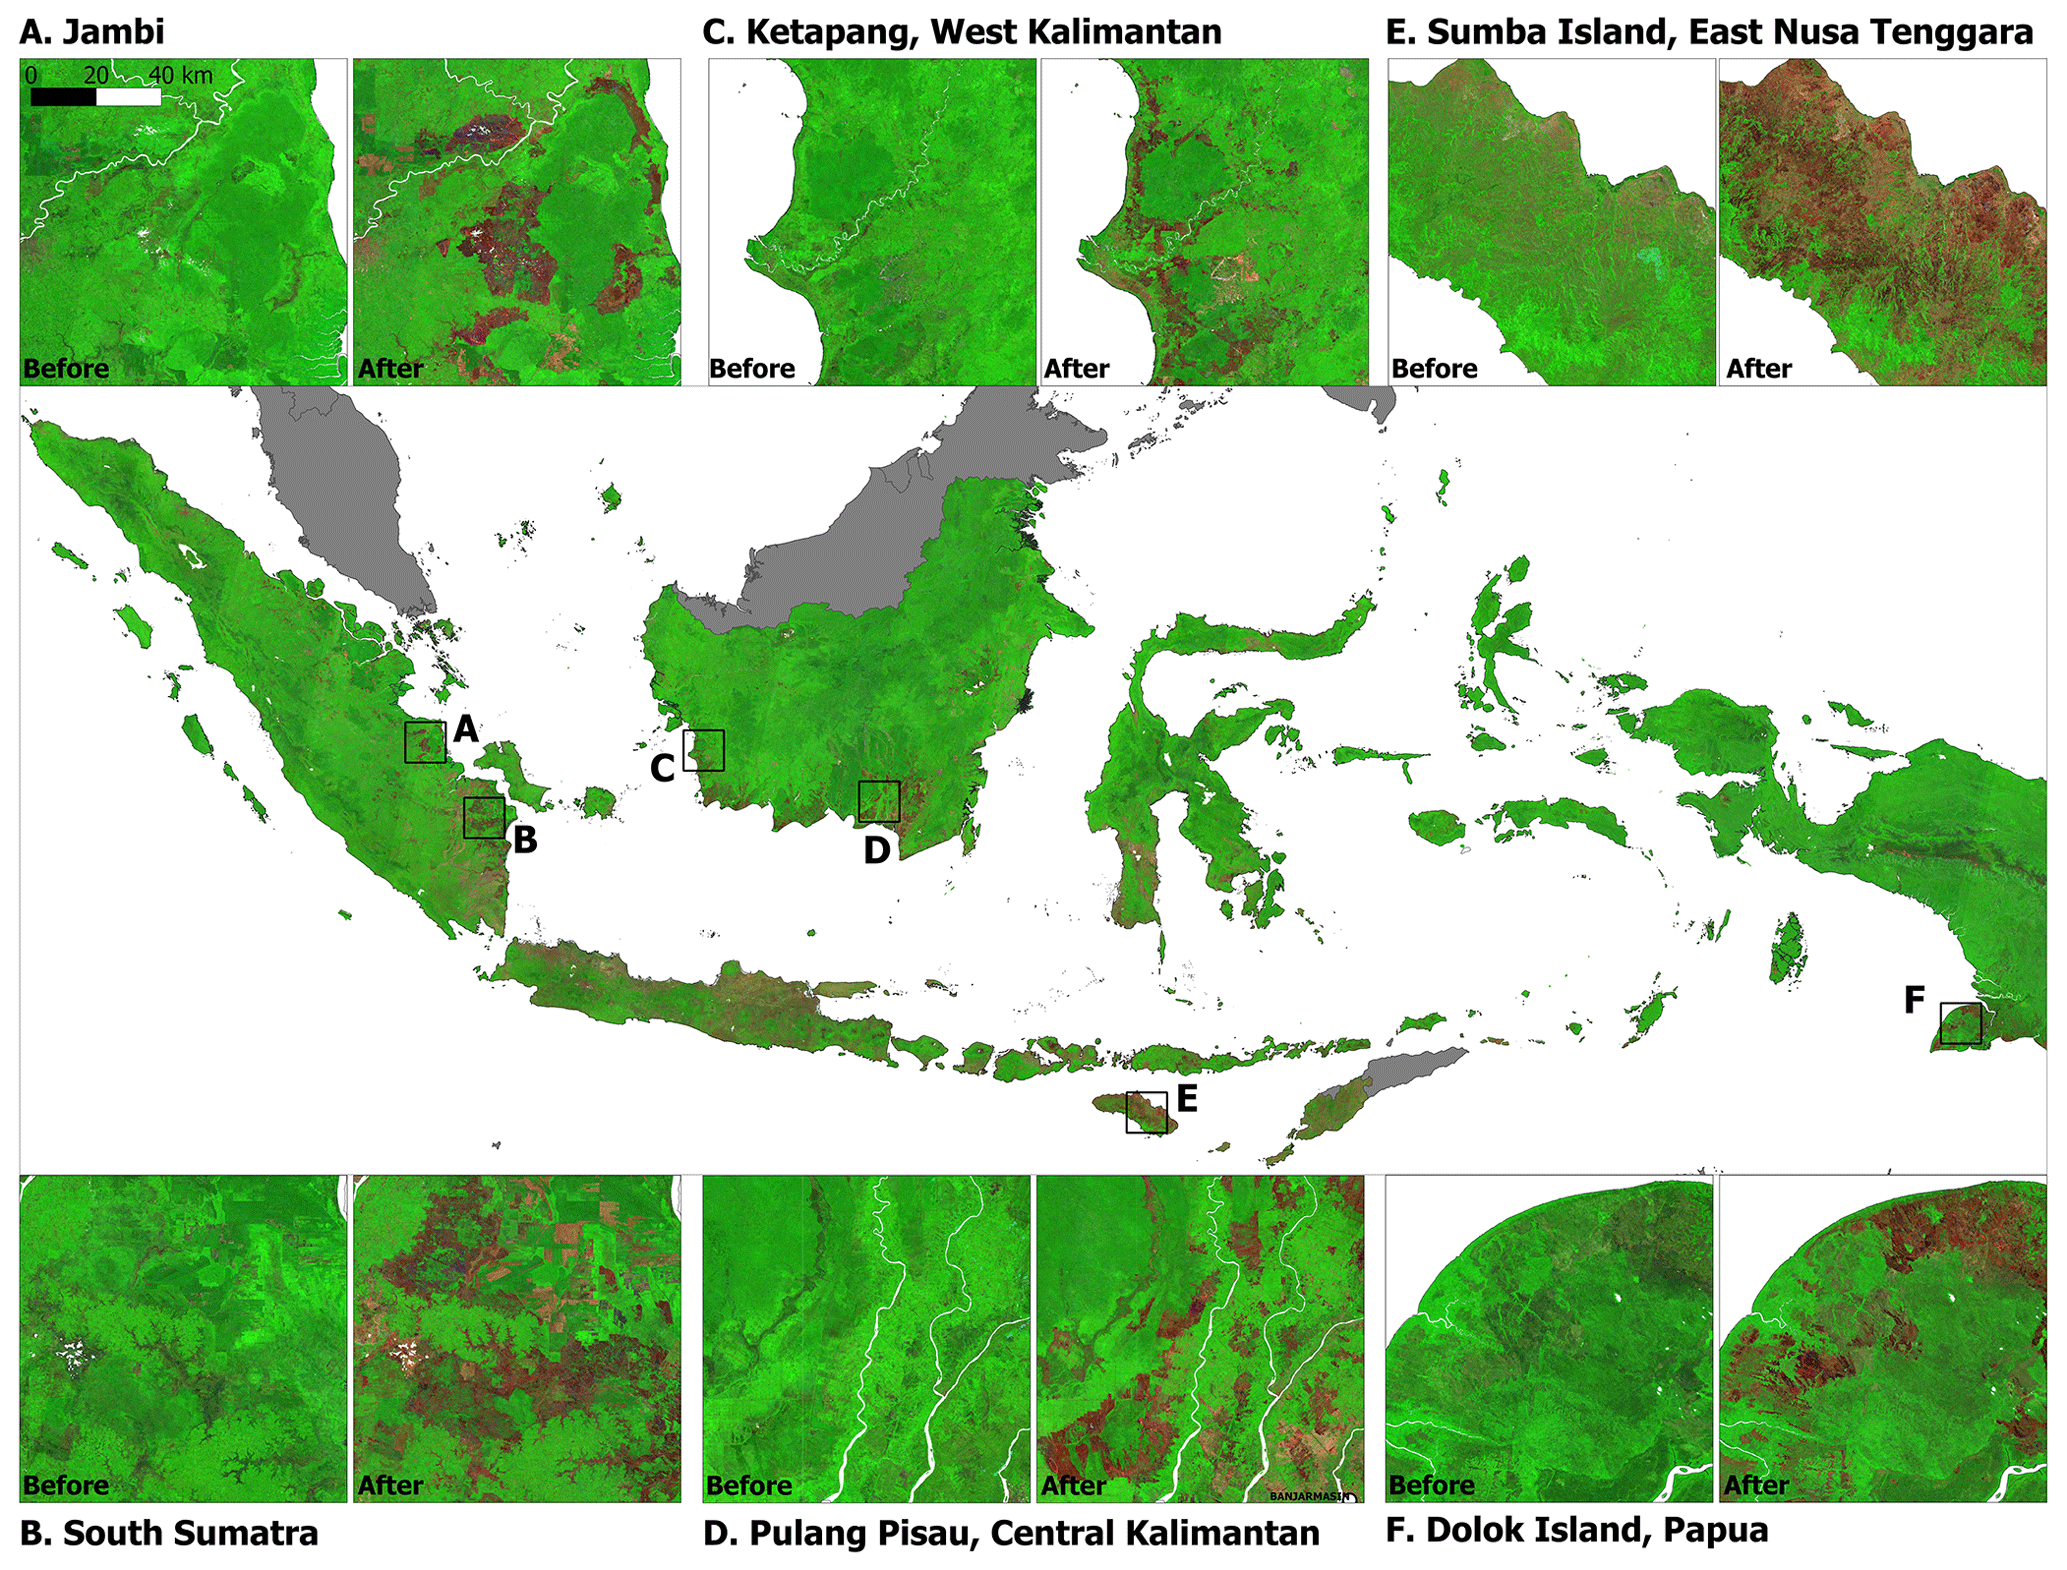
Figure 1The pair of cloud-free pre-and post-fire Sentinel-2 composites shown over six locations in insets A, B, C, D, E, and F (all insets have the same scale). The base Indonesia-wide imagery is the post-fire composite. Imagery displayed in false colours (RGB: short-wave infrared, band 11; near infrared, band 8; blue: red, band 4). In this pair of composite images acquired shortly before and after fire, a recently burned area will readily appear to have transitioned from “green” to dark “brown/red” tones. Areas cleared without burning appear bright pink. Areas covered with vegetation appear dark to bright green.
2.2 Pre- and post-fire Sentinel-2 national composite images of 2019
Here, we describe our automated procedure to create a national pair of pre- and post-fire composites from 47 220 original Sentinel-2 images acquired between 1 November 2018 and 31 December 2019. Prior to creating the composites, we removed non-valid pixels using the Sentinel-2 imagery quality flag (this flag provides information about clouds, cloud shadows, and other non-valid observations) produced by the ATCOR algorithm and included in the atmospherically corrected surface reflectance multispectral images of the Sentinel-2A and B satellite surface reflectance products (Level 2A product) (Drusch et al., 2012).
A time series of the normalised burned ratio (NBR), given as (NIR − SWIR)(NIR + SWIR), represents a convenient index to detect the approximate day when the vegetation was damaged. Before damage, vegetated pixels register high NBR values close to 1 because reflectance in the near-infrared spectrum (NIR; wavelength = 0.842 µm; Band 8) is high due to the chlorophyll content of the vegetation (open circles before a disturbance, in this case a fire, in Fig. 2). The NBR of damaged vegetation typically declines abruptly towards 0 (or ≤0 for severe damage) because the NIR reflectance declines due to chlorophyll and leaf destruction, while the reflectance of the short-wave-infrared spectrum (SWIR; wavelength =1.610 or 2.190 µm; Band 11 or Band 12) increases due to dead or charred material and exposed ground cover. NBR values ≤0 are often apparent for several weeks after severe burning or clear-cutting. We analysed NBR time series for approximately 4.73 billion pixels (1 pixel = 0.04 ha; Indonesia's landmass ∼189 Mha). We describe the procedure to detect drops in the NBR time series in the following paragraph.
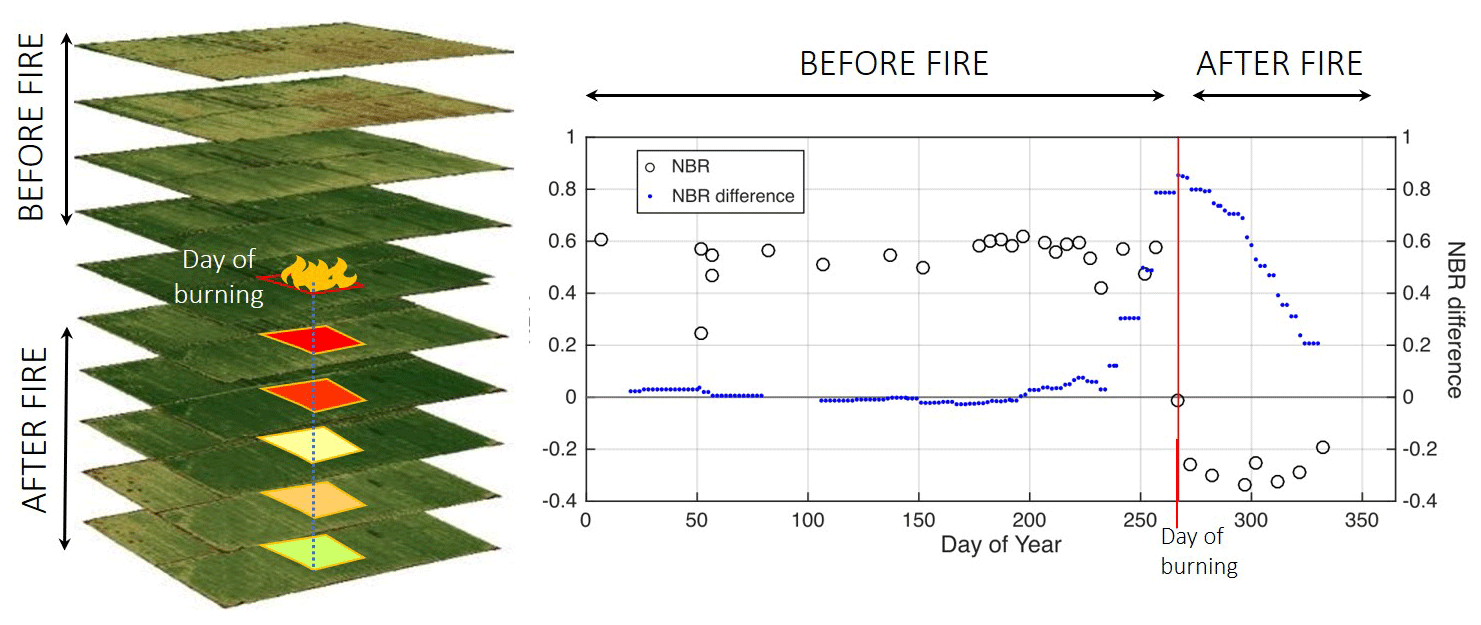
Figure 2A schematic of Sentinel-2 time-series imagery, associated NBR values (open circles), and NBR differences between average NBR values observed before and after the central day of a 2 d moving window (blue dots). A burned pixel (20 m×20 m) is represented by a red rectangle on the left. Before fire, the vegetated pixel registers positive NBR values (open circles). The NBR rapidly drops during the fire, and, for a few weeks, the satellite observations show a negative NBR. The day of the year when the NBR difference observed via the moving window reaches a maximum corresponds to the moment NBR dropped (red line). This day marks a decline in the pixel's vegetation, possibly reflecting a burning event. Over time, the vegetation regenerates (re-greening) and the spectral characteristic of charred vegetation fades. Re-greening can happen within days in the case of savanna grasslands, or within months in the case of forest fires on peatlands.
We detected drops in NBR time series with a moving-window approach. A moving window scanned NBR values 3 months prior and 1 month after the central day of the window. The output value of the moving window (blue dots in Fig. 2) is the difference between average NBR values observed before and after the central day. The NBR average after the central day included the value at the central day. The difference between the average NBR values was estimated every 2 d in the time series, skipping the day of year that was an odd number (day of year equal to 2, 4, 6, 8). Although Sentinel-2 has a temporal resolution of 5 d, the overlap between satellite passes may increase the temporal resolution regionally up to 2 d at the Equator. Thus, we estimated the NBR difference (dNBR) every 2 d instead of 5 d. Taking this into consideration, our “disturbance” date estimate has a maximum temporal precision of 2 d in specific regions, but generally 5 d when satellite passes do not overlap. The day of the year when dNBR reached a maximum corresponded to the moment NBR dropped most markedly in each pixel, flagging a disturbance to the pixel's vegetation potentially caused by fire. At this date, we created a pair of pre- and post-fire pixels by selecting the median red, NIR, and SWIR spectral values acquired 3 months before and 1 month after the disturbance. We selected a 1-month window rather than a 3-month window to compute the post-fire image to maximise our chances to detect recent burns, given that burned areas on degraded lands and savanna tend to re-green rapidly. We repeated this procedure for approximately 4.73 billion pixels to assemble two national composite images depicting the spectral condition of vegetation shortly before and shortly after each detected a disturbance (Fig. 1).
2.3 Supervised burned–unburned classification
We used the random forest supervised classification algorithm (Breiman, 2001), available via the Google Earth Engine, to determine whether the spectral changes detected by the pre- and post-fore composites corresponded to a burning event, and subsequently we classify burned areas. Supervised classifiers require “training data”, that is, exemplary spectral signatures of “burned” and “unburned” lands in the present case, to guide the algorithm to reliably classify the target classes. The spectral signatures (i.e. the reflectance values in the pre- and post-fire composite images) are the predictive variables of the classification model. The features used in the random forest are the bands of Sentinel-2 in the pre- and post-fire composites plus their respective NBR index. We excluded the bands at 60 m spatial resolution (bands B1, B9, and B10) since these bands present a low spatial resolution for the aim of the study. Therefore, we used a total of 22 features: the NBR and bands B2, B3, B4, B5, B6, B7, B8, B8A, B11, and B12 of the pre and post-composites.
We used a 10-fold cross-validation to assess the accuracy obtained with a set of different parameters in the random forest. The splitting “train-test” in the cross-validation was done only with the training dataset, since the reference dataset used for the final validation must be completely independent of the training and model parameterisation. The two parameters that we tuned were the number of trees and the minimum leaf size. Random forest is an ensemble classifier composed of several decision trees; the parameter number of trees represents the number of decision trees in the random forest. The minimum leaf size represents the minimum number of samples that result from a splitting node at the decision tree. We found that a minimum leaf size equal to 1 performed the best on average, and, thus, we used this value. We selected a conservative number of trees, 50, to ensure the good performance of the random forest. We did not set any limit to the maximum nodes in each tree, and the variable to split in the random forest was set to the square root of the number of variables, which is the common practice among machine learning practitioners and the default configuration in the Google Earth Engine.
The required number of points used to train our supervised classification model (here a random forest) depends on the spectral separability of the classes (in our case two classes: burned and unburned). The pixels that show a burn present a singular spectral signature, and, for this reason, it is necessary to collect a large number of training points. We collected training points until we were satisfied with the results of the classification by visually comparing the resulting burned-area map against the pre- and post-fire composites. We trained the random forest algorithm using 988 independent training pixels (Fig. S1 in the Supplement for locations), point coordinates labelled as either burned (317 points) or unburned (671 points). These pixels were selected by visual interpretation of the pre- and post- fire image composites. Burned areas show a distinctive dark (low albedo) brown/red colour in the SWIR–NIR–red composite image when displayed as red–green–blue channels (Fig. 1). The training pixels were collected across land cover types (Table S1 in the Supplement for land cover types) to ensure the representativeness of the training dataset and the satisfactory generalisation of the classification model across Indonesia. We selected training pixels focused explicitly on medium to high burn severity, i.e. areas where the distinctive red colour in the SWIR–NIR–red composite image looked the darkest, indicating that all or most of the vegetation/soil burned. This aspect of the method minimised “false positives” but may exclude areas with implied low burn severity or low-visibility impacts, such as understorey fires (below an intact forest canopy; see e.g. van Nieuwstadt and Sheil, 2005). By prioritising confident identification of fires over absolute burned-area coverage, as well as by duly validating our estimates, this approach avoids the problems caused by frequent false positives (Rochmyaningsih, 2020).
We assessed burn severity during algorithm training based on visual interpretation. RGB composites with bands 11 (SWIR wavelength =1.610 µm), 8 (NIR wavelength =0.842 µm), and 4 (red wavelength =0.665 µm) provide information about the severity of the fire; burns with high severity present a dark (low albedo) red/brown colour (Fig. 1). We included the histogram of dNBR (NBRpostfire−NBRprefire) for the 317 training points labelled burned in Fig. S2 to corroborate that the burned training samples were selected in areas with medium- to high-severity fires. A total of 81 % (256) of burned training points (317) had dNBR values , which represents the threshold for medium- to high-severity burns according to the proposed classification table of the United States Geological Survey (USGS).
2.4 Burned-area map validation
The gold standard is to validate the map against a sufficiently large reference dataset developed based on ground visits to burned and unburned sites sampled objectively and randomly across the region of interest (Olofsson et al., 2014). We sought alternative ways to generate the reference dataset because the sample of GPS locations of burned locations collected by the Indonesian government was not available. Given the laborious scale of this validation exercise, we validated our burned-area estimates for only the seven provinces prioritised by the Indonesian government for restoration of fire-prone degraded lands (Kalimantan Barat, Kalimantan Tengah, Kalimantan Selatan, Papua, Jambi, Riau, and Sumatra Selatan). These provinces are also those that typically burn most extensively. We used visual interpretations of the original time-series Sentinel-2 imagery acquired every 5 d over 2019 at 1298 randomly selected sites (one site =1 pixel of 20 m×20 m) to detect flaming fronts (fire hotspots) and other signs of burning (smoke and charred vegetation). We used these reference data to calculate the overall accuracy (OA), producer accuracy (PA), and user accuracy (UA) with a 95 % confidence interval, of all three burned-area maps (i.e. our Sentinel-derived burned-area classification, the official Landsat-based burned-area map, and the MCD64A1 product) following “good practices” for estimating area and assessing accuracy reported by Olofsson et al. (2014). We use the term “mapped burned-area” for the area classified as burned by each burned-area map. We employ the term “corrected burned-area” for the estimation of the burned area based on the validation of a given burned-area map against the reference dataset, following the practices in Olofsson et al. (2014). For instance, a high omission rate in the burned class of a given burned-area estimate would potentially lead to a lower mapped area than a corrected area for that estimate, while a high commission rate would potentially lead to a higher mapped area than the corrected area. The corrected area represents an estimation of the actual burned area for the year 2019 computed for each of the three datasets separately. The accuracy of the burned-area map and the sample size of the reference dataset play a role in the confidence interval of the corrected area estimate. Lower map accuracy and smaller sample size mean wider confidence intervals.
2.4.1 Reference site sampling design
Good practices for estimating area and assessing accuracy, as reported in Olofsson et al. (2014), assume a simple random sampling or a stratified random sampling in the generation of the reference dataset. In our study, we employed a stratified-random sampling approach to ensure an acceptable sample of burned reference sites. Our stratified approach was necessary given that the burned class was rare over the study area: the area of seven provinces of interest is 87.6 Mha and the combined area detected as burned by all three datasets represented only 3.1 % of this area.
For the generation of the 1298 reference sites (see Table S4 for associated land cover types 1 year before fire), we randomly sampled (i) 419 sites across from the areas classified burned by the three datasets (red area in Fig. 3a; Table S2), and (ii) 879 sites in areas classified as unburned by all three datasets hereafter denoted U (grey area in Fig. 3a). This sample size is deemed sufficient and comparable to other map assessments at a larger scale (Stehman et al., 2003; Olofsson et al., 2014).
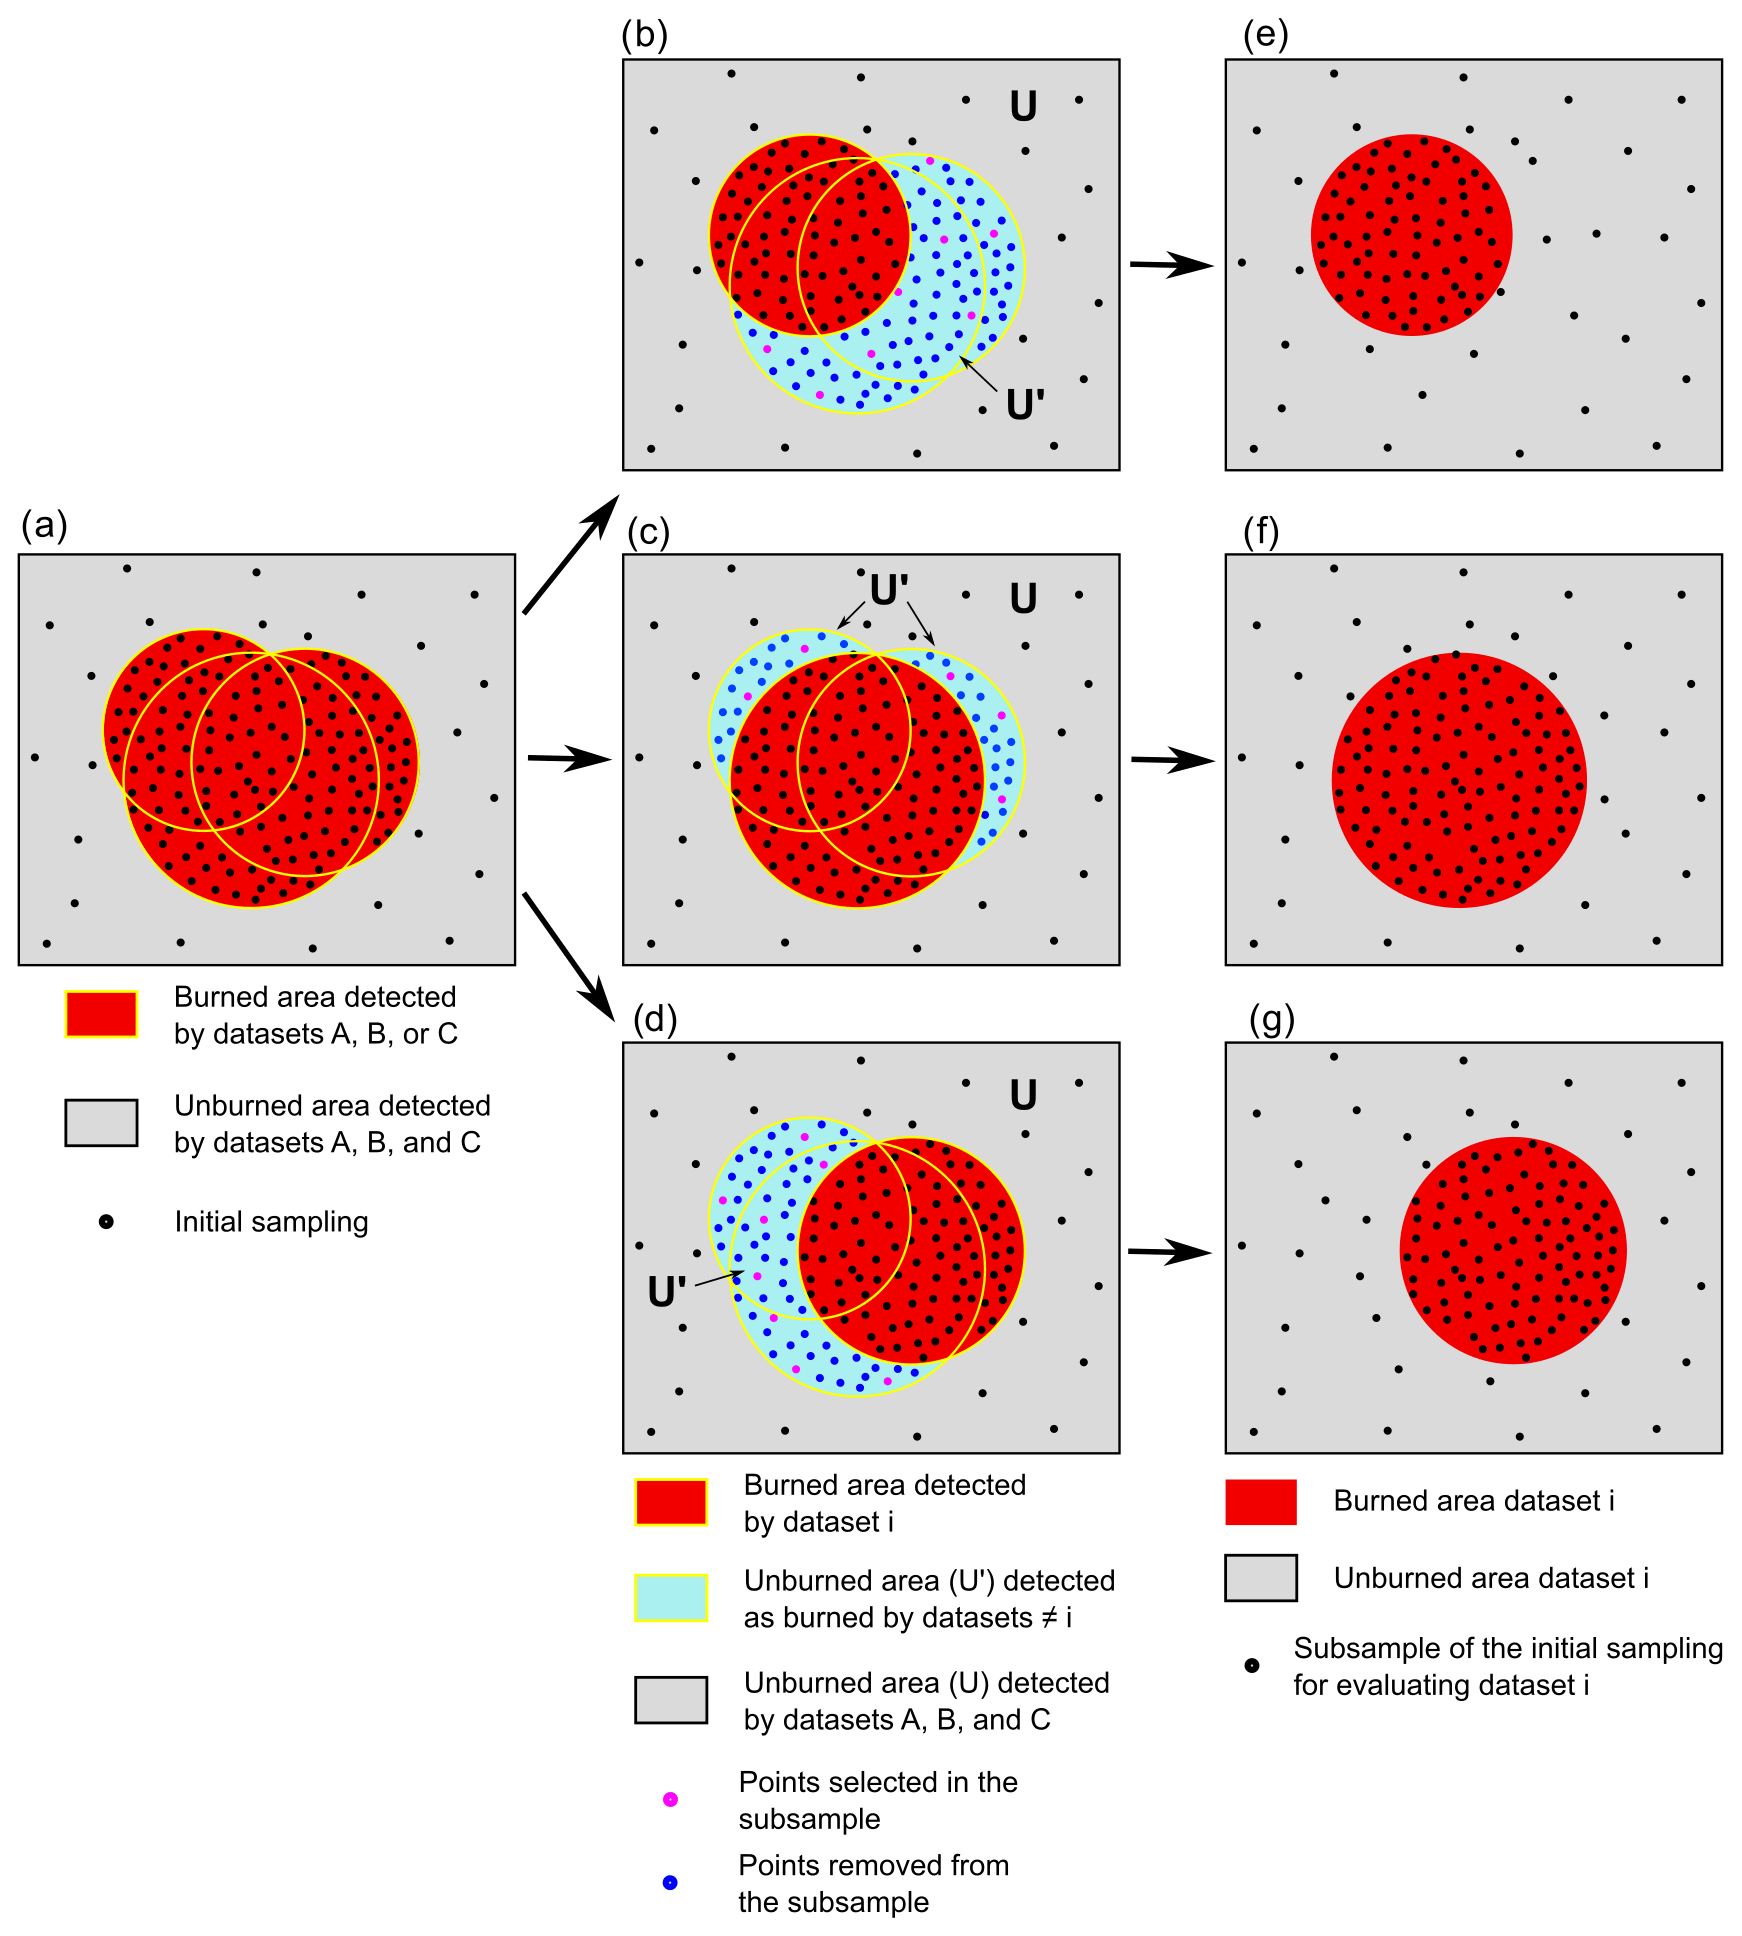
Figure 3Representation of the adjusted stratified-sampling design for the validation of three burned-area datasets (A, B, and C) against reference sites (dots). Panel (a) shows the stratified random sampling of reference sites (black points) over the combined burned area. Note that the density of samples is higher in the combined burned area than the unburned area. Panels (b–d) show, in cyan, the area U′, being classified as unburned in a given dataset i but classified as burned in at least one other datasets ≠i. For a given validation of A, B, and C, the sample points in the corresponding area U′ (b–d) were randomly excluded until the sampling density in the area U′ equalled that of the larger unburned area U (area in grey). Panels (e–g) show the three final adjusted, stratified subsamples of reference points derived from the initial sample of 1298 reference points. Note that the relative areas and number of sites per class in Fig. 3 do not correspond to the actual datasets being evaluated.
Table 1Adjusted, stratified subsamples of reference sites to validate burned-area estimates.
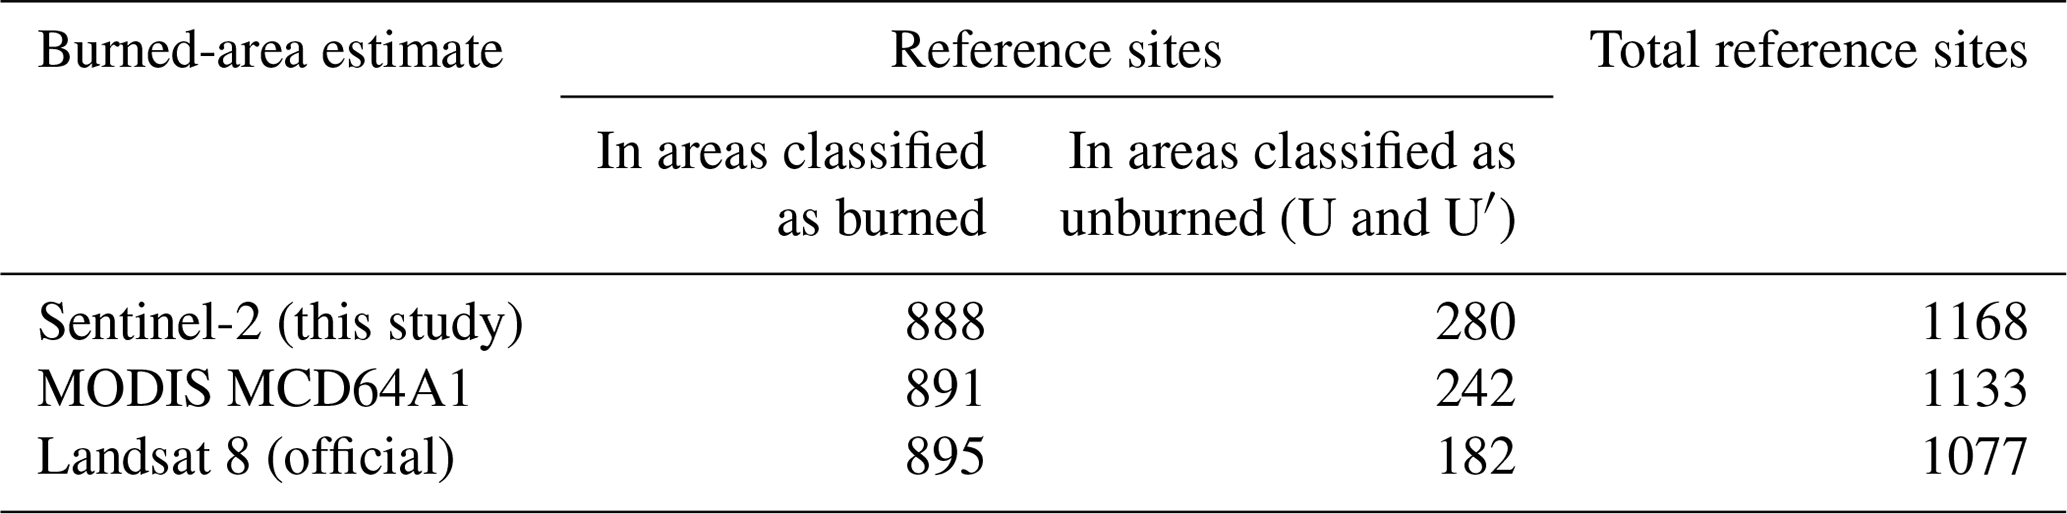
This initial sample of 1298 total sites presents a shortcoming for direct pair-wise comparisons between the reference dataset and each of the three burned-area maps individually. Specifically, sampling densities in the reference dataset were greater in areas classified burned by the three datasets (red area in Fig. 3a) compared to the area deemed unburned by all three datasets, hereafter denoted U (grey area in Fig. 3a). Consequently, for the validation of a given burned-area dataset, its total number of unburned reference sites would be over-sampled upon defining unburned reference sites with reference to U as well as areas classified as burned uniquely by one of the other two maps (cyan areas in Fig. 3b–d, hereafter denoted as U′). Such over-sampling of reference sites in the realm of U′ would violate the stratified-sampling approach described in Olofsson et al. (2014) and would lead to an erroneous accuracy assessment. To achieve a balanced stratified sampling of reference sites across burned and unburned areas of each dataset, we generated three subsamples from the initial 1298 reference sites (red areas in Fig. 3e–g) and used these subsamples to validate each dataset. These three subsamples were generated by randomly excluding reference sites from the realm of U′ in Fig. 3b–d until the density of reference sites in U′ equalled the density of the larger unburned area U. For instance, for the validation of the official burned-area map, the density of reference sites in U was 10.36 sites Mha−1, and the extent of U′ was 1.551 Mha, such that the number of reference sites to retain in U′ for this validation was given as sites. The calculations of the number of sites removed from each subsample are illustrated in Table S3. The final, adjusted, stratified subsamples of reference sites used for validation are given in Table 1.
2.4.2 Interpretation of the burned-area reference dataset
We developed a series of scripts in the Google Earth Engine to streamline the visual interpretation of the reference sites. Specifically, we adapted a script written by Olofsson et al. (2014) to rapidly scan the time series of original Sentinel-2 images in visible and infrared bands and thus visually detect a smoke plume, a burn, or a heat source (flaming front) and determine whether and when in 2019 a reference site burned. The script enabled the interpreter to interactively track the evolution of NBR values and patterns over the 2019 time series of 5 d images. Reference sites were investigated wherever a marked drop in the NBR time series was detected, indicating a disturbance in the vegetation. For reference sites where a disturbed area was observed, we subsequently reviewed the last few images before the drop in NBR and the first few images after the drop. Interpreters looked for three distinct signs of burning in these images to confirm them as burned: (i) smoke plumes; (ii) flaming fronts – that is, a line of moving fire where the combustion is primarily flaming; and (iii) rapid changes in colour from green to dark red, characteristic of a transition to charred vegetation (Fig. 4). If rapid changes in colour were observed over the reference site, with at least one direct feature (smoke or flame) in its vicinity, this indicated a fresh burn, and the reference site was declared to be burned. If rapid changes in colour from green to dark red were observed without smoke or flame, the reference site was also declared to be burned. If no change in colour was observed, with at least one direct feature (smoke or flame) in its vicinity, the reference site was declared to be unburned. If none of these three features were observed, the reference site was declared to be unburned.
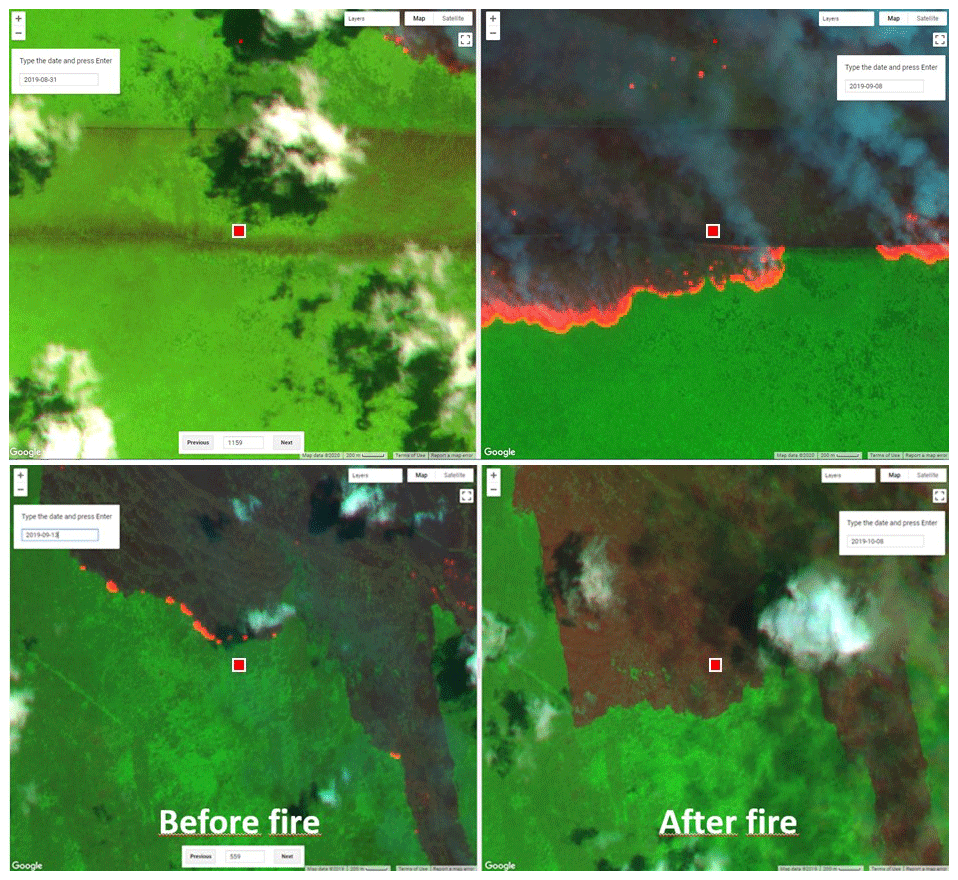
Figure 4Two snapshots recording the pre-fire (left panel) and post-fire (right panel) original Sentinel-2 images acquired shortly before (13 September 2019) and shortly after (8 October 2019) fire for two reference sites (red squares). Imagery displayed in RGB: SWIR, NIR, and red. Sentinel-2 provides two SWIR bands. Band 12=2.190 µm is more suitable than Band 11=1.610 µm to detect the intense heat from flaming fronts. On these image pairs, one can see flaming fronts travelling towards the reference sites (red dot) from the north in the pre-fire images (left) and sharp changes in colour from green to dark red characteristic of charred remains with continuing flaming in the post-fire images (right). Layout built using © Google Earth Engine.
Three interpreters independently reviewed the time series of original Sentinel-2 images and associated NBR trends for all reference sites (N=1298) (see Fig. S3 for a frequency distribution of burn sizes of the Sentinel-2 burned-area map, for select spatially coincident burned reference sites). To reduce uncertainties associated with the interpretation of the imagery, the results of the three interpreters were compared to each other. If all three interpreters recorded the same interpretation and timing of a burning event for a given reference site, their interpretations were retained. If one or more interpreters disagreed, all interpreters reviewed the data and resolved discrepancies by consensus. In some cases, it was difficult to reconcile disagreements because of poor image quality or because of uncertain spectral patterns. Therefore, if possible, interpreters also explored other satellite images (e.g. Landsat) to detect the presence of fire and resolve disagreements for a given reference site. The sites in which the three interpreters disagreed were ultimately excluded (70 sites) from the reference dataset. For these excluded sites, disagreement typically resulted from uncertainties over the boundary of burned or unburned areas, or because the imagery was not clear enough. The sample size of reference points explored here, N=1298, excludes the discarded points of disagreement in question.
We created a second script to generate snapshot images (see examples in Fig. 4) depicting infrared spectral conditions, shortly before and shortly after a fire, as well as the corresponding image dates. Interpreters recorded and geotagged a snapshot of before and after fire conditions at every reference site (for which a burned area was detected) to enable third-party reviewers to check the consistency and validity of interpretations on a site-by-site basis (see Data availability).
2.4.3 Burn size comparisons
We tested whether, and how, the three burned-area estimates differed in their tendencies to incorporate burns of larger or smaller sizes. Specifically, we compared the frequency distributions of burned areas (or “scars”) amongst the three estimates to test for similarity and qualify any distinguishing differences on the part of our Sentinel-based estimate. Differences amongst burn-scar size frequency distributions imply that a given burned-area estimate is inclusive of burn scars of a given size, regardless of absolute differences to the total burned area between the estimates. Inter-estimate comparisons of burn-scar size frequency are effectively a test of whether each estimate captures the same realms of total fire activity. Significant inter-estimate differences imply greater or lesser inclusion of a given realm of fire activity – e.g. small-scale agricultural burning, plantation fires, extreme wildfires – thus indicating bias (or lack thereof) without defining such realms explicitly.
For all three estimates, we employed the Kruskal–Wallis H test of differences with respect to the “location” of frequency distributions along a continuum of burn sizes. Given significant inter-estimate differences according to this three-way test, we tested for two-way differences in the shape and location of the burn size frequency distribution (Kolmogorov–Smirnov test), as well as two-way differences in medians (Mann–Whitney U test), between our Sentinel estimate and either the official or MODIS estimate individually. Testing for similarity over increasingly large scar size cohorts clarified the degree to which significant inter-estimate differences were attributable to the inclusion or omission of a given cohort.
We excluded burns <6.25 ha because this is the minimum observable burn size of the Landsat 8 official estimates due to the challenging nature of visual interpretations at such scales. We note that the minimum size of the MODIS data is 25 ha; hence for comparison with the MCD64A1 product we used a 25 ha threshold. In relation to Sentinel and MODIS estimates, for which burned areas were originally mapped as arrays of pixels, we defined a burn to be any array of pixels contiguous across cardinal directions but not diagonals to render the resultant burned-area map conservative with respect to patch size (Fig. S4). For the official estimate, burns are manually delineated via visual interpretation by interpreters from the government of Indonesia. All burns are spatially and temporally discrete, such that burns of a given estimate that overlap spatially but not temporally are considered separate.
3.1 Increased burned-area estimates
Our Indonesia-wide burned-area estimate, based on the classification of the pair of pre- and post-fire Sentinel-2 composites, is larger than the official estimates as well as the MODIS MCD64A1 to a lesser degree. We estimate 3.11 Mha burned in 2019 across Indonesia, of which 31 % was on peat (Fig. 5). The extent of peatlands was defined using a national dataset from the Ministry of Agriculture (Ritung et al., 2011). In contrast, official burned-area estimates, based on visual interpretation of Landsat 8 imagery, report only about half as much burned area, at 1.64 Mha, of which 39 % was on peat. Our estimates too are larger than the MODIS MCD64A1 product, which reports 2.04 Mha burned in 2019, or two-thirds of our estimate, with 40 % on peat. The larger burning extent and proportionally lesser extent of peatland burning according to our estimates suggest that our estimates are particularly more inclusive of burning across mineral soils.
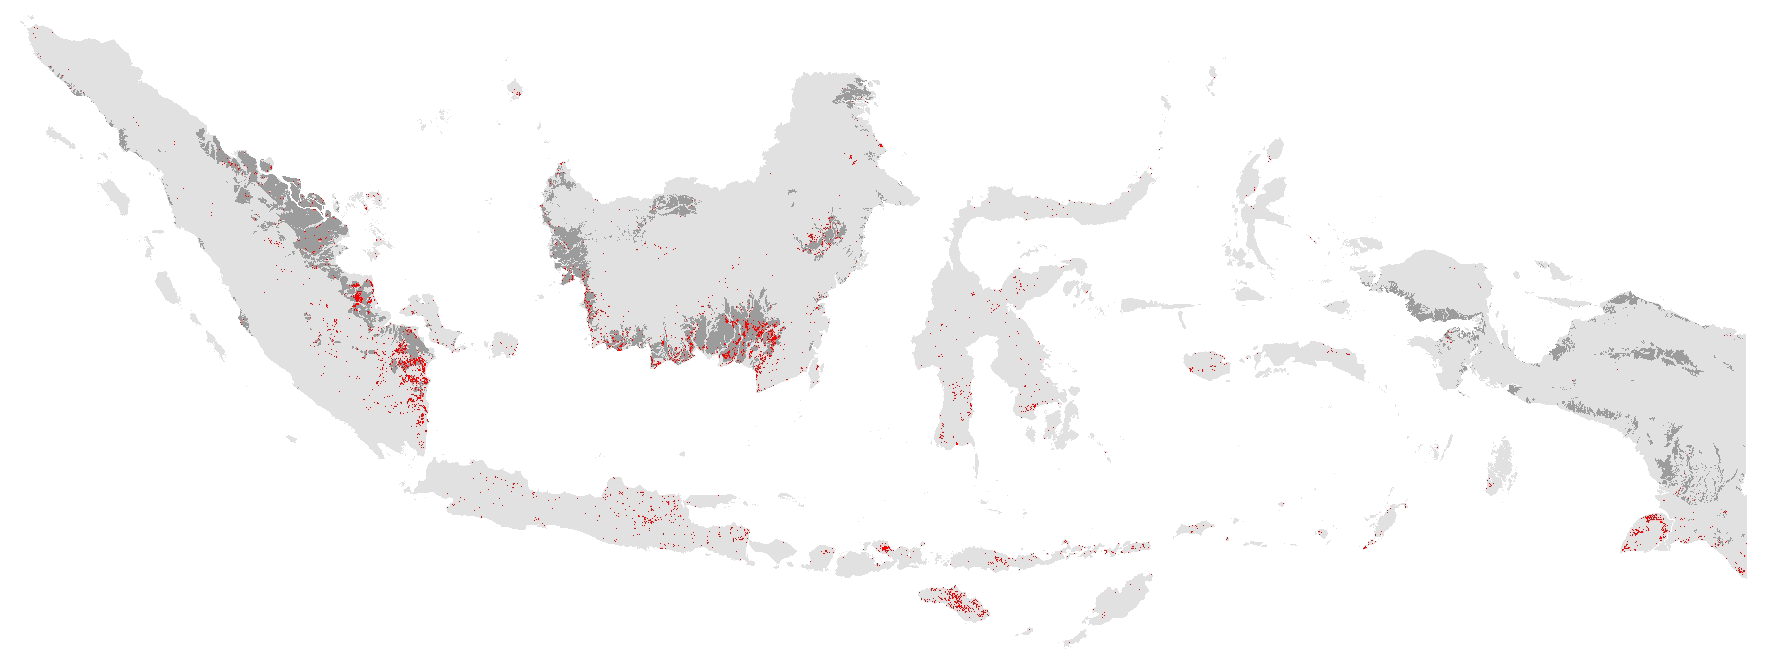
Figure 5The 2019 burned areas (red) for Indonesia (grey area) derived using a time series of the atmospherically corrected surface reflectance multispectral images (level 2A product) taken by the Sentinel-2A and B satellites. The spatial resolution of this map is 20 m×20 m, and the minimum mapping unit is 6.25 ha. The officially recognised peatland extent is shown with the darkest shade of grey. A provincial breakdown of burned areas according to our map estimates and those of the official and the MCD64A1 products is given in Fig. S5.
Table 2Accuracy assessment of each of the three burned-area maps performed in seven Indonesian provinces (87.60 Mha) targeted for peatland restoration. The accuracy metrics were estimated with an initial total of 1298 points randomly distributed using stratified sampling. The reported metrics are (1) the overall accuracy (OA), the user accuracy (UA), and the producer accuracy (PA) with their 95 % confidence intervals and (2) the mapped burned area and the corrected burned area with their 95 % confidence intervals.
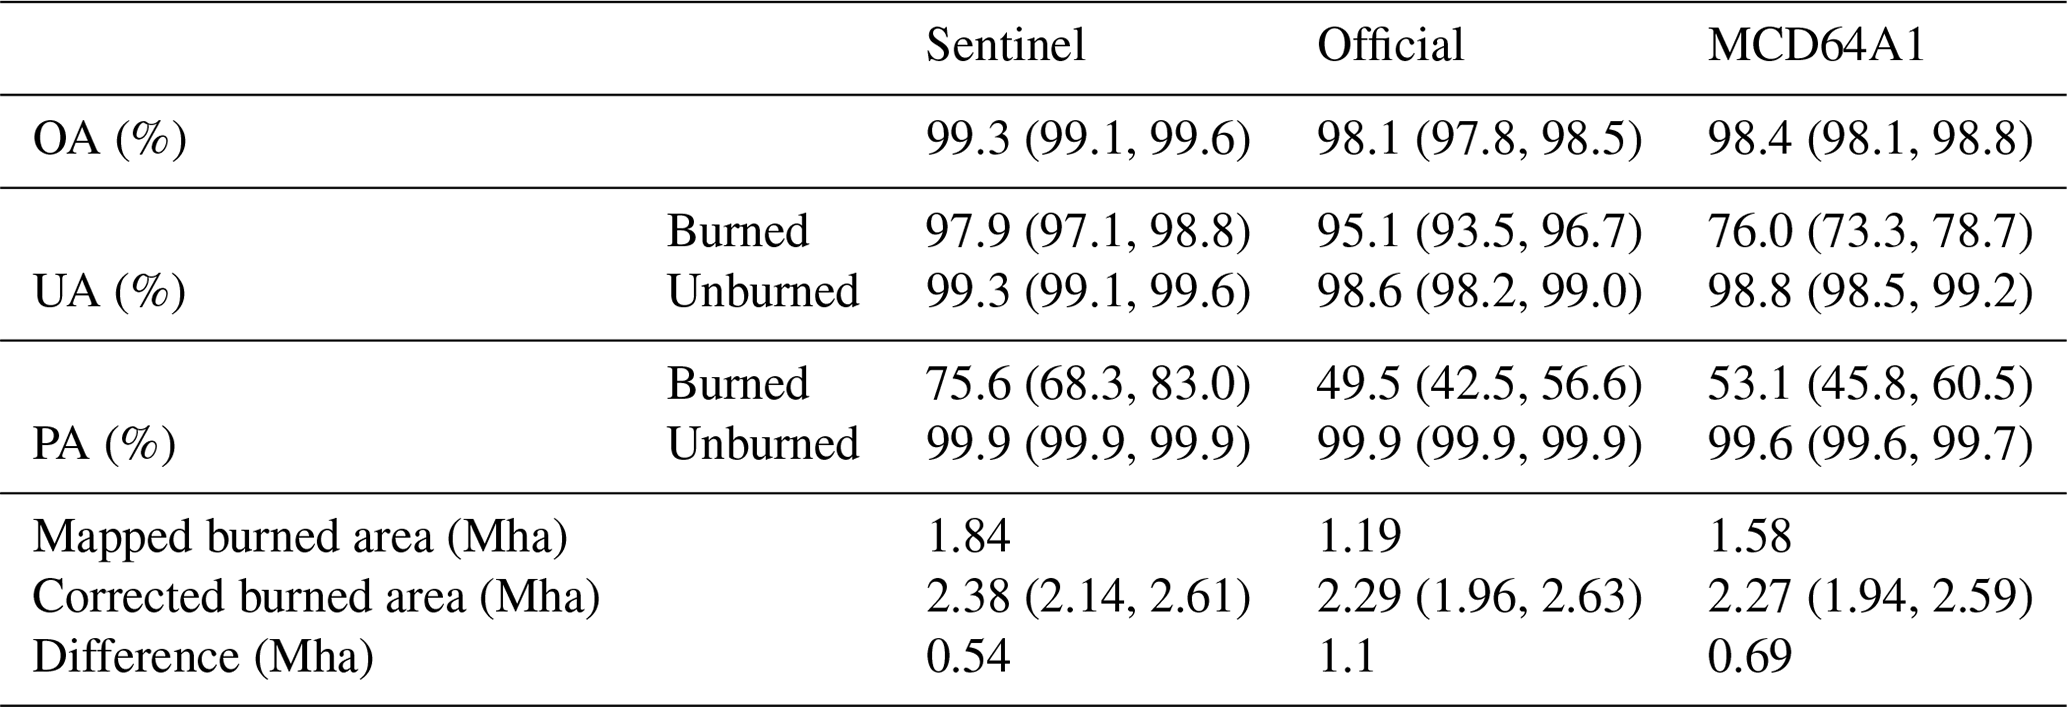
In the seven provinces for which we assessed accuracy, our Sentinel-2 estimates and the official Landsat 8 estimates both report excellent user accuracies (UAs) for the burned class, at 97.9 % (CI: 97.1 %–98.8 %) and 95.1 % (CI: 93.5 %–96.7 %), respectively, indicating a mere 2.9 %–4.9 % commission-error rate (Tables 2 and S5). The producer accuracies (PAs) are comparatively lower for both datasets, but notably less so for our estimates, at 75.6 % (CI: 68.3 %–83.0 %) and 49.5 % (CI: 42.5 %–56.6 %) for our estimate and the official dataset, respectively. In other words, for any burned area in our reference dataset, there is a 75.6 % chance that it will be correctly mapped as burned by our estimate, compared to only 49.5 % for the official estimate. This is in keeping with the tendency of the Sentinel-2 estimate to capture more smaller and intermediate-size burns. The MCD64A1 data had a much lower UA for the burned class, at 76.0 % (CI: 73.3 %–78.7 %), as well as a much lower PA for the burned class, at 53.1 % (CI: 45.8 %–60.5 %), qualifying it as the least reliable and accurate of the three estimates notwithstanding comparable high overall accuracy (Table 2).
All three burned-area maps underestimate the true burned-area extent, as per their respective PA figures, but our Sentinel-based map has the smallest shortfall and maintained user accuracy. The corrected burned area of the seven provinces is higher than the mapped area for all three burned-area maps. Again, however, our map area most closely approximates its corresponding corrected burned area (Table 2). Whereas our Sentinel-based mapped burned area indicates that 1.84 Mha burned in the seven provinces (or 59 % of our total national estimated burned area), the corrected burned area is 2.38 Mha (CI: 2.14–2.61 Mha) (Table 2), for a discrepancy of 0.54 Mha. In contrast, the official estimate indicates 1.19 Mha burned in the seven provinces (73 % of its corresponding total), and a corrected burned area of 2.29 Mha (CI: 1.96–2.63 Mha), for a 1.1 Mha discrepancy. Likewise, the MCD64A1 dataset mapped 1.58 Mha burned in the seven provinces and has a corrected burned area of 2.27 Mha (CI: 1.94–2.59 Mha), for a 0.69 Mha discrepancy. Although we cannot extrapolate a corrected burned area across Indonesia, we are confident that more than 3.11 Mha burned in 2019.
3.2 Burn size comparison
The Sentinel, official, and MCD64A1 estimates captured significantly distinct realms of fire activity, as represented by relative burn size frequencies (Fig. S6). The three estimates differ from one another most notably for small burns; however, they are statistically indistinguishable for burns >5000 ha indicative of extreme fire activity (Table 3). In other words, all three estimates capture very large burns (>5000 ha) equally well, and distinctions amongst the estimates concentrate amongst small (<100 ha), intermediate (100–1000 ha), and larger burns (1000–5000 ha), in decreasing order of degree as indicated by the magnitude of the test statistics in Table 3.
Table 3Tests statistics with respect to three-way differences in burned-area scar size frequency distributions for Sentinel, MODIS, and official estimates.
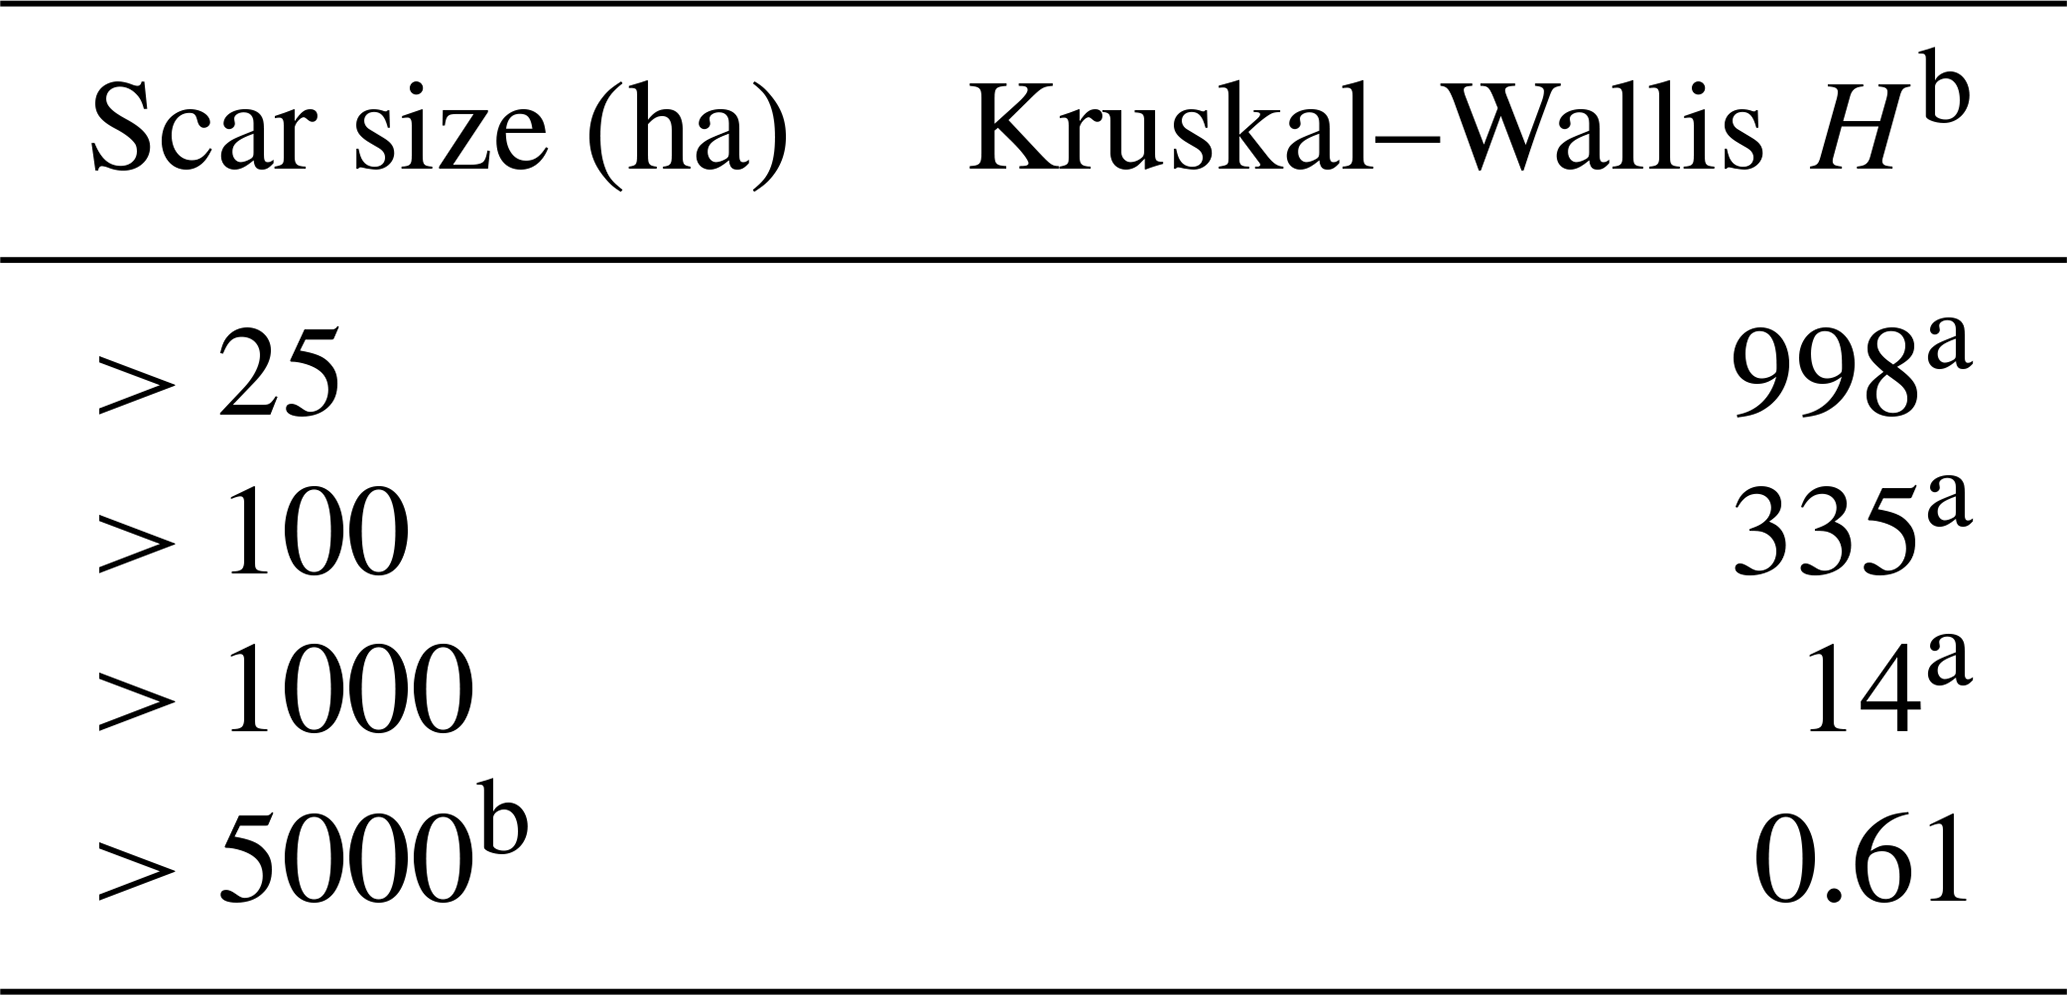
Significance: a p<0.001.
Notes: Scar size thresholds in the table denote the set of scars included in
a test. Tests pertain to whether frequency distributions have equivalent
distribution location, that is, position along a continuum of scar sizes.
Tests thus pertain to whether the estimates capture distinct realms of fire
activity, assuming similarly shaped frequency distributions. Higher test
statistic values indicate greater probability that the estimates differ with
respect to distribution location. The three-way comparisons of the estimates
may flag differences where all three estimates differ or where only two of
the three differ. Significance is not Bonferroni corrected. b There are
56, 60, and 16 scars >5000 ha for Sentinel, MCD64A1, and official
estimates, respectively.
Table 4Test statistics with respect to two-way differences in burned-area scar size frequency distributions, with respect to distribution shape and situation (Test I) or situation alone (Test II), for Sentinel estimates compared to either MCD64A1 or official estimates.
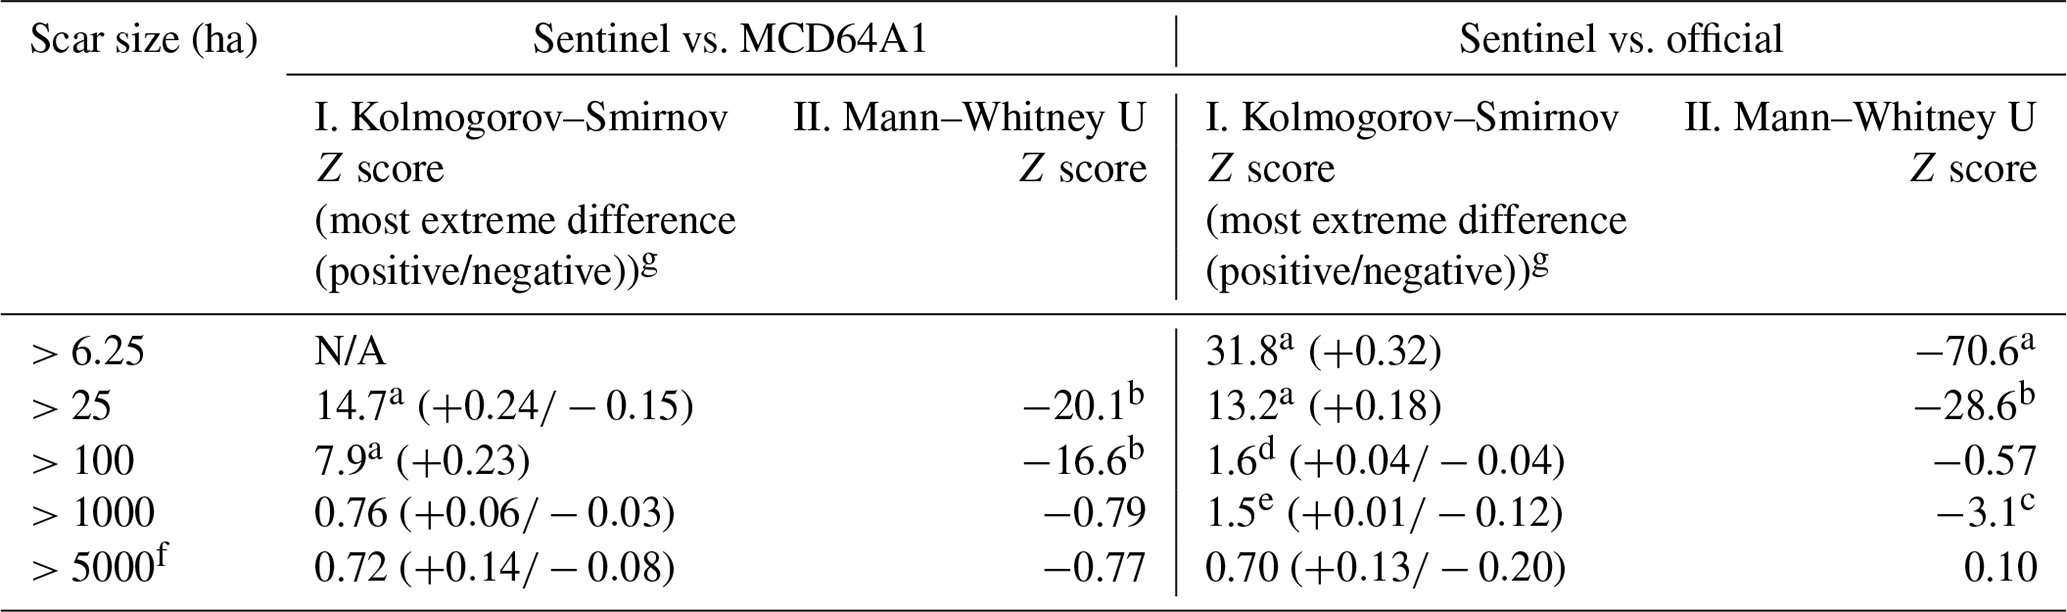
Significance: a p<0.0001. b p<0.001. c p<0.01. d p=0.014. e p<0.05.
Notes: scar size thresholds denote the cohort of scars included in a test.
Test I and Test II both pertain to whether the Sentinel estimates capture
distinct realms (scar size cohorts) of fire activity compared to the other
two estimates. Test I pertains to whether the scar size frequency
distribution of the Sentinel estimate has the same shape and distribution
location as either the MODIS or official estimate. Test II is the same but
with respect to distribution location only. Distribution location refers to
the situation of a frequency distribution along a continuum of scar sizes.
Higher test statistics indicate greater probability that the estimates
differ significantly with respect to distribution shape and/or location.
Reported statistical significance is without Bonferroni
corrections. f There are 56, 60, and 16 scars >5000 ha for Sentinel, MODIS, and
official estimates, respectively. g The largest positive and negative
differences in the cumulative probability functions of Sentinel vs. MODIS or
official scar size estimates are shown. No difference was reported where it was
<0.00 absolutely.
Inclusivity of smaller and intermediate burned areas is the primary source of difference among estimates. Compared to official or MCD64A1 estimates, the Sentinel estimate has a significantly greater relative frequency of small burned areas (<100 ha), especially amongst the smallest of these (Table 4). This is indicative of a better detection of small fires presumably characterised by small-scale agriculture fires and similar small-scale controlled burning. The Sentinel estimate similarly has a greater relative frequency of intermediately sized burns (100–1000 ha), but less acutely so, with inter-estimate differences being more moderate for the official estimate than the MCD64A1 estimate (Table 4, Figs. 6 and S6). For burns >1000 ha, the Sentinel estimate differs only relative to the official estimate (Table 3), seemingly due to the latter's underestimation of large and very large scars (Fig. 6). Note for instance the increasingly large divergence between the cumulative burned-area curves for the Sentinel-2 and the official estimates in Fig. 6 for burn areas >1000 ha. For very large burns (>5000 ha), two-way comparisons in Table 4 again report no significant statistical differences in burn-scar detection rates between the Sentinel and alternative estimates. However, given the small sample of patches >5000 ha, it is noteworthy that the Sentinel estimate captures more very large scars compared to official estimates (n=56 vs. n=16) and avoids critical omissions made by both official and MCD64A1 estimates for extremely large burns (>15 000 ha) on peatlands around Berbak National Park in Jambi Province, Sumatra (Fig. 7).

Figure 6Cumulative national total burned area vs. burned-scar area, for Sentinel-2, Landsat 8 (official), and MODIS MCD64A1 burned-area estimates. Note the logarithmic axis. For a given segment of the x axis between scar sizes X1 and X2, a difference in the slopes for any two estimates is indicative of inter-estimate differences in terms of inclusivity of scars between X1 and X2.

Figure 7The pair of cloud-free pre- and post-fire Sentinel-2 composites over Berback National Park (black line) and surrounding areas in Jambi Province (see also Inset A, Fig. 1), revealing large burned areas around Berbak National Park (areas that have transitioned from green to dark brown/red tones). These large burn scars have been detected by VIIRS hotspots and by the Sentinel-2 burned-area map, but some have been missed by the official and MCD64A1 datasets.
In summary, the greater overall burned-area estimate of our Sentinel data compared to the official and MCD64A1 alternatives reflects differences in the inclusion of smaller and intermediately sized scars. The sum of all Sentinel burned areas that are individually ≲ 860 ha equals the entirety of the official burned-area estimate (Fig. 6). The Sentinel-2 data exhibit a size–frequency pattern that approximates a near scale-free power law (Fig. 6).
The code for generating the Sentinel-2 pre- and post-fire composites can be found at https://doi.org/10.5281/zenodo.5646758 (Salim et al., 2021).
All the data including pre- and post-fire composites, all three burned-area products, and reference points with screenshots can be visualised online at this application portal: https://thetreemap.users.earthengine.app/view/burn-area-validation-simplified (last access: 5 November 2021, Salim, 2021).
The Sentinel-based burned-area map and reference dataset are freely available for download at https://doi.org/10.5281/zenodo.4551243 (Gaveau et al., 2021a).
The dataset 2019_burnedarea_indonesia.shp contains the 2019 burned-area estimates that we developed for Indonesia using 20 m×20 m time-series Sentinel-2 imagery. The reference dataset Reference_dataset.shp contains 1298 reference points that we assembled and used to validate all three burned-area products described in this study. Each reference point includes the attribute REFERENCE to describe the values obtained by visual interpretation: either NO unburned or YES burned. Each reference point has three attributes, C_SENTINEL, C_OFFICIAL, and C_MCD64A1, to describe the values of the classification of each burned-area product: either NO unburned or YES burned. Finally, each reference point has three additional attributes SENTINEL, OFFICIAL, and MCD64A1 to describe which burned-area product this reference point validates. The values are either 0 (not validate) or 1 (validate).
The MODIS MCD64A1 dataset was obtained at https://developers.google.com/earth-engine/datasets/catalog/MODIS_006_MCD64A1 (last access: 12 August 2021, Giglio et al., 2015, https://doi.org/10.5067/MODIS/MCD64A1.006). The official burned-area dataset from the Ministry of Environment and Forestry (MOEF, 2021) was obtained at https://geoportal.menlhk.go.id/webgis/index.php/en/ (last access: 1 April 2021).
The Sentinel-2 Level 2A data used in this study are hosted and accessed in the Google Earth Engine data catalogue (the link to the data is https://developers.google.com/earth-engine/datasets/catalog/COPERNICUS_S2_SR, last access: 10 November 2020, European Union/ESA/Copernicus, 2020). Data ingested and hosted in Google Earth Engine are always maintained in their original projection, resolution, and bit depth (Gorelick et al., 2017, https://doi.org/10.1016/j.rse.2017.06.031).
We developed a method that generates two national composite Sentinel-2 images depicting vegetation conditions before and after burning in 2019 (Fig. 1), and then we classified these paired composites to extract burned areas using a random forest supervised classification algorithm. We developed a comprehensive validation protocol to strictly assess the reliability and accuracy of our product based on visual interpretation of dense time-series Sentinel-2 original images, and we also applied this validation to the widely used global MODIS burned-area product (MCD64A1, collection 6) (Giglio et al., 2018) and to the official burned-area product of the Indonesian Ministry of Environment and Forestry (MOEF) (Sipongi, 2020).
Our estimate is the most reliable and accurate and therefore captures more of the 2019 total burned area, confirming that 20 m Sentinel-2 imagery is better suited to widespread small-scale burning in Indonesia (Huang et al., 2016), while it also captures large burn scars relatively thoroughly. The study finds similar omission and commission errors (47 % and 24 %) for the burned class of the MCD64A1 product as those presented globally (40 % and 22 %) (Giglio et al., 2018). The underestimation of total burned area according to the MCD64A1 product compared with our Sentinel-2 estimate is unsurprising, considering that the MODIS 500 m pixel resolution struggles to detect smaller fires (Giglio et al., 2018). Similar conclusions were reached by Ramo et al. (2021) when comparing the new “Small Fire Dataset” derived using Sentinel-2 and the MCD64A1 product over sub-Sahara Africa (Chuvieco et al., 2018). More surprising is the near 2:1 ratio by which the Sentinel-2 estimates surpass the Landsat 8 official estimate. Our examination shows that this difference reflects differential detection of small (<100 ha) to intermediately sized (<1000 ha) burn scars.
The Sentinel-2 data exhibit a size–frequency pattern that approximates closer to a near scale-free power law, or Pareto distribution (Karsai et al., 2020; Falk et al., 2007). These patterns are typical of large-scale fire studies (Malamud et al., 1998). Both other methods yield an S-shaped curve with less area at smaller and larger sizes than captured in Sentinel-2, indicating likely bias by omission over the entire range of scales, and are not determined by image resolution alone (Fig. 6). These results, with different frequency patterns arising from burns from the same regions in the same period, also highlight the danger in interpreting apparent burned-area patterns without careful consideration of the limitations and biases that arise from the methods used to map them – an issue that may not have always been sufficiently recognised in past assessments or policy.
Although both Sentinel-2 and Landsat 8 observe the infrared wavelengths required to detect charred vegetation and have similar spatial resolutions (20 m×20 m and 30 m×30 m, respectively), Sentinel-2 detects more burns because of the greater frequency of its coverage (5 vs. 16 d revisit time). Also, our method makes use of the massive computational capabilities and automation of the Google Earth Engine, allowing us to analyse more images and thus map more and smaller burn scars and associated details than even the most well-equipped team of visual interpreters could.
Despite high reliability that every burn scar detected on the map was valid (2.9 % commission error rate), our method suffered a 24.4 % omission error rate (burned areas that remained undetected). These rates reflect necessary tradeoffs between commission and omission error in a context where conservative estimates are much preferred for environmental policy and monitoring. We prioritised a low commission error rate (i.e. high user accuracy) over absolute burned-area coverage to address sensitivities (Rochmyaningsih, 2020). By hedging against commission errors, our approach omitted hard-to-detect events, including low-intensity burns, such as those that occur beneath the forest canopy on mineral soils (van Nieuwstadt and Sheil, 2005) or on savanna grasslands, which tend to re-green rapidly. While further work is required to clarify and refine the optimal levels of inclusivity and reliability, we emphasise that the production of annual before- and after-fire composite images is relatively straightforward for the user community, given the availability of both the necessary imagery and our Google Earth scripts.
While the accuracy assessment proved that our training dataset is valid for the classification of Sentinel-2 composites for the year 2019 in Indonesia, this training dataset might not achieve equivalent accuracy for other years and regions. The pre- and post-fire composites might show different spectral changes under different conditions. For instance, high rainfall in 2020 influenced reflectance. Similarly, representative training points should be used in other regions. Those adapting these methods should ensure adequate local training data and validation.
Doubts may persist concerning confident estimates of burned areas without extensive and costly ground checks. Modern high-resolution remote sensing makes such on-the-ground checks less essential than in the past as burned areas are readily identified with good accuracy in modern high-resolution imagery such as that we used for our validation. The protocol developed here to generate a reference dataset based on visual inspection of dense (5 d revisit time) infrared satellite imagery is better suited than ground verifications of burned and unburned locations because it allows the generation of extensive randomly distributed, well-characterised reference sites, a process too time-consuming and costly with field visits. The identification and quantification of less readily detected burned areas, such as those under a closed forest canopy, remain a challenge but will require dedicated and targeted research and would not be solved by ground checks alone.
Accurate estimates of burned lands, in particular on peat, are central to addressing concerns about regional air quality and to ambitious national climate-change atmospheric carbon reduction commitments heavily reliant on improved land and fire management (DGCC, 2019). Though we observed proportionally less peatland burning than the alternative burned-area estimates (31 % vs. 39 % and 40 % for the official and MCD64A1 products, respectively), we observed more peatland burning in total (0.96 Mha) than the official estimate (0.64 Mha). Given such differences, we anticipate that our refined burned-area product will enable others to better estimate carbon emissions from the 2019 fires in Indonesia. Combined with daily fire hotspots detected using thermal remote sensing, our detailed burned-area map can help identify ignition sites and estimate fire duration more precisely, and therefore contribute to forensic analyses of burning across landholdings (Gaveau et al., 2017) as well as assess policies and practices intended to reduce or control ignition events and the scale of fires (Watts et al., 2019).
The Indonesian government has shown some success in reducing fires (Sloan et al., 2021). Apparent reductions to fire activity would however ideally be qualified using our more inclusive and accurate burned-area estimates. Further, the Indonesian government must also develop improved protocols to quantify the resulting carbon emissions (DGCC, 2019). Our protocols for creating reliable pre- and post-fire composites are replicable. To further the adoption and reproduction of our approach, we have published all our protocols, scripts, applications, burned-area map, reference data, pre-fire and post-fire Sentinel-2 composite images, and various other outputs so that anyone may employ and revise them as they wish (see Data availability).
The supplement related to this article is available online at: https://doi.org/10.5194/essd-13-5353-2021-supplement.
DLAG designed the study. DLAG, MAS, and AD designed the burn scar detection method. MAS and AD wrote the code in Google Earth Engine. DLAG, MAS, and AD carried out the validation. SS carried out the burn scar size analysis. DLAG, AD, SS, and DS interpreted the results and wrote the manuscript and produced the figures.
The authors declare that they have no conflict of interest.
Publisher's note: Copernicus Publications remains neutral with regard to jurisdictional claims in published maps and institutional affiliations.
This research has been partially supported by the donors of the CGIAR Fund.
This paper was edited by Alexander Gruber and reviewed by three anonymous referees.
Adrianto, H. A., Spracklen, D. V., Arnold, S. R., Sitanggang, I. S., and Syaufina, L.: Forest and Land Fires Are Mainly Associated with Deforestation in Riau Province, Indonesia, Remote Sens.-Basel, 12, 3, https://doi.org/10.3390/rs12010003, 2020.
Alonso-Canas, I. and Chuvieco, E.: Global burned area mapping from ENVISAT-MERIS and MODIS active fire data, Remote Sens. Environ., 163, 140–152, 2015.
Breiman, L.: Random forests, Mach. Learn., 45, 5–32, 2001.
Carmenta, R., Zabala, A., Trihadmojo, B., Gaveau, D., Salim, M. A., and Phelps, J.: Evaluating bundles of interventions to prevent peat-fires in Indonesia, Global Environ. Chang., 67, 102154, https://doi.org/10.1016/j.gloenvcha.2020.102154, 2021.
Chuvieco, E., Pettinari, M. L., Bastarrika, A., Roteta, E., Storm, T., and Padilla Parellada, M.: ESA Fire Climate Change Initiative (Fire_cci): Small Fire Dataset (SFD) Burned Area pixel product for Sub-Saharan Africa, version 1.1, Centre for Environmental Data Analysis [data set], https://doi.org/10.5285/065f6040ef08485db989cbd89d536167, 2018.
Chuvieco, E., Mouillot, F., van der Werf, G. R., San Miguel, J., Tanase, M., Koutsias, N., García, M., Yebra, M., Padilla, M., and Gitas, I.: Historical background and current developments for mapping burned area from satellite Earth observation, Remote Sens. Environ., 225, 45–64, 2019.
Crippa, P., Castruccio, S., Archer-Nicholls, S., Lebron, G., Kuwata, M., Thota, A., Sumin, S., Butt, E., Wiedinmyer, C., and Spracklen, D.: Population exposure to hazardous air quality due to the 2015 fires in Equatorial Asia, Sci. Rep.-UK, 6, 1–9, 2016.
Dennis, R. A., Mayer, J., Applegate, G., Chokkalingam, U., Colfer, C. J. P., Kurniawan, I., Lachowski, H., Maus, P., Permana, R. P., and Ruchiat, Y.: Fire, people and pixels: linking social science and remote sensing to understand underlying causes and impacts of fires in Indonesia, Hum. Ecol., 33, 465–504, 2005.
DGCC: Emission Reduction Report for the Indonesia-Norway partnership, Directorate General of Climate Change, available at: http://ditjenppi.menlhk.go.id/reddplus/images/adminppi/dokumen/igrk/Progres_penurunan_emisi.pdf (last access: 15 October 2021), 2019.
Drusch, M., Del Bello, U., Carlier, S., Colin, O., Fernandez, V., Gascon, F., Hoersch, B., Isola, C., Laberinti, P., Martimort, P., Meygret, A., Spoto, F., Sy, O., Marchese, F., and Bargellini, P. G.: Sentinel-2: ESA's optical high-resolution mission for GMES operational services, Remote Sens. Environ., 120, 25–36, 2012.
European Union/ESA/Copernicus: Sentinel-2 MSI: MultiSpectral Instrument, Level-2A, Earth Engine Data Catalog [data set], available at: https://developers.google.com/earth-engine/datasets/catalog/COPERNICUS_S2_SR, last access: 10 November 2020.
Falk, D. A., Miller, C., McKenzie, D., and Black, A. E.: Cross-scale analysis of fire regimes, Ecosystems, 10, 809–823, 2007.
Fanin, T. and van der Werf, G. R.: Precipitationfire linkages in Indonesia (1997–2015), Biogeosciences, 14, 3995–4008, https://doi.org/10.5194/bg-14-3995-2017, 2017.
Field, R. D., van der Werf, G. R., and Shen, S. S.: Human amplification of drought-induced biomass burning in Indonesia since 1960, Nat. Geosci., 2, 185–188, 2009.
Field, R. D., Van Der Werf, G. R., Fanin, T., Fetzer, E. J., Fuller, R., Jethva, H., Levy, R., Livesey, N. J., Luo, M., and Torres, O.: Indonesian fire activity and smoke pollution in 2015 show persistent nonlinear sensitivity to El Ni no-induced drought, P. Natl. Acad. Sci. USA, 113, 9204–9209, 2016.
Gaveau, D. L. A., Salim, M., Hergoualc'h, K., Locatelli, B., Sloan, S., Wooster, M., Marlier, M., Molidena, E., Yaem, H., Defries, R., Verchot, L., Murdiyarso, D., Nasi, R., Holmgren, P., and Sheil, D.: Major atmospheric emissions from peat fires in Southeast Asia during non-drought years: evidence from the 2013 Sumatran fires, Sci. Rep.-UK, 4, 6112, https://doi.org/10.1038/srep06112, 2014.
Gaveau, D. L. A., Pirard, R., Salim, M. A., Tonoto, P., Parks, S. A., and Carmenta, R.: Overlapping land claims limit the use of satellites to monitor No-Deforestation commitments and No-Burning compliance, Conserv. Lett., 10, 257–264, 2017.
Gaveau, D. L. A., Descal, A., Salim, M. A., Sheil, D., and Sloan, S.: 2019 burned area map for Indonesia using Sentinel-2 data, Zenodo [data set], https://doi.org/10.5281/zenodo.4551243, 2021a.
Gaveau, D. L. A., Santos, L., Locatelli, B., Salim, M. A., Husnayaen, H., Meijaard, E., Heatubun, C., and Sheil, D.: Forest loss in Indonesian New Guinea (2001–2019): Trends, drivers and outlook, Biol. Conserv., 261, 109225, https://doi.org/10.1016/j.biocon.2021.109225, 2021b.
Giglio, L., Justice, C., Boschetti, L., and Roy, D.: MCD64A1 MODIS/Terra+Aqua Burned Area Monthly L3 Global 500m SIN Grid V006, NASA EOSDIS Land Processes DAAC [data set], https://doi.org/10.5067/MODIS/MCD64A1.006, 2015 (data available at: https://developers.google.com/earth-engine/datasets/catalog/MODIS_006_MCD64A1, last access: 12 August 2021).
Giglio, L., Boschetti, L., Roy, D. P., Humber, M. L., and Justice, C. O.: The Collection 6 MODIS burned area mapping algorithm and product, Remote Sens. Environ., 217, 72–85, 2018.
Gorelick, N., Hancher, M., Dixon, M., Ilyushchenko, S., Thau, D., and Moore, R.: Google Earth Engine: Planetary-scale geospatial analysis for everyone, Remote Sens. Environ., 202, 18–27, https://doi.org/10.1016/j.rse.2017.06.031, 2017.
Gütschow, J., Jeffery, M. L., Gieseke, R., Gebel, R., Stevens, D., Krapp, M., and Rocha, M.: The PRIMAP-hist national historical emissions time series (1850–2017), GFZ Data Services [data set], https://doi.org/10.5880/pik.2019.018, 2019.
Harrison, M. E., Ripoll Capilla, B., Thornton, S. A., Cattau, M. E., and Page, S. E.: Impacts of the 2015 fire season on peat-swamp forest biodiversity in Indonesian Borneo, Peatlands in harmony–Agriculture, industry & nature, in: Proceedings of the 15th international peat congress: Oral presentations, Kuching Malaysia, 15–19 August 2016, 713–717, 2016.
Hawbaker, T. J., Vanderhoof, M. K., Schmidt, G. L., Beal, Y.-J., Picotte, J. J., Takacs, J. D., Falgout, J. T., and Dwyer, J. L.: The Landsat Burned Area algorithm and products for the conterminous United States, Remote Sens. Environ., 244, 111801, https://doi.org/10.1016/j.rse.2020.111801, 2020.
Huang, H., Roy, D. P., Boschetti, L., Zhang, H. K., Yan, L., Kumar, S. S., Gomez-Dans, J., and Li, J.: Separability analysis of Sentinel-2A Multi-Spectral Instrument (MSI) data for burned area discrimination, Remote Sens.-Basel, 8, 873, https://doi.org/10.3390/rs8100873, 2016.
Huijnen, V., Wooster, M., Kaiser, J., Gaveau, D., Flemming, J., Parrington, M., Inness, A., Murdiyarso, D., Main, B., and Van Weele, M.: Fire carbon emissions over maritime southeast Asia in 2015 largest since 1997, Sci. Rep.-UK, 6, 26886, https://doi.org/10.1038/srep26886, 2016.
Karsai, I., Schmickl, T., and Kampis, G.: Forest Fires: Fire Management and the Power Law, in: Resilience and Stability of Ecological and Social Systems, Springer, 63–77, 2020.
Koplitz, S. N., Mickley, L. J., Marlier, M. E., Buonocore, J. J., Kim, P. S., Liu, T., Sulprizio, M. P., DeFries, R. S., Jacob, D. J., and Schwartz, J.: Public health impacts of the severe haze in Equatorial Asia in September–October 2015: demonstration of a new framework for informing fire management strategies to reduce downwind smoke exposure, Environ. Res. Lett., 11, 094023, https://doi.org/10.1088/1748-9326/11/9/094023, 2016.
Liu, S., Zheng, Y., Dalponte, M., and Tong, X.: A novel fire index-based burned area change detection approach using Landsat-8 OLI data, Eur. J. Remote Sens., 53, 104–112, 2020.
Lizundia-Loiola, J., Otón, G., Ramo, R., and Chuvieco, E.: A spatio-temporal active-fire clustering approach for global burned area mapping at 250 m from MODIS data, Remote Sens. Environ., 236, 111493, https://doi.org/10.1016/j.rse.2019.111493, 2020.
Lizundia-Loiola, J., Franquesa, M., Boettcher, M., Kirches, G., Pettinari, M. L., and Chuvieco, E.: Operational implementation of the burned area component of the Copernicus Climate Change Service: from MODIS 250 m to OLCI 300 m data, Earth Syst. Sci. Data Discuss. [preprint], https://doi.org/10.5194/essd-2020-399, 2021.
Lohberger, S., Stängel, M., Atwood, E. C., and Siegert, F.: Spatial evaluation of Indonesia's 2015 fire-affected area and estimated carbon emissions using Sentinel-1, Glob. Change Biol., 24, 644–654, 2018.
Malamud, B. D., Morein, G., and Turcotte, D. L.: Forest fires: an example of self-organized critical behavior, Science, 281, 1840–1842, 1998.
Marlier, M. E., DeFries, R. S., Voulgarakis, A., Kinney, P. L., Randerson, J. T., Shindell, D. T., Chen, Y., and Faluvegi, G.: El Ni no and health risks from landscape fire emissions in southeast Asia, Nat. Clim. Change, 3, 131–136, 2013.
Ministry of Environment and Forestry (MOEF): available at: https://geoportal.menlhk.go.id/webgis/index.php/en/, last access: 1 April 2021.
Olofsson, P., Foody, G. M., Herold, M., Stehman, S. V., Woodcock, C. E., and Wulder, M. A.: Good practices for estimating area and assessing accuracy of land change, Remote Sens. Environ., 148, 42–57, https://doi.org/10.1016/j.rse.2014.02.015, 2014.
Otón, G., Lizundia-Loiola, J., Pettinari, M. L., and Chuvieco, E.: Development of a consistent global long-term burned area product (1982–2018) based on AVHRR-LTDR data, Int. J. Appl. Earth Obs., 103, 102473, 2021.
Ramo, R., Roteta, E., Bistinas, I., Van Wees, D., Bastarrika, A., Chuvieco, E., and Van der Werf, G. R.: African burned area and fire carbon emissions are strongly impacted by small fires undetected by coarse resolution satellite data, P. Natl. Acad. Sci. USA, 118, e2011160118, https://doi.org/10.1073/pnas.2011160118, 2021.
Ritung, S., Wahyunto, Nugroho, K., Sukarman, Hikmatullah, Suparto, and Tafakresnanto, C.: Peatland map of Indonesia, Department of Research and Development of Agricultural Land Resources, Ministry of Agriculture, Jakarta, 2011.
Rochmyaningsih, D.: Wildfire researcher deported amid growing rift between Indonesian government and scientists, Science, 367, 722–723, 2020.
Salim, M. A.: Visualise 2019 burned areas across Indonesia, TheTreeMap.com, available at: https://thetreemap.users.earthengine.app/view/burn-area-validation-simplified, last access: 5 November 2021.
Salim, M. A., Descals, A., and Gaveau, D.: Code for generating annual pre- and post-fire Sentinel-2 composites over Indonesia, V1.0, Zenodo [code], https://doi.org/10.5281/zenodo.5646758, 2021.
Sipongi: Recapitulation of Land and Forest Fires Area (Ha) per Province in Indonesia 2015–2020, available at: http://sipongi.menlhk.go.id/hotspot/luas_kebakaran (last access: 8 November 2021), 2020.
Sloan, S., Locatelli, B., Wooster, M. J., and Gaveau, D. L.: Fire activity in Borneo driven by industrial land conversion and drought during El Ni no periods, 1982–2010, Global Environ. Chang., 47, 95–109, 2017.
Sloan, S., Tacconi, L., and Cattau, M.: Fire prevention in managed landscapes: Recent success and challenges in Indonesia, Mitig. Adapt. Strat. Gl., 26, 32, https://doi.org/10.1007/s11027-021-09965-2, 2021.
Stehman, S. V., Wickham, J., Smith, J., and Yang, L.: Thematic accuracy of the 1992 National Land-Cover Data for the eastern United States: Statistical methodology and regional results, Remote Sens. Environ., 86, 500–516, 2003.
Tacconi, L.: Preventing fires and haze in Southeast Asia, Nat. Clim. Change, 6, 640–643, 2016.
Tansey, K., Beston, J., Hoscilo, A., Page, S., and Paredes Hernández, C.: Relationship between MODIS fire hot spot count and burned area in a degraded tropical peat swamp forest in Central Kalimantan, Indonesia, J. Geophys. Res., 113, D23112, https://doi.org/10.1029/2008JD010717, 2008.
Van der Werf, G. R., Dempewolf, J., Trigg, S. N., Randerson, J. T., Kasibhatla, P. S., Giglio, L., Murdiyarso, D., Peters, W., Morton, D., and Collatz, G.: Climate regulation of fire emissions and deforestation in equatorial Asia, P. Natl. Acad. Sci. USA, 105, 20350–20355, 2008.
van der Werf, G. R., Randerson, J. T., Giglio, L., van Leeuwen, T. T., Chen, Y., Rogers, B. M., Mu, M., van Marle, M. J. E., Morton, D. C., Collatz, G. J., Yokelson, R. J., and Kasibhatla, P. S.: Global fire emissions estimates during 1997–2016, Earth Syst. Sci. Data, 9, 697–720, https://doi.org/10.5194/essd-9-697-2017, 2017.
van Nieuwstadt, M. G. L. and Sheil, D.: Drought, fire and tree survival in a Borneo rain forest, East Kalimantan, Indonesia, J. Ecol., 93, 191–201, 2005.
Watts, J. D., Tacconi, L., Hapsari, N., Irawan, S., Sloan, S., and Widiastomo, T.: Incentivizing compliance: Evaluating the effectiveness of targeted village incentives for reducing burning in Indonesia, Forest Policy Econ., 108, 101956, https://doi.org/10.1016/j.forpol.2019.101956, 2019.
Wooster, M., Gaveau, D., Salim, M., Zhang, T., Xu, W., Green, D., Huijnen, V., Murdiyarso, D., Gunawan, D., and Borchard, N.: New tropical peatland gas and particulate emissions factors indicate 2015 Indonesian fires released far more particulate matter (but less methane) than current inventories imply, Remote Sens.-Basel, 10, 495, https://doi.org/10.3390/rs10040495, 2018.