the Creative Commons Attribution 4.0 License.
the Creative Commons Attribution 4.0 License.
 | 29 Sep 2021
Long-term phenological data set of multi-taxonomic groups, agrarian activities, and abiotic parameters from Latvia, northern Europe
Gunta Kalvāne
Andis Kalvāns
Andris Ģērmanis
A phenological data set collected by citizen scientists from 1970 to 2018 in Latvia is presented, comprising almost 47 000 individual observations of eight taxonomical groups, in addition to agrarian activities and abiotic parameters, covering in total 159 different phenological phases. These original data published offline in annual issues of the Nature and History Calendar (in Latvian, Dabas un vēstures kalendārs) have been digitized, harmonized, and geo-referenced.
Overall, the possible use of such data is extensive, as phenological data are excellent bioindicators for characterizing climate change and can be used for the elaboration of adaptation strategies in agriculture, forestry, and environmental monitoring. The data can also be used in cultural–historical research; for example, the database includes data on sugar beet and maize, the cultivation of which was imposed on collective farms during the Soviet period. Thus, such data are not only important in the Earth sciences but can also be applied to the social sciences.
The data significantly complement current knowledge on European phenology, especially regarding northern regions and the temporal biome. The data here cover two climate reference periods (1971–2000; 1981–2010), in addition to more recent years, and are particularly important in monitoring the effects of climate change. The database can be considered the largest open phenological data set in the Baltics.
The data are freely available to all interested at https://doi.org/10.5281/zenodo.3982086 (Kalvāne et al., 2020).
- Article
(4632 KB) - Full-text XML
- BibTeX
- EndNote


From the relatively narrow study of natural rhythms, phenology has developed into an interdisciplinary field of science, the application of which is constantly expanding. Phenological data are important for agriculture, forestry (Peñuelas et al., 2009), understanding ecological processes (Walther et al., 2002), human health (Dierenbach et al., 2013) (knowledge of allergen flowering times and implementation of early warning and monitoring systems can protect those affected by pollinosis and reduce economic losses due to illness), tourism, and education (Kalvāne, 2011), and on-site phenological observations are used as ground truth for satellite data calibration (Nagai et al., 2018). Additionally, phenological data are increasingly being used as bioindicators of climate change (Jochner and Menzel, 2015; Menzel et al., 2020; Ovaskainen et al., 2013).
The oldest phenological data series in Europe dates back to 1354 and holds the dates of grape harvest in Beaube, Burgundy, France (Labbé et al., 2019), as well as data from 15th century France and Austria (Schleip et al., 2008). The earliest known data collection in the Baltic region, although fragmentary in nature, dates back to the 17th century, obtained by reconstructing the date of the rye harvest in Estonia (Ahas, 2008). In Lithuania and Estonia, more systematic observations have been undertaken in botanical gardens: when the Botanical Garden of Vilnius University was founded in Lithuania in 1782 (Romanovskaja and Baksiene, 2008) and in 1865 with the founding of the Botanical Garden of the University of Tartu in Estonia (Ahas, 2008). In Russia, a network of volunteer observers was established in 1848, when the Russian Geographical Association distributed a questionnaire to the scientific community, including schoolteachers (Ovaskainen et al., 2013). Fragmentary data on phenology in the territory of present-day Latvia can be found in the collections of German clergies, as well as in the mid-19th century collections of articles of the Riga Society of Nature Researchers (in German, Naturforscher-Verein zu Rīga; in Latvian, Rīgas Dabaspētnieku biedrība). Systematic networks of voluntary observers across the Baltic states were established in the 1920s (Ahas, 2008; Grišule and Briede, 2008; Romanovskaja and Baksiene, 2008) and have, with varying success and changes in the maintainers of the data, continued to operate to this day, continuing the development an extremely valuable database.
Here we have described the significance of phenological data and the history of phenology in Latvia. We have evaluated the quality and reliability of the phenological data, describing the methods of data quality assessment and the structure of the database in detail. We have outlined the potential for its use in climate change research as an example of seasonal, chronological analysis (phenological calendar method) and long-term and annual fluctuation assessment. The presented data cover a period of almost 50 years, including not only plant phenology, but also animal, insect, and fungal phenology, as well as agrarian seasonal practices and abiotic parameters such as first snow, frost, and ice melting.
The goal of the publication is to (1) contribute to open data and science in the field of phenology, (2) outline the possible applications of the phenological data set, and (3) provide insight into the development of phenology in Latvia. The data set include 159 phenological phases over 1971 to 2018 for eight taxonomic groups, as well as abiotic and agrarian phenomena that can be attributed to a temporal biome in northern Europe.
The greatest value of our data is the large number (159) of reported phenological occurrences, which allows one to not only fully characterize the annual seasonal developments across the Latvian landscape, but also analyse long-term changes, mainly in the context of climate change. It is important to note that the data are not only useful for the Earth sciences, but they also have societal value. Agrarian observations allow one to gain insight into cultural and historical events: for example, the database contains data on the initiation of grazing in Latvia. Historically, the first cattle grazing after the long winter (Latvia has 96 to 155 d frost days annually; Avotniece et al., 2017) was a significant event, which was celebrated by entertainment like traditional water fights (rumulēšanās in Latvian). Along with changes in agricultural practices, such events were no longer recorded. During the Soviet period, volunteer observers recorded maize (Zea mays) and sugar beet (Beta vulgaris) phenology, which had previously not been cultivated often in Latvia and were in a way “imposed”. Observations of maize and sugar beet were recorded over 1970 to 1976. The publication takes an expanded look at the application of data in the Earth sciences.
The phenological data described here are available in the Zenodo data repository at https://doi.org/10.5281/zenodo.3982086 (Kalvāne et al., 2020) and integrated into the common European phenological database PEP725 (Pan European Phenology Project) (Templ et al., 2018).
2.1 Data source
The original paper publication of the data set can be found in the Nature and History Calendar yearbooks (in Latvian, Dabas un vēstures kalendārs; Fig. 1), from 2005 in Nature and History (in Latvian Daba un vēsture) and from 2014 in the Yearbook of [the] Latvian Newspaper (in Latvian, Latvijas Avīzes Gadagrāmata), where the phenological observations from the last year are presented. The original data source is volunteer observations (Fig. 2).
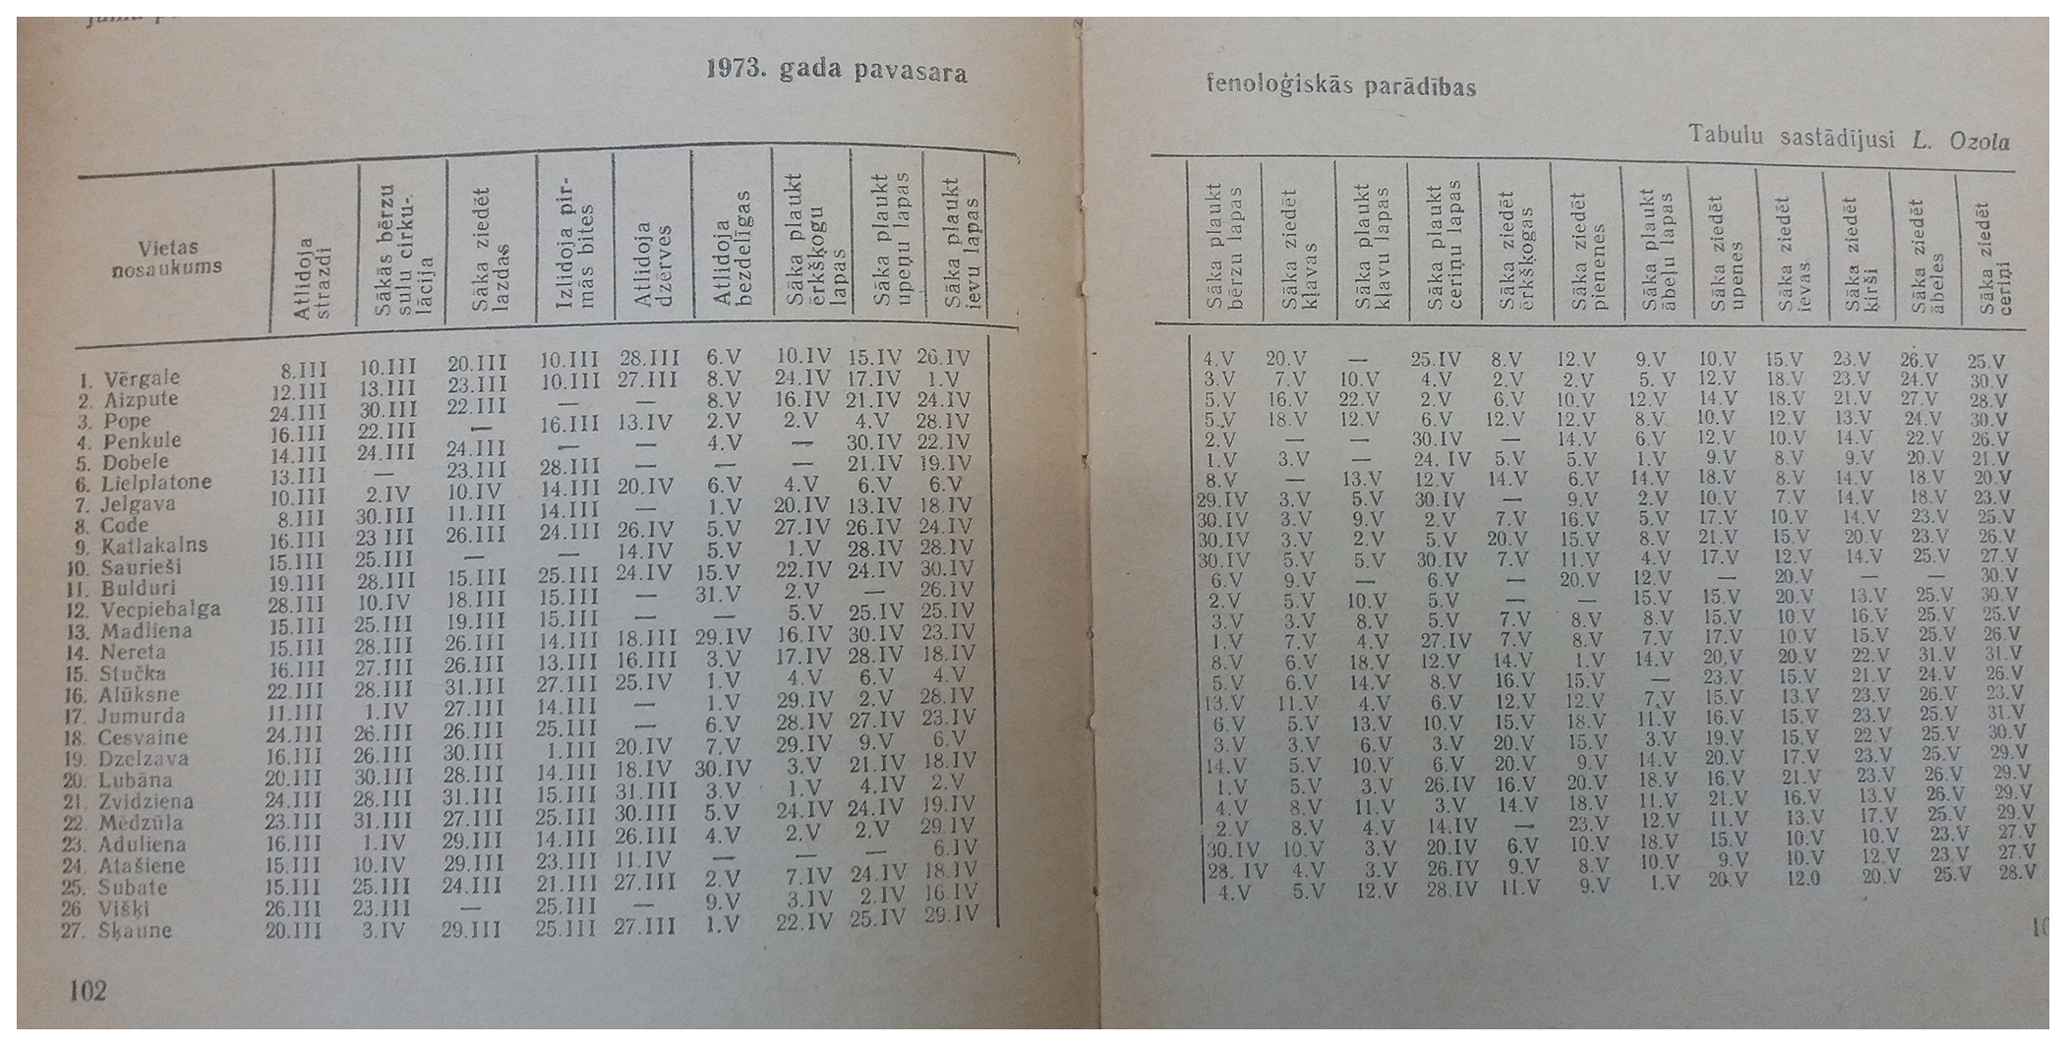
Figure 1Example of the original paper publication of phenological observations for spring 1973 in the 1974 issue of the Nature and History Calendar yearbook (in Latvian, Dabas un vēstures kalendārs; “Nature and History Calendar, 1974”, the National Library of Latvia, copyright owner unknown).

Figure 2Excerpt from the notes made by voluntary observer Leontīna Pelše in Lazdona, in autumn of 2012.
With a varying degree of success, and along with changes of the data maintainers, this network of volunteer observers has been operating since 1927, with interruptions during World War II. In this publication we have collected phenological data, digitizing them from the above-mentioned sources for the last two climatic reference periods (1971–2000, 1981–2010), as well as for more recent years, which are especially important for monitoring the effects of climate change.
The largest number of observation points or stations (34) and the largest number of observations (3107) were recorded in 1976. More recently, observations were only taken at 7–10 points. Observations are published annually in the yearbook regarding about 70–110 different phenological phases, covering different taxonomic groups, as well as abiotic and agrarian phenomena. In this data source (Nature and History Calendar), the starting dates or first occurrence in the observation area of a given phenomenon are usually fixed. They are grouped by season: spring, summer, and autumn.
In total, the database contains almost 47 000 records of 159 different phenological phases from 103 observation points (Fig. 4). Observations of the same phenological phase from the same location are considered a single data series. According to this definition, there are 7892 data series. However, there are only 1980 data series with 10 or more yearly observations.
The table in the image shows phenological observations recorded in different locations (1. Vērgale, 2. Aizpute … 26. Visķi, 27. Šķaune); in the header row phenological phases are mentioned: first individuals – starlings (in Latvian, atlido strazdi) and so on.
Leontīna Pelše generally described autumn as follows (handwriting text below the table):
autumn is wet and rainy, without Indian summer. Harvest is good. A lot of berries and nuts. Often thunderstorm, hail. The first snow was on 26 October, 23.4 cm. 28 October: first river ice. 30 October: Air temperature during night −9 ∘C.
The coordinates of the administrative units (village or town) were recorded as the location of the reported observations; it is evident that these were not the exact locations of actual observations. The locations of the observations were coded by the village or town name.
The dates were entered into an Excel spreadsheet following the format of the original publication, with each sheet including the year of observations; the data set was further processed in R (R Core Team, 2019). We have coded the phytophenological phases according to the Biologische Bundesanstalt Bundessortenamt and Chemical Industry (BBCH) scale (Meier et al., 2001). For the start of crop sowing, we assigned code BBCH00 (Dry seed, innate or enforced dormancy, tuber not sprouted); however, the sowing date is usually the end date of this phase rather than starting date.
2.2 Quality control
A multi-step quality control procedure for the presented data set was adopted. There are two main sources of possible errors in the data set: (1) errors related to the digitization of the paper publications and (2) errors related to observations, processing, and publication in the original source. If identified, the errors of the first type were corrected manually. The presence of the second type of errors can only be inferred from internal inconsistencies of impossible or implausible values of reported observations. When such internal inconsistencies were identified, the values were flagged in the final data set, but not eliminated. The user of the data set can themselves decide to exclude such flagged values. The following error screening procedure, similar to that used by Rutishauser et al. (2019), was used.
-
Test 1. Global outlier identification was applied if at least four observations of the given phase in a given year were available; 98.4 % of all observations met this criterion. At first, deviation of each observation from the median value (Fmed-dev) for the given year and phenological phase for all stations was calculated. Then, the phenophase specific standard deviation (SDmed-dev) of the differences between yearly median (Fmed-dev) and actual observation for all years and stations combined was calculated. All observations deviating from the yearly median by more than 4 standard deviations Fmed-dev>4 SDmed-dev were double checked against the original publication and corrected if necessary. After that, the remaining observations not passing Test 1 were individually considered by authors and, if so decided, flagged as implausible. After manual correction of typing errors, only 16 observations were flagged by Test 1 and only four of these observations were flagged as implausible according to expert judgement (Fig. 3).
-
Test 2. Local outlier identification was carried out for series where there are more than 10 observations for a given phenological phase (65 % of all observations). Observations that deviated from the station median of the given phenological phase by more than 3 standard deviations were flagged and double checked for typing errors against the original paper publication. After error correction, 94 observations were flagged by Test 2, and nine of those were flagged as implausible according to expert judgement (Fig. 3).
-
Test 3. This test examines the impossible order of phenological phases. Certain phenological phases must follow a strict order; e.g. fruiting (BBCH87) can take place only after flowering (BBCH61). We defined two lines of phase order: vegetative and generative. We checked these for each species, station, and year. A special case is the development of winter cereals: it is normal that sowing and emergence take place in the autumn, after the onset of the spring and summer development phases. Therefore, the arbitrary code “ReassumedGrowth” instead of regular BBCH is assigned as the first number in spring development. In Test 3 we were able to consider only 9214 or 19.6 % of all observations. Of those, only 14 (0.15 %) failed this test and were marked both as “Wrong order” and “Implausible” (Fig. 3).
The questionable observations identified in Test 1 and Test 2 were evaluated by experts (the authors of this publication) and were flagged as implausible if considered unrealistic. Test 1 and Test 2 were reiterated after excluding implausible values. In total, only 43 observations (less than 0.1 % of the data set) were flagged as implausible.
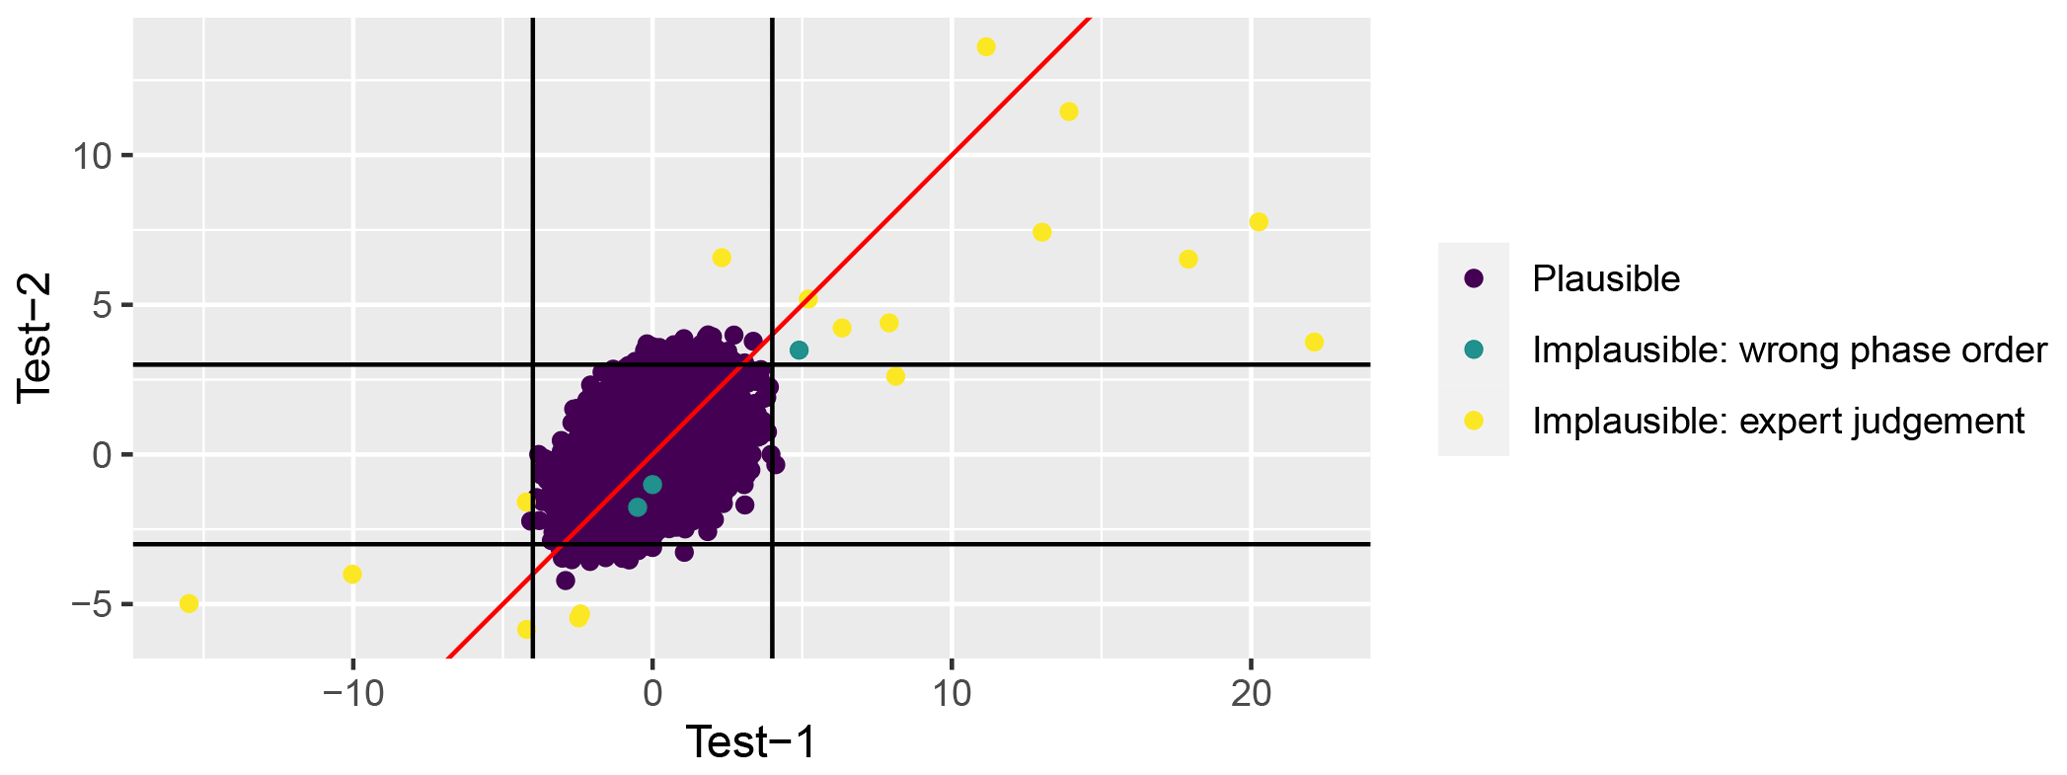
Figure 3Association between Test 1 (standard deviation from yearly median of the given phase) and Test 2 (standard deviation from station median of the given phase); black lines indicate thresholds of 4 (Test 1) or 3 (Test 2) standard deviations.
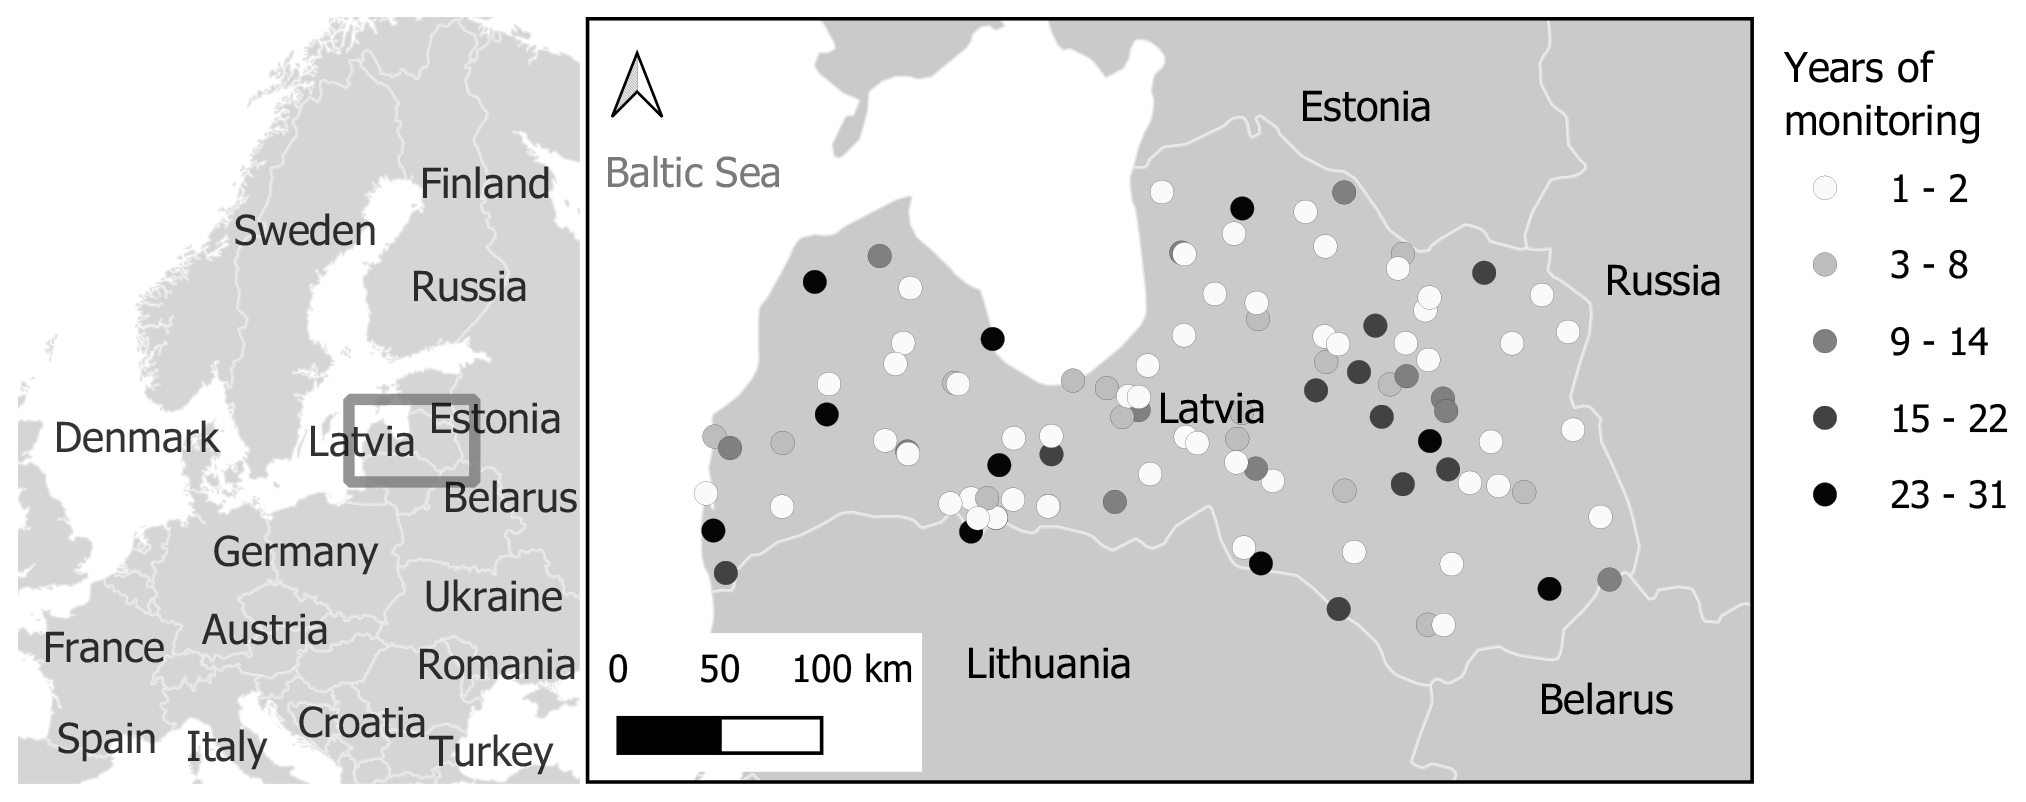
Figure 4Site and observation point locations and quantity of available data; duration given in years.
2.3 Temporal trends
In the presented data set, the time series from individual observation locations are rather short. There are indications in the literature that a shift in meteorological conditions in the Baltic region occurred around 1990 (Apsīte et al., 2013; Jaagus et al., 2017). Similar Europe-wide changes to earlier spring phenology starting from 1988 were reported by Wu et al. (2016). However, to gain insight into the temporal phenological trends, we sub-selected series that match two criteria: (1) at least four observations before 1987 and (2) at least four observations after 1992. This ensures that data points from either side of 1990 are included. Further, we calculated a simple linear trend for each station-phase time series and aggregated them along the lines of major phase groups: start of leaf unfolding (BBCH11), flowering (BBCH61), ripening (BBCH83-87) and plant senescence (BBCH92-93), and first arrival and departure of migratory birds, in addition to abiotic and agrarian phenological phases.
2.4 Phenological calendar
The overview of the most observed phenological phases and their arrangement can be presented as a phenological calendar. We selected only phases with more than 500 observations, arranged them by the average reported date of phase onset and presented them as a boxplot. The box plot was supplemented with a relative number of yearly observations indicated by density plot. The phenological calendar includes data on 46 phenological phases, arranged in chronological order by the median values.
3.1 The history of phenology in Latvia – a brief overview
For Latvia, fragmentary phenological data can be found in certain regions in the diaries of clergy (Jansons, 1929; Kalvāne, 2011) from the beginning of the 19th century. The first data on the phenology of birds, bees, and crops were published in 1866 in Terbata (now Tartu, Estonia) in Korrespondenzblatt der Naturforscher-Vereins zu Riga (Naturforscher-Vereins zu Riga, 1867). In the beginning of the 20th century, the text “Nature phenomena in annuals changes” by Jessens (1920) on the Vidzeme and Kurzeme areas was published with encouragement for people “to observe nature and to diligently record information about plants (budding, flowering) and insects and other animals (awakening, appearance), birds (arrival), as well as to take notes on ice moving in rivers, the first thunder, etc.”.
The network of systematic observations was established in 1927 under the leadership of the Meteorological Institute of the University of Latvia. Guidelines for observations were developed for the primary research objective of “closer links between plant distribution and meteorological phenomena and provision of results that support conclusions based on meteorological data” as phenological data were seen as complementary to a region's climatic information (Jansons, 1929). The guidelines also stated that “it is also important that the observation includes plants that are indeed well-known, which are related to some other interests, including some quite practical ones, and such that can be observed, one could say, right before the eyes” (Jansons, 1929). It should be noted that the guidelines have not changed significantly over time. The text “Phenological Observations in Latvia” was published until 1935. Observations were taken at more than 70 different points, and this was the largest observation network to operate in Latvia.
Phenological data for the 1940s and 1950s were summarized in the publications of Zirnītis (1956) as the average period values, without indicating the sources of the obtained data, which might have been for political reasons. Information is lacking about the maintainer of data during this period.
After World War II the network of phenological observations was renewed by the Hydrometeorological Service. Observations about crops and wildlife were taken at 20 meteorological stations and 20 posts. The obtained data were used for agricultural purposes. Since the establishment of the Phenological Commission of the Geographical Society of the Latvian Soviet Socialist Republic in 1959, a network of public correspondents and phenologists has operated the Society (Sproǵe, 1979). Since 1971, phenological data have also been published annually in the Nature and History Calendar, which have been digitized as part of the study.
In recent years (since 1999) the phenological network has been voluntarily coordinated by the co-author, Andris Ģērmanis, continuing to send observation questionnaires, data forms (Fig. 2), and publications of the Nature and History Calendar, and from 2014, of the Yearbook of [the] Latvian Newspaper Voluntary. Observers and phenologists annually record more than 200 different phenological phases: the development of 23 types of trees (from leaf budding to the beginning of leaf-fall), the flowering phase of 52 plants, migration of 14 migratory birds, ripening phase for 7 plants, characterization of 7 crops (from sowing to harvest), 11 zoo-phenological phenomena, and 13 economic activities, as well as the so-called inanimate phenomena such as ice moving and the first snow (statistics from the observation templates of recent years). A selected subset of the submitted data have been published in the Nature and History Calendar.
In parallel with the traditional network of volunteer observers, natural observations in Latvia are recorded in the Dabasdati.lv portal, maintained by the NGO Latvian Fund for Nature. A smartphone application is also available that has significantly increased interest in nature observations. For example, in the first 3 months of 2020, more than 34 000 observations (16 000 with photographs) were recorded, mainly of birds as Latvia has a long history of ornithology (Priedniece, 2020). Ornithological data are published on the latvijasputni.lv online portal.
3.2 Description of phenological data (database structure, data availability)
3.2.1 Database structure
Digitized historical data of volunteer observers after data quality control (see the section on methods) are combined in a database. The data are freely available at https://zenodo.org (last access: 19 September 2021), https://doi.org/10.5281/zenodo.3982086 (Kalvāne et al., 2020).

Figure 5An excerpt from the database showing the structure of the database.
The data are available at https://doi.org/10.5281/zenodo.3982086 (Kalvāne et al., 2020). The data fields are as follows (Fig. 5):
-
Station: observation station name;
-
Year: year of observation;
-
Season: season of observation as indicated in the primary publication;
-
Taxonomic_group: taxonomic group of the species observed or grouping of non-biological phases (“Abiotic” for meteorological phenomena and “Agrarian” for agrarian activities);
-
Species: English name of the species observed, or description of phenomena observed in case of abiotic occurrences;
-
Species_Latin: Latin name of the species observed;
-
Phenophase: description of phenological phase observed;
-
DoY: day of the year of the first observation of the phase;
-
Date: date of the first observation of the phase;
-
BBCH: attributed BBCH code for phenological phase observed, where applicable;
-
Decimal_longitude: longitude of observation site as decimal degrees;
-
Decimal_latitude: latitude of observation site as decimal degrees;
-
Geodetic_datum: geodetic reference system (EPSG:4326; WGS 84; World Geodetic System 1984);
-
Wrong_order: flag indicating whether the order of the reported phases of the same taxon at a given station and year is not realistic (TRUE) or realistic (FALSE);
-
Implausible: flag indicating the reported date of the phenological phase is highly unrealistic (TRUE) or realistic (FALSE).
3.2.2 Phenological phases
The database contains data on eight different taxonomic groups, as well as on abiotic phenomena (first snow, snowmelt, ice moving, first thunder, first and last frost) and agrarian activities (planting of seedlings, planting and harvesting of potatoes, ploughing in autumn, etc.). However, it should be noted that the largest data group is for plants (almost 70 %). The second largest group is birds (11 %), followed by abiotic phenomena (8 %), agricultural data (7 %), and insects (3 %). Other taxonomic groups comprise less than 1 % (Fig. 6). From the taxonomic group of plants, almost half of the observations are recorded about the flowering phase.
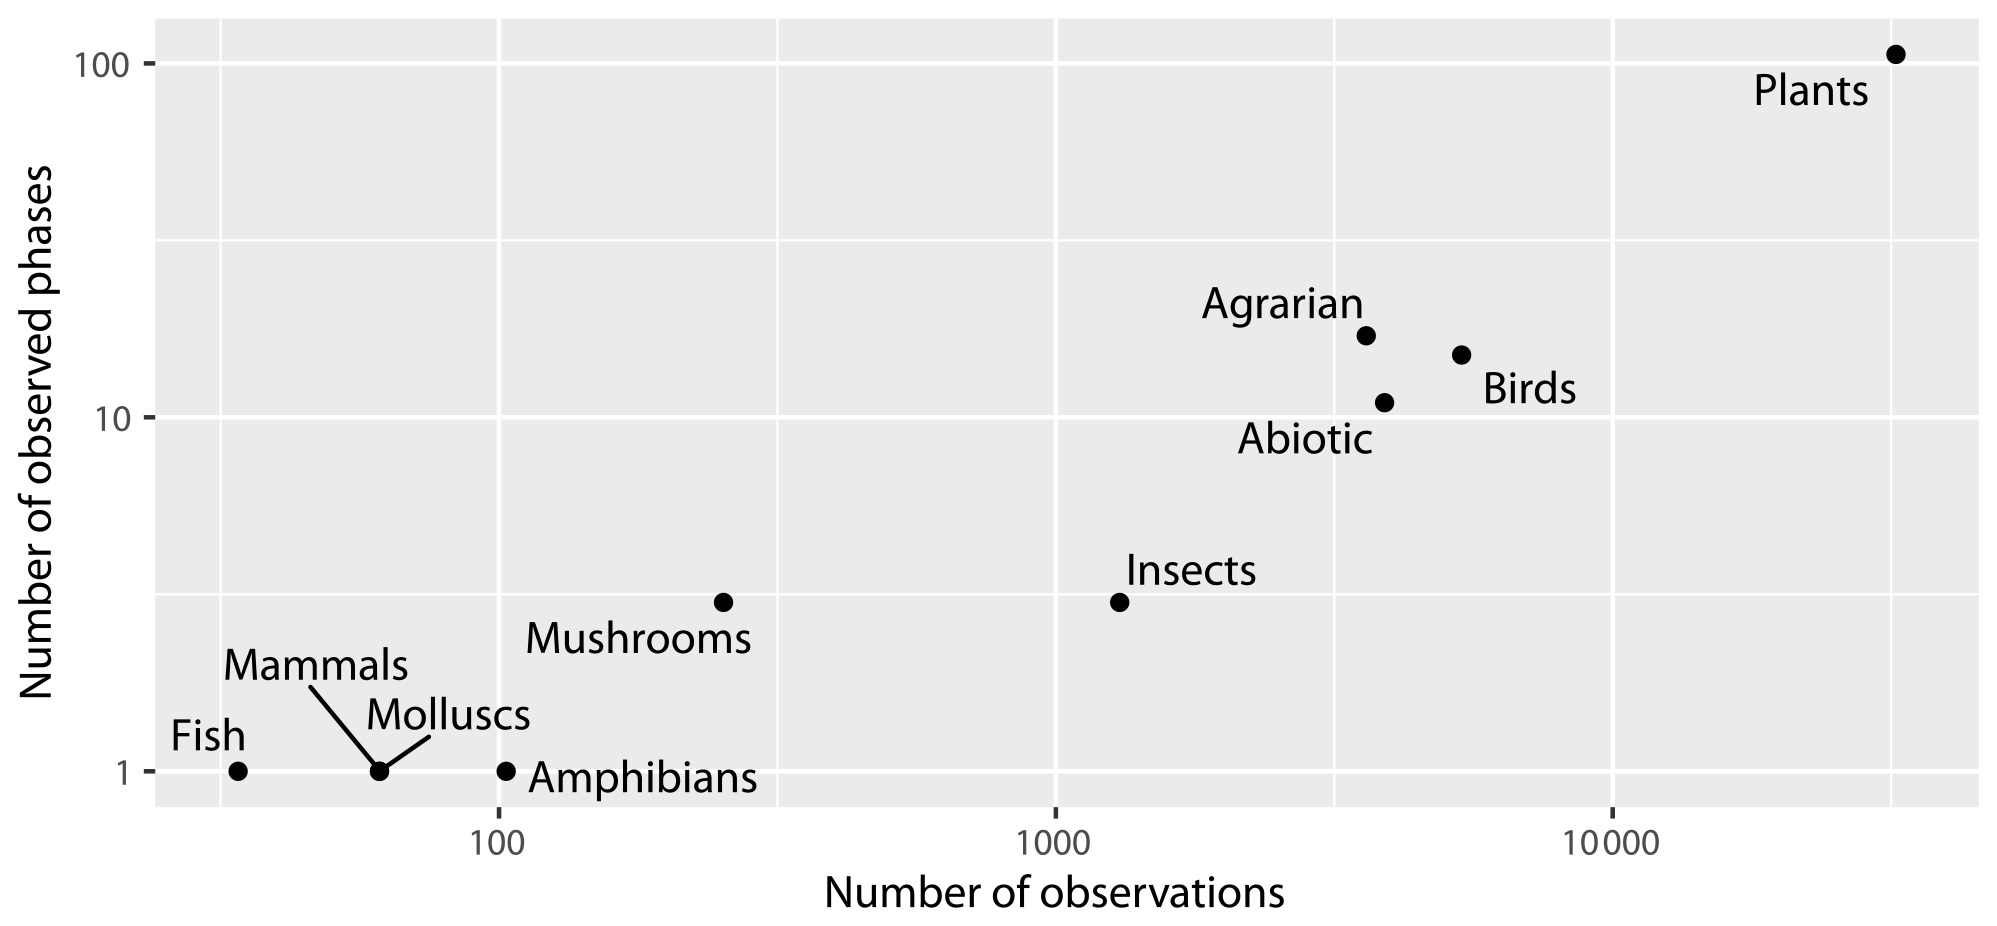
Figure 6Number of observed phases and observations across taxonomic groups; note that both axes are on the logarithmic scale.
The number of observations for individual phases ranged from 11 for the beginning of flowering of the European ash (Fraxinus excelsior; BBCH61) to 743 for the beginning of flowering of the common dandelion (Taraxacum officinale; BBCH61). Generally, between 70 and 79 phases were reported up until 2002, while starting from 2003, between 101 and 107 phases were reported. The years 1971 and 1973 had exceptionally low numbers of reported phases (46 and 51 respectively) while 1970 and 1976 had exceptionally higher numbers of reported phases (109 and 117 respectively). In recent years, for example, observations of the flowering of the snowdrop (Galanthus nivalis) and the first mushrooms observed have been published.
The majority of volunteers note the first observed specimen/individual, which is often the earliest value, rather than the average value specific to the observation area, which is important to keep in mind when using these data. According to one volunteer observer (Ģērmanis Agris, personal communication, 2020), it usually takes another 2 to 3 d for other specimens/individuals to reach the specified developmental stage reported in the observations.
Overall, the quality of the data can be assessed as high, as evidenced by the very low proportion of observations that were determined to be unrealistic. For example, data from the same source (Nature and History Calendar) were successfully used to calibrate the initial model of the budding and flowering of the bird cherry (Padus avium) and silver birch (Betula pendula; Kalvāns et al., 2015). The uncertainty of the model (2 to 4 d) was comparable to or higher than in other similar studies (Siljamo et al., 2008).
3.2.3 Data limitations
When using the data, it is important to note that (1) the georeferencing was approximate, (2) the observers record the first instance of the phenomenon, (3) most of the observations represent the spring phases, and (4) number of yearly observation points ranges from 7 to 10 in the 21st century to 34 in 1976.
-
A significant shortcoming of the database, the lack of metadata, must be mentioned; we only know the approximate location of observation points. The coordinates of administrative units were taken as the location of the reported observations, although it is evident that this is not the exact location of the actual observation. However, the study region (Latvia) is on the East European Plain with poorly articulated terrain and elevations not exceeding 311 m above sea level; considering the relatively flat and homogeneous territory, this should not have a major impact when analysing data globally or regionally.
-
As is common in an area of strong seasonality, the volunteer observers often pay more attention to the spring phases and less to summer or autumn, which may affect the data analysis, such as annual lengths or assumptions about growth stages and length.
-
Volunteers record the first appearance of the phenomena in the area. It is possible that the significance of phenological trends has also been influenced by the methodology of data collection. Voluntary observers do not observe the specific individuals from year to year but record the earlier observed value: this is event monitoring and not status monitoring. For example, in the study by Forrest and Miller-Rushing (2010), it was stated that larger plants (with better physiological conditions) bloom earlier than smaller ones in the same population. Also, the healthiest birds lay eggs earlier than those that are in a weaker physiological state (Forrest and Miller-Rushing, 2010).
-
The number of observers varies greatly from year to year, reaching a peak in the 1970s, and no continuous data series from 1970 to 2018 are available for any observation point (Fig. 7), which is required for analyses of long-term changes and for regional studies. There are two ways to solve this problem. The usual approach is to combine a series of observations from adjacent observation points, as has been done in the past (Kalvane et al., 2009). The second approach is to calibrate the phenological model using the available observation data set and to use, for example, gridded meteorological data (E-OBS), data of reanalysis, or operational meteorological models for regional calculations (Kalvāns et al., 2015; Wu et al., 2016).
The above-mentioned factors must be considered before using the data in our database; however, they do not reduce the value of the database or the applicability of the data.
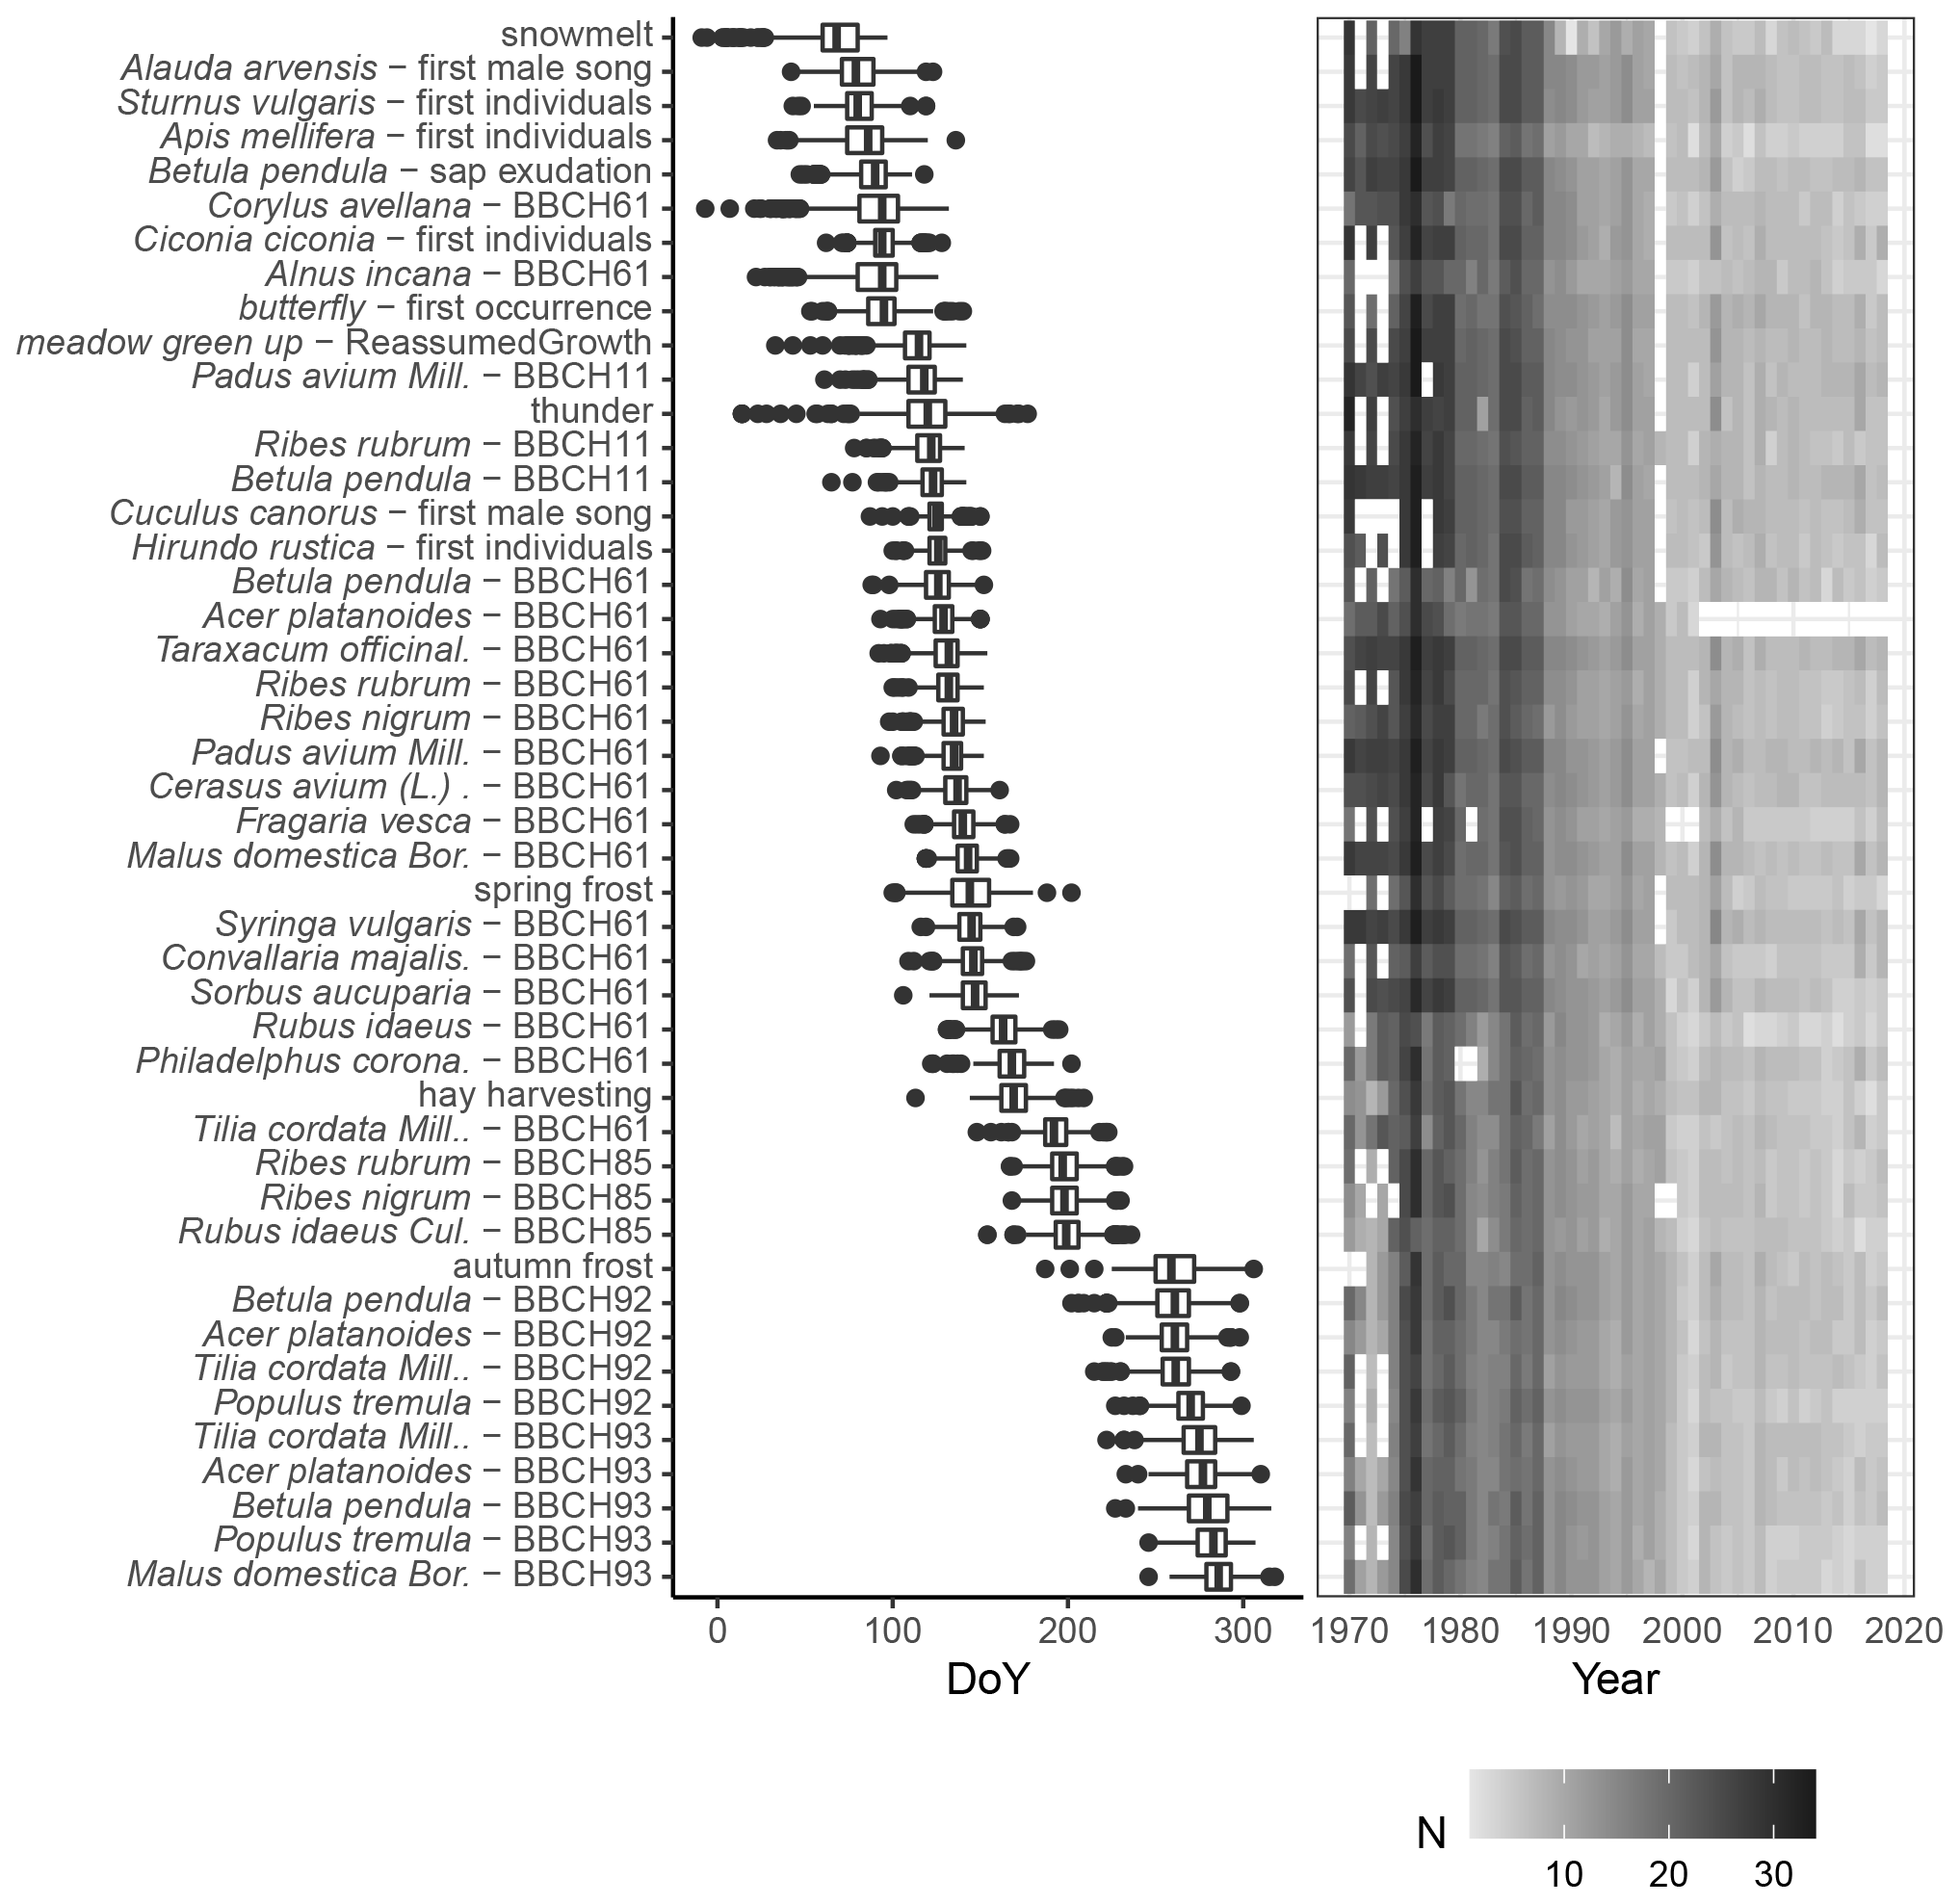
Figure 7Phenological calendar for Latvia – chronological sequence of phenological phases. Phases selected with >500 observations, plotted as a boxplot, where the median value is the vertical line, the sides of the boxplot are corresponding 25th and 75th quartiles, the whiskers extend to 1.5 times the distance between the first and third quartiles, and the dots are any remaining outliers. The right panel shows the number of observations per year.
3.3 Applicability of phenological data: temporal changes and seasonality in the landscape
A large amount of data, as in our case, allow one to describe chronological changes in the landscape in general – the phenological calendar method – and to analyse long-term data changes that serve as evidence of climate change. This makes it possible to compare annual fluctuations in the context of both species and region.
3.3.1 Seasonality in the landscape
Phenological calendars are long-established, identifying the most important indicator species (specific, characteristic, and easily identifiable development phase) (Kalvāne, 2011) or describing natural seasonal phenomena in general. The methods of creating phenological calendars and the forms of representation differ, but their goal is to demonstrate events in nature in chronological order.
In this study, based on the quality of the data (phenological phases were selected with at least 500 observations throughout Latvia), a phenological calendar for the temporal biome has been created.
In Latvia, snowmelt marks the beginning of the phenological season, but the end of it is marked by leaves falling off the apple tree (Malus domestica; BBCH93). In total, 46 phenological phases are described in the calendar. As can be seen in Fig. 7, the spring and autumn phases show a relatively larger scattering of values, i.e. larger interannual variation. For example, the beginning of flowering of pioneer species (Kolářová et al., 2014) such as hazel (Corylus avellana) and grey alder (Alnus incana; BBCH61) in Latvia may occur from the end of December to the beginning of May (Kalvāne and Kalvāns, 2021). It should be noted that during recent years, the beginning of flowering can already be observed in March. The timing of the summer phases is more consistent. In general, the green-up in Latvia is observed from the end of April to the beginning of May. As it is an area with high seasonality, which includes a long winter period, it is reasonable that spring indicators are recorded more often than, for example, summer or autumn phases.
Figure 7 shows that the data coverage varies from year to year – most observations are recorded in the 1970s, and recently the number of observations has been declining.
3.3.2 Phenological data as the representative of long-term and annual fluctuations
Analysis of phenological trends is a generally accepted method in bioclimatology, which characterizes both long-term and short-term changes. Figure 8 shows the flowering of hazel (Corylus avellana) as the phenological indicator of the beginning of spring, the flowering of linden (Tilia cordata) marks the middle of summer, and the yellowing of the leaves of the silver birch (Betula pendula) in the Baltic region (Kalvāne, 2011) is considered to be the beginning of autumn.
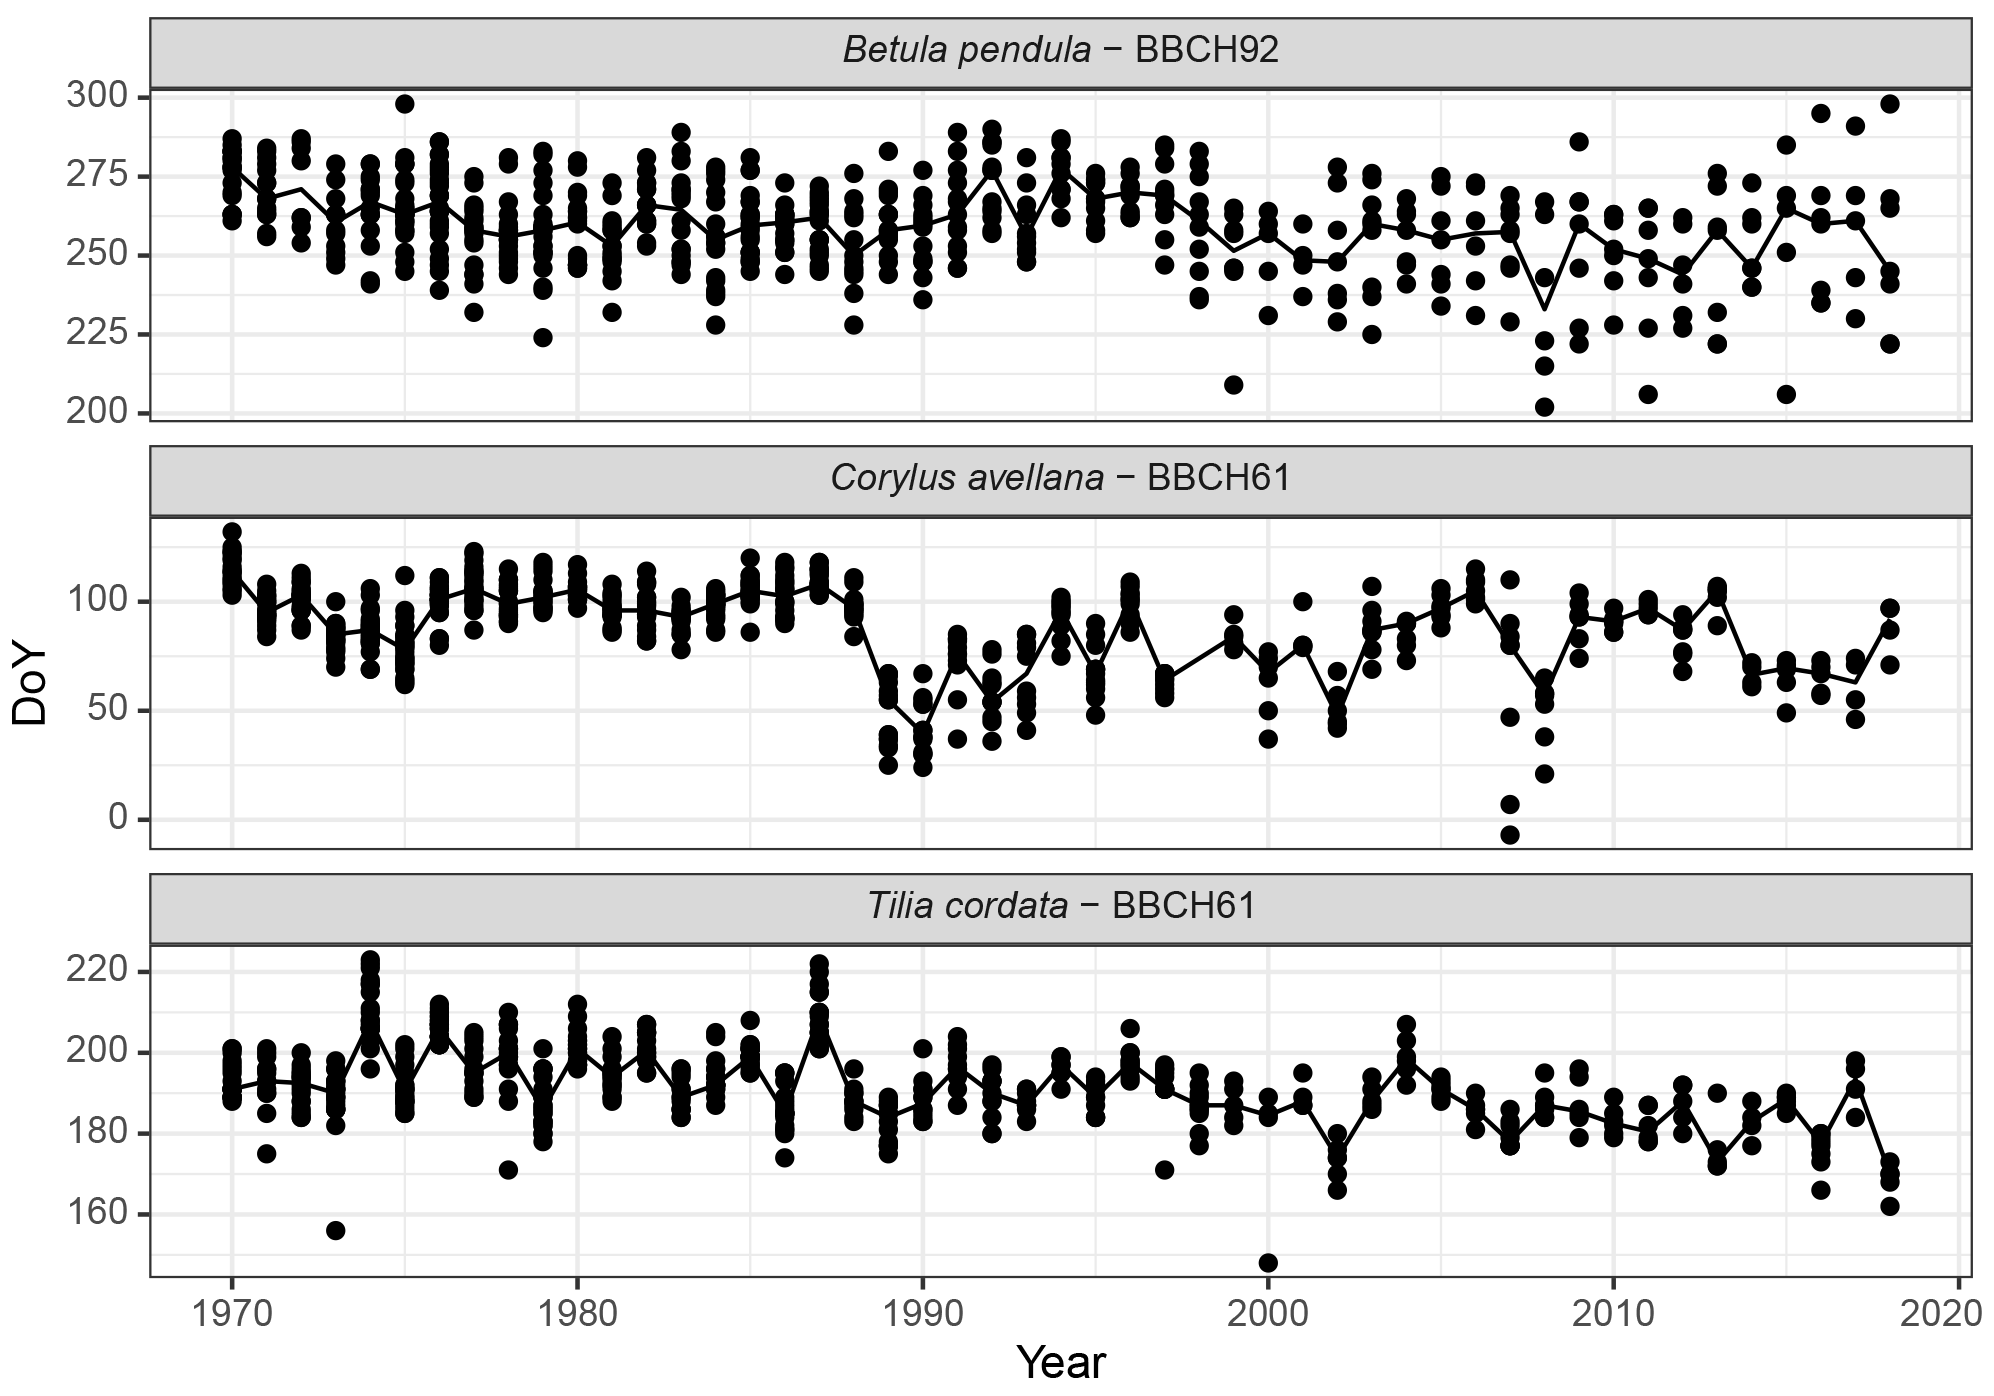
Figure 8Long-term and annual phenological changes in Latvia: examples of the beginning of the flowering of hazel (Corylus avellana, BBCH61) and linden (Tilia cordata, BBCH61) and yellowing of the leaves of silver birch (Betula pendula, BBCH92) from 1970 to 2018; all available observation data of the given phases are plotted.
Autumn phases (of both birch and other wild deciduous trees) are characterized by large annual variations in observation points. Within 1 year, yellowing can be recorded in the range of up to 2 months. Interestingly, after the year 2000, the observations become even more heterogeneous – the data demonstrate a larger deviation in the observation points. We explain this with changes in the humidity regime – in recent years, the yellowing of the leaves due to drought has become more common (also observed for linden, Tilia cordata). In general, the spring and summer phases tend to occur earlier, and the characteristics of autumn trends are less pronounced.
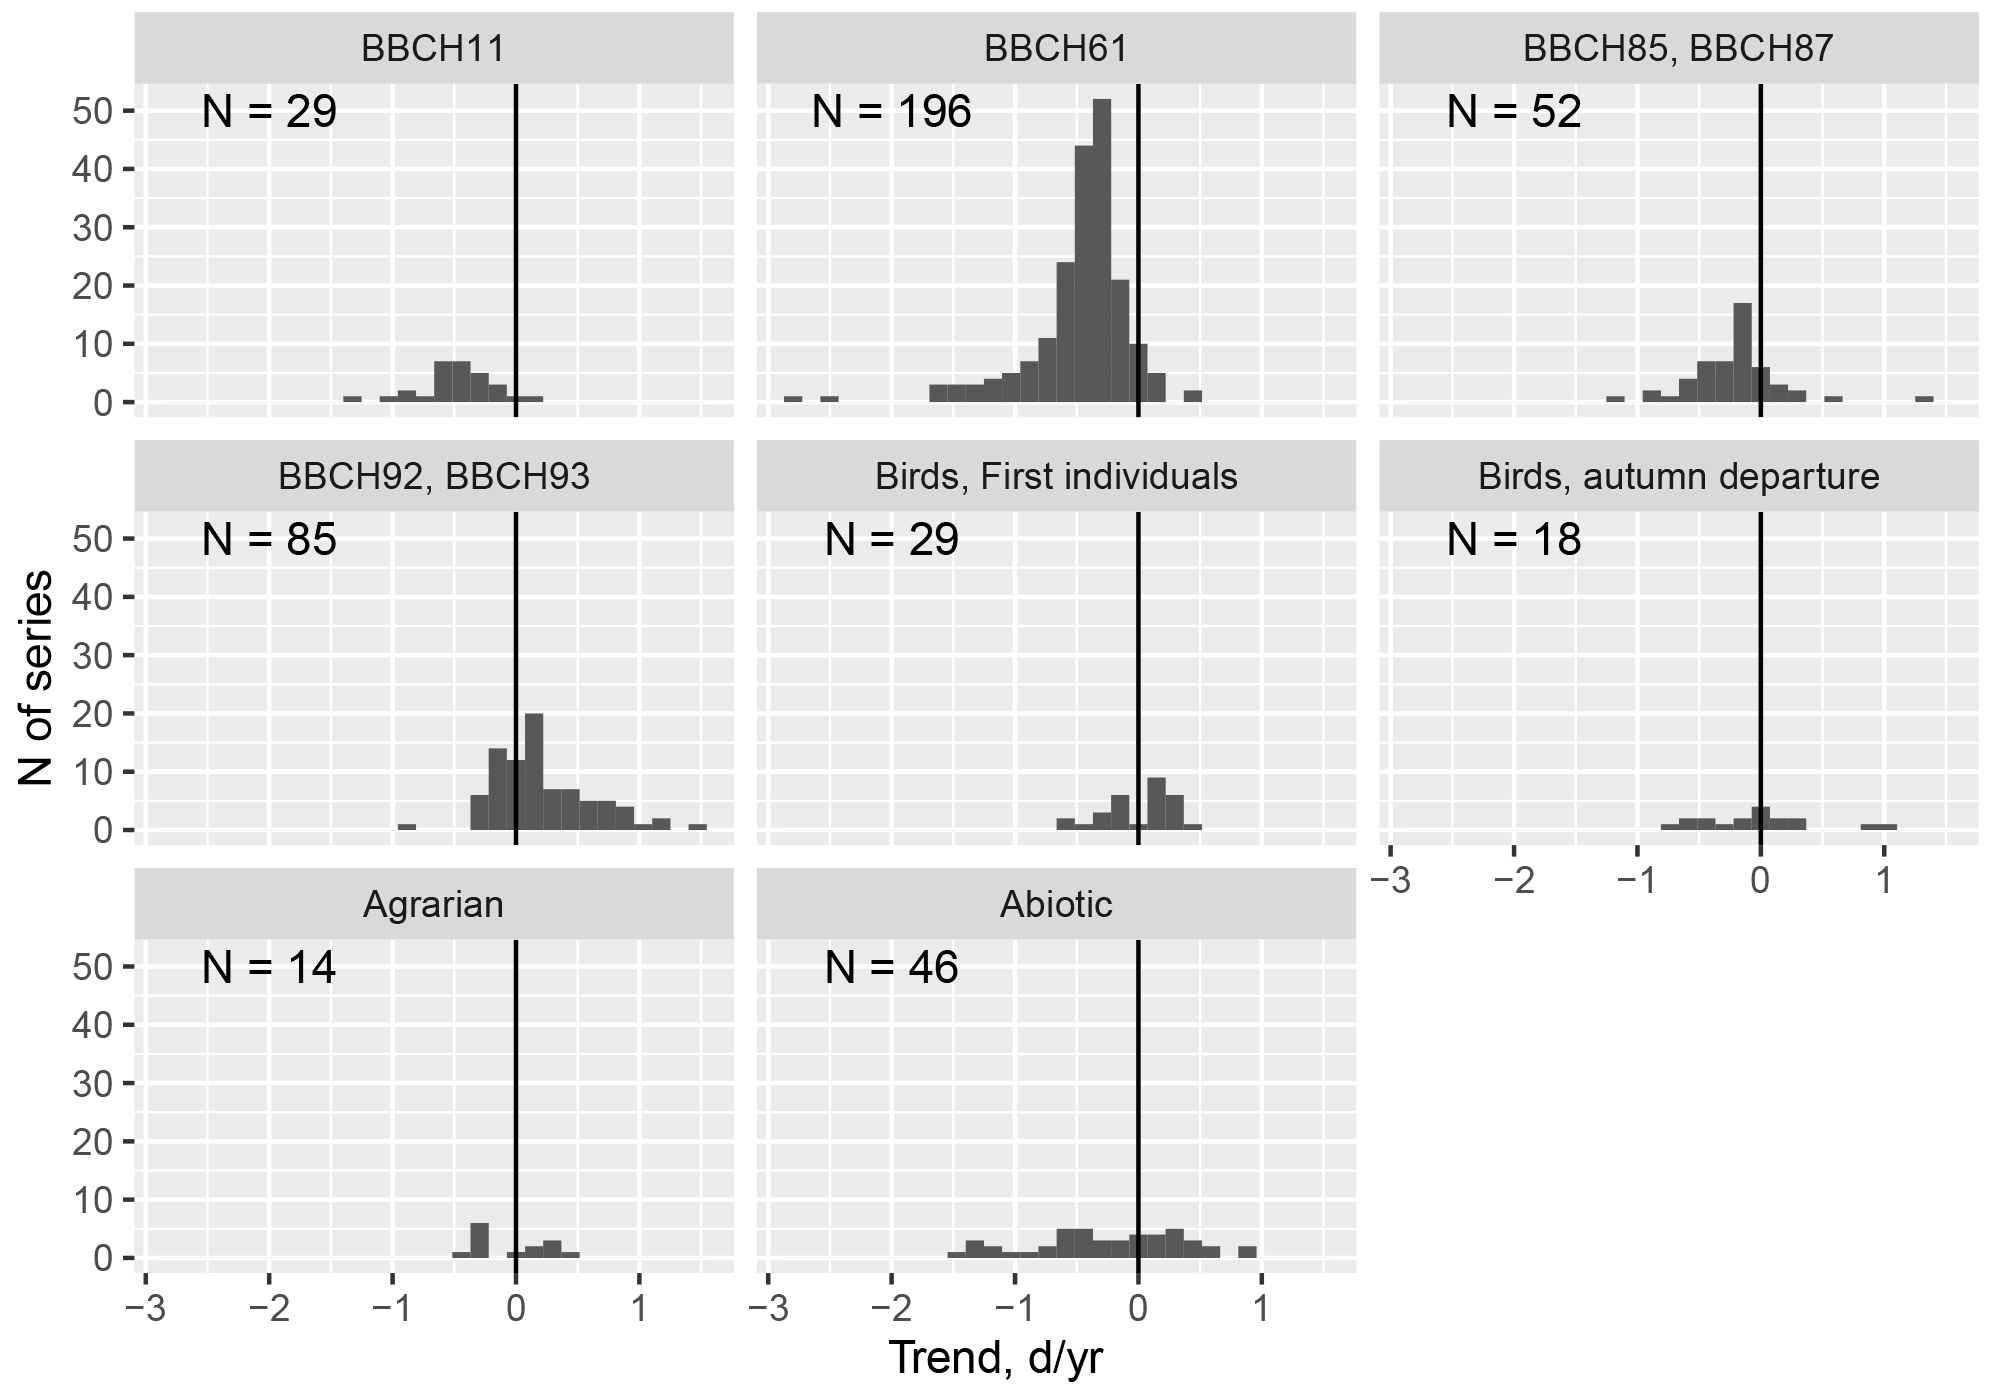
Figure 9Phenological changes in Latvia in the period from 1970 to 2018. Phenological phases are grouped into taxonomic groups: separately distinguishing developmental phases of plants such as leaf unfolding, flowering, ripening, and leaf colouring. N is the number of observation series used. Data series – data from one observation station with at least four single-phase observations before 1987 and four after 1992.
Phenological observations are mentioned in the scientific literature as bioclimatic indicators of climate change, indicating significant phenological changes in all regions of the world. The evaluations of our data also coincide with those mentioned in the literature. By grouping the phenological data according to taxonomic groups and by separating the leaf unfolding, flowering, maturation, and leaf colouring of the plant phases, it can be seen in the created histograms that significant seasonal changes have taken place in the landscape of Latvia (Fig. 9).
The largest changes have been recorded for the unfolding (BBCH11) and flowering (BBCH61) phase of plants – almost 90 % of the data included in the database demonstrate a negative trend. The ripening (BBCH83-87) phase also has a negative trend – most crops and wild plants ripen earlier. The onset of the autumn phase as the leaves change colour (BBCH92) and fall (BBCH93) shows a later trend with changes at the regional and interspecies level. For example, on average Norway maple (Acer platanoides) and aspen (Populus tremula) tend to colour later, while linden and birch colour earlier. Bird migration trends are ambiguous: some bird species return earlier and some later. In the autumn migration, for example, on average the white stork leaves earlier, while geese migrate later (Kalvāne and Kalvāns, 2021).
Interestingly, the phase BBCH93 – the beginning of leaf-fall – rather frequently occurs before phase BBCH92 – the start of leaf senescence – for tree species such as birch, cherry, apple trees, aspen, and maple. There are 30 such cases. However empirical observations indicate that such a situation is possible – first leaves can fall while green. It should be noted that such cases have been recorded in the last decade, which may indicate a change in influencing factors; for example, the risk of drought has increased during recent years. Therefore, the sequence of the phases BBCH92 and BBCH93 is not universal and was excluded from Test 3 (Sect. 2.2).
For the abiotic phenomena, the greatest changes have been recorded for the first thunder; snowmelt, which occurs significantly earlier; and autumn frosts and first snow, which occur later. Changes in agrarian activities have been observed in those taking place in autumn, such as field ploughing and winter sowing, which on average, are presently carried out later than was the case in the middle of the 20th century, indicating an extension of the season of fieldwork. In general, significant seasonal changes have taken place across the Latvian landscape.
The data presented and described in this paper are freely available to all interested at https://zenodo.org (https://doi.org/10.5281/zenodo.3982086, Kalvāne et al., 2020).
We have presented the historical and phenological data of volunteer observers in Latvia for a period of almost 50 years as an open data set. Data can primarily be used to describe the seasonal events of the temporal biome and to analyse influencing factors.
It should be noted that the role of phenological observations is growing. As provided in the example publications, the application types vary; for example, they provide a good characterization of the seasonality of the landscape and of chronology (Fig. 7), or change of chronology due to environmental changes (for example, the trophic mismatch between pollinators and plant flowering, which has been extensively described; Hegland et al., 2009). Seasonality changes can also be observed in the landscape of Latvia, especially in the early spring phases (Fig. 8).
Phenological data allow for the analysis of long-term and annual fluctuations (Fig. 8), which in combination with meteorological studies create a comprehensive climatic characterization of the territory, which has also long been a priority for phenologists in Latvia (Sect. 3.1). Phenology studies play an important role in the research of climate change, because phenological data are used as bioindicators to identify changes on regional and global scales. Satellite data are used on global modelling scales, in the calibration of which, phenological data, as the ground truth, play an invaluable role. The greater the number of open data on ground truth observations available for validation, the higher the quality of the satellite imagery product. In turn, modelling is important for the development of agricultural and forestry adaptation strategies. Future projections are based on the assessment of complex factors and phenological parameters, and the inclusion of influencing factors provides a more comprehensive and complete assessment important for third parties such as insurance companies and decision-making bodies.
This database is unique as it covers not only phytophenological data but also other taxonomic groups, as well as abiotic and agricultural phenomena. The latter have major potential applications in the Earth sciences, as well as in the social sciences.
GK was responsible for the study's conceptualization, investigation, and supervision and prepared the manuscript with contributions from all co-authors. AK designed the methodology part as well as prepared the phenological data for the database and undertook statistical analyses, programming, and visualization. AĢ undertook data curation and validation by using CRediT contributor role taxonomy.
The authors declare that they have no conflict of interest.
Publisher's note: Copernicus Publications remains neutral with regard to jurisdictional claims in published maps and institutional affiliations.
Thanks are due to Ivonna Tokere for the digitization of the historical data and to all volunteers – citizen scientists – for data collection through the decades.
This research has been supported by the ERDF postdoctoral grants (grant nos. 1.1.1.2/VIAA/2/18/265 and 1.1.1.2/VIAA/3/19/524).
This paper was edited by Dirk Fleischer and reviewed by José Antonio Oteros Moreno and Dirk Fleischer.
Ahas, R.: Phenological observations in Estonia, in: The history and current status of plant phenology in Europe, edited by: Nekovář, J., COST office, Brussels, Belgium, 64–68, 2008.
Apsīte, E., Rudlapa, I., I. L., and Elferts, D.: Changes in Latvian river discharge regime at the turn of the century, Hydrol. Res., 44, 554–569, https://doi.org/10.2166/nh.2012.007, 2013.
Avotniece, Z., Aòiskeviˇca, S., and Maïinovskis, E.: Klimatapārmaiņu scenāriji Latvijai, Climate change scenarios in Latvia, VSIA “Latvijas Vides, ģeoloģijas un meteoroloģijas centrs”, Riga, Latvia, 2017.
Dierenbach, J., Badeck, F. W., and Schaber, J.: The plant phenological online database (PPODB): An online database for long-term phenological data, Int. J. Biometeorol., 57, 805–812, https://doi.org/10.1007/s00484-013-0650-2, 2013.
Forrest, J. and Miller-Rushing, A. J.: Toward a synthetic understanding of the role of phenology in ecology and evolution, Philos. Trans. R. Soc. B Biol. Sci., 365, 3101–3112, https://doi.org/10.1098/rstb.2010.0145, 2010.
Grišule, G. and Briede, A.: The history and curent status of phenological recording in Latvia, in: The history and current status of plant phenology in Europe, edited by: Nekovář, J., COST office, Brussels, Belgium, 101–105, 2008.
Hegland, S. J., Nielsen, A., Lázaro, A., Bjerknes, A. L., and Totland, Ø.: How does climate warming affect plant-pollinator interactions?, Ecol. Lett., 12, 184–195, https://doi.org/10.1111/j.1461-0248.2008.01269.x, 2009.
Jaagus, J., Sepp, M., Tamm, T., Järvet, A., and Mõisja, K.: Trends and regime shifts in climatic conditions and river runoff in Estonia during 1951–2015, Earth Syst. Dynam., 8, 963–976, https://doi.org/10.5194/esd-8-963-2017, 2017.
Jansons, E.: Augu fenoloģiskie novērojumi Latvijā 1927, Latvijas Uinersitātes Meteoroloģijas Insitūts, Riga, Latvia, 1929.
Jessens, A.: Dabas parahdibas gadskahrtu maiņās: skolām un paschisglihtibai, Latvijas Uinersitātes Meteoroloģijas Insitūts, Riga, Latvia, 1920.
Jochner, S. and Menzel, A.: Does flower phenology mirror the slowdown of global warming?, Ecol. Evol., 5, 2284–2295, https://doi.org/10.1002/ece3.1503, 2015.
Kalvāne, G.: Phenological changes and their influencing factors (in Latvian, Fenoloǵiskās izmaiòas un ietekmējošie faktori), Latvijas Universitātes Akadēmiskais apgāds, Rīga, Latvia, 2011.
Kalvāne, G. and Kalvāns, A.: Phenological trends of multi-taxonomic groups in Latvia, 1970–2018, Int. J. Biometeorol., 65, 895–904, https://doi.org/10.1007/s00484-020-02068-8, 2021.
Kalvane, G., Romanovskaja, D., Briede, A., and Bakšiene, E.: Influence of climate change on phenological phases in Latvia and Lithuania, Clim. Res., 39, 209–219, https://doi.org/10.3354/cr00813, 2009.
Kalvāne, G., Kalvāns, A., and Ģērmanis, A.: A phenology data set of plants and birds and other taxonomic groups, as well as agrarian activities and abiotic phenomena from Latvia, 1970–2018, Zenodo [data set], https://doi.org/10.5281/zenodo.3982086, 2020.
Kalvāns, A., Bitāne, M., and Kalvāne, G.: Forecasting plant phenology: evaluating the phenological models for Betula pendula and Padus racemosa spring phases, Latvia, Int. J. Biometeorol., 59, 165–179, https://doi.org/10.1007/s00484-014-0833-5, 2015.
Kolářová, E., Nekovář, J., and Adamík, P.: Long-term temporal changes in central European tree phenology (1946–2010) confirm the recent extension of growing seasons, Int. J. Biometeorol., 58, 1739–1748, https://doi.org/10.1007/s00484-013-0779-z, 2014.
Labbé, T., Pfister, C., Brönnimann, S., Rousseau, D., Franke, J., and Bois, B.: The longest homogeneous series of grape harvest dates, Beaune 1354–2018, and its significance for the understanding of past and present climate, Clim. Past, 15, 1485–1501, https://doi.org/10.5194/cp-15-1485-2019, 2019.
Meier, U., Bleiholder, H., Weber, E., Feller, C., Hess, M., Wicke, H., Meier, U., van den Boom, T., Lancashire, P. D., Buhr, L., Hack, H., Klose, R., and Stauss, R.: Growth stages of mono-and dicotyledonous plants, BBCH Monograph, 2nd edn., edited by: Meier, U., Federal Biological Research Centre for Agriculture and Forestry, Berlin and Braunschweig, Germany, 2001.
Menzel, A., Yuan, Y., Matiu, M., Sparks, T., Scheifinger, H., Gehrig, R., and Estrella, N.: Climate change fingerprints in recent European plant phenology, Glob. Chang. Biol., 26, 2599–2612, https://doi.org/10.1111/gcb.15000, 2020.
Nagai, S., Akitsu, T., Saitoh, T. M., Busey, R. C., Fukuzawa, K., Honda, Y., Ichie, T., Ide, R., Ikawa, H., Iwasaki, A., Iwao, K., Kajiwara, K., Kang, S., Kim, Y., Khoon, K. L., Kononov, A. V., Kosugi, Y., Maeda, T., Mamiya, W., Matsuoka, M., Maximov, T. C., Menzel, A., Miura, T., Mizunuma, T., Morozumi, T., Motohka, T., Muraoka, H., Nagano, H., Nakai, T., Nakaji, T., Oguma, H., Ohta, T., Ono, K., Pungga, R. A. S., Petrov, R. E., Sakai, R., Schunk, C., Sekikawa, S., Shakhmatov, R., Son, Y., Sugimoto, A., Suzuki, R., Takagi, K., Takanashi, S., Tei, S., Tsuchida, S., Yamamoto, H., Yamasaki, E., Yamashita, M., Yoon, T. K., Yoshida, T., Yoshimura, M., Yoshitake, S., Wilkinson, M., Wingate, L., and Nasahara, K. N.: 8 million phenological and sky images from 29 ecosystems from the Arctic to the tropics: the Phenological Eyes Network, Ecol. Res., 33, 1091–1092, https://doi.org/10.1007/s11284-018-1633-x, 2018.
Naturforscher-Vereins zu Riga: Korrespondenzblatt des Naturforscher-Vereins zu Riga, Gedruckt bei Wilhelm Ferdinand Häcker, Riga, Latvia, 1867.
Ovaskainen, O., Skorokhodova, S., Yakovleva, M., Sukhov, A., Kutenkov, A., Kutenkova, N., Shcherbakov, A., Meyke, E., and Del Mar Delgado, M.: Community-level phenological response to climate change, Proc. Natl. Acad. Sci. USA, 110, 13434–13439, https://doi.org/10.1073/pnas.1305533110, 2013.
Peñuelas, J., Rutishauser, T., and Filella, I.: Phenology feedbacks on climate change, Science, 324, 887–888, https://doi.org/10.1126/science.1173004, 2009.
Priedniece, I.: DABASDATI.LV ziòojumu apkopojums: 2020. gada janvāris-marts, available at: https://dabasdati.lv/lv/article/dabasdatilv-zinojumu-apkopojums-2020-gada-janvaris-marts (last access: 26 July 2021), 2020.
R Core Team: R: A language and environment for statistical computing, R Foundation for Statistical Computing, Vienna, Austria, available at: https://www.r-project.org/ (last access: 19 September 2021), 2019.
Romanovskaja, D. and Baksiene, E.: Phenological investigations in Lithuania, in: The history and current status of plant phenology in Europe, edited by: Nekovář, J., COST office, Brussels, Belgium, 105–110, 2008.
Rutishauser, T., Jeanneret, F., Brügger, R., Brugnara, Y., Röthlisberger, C., Bernasconi, A., Bangerter, P., Portenier, C., Villiger, L., Lehmann, D., Meyer, L., Messerli, B., and Brönnimann, S.: The BernClim plant phenological data set from the canton of Bern (Switzerland) 1970–2018, Earth Syst. Sci. Data, 11, 1645–1654, https://doi.org/10.5194/essd-11-1645-2019, 2019.
Schleip, C., Rutishauser, T., Luterbacher, J., and Menzel, A.: Time series modeling and central European temperature impact assessment of phenological records over the last 250 years, J. Geophys. Res.-Biogeo., 113, 1–13, https://doi.org/10.1029/2007JG000646, 2008.
Siljamo, P., Sofiev, M., Ranta, H., Linkosalo, T., Kubin, E., Ahas, R., Genikhovich, E., Jatczak, K., Jato, V., Nekovář, J., Minin, A., Severova, E., and Shalaboda, V.: Representativeness of point-wise phenological Betula data collected in different parts of Europe, Glob. Ecol. Biogeogr., 17, 489–502, https://doi.org/10.1111/j.1466-8238.2008.00383.x, 2008.
Sproǵe, E.: Bioklimatiskās sezonas Latvijā, Dabas un vēstures Kal., Zinātne, Riga, Latvia, 67–71, 1979.
Templ, B., Koch, E., Bolmgren, K., Ungersböck, M., Paul, A., Scheifinger, H., Rutishauser, T., Busto, M., Chmielewski, F. M., Hájková, L., Hodzić, S., Kaspar, F., Pietragalla, B., Romero-Fresneda, R., Tolvanen, A., Vučetič, V., Zimmermann, K., and Zust, A.: Pan European Phenological database (PEP725): a single point of access for European data, Int. J. Biometeorol., 62, 1109–1113, https://doi.org/10.1007/s00484-018-1512-8, 2018.
Walther, G. R., Post, E., Convey, P., Menzel, A., Parmesan, C., Beebee, T. J. C., Fromentin, J. M., Hoegh-Guldberg, O., and Bairlein, F.: Ecological responses to recent climate change, Nature, 416, 389–395, https://doi.org/10.1038/416389a, 2002.
Wu, X., Zurita-Milla, R., and Kraak, M. J.: A novel analysis of spring phenological patterns over Europe based on co-clustering, J. Geophys. Res.-Biogeo, 121, 1434–1448, https://doi.org/10.1002/2015JG003308, 2016.
Zirnītis, A.: Daži pētījumi par Latvijas PSR bioklimatu, Latv. Valsts Univ. zinātniskie raksti, Ģeogrāfijas zinātnes, 1, Latvijas Valsts Universitāte, Riga, Latvia, 71–92, 1956.