the Creative Commons Attribution 4.0 License.
the Creative Commons Attribution 4.0 License.
 | 13 Aug 2021
Inter-annual variation in lake ice composition in the European Arctic: observations based on high-resolution thermistor strings
Yubing Cheng
Timo Vihma
Anna Kontu
Fei Zheng
Juha Lemmetyinen
Yubao Qiu
Jouni Pulliainen
Climate change and global warming strongly impact the cryosphere. The rise of air temperature and change of precipitation patterns lead to dramatic responses of snow and ice heat and mass balance. Sustainable field observations on lake air–snow–ice–water temperature regime have been carried out in Lake Orajärvi in the vicinity of the Finnish Space Centre, a Flagship Supersite in Sodankylä in Finnish Lapland since 2009. A thermistor-string-based snow and ice mass balance buoy called “Snow and ice mass balance apparatus (SIMBA)” was deployed in the lake at the beginning of each ice season. In this paper, we describe snow and ice temperature regimes, snow depth, ice thickness, and ice compositions retrieved from SIMBA observations as well as meteorological variables based on high-quality observations at the Finnish Space Centre. Ice thickness in Lake Orajärvi showed an increasing trend. During the decade of data collection (1) the November–May mean air temperature had an increasing trend of 0.16 ∘C per year, and the interannual variations were highly correlated (r = 0.93) with the total seasonal accumulated precipitation; (2) the maximum granular ice thickness ranged from 15 % to 80 % of the maximum total ice thickness; and (3) the snow depth on lake ice was not correlated (r = 0.21) with the total precipitation. The data set can be applied to investigate the lake ice surface heat balance and the role of snow in lake ice mass balance and to improve the parameterization of snow to ice transformation in snow and ice models. The data are archived at https://doi.org/10.5281/zenodo.4559368 (Cheng et al., 2021).
- Article
(13958 KB) - Full-text XML
- BibTeX
- EndNote


The rapid climate warming in the Arctic (Box et al., 2019; Przybylak and Wyszyński, 2020) has also affected lakes, in particular lake surface temperatures and lake ice phenology (Woolway et al., 2019). In the Northern Hemisphere, the lake ice season has become shorter and lake ice has become thinner, and these trends are projected to continue throughout the 21st century (Sharma et al., 2019). Lakes are important in the Earth system, as they can adjust local climate (Brown and Duguay, 2010) and affect the environment through interactions among physical, hydrological, biological, and chemical processes (Leppäranta, 2010).
Observations on snow depth and lake ice thickness are needed for (a) monitoring of climate variability and trends (Filazzola et al., 2020); (b) practical applications, such as use of lake ice for winter fishing, transport, and recreational activities (Leppäranta, 2015); and (c) to provide initial conditions for operational forecasting (Anderson et al., 2018). Snow depth and lake ice thickness can be measured manually. For example, in Finland, lake ice thickness is measured via manual drilling in a single location in 45 lakes with 10 d intervals throughout the ice season. However, this requires a lot of manpower and accordingly does not allow collection of time series with a better spatial and temporal resolution. During recent decades, the number of manual observations has strongly declined in many countries (Duguay et al., 2006). Satellite remote sensing yields information on lake ice cover (Wu et al., 2021) and snow and ice surface temperature (Cheng et al., 2014) with a sufficiently high spatial and temporal resolution. Kang et al. (2014) introduced a method to derive lake ice thickness from coarse-resolution (∼ 10 km) passive microwave data over large lakes in Canada. However, the transferability of the method to sub-pixel-scale lakes has not been investigated. Synthetic aperture radar (SAR) polarimetry has shown some promise in retrieving ice depth over rivers (Mermoz et al., 2013); as fully polarimetric data are not widely available from existing SAR sensors to date, extensive testing and application of the method for lakes are currently lacking.
The SIMBA data set is potentially highly relevant for the development of land applications for planned and existing passive microwave satellite sensors, such as the Copernicus Imaging Microwave Radiometer (CIMR), new Metop multichannel radiometer sensors of EUMETSAT, ESA SMOS, NASA SMAP, and Chinese sensors. Due to the inherent coarse resolution of these sensors (tens of kilometres), a key issue is to acquire combined simultaneous data representing various processes in lakes, in addition to surrounding land areas. As such, SIMBA forms an integral part of the FMI sensor network in Sodankylä.
Thermistor-string-based snow and ice mass balance apparatus (SIMBAs) have been applied for more than a decade to measure snow depth, ice thickness, and temperature profile from air through snow and ice to water (Jackson et al., 2013). Most SIMBAs have so far been deployed in polar sea ice (Lei et al., 2018), but lake ice has also been studied (Cheng et al., 2014; Wei et al., 2016). In this paper we describe SIMBA observations from an ongoing programme that started in Lake Orajärvi in northern Finland in 2009. Supporting meteorological observations from the Finnish Meteorological Institute Arctic Research Centre (FMI-ARC) are also presented. The objectives of the SIMBA programme were
-
to evaluate the cost effectiveness of SIMBA buoys in a remote lake environment;
-
to monitor climate variability and change as reflected in snow depth as well as lake ice thickness and composition;
-
to investigate (a) atmospheric forcing on lake ice growth and melt, (b) the role of snow in lake ice mass balance via formation of superimposed ice due to refreezing of meltwater and rain and formation of snow ice due to flooding under a heavy snow load, and (c) the role of granular ice in lake ice phenology;
-
to develop better parameterizations of snow-to-ice transformation in numerical snow and ice models.
2.1 Sodankylä supersite
The SIMBA programme at Lake Orajärvi is a component of the FMI Sodankylä supersite. The Finnish Meteorological Institute's Arctic Space Centre (FMI-ARC) in Sodankylä (67.367∘ N, 26.629∘ E), Finland, is a super-observation site where various Earth observations (upper-air chemistry and physics, atmospheric column measurements, snow and soil hydrology, biosphere–atmosphere interaction) and ground truth measurements for satellite calibration–validation are carried out continuously (Fig. 1). The site is equipped with comprehensive in situ and remote sensing instrumentation placed in the forests, wetlands, and freshwater bodies, which are the main land cover types in the area. In this paper we focus on the cryospheric in situ observations of snow cover and lake ice as well as meteorological parameters.
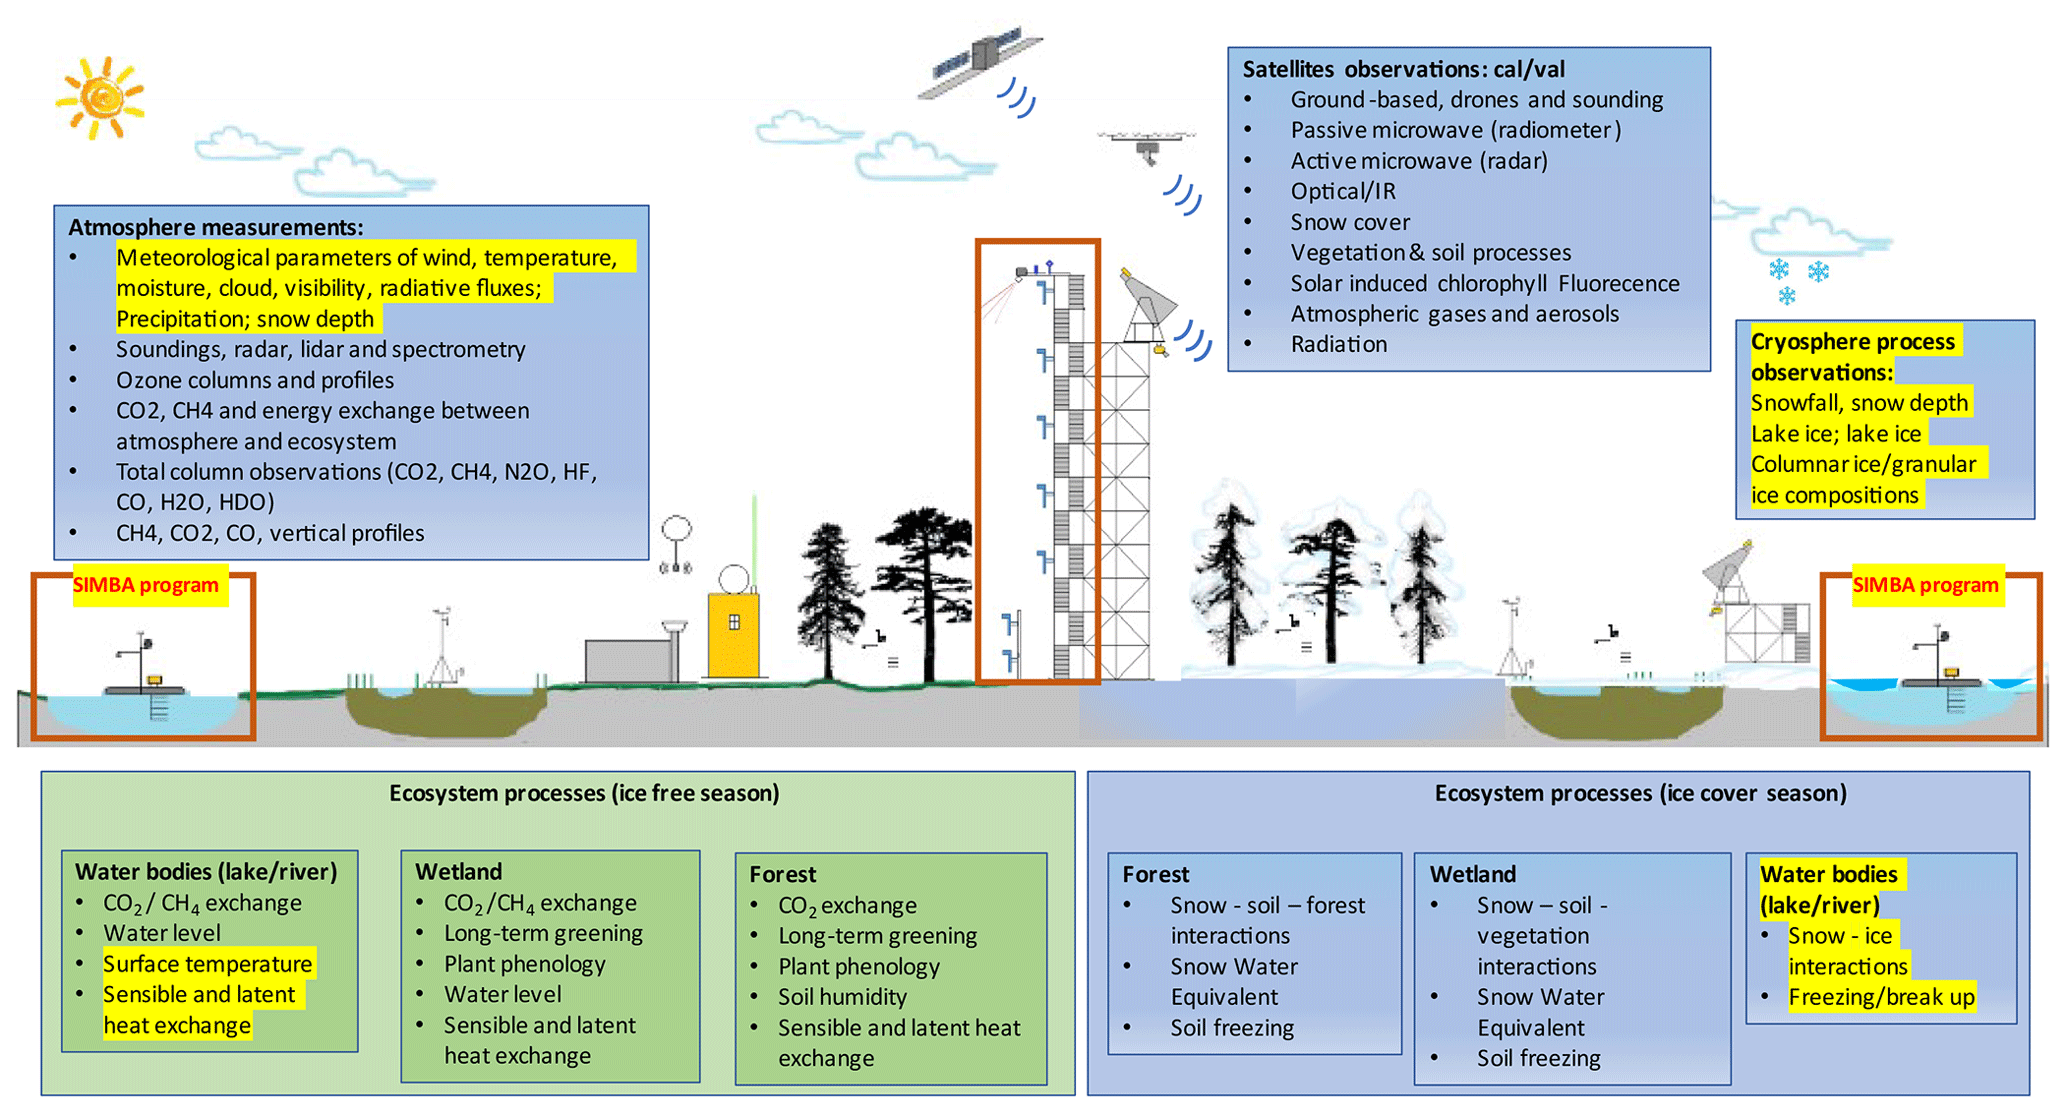
Figure 1Schematic diagram of the FMI-ARC supersite observational systems at Sodankylä. The original diagram is at https://litdb.fmi.fi/ (last access: 10 August 2021). The frames in red and text with yellow background describe the measurements addressed in this paper.
The sub-Arctic climate and the geographic location between continental and marine climate zones result in a high inter-annual, seasonal, and synoptic-scale variation in local weather conditions, enabling development of very different kinds of snowpack structures on land (Tikkanen, 2005) and snow and ice composition on lakes (Cheng et al., 2014). Lake Orajärvi is a boreal medium-sized lake located in Sodankylä municipality in eastern Lapland. The lake has a surface area of about 11 km2 with an average depth of 4.4 m and a maximum depth of 11 m close to the southern shore of the lake (Fig. 2a). The estimated water volume in the lake is 0.0485 km3, and the shore length is 28 km. The lake surface elevation is 182 m above sea level. The ice season typically starts in November and lasts until May. The first snowfall typically occurs in late October, but the snow may melt during warmer autumn days. The seasonally permanent winter snow accumulation usually starts between mid-November and early December. Snow is present on the lake ice surface every winter season.
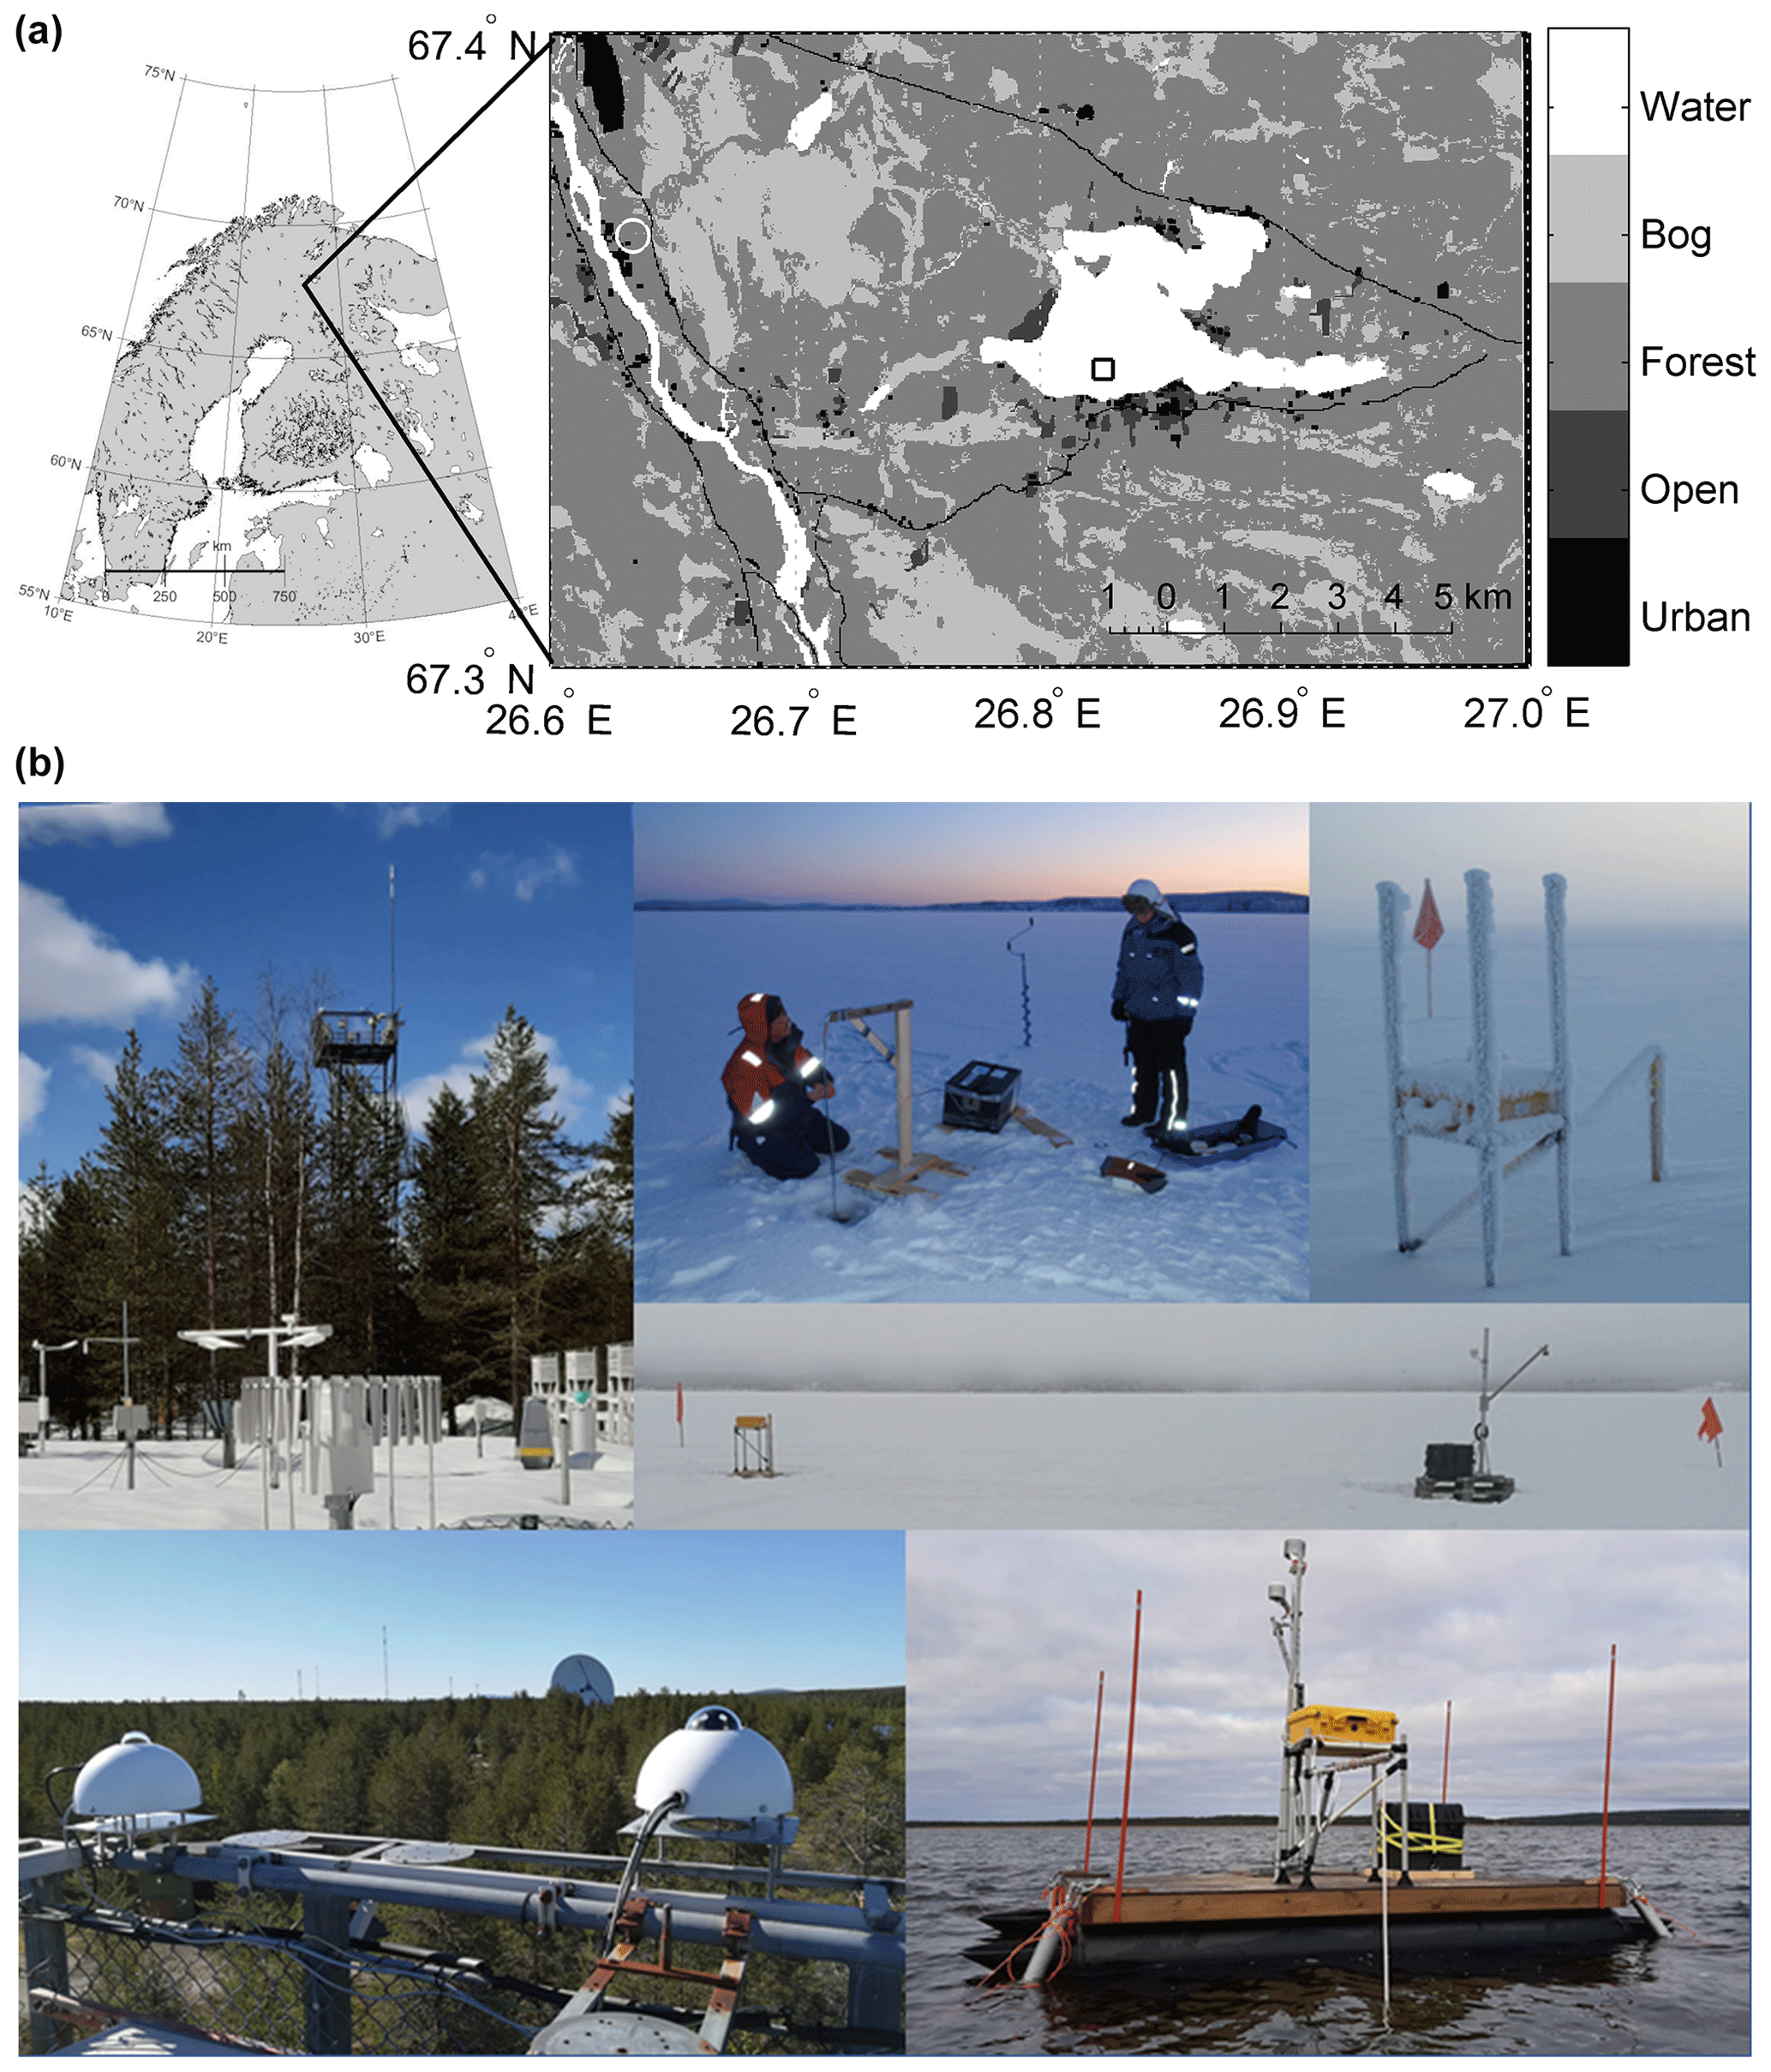
Figure 2(a) The location of Lake Orajärvi in Finnish Lapland and a map of lake Orajärvi and the local catchment, where the open black square marks the SIMBA site, and the white circle is the Finnish Space Centre. (b) Snapshots of SIMBA deployment in Lake Orajärvi and a weather station at FMI-ARC main camp. A raft was anchored in the lake in October 2019 aiming to extend the lake observations beyond the ice season.
2.2 SIMBA
2.2.1 SIMBA programme
SIMBA buoys have been deployed in Lake Orajärvi since 2009. The 2009 deployment was probably the internationally first SIMBA application for a lake study. In each winter when ice was formed in Lake Orajärvi, one SIMBA was deployed around mid-December at the same site, 67.35∘ N, 26.83∘ E, some 500 m from the shoreline. At the time of deployment, the snow depth, lake ice thickness, and ice freeboard were measured. A supporting frame made of fibreglass was constructed on lake ice, and the SIMBA main control Peli case was placed on top of it (Fig. 2b). A separate wooden pole with scale was standing vertically to hold the thermistor string. An ice borehole was drilled through the ice layer, and the thermistor string was placed in it. The scene was left as is, and then the thermistor string was frozen with surrounding water in the borehole. The SIMBA operated in the lake over the winter and most of the spring melting season. The recovery of SIMBA usually took place in late April but in some years as late as mid-May. Snow and ice conditions around the deployment site were documented and measured before dismantling the SIMBA camp. The documentation on SIMBA deployment and recovery is provided along with the SIMBA data as online files (see data availability). Table 1 summarizes the SIMBA deployment and recovery status.
Table 1SIMBA deployment and recovery days and simultaneous in situ observed snow depth (hs), total ice thickness (Hi), and ice freeboard (Hfb, defined as negative if the lake water level was above the snow–ice interface) The seasonal mean values were derived from SIMBA-ET and SIMBA-HT observations. Hgi is the granular ice and Hci is the congelation ice thickness. NA – not available. The SD is the standard deviation.
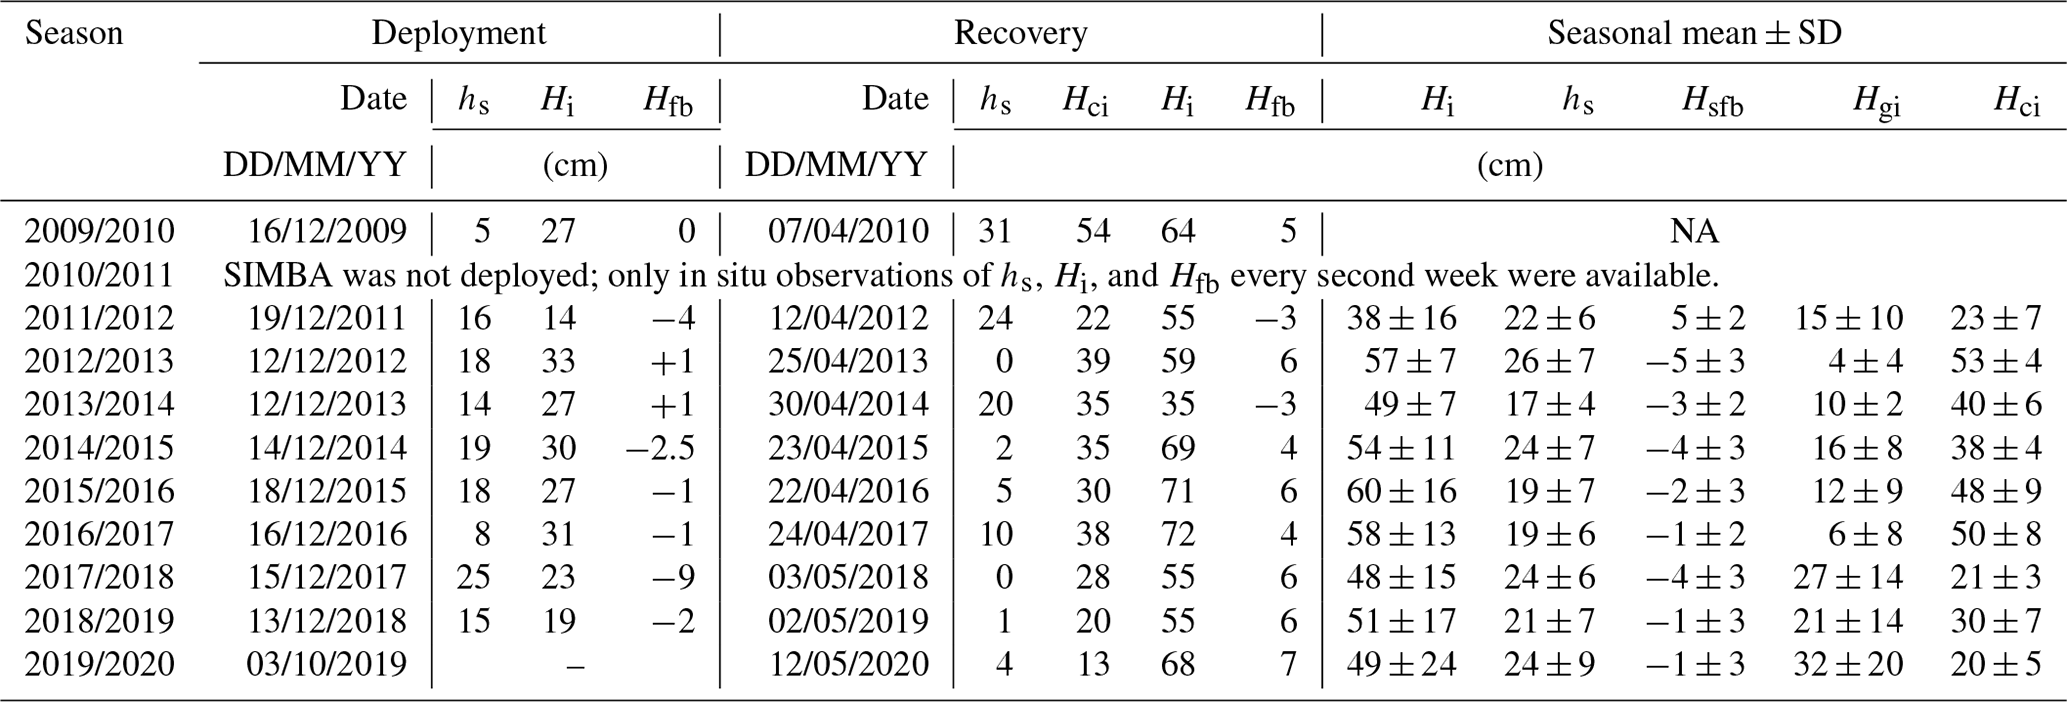
The seasonal mean values of Hi, hs, Hgi, and Hci were calculated by the SIMBA algorithm (Cheng et al., 2020). The seasonal mean value of ice freeboard (Hsfb) was calculated based on time series of snow depth (hs), granular ice thickness (Hgi), and columnar ice thickness (Hi) according to Archimedes' principle: , where ρs, ρgi, ρi, and ρw are seasonal mean densities of snow, granular ice and columnar ice, and lake water, assumed to be 320, 890 and 910, and 1000 kg/m3, respectively.
2.2.2 SIMBA buoy
SIMBA is a thermistor-string-based snow and ice mass balance apparatus. It has been developed by the Scottish Association for Marine Science (SAMS) Research Services Ltd (SRSL) in UK. SIMBA consists of a simple, robust thermistor string with 240 temperature sensors distributed evenly (2 cm intervals) along a 4.8 m long heat-shrink PVC plastic sleeve coated flat white wire. The white heat-shrink sleeve is used to minimize the possibility of solar heating of the sensors. The accuracy of the SIMBA thermistor sensor is ±0.1 ∘C, which is comparable with other types of thermistor-string-based IMBs (Richter-Menge et al., 2006). Each sensor measures the environment temperature (SIMBA-ET). The resolution of the thermistor sensor is 0.0625 ∘C; i.e. smaller changes cannot be detected even if the absolute accuracy of the sensor would allow it. In addition, the thermistor chain is equipped with heaters, i.e. resistor components mounted next to the temperature-sensing elements. A weak voltage (8 V) supply is connected to provide gentle identical heating of each sensor on the chain. The SIMBA heating cycle is usually long enough, often 60 or 90 s, for the temperature rise at the sensor to reach a steady state. Thermal conductivity determines how the heat is conducted away from the heated sensors placed in air, snow, ice, and lake water. As a result, the SIMBA-HT profiles can greatly enhance the detection of the interfaces between air, snow, ice, and water. The heating cycle is applied once per day. The SIMBA-HT is controlled to not disturb the SIMBA-ET measurements, which are typically carried out four times per day (Jackson et al., 2013). SIMBA also includes a built-in GPS to record SIMBA drift positions (for sea ice applications), a magnetometer for tilt and floe rotation, a barometer for surface air pressure, and an external sensor to measure near-surface ambient air temperature. An iridium modem is applied for data transmission. SIMBA has been used in various field campaigns targeting snow and ice mass balance in seasonal ice covers in lakes (Cheng et al., 2014) and polar oceans (Hoppmann et al., 2015; Provost et al., 2017; Lei et al., 2018, 2021). Table 1 presents a summary of SIMBA observations in Lake Orajärvi.
2.3 Weather station
Meteorological data were collected at FMI-ARC station (67.3666∘ N, 26.6290∘ E, WMO code 02836) 11 km from Lake Orajärvi. The data sets include wind speed (Va), air temperature (Ta), relative humidity (RH), cloudiness (cn), longwave (Ql) and shortwave (Qs) radiation, snow depth on land (Hs), and precipitation (Prec) (Table 2). The radiative fluxes were measured on a 10 m high tower above treetops using Kipp & Zonen CM11 pyranometers (305–2800 nm) and Kipp & Zonen CG4 pyrgeometers (4500–42 000 nm). Snow depth (Campbell Scientific SR50) and precipitation (OTT Pluvio2) at ground level were also measured. All measurements were taken once a minute and aggregated to 1 h time intervals.
3.1 SIMBA data
The main output of a SIMBA buoy is the time series of environment (SIMBA-ET) and heating (SIMBA-HT) temperature measured at different depths from the lake water through ice and snow to air.
3.1.1 SIMBA-ET
For each season, we have up to 241 time series of temperature (SIMBA-ET) at different depths. For those sensors located in the air, the temperature differences between the sensors are small, as the air in the lowermost 1.5 m layer mixes effectively and the sensors are close to each other. The temperatures inside snow reveal much larger vertical gradients because snow has a small thermal conductivity. The temperature profile in ice has a smaller vertical gradient compared to that in snow, since the thermal conductivity of ice is larger than that of snow. At the ice bottom, temperature is at the freezing point and gradually increases towards the lake bottom. Figure 3 shows an example of seasonal SIMBA-ET. One can estimate the heat fluxes within snow and ice and those at the air–snow, snow–ice, and ice–water interfaces.
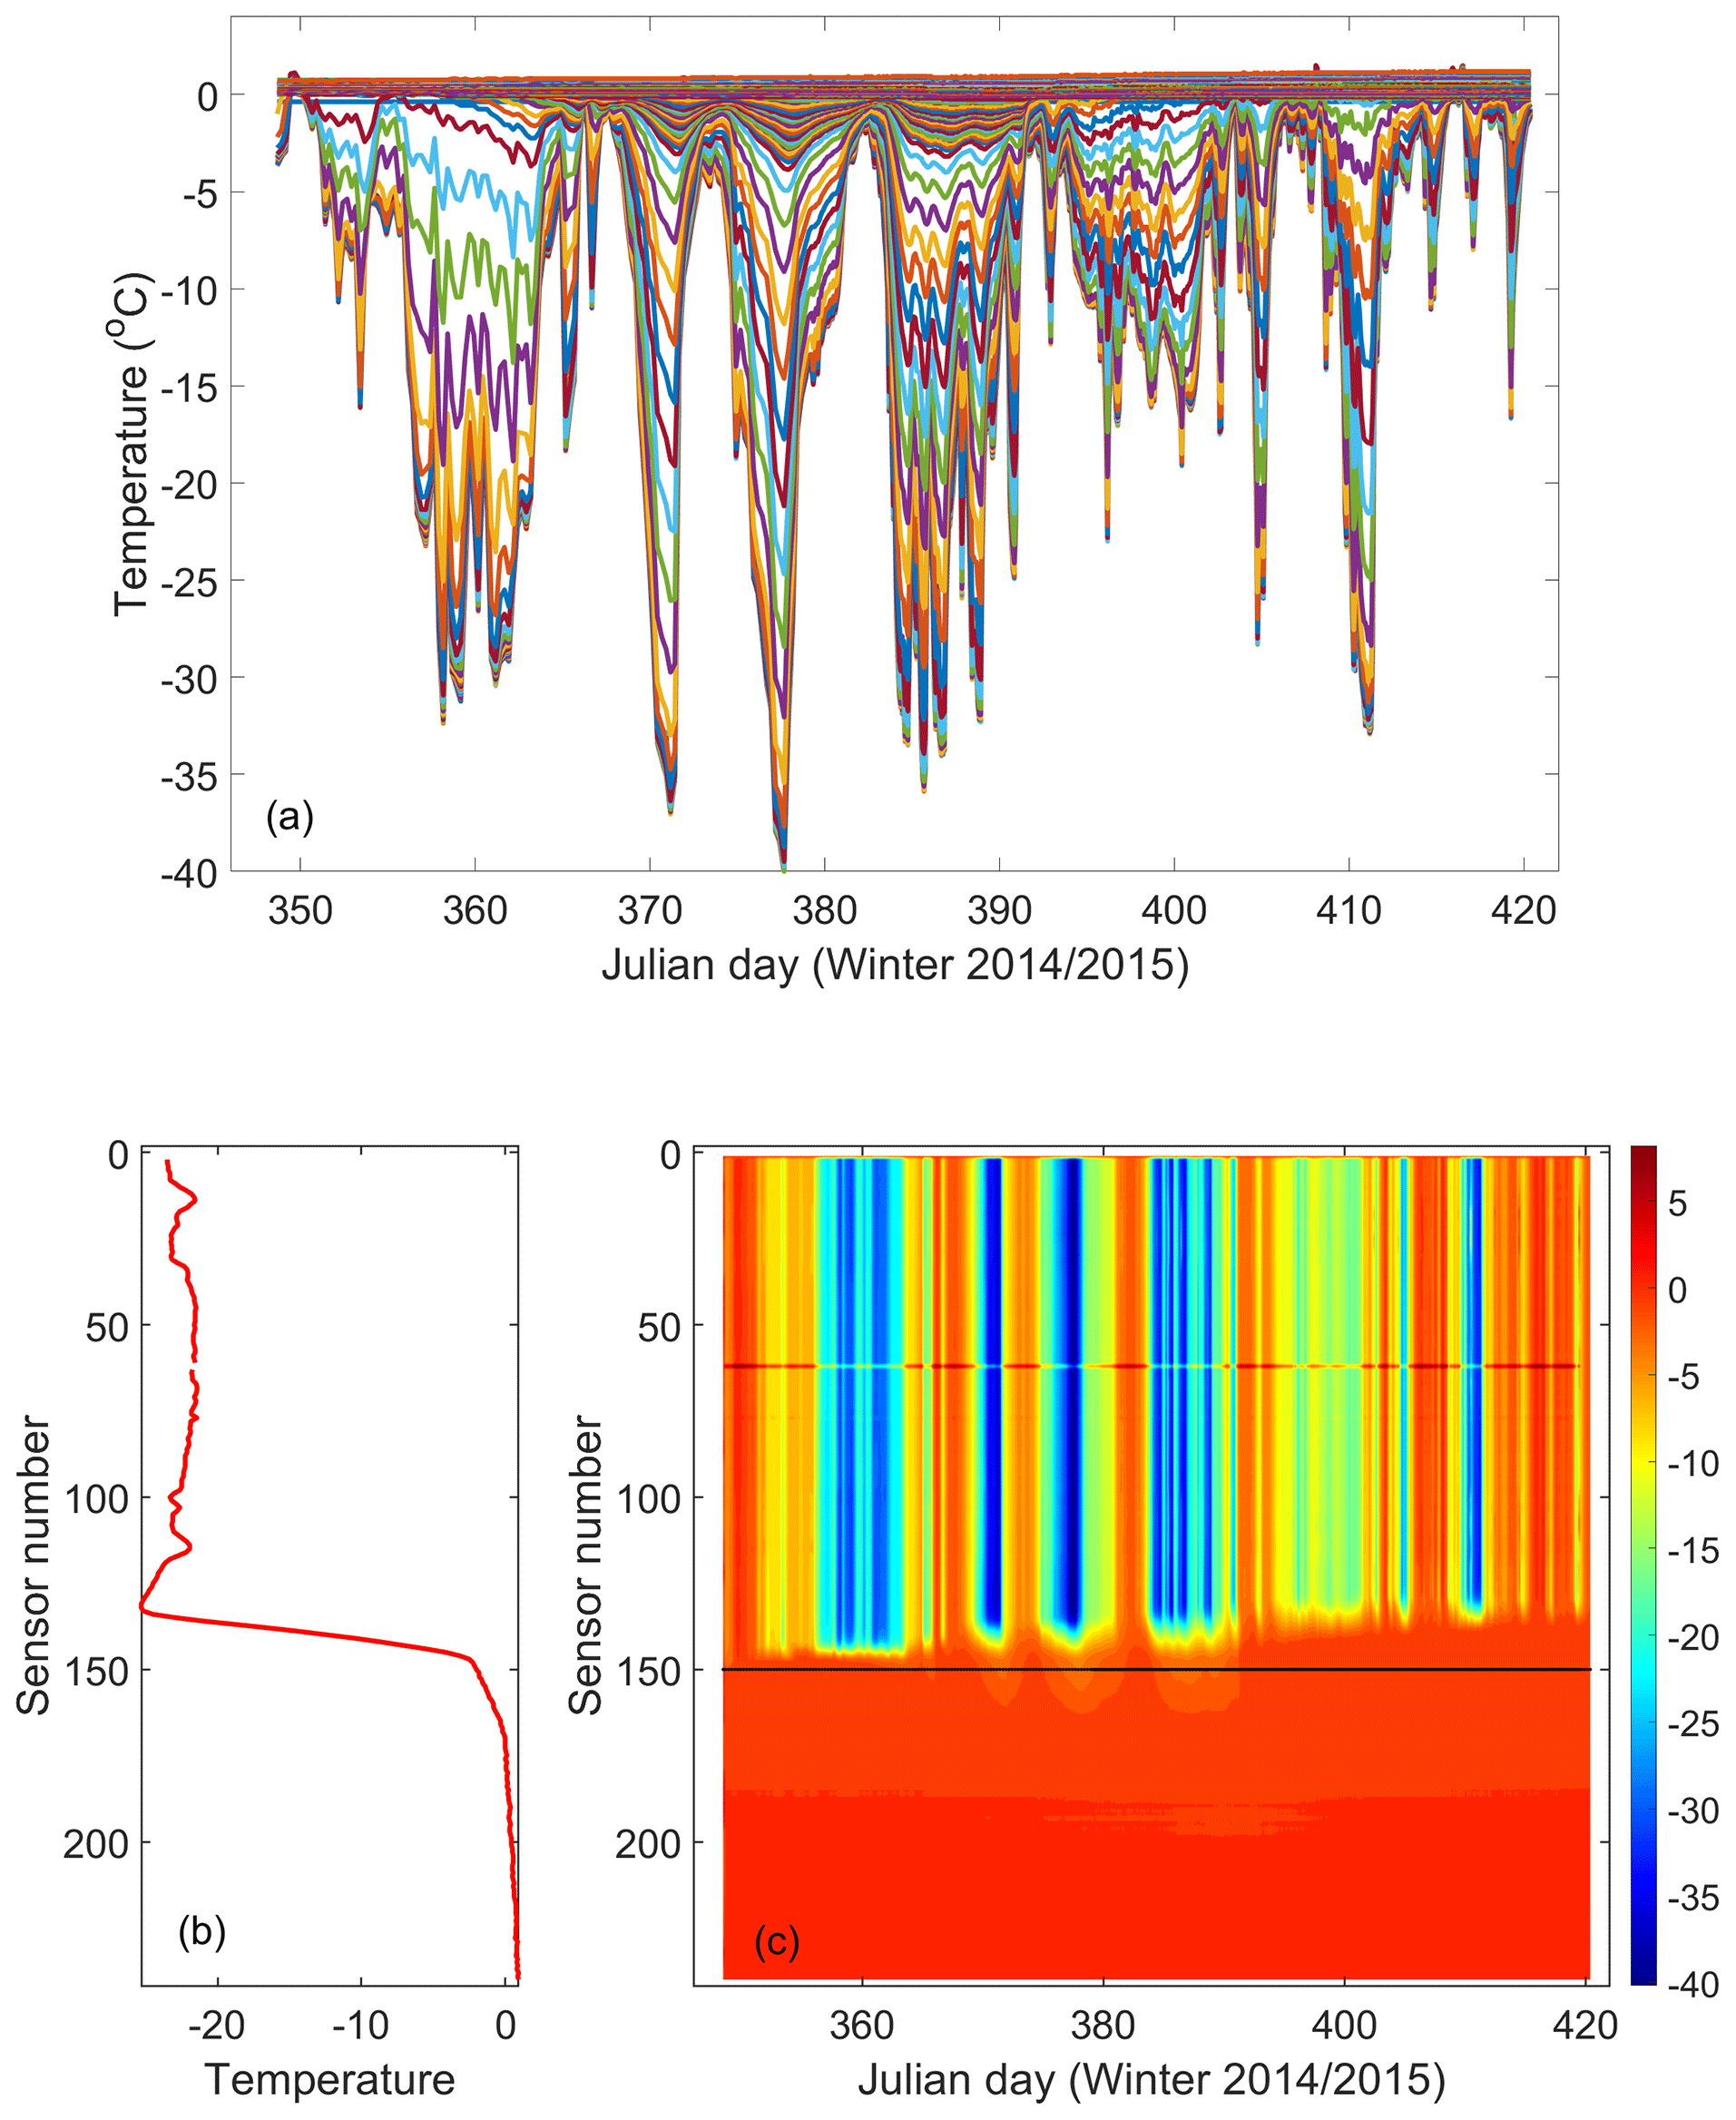
Figure 3Illustrations of SIMBA-ET data: (a) time series of SIMBA-ET during observation period; (b) one snapshot (19 January 2014 08:00 UTC) of vertical SIMBA-ET profile through air–snow–lake ice–water; (c) SIMBA-ET field observed by 240 sensors. Sensor 1 was placed in air and sensor 240 in water.
3.1.2 SIMBA-HT
SIMBA-HT shows the temperature increase in the medium when each sensor was contacted during a short heating period of 60 and 90 s. The temperature changes are largely dependent on the thermal diffusivity of the surrounding medium. Low heating power ensures that the increasing temperature will not be too high to melt snow and ice in contact with the sensor and guarantee a fast restoration of environment temperature around the sensor before the next SIMBA-ET observation and above all to minimize SIMBA power consumption. One example of SIMBA-HT is given in Fig. 4.
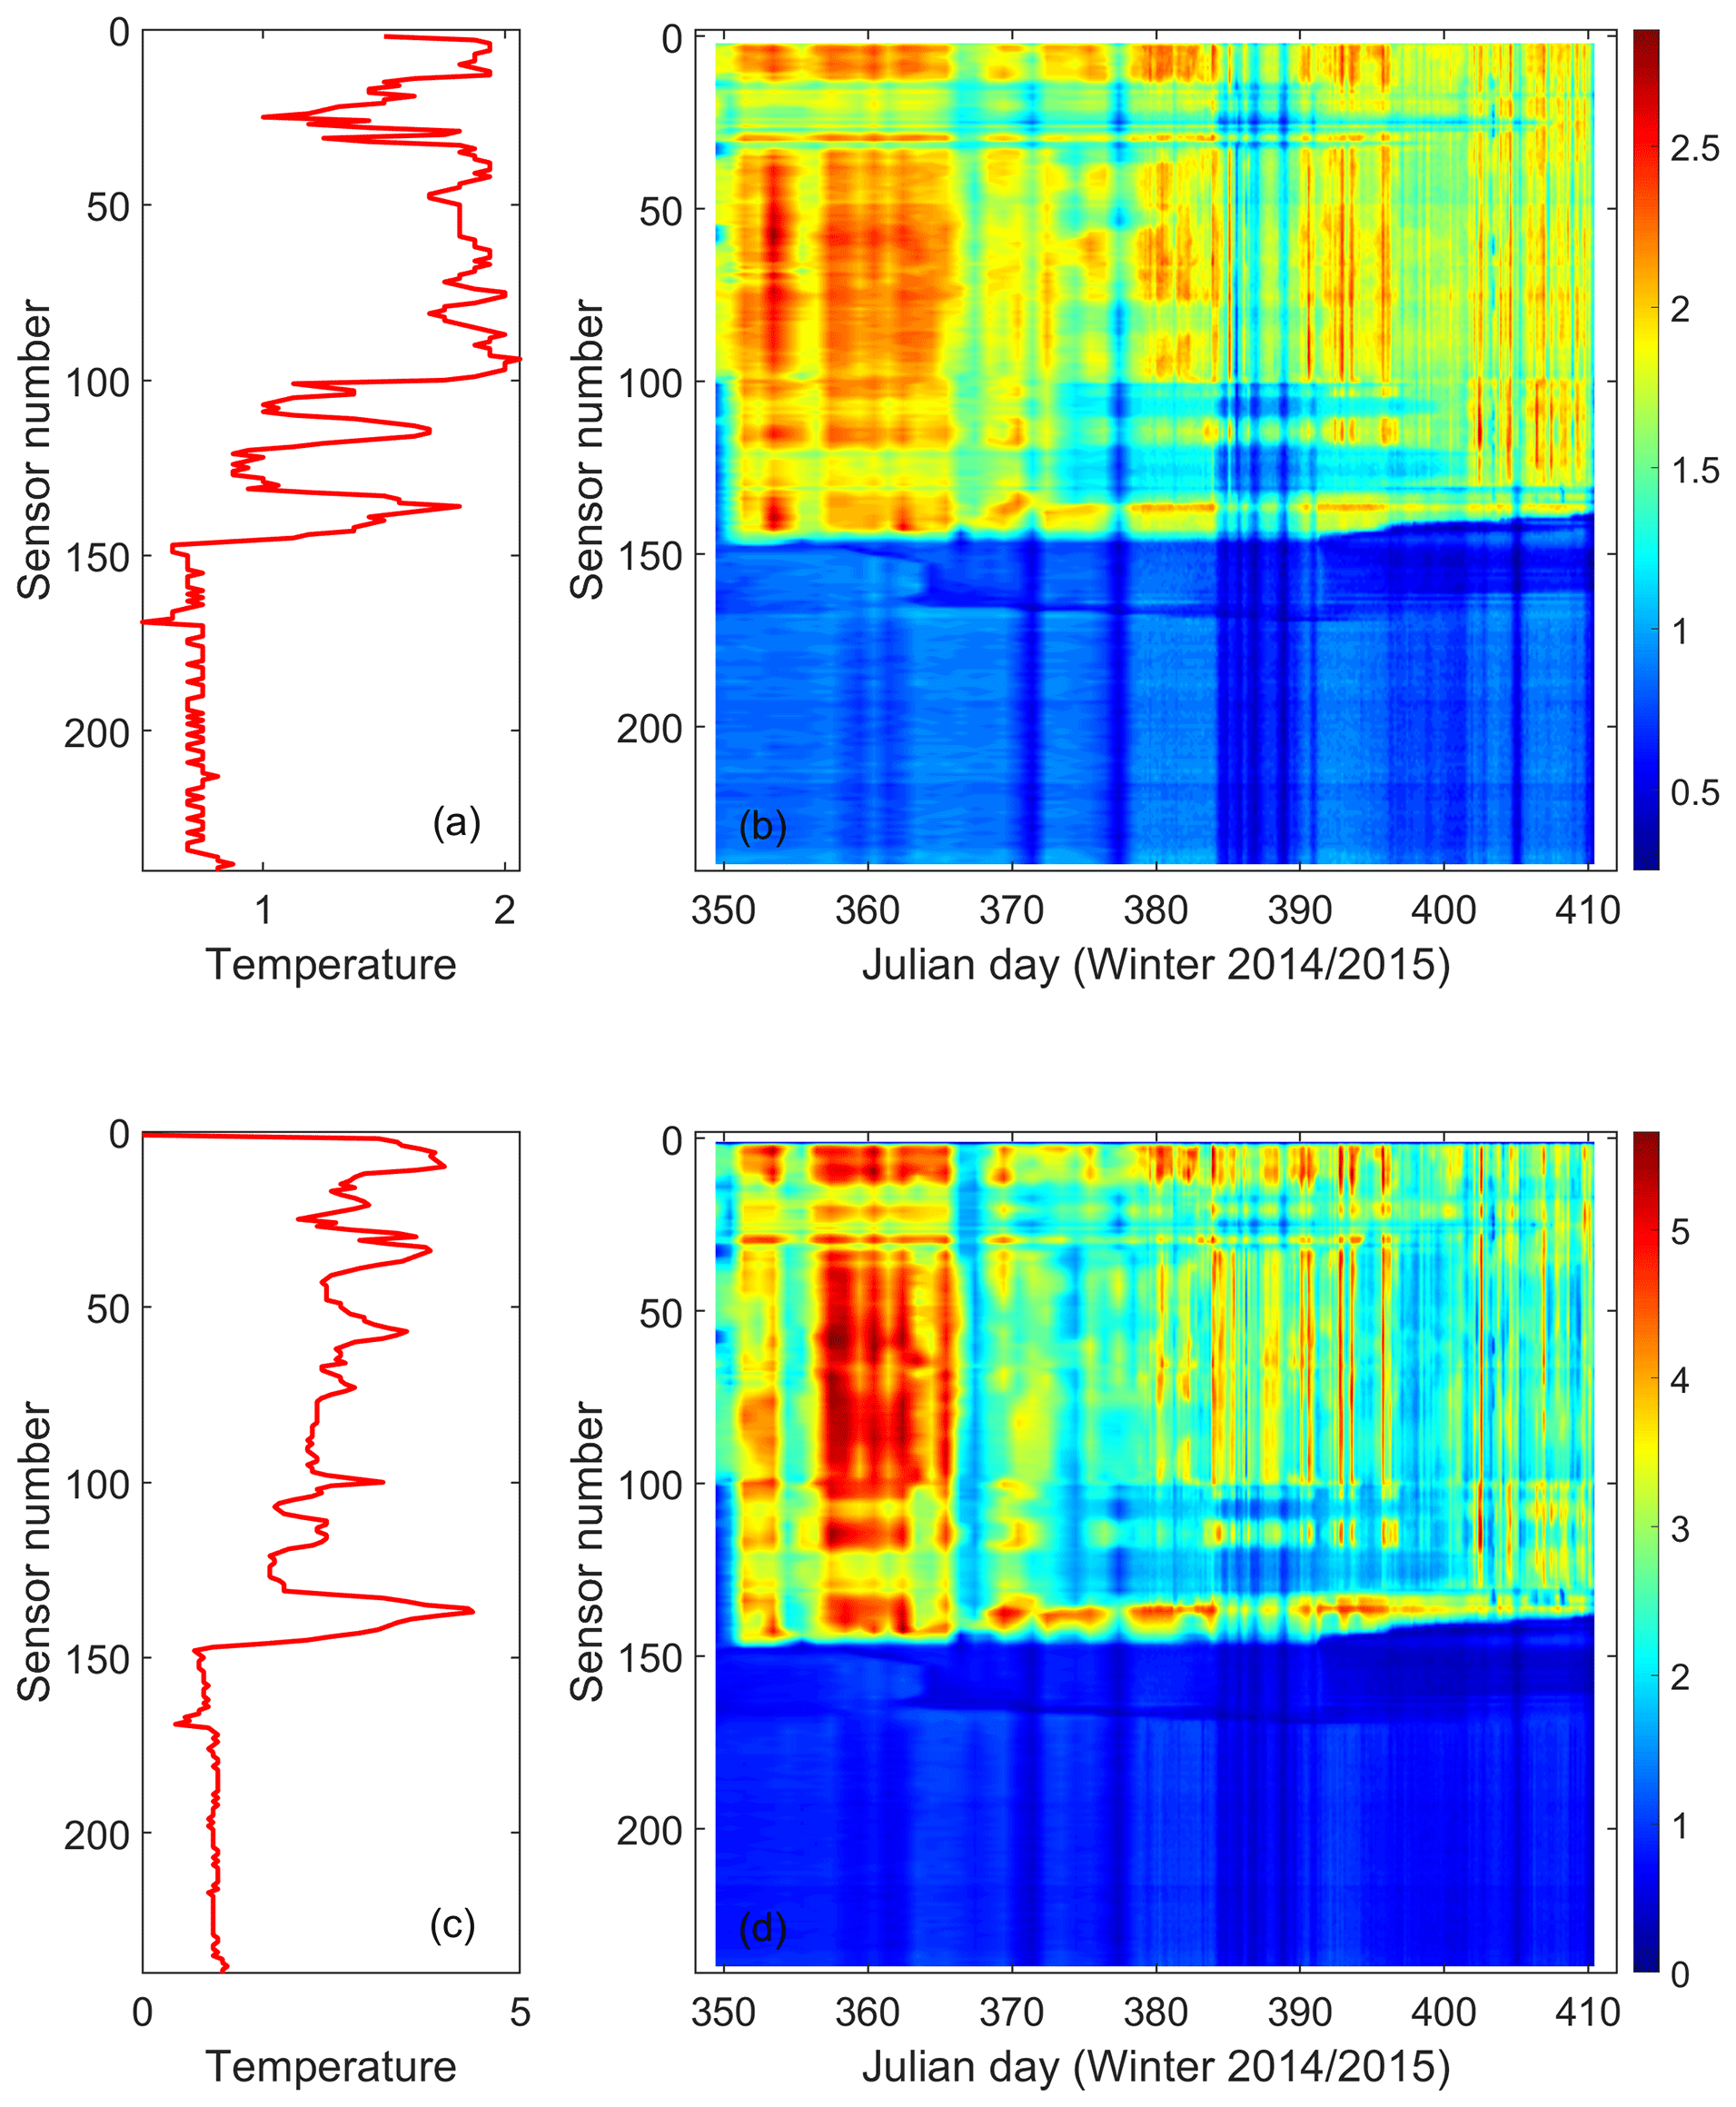
Figure 4Illustrations of SIMBA-HT: (a) a snapshot (25 January 2015, 18:00 UTC) of vertical profile of observed temperature increase after 60 s. (b) SIMBA-HT (60 s) field observed by 240 sensors. (c) Same as (a) but after heating for 90 s, and (d) SIMBA-HT (90 s) field observed by 240 sensors.
3.1.3 SIMBA snow depth and ice thickness
Snow depth and ice thickness are derived from SIMBA-ET and SIMBA-HT data. A common procedure is to look at SIMBA-ET temperature profiles manually and identify sudden changes of vertical temperature gradient to locate the air–snow, snow–ice, and ice–water interfaces. The snow depth is then calculated as the distance between the air–snow and snow–ice interfaces, and the ice thickness is the distance between the snow–ice and ice–water interfaces. However, a manual procedure is a heavy task, especially if SIMBA operation covers a long period or one would need real-time SIMBA results. Several studies have been carried out aimed at development of an algorithm to obtain snow depth and ice thickness automatically (Liao et al., 2019; Zuo et al., 2018; Cheng et al., 2020).
Below we present an example of the application of the Cheng et al. (2020) algorithm to retrieve snow depth and ice thickness from SIMBA data observed in Lake Orajärvi. When SIMBA was deployed, the initial sensor position at the snow–ice interface is known and we defined it as Zgi0, i.e. zero reference position for granular ice. During the observation period, if the initial snow–ice interface moves upward from Zgi0, which is a common phenomenon in Arctic lakes, the distance between Zgi0 and the moving snow–ice interface is the new granular ice thickness formed by snow-to-ice transformation. The depth difference between total ice thickness and granular ice thickness is the congelation ice formed at the ice bottom. Figure 5 shows the air–snow, snow–ice, and ice–water interfaces with SIMBA-ET (a) and SIMBA-HT (b) as the background. For better clarity, the 5 d running average can be produced as the final products.

Figure 5Time series of sensor position for the air–snow (white), snow–ice (green), and ice–water (yellow) interfaces, identified applying the SIMBA algorithm. The SIMBA-ET observation is illustrated as background in (a) and SIMBA-HT ratio (HT60HT90) in (b). The black dashed line shows the sensor number (120) at the initial ice surface (Zgi0). For clarity, we only illustrate sensors 50–150.
Using the snow–ice interface as the zero-reference level, time series can be calculated for the snow depth, snow–ice thickness, total ice thicknesses, and ice freeboard. Figure 6 is an example of the 2019/2020 time series, indicating that the lake ice was mainly granular ice, which was related to heavy snowfall during the ice season. The snow depth observed at the FMI-ARC weather station on land was the highest in a decade. A few in situ observations (symbols in Fig. 6) were made during the ice season. Point comparison between SIMBA algorithm detected and in situ observed values ranged from 2 up to 12 cm. The mean biases are 5, −1, 3, and 2 cm for snow depth, freeboard, and granular and total ice thickness, respectively. Small values were largely due to the compensation effect. To validate the algorithm, a lot more in situ observations are needed. Such analyses can be found in Cheng et al. (2020).

Figure 6Products derived based on SIMBA data: snow depth (blue), ice freeboard (cyan), granular ice thickness (magenta), and total ice thickness (green). The symbols represent in situ observations of snow depth (red cross), ice freeboard (blue dot), granular ice thickness (magenta dot), total ice thickness (black cross), and the initial freezing-up day (red circle). The black solid line denotes the snow depth on land.
3.2 Weather data
The observed daily mean values of meteorological parameters for all seasons are presented in Fig. 7. The inter-annual mean, maximum, and minimum air temperatures are −2.5, −16.5, and −5.5 ∘C, respectively. The air temperature reveals a constant decreasing pattern from November to January. The coldest months are January and February. From March onward, the air temperature increased gradually due to increasing solar radiation (Fig. 7c). The inter-annual average, maximum, and minimum downward longwave radiative fluxes are 259, 309, and 201 W/m2, respectively. The corresponding values for downward shortwave radiative fluxes are 64, 97, and 26 W/m2.
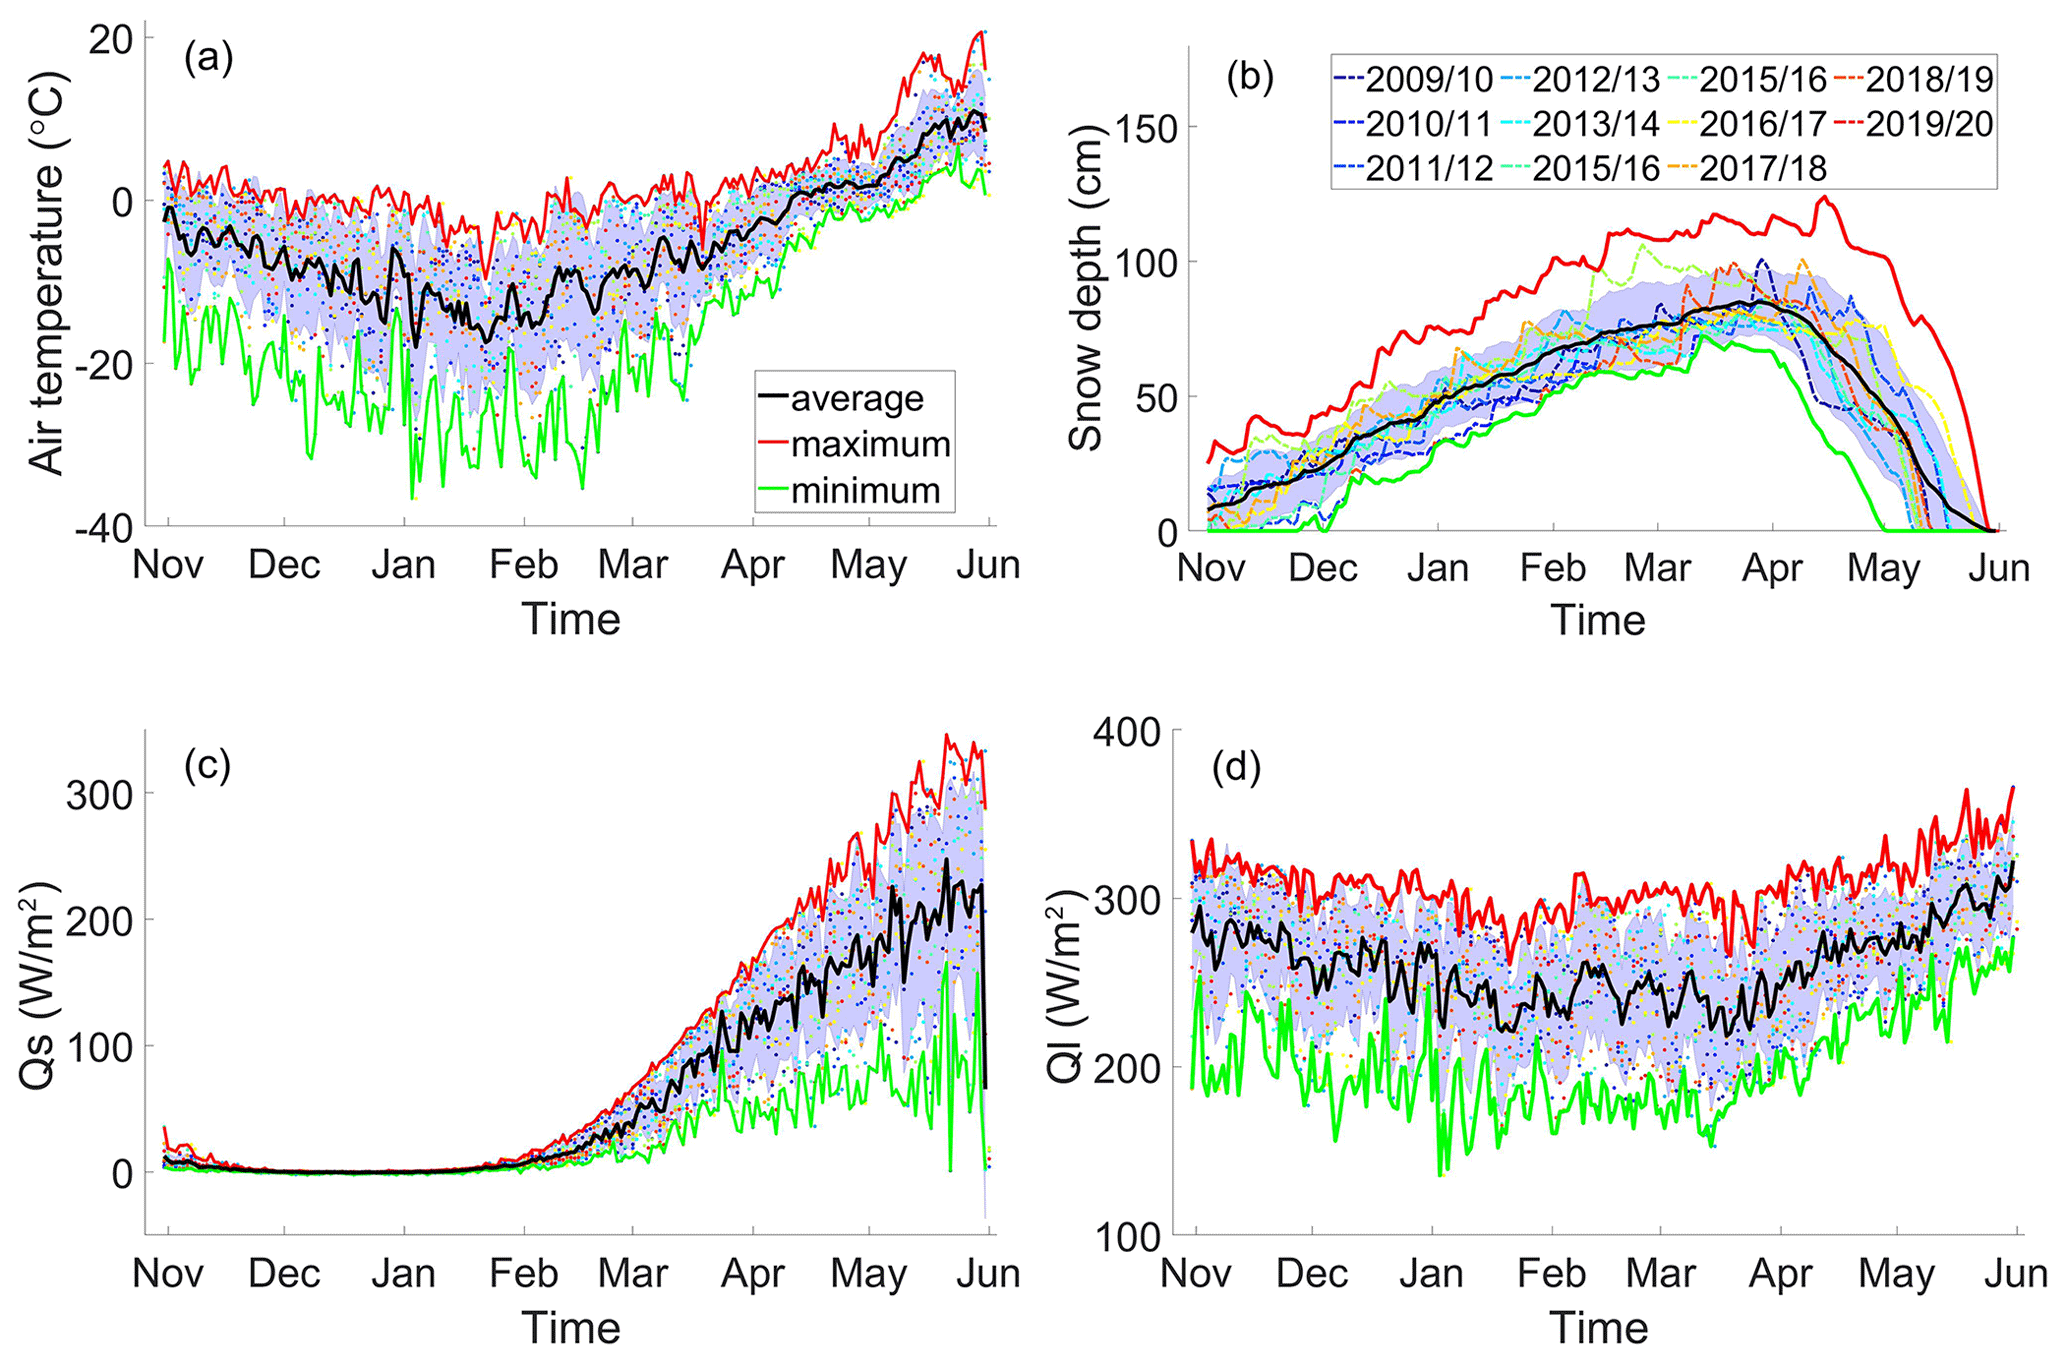
Figure 7The observed (dots) daily mean air temperature (a), snow depth (b), downward shortwave radiative flux (c), and longwave radiative flux (d) for each ice season between 1 November and 31 May. The solid lines represent decadal daily maximum (red), minimum (green), and average (black) values. The shadow area represents the standard deviation (SD). For snow depth, daily mean values are given as thin colour lines.
Table 2Summary of various meteorological and physical observations between 1 November and 31 May. For meteorological parameters (Va, Ta, RH, cn, Qs, Ql) the values are seasonal mean ± standard deviation.

Tprec: total accumulated precipitation in water equivalent (mm); Hsmax: the maximum observed snow depth on land. AFDD: the accumulated freezing degree day, the sum of daily mean air temperature below freezing point; ATDD: the accumulated thawing degree day, the sum of daily mean air temperature above freezing point.
Figure 7b clearly indicates that snow depth for the 2019/2020 season represented an extreme condition in a decade. There is an increasing trend of total precipitation during the ice season (Fig. 8). The total seasonal accumulated total precipitation is highly correlated (correlation coefficient r = 0.93) with the seasonal mean air temperature. The correlations between seasonal mean–maximum snow depth and corresponding air temperature are much lower: r = 0.40 and r = 0.38, respectively. The correlation between total accumulated precipitation and maximum snow depth was 0.55. The difference is contributed by the snow drift and changes of snow metamorphism.
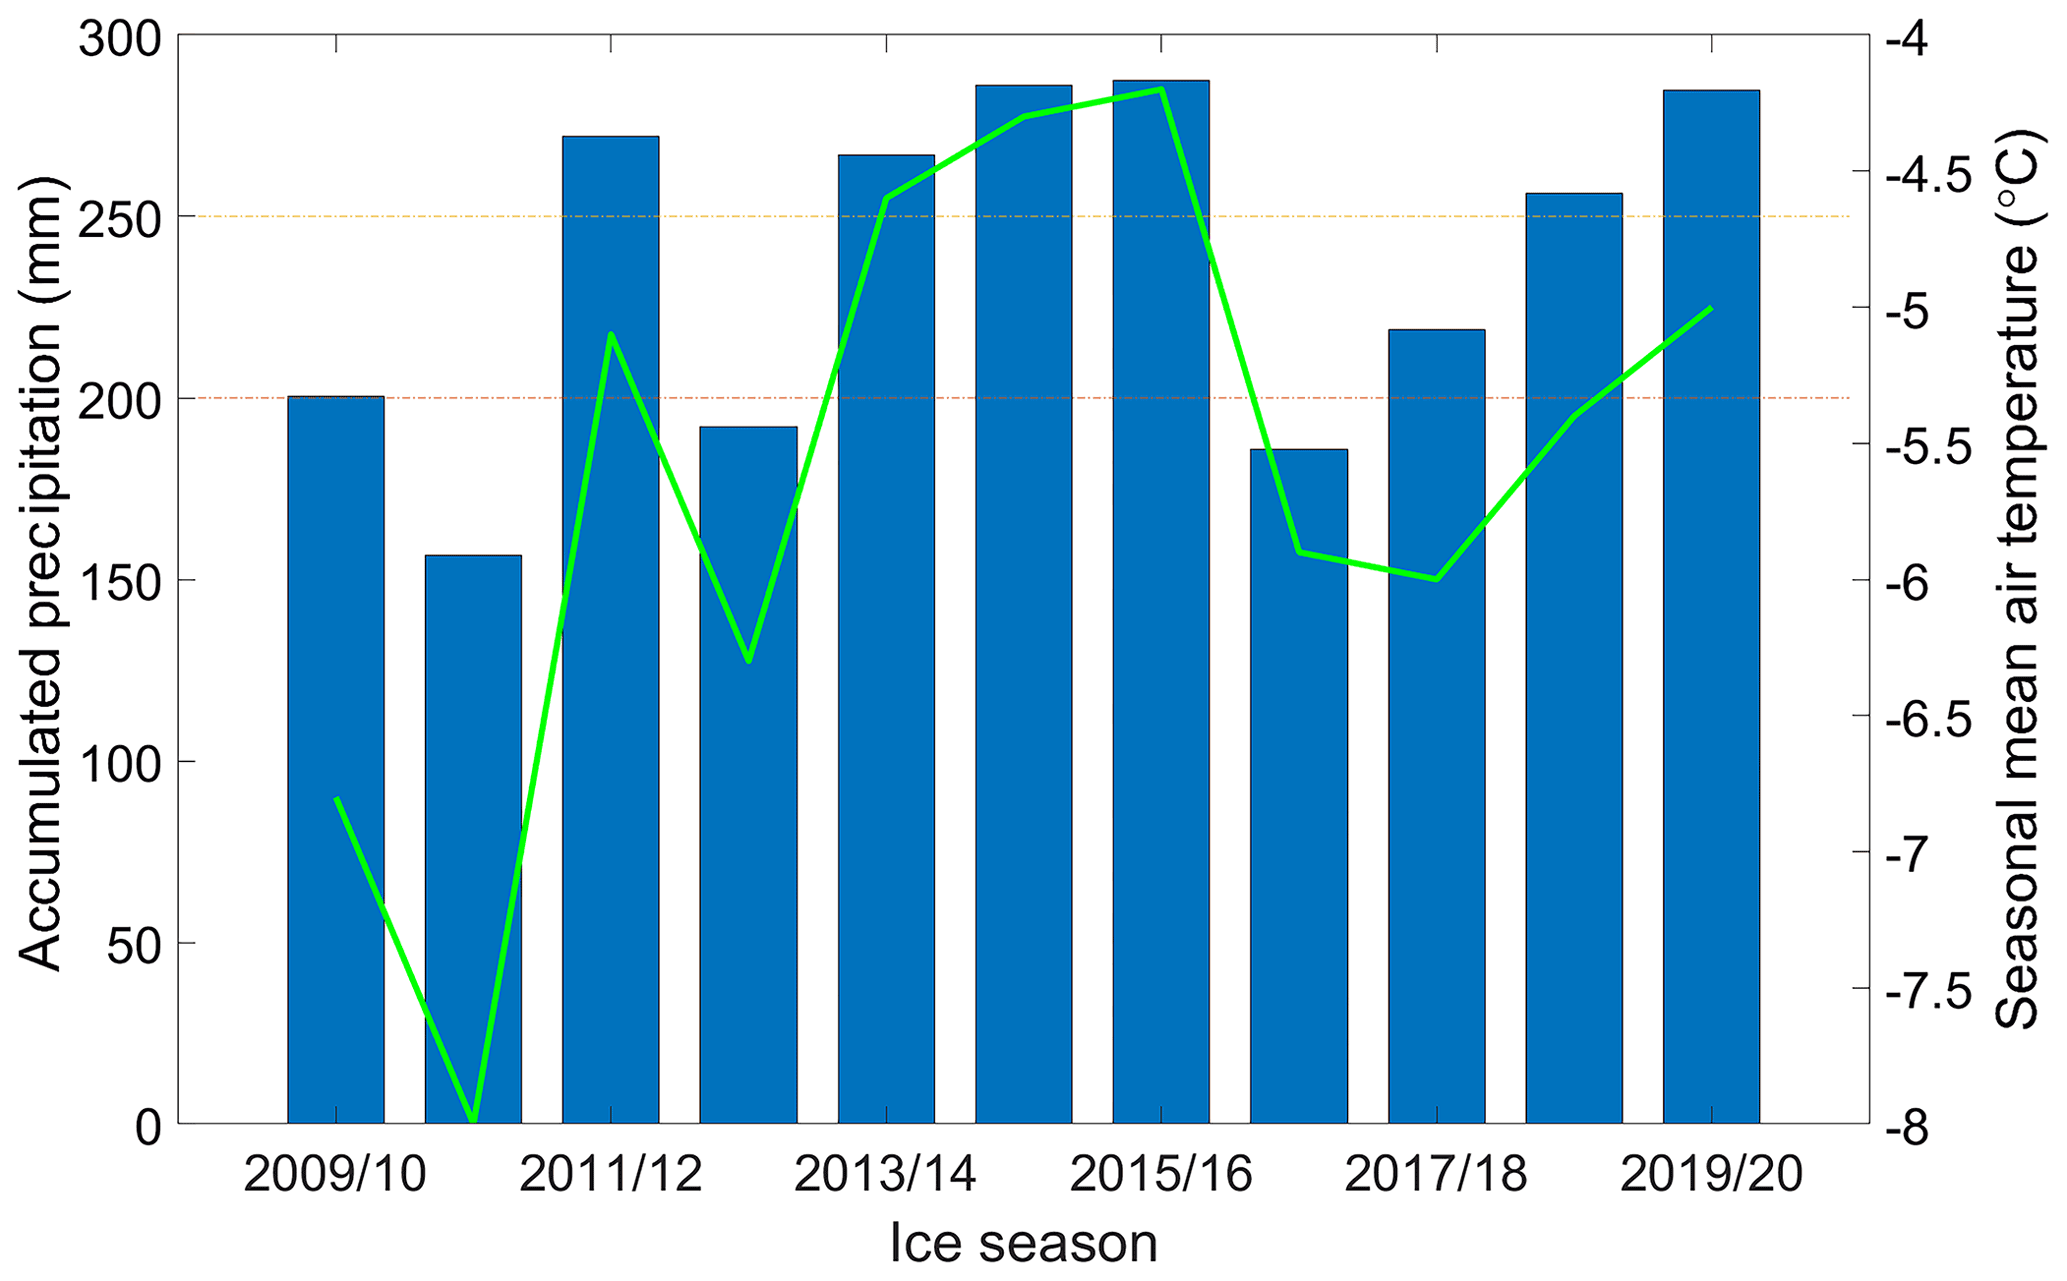
Figure 8The accumulated total precipitation and mean air temperature between 1 November and 31 May.
4.1 Inter-annual variation in SIMBA snow and ice products
Applying the SIMBA algorithm (Cheng et al., 2020), we obtained lake snow and ice products for all seasons (see data availability). Figure 9 shows the observed seasonal maximum values for the snow depth, maximum total ice thickness, and maximum granular ice thickness. During the observation period, both snow depth and ice thickness showed increasing trends. The increase in granular ice thickness is the fastest among all the snow and ice components. It reached the maximum 80 % of the total ice thickness in 2019/2020. In Lake Orajärvi, snow mass has contributed to the ice thickness during every winter season. The maximum granular ice thickness was on average about 40 % of the maximum total ice thickness during the data period. For all seasons, the correlation coefficient between the maximum granular ice thickness and the maximum ice thickness was 0.64. The occurrence of maximum lake snow is, on average, about 1 month prior to the maximum granular ice formation (Fig. 10). Because of snow-to-ice transformation, the time series of snow depth in the lake is not correlated with the snow depth on land. The snow depth on lake ice ranged from 25 % to 43 % of that on land. On average the ratio was 0.33, some 11 % less than observed for a lake in southern Finland (Kärkäs, 2000). In several seasons, when SIMBA was recovered in late April or early May, the entire snow layer on lake ice was transferred to granular ice. Granular ice reached its maximum value when the ice surface was free of snow.
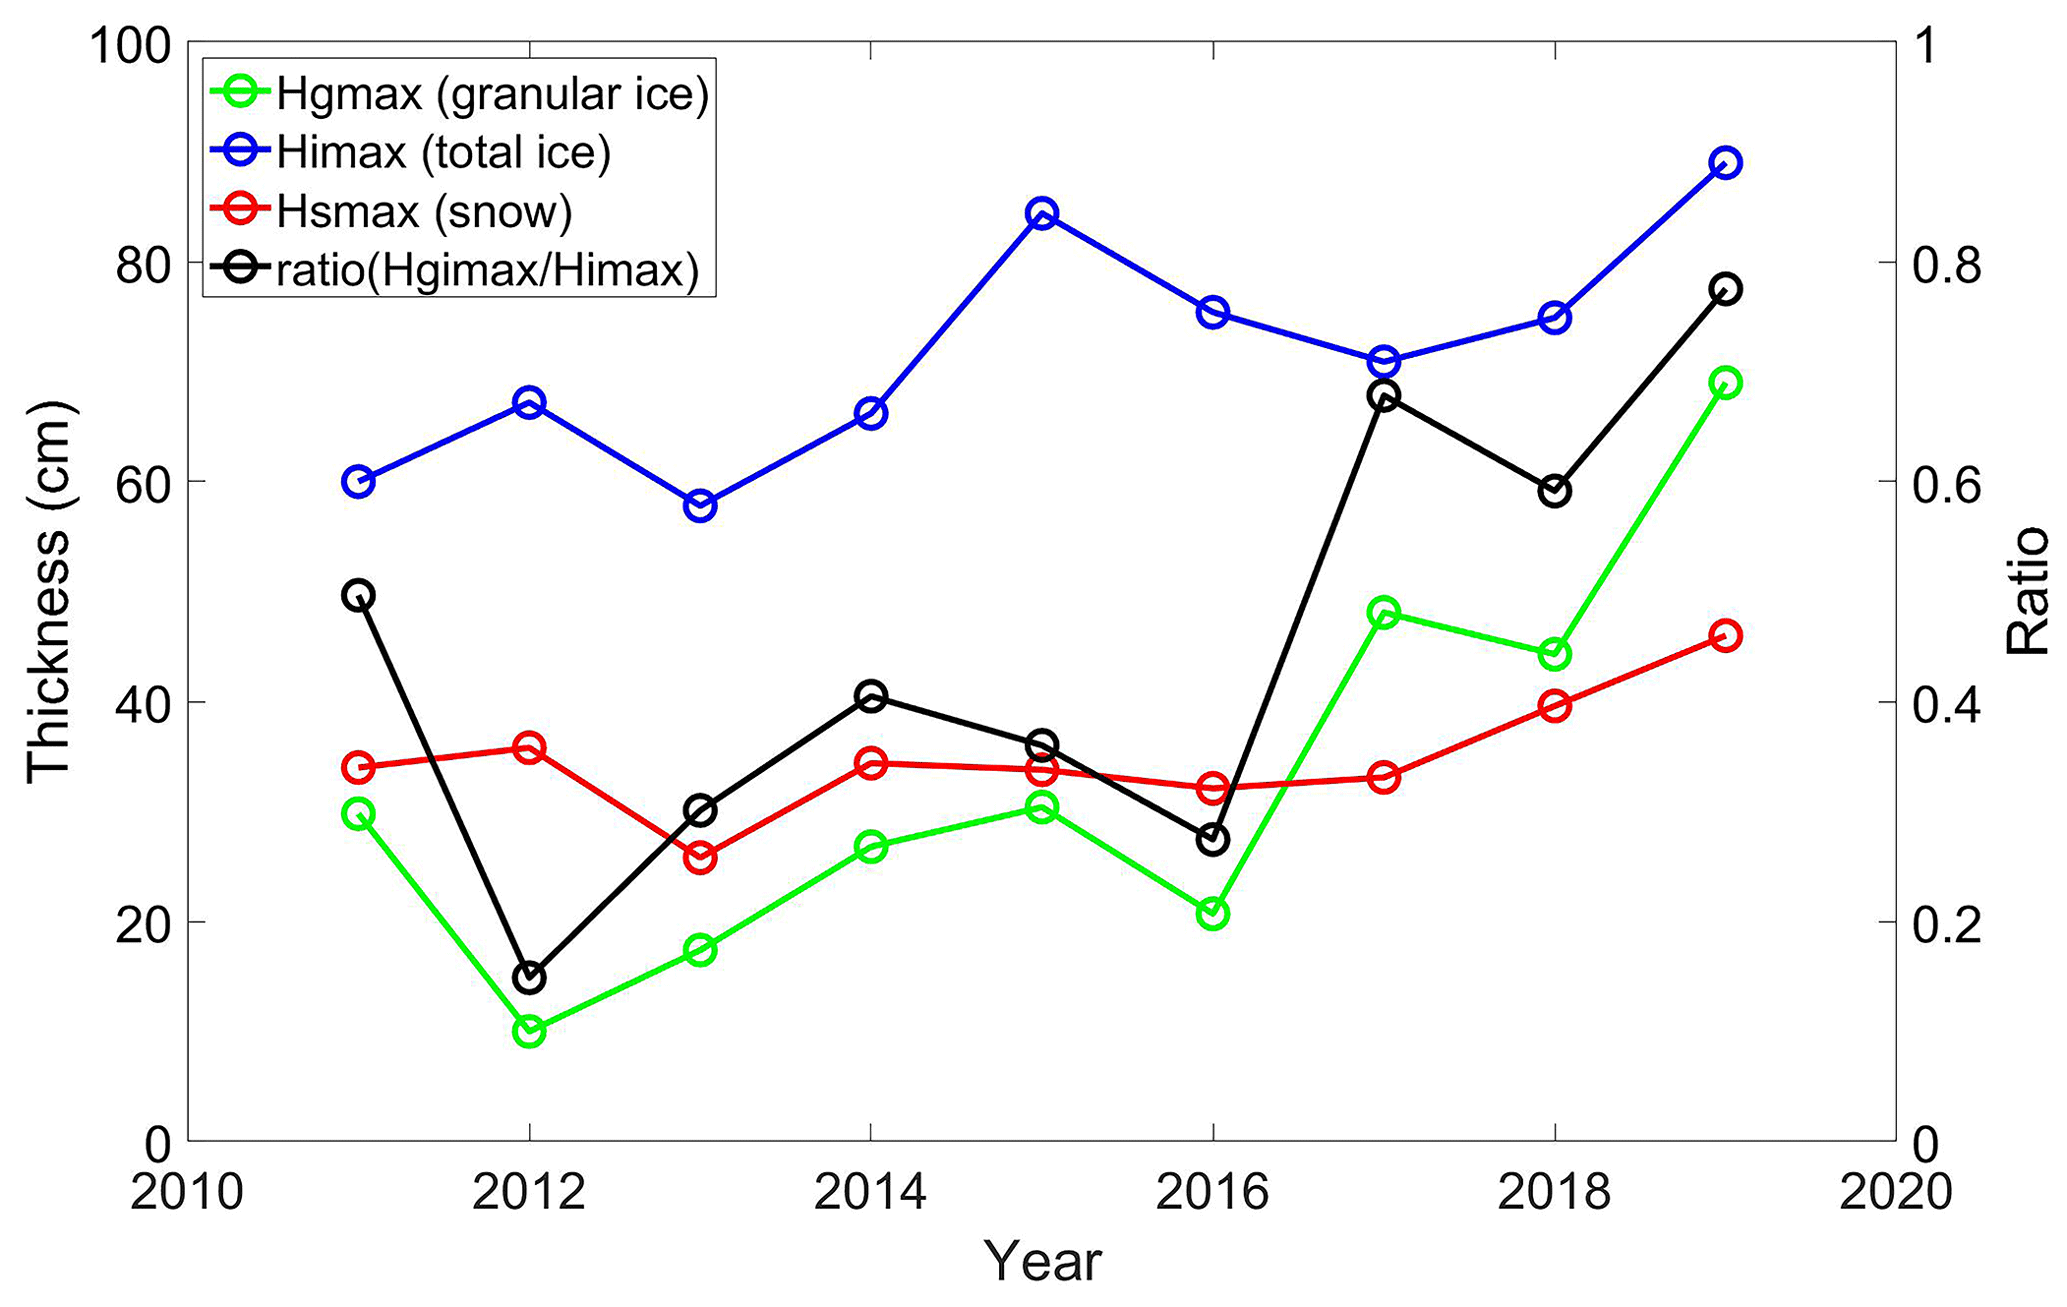
Figure 9SIMBA observed seasonal maximum snow depth (red), maximum total ice thickness (blue), maximum granular ice thickness (green), and the ratio between granular ice and total ice thickness (black) during observation seasons.

Figure 10Seasonal maximum snow depth, granular ice thicknesses, congelation ice thicknesses, and the date when those values were observed.
4.2 Inter-annual variation in temperature conditions
According to weather observations in Sodankylä, the air temperature increased by about 0.16 ∘C per year during the last decade. For the period from 1980–2020, the air temperature has an increasing trend of about 0.06 ∘C per year. On average, the increase in air temperature in the last decade is about 3 times faster than in the past 40 years in agreement with the findings of Przybylak and Wyszyński (2020) for the high Arctic. The accumulated precipitation correlated better to the maximum snow depth on land (r = 0.55) than the mean snow depth (r = 0.45). It is, however, not correlated (r = 0.21) with snow depth on the lake ice.
The seasonal AFDD and ATDD for each winter season are shown in Fig. 11. A negative decrease in AFDD was seen in response to the increase in air temperature. AFDD is directly linked with thermodynamic ice formation. During a given period, a decrease in AFDD is expected to result in less formation of columnar ice. However, during our observation period, the total ice thickness revealed an increasing trend. The increase in ice thickness is due to snow–ice formation. The trend of ATDD is very insignificant, suggesting that the melting of lake ice due to temperature increase has not increased much during the observation decade.
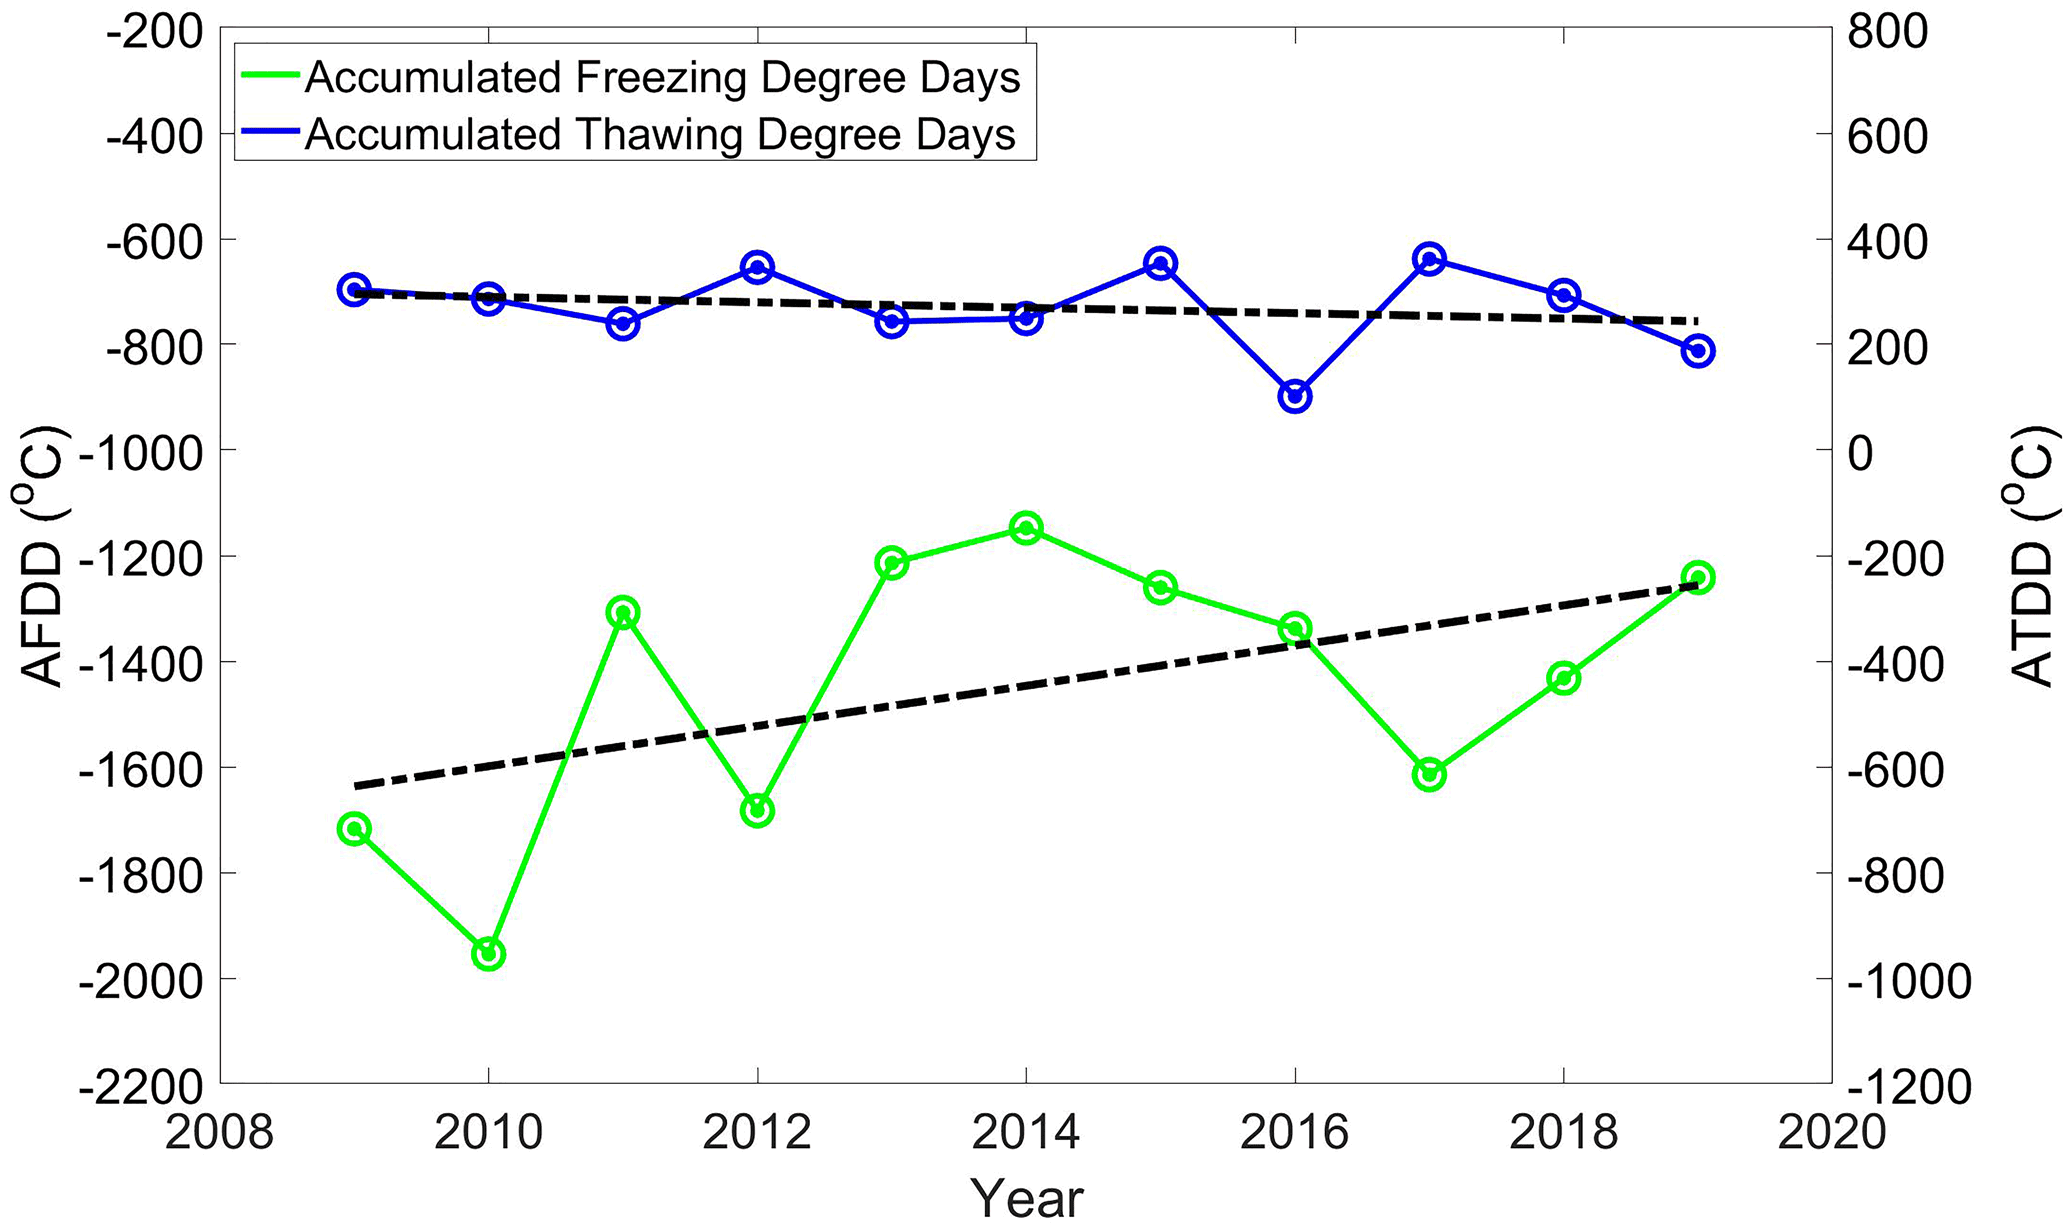
Figure 11The seasonal accumulated freezing degree day (AFDD) and thaw degree day (ATDD) during the observation period (2009/2010–2019/2020).
4.3 Challenges of the SIMBA programme
SIMBA observations in Lake Orajärvi represent a small but sustainable programme, operating for a decade so far. A few times we have encountered malfunction of SIMBA, especially in the early phases of the SIMBA programme. In recent years, SIMBA has become more robust without the need for heavy-duty maintenance during field measurements, and the system has been remarkably improved with respect to the quality of HT measurements. Several snow and ice products can be derived from SIMBA's two types of temperature (SIMBA-ET and SIMBA-HT) measurements. The SIMBA programme has largely benefited from the Sodankylä supersite infrastructure, where the comprehensive and high-standard meteorological observations are available.
Challenges remain in further improvement of the SIMBA programme. Due to safety issues, SIMBA must be deployed and recovered when ice is strong enough. Hence, the early freeze-up and late break-up cannot be monitored. In autumn 2019, a wooden floating raft was deployed and anchored in Lake Orajärvi. SIMBA was, for the first time, deployed during the ice-free season on 1 October. This kind of deployment will also be carried out in the future, allowing year-round SIMBA measurements.
Part of the thermistor chain exposed in the air above the snow surface may suffer from frost in winter or from solar heating in spring, and also the sensors in the upper layers of snow and ice may suffer from solar heating, resulting in large uncertainties in SIMBA-ET and SIMBA-HT readings. To compensate for the effect of temperature errors on snow depth detection, one solution is to deploy acoustic rangefinder sounders (ARSs) to measure the evolution of snow surface. In fact, an ARS has been deployed in the past two winter seasons. These data sets can also be used to understand the effect of wind on snow drift and quantify snow surface sublimation in winter.
During the melting season, both SIMBA-ET and SIMBA-HT strongly increase in the upper part of the ice, resulting in an isothermal status of the entire ice column. In this condition, SIMBA snow depth and ice thickness values are liable to large errors. A combination of SIMBA observations and numerical model experiments may yield more reliable results in such conditions.
SIMBA measurements have been taken automatically, but it is still important to carry out in situ observations, such as collecting ice core and snow samples, as such observations cannot be made by automatic instruments.
The data are archived at https://doi.org/10.5281/zenodo.4559368 (Cheng et al., 2021). The four zip files should be unzipped in different file folders, preferably using zip-file names as the folder names. A readme file exists in each folder. The in situ snow depth and ice thickness observations for 2009/2010–2012/2013 as well as a description file of SIMBA deployment and recovery for each ice season (SIMBA_D&R_all_Years.docx) are provided.
A thermistor-string-based snow and ice mass balance apparatus (SIMBA) has been deployed in an Arctic lake since 2009. The measurements covered most of the ice season from mid-December to late April–early May. SIMBA-ET and SIMBA-HT temperature observations are described in this paper. The daily snow depth and ice thickness were derived from the SIMBA temperature field applying a validated automatic algorithm (Cheng et al., 2020). The meteorological parameters for winter seasons (1 November–31 May) are also collected and discussed. During the investigation decade, the air temperature in the ice season has had an increasing trend of 0.16 ∘C per year. The warming rate is comparable to the result found for the high Arctic by Przybylak and Wyszyński (2020). The increase in air temperature in the winter season is highly correlated (0.93) with total seasonal accumulated precipitation. This is because warm winters in the study region are also wet and characterized by a high cyclone activity. Transient cyclones are vital for the transport of warm, moist air masses to northern Europe (Wickström et al., 2020). The precipitation in the 2019/2020 season represented an extreme episode during the study decade. Despite the air temperature increase, the total maximum ice thickness in the lake has an increasing trend. The increase in maximum ice thickness is due to the increase in granular ice. The interannual variability of maximum granular ice thickness is large, ranging from 15 % to 80 % of the total maximum ice thickness. The time series of the SIMBA ET and HT allow identification of moving air–snow, snow–ice, and ice–water interfaces. Because of the air temperature increase, the seasonal AFDD reduces. This results in a decreasing impact of below-zero air temperatures on lake ice growth during the freezing season, as the growth of columnar ice is reduced. Simultaneously, the role of precipitation in total ice formation is enhanced because snow–ice and superimposed ice contribute to an increasing fraction of the total ice thickness. The trend in ATDD was negligible, suggesting that the effect of air temperature on ice melting has remained unchanged.
To our knowledge, this is the first decadal-scale SIMBA data set ever collected from an Arctic lake. The data provide information on snow and ice mass balance and the controlling atmospheric factors. The measurements will continue in the future.
The weather observations, e.g. decadal time series of daily maximum and minimum weather parameters, can be used to estimate snow and ice conditions in the lake applying a snow and ice model (e.g. Cheng et al., 2014). The SIMBA data are not only suitable for snow and ice surface heat and mass balance studies. The temperatures at the ice bottom and in the water below are valuable to understand the lake thermal structure and water–ice heat transfer (Huang et al., 2019b).
The SIMBA programme, with Lake Orajärvi as a test bed, offers excellent opportunities for dissemination of cryospheric knowledge and related outreach, providing rich possibilities for community collaborations both nationally and internationally. The observed changes in snow depth and composition of lake ice contribute to better understanding of cryospheric aspects of climate change. For example, parameterizations of the discovered snow and ice processes can be improved in climate models.
Snow and ice measurements similar to those in Lake Orajärvi have been recently initiated in Wulaingsuhai lake in an arid climate zone in Inner Mongolia of China. The observations focused on lake ice mass balance (Lu et al., 2020) and energy budget, in particular the solar radiation (Cao et al., 2020). In the long run, the corresponding lake snow and ice measurements at both sites and possible similar observations in a thermokarst lake (e.g. Huang et al., 2019a, b) at Qinghai–Tibet Plateau, often referred to as the “Third Pole of the Earth”, can be used together to carry out coordinated research.
BC and TV initiated the SIMBA programme and drafted the manuscript; YC, BC, FZ, and YQ developed the SIMBA algorithm, processed the SIMBA data, and analysed the results; JP, AK, and JL are responsible for supersite and various meteorological in situ observations and data collections. All authors contributed to writing the manuscript.
The authors declare that they have no conflict of interest.
Publisher's note: Copernicus Publications remains neutral with regard to jurisdictional claims in published maps and institutional affiliations.
This article is part of the special issue “Extreme environment datasets for the three poles”. It is not associated with a conference.
We are grateful to Pekka Kosloff for carrying out fieldwork in Lake Orajärvi for all the winter seasons. The logistical assistance provided by Jyrki Mattanen in FMI-ARC, Sodankylä, is acknowledged. We are grateful for comments from Keith Jackson, the one anonymous reviewer, and the topical editor Xin Li that helped to improve the manuscript.
This research has been supported by the Horizon 2020 (INTAROS (grant no. 727890)), the Academy of Finland (grant no. 317999), and the Ministry of Science and Technology of the People's Republic of China (grant no. 2017YFE0111700 – MARIS). Yubing Cheng and Fei Zheng were supported by the National Natural Science Foundation of China (grant 441 no. 41876012; 41861144015) and the Key Research Program of Frontier Sciences, CAS (grant no. ZDBS-LY-DQC010) and Light of West China, CAS Program (E129030101, Y929641001).
This paper was edited by Xin Li and reviewed by Keith Jackson and one anonymous referee.
Anderson, E. J., Fujisaki-Manome, A., Kessler, J., Lang, G. A., Chu, P. Y., Kelley, J. G. W., Chen, Y., and Wang, J.: Ice Forecasting in the Next-Generation Great Lakes Operational Forecast System (GLOFS), J. Mar. Sci. Eng., 6, 123, https://doi.org/10.3390/jmse6040123, 2018.
Box, J. E., Colgan, W. T., Christensen, T. R., Schmidt, N. M., Lund, M., Parmentier, F-J. W., Brown, R., Bhatt, U. S., Euskirchen, E. S., Romanovsky, V. E., Walsh, J. E., Overland, J. E., Wang, M., Corell, R. W., Meier, W. N., Wouters, B., Mernild, S., Mård, J., Pawlak, J., and Olsen, M. S.: Key indicators of Arctic climate change: 1971–2017, Environ. Res. Lett., 14, 045010, https://doi.org/10.1088/1748-9326/aafc1b, 2019.
Brown, L. C. and Duguay, C. R.: The response and role of ice cover in lake climate interactions, Prog. Phys. Geog., 34, 671–704, 2010.
Cheng, B., Vihma, T., Rontu, L., Kontu, A., Kheyrollah Pour, H., Duguay, C., and Pulliainen, J.: Evolution of snow and ice temperature, thickness and energy balance in Lake Orajärvi, northern Finland, Tellus A, 66, 21564, https://doi.org/10.3402/tellusa.v66.21564, 2014.
Cheng, B., Cheng, Y., Vihma, T., Kontu, A., Zheng, F., Lemmetyinen, J., and Pulliainen, J.: SIMBA snow/ice mass balance buoy data and weather station data, Earth System Science Data (ESSD), Zenodo [data set], https://doi.org/10.5281/zenodo.4559368, 2021.
Cheng, Y., Cheng, B., Zheng, F., Vihma, T., Kontu, A., Yang, Q., and Liao, Z.: Air/snow, snow/ice and ice/water interfaces detection from high-resolution vertical temperature profiles measured by ice mass-balance buoys on an Arctic lake, Ann. Glaciol., 61, 309–319, https://doi.org/10.1017/aog.2020.51, 2020.
Cao, X., Lu, P., Leppäranta, M., Arvola, L., Huotari, J., Shi, X., Li, G., and Li, Z.: Solar radiation transfer for an ice-covered lake in the central Asian arid climate zone, Inland Waters, 11, 89–103, https://doi.org/10.1080/20442041.2020.1790274, 2020.
Duguay, C. R., Prowse, T. D., Bonsal, B. R., Brown, R. D., Lacroix, M. P., and Ménard, P.: Recent trends in Canadian lake ice cover, Hydrol. Process., 20, 781801, https://doi.org/10.1002/hyp.6131, 2006.
Filazzola, A., Brown, C., Dettlaff, M. A., Batbaatar, A., Grenke, J., Bao, T., Heida, I. P., and Cahill Jr., J. F.: The effects of livestock grazing on biodiversity are multitrophic: a meta-analysis, Ecol. Lett., 23, 1298–1309, https://doi.org/10.1111/ele.13527, 2020.
Hoppmann, M., Nicolaus, M., Hunkeler, P. A., Heil, H., Behrens, L.-K., Konig-Langlo, G., and Gerdes, R.: Seasonal evolution of an ice-shelf influenced fast-ice regime, derived from an autonomous thermistor chain, J. Geophys. Res.-Oceans, 120, 1703–1724, https://doi.org/10.1002/2014JC010327, 2015.
Huang, W., Cheng, B., Zhang, J., Zhang, Z., Vihma, T., Li, Z., and Niu, F.: Modeling experiments on seasonal lake ice mass and energy balance in the Qinghai–Tibet Plateau: a case study, Hydrol. Earth Syst. Sci., 23, 2173–2186, https://doi.org/10.5194/hess-23-2173-2019, 2019a.
Huang, W., Zhang, J., Leppäranta, M., Li, Z., Cheng, B., and Lin, Z.: Thermal structure and water-ice heat transfer in a shallow ice–covered thermokarst lake in central Qinghai-Tibet Plateau, J. Hydrol., 578, 124122, https://doi.org/10.1016/j.jhydrol.2019.124122, 2019b.
Jackson, K., Wilkinson, J., Maksym, T., Meldrum, D., Beckers, J., Haas, C., and Mackenzie, D.: A novel and low-cost sea ice mass balance 1010 buoy, J. Atmos. Ocean. Tech., 30, 2676–2688, https://doi.org/10.1175/JTECH-D-13-00058.1, 2013.
Kang, K.-K., Duguay, C. R., Lemmetyinen, J., and Gel, Y.: Estimation of ice thickness on large northern lakes from AMSR-E brightness temperature measurements, Remote Sens. Environ., 150, 1–19, https://doi.org/10.1016/j.rse.2014.04.016, 2014.
Kärkäs, E.: The ice season of Lake Pääjärvi in southern Finland, Geophys. Res. Lett., 36, 85–94, 2000.
Lei, R., Cheng, B., Heil, P., Vihma, T., Wang, J., Ji, Q., and Zhang, Z.: Seasonal and interannual variations of sea ice mass balance from the central Arctic to the Greenland Sea, J. Geophys. Res.-Oceans, 123, 2422–2439, 2018.
Lei, R., Hoppmann, M., Cheng, B., Zuo, G., Gui, D., Cai, Q., Belter, H. J., and Yang, W.: Seasonal changes in sea ice kinematics and deformation in the Pacific sector of the Arctic Ocean in 2018/19, The Cryosphere, 15, 1321–1341, https://doi.org/10.5194/tc-15-1321-2021, 2021.
Leppäranta, M.: Modelling the formation and decay of lake Ice, in: The Impact of Climate Change on European Lakes, edited by: George, G., Dordrecht, Netherlands, Springer, 63–83, 2010.
Leppäranta, M.: Freezing of Lakes and the Evolution of Their Ice Cover, Springer, Berlin Heidelberg, 2015.
Liao, Z., Cheng, B., Zhao, J., Vihma, T., Jackson, K., Yang, Q., Yang, Y., Zhang, L., Li, Z., Qiu, Y., and Cheng, X.: Snow depth and ice thickness derived from SIMBA ice mass balance buoy data using an automated algorithm, Int. J. Digit. Earth, 12, 962–979, 2019.
Lu, P., Cao, X., Li, G., Huang, W., Leppäranta, M., Arvola, L., Huotari, J., and Li, Z.: Mass and heat balance of a lake ice cover in the central Asian arid climate zone, Water, 12, 2888, https://doi.org/10.3390/w12102888, 2020.
Mermoz, S., Allain-Bailhache, S., Bernier, M., Pottier, E., Van Der Sanden, J. J., and Chokman, K.: Retrieval of river ice thickness from C-band PolSAR data, IEEE T. Geosci. Remote, 99, 1–11, https://doi.org/10.1109/TGRS.2013.2269014, 2013.
Provost, C., Sennechael, N., Miguet, J., Itkin, P., Rosel, A., Koenig, Z., Villacieros-Robineau, N., and Granskog, M. A.: Observations of flooding and snow-ice formation in a thinner Arctic sea-ice regime during the N-ICE2015 campaign: influence of basal ice melt and storms, J. Geophys. Res.-Oceans, 122, 7115–7134, https://doi.org/10.1002/2016JC012011, 2017.
Przybylak, R. and Wyszyński, P.: Air temperature changes in the Arctic in the period 1951– 2015 in the light of observational and reanalysis data, Theor. Appl. Climatol, 139, 75–94, https://doi.org/10.1007/s00704-019-02952-3, 2020.
Richter-Menge, J. A., Perovich, D. K., Elder, B. C., and Claffey, K.: Ice mass balance buoys: a tool for measuring and attributing changes in the thickness of the Arctic sea-ice cover, Ann. Glaciol., 44, 205–210, 2006.
Sharma, S., Blagrave, K., Magnuson, J. J., O'Reilly, C., Oliver, S., Batt, R., Magee, M., Straile, D., Weyhenmeyer, G. A., Winslow, L., and Woolway, R. I.: Widespread loss of lake ice around the Northern Hemisphere in a warming world, Nat. Clim. Change, 9, 227–231, https://doi.org/10.1038/s41558-018-0393-5, 2019.
Tikkanen, M.: Climate, in: The Physical Geography of Fennoscandia, edited by: Seppälä, M., Oxford University Press, Oxford, 96112 pp., 2005.
Wei, L., Deng, X., Cheng, B., Vihma, T., Hannula, H., Qin, T., and Pulliainen, J.: The impact of meteorological conditions on snow and ice thickness in an Arctic lake, Tellus A, 68, 1–12, 2016.
Wickström, S., Jonassen, M., Vihma, T., and Uotila, P.: Trends in cyclones in the high latitude North Atlantic during 1979–2016, Q. J. Roy. Meteor. Soc., 146, 762–779, https://doi.org/10.1002/qj.3707, 2020.
Woolway, R., Weyhenmeyer, G. A., Schmid, M., Dokulil, M. T., Eyto, E. D., Maberly, S. C., May, L., and Merchant, J. C.: Substantial increase in minimum lake surface temperatures under climate change, Climatic Change 155, 81–94, https://doi.org/10.1007/s10584-019-02465-y, 2019.
Wu, Y., Duguay, C. R., and Xu, L.: Assessment of machine learning classifiers for global lake ice cover mapping from MODIS TOA reflectance data, Remote Sens. Environ., 253, 112206, https://doi.org/10.1016/j.rse.2020.112206, 2021.
Zuo, G., Dou, Y., and Lei, R.: Discrimination algorithm and procedure of snow depth and sea ice thickness determination using measurements of the vertical ice temperature profile by the ice-tethered buoys, Sensors, 18, 4162, https://doi.org/10.3390/s18124162, 2018.