the Creative Commons Attribution 4.0 License.
the Creative Commons Attribution 4.0 License.
 | 16 Jul 2021
A 1 km resolution soil organic carbon dataset for frozen ground in the Third Pole
Dong Wang
Cuicui Mu
Ren Li
Xianhua Wei
Guojie Hu
Xiaofan Zhu
Junmin Hao
Jie Ni
Xiangfei Li
Wensi Ma
Amin Wen
Chengpeng Shang
Yune La
Xin Ma
Xiaodong Wu
Soil organic carbon (SOC) is very important in the vulnerable ecological environment of the Third Pole; however, data regarding the spatial distribution of SOC are still scarce and uncertain. Based on multiple environmental variables and soil profile data from 458 pits (depth of 0–1 m) and 114 cores (depth of 0–3 m), this study uses a machine-learning approach to evaluate the SOC storage and spatial distribution at a depth interval of 0–3 m in the frozen ground area of the Third Pole region. Our results showed that SOC stocks (SOCSs) exhibited a decreasing spatial pattern from the southeast towards the northwest. The estimated SOC storage in the upper 3 m of the soil profile was 46.18 Pg for an area of 3.27×10⁶ km2, which included 21.69 and 24.49 Pg for areas of permafrost and seasonally frozen ground, respectively. Our results provide information on the storage and patterns of SOCSs at a 1 km resolution for areas of frozen ground in the Third Pole region, thus providing a scientific basis for future studies pertaining to Earth system models. The dataset is open-access and available at https://doi.org/10.5281/zenodo.4293454 (Wang et al., 2020).
- Article
(13614 KB) - Full-text XML
-
Supplement
(749 KB) - BibTeX
- EndNote


Soil is an important part of the global terrestrial ecosystem and represents the largest terrestrial organic carbon pool with the longest turnover time (Amundson, 2001). This is especially true in areas of frozen ground, including permafrost and seasonally frozen ground. In cold environments, soil accumulates substantial organic carbon due to slow decomposition rates and repeated freeze–thaw cycles (Fan et al., 2012; Li et al., 2020). It has been reported that more than half of the world's soil organic carbon (SOC) is stored in permafrost regions (Hugelius et al., 2014; Ping et al., 2015). Even slight changes in the decomposition of the SOC pool in permafrost regions might lead to significant changes in the atmospheric CO2 concentration, which plays an important role in regulating and stabilizing the carbon balance of global ecosystems (Schuur et al., 2015). Therefore, it is of great significance to accurately estimate the storage and spatial distribution of SOC in regions of frozen ground in order to study the carbon cycle of this ecosystem as well as global change.
As the “roof of the world”, the Third Pole is the area of frozen ground at the highest average altitude in the middle and low latitudes of the Northern Hemisphere. The Third Pole is also one of the most sensitive areas with respect to global climate change and has a warming rate that is approximately twice the global average (Stocker et al., 2013). In the past few decades, permafrost in the Third Pole region has experienced obvious degradation (Mu et al., 2020b; Ran et al., 2018; Turetsky et al., 2019; Wu et al., 2012). Permafrost degradation will not only cause serious geological disasters and affect engineering construction in cold areas, but it will also accelerate the decomposition of the huge SOC pool stored in permafrost (Cheng and Wu, 2007; Cheng et al., 2019; Ding et al., 2021). Moreover, it will emit a large amount of greenhouse gases into the atmosphere, thus increasing the rate of climate change in the future (Schuur et al., 2015). Therefore, accurate estimates of the SOC storage and spatial distribution in the areas of frozen ground in the Third Pole region have become important for Earth system modeling. Such estimates are widely used to study the carbon cycle of this ecosystem and global change (Koven et al., 2011; Lombardozzi et al., 2016; McGuire et al., 2018).
Early studies were mostly based on data from China's national soil survey and were combined with regional vegetation–soil maps to estimate the SOC pool for a certain vegetation type or relatively small area (Wang et al., 2002; Zeng et al., 2004). Up until 2008, the Chinese part of the Qinghai–Tibet Plateau (QTP) was taken as an independent geographical unit to estimate the SOC pool in the upper 100 cm of the soil profile (Tian et al., 2008; Wu et al., 2008). However, these studies did not distinguish between regions of permafrost and seasonally frozen ground. In recent years, based on soil profile data and vegetation–soil maps, some studies have estimated the SOC pool in the QTP permafrost region (Mu et al., 2015; Zhao et al., 2018; Jiang et al., 2019). The aforementioned studies improved our understanding of SOC storage in the Third Pole region, but estimation results of 0–3 m SOC pool have large uncertainties, ranging from 17.1 to 40.9 Pg. In addition, the large-scale maps of vegetation and soil types used in these studies were associated with large uncertainties because they were created years ago and have a low spatial resolution, thus leading to potentially large errors in the estimated total SOC pools (Mishra et al., 2013; Mu et al., 2020a). Recently, considerable progress has been made in digital soil mapping methods. Spatial interpolation, linear regression, and machine learning have been widely used to simulate the spatial distribution of SOC in the permafrost region of the QTP (Ding et al., 2016, 2019; Wang et al., 2020; Yang et al., 2008). These studies have provided new spatial data and improved the prediction accuracy of SOC compared with earlier studies. However, few studies to date have systematically assessed SOC pools across areas of seasonally frozen ground in the Third Pole region, which limits many investigations requiring SOC data for these areas.
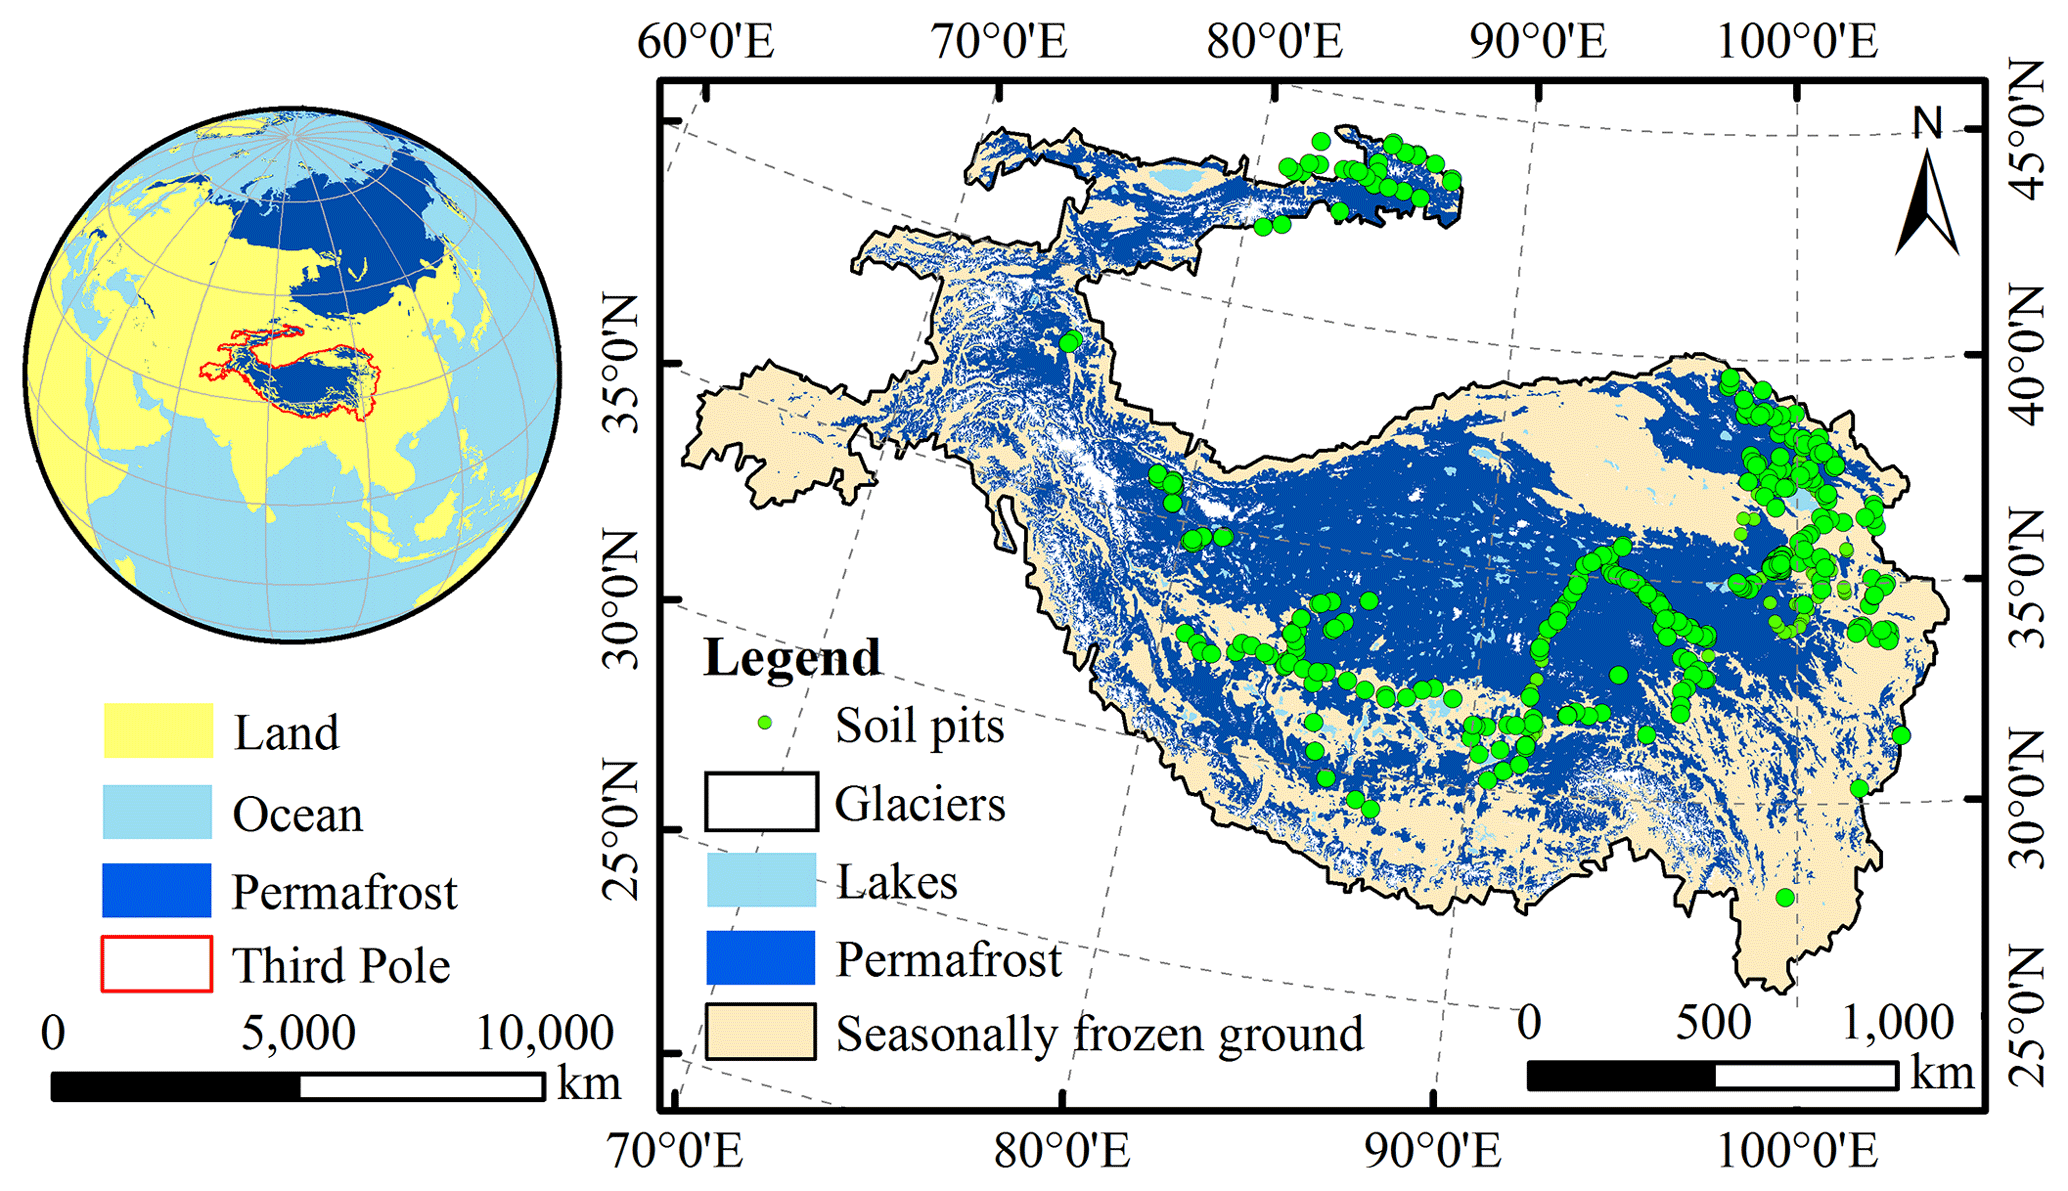
Figure 1Distribution of soil pits in the Third Pole region (the frozen ground map is derived from Obu et al., 2019).
To evaluate the size and high-resolution spatial patterns of SOC stocks in the Third Pole region, we carried out a large-scale field-sampling plan that covered representative permafrost zones over the region's bioclimatic gradient, including a large unpopulated area with harsh natural conditions. A total of 200 soil pits were excavated, most of which were deeper than 2 m. In addition, we collected field-measured SOCS data for the Third Pole region from relevant literature published between 2000 and 2016 (Ding et al., 2016; Song et al., 2016; Xu et al., 2019; Yang et al., 2008). By combining high-resolution remotely sensed data and interpolated meteorological datasets, we simulated the spatial distribution of SOCSs in the Third Pole region by three machine-learning methods and calculated the SOC storage of specific soil intervals (0–30, 0–50, 0–100, 0–200, and 0–300 cm). The results provide basic data for Earth system modeling and reference methods for studying the spatial distribution of soil elements under complex terrain.
2.1 Study area
The Third Pole is the highest plateau in the world and is located on the QTP and its surrounding mountains, which include Pamir and Hindu Kush mountain ranges in the west, the Hengduan Mountains in the east, the Kunlun and Qilian Mountains in the north, and the Himalayas in the south (Yao et al., 2012). In addition, the Third Pole is the largest high-altitude permafrost zone in the Northern Hemisphere, with a total permafrost area of approximately 1.72×10⁶ km2, thus representing ∼ 8 % of permafrost regions in the Northern Hemisphere (Obu et al., 2019). The area of seasonally frozen ground covers an area of approximately 1.55×10⁶ km2, which is mainly located in the eastern and southern parts of the Third Pole as well as at lower elevations of basins (Fig. 1). The Third Pole is mainly covered by five ecosystems: forests, shrubs, grasslands, croplands, and deserts (Hao et al., 2017).
2.2 Data processing
2.2.1 Soil organic carbon data
The collected SOC data used in this study included field-investigated data and available published data for a total of 371 soil samples (458 samples for the 0–100 cm soil layer and 113 samples for the 0–300 cm soil layer).
-
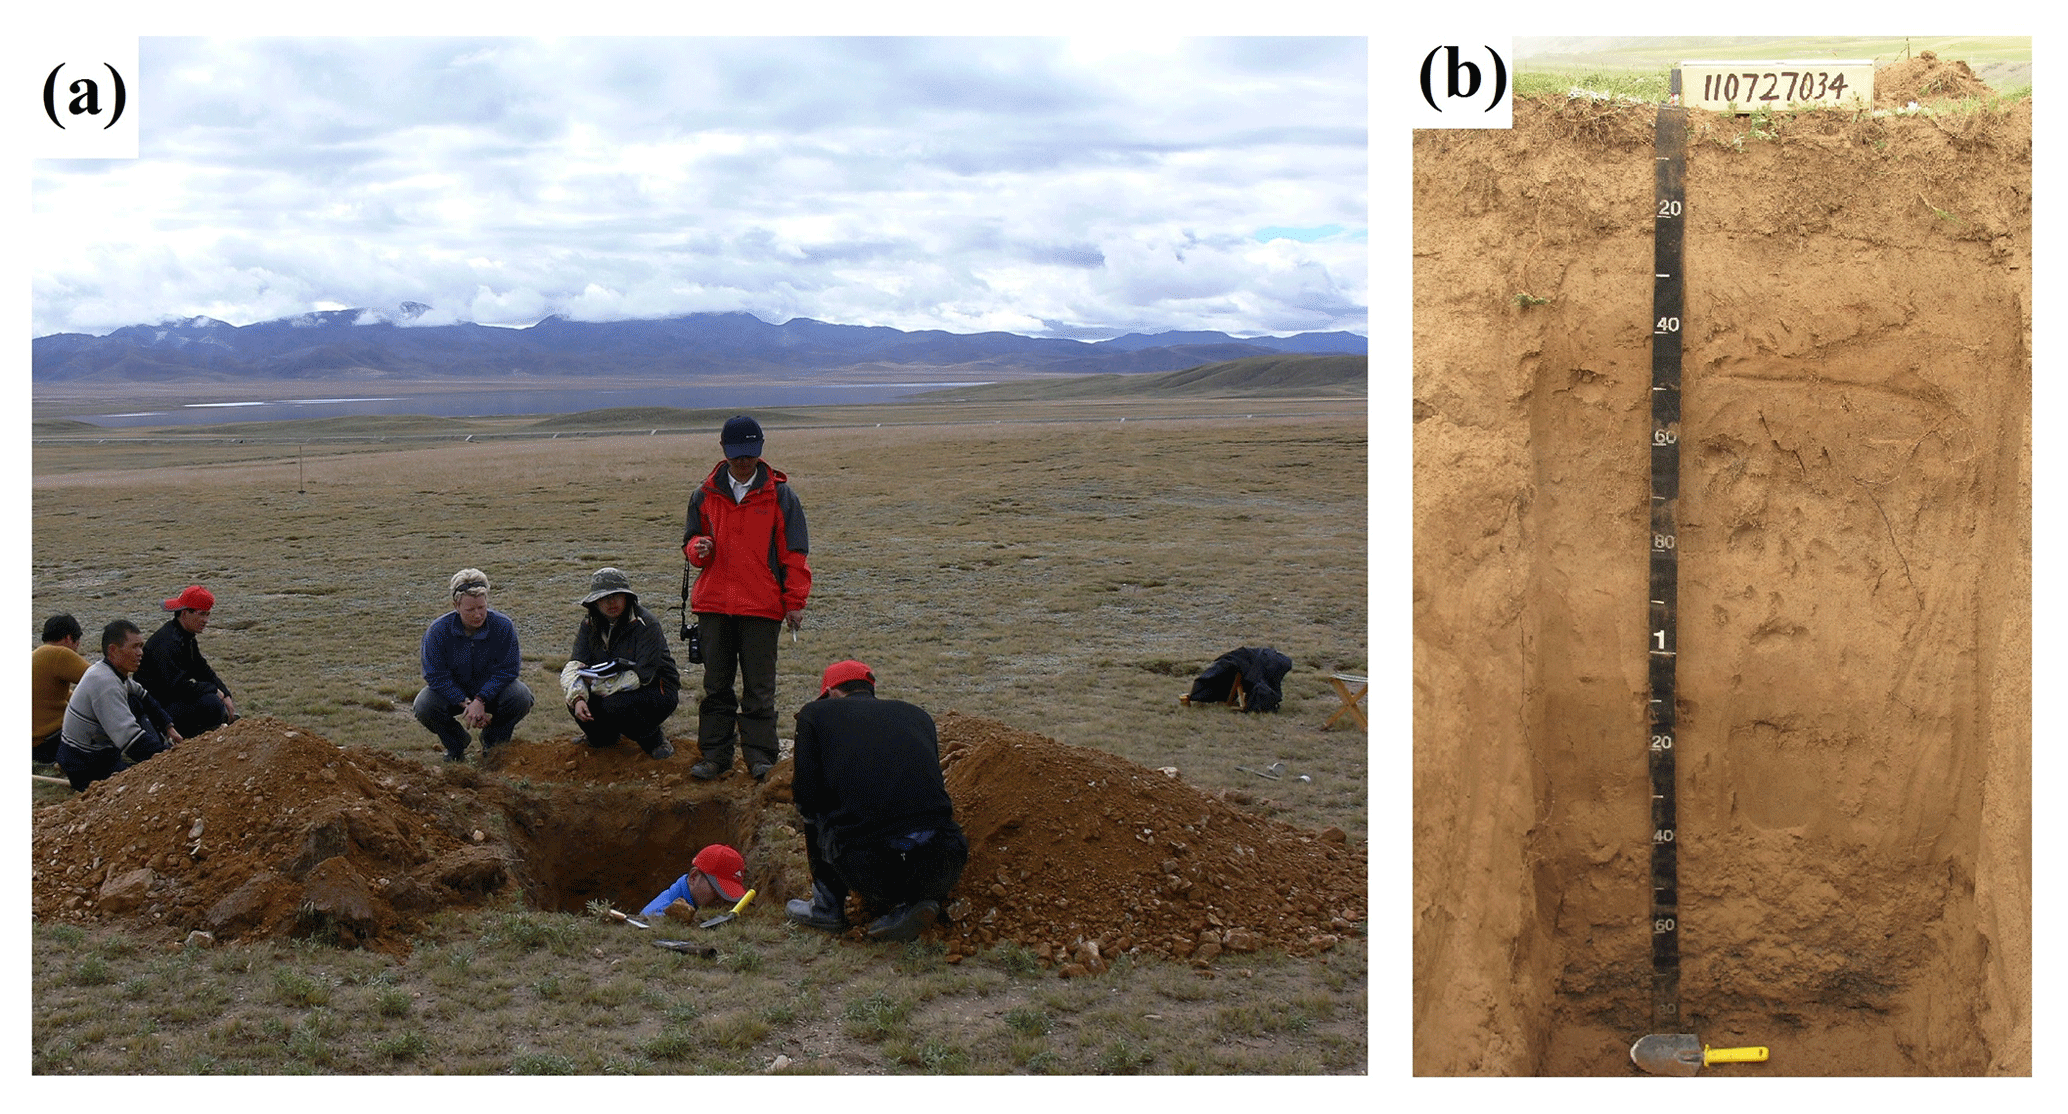
Field-measured data. A total of 200 soil pits were excavated between 2009 and 2011; 72 soil pits were excavated manually in 2009, and 128 soil pits were excavated with hydraulic excavators in 2010 and 2011. Most of the pits were deeper than 2 m, unless rock layers were detected. For each soil profile, we collected soil samples at depth intervals of 0–10, 10–20, 20–30, 30–50, 50–100, and 100–200 cm (Fig. 2). The bulk density samples were obtained for each layer using a standard soil sampler (5 cm diameter and 5 cm high stainless-steel cutting ring), and bulk density was calculated as the ratio of the oven-dry soil mass to the container volume. Soil samples for carbon analysis were air-dried, handpicked to remove plant detritus, and then sieved through a 2 mm mesh to calculate the volume percentage of the gravel. The SOC content was determined using the Walkley–Black method after soil samples were pretreated by air drying, grinding, and screening. The analyses were carried out in triplicate using subsamples, and the mean of three values was used as the SOC content. The SOCS was calculated using Eq. (1):
where Ti, BDi, SOCi,, and Ci are soil thickness (cm), dried bulk density (g cm−3), SOC content (%), and > 2 mm rock fragment content (%) at layer i.
-
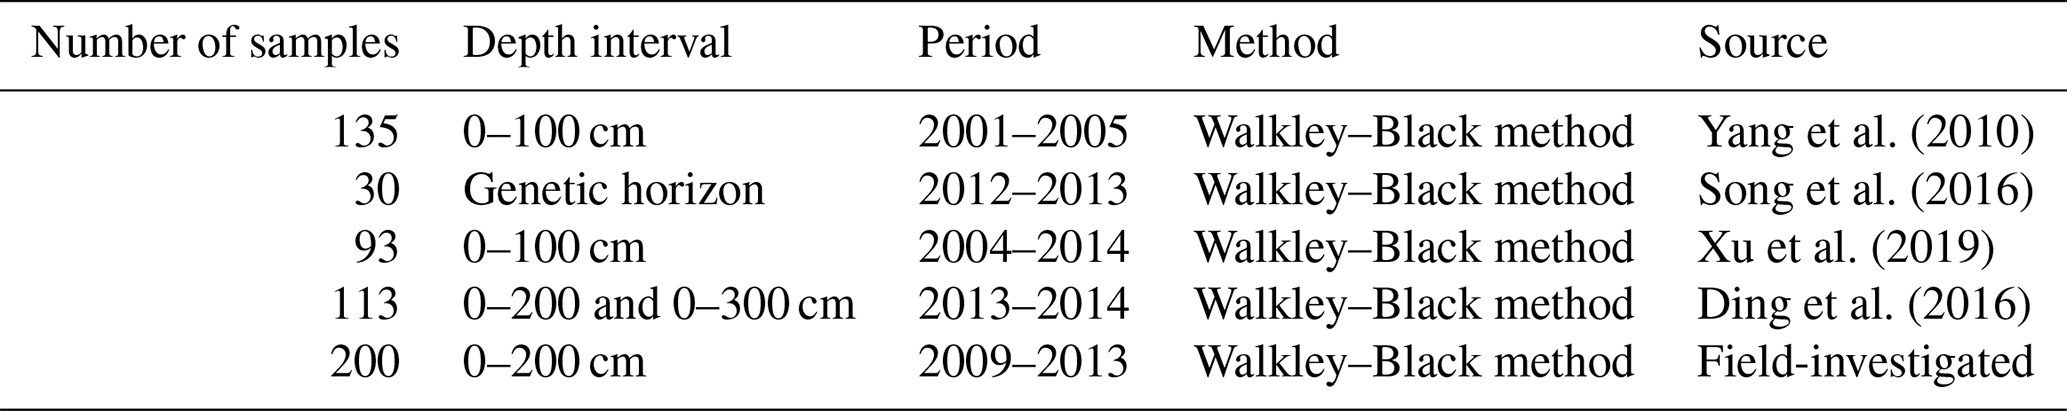
Available published data. We compiled all available information from the studies on SOC stocks in the Third Pole regions published after 2000. The following three criteria are used to screen the data of SOC stocks from the published literature: (1) the SOC data must be field investigated data; (2) eliminate sample data with missing geographic location information and sampling time; (3) SOC measuring methods were similar to our experimental procedure. Finally, the four papers selected encompassed the main ecosystems in the Third Pole, namely forest, grassland, desert, cropland, and shrub ecosystems. Specifically, data pertaining to a soil depth interval of 0–30 cm (n= 135) were retrieved from Yang et al. (2010) for the SOC database; data pertaining to a depth interval of 0–100 cm (n= 93) were obtained from Xu et al. (2019); data pertaining to a depth interval of 0–100 cm (n= 30) were retrieved from Song et al. (2016). Moreover, additional data for 0–3 and 0–2 m depth intervals (n= 113) were retrieved from Ding et al. (2016).
Table 1Summary of soil organic carbon datasets used in this study.
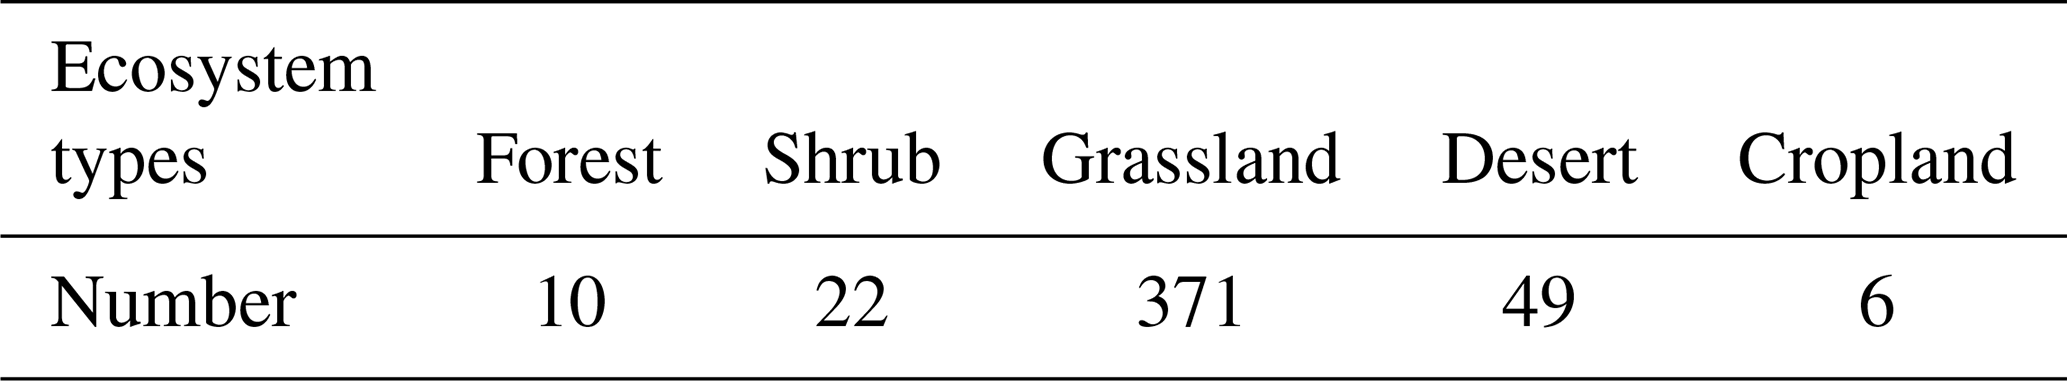
Combined with the available published data and field-investigated data (Table 1), the 458 soil pits (depth of 0–1 m) and 114 soil cores (depth of 0–3 m) can represent the ecosystem types and characters in large areas of the Third Pole (Table 2).
Table 2Number of soil sample points of different ecosystems in the Third Pole region.
2.2.2 Environmental covariates
The environmental covariates used in this study included a digital elevation model (DEM), remotely sensed data, and spatial interpolation data (Table S1).
A DEM at a spatial resolution of 1 km was downloaded from the International Scientific Data Service Platform (http://datamirror.csdb.cn, last access: 8 July 2021). Using the DEM data and SAGA GIS software, we calculated 14 terrain attributes: elevation (H), slope (S), aspect (A), plan curvature (PlanC), profile curvature (ProC), topographic wetness index (TWI), total catchment area (TCA), relative slope position (RSP), slope length and steepness factor (LS), convergence index (CI), channel network base level (CNB), channel network distance (CND), valley depth (VD), and closed depressions (CD).
Mean annual air temperature (MAT) and mean annual precipitation (MAP) data were downloaded from WorldClim version 2.1 (https://www.worldclim.org, last access: 8 July 2021). These datasets were generated by organizing, calculating, and spatially interpolating observed data from global meteorological stations for the period 1970–2000.
Normalized difference vegetation index (NDVI) data were obtained from the United States Geological Survey (USGS) (http://modis.gsfc.nasa.gov/, last access: 8 July 2021). The datasets underwent atmospheric, radiometric, and geometric correction, with a spatial resolution of 1 km for every 1-month interval over the period 2000–2015. The NDVI product was calculated using the maximum value composite (MVC) method, which can minimize the effects of aerosols and clouds (Stow et al., 2004).
The net primary productivity (NPP) and leaf area index (LAI) data were obtained from the Global Land Surface Satellite (GLASS, V3.1), which is estimated from the MODIS reflectance data using the general regression neural network (GRNN) method (Liang et al., 2013). Data were at a 1 km resolution for 8 d periods between 2000 and 2015 and were downloaded from the National Earth System Science Data Center of the National Science & Technology Infrastructure of China (http://www.geodata.cn).
The soil texture data, including sand, silt, and clay contents, were obtained from the SoilGrids250m database (http://www.isric.org, last access: 8 July 2021). The original 250 m spatial resolution data were resampled to a 1 km resolution based on nearest neighbor interpolation using ArcGIS 10.2 software (ESRI, Redlands, CA, USA).
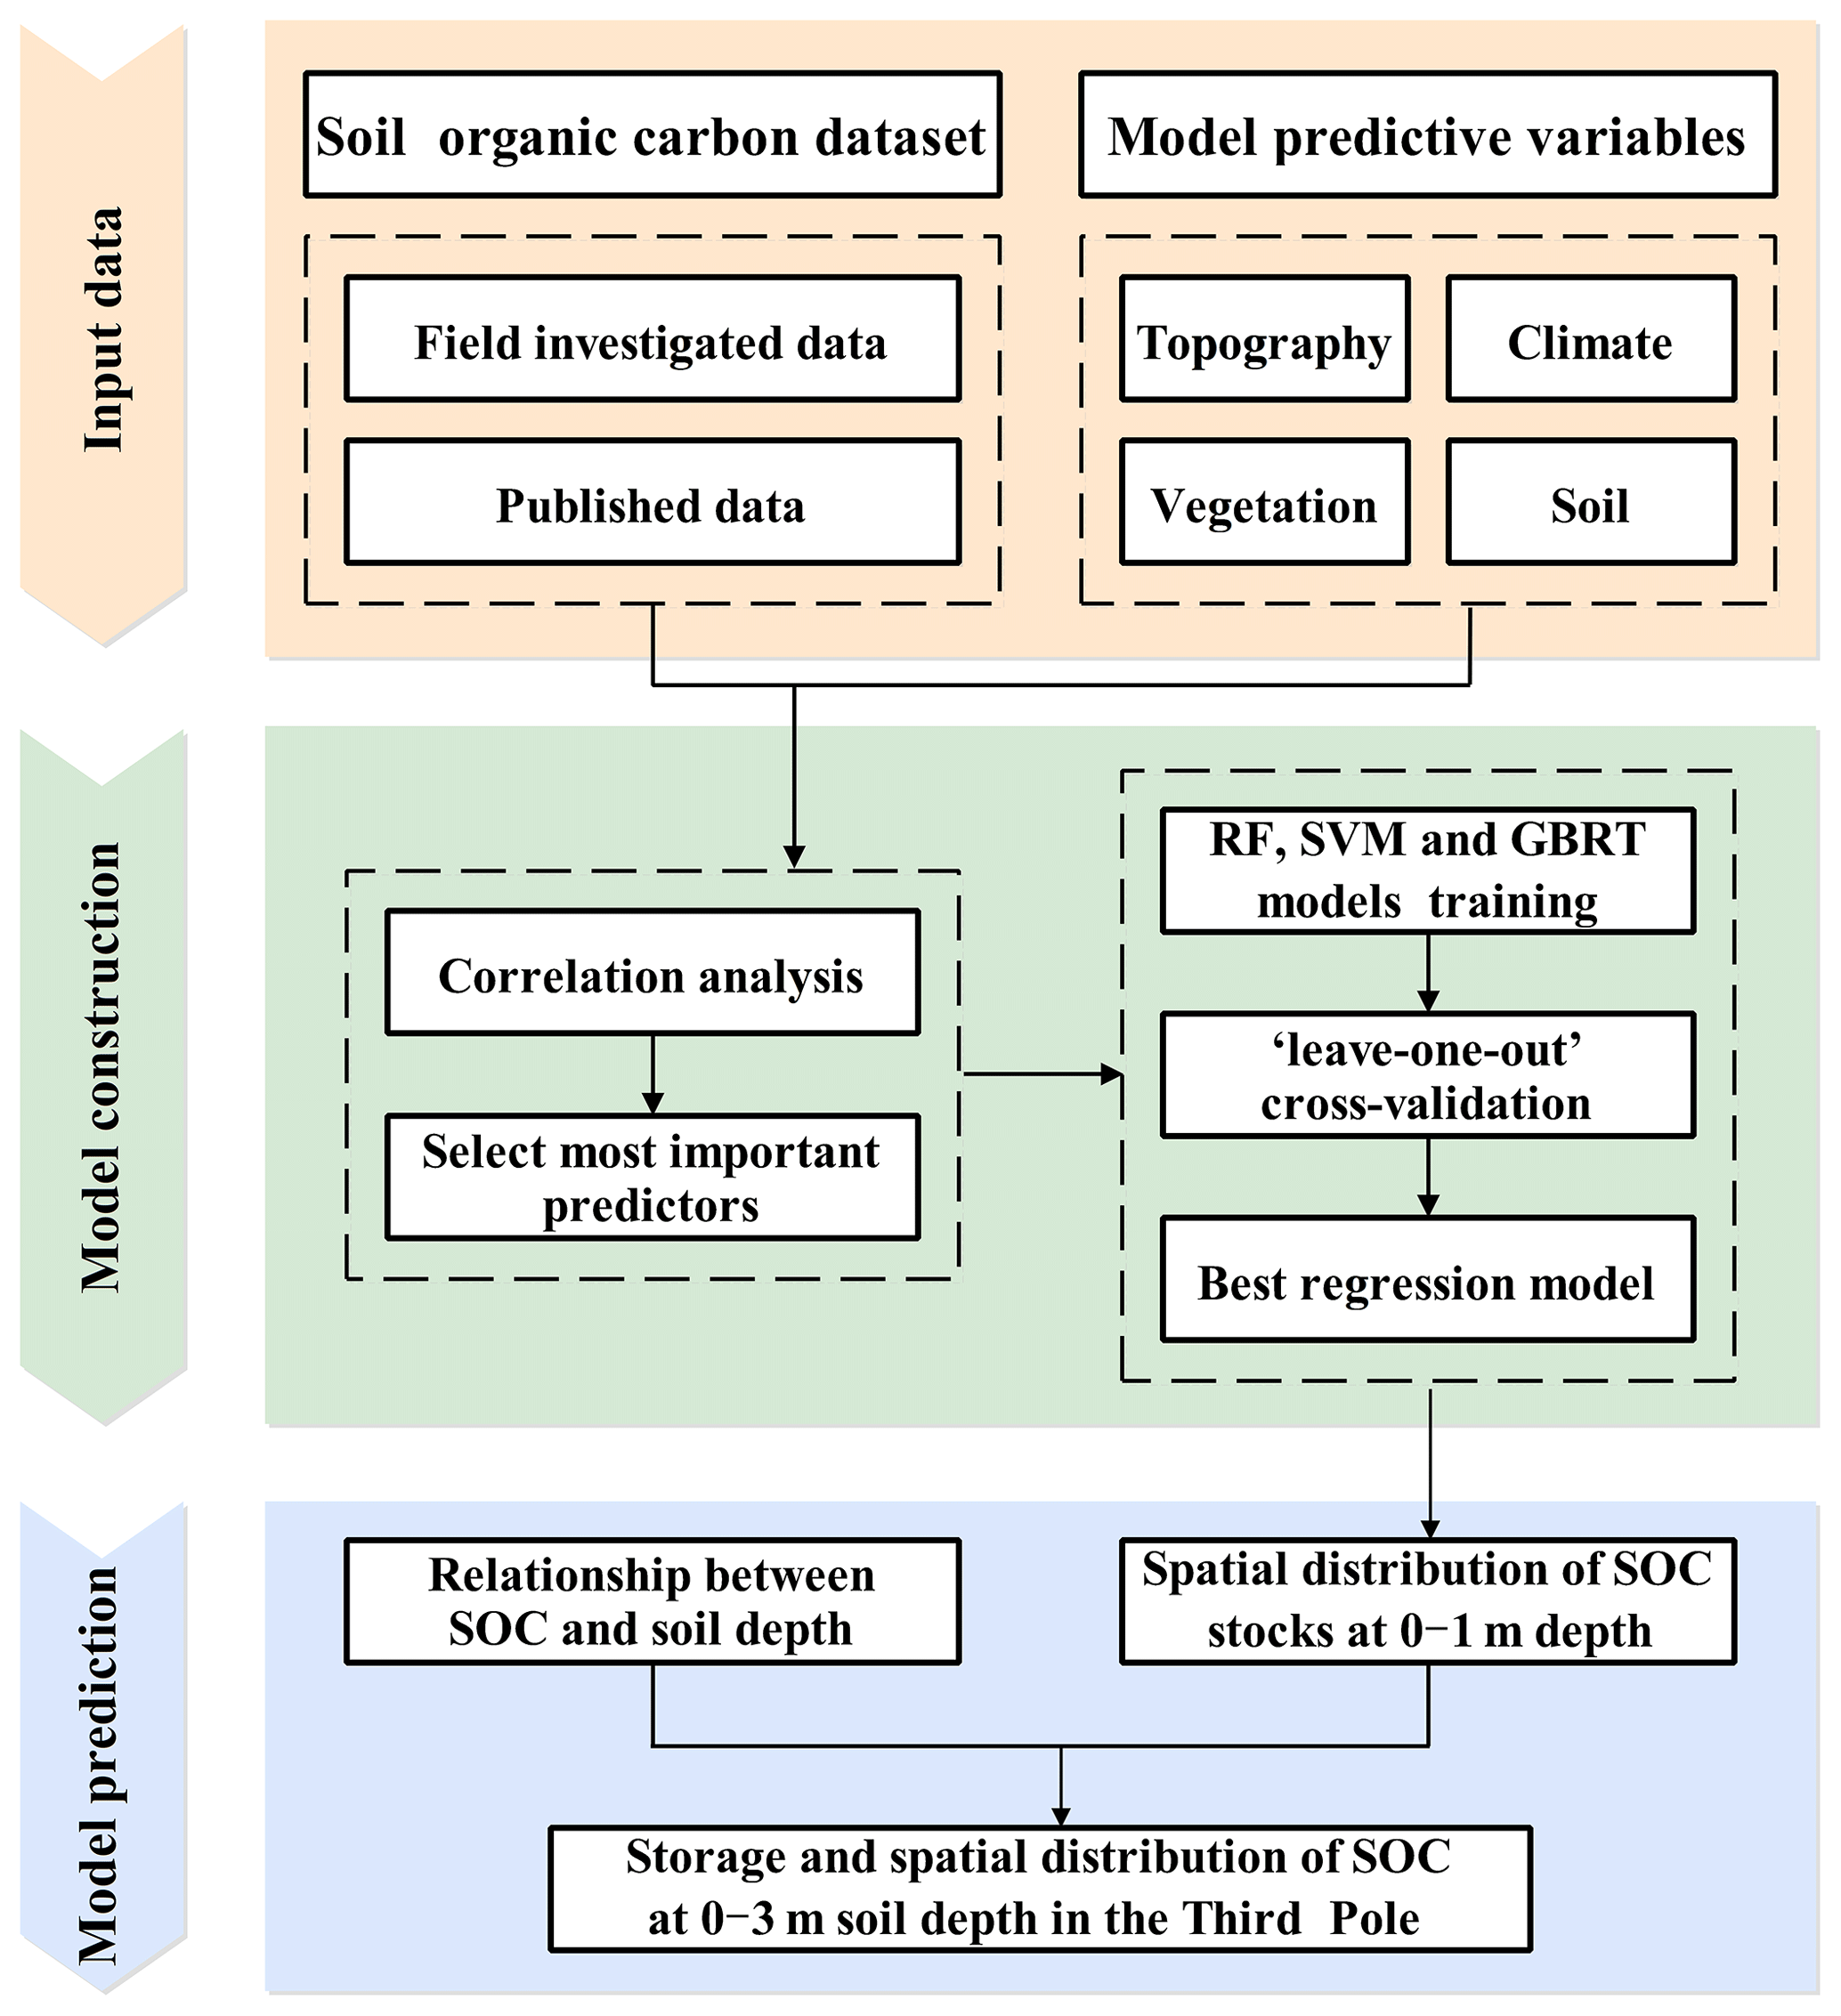
Figure 3Workflow diagram for predicting SOCS in this study. RF: random forest; SVM: support vector machine; GBRT: gradient boosted regression tree.
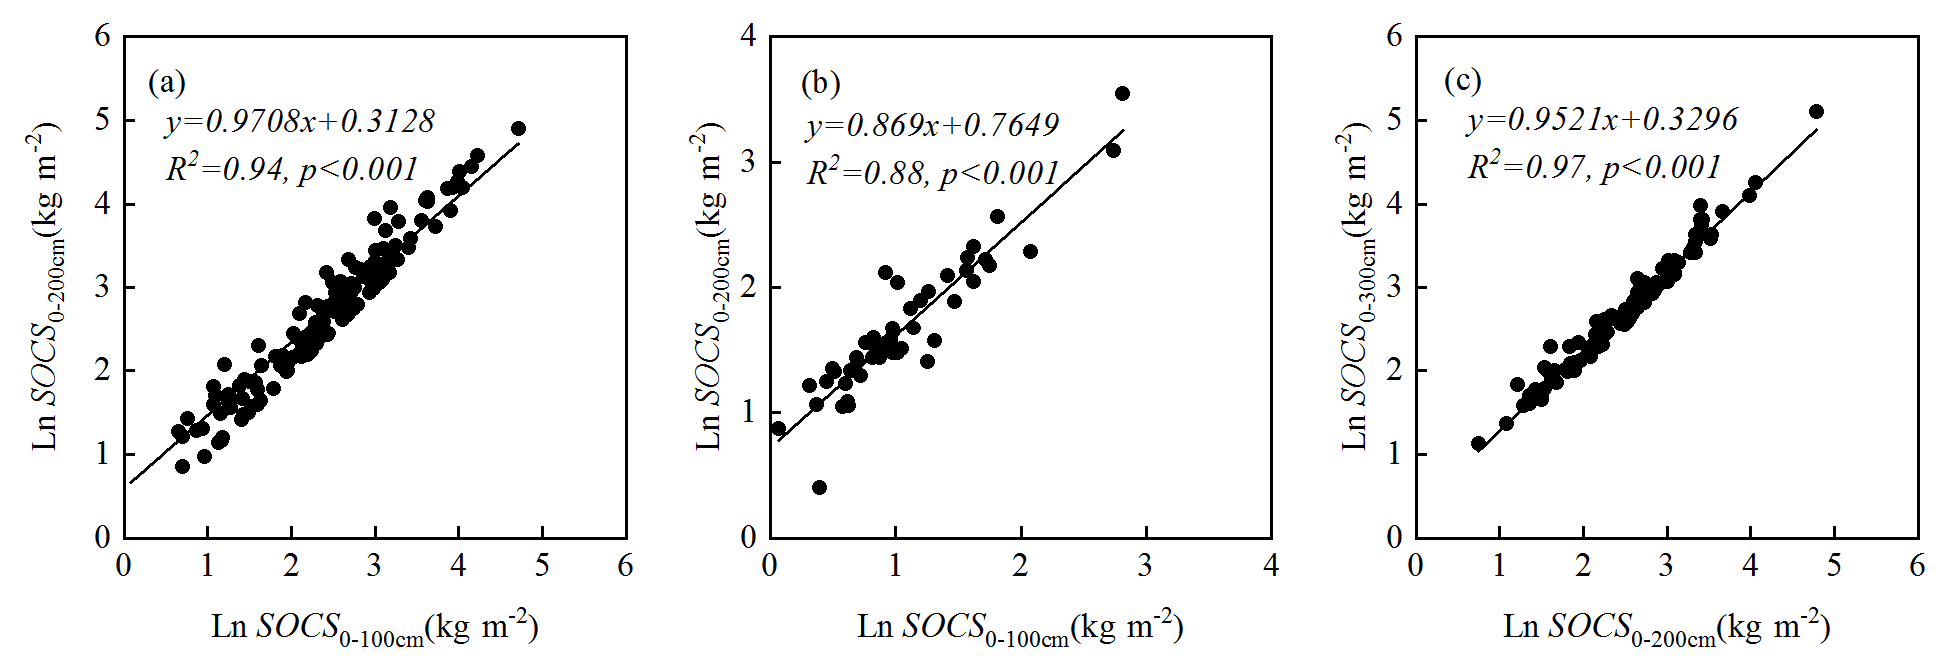
Figure 4Extrapolation function of the SOCS between soil depth intervals of (a) 0–100 and 0–200 cm in grassland ecosystems, (b) 0–100 and 0–200 cm in desert ecosystems, and (c) 0–200 and 0–300 cm in grassland ecosystems.
The land cover data used in this study were collected from the Land Cover Type Climate Modeling Grid (CMG) product (MCD12C1) from 2010 (https://lpdaac.usgs.gov, last access: 8 July 2021). The classification schemes in this study were based on the global vegetation classification scheme of the International Geosphere-Biosphere Programme (IGBP). We reclassified the land cover types into five major categories: forest, shrub, grassland, cropland, and desert.
2.3 Model predictions
2.3.1 Geographical modeling and selection of the predictors
In this study, three machine-learning methods (random forest (RF), gradient boosted regression tree (GBRT), and support vector machine (SVM)) were constructed and validated using the SOCS in the upper 30 cm of soil profiles along with associated variables (Fig. 3).
With respect to the machine-learning methods used, RF is used for classification, regression, and other tasks. It is operated by constructing a large number of decision trees during training and outputs the class as the classification or regression patterns of single trees (Tin Kam, 1998). The GBRT method is an iterative fitting algorithm composed of multiple regression trees and combines regression trees with a boosting technique to improve predictive accuracy (Elith et al., 2008). The SVM regression method uses kernel functions to construct an optimal hyperplane, which has a minimal total deviation (Drake and Guisan, 2006). Combined with the remotely sensed data and spatial interpolation data, RF, GBRT, and SVM regression were conducted to predict the SOCS in the Third Pole region. The “randomForest”, “gbm”, and “e1071” packages in R were used to perform RF, GBRT, and SVM analyses.
The 15 input variables (H, S, TWI, TCA, RSP, CNB, CND, VD, NDVI, NPP, LAI, MAP, MAT, sand, and silt) for the three regression models were selected because they can reflect the effects of topography, climate, vegetation, and soil properties on regional SOCS. Moreover, these variables were significantly associated with the SOCS at a depth interval of 0–30 cm (P<0.01, Table S2), whereas other environmental factors were eliminated due to their low correlation coefficients.
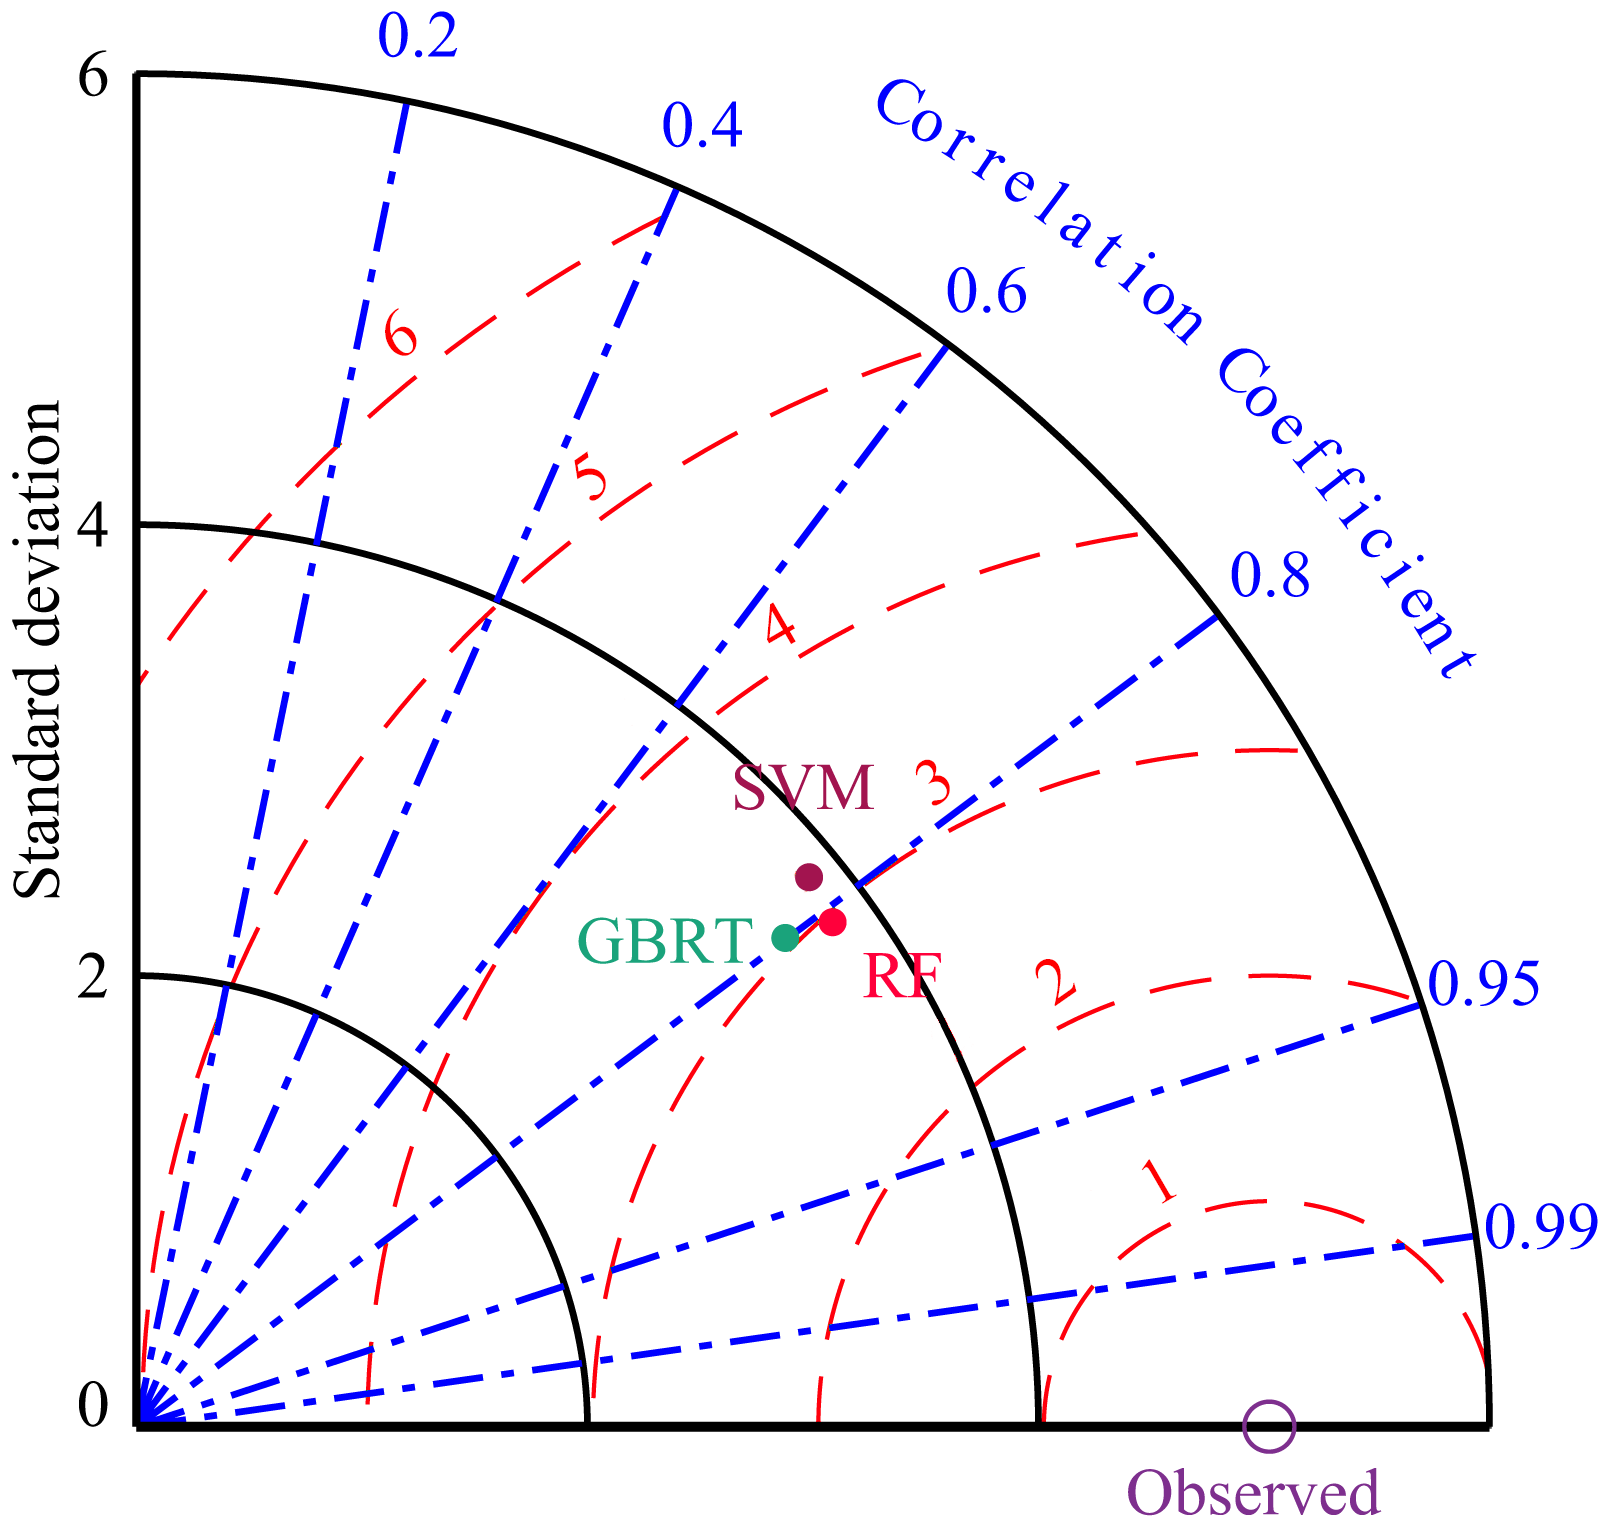
Figure 5A Taylor diagram used to evaluate the model performance of random forest (RF), support vector machine (SVM), and gradient boosting regression tree (GBRT) models, which were used to predict the SOCS in the upper 30 cm of soil profiles across the Third Pole. The contour centered on the observed indicates the root-mean-square error (RMSE, kg m−2) between the predicted value and observed value.

Figure 6“Leave-one-out” cross-validation for the RF model used to predict the SOCS at (a) 0–30 cm, (b) 0–50 cm, and (c) 0–100 cm depth intervals.
2.3.2 Estimation method of SOCS in deep soils
To generate the spatial distributions of SOCS in deep layers (below a depth of 100 cm), we established nonlinear extrapolation models (Fig. 4a–b; Eqs. 2–4) between the SOCS in the upper 100 cm interval and the SOCS in the upper 200 cm interval using the data from the 200 soil pits in grassland (n= 151) and desert ecosystems (n= 49, Fig. S1). A third extrapolation model between the SOCS in the upper 200 cm interval and the SOCS in the upper 300 cm interval in grassland ecosystems was established using the data from 114 sites reported by Ding et al. (2016) (Fig. 4c; Eq. 4).
where lnSOCS, lnSOCS, and lnSOCS are the natural logarithms of the SOC stocks (kg m−2) in grassland ecosystems at the depth intervals of 0–100, 0–200, and 0–300 cm, respectively; likewise, lnSOCS and lnSOCS are the natural logarithms of the SOC stocks (kg m−2) in desert ecosystems at the depth intervals of 0–100 and 0–200 cm, respectively.
It is impossible to build extrapolation models directly to estimate deep SOC storage in forest, shrub, and cropland ecosystems, which lack deep soil pits below 100 cm. Therefore, according to the vertical distribution of the SOCS associated with different land cover types worldwide from Jobbagy and Jackson (2000), the extrapolation models shown in Eqs. (5)–(6) were established indirectly to estimate deep SOC storage (below a depth of 100 cm) in areas of these land cover types (Fig. S1). Correspondingly, Eq. (7) was established to estimate the deep SOC storage (below a depth of 200 cm) in desert ecosystems due to a lack of deep soil pits below 200 cm.
where β100–200 cm and β200–300 cm are proportion of SOCS100–200 cm and SOCS200–300 cm in SOCS0–100 cm, respectively.
The calculation of the SOC storage (Pg) for a region generally uses Eq. (8):
where SOCSi is the SOCS (kg m−2) at site i, and A is the area (m2) of each grid unit.
2.3.3 Model validation
To test the predictive effects of the three machine-learning methods, “leave-one-out” cross-validation was conducted. We used the R2 value, the mean error (ME, Eq. 9), and the root mean square error (RMSE, Eq. 10) to evaluate the performance of the prediction models.
where D(xi) is the measured SOCS, D∗(xi) is the predicted SOCS, and n is the number of validation sites.
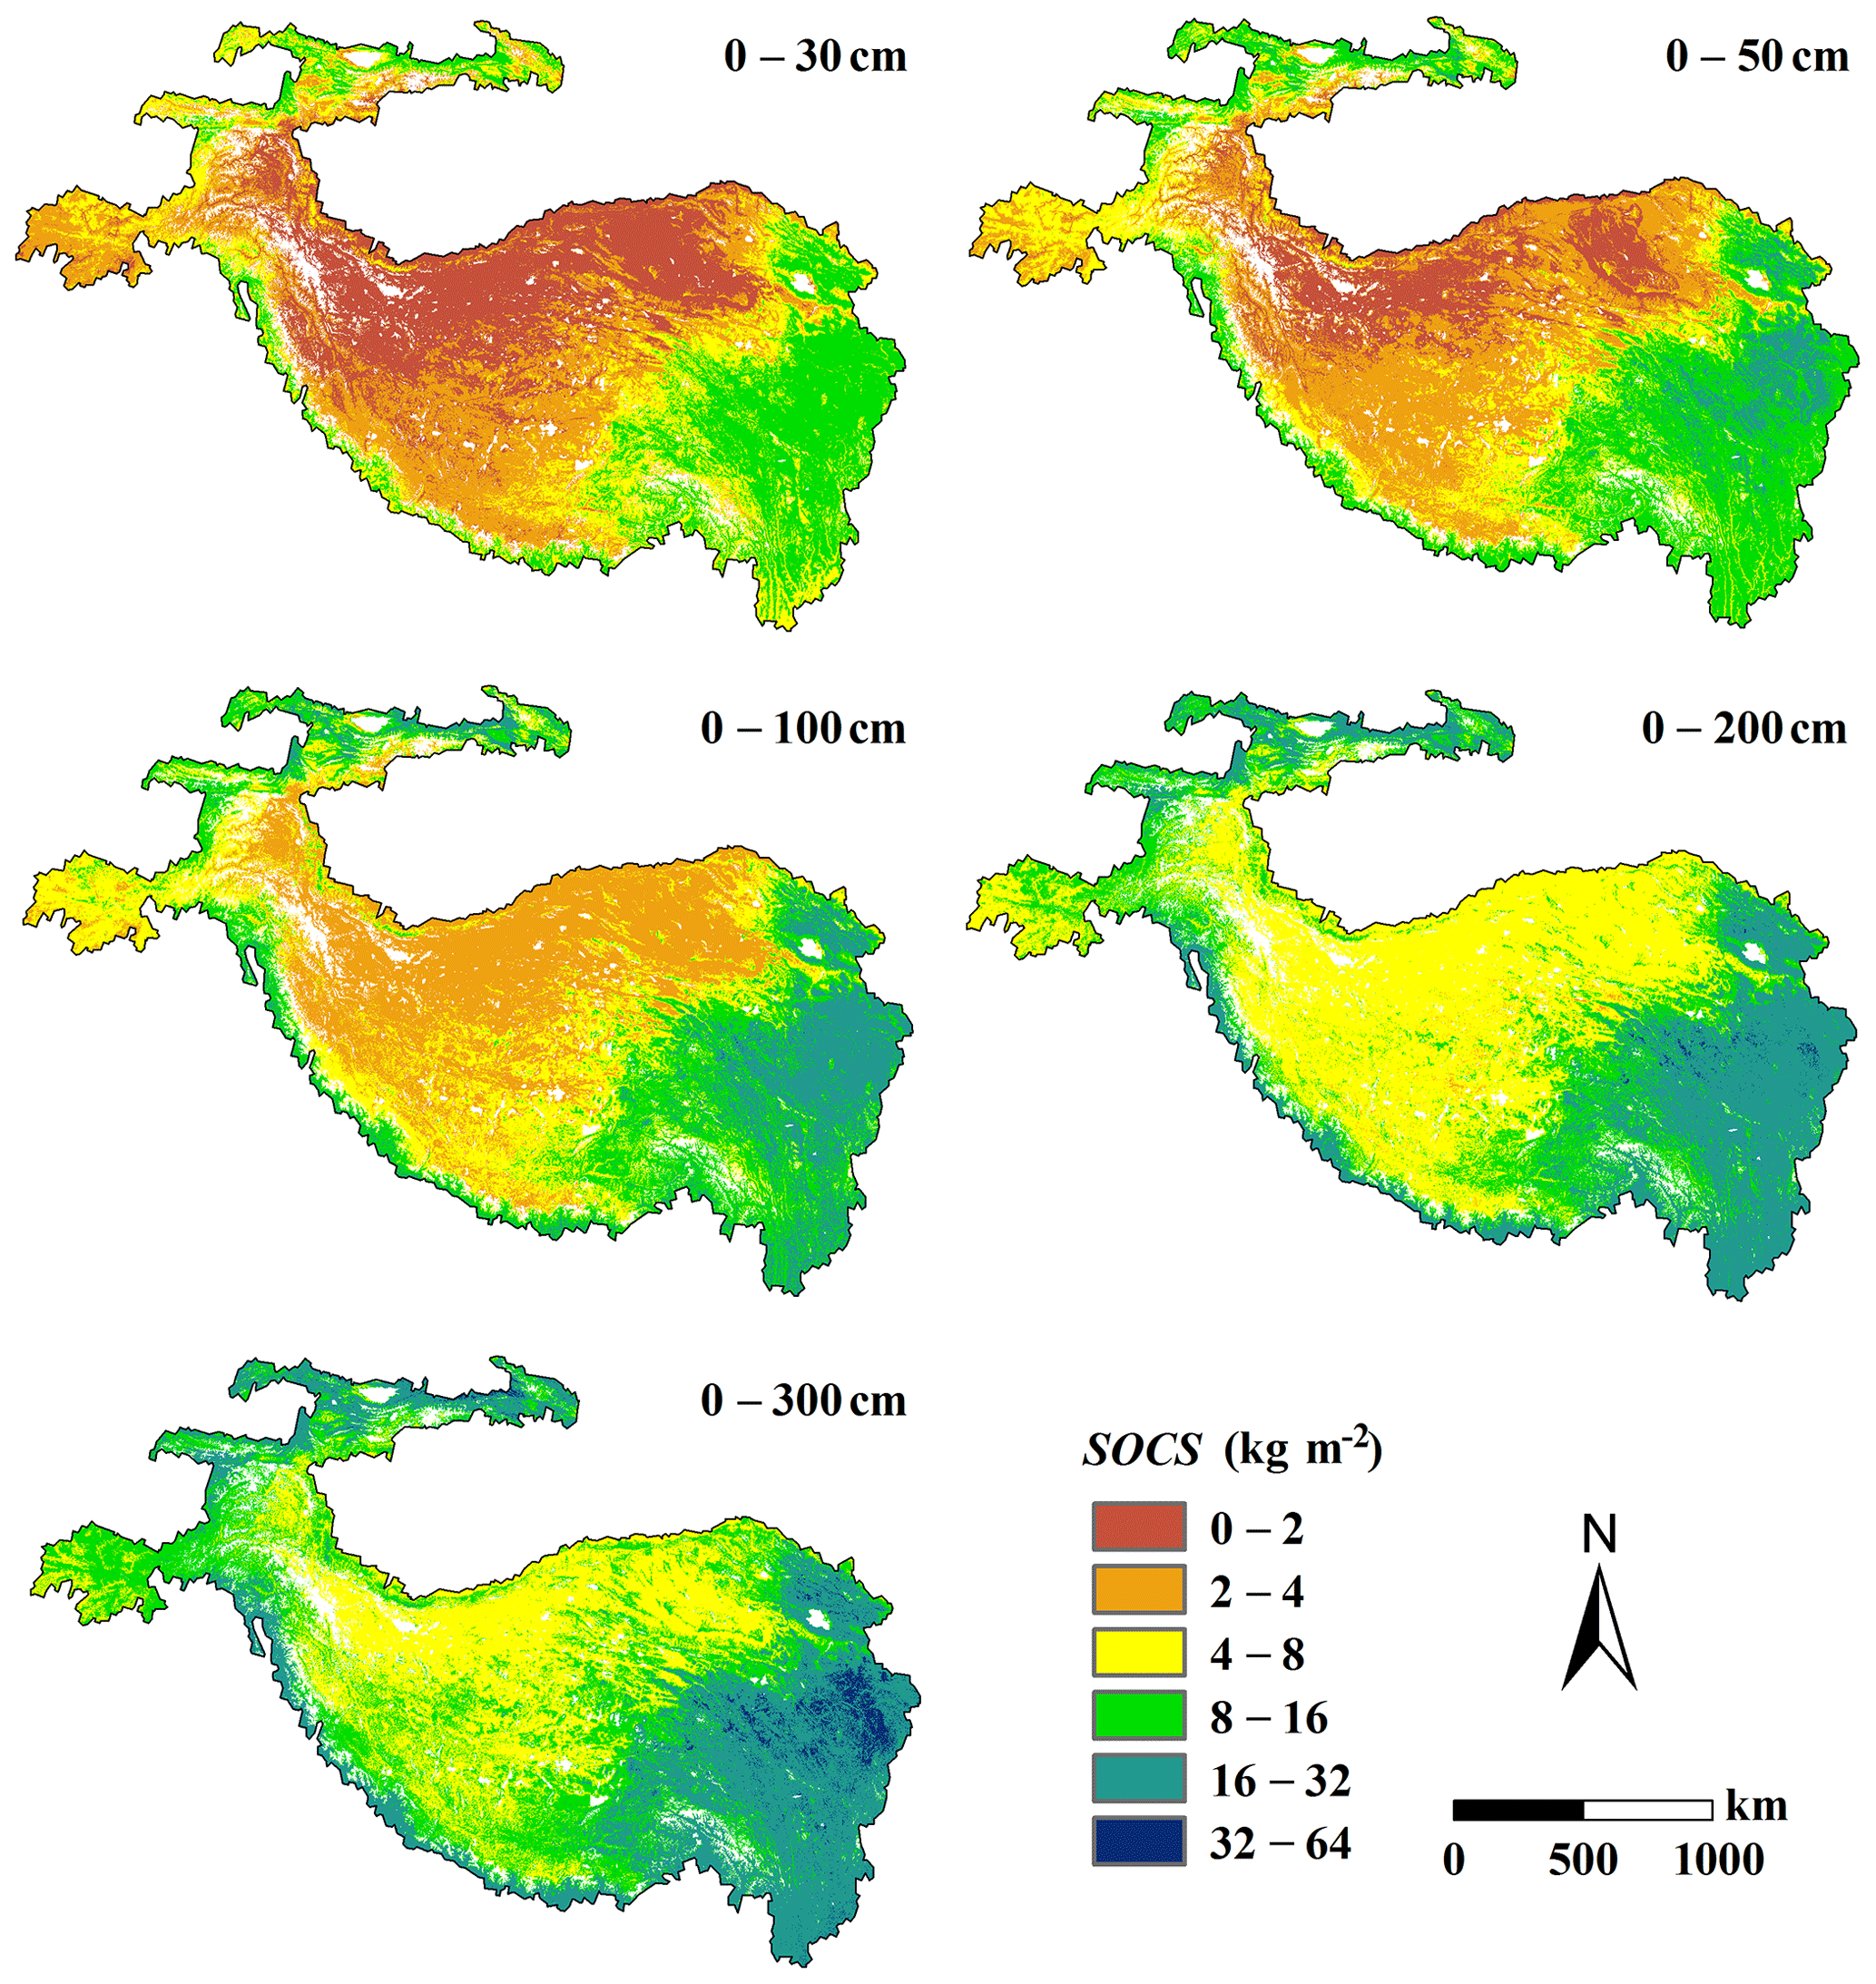
Figure 7Spatial distribution of SOCS at different depth intervals over the Third Pole.
Table 3Summary of the estimated mean SOC stocks and storages in permafrost and seasonally frozen ground of the Third Pole.
3.1 Performance of machine-learning methods
The results of the “leave-one-out” cross-validation showed that the RF model exhibited a Pearson's correlation coefficient of 0.81, which was higher than that of the GBRT model (0.79) and SVM model (0.77). In addition, the RMSE of the RF model (3.01 kg m−2) was lower than that of the GBRT model (3.11 kg m−2) and SVM model (3.21 kg m−2) for the upper 30 cm of the soil profile (Fig. 5). These results suggest that the RF model provides a better tool for predicting the spatial distribution of SOCS in the Third Pole region. Moreover, in order to further discuss the simulation accuracy of the RF model in this study, “leave-one-out” cross-validations were conducted for depth intervals of 0–50 and 0–100 cm. The results revealed high R2 as well as low RMSE and ME values (Fig. 6).
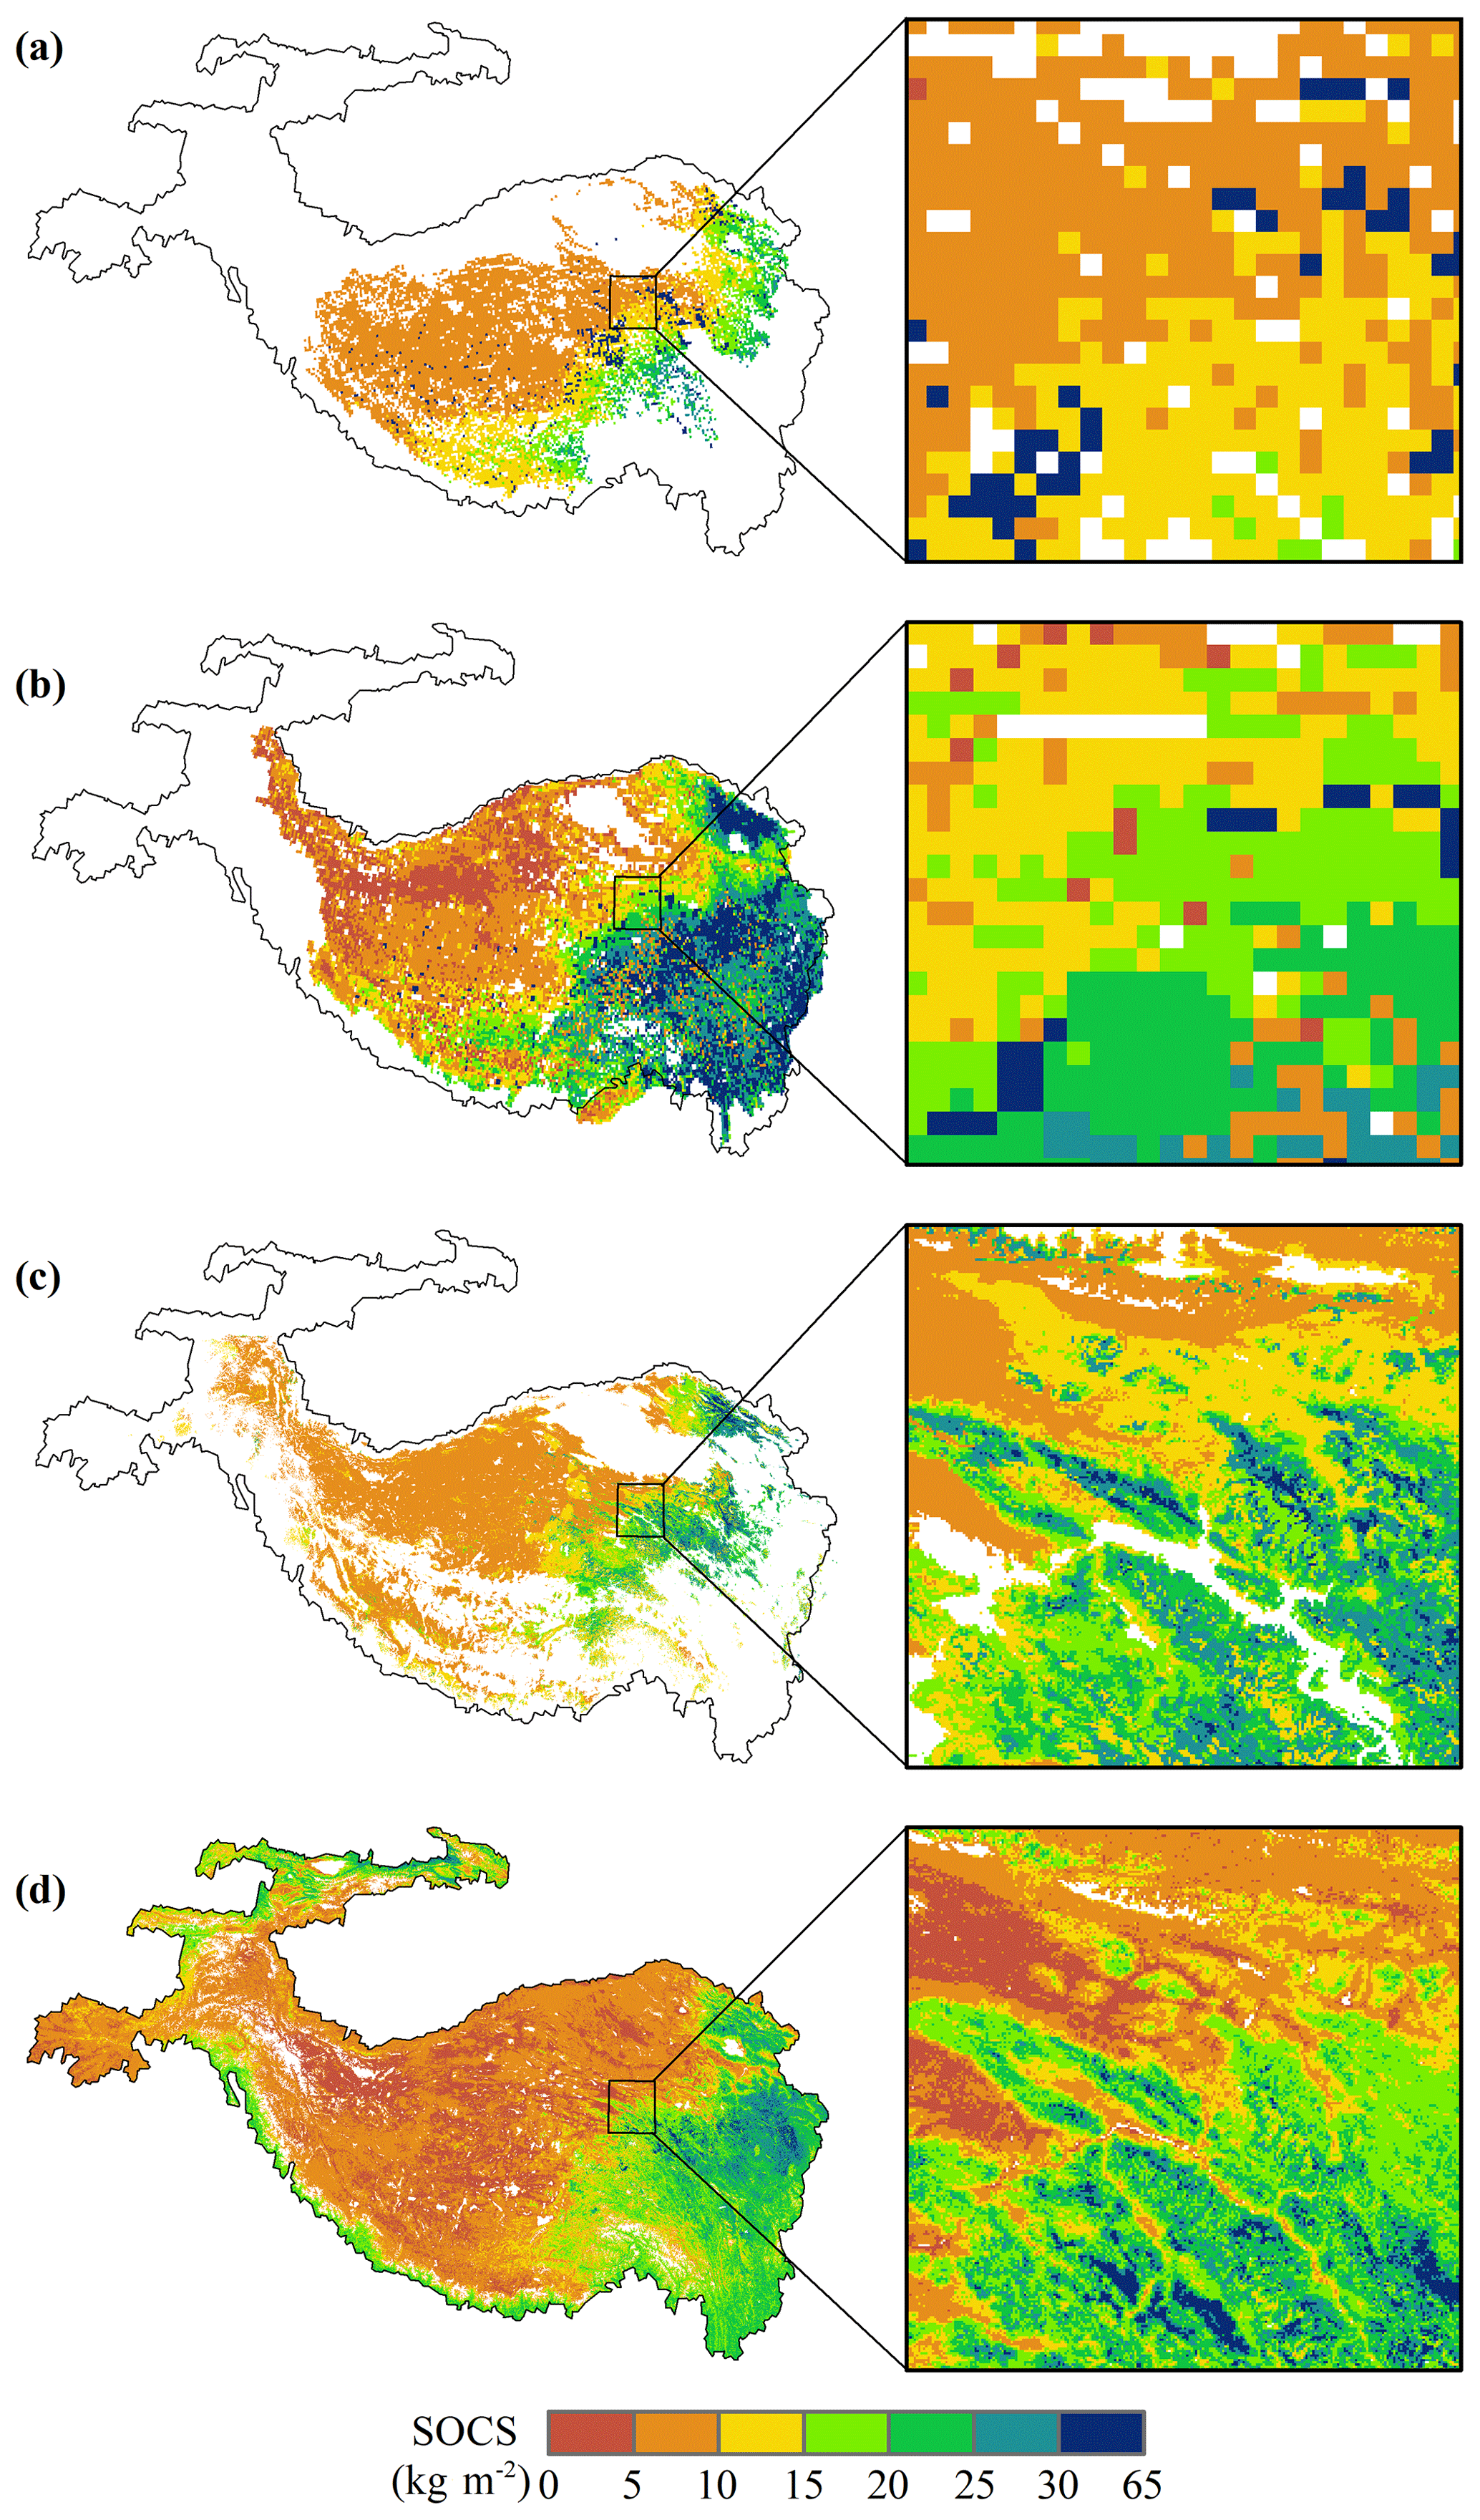
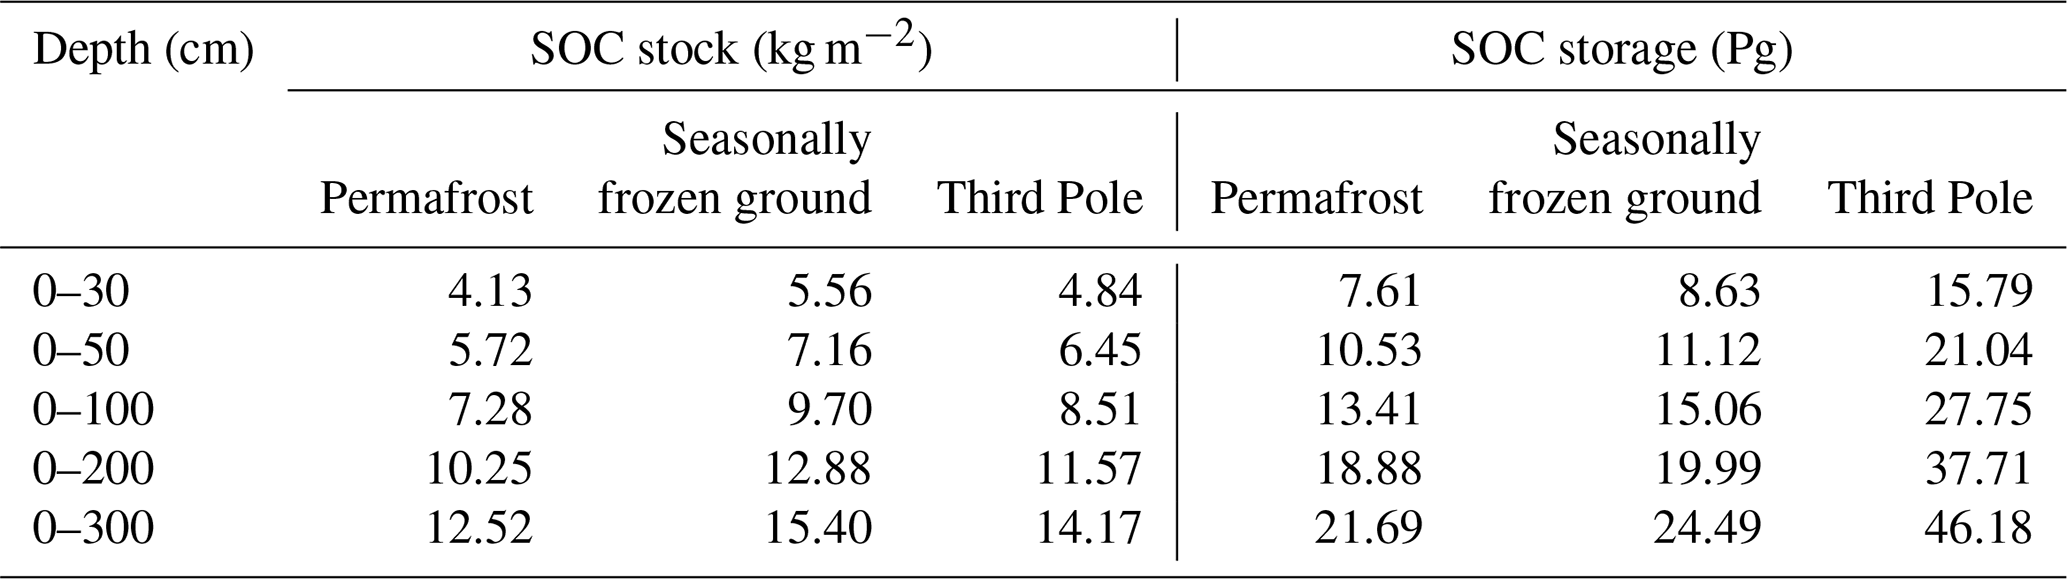
Figure 8Comparison of spatial details of the predictions with the previous studies: SOCS at 0–300 cm depth in the map excerpt of Budongquan area of Qinghai province, China. (a) Ding et al. (2016); (b) Ding et al. (2019); (c) Wang et al. (2020); (d) this study.
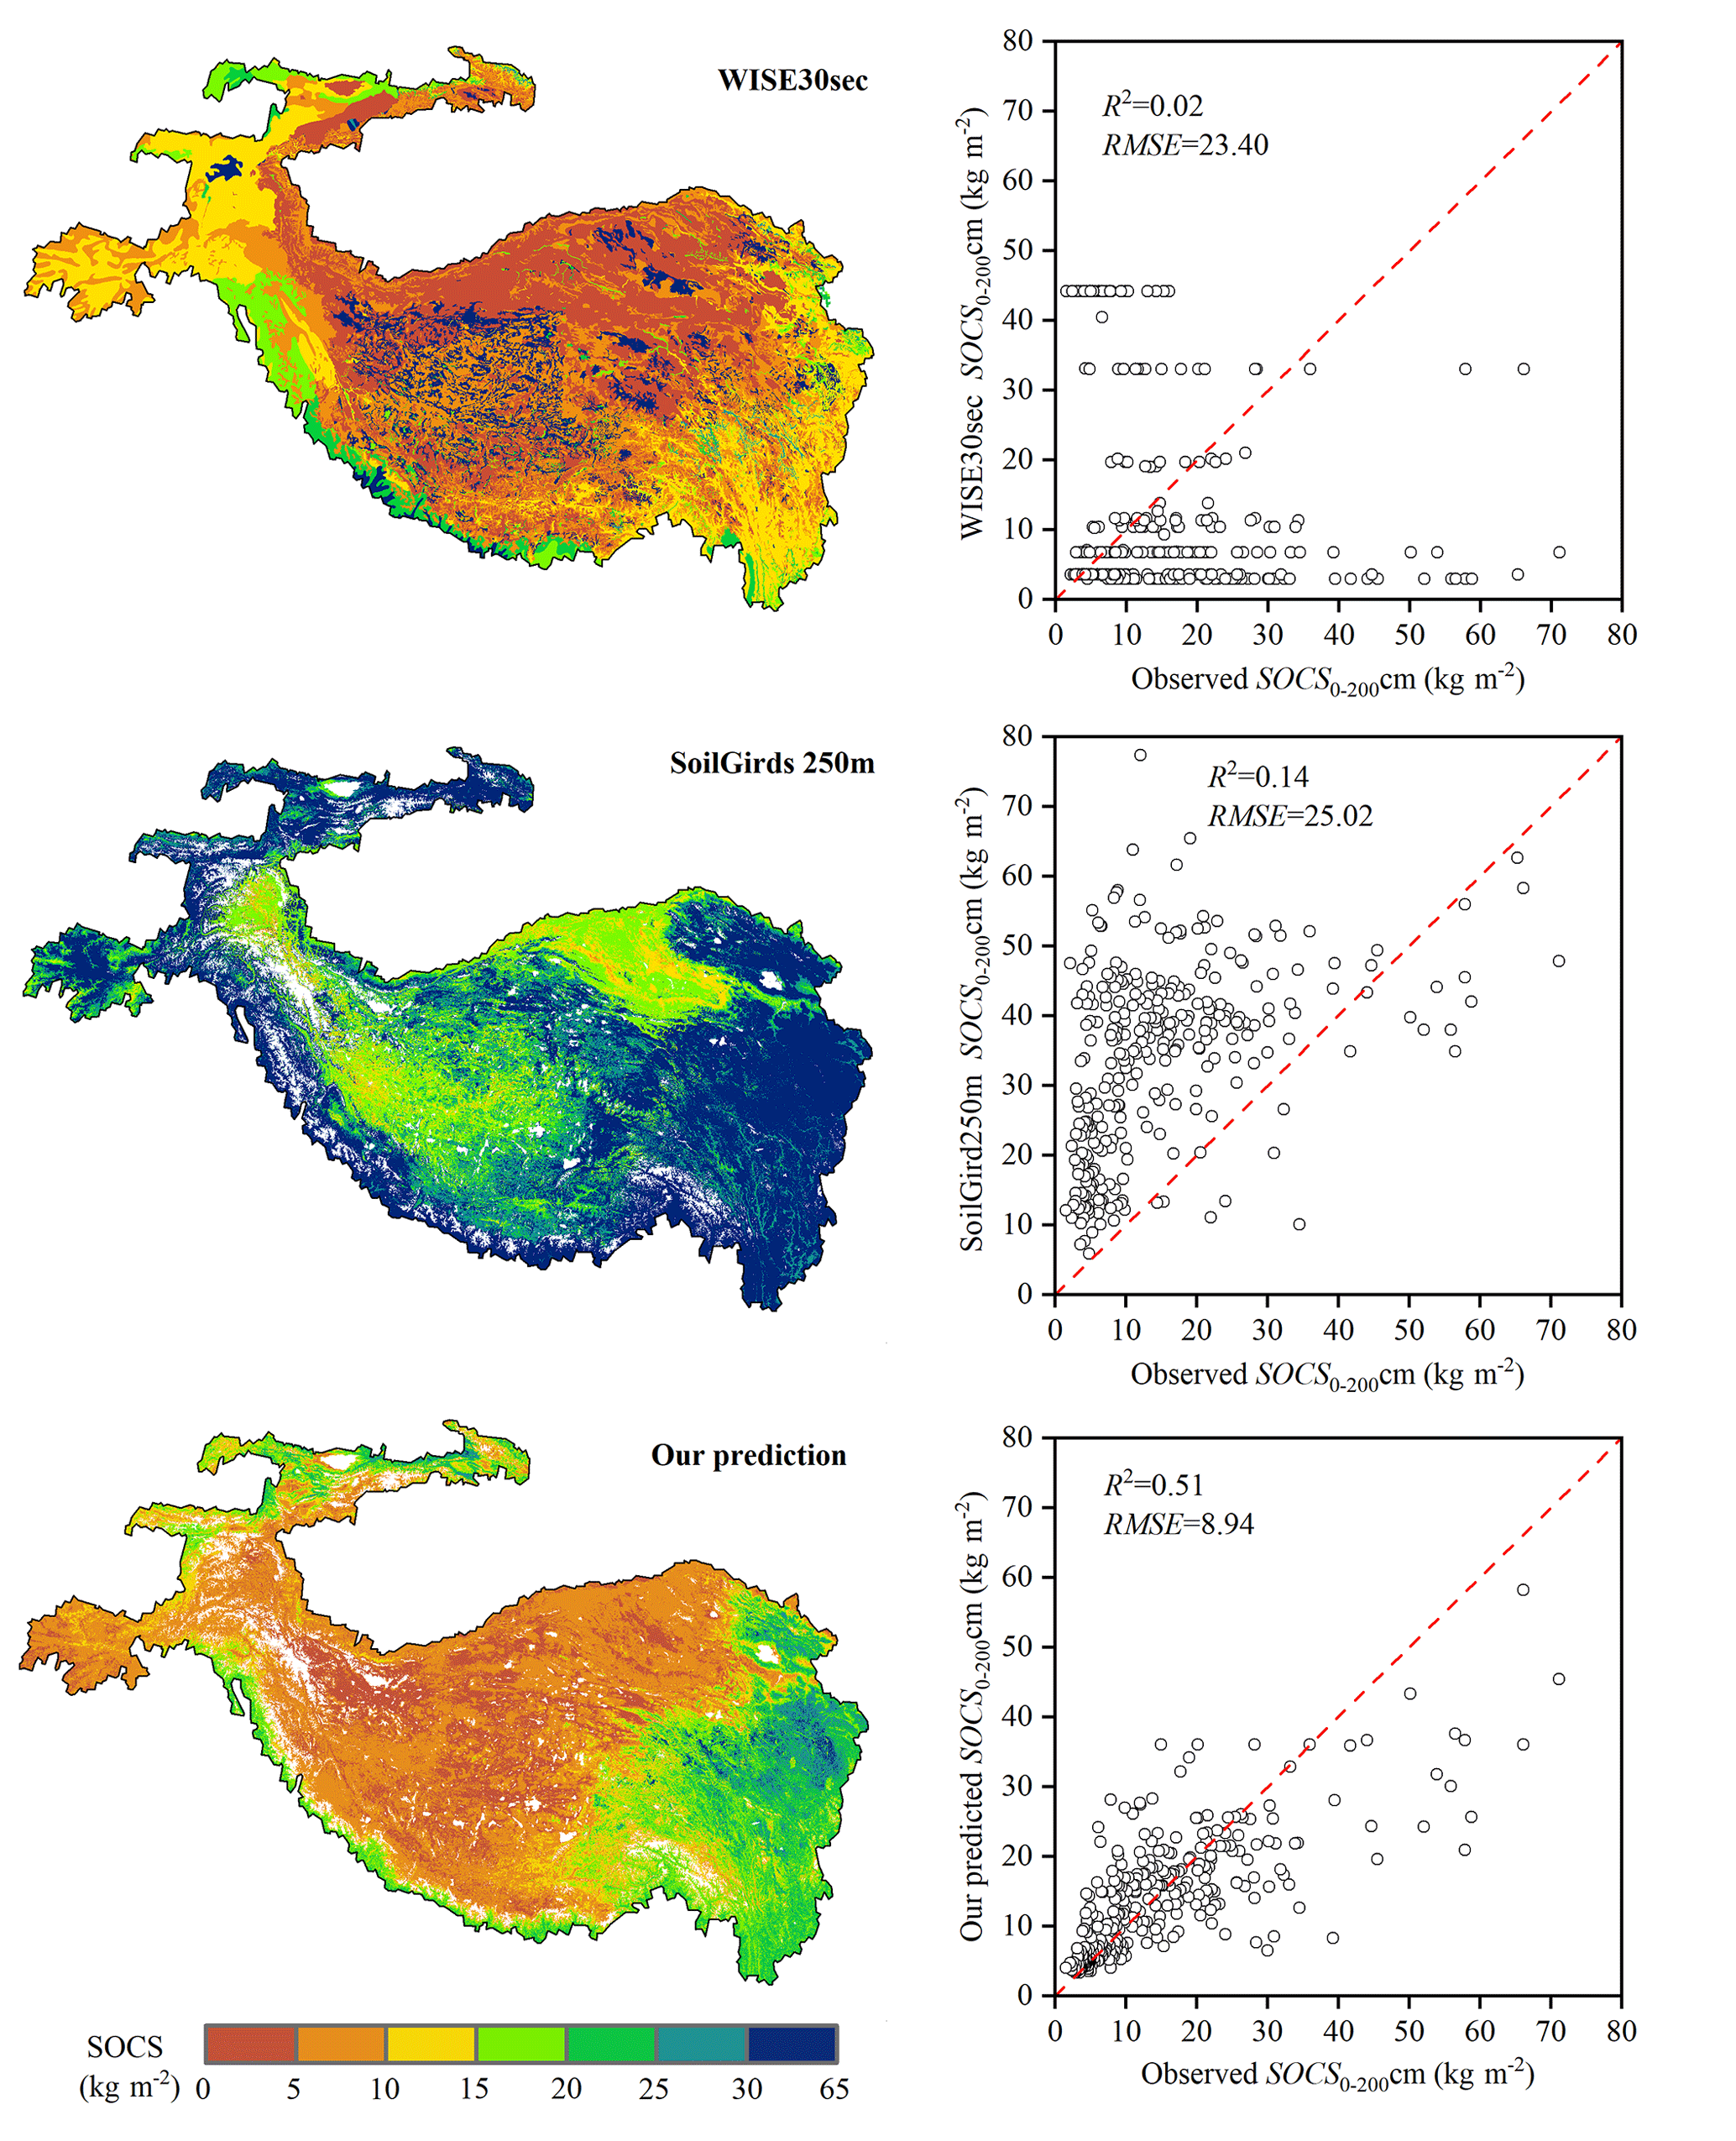
Figure 9Comparison of the SOCS prediction with the WISE30sec from Batjes (2016) and the SoilGrids250m from Hengl et al. (2017) at 0–200 cm depth intervals based on the 213 SOCS data from Ding et al. (2016) and field investigations.
3.2 Storage and spatial distribution of soil organic carbon
Figure 7 shows a large spatial variability of the SOCS across the Third Pole region, whereby an overall decreasing trend can be observed from the southeast towards the northwest. The wetland area in the eastern region of the Third Pole (Ruoergai) had the highest predicted SOCS for a depth interval of 0–300 cm (> 32 kg m−2), whereas the northern region (Qiangtang Plateau and Qaidam Basin) had the lowest SOCS (< 8 kg m−2). The estimated mean SOCS for the entire Third Pole region at depth intervals of 0–30, 0–50, 1–100, 0–200, and 0–300 cm was 4.84, 6.45, 8.51, 11.57, and 14.17 kg m−2, respectively. Correspondingly, the total estimated SOC storage was 15.79, 21.04, 27.75, 37.71, and 46.18 Pg at 0–30, 0–50, 0–100, 0–200, and 0–300 cm, respectively (Table 3). In addition, the SOCS decreased with increasing soil depth across the Third Pole region, with 34.26 % of the total SOC storage for a depth interval of 0–300 cm being contained in the uppermost 30 cm and only 17.89 % in the 200–300 cm depth interval.
Compared with the area of seasonally frozen ground, the mean SOCS and total SOC storage in the permafrost region were lower in each soil layer. The estimated amount of SOC stored at a depth interval of 0–300 cm in the permafrost and seasonal frozen ground zone was 21.69 and 24.49 Pg, respectively, which accounted for 46.97 % and 53.03 % of the total SOC pools, respectively.
In this study, we provided the new version of 1 km resolution maps of SOCS across the Third Pole at 0–300 cm depth intervals, which largely makes up for the deficiencies of previous studies (Ding et al., 2016, 2019; Wang et al., 2020). On the one hand, our predictions have higher resolution than those studies. Take an example and focus on a 4.5×10⁴ km2 local area situated in the Budongquan area of Qinghai province, China (Fig. 8). It can be seen from the excerpts of the map that our prediction is much more detailed than previous studies. Thus, our predictions better represented spatial variation of the SOCS across the Third Pole region, especially for those regions with large heterogeneity. On the other hand, these reports focused mostly on the permafrost regions rather than the whole Third Pole (Ding et al., 2016; Wang et al., 2020). To date, few studies have investigated the SOC storage and spatial patterns in areas of seasonally frozen ground in the Third Pole region. In this study, we created high spatial resolution data of SOCS distribution in the whole Third Pole by compiling all the field data and using machine-learning methods, thus providing more accurate data than previous studies.
In addition, our predictions were much more accurate than the existing global SOC datasets. Figure 9 shows accuracy assessments of our predictions, the SoilGrids250m from Hengl et al. (2017), and the WISE30sec SOCS data from Batjes (2016) at 0–2 m depth intervals based on the 213 SOC stock data from Ding et al. (2016) and field investigations. We found that our prediction had a higher R2 value and lower RMSE value than SoilGrids250m and WISE30sec. The lowest accuracy was found for the WISE30sec maps, showing the advantage of digital soil mapping based on machine learning over conventional mapping method based on the vegetation–soil units (Liu et al., 2020). The lower accuracy of SoilGrids250m than our predictions is mainly because of serious overestimation of bulk density, as well as the neglected influence of coarse gravel content (Hengl et al., 2017). Soil profile data used in SoilGrids250m at the Third Pole region are mainly from China's second national soil survey, which lacked accurate information on coarse-gravel content and bulk density (Shi and Song, 2016). In addition, almost all of these soil profiles are within 1 m depth, which could be a great instability in calculating the deeper SOC by SoilGrids250m. Moreover, the global model building could be less accurate than the regional model building when focusing on a regional extent (Vitharana et al., 2019; Liu et al., 2020). Consequently, our predictions were much more accurate than the existing maps of SOCS.
Our study provides new and more accurate data on SOC storage and spatial patterns for a depth interval of 0–3 m at a 1 km resolution over the Third Pole region, thus providing basic data for future studies pertaining to Earth system modeling. We note that a lack of deep soil pits in forest, shrub, and cropland ecosystems (Fig. S2) means some uncertainties in the estimation of deep SOC pools remain; however, the collective area of these ecosystems accounts for < 6% of the total area of the Third Pole region and may have a relatively small influence on total SOC pools (Fig. S1). Regardless, there is a need for large-scale soil surveys that include these areas in order to obtain more accurate information on the SOC storage and distribution in the Third Pole region. Furthermore, regional SOC pools are affected by many other factors, such as soil moisture (Wu et al., 2016) and grazing activities (Zhou et al., 2017), which were not considered in our study due to lack of high-resolution data with a high accuracy. Future work should consider the influence of these factors on SOC at a regional scale to obtain more accurate datasets.
The datasets of SOC stocks distribution in GeoTiff format are available at https://doi.org/10.5281/zenodo.4293454 (Wang et al., 2020). The file name is “TP-SOC-d.tif”, where d represents soil depth; for example, “TP-SOC-30.tif” represents the spatial distribution of SOC stocks in the Third Pole regions of the upper 30 cm depth interval.
This study simulated the spatial pattern of the SOCS over the Third Pole region, and systematically estimated the SOC storage (46.18 Pg) at a depth interval of 0–3 m for the first time. Our results demonstrated that combining multi-environmental factors with machine-learning techniques (RF, SVM, and GBRT) can offer an effective and powerful modeling approach for mapping the spatial patterns of SOC. Furthermore, this study provided datasets of SOCS and SOC storage for permafrost and seasonally frozen ground at different soil depths (0–30, 0–50, 0–100, 0–200, and 0–300 cm) across the Third Pole region. These datasets can be used to modify existing Earth system models and improve prediction accuracy, as well as also serve as a reference for policymakers to formulate more effective carbon budget management strategies.
The supplement related to this article is available online at: https://doi.org/10.5194/essd-13-3453-2021-supplement.
The study was completed with cooperation between all authors. TW and XW conceived the idea of mapping the spatial distribution of the SOC across the Third Pole regions. DW conducted the data analyses and wrote the paper. All authors discussed the simulation results and helped revise the paper.
The authors declare that they have no conflict of interest.
Publisher's note: Copernicus Publications remains neutral with regard to jurisdictional claims in published maps and institutional affiliations.
This article is part of the special issue “Extreme environment datasets for the three poles”. It is not associated with a conference.
This work was financially supported by the State Key Laboratory of Cryospheric Science (SKLCS–ZZ–2020), the National Natural Science Foundations of China (41690142, 41721091, 41771076, 41961144021, 41671070), and the CAS “Light of West China” Program.
This research has been supported by the National Natural Science Foundation of China (grant nos. 41690142, 41721091, 41771076, 41961144021, and 41671070), the State Key Laboratory of Cryospheric Science (grant no. SKLCS-ZZ-2020), and the West Light Foundation of the Chinese Academy of Sciences (grant no. E029010401).
This paper was edited by Min Feng and reviewed by two anonymous referees.
Amundson, R.: The Carbon Budget in Soils, Ann. Rev. Earth Planet. Sci., 29, 535–562, https://doi.org/10.1146/annurev.earth.29.1.535, 2001.
Batjes, N. H.: Harmonized soil property values for broad-scale modelling (WISE30sec) with estimates of global soil carbon stocks, Geoderma, 269, 61–68, https://doi.org/10.1016/j.geoderma.2016.01.034, 2016.
Cheng, G. and Wu, T.: Responses of permafrost to climate change and their environmental significance, Qinghai-Tibet Plateau, J. Geophys. Res.-Ea. Surf., 112, F02S03, https://doi.org/10.1029/2006JF000631, 2007.
Cheng, G., Zhao, L., Li, R., Wu, X., Sheng, Y., Hu, G., Zou, D., Jin,, H., Li, X., and Wu, Q.: Characteristic, changes and impacts of permafrost on Qinghai-Tibet Plateau, Chin. Sci. Bull., 64, 2783–2795, https://doi.org/10.1360/TB-2019-0191, 2019 (in Chinese).
Ding, J., Li, F., Yang, G., Chen, L., Zhang, B., Liu, L., Fang, K., Qin, S., Chen, Y., Peng, Y., Ji, C., He, H., Smith, P., and Yang, Y.: The permafrost carbon inventory on the Tibetan Plateau: a new evaluation using deep sediment cores, Glob. Change Biol., 22, 2688–2701, https://doi.org/10.1111/gcb.13257, 2016.
Ding, J., Wang, T., Piao, S., Smith, P., and Zhao, L.: The paleoclimatic footprint in the soil carbon stock of the Tibetan permafrost region, Nat. Commun., 10, 4195, https://doi.org/10.1038/s41467-019-12214-5, 2019.
Ding, Y., Mu, C., Wu, T., Hu, G., Zou, D., Wang, D., Li, W., and Wu, X.: Increasing cryospheric hazards in a warming climate, Earth-Sci. Rev., 213, 103500, https://doi.org/10.1016/j.earscirev.2020.103500, 2021.
Drake, J. M. and Guisan, R. A.: Modelling Ecological Niches with Support Vector Machines, J. Appl. Ecol., 43, 424–432, https://doi.org/10.1111/j.1365-2664.2006.01141.x, 2006.
Elith, J., Leathwick, J. R., and Hastie, T.: A working guide to boosted regression trees, J. Anim. Ecol., 77, 802–813, https://doi.org/10.1111/j.1365-2656.2008.01390.x, 2008.
Fan, J., Cao, Y., Yan, Y., Lu, X., Wang, X., Fan, J., Cao, Y., Yan, Y., Lu, X., and Wang, X.: Freezing-thawing cycles effect on the water soluble organic carbon, nitrogen and microbial biomass of alpine grassland soil in Northern Tibet, Afr. J. Microbiol. Res., 6, 562–567, https://doi.org/10.5897/AJMR11.1218, 2012.
Hao, Y., Luo, X., Zhong, B., and Yang, A.: Methods of the National Vegetation Classification based on Vegetation Partition, Remote Sens. Technol. Appl., 32, 315–323, https://doi.org/10.2991/mmme-16.2016.60, 2017.
Hengl, T., Mendes de Jesus, J., Heuvelink, G. B. M., Ruiperez Gonzalez, M., Kilibarda, M., Blagotić, A., Shangguan, W., Wright, M. N., Geng, X., Bauer-Marschallinger, B., Guevara, M. A., Vargas, R., MacMillan, R. A., Batjes, Niels H.; Leenaars, J. G. B., Ribeiro, E., Wheeler, I., Mantel, S., and Kempen, B.: SoilGrids250m: Global gridded soil information based on machine learning, PLoS ONE, 12, e0169748, https://doi.org/10.1371/journal.pone.0169748, 2017.
Hugelius, G., Strauss, J., Zubrzycki, S., Harden, J. W., Schuur, E. A. G., Ping, C.-L., Schirrmeister, L., Grosse, G., Michaelson, G. J., Koven, C. D., O'Donnell, J. A., Elberling, B., Mishra, U., Camill, P., Yu, Z., Palmtag, J., and Kuhry, P.: Estimated stocks of circumpolar permafrost carbon with quantified uncertainty ranges and identified data gaps, Biogeosciences, 11, 6573–6593, https://doi.org/10.5194/bg-11-6573-2014, 2014.
Jiang, L., Chen, H., Zhu, Q., Yang, Y., Li, M., Peng, C., Zhu, D., and He, Y.: Assessment of frozen ground organic carbon pool on the Qinghai-Tibet Plateau, J. Soil. Sediment., 19, 128–139, https://doi.org/10.1007/s11368-018-2006-3, 2019.
Jobbagy, E. G. and Jackson, R. B.: The vertical distribution of soil organic carbon and its relation to climate and vegetation, Ecol. Appl., 10, 423–436, https://doi.org/10.2307/2641104, 2000.
Koven, C. D., Ringeval, B., Friedlingstein, P., Ciais, P., Cadule, P., Khvorostyanov, D., Krinner, G., and Tarnocai, C.: Permafrost carbon-climate feedbacks accelerate global warming, P. Natl. Acad. Sci. USA, 108, 14769–14774, https://doi.org/10.1073/pnas.1103910108, 2011.
Li, F., Zang, S., Liu, Y., Li, L., and Ni, H.: Effect of Freezing–Thawing Cycle on Soil Active Organic Carbon Fractions and Enzyme Activities in the Wetland of Sanjiang Plain, Northeast China, Wetlands, 40, 167–177, https://doi.org/10.1007/s13157-019-01164-9, 2020.
Liang, S., Zhao, X., Liu, S., Yuan, W., Cheng, X., Xiao, Z., Zhang, X., Liu, Q., Cheng, J., Tang, H., Qu, Y., Bo, Y., Qu, Y., Ren, H., Yu, K., and Townshend, J.: A long-term Global Land Surface Satellite (GLASS) dataset for environmental studies, Int. J. Digit. Earth, 6, 5–33, https://doi.org/10.1080/17538947.2013.805262, 2013.
Liu, F., Zhang, G., Song, X., Li, D., Zhao, Y., Yang, J., Wu, H., and Yang, F.: High-resolution and three-dimensional mapping of soil texture of China, Geoderma, 361, 114061, https://doi.org/10.1016/j.geoderma.2019.114061, 2020.
Lombardozzi, D. L., Bonan, G. B., Smith, N. G., Dukes, J. S., and Fisher, R. A.: Temperature acclimation of photosynthesis and respiration: A key uncertainty in the carbon cycle–climate feedback, Geophys. Res. Lett., 42, 8624–8631, https://doi.org/10.1002/2015GL065934, 2016.
McGuire, A. D., Lawrence, D. M., Koven, C., Clein, J. S., Burke, E., Chen, G., Jafarov, E., Macdougall, A. H., Marchenko, S., Nicolsky, D., Peng, S., Rinke, A., Ciais, P., Gouttevin, I., Hayes, D. J., Ji, D., Krinner, G., Moore, J. C., Romanovsky, V., Schädel, C., Schaefer, K., Schuur, E. A. G., and Zhuang, Q.: Dependence of the evolution of carbon dynamics in the northern permafrost region on the trajectory of climate change, P. Natl. Acad. Sci. USA, 115, 3882–3887, https://doi.org/10.1073/pnas.1719903115, 2018.
Mishra, U., Jastrow, J. D., Matamala, R., Hugelius, G., Koven, C. D., Harden, J. W., Ping, C. L., Michaelson, G. J., Fan, Z., and Miller, R. M.: Empirical estimates to reduce modeling uncertainties of soil organic carbon in permafrost regions: a review of recent progress and remaining challenges, Environ. Res. Lett., 8, 1402–1416, https://doi.org/10.1088/1748-9326/8/3/035020, 2013.
Mu, C., Zhang, T., Wu, Q., Peng, X., Cao, B., Zhang, X., Cao, B., and Cheng, G.: Editorial: Organic carbon pools in permafrost regions on the Qinghai–Xizang (Tibetan) Plateau, The Cryosphere, 9, 479–486, https://doi.org/10.5194/tc-9-479-2015, 2015.
Mu, C., Abbott, B. W., Norris, A. J., Mu, M., Fan, C. Y., Chen, X., Jia, L., Yang, R. M., Zhang, T. J., Wang, K., Peng, X. Q., Wu, Q. B., Guggenberger, G., and Wu, X. D.: The status and stability of permafrost carbon on the Tibetan Plateau, Earth-Sci. Rev., 211, 103433, https://doi.org/10.1016/j.earscirev.2020.103433, 2020a.
Mu, C., Shang, J., Zhang, T., Fan, C., Wang, S., Peng, X., Zhong, W., Zhang, F., Mu, M., and Jia, L.: Acceleration of thaw slump during 1997–2017 in the Qilian Mountains of the northern Qinghai-Tibetan plateau, Landslides, 17, 1051–1062, https://doi.org/10.1007/s10346-020-01344-3, 2020b.
Obu, J., Westermann, S., Bartsch, A., Berdnikov, N., Christiansen, H. H., Dashtseren, A., Delaloye, R., Elberling, B., Etzelmüller, B., Kholodov, A., Khomutov, A., Kääb, A., Leibman, M. O., Lewkowicz, A. G., Panda, S. K., Romanovsky, V., Way, R. G., Westergaard-Nielsen, A., Wu, T., Yamkhin, J., and Zou, D.: Northern Hemisphere permafrost map based on TTOP modelling for 2000–2016 at 1 km2 scale, Earth-Sci. Rev., 193, 299–316, https://doi.org/10.1016/j.earscirev.2019.04.023, 2019.
Ping, C. L., Jastrow, J. D., Jorgenson, M. T., Michaelson, G. J., and Shur, Y. L.: Permafrost soils and carbon cycling, SOIL, 1, 147–171, https://doi.org/10.5194/soil-1-147-2015, 2015.
Ran, Y., Li, X., and Cheng, G.: Climate warming over the past half century has led to thermal degradation of permafrost on the Qinghai–Tibet Plateau, The Cryosphere, 12, 595–608, https://doi.org/10.5194/tc-12-595-2018, 2018.
Schuur, E. A. G., McGuire, A. D., Schädel, C., Grosse, G., Harden, J. W., Hayes, D. J., Hugelius, G., Koven, C. D., Kuhry, P., Lawrence, D. M., Natali, S. M., Olefeldt, D., Romanovsky, V. E., Schaefer, K., Turetsky, M. R., Treat, C. C., and Vonk, J. E.: Climate change and the permafrost carbon feedback, Nature, 520, 171–179, https://doi.org/10.1038/nature14338, 2015.
Shi, J. and Song, G.: Native database in China–based on the second national soil soil survey data sets, V1, China Scientific Data, https://doi.org/10.11922/sciencedb.180.88, 2016 (in Chinese).
Song, X. D., Brus, D. J., Liu, F., Li, D.-C., Zhao, Y. G., Yang, J. L., and Zhang, G. L.: Mapping soil organic carbon content by geographically weighted regression: A case study in the Heihe River Basin, China, Geoderma, 261, 11–22, https://doi.org/10.1016/j.geoderma.2015.06.024, 2016.
Stocker, T. F., Qin, D., Plattner, G. K., Tignor, M., Allen, S. K., Boschung, J., Nauels, A., Xia, Y., Bex, B., and Midgley, B. M.: Climate Change 2013: The Physical Science Basis, Contribution of Working Group I to the Fifth Assessment Report of the Intergovernmental Panel on Climate Change, Cambridge University Press, Cambridge, UK, New York, NY, USA, 95–123, 2013.
Stow, D. A., Hope, A., McGuire, D., Verbyla, D., Gamon, J., Huemmrich, F., Houston, S., Racine, C., Sturm, M., Tape, K., Hinzman, L., Yoshikawa, K., Tweedie, C., Noyle, B., Silapaswan, C., Douglas, D., Griffith, B., Jia, G., Epstein, H., Walker, D., Daeschner, S., Petersen, A., Zhou, L., and Myneni, R.: Remote sensing of vegetation and land-cover change in Arctic Tundra Ecosystems, Remote Sens. Environ., 89, 281–308, https://doi.org/10.1016/j.rse.2003.10.018, 2004.
Tian, Y., Ouyang, H., Xu, X., Song, M., and Zhou, C.: Distribution characteristics of soil organic carbon storage and density on the Qinghai-Tibet Plateau, Acta Pedologica Sinica, 45, 933–942, 2008.
Tin Kam, H.: Random subspace method for constructing decision forests, IEEE T. Pattern Anal., 20, 832–844, https://doi.org/10.1109/34.709601, 1998.
Turetsky, M. R., Abbott, B. W., Jones, M. C., Walter Anthony, K., Olefeldt, D., Schuur, E. A. G., Koven, C., McGuire, A. D., Grosse, G., Kuhry, P., Hugelius, G., Lawrence, D. M., Gibson, C., and Sannel, A. B. K.: Permafrost collapse is accelerating carbon release, Nature, 569, 32–34, https://doi.org/10.1038/d41586-019-01313-4, 2019.
Vitharana, U., Mishra, U., and Mapa, R. B.: National soil organic carbon estimates can improve global estimates, Geoderma, 337, 55–64, https://doi.org/10.1016/j.geoderma.2018.09.005, 2019.
Wang, G., Qian, J., Cheng, G., and Lai, Y.: Soil organic carbon pool of grassland soils on the Qinghai-Tibetan Plateau and its global implication, Sci. Total Environ., 291, 207–217, https://doi.org/10.1016/S0048-9697(01)01100-7, 2002.
Wang, T. H., Yang, D. W., Yang, Y. T., Piao, S. L., Li, X., Cheng, G. D., and Fu, B. J.: Permafrost thawing puts the frozen carbon at risk over the Tibetan Plateau, Sci. Adv., 6, eaaz3513, https://doi.org/10.1126/sciadv.aaz3513, 2020.
Wu, Q., Zhang, T., and Liu, Y.: Thermal state of the active layer and permafrost along the Qinghai-Xizang (Tibet) Railway from 2006 to 2010, The Cryosphere, 6, 607–612, https://doi.org/10.5194/tc-6-607-2012, 2012.
Wu, X., Zhao, L., Fang, H., Zhao, Y., Smoak, J. M., Pang, Q., and Ding, Y.: Environmental controls on soil organic carbon and nitrogen stocks in the high-altitude arid western Qinghai-Tibetan Plateau permafrost region, J. Geophys. Res.-Biogeosci., 121, 176–187, https://doi.org/10.1002/2015JG003138, 2016.
Wu, Y., Liu, G., Fu, B., and Guo, Y.: Study on the vertical distribution of soil organic carbon density in the Tibetan Plateau, Acta Sci. Circum., 28, 362–367, https://doi.org/10.3724/SP.J.1148.2008.00259, 2008.
Xu, L., Yu, G., and He, N.: Increased soil organic carbon storage in Chinese terrestrial ecosystems from the 1980s to the 2010s, J. Geogr. Sci., 29, 49–66, https://doi.org/10.1007/s11442-019-1583-4, 2019.
Yang, Y., Fang, J., Tang, Y., Ji, C., Zheng, C., He, J., and Zhu, B.: Storage, patterns and controls of soil organic carbon in the Tibetan grasslands, Glob. Change Biol., 14, 1592–1599, https://doi.org/10.1111/j.1365-2486.2008.01591.x, 2008.
Yang, Y., Fang, J., Ma, W., Smith, P., Mohammat, A., Wang, S., and Wang, W.: Soil carbon stock and its changes in northern China's grasslands from 1980s to 2000s, Glob. Change Biol., 16, 3036–3047, https://doi.org/10.1111/j.1365-2486.2009.02123.x, 2010.
Yao, T., Thompson, L. G., Mosbrugger, V., Zhang, F., Ma, Y., Luo, T., Xu, B., Yang, X., Joswiak, D. R., Wang, W., Joswiak, M. E., Devkota, L. P., Tayal, S., Jilani, R., and Fayziev, R.: Third Pole Environment (TPE), Environ. Develop., 3, 52–64, https://doi.org/10.1016/j.envdev.2012.04.002, 2012.
Zeng, Y., Feng, Z., Cao, G., and Xu, L.: The Soil Organic Carbon Storage and Its Spatial Distribution of Alpine Grassland in the Source Region of the Yellow River, Acta Geogr. Sin., 59, 497–504, https://doi.org/10.1007/BF02873091, 2004.
Zhou, G., Zhou, X., He, Y., Shao, J., Hu, Z., Liu, R., Zhou, H., and Hosseinibai, S.: Grazing intensity significantly affects belowground carbon and nitrogen cycling in grassland ecosystems: a meta-analysis, Glob. Change Biol., 23, 1167–1179, https://doi.org/10.1111/gcb.13431, 2017.
Zhao, L., Wu, X., Wang, Z., Sheng, Y., Fang, H., Zhao, Y., Hu, G., Li, W., Pang, Q., Shi, J., Mo, B., Wang, Q., Ruan, X., Li, X., and Ding, Y.: Soil organic carbon and total nitrogen pools in permafrost zones of the Qinghai-Tibetan Plateau, Sci. Rep., 8, 3656, https://doi.org/10.1038/s41598-018-22024-2, 2018.