the Creative Commons Attribution 4.0 License.
the Creative Commons Attribution 4.0 License.
 | 03 Jun 2021
Intercomparisons, error assessments, and technical information on historical upper-air measurements
Noemi Imfeld
Leopold Haimberger
Alexander Sterin
Yuri Brugnara
Stefan Brönnimann
Upper-air data form the backbone of weather analysis and reanalysis products, particularly in the pre-satellite era. However, they are particularly prone to errors and uncertainties, especially data from the early days of aerology. Information that allows us to better characterize the errors of radiosonde data is important. This paper reports on an attempt to collect data from historical upper-air intercomparisons and from historical error assessments reaching back to the 1930s. The digitized numerical data will be made available through Copernicus Climate Change Services; here we publish the full information that includes images, literature, and other metadata that may be relevant and can be used to inform homogenization approaches or reanalysis production. The data collection described in this paper is available on PANGAEA: https://doi.org/10.1594/PANGAEA.925860 (Imfeld et al., 2021).
- Article
(5153 KB) - Full-text XML
- BibTeX
- EndNote


Despite the advanced use of satellite data in analysis systems, upper-air data from weather balloons still form the backbone of weather analysis and reanalysis products. This is particularly the case in the pre-satellite era. Although surface-only reanalyses have become highly successful (Compo et al., 2011; Laloyaux et al., 2018; Slivinski et al., 2019), better results could be gained by assimilating the available upper-air data (Hersbach et al., 2017), which on a large scale reach back to the 1910s (Stickler et al., 2014; Ramella et al. 2014; Durre et al. 2018). However, the quality and homogeneity of radiosonde data are a serious issue and could hamper the proper use of these data in reanalyses. Statistical methods have been used to generate more consistent radiosonde products (e.g., Lanzante et al., 2003; Sherwood et al., 2008; Zhou et al., 2021; Dai et al., 2011). Some homogenization methods successfully make use of the background departures from reanalysis data sets (RAOBCORE, Haimberger 2007; RICH, Haimberger et al., 2012). However, most homogenization approaches rely entirely on statistics.
An alternative would be to use information on the measurement system and corresponding errors. Such information is sometimes available from direct comparisons, from other systematic trials or analyses, or even from laboratory tests. Compiling such information might support future homogenization efforts and might inform future reanalysis projects. Grant et al. (2009) used a physics-based correction approach to obtain consistent corrections; error classes were diagnosed based on the shape of the error profile. Today, assimilation systems could possibly make use of such additional information, e.g., to better define online bias correction schemes.
Within Copernicus Climate Change Services (C3S) contract C311c, a database of error characterizations of radiosonde was compiled. In particular, the database contains data from radiosonde intercomparison campaigns. These data will be incorporated into the global radiosonde data set such that reanalyses and other applications can make use of them. However, only the numerical data such as the ascents from intercomparisons can be made available via C3S. Here we present and publish the complete documentation which includes the data themselves and also additional metadata such as imaged graphical data, handbooks, technical literature translated from Russian, and an expert interview.
The paper is organized as follows. Section 2 gives an overview of the history of radiosonde intercomparisons and error assessments. This is important to understand the material at hand. Section 3 describes the compilation and structure of the database. In Sect. 4 we discuss findings and present examples. Conclusions are drawn in Sect. 5.
2.1 Intercomparison campaigns
Upper-air measurements, particularly in the early decades, were extremely demanding in terms of instrumentation posing a challenge for their first designers (e.g., Diamond et al. 1937; Lange, 1937). Measurement devices need to be lightweight and operate under an extremely large range of conditions (e.g., they need to cover a temperature range from 30 to −80 ∘C within an hour or a pressure range from 1040 to 10 hPa), and each instrument only operates for a short time. The instruments are exposed to radiation, freezing clouds, and strong winds. Both systematic and random errors in these situations are large. Furthermore, the data transmission and processing introduce uncertainties.
Scientists such as Gustave Hermite were aware of the overheating of sensors due to radiation at high altitudes already in the very beginning of unmanned balloon flights. His observations, in 1893, of high temperature at 16 km were therefore considered erroneous (Hermite, 1893). To overcome this problem, several strategies were selected including statistical approaches (comparing day and night ascents), intercomparisons (parallel measurements with manned and unmanned balloons; Labitzke 1999), and laboratory studies (better characterization of instruments). The same strategies have been used until the present.
Already in the early years it was considered important to coordinate and compare results (Assmann et al., 1898). In 1896, the program of “International Days” was established: 1 d per month on which participating countries performed simultaneous ascents based on a telegraphic signal (Brückner, 1899). The International Aeronautical Commission agreed then in 1909 that balloons should be launched at 07:00 Greenwich time (Dines, 1912). Later one “International Week” per year was added. These coordinated ascents were interrupted during the First World War and resumed in the 1920s. In 1927, two French scientists managed to transmit the measurements through a radio transmitter to the ground. This was the start of the development of a worldwide radiosonde network, and the need for further intercomparisons was stated (Jeannet et al., 2016). For instance, in 1935, in the context of an International Week, Norway and Sweden agreed to launch additional ascents at two locations, Nesbyen and Filipstad, 296 km apart (Nyberg et al., 1942) with the same radiosonde types in order to compare the instrument errors. These data are part of our collection.
The first World Meteorological Organization (WMO) intercomparison of radiosondes took place in Payerne, Switzerland, in 1950 (Painter, 1950) as many countries had started operational upper-air networks after the Second World War and the WMO was a newly founded body to coordinate such activities. Intercomparisons then increased in anticipation of the International Geophysical Year (IGY) in 1957/58. A regional intercomparison was performed in Brussels in 1954 (Malet, 1955), and a second global intercomparison of radiosondes was organized in Payerne in 1956 in preparation of the IGY (Beelitz, 1958). Further global intercomparisons took place in 1968 (in several countries; see Kuzenkov and Shlyakhov, 1976), 1984/85 (UK/USA), 1993 (Japan), and 1995/7 (USA/Russia). In addition, important regional intercomparisons were carried out in Payerne (1981; Richner and Phillips, 1982) and Crawley, UK (1987 and 1992; Bond et al., 1988), as well as in the former Soviet Union (FSU) in 1984 and 1985 (Kazakova, 1998; Karhunen et al., 1987; Zaitseva et al., 1989). For some campaigns, however, precise information on the radiosondes were missing (e.g., Goltsova et al., 1974), or the comparison was made against other thermometers but not radiosondes (e.g., Krechmer et al., 1969), which are thus not added to the database.
The raw data from past intercomparisons are often not available electronically (for some campaigns not even on paper), and distribution is limited. For some campaigns, however, assessments and statistics have survived, and perhaps these are the more important products.
Today, radiosonde intercomparisons have become a standard procedure within the WMO to assure the quality of the global radiosonde network, and the most recent intercomparisons took place in 2001 (Brazil), 2005 (Mauritius), and 2010 (China) (Nash et al., 2006; da Silveira et al., 2006; Nash et al., 2011). Within the Global Climate Observing System (GCOS), the GCOS Reference Upper-Air Network (GRUAN) (Bodeker et al., 2016) was established as a reference, with which the radiosonde quality was further enhanced (Seidel et al., 2009).
2.2 Characterization of errors and instruments
There are other ways to characterize the error of a radiosonde than intercomparisons with other radiosondes. For instance, statistics of day vs. night ascents can be used to estimate the radiation error. Radiosondes and sensors can be analyzed in the lab, and well-understood influences (e.g., the lag) can be modeled (Dirksen et al., 2014). It is therefore important also to compile information from such sources. Brönnimann (2003) has compiled some of the early information. Reports are available, for instance, for the Finnish (Väisälä, 1941, 1949; Raunio, 1950), German (Scherhag, 1948), and UK Met Office (Scrase, 1954) radiosondes.
In the FSU, a considerable number of studies on radiosondes have been conducted (e.g., Balagurov and Fridzon, 1983; Balagurov et al., 1984; Shlyakhov and Kuzenkov, 1973; Zaichikov 1957 and 1962; Zaitseva et al., 1989), whereof reports and correction values are available at the All-Russian Research Institute of Hydrometeorological Information – World Data Centre (RIHMI/WDC) in Obninsk, Russia. A selection of these error assessments has been added to our database as well.
In the early days, measurements were not fully operational, and procedures and instruments were changing and not always well documented. Although several error sources were known (e.g., the lag error) and understood, it is sometimes unclear whether a correction (e.g., of the radiation error) was performed or not. It is therefore important to also compile handbooks from early times. Our compilation contains the handbook for the Lang radiosonde which gives insights into lag corrections that had been applied to the Lang radiosondes in 1940 (Reichsamt für Wetterdienst, 1940). A set of handbooks has also been collected by the “Museum of Radiosondes of North America”. Its contents can, however, only be accessed on request and are not available online (see http://radiosondemuseum.org/, last access: 17 September 2020). Detailed technical descriptions of the very early radiosonde systems up to the 1950s can also be found in Dubois et al. (2002) and, for example, for the British radiosondes in Lander (1946) and Lange (1937). For the FSU, Zaitseva (1993) summarized the different radiosonde systems for a period starting in the 1920s.
In the context of the IGY, Beelitz (1958) compiled the information on current and planned operational corrections. This compilation of Beelitz is useful to determine in what countries and for which radiosondes corrections have been applied, and it can be found in our database. Many countries started operational corrections of the soundings only after the IGY of 1957/58.
2.3 History of station networks
In order to relate error estimates derived from intercomparisons or error assessments to the operationally used radiosondes by weather services, it is important to know the changes a station network underwent and to be able to identify radiosondes properly. This is especially relevant regarding the missing international standards of early radio soundings. A range of radiosonde manufacturers has existed since the early 1930s that used different sensor types or radiation shielding or applied different corrections to the data, which often led to difficulties when comparing soundings that had been conducted in different countries (Painter, 1950).
A station history of a network needs to include instrumentation changes, applied corrections, launching procedures, and also information on transmission systems. An attempt to provide a comprehensive summary of radiosondes and station histories from different countries has been made by Gaffen (1993). By contacting a vast amount of weather services, she established a document of historical changes in radiosonde instruments and practices for 49 countries covering the period between the 1930s and 1990s. The summary reports on the radiosondes used in the 1990s, as well as previously used radiosondes. Further, it lists a large amount of radiosondes including their sensor types of temperature, pressure, and humidity measurements and applied corrections.

Figure 1Three types of Vaisala radiosondes. Left: the Vaisala RS11 was introduced in 1937 and won a gold medal in the world fair at Paris (vaisala.com). Middle: Vaisala RS21 from 1971 (https://radiosondemuseum.org, last access: 21 December 2020). Right: Vaisala RS80-N from 1981 with its original packaging (https://radiosondemuseum.org, last access: 21 December 2020). All three radiosondes have been used in the intercomparison campaigns in our collection. They correspond to comp002fin (left), comp009van (middle), and comp009v80 (right). Note that the introduction dates may vary because of slight modifications of the instruments.
WMO established a table of common codes for radiosondes, but prior to the 1960s radiosonde descriptions are equivocal and their coverage is by no means exhaustive (WMO, 2019). A comprehensive list including radiosondes from the very early days of aerology (e.g., the British Biram's anemometer suspended from a kite in 1883) up to 2014 has been compiled by Steven Schröder from the Texas A&M University (personal communication). This inventory covers even small instrumentation changes or changes in transmission frequencies. It relates each radiosonde to a unique reference identifications and where possible to the codes established by WMO. For example, for the Vaisala radiosondes, more than 200 different radiosonde types are found in the collection including the earliest radiosonde developed in 1931. Figure 1 shows three different Vaisala radiosondes from 1937, 1971, and 1981 that are part of Schröder's list, as well as our database. It is also worth mentioning the radiosonde collection from an association devoted to finding radiosondes in Europe. Their website offers a detailed though not very systematic description of sensors of very old to more recent radiosondes including pictures of the radiosondes (http://radiosonde.eu/RS03/RS03A01.html last access: 17 September 2020).
A large collection of radiosondes has also been compiled by the aforementioned “Museum of radiosondes from North America” that includes radiosondes used worldwide, as well as artifacts such as balloons and batteries.
3.1 Compilation of the database
For the compilation of the database, we started by creating a list of intercomparison campaigns, comprising global (WMO organized), regional, and national campaigns based on existing documents (e.g., Jeannet et al., 2016). This list of regional and national intercomparisons is, however, not exhaustive. Not all intercomparisons are equally important with the prospect of building a global data set. National intercomparisons were less important, and those focusing on specific parts such as the boundary layer (e.g., Kaimal et al., 1980) also were not of high priority. Rather, we set priority on historical campaigns (i.e., the first intercomparison campaigns that were conducted), assuming that these data are more error-prone and hence corrections more important.
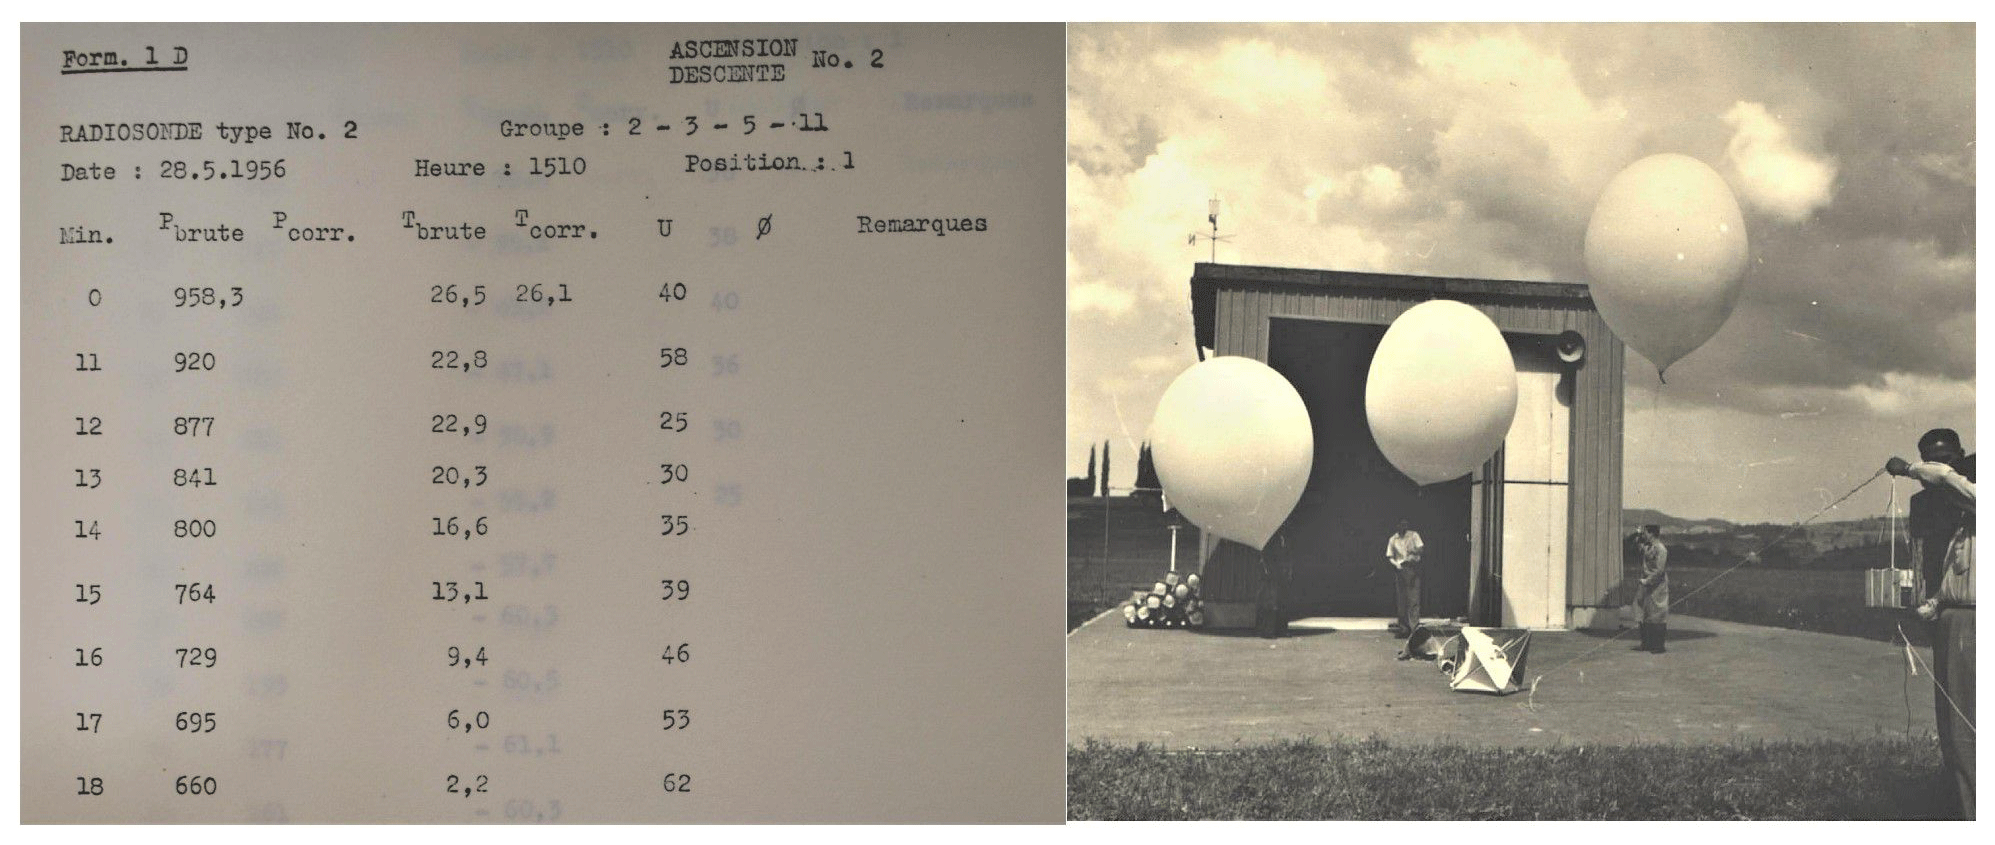
Figure 2Left: sounding data from the 1956 campaign held in Payerne, Switzerland, from the archive of MeteoSwiss in Payerne (own image). Right: at the beginning of the campaign, soundings were performed with four radiosondes on a train of balloons (archive of MeteoSwiss). Within the course of the campaign this procedure changed to 13 radiosondes on a train of several balloons.
We searched the archives of the MeteoSwiss aerological station of Payerne (Switzerland, e.g., Fig. 2) and RIHMI/WDC Obninsk (Russia) to obtain raw data from early intercomparisons and obtained further data via interlibrary loan. Furthermore, we also searched for other literature (including laboratory, statistical, etc.). We consulted WMO with regards to data from more recent intercomparison campaigns and had meetings with scientists who performed radiosonde intercomparisons in the 1970s and 1980s (Hans Richner, ETH Zürich, and Pierre Jeannet, MeteoSwiss, Payerne). The interview with Hans Richner was recorded and can be found in the database (in German).
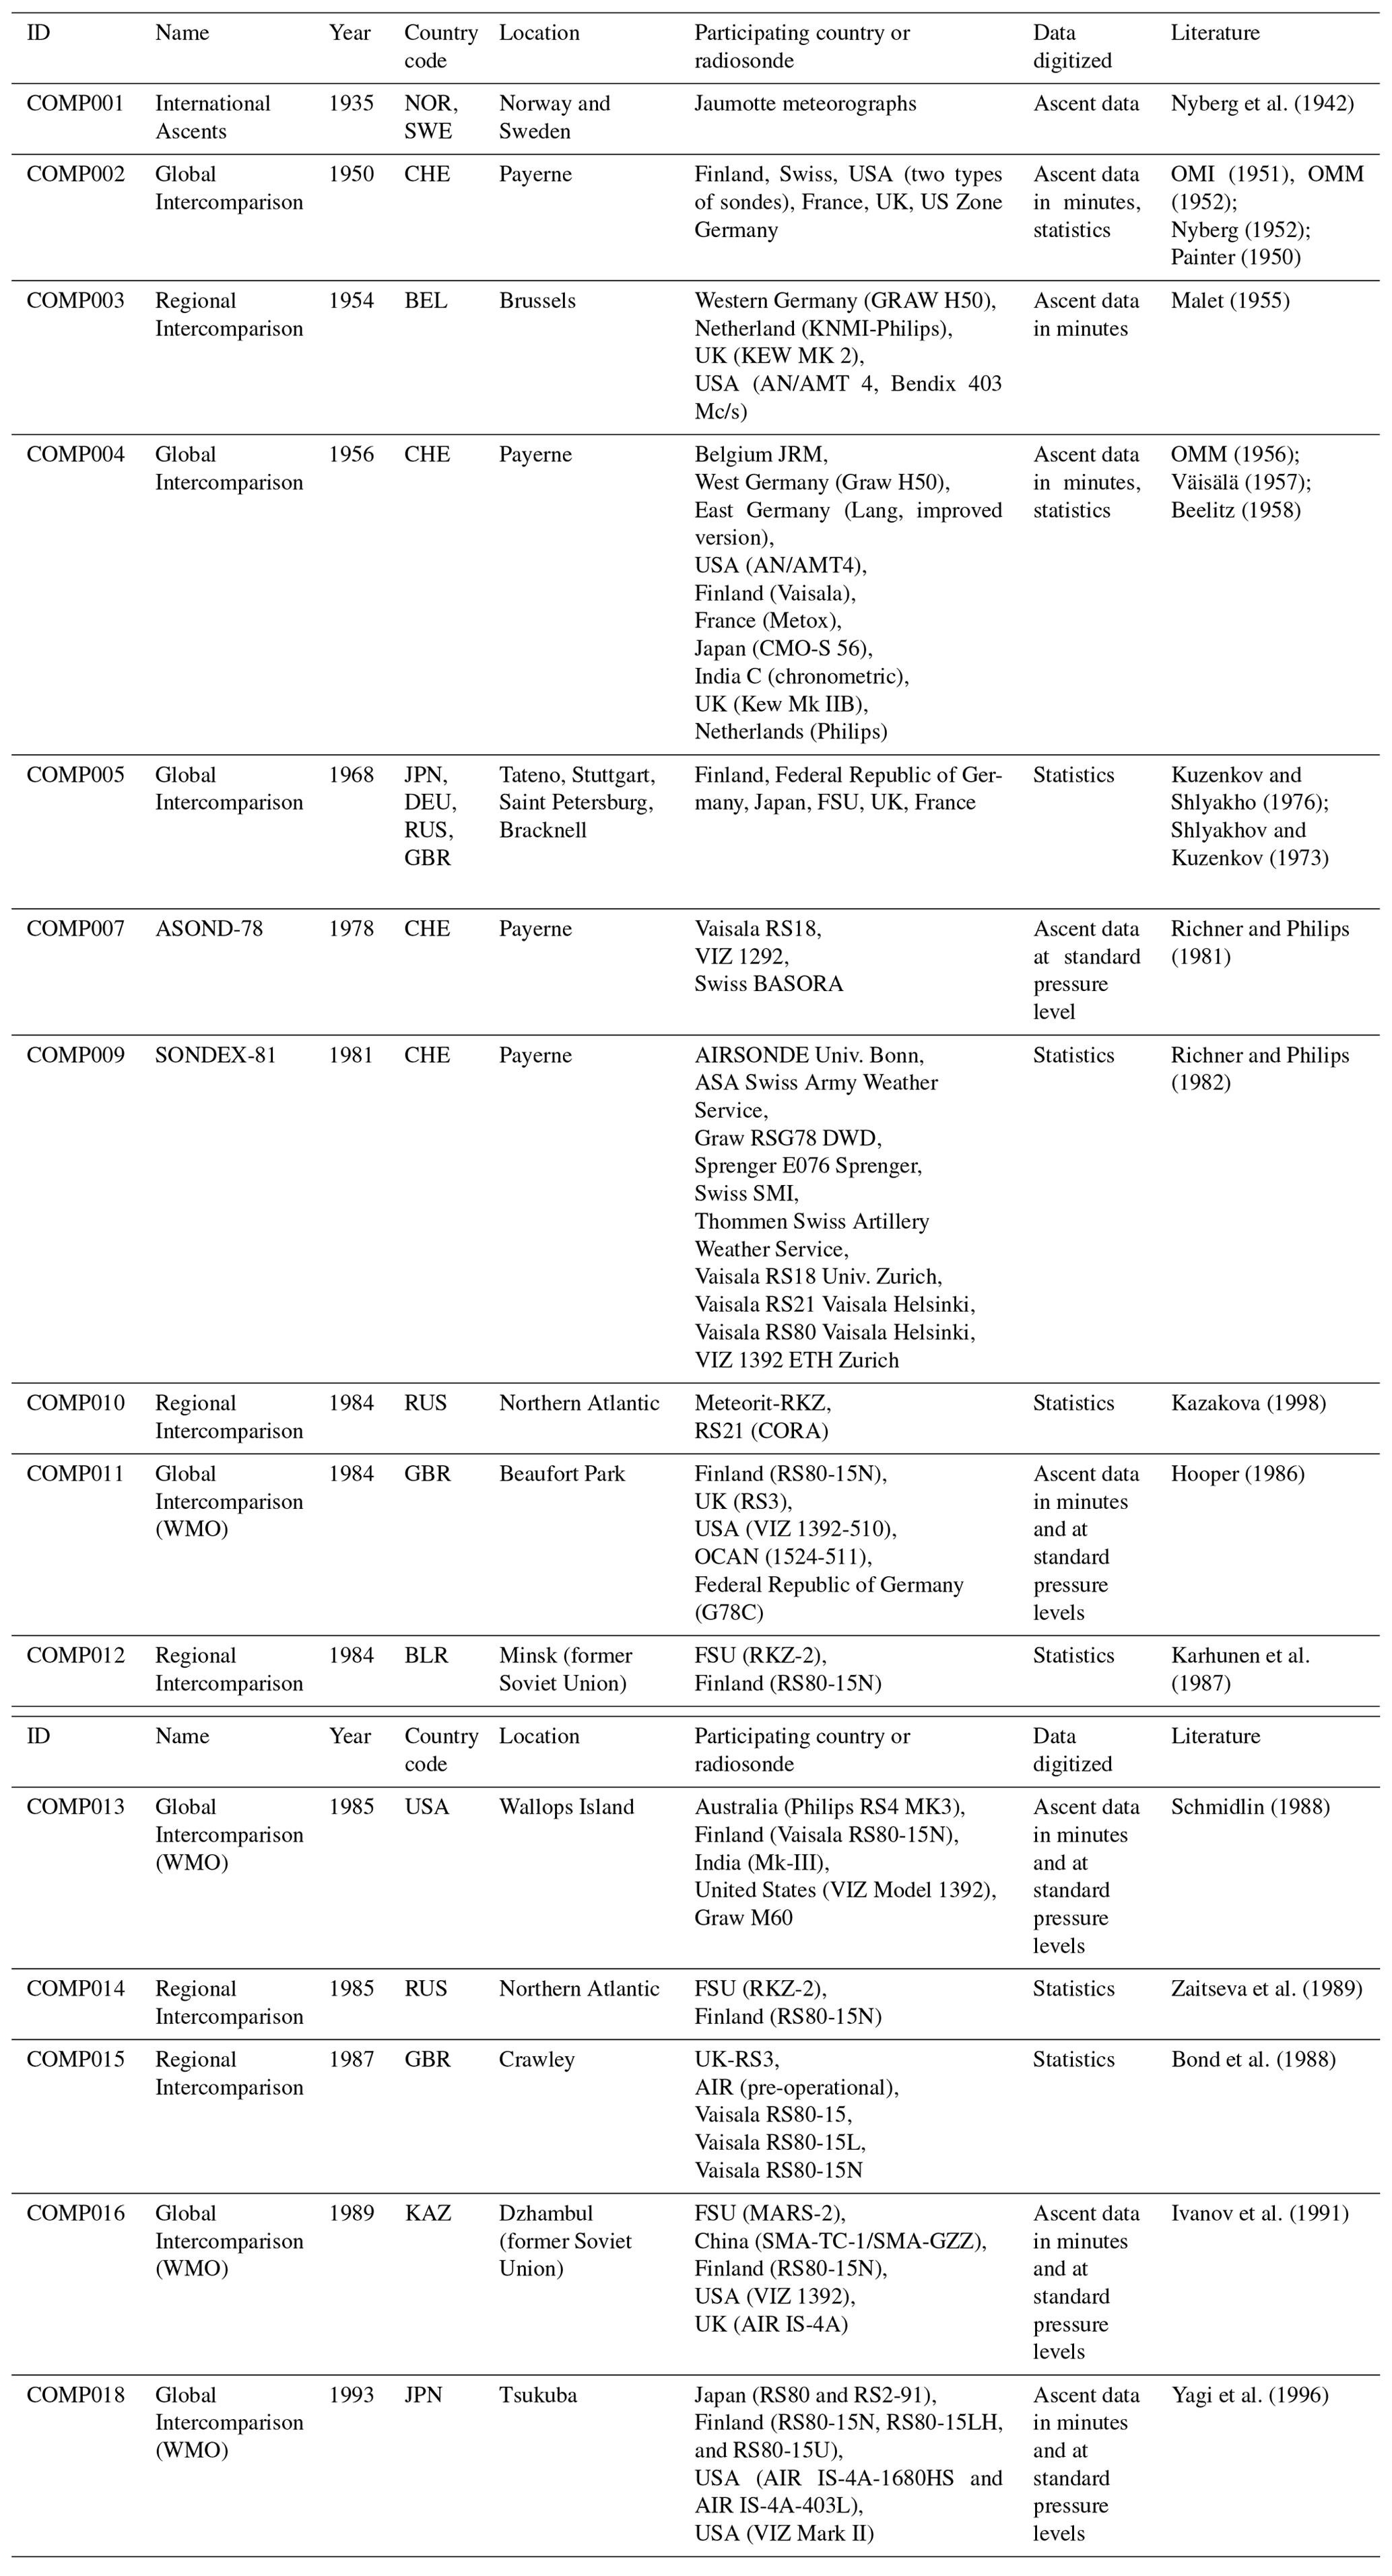
Table 1Digitized intercomparison campaigns between 1935 and 1995 containing raw ascent data and statistics. For full table of intercomparison campaigns, refer to the database link provided in Sect. 5.
Digitization of raw data, as well as aggregated data, was performed based on this list of intercomparisons (Table 1). Raw data allow for independent analyses, but the analyses performed in the aftermath of the campaigns had all the expert information which might be relevant, and usually the results are preferable (e.g., for determining corrections). However, all intercomparisons have the problem of a missing standard. There is no agreed standard, so only pairwise comparisons can be made. The database contains data for the variables temperature, pressure, relative humidity, geopotential height, wind speed, and wind direction. However, not all campaigns cover all variables.
We made quality checks of the digitized data (mainly the ascent data) to find digitizing errors. These checks included simple consistency checks, e.g., whether the data are within a reasonable range, whether pressure is decreasing, and cross-checks of geopotential altitude with the hydrostatic balance. No additional quality control has been performed on the data; suspicious values have not been corrected if they corresponded to the values on the original image.
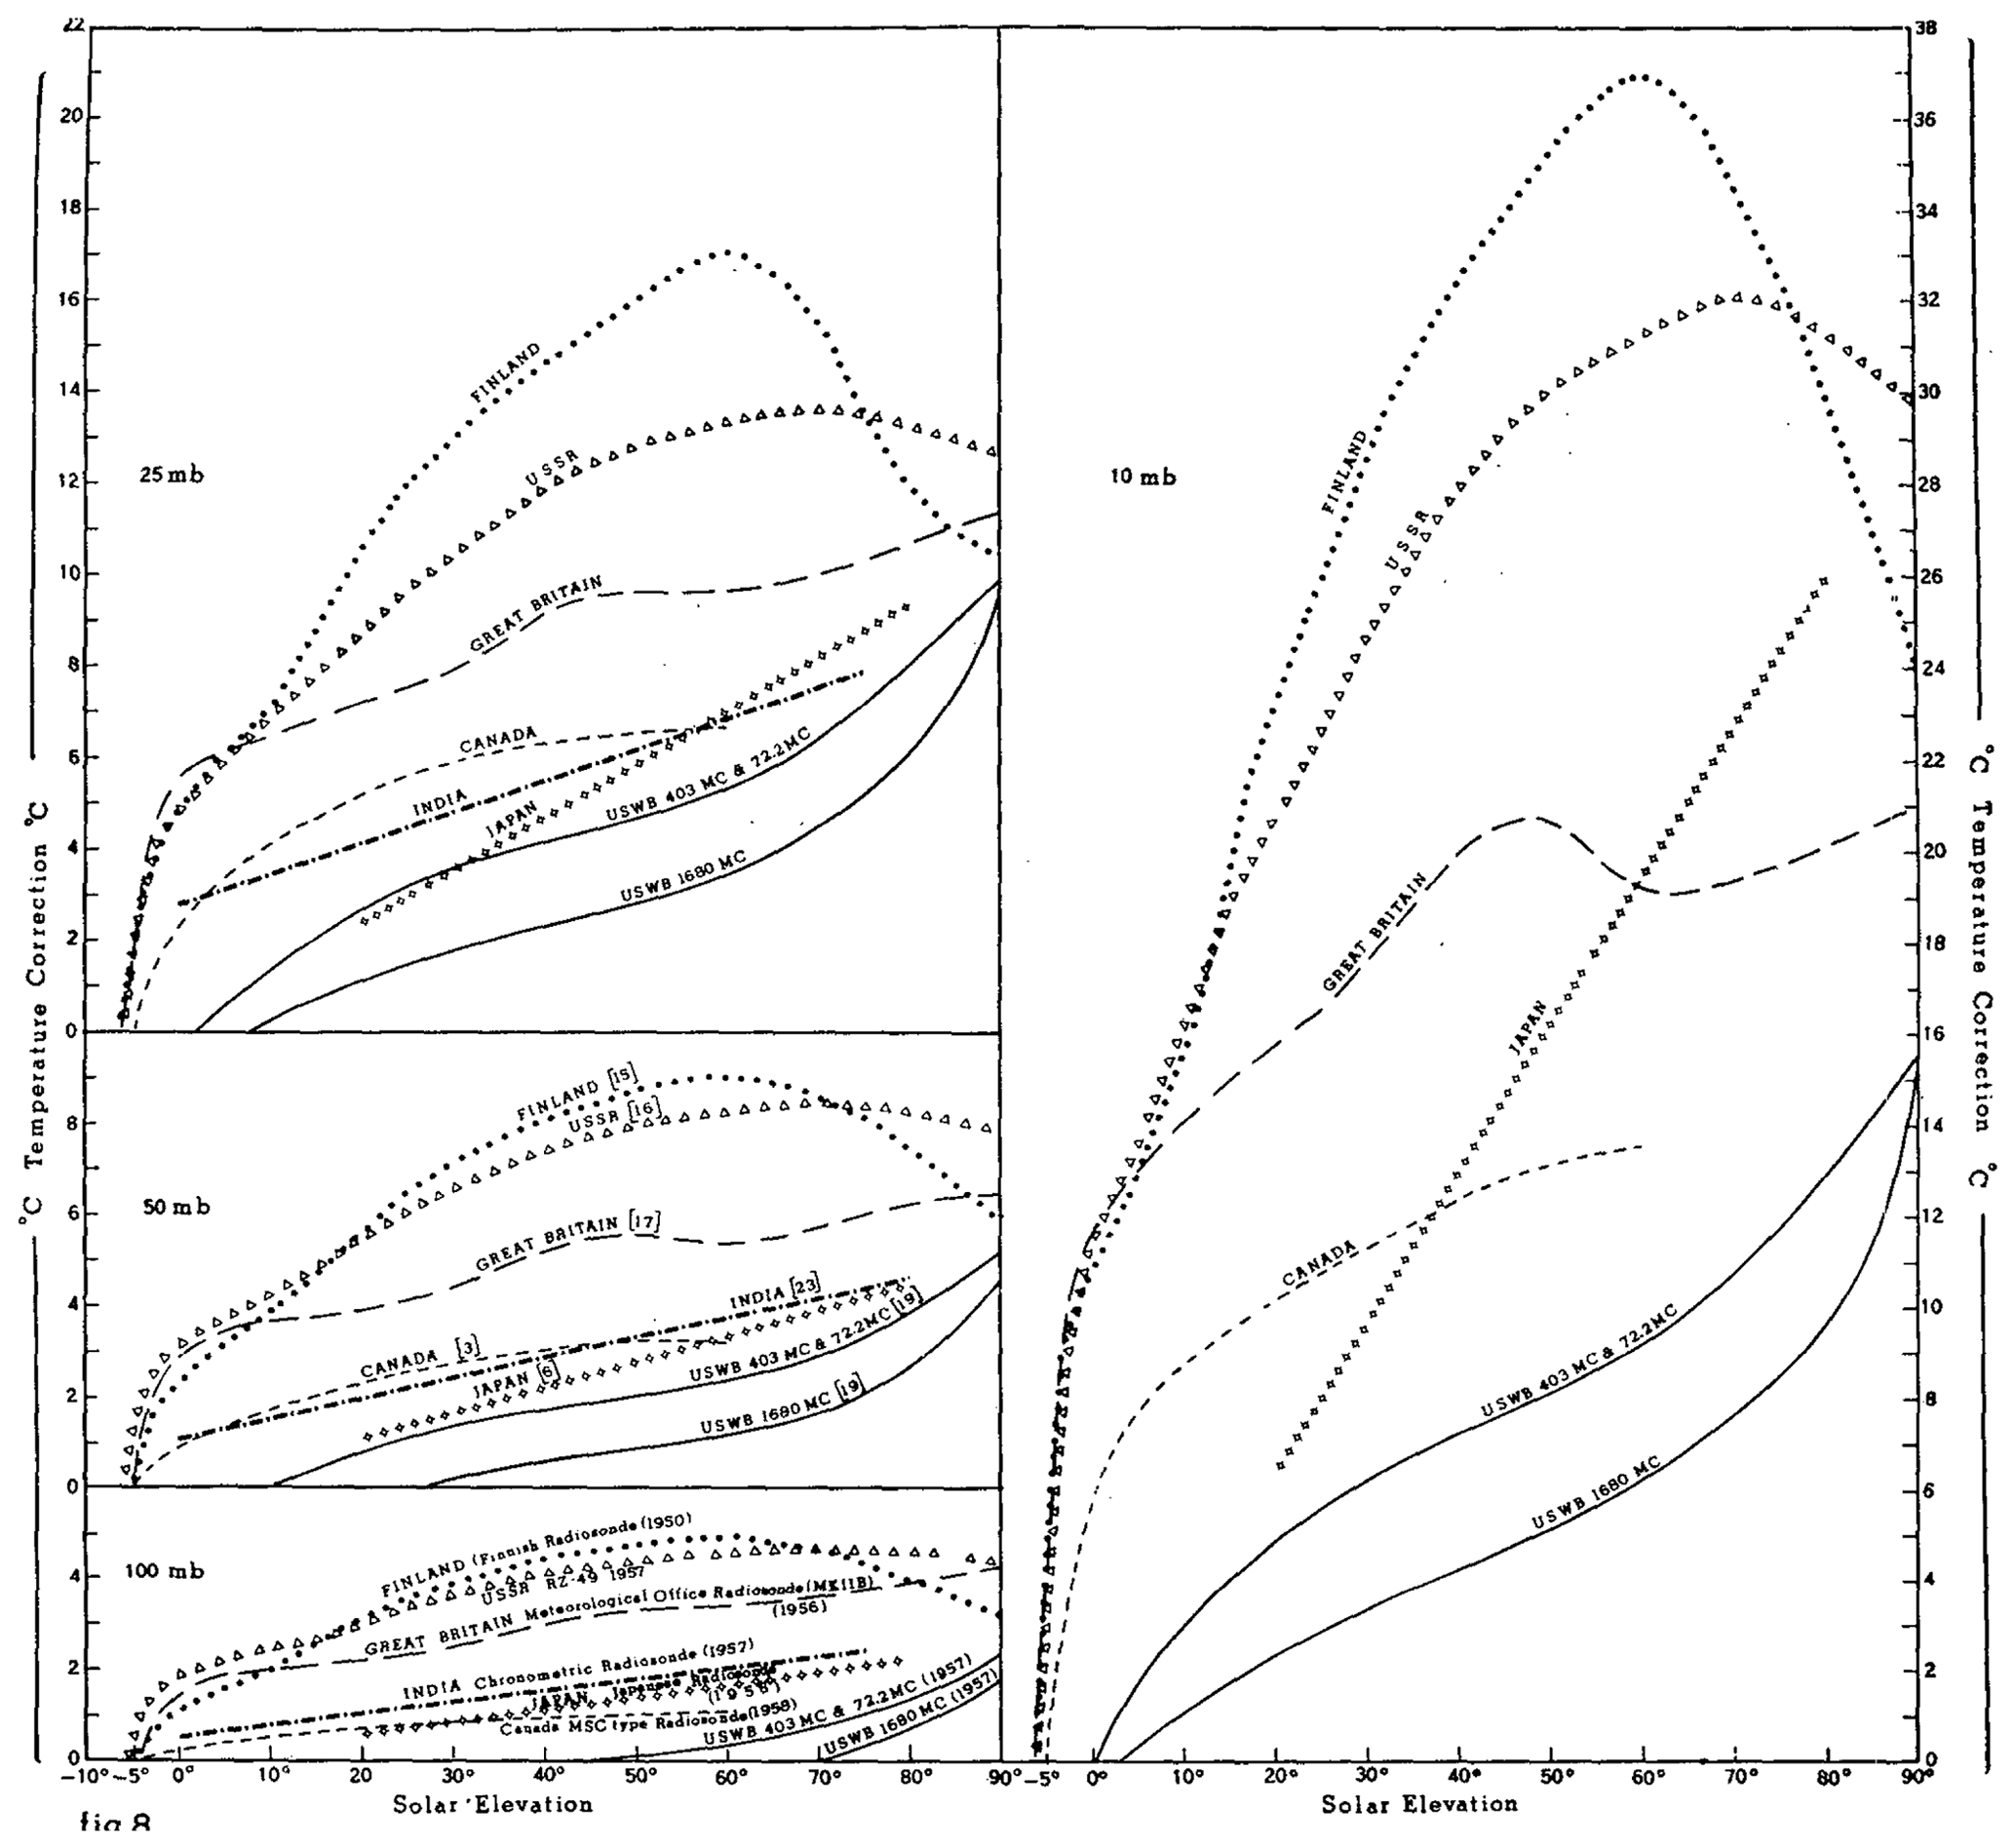
Figure 3Radiosonde temperature biases due to radiation for different radiosonde types, pressure levels, and solar elevation angles (from Teweles and Finger, 1960).
With respect to error assessments, we digitized relevant information from tabular data and even graphical data (e.g., Fig. 3). The scope of the digitized error assessment is, however, much smaller compared to the intercomparison campaigns. In addition, studies on errors and intercomparisons from the Soviet radiosondes found at the RIHMI/WDC Obninsk were translated into English and are incorporated into the database. The full collection of translated literature is publicly available under https://github.com/MBlaschek/CEUAS/tree/master/CEUAS/public/intercomparisons (last access: 14 January 2021).
3.2 Database structure
Intercomparisons can have different setups: different radiosondes can be flown on the same balloons, on different balloons at the same time, different balloons at different times, or even different balloons at different times and different places. The comparison of pressure is, for example, only possible if instruments are flown on the same balloon; then time can be used as the common axis in the data format. Also, the intercomparison campaigns are sometimes accompanied by statistical evaluations that present relative errors per radiosonde type, pressure level, etc. This information is also important as it embodies the expert knowledge of the authors, such as applied corrections. An organization of the data must thus be found that retains all the original information while also making use of the evaluated data and that allows easy access to metadata and original images.
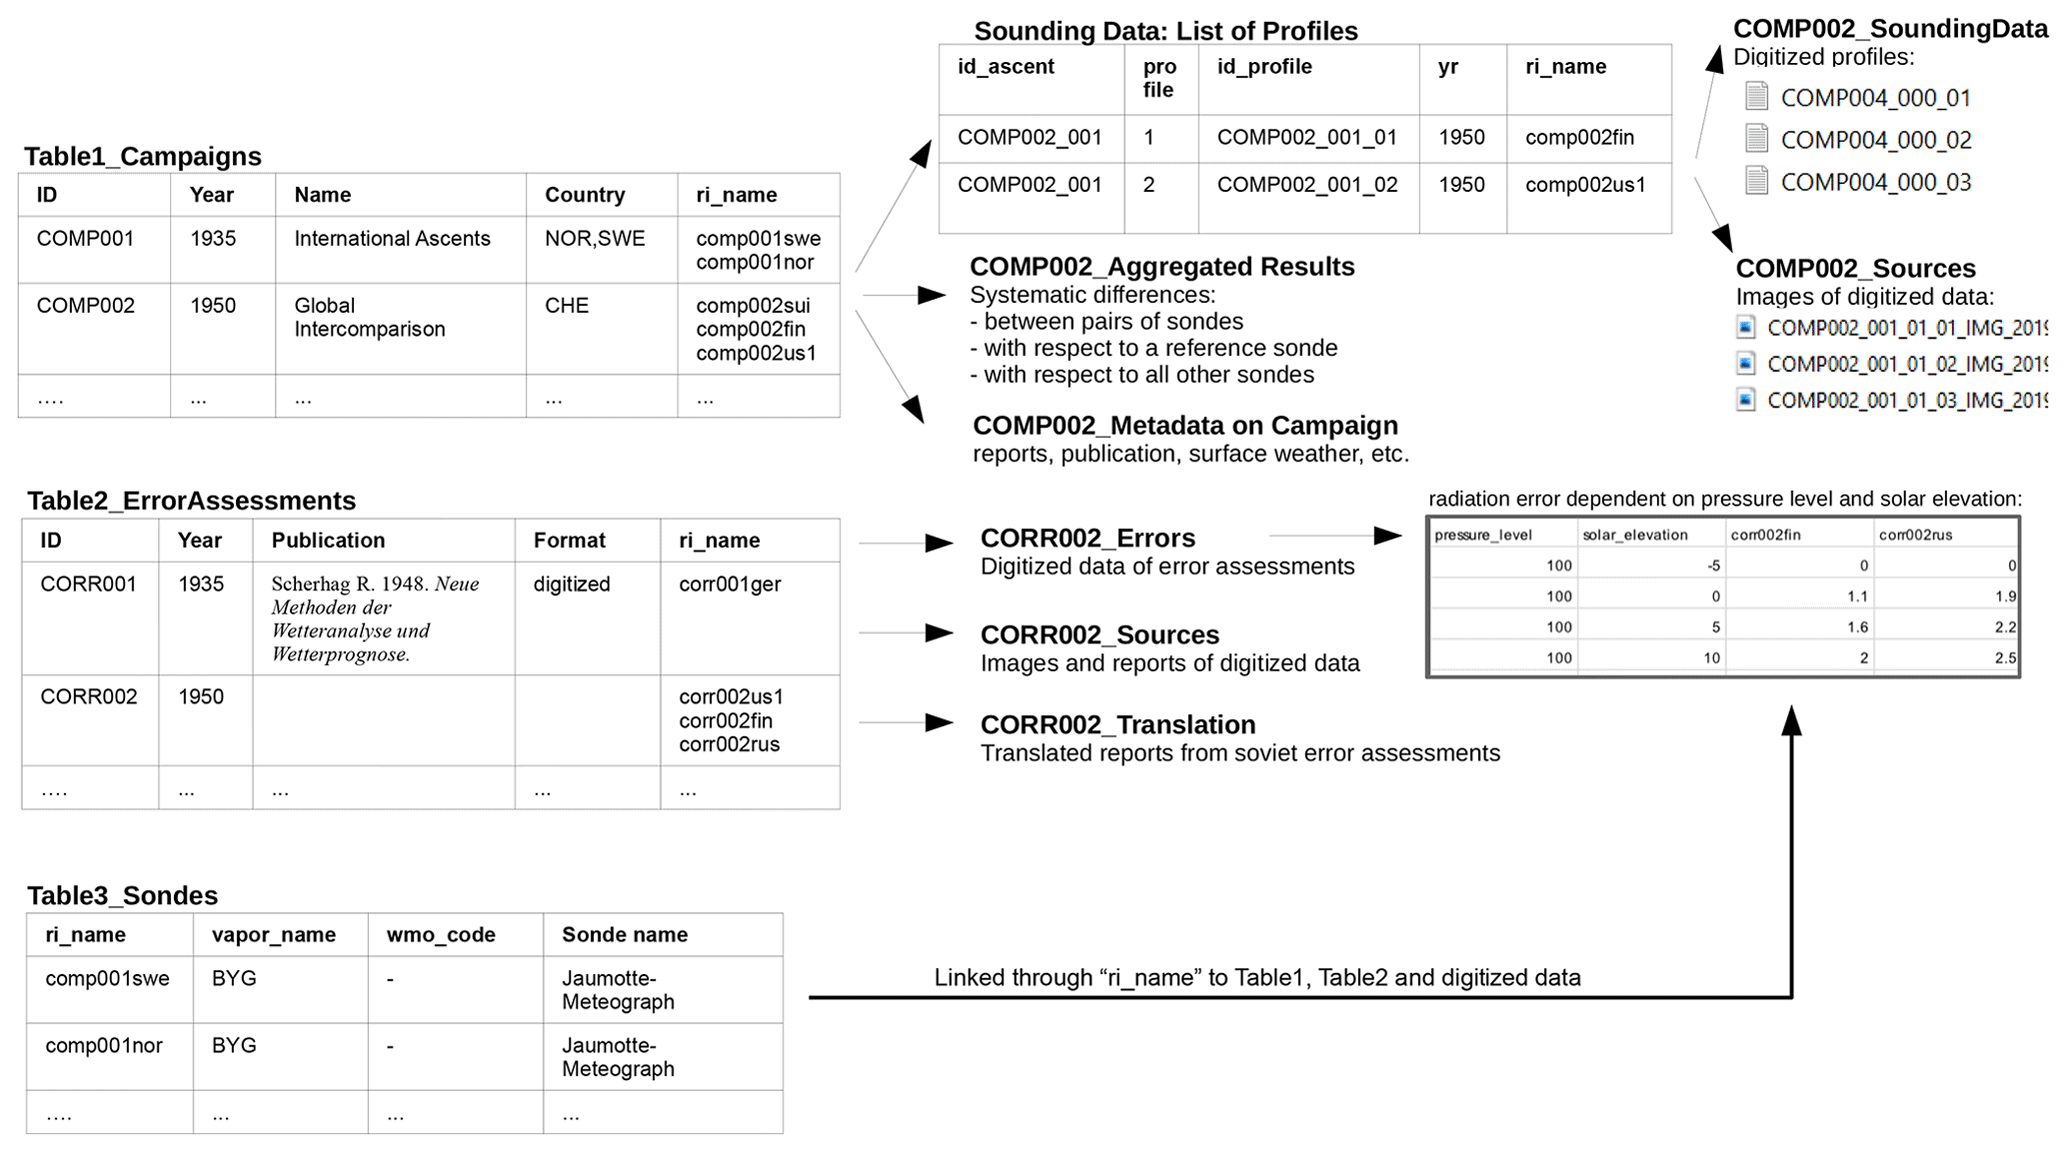
Figure 4Schematic view of database structure based on the three tables for intercomparison campaigns, error assessments, and radiosondes. A common nomenclature links the different elements of the database, i.e., the digitized data files, the metadata, the source files, and the respective radiosondes.
Table 2Digitized error assessment in our database for different radiosonde types. For full table of error assessments, refer to the database link provided in Sect. 5.
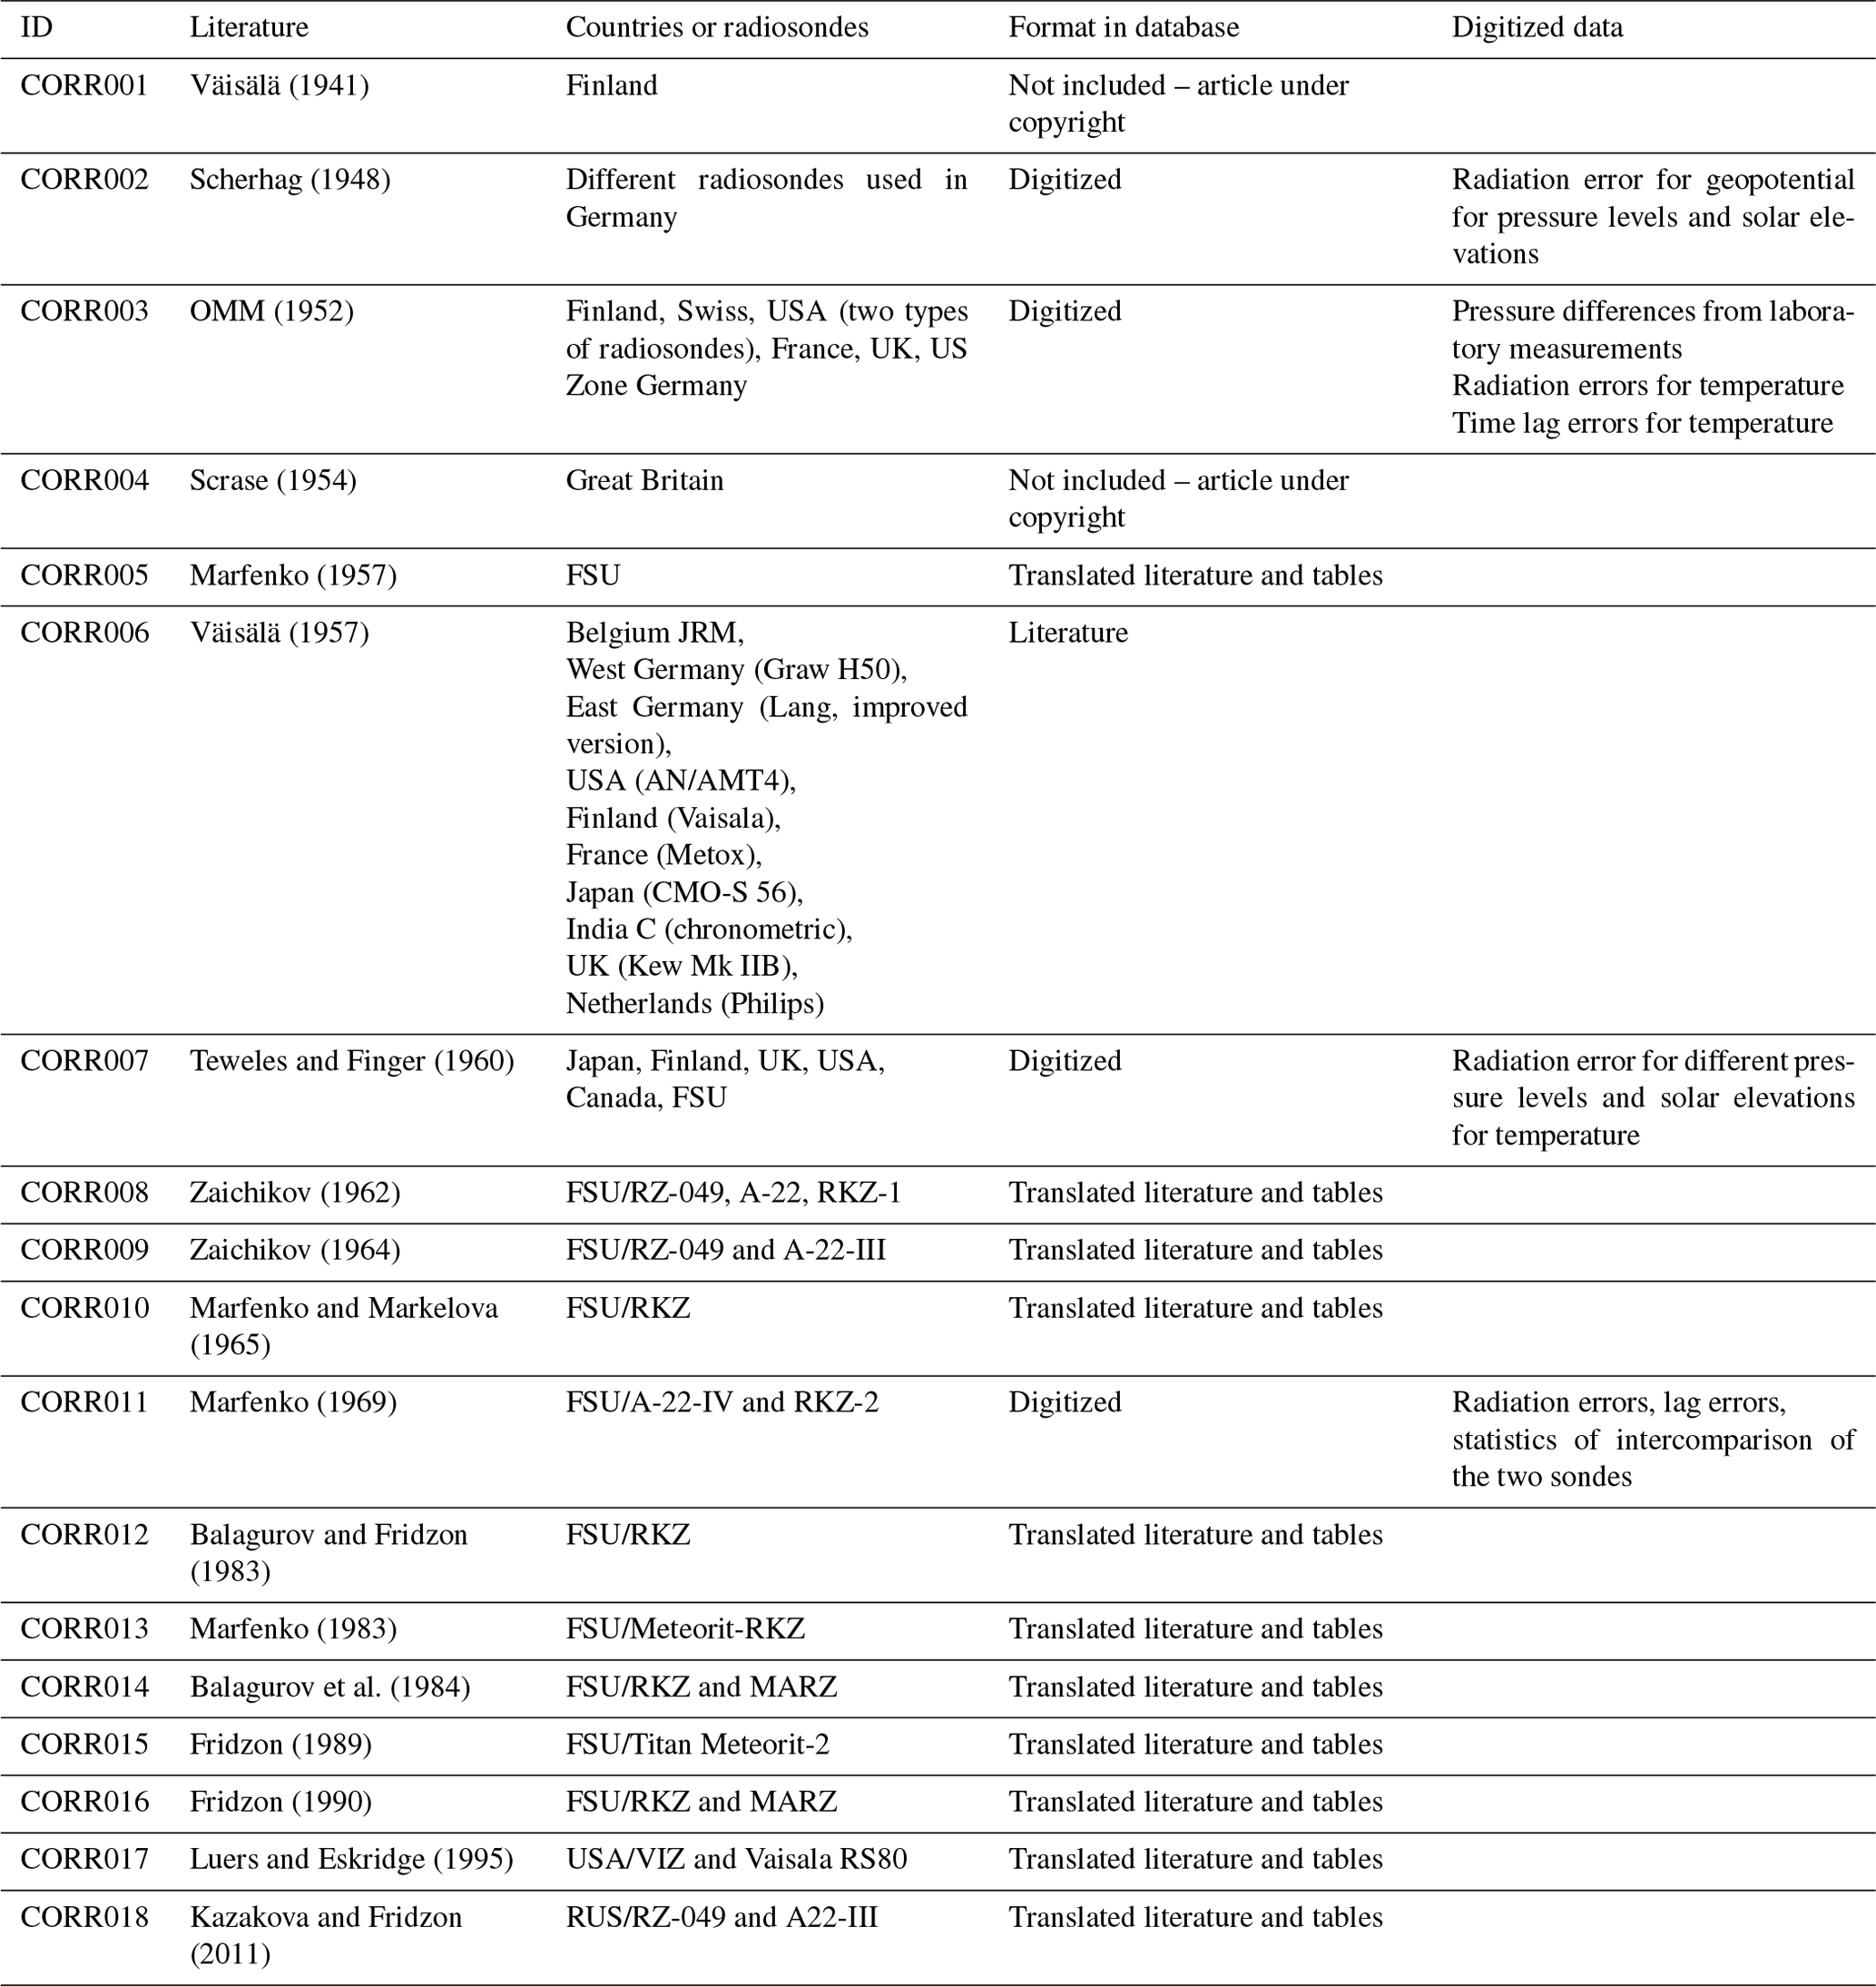
We structured the database therefore along two main threads of information: a table of intercomparison campaigns (summarized in Table 1) and a table of error assessments (summarized in Table 2) (see Fig. 4 for structure of database). Both types are linked to a third thread of information, a list of radiosondes, which reports information on the radiosonde type and relates them to operationally used radiosondes. To relate all types of information, we introduced a specific nomenclature for the campaigns, error assessments, and radiosondes. Intercomparison campaigns are named COMPXXX, where XXX relates to one campaign. All information related to one campaign is named correspondingly. Error assessments are named CORRXXX.
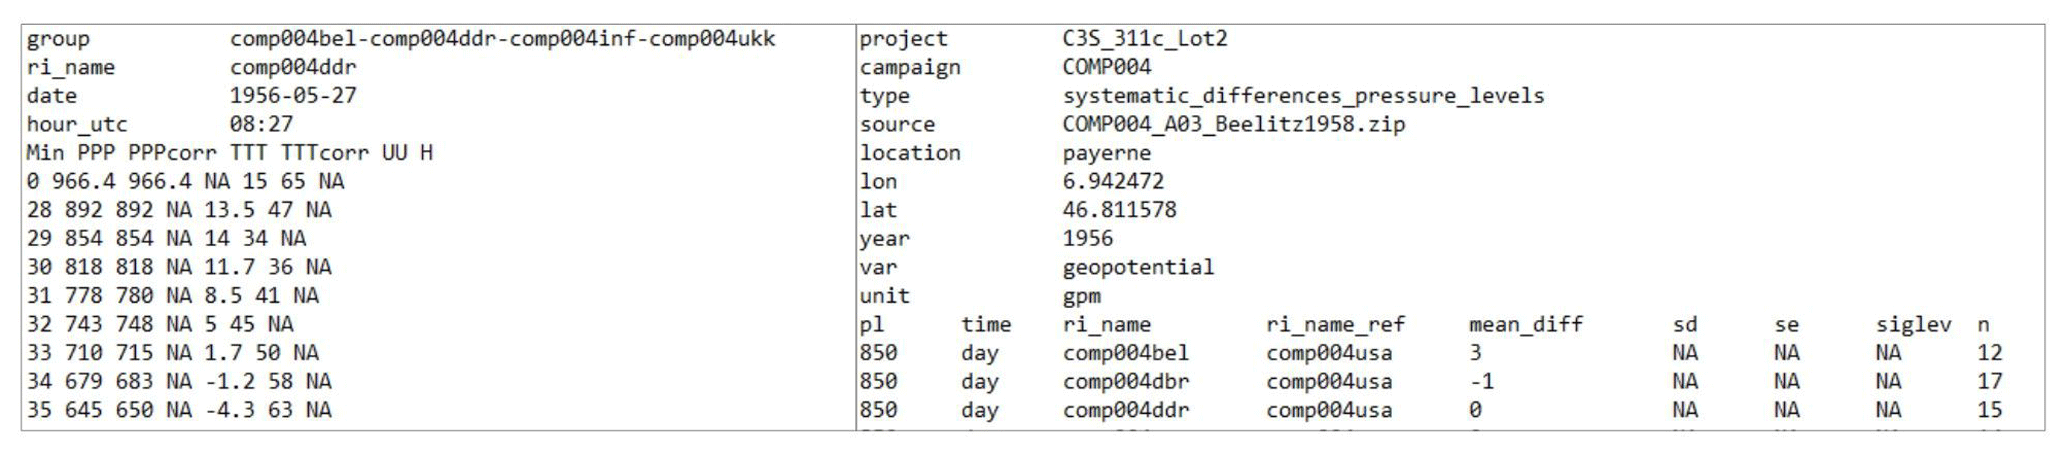
Figure 5Left: example of data format for a radiosonde profile based on minute data. Right: example of data format for aggregated results. Both data files can be linked to the lists of profiles and the lists of soundings of the respective campaign.
3.2.1 Intercomparisons
A summary of each intercomparison campaign for which digitized data are available in our database can be found in Table 1. Note that a more comprehensive summary on intercomparison campaigns can be found in the database itself, which also includes intercomparison campaigns for which we were not able to find either raw or aggregated data. The information on each intercomparison is structured uniformly. All performed soundings and all profiles of the different radiosondes from these soundings are listed in two separate lists, a list of soundings and a list of profiles (COMPXXX_ListProfiles and COMPXXX_ListSoundings). Every sounding is assigned an identification (COMPXXX_XXX) chronologically. Every profile is then assigned this sounding identification, including in addition two digits that identify the radiosonde (or profile) (COMPXXX_XXX_XX). Profiles may correspond to the same sounding, but they were launched on different balloons. Thus, start times of profiles from the same sounding can differ. The profile identification links to the digitized ascent data and to the images that have been digitized. Ascent data can be available in minute or standard level pressure data, though minute data are preferred as they allow for the comparison of pressure sensors. The prefix “m” or “s” indicate whether the data are available as minute data or on standard pressure levels. An example of the digitized ascent data is shown in Fig. 5 (left). For some campaigns, sounding lists are available, but we could not find the raw data. We still consider these lists important, as they report on the sounding schedule during the campaign and they allow us to estimate the number of performed ascents.
For some campaigns, aggregated results (statistics) that stem from analyses performed in the aftermath of the campaign are available (for some, only the aggregated results are available; see Table 1). These aggregated results are either comparisons between pairs of radiosondes, comparisons to a reference radiosonde, or comparisons to the mean of all other radiosondes. The available information includes mean differences, standard deviations, standard errors, significance levels, and the number of profiles used for the calculation of the statistics. Abbreviations thereof are mean_diff, sd, se, siglev, and n. For the aggregated results, however, the amount of information differs. For example, not for every campaign is it known how many pairs of comparisons have been used for the calculation of the statistics. The standardized files for statistics are named in addition to the campaign number with the variable they contain (e.g., temperature, pressure, etc.), the aforementioned abbreviation (“m”/“s”) for minute and pressure data, and whether they contain day or night comparisons. An example of the file structure is seen in Fig. 5 (right).
All digitized data (the profile data and the statistics) are linked to a radiosonde type, which is further described in a radiosonde table (see Sect. 3.2.3). The metadata of each campaign are available in a sub-folder of the respective campaign, and they mostly describe the setup of the intercomparisons, specify the participating radiosondes, or report on the methods used to calculate aggregated results.
3.2.2 Error assessments
Error assessments are either in digitized form as aggregated results, in graphical form, or in reference to publications (and the tables therein). A summary of error assessments that are part of the database can be found in Table 2. Error assessments can report overall errors, estimations of lag or radiation errors of a radiosonde, or also results from laboratory measurements or calibration information. Error assessments of temperature include further information, such as the solar elevation related to the temperature error, and for temperature they are mostly made on standard pressure levels. Not for all radiation errors is the solar elevation angle known, nor can it be derived, because the time when the soundings were performed is not available. The digitized error assessments is stored in a folder CORRXXX, where XXX corresponds to the identification as seen in Table 2 or the table error assessments in the database.
The list of error assessments contains the links to the digitized data, as well as metadata (e.g., methods of calculations) and images (CORRXXX_Sources). For error assessments from the RIHMI/WDC the original literature in Cyrillic and the translations thereof are made available.
3.2.3 Radiosondes table
The list of radiosondes includes specifications of the instruments that are mainly based on metadata from the individual campaigns. Each radiosonde type has a unique identifier (UID) that refers to the WMO-Code for radiosondes (if available) and more importantly to the UID from the compilation of Schröder described in Sect. 2.3. Despite the comprehensiveness of Schröder's list, we were not able to relate all radiosondes used in our comparison to the list by Schröder, and we extended his list with additional instruments. In the database, the radiosondes have their own nomenclature, the ri_name (compXXXzzz), whereof XXX refers to the campaign the radiosonde has been used in and zzz to the radiosonde itself. For the complete list of radiosondes, please refer to the database with the link provided in Sect. 5.
In the course of the three early regional and international campaigns held in Payerne 1950/1956 and Brussels 1954, the magnitude of discrepancies between radiosondes types was recognized. As a result of these intercomparisons, it was emphasized that further intercomparisons are highly needed and that efforts should be put into correcting these errors and harmonizing instruments (Beelitz, 1958; Nyberg, 1952; Painter, 1950). Nyberg (1952) concluded in their report on the first international intercomparison (COMP002) that the systematic differences between the six radiosondes compared are considerable and primarily related to radiation and lag errors. For Europe, upper-air weather maps were drawn at that time based on at least seven different radiosonde types (Painter, 1950). Until then, however, only for the Finnish radiosondes had radiation corrections been applied, which likely made the European network even less homogeneous (Nyberg, 1952). As a result of the second international comparison in 1956 (COMP004), technical recommendations were formulated to harmonize radiosonde construction. Correction values with respect to the US radiosondes were reported that could be applied to the present radiosonde network for increasing homogeneity (Beelitz, 1958). Such corrections are, however, different from corrections of lag or radiation errors, as their goal is not to correct for physical errors.
When interpreting the data from earlier intercomparison campaigns, some considerations have to be addressed. Regarding the operational networks at times, it is not entirely clear what kind of procedures were followed by the different weather services (e.g., which radiosondes were corrected for radiation and lag errors). Also, the soundings performed during the intercomparison campaigns may not be fully comparable to operational soundings (Nyberg, 1952). The intercomparisons were conducted by experts taking more precautionary measures that may not have been taken in operational soundings. Nevertheless, estimated biases are useful. Fortunately, for most of the campaigns minute data were found. This has the advantage that pressure sensors can be compared. For campaigns for which profile data are only available at standard pressure levels (e.g., COMP007), comparisons of temperature (or other) data may also contain differences that stem from the pressure sensors and not the temperature measurements.
More than 10 years after the second international intercomparison, in 1968/69, different temperature reference radiosondes were compared in Japan, FSU, Germany, and the UK (Kuzenkov and Shlyakhov, 1976). For these comparisons, summary statistics but no raw ascent data have been found at the RIHMI/WDC.
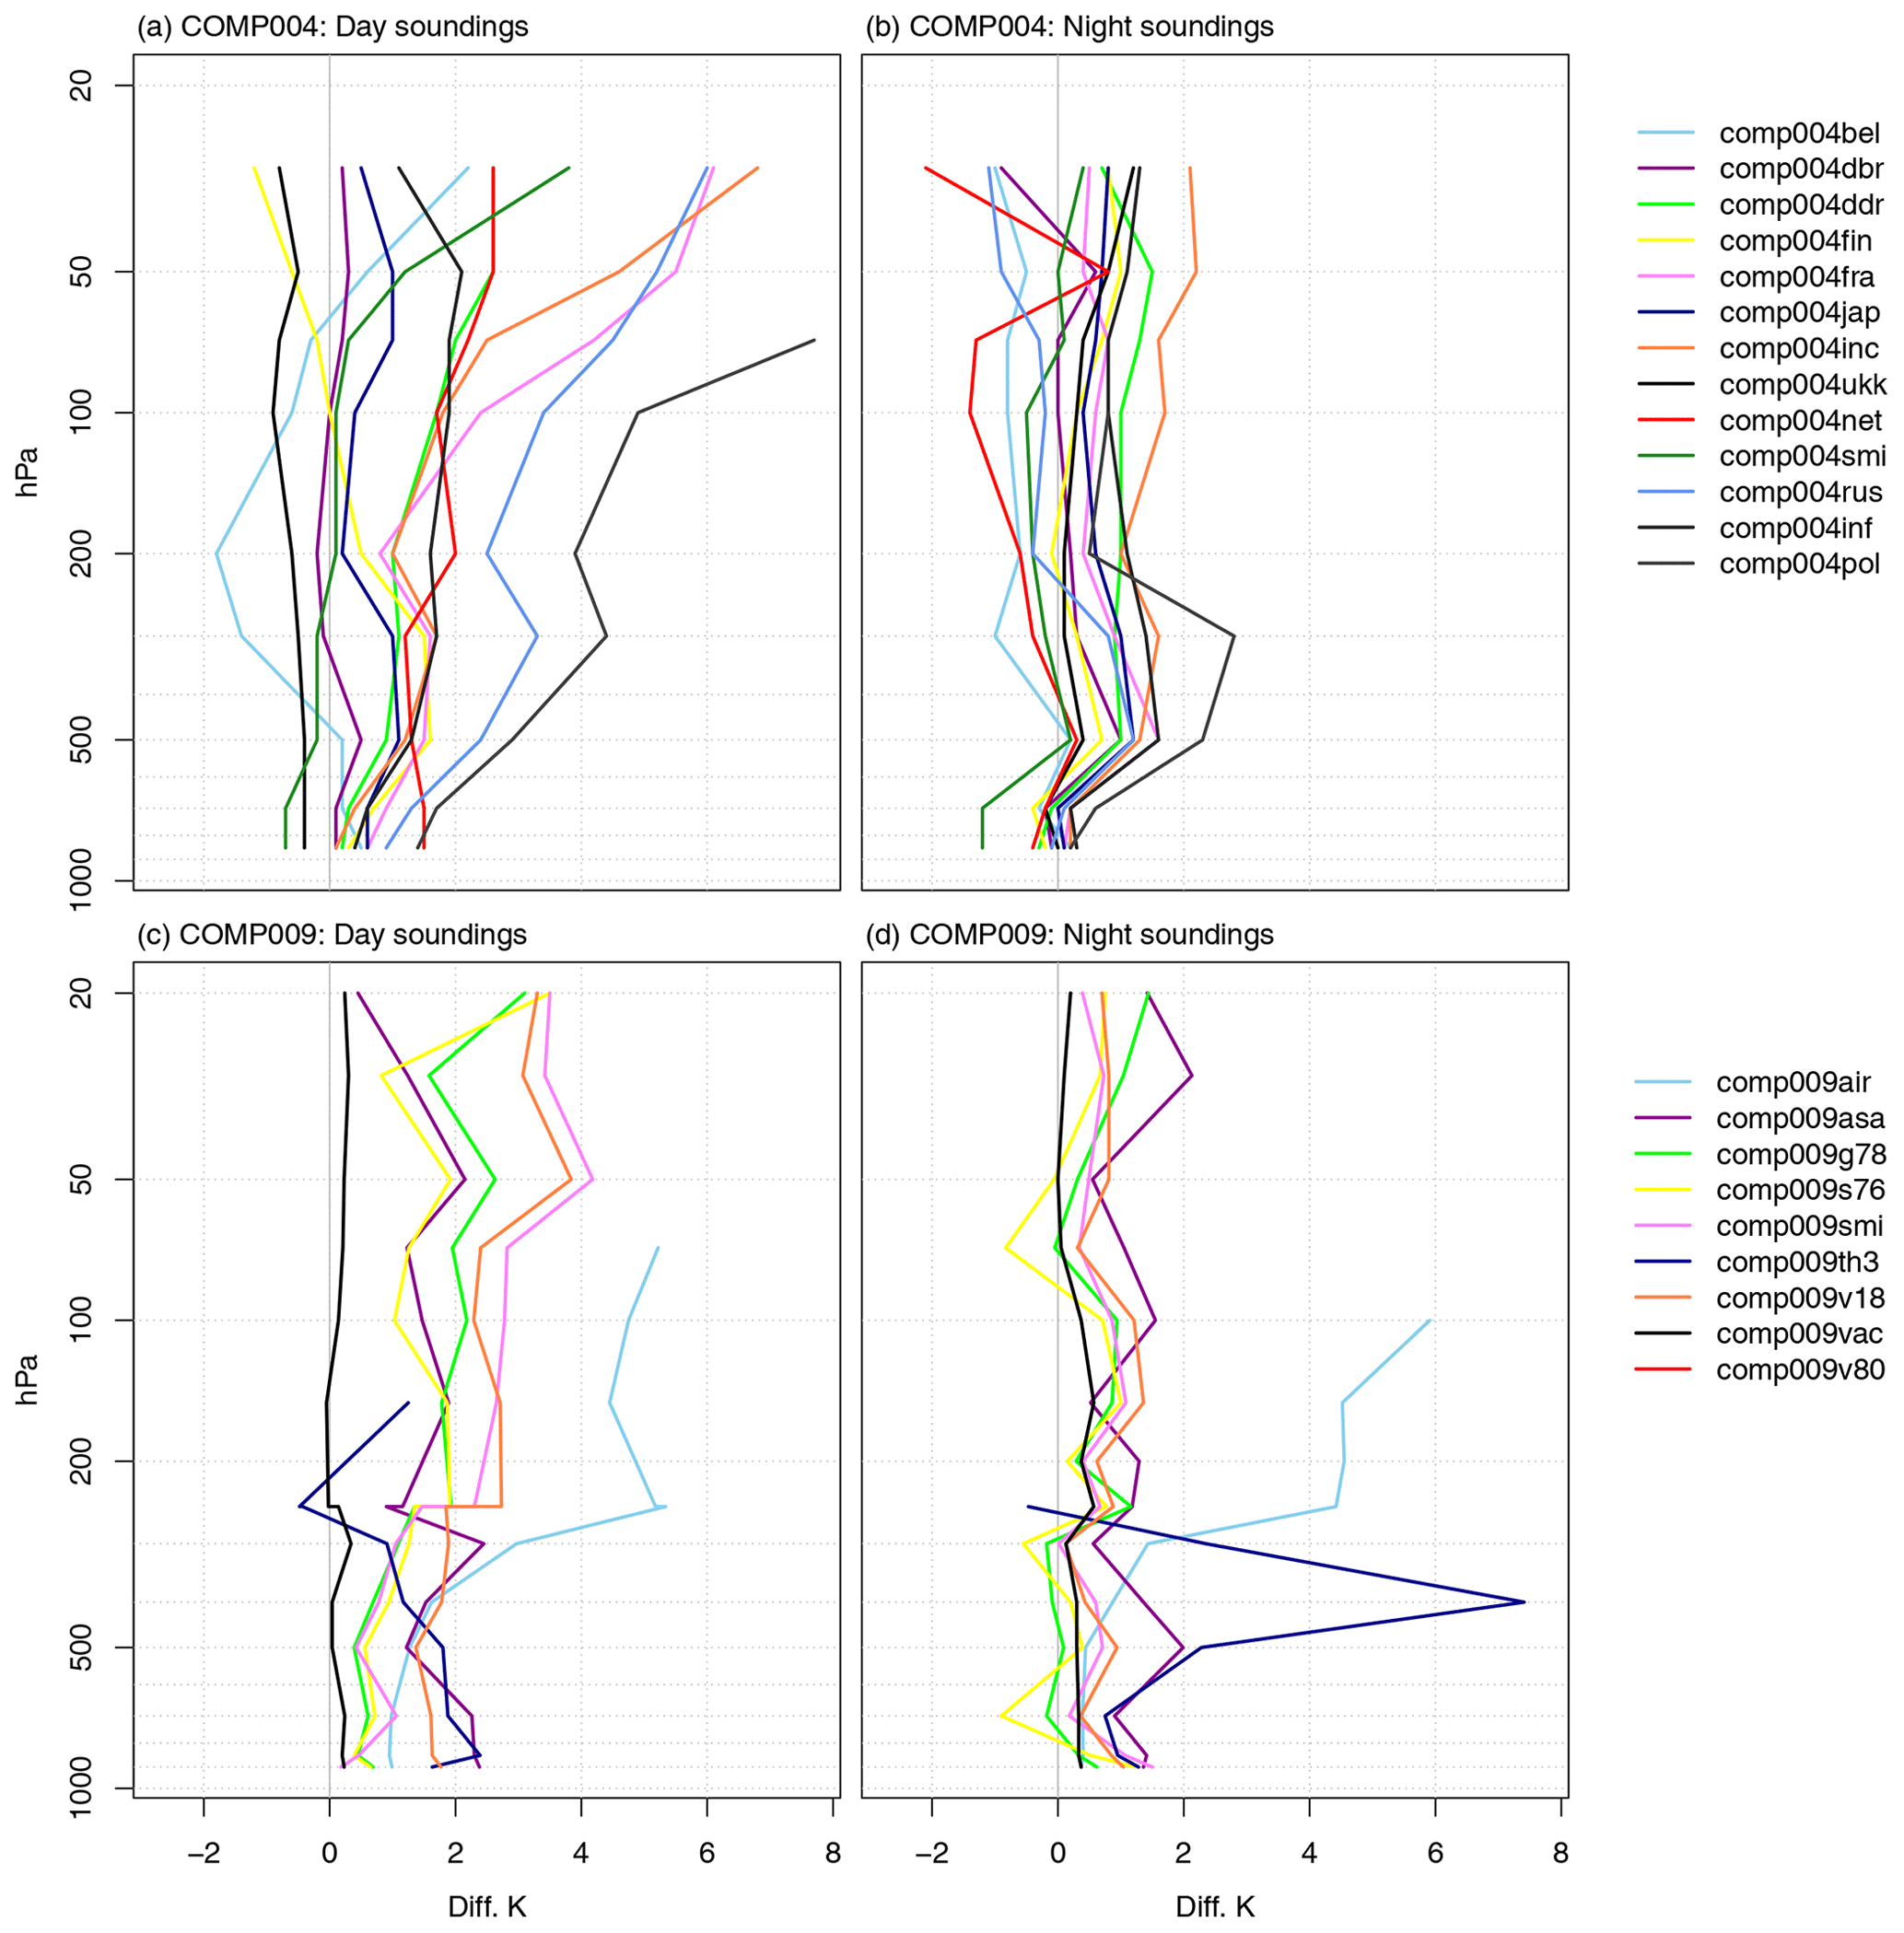
Figure 6Example of the mean differences between pairs of sondes for day and night soundings with respect to the US sonde AN/AMT-4 for COMP004 (a, b) and to the Vaisala sonde RS21-12CN (Navaid) for COMP009 (c, d). Both comparison campaigns were conducted in Payerne in 1956 and 25 years later in 1981.
Despite improved radiosonde technologies, after the intercomparisons held in Payerne in 1978 and 1981, the main conclusions still pointed out the importance of radiation correction and the need for laboratory tests (Philips et al., 1981; Richner and Philips, 1982). Systematic differences between radiosondes changed from the early campaigns in 1956 (COMP004) to 1982 (COMP009); however, they still remain evident, though systematic differences in upper-levels decreased (Fig. 6). Regarding these statistics, metadata are important because often different calculation methods were applied which also resulted in considerably different results (see, for example, a comparison of calculation methods in Beelitz, 1958). Statistics have the advantage that they contain all relevant information, such as for which radiosondes lag or radiation corrections have been applied. However, also the statistics should be considered with care. For example, the nighttime soundings for COMP009 (Fig. 6d) show outliers for two radiosonde differences. For the radiosonde comp009air, the difference value seems to increase systematically with height, whereas the outlier for comp009th3 only occurs on one pressure level. We could hypothesize that it stems from a measurement error but have no means to confirm this. As stated above the data presented are checked for digitizing errors, but outliers are not flagged. This has to be considered when using the data. In this context, it should be noted that some results may only be of limited practical value, as modifications have been made on the radiosonde or software after the experiment took place. This was the case for Airsonde, Graw RSG 78, and Vaisala RS80 used in COMP009, and it might also be true for earlier campaigns.
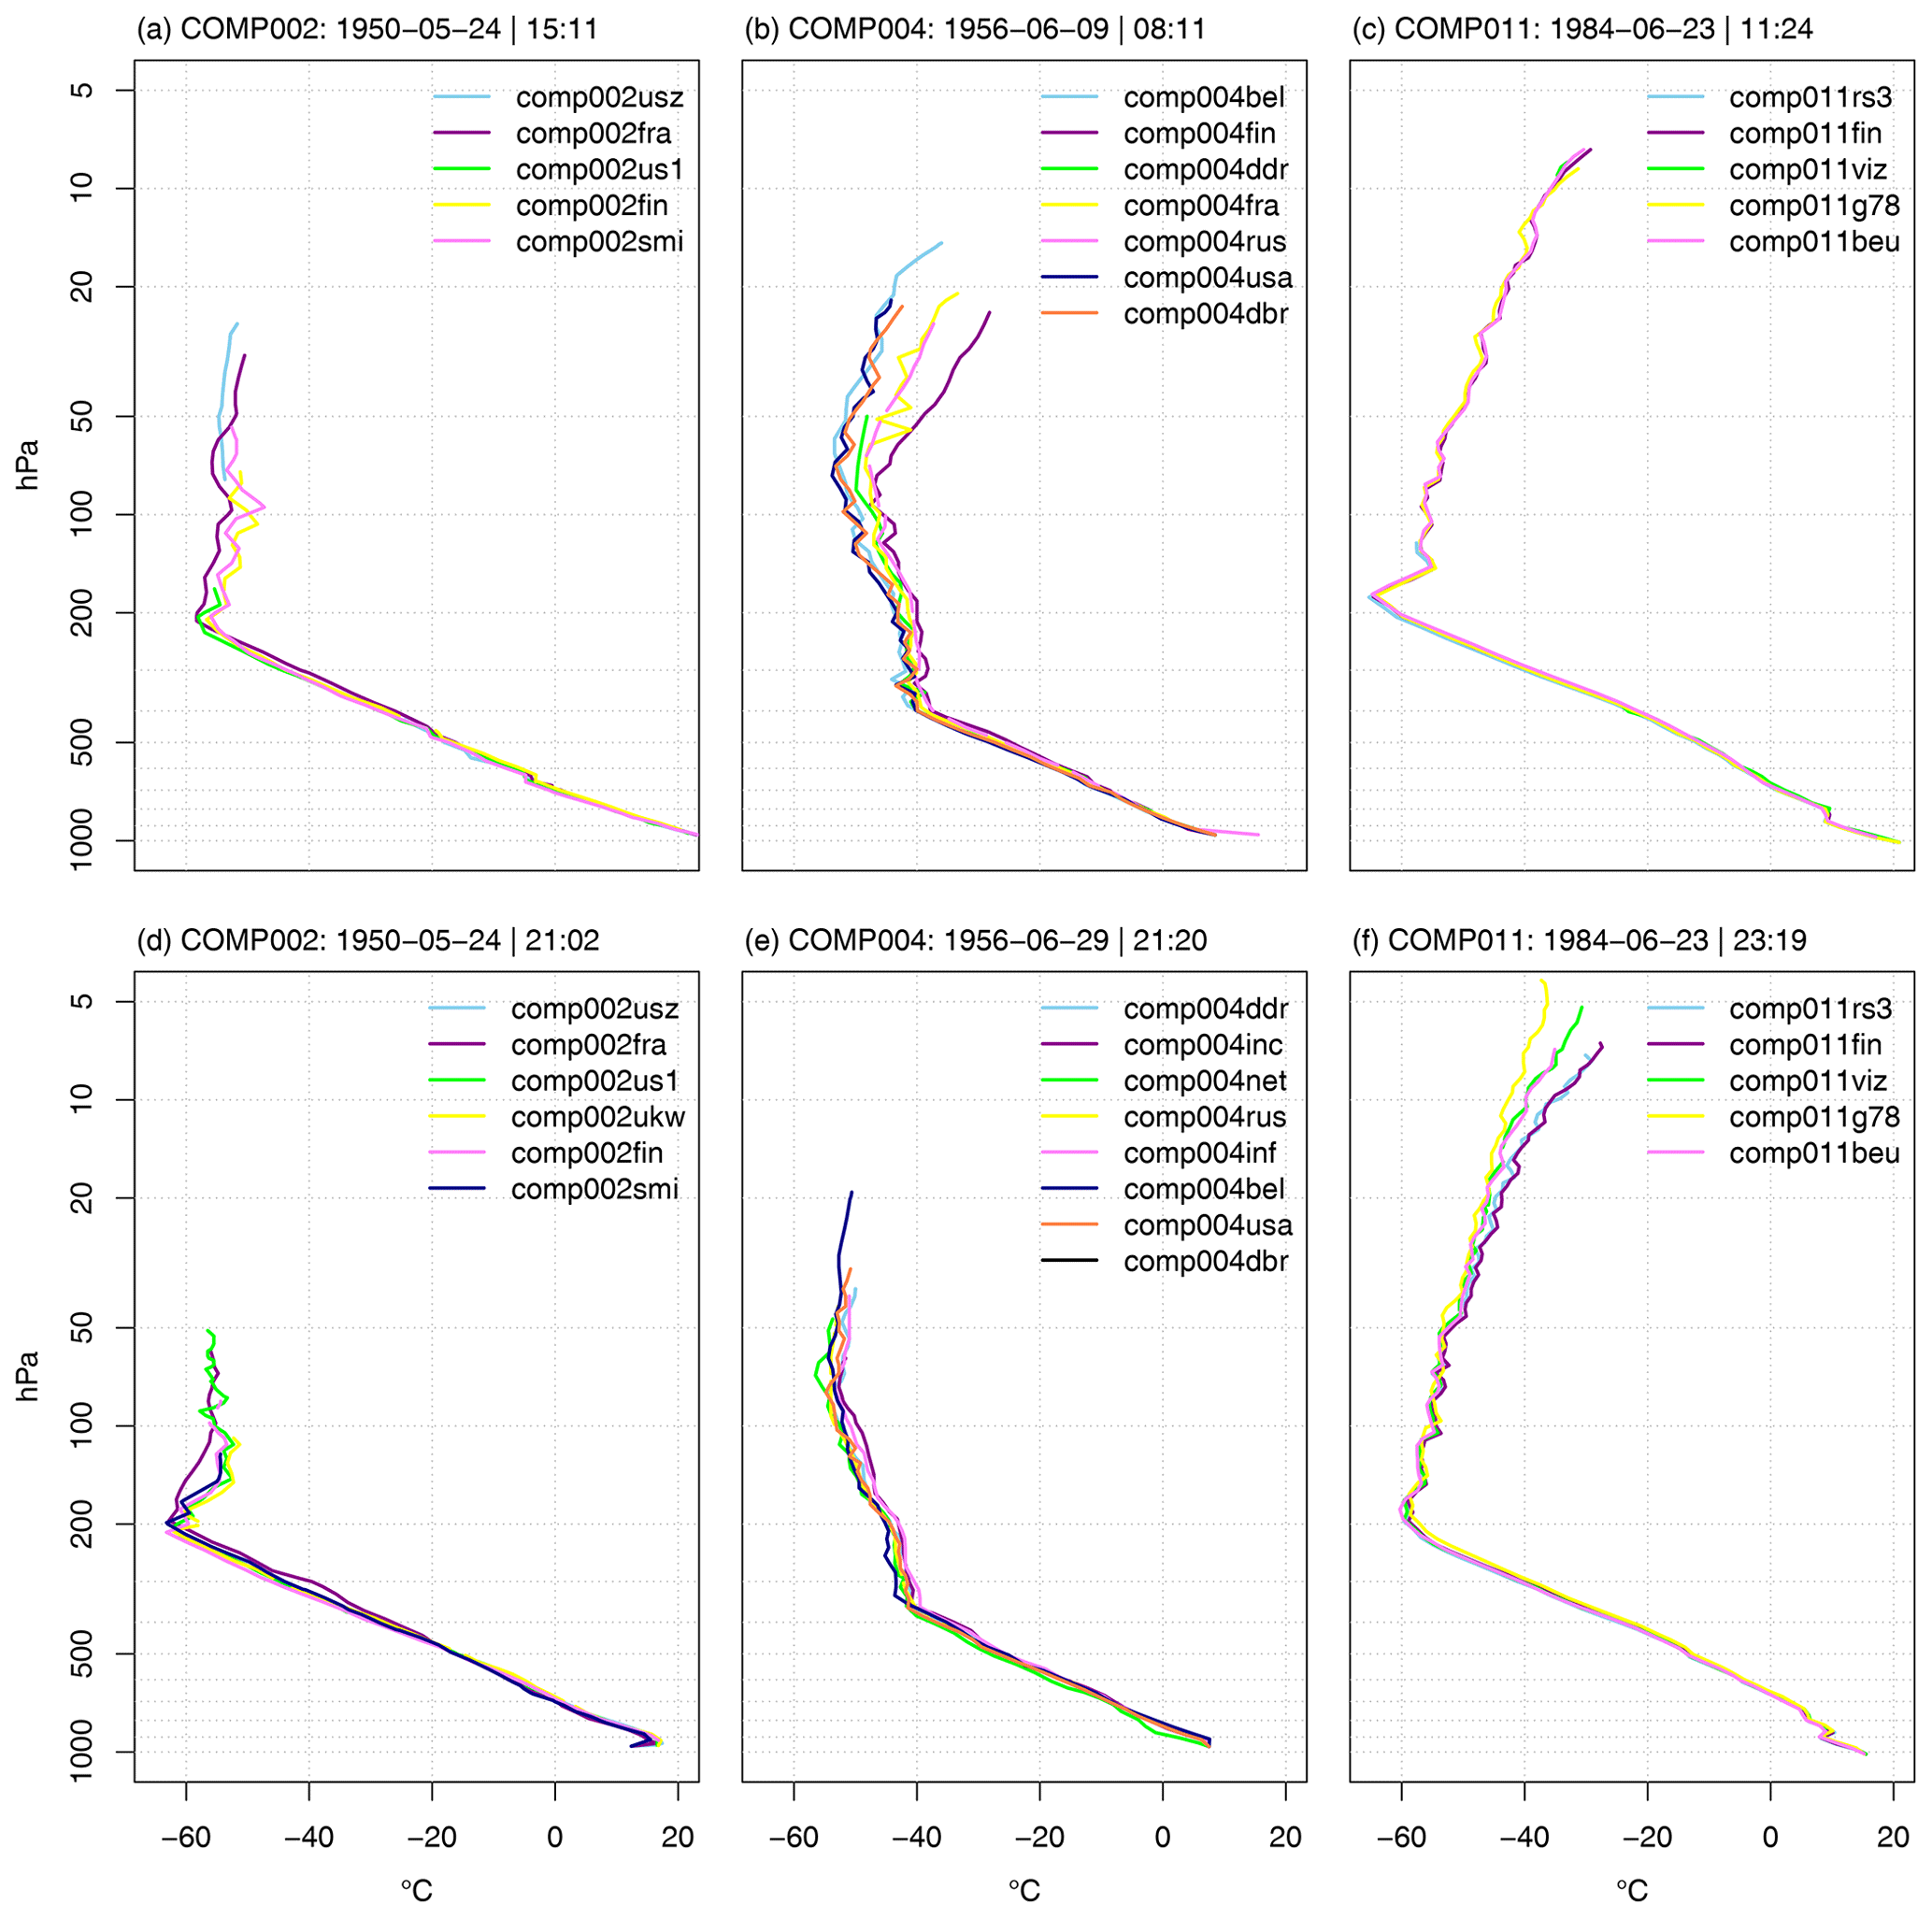
Figure 7Example of the raw digitized temperature data for Payerne 1950 (COMP002; a, d), Payerne 1956 (COMP004; b, e), and Beaufort Park 1984 (COMP011; c, f). The upper row shows soundings during different times of day, and the lower row shows soundings during different times of night. Note that the different times of day lead to considerably different solar angles. Nevertheless, the development of radiosondes is nicely visualized, in particular the increased consistency between radiosondes in 1984.
Data from more recent campaigns are easier to interpret as more metadata are available and station histories are more carefully documented. As of 1984, the first of four phases of the WMO-organized intercomparison campaigns was held in Beaufort Park, UK (Hooper, 1986). These intercomparison campaigns followed standard procedures in the setup of experiments, the calculation methods, and the software, and for all instruments relevant information on sensors and applied corrections were carefully documented. Link radiosondes were used (i.e., radiosondes without instrument changes) that allow us to relate results between the different campaigns (Hooper, 1986; Bond et al., 1988). The same practices were adopted in the regional campaign held at Crawley in 1987. Comparisons showed a marked increase in the consistency of radiosondes due to technological advances (Hooper, 1986; Bond et al., 1988). Figure 7 shows three daytime and three nighttime soundings from COMP002 (1950), COMP004 (1956), and COMP011 (1984). Despite it being exemplary, the discrepancy between temperature measurements in radiosondes is much smaller in upper-levels, and soundings reached much higher levels for COMP011. The technological improvements that made the soundings less labor intensive also allowed research teams to focus on other aspects. More soundings were conducted per day to evaluate the effects of different solar angles, and systematic differences of nighttime soundings could be evaluated (Bond et al., 1988).
The data presented herein can also inform us about homogenization procedures. A preliminary study comparing the differences of intercomparison campaigns with differences from operational radiosondes and reanalysis background departures has been performed for the four WMO intercomparisons, COMP011, COMP013, COMP016, and COMP018 (Rupnig, 2020), but results are ambiguous. A further comparison of the statistics presented herein with the differences from operational data is, however, beyond the scope of this paper.
Despite the successful search of early radiosonde intercomparisons, it should also be noted that for very recent campaigns, such as Mauritius 2005 (Nash et al., 2006), the original ascent data have not been found. This stresses the need for proper archiving and data retrieval systems.
On a large scale, radiosonde data reach back to the 1910s (e.g., Stickler et al., 2014). For this period, no sources report on intercomparison campaigns. However, on “International Days”, radiosonde ascents have been conducted in different countries synchronously. These data, which remain undigitized, could provide further information on biases of these very early soundings.
Notwithstanding the more challenging interpretation of the early radiosonde intercomparisons, for the purpose of estimating biases in early radiosonde data, the now digitally available data from the early campaigns (e.g 1950, 1953, 1956, 1968) are very important. With this database, these data are now publicly available without restrictions.
The full database is made available through PANGAEA (https://doi.org/10.1594/PANGAEA.925860) (Imfeld et al., 2021). In addition, the digitized ascent data will be available at Copernicus Climate Data Store (https://cds.climate.copernicus.eu/cdsapp#!/search?type=dataset, last access: June 2021) in “insitu-comprehensive-upper-air-observation-network” which is expected to become public in summer 2021.
For the early intercomparison campaigns of radiosondes, so far no data have been digitally available. Especially for this time, however, quantitative estimates for errors of radiosondes are available, and thus making use of this newly digitized data can prove very useful, for example, for future reanalysis products assimilating upper-air data. This paper presents a database of upper-air sounding intercomparisons and error assessments mainly focusing on data from historic radiosonde intercomparisons and error assessments as these are more error-prone. The structure of the database allows us to combine digitized soundings and graphical sources, as well as metadata. This should serve to better correct for errors in historical upper-air data, which will contribute to future reanalysis efforts.
NI and SB wrote the manuscript and set up the database. NI organized the digitization, converted the data, and completed the database. YB contributed to the digitization, database structure, and writing of the manuscript. AS carried out the archive work and translation from RIHMI/WDC. SB and LH led the project and contributed to the database organization and the writing of the manuscript.
The authors declare that they have no conflict of interest.
We thank all the students who helped in digitizing the historical data, Hans Richner for informing us about the campaigns held at Payerne, and NASA for sharing their collection of intercomparison campaigns.
The work was supported by the Copernicus Climate Change Service C311c Lot2.
This paper was edited by Qingxiang Li and reviewed by two anonymous referees.
Assmann, R., Moedebeck, H., and Hergesell, H.: Zur Geschichte der internationalen Ballonfahrten, Illustrierte Aeronautische Mitteilungen, 1898, 49–51, 1898.
Balagurov, A. M. and Fridzon, M. B.: Investigation of the temperature impact on humidity sensors of radiosonde RKZ and capabilities of its rationing, CAO Proceedings, 151, 28–33, 1983.
Balagurov, A. M., Fridzon, M. B., and Dozortsev, A. P.: Estimating the time constant of radiosondes' sorption humidity sensors, Meteor. Gidrol., 4, 114–117, 1984.
Beelitz, P.: Bearbeitung der Ergebnisse der Radiosonden-Aufstiege anläßlich des 2. Weltvergleichs von Radiosonden in Payerne (Schweiz) 1956, Meteorologische Abhandlungen, Band VII, Heft 4, Dietrich Reimer, Berlin, 1958.
Bodeker, G. E., Bojinski, S., Cimini, D., Dirksen, R. J., Haeffelin, M., Hannigan, J. W., Hurst, D. F., Leblanc, T., Madonna, F., Maturilli, M., Mikalsen, A. C., Philipona, R., Reale, T., Seidel, D. J., Tan, D. G. H., Thorne, P. W., Vömel, H., and Wang, J.: Reference Upper-Air Observations for Climate: From Concept to Reality, B. Am. Meteorol. Soc., 97, 123–135, https://doi.org/10.1175/BAMS-D-14-00072.1, 2016.
Bond, F., Edge, P., and Nash, J.: Final report on the advanced radiosonde intercomparison held at Crawley 1987, Met Office, Bracknell, 1988.
Brönnimann, S.: A historical upper air data set for the 1939–1944 period, Int. J. Climatol., 23, 769–791, 2003.
Brückner, E.: Bericht über den VII. internationalen Geographen-Kongress, Jahresbericht der Geographischen Gesellschaft von Bern, 17 (1898–1899), Geographische Gesellschaft Bern, 187–194, 1899.
Compo, G. P., Whitaker, J. S., Sardeshmukh, P. D., Matsui, N., Allan, R. J., Yin, X., Gleason, B. E., Vose, R. S., Rutledge, G., Bessemoulin, P., Brönnimann, S., Brunet, M., Crouthamel, R. I., Grant, A. N., Groisman, P. Y., Jones, P. D., Kruk, M., Kruger, A. C., Marshall, G. J., Maugeri, M., Mok, H. Y., Nordli, Ø., Ross, T. F., Trigo, R. M., Wang, X., Woodruff, S. D., and Worley, S. J.: The Twentieth Century Reanalysis Project, Q. J. Roy. Meteor. Soc., 137, 1–28, 2011.
da Silveira, R. B., Fisch, G. F., Machado, L. A. T., Dall'Antonia, A. M., Sapucci, L. F., Fernandes, D., Marque, R., and Nash, J.: WMO Intercomparison of GPS Radiosondes, Alcãntra, Brazil, 20 May–10 June 2001, WMO Instruments and Observing Methods Report 90, WMO, Geneva, 2006.
Dai, A., Wang, J., Thorne, P. W., Parker, D. E., Haimberger, L., and Wang, X. L.: A new approach to homogenize daily radiosonde humidity data, J. Climate, 24, 965–991, 2011.
Diamond, H., Hinman Jr., W. S., and Dunmore, F. W.: The development of a radio-meteorograph system for the Navy Department, B. Am. Meteorol. Soc., 18, 73–99, 1937.
Dines, W. H.: The Vertical Temperature Distribution in the Atmosphere over England, and Some Remarks on the General and Local Circulation, Philos. T. R. Soc. Lond., 211 253–278, 1912.
Dirksen, R. J., Sommer, M., Immler, F. J., Hurst, D. F., Kivi, R., and Vömel, H.: Reference quality upper-air measurements: GRUAN data processing for the Vaisala RS92 radiosonde, Atmos. Meas. Tech., 7, 4463–4490, https://doi.org/10.5194/amt-7-4463-2014, 2014.
Dubois, J. L., Multhauf, R. P., and Ziegler, C. A.: The invention and development of the radiosondes, with a catalog of upper-atmospheric telemetering probes in the National museum of American History, Smithsonian Institution, Smithsonian Institution Press, Washington, DC, 2002.
Durre, I., Yin, X., Vose, R. S., Applequist, S., and Arnfield, J.: Enhancing the Data Coverage in the Integrated Global Radiosonde Archive, J. Atmos. Ocean. Tech., 35, 1753–1770, 2018.
Fridzon, M. B.: Estimation of temperature and humidity measurement errors at radiosondes on the USSR aerological network, Meteorologia and Gydrologia, 5, 114–118, 1989.
Fridzon, M. B.: On research of metrological characteristics of radiosondes' humidity sensors, CAO Proceedings, 168, 48–56, 1990.
Gaffen, D. J.: Historical changes in radiosonde instruments and practices, WMO Instruments and observing methods Report No. 50, WMO/TD-No. 541, WMO, Geneva, 1993.
Goltsova, K. L., Marfenko, O. V., Petrosyants, M. A., and Reshetov, V. D.: Intercomparison of the Soviet and the American systems for ship radiosounding, Meteor. Gidrol., 12, 92–97, 1974.
Grant, A. N., Brönnimann, S., Ewen, T., and Nagurny, A.: A New Look at Radiosonde Data Prior to 1958, J. Climate, 22, 3232–3247, 2009.
Haimberger, L.: Homogenization of radiosonde temperature time series using innovation statistics, J. Climate, 20, 1377–1403, 2007.
Haimberger, L., Tavolato, C., and Sperka, S.: Homogenization of the global radiosonde dataset through combined comparison with reanalysis background series and neighboring stations, J. Climate, 25, 8108–8131, 2012.
Hermite G.: L'exploration de la haute atmosphère. Ascension du ballon l'Aérophile, L'Aérophile, 1, 45–55, 1893.
Hersbach, H., Brönnimann, S., Haimberger, L., Mayer, M., Villiger, L., Comeaux, J., Simmons, A., Dee, D., Jourdain, S., Peubey, C., Poli, P., Rayner, N., Sterin, A. M., Stickler, A., Valente, M. A., and Worley, S. J.: The potential value of early (1939–1967) upper-air data in atmospheric climate reanalysis, Q. J. Roy. Meteor. Soc., 143, 1197–1210, 2017.
Hooper, A. H.: WMO International radiosonde comparison Phase 1 Beaufort Park, UK 1984, WMO Instruments and observing methods, Report No. 28, WMO, Geneva, 1986.
Imfeld, N., Haimberger, L., Sterin, A., Brugnara, Y., and Brönnimann S.: Intercomparisons, Error Assessments, and Technical Information on Historical Upper-Air Measurements, PANGAEA, https://doi.org/10.1594/PANGAEA.925860, 2021.
Ivanov, A., Kats, A., Kurnosenko, S., Nash, J., and Zaitseva, N.: WMO International Radiosonde Comparison, Phase III, Dzhambul, USSR, 1989, WMO Instruments and observing methods, Report No. 40, WMO, Geneva, 1991.
Jeannet, P., Philipona, R., and Richner, H.: Swiss upper-air balloon soundings since 1902, in: From weather observations to atmospheric and climate sciences in Switzerland. Celebrating 100 years of the Swiss Society for Meteorology: A book of the Swiss Society for Meteorology, edited by: Willemse S. and Furger M., Vdf Hochschulverlag AG ETH Zürich, 141–167, 2016.
Kaimal, J. C., Baynton, H. W., and Gaynor, J. E.: The Boulder low-level intercomparison experiment, NOAA/NCAR Boulder Atmospheric Observatory, 189, 1980.
Karhunen, P., Trifonov, G. P., and Yurmanov, V. A.: The intercomparison of the Soviet radiosonde system “Meteorit-2-MARS-2-0KA-3” with the Finnish system MicroCORA, Meteor. Gidrol., 11, 111–115, 1987.
Kazakova, N. N.: On the comparison of temperature and wind sounding data obtained by different systems, AARI Proceedings, 409, 93–111, 1998.
Kazakova, N. N. and Fridzon, M. B.: Assessment of uniformity (homogeneity) of the data series of temperature-wind sounding of the atmosphere at the Russian Antarctic stations, Problemi Arktiki i Antarktiki, 1, 41–55, 2011.
Krechmer, M. V., Shlyakhov, V. I., Glagolev, Y. A., Kuzmicheva, N. A., Kuzenkov, A. F., Markelova, K. I., and Yurchuk, V. A.: Individual results of comparison between upper-air radio-thermometers, Meteor. Gidrol., 10, 98–102, 1969.
Kuzenkov, A. F. and Shlyakhov, V. I.: Implementing the programme of international comparisons of upper-air radiosondes, CAO Proceedings, 118, 33–39, 1976.
Labitzke, K.: Die Stratospäre: Phänamene, Geschichte, Relevanz, Springer Verlag, Berlin Heidelberg New York, 177 S., 1999.
Laloyaux, P., de Boisseson, E., Balmaseda, M., Bidlot, J.-R., Broennimann, S., Buizza, R., Dalhgren, P., Dee, D., Haimberger, L., Hersbach, H., Kosaka, Y., Martin, M., Poli, P., Rayner, N., Rustemeier, E., and Schepers, D.: CERA-20C: A coupled reanalysis of the twentieth century, J. Adv. Model. Earth Sy., 10, 1172–1195, https://doi.org/10.1029/2018MS001273, 2018.
Lander, A. J.: The British Radiosonde, Weather, 1, 21–24, 1946.
Lange, K. O.: The 1936 radio-meteographs of Blue Hill Observatory, B. Am. Meteorol. Soc., 18, 107–126, 1937.
Lanzante, J. R., Klein, S. A., and Seidel, D. J.: Temporal homogenization of monthly radiosonde temperature data. Part I: Methodology, J. Climate, 16, 224–240, 2003.
Luers, J. K. and Eskridge, R. E.: Temperature correction for the VIZ and Vaisala Radiosondes, J. Appl. Meteorol., 34, 1241–1253, 1995.
Malet, L. M.: Comparaison régionale de radiosondes – Bruxelles 4.11.54–19.11.54, Inst. Roy. Mét., Publ. Série A 3, Uccle, 1955.
Marfenko, O. V.: Random (Accidental) errors of radiosonde RZ-049, CAO Proceedings, 22, 35–39, 1957.
Marfenko, O. V.: Estimating the accuracy of radiosounding results in the upper-air network of the Soviet Union, Meteor. Gidrol., 3, 14–21, 1969.
Marfenko, O. V.: Metrological investigation of the method for pressure measurement in atmospheric radiosounding, CAO Proceedings, 147, 3–9, 1983.
Marfenko, O. V. and Markelova, K. I.: Findings of radiation errors of thermistor radiosonde RKZ in flying conditions, CAO Proceedings, 67, 24–30, 1965.
Nash, J., Smout, R., Oakley, T., Pathack, B., and Kurnosenko, S.: The WMO Intercomparison of Radiosonde Systems – Final Report, Vacoas, Mauritius, 2–25 February 2005, WMO/TD No. 1303, OM Report No. 83, WMO, Geneva, 21–27, 2006.
Nash, J., Oakley, T., Vömel, H., and Wei, L. I.: WMO Intercomparison of high quality radiosonde systems, Yangjiang, China, 12 July–3 August 2010, WMO Instruments and Observing Methods Report 107, WMO, Geneva, 238, 2011.
Nyberg, A.: On the comparison of radiosonde data in Payerne, May 1950, Sveriges Meteorologiska Och Hydrologiska Institut, Stockholm, 1952.
Nyberg, A., Bergeron, T., and Palmén, E.: Synoptisch-aerologische Bearbeitung der Internationalen Registrierballonaufstiege in Europa in der Zeit 17.–19. Oktober 1935, Geogr. Ann., 24, 51–93, 1942.
OMI: Comparaison Mondiale des Radiosondes, Acte Final, Vol. I, Station Centrale Suisse de Météorologie, Organisation Météorologique Internationale, 1951.
OMM: Comparaison Mondiale des Radiosondes, World Comparison of Radiosondes, Acte Final, Vol. III, Station Centrale Suisse de Météorologie, Organisation Météorologique Mondiale, Zurich, March 1952.
OMM: Comparaison Mondiale des Radiosondes, World Comparison of Radiosondes, Recueil des Radiosondages, Complet Results of Radiosoundings. Vol. I, Technical Informations, Organisation Météorologique Mondiale, Zurich, July 1956.
Painter, E. E.: International radiosonde trials, Weather, 5, 307–310, 1950.
Phillips, P. D., Richner, H., Joss, J., and Ohmura, A.: ASOND-78: An Intercomparison of Vaisala, VIZ and Swiss Radiosondes, Pure Appl. Geophys., 119, 1–19, 1981.
Ramella Pralungo, L., Haimberger, L., Stickler, A., and Brönnimann, S.: A global radiosonde and tracked balloon archive on 16 pressure levels (GRASP) back to 1905 – Part 1: Merging and interpolation to 00:00 and 12:00 GMT, Earth Syst. Sci. Data, 6, 185–200, https://doi.org/10.5194/essd-6-185-2014, 2014.
Raunio, N.: Amendments to the computation of the radiation error of the Finnish (Väisälä) radiosonde, Geophysica, 4, 14–20, 1950.
Reichsamt für Wetterdienst: Technische Vorschrift für die Radiosonde, Modell Lang, Vorläufige Form, Reichsamt für Wetterdienst, Juli 1940.
Richner, H. and Phillips, P. D.: Reproducibility of VIZ Radiosonde Data and Some Sources of Error, J. Appl. Meteorol., 20, 954–962, 1981.
Richner, H. and Phillips, P. D.: The Radiosonde Intercomparison SONDEX Spring 1981, Payerne, PAGEOPH, 120, 852–907, 1982.
Rupnig, T.: Messdifferenz zwischen Radiosondensensoren, geschätzt aus Radiosondenvergleichsexperimenten und Reanalysen, Master's thesis, available at: http://othes.univie.ac.at/65166/1/70520.pdf (last access: 7 April 2021), University of Vienna, Vienna, 2020.
Scherhag R.: Neue Methoden der Wetteranalyse und Wetterprognose, Springer, Berlin, 1948.
Schmidlin, F. J.: WMO International Radiosonde Comparison, Phase II, 1985, WMO Instruments and observing methods, Report No. 29, WMO, Geneva, 1988.
Scrase, F. J.: Radiation and lag errors of the Meteorological Office radiosonde and the diurnal variation of upper-air temperature, Q. J. Roy. Meteor. Soc., 80, 565–578, 1954.
Seidel, D. J., Berger, F. H., Diamond, H. J., Dykema, J., Goodrich, D., Immler, F., Murray, W., Peterson, T., Sisterson, D., Sommer, M., Thorne, P., Vömel, H., and Wang, J.: Reference Upper-Air Observations for Climate: Rationale, Progress, and Plans, B. Am. Meteorol. Soc., 90, 361–369, https://doi.org/10.1175/2008BAMS2540.1, 2009.
Sherwood, S. C., Meyer, C. L., Allen, R. J., and Titchner, H. A.: Robust Tropospheric Warming Revealed by Iteratively Homogenized Radiosonde Data, J. Climate, 21, 5336–5352, https://doi.org/10.1175/2008JCLI2320.1, 2008.
Shlyakhov, V. I. and Kuzenkov, A. F.: The results of international comparison of the reference radiosondes, Meteor. Gidrol., 4 94-98, 1973.
Slivinski, L. C., Compo, G. P., Whitaker, J. S., Sardeshmukh, P. D., Giese, B. S., McColl, C., Allan, R., Yin, X., Vose, R., Titchner, H., Kennedy, J., Spencer, L. J., Ashcroft, L., Brönnimann, S., Brunet, M., Camuffo, D., Cornes, R., Cram, T. A., Crouthamel, R., Domínguez-Castro, F., Freeman, J. E., Gergis, J., Hawkins, E., Jones, P. D., Jourdain, S., Kaplan, A., Kubota, H., Blancq, Le, F., Lee, T. C., Lorrey, A., Luterbacher, J., Maugeri, M., Mock, C. J., Moore, G. W. K., Przybylak, R., Pudmenzky, C., Reason, C., Slonosky, V. C., Smith, C. A., Tinz, B., Trewin, B., Valente, M. A., Wang, X. L., Wilkinson, C., Wood, K., and Wyszyński, P.: Towards a more reliable historical reanalysis: Improvements for version 3 of the Twentieth Century Reanalysis system, Q. J. Roy. Meteor. Soc., 145, 2876–2908, https://doi.org/10.1002/qj.3598, 2019.
Stickler, A., Brönnimann, S., Valente, M. A., Bethke, J., Sterin, A., Jourdain, S., Roucaute, E., Vasquez, M. V., Reyes, D. A., Allan, R., and Dee, D.: ERA-CLIM: Historical Surface and Upper-Air Data for Future Reanalyses, B. Am. Meteorol. Soc., 95, 1419–1430, 2014.
Teweles, S. and Finger, F. G.: Reduction of diurnal variation in the reported temperatures and heights of stratospheric constant-pressure surfaces, J. Meteorol., 17, 177–194, 1960.
Väisälä, V.: Der Strahlungsfehler der finnischen Radiosonde, Suomalainen Tiedeakatemia, Helsinki, 47, 63 pp., 1941.
Väisälä, V.: Solar radiation intensity at the ascending radiosonde, Geophysica, 3, 37–55, 1949.
Väisälä, V.: Radiation error of different radiosondes at Payerene, 1956, Geophysica, 6, 1–7, 1957.
WMO: Common code table and alphanumeric codes, available at: https://www.wmo.int/pages/prog/www/WMOCodes/WMO306_vI2/LatestVERSION/WMO306_vI2_CommonTable_en.pdf (last access: 31 May 2021), WMO, Geneva, 2019.
Yagi, S., Mita, A., and Inoue, N.: WMO International Radiosonde Comparison, Phase IV, 1993, Tsukuba, Japan, 15. February–12 March 1993, WMO Instruments and observing methods, Report No. 29, WMO, Geneva, 1996.
Zaichikov, P. F.: The preliminary results of processing the observational materials of the 2nd International Radiosonde Comparison, CAO Proceedings, 22, 51–59, 1957.
Zaichikov, P. F.: Procedure to determine radiation corrections to temperature readings of radiosondes A-22, RKZ-1 and RZ-049 from differential data “daytime minus night”, CAO Proceedings, 43, 10–21, 1962.
Zaichikov, P. F.: Some additions for “the triple check” method. On the precision of independent determining the altitude of the system that is raised up, CAO Proceedings, 60, 43–53, 1964.
Zaitseva, N. A.: Historical developments in radiosonde systems in the former Soviet Union, B. Am. Meteorol. Soc., 74, 1893–1900, 1993.
Zaitseva, N. A., Ahmetyanov, R. K., and Karhunen, P.: On the results of the intercomparison between the Soviet and Finnish radiosondes, Meteor. Gidrol., 1, 105–110, 1989.
Zhou, C., Wang, J., Dai, A., and Thorne, P.: A New Approach to Homogenize Global Twice-daily Radiosonde Temperature Data from 1958 to 2018, J. Climate, 34, 1163–1183, https://doi.org/10.1175/JCLI-D-20-0352, 2021.