the Creative Commons Attribution 4.0 License.
the Creative Commons Attribution 4.0 License.
 | 04 Dec 2020
The impact of landscape evolution on soil physics: evolution of soil physical and hydraulic properties along two chronosequences of proglacial moraines
Anne Hartmann
Markus Weiler
Theresa Blume
Soil physical properties highly influence soil hydraulic properties, which define the soil hydraulic behavior. Thus, changes within these properties affect water flow paths and the soil water and matter balance. Most often these soil physical properties are assumed to be constant in time, and little is known about their natural evolution. Therefore, we studied the evolution of physical and hydraulic soil properties along two soil chronosequences in proglacial forefields in the Central Alps, Switzerland: one soil chronosequence developed on silicate and the other on calcareous parent material. Each soil chronosequence consisted of four moraines with the ages of 30, 160, 3000, and 10 000 years at the silicate forefield and 110, 160, 4900, and 13 500 years at the calcareous forefield. We investigated bulk density, porosity, loss on ignition, and hydraulic properties in the form of retention curves and hydraulic conductivity curves as well as the content of clay, silt, sand, and gravel. Samples were taken at three depths (10, 30, 50 cm) at six sampling sites at each moraine. Soil physical and hydraulic properties changed considerably over the chronosequence. Particle size distribution showed a pronounced reduction in sand content and an increase in silt and clay content over time at both sites. Bulk density decreased, and porosity increased during the first 10 millennia of soil development. The trend was equally present at both parent materials, but the reduction in sand and increase in silt content were more pronounced at the calcareous site. The organic matter content increased, which was especially pronounced in the topsoil at the silicate site. With the change in physical soil properties and organic matter content, the hydraulic soil properties changed from fast-draining coarse-textured soils to slow-draining soils with high water-holding capacity, which was also more pronounced in the topsoil at the silicate site. The data set presented in this paper is available at the online repository of the German Research Center for Geosciences (GFZ; Hartmann et al., 2020b). The data set can be accessed via the DOI https://doi.org/10.5880/GFZ.4.4.2020.004.
- Article
(5735 KB) - Full-text XML
- BibTeX
- EndNote


Today's landscapes are affected by changes, e.g., in the form of climate conditions or land use. Insights into the complex and dynamic interplay between soil development and hydrological, geomorphological, and ecological processes in the context of landscape evolution provide important process understanding, which is important for predicting how landscapes will adapt to changes. Soil has a crucial role in landscape evolution since it influences and is also in turn influenced by vegetation, water, sediment, and solute transport. The soil properties are state variables that play an important role within this feedback cycle (van der Meij et al., 2018). The soil physical properties such as bulk density, porosity, and grain size distribution highly influence water flow (flow rates and flow direction), water storage, capacity, and drainage (Hu et al., 2008; Lohse and Dietrich, 2005; Reynolds et al., 2002) as well as root water availability (Hupet et al., 2002). In the course of soil development, these properties change and are influenced by (but in turn also influence) flora, fauna, and water availability. Over time, this interaction also leads to a change in soil water and material transport and their balance (Lohse and Dietrich, 2005). Knowledge of the development of physical and hydraulic soil properties as well as their codependency can provide important insights into the changes in hydraulic water balance and water availability during landscape evolution.
Several studies have focused on the alteration of soil biological, chemical, and physical properties during soil development by studying soil chronosequences (Crocker and Major, 1955; Egli et al., 2010; Dümig et al., 2011; Vilmundardóttir et al., 2014; D'Amico et al., 2014; Hudek et al., 2017; Musso et al., 2019). Especially glacial forefields were proven suitable for this “space-for-time approach” as soil develops rapidly on glacial till (e.g., Crocker and Major, 1955; Douglass and Bockheim, 2006; He and Tang, 2008; Dümig et al., 2011; Vilmundardóttir et al., 2014; D'Amico et al., 2014). The most commonly studied soil properties are pH value, organic carbon, total nitrogen, calcium carbonate, bulk density, and particle size distribution. It was found that in the very first 100 years of soil development, the pH value decreases fast, and total nitrogen and soil organic carbon increase with the onset of vegetation (Crocker and Major, 1955; Vilmundardóttir et al., 2014; Egli et al., 2010). The young and poorly sorted soils with no depth-dependent property distribution (Crocker and Major, 1955) eventually develop into a layered soil system with vertical gradients in soil properties such as organic matter, color, bulk density, or particle size distribution. In these geological rather short observation periods (<200 years) soils show a high variability in particle size distribution within single age classes without a specific trend in grain size distribution (Dümig et al., 2011). An extension of the observation period to several thousand years of soil development revealed an accumulation of clay-sized particles with increasing age (Douglass and Bockheim, 2006; Dümig et al., 2011). Another common finding is also a decrease in bulk density (Crocker and Major, 1955; Crocker and Dickson, 1957; He and Tang, 2008; Vilmundardóttir et al., 2014). The decrease in bulk density is often linked to ongoing vegetation succession, which causes an accumulation of organic matter and the development of a root system. Soil organic matter is also known to have an impact on soil hydrology since it influences soil structure as it contributes to aggregate formation and increases water-holding capacity. An increase in organic matter content was also found in a number of soil chronosequence studies (Burga et al., 2010; Douglass and Bockheim, 2006; Deuchars et al., 1999; Alexander and Burt, 1996). Especially in former glacial areas of cool and humid climate, the formation of soils with a highly organic top layer is favored (Carey et al., 2007). The hydraulic behavior of these organic soils is less intensively studied than the mineral soils. Organic soils for example have a high total porosity (up to 90 %) and a low bulk density (Carey et al., 2007). The listed soil chronosequence studies are not meant to be comprehensive but were selected as they are most comparable to the study presented here. A full literature review of chronosequence studies is beyond the scope of our data presentation. These studies showed that soil texture and soil structure change over time due not only to physical and chemical processes but also to the influence of vegetation (Morales et al., 2010; Hudek et al., 2017). A change in soil structure and texture leads to a change in the soil's behavior, which has a direct impact on the surface and subsurface water transport. However, the focus of previous studies was primarily on the estimation of development rates of mainly chemical soil properties and the interaction between soil development and vegetation succession. Only a few studies have looked at how changing physical soil properties and organic matter content affect soil water transport (Lohse and Dietrich, 2005; Yoshida and Troch, 2016; Hartmann et al., 2020a) or have focused directly on the development of soil hydraulic properties in the form of retention curves and hydraulic conductivity curves (Crocker and Dickson, 1957; Deuchars et al., 1999; Lohse and Dietrich, 2005). Both curves describe the soil hydraulic behavior and are highly soil-specific since they depend strongly on soil physical properties. The retention curve is the relationship between volumetric soil water content and soil matric potential. The unsaturated hydraulic conductivity curve describes the relationship between unsaturated soil hydraulic conductivity and soil matric potential (or soil water content). While the hydraulic conductivity function gives information on how much water per unit of time can be transported through the partially filled pore system of the soil matrix at a certain matric potential, the retention curve gives information on how much water is available at a certain matric potential and how much the matric potential will change when a certain amount of water is removed from the soil. Based on these two relationships, the specific soil hydraulic behavior with characteristics such as storage capacity, drainability, and the amount of plant-available water can be derived. Additionally, both non-linear relationships are important for the parameterization of physically based soil hydraulic models (Schwen et al., 2014; Bourgeois et al., 2016).
Previous investigations of the soil-hydraulic-property development are only based on a few data points and time periods that are either very long (comparing a 200 and a 4.1 million year old soil) or short (studying soils ranging from less than 50 to 200 years in age) and a small vertical and horizontal spatial resolution. Crocker and Dickson (1957), for example, determined the field capacity of soil samples on the basis of water content measurements after oven-drying at 110 ∘C and after centrifuging in a standard moisture equivalent centrifuge. Here, an increase in field capacity over the first 200 years of soil development was shown for two glacier forefields in southeastern Alaska, where the soils developed on glacial till mainly composed of quartz diorite. Lohse and Dietrich (2005) compared in situ field measurements of water content and matric potential as well as experimentally derived in situ unsaturated hydraulic conductivities in the field at two depths of a 300 and a 4.1 million year old site on the Hawaiian islands. From 300 to 4.1 million years age, the hydraulic characteristics changed significantly with a shift from rather homogeneous to a layered system with strong differences in the hydraulic characteristics between the soil horizons, which developed from volcanic deposits (Lohse and Dietrich, 2005).
The development of soil hydraulic properties during the first few millennia of soil development has so far not been investigated. We therefore focused on the co-evolution of soil hydraulic properties, soil physical properties, and organic matter content during the first 10 millennia of landscape evolution by using soil chronosequences at two glacier forefields. We chose forefields developed from silicate (Stone glacier forefield) and calcareous rocks (Griessfirn forefield). The study is expected to provide information on how strong the evolution of soil physical properties affects the development of soil hydraulic properties and to give insights about the changes to be expected in non-stationary landscape systems. The comparison of two sites is expected to highlight how the parent material influences the development. A detailed investigation of hydrologic flow path evolution on these same moraines can be found in Hartmann et al. (2020a).
The data set can be useful to improve predictions on hydrological processes during landscape development using soil and landscape evolution models (SLEMs). The incorporation of measured soil hydraulic properties from chronosequence studies in the calibration of SLEMs was proposed by van der Meij et al. (2018), for example, to account for the long-term evolution of soil hydraulic properties. This is important to improve the feedback modeling between soil structure and soil hydrologic processes as well as for an improved process reflection of the interaction of pedogenic, geomorphic, and hydrologic processes. Our data set is also suitable for the derivation or verification of pedotransfer functions for alpine soils. Pedotransfer functions are a less time-consuming and cost-effective method for determining the soil hydraulic properties (Vereecken et al., 2010) and are also used in SLEMs (van der Meij et al., 2018). They are designed to translate easy-to-measure soil properties such as organic-carbon content, bulk density, grain size distribution, or porosity (Wang et al., 2009; Schaap et al., 2001) into soil hydraulic properties. The data set makes it possible to derive and test pedotransfer functions for both study sites in order to find out whether site properties such as parent material have an additional influence on the validity of the pedotransfer function. Further soil physical and hydraulic properties from chronosequence studies can be helpful to derive information of water and nutrient availability, which can be important for other chronosequence studies related to abundance, diversity, and function of microbial life in initial soils as well as for studies of vegetation succession.
2.1 Study sites
We investigated how soil structure and soil hydraulic behavior change through time by using a soil chronosequence at two glacier forefields. The two study sites differ in their parent material. The selected proglacial moraines at the Stone Glacier forefield developed from silicate parent material (S-PM) and the moraines at the Griessfirn forefield from calcareous rocks (C-PM). The parent material is one of the five main factors of soil formation (next to climate, biota, topography, and time). The comparison of the two parent materials is expected to provide information on how under assumed equal climate conditions this site characteristic influences the development of structure and soil hydraulic behavior. It is already known that soils developed on calcareous material are richer in organic carbon and clay particles (Jenny, 1941), but little is known how strong these differences are throughout the course of soil development and how much they influence the soil hydraulic behavior.
2.1.1 Silicate parent material
The study area of the proglacial forefield developed on silicate parent material was formed by the retreat of the Stone Glacier and is located in the Central Swiss Alps, south of the Sustenpass in the Urner Alps (approx. 47∘43′ N, 8∘25′ E). Its elevation ranges from 1900–2100 m a.s.l. The area lies in the polymetamorphic “Erstfelder” gneiss zone, which is part of the Aar massif (Blass et al., 2003). The geology is defined by metamorphosed pre-Mesozoic metagranitoids, gneisses, and amphibolites (Heikkinen and Fogelberg, 1980; Schimmelpfennig et al., 2014); thus the material is mainly acidic and rich in silicate.
The closest official weather station is located 18 km away at Grimsel Hospiz (46∘34′ N, 8∘19′ E) at an elevation of 1980 m a.s.l. The recorded annual mean temperature is 1.9 ∘C, and the annual precipitation is 1856 mm (1981–2010) (Schweizerische Eidgenossenschaft, 2016). The moraines of the Stone Glacier were exposed due to its retreat to the south. Four moraines were selected for this study (see Fig. 1). Schimmelpfennig et al. (2014) conducted a detailed dating study of the Stone Glacier moraines based on high-sensitivity beryllium-10 moraine dating and found that the ages of the four moraines range between 160 and 10 000 years. The age of the youngest moraine was dated as 30 years based on maps and aerial photos. Table 1 provides an overview of the main characteristics of the four moraines including elevation, slope, dominant vegetation, vegetation cover, and soil type compiled from Maier et al. (2020) and Musso et al. (2020). The soil at the two youngest moraines was classified as a Hyperskeletic Leptosol. At the 3000-year-old moraine a Skeletic Cambisol and at the oldest moraine an Entic Podzol was found. Illustrations of the soil layers at each moraine can be found in Maier et al. (2020).
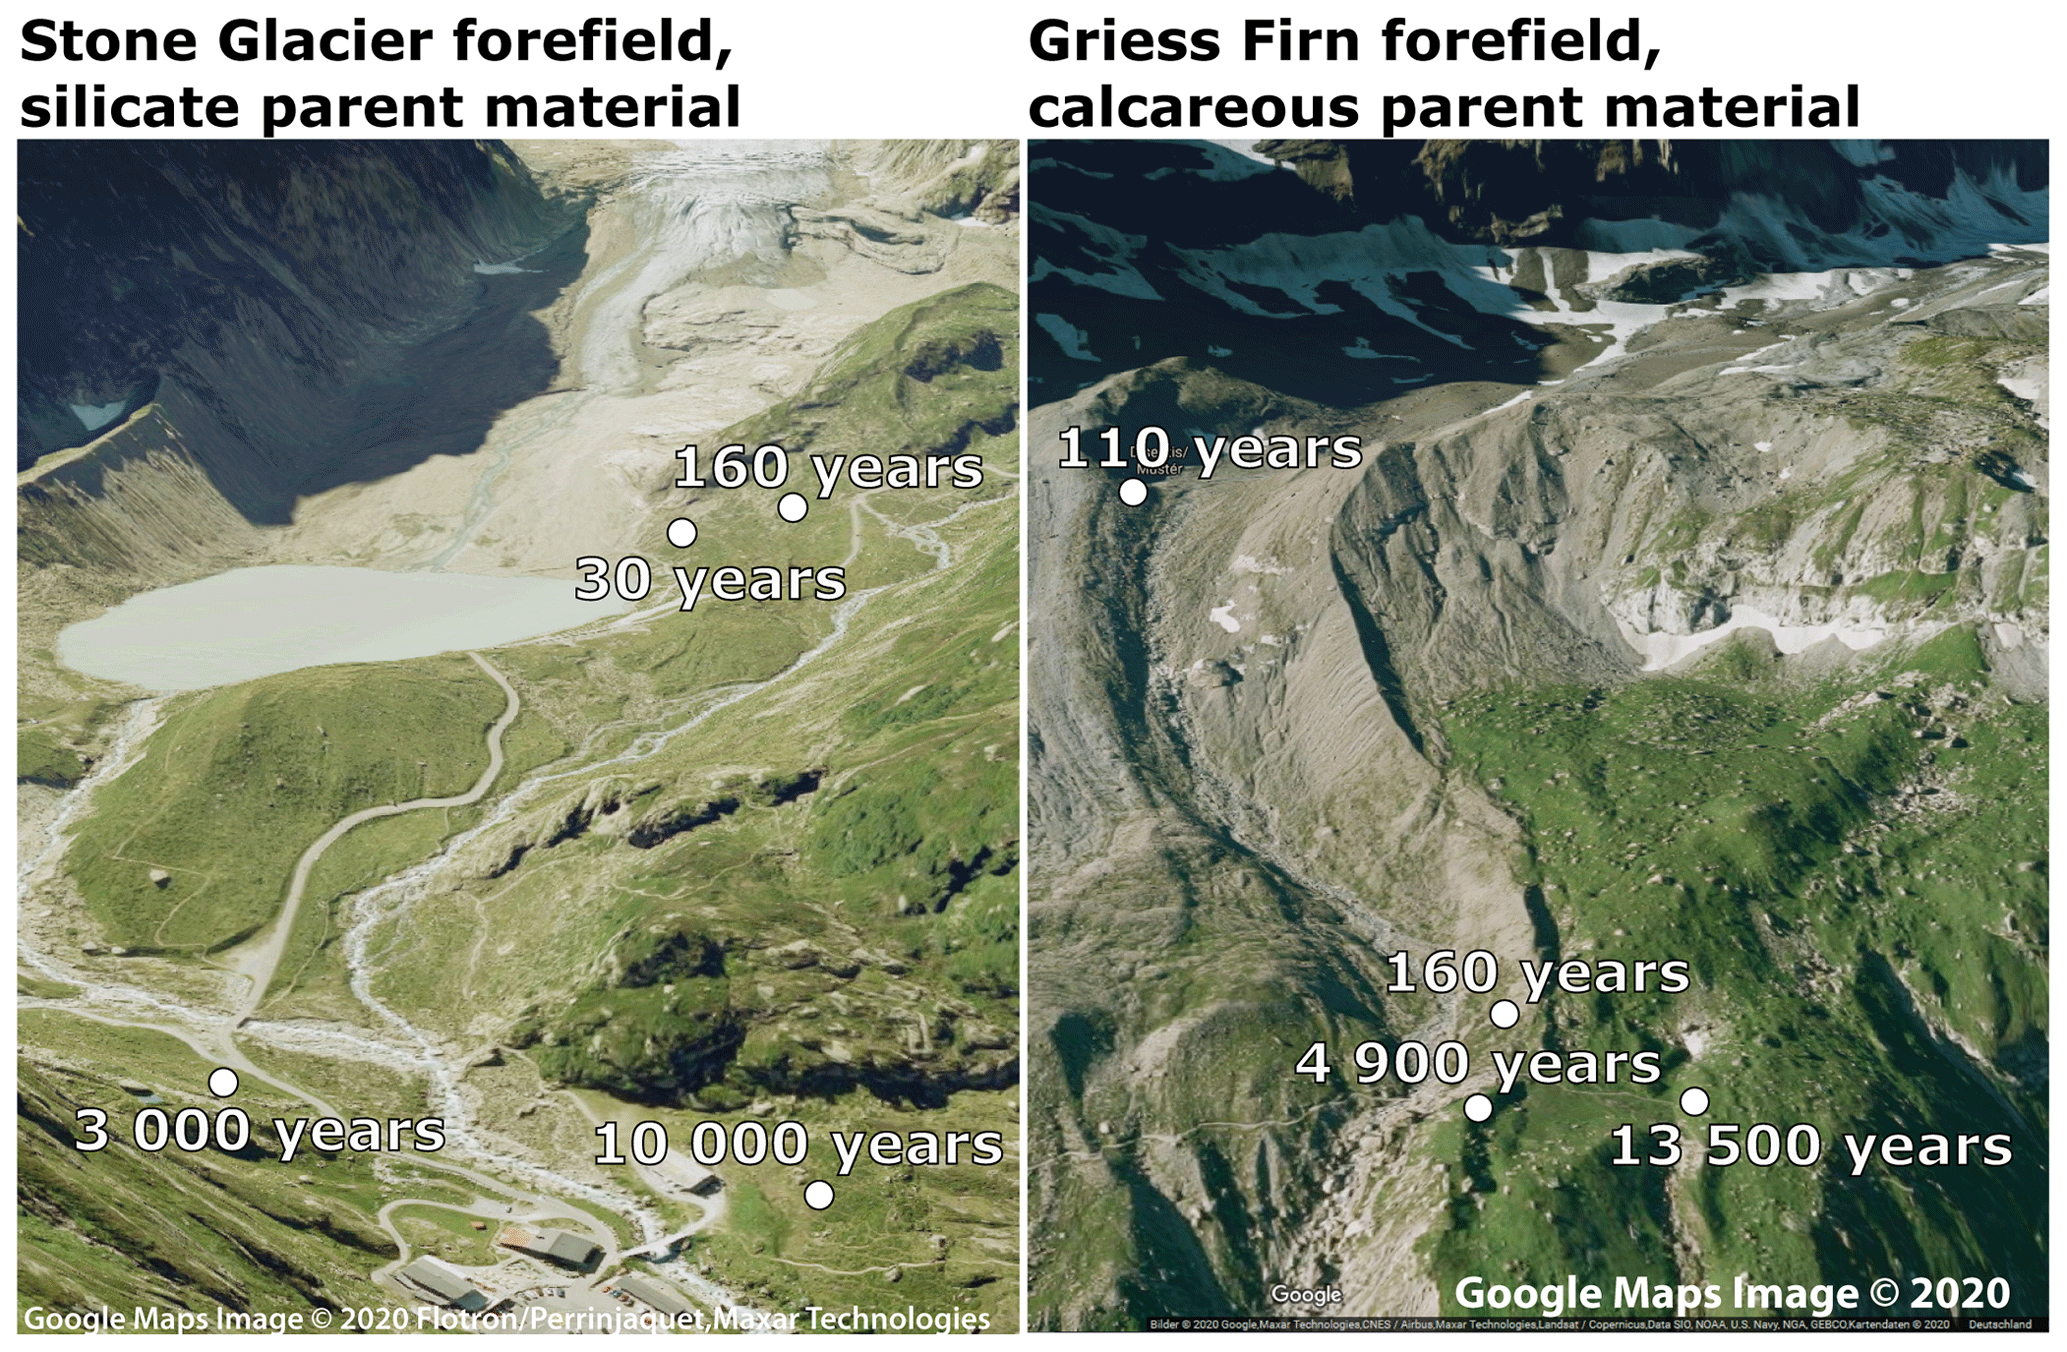
Table 1Overview of the main characteristics of the four moraines at the silicate and calcareous parent material. This information was compiled from the publications Maier et al. (2020), Musso et al. (2019), and Musso et al. (2020).
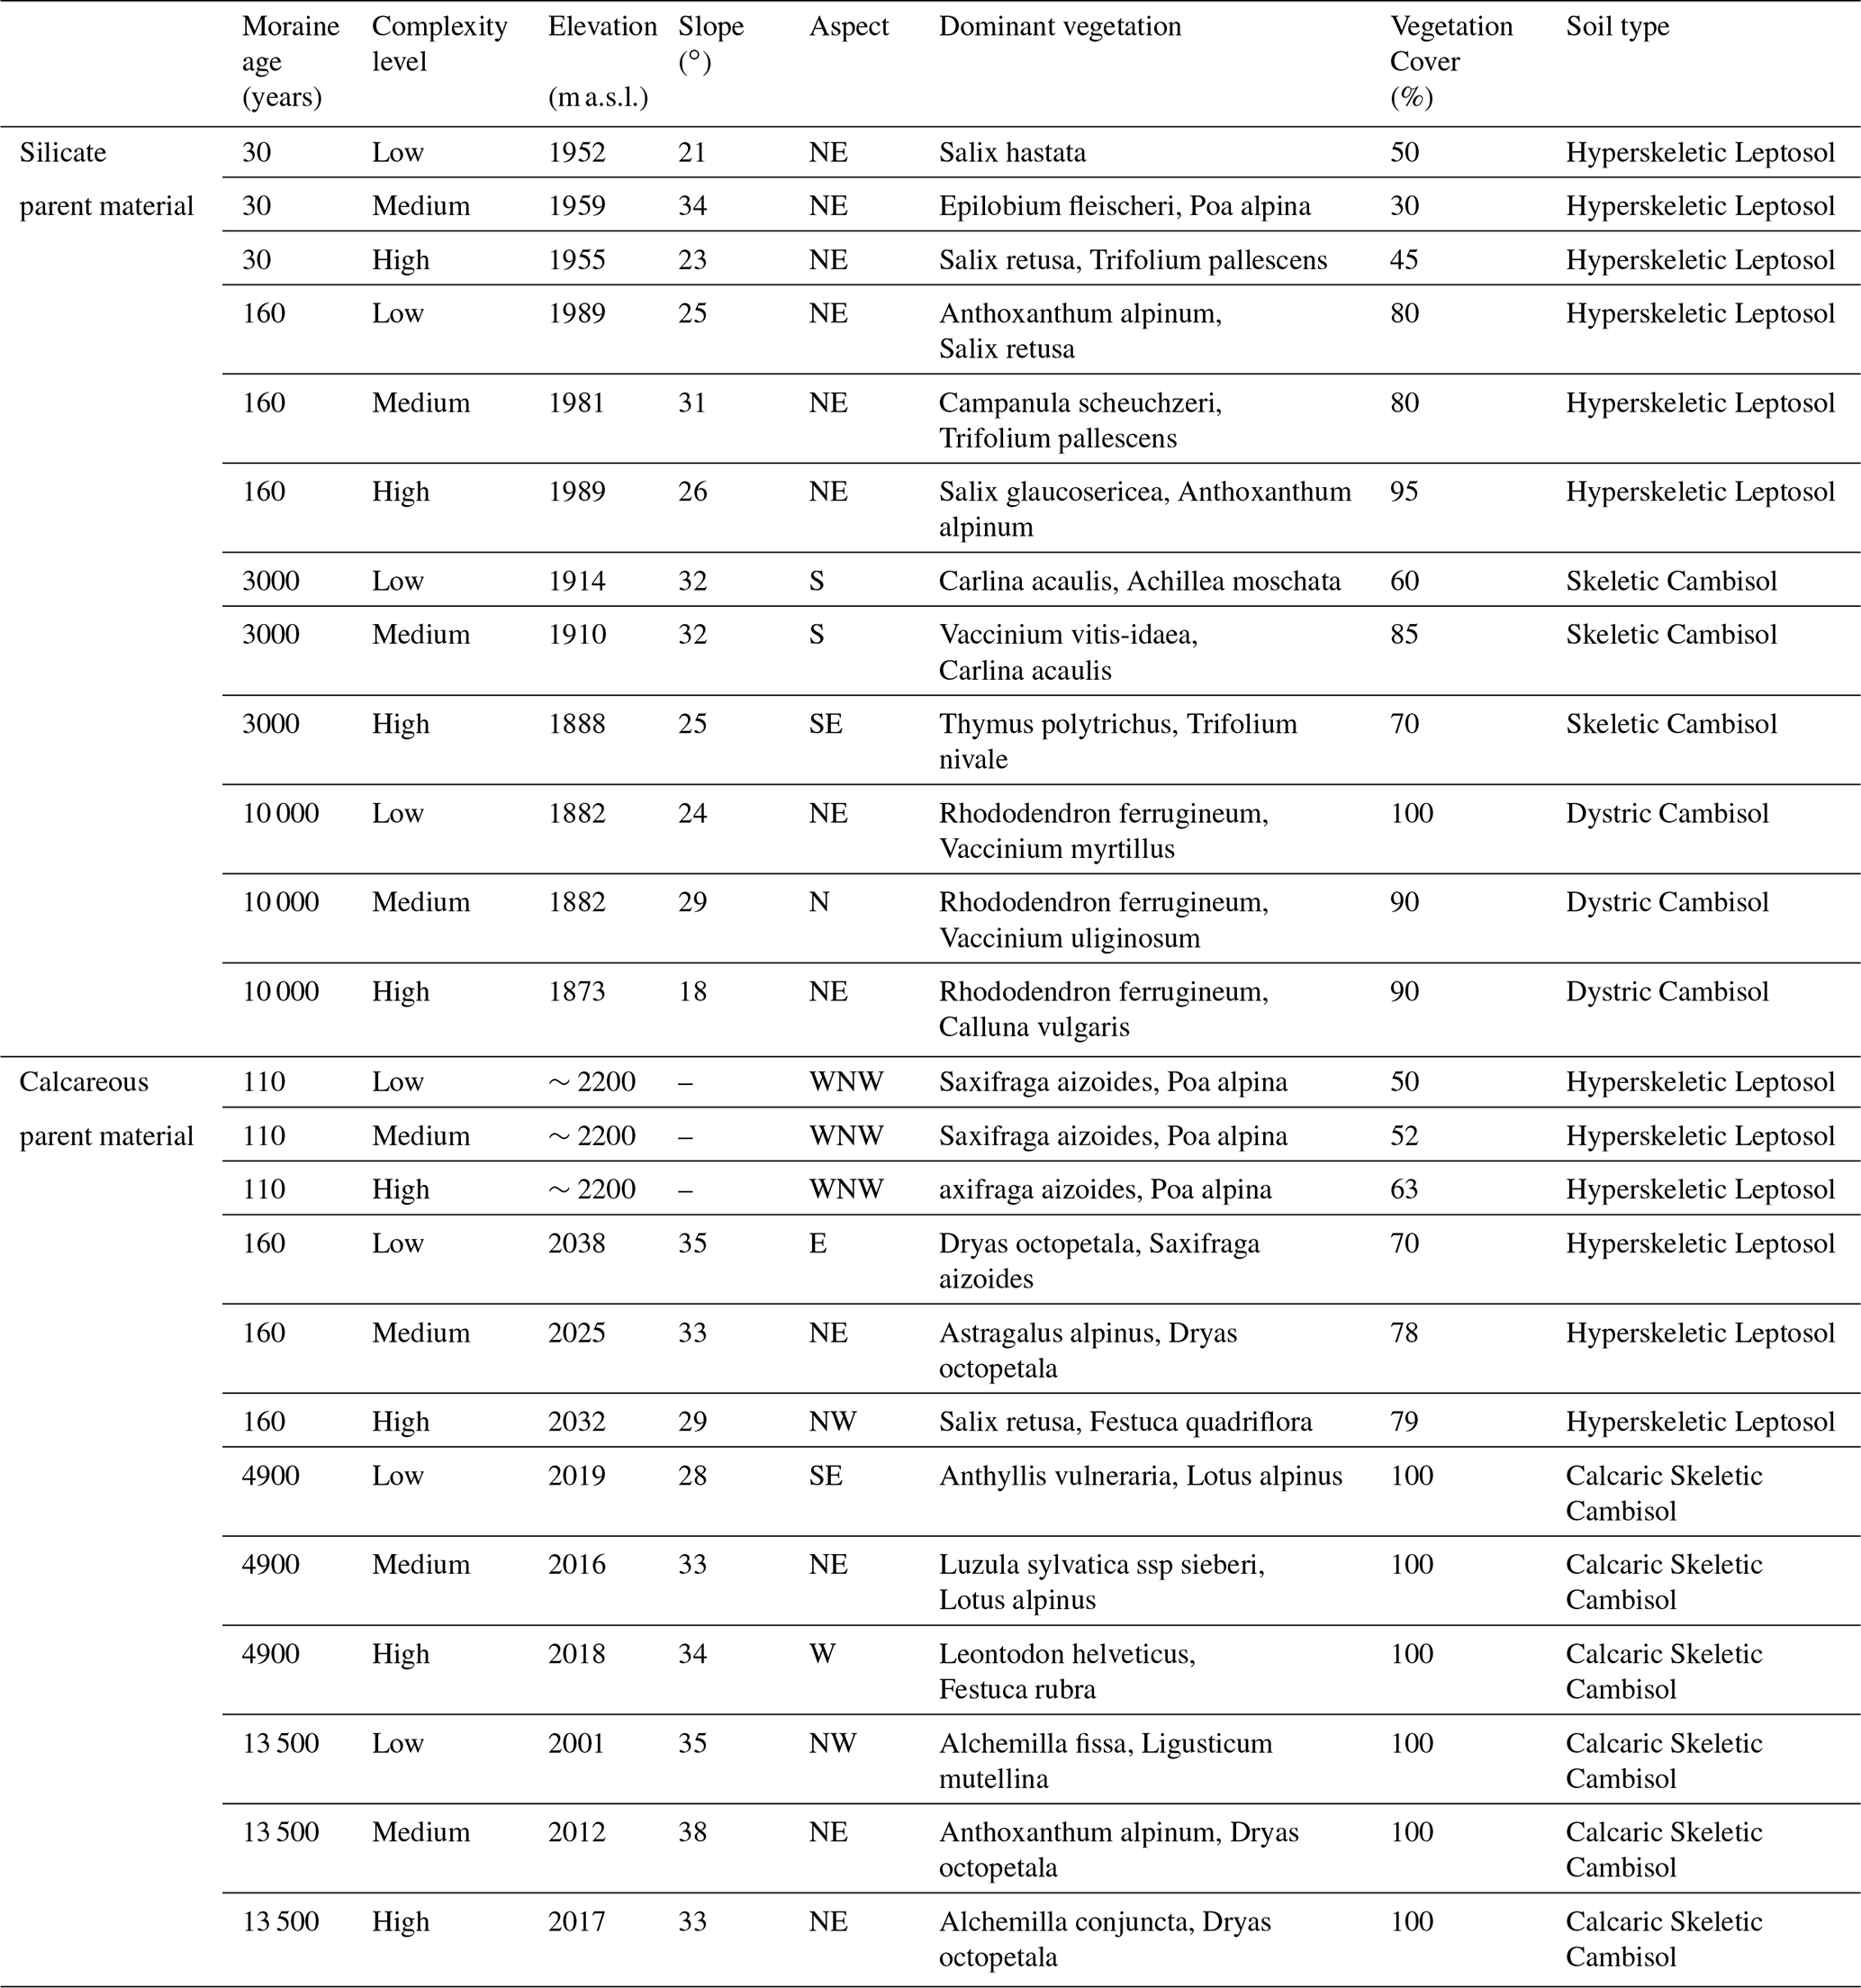
The vegetation cover differs significantly among the four age classes and was mapped in summer 2017 (Maier et al., 2020). The moraines are occasionally grazed by cows and sheep during the summer months, which we prevented during our study by the installation of fences. Whereas the vegetation cover at the oldest moraine is dominated by a variety of prostrate shrubs, small trees, and several grasses, the 3000-year-old moraine has mainly a grassland cover with fern, mosses, sedges, and forbs. The 160-year-old moraine is dominated by grasses, lichen, forbs, and shrubs. The vegetation cover of the youngest moraine is sparse, with mainly grass, moss, forbs, and a few shrubs.
2.1.2 Calcareous parent material
The study area of the proglacial forefield developed on calcareous parent material was formed by the retreat of the Griessfirn and is located between 2030–2200 m a.s.l. in the Central Swiss Alps (approx. 46∘85′ N, 8∘82′ E). The geology is defined by limestone (Frey, 1965); thus the material is mainly calcareous. A more detailed description of the geological composition is provided by Musso et al. (2019). The closest official weather station located at a similar elevation (2106 m a.s.l.) is 48 km away at Mount Pilatus (46∘98′ N, 8∘25′ E). The recorded annual mean temperature is 1.8 ∘C, and the annual precipitation is 1752 mm (1981–2010) (Swiss Confederation, 2020).
The four selected moraines were dated by Musso et al. (2019) based on historical maps and the radiocarbon method. The youngest moraine is 110 years old and is located at 2200 m a.s.l. The three other moraines are 160, 4900, and 13 500 years old and located at an elevation of roughly 2030 m a.s.l. (see Fig. 1). An overview of the main characteristics of the four moraines including elevation, slope, dominant vegetation, vegetation cover, and soil type compiled from Maier et al. (2020), Musso et al. (2019), and Musso et al. (2020) is provided in Table 1. The soil at the two youngest moraines was classified as a Hyperskeletic Leptosol and at the two oldest moraines as a Calcaric Skeletic Cambisol (Musso et al., 2019). The two oldest moraines are densely covered with grass, dwarf shrubs, and sedge. The vegetation coverage of the two younger moraines is sparse, with patches of grass and forbs at the 160-year-old moraine and patches of mostly mosses and lichens at the 110-year-old moraine.
2.2 Soil sampling and laboratory analysis
2.2.1 Soil sampling
Soils samples were taken during August and September of 2018 at the silicate site and during August and September 2019 at the calcareous site. Three sampling sites were chosen per moraine to capture three complexity levels (low, medium, high) of the vegetation coverage (Musso et al., 2019). Table 2 provides a detailed overview of the sampling scheme at each sampling site for both parent materials. At each sampling site, replicate samples were taken 3–4 m apart to account for spatial variability. The two sampling locations per sampling site are denoted as Location 1 and Location 2 in Table 2. For grain size analysis, at each sampling site two disturbed soil samples (one per sampling location) were taken at 10, 30, and 50 cm depth.
Table 2Overview of the sampling scheme at each sampling site for both parent materials. The two sampling locations per sampling site are denoted as Location 1 and Location 2. Locations 1 and 2 were 3–4 m apart. The volume of the sample rings is given in the respective headers, and the corresponding numbers of samples are provided for each soil depth.
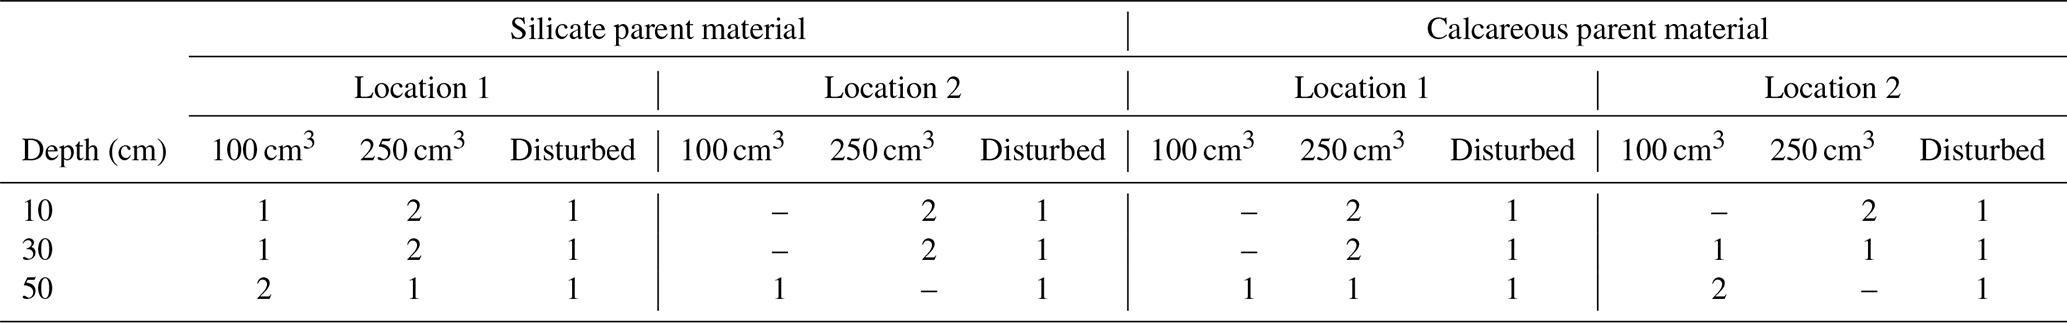
For the determination of porosity, bulk density, and loss on ignition as well as the derivation of the soil hydraulic properties, undisturbed soil samples were taken with steel sampling rings, which preserve the natural soil structure. At each sampling site and sampling location at the S-PM, two 250 cm3 undisturbed soil samples were taken at a depth of 10 and 30 cm, and one 100 cm3 sample was taken at a depth of 50 cm. Additionally at sampling Location 1, one undisturbed 100 cm3 soil sample was taken at a depth of 10 and 30 cm, and one 250 cm3 and two 100 cm3 soil samples were taken at a depth of 50 cm. This sampling scheme provides 15 undisturbed soil samples at the depths of 10 and 30 cm and 12 samples at a depth of 50 cm per moraine. All 168 samples were used for the determination of porosity and bulk density. Due to the high stone content at the S-PM forefield, a few sampling rings were damaged and could not be used the following year. Therefore, the sampling scheme at the C-PM forefield had to be adapted to a reduced number of samples (see Table 2). At the C-PM forefield and Location 1 at each sampling site, two 250 cm3 undisturbed soil samples were taken at a depth of 10 and 30 cm, and one 250 cm3 and one 100 cm3 sample were taken at 50 cm. At Location 2, two 250 cm3 samples were taken at 10 cm and one 250 cm3 and one 100 cm3 sample at 30 cm as well as two 100 cm3 samples at 50 cm. This sampling scheme provides 12 undisturbed soil samples at the depths of 10, 30, and 50 cm per moraine. All 144 samples were used for the determination of porosity and bulk density.
2.2.2 Laboratory analysis
The laboratory analysis was carried out between October 2018 and June 2019 for the S-PM samples and between October 2019 and January 2020 for the C-PM samples. For the grain size analysis, we used a combination of dry sieving (particles >0.063 mm) and sedimentation analysis (particles <0.063 mm) with the hydrometer method. Particles between 2 and 0.063 mm were classified as sand, between 0.063 and 0.002 mm as silt, and <0.002 mm as clay. Particles larger than 0.063 mm were separated from the fine particles by wet sieving. They were then dried at 550 ∘C for combustion of organic matter prior to the dry sieving. Due to lab limitations, organic matter removal from the fine particles was only possible by floating off the lighter fractions prior to the sedimentation analysis. Na4P2O7 was added 24 h before sedimentation analysis as a dispersant to the sample solution to prevent coagulation of the particles. Particle size fractions were calculated as weight percentages of the fine earth (<2 mm), thus excluding gravel and stones to prevent single larger stones from shifting or dominating the distribution. The gravel and stone fraction (particles >2 mm) was calculated separately as a weight percentage of the entire soil sample. The porosity was determined by using the water saturation method and weighing the samples at saturation and after drying at 105 ∘C. The loss on ignition was determined by drying sub-samples (4–6 g) of 131 samples of the S-PM forefield and 144 samples of the C-PM forefield for at least 24 h at 105 ∘C and then at 550 ∘C. The loss on ignition was then calculated by relating the weight loss after drying at 550 ∘C to the sample weight after drying at 105 ∘C.
A total of 15 undisturbed 250 cm3 samples per moraine (six samples at both 10 and 30 cm depth and three at 50 cm depth) were used for the analysis of soil hydraulic properties in the form of retention curve and hydraulic conductivity curve. The soil hydraulic properties of the 120 soil samples were measured based on the experimental evaporation method (Schindler, 1980; Schindler and Müller, 2006). This laboratory-based method allows the simultaneous determination of retention curve and hydraulic conductivity curve. The water-saturated soil samples are dried evenly and slowly by evaporation. During this process, the weight of the soil sample and the matric potential at two heights in the soil core are measured. To conduct the experiment we used the ku-pF MP10 (Umwelt-Geräte-Technik GmbH, Germany). The device allows the experiment to be conducted simultaneously on 10 soil samples at a time, with each cycle taking 2 to 3 weeks. The device holds 10 soil samples on a rotating appliance and automatically measures the weight of each sample. The interval between individual sample measurements was set to 1 min so that each sample was measured every 10 min. For the measurement of the matric potential, two tensiometers were installed at two different heights in the soil core. At each weight measurement, the device also records the tensiometer readings. The data analysis was carried out according to Peters and Durner (2008). Based on the weights the soil water content can be derived and is set in relation with the average measured matric potential to provide the retention curve. Based on the measured reduction in water content, a flow rate can be determined, and the hydraulic gradient can be derived based on the measured matric potentials. The combination of flow rate and gradient allows the determination of the unsaturated hydraulic conductivity for all measured water contents.
3.1 Bulk density and porosity
The obtained data sets of bulk density and porosity show a clear trend over the millennia in both properties at both soil chronosequences (see Fig. 2). At the C-PM forefield, the bulk density decreases along the chronosequence at all soil depths (see Fig. 2a). The decrease is most pronounced in the top layer and is weaker towards deeper soil depths. With increasing age an ongoing differentiation in bulk density along the soil profile is observed. At the youngest moraine, of 110 years, the bulk density ranges mainly between median values of 1.6 and 1.8 g/cm3, with slightly higher values at 30 cm. At the 160-year-old moraine, the bulk density at all depths varies in median values between 1.5 and 1.6 g/cm3. The 4900-year-old moraine has significantly lower bulk densities, with the lowest values in the top layer (median value in the top layer: 0.46 g/cm3). The bulk density increases with depth and varies around 0.78 g/cm3 at 30 cm and around 1.2 g/cm3 at 50 cm. The oldest moraine of 13 500 years does not show major differences in bulk density from the 4900-year-old moraine. The ranges of the values differ, but the median values are quite similar.
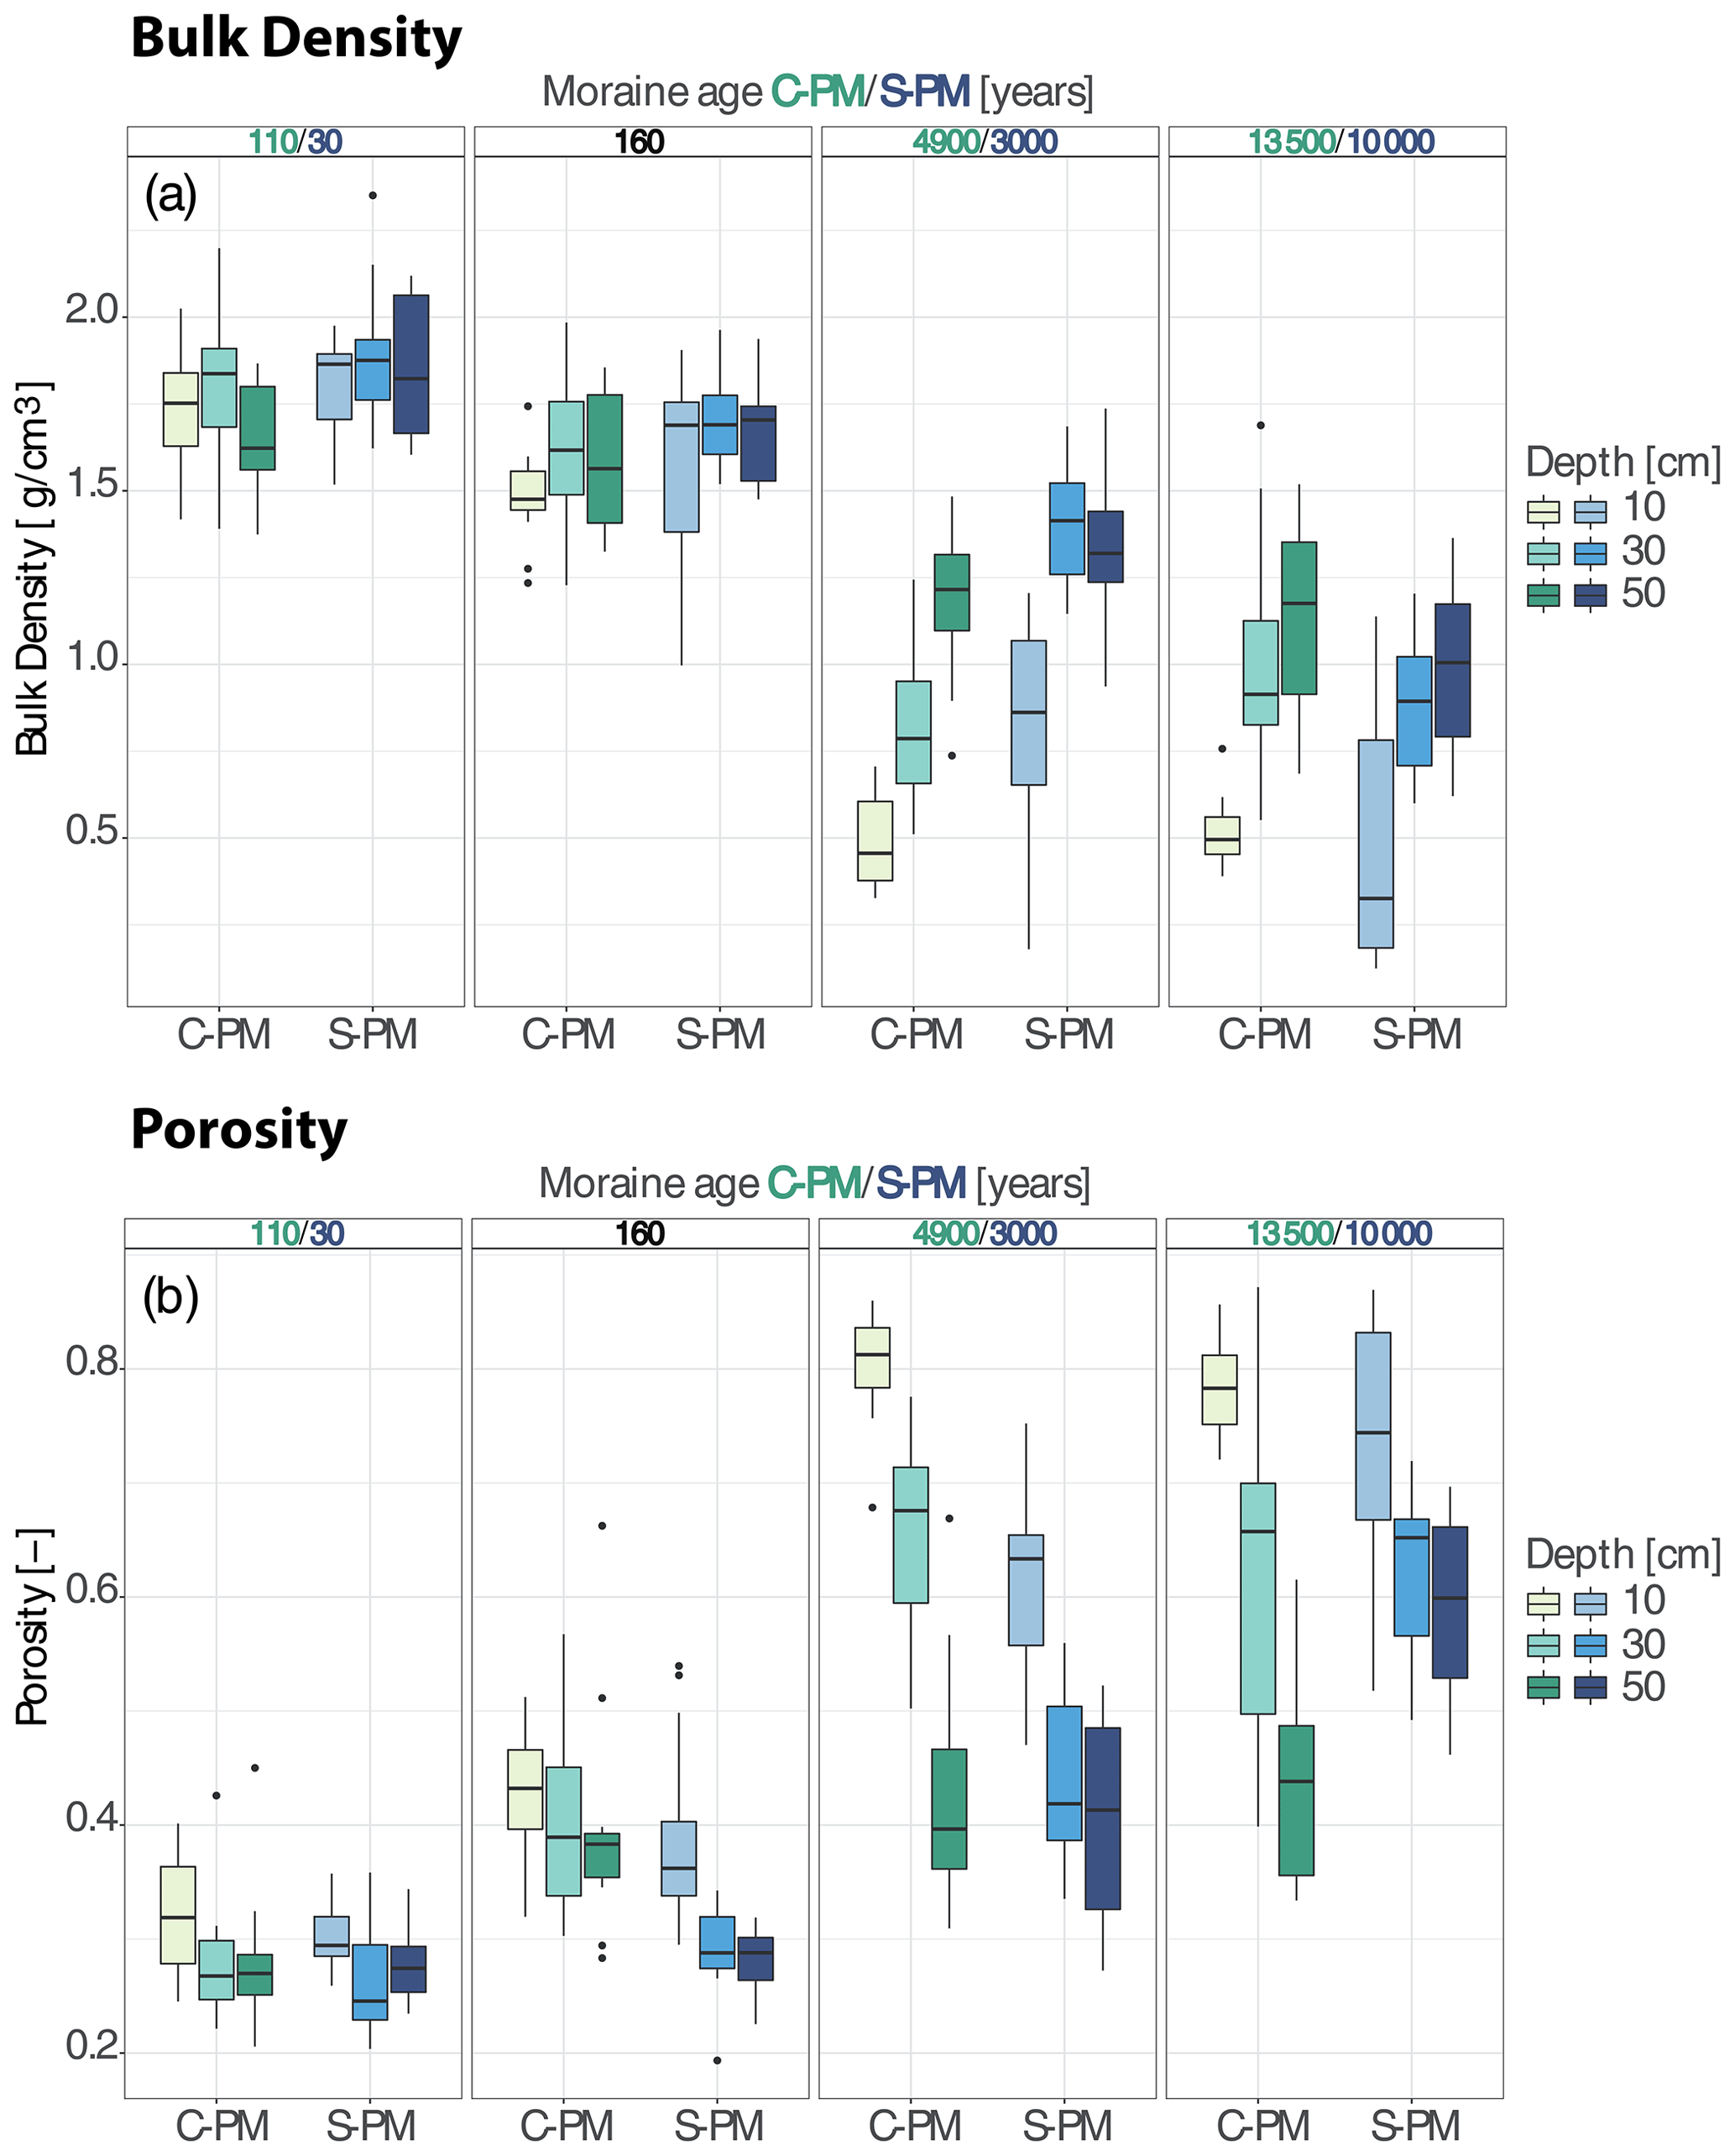
Figure 2Development of bulk density and porosity at 10, 30, and 50 cm depth over 10 millennia on silicate (S-PM, shown in blue color scale) and calcareous (C-PM, shown in green color scale) parent material.
At the youngest moraine at the S-PM forefield, the interquartile range (IQR) at all three depths overlaps; the bulk density values vary mainly between 1.7 and 1.9 g/cm3. The bulk density at the 160-year-old moraine is lower and ranges mainly between 1.4 (lower end of IQR at 10 cm) and ∼ 1.75 g/cm3 (upper end of IQR at all three depths). At this age class, the uppermost layer already shows the tendency to have a lower bulk density than the deeper soil. This is even more pronounced at the 3000-year-old moraine. The bulk density at 30 and 50 cm depth at this moraine ranges between median values of 1.3 (at 50 cm) and 1.4 g/cm3 (at 30 cm), whereas the bulk density at 10 cm mainly ranges in IQR between 0.65 and 1.07 g/cm3. At the 10 000-year-old moraine the bulk density is the lowest and varies in IQR between 0.2 and 0.78 in the uppermost layer. The IQR at 30 and 50 cm overlaps strongly. Here, the bulk density varies between 0.7 (lower end of IQR at 30 cm) and 1.17 (upper end of IQR at 50 cm).
A comparison of the 160-year-old moraine at both locations shows that the bulk density across the soil profiles is similar at both locations but is in general lower at the C-PM. At the second-oldest moraines the bulk density at C-PM is also lower at all three depths compared to S-PM. However, this relation is reversed at the oldest moraine. The bulk density at 10 and 50 cm depth at S-PM is significantly lower even though the moraine is younger than the corresponding moraine at C-PM.
The porosity shows an increase along the age groups and an ongoing differentiation across the soil profile at both chronosequences (Fig. 2b). At C-PM the porosity at the youngest moraine is in a similar range along the soil profile, except for the top layer, which shows higher porosity values, with a median at 0.32 (30–50 cm median value: ∼0.27). At the 160-year-old moraine, the values are already slightly higher and vary around median values of 0.38 and 0.43. The 4900-year-old moraine shows a strong increase in porosity and a clear differentiation between the individual depths. The porosity in the topsoil is highest, with a median value slightly above 0.81. In the layers below, on the other hand, the porosity is lower (values vary around median values of 0.67 and 0.39 at 30 and 50 cm depth, respectively). Analogous to the development of bulk density, there is no striking difference between the two oldest moraines; the porosity values have a similar range.
At the S-PM forefield the porosity evolution shows similar tendencies. At the 30-year-old moraine the porosity at 30 to 50 cm depth ranges between 0.24 and 0.29. The porosity at 10 cm is slightly higher, with values in an IQR from 0.28 to 0.32. A differentiation between the soil depths is, however, already visible at the 160-year-old moraine, where the IQR of porosity values in the uppermost layer ranges from 0.34 to 0.4. The porosity at 30 and 50 cm depth, however, is not noticeably different from the same depths at the youngest moraine. Compared to the two youngest moraines, the porosity in the uppermost layer at the 3000-year-old moraine is distinctly higher, with values of the IQR mainly ranging between 0.55 and 0.65. The porosity at 30 and 50 cm is also higher and varies over a broader range compared to the younger moraines. The IQRs of the two depths are overlapping. The porosity values range mainly between 0.33 and 0.5, with a median value at 0.41 at both depths. After 10 000 years of soil development the porosity reached its highest values, ranging in an IQR from 0.67 to 0.83 in the uppermost soil layer and again in an overlapping IQR at 30 and 50 cm depth from mainly 0.5 to 0.66. In contrast to the 3000-year-old moraine the median values differ at 30 and 50 cm depth (0.65 at 30 cm and 0.6 at 50 cm).
A comparison of the two 160-year-old moraines at the two sites shows that the porosity at the C-PM is higher at all three soil depths. However, while there is a strong change in porosity at all depths at S-PM between 3000 and 10 000 years of soil development, there is no clear difference between the two oldest age groups at C-PM.
The evolution of bulk density and porosity does not only reveal a constant decrease in bulk density and increase in porosity but also shows a progressive differentiation of these values between the soil layers. Additionally, an increase in the range of values is also noticeable. Thus, with increasing age not only the vertical but also the lateral variability in bulk density and porosity increases.
3.2 Soil texture
The development of the grain size distribution over the millennia shows a distinct reduction in the sand fraction at all three depths at both chronosequences (Fig. 3a). At C-PM, the fraction of sand at the youngest moraine, with over 50 wt %, accounts for the largest share of all grain sizes and is also relatively homogeneous with depth. The fraction of sand at the 160-year-old moraine is slightly larger compared to the youngest moraine. With increasing age, there is a significant reduction in the fraction of sand, especially in the upper layers. The sand content at the surface is reduced to ∼10 wt % at the two oldest moraines, whereas the sand content at 50 cm is less affected. However, at 30 cm at the 4900-year-old moraine and at 50 cm at the 13 500-year-old moraine, the sand fraction varies over a broad range (15 wt %–45 wt % and 30 wt %–60 wt %, respectively).
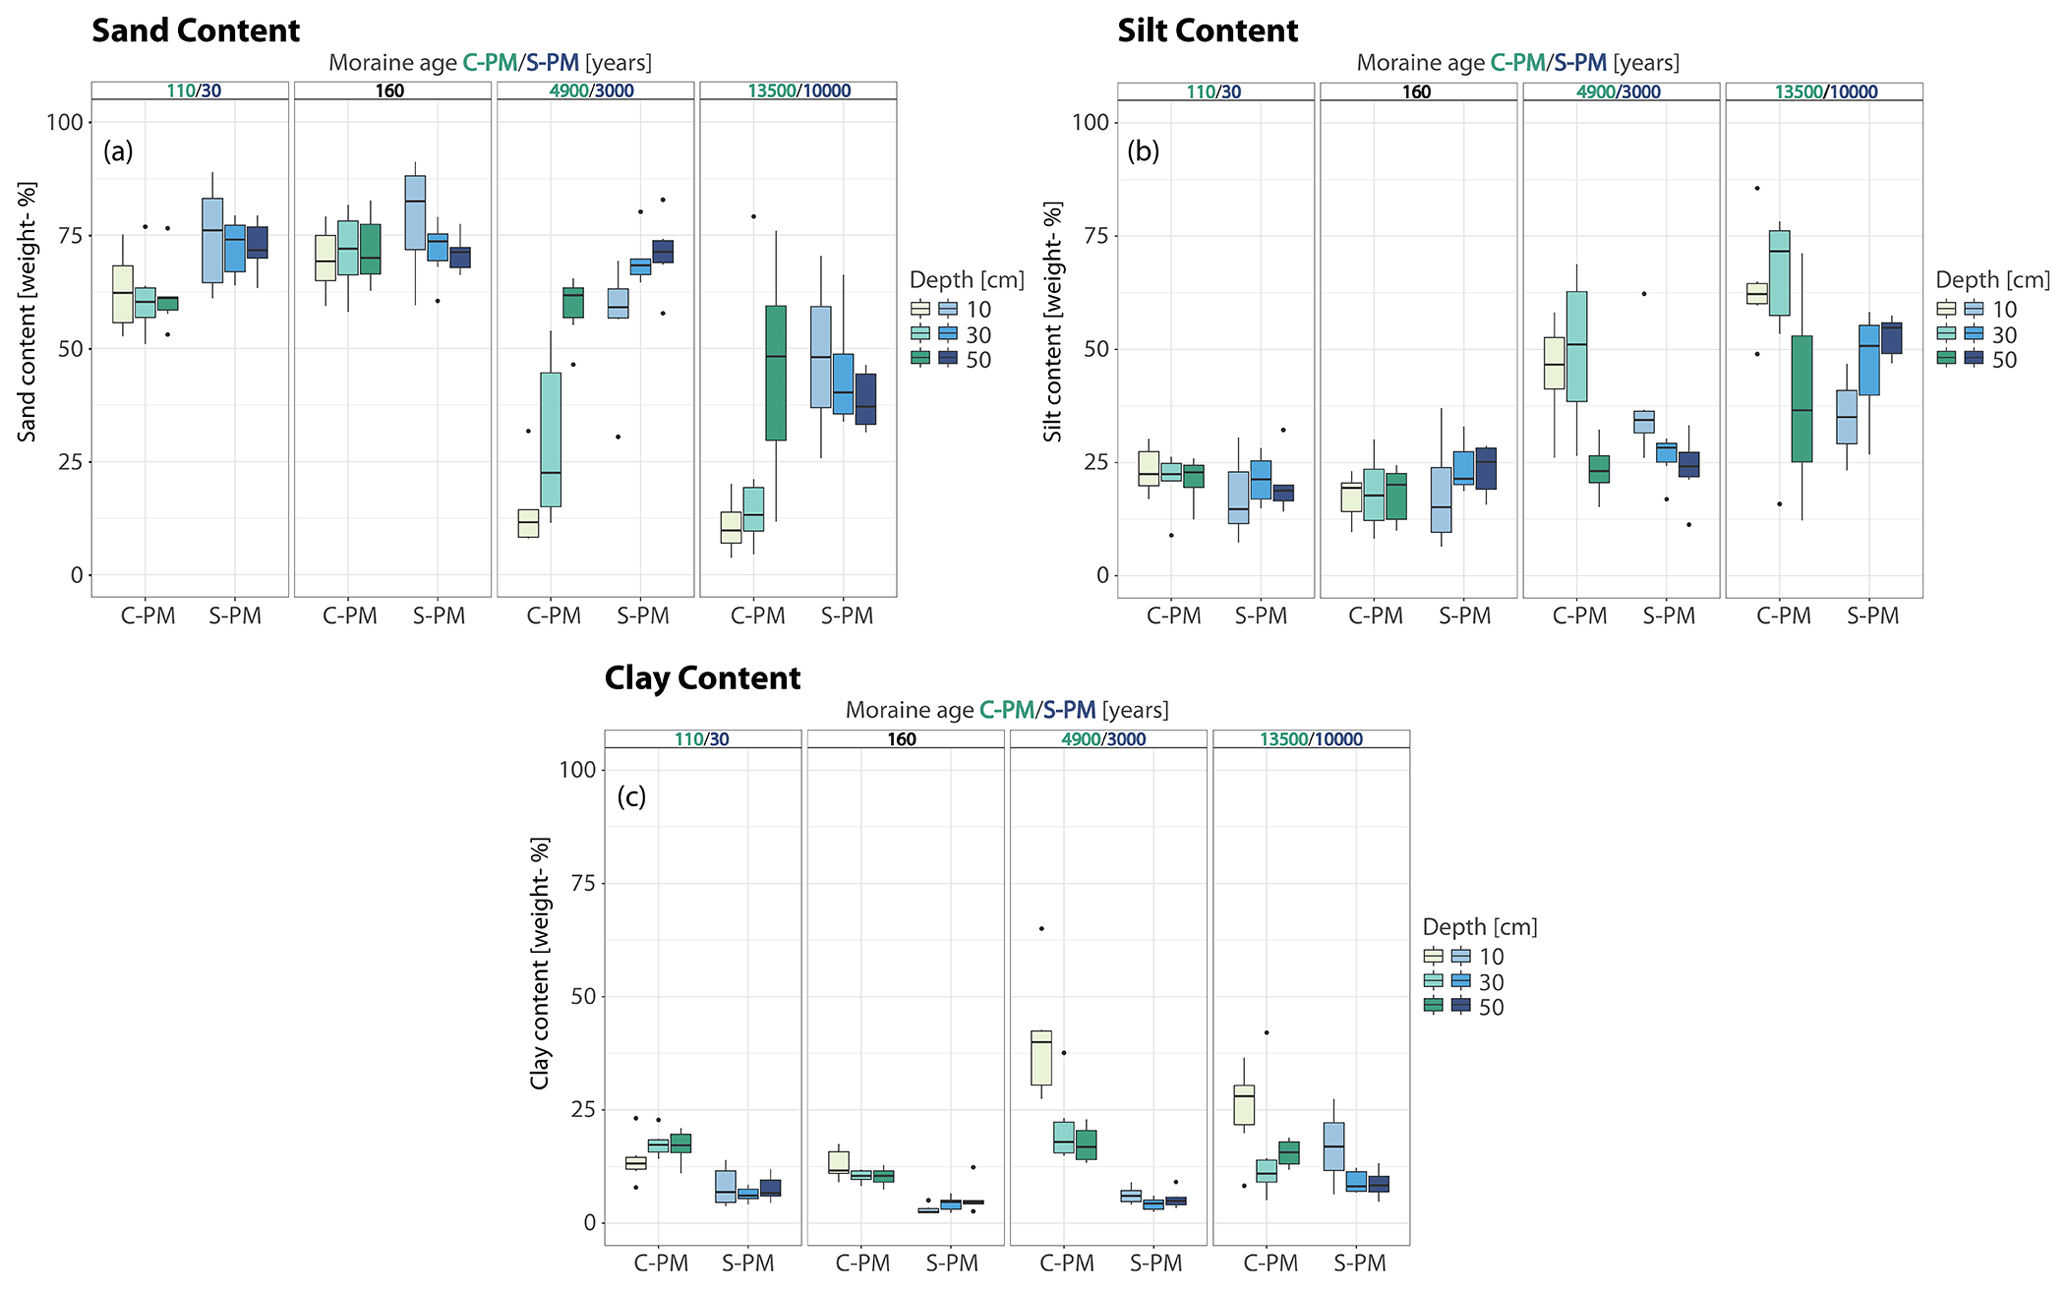
Figure 3Development of sand, silt, and clay content at 10, 30, and 50 cm over 10 millennia on silicate (S-PM, shown in blue color scale) and calcareous (C-PM, shown in green color scale) parent material.
At S-PM, the fraction of sand at the youngest moraine is relatively homogeneous across the soil profile. At the 160-year-old moraine, the fraction at the topsoil is slightly higher than at the youngest moraine. However, a differentiation with depth can already be seen with lower values in deeper layers. The reduction in sand content continues with increasing age, whereas at the 3000-year-old moraine the distribution with depth is reversed, with the topsoil having a lower sand fraction than the deeper layers. At the 10 000-year-old moraine, the profile distribution reverses again, with the topsoil having now the highest values. In general, the fraction of sand at the individual depths and age classes is higher at the S-PM chronosequence compared to the C-PM chronosequence.
It has to be taken into account that the particle size analysis of the samples at a depth of 10 cm in the 10 000-year-old moraine at S-PM could only be carried out on two samples since the organic matter content of the other samples was too high. Since a complete removal of the organic matter content cannot be guaranteed, the two samples are subject to strong uncertainties. These uncertainties also apply to the other samples from the oldest moraines at both chronosequences that have a high organic matter content.
For the silt fraction, an increase at all depths over the chronosequence can be seen at both forefields. This is more pronounced at C-PM than at S-PM (Fig. 3b). At C-PM, the silt fraction at the 110- and 160-year-old moraines is mostly lower than 25 wt % and homogeneous across the profile but with slightly higher values at the youngest moraine. With increasing age, the silt fraction increases strongly, especially at 10 and 30 cm. After 13 500 years the silt fraction is at its highest at 30 cm (median: ∼72 wt %), even higher than in the topsoil (median: 62 wt %), and the lowest at 50 cm (median: 37 wt %).
At S-PM, the silt fraction in the topsoil at the youngest moraine (median: <20 wt %) is slightly lower than in the deeper soil (median ∼20 wt %). The difference can be seen more clearly at the 160-year-old moraine, where the silt fraction at all depths is still mainly below 25 wt %. After 3000 years of soil development the silt content at 10 and 30 cm is higher compared to the 160-year-old moraine, but the distribution reverses, revealing a decrease in silt content with depth. The silt fraction at 50 cm is in the same range as at the 160-year-old moraine (median: ∼25 wt %), whereas in the top layers the silt content increased to values ranging in the IQR from 31 wt %–35 wt %. After 10 000 years the depth distribution is reversed again. Compared to the 3000-year-old moraine the silt fraction in the topsoil is still in the same range, whereas the fraction at 30 and 50 cm increased to median values equal to and higher than 50 wt %. Among S-PM and C-PM, the depth distribution of the silt content at the oldest moraine differs significantly. Whereas at S-PM the silt content increases with depth, the silt content at C-PM is highest at 30 cm (median value at 72 wt %) and lowest at 50 cm (median: ∼30 wt %).
The clay content increases with age at both chronosequences (see Fig 3c). At the youngest moraine of both chronosequences the clay fraction is fairly homogeneous across the soil profile. At C-PM the topsoil has a slightly lower clay fraction (median: ∼13 wt %) than the deeper layers (median: ∼17 wt %), but the values are in general slightly higher than at S-PM (median at all depths: < 10 wt %). At the 160-year-old moraine, the clay fraction at both chronosequences is comparatively lower than at the youngest age class but relatively homogeneous throughout the soil profile. The clay fractions at C-PM (median at all depths: ∼11 wt %) are higher than at S-PM (median at all depths: <10 wt %). At the second-oldest moraine of the C-PM chronosequence the clay content increases at all depths, which is most pronounced in the top layer (median value around 40 wt %). The oldest moraine, however, shows lower values at 10 and 50 cm compared to the second-oldest moraine. The clay fraction in the topsoil at 13 500 years (∼28 wt %) is still higher than at 50 cm, where at 30 cm the clay fraction is the lowest (median: ∼10 wt %). At S-PM only the topsoil shows a slight increase in clay fraction from 160 to 3000 years of soil development, while at the oldest moraine clay fraction increases at all depths, with the topsoil having the highest fraction (median value: ∼17 wt %). In comparison, the clay content at all age classes is higher at C-PM than at S-PM. A first investigation of the effect of the soil texture at the S-PM forefield on near-surface hydrology can be found in Maier et al. (2020).
Incorporated into a ternary diagram (Fig. 4) for soil type classification using the USDA Textural Soil Classification (Hamilton and Ferry, 2018), the grain size evolution reveals a clear shift in soil types at both chronosequences throughout the millennia. The soil types at the two youngest moraines at both chronosequences mainly vary between loamy sand and sandy loam. Soil types at the 3000- (S-PM) and 4900-year-old (C-PM) moraines differ from each other (Fig. 4c). Whereas at S-PM sandy loam is still the prevailing soil type, the soil types at C-PM shifted to silty clay and silty clay loam in the topsoil and mainly loam and silt loam at 30 cm. At 50 cm sandy loam is still the main soil type. At the oldest moraine the soil types at S-PM also shift to loam and silt loam (Fig. 4d). At C-PM the topsoil at the oldest moraine is still mainly a combination of silt, clay, and loam. In 30 and 50 cm depth, however, next to loam- and silt-dominated soil also sandy loam is frequently present.
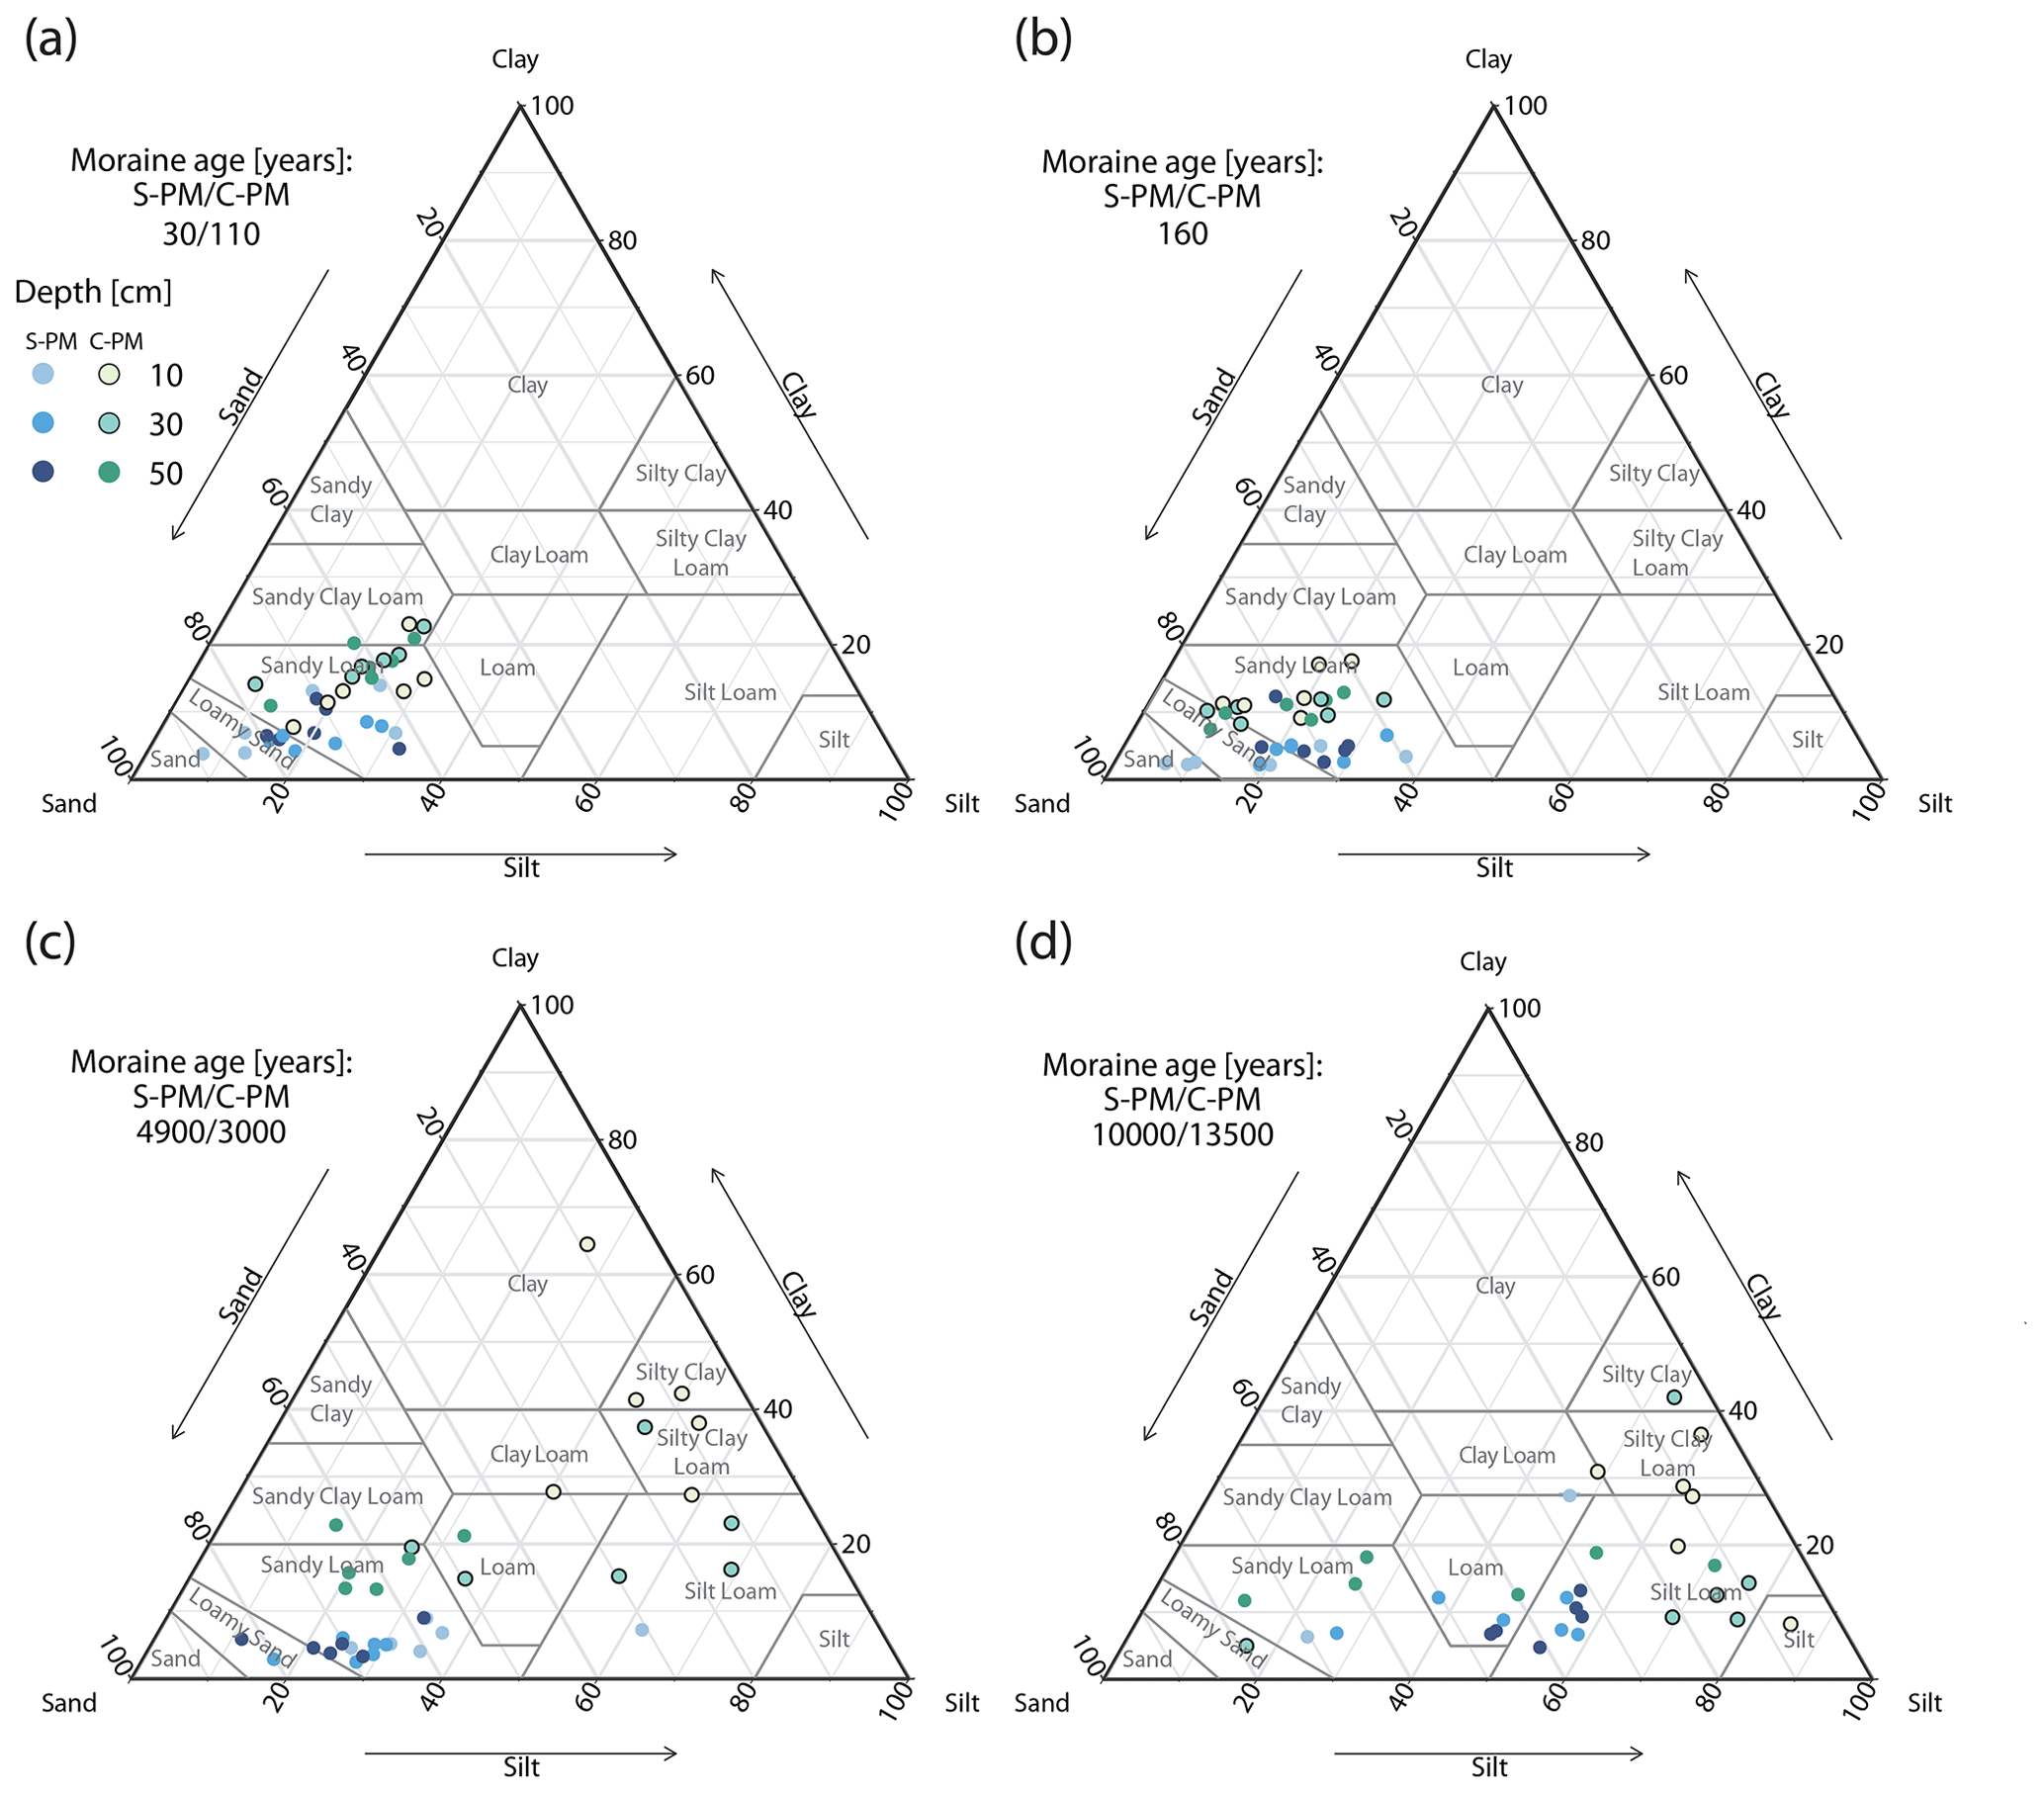
Figure 4Ternary diagram for soil type classification using the USDA Textural Soil Classification. Each plot shows a single age class and compares the grain size distributions of both parent materials and all three depths.
The gravel and stone fraction (see Fig. 5) here included only stones with a diameter between 2 and ∼100 mm. At both parent materials the gravel and stone fraction decreases with soil age. The decrease is most pronounced in the topsoil and at the oldest moraine in the C-PM forefield (Fig. 5b).
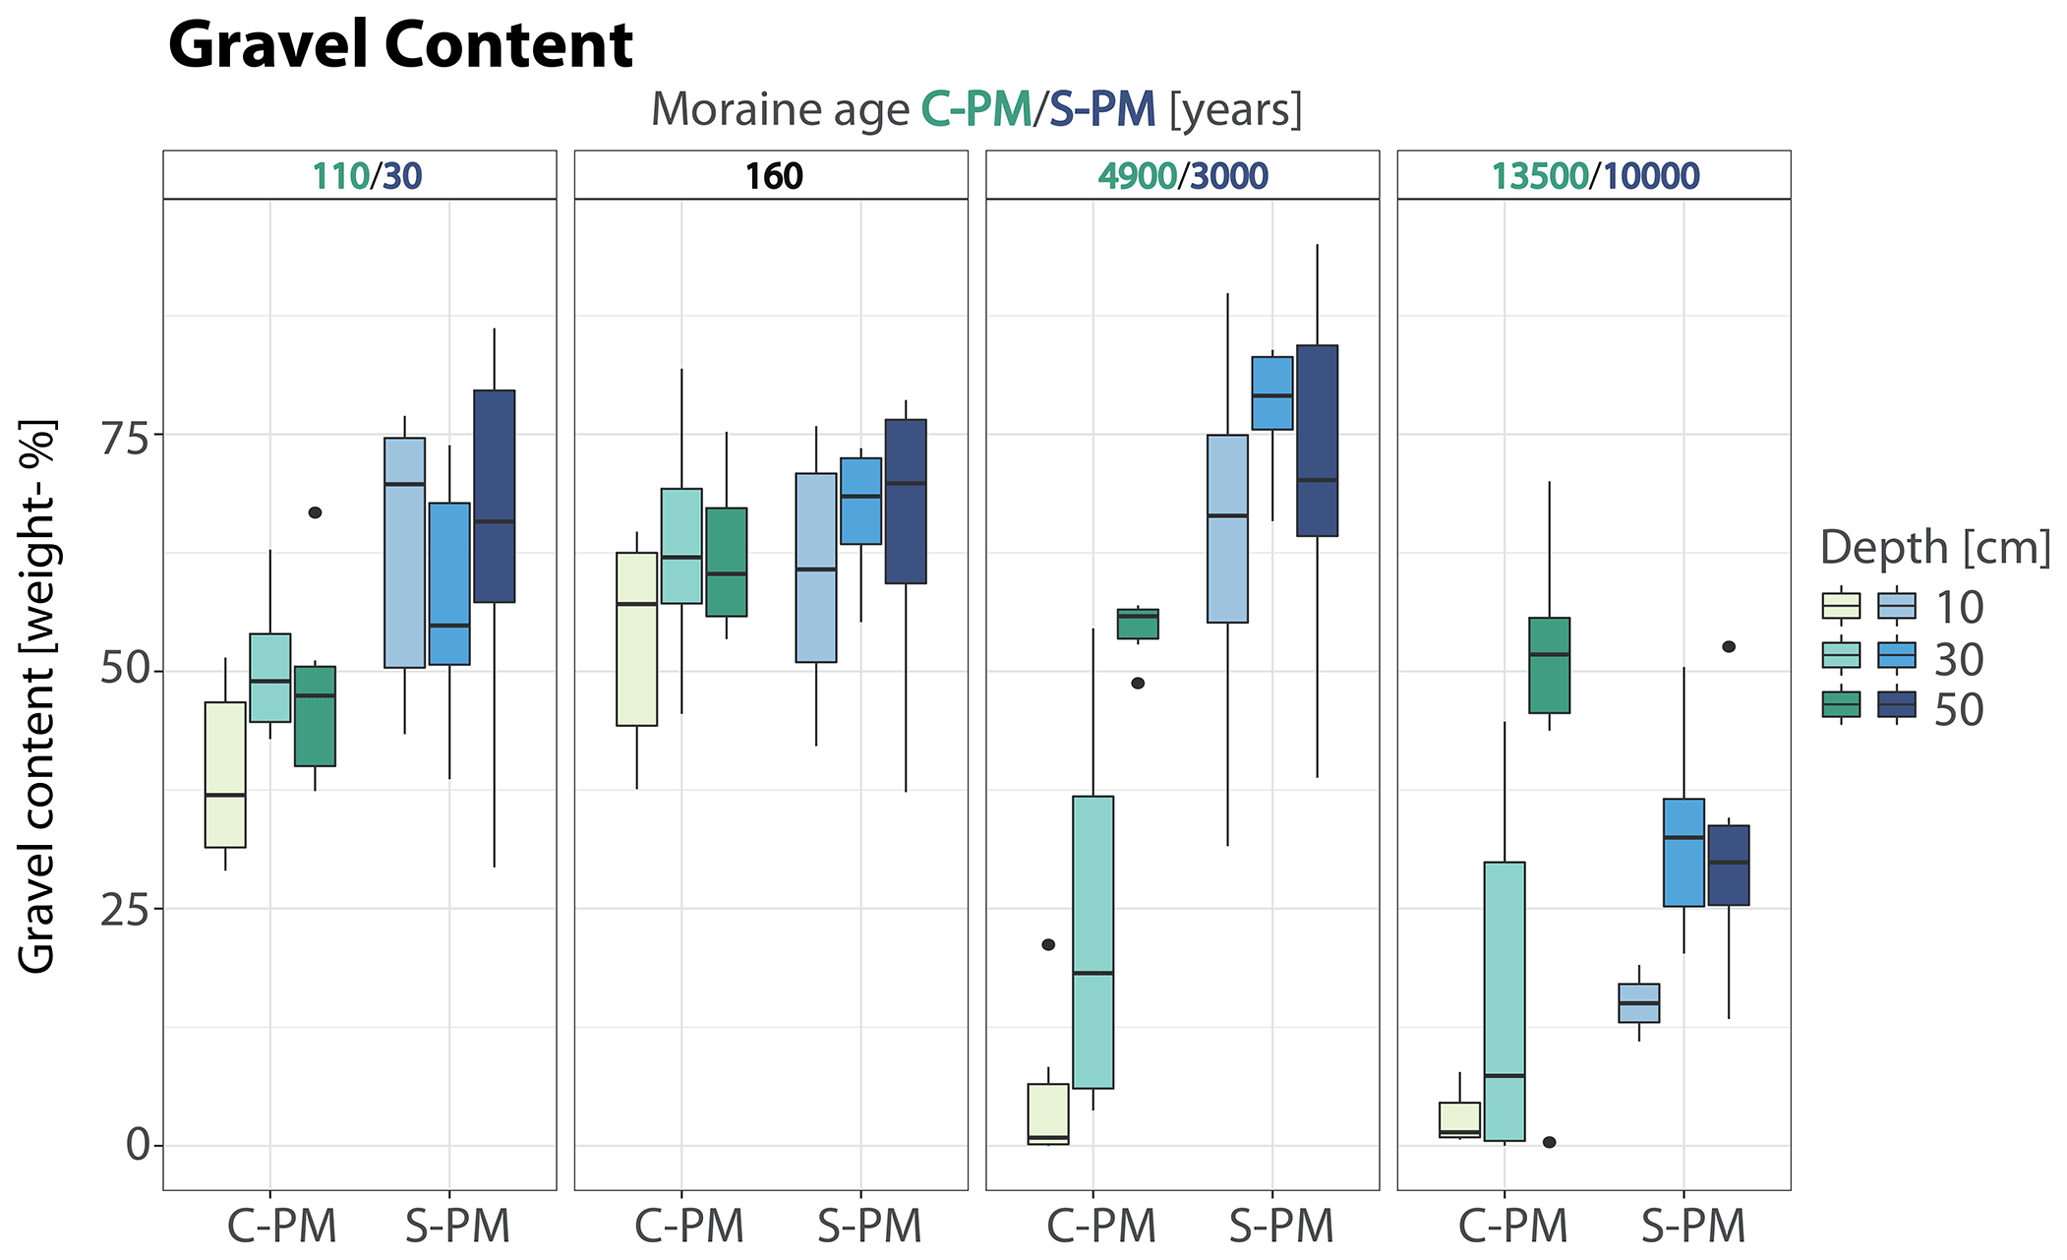
Figure 5Development of gravel at 10, 30, and 50 cm over 10 millennia on silicate (S-PM, shown in blue color scale) and calcareous (C-PM, shown in green color scale) parent material.
Hartmann et al. (2020a) provides additional information on the evolution of stone content with depth for the S-PM forefield derived by image analysis of soil profile walls with a vertical extent up to 1 m.
3.3 Loss on ignition
The loss on ignition is a measure of the organic substance in the soil and describes the proportion of the organic substance that was oxidized during annealing for 24 h at 550 ∘C. The organic substance is a heterogeneous mixture of faunal and floral substances.
Both chronosequences show a significant increase in organic matter throughout the first 10 millennia of soil development, which is most pronounced in the upper soil layer (see Fig. 6). For both chronosequences at the two youngest moraines the organic matter content is still very low, with C-PM showing slightly higher values (<2 wt % at S-PM and 2 wt %–4 wt % at C-PM). At these two age classes the organic matter content is homogeneously distributed over the profile, with a slight tendency to higher values in the topsoil at the 160-year-old moraine. At the medium-age moraines of both chronosequences (3000 and 4900 years) a significant increase in the organic matter content in the surface layer can be observed (median: 11 wt % at S-PM and up to 26 wt % at C-PM). There is also an increase at greater depths, which is more pronounced at C-PM. At the oldest moraine at S-PM the trend of increasing organic matter continues at all three depths. Here, the organic content in the topsoil makes up to two-thirds of the soil material. However, the organic matter content varies strongly, with a minimum of 6 and a maximum 87 wt %. At greater depths, the organic matter content also increases compared to the 3000-year-old soil but remains below 20 wt %. The organic matter content decreases with increasing soil depth. At C-PM the organic matter content at the top layer of the oldest moraine is slightly lower compared to the second-oldest moraine. In general the organic matter content at all three soil depths does not differ considerably between the two age classes.
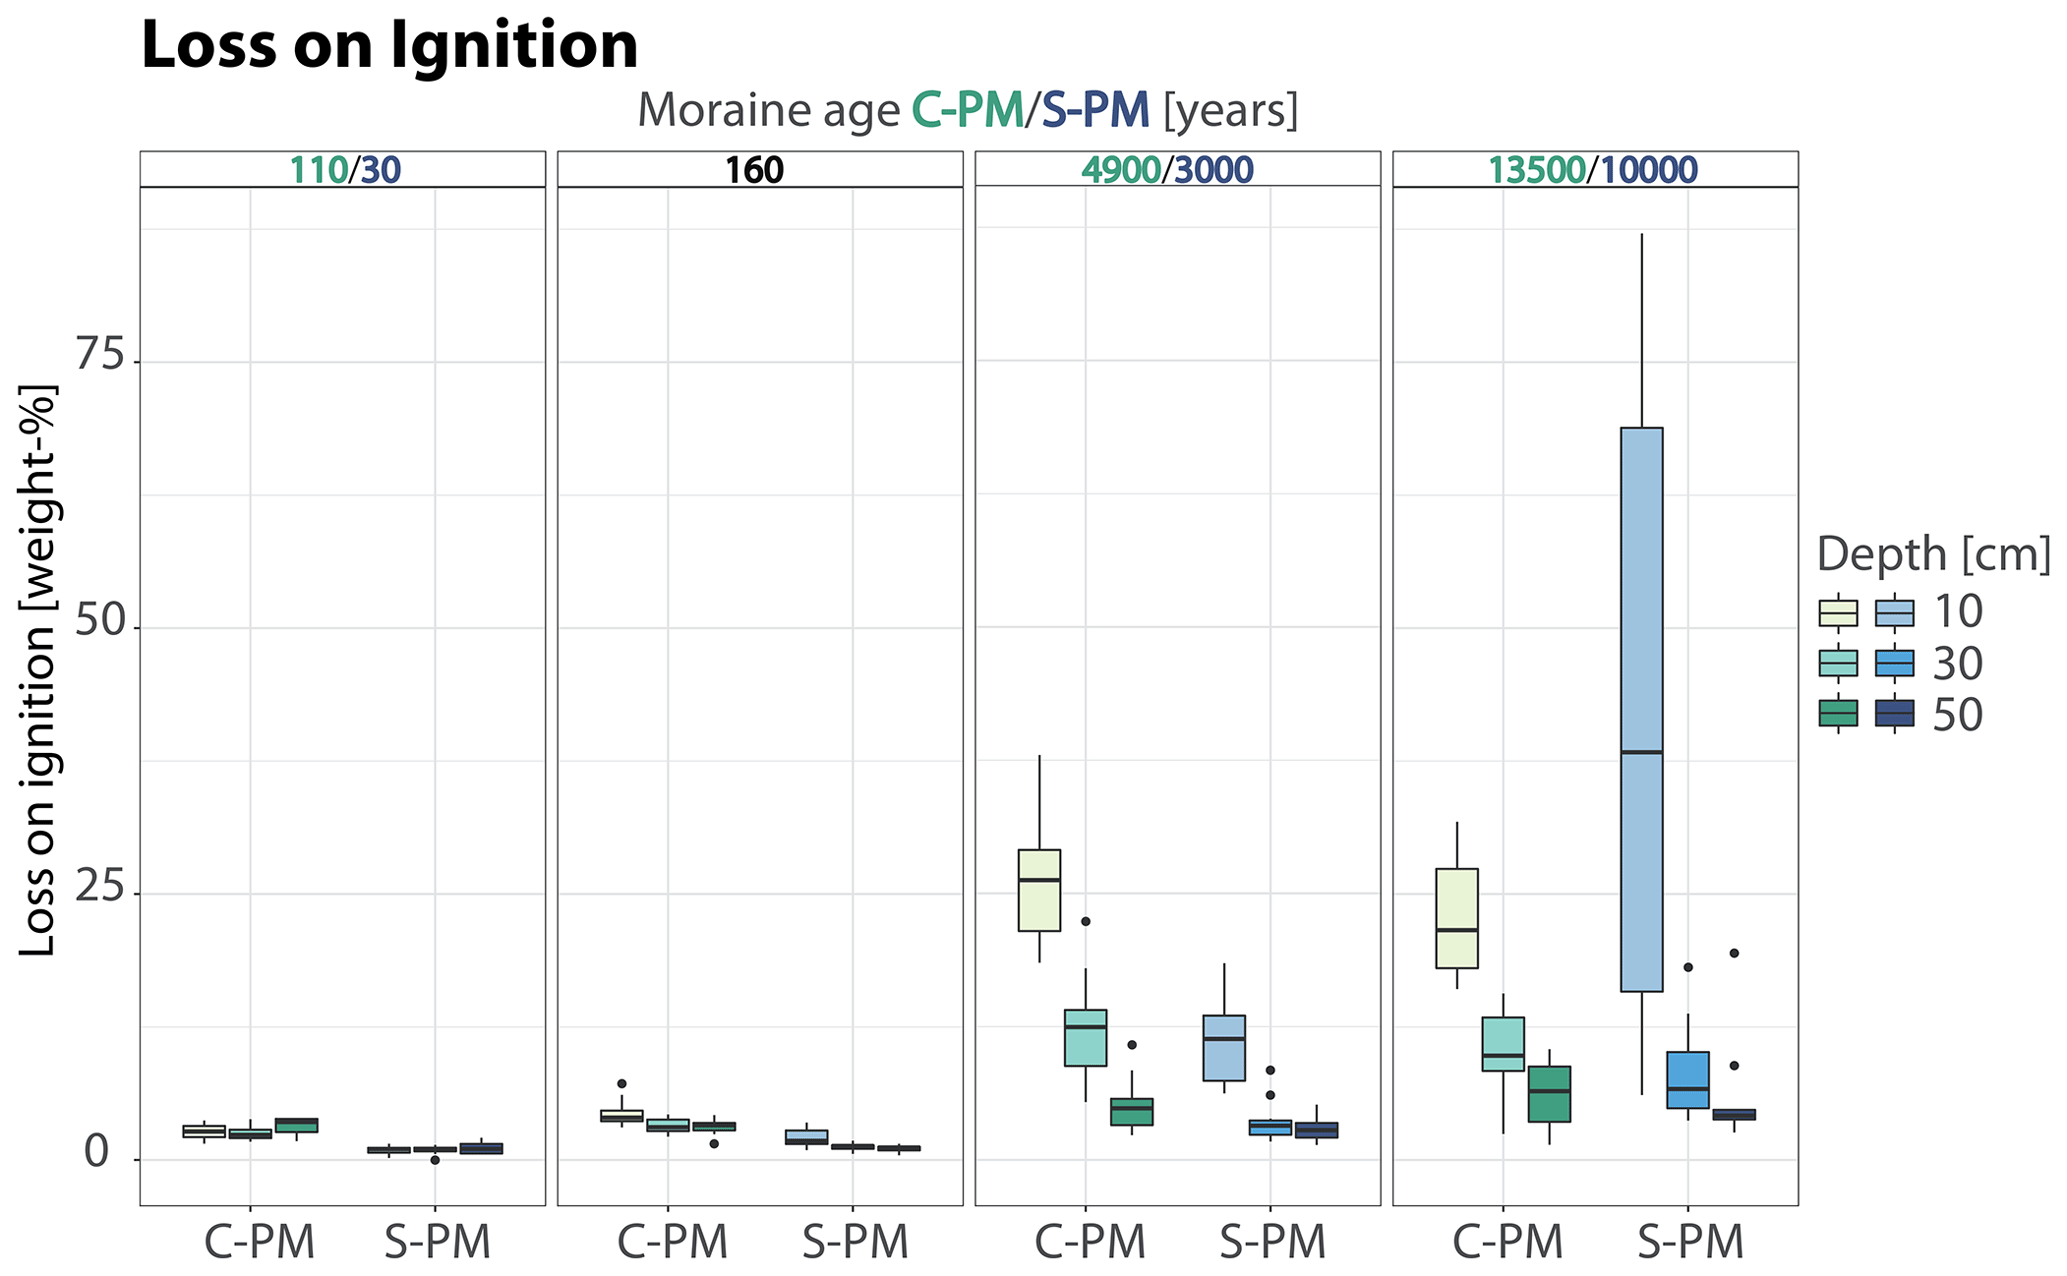
Figure 6Development of loss on ignition at 10, 30, and 50 cm over 10 millennia on silicate (S-PM, shown in blue color scale) and calcareous (C-PM, shown in green color scale) parent material.
4.1 Retention curves
The retention curve, the relationship between volumetric soil water content and matric potential, is an important individual characteristic of soils and depends strongly on soil physical and biological soil properties. The retention curves show a clear change over the millennia at both forefields (Fig. 7).
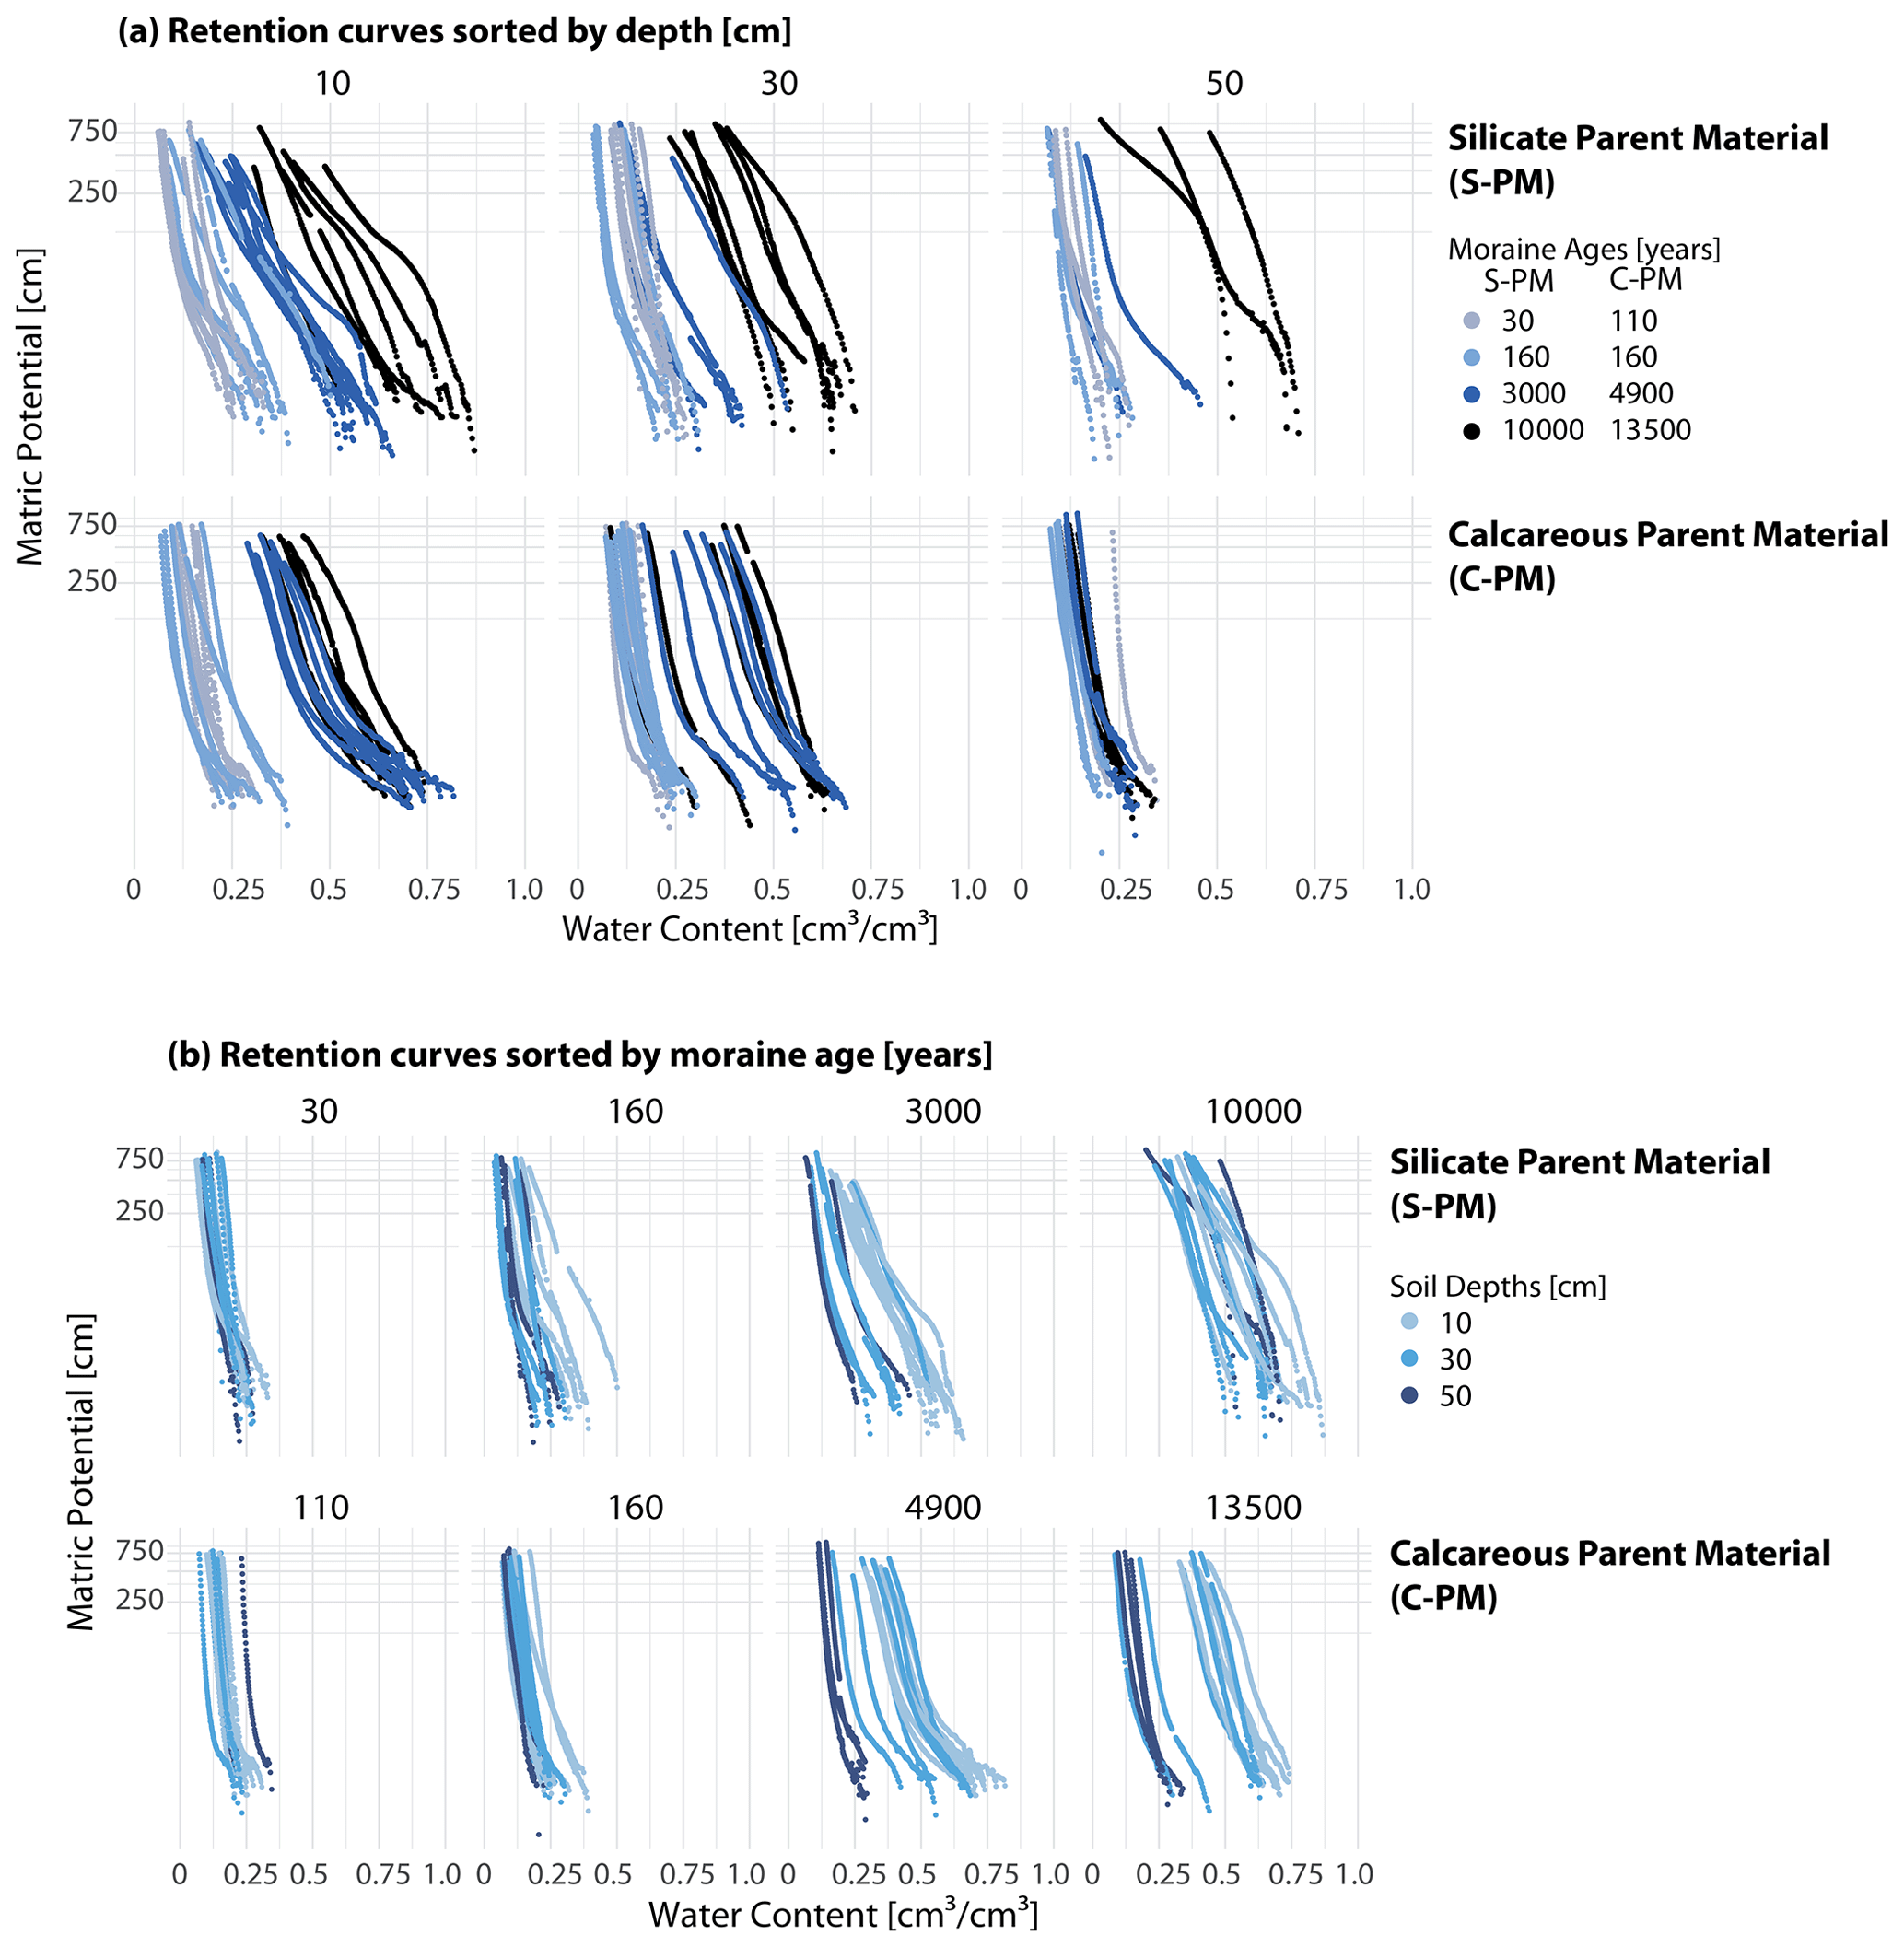
Figure 7Development of retention curves at 10, 30, and 50 cm over 10 millennia on silicate (S-PM) and calcareous (C-PM) parent material sorted by depth (a) and moraine age (b).
At both chronosequences the lower end of the retention curves (nearly saturated conditions) show a clear shift to higher water contents with increasing moraine age, which is strongly coupled to the increase in porosity (equal to saturated water content) (see Fig. 7a). This trend is most pronounced in the top layer and decreases with soil depth. The air entry value, indicated by the first change in slope close to saturated conditions, shifts to higher matric potential, which is particularly pronounced in the organic layer at S-PM. At C-PM, however, this shift is not very pronounced, and especially at 50 cm depth, the retention curves are all similar. However, at both chronosequences the slope of the curve above the air entry value shows the tendency to decline with increasing age. The variability in retention curves with depth also increases with age at both chronosequences (see Fig. 7b). After 3000 years at S-PM and 4900 years at C-PM, the retention curves of the three depths show clear differences, while at the youngest moraines of both chronosequences the retention curves of the three depths are similar, indicating a homogeneous soil profile. For the older moraines, the increase in saturated water content and air entry value as well as the decrease in slope are most pronounced in the uppermost layer; this becomes less pronounced with increasing depth.
4.2 Hydraulic conductivity curves
The unsaturated hydraulic conductivity curve is another important flow-defining soil characteristic. It describes the relation between the unsaturated soil hydraulic conductivity and soil matrix potential (or soil water content, respectively). The hydraulic conductivity curves also change over the millennia (Fig. 8a).

Figure 8Development of hydraulic conductivity curves at 10, 30, and 50 cm over 10 millennia on silicate (S-PM) and calcareous (C-PM) parent material sorted by depth (a) and moraine age (b).
Out of the 60 soil samples taken at each moraine and analyzed by the method according to Schindler (1980), only 32 at S-PM and 41 at C-PM could be analyzed for the hydraulic conductivity curve according to the method by Peters and Durner (2008). Seven of the excluded soil samples at S-PM and two at C-PM could not be used because the installation of the second tensiometer into the sample was prevented by stones. The other samples had to be excluded as the upper part of the sample dried out much faster than the lower part during the evaporation experiment. An approximately linear profile of the soil matric potential within the sample could thus no longer be assumed. This is typical for soils with large pore sizes, such as sandy soils. The excluded samples belonged to all age classes, but most of them belonged to the topsoil of the oldest moraines, where the organic matter content is very high (Fig. 6).
Despite the thin data basis, a trend is visible at both chronosequences that the heterogeneity in the conductivity curves increases with increasing moraine age (Fig. 8). At the S-PM forefield the conductivity curves at 10 cm show a sharp drop in conductivity, except for the young moraine. Here, the reduction in the conductivity reduces only slowly to a certain point at which the decrease continues faster. The conductivity curves of C-PM at 10 cm cannot be evaluated in this context since the curves of the topsoil at the two oldest moraines could not be evaluated. However, the curves of the youngest moraine show a similar modest decrease in conductivity at higher matric potentials as at the young moraines at the S-PM forefield. The curves of the 160-year-old moraine at C-PM already show a sharper decrease in conductivity.
At 30 cm depth at S-PM, almost all curves show a slight reduction in conductivity. The curves of the 3000-year-old moraine are an exception here and show steeper curves. The curves at 30 cm at C-PM are very heterogeneous. The curves of the young moraines still show a rather slow decrease in conductivity, whereas the curves at the older moraines show a faster reduction. At 50 cm depth, the database at both chronosequences is not so extensive. While the conductivity curves at the S-PM forefield are very heterogeneous, the curves at the C-PM forefield are very close to each other with, only a few single curves from the two oldest moraines showing a steeper slope towards increasing soil matric potential. At the S-PM forefield, the curves show a strong reduction in conductivities at higher matric potential, but this appears to occur at even higher matric potentials at the oldest moraine.
The space-for-time substitution approach assumes that a sequence of sites (e.g., moraines) with similar site characteristics such as topography, climate, and parent material can be treated as a chronosequence. It is well known that the application of this chronosequence concept has some limitations. The assumption that time is the only factor affecting soil development in a spatial sequence of soils is rarely valid but the only option for a detailed historical tracking of landscape development at a particular location (Phillips, 2015). We therefore have to assume that differences in topography and elevation among the selected moraines only lead to moderate differences in soil hydrologic conditions. However, we made sure that slopes of the three selected plots per moraine were in a similar range. The plots at the silicate parent material range in slope from 18 to 34∘, with the majority of plots between 20 and 30∘. The maximum elevation difference between the lowest and the highest plot is 116 m. At the calcareous site the slopes range from 29 to 38∘, also with the majority of plots ranging between 33 and 35∘. Here, three out of four moraines are at almost the same elevation. The elevation difference to the youngest moraine is 200 m.
While sampling, transport, and analyses of the samples were handled with the uttermost care, we cannot entirely exclude the possible occurrence of different adverse effects which would negatively impact our measurement uncertainty. A quantification of these uncertainties is difficult to achieve; however, we briefly discuss them below and give some indication for which of the sample uncertainties might be higher than for others.
All data shown were obtained on the basis of soil samples taken in the field. Soil samples are subject to various types of uncertainties. Due to the high spatial variability in vegetation cover and soil properties, it is difficult to represent a complete moraine by taking individual soil samples. In order to counteract this situation, we used the variability in vegetation cover as a proxy to bracket this variability. Thus, samples were taken at several locations with different vegetation complexity (low, medium, high) and by taking at least two replicates.
Undisturbed sampling with sample rings that are hammered into the ground is difficult to guarantee and requires great care. In alpine locations, the high stone content of the soil leads to an increased level of difficulty. This was particularly the case at the young moraines. Sampling was particularly difficult here and required repeated attempts to obtain a sample (which is likely biased towards less or smaller stones). Furthermore, the samples must be transported with as little disturbance as possible. Despite adequate precautions, it cannot be ruled out that vibrations occurred during the transport of the samples, which could have affected the structure of the soil samples. This applies particularly to the C-PM site, where the samples had to be transported part of the way by helicopter due to the difficult access to the site.
Even when processing the samples in the laboratory, handling of the samples can affect the structure. Also, the integrity of the samples can be influenced by laboratory methods. The complete saturation of the soil samples, which is necessary for many analyses but is rarely found under natural conditions, can lead to the displacement of fine particles in the sample. This could have affected the results of the soil-hydraulic-property analysis. However, the resulting uncertainty cannot be quantified. Additionally, the particle size analysis of the samples at a depth of 10 cm in the 10 000-year-old moraine could only be carried out on two samples at the S-PM site since the organic matter content of the other samples was too high. The results of the two samples are subject to strong uncertainties since it could not be ensured that the entire organic matter could be removed. This also accounts for the other soil samples with a high organic matter content. The incomplete removal of the organic matter can lead to an overestimation of the silt and clay content.
Uncertainties in the analysis of the soil hydraulic properties result, on the one hand, from the already-mentioned possible particle displacement during saturation or from the measuring device used. The installation of the tensiometers can lead to a compaction of the soil material around the tensiometer tips, which is more likely in the samples of the old moraines with strongly developed soil material. In the samples of the young moraines, on the other hand, the installation can shift stones and soil material, which affects the structure. When evaluating the evaporation experiment, the validity of the assumptions about the matric-potential distribution must also be considered. Since a drifting apart of the matric potential in the upper and lower tensiometer excludes an approximately constant linear profile of the matric potential in the center of the sample, an evaluation of the conductivity curve is no longer justifiable. When evaluating the retention curves, this was not considered to be critical since the averaged measured matric potential is related to the bulk water content, determined via the weight measurement.
The data are available at the online repository of the German Research Center for Geosciences (GFZ; Hartmann et al., 2020b) and can be accessed via the DOI https://doi.org/10.5880/GFZ.4.4.2020.004.
The evolution of soil physical and hydraulic properties over 10 millennia was investigated by analyzing soil samples of soil chronosequences in two glacier forefields: one glacier forefield developed on silicate and the other on calcareous parent material. The chosen soil chronosequences consisted of four age classes ranging in age from less than 100 years to more than 10 000 years. Spatial variability in soil properties was taken into account by selecting three sampling sites per moraine along a gradient of vegetation complexity (low, medium, high) and by taking replicate samples. Uncertainties due to sampling techniques, transportation, or sample handling during laboratory analyses cannot be excluded but were minimized as much as possible through careful handling. Soil physical properties in the form of bulk density, porosity, and organic matter content as well as gravel, sand, silt, and clay fraction were analyzed at 10, 30, and 50 cm soil depth.
At both chronosequences a decrease in bulk density and an increase in porosity was observed at all depths. The trend was equally present at both chronosequences, but absolute values and depth profiles differ among the two parent materials at both sites. The grain size distribution shows a pronounced reduction in sand fraction and an increase in silt and clay fraction over time. The sand fraction at the calcareous site was initially lower than at the silicate site. This difference became stronger at the two oldest age classes since the reduction in sand fraction was more pronounced at the calcareous site. The silt fraction, however, was almost equal at the youngest age classes at both sites but increased strongly in the topsoil of the calcareous site. The smallest changes occurred in the clay fraction, which was higher at the calcareous site at all age classes.
The organic matter content also increased with increasing age at both sites. Whereas the organic matter content in the topsoil was higher at the calcareous site at the intermediate age classes, the silicate site showed a strong increase and a high variation at the oldest age class. With the change in physical soil properties and organic matter content, a pronounced change in hydraulic soil properties in the form of retention curve and hydraulic conductivity curve was also observed. The changes reveal an evolution from fast-draining coarse-textured soils to slow-draining soils with high water-holding capacity, with the increase in water-holding capacity being more pronounced in the topsoil at the silicate site. This also affected the evolution of hydrologic flow paths at these sites, as shown in Hartmann et al. (2020a).
The obtained data set provides important insights into the development and dynamics of soil structure and soil hydraulic properties for two different parent materials and thus can be useful for the understanding of interactions of pedogenic, biotic, geomorphic, and hydrologic processes during landscape evolution.
AH collected the soil samples and conducted the laboratory analysis. MW and TB were involved in planning the fieldwork. AH prepared the paper with contributions from all coauthors.
The authors declare that they have no conflict of interest.
This article is part of the special issue “Linking landscape organisation and hydrological functioning: from hypotheses and observations to concepts, models and understanding (HESS/ESSD inter-journal SI)”. It is not associated with a conference.
We thank Jonas Freymüller, Nina Zahn, Wibke Richter, Louisa Kanis, Peter Grosse, and Carlo Seehaus for their persevering assistance in the field and Franziska Röpke for her patient assistance in the laboratory. We also thank Kraftwerke Oberhasli AG (KWO) for permission to conduct the fieldwork at the Stone Glacier forefield and the Canton Uri, the community Unterschächen, and Korporation Uri for permission to conduct the fieldwork at the Griessfirn forefield. Many thanks to Thomas Michel and his team of the Alpin Center Sustenpass and Peter Luchs as well as Christine, Franz, and Matthias Stadler at Chammlialp for their support and kind hospitality.
This research has been supported by the German Research Foundation (DFG) and the Swiss National Science Foundation (SNF) within the DFG-SNF project Hillscape (Hillslope Chronosequence and Process Evolution) (DFG; grant no. BL 1184/4-1).
This paper was edited by Alexander Gelfan and reviewed by two anonymous referees.
Alexander, E. and Burt, R.: Soil development on moraines of Mendenhall Glacier, southeast Alaska. 1. The moraines and soil morphology, Geoderma, 72, 1–17, https://doi.org/10.1016/0016-7061(96)00021-3, 1996. a
Blass, A., Anselmetti, F. S., and Ariztegui, D.: 60 years of glaciolacustrine sedimentation in Steinsee (Sustenpass, Switzerland) compared with historic events and instrumental meteorological data, Eclogae Geol. Helv., 96, Supplement 1, S59–S71, https://doi.org/10.1007/978-3-0348-7992-7_8, 2003. a
Bourgeois, O. L., Bouvier, C., Brunet, P., and Ayral, P.-A.: Inverse modeling of soil water content to estimate the hydraulic properties of a shallow soil and the associated weathered bedrock, J. Hydrol., 541, 116–126, https://doi.org/10.1016/j.jhydrol.2016.01.067, 2016. a
Burga, C. A., Krüsi, B., Egli, M., Wernli, M., Elsener, S., Ziefle, M., Fischer, T., and Mavris, C.: Plant succession and soil development on the foreland of the Morteratsch glacier (Pontresina, Switzerland): Straight forward or chaotic?, Flora - Morphology, Distribution, Functional Ecology of Plants, 205, 561–576, https://doi.org/10.1016/j.flora.2009.10.001, 2010. a
Carey, S. K., Quinton, W. L., and Goeller, N. T.: Field and laboratory estimates of pore size properties and hydraulic characteristics for subarctic organic soils, Hydrol. Process., 21, 2560–2571, https://doi.org/10.1002/hyp.6795, 2007. a, b
Crocker, R. L. and Dickson, B. A.: Soil Development on the Recessional Moraines of the Herbert and Mendenhall Glaciers, South-Eastern Alaska, J. Ecol., 45, 169–185, https://doi.org/10.2307/2257083, 1957. a, b, c
Crocker, R. L. and Major, J.: Soil Development in Relation to Vegetation and Surface Age at Glacier Bay, Alaska, J. Ecol., 43, 427–448, https://doi.org/10.2307/2257005, 1955. a, b, c, d, e
D'Amico, M. E., Freppaz, M., Filippa, G., and Zanini, E.: Vegetation influence on soil formation rate in a proglacial chronosequence (Lys Glacier, NW Italian Alps), CATENA, 113, 122–137, https://doi.org/10.1016/j.catena.2013.10.001, 2014. a, b
Deuchars, S., Townend, J., Aitkenhead, M. J., and FitzPatrick, E.: Changes in soil structure and hydraulic properties in regenerating rain forest, Soil Use Manage., 15, 183–187, https://doi.org/10.1111/j.1475-2743.1999.tb00086.x, 1999. a, b
Douglass, D. C. and Bockheim, J. G.: Soil-forming rates and processes on Quaternary moraines near Lago Buenos Aires, Argentina, Quaternary Res., 65, 293–307, https://doi.org/10.1016/j.yqres.2005.08.027, 2006. a, b, c
Dümig, A., Smittenberg, R., and Kögel-Knabner, I.: Concurrent evolution of organic and mineral components during initial soil development after retreat of the Damma glacier, Switzerland, Geoderma, 163, 83–94, https://doi.org/10.1016/j.geoderma.2011.04.006, 2011. a, b, c, d
Egli, M., Mavris, C., Mirabella, A., and Giaccai, D.: Soil organic matter formation along a chronosequence in the Morteratsch proglacial area (Upper Engadine, Switzerland), CATENA, 82, 61–69, https://doi.org/10.1016/j.catena.2010.05.001, 2010. a, b
Frey, F.: Geologie der östlichen Claridenkette, PhD thesis, ETH Zurich, Zürich, SA aus: Vierteljahrsschrift der Naturforschenden Gesellschaft in Zürich, Jg. 110, Heft 1, S. 1–287, Diss. Naturwiss, ETH Zürich, Nr. 3590, 0000, Ref.: Trümpy, R. ; Korref.: Gansser, A., https://doi.org/10.3929/ethz-a-000088454, 1965. a
Google: Stone Glacier Map, 3863 Gadmen, CH, Google Maps, April 2020, available at: http://maps.google.com (last access: 12 April 2020), (Pictures 2020 Flotron/Perinjaquet, Maxar Technologies, Maps), 2020a. a
Google: Griess Firn Map, 8751 Spiringen, CH, Google Maps, January 2020, available at: http://maps.google.com (last access: 20 January 2020), (Kartendaten 2020, Maps), 2020b. a
Hamilton, N. and Ferry, M.: ggtern: Ternary Diagrams Using ggplot2, J. Stat. Softw., 87, Code Snippet 3, 1–17, https://doi.org/10.18637/jss.v087.c03, 2018. a
Hartmann, A., Semenova, E., Weiler, M., and Blume, T.: Field observations of soil hydrological flow path evolution over 10 millennia, Hydrol. Earth Syst. Sci., 24, 3271–3288, https://doi.org/10.5194/hess-24-3271-2020, 2020a. a, b, c, d
Hartmann, A., Weiler, M., and Blume, T.: Soil physical and hydraulic properties along two chronosequences of proglacial moraines, GFZ Data Services, https://doi.org/10.5880/GFZ.4.4.2020.004, 2020b. a, b
He, L. and Tang, Y.: Soil development along primary succession sequences on moraines of Hailuogou Glacier, Gongga Mountain, Sichuan, China, CATENA, 72, 259–269, https://doi.org/10.1016/j.catena.2007.05.010, 2008. a, b
Heikkinen, O. and Fogelberg, P.: Bodenentwicklung im Hochgebirge : ein Beispiel vom Vorfeld des Steingletschers in der Schweiz, Geogr. Helv., 35, 107–112, https://doi.org/10.5194/gh-35-107-1980, 1980. a
Hu, W., Shao, M. A., Wang, Q. J., Fan, J., and Reichardt, K.: Spatial variability of soil hydraulic properties on a steep slope in the loess plateau of China, Sci. Agr., 65, 268–276, 2008. a
Hudek, C., Stanchi, S., D’Amico, M., and Freppaz, M.: Quantifying the contribution of the root system of alpine vegetation in the soil aggregate stability of moraine, International Soil and Water Conservation Research, 5, 36–42, https://doi.org/10.1016/j.iswcr.2017.02.001, 2017. a, b
Hupet, F., Lambot, S., Javaux, M., and Vanclooster, M.: On the identification of macroscopic root water uptake parameters from soil water content observations, Water Resour. Res., 38, 36-1–36-14, https://doi.org/10.1029/2002WR001556, 2002. a
Jenny, H.: Factors of soil formation, in: A system of quantitative pedology, McGraw-Hill, New York, New York, 281 pp., 1941. a
Lohse, K. A. and Dietrich, W. E.: Contrasting effects of soil development on hydrological properties and flow paths, Water Resour. Res., 41, W12419, https://doi.org/10.1029/2004WR003403, 2005. a, b, c, d, e, f
Maier, F., van Meerveld, I., Greinwald, K., Gebauer, T., Lustenberger, F., Hartmann, A., and Musso, A.: Effects of soil and vegetation development on surface hydrological properties of moraines in the Swiss Alps, CATENA, 187, 104353, https://doi.org/10.1016/j.catena.2019.104353, 2020. a, b, c, d, e, f
Swiss Confederation: Climate normals Pilatus – Reference period 1981–2010, Federal Office of Meteorology and Climatology MeteoSwiss, available at: https://www.meteoswiss.admin.ch/product/output/climate-data/climate-diagrams-normal-values-station-processing/PIL/climsheet_PIL_np8110_e.pdf, last access 17 June 2020. a
Morales, V. L., Parlange, J.-Y., and Steenhuis, T. S.: Are preferential flow paths perpetuated by microbial activity in the soil matrix? A review, J. Hydrol., 393, 29–36, https://doi.org/10.1016/j.jhydrol.2009.12.048, 2010. a
Musso, A., Lamorski, K., Sławiński, C., Geitner, C., Hunt, A., Greinwald, K., and Egli, M.: Evolution of soil pores and their characteristics in a siliceous and calcareous proglacial area, CATENA, 182, 104154, https://doi.org/10.1016/j.catena.2019.104154, 2019. a, b, c, d, e, f, g
Musso, A., Ketterer, M. E., Greinwald, K., Geitner, C., and Egli, M.: Rapid decrease of soil erosion rates with soil formation and vegetation development in periglacial areas, Earth Surf. Proc. Land., 45, 2824–2839, https://doi.org/10.1002/esp.4932, 2020. a, b, c
Peters, A. and Durner, W.: Simplified evaporation method for determining soil hydraulic properties, J. Hydrol. 356, 147–162, https://doi.org/10.1016/j.jhydrol.2008.04.016, 2008. a, b
Phillips, J. D.: The robustness of chronosequences, Ecol. Model., 298, 16–23, https://doi.org/10.1016/j.ecolmodel.2013.12.018, 2015. a
Reynolds, D., Bowman, B., Drury, C., Tan, C., and Lu, X.: Indicators of good soil physical quality: Density and storage parameters, Geoderma, 110, 131–146, https://doi.org/10.1016/S0016-7061(02)00228-8, 2002. a
Schaap, M. G., Leij, F. J., and van Genuchten, M. T.: rosetta: a computer program for estimating soil hydraulic parameters with hierarchical pedotransfer functions, J. Hydrol., 251, 163–176, https://doi.org/10.1016/S0022-1694(01)00466-8, 2001. a
Schimmelpfennig, I., Schaefer, J. M., Akçar, N., Koffman, T., Ivy-Ochs, S., Schwartz, R., Finkel, R. C., Zimmerman, S., and Schlüchter, C.: A chronology of Holocene and Little Ice Age glacier culminations of the Steingletscher, Central Alps, Switzerland, based on high-sensitivity beryllium-10 moraine dating, Earth Planet. Sc. Lett., 393, 220–230, https://doi.org/10.1016/j.epsl.2014.02.046, 2014. a, b
Schindler, U.: Ein Schnellverfahren zur Messung der Wasserleitfähigkeit im teilgesättigten Boden an Stechzylinderproben, Arch. Acker- Pfl. Boden., Berlin, 24, 1–7, ISSN 0365-0340, 1980. a, b
Schindler, U. and Müller, L.: Simplifying the evaporation method for quantifying soil hydraulic properties, J. Plant Nutr. Soil Sc., 169, 623–629, https://doi.org/10.1002/jpln.200521895, 2006. a
Schweizerische Eidgenossenschaft: Klimanormwerte Grimsel Hospiz Normperiode 1981–2010, available at: http://www.meteoschweiz.admin.ch/product/output/climate-data/climate-diagrams-normal-values-station-processing/GRH/climsheet_GRH_np8110_d.pdf (last access: 17 June 2020), Bundesamt für Meteorologie und Klimatologie MeteoSchweiz, 2016. a
Schwen, A., Zimmermann, M., and Bodner, G.: Vertical variations of soil hydraulic properties within two soil profiles and its relevance for soil water simulations, J. Hydrol., 516, 169–181, https://doi.org/10.1016/j.jhydrol.2014.01.042, 2014. a
van der Meij, W., Temme, A., Lin, H., Gerke, H., and Sommer, M.: On the role of hydrologic processes in soil and landscape evolution modeling: concepts, complications and partial solutions, Earth-Sci. Rev., 185, 1088–1106, https://doi.org/10.1016/j.earscirev.2018.09.001, 2018. a, b, c
Vereecken, H., Weynants, M., Javaux, M., Pachepsky, Y., Schaap, M. G., and van Genuchten, M. Th.: Using Pedotransfer Functions to Estimate the van Genuchten–Mualem Soil Hydraulic Properties: A Review, Vadose Zone J., 9, 795–820, https://doi.org/10.2136/vzj2010.0045, 2010. a
Vilmundardóttir, O. K., Gísladóttir, G., and Lal, R.: Early stage development of selected soil properties along the proglacial moraines of Skaftafellsjökull glacier, SE-Iceland, CATENA, 121, 142–150, https://doi.org/10.1016/j.catena.2014.04.020, 2014. a, b, c, d
Wang, T., Zlotnik, V. A., Šimunek, J., and Schaap, M. G.: Using pedotransfer functions in vadose zone models for estimating groundwater recharge in semiarid regions, Water Resour. Res., 45, W04412, https://doi.org/10.1029/2008WR006903, 2009. a
Yoshida, T. and Troch, P. A.: Coevolution of volcanic catchments in Japan, Hydrol. Earth Syst. Sci., 20, 1133–1150, https://doi.org/10.5194/hess-20-1133-2016, 2016. a
- Abstract
- Introduction
- Material and methods
- Data set of soil physical properties and their change through the millennia
- Data set of soil hydraulic properties and their change through the millennia
- Data quality and uncertainties
- Data availability
- Summary
- Author contributions
- Competing interests
- Special issue statement
- Acknowledgements
- Financial support
- Review statement
- References