the Creative Commons Attribution 4.0 License.
the Creative Commons Attribution 4.0 License.
 | 25 Nov 2020
A homogenized daily in situ PM2.5 concentration dataset from the national air quality monitoring network in China
Kaixu Bai
Ke Li
Chengbo Wu
Ni-Bin Chang
In situ PM2.5 concentration observations have long been used as critical data sources in haze-related studies. Due to the frequently occurring haze pollution events, China started to regularly monitor PM2.5 concentration nationwide from the newly established air quality monitoring network in 2013. Nevertheless, the acquisition of these invaluable air quality samples is challenging given the absence of a publicly available data download interface. In this study, we provided a homogenized in situ PM2.5 concentration dataset that was created on the basis of hourly PM2.5 data retrieved from the China National Environmental Monitoring Center (CNEMC) via a web crawler between 2015 and 2019. Methods involving missing value imputation, change point detection, and bias adjustment were applied sequentially to deal with data gaps and inhomogeneities in raw PM2.5 observations. After excluding records with limited samples, a homogenized PM2.5 concentration dataset comprising of 1309 5-year long PM2.5 data series at a daily resolution was eventually compiled. This is the first attempt to homogenize in situ PM2.5 observations in China. The trend estimations derived from the homogenized dataset indicate a spatially homogeneous decreasing tendency of PM2.5 across China at a mean rate of about −7.6 % per year from 2015 to 2019. In contrast to raw PM2.5 observations, the homogenized data record not only has complete data integrity but is more consistent over space and time. This homogenized daily in situ PM2.5 concentration dataset is publicly accessible at https://doi.org/10.1594/PANGAEA.917557 (Bai et al., 2020a) and can be applied as a promising dataset for PM2.5-related studies such as satellite-based PM2.5 mapping, human exposure risk assessment, and air quality management.
- Article
(8213 KB) - Full-text XML
-
Supplement
(1070 KB) - BibTeX
- EndNote


A consistent PM2.5 concentration dataset is vital to the analysis of variations in PM2.5 loadings over space and time as well as in support of its risk analysis for air quality management, meteorological forecasting, and health-related exposure assessment (Lelieveld et al., 2015; Yin et al., 2020). Ground-based monitoring networks are commonly built to measure concentrations of air pollutants across the globe. Suffering from extensive and severe haze pollution events in the past few years (Guo et al., 2014; Ding et al., 2016; Wang et al., 2016; Cai et al., 2017; Huang et al., 2018; Luan et al., 2018; Ning et al., 2018), China launched the operational ambient air quality sampling late in 2012 on the basis of the sparsely distributed aerosol observation network. To date, this in situ network has been enlarged to cover almost all major cities in China consisting of about 1500 monitoring stations. Concentrations of six key air pollutants including PM2.5, PM10, NO2, SO2, CO, and O3 are routinely measured on an hourly basis while the sampled data are released publicly online by the China National Environmental Monitoring Center (CNEMC) since 2013.
Although in situ PM2.5 concentration data have played critical roles in improving our understanding of regional air quality variations and relevant influential factors (D. Yang et al., 2018; Q. Yang et al., 2019; Zheng et al., 2017), little concern was raised about the quality of such dataset itself (Bai et al., 2019a, c; He and Huang, 2018; Zhang et al., 2019, 2018; Zou et al., 2016). Meanwhile, few studies provided a detailed description of the accuracy or bias level (uncertainty) of the observed PM2.5 data in recent years (Xin et al., 2015; You et al., 2016; Guo et al., 2017; Shen et al., 2018). The primary reason lies in the fact that neither quality assurance flags nor metadata information documenting the uncertainty other than data values were provided, making such quality assessment infeasible.
The data quality, in particular the data homogeneity, is of critical importance to the exploration of the given dataset, especially for trend analysis (Bai et al., 2019c; C. Lin et al., 2018; Liu et al., 2018; Ma et al., 2015) and data integration (Bai et al., 2019a, b; T. Li et al., 2017; Zhang et al., 2019) in which a homogeneous dataset is absolutely essential for downstream applications. Since two distinct kinds of instruments are used in the current air quality monitoring network to measure near-surface PM2.5 concentration in China (Bai et al., 2020b), imperfect instrumental calibration and intermittent replacement of instruments may thus introduce the obvious issue of discontinuity in PM2.5 observations. Such inhomogeneity may result in large uncertainty and even biased results in the subsequent analysis, especially in context-based and data-driven PM2.5 concentration mapping (Bai et al., 2019b, a; He and Huang, 2018; Wei et al., 2020), in which in situ PM2.5 concentration observations are used as the ground truth to characterize complex statistical relationships with other possible contributing factors.
Given the absence of an open-access and quality-assured in situ PM2.5 concentration dataset in China, in this study, we attempted to generate a long-term coherent in situ PM2.5 concentration dataset for scientific community to use in future applications. A set of methods involving missing value imputation, change point detection, and bias adjustment were geared up seamlessly in a big data analytic manner toward the improvement of data integrity and the removal of possible discontinuities in raw PM2.5 observations. Such an analytical process is also referred to as data homogenization in data science or big data analytics (Cao and Yan, 2012; Wang et al., 2007). To our knowledge, this is the first attempt to homogenize a large-scale dataset of in situ PM2.5 concentration observations in China. In the following sections, we will introduce the data source as well as detailed big data analytics methods used for the creation of a homogenized PM2.5 concentration dataset.
In this study, the hourly PM2.5 concentration data sampled from more than 1600 state-controlled air quality monitoring stations across China between 1 January 2015 and 31 December 2019 were utilized. These PM2.5 concentration data were measured on an hourly basis using either beta-attenuation monitors or a tapered element oscillating microbalance (TEOM) analyzer. The ordinary instrumental calibration and quality control were performed according to the national ambient air quality standard of GB3095-2012 and HJ 618–2011 (Guo et al., 2009, 2017). Generally, TEOM can measure PM2.5 concentration within the range of 0–5000 µg m−3 at a resolution of 0.1 µg m−3, with precision of ±0.5 µg m−3 for the 24 h average and ±1.5 µg m−3 for the hourly average (Guo et al., 2017; Xin et al., 2012; Xin et al., 2015). The PM2.5 measurements were publicly released online by the China National Environmental Monitoring Center (CNEMC) via the National Urban Air Quality Real-time Publishing Platform (http://106.37.208.233:20035/, last access: 10 November 2020) within 1 h after the direct sampling.
Although the sampled data were publicly released, the acquisition of these valuable samplings is always challenging because no data download interface is provided to the public by the CNEMC website. Therefore, it is impossible for users to retrieve the historical observations from the given website. Rather, the science community has to count on other measures such as an automatic web crawler for the retrieval of these online updated data samples from the data publishing platform. Nevertheless, the data records retrieved through such an approach suffered from significant data losses due to various unexpected reasons like power outage and internet interruption. Consequently, the data integrity becomes problematic and further treatments like gap filling are thus required to account for such defects.
Moreover, hourly PM2.5 concentration observations that were sampled at five embassies of the United States in China from January 2015 to June 2017 were used as an independent dataset to evaluate the fidelity of the homogenized PM2.5 concentration dataset. Geographic locations of these five embassies are shown in Table S1 in the Supplement. These PM2.5 data were measured independently under the US Department of State Air Quality Monitoring Program and can be acquired from http://www.stateair.net/ (last access: 10 November 2020). To be in line with the homogenized dataset, the hourly PM2.5 concentration data were aggregated to the daily level by averaging the 24 h observations sampled on each date while daily averages were calculated only for days with more than 12 valid samples of a possible 24 h.
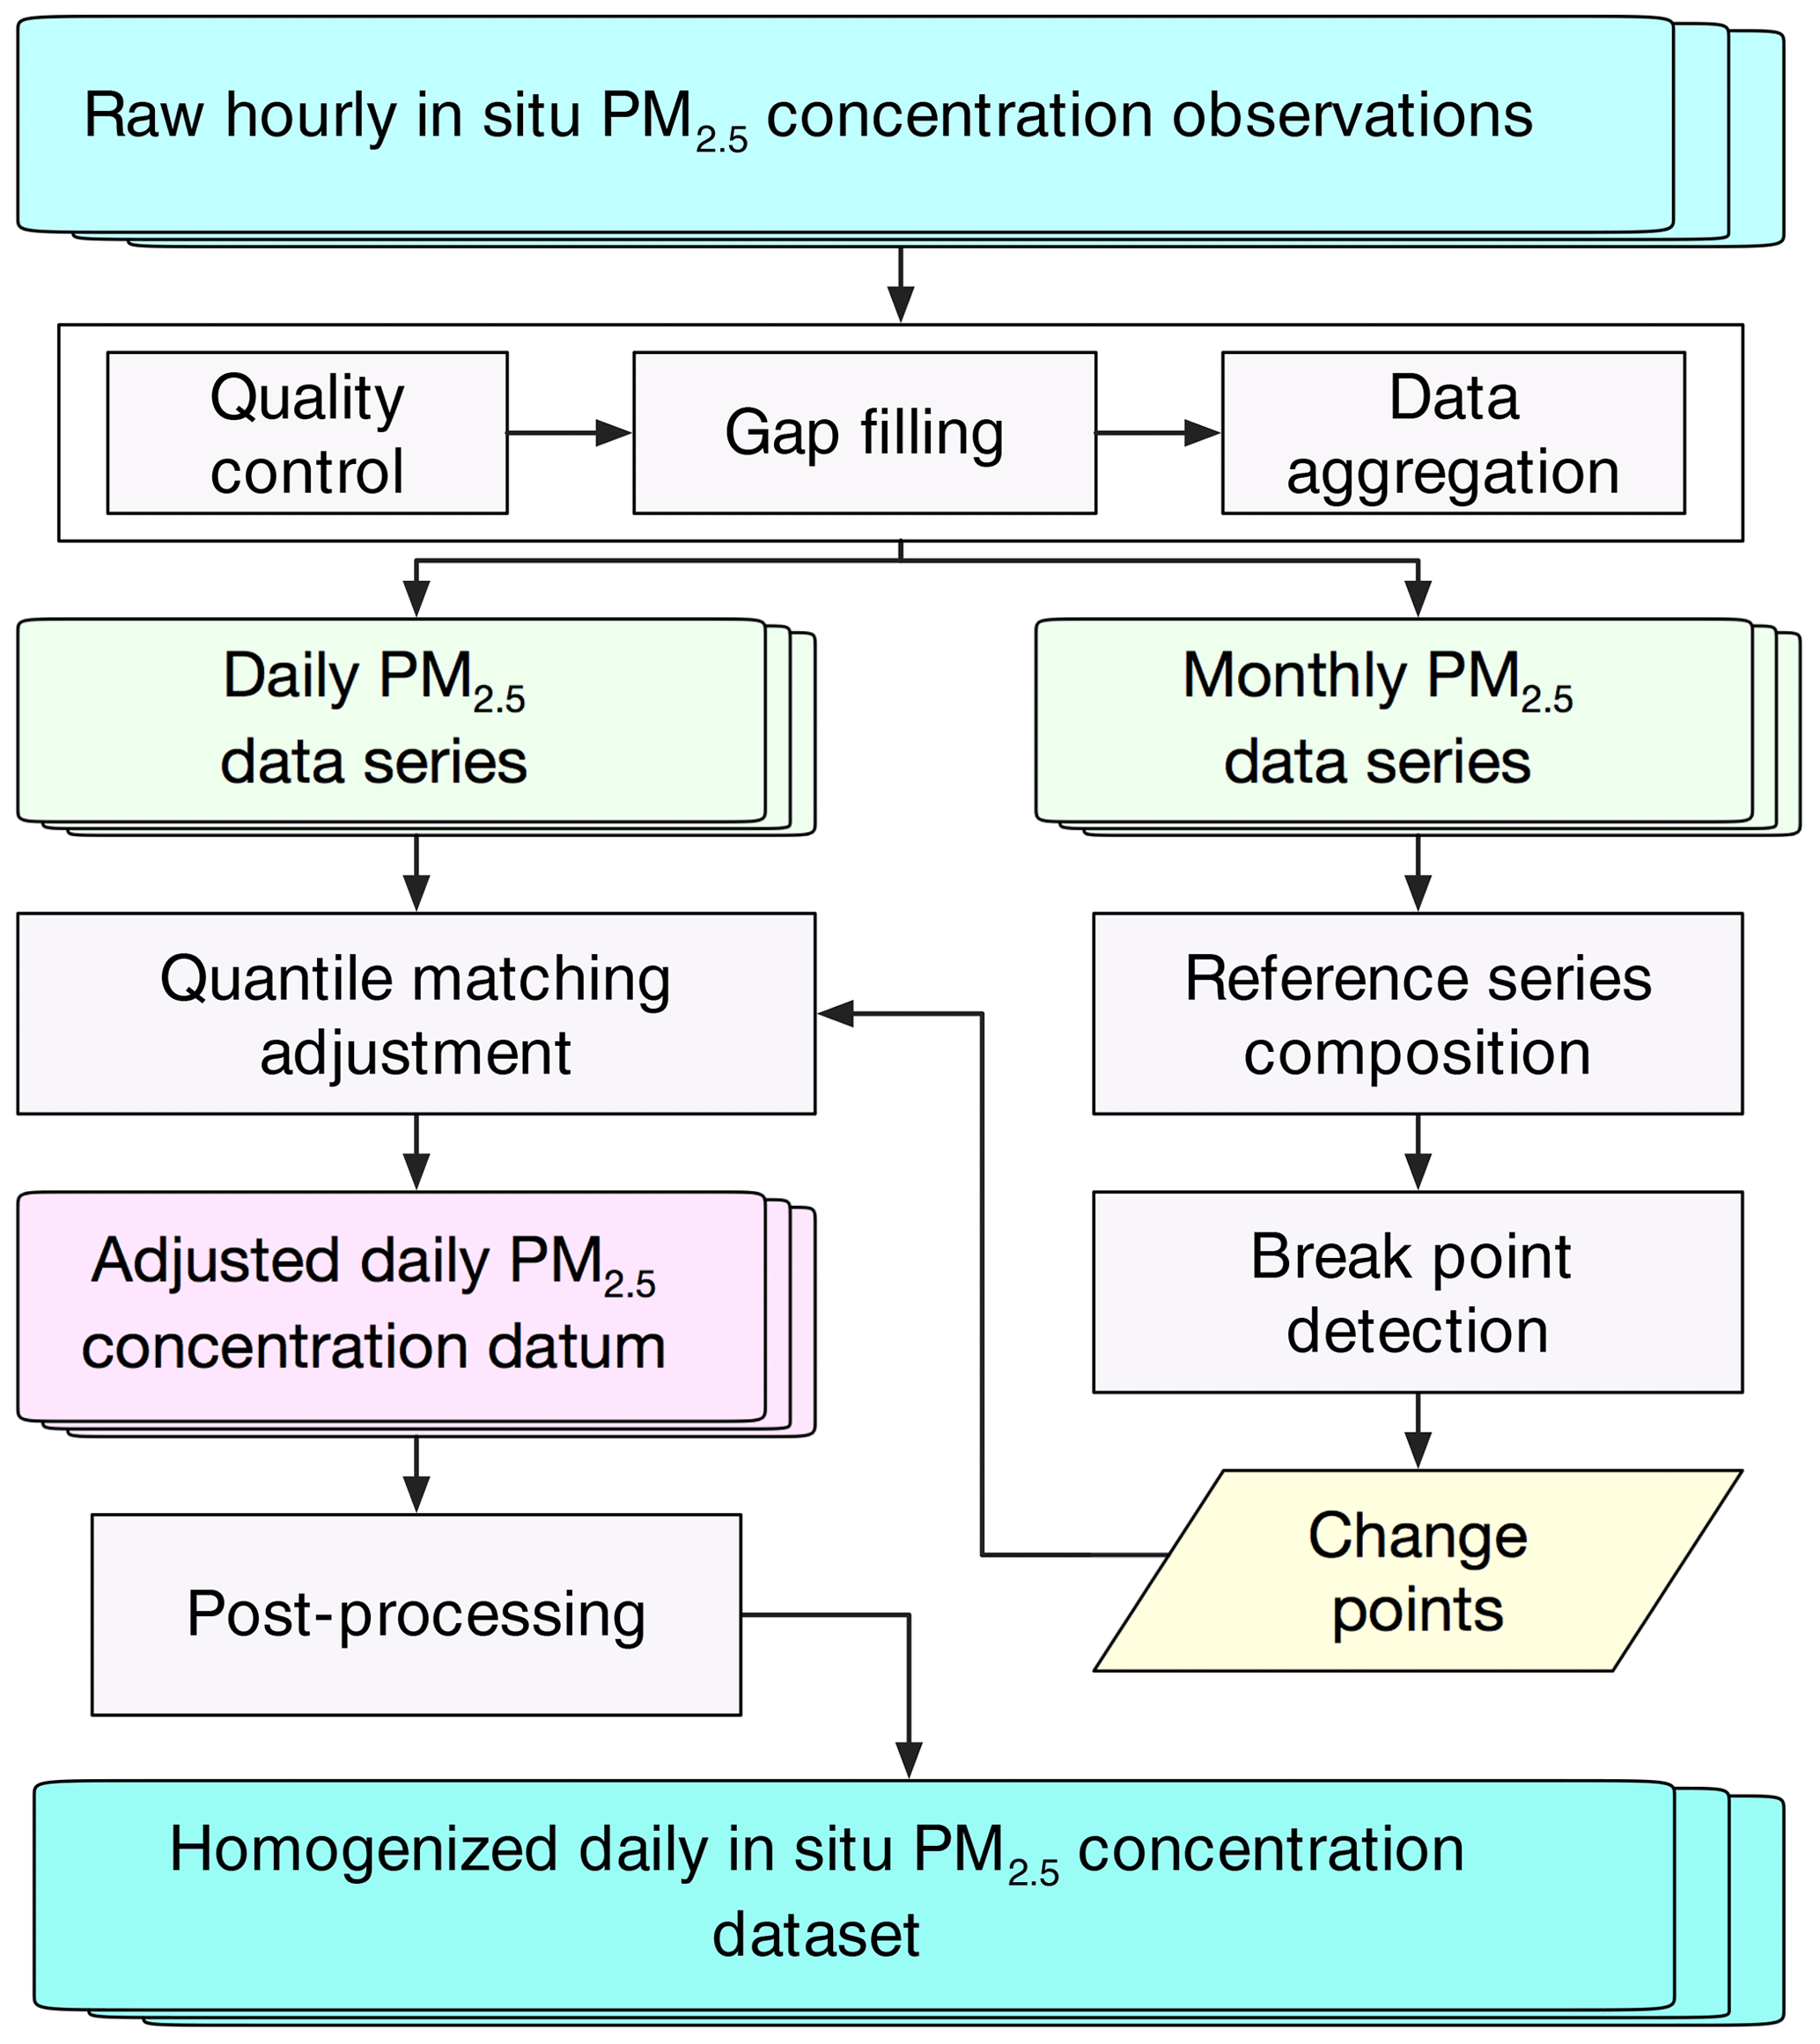
Figure 1A schematic flowchart for the creation of a homogenized daily in situ PM2.5 concentration dataset.
For the creation of a long-term coherent in situ PM2.5 concentration dataset, it is necessary to create an analytical framework of the big data analytics which seamlessly gears up several methods as a whole for the purposes of missing value imputation, change point detection, and discontinuity adjustment, given the presence of data gaps and possible discontinuity in raw PM2.5 observations. Figure 1 shows a schematic illustration of the general workflow toward generating a homogenized PM2.5 concentration dataset, and the whole process can be outlined as follows.
-
It is necessary to perform essential quality control and gap filling on raw PM2.5 observations so that the bias arising from large outliers and resampling errors due to incomplete observations can be reduced.
-
Short-term time series due to site relocation were temporally merged to attain a long-term record. Then, PM2.5 concentration time series with a temporal coverage of less than 4 years during the study period were excluded. Subsequently, the quality-controlled observations of hourly in situ PM2.5 concentrations were resampled to daily and monthly scales to initiate the homogeneity test.
-
Reference time series were constructed for each long-term PM2.5 concentration record on the basis of data measured from adjacent monitoring sites. For PM2.5 concentration records failing to produce a reliable reference series, no homogeneity test was performed for such data due to the absence of essential reference data series.
-
The discontinuity identified in each daily long-term PM2.5 concentration time series were corrected using the quantile-matching (QM) adjustment method according to the change points detected in each monthly data record with the support of reference series.
-
Post-processing measures such as nonpositive value correction and another round of gap filling were further performed on the homogenized records to attain a quality-assured in situ PM2.5 concentration dataset. More details of each analytic method are described in the following subsections.
3.1 Quality control
Given the possibility of the presence of abnormal samplings, it is necessary to remove the outliers detected in raw PM2.5 observations to reduce the false alarm rate in change point detection during the subsequent homogeneity test. Specifically, hourly PM2.5 concentration data values meeting one of the following criteria were excluded: (1) out of the range between 1 and 1000 µg m−3 and (2) more than 3 standard deviations from the median of observations within a 15 h time window. Both criteria aimed to remove large outliers which could result in biased daily averages. Overall, 3.46 % of PM2.5 samples were treated as outliers and were then excluded accordingly (treated as missing values).
3.2 Gap filling and resampling
As indicated in our recent study (Bai et al., 2020b), missing-value-related data gaps become a big obstacle in the exploitation of raw PM2.5 observations that were retrieved from the CNEMC website, as PM2.5 observations on 40 % of sampling days suffered from data losses due to unexpected reasons. To reduce the impact of missing-value-related sampling (from hourly to daily) bias on the subsequent homogeneity test, we filled those missing-value-related data gaps that were found in each 24 h PM2.5 observation using our recently developed diurnal cycle constrained empirical orthogonal function (DCCEOF) method (Bai et al., 2020b). Such a gap filling effort enabled us to improve the percentage of days without missing data during the study time period from 58.8 % to 97.3 %.
In spite of the improvement of data integrity after gap filling, the resultant PM2.5 time series remain temporally discontinuous due to the emergence of several long-lasting (e.g., more than 24 consecutive hours) missing-data episodes. Also, the hourly time series are still too noisy to be handled by the current homogeneity test software due to the significant variation in PM2.5 concentration over space and time. In such a context, the hourly PM2.5 concentration records were aggregated to daily and monthly scales to initiate the homogeneity test. Moreover, the monthly series was primarily used to detect the possible change points while the daily series was adjusted in reference to the corresponding reference series according to the change points detected from the monthly series. To avoid a large resampling bias, monthly averages were calculated only for those with at least 20 valid daily means of a possible month at each site. The frequency of missing values in each month was also calculated as possible metadata information to support the examination of the detected change points.
3.3 Homogeneity test
A commonly used homogeneity test software, the RHtestsV4 package, was hereby applied to detect the possible discontinuities in raw PM2.5 data series that were retrieved from the CNEMC website. As suggested in Wang and Feng (2013), RHtestsV4 is capable of detecting and adjusting change points in a data series with first-order autoregressive errors. Given the low false alarm rate in change point detection and the capability to adjust discontinuity, the RHtests software packages have been widely used to homogenize climate data records such as temperature (Cao et al., 2013; Xu et al., 2013; Zhao et al., 2014), precipitation (Wang et al., 2010a; Nie et al., 2019), and other data like boundary layer height (Wang and Wang, 2016). Two typical methods, namely the PMTred and PMFred, were embedded in a recursive testing algorithm in RHtestsV4, with the former relying on the penalized maximal t test (PMT) while the latter based on the penalized maximal F test (PMF) (Wang et al., 2007; Wang, 2008a). With the incorporation of these empirical penalty functions (Wang, 2008a, b), the problem of the uneven distribution of the false alarm rate is largely alleviated in RHtestsV4. In contrast to the PMF, which works without a reference series, the PMT uses a reference series to detect change points, and the results are thus far more reliable (Wang, 2008a, b). The way to generate reference series will be described in the next subsection. Also, the RHtestsV4 is capable of making essential adjustments to the detected discontinuities by taking advantage of the QM adjustment method (Wang and Feng, 2013).
Here the PMT method rather than the PMF was used to detect change points given the higher confidence of the former method in change point detection due to the involvement of reference series (Wang and Feng, 2013). To ensure the reliability of detected discontinuities, the change point was defined and confirmed at a nominal 99 % confidence level, and the data records were then declared to be homogeneous once no change point was identified. Subsequently, the QM adjustment method was applied to correct PM2.5 observations with evident drifts with the support of reference series, namely, to homogenize PM2.5 concentration data series. To avoid large sampling uncertainty in the estimate of QM adjustments, the Mq (i.e., the number of categories on which the empirical cumulative distribution function is estimated) was automatically determined by the software to ensure adequate samples for the estimation of mean difference and probability density function. Meanwhile, the number to determine the base segment (i.e., Iadj) was set to zero so that data in other segments were all adjusted to the segment with the longest temporal coverage.
3.3.1 Construction of reference series
A good reference series is vital to the relative homogeneity test because it helps pinpoint possible discontinuities in each base series (the data series to be tested) and determines the performance of the subsequent data adjustment. In general, reference series can be organized by using one specific record either measured from one adjacent station or aggregated from multiple observations (Cao and Yan, 2012; Peterson and Easterling, 1994; Xu et al., 2013; Wang et al., 2016). The most straightforward way is to use the neighboring data series either measured at the nearest station or series that are highly correlated with the base series (Peterson and Easterling, 1994; Cao and Yan, 2012; Wang and Feng, 2013). Such methods, however, fail to take the representativeness of the neighboring series into account since the neighboring series may also suffer from discontinuities.
To avoid the misuse of inhomogeneous PM2.5 concentration records as reference series, a complex yet robust data integration scheme was hereby developed to screen, organize, and construct reference series for each in situ PM2.5 concentration data series. For each daily PM2.5 concentration data series, all the neighboring series were first identified from their surroundings with a lag distance as large as of 50 km. No reference series was constructed once there was no neighboring series available within the given radius, and in turn the homogeneity of the given record was not examined. Otherwise, both correlation coefficient (R) and coefficient of variation (CV) were calculated between the given base series and each selected neighboring series to assess their representativeness (Shi et al., 2018; Rodriguez et al., 2019). Then, neighboring series with R greater than 0.8 and CV smaller then 0.2 were selected as candidates to construct the reference series for a given base series.
The reference series was then constructed by averaging both the base and the candidate series at each observation time if there was only one candidate series. For the situation with more than one candidate series, the empirical orthogonal function (EOF) method was applied to these multiple candidates and then the original fields were reconstructed with the leading principal components when the accumulated variance explained by them exceeded 80 %. This was expected to reduce the possible impacts of abnormal observations and short-term discontinuities in the neighboring candidates on the resultant reference series. Subsequently, the reference series were organized and constructed through a spatial weighting scheme as each reconstructed record was assigned a spatially resolved weight according to their relative distances to the base series over space. Here we applied a Gaussian kernel function to estimate the weight of each neighboring observation that can influence the base series in space, and such a scheme has been proven to be effective in assessing the spatial autocorrelation of PM2.5 concentration (Bai et al., 2019b). Mathematically, the reference series can be constructed from the following equations:
where PMref and PMcand denote the reference and candidate series, respectively. N is the total number of candidate series while w is the spatially resolved weight assigned to each candidate series and d is the spatial lag distance between the base and the corresponding candidate series. h is a spatial correlation length that is used to modulate the relative influence of a distant observation on the data measured at the base site. In this study, an empirical value of 50 km was used according to the estimated semi-variogram results (Bai et al., 2019b).
For any record having neighboring series within 50 km but poorly correlated (R<0.8 or CV > 0.2) to all its neighbors (meaning the base series differ from the neighbors), the reference series were created by following the same procedures as those detailed above by taking the nearest neighbor as the base series. For the situation with only one candidate series available, it is logical to compare both the base and the candidate series against other data to check which one should be corrected. In this study, the PM2.5 time series estimated from the MERRA-2 aerosol reanalysis in the same way as described in He et al. (2019) was used. The one with higher correlation to this external PM2.5 time series was then used as the reference (deemed as homogeneous) while the other was considered as the base series (that needs to be adjusted). Such an inclusive scheme empowered us to screen and construct reference series for 1262 long-term PM2.5 concentration records across the board. In contrast, no reference series were constructed for 47 isolated records.
3.3.2 Post-processing measures
Several post-processing measures were applied to the adjusted data records to further improve the quality of this dataset. Since nonpositive values may appear in the QM adjusted data series if the original values are close to zero (Wang et al., 2010b), nonpositive values were replaced with the smallest valid PM2.5 concentration amount measured at each monitoring site during the study period. Subsequently, the data gaps in the adjusted data due to long-term missing values were filled by first calibrating the corresponding data values in the reference series measured on the same date (if available) to the homogenized datum level. The modified quantile–quantile adjustment (MQQA) method proposed in Bai et al. (2016) was hereby used given its adaptive data adjustment principle. For the predicted values, such a MQQA scheme rendered higher accuracy than those interpolated from data values measured on adjacent dates because PM2.5 concentration is spatially more correlated than in the temporal domain (Bai et al., 2019b). For the remaining data gaps, those missing values were reconstructed in a similar procedure to the DCCEOF method (Bai et al., 2020b). Note that the matrix used for EOF analysis in the context of DCCEOF was constructed using the neighboring data series measured within a radius of 100 km with a temporal lag of 30 d at most. Finally, all data values were rounded to integers to be in line with the original PM2.5 concentration observations.
4.1 Descriptive statistics
Prior to data homogenization, we first need to exclude those short-term and less reliable records. Figure 2 shows the temporal variations in the number of air quality monitoring stations deployed in China during 2015–2019 as well as the spatial patterns of the frequency of missing values for each long-term PM2.5 concentration record. It shows that a total of about 1630 air quality monitoring stations had been deployed in China before 2020. Nevertheless, about 1500 sites routinely providing PM2.5 observations were kept in operation since 2015 (Fig. 2a). By referring to the data continuity of PM2.5 observations, it is noticeable that 100 monitoring stations had been withdrawn before 2020 because no PM2.5 observations were provided for more than three consecutive months since the release of their last valid data (Fig. 2b). Meanwhile, 42 pairs of stations were found to be relocated since new stations nearby started to provide PM2.5 observations soon after the suspension of the original site. This is also corroborated by the temporal lags of PM2.5 observations between original and newly deployed stations, as many of them were found to have a time lag less than 15 d. Also, 94 sites were found to have limited data records due to short temporal coverage (newly deployed). Finally, 1353 long-term PM2.5 concentration records with their first valid data released earlier than 2015 were identified. In regard to the frequency of missing values, it is indicative that data gaps were obvious in these long-term PM2.5 concentration records, with about 6 % of hourly data values missed on ∼ 47 % of sampling days on average. This also motivates us to first fill such data gaps to improve the data integrity.
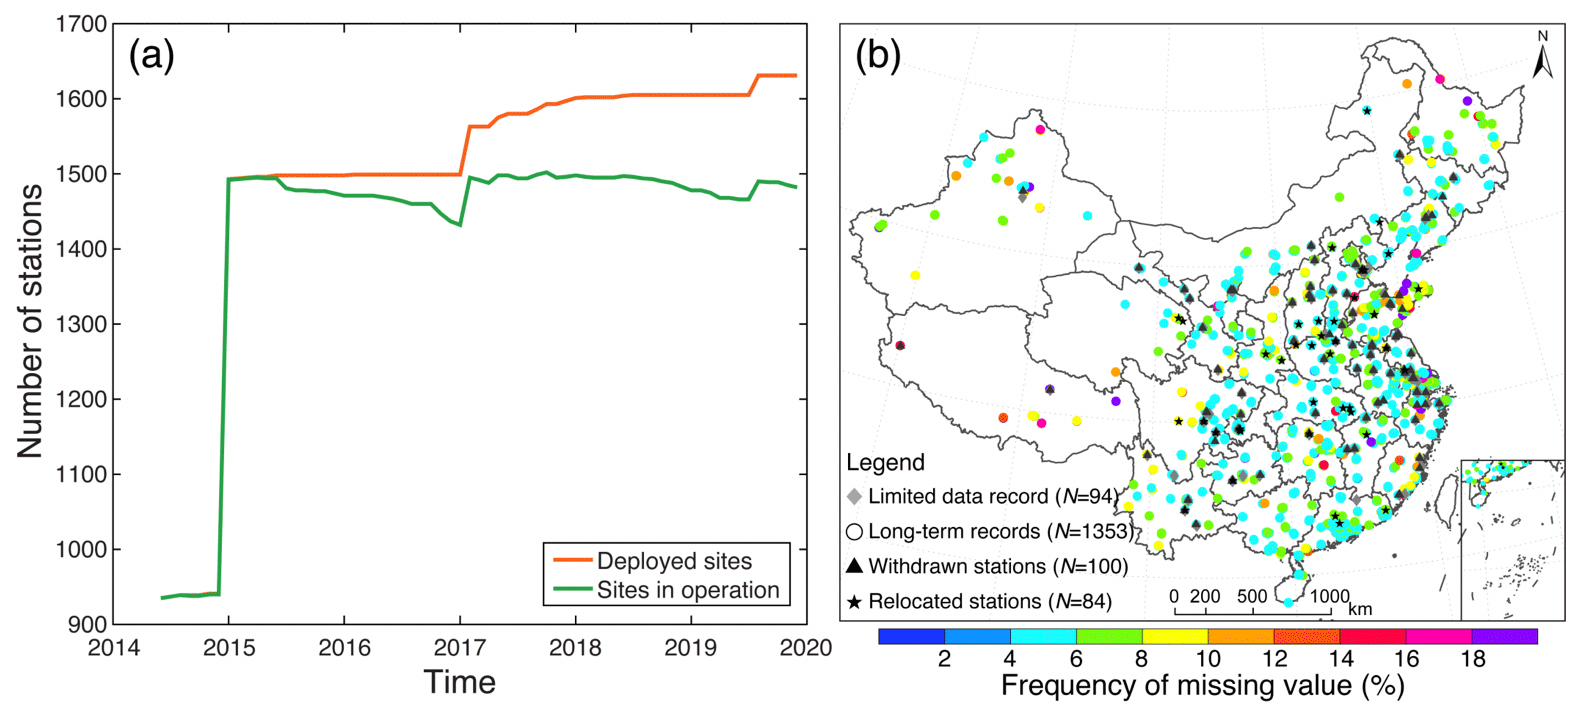
Figure 2Spatial and temporal patterns of air quality monitoring stations in the study area. (a) Temporal variations of the total number of air quality monitoring stations. (b) Spatial patterns of the frequency of missing values in each long-term hourly PM2.5 concentration record measured from 1 January 2015 to 31 December 2019. Stations were categorized into distinct groups according to their data length and temporal continuity. The frequency of missing values was calculated as the ratio of the number of missing values in each PM2.5 concentration record to the total number of samplings from the time of the release of the first valid data to 31 December 2019.
4.2 Homogenization of in situ PM2.5 data
A total of 1395 long-term (with 5-year observations) PM2.5 concentration records were acquired with the inclusion of 42 temporally merged data series at those relocated stations. After removing those suffering from more than three consecutive months of data losses, 1309 long-term yet consecutive PM2.5 concentration records were obtained. The homogeneity test was finally performed on 1262 records due to the availability of reference series. Figure 3 shows the spatial patterns of the total number of change points detected in 1262 monthly PM2.5 concentration records. The ubiquitous change points imply that there is an obvious inhomogeneity in this in situ PM2.5 concentration dataset. About 57 % (719 out of 1262) of the records failed to pass the homogeneity test due to the presence of change points. Given the overall good agreement between the base and reference series (refer to Fig. S1 for the correlation coefficient and root mean square error between them), it indicted that these PM2.5 concentration records did suffer from evident discontinuities. Meanwhile, the vast majority (∼ 80 %) of the inhomogeneous PM2.5 records suffered from no more than two change points (Fig. 3), suggesting the mean shift could be the primary reason for the detected discontinuities. Moreover, 20 records were even found to be suffering from no less than five significant change points, indicating phenomenal discontinuities in these records.
Figure 4 shows the temporal variability of the number of change points detected in monthly PM2.5 concentration records. As indicated, change points were detected in every specific month of the year from May 2015 to July 2019, especially in late spring (e.g., May), in which change points were more likely to be detected (Fig. 4b). This is attributable to the seasonality of PM2.5 loading in China as high PM2.5 concentrations are always observed in the winter whereas low values are observed in the summer. Consequently, change points were more likely to be detected during the chronic transition periods (e.g., spring to summer). In addition, it is noteworthy that a large volume of change points was detected in early 2015, indicating the existence of phenomenal discontinuities during this period (Fig. 4a). After checking the temporal variations in PM2.5 concentration, findings indicate that PM2.5 observations varied with large deviations among each other during this period. This could be linked to the imperfect instrument calibration or irregular operation in the early stages.
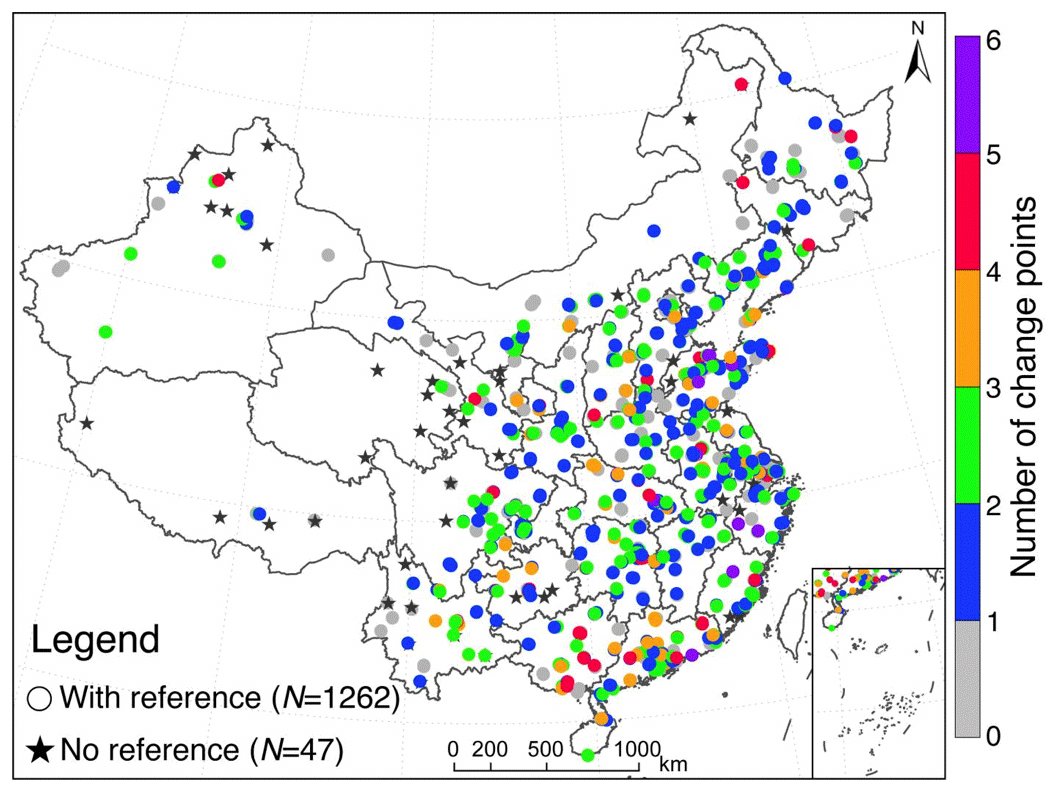
Figure 3Spatial patterns of the total number of change points detected in each long-term yet consecutive PM2.5 concentration record in the study area. Gray dot indicates there was no change point detected in this PM2.5 concentration record.
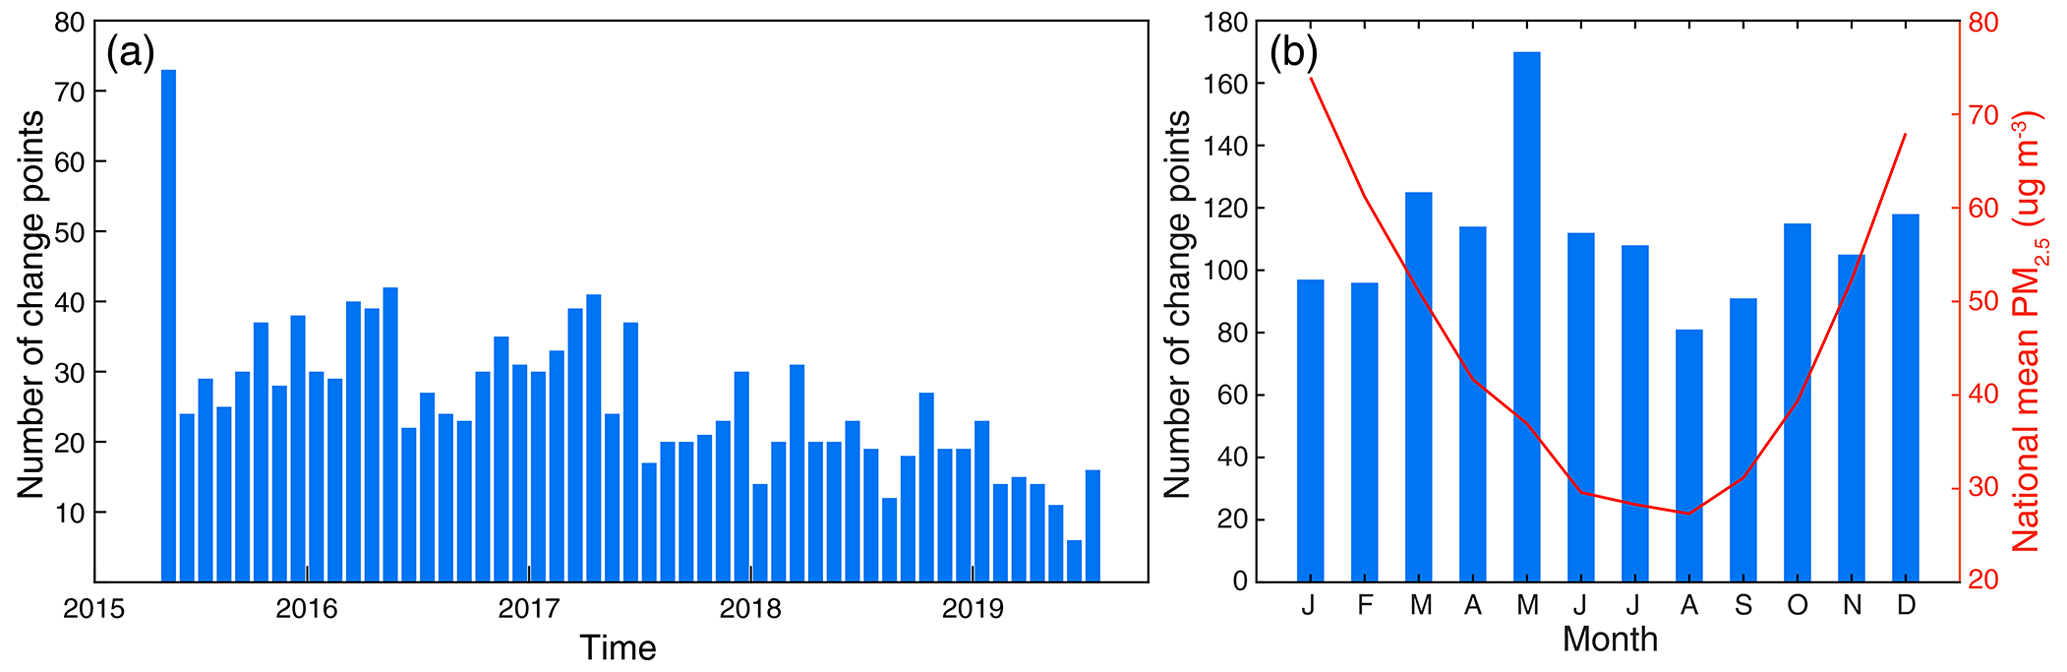
Figure 4Temporal variations of the number of change points detected in (a) each specific month from 2015 to 2019 and (b) each month of the year. National mean PM2.5 concentration in each month of the year was calculated based on PM2.5 data measured at our selected 1309 sites during 2015–2019.
Due to the lack of essential metadata information, it is a challenge for us to verify each detected change point through a manual inspection. Rather, the variations in the base and reference series were explored to identify the possible reasons for the detected discontinuities. Figure 5 presents three typical inhomogeneous PM2.5 time series with different numbers of change points. The inter-comparisons between the base and reference series indicate an overall good agreement among them in terms of the long-term variation tendency. However, drifts were still phenomenal in their residual series, which were even more evident when referring to their mean-shift series. For example, both the residual and mean-shift series shown in Fig. 5d clearly illustrate a typical discontinuity as there was an obvious departure of mean PM2.5 concentration level during the period of January to October 2016. In contrast, Fig. 5b and e present another typical inhomogeneity as a statistically significant decreasing trend was found in the residual series, with monthly PM2.5 concentration deviations decreasing from nearly 5 to −4 µg m−3 stepwise. Such inhomogeneity would undoubtedly result in a large bias in the trend estimations over that region. Figure 5c and f show the change points detected in the merged PM2.5 time series at a pair of relocated sites. It is noteworthy that the detected discontinuity should be largely ascribed to the inconsistency that emerged in the first data series rather than to the site relocation.
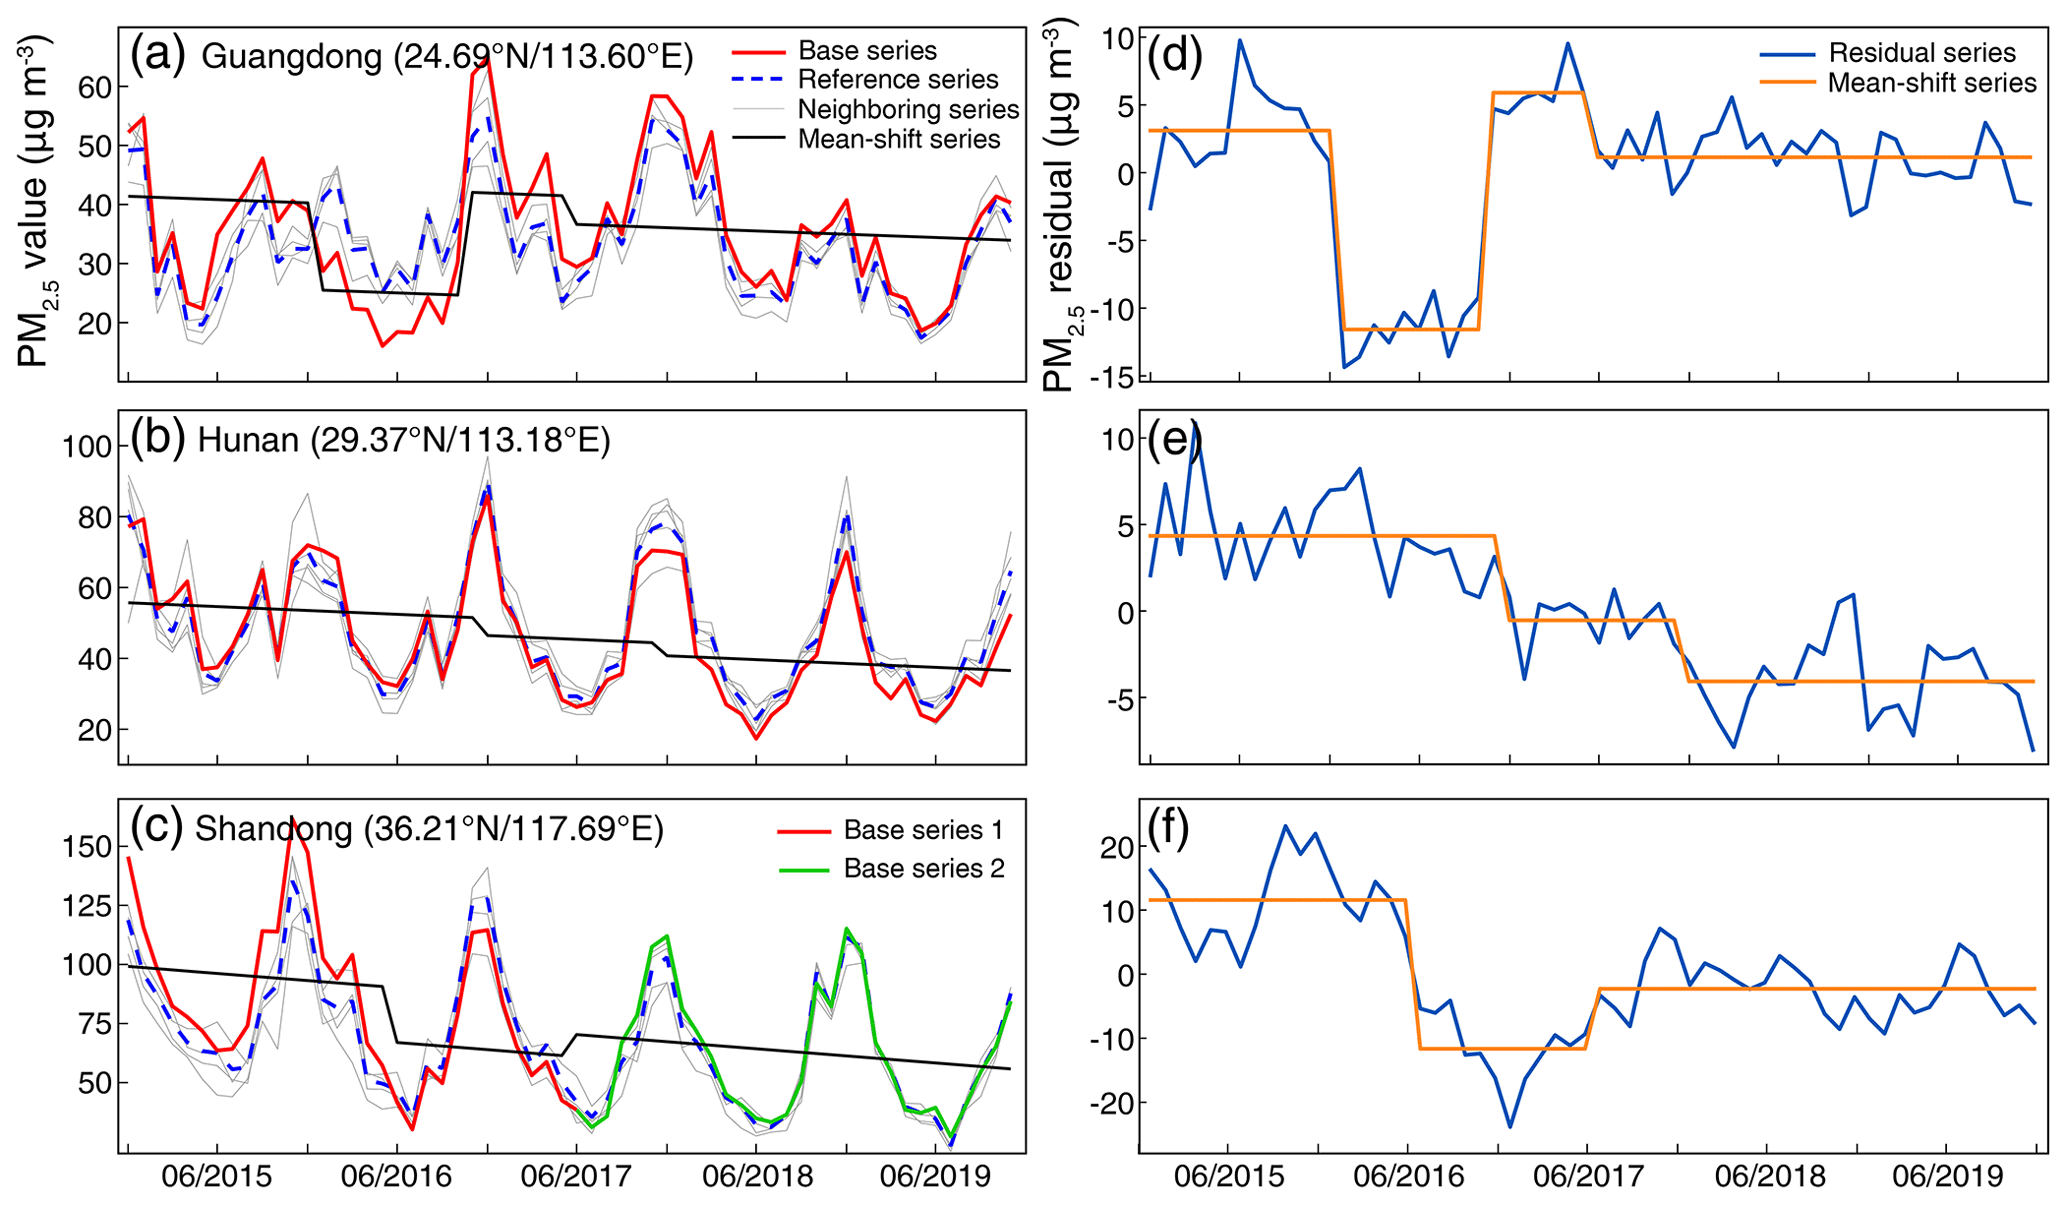
Figure 5Temporal variations of three typical inhomogeneous PM2.5 concentration records during 2015–2019. (a, d) Significant deviations during a short time period, (d, e) long-term chronic drifts with statistically significant varying trend detected in the residual series, (c, f) discontinuity due to site relocation. The left panels compare the base series with the reference and the neighboring series used to compose the reference while the right panels show the residual series between the base and reference series as well as their mean-shift series.
Figure 6 shows the estimated linear trends for PM2.5 residual series that failed to pass the homogeneity test. Approximately 89 % of the residual series were found to exhibit statistically significant linear trends, suggesting the vital importance of homogenizing such PM2.5 concentration records as the trend estimations at these stations could be prone to large bias without essential adjustments. Further comparisons of the percentage of data gaps between homogeneous and inhomogeneous records (Fig. S2) as well as the spatial distance between the base and the reference series (Fig. S3) indicate that both the frequency of data gaps and lag distance in space have no obvious impact on the change point detection. In other words, the detected change points have no linkage with neither missing value frequency nor spatial distance between the base and neighboring series, suggesting a high confidence level of the identified discontinuities in these PM2.5 concentration records.
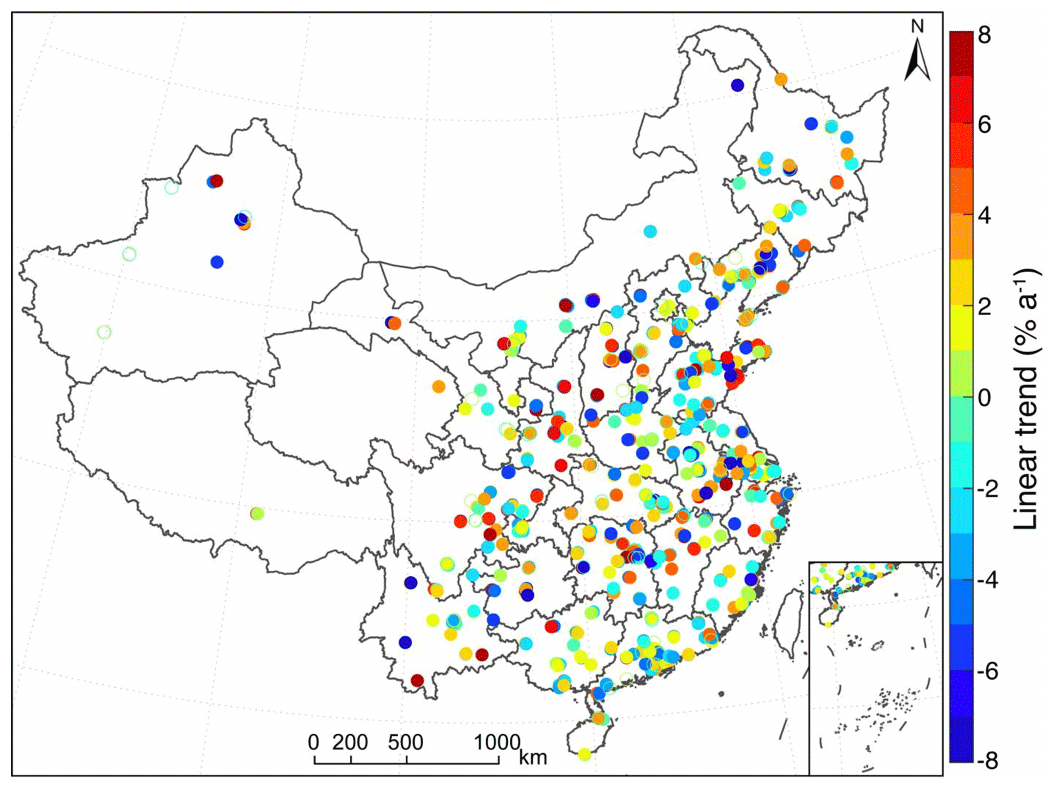
Figure 6Trend estimations for the residual PM2.5 concentration data series that failed to pass the homogeneity test during 2015–2019 in the study area. The solid circles indicate trends are statistically significant at the 95 % confidence level.
Given the emergence of obvious discontinuities in more than half of the selected long-term PM2.5 concentration records, the QM adjustment method was applied to correct the discontinuities detected in each PM2.5 concentration record. Figure 7 shows an example of homogenization on PM2.5 concentration data series that suffered from evident drifts from its reference (large drifts shown in Fig. 5d). The inter-comparisons of PM2.5 concentration data between the base and reference series indicate that the PM2.5 concentration level was obviously underestimated by the raw observations compared with the reference, especially during the middle of 2016 (Fig. 7a). Such evident drifts were remarkably diminished after the homogenization (Fig. 7b), which shows a good agreement of the mean PM2.5 concentration level between the homogenized datum and the reference series.
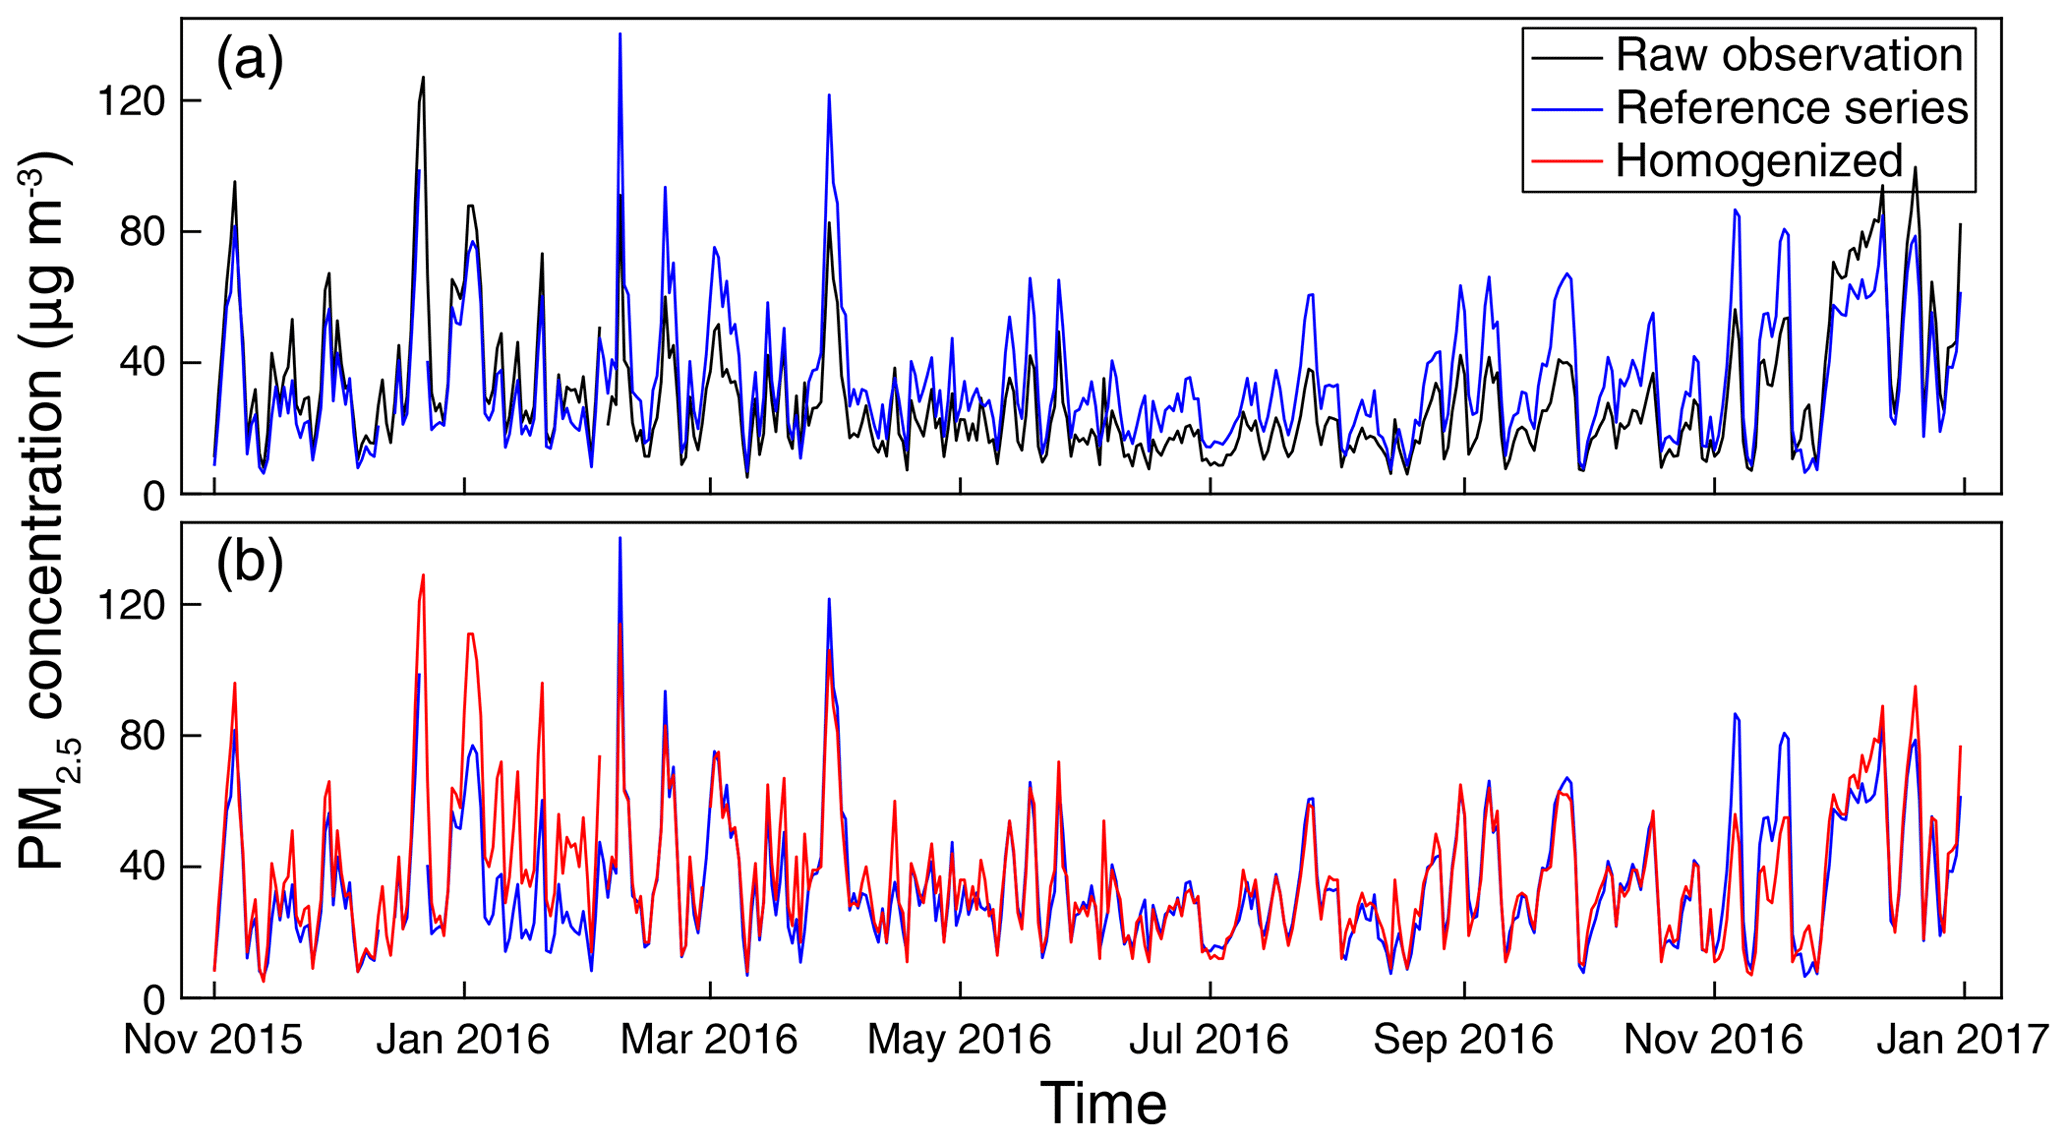
Figure 7Comparison of daily mean PM2.5 concentration before and after homogenization at one monitoring site in Guangdong province (24.69∘ N, 113.60∘ E) from November 2015 to December 2016 (large drifts shown in Fig. 5d).
4.3 Validation with independent dataset
In this study, PM2.5 observations that were collected independently at five consulates of the United States distributed throughout five major Chinese cities between 2015 and 2017 were used to evaluate the consistency of the derived PM2.5 concentration records. Figure 8 shows site-specific comparisons of daily PM2.5 concentration between homogenized and observed data in Beijing, Shanghai, Chengdu, Shenyang, and Guangzhou. It is indicative of the homogenized daily PM2.5 concentration data being in good agreement with PM2.5 observations sampled at US consulates, with a correlation coefficient value of > 0.95 and root mean square error of < 15 µg m−3. Given the independent measurement of PM2.5 concentration data at US consulates, we argue that the homogenized PM2.5 records are accurate enough in characterizing the variability of PM2.5 loadings in China. It is also noteworthy that the homogenized PM2.5 records are temporally complete whereas missing values are found in PM2.5 observations sampled at US consulates.
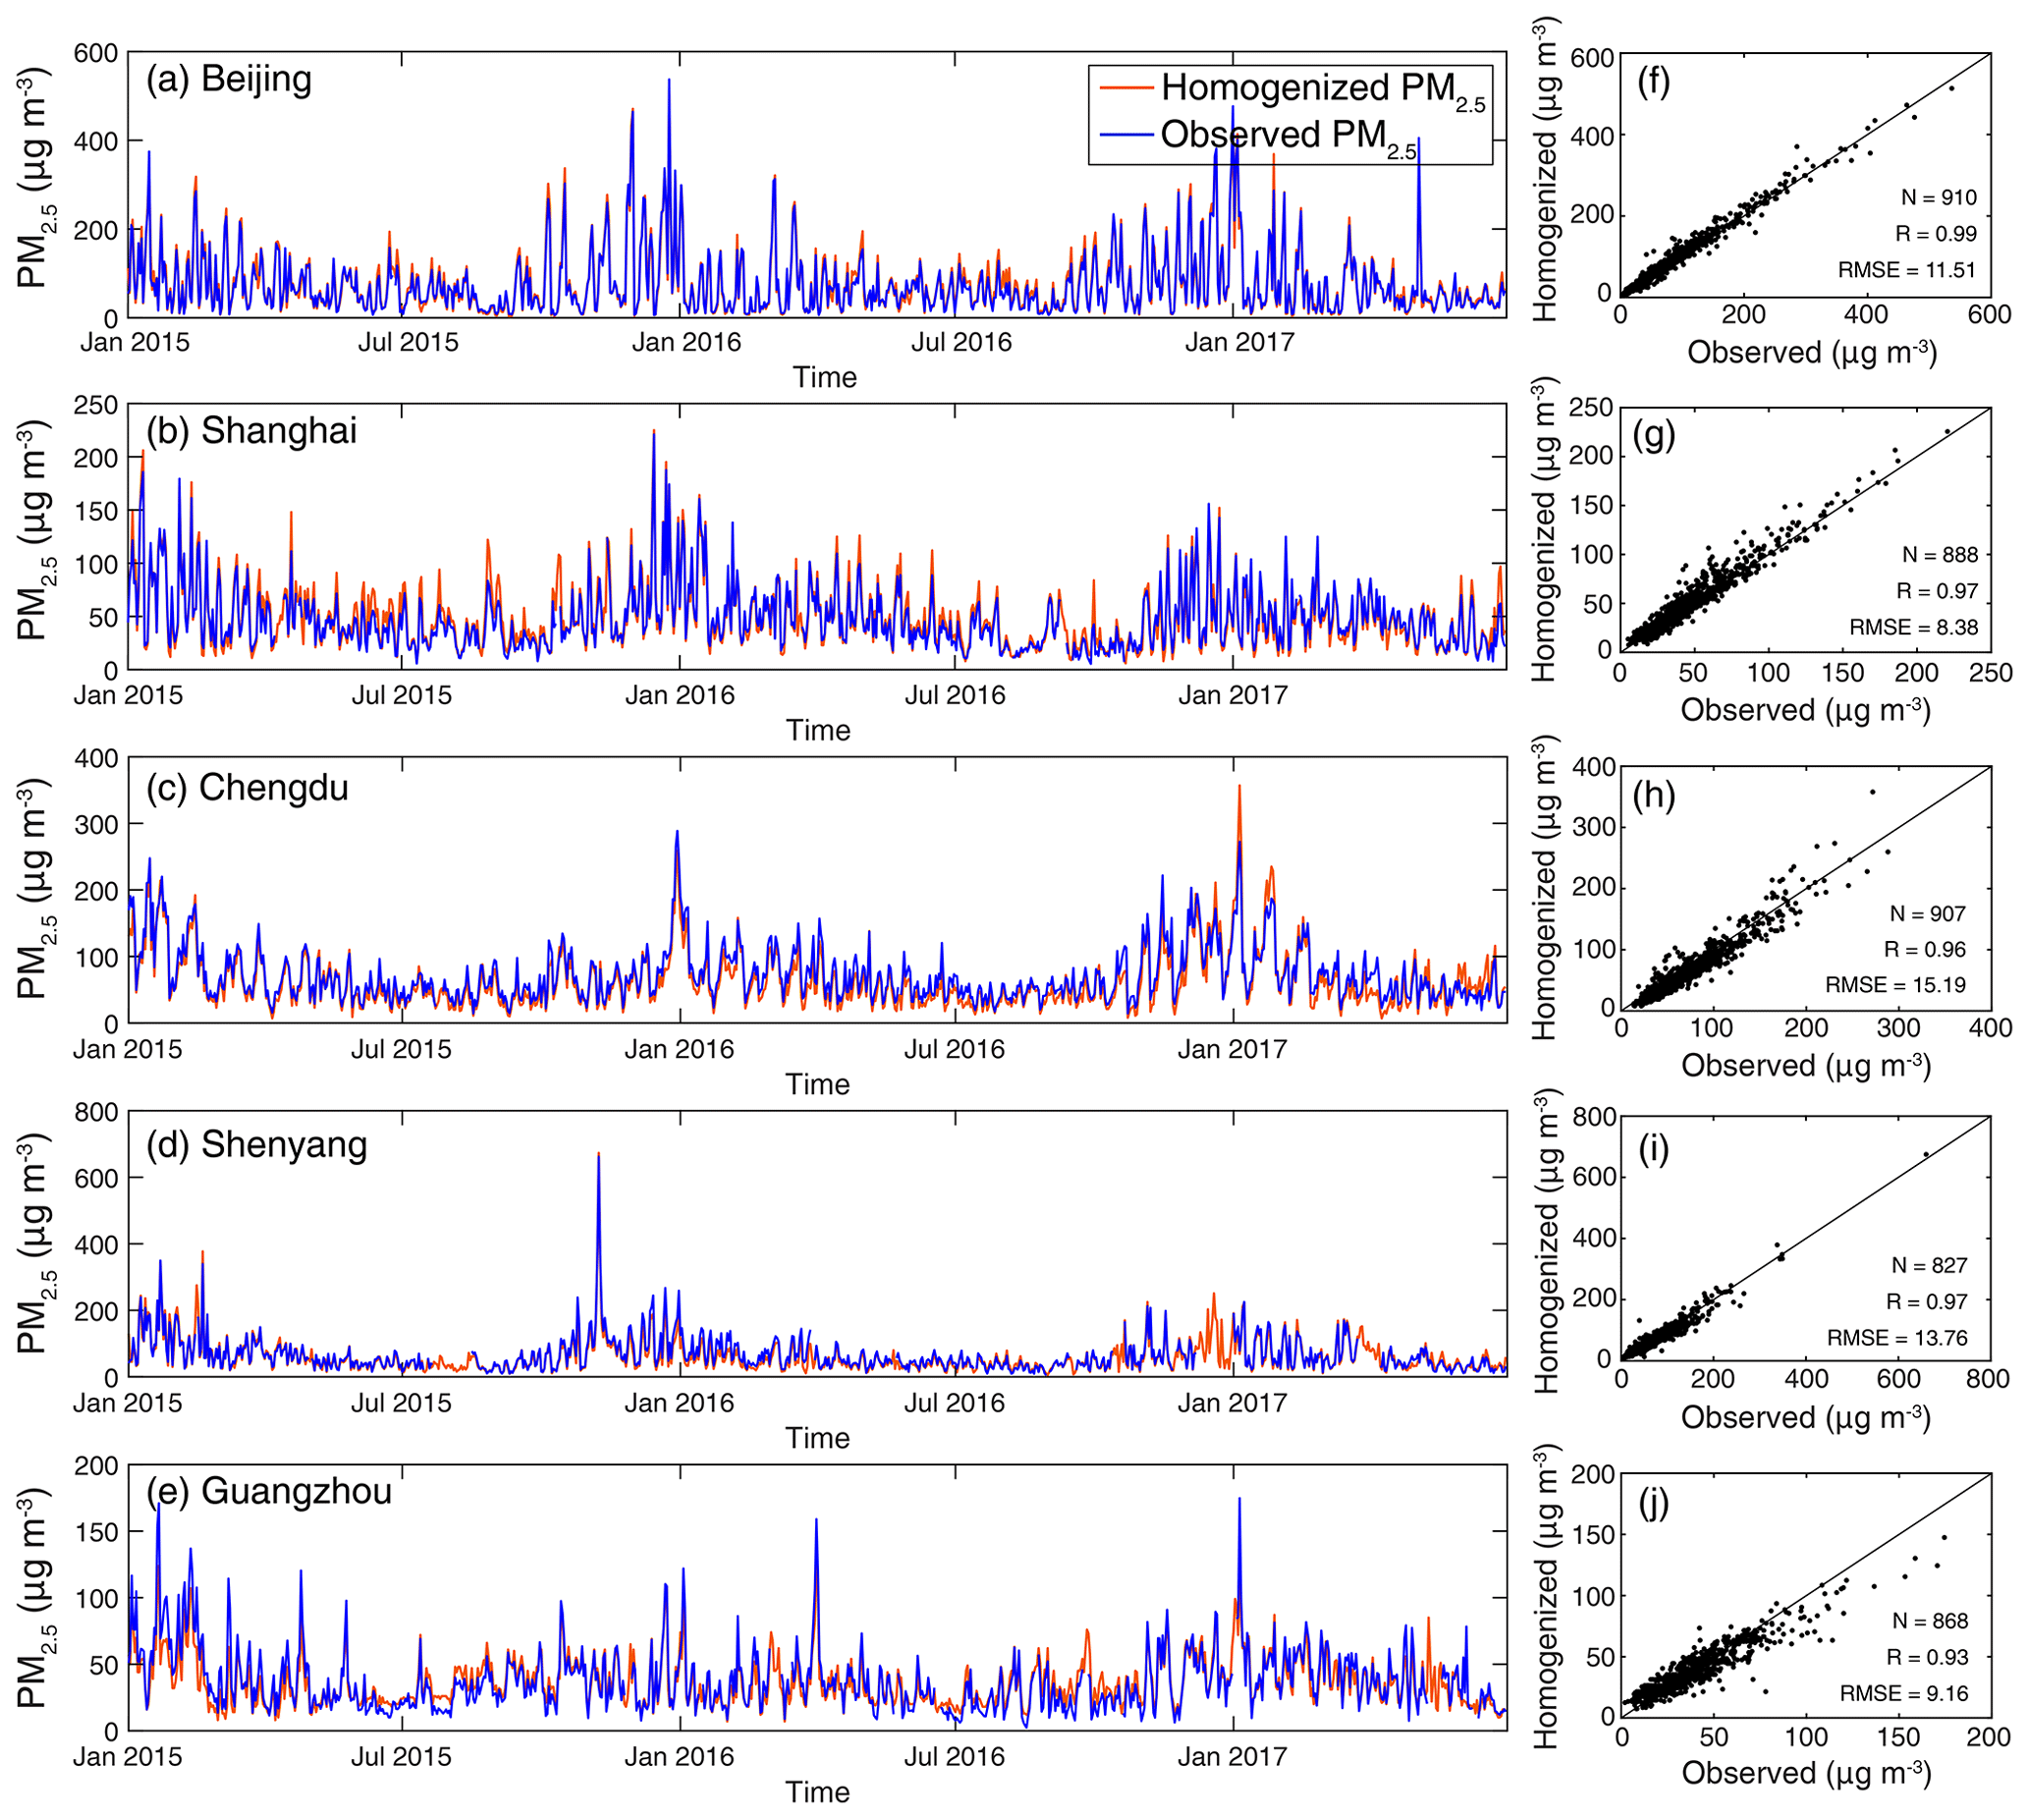
Figure 8Comparisons of the homogenized PM2.5 concentration (red) against PM2.5 observations (blue) measured at five consulates of the United States in China from January 2015 to June 2017. (a–e) Temporal variations of daily PM2.5 concentration and (f–j) the associated scatter plots.
4.4 PM2.5 trends estimated from the homogenized dataset
A homogenized data record is essential to trend analysis. Figure 9 presents the annual mean concentration of PM2.5 across China between 2015 and 2019. As shown, there is a phenomenal reduction of PM2.5 concentration in China in the past 5 years, especially over the North China Plain (the region outlined by a red rectangle shown in Fig. 9f), where the annual mean PM2.5 concentration decreased from more than 100 µg m−3 in 2015 to about 60 µg m−3 in 2019. Such an evident decrease in PM2.5 concentration clearly demonstrates the effectiveness of clean air actions that were implemented in recent years.

Figure 9Annual mean PM2.5 concentration derived from the homogenized daily PM2.5 concentration dataset at 1309 monitoring stations between 2015 and 2019. The North China Plain is outlined by the red rectangle in panel (f).
To evaluate the benefits of data homogenization on PM2.5 trend estimations, PM2.5 trends estimated from both the raw observations and homogenized dataset were compared. Prior to trend analysis, each PM2.5 concentration record was standardized in reference to its mean annual cycle (i.e., PM2.5 concentration on the same date of the year between 2015 and 2019 was averaged) to reduce the impacts of seasonality and spatial variations. Figure 10 shows a site-specific comparison of PM2.5 trend estimations derived from raw observations and homogenized datasets during 2015–2019. In general, trend estimations from both datasets showed an evident decreasing tendency of PM2.5 concentration across China during the study period. Nevertheless, noteworthy is that trend estimations derived from raw PM2.5 observations suffered from obvious inhomogeneity over space, being evidenced by antiphase (positive versus negative) trend estimations even at adjacent stations, especially for those that had positive trends while all adjacent neighbors exhibited negative trends. These antiphase trend estimations over a small region also corroborate the existence of obvious inhomogeneity in raw observed in situ PM2.5 concentration dataset.

Figure 10Linear trends for (a) raw observed and (b) homogenized daily PM2.5 concentration data during 2015–2019 in the study area. Solid circles indicate trends are statistically significant at the 95 % confidence interval. Numbers shown in the lower left of each panel indicate the overall trend derived from (top) all available stations and (bottom) the stations with significant trends at the 95 % confidence interval while the numbers shown in brackets are the corresponding number of data records. Each PM2.5 time series was standardized by its mean annual cycle during the study period to account for spatial variations of PM2.5.
The dotted antiphase trend estimations were substantially diminished after data homogenization, resulting in a spatially much more homogeneous decreasing tendency of PM2.5 concentration across China (Fig. 10b). It is indicative that after data homogenization the national mean PM2.5 trend was enlarged from −7.01 % a−1 to −7.25 % a−1 while the uncertainty was reduced from 0.25 % a−1 to 0.22 % a−1. Also, the number of PM2.5 records with statistically significant trends was increased from 1208 to 1248. These results collectively justify the effectiveness of the QM adjustment method in mitigating data inhomogeneity in PM2.5 observations, which also highlight the critical importance of data homogenization in accounting for discontinuities in this in situ PM2.5 concentration dataset. Overall, our results indicate an obvious decreasing trend of PM2.5 concentration in China in the past 5 years at a mean rate of −7.25 ± 0.22 % a−1. Table 1 further compares the regional mean PM2.5 trend between 2015 and 2019. Compared with other regions of interest (ROIs) such as the Pearl River Delta (PRD; refer to Fig. S4 for the location) and northern part of Xinjiang (XJ), PM2.5 loading over Beijing–Tianjin–Hebei (BTH), Heilongjiang–Jilin–Liaoning (HJL), and central China (CC) decreased even more prominently.
Table 1Regional mean trend for PM2.5 concentrations over eight major ROIs in China during 2015–2019 before and after the data homogenization. Uncertainties in trend estimations were characterized at the 95 % confidence interval. Locations of these ROIs can be found in Fig. S4.

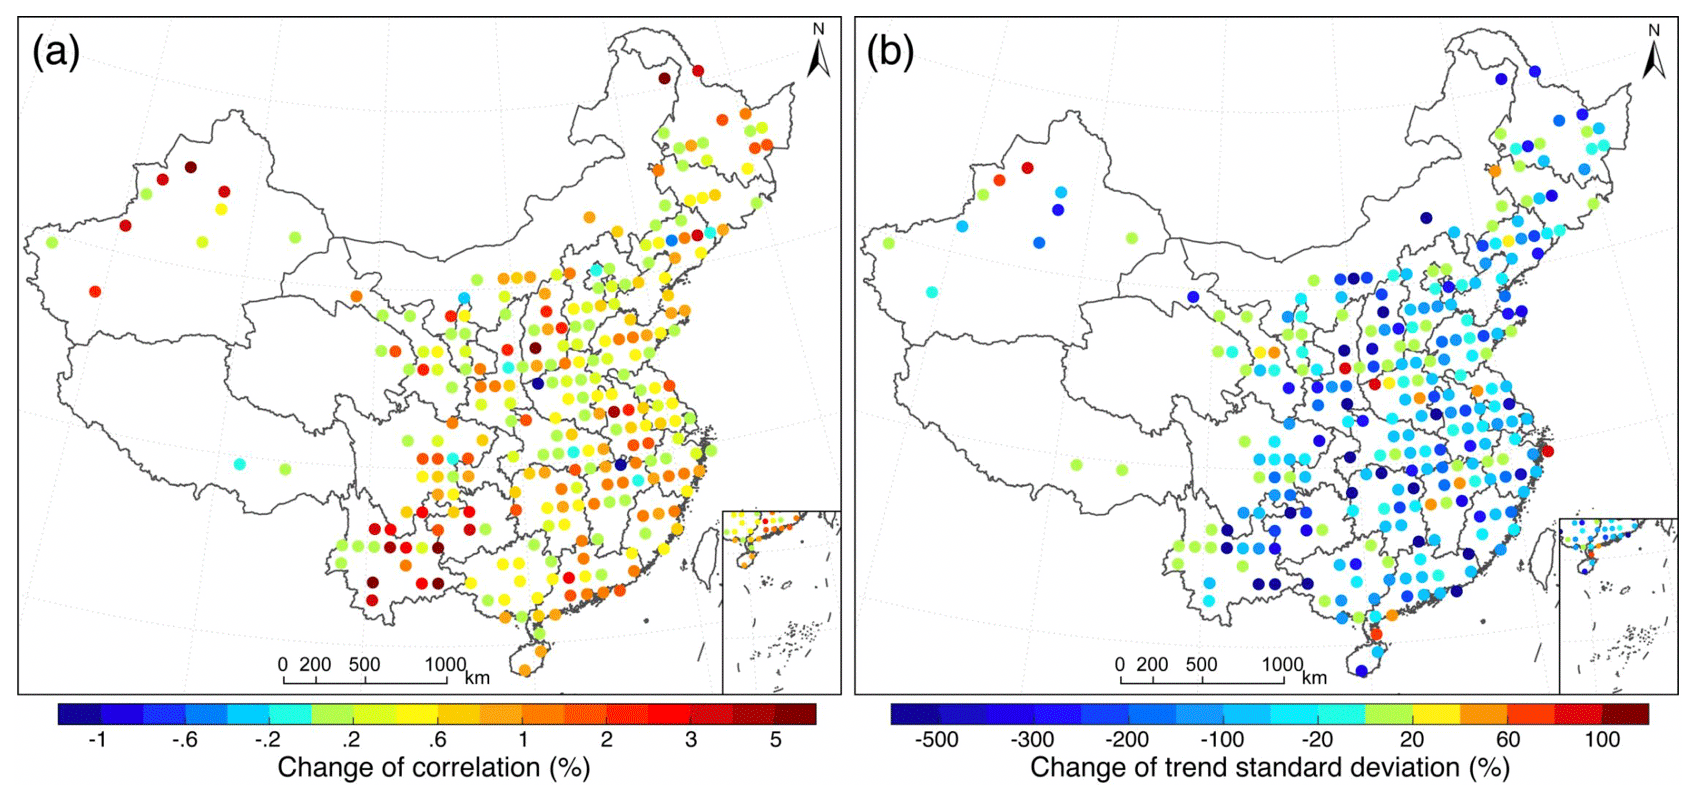
Figure 11Spatial distributions of (a) the improvements of mean correlation coefficient among PM2.5 concentration records before and after homogenization at a 1∘ × 1∘ grid cell resolution in the study area, and (b) their corresponding standard deviations of PM2.5 trends.
To further assess the improvement of the data quality after homogenization, the daily in situ PM2.5 concentration records at a 1∘ × 1∘ grid cell resolution were grouped across China. In each grid cell, the regional mean correlation coefficient among PM2.5 concentration time series and standard deviation of PM2.5 trends were estimated from the raw observed and homogenized daily PM2.5 concentration time series, respectively. Their relative differences were then calculated to show the improvements of data homogeneity within each grid cell. As shown in Fig. 11, the correlation among PM2.5 concentration data was enhanced ubiquitously after homogenization, especially in the southwest of China (e.g., Yunnan) where obvious inhomogeneity was observed in the raw PM2.5 observations (Fig. 10a). Meanwhile, the standard deviation of PM2.5 trends within each grid cell was also substantially reduced, even by more than two times in magnitude (Fig. 11b). These results also highlight the critical need to homogenize the observed PM2.5 concentration data from a large-scale monitoring network to reduce temporal inconsistency and spatial inhomogeneity that were not even noticed before.
The raw observations of in situ PM2.5 concentration data in China used in this study were retrieved via a web crawler from the National Urban Air Quality Real-time Publishing Platform (http://106.37.208.233:20035, China National Environmental Monitoring Center, 2020) between 2014 and 2019. Given the deployment of many new monitoring sites in 2014, we decided to generate a coherent PM2.5 concentration dataset starting from 2015 to include as many PM2.5 data records as possible. The homogenized daily in situ PM2.5 concentration dataset developed in this study is publicly accessible at https://doi.org/10.1594/PANGAEA.917557 (Bai et al., 2020a). To provide a long-term coherent PM2.5 concentration dataset to the scientific community, the homogenized PM2.5 concentration dataset will be regularly updated for each half a year by including new PM2.5 observations that are retrieved during the past 6 months.
In this study, a homogenized yet temporally complete daily in situ PM2.5 concentration dataset was generated based on the discrete hourly PM2.5 concentration records that were retrieved from the China National Urban Air Quality Real-time Publishing Platform using a web crawler during the period of 2015–2019. To create such a long-term coherent dataset, a set of analytic methods were geared up seamlessly and applied sequentially to the retrieved raw PM2.5 concentration records, involving quality control, gap filling, data merging, change point detection, and bias correction. This new dataset could help the scientific community better elucidate the temporal and spatial variability of haze pollution in China in recent years, which is expected to improve the understanding of underlying causes.
The raw PM2.5 concentration records were found to be suffering from phenomenal inhomogeneity caused by data inconsistency and temporal discontinuity as well as the relocation and repeal of a number of monitoring stations. More than half of the long-term PM2.5 concentration records were found to fail the homogeneity test due to the presence of significant change points. Further investigation confirms that large yet short-term mean shifts and chronic drifts are two primary reasons for the detected discontinuities in raw PM2.5 concentration records.
Based on the homogenized dataset, the long-term trends of PM2.5 concentration in China were estimated. In contrast to the inhomogeneous trend estimations that were derived from raw PM2.5 concentration records, the homogenized dataset yielded a spatially much more homogeneous decreasing tendency of PM2.5 concentration across China at a mean rate of about –7.3 % per year. Such an improvement of homogeneity was also evidenced by the enhanced correlation and reduced standard deviation of trend estimations between homogenized PM2.5 concentration time series in the surroundings. These results clearly demonstrate the benefits of data homogenization on the improvement of the quality of this PM2.5 concentration dataset as evident discontinuities have been removed after homogenization. Overall, our results clearly indicate the presence of discontinuities in the raw in situ PM2.5 concentration observations that were measured in China, and the homogenization actions are essential to the acquisition of a long-term coherent PM2.5 concentration dataset that can be used to advance PM2.5 pollution related policy making and public health risk assessment.
The supplement related to this article is available online at: https://doi.org/10.5194/essd-12-3067-2020-supplement.
The study was completed with cooperation between all authors. JG and KB conceived of the idea behind generating a homogenous PM2.5 dataset across China. KB and KL conducted the data analyses and KB wrote the paper. All authors discussed the experimental results and helped review the paper.
The authors declare that they have no conflict of interest.
This study was supported by the International Cooperation Platform in Resources, Environment and Ecology, East China Normal University. The authors are grateful to China National Environmental Monitoring Center (http://www.cnemc.cn/en/, last access: 10 November 2020) and the embassy of the United States in China (http://www.stateair.net/, last access: 10 October 2020) for releasing the sampled air quality data publicly online. We also want to express our sincere thanks to Yang Feng in the Expert Team on Climate Change Detection and Indices (ETCCDI) (http://etccdi.pacificclimate.org/software.shtml, last access: 10 October 2020) for providing the RHtestsV4 software package.
This research has been supported by the Ministry of Science and Technology of the People's Republic of China (grant no. 2017YFC1501401) and the National Natural Science Foundation of China (grant no. 41701413).
This paper was edited by David Carlson and reviewed by two anonymous referees.
Bai, K., Chang, N.-B., Yu, H., and Gao, W.: Statistical bias correction for creating coherent total ozone record from OMI and OMPS observations, Remote Sens. Environ., 182, 150–168, https://doi.org/10.1016/j.rse.2016.05.007, 2016.
Bai, K., Chang, N.-B., Zhou, J., Gao, W., and Guo, J.: Diagnosing atmospheric stability effects on the modeling accuracy of PM2.5/AOD relationship in eastern China using radiosonde data, Environ. Pollut., 251, 380–389, https://doi.org/10.1016/j.envpol.2019.04.104, 2019a.
Bai, K., Li, K., Chang, N.-B., and Gao, W.: Advancing the prediction accuracy of satellite-based PM2.5 concentration mapping: A perspective of data mining through in situ PM2.5 measurements, Environ. Pollut., 254, 113047, https://doi.org/10.1016/j.envpol.2019.113047, 2019b.
Bai, K., Ma, M., Chang, N.-B., and Gao, W.: Spatiotemporal trend analysis for fine particulate matter concentrations in China using high-resolution satellite-derived and ground-measured PM2.5 data, J. Environ. Manage., 233, 530–542, https://doi.org/10.1016/j.jenvman.2018.12.071, 2019c.
Bai, K., Li, K., Wu, C., Chang, N.-B., and Guo, J.: A homogenized daily in situ PM2.5 concentration dataset in China during 2015–2019, PANGAEA, https://doi.org/10.1594/PANGAEA.917557, 2020a.
Bai, K., Li, K., Guo, J., Yang, Y., and Chang, N.-B.: Filling the gaps of in situ hourly PM2.5 concentration data with the aid of empirical orthogonal function analysis constrained by diurnal cycles, Atmos. Meas. Tech., 13, 1213–1226, https://doi.org/10.5194/amt-13-1213-2020, 2020b.
Cai, W., Li, K., Liao, H., Wang, H., and Wu, L.: Weather conditions conducive to Beijing severe haze more frequent under climate change, Nat. Clim. Chang., 7, 257–262, https://doi.org/10.1038/nclimate3249, 2017.
Cao, L.-J. and Yan, Z.-W.: Progress in research on homogenization of climate Data, Adv. Clim. Chang. Res., 3, 59–67, https://doi.org/10.3724/SP.J.1248.2012.00059, 2012.
Cao, L., Zhao, P., Yan, Z., Jones, P., Zhu, Y., Yu, Y., and Tang, G.: Instrumental temperature series in eastern and central China back to the nineteenth century, J. Geophys. Res.-Atmos., 118, 8197–8207, https://doi.org/10.1002/jgrd.50615, 2013.
China National Environmental Monitoring Center, China National Urban Air Quality Real-time Publishing Platform, available at: http://106.37.208.233:20035, last access: 10 November 2020.
Ding, A. J., Huang, X., Nie, W., Sun, J. N., Kerminen, V.-M., Petäjä, T., Su, H., Cheng, Y. F., Yang, X.-Q., Wang, M. H., Chi, X. G., Wang, J. P., Virkkula, A., Guo, W. D., Yuan, J., Wang, S. Y., Zhang, R. J., Wu, Y. F., Song, Y., Zhu, T., Zilitinkevich, S., Kulmala, M., and Fu, C. B.: Enhanced haze pollution by black carbon in megacities in China, Geophys. Res. Lett., 43, 2873–2879, https://doi.org/10.1002/2016GL067745, 2016.
Guo, J.-P., Zhang, X.-Y., Che, H.-Z., Gong, S.-L., An, X., Cao, C.-X., Guang, J., Zhang, H., Wang, Y.-Q., Zhang, X.-C., Xue, M., and Li, X.-W.: Correlation between PM concentrations and aerosol optical depth in eastern China, Atmos. Environ., 43, 5876–5886, https://doi.org/10.1016/j.atmosenv.2009.08.026, 2009.
Guo, J., Xia, F., Zhang, Y., Liu, H., Li, J., Lou, M., He, J., Yan, Y., Wang, F., Min, M., and Zhai, P.: Impact of diurnal variability and meteorological factors on the PM2.5-AOD relationship: Implications for PM2.5 remote sensing, Environ. Pollut., 221, 94–104, https://doi.org/10.1016/j.envpol.2016.11.043, 2017.
Guo, S., Hu, M., Zamora, M. L., Peng, J., Shang, D., Zheng, J., Du, Z., Wu, Z., Shao, M., Zeng, L., Molina, M. J., and Zhang, R.: Elucidating severe urban haze formation in China, P. Natl. Acad. Sci. USA, 111, 17373–17378, https://doi.org/10.1073/pnas.1419604111, 2014.
He, L., Lin, A., Chen, X., Zhou, H., Zhou, Z., and He, P.: Assessment of MERRA-2 Surface PM2.5 over the Yangtze River Basin: Ground-based verification, spatiotemporal distribution and meteorological dependence, Remote Sens., 11, 460, https://doi.org/10.3390/rs11040460, 2019.
He, Q. and Huang, B.: Satellite-based mapping of daily high-resolution ground PM2.5 in China via space-time regression modeling, Remote Sens. Environ., 206, 72–83, https://doi.org/10.1016/j.rse.2017.12.018, 2018.
Huang, X., Wang, Z., and Ding, A.: Impact of aerosol-PBL interaction on haze pollution: multiyear observational evidences in North China, Geophys. Res. Lett., 45, 8596–8603, https://doi.org/10.1029/2018GL079239, 2018.
Lelieveld, J., Evans, J. S., Fnais, M., Giannadaki, D., and Pozzer, A.:The contribution of outdoor air pollution sources to premature mortality on a global scale, Nature, 525, 367–371, https://doi.org/10.1038/nature15371, 2015.
Li, Z., Guo, J., Ding, A., Liao, H., Liu, J., Sun, Y., Wang, T., Xue, H., Zhang, H., and Zhu, B.: Aerosol and boundary-layer interactions and impact on air quality, Natl. Sci. Rev., 4, 810–833, https://doi.org/10.1093/nsr/nwx117, 2017.
Lin, C., Li, Y., Lau, A. K. H., Li, C., and Fung, J. C. H.: 15-Year PM2.5 trends in the Pearl River Delta region and Hong Kong from satellite observation, Aerosol Air Qual. Res., 18, 2355–2362, https://doi.org/10.4209/aaqr.2017.11.0437, 2018.
Lin, C. Q., Liu, G., Lau, A. K. H., Li, Y., Li, C. C., Fung, J. C. H., and Lao, X. Q.: High-resolution satellite remote sensing of provincial PM2.5 trends in China from 2001 to 2015, Atmos. Environ., 180, 110–116, https://doi.org/10.1016/j.atmosenv.2018.02.045, 2018.
Liu, D., Deng, Q., Zhou, Z., Lin, Y., and Tao, J.: Variation trends of fine particulate matter concentration in Wuhan city from 2013 to 2017, Int. J. Env. Res. Pub. He., 15, 1487, https://doi.org/10.3390/ijerph15071487, 2018.
Luan, T., Guo, X., Guo, L., and Zhang, T.: Quantifying the relationship between PM2.5 concentration, visibility and planetary boundary layer height for long-lasting haze and fog–haze mixed events in Beijing, Atmos. Chem. Phys., 18, 203–225, https://doi.org/10.5194/acp-18-203-2018, 2018.
Ma, Z., Hu, X., Sayer, A. M., Levy, R., Zhang, Q., Xue, Y., Tong, S., Bi, J., Huang, L., and Liu, Y.: Satellite-based spatiotemporal trends in PM2.5 concentrations: China, 2004–2013, Environ. Health Persp., 124, 184–192, https://doi.org/10.1289/ehp.1409481, 2015.
Nie, H., Qin, T., Yang, H., Chen, J., He, S., Lv, Z., and Shen, Z.: Trend analysis of temperature and precipitation extremes during winter wheat growth period in the major winter wheat planting area of China, Atmosphere-Basel, 10, 240, https://doi.org/10.3390/atmos10050240, 2019.
Ning, G., Wang, S., Ma, M., Ni, C., Shang, Z., Wang, J. and Li, J.: Characteristics of air pollution in different zones of Sichuan Basin, China, Sci. Total Environ., 612, 975–984, https://doi.org/10.1016/j.scitotenv.2017.08.205, 2018.
Peterson, T. C. and Easterling, D. R.: Creation of homogeneous composite climatological reference series, Int. J. Climatol., 14, 671–679, https://doi.org/10.1002/joc.3370140606, 1994.
Rodriguez, D., Valari, M., Payan, S., and Eymard, L.: On the spatial representativeness of NOX and PM10 monitoring-sites in Paris, France, Atmos. Environ. X, 1, 100010, https://doi.org/10.1016/j.aeaoa.2019.100010, 2019.
Shen, H., Li, T., Yuan, Q., and Zhang, L.: Estimating regional ground-level PM2.5 directly from satellite top-of-atmosphere reflectance using deep belief networks, J. Geophys. Res.-Atmos., 123, 13875–13886, https://doi.org/10.1029/2018JD028759, 2018.
Shi, X., Zhao, C., Jiang, J. H., Wang, C., Yang, X., and Yung, Y. L.: Spatial representativeness of PM2.5 concentrations obtained using observations from network stations, J. Geophys. Res.-Atmos., 123, 3145–3158, https://doi.org/10.1002/2017JD027913, 2018.
Wang, G., Zhang, R., Gomez, M. E., Yang, L., Levy Zamora, M., Hu, M., Lin, Y., Peng, J., Guo, S., Meng, J., Li, J., Cheng, C., Hu, T., Ren, Y., Wang, Yuesi, Gao, J., Cao, J., An, Z., Zhou, W., Li, G., Wang, J., Tian, P., Marrero-Ortiz, W., Secrest, J., Du, Z., Zheng, J., Shang, D., Zeng, L., Shao, M., Wang, W., Huang, Y., Wang, Yuan, Zhu, Y., Li, Y., Hu, J., Pan, B., Cai, L., Cheng, Y., Ji, Y., Zhang, F., Rosenfeld, D., Liss, P. S., Duce, R. A., Kolb, C. E., and Molina, M. J.: Persistent sulfate formation from London Fog to Chinese haze, P. Natl. Acad. Sci. USA, 113, 13630–13635, https://doi.org/10.1073/pnas.1616540113, 2016.
Wang, X. and Wang, K.: Homogenized variability of radiosonde-derived atmospheric boundary layer height over the global land surface from 1973 to 2014, J. Clim., 29, 6893–6908, https://doi.org/10.1175/JCLI-D-15-0766.1, 2016.
Wang, X. L.: Penalized maximal F test for detecting undocumented mean shift without trend change, J. Atmos. Ocean. Tech., 25, 368–384, https://doi.org/10.1175/2007JTECHA982.1, 2008a.
Wang, X. L.: Accounting for autocorrelation in detecting mean shifts in climate data series using the Penalized Maximal t or F Test, J. Appl. Meteorol. Clim., 47, 2423–2444, https://doi.org/10.1175/2008JAMC1741.1, 2008b.
Wang, X. L., Wen, Q. H., and Wu, Y.: Penalized maximal t test for detecting undocumented mean change in climate data series, J. Appl. Meteorol. Clim., 46, 916–931, https://doi.org/10.1175/JAM2504.1, 2007.
Wang, X. L., Chen, H., Wu, Y., Feng, Y., and Pu, Q.: New techniques for the detection and adjustment of shifts in daily precipitation data series, J. Appl. Meteorol. Clim., 49, 2416–2436, https://doi.org/10.1175/2010JAMC2376.1, 2010a.
Wang, X. L., Chen, H., Wu, Y., Feng, Y., and Pu, Q.: New techniques for the detection and adjustment of shifts in daily precipitation data series, J. Appl. Meteorol. Clim., 49, 2416–2436, https://doi.org/10.1175/2010JAMC2376.1, 2010b.
Wang, X. L. and Feng, Y.: RHtests V4 User Manual, Climate Research Division Atmospheric Science and Technology Directorate Science and Technology Branch, Environment Canada Toronto, Ontario, Canada., 2013.
Wei, J., Li, Z., Cribb, M., Huang, W., Xue, W., Sun, L., Guo, J., Peng, Y., Li, J., Lyapustin, A., Liu, L., Wu, H., and Song, Y.: Improved 1 km resolution PM2.5 estimates across China using enhanced space–time extremely randomized trees, Atmos. Chem. Phys., 20, 3273–3289, https://doi.org/10.5194/acp-20-3273-2020, 2020.
Xin, J., Wang, Y., Wang, L., Tang, G., Sun, Y., Pan, Y., and Ji, D.: Reductions of PM2.5 in Beijing-Tianjin-Hebei urban agglomerations during the 2008 Olympic Games, Adv. Atmos. Sci., 29, 1330–1342, https://doi.org/10.1007/s00376-012-1227-4, 2012.
Xin, J., Wang, Y., Pan, Y., Ji, D., Liu, Z., Wen, T., Wang, Y., Li, X., Sun, Y., Sun, J., Wang, P., Wang, G., Wang, X., Cong, Z., Song, T., Hu, B., Wang, L., Tang, G., Gao, W., Guo, Y., Miao, H., Tian, S., and Wang, L.: The campaign on atmospheric aerosol research network of China: CARE-China, B. Am. Meteorol. Soc., 96, 1137–1155, https://doi.org/10.1175/BAMS-D-14-00039.1, 2015.
Xu, W., Li, Q., Wang, X. L., Yang, S., Cao, L., and Feng, Y.: Homogenization of Chinese daily surface air temperatures and analysis of trends in the extreme temperature indices, J. Geophys. Res.-Atmos., 118, 9708–9720, https://doi.org/10.1002/jgrd.50791, 2013.
Yang, D., Wang, X., Xu, J., Xu, C., Lu, D., Ye, C., Wang, Z., and Bai, L.: Quantifying the influence of natural and socioeconomic factors and their interactive impact on PM2.5 pollution in China, Environ. Pollut., 241, 475–483, https://doi.org/10.1016/j.envpol.2018.05.043, 2018.
Yang, Q., Yuan, Q., Yue, L., Li, T., Shen, H., and Zhang, L.: The relationships between PM2.5 and aerosol optical depth (AOD) in mainland China: About and behind the spatio-temporal variations, Environ. Pollut., 248, 526–535, https://doi.org/10.1016/j.envpol.2019.02.071, 2019.
Yin, P., Guo, J., Wang, L., Fan, W., Lu, F., Guo, M., Moreno, S. B. R., Wang, Y., Wang, H., Zhou, M., and Dong, Z.: Higher Risk of Cardiovascular Disease Associated with Smaller Size-Fractioned Particulate Matter, Environ. Sci. Technol. Lett., 7, 95–101, https://doi.org/10.1021/acs.estlett.9b00735, 2020.
You, W., Zang, Z., Zhang, L., Li, Y., and Wang, W.: Estimating national-scale ground-level PM2.5 concentration in China using geographically weighted regression based on MODIS and MISR AOD, Environ. Sci. Pollut. Res., 23, 8327–8338, https://doi.org/10.1007/s11356-015-6027-9, 2016.
Zhang, D., Bai, K., Zhou, Y., Shi, R., and Ren, H.: Estimating ground-level concentrations of multiple air pollutants and their health impacts in the Huaihe River Basin in China, Int. J. Environ. Res. Pub. He., 16, 579, https://doi.org/10.3390/ijerph16040579, 2019.
Zhang, T., Zhu, Z., Gong, W., Zhu, Z., Sun, K., Wang, L., Huang, Y., Mao, F., Shen, H., Li, Z., and Xu, K.: Estimation of ultrahigh resolution PM2.5 concentrations in urban areas using 160 m Gaofen-1 AOD retrievals, Remote Sens. Environ., 216, 91–104, https://doi.org/10.1016/j.rse.2018.06.030, 2018.
Zhao, P., Jones, P., Cao, L., Yan, Z., Zha, S., Zhu, Y., Yu, Y., and Tang, G.: Trend of surface air temperature in Eastern China and associated large-scale climate variability over the last 100 years, J. Clim., 27, 4693–4703, https://doi.org/10.1175/JCLI-D-13-00397.1, 2014.
Zheng, C., Zhao, C., Zhu, Y., Wang, Y., Shi, X., Wu, X., Chen, T., Wu, F., and Qiu, Y.: Analysis of influential factors for the relationship between PM2.5 and AOD in Beijing, Atmos. Chem. Phys., 17, 13473–13489, https://doi.org/10.5194/acp-17-13473-2017, 2017.
Zou, B., Pu, Q., Bilal, M., Weng, Q., Zhai, L., and Nichol, J.E.: High-resolution satellite mapping of fine particulates based on geographically weighted regression, IEEE Geosci. Remote S., 13, 495–499, https://doi.org/10.1109/LGRS.2016.2520480, 2016.