the Creative Commons Attribution 4.0 License.
the Creative Commons Attribution 4.0 License.
 | 11 Nov 2026
State of Wildfires 2025–2026
Chantelle A. Burton

Francesca Di Giuseppe
Matthew W. Jones
Maria L. F. Barbosa
Joe McNorton
Bob Potts
Carlota Segura-Garcia
John T. Abatzoglou
Iulian Alin Rosu
Niels Andela
Liana O. Anderson
Sally Archibald
Esther Brambleby
Emilio Chuvieco
Andrew Ciavarella
Hamish Clarke
Francisco de la Barrera
Carlos M. Di Bella
Enza Di Tomaso
Kebonye Dintwe
Tim S. Doherty
Victoria M. Donovan
Jonathan M. Eden
Paulo M. Fernandes
Lukas Fiedler
Louis Giglio
Olivia Haas
Douglas S. Hamilton
Stijn Hantson
Sarah Harris
Andrew J. Hartley
Theo Keeping
Crystal A. Kolden
Jean-Luc Kouassi
Elena Kukavskaya
Seppe Lampe
Zhongwei Liu
Guilherme Mataveli
Sarah Meier
Duarte Oom
Mark Parrington
Yuquan Qu
Victor Resco de Dios
Julien Ruffault
Mojtaba Sadegh
Cristina Santín
Fernando Sedano
Jacquelyn K. Shuman
Patrícia S. Silva
Fiona R. Spuler
Carmen B. Steinmann
Veerachai Tanpipat
Miguel Ángel Torres-Vazquez
Marco Turco
Guido R. van der Werf
Dave van Wees
Sander Veraverbeke
Jakob B. Wessel
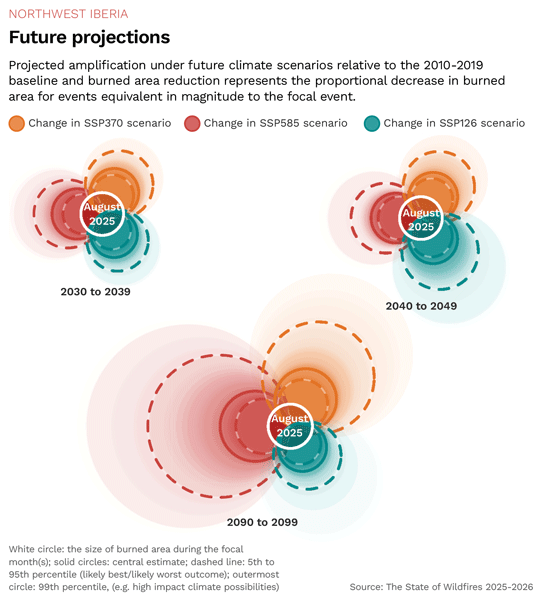
The global geography, behaviour, and impact of fires are shifting, as spatially varying human influences interact with a visibly changing climate. The State of Wildfires project systematically tracks global and regional fire activity, analyses the causes of prominent extreme wildfire events for three focal regions, and projects the likelihood of similar events under future climate scenarios. During the March 2025–February 2026 fire season, global burned area (BA) was 18 % below the 2002–2024 average and global fire carbon (C) emissions were also 20 %–31 % below average, making it one of the lowest years on record. Yet this globally low fire year still produced widespread regional impacts. Canada experienced a third consecutive extreme fire year, with national fire C emissions at nearly triple the average since 2002, 70 000 evacuations, and reported direct losses of USD 360 million. In the Midwestern Canadian Shield Forests, the epicentre of Canada's anomalous season, we find that anthropogenic climate change has nearly doubled (likely synthesis range 0.33–44.9, median 1.85) the likelihood of extreme fire weather in this region and made the observed BA around 10 times more likely during July–August 2025. BA extent in the region is found to be 9 times greater. Many parts of Europe also experienced record or high-ranking BA and fire C emissions, including in Spain, Portugal, and the UK, and a record USD 4.11 billion of physical assets were exposed to fire across the continent. Direct fatalities occurred in Türkiye (17), Spain (8), Portugal (6), Cyprus (2), Greece (1) and France (1), and evacuations in Türkiye, Spain, and Greece totalled over 110 000. In the Northwest Iberian Peninsula, we find that extreme fire weather over August 2025 was around 3 times (virtually certain modelled range 0.14–657, median 3.63) more likely due to climate change. Under a high-emissions scenario (SSP3-7.0), fires of the same return interval are likely to burn about 78 % more area by the end of the century, with some projections within the same scenario suggesting increases of around sevenfold. In Chile and northwest Argentina, January–February 2026 fires caused 23 fatalities, displaced 55 000 people and threatened a UNESCO World Heritage Site. In the Chilean Temperate Forests and Matorral, the epicentre, we find that BA was around two times larger due to anthropogenic climate change. Across all focal regions in this report, the conditions for extreme fire developed gradually through months of precipitation deficits, cumulative drying and, in the case of Northwest Iberia, antecedent fuel accumulation aided by preceding wet periods. Continued climate change is expected to intensify these hydroclimatic extremes. However, comparison of SSP3-7.0 with SSP5-8.5 suggests that projected end-of-century extreme BA events in our focal regions are 4 %–23 % smaller than under the very high-emissions futures that were once considered plausible.. Meeting the Paris targets (SSP1-2.6) would further reduce BA during these events by 5 %–36 % across our focal regions. By integrating expertise from across the wildfire community with state-of-the-art observations, data, and modelling, this annual report advances understanding of regional wildfire extremes and their drivers, providing evidence to inform policy, preparedness, mitigation, adaptation, and broader societal benefit. Fifteen new and updated datasets created in this report are available from the State of Wildfires Project's Zenodo community (https://zenodo.org/communities/stateofwildfiresproject/, last access: 23 October 2026).
- Article
(11219 KB) - Full-text XML
-
Supplement
(9975 KB) - BibTeX
- EndNote


1.1 Background
Year after year, we are witnessing extreme wildfires occurring on every inhabited continent. While global total burned area (BA) is decreasing, both BA and fire emissions are rising in extratropical carbon-rich forests and peatlands (Jones et al., 2024a; Zheng et al., 2021). Meanwhile, fire intensity is also rising globally and abnormally intense fires across Mediterranean biomes have been linked to extreme heat and drought (Cunningham et al., 2024; Ghasemiazma et al., 2026). Climate change is driving fire weather and resultant extreme fires that would be very unlikely in a world without human-induced climate change (Jones et al., 2024b; Kelley et al., 2025). As human population and urban area expand, we also see increasing extreme fire effects at the wildland-urban interface (Teymoor Seydi et al., 2025). As a result, over each successive year of the State of the Wildfire report, we are seeing a continuing trend of increased regional anomalies and societal impacts. Fire regimes are not just changing geographically, but are also demonstrating changing characteristics, with the most extreme wildfires becoming more frequent, intense, costly and deadly (Cunningham et al., 2024). Together, these trends underscore the need for a more regional understanding of extreme wildfire behaviour, emissions, and impacts.
Global BA decline is dominated by a reduction in low-intensity fires across African savannahs associated with landscape fragmentation and fire suppression (Andela et al., 2017; Jones et al., 2022). However, BA alone provides only a limited understanding of the observed changes in spatially heterogeneous and highly complex contemporary fire regimes, with compound drivers and impacts on both local and global scales. The number of extreme fires in areas that are not typically fire-adapted is increasing, and larger, more frequent, more intense fires in fire-evolved regions mean ecosystems and communities are struggling to adapt to the speed of change (Cunningham et al., 2024; Grau-Andrés et al., 2024).
An increasing body of evidence shows that extreme fire weather is more likely with anthropogenic climate forcing (Abatzoglou et al., 2025; Turco et al., 2026b; Jones et al., 2022; Jones et al., 2024b), with the extent of extreme BA also amplified (Kelley et al., 2025). Globally, the last 11 years have been the hottest on record (C3S/ECMWF and WMO, 2026), and the Arctic is warming nearly 4 times faster than the global average (C3S/ECMWF and WMO, 2026; Rantanen et al., 2022). Concurrently, wildfires are becoming an emerging risk in the Arctic and subarctic (Overland et al., 2026), with Canada experiencing three years of unprecedented wildfire emissions over 2023–2025.
Climate change also contributes to compound events, including longer and more intense heatwaves and drought. Europe is the fastest-warming continent, with current warming since pre-industrial of around 2.5 °C (C3S/ECMWF and WMO, 2026), and is seeing compounding fire weather spatially with multiple regions facing extreme conditions simultaneously (Torres-Vázquez et al., 2025; Gauthier and Bevacqua, 2026; Yin et al., 2026). Extreme heat and drought can lead to abnormally large fires and more complete combustion, increasing emissions and transport of those emissions for individual fire events. BA and emissions in Europe reached record levels in 2025, with the largest contributions from the Iberian Peninsula (C3S/ECMWF and WMO, 2026). Longer fire seasons can reduce safe burning windows, limiting the capacity of communities to prepare and mitigate ahead of the fire season (Taylor et al., 2026). Larger fires are also more difficult to suppress and control, potentially leading to more destruction and loss of life. Over 2025–2026 for example, severe heat and drought have driven record-breaking fires across Chile, the Aegean and Europe, with Spain experiencing its largest BA of over 3500 km2 since at least 2002 (Jones et al., 2026a). Across Greece, Türkiye, and Cyprus, prolonged heatwaves drove destructive fires that displaced tens of thousands of people. In June–July, the UK experienced its first documented “megafire” in Scotland, exceeding 100 km2 (Schoenecker et al., 2026).
Together, these events reinforce trends that are expected to strengthen under continued warming, including more intense wildfires in the extra-tropics and high-latitudes (Jones et al., 2026a; Haas et al., 2026), and greater compound heat and drought-driven fire activity across dry Mediterranean ecoregions (Gauthier and Bevacqua, 2026; Bayar et al., 2026). The contribution of climate change to global BA is rising each year, partially offsetting socio-economic suppression, and increasing the probability of experiencing months with above-average global BA by 22 % (Burton et al., 2024b). Regional extreme fire weather and BA extent are both projected to increase with continued emissions as well (Jones et al., 2024b; Kelley et al., 2025), reemphasizing the need for greater mitigation and adaptation efforts.
It is important to understand the state of global wildfires as an indicator of how climate change is affecting our natural world. Fire is an inherent part of the Earth system, with some ecosystems having evolved with and become dependent on fire to maintain healthy biodiversity and vegetation succession (Bowman et al., 2020; Hardesty et al., 2005). There is also a long history of positive fire use in human societies, including highly diverse place-based cultural fire knowledge (e.g. Maclean et al., 2023; Bilbao et al., 2025; Roos et al., 2021). However, human activity can alter fire regimes through increased ignitions (Hantson et al., 2022), suppression (Kreider et al., 2024), changing fuel load and continuity through land use (Andela et al., 2017), and can indirectly change conditions as a result of climate change (Turco et al., 2026b; Abatzoglou et al., 2025). Larger, longer, more intense and more frequent fires can push ecosystems outside of their usual envelope to a point where the system cannot adapt or recover, giving rise to the possibility of non-linear response and changed states (e.g. Brando et al., 2025). This can also reduce the capacity of natural carbon sinks, providing a positive feedback on the climate (Burton et al., 2024a).
Questions are often asked in the aftermath of an extreme fire event: How unusual was this event? What was the overall impact? What caused it? Did climate change alter the likelihood and intensity of this event? Can we expect more of these in the future? Answering all these questions on a regional level can help communities to prepare localised responses and adapt to changing fire regimes in a culturally-appropriate way. Studies often focus on addressing each aspect of these changes individually. Here, we aim to provide a holistic picture of how fires are changing at a global and regional level, considering the whole process chain of the fire event from beginning to end to inform future planning.
This third State of Wildfires report represents an annual effort to systematically catalogue extreme wildfire events, explaining anomalies in the record, their hydroclimatic drivers, attribution to climate change, and projected future changes (Jones et al., 2024b; Kelley et al., 2025). As well as collating records of extreme fire activity from Earth observations, we draw on regional expert panels from each continent to help identify events considered extreme in terms of their social, economic, and ecological impacts, thereby capturing important dimensions of fire activity not always visible in satellite data. Overall, this report capitalises on recent advances in the study of extreme fire events and seasons to provide timely information about shifting fire regimes and their causes. The findings of the report are relevant to organisations involved in all phases of the fire cycle, from wildfire prevention and planning to early warning and management, as well as to policymakers, the media, and the wider public.
1.2 Objectives of this Report
The State of Wildfires report brings together the latest science, tools and datasets for extreme fire monitoring, attribution and modelling to track how wildfire impacts on society and the environment are changing and to explain the drivers behind these shifts. It forms the foundation of the wider State of Wildfires Project (2026; https://stateofwildfires.com/, last access: 22 July 2026), which aims to deliver insights into climate, land-use, and fire management policy to decision-makers and practitioners, ultimately supporting stronger societal and environmental resilience to wildfire. In this edition of the State of Wildfires report, we address the following objectives:
-
Identify extreme individual wildfires or extreme wildfire seasons globally over the period March 2025–February 2026, and place them in the context of recent trends;
-
Shortlist three “focal” extreme events (extreme individual wildfires or extreme wildfire seasons) with notable impacts on society or the environment, which are the subject of dedicated analysis in subsequent report sections;
-
Assess the impacts of extreme wildfire events globally and for each focal event, in terms of the exposure of population, physical assets (built environment), protected areas and forest carbon projects to fire, as well as their impacts on air quality;
-
Diagnose the contributions of weather, fuel dryness, fuel load, ignitions, and suppression to the occurrence of each focal event;
-
Attribute each focal event to anthropogenic influence by testing the role of climate change on fire weather and BA extent;
-
Project future changes in the probability of each focal event under future climate scenarios.
To address objectives 1 and 2, we build a comprehensive dataset of fire metrics, including BA, fire counts, fire carbon emissions, and regional statistics of individual fire properties such as size and rate of growth, all for consistent world regions, and quantitatively identify anomalies in these metrics during the past fire season. For objective 3, we assess population, assets, carbon mitigation projects and protected area exposure, and conduct an air quality impact assessment globally and regionally. We leverage available weather reanalysis, fuel modelling and satellite observations and employ a state-of-the-art explainable AI fire modelling framework (SPARKY, McNorton et al., 2024) to pinpoint the causes of the extreme fire events of 2025–2026 for objective 4. To address objective 5, we calculate changes in fire weather using an ensemble of models and observations in simulations with and without climate change, and employ the probabilistic Bayesian model ConFLAME (Kelley et al., 2019; Barbosa et al., 2025) to attribute changes in extreme BA extent. For objective 6, we project future changes in fire season weather and the likelihood of the fire weather comparable to that observed in 2025–2026. We use ConFLAME to project future BA under different climate scenarios. We also analyse annual fire behaviour, covering BA, size, and intensity, using the BURNN (Lampe et al., 2026) and Haas et al. (2026) models.
The State of Wildfires report was launched in 2024 and is an annual report that can harness and adopt new methodologies developed by the scientific community in the interim between its yearly publication. Over the coming years and decades, we aim to enhance the tools presented in this report to predict extremes with increasing lead times, monitor emerging situations in near-real time (NRT), and explain their causes rapidly, thus enhancing our ability to deliver timely insights to decision-makers when they are most needed.
2.1 Extreme Wildfire Events of 2025–2026
2.1.1 Overall Approach and Definitions
As in our previous editions of this report, we define extremes in the 2025–2026 global fire season using two overarching approaches: firstly, through assessment of Earth Observations of fire from global satellite and data-driven modelling products (Sect. 2.1.1), and; secondly, through consultation of panels of experts from six vegetated continents (Sect. 2.1.2). Since our first report, the global fire season is defined as occurring in March–February windows oriented around the annual minima of global fire activity in boreal spring (Jones et al., 2024b; Boschetti and Roy, 2008; Giglio et al., 2013). This definition places the reporting boundary after the austral fire season and before widespread burning in the boreal extratropics. However, it is less well suited to northern South America, Southeast Asia, and Central America.
Due to the diversity of environmental settings in which fires occur and the range of ecological, economic, or societal impacts caused, defining an extreme fire or an extreme fire season remains inherently challenging and a universally accepted objective definition of “extreme” remains elusive. To date, extreme fires have commonly been defined by their BA extent, intensity, or severity, by their feedback on the global climate, and by their socio-economic and ecological impacts (Linley et al., 2022, 2025; Driscoll et al., 2024; Cunningham et al., 2024; Tedim and Leone, 2020). We reviewed the range of approaches that can be taken to identify extreme wildfire events in our inaugural report (see Appendix B1.1 of Jones et al., 2024b). Recognising these complexities and the need for transdisciplinary processes to establish robust criteria in future work, this report maintains the deliberately broad and flexible definition of extreme, precisely following the definition used in our previous reports (Jones et al., 2024b; Kelley et al., 2025). For our full justification of this approach, please see Appendix B1.1 of Jones et al. (2024b).
2.1.2 Identifying Extreme Fire Seasons and Events from Earth Observations
We catalogued the extreme regional wildfire events or annual fire seasons in the period March 2025–February 2026 based on anomalies in the distribution of several observable fire metrics from Earth observations. Since our inaugural report on the 2023–2024 fire season (Jones et al., 2024b), the observable metrics that we assess have included: regional fire counts; regional BA and carbon emissions totals, and; regionally sampled statistics describing fire sizes and rates of spread (95th percentile and maximum values). In our second report on the 2024–2025 fire season, we introduced one new metric: the average fire's peak intensity calculated regionally as the average of the 95th percentile fire radiative power (FRP) values observed for individual fire perimeters (Kelley et al., 2025). In this report, we do not add further metrics but we do: update the source of one carbon emissions dataset (GFED5.1 replaces GFED4.1s, see Sect. “Input Data”); update the source of FRP observations (NASA FIRMS is now used, replacing the MOD14A1 and MYD14A1 products, see Sect. “Input Data”); alter our calculation of the carbon emissions anomaly (see Sect. “Calculating Regional Anomalies in Fire Observations”), and; refine our calculation of the average fire's peak intensity (see Sect. “Input Data”).
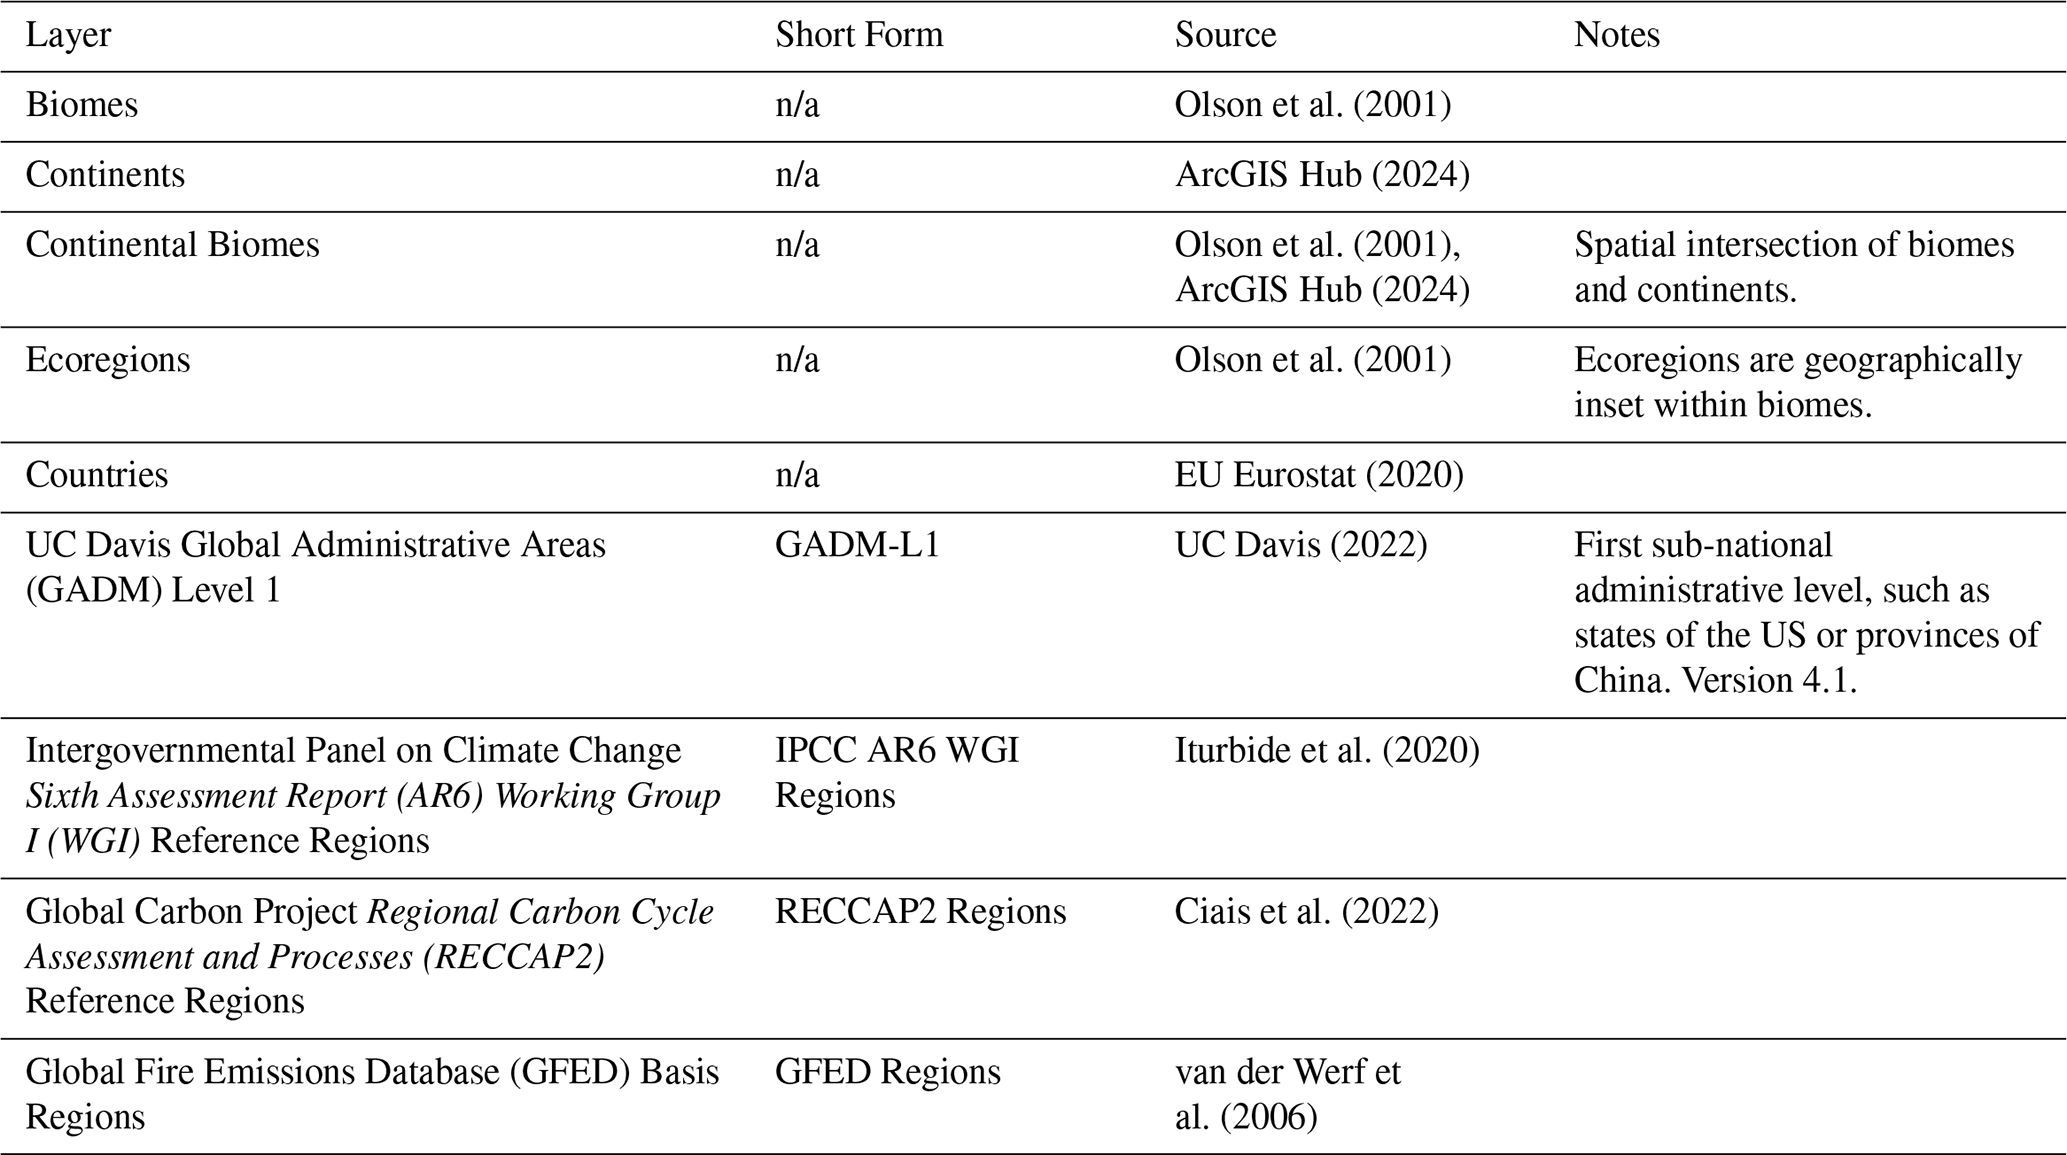
All metrics are calculated for several regional layers shown in Table 1, which represent a variety of biogeographical boundaries (e.g. biomes and ecoregions), geopolitical boundaries (e.g. countries), and regions used in major scientific reports (e.g. by the Intergovernmental Panel on Climate Change or the Global Carbon Project's Regional Carbon Cycle Assessment and Process). These layers are unchanged from our previous report.
Table 1Regional layers to which global Earth observations were disaggregated and used to define regions with extreme wildfire seasons or extreme individual wildfire attributes. Regional layers are available from Jones et al. (2026b). n/a – not applicable
Input Data
Table 2 lists all datasets, source variables, and derivative variables used in the current update of the State of Wildfires Report. In brief, unchanged data sources include: BA is primarily derived from the MODIS MCD64A1 BA product (Giglio et al., 2018); individual fire size and rate of growth properties are derived from the Global Fire Atlas (Andela et al., 2019). Here, we focus on describing the two changes made to input data sourcing since our previous report. The reader is directed to our two previous reports for full details regarding other source datasets (Jones et al., 2024b; Kelley et al., 2025), however a brief summary of the metrics derived from each dataset is provided in Table 2. Note that all datasets and analyses were updated through February 2026 to support our assessment of anomalous fire activity in the 2025–2026 fire season.
Table 2Datasets used in this update of the State of Wildfires Report, noting any changes in use since the prior report (Kelley et al., 2025). Data periods are extended through February 2026 in all cases. Regional data values are available from Jones et al. (2026b).
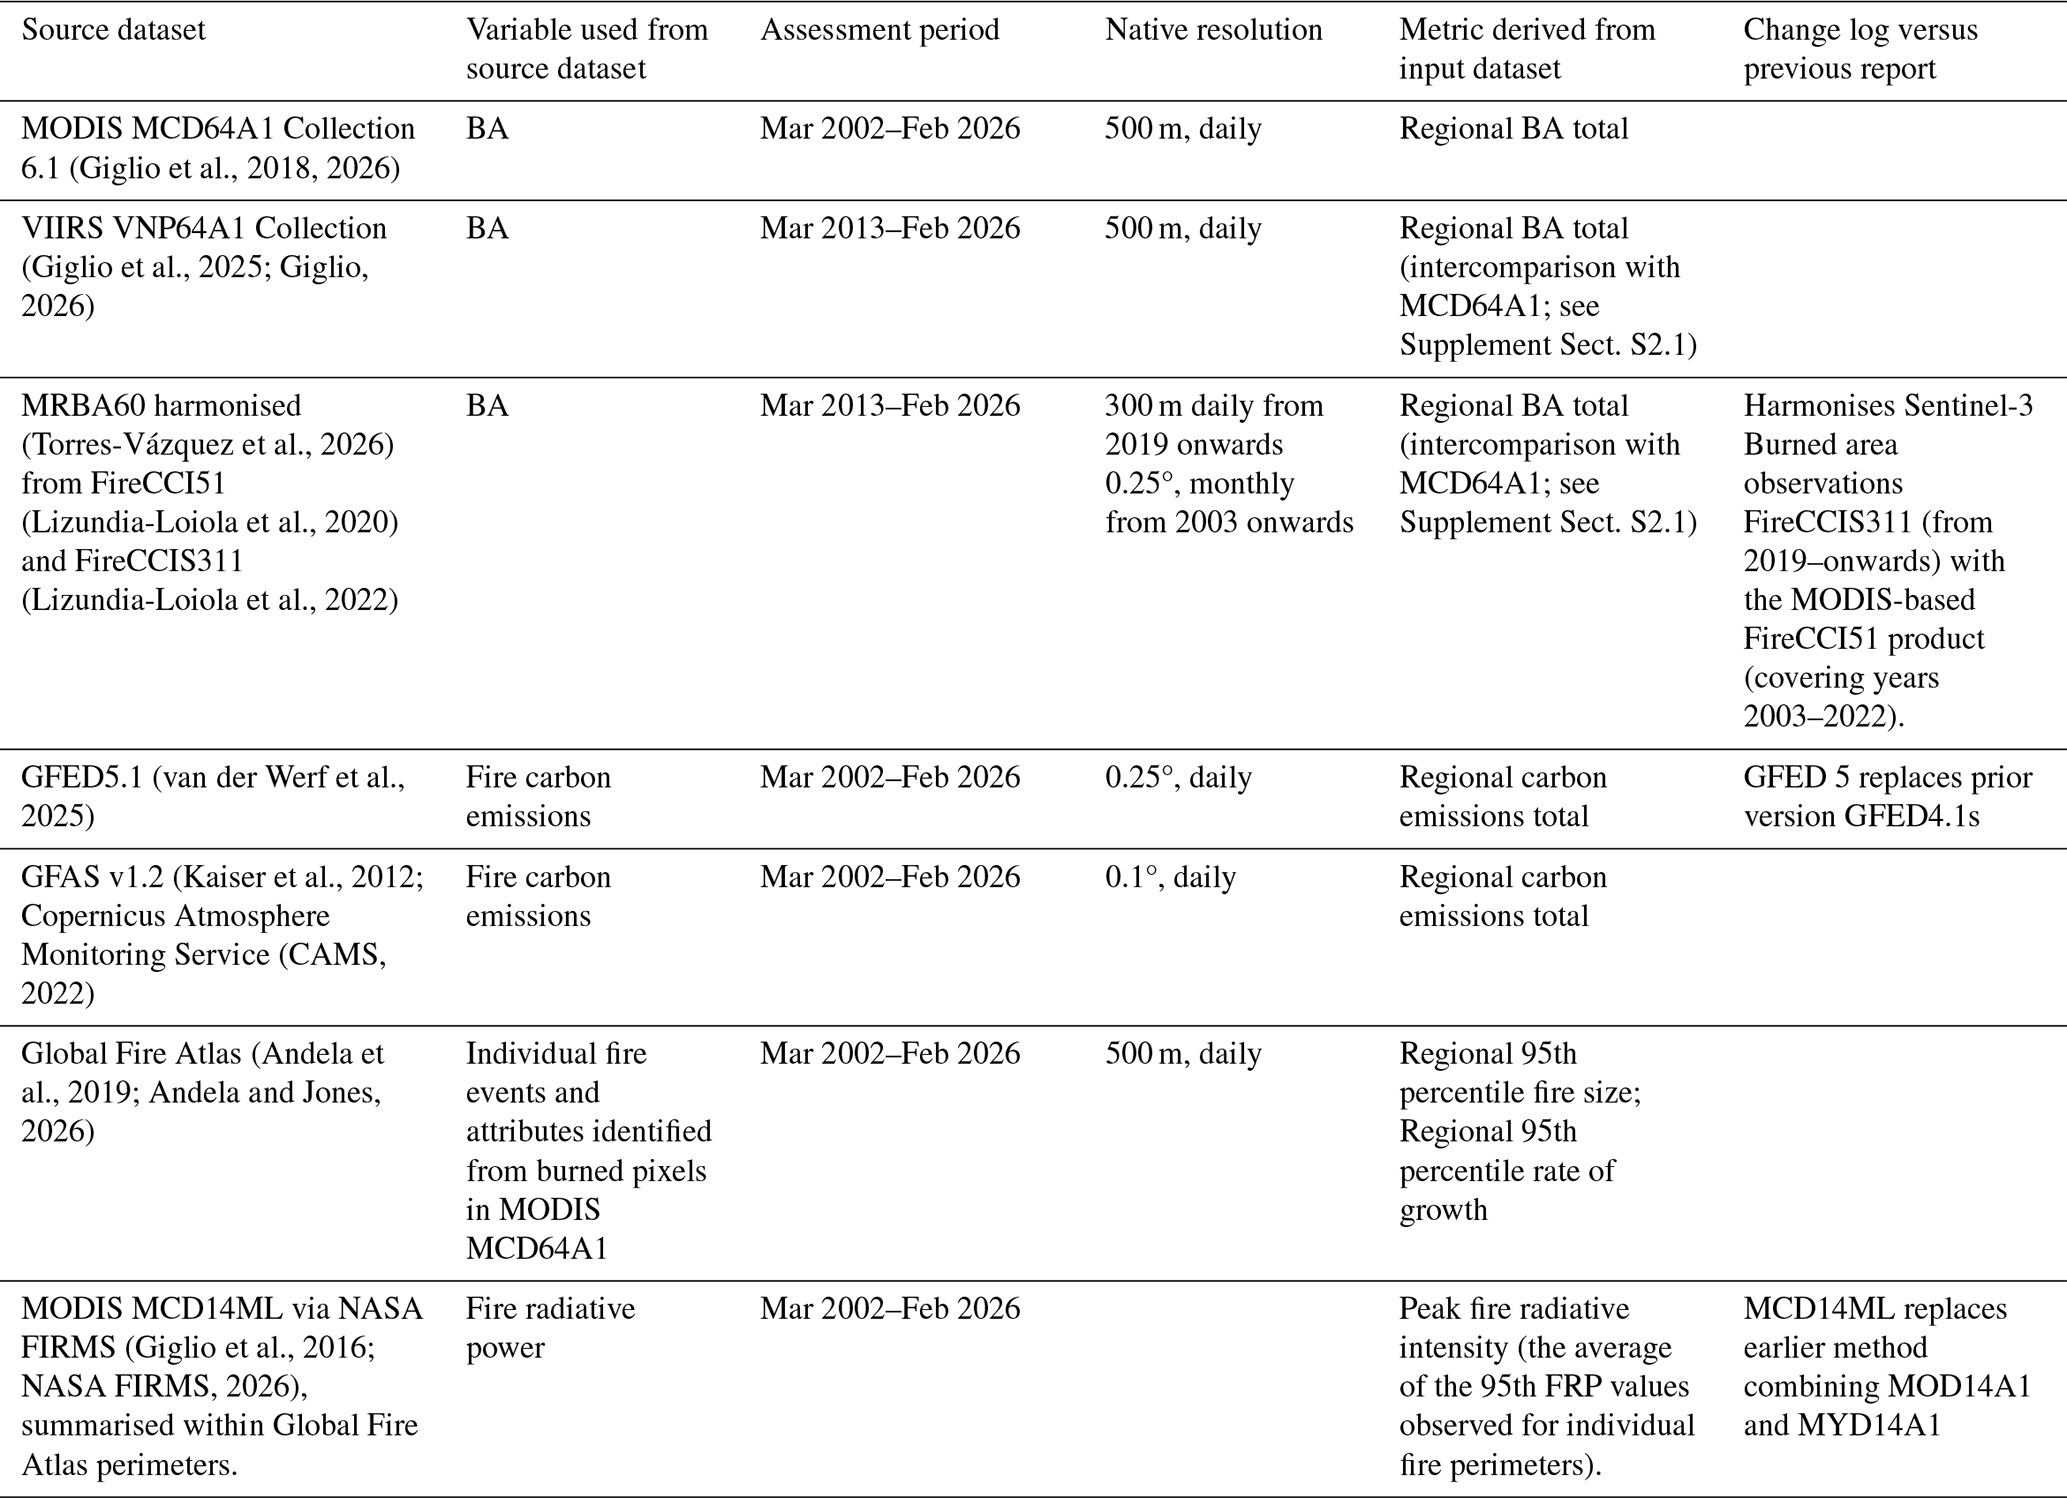
The first substantial change to our input data was the replacement of the Global Fire Emissions Database (GFED) version 4.1s (GFED4.1s, van der Werf et al., 2017; as used in Kelley et al., 2025) carbon emissions with GFED5.1 (van der Werf et al., 2025; Chen et al., 2026b). Our emissions record combines standard GFED5.1 estimates covering 2003–2022 with the GFED5.1 near-real-time extension (GFED5NRT; Chen et al., 2026b) from 2023 to February 2026. GFED5.1 substantially revises GFED4.1ss by using a larger, better-constrained BA estimate, though at a relatively coarse resolution of 0.25° (Chen et al., 2023). It captures more small and agricultural fires than GFED4.1s and MCD64A1, and major updates from GFED4.1s include a 500 m fuel-consumption model aggregated to 0.25° and updated emission factors (Binte Shahid et al., 2024), including dynamic savanna emission factors (Vernooij et al., 2023). GFED5.1 generally gives higher carbon emissions than GFED4.1s, globally amounting to a 65 % uplift in total emitted carbon. However, the uplift is uneven, with especially large increases in fragmented or human-dominated regions such as Southeast Asia, Europe and Central America, while equatorial Asia decreases slightly because of recalibrated peat-fire emissions in GFED5.1 (van der Werf et al., 2025). GFED5NRT extends the record using VIIRS active-fire observations, converting active-fire counts to burned area using biome- and region-specific effective-fire-area relationships calibrated against standard GFED5, and estimating emissions using corresponding GFED5-derived fuel-consumption relationships. Although this differs from the full GFED5.1 methodology, evaluation over the overlapping period shows that GFED5NRT broadly reproduces GFED5.1 spatial patterns, seasonal cycles and interannual variability.
The second significant change was the replacement of the Terra and Aqua Moderate Resolution Imaging Spectroradiometer (MODIS) daily thermal anomaly products, MOD14A1 and MYD14A1, with the MCD14ML active-fire product, accessed through NASA Fire Information for Resource Management System (FIRMS; Giglio et al., 2016; NASA FIRMS, 2026). MOD14A1 and MYD14A1 (used in Kelley et al., 2025) are gridded raster products resampled to fixed 1 km spatial grids. By contrast, MCD14ML is a vector point dataset based on the same underlying Terra and Aqua MODIS observations, but combining them into records of individual fire-pixel detections with geographic coordinates, timestamps and FRP values. This change impacts the 95th percentile of FRP values assessed for individual fires by preserving the statistical distribution of individual detections, avoiding the distortion that occurs when the pre-processed daily maximum values from MOD14A1 and MYD14A1 are used.
In our intercomparison of MODIS MCD64A1 with other available BA records, we now include a comparison with the ESA MRBA60 BA product combining the FireCCI51 and FireCCIS311 BA products (Torres-Vázquez et al., 2026; Lizundia-Loiola et al., 2020; Lizundia-Loiola et al., 2022) for the period 2013–2026 (see Supplement Sect. S2.1), which replaces our comparison with FireCCIS311 for the years since 2019 presented in Kelley et al. (2025). In addition, we compare MODIS MCD64A1 observations with the VIIRS VNP64A1 BA product (Giglio et al., 2025) for the period 2013–2026 (see Supplement Sect. S2.1), extended from the years since 2019 in Kelley et al. (2025). 2013–2016 is the period of mutual observations by MCD64A1, VNP64A1 and FireCCI MRBA60.
Input Data Uncertainties
We do not substantially update our assessment of input data uncertainties in this report, as our data sources are largely identical or highly related to those used previously. The reader is referred to the full discussion provided by Kelley et al. (2025). Here, we highlight only the main uncertainties and any effect of transitioning to new data product versions such as GFED5.1 and MCD14ML (see Table 2).
The MODIS MCD64A1 BA product is known to underestimate absolute BA, mainly because small, short-lived, agricultural, or obscured fires are often missed at 500 m resolution. Comparisons with higher-resolution data and products, including small-fire corrections suggest under-detection of approximately 50 %, and substantially higher global BA when small fires are included (Chuvieco et al., 2022; Chen et al., 2023). However, these omissions are relatively consistent through time, making MCD64A1 suitable for anomaly-based analyses of regional variability and trends (Chen et al., 2023).
Fire carbon emissions estimates are uncertain because of errors in BA or active fire detection, fuel type and consumption, combustion completeness, and emission factors. GFED5.1 includes improved BA corrections, 500 m fuel consumption modelling, and updated emission factors, resulting in substantially higher global emissions than GFED4.1s and better agreement with atmospheric constraints for some major fire events (van der Werf et al., 2025). However, GFED5.1 uncertainties remain substantial and difficult to quantify, with cropland burning highlighted as particularly uncertain because of limited field constraints on fuel consumption. Global uncertainties for earlier GFED versions and GFAS are typically around ±20 %–25 % at one standard deviation, but new insights such as the importance of previously ignored small fires indicate these datasets are biased low and reported uncertainties are conservative (Wiedinmyer et al., 2023; Parrington et al., 2025). While absolute values remain uncertain across products, there is better agreement on trends. We therefore continue to report anomalies compared to the baseline climatology alongside total BA and emissions, which makes understanding long-term changes easier through data upgrades. Emissions estimates from both GFED5.1 and GFAS represent the total carbon (C) emitted from fires, encompassing carbon released as CO2, CO, CH4 and other carbon-containing species. Although both datasets provide estimates of individual emitted species, our analysis does not distinguish between them or account for differences in their global warming potentials (GWP). Importantly, these gross emissions estimates also exclude subsequent carbon uptake during post-fire ecosystem recovery, which influences the longer-term net contribution of fires to atmospheric CO2. We therefore report emissions in C terms and do not convert them into CO2-equivalent climate impacts, which would require consideration of both the composition of emitted species and the longer-term carbon balance of affected ecosystems.
MODIS fire radiative power is affected by missed active fires, limited overpass frequency, cloud, smoke, canopy cover, low-intensity combustion, and occasional non-fire thermal anomalies. Commission errors are generally low, often below 10 %, while individual-pixel fire radiative power uncertainty is around 27 % at one standard deviation, declining substantially when observations are aggregated across multiple pixels or fires (Freeborn et al., 2014; Giglio et al., 2016; Wooster et al., 2021). An additional consideration for this year's analysis is the change in the statistical unit used to estimate high-percentile fire radiative power. In previous reports, the 95th percentile was calculated from MOD14A1 and MYD14A1 daily maximum fire radiative power values on a fixed 1 km grid, meaning the input distribution was already filtered towards grid-cell daily peaks, which could inflate the reported percentile. In the present report, the 95th percentile is instead calculated from MCD14ML individual active-fire detections, accessed through the NASA FIRMS system, which preserves the detection-level fire radiative power distribution within each fire perimeter. This change primarily reduces structural bias in the percentile estimate, rather than removing the underlying observational uncertainty associated with MODIS FRP retrieval.
Calculating Regional Anomalies in Fire Observations
Our approach for calculating regionally-aggregated values remains largely consistent with our previous two reports. Briefly, we calculated regional totals of BA, fire carbon emissions, and fire counts using the regional layers defined in Table 1 for each March–February fire season. Monthly BA and fire carbon emissions totals were derived by aggregating the input datasets spatially and temporally for each region. Regional fire counts were calculated for each March–February fire season as the number of Global Fire Atlas ignition points within each region.
In addition, we used the Global Fire Atlas to identify regions where unusually large or fast-moving fires occurred during March 2025–February 2026 (Andela et al., 2019). For each region and fire season, we summarised the largest fire, the fastest daily rate of growth, and the 95th percentile values of fire size and rate of growth. For our estimate of the average fire's peak intensity, first, we assign each Global Fire Atlas event a 95th percentile FRP value based on observations within its fire perimeter and date range, and then we average those event-level peak intensity values by region and fire season.
For each region, we calculated anomalies in each observable metric for the March 2025–February 2026 fire season relative to all previous March–February periods since 2002 (since 2003 for fire carbon emissions). Anomalies were expressed in several ways: as percentage differences from the mean of previous fire seasons, standardised deviations from the mean of previous fire seasons, and ranks among all fire seasons in the observational record, including 2025–2026. Data for all fire seasons and anomalies for the 2025–2026 fire season are available from Jones et al. (2026b).
The most substantial change to our anomaly reporting versus previous reports was as follows. Previously, we calculated “multi-product” fire carbon emissions anomalies by first averaging annual emissions from GFED4.1s and GFAS for each fire season, and then calculating anomalies from that combined time series. For 2025–2026, we changed this approach because the transition from GFED4.1s to GFED5.1 substantially increased absolute emissions estimates in the GFED product family, whereas the latest GFAS version, v1.2, remains calibrated to earlier, lower GFED3 estimates (Kaiser et al., 2012). Until GFAS is recalibrated to GFED5, we therefore calculate fire carbon emissions anomalies separately for GFED5.1 and GFAS, then report the mean of the product-specific anomalies. This retains information from both products while avoiding a direct average of inconsistent absolute emissions estimates. Jones et al. (2026b) provide regional emissions values from GFED5.1 and GFAS for each fire season, as well as anomalies for each product and the average anomaly from both products for the 2025–2026 fire season.
Extreme or Anomalous Value Identification
As in our previous reports, we identified extreme regional fire seasons using the rank, percentage anomaly, and standardised anomaly values of each observable metric outlined above. Per Sect. 2.1, we intentionally define extreme events broadly, but for visualisation purposes we highlight regions where 2025–2026 ranked among the top five fire seasons on record, approximately corresponding to the upper quartile of the available observational records from all fire seasons since 2002–2003.
We also characterised the timing of anomalous events on a monthly timescale by identifying the month with the largest positive anomaly in BA, then defining onset and cessation as the bounds of consecutive above-average months before and after this peak (constrained to March 2025–February 2026). The resulting onset and cessation data for the 2025–2026 fire season are available from Jones et al. (2026b) and presented in Supplement Sect. S2.5.
2.1.3 Identifying Extreme Fire Seasons and Events through Expert Consultation
As in our previous reports, we assembled regional expert panels for each continent to provide additional context on the extreme and impactful nature of the latest fire season (Table 3). The panels bring vital knowledge of regional fire regimes, land management, exposure, and vulnerability, making them well placed to judge whether specific fire seasons or events were exceptional in context. They helped identify and describe events that were societally or environmentally significant but may not have been fully captured by Earth observations because of their scale, duration, timing, or obscuration by cloud or canopy cover. These included fires associated with major suppression challenges, fatalities, evacuations, displacement, infrastructure damage, air or water quality impacts, livelihood disruption, cultural impacts, or disturbance to vulnerable ecosystems and ecosystem services. Rather than applying fixed quantitative thresholds, we asked in-region experts to identify events whose impacts were large enough to enter public or political discourse, drawing on regional fire records, agency and disaster-management reports, news and social media. The panels also contextualised fire seasons identified as extreme by Earth observations or regional assessment, recognising that observed impacts reflect not only fire behaviour and climate conditions but also exposure, vulnerability, governance, funding, and policy decisions. In this way, the expert panels provide vital interpretation of which fire seasons and events should be considered extreme, and why, beyond what can be inferred from Earth observations alone.
Table 3Expert panellists contributing to the identification of extreme events and characterisation of the global fire season during March 2025–February 2026.
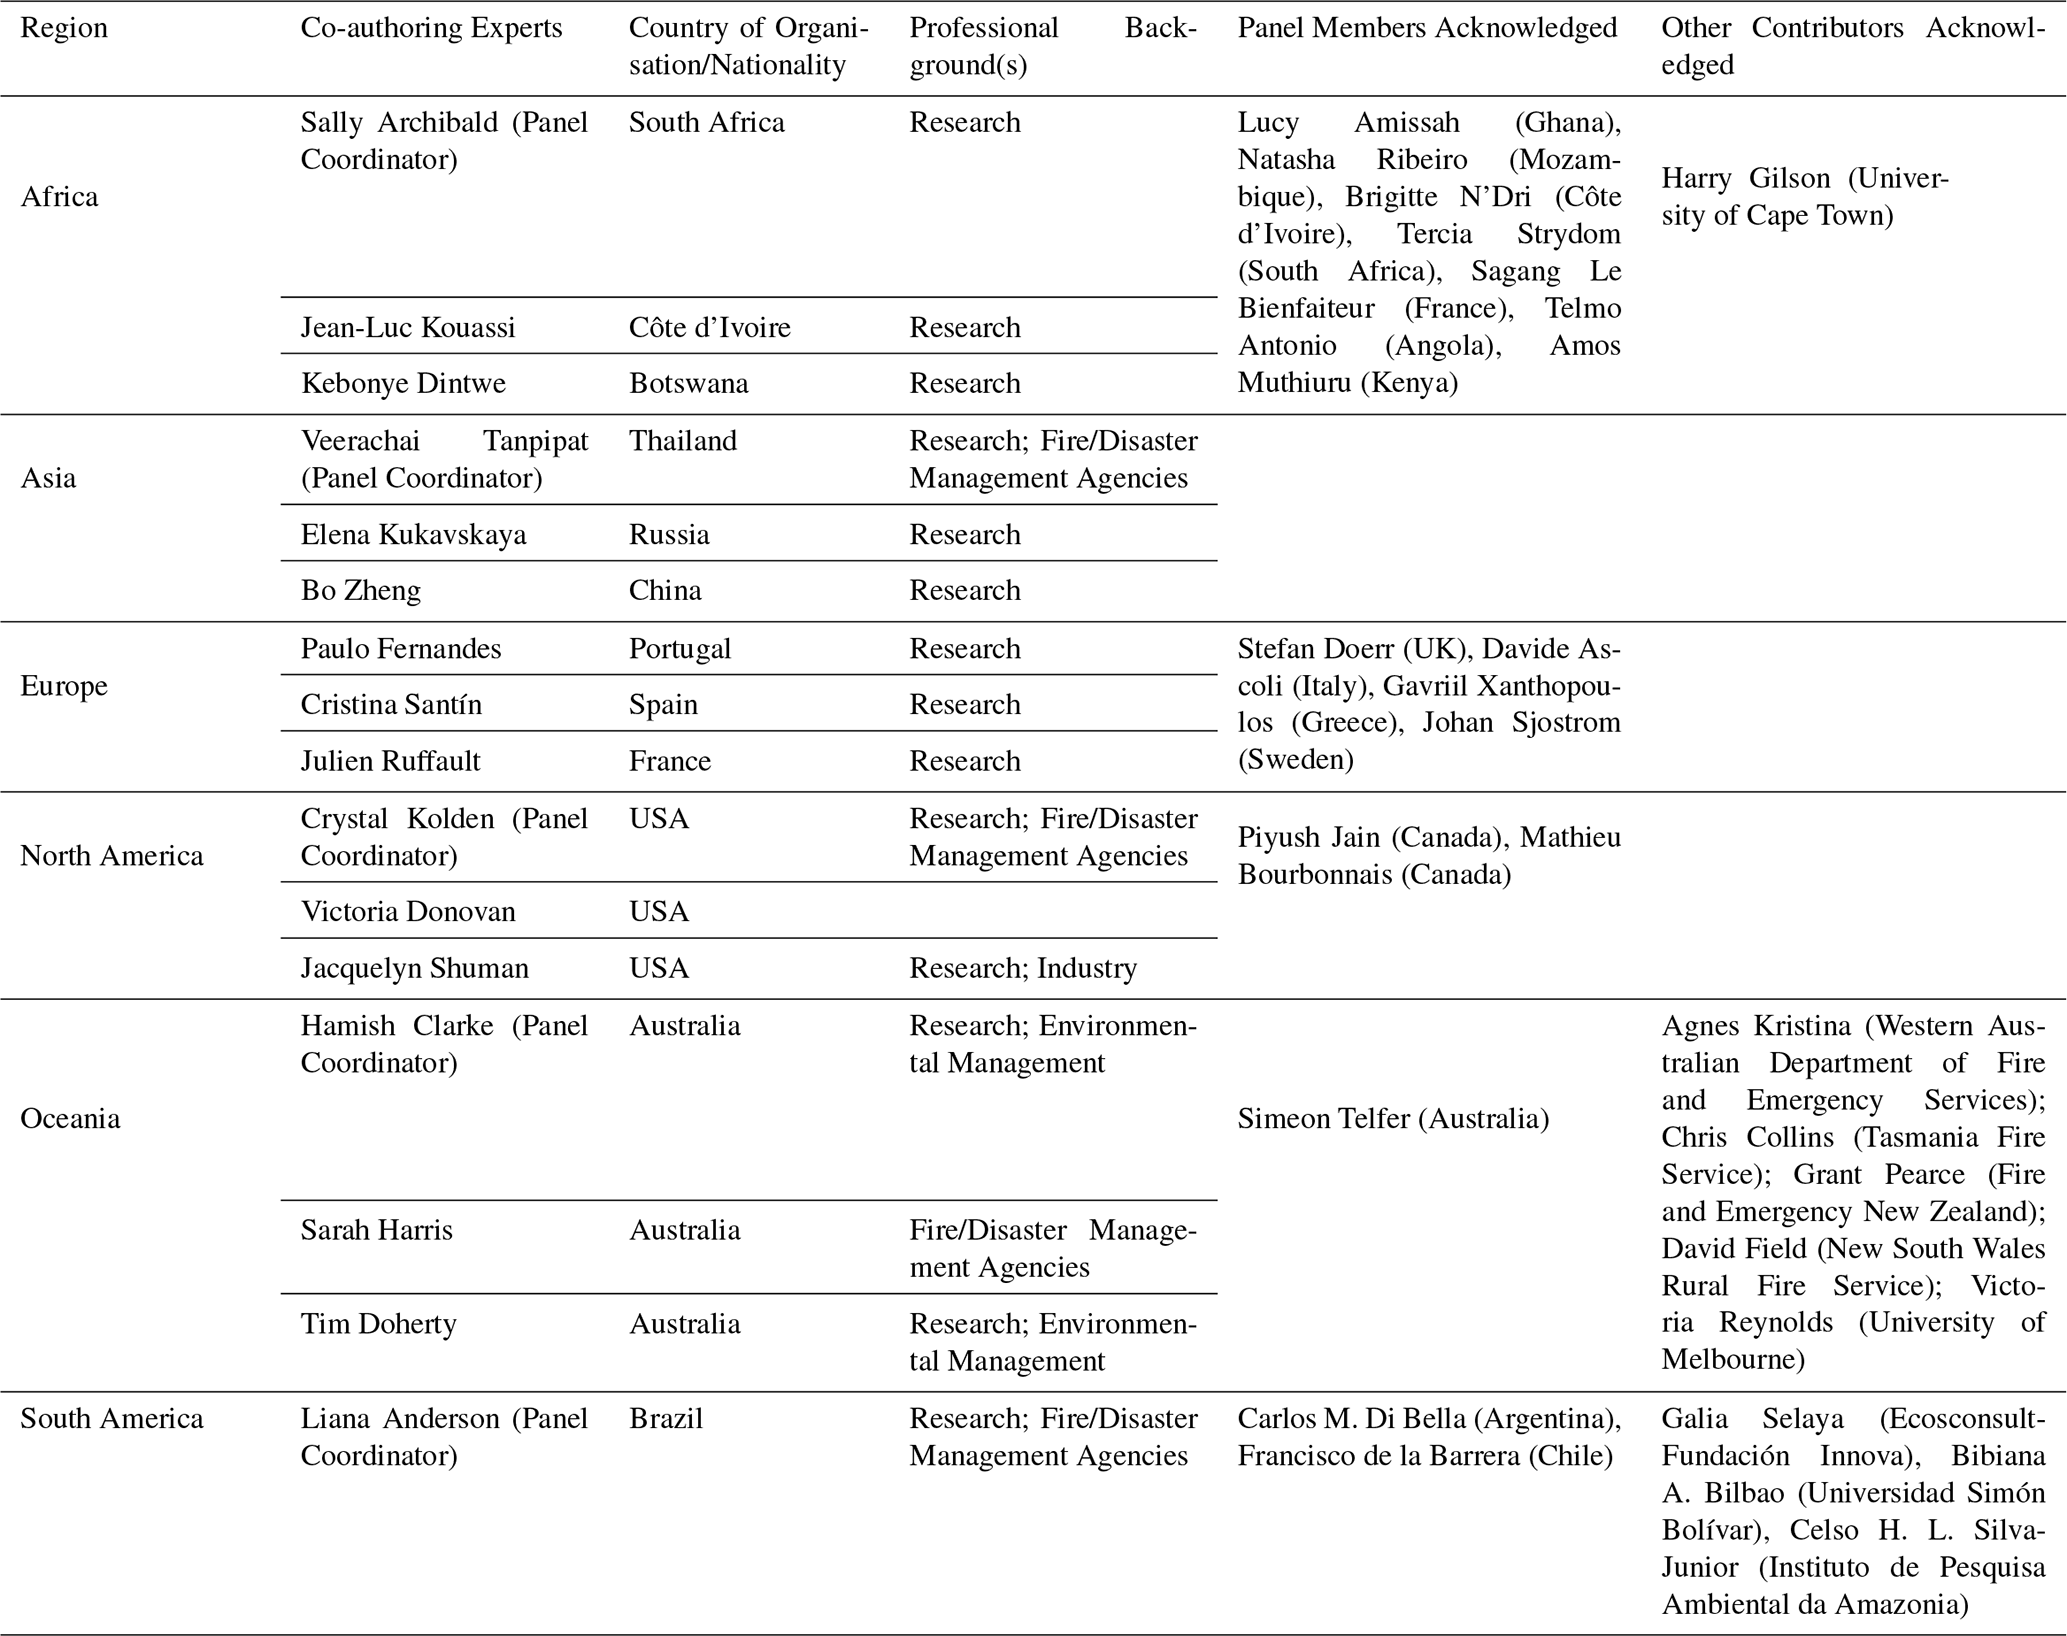
From this edition onwards, each continental expert panel publishes its regional assessment as a standalone article rather than as an appendix to the core State of Wildfires report. This change makes the panel assessments independently accessible and citable, gives appropriate credit to the regional contributors who gather and interpret evidence for their regions, and allows panels to involve additional experts whose experience is most relevant to the latest fire season. It also helps keep the core report concise and accessible for a broad readership. Section 3.3 therefore summarises the main findings of the continental assessments, which are presented in full elsewhere (Dintwe et al., 2026; Kukavskaya et al., 2026; Fernandes et al., 2026; Kolden et al., 2026; Reynolds et al., 2026; Anderson et al., 2026).
2.2 Global Impact Assessments
In our report on the 2024–2025 fire season, we introduced several global-scale impact assessments including population, physical asset, and forest carbon project exposure to fire. Analysis of the impact of fires on air quality was also introduced for selected regions. Key advances in this report include: a refined method of accounting for population and asset exposure through analysis at higher resolution; a new analysis of protected area exposure extending from recent work by Resco de Dios et al. (2025); and the expansion of regional air quality impact modelling to the global scale. Reporting of all analyses is now provided consistently for the regional layers listed in Table 1, with anomalies for the 2025–2026 fire season also reported for all impact analyses. Anomalies are calculated and reported in the same way as for Earth observations of fire (see Sect. “Calculating Regional Anomalies in Fire Observations”).
2.2.1 Population Exposure Assessment
In the 2024–2025 report, population exposure to fire was estimated using the CLIMate ADAptation (CLIMADA) global risk assessment platform, following the gridded exposure framework of Aznar-Siguan and Bresch (2019). In that approach, monthly MODIS MCD64A1 BA was aggregated to a 150 arcsec grid and multiplied by gridded population estimates from WorldPop on a 4 km grid for the reference year 2018 (Eberenz et al., 2020), providing a consistent global estimate of population exposed to BA at coarse resolution. For this report, we replace that workflow with the high-resolution event-based method introduced by Teymoor Seydi et al. (2025), which overlays annual WorldPop population data at ∼ 100 m resolution with individual fire perimeters from the Global Fire Atlas. This improves the spatial precision of exposure estimates and allows exposure to be assigned to individual fire events. The new approach also screens the Global Fire Atlas record to retain only wildland fires and remove agricultural burns, urban heat signatures, persistent thermal anomalies, and hot-desert artefacts that can spuriously inflate exposure estimates (see Teymoor Seydi et al., 2025). We therefore define direct population exposure as the number of people residing within filtered wildland-fire perimeters. Uncertainty propagates from the commission and omission errors in the underlying BA products (Sect. “Input Data Uncertainties”). Misallocation of population in the WorldPop density grid is most uncertain in cells with a high density of informal housing and less certain in rural than urban areas (Thomson et al., 2022). Moreover, the metric only captures direct exposure within fire perimeters and excludes indirect impacts such as smoke exposure or precautionary evacuations (Teymoor Seydi et al., 2025).
The data produced using these methods are available from Teymoor Seydi et al. (2026).
2.2.2 Physical Asset Exposure Assessment
Physical asset exposure follows the same event-based fire-exposure framework as the population exposure analysis, but replaces gridded population with gridded physical asset value. In the 2024–2025 report, asset exposure was estimated using CLIMADA (Aznar-Siguan and Bresch, 2019) and the exposure layer LitPop for the fixed reference year 2018. LitPop spatially distributes nationally produced capital estimates (World Bank, 2024) using night-light intensity and population density (Eberenz et al., 2020). In the 2024–2025 report, the gridded asset values were multiplied by monthly MODIS BA fractions aggregated to a 4 km grid. For this report, we retain the CLIMADA/LitPop approach for distributing produced-capital estimates in space, but use an annual representation on a 1 km grid and intersect it with the same filtered Global Fire Atlas wildland-fire perimeters used for the population exposure analysis, following the event-based approach of Teymoor Seydi et al. (2025). This produces fire-event-level estimates of the value of physical assets located within burned perimeters, while reducing spurious exposure from agricultural burns, urban heat signatures, persistent thermal anomalies, and hot-desert artefacts. As with population exposure, asset exposure indicates the value of assets located within filtered wildland-fire perimeters and does not imply damage or loss.
The data produced using these methods are available from Steinmann et al. (2026).
2.2.3 Air Quality Impact Assessment
As in our previous report (Kelley et al., 2025), we assessed the contribution of anomalous fire activity to degraded air quality using the ECMWF Integrated Forecasting System configured for atmospheric composition (IFS-COMPO) which is at the core of the Copernicus Atmosphere Monitoring Service (CAMS) for the global domain. Fire smoke affects human health through exposure to fine particulate matter (PM2.5), ozone, carbon monoxide and other toxic compounds, with acute exposure linked to respiratory and cardiovascular illness, increased mortality, reduced visibility, and wider mental-health impacts (Johnston et al., 2024; Xu et al., 2024). Seasonal biomass burning and fire emissions have impacts on local and transboundary air quality in many regions around the world throughout the year (for example, in Southeast Asia; Gu et al., 2024), but extreme fires can increase these impacts. ECMWF IFS-COMPO simulates trace gas and aerosol emissions, transport and removal at ∼ 40 km resolution with 137 vertical levels. Daily fire emissions were prescribed from GFAS v1.4.2, which estimates 0.1° biomass burning emissions from satellite fire radiative power, with plume-rise injection following GFAS/IS4FIRES (Kaiser et al., 2012; Rémy et al., 2017). GFAS v1.4.2 applies screening procedures to minimise spurious fire detections associated with industrial sites, reflective surfaces and gas flares. However, these procedures may not eliminate all non-vegetation thermal signals, potentially introducing false fire emissions that could affect simulated PM2.5 concentrations, particularly in regions with relatively little vegetation fire activity.
In previous reports, air quality impacts were assessed only for selected focal events by comparing simulations with and without local fire emissions. For this report, we instead ran two global ECMWF IFS-COMPO simulations for the full 2025–2026 fire season: a factual simulation using observed global fire emissions from GFAS, and a climatological simulation in which 2025–2026 fire emissions were replaced by a 2003–2023 fire emissions climatology from GFAS (the climatological baseline). Both simulations include non-biomass-burning emission sources of atmospheric pollutants described via CAMS pre-compiled inventories, or estimated online when strongly dependent on meteorological conditions. The difference between the two simulations isolates the contribution of anomalous fire activity during 2025–2026 to surface PM2.5 concentrations. This global design allows fire-related air quality degradation to be assessed consistently across all reporting regions listed in Table 1, rather than only within pre-selected focal-event regions.
Simulated surface PM2.5 concentrations were summarised for each reporting region as daily population-weighted mean concentrations using 2020 population data from Gridded Population of the World version 4 (Doxsey-Whitfield et al., 2015). We then compared factual and climatological simulations to estimate the additional PM2.5 exposure attributable to anomalous 2025–2026 fire activity compared to baseline exposure within each region. We report the climatological baseline and observed number of days on which regional population-weighted daily PM2.5 exceeded the World Health Organization 24 h guideline of 15 µg m−3 (World Health Organization, 2021).
The data produced using these methods are available from Di Tomaso et al. (2026).
2.2.4 Protected Area Exposure Assessment
Our analysis of protected area exposure is a new addition to this year's report, with the approach adapted from the published work of Resco de Dios et al. (2025). The exposures are reported for the regions listed in Table 1 and for the March–February fire-season definition. Protected-area polygons were compiled primarily from the World Database on Protected Areas (WDPA), supplemented with national datasets where WDPA coverage was restricted or incomplete, and cleaned to remove overlaps so that co-located designations were not counted repeatedly. Protected areas were treated as multipart sites, meaning that multiple spatial fragments with the same site identifier were analysed as a single protected area. Following Resco de Dios et al. (2025), analyses were restricted to natural and semi-natural burnable vegetation using a wildland land-cover mask, and regions with unavailable or insufficient protected-area data were excluded. Annual MODIS MCD64A1 Collection 6.1 BA (Giglio et al., 2018) was then intersected with the protected area layer to calculate, for each reporting region and fire season, the number and fraction of protected areas exposed to fire, the fraction of total protected area extent burned, and associated relative and standard anomalies.
The data produced using these methods are available from Cunill Camprubí et al. (2026).
2.2.5 Forest Carbon Project Exposure Assessment
Our approach to calculating forest carbon project exposure assessment is largely unchanged from last year, aside from the geographical unit of reporting which now maps onto the regional layers provided in Table 1. We assessed fire exposure across 1798 forestry-based carbon offset projects using digitised project boundaries from BeZero Carbon Ltd., spanning South America (n=324), North America (n=905), Asia (n=228), Africa (n=157), Europe (172) and Oceania (n=12). These projects are a subset of the total number of forest carbon project boundaries digitised by BeZero Carbon Ltd., after excluding JREDD+ projects and project areas larger than 70 000 km2 (a total of 33 projects), which often span multiple countries or entire continents and are therefore not comparable with spatially discrete forest carbon projects. Annual BA was derived from MODIS MCD64A1 Collection 6.1 and intersected with MODIS MCD12Q1 land cover to separate forest and non-forest fire activity (Giglio et al., 2018; Sulla-Menashe et al., 2019). Drought conditions were assessed using 12-month Standardised Precipitation-Evapotranspiration Index (SPEI) calculated from ERA5-Land and calibrated over 1980–2014 (Muñoz-Sabater et al., 2021). For each year since 2002, we calculated the number of projects affected by fire and the mean percentage of project area burned. To place this in the context of climate change, we calculated the 2025 drought anomaly as the 2025 SPEI minus the long-term average SPEI (1980–2024). The results from this drought analysis are presented in Supplement Sect. S2.4.
The data produced using these methods are available from Andela et al. (2026).
2.3 Shortlisting of Focal Events
We selected three focal events for detailed analysis of the drivers and impacts of extreme wildfire activity during March 2025–February 2026. As in our previous assessments, the number of focal events was limited to a computationally manageable set of internationally significant episodes. Events were shortlisted in consultation with the continental expert panels, considering both the magnitude of anomalies in Earth observations, the extremity of fire extent, emissions or behaviour versus fire regime contexts, and the severity of societal and environmental impacts deriving either from our global impact assessments or from other sources accessed by the expert panels. Across our reports, focal events have been selected for their scientific and international significance, rather than solely for the level of international media attention they received. The specific motivations for selecting each focal event are presented in Sects. 4, 5, and 6.
2.4 Hydroclimatic Drivers of Focal Events
Weather, fuel, and ignition are the three primary factors influencing the occurrence and intensity of fire events (Bowman et al., 2009). These broad categories can be further examined to pinpoint individual factors, for example, precipitation and temperature within the weather category or fuel moisture from dead and live vegetation in the fuel category. Analysing the single factors can give an idea not only of the probability of the fire occurring but also of its intensity and behaviour. For example, anomalies below the climatology (here 2003–2024) of dead fuel moisture, due to its higher flammability, often play a significant role in determining potential fire ignition, spread, severity and intensity. Similar to previous editions of the report, we characterise the hydroclimatic conditions associated with each focal event by analysing anomalies in key vegetation and weather drivers. In addition, we perform a SHAP-based model attribution analysis to quantify the contribution of each driver to the final predicted BA, thereby assessing the relative influence of fuel, weather, and human-related factors on the observed fire activity. Anomalous conditions are measured using standardised z-scores computed relative to the climatological (2003–2024) mean and standard deviation. This normalisation allows direct comparison between variables with different physical units and enables the identification of anomalously wet, productive, or dry conditions during the four months preceding the event and the month following its onset. In particular, spring vegetation productivity is characterised using anomalies in fuel biomass, while fire weather is represented through anomalies in temperature, precipitation, humidity, and surface wind. This approach allows us to investigate the hydroclimatic conditions both antecedent and concurrent to the event. Weather data are from ERA5-Land (Muñoz-Sabater et al., 2021; Copernicus Climate Change Service, 2019), and record fuel variables are from (McNorton and Di Giuseppe, 2024)
Beyond this descriptive approach, we formally quantify the relative contribution of the different hydroclimatic drivers to BA anomalies, using the SPARKY modelling framework. SPARKY is a machine-learning-based wildfire prediction system designed to estimate BA occurrence from coupled fuel, weather, and socio-economic predictors (McNorton et al., 2024). Within this framework, the fuel-related component explicitly represents vegetation growth and drying dynamics. In addition, the framework incorporates a suite of socio-economic predictors aimed at representing anthropogenic influences on ignition probability and landscape vulnerability. These include indicators such as population density, road-network density, Human Development Index (HDI), and gross domestic product (GDP), which act as proxies for human activity, infrastructure, and suppression capacity. Attribution is derived using SHapley Additive exPlanations (SHAP; Lundberg and Lee, 2017), which quantify the contribution of each predictor to the model output and allow the relative roles of fuel availability, hydroclimatic conditions, weather extremes, and socio-economic factors to be assessed consistently across fire seasons.
For each grid cell and day, SHAP values are computed in the native log-link space, preserving the full spatiotemporal structure of the model attributions. Daily climatologies of both SHAP values and reconstructed model predictions are then calculated over a 2003–2024 baseline period using a trimmed mean (20th–80th percentile range) for each day, reducing sensitivity to extreme values. Daily SHAP anomalies are then defined relative to this climatology for each predictor.
Because the Tweedie-based model uses a logarithmic link function, SHAP anomalies are transformed into multiplicative perturbations in prediction space through exponentiation. For each predictor, its regional attribution is calculated by weighting these multiplicative anomalies by the climatological model prediction at each grid cell and aggregating them over the focal regions. This gives a daily regional attribution in km2. Predictors are then grouped into physically interpretable categories. The grouping accounts for correlations among predictors and improves interpretability. These categories are assigned to three larger groups of ignition and suppression, fuel, and weather.
Period-attribution metrics are then obtained by averaging these regional attributions over each fire event. For every category, the daily attribution on each event day is compared with its climatological value for the same calendar day. These differences are averaged over the event period to give an event-mean anomaly. A positive anomaly means the category is associated with higher modelled BA than typical for the season, and a negative anomaly means it is associated with lower modelled BA.
The percentage attributed to each category is its share of the total positive anomaly. Each category with a positive event-mean anomaly is divided by the sum of all positive event-mean anomalies for that event and expressed as a percentage, so the percentages for all positively associated categories add up to 100 %. Group-level percentages for ignition and suppression, fuel, and weather are the sums of the percentages of their member categories. Categories with negative event-mean anomalies are left out of the percentage calculation. The percentages therefore show how the positive departure of modelled BA from climatology is split among categories within the model.
These diagnostics describe sensitivities within the model representation and are not definitive causal attribution of observed BA.They provide a physically interpretable decomposition of the factors associated with anomalous modelled fire-season activity.
2.5 Influence of Climate Change on Focal Events
As an update to last year's report, and working towards a more integrated and seamless attribution approach, we focus on attributing changes in fire weather and BA due to climate change for our three focal extreme events, and present the attribution analysis alongside projected changes in fire characteristics with future climate change. Linking both present-day and future attribution analysis in this way enables a more evidence-driven approach to the results.
2.5.1 Attribution of Present Day Focal Events – FWI
To assess the influence of climate change on fire weather for the observed focal events, we calculate the Canadian Fire Weather Index (FWI) as presented in previous State of Wildfire reports (Jones et al., 2024b; Kelley et al., 2025). This uses daily temperature, mean relative humidity, 10 m wind speed, and total daily precipitation.
This year, we follow the multi-model method from the World Weather Attribution Protocol, described in Philip et al. (2020), as follows. We calculate the “observed” FWI using ERA5 reanalysis data (Hersbach et al., 2020) for the month and region of the focal event (our “event definition”, as defined in Sect. 3.3.7). We then calculate the FWI across all CMIP6 (Eyring et al., 2016) and HighResMIP (Haarsma et al., 2016) models (labelled “models”). We assess the performance of each climate model and ensemble member regionally using a qualitative comparison of the seasonal cycle and spatial pattern for a 1990–2019 climatology, and the parameters of the fitted statistical models. If the model does not pass in any one of these three criteria, it is excluded from the analysis (see Supplement Sect. S1.2.1) for full model evaluation details). For each time series, we fit a Generalised Extreme Value (GEV) model, scaled by a 4-year smoothed Global Surface Air Temperature (GSAT). This allows us to compare the climate of the preindustrial past (1850–1900, representing our “counterfactual” scenario) to the climate of today (calculated as 1.3 °C warmer, based on the Global Warming Index (Leedham et al., 2026), representing our “factual” scenario). We do the same for reanalysis products. We use ERA5 for all focal regions, and MERRA2 for Northwest Iberia. MERRA2 is excluded for Chile as 2026 data wasn't available at the time of processing, and for Canada as the seasonality and spatial pattern were found to be incorrect compared to data from ERA5 and National Research Council Canada. The reanalysis and models are combined to give the synthesis; a best estimate following the method of Otto et al. (2024). We calculate the Probability Ratio (PR), defined as the ratio of the probability of an FWI event with the observed return period occurring in the factual vs counterfactual climate, across all models and reanalyses.
The CMIP6 ensemble includes 9 models (CanESM5, CNRM-ESM2-1, GFDL-CM4, MIROC6, MIP-ESM1-2-LR, MRI-ESM2-0, AWI-ESM-1-REcoM, INM-CM4-8 and INM-CM5-0) and HighResMIP includes 7 models (CNRM-CM6-1-HR, CNRM-CM6-1, EC-Earth3P-HR, EC-Earth3P, HadGEM3-GC31-HM, HadGEM3-GC31-LM, HadGEM3-GC31-MM). We bootstrap the models 1000 times to estimate the upper and lower bounds of a 95 % confidence interval for each. For all CMIP6 simulations, the period 1850 to 2015 is based on historical simulations, while the Shared Socioeconomic Pathway (SSP) 5-8.5 scenario is used for the remainder of the 21st century (as per Philip et al., 2022). HighResMIP is a Sea Surface Temperature (SST)-forced model ensemble (Haarsma et al., 2016) with simulations covering 1950–2050. The SST and sea ice forcings for the period 1950–2014 are obtained from the 0.25° × 0.25° Hadley Centre Global Sea Ice and Sea Surface Temperature reanalysis dataset (HadISST; Rayner et al., 2003), regridded to match the climate model resolution. For the current/future time period (2015–2050), SST/sea-ice data are derived from RCP8.5 (CMIP5) data, and combined with greenhouse gas forcings from SSP5-8.5 (CMIP6) simulations (Haarsma et al., 2016).
As an additional line of model evidence, we also use the HadGEM3-A large ensemble (Ciavarella et al., 2018) to calculate the PR for the observed focal event, as in previous reports. This configuration runs in near real time and is designed to enable specific event attribution studies such as this. It provides a 525-member ensemble with observed SSTs and all anthropogenic forcing for the factual simulation, and a 525-member ensemble with natural-only forcing (solar and volcanic activity) for the counterfactual simulation, allowing direct attribution of observed events to anthropogenic climate forcing. This system is currently undergoing an upgrade, and only data up to and including 2024 is now available. We therefore run our analysis for the 2025–2026 events using 2020–2024 factual and counterfactual data to represent a near-present-day (“Early 2020s”) climate state. Using a 5 year period reduces SST influence from any individual year. We present the results alongside the multi-model assessment outlined above. Methods follow last year's report; in short, we first evaluate and bias correct the model data to ERA5 over the historical period (here we select the period 1980–2013 to avoid uncertainties in satellite data pre-1980, see Supplement Sect. S1.2.1), and apply this correction to the full near present day attribution ensemble. We calculate a PR from the factual and counterfactual ensembles, and bootstrap to give uncertainty ranges. Both the WWA and HadGEM3-A ensemble analyses specifically target the months identified as extreme for each focal event as outlined in Sect. 3.3.7, and focus on sub-regional extremes that occur in the model grid cells with the highest FWI values temporally and spatially (top 5 % of all regional grid cells during the period).
In addition to the 95th percentile (FWI95), we also calculate the FWI7X (the 7 d of highest FWI during the focal event period), as an additional measure of extreme fire weather, from the output of 3 CMIP6 ESMs that have large ensembles available (CanESM5 (50 members), ACCESS-ESM1-5 (30 members), and MPI-ESM1-2-LR (10 members) (Gallo et al., 2023)). A GEV scaling method is applied to the whole ensemble for each model based on Liu et al. (2025), and a 1000-sample non-parametric bootstrapping method is used to give uncertainty estimates for the FWI PRs. While FWI95 gives a reasonable upper bound for the peak intensity of an event by looking at the 95th percentile value of the FWI during the period, FWI7X gives additional context of the intensity by looking at the maxima of running 7 d FWI mean (Liu et al., 2025). While both metrics look at the peak/near peak values, FWI7X tempers this by reviewing local maxima in the FWI series. A high value of FWI95 with a correspondingly lower value of FWI7X suggests the anomaly was concentrated in time, while a relatively lower FWI95 with a higher FWI7X suggests a longer, high period of sustained fire weather. As both are relevant metrics with complementary use cases and context, particularly when reviewing the causes for sustained drawn-out burns versus a fast-moving quick burn, both metrics were used to calculate a PR. As the wider community has indicated useful interpretation of both, they are provided to enable commonalities between events to be compared for multiple lines of evidence.
Using three different approaches here allows us to target different aspects of attribution, while looking at the same extreme event. The WWA approach represents the degree to which the observed FWI could be expected in today's climate compared to the pre-industrial past (emergence from natural variability); HadGEM3-A targets a specific event using recent climate while controlling internal variability (event-specific attribution); the CMIP6 large ensemble reports the strength of the climate change signal (external forcing) on an event like 2025–2026.
2.5.2 Future Projections – FWI
For the projections of future fire weather, we follow the same calculation of FWI as for the WWA multi-model attribution analysis (using CMIP6 and HighResMIP models), but this time compare FWI at Global Warming Levels (GWLs) +1.5, +2.0, and +3.0 °C above pre-industrial relative to a present-day value taken as +1.3 °C. It is important to note that all CMIP6 models reach +3.0 °C warming. For the HighResMIP models, the GEV fit is calculated using FWI data for years up to a 2.2–2.4 °C GWL, with that relationship used to project the likelihood out to 3 °C which thus effectively represents 3 °C of global mean warming above pre-industrial in those models that don't fully reach the temperature threshold. This is in line with Seneveratne and Haser (2020), who show that linearity can be assumed in the relationship between climate extremes and global mean surface temperature. This method allows us to include additional models from HighResMIP which can be more informative than relying only on CMIP6 models. The results are then synthesised with CMIP6. We again supplement this with FWI7X calculated across the same large ensemble CMIP6 models for all GWLs.
Additional metrics calculated for the FWI seasonal average fwisa, defined by the local annual maximum of the 90 d running average of the FWI and the annual maximum fwixx, defined by the annual maximum value of FWI (Quilcaille et al., 2023; Gallo et al., 2025). Projections for fwisa and fwixx from CMIP6 models are presented in the Supplement for each focal region, and for three climate change scenarios defined by SSP1-2.6, SSP2-4.5 and SSP5-8.5 (Riahi et al., 2017). SSP1-2.6 represents strong mitigation consistent with the Paris Agreement, limiting warming to around 2 °C and aiming for 1.5 °C. SSP2-4.5 represents an intermediate scenario in a world with both adaptation and mitigation. SSP5-8.5, originally developed in 2008 as a high-end, no-mitigation scenario, is now inconsistent with the evolution of our subsequent emissions trajectory and will be discontinued in CMIP7 (Van Vuuren et al., 2026); However, it is retained here to provide context for how projected wildfire outcomes have changed as expectations of future emissions trajectories have evolved, and to compare contemporary high-end emissions pathways with the very high-emissions futures that were once considered plausible.
2.5.3 Attribution of Present Day Focal Events – BA
As per the last report, we use ConFLAME (Controles de Fogo Local Analisados pela Máxima Entropia – English “Local Fire Control Analysis by Maximum Entropy”; Kelley et al., 2021; Barbosa et al., 2025) to attribute the likelihood and extent of the observed 2025–2026 BA during focal months to anthropogenic climate forcing. Unlike most process-based fire models, ConFLAME does not explicitly simulate the physical mechanisms of fire; instead, it infers the influence of environmental controls on BA from observed relationships within a probabilistic framework, learning from observed patterns between drivers and BA. Controls sort driving variables into fuel continuity (from here on “fuel”), weather or driver variables including tree cover (“dryness”), anthropogenic and natural ignitions (“ignitions”) and suppression, both active and fragmentation (“suppression”). ConFLAME is designed to capture the inherent stochasticity in fire activity, arising from the intrinsically variable nature of fire itself and from the fact that key drivers of BA are only partially observed, or often unresolved, in large-scale datasets. These two sources of uncertainty are particularly important for extreme events, which lie in the tails of the distribution and are often poorly captured by deterministic or mean-state modelling approaches. ConFLAME addresses this using a Bayesian framework, applying a large ensemble approach to represent the full distribution of possible BA outcomes, by sampling from relationships learned from historical observations. This allows the full range of plausible outcomes, including extremes, to be represented and analysed probabilistically in terms of likelihood and amplification.
We trained ConFLAME using ERA5 reanalysis data (Muñoz-Sabater et al., 2021) to represent the meteorological conditions during the observed fire events, together with land-cover fractions from ISAM-HYDE (Ciavarella et al., 2018) (mapped to tree, shrub, and grass cover, consistent with the HadGEM3-A configuration used in the FWI attribution) and HYDE land use (Klein Goldewijk et al., 2010). The model was optimized against MODIS BA (see Sect. “Input Data”) following the same bayesian inference approach as in previous reports (Kelley et al., 2025). We then applied the optimised model using two sets of inputs: factual and counterfactual conditions. The factual simulations are driven directly by ERA5 and therefore represent the real-world conditions under which the fires occurred. The counterfactual simulations are constructed by removing the influence of anthropogenic climate change from these same meteorological conditions. To do this, we use HadGEM3-A simulations to estimate the difference between climates with and without human influence, and apply this adjustment to the ERA5 data for each variable. This produces a version of the observed weather that is consistent with a world without anthropogenic climate change, while preserving the timing and structure of the event. This HadGEM3-A-based approach allows us to isolate the anthropogenic climate signal in near real-time conditions, providing an event-focused attribution using recent climate consistent with the FWI analysis (Sect. 2.5.1). Due to data availability, the estimated anthropogenic signal is based on HadGEM3-A simulations from 2020–2024. Further details are provided in the Supplement Sect. S1.2.1.
We then run paired ConFLAME simulations for factual and counterfactual conditions at monthly resolution, allowing direct comparison of BA outcomes. Model evaluation follows Barbosa et al. (2025), with additional details of model fitting and validation provided in Supplement Sect. S1.2.2.
We express attribution results using two key metrics for the identified extreme target months for each focal region. First, the amplification factor (AF) quantifies how much larger (or smaller) BA is for events of equivalent rarity, calculated as the ratio of our factual BA to our counterfactual BA. For attributing our focal event directly (i.e. Sects. 4.3.2, 5.3.2 and 6.3.2), the factual and counterfactual experiments are taken from the month(s) of the events, and are conditioned on the observed BA (see Supplement Sect. S1.2.2 for calculation), whereas for annual average BA, the factual and counterfactual use annual average BA over all months, and are not conditioned on observed BA. We also calculated how much larger (AF) BA was due to fuel or dryness alone. Second, the Probability Ratio (PR) quantifies how much more likely an event with comparable BA is under factual than under counterfactual conditions. We do this by calculating the ratio of probability of the observed BA, given the BA simulated by paired factual and counterfactual ensemble members. ConFLAME gives the likelihood of all possible BA outcomes for each region based on a probabilistic analysis of past burn patterns and environmental conditions. Each result, therefore, presents a 5–95th percentile probability estimate which we refer to as the uncertainty range. We also report the likelihood of AF being greater than 1 – i.e., the likelihood that anthropogenic climate forcing led to an increase in BA.
2.5.4 Future Projections – BA
Our approach follows that used in last year's report but with the addition of AF to align with the attribution framework. We use the same ConFLAME model as for the attribution analysis, though using different training and experiment datasets, including bias-corrected climate projections.
ConFLAME was trained on GSWP3 relanalysis data available via Inter-Sectoral Impact Model Intercomparison Project version 3a (ISIMIP3a) (Frieler et al., 2024) and MODIS VCF (Vegetation Continuous Fields) fractional vegetation cover as per last year's report (Kelley et al., 2025). For projections, we took climate projections from ISIMIP3b (Frieler et al., 2026), which provides bias-corrected global climate model (GCM) outputs for historical (up to 2014) and current/future (2015–2100) periods. Bias correction ensures a seamless transition between historical and future. We use five GCMs (GFDL-ESM4, IPSL-CM6A-LR, MPI-ESM1-2-HR, MRI-ESM2-0, and UKESM1-0-LL), each bias-corrected to W5E5 (a merged WFDE5 and ERA5 reanalysis dataset) following Lange (2019). ConFLAME is trained using the ISIMIP3a GSWP3 forcing dataset, while simulations are driven by GCM outputs (ISIMIP3b) bias-corrected to WFDE5 ERA5. To quantify the influence of these differences on baseline-period results, an analysis is included in Kelley et al. (2026d) to assess the sensitivity of model outputs to these forcing choices. Vegetation and fuel availability are simulated offline using JULES-ES (the terrestrial Earth system component of UKESM) forced by these climate data and scenario-specific CO2 concentrations (Mathison et al., 2023), with resulting land cover bias-corrected against MODIS VCF collection 6.1 tree cover (DiMiceli et al., 2015) using ibicus (Spuler et al., 2024). Future socioeconomic drivers, such as changes in ignition or land use, are set at present-day conditions, so that we simulate the effects of climate only, which includes climate influence over vegetation cover and resultant fuel connectivity.
Projections are performed under three SSPs: SSP1-2.6 and SSP5-8.5 as defined above, and SSP3-7.0 which represents a high-emissions pathway broadly consistent with, though at the higher end of, our current global policies and is used here as a pessimistic but plausible trajectory.
For each region, GCM, and SSP combination, we generate 200-member ensembles using the trained model, sampling internal variability and GCM-based uncertainty in future climate response to forcing. AF and PR are calculated as per attribution in Sect. 2.5.3, though with 2010–2019 taking the place of our counterfactual and the target decade our factual. For Sects. 4.3.2, 5.3.2 and 6.3.2, we defined AF as changes in BA for events with the same likelihood as the 2025–2026 event (defined by ConFLAME simulations), estimated using equivalent percentiles of the modelled BA distribution across periods. We calculated AF in the same way as historical attribution as described in Sect. 2.5.3. Analyses are conducted at the regional scale (whole focal region) and for sub-regional extremes (top 5 % BA grid cells). We test the significance of the change in the resultant 5 AFs (one for each GCM) relative to the baseline-period AFs using a paired permutation/sign-flip test, appropriate for small-ensemble significance testing (see the Supplement for details).
2.5.5 Future Projections – Typical Fire Behaviour
While future projections of BA are not yet available from the full set of FireMIP models under the ISIMIP3b protocol, we performed future simulations with the data-driven model BuRNN (“Burned area modelling through Recurrent Neural Network”; Lampe et al., 2026) using the ISIMIP3b driving data (Frieler et al., 2026). BuRNN is trained to predict the BA of GFED5.1 from a range of climatic, vegetation, and socio-economic parameters at a 0.5° by 0.5° spatial scale and a monthly time resolution. BuRNN exists from 55 Long Short-Term Memory networks (LSTMs) that are trained on different splits of AR6 regions. Predictions in a specific region/gridcell are the mean of 5 LSTMs that have not seen data for that entire AR6 region before, neither in training nor in validation. Here, only two minor changes were made in the methodology of Lampe et al. (2026). First, we trained on GFED5.1. Second, instead of taking the multi-model mean of Gross Primary Productivity (GPP), Leaf Area Index (LAI) and carbon mass stored in vegetation (Cveg) from all ISIMIP models, we used the values from the model VISIT (Ito, 2019). We did the latter as ISIMIP3b consists of many experiment setups and not all models have performed all experiments. At the time of the analysis, VISIT had the highest number of experiment results available. We then force this version of BuRNN with three SSPs (SSP1-2.6, SSP3-7.0 and SSP5-8.5) considering only a single bias-corrected ESM (GFDL-ESM4) and land-use allocation model (Integrated Model to Assess the Global Environment, IMAGE, Stehfest et al., 2014). The simulations were performed with the SSP-associated climate and socio-economic forcings.
We assessed how well different historical projections of BA, fire size, and fire intensity performed in each focal region under present-day conditions and, where appropriate, the agreement in the directionality and magnitude of their future projections. For this, we obtained the outputs of generalized linear model (GLM) simulations of future fire activity (Haas et al., 2026). The models used in this study were originally developed by Haas et al. (2022) and represent three independent models for BA, fire size, and a metric of fire intensity, primarily driven by climate drivers but also accounting for human activity and vegetation effects on fire. The models were designed and perform best as a timestep, and they represent the average spatial conditions in fire regimes. In order to minimise the uncertainty in projections, we compared the 2010–2020 period with the 2090–2100 period varying only the climate predictors (vapour pressure deficit, number of dry days and their seasonality, wind speeds and diurnal temperature range). Vegetation and human activity predictors were held constant at the 2010–2020 baseline conditions. Importantly, for consistency in potential land cover and vegetation effects, vegetation predictors were derived from BIOME4 simulations (Kaplan et al., 2003) and the productivity model P-Model (Stocker et al., 2020) even though observational products were available. This may potentially influence the ability of the model to reproduce current spatial patterns and introduce systematic biases into the results. Model performance was assessed using correlations and spatial normalized mean square error metrics along with model mean performance. If model performance was not considered good enough under present-day conditions, no future projection result is reported. For future projections, if the majority (3 models) of the four global circulation models used (GFDL, IPSL-LSCE, MIROC5 and HadGEM2) agreed on a significant increase or decrease respectively, this was reported. In regions where no fire activity was simulated under present-day conditions but fire activity appears in the future in the majority of the models, this was reported as emergence. Where there was no majority agreement, nothing was reported in terms of future projection trends. The spatial pattern of agreement is mapped for each region.
3.1 Global Summary: BA and Fire Carbon Emissions Anomalies
According to the MODIS BA product, at least 3.29 million km2 burned globally during the 2025–2026 global fire season (March 2025–February 2026), 18 % below the average of previous fire seasons since 2002 (Figs. 1, 2, Table 4). This ranks 23rd of 24 fire seasons in the MODIS record, indicating one of the lowest global BA totals observed since 2002. Fire carbon emissions were also below average globally (Figs. 1, 3, Table 5). GFED5.1 fire carbon emissions were 2.74 PgC, 682 TgC below average, with relative anomalies of −20 % and −31 % in GFED5.1 and GFAS, respectively. The 2025–2026 fire season therefore, departed from the pattern seen in the preceding two fire seasons, when above-average fire carbon emissions occurred despite below-average global BA. These values represent gross carbon emissions from fires, rather than their net contribution to atmospheric CO2 or climate warming. The latter depends on the composition of emitted gases, subsequent carbon uptake during ecosystem recovery, and the timescale considered (see Sect. “Input Data Uncertainties”).
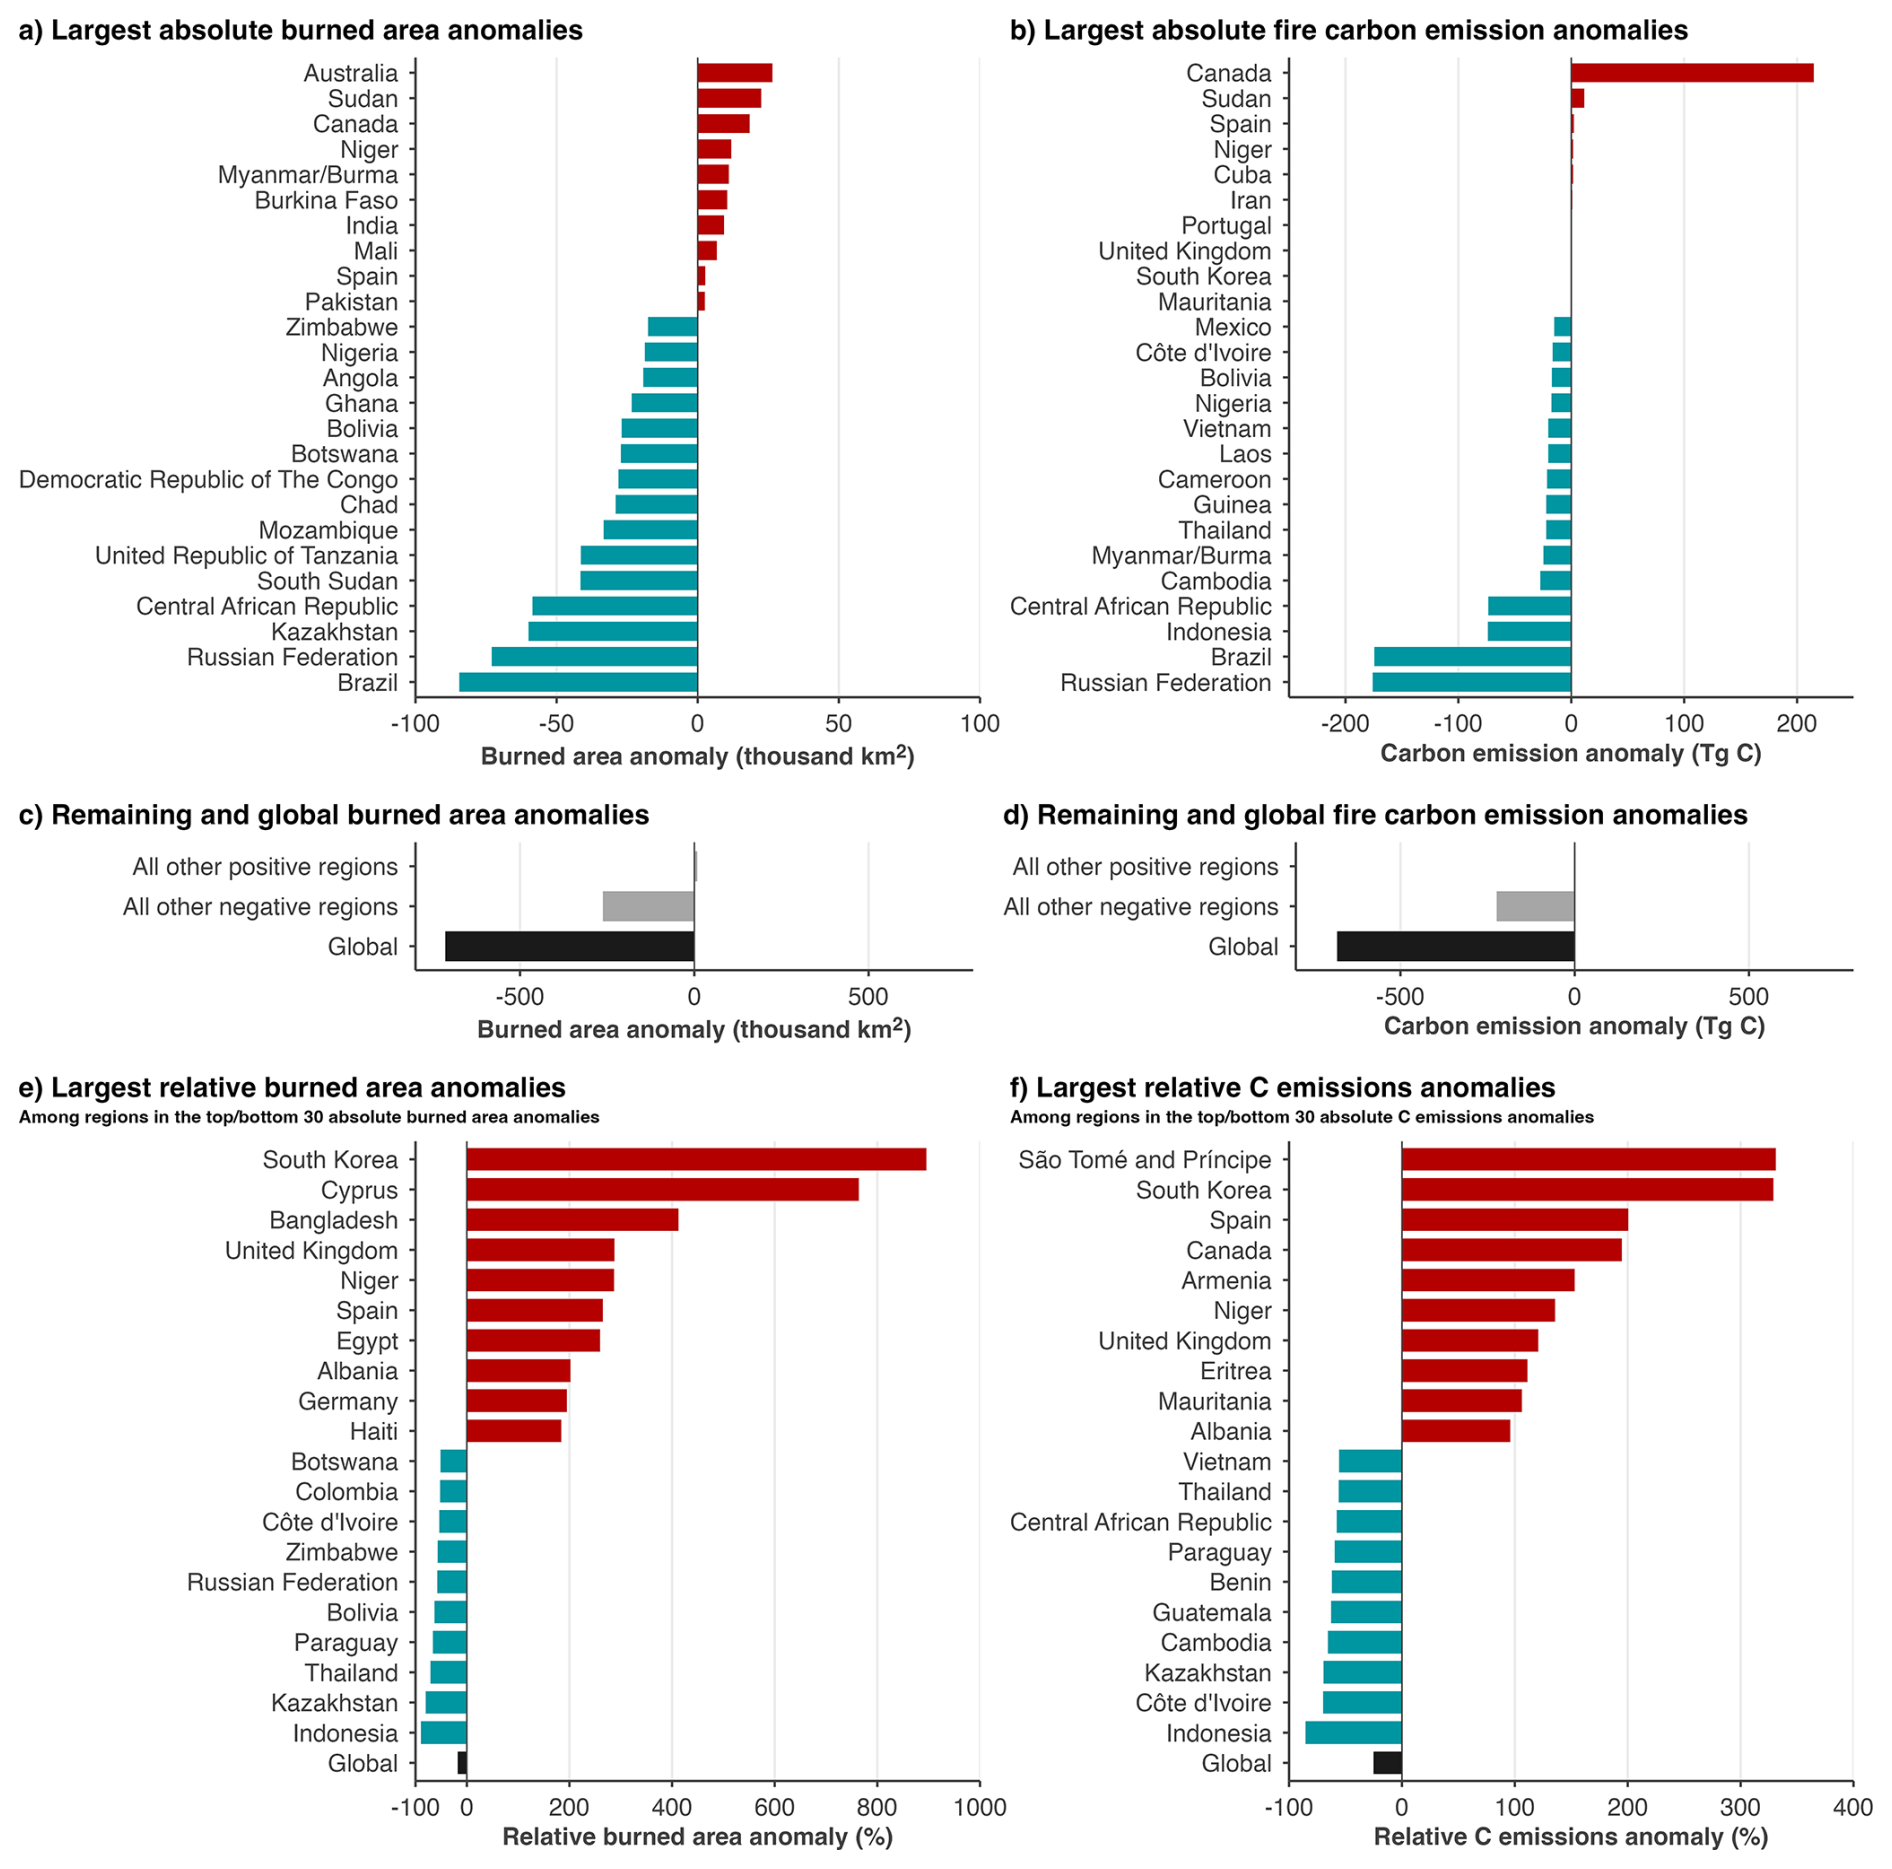
Figure 1Anomalies in BA (BA) and fire carbon (C) emissions at national and global scales. Absolute anomalies in (a) BA and (b) fire carbon emissions are shown for the countries with the largest positive and negative anomalies during the 2025–2026 global fire season, defined as March 2025 to February 2026, relative to the average of prior fire seasons since 2002. Panels (c) and (d) show the combined anomalies for all other positive countries, all other negative countries, and the global total, respectively, using the same anomaly definitions. Relative anomalies in (e) BA and (f) fire carbon emissions are shown for the countries with the largest positive and negative percentage anomalies among those ranking in the top 30 positive or top 30 negative countries by absolute anomaly. BA anomalies are derived from the MODIS MCD64A1 BA product and are reported in thousand km2. Absolute fire carbon emission anomalies are derived from GFED5.1 and are reported in Teragrams of Carbon (TgC), while relative fire carbon emission anomalies use our synthesis value (see Sect. “Calculating Regional Anomalies in Fire Observations”). Countries are excluded from the fire carbon emissions rankings in cases where the sign of the relative carbon emission anomaly differs between GFED5.1 and CAMS GFAS, reflecting our low confidence in the sign of the anomaly.
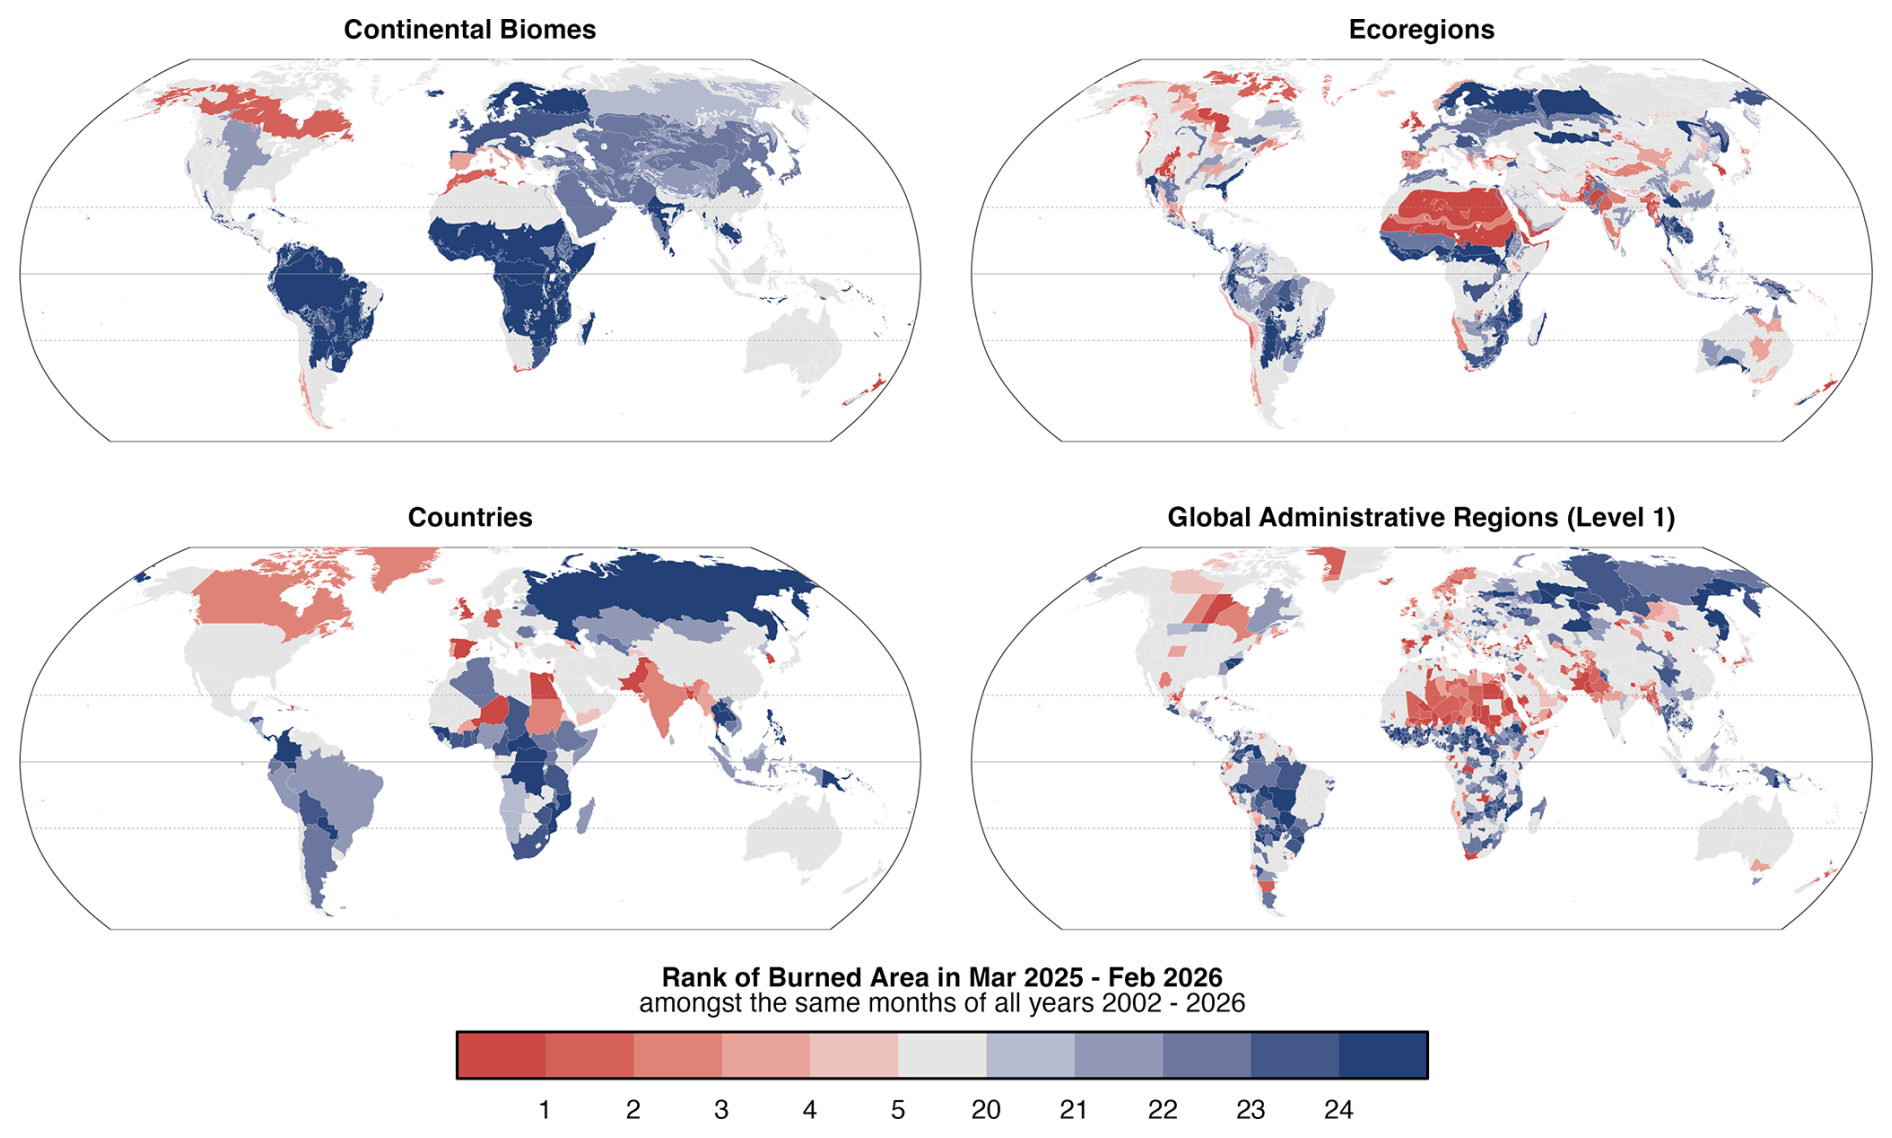
Figure 2Ranks of BA (BA) during March 2025–February 2026 versus previous March–February periods (n=24 global fire seasons), at the scales of (top left) continental biomes, (top right) ecoregions, (bottom left) countries and (bottom right) level 1 administrative regions. Results for regions with high-ranking (top 5 years) or low-ranking (bottom 5 years) events are highlighted. BA data are derived from the MODIS MCD64A1 BA product (Sect. 2.1.2) and our evaluation of the BA product dependence of these results is provided in Supplement Sect. S2.1 (see Fig. S1). The timing of BA anomalies is shown in Fig. S4.
Table 4Summary of the largest positive anomalies in BA during the 2025–2026 fire season on national and sub-national scales (GADM level 1 administrative regions, such as states or provinces). Anomalies are expressed relative to all previous fire seasons 2002–2024 (n=23). The table includes countries with absolute BA anomalies over +1000 km2 and the top 30 administrative regions grouped into countries where applicable in section (a). In section (b), other administrative regions belonging to unlisted countries are shown. In section (c), the anomalies for selected countries are shown due to their nationally high-ranking and large relative anomalies. Extended data for all countries and region layers are available from Jones et al. (2026b). Bold denotes Country level statistics and rank.
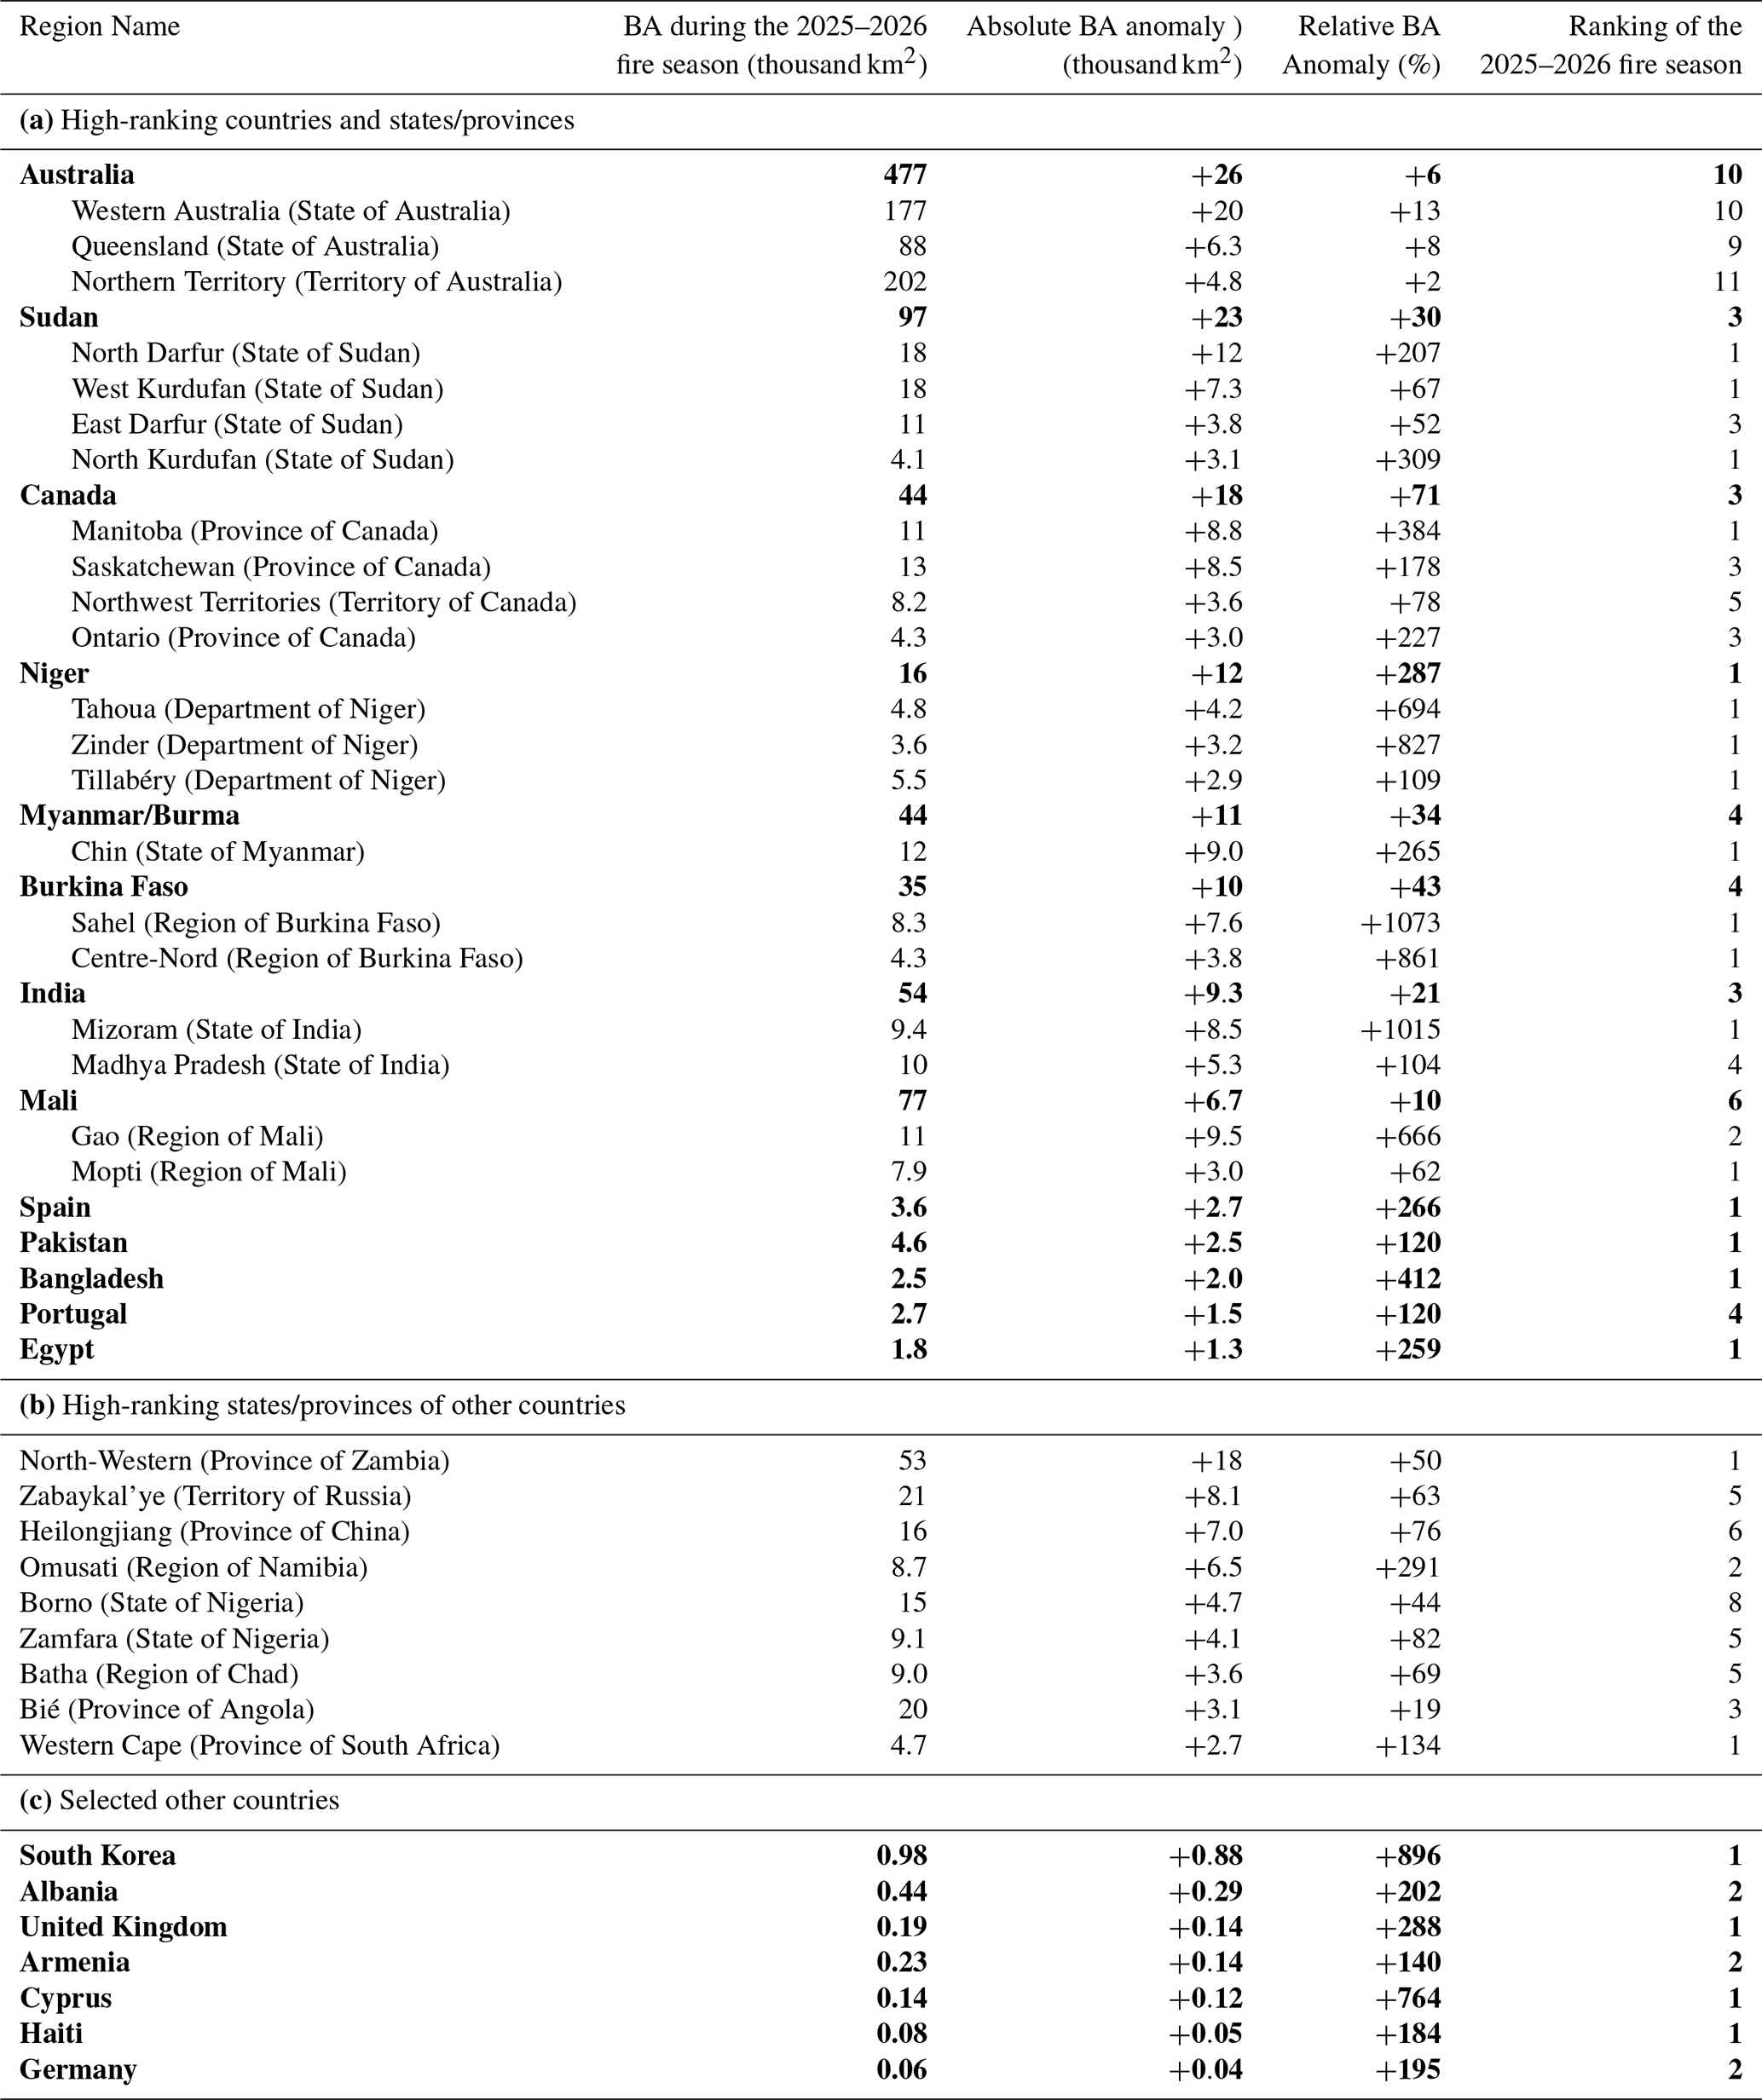
Table 5Summary of the largest positive anomalies in fire carbon emissions during the 2025–2026 fire season on national and sub-national scales (GADM level 1 administrative regions, such as states or provinces). Anomalies are expressed relative to all previous fire seasons 2003–2025 (n=22). The table includes countries with absolute fire carbon emissions over +0.5 Teragrams of Carbon (TgC) and the top 30 administrative regions grouped into countries where applicable in section (a). In section (b), other administrative regions belonging to unlisted countries are shown. In section (c), the anomalies for selected countries are shown due to their nationally high-ranking and large relative anomalies. Estimates of fire carbon emissions or absolute anomalies in the 2025–2026 derive from the GFED5.1 emissions product, whereas for relative anomalies, we primarily report our synthesis values with the GFED5.1 values reported in parentheses (see Sect. “Calculating Regional Anomalies in Fire Observations”). Extended data for all countries and region layers are available from Jones et al. (2026b). Countries are not shown if the sign of the relative carbon emission anomaly differs between GFED5.1 and CAMS GFAS, reflecting low confidence in the direction of the anomaly. Bold denotes Country level statistics and rank.
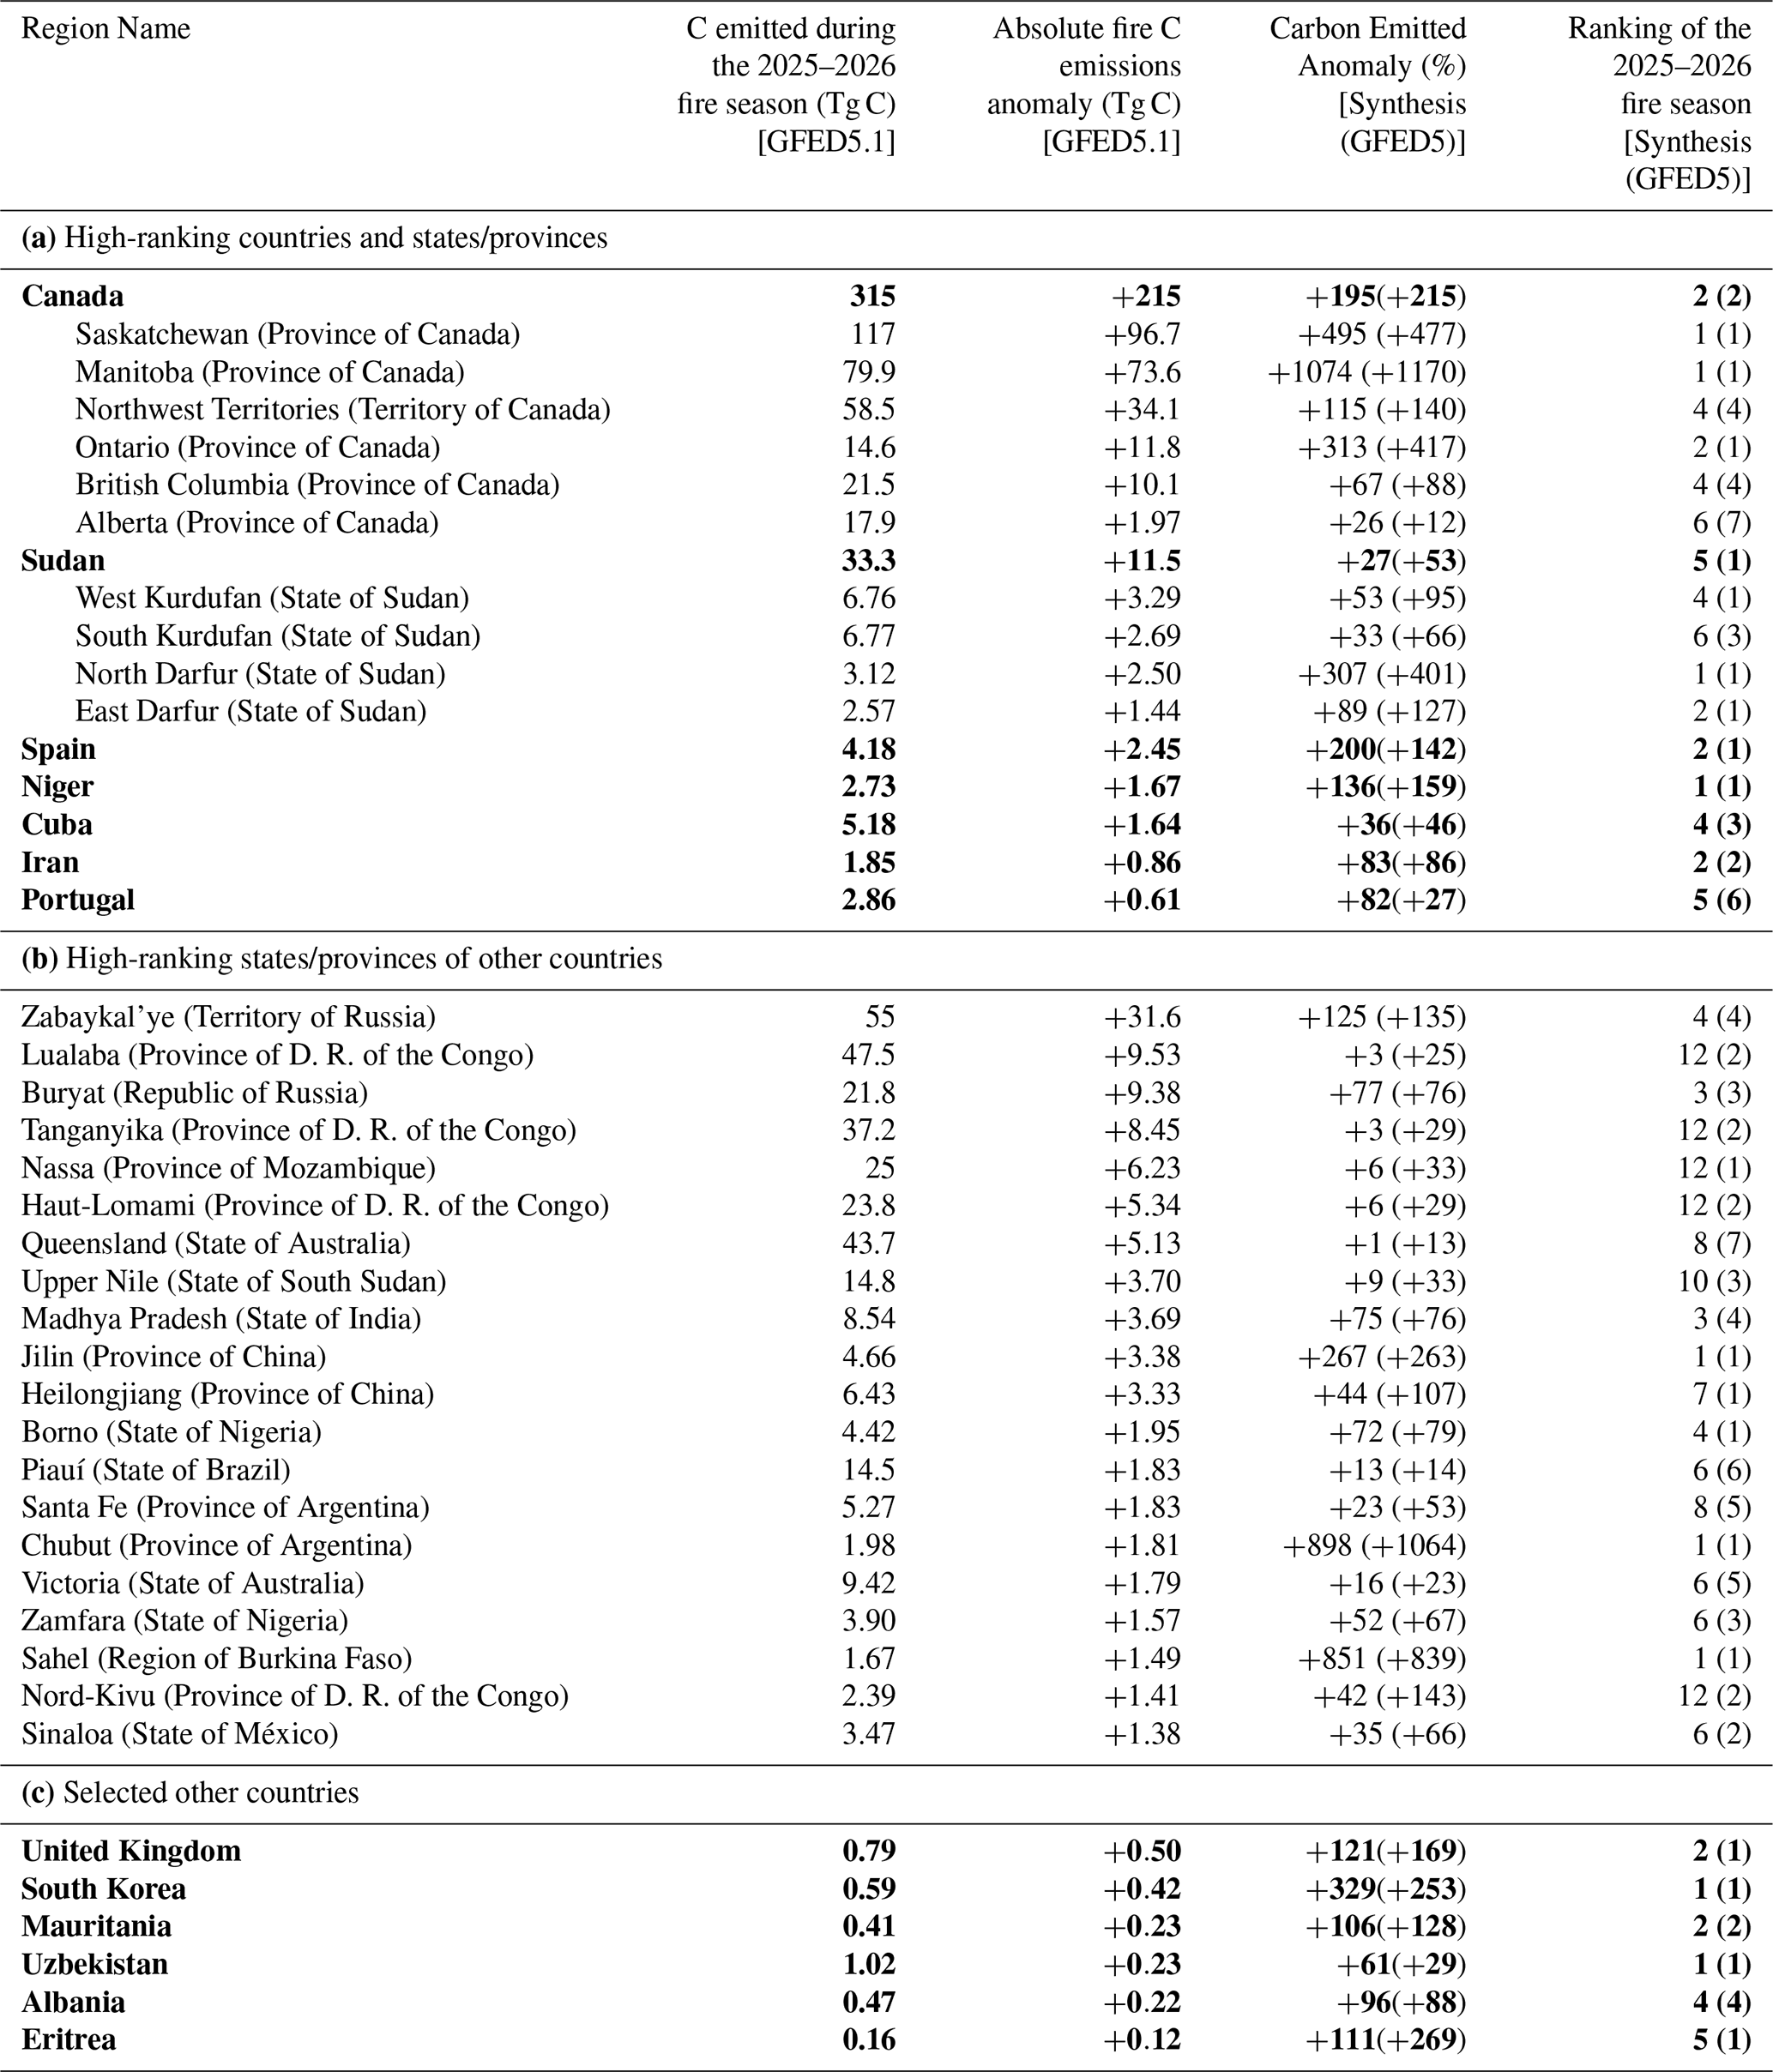
The low global BA total was in line with the ongoing decline in BA across major savannah and grassland systems, which continue to account for a large share of global BA. The global (sub)tropical grassland, savannah and shrubland biome burned 2.44 million km2, 406 000 km2 (14 %) below average and the second-lowest annual total in the MODIS record. GFED5.1 fire carbon emissions from this biome were 1.37 PgC, 224 TgC below average, with relative anomalies of −14 % and −39 % in GFED5.1 and GFAS, respectively. The largest negative anomaly contribution came from the African (sub)tropical grassland, savannah and shrubland biome, where 1.98 million km2 burned, 341 000 km2 (15 %) below average and the lowest annual total since 2002. BA was also strongly below average across Asia and South America, which both recorded their lowest continental BA totals in the MODIS record.
Despite this globally low fire year, stark regional contrasts were visible across the Earth observations. The clearest positive fire carbon emissions anomaly occurred in North America, where BA was only moderately above average but GFED5.1 fire carbon emissions reached 418 TgC, 177 TgC above average, with relative anomalies of +74 % and +81 % in GFED5.1 and GFAS, respectively. This anomaly was concentrated in the North American boreal forest, principally in central Canada, where BA and emissions were again among the highest values on record. The 2025–2026 season therefore marked a third consecutive year of extreme fire activity in North American boreal forests, although the geographical focus shifted from the western and northwestern regions emphasised in recent fire seasons towards central Canada.
Outside North America, most major positive anomalies were more regional or subregional than continental in scale. In Africa, the continent as a whole recorded its lowest MODIS BA total, but this masked anomalous burning in the Sahel and semi-arid West Africa, especially Sudan, Niger and Burkina Faso, as well as a record BA season in the Western Cape of South Africa. In Asia, BA and fire carbon emissions were both among the lowest on record, but positive BA anomalies were concentrated in South, Southeast and East Asia, including Myanmar, India, Pakistan, Bangladesh and South Korea. South Korea was particularly notable because it recorded both its highest MODIS BA and highest fire carbon emissions in both emissions products.
Europe also presents a scale-dependent picture. Continental BA was below average in our BA analysis, and the two emissions products differed in the sign of the relative continental emissions anomaly, but the Mediterranean region experienced a clearly anomalous season. The European Mediterranean forests, woodlands and scrub biome burned 7339 km2, 3865 km2 (111 %) above average, and Spain recorded its highest national MODIS BA total since the start of the record in 2002. The United Kingdom was also a notable north-west European outlier, with its highest MODIS BA and highest GFED5.1 fire carbon emissions in the record, although absolute BA remained small compared with southern Europe. Notably, records from the European Forest Fire Information System (2026; EFFIS) suggest a different situation, with 19 629 km2 burned across Europe in 2025–2026, the largest total since its records began in 2006 and 301 % above the dataset's 2006-2024 average (Sect. 3.3.3). This is explained by differences in the temporal and spatial coverage of the EFFIS system versus our definition of the European continent used here (ArcGIS Hub, 2024). European EFFIS coverage is restricted to the 27 EU member states plus Albania, Bosnia and Herzegovina, Kosovo, Montenegro, North Macedonia, Norway, Serbia, Switzerland, Türkiye, the UK, and Ukraine, whereas the adopted continents layer also includes western parts of Russia (west of the Ural mountains) and Moldova.
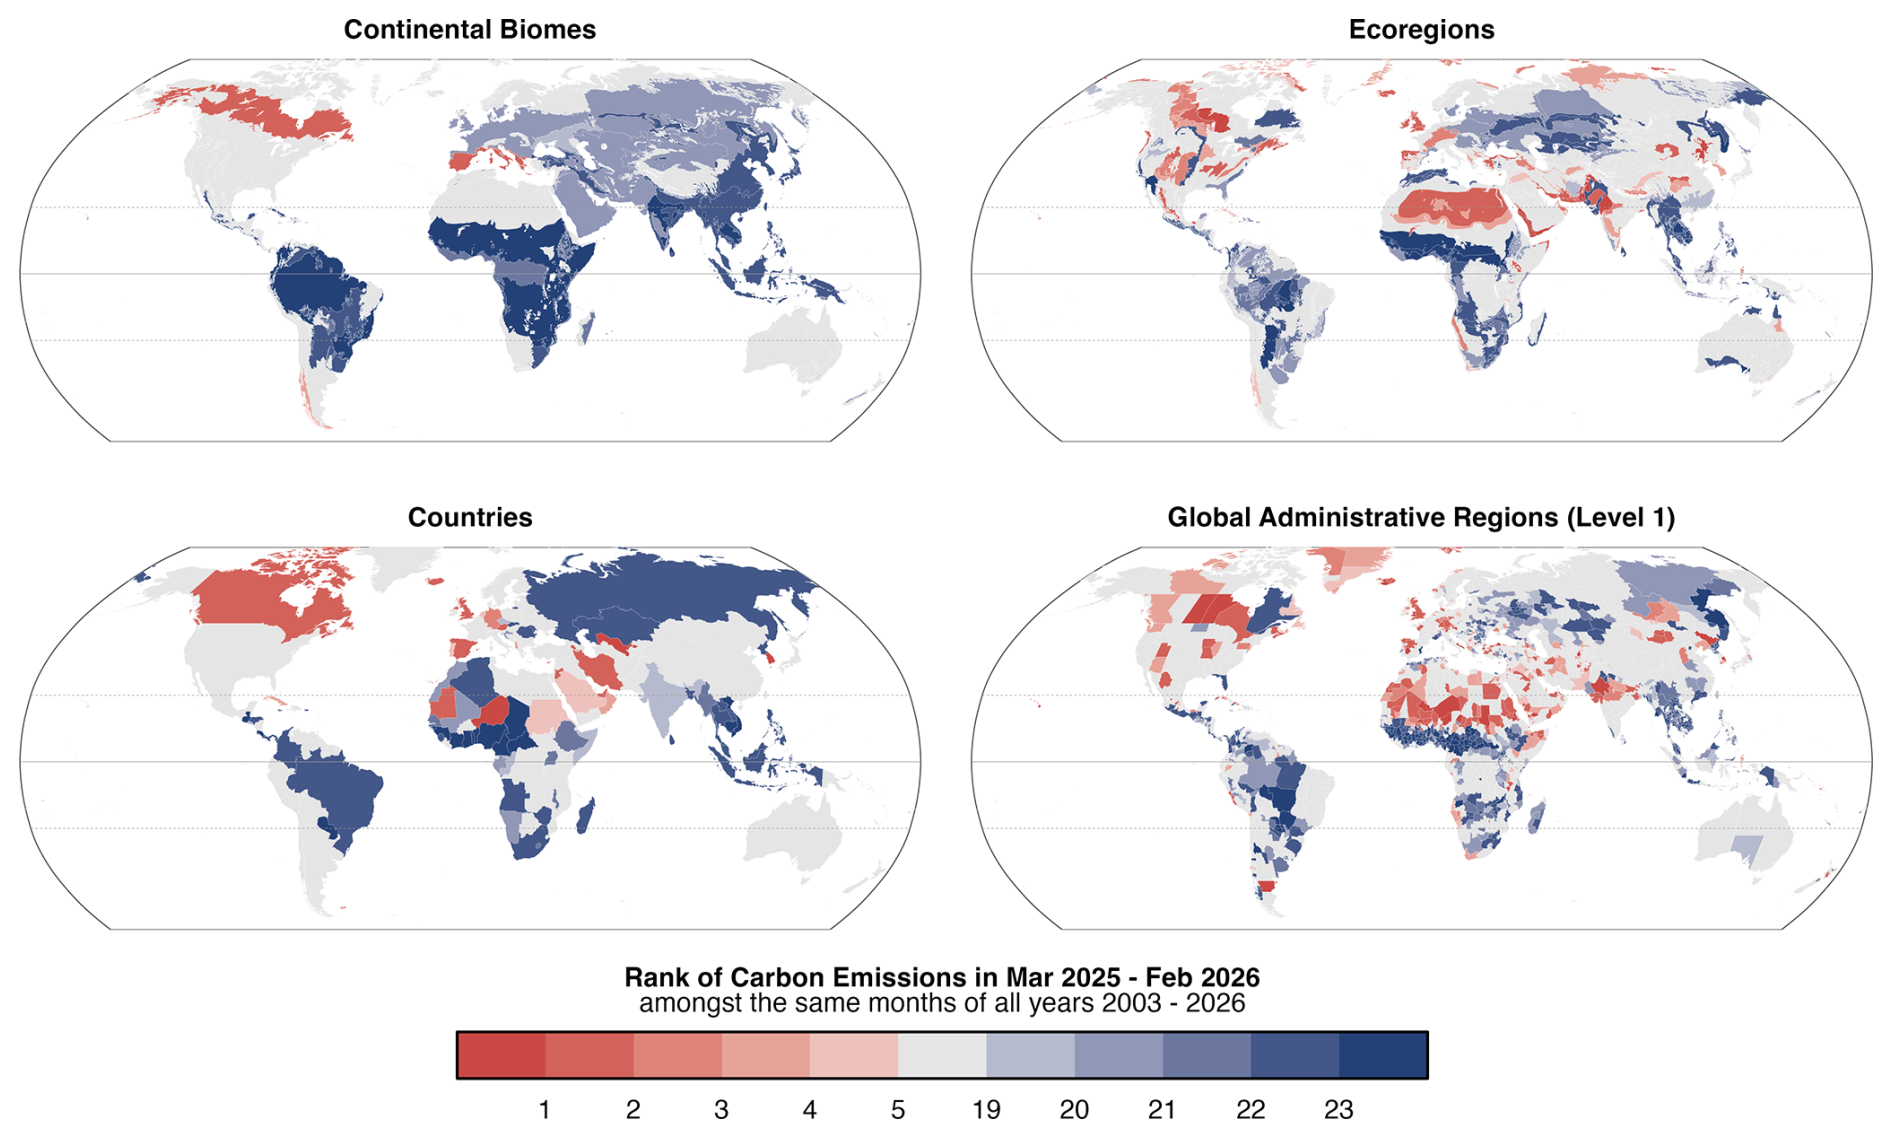
Figure 3Relative anomalies (%) in fire carbon emissions during March 2025–February 2026 versus all March–January periods since 2003 (n=23 global fire seasons), at the scales of (top left) continental biomes, (top right) ecoregions, (bottom left) countries and (bottom right) level 1 administrative regions (e.g. states and provinces). We consider fire carbon emissions estimates from two products (GFAS and GFED), first calculating the relative anomaly (%) for each individual product, then averaging those anomalies (Sect. “Calculating Regional Anomalies in Fire Observations”).
In Australia, 477 000 km2 burned, which is the largest positive national BA anomaly globally in absolute terms, but the national total ranked only tenth in the MODIS record and fire carbon emissions were close to or below average depending on the emissions product. This supports the interpretation of the 2025–2026 Australian season as one characterised by widespread fire occurrence and large fires in northern savanna and arid-zone systems, rather than an exceptional national emissions year. South America, by contrast, experienced a much lower fire season than in 2024–2025: continental BA and fire carbon emissions were both around half of the average value. However, localised positive anomalies occurred in Chaparral and temperate forest regions of Chile and Argentina (see Sect. 6), as well as in parts of Brazil.
Overall, the 2025–2026 global fire season was defined less by globally elevated fire activity than by strong contrasts across spatial scales. Global BA and fire carbon emissions were among the lowest in the satellite record, driven by suppressed burning in several extensive savannah and grassland regions. Within that low global context, severe regional fire anomalies occurred in central boreal Canada, the Sahel and semi-arid West Africa, South and East Asia, the European Mediterranean region and United Kingdom, northern and arid Australia, and parts of southern South America. This pattern highlights the importance of assessing fire extremes across multiple regional layers: global and continental totals identify a low fire year, while biome, national and subnational layers reveal several regionally severe fire seasons with important ecological and societal consequences.
3.2 Global Summary: Exposure and Impact Assessments
3.2.1 Population Exposure
Despite globally low BA and fire carbon emissions, population exposure to BA (Sect. 2.2.1) was above average in 52 countries during the 2025–2026 fire season (versus 121 below average). At continental scale, our analysis suggests that 20.93 million people were exposed to fire in Africa, 8 % above the preceding 24-year mean, although this ranked only eighth in the 24-year record. The largest national exposure totals (Fig. 4) were within the Democratic Republic of the Congo (DRC), with 5.69 million people exposed, 29 % above average; South Sudan, with 3.46 million, 21 % above average; and Zambia, with 1.77 million, 13 % above average.
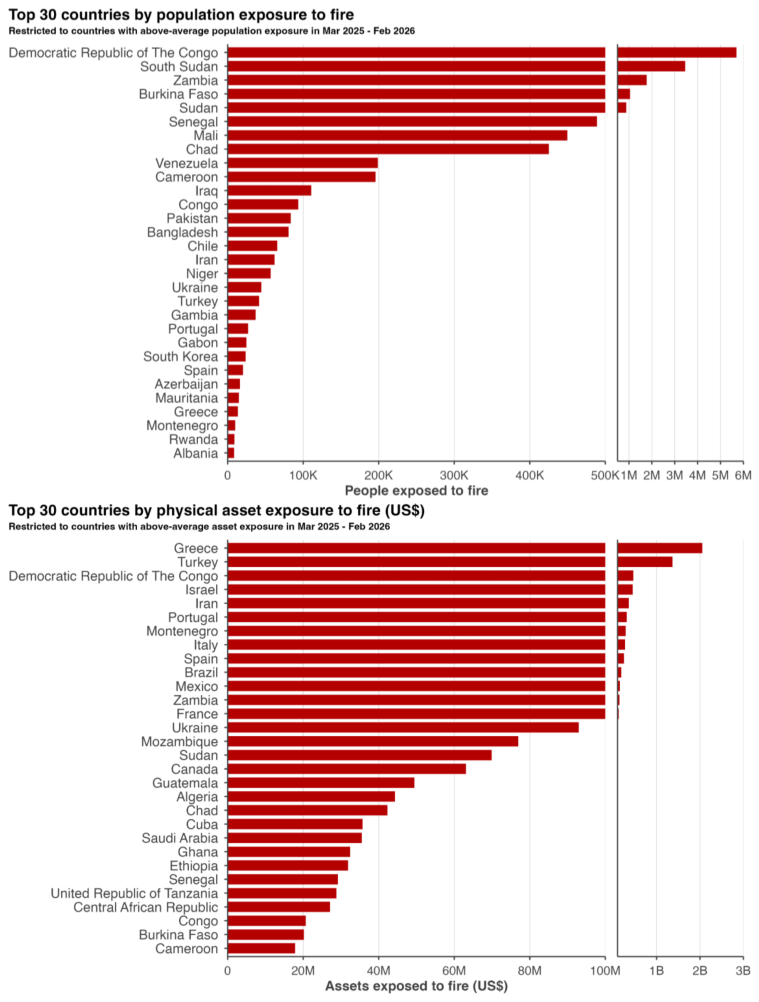
Figure 4(Top panel) Population (capita) and (bottom panel) physical asset exposure (USD) to fire during the 2025–2026 fire season shown for the top-30 countries globally, restricted to countries where these values are above-average values. Split scales are used, emphasising that a small number of countries experienced considerably higher exposures than the remaining top-30 countries. For methods, data sources, and derived data availability, see Sect. 2.2.
The largest relative anomalies in national exposure in Africa occurred in the Sahel and semi-arid West Africa regions. Sudan had its highest estimated population exposure, with 0.88 million people exposed, 99 % above average; Burkina Faso had its second-highest, with 1.05 million, 2.9 times the average; and Mali had its third-highest, with 0.45 million, 55 % above average. Record-high subnational exposure estimates were observed in the Sahelian regions of Centre-Nord in Burkina Faso, with 0.29 million people exposed, 14.6 times the average; North Darfur in Sudan, with 0.19 million, 8.2 times the average; and Mopti in Mali, with 0.13 million, 3.5 times the average.
Outside Africa, several other countries had record or near-record population exposure values relative to their own baselines. Within Asia, Bangladesh had its highest estimated population exposure on record, with 80 665 people exposed (8.3 times the average), consistent with its record national BA season; South Korea also had its highest estimated population exposure, with 23 752 people exposed (13.6 times the average), aligning with its record BA and fire carbon emissions season. Europe was below average at continental scale, with 205 265 people exposed (10 % below average), ranking twelfth in the record. However, Türkiye had its highest estimated national exposure, with 41 742 people exposed (4.8 times the average); Albania had its second-highest, with 8596 people (4.6 times the average); Montenegro had its third-highest, with 10 214 people (4.2 times the average); and Spain had its fifth-highest, with 20 332 people (73 % above average). By definition, our estimates count only people within areas that ultimately burned, not the wider population moved from areas at risk. In Spain, for example, over 40 000 people were evacuated during summer 2025 (Sect. 3.3.3), far above our estimate of population exposed within the burn perimeters.
3.2.2 Physical Asset Exposure
Physical asset exposure to BA (see Sect. 2.2.2 for methods) was above average in 64 countries during the 2025–2026 fire season, compared with 101 below average. Europe had an estimated USD 4.11 billion in physical assets exposed to fire (2.2 times the average), whereas Africa had USD 2.37 billion exposed, 39 % below average. Greece had its highest estimated physical asset exposure on record, with USD 2.05 billion exposed, half of Europe's total asset exposure and 12.4 times the national average (Fig. 4). Türkiye had its second-highest, with USD 1.37 billion (10.2 times the average). Israel had USD 0.45 billion exposed, 42 % above average and its fourth-highest value; Portugal had USD 0.31 billion, 83 % above average and its sixth-highest; Montenegro had its highest value, with USD 0.28 billion (77.5 times the average); Italy had its second-highest, with USD 0.27 billion (6.3 times the average); and Spain had its fourth-highest, with USD 0.25 billion (98 % above average). The DRC was the main country outside Europe and the eastern Mediterranean among the largest national exposure values, with USD 0.47 billion exposed, 3.8 times the average and the highest value in its record.
The largest subnational asset exposure estimates were in Peleponnese, Greece with USD 1.75 billion exposed, 786 times the average and its highest value on record; Izmir Province, Türkiye, with USD 0.98 billion exposed, 7.8 times the average and its second-highest value; Rostov Region, Russia, with USD 0.60 billion, 4.4 times the average and its fourth-highest; HaMerkaz District, Israel, with USD 0.45 billion, 10.1 times the average and its second-highest; Podgorica, Montenegro, with USD 0.28 billion, 179 times the average and its highest; and West Equatoria, South Sudan, with USD 0.27 billion, 46 % above average and its seventh-highest. Several smaller exposure totals represented record-high sub-national values, including Haut-Katanga in the DRC, with USD 0.18 billion exposed (4.9 times the average); Castelo Branco, Portugal, with USD 0.16 billion (60.5 times the average); Fars Province, Iran, with USD 0.16 billion (47.4 times the average); Occitanie, France, with USD 0.09 billion (24.3 times the average); Tabasco, Mexico, with USD 0.09 billion (18.8 times the average); and Manitoba, Canada, with USD 0.06 billion (28.8 times the average).
As noted in Sect. 2.2.2, these figures represent physical assets within fire perimeters rather than realised losses. Comparison with reported damages from the EM-DAT database (Centre for Research on the Epidemiology of Disasters, 2026), available for a small number of events, shows that the two can diverge in both directions. In Provence-Alpes-Côte d'Azur, exposure (USD ∼ 33 million) exceeds the USD ∼ 10 million reported for the July 2025 Marseille fire, although this regional estimate reflects all wildland fires in the region over the season rather than the Marseille fire alone. In Oregon, by contrast, exposure (USD ∼ 8 million) is below the reported USD ∼ 10 million damage for the Rowena fire alone, despite covering all Oregon fires that season. Divergence also arises because exposure is confined to filtered wildland-fire perimeters and may under-represent built structures at the wildland-urban interface, while reported damages are heterogeneously sourced and subject to reporting bias.
3.2.3 Exposure to Poor Air Quality
At the national scale, 45 countries had an above-average count of population-weighted poor air quality days relative to the climatological fire emissions of the 24 years prior (Fig. 5; see Sect. 2.2.3 for methods). In comparison, 114 countries had a below-average count of poor air quality days. Although wildfire smoke impacts on human health are spatially heterogeneous, producing larger relative exposure impacts at regional scales than at national scales, degradation at the national level indicates that exposure was widespread enough to affect population-weighted air quality across entire countries. The largest national health burden increases occurred mainly in Europe and western to central Asia. During 2025–2026 compared with the climatological reference, Albania experienced the highest population weighted burden with 10 extra poor air quality days, followed by Italy, Spain, and Tajikistan all experiencing a week's worth of additional poor air quality days, while Uzbekistan and Cyprus each had 6 additional poor air quality days.
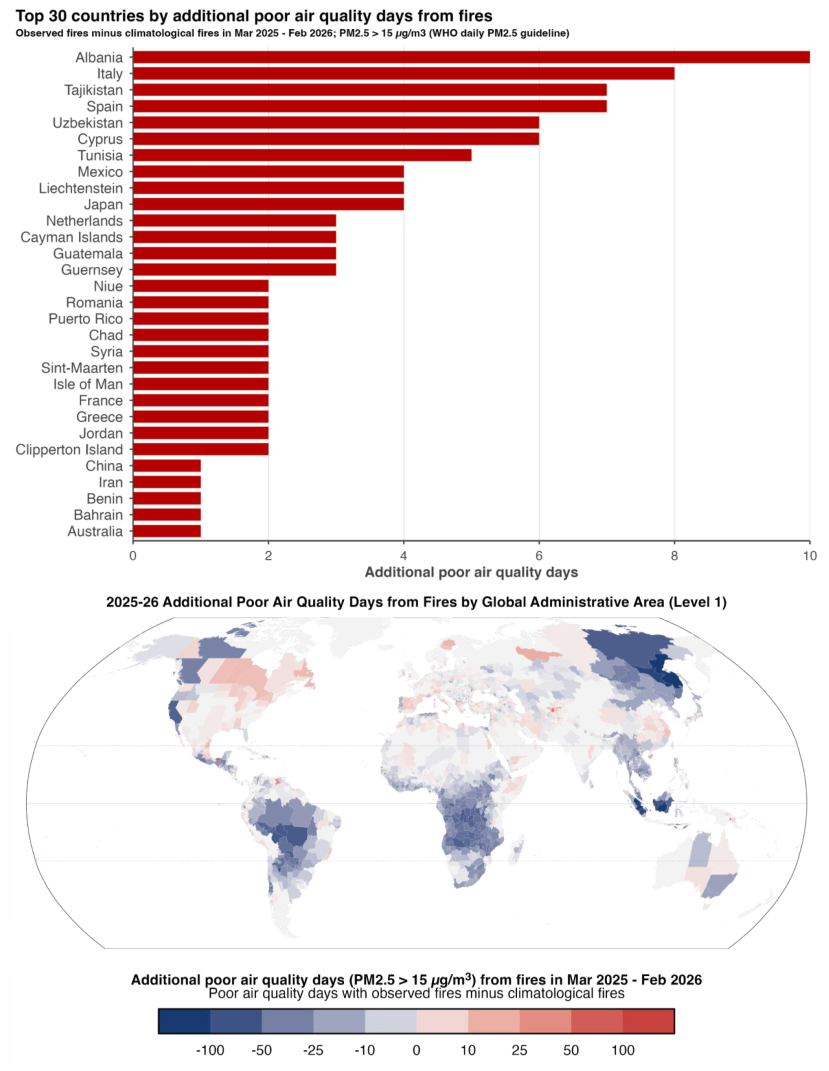
Figure 5Impacts of anomalous fire activity on the number of poor air quality days (days with PM2.5 concentrations exceeding 15 µg m−3) during the 2025–2026 fire season, with additional days expressed relative to the number of days occurring under climatological fire PM2.5 emissions. Data are shown for (top panel) the top-30 countries globally and (bottom panel) level 1 administrative regions (e.g. states and provinces). The 15 µg m−3 threshold is the World Health Organisation 24 h daily exposure guideline for PM2.5. Values are expressed in population-weighted terms, such that they represent the typical additional exposure for a person living within the region; high PM2.5 concentrations occurring in low-population areas are down-weighted. For methods, data sources, and derived data availability, see Sect. 2.2.
At subnational scale, Tabasco in Mexico had the largest increase, with 97 additional poor air quality days, increasing from 86 to 183 population-weighted days, 2.1 times the climatological-fire value. Surxondaryo in Uzbekistan had 55 additional days, increasing from 119 to 174 d (+46 %), and Anzoátegui in Venezuela had 33 additional days, increasing from 52 to 85 d (+64 %). Large relative changes occurred in Manitoba, Canada, from 4 to 15 d, 3.8 times the climatological-fire value; Tamaulipas, Mexico, from 3 to 12 d, 4.0 times the climatological-fire value; and Espírito Santo, Brazil, from 1 to 8 d, 8.0 times the climatological-fire value. Norrbotten in Sweden, Newfoundland and Labrador in Canada, and Saskatchewan in Canada shifted from no climatological-fire exceedance days to 13, 12 and 10 observed-fire exceedance days, respectively. In many regions, increased PM2.5 occurs against a backdrop of longer-term measures aimed at improving air quality. Increasing wildfire smoke emissions are therefore pushing, or maintaining, PM2.5 concentrations above air quality guideline thresholds.
3.2.4 Protected Area Exposure
Protected area burned percentage in “wildlands” (forests, grasslands, shrublands and sparse vegetation) was above average in 39 of 238 countries, and the percentage of protected areas units affected was above average in 51 of 238 countries (Fig. 6; see Sect. 2.2.4 for methods). Globally, protected area fire was the lowest in the 24-year record by two metrics: 830 thousand km2 burned, equivalent to 4.65 % of global protected area and 17 % below average; and 3708 protected area units affected, equivalent to 7.61 % of protected area units and 16 % below average. This low global ranking was strongly influenced by Africa, where 582 000 km2 of protected area burned, equivalent to 17.1 % of protected area, but still 20 % below the continental reference mean and the lowest percentage in the continental record. Protected area burning was nevertheless above average on some continents such as Europe, where 5100 km2 burned, equivalent to 0.38 % of protected area and 30 % above average, the fifth-highest percentage in the European record.
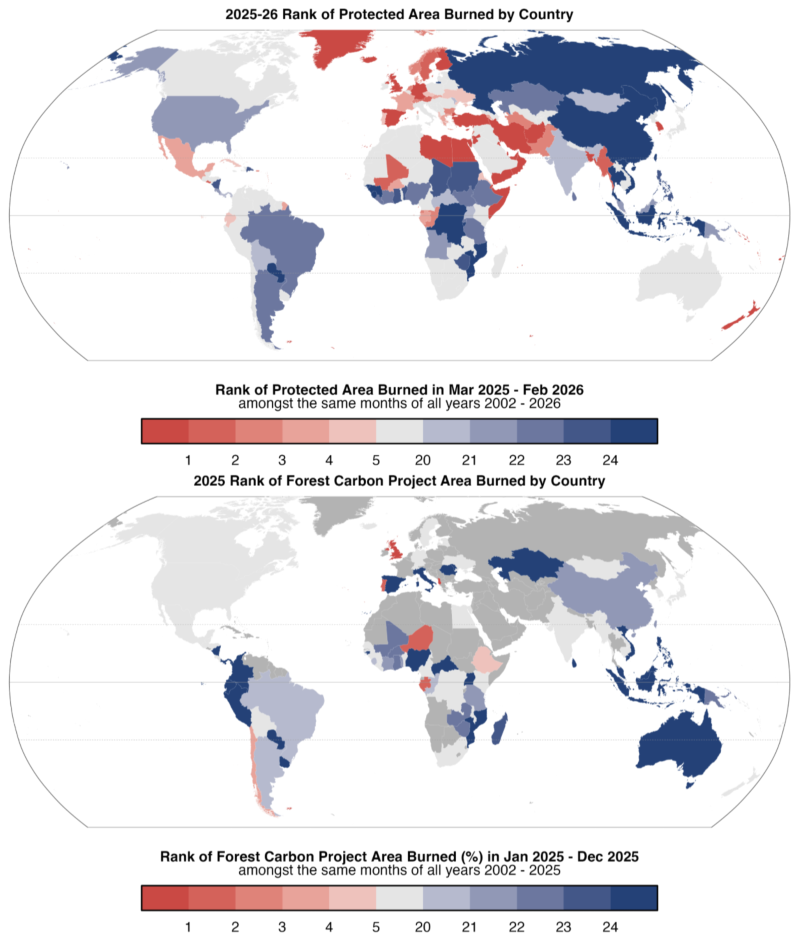
Figure 6Ranked exposure of (top panel) protected areas (% of regional protected area burned) and (bottom panel) forest carbon projects (% of regional project area burned) to fire during the 2025–2026 fire season amongst all fire seasons since 2002, mapped by country. Regions with no forest carbon projects in the reference dataset are mapped in dark grey. For methods, data sources, and derived data availability, see Sect. 2.2.
At country scale, Australia had the largest above-average protected area BA, with 160 000 km2 burned, equivalent to 8.69 % of national protected area and 16 % above average, although this was only its ninth-highest percentage in the record. The largest above-average protected area BAs outside Australia were in Burkina Faso, where 12 300 km2burned, equivalent to 28.70 % of national protected area and 10 % above average, its fourth-highest value; Cambodia, where 11 600 km2 burned, equivalent to 16.69 % and 10 % above average; Mali, where 8700 km2 burned, equivalent to 11.28 % and 24 % above average, its second-highest value; and Congo, where 7000 km2 burned, equivalent to 5.72 % and 49 % above average, its third-highest value. Record national protected area burned percentages occurred in Spain, with 1558 km2burned, equivalent to 1.29 % of protected area and 4.8 times the average; Bangladesh, with 132 km2 burned, equivalent to 12.06 % and 6.2 times the average; Cyprus, with 126 km2 burned, equivalent to 4.14 % and 16.4 times the average; South Korea, with 118 km2 burned, equivalent to 0.78 % and 56.1 times the average; and the United Kingdom, with 122 km2 burned, equivalent to 0.21 % and 5.4 times the average.
3.2.5 Forest Carbon Project Exposure
Forest carbon project exposure was detected in 50 of 83 countries with assessed projects, while overall fire exposure in 2025 was below-average. Project area burned was above average in 10 countries and the number of projects exposed to fire was above average in 20 countries (Fig. 6; see Sect. 2.2.5 for methods). Across the assessed portfolio, 235 of 1798 forestry projects in the voluntary carbon market were affected by fire during 2025, equivalent to 13.1 % of projects. In terms of BA, this amounted to 27 400 km2 inside project boundaries, representing 3.7 % of the total project area globally. Africa had the largest burned project area of any continent, with fire affecting 78 of 157 projects and burning 22 400 km2 within project boundaries in 2025, equivalent to 15.9 % of the assessed project area. Despite this large absolute impact, BA was 21 % below average and marked the lowest value in the African record. South America had 61 of 324 projects exposed to fire and 4000 km2 (1.2 %) of project area burned, but project area burned was 43 % below average and the second-lowest value in its continental record. Asia had 28 of 227 projects exposed to fire and 610 km2 (1.0 %) of project area burned, 21 % below average. North America had 65 of 905 projects exposed, but only 356 km2 (0.2 %) of project area burned, which is 34 % below average. Europe was the main relative exception: although only 3 out of 172 projects were exposed, the 5.57 km2 (0.9 %) of project area burned was 4.8 times the average, making 2025 the second-highest year in the European record and sixth-highest in terms of the number of affected projects. Notably, 92 % of the BA was concentrated in two projects: one in Portugal, where fire affected 79 % of the project area, and one in the UK, where it affected 51 %.
At country scale over 2025, Zambia had the largest burned project area, with 8800 km2 burned across all 7 assessed projects, equivalent to 24.9 % of project area, although this was the third lowest year on record since 2002. Benin had 7800 km2 burned in its single assessed project, equivalent to 61.7 % of project area, but this was the sixth lowest year on record. In Africa, many forestry projects are located in seasonally dry woodlands, ecosystems that are naturally adapted to fire. Brazil had 3900 km2 burned across 29 of 111 projects, equivalent to 2.95 % of project area, the fifth lowest year on record. Cambodia had all 4 projects exposed and 520 km2 (7.7 %) burned, although this ranked 17th for project area burned in its record. Mozambique had all 3 projects exposed and 461 km2 (28.3 %) burned, with the lowest burned project area in its record. Of the countries with the largest BA, India was the only country with above average project area burned (71 km2 or 1.7 %), with 8 of 53 projects exposed, ranking ninth for burned project area. Other large portfolios with over 100 forestry projects, such as China, Colombia, Mexico and the United States had 5.8 %, 13.2 %, 9.7 % and 2.3 % of projects exposed to fire, respectively. This resulted in the lowest and fourth lowest project areas burned on record in Colombia and China, and about average project area burned in Mexico and the United States, ranking 13th and 14th, respectively.
3.3 Continental Summaries: A Year in Review by Continent
Each continental expert panel has presented its regional assessment of the 2025–2026 fire season as a standalone article (Dintwe et al., 2026; Kukavskaya et al., 2026; Fernandes et al., 2026; Kolden et al., 2026; Reynolds et al., 2026; Anderson et al., 2026), rather than as an appendix to the core State of Wildfires report (as in previous editions). Here, we summarise the key events of the 2025–2026 fire season presented by each of the regional panels.
3.3.1 Africa
The 2025–2026 fire season in Africa had the lowest BA and fire emissions in the 25-year satellite record. The significantly above-average burning across the Sahel and semi-arid West Africa contrasted with suppressed fire activity across much of Central, Eastern, and Southern Africa. Continental BA was lower than in the 2023–2024 and 2024–2025 fire seasons, and all major African biomes except the Mediterranean recorded negative BA anomalies, but this masked exceptional regional activity in Sudan, Niger, Burkina Faso and the Western Cape of South Africa. Fire carbon emissions anomalies were also pronounced in Sudan and Niger, while most southern and central African countries recorded negative fire-related carbon emissions anomalies. The key events of the 2025–2026 fire season are summarised by Dintwe et al. (2026) and included:
-
Sudan recorded the largest absolute positive BA anomaly in Africa, at approximately +23 000 km2, with the strongest subnational anomalies in North Darfur (+207 %) and North Kurdufan (+309 %).
-
Niger recorded the second-largest absolute BA anomaly on the continent, at approximately +12 000 km2. Three of its principal fire-active departments recorded their highest BAs since 2002: Tahoua (+694 %), Zinder (+827 %) and Tillabéry (+109 %).
-
Burkina Faso experienced its fourth-highest BA season nationally since 2002, dominated by record burning in the Sahel (+1073 %) and Centre-Nord (+861 %) regions.
-
Mali recorded a moderate positive national BA anomaly of approximately +6700 km2, concentrated in Gao (+666 %) and Mopti (+62 %). Mauritania also ranked among the largest positive relative fire carbon emissions anomalies in Africa, at +106 %.
-
In contrast, much of southern and central Africa recorded below-average fire activity, including Botswana (−56.9 %), Cameroon (−40.1 %) and Zimbabwe (−51.7 %) for BA, and Lesotho (−72.3 %) and the Central African Republic (−57.9 %) for fire-related carbon emissions.
-
The Congo Basin experienced a comparatively normal fire season, with BA only slightly deviating from the long-term average across Congolian forests, Angolan Miombo Woodlands and Central Zambezian Miombo Woodlands.
-
The Western Cape of South Africa experienced its highest BA on record, with approximately 4700 km2 burned compared with a long-term average of 2700 km2. The season began unusually early, with 31 significant fires between September and November 2025 compared with a 25-year average of nine.
-
Major Western Cape fires in January 2026 included the Cederberg Complex and Overstrand fires, which burned more than 340 and 370 km2, respectively, and contributed to a provincial disaster declaration.
-
In Namibia, a September 2025 fire burned approximately 7000–8500 km2 in Etosha National Park, representing about one-third of the park area.
-
In Ghana, early-2026 fires affected agricultural communities in the Atebubu Amantin Municipality of the Bono East Region, including around 60 acres (0.25 km2) of cocoa and cashew plantations in Asueyi, with further fires affecting maize farms in February.
Beyond the insights captured by the regional panel report, we report on indicators of extreme fire behaviour within Africa. Our analyses show that the broad continental suppression of BA and fire carbon emissions was also reflected in subdued fire intensity across the major savannah systems, while several Sahelian regions showed clear evidence of unusual fire occurrence, size or growth:
-
Peak fire radiative intensity in the African (sub)tropical grasslands, savannahs and shrubland biomes was 11 % below average and the lowest in the record.
-
Sudan's positive BA anomaly was linked mainly to widespread fire occurrence: the number of mapped fires was 189 % above average, but 95th percentile fire size and peak intensity were below average.
-
Niger recorded its highest 95th percentile rate of growth in the record, 64 % above average.
-
Tahoua, Niger, had exceptionally large and fast-growing fires, with 95th percentile fire size 332 % above average and 95th percentile rate of growth 232 % above average.
-
Burkina Faso's Sahel region recorded its highest 95th percentile fire size, 387 % above average.
-
Centre-Nord, Burkina Faso, recorded its highest number of mapped fires, 1113 % above average, together with strongly elevated fire size and growth metrics.
-
The Western Cape's record BA season was supported by elevated peak fire radiative intensity, 26 % above average, though 95th percentile fire size and rate of growth were less exceptional. These emissions are far lower than in the last drought where the emissions were nearly double average for four years (2016–2019).
3.3.2 Asia
Based on the regional MODIS BA and GFED fire carbon emissions analyses, the 2025–2026 fire season in Asia had significant positive anomalies across South, Southeast and East Asia despite below-average continental totals. The expert-panel report estimates 235 112 km2 burned across Asia in MODIS MCD64A1, 38 % below the post-2002 average, with GFED fire emissions 49 % below average. Regional MODIS anomalies show record or near-record BA in Myanmar, India, Pakistan, Bangladesh and South Korea. The key events of the 2025–2026 fire season are summarised by Kukavskaya et al. (2026) and included:
-
Myanmar recorded Asia's highest absolute BA anomaly in the regional MODIS analysis, at approximately +11 000 km2, concentrated in Chin State (+265 %; highest since 2002).
-
India recorded its third-highest BA season since 2002 in the regional MODIS analysis, at approximately +9300 km2 above average, with record burning in Mizoram (+1015 %) and the fourth-highest season in Madhya Pradesh.
-
Pakistan and Bangladesh recorded their highest national BA seasons since 2002 in the regional MODIS analysis: Pakistan was approximately +2500 km2 above average (+120 %), while Bangladesh was approximately +2000 km2 above average (+412 %).
-
South Korea recorded its highest BA season since 2002 in the regional MODIS analysis, at approximately +880 km2 above average (+896 %), the largest relative BA anomaly globally. GFED ranked South Korea second globally for relative fire carbon emissions anomaly (+329 %).
-
The South Korean spring 2025 fires were the deadliest in the national record, with 32 fatalities, 54 injuries, approximately 37 000 residents evacuated and nearly 5000 structures destroyed. During 21–30 March, 79 wildfires burned under temperatures more than 10 °C above average, relative humidity below 20 %, and winds exceeding 15 m s−1.
-
In Pakistan, catastrophic fires in Balochistan caused at least 35 fatalities, burned thousands of hectares of forest and displaced more than 3000 families.
-
Myanmar's 2025–2026 BA was 33 % above the 2002–2024 average in MODIS MCD64A1 according to the expert-panel report, with agricultural and forest fires, especially in Shan State, contributing to transboundary haze affecting Thailand and Laos. Myanmar's 2025 mean PM2.5 concentration reached 23.5 µg m−3, more than five times the WHO annual guideline.
-
Russia recorded below-average fire activity nationally, but Zabaikalsky Krai, Buryatia and Amur Oblast accounted for 61 % of Russia's total BA and 90 % of forested BA in the expert-panel report. Zabaikalsky Krai alone accounted for 40 % of Russia's total BA, was under a federal fire emergency from 14 April to 10 July 2025, and recorded three firefighter fatalities.
-
China's national BA reached 126 000 km2 in the expert-panel report, with Heilongjiang and Jilin contributing 26 000 and 17 000 km2, respectively, or 35 % of the national total. Spring precipitation in Northeast China was more than 40 % below the climatological mean.
Beyond the insights captured by the regional panel report, we report on indicators of extreme fire behaviour within Asia. Our analyses show that the continental-scale low BA and fire carbon emissions were accompanied by generally subdued fire occurrence and intensity, but with important exceptions in South and East Asia:
-
Across Asia, mapped fire count was 49 % below average and peak fire radiative intensity was 9 % below average.
-
Myanmar recorded Asia's largest positive BA anomaly, but fire count, 95th percentile fire size, rate of growth and peak intensity were all below average. In Chin State, record BA was not matched by positive fire size, growth or intensity anomalies in the Global Fire Atlas diagnostics.
-
India's BA anomaly was supported by larger and faster-growing fires: 95th percentile fire size was 36 % above average and rate of growth was 31 % above average.
-
Madhya Pradesh was the clearest Indian fire behaviour anomaly, with 95th percentile fire size 60 % above average and 95th percentile rate of growth 64 % above average.
-
Pakistan recorded its highest number of mapped fires, 150 % above average, alongside elevated 95th percentile fire size.
-
South Korea had the strongest fire-intensity anomaly in Asia, with peak fire radiative intensity 450 % above average and the highest in the record.
3.3.3 Europe
Based on the regional MODIS BA and GFED fire carbon emissions analyses, Europe experienced its most extreme wildfire season in the observational record during 2025–2026 according to regional fire monitoring products, with record BA and fire carbon emissions concentrated in the Iberian Peninsula. The European Forest Fire Information System (EFFIS) estimated 19 629 km2 burned across Europe in 2025–2026, the largest total since its records began in 2006 and 301 % above the 2006–2024 average. EFFIS also estimated 58.35 Mt CO2 emissions, 165 % above its reference-period mean (European Forest Fire Information System, 2026), while the regional GFED analysis indicated record fire carbon emissions for Europe. As noted in Sect. 3.1, there is some misalignment between the EFFIS data presented here and our analysis of the global MODIS BA product, which conversely showed below-average BA on the European continent. This is explained by differences in the temporal and spatial coverage of the EFFIS system versus our definition of the European continent used here (ArcGIS Hub, 2024; see Sect. 3.1 for details).
The key events of the 2025–2026 fire season are summarised by Fernandes et al. (2026) and included:
-
EFFIS recorded 7205 km2 burned across Europe during two exceptional August weeks. During 8–26 August 2025, approximately 5247 km2 burned in the Iberian Peninsula across 66 large fires exceeding 5 km2. The event coincided with Spain's warmest summer since 1961 and driest in the region most affected, Portugal's warmest and driest June–August period since 1931, and first-ranked August FWI values across much of the Northwest Iberian Peninsula since 1985.
-
Spain was the dominant contributor to the continent's positive fire anomaly seen in our MODIS BA analysis (Sect. 2.1.2), recording its highest national BA since 2002, with approximately 3600 km2 burned and a +266 % anomaly. EFFIS BA totals for Spain were comparable, at 3931 km2. Nine Spanish fires exceeded 100 km2 and burned in just 15 d over 13–28 August, including the Molezuelas de la Carballeda fire in Zamora, which burned 400 km2 and became the largest wildfire recorded in Spain.
-
Portugal recorded a +120 % BA anomaly in the regional MODIS analysis, while EFFIS reported around 2789 km2 burned, equivalent to 3.0 % of national land area. Six Portuguese fires exceeded 100 km2 (the 10 000 ha threshold commonly used to define a “megafire”), including the Arganil fire, which burned 654.17 km2 and became the largest wildfire recorded in Portugal.
-
Spain reported eight fatalities, 86 injuries, 42 913 evacuations and 108 202 people confined. Portugal reported six fatalities, at least 246 hospitalisations, 308 people assisted on site, and 16 activations of the community-based wildfire evacuation and preparedness program “Safe Villages, Safe People”.
-
The United Kingdom recorded its highest national BA season since 2002 in the regional MODIS analysis, with a +288 % anomaly, and ranked among the largest positive relative fire carbon emissions anomalies globally in the regional emissions analyses (+121 %–169 %). The Dava-Carrbridge fire complex in the Scottish Highlands burned approximately 100 km2, making it the UK's first recorded “megafire” according to a 100 km2 (10 000 ha) definition. High-severity burning affected more than 80 % of the Dava-Carrbridge fire complex, with peat combustion estimated to contribute 85 % of the fire's total carbon emissions. Meanwhile, the Abergwesyn fire in Wales burned more than 50 km2.
-
Albania recorded its second-highest BA season in the regional MODIS analysis (+202 %). EFFIS identified the Western Balkans as the second major European hotspot, with 2250 km2 burned, including Albania's Dhivër fire, which burned 105.65 km2 and was the largest recorded in the country.
-
Cyprus recorded a national record BA season in EFFIS, including the Limassol fire, which burned 101 km2, killed two people and damaged 532 houses, 113 warehouses, 29 businesses and 300 vehicles.
-
France's Ribaute fire burned 113.91 km2 in less than eight hours, leading to 1 fatality and 13 injuries. Türkiye recorded more than 55 000 evacuations and 17 deaths during multiple western and northwestern fires, while Greece reported evacuations from at least 29 communities, 15 000 people evacuated, 17 firefighter injuries and one fatality.
-
EFFIS reported that 39.3 % of EU27 BA occurred within protected sites, the highest share on record, including 1717 km2 in Spain, 935 km2 in Romania and 513 km2 in Portugal.
Beyond the insights captured by the regional panel report, we report on indicators of extreme fire behaviour within Europe. Our analyses show that although continental BA was below average, the Mediterranean fire season was exceptional in the individual-fire diagnostics, especially in Iberia:
-
Peak fire radiative intensity across Europe was 57 % above average and the highest in the record.
-
The European Mediterranean forests, woodlands and scrub biome recorded its highest 95th percentile fire size, highest 95th percentile rate of growth and highest peak fire radiative intensity.
-
Spain showed the strongest national fire behaviour anomaly in Europe: 95th percentile fire size was 790 % above average, rate of growth 504 % above average and peak intensity 121 % above average.
-
Portugal also had exceptional fire behaviour anomalies, with 95th percentile fire size 266 % above average, rate of growth 268 % above average and peak intensity 165 % above average.
-
Albania recorded its highest 95th percentile fire size and rate of growth, at 349 % and 225 % above average, respectively.
-
The United Kingdom recorded its highest number of mapped fires, 234 % above average, and its second-highest 95th percentile fire size, 146 % above average.
-
Within Spain, Galicia and Castilla y León had especially extreme individual-fire metrics, with 95th percentile fire size more than 10 times the average in both regions.
3.3.4 North America
The 2025–2026 fire season in North America marked a third consecutive year of extreme wildfire activity, characterised by extensive BA and emissions in Canada. Based on the MODIS BA and GFED fire carbon emissions analyses (Sect. 2.1.2), approximately 90,725 km2 burned across the continent between March 2025 and February 2026, ranking 8th in the 24-year BA record, while fire carbon emissions reached 417.4 TgC, 184 % of the 20-year average and the third highest total since 2003. Canada experienced its third most severe fire season on record for BA, with more than 73 000 km2 burned according to national fire agency reporting, and its second-highest fire carbon emissions on record after 2023–2024 in the fire carbon emissions record. Fire activity was especially anomalous in central Canada: Manitoba, Saskatchewan, the Northwest Territories and Ontario all ranked among their top five fire seasons, with absolute BA anomalies exceeding +8000 km2 in both Manitoba and Saskatchewan. At the national scale, Mexico and Cuba were also among the largest positive relative anomalies for fire carbon emissions in North America. The key events of the 2025–2026 fire season are summarised by Kolden et al. (2026) and included:
-
Anomalous BA and fire carbon emissions were concentrated in central boreal Canada, especially Manitoba and Saskatchewan, rather than in the western and eastern Canadian regions associated with recent record fire seasons.
-
Manitoba recorded its highest BA on record following an early heatwave, including 37 °C in Winnipeg on 13 May, while Saskatchewan also experienced extensive boreal burning.
-
Canadian fire carbon emissions were dominated by central provinces in the GFED record: Manitoba emitted 79.9 TgC, 11.7 times its 2003–2026 average, while Saskatchewan emitted 116.9 TgC, 477 % of normal.
-
Ontario and New Brunswick also recorded their highest fire carbon emissions in the 2003–2026 GFED record, while New Brunswick and Nova Scotia had above-average BA, including unusually late season fire activity.
-
Major societal impacts occurred in central Canada, with statistics from agency and media reporting including two civilian deaths, more than 31 000 evacuations in Manitoba, more than 26 000 in Saskatchewan, and hundreds of homes destroyed. Many of the evacuated communities were remote Indigenous First Nations communities, and fire response was challenged by limited suppression capacity in provinces that historically experience fewer large fires than western Canada.
-
Mexico recorded over 12 300 km2 burned according to the Comisión Nacional Forestal (CONAFOR) database, its second-highest total since records began in 1970; this was 385 % of the 1970–2024 long term average and 249 % of the 2005–2024 average.
-
The United States recorded near average BA according to U.S National Interagency Fire Center (NIFC) reporting, with more than 21 500 km2 burned, but 77 850 fires were detected, the highest number since 2011 and 25 % above the previous decade's average.
-
In March 2025, NIFC reported that grassland fires in Oklahoma and the Texas Panhandle burned more than 688 km2, destroyed over 500 structures, injured more than 200 people, and killed four people.
-
Several US fires were notable for unusual timing or conditions, including North and South Carolina fires partly fuelled by Hurricane Helene debris, the Minnesota Camp House Fire that destroyed 187 structures, and mid winter fires in Colorado and the Great Plains.
-
The Dragon Bravo Fire in Arizona burned 588 km2 in and around Grand Canyon National Park and destroyed 113 structures, including the historic Grand Canyon Lodge.
Beyond the insights captured by the regional panel report, we report on indicators of extreme fire behaviour within North America. Our analyses show that the strong fire carbon emissions anomaly was accompanied by record continental fire intensity and widespread fire occurrence, especially across central Canada:
-
North America recorded its highest peak fire radiative intensity in the record, 61 % above average.
-
Continental 95th percentile fire size and 95th percentile rate of growth were also elevated, at 77 % and 31 % above average.
-
The North American boreal forest had a record number of mapped fires, 370 % above average, but 95th percentile fire size and rate of growth were below average.
-
Canada recorded its highest number of mapped fires, 339 % above average, and its second-highest peak fire radiative intensity, 31 % above average.
-
Manitoba recorded its highest number of mapped fires, 541 % above average, alongside elevated fire size and peak intensity.
-
Saskatchewan also recorded its highest number of mapped fires, 624 % above average, and high peak intensity, but 95th percentile fire size and rate of growth were below average.
-
Ontario showed positive anomalies across fire count, 95th percentile fire size, rate of growth and peak intensity, reinforcing its high-ranking BA and emissions season.
3.3.5 Oceania
The 2025–2026 fire season in Australia was notable for the high number of fires rather than exceptional total BA. Approximately 477 000 km2 burned between March 2025 and February 2026, ranking 10th in the 24-year record, while the number of detected fires was the highest in the period of record. The key events of the 2025–2026 fire season were summarised by Reynolds et al. (2026) and included:
-
Anomalous high BA extent was concentrated in northern savanna and arid-zone systems of Australia, where fuel availability was above usual due to antecedent rainfall in early 2025. In the calendar year 2025, 455 000 km2 burned in Australia's tropical savannas, the largest extent since 2012, including almost 300 000 km2 in the Northern Territory (North Australia and Rangelands Fire Information, 2026). Some desert regions in Western Australia and the Northern Territory experienced more than twice the median annual burned extent of the previous 25 years.
-
Several large fires occurred in sparsely populated savanna, rangeland and desert landscapes of Australia under continuous-fuel conditions. Notable examples included: the Tanami Desert fire complex (Northern Territory) alone burning > 35 000 km2 following dry lightning ignitions in fuels accumulated after successive wet years; a fire south of Broome (Western Australia) that burned > 12 000 km2 over 28 d; a Northern Territory fire that burned > 7000 km2 over 62 d, and multiple Kimberley (Western Australia) and Queensland fires each exceeding 4000 km2.
-
The most severe societal impacts occurred in southern and eastern Australia, particularly Victoria and New South Wales. In Victoria, an early-January catastrophic fire-weather episode produced 25 major fires, approximately 4000 km2 burned, one fatality, over 450 homes destroyed, and the loss of around 45 000 livestock, following 24 months of persistent dryness. New South Wales experienced a prolonged season with > 11 000 bush and grass fires, > 2000 km2 burned, 26 homes destroyed, and one agency firefighter fatality.
-
The season affected multiple landscapes of high ecological, cultural or international conservation significance. Fire burned 62 % of Judburra/Gregory National Park in the Northern Territory; approximately 1710 km2 in and adjacent to Fitzgerald River National Park (Western Australia), the core of a UNESCO Biosphere Reserve; 40 % of Deep Creek National Park (South Australia); and two areas of Tongariro National Park (New Zealand), a dual World Heritage site.
-
Several fires led to significant societal impacts despite their not growing to be large. In Tasmania, the Dolphin Sands fire burned only approximately 7 km2 but destroyed 19 homes. In New Zealand, a fire near Kaikōura destroyed 14 buildings having spread under downslope winds reaching 200 km h−1.
Beyond the insights captured by the regional panel report, we report on indicators of extreme fire behaviour within Oceania. Our analyses show that Australia's 2025–2026 season was most clearly expressed through widespread fire occurrence, particularly in savanna and arid-zone systems, rather than through exceptional national fire intensity:
-
Australia recorded its highest number of mapped fires in the record, 88 % above average.
-
National 95th percentile fire size and rate of growth were moderately elevated, at 21 % and 22 % above average.
-
Peak fire radiative intensity in Australia was 8 % below average, consistent with near-average or below-average national fire carbon emissions.
-
The Australian (sub)tropical grassland, savannah and shrubland biome recorded its highest number of mapped fires, 105 % above average.
-
Australian deserts and xeric shrublands showed the clearest individual-fire anomaly, with fire count 124 % above average, 95th percentile fire size 91 % above average and rate of growth 59 % above average.
-
Victoria's societal impacts were not matched by extreme state-wide fire size or growth diagnostics; peak intensity was close to average.
3.3.6 South America
The 2025–2026 fire season in South America was notable for damaging localised fires in Chile and Argentina, major protected-area burning in Brazil, and increased fire activity in parts of the Caatinga, Pampa and Ceará, rather than exceptional continental BA. Based on the regional MODIS BA and GFED fire carbon emissions analyses, continental BA was the lowest since 2002, at 185 075 km2, and fire carbon emissions were below their post-2003 average. This low continental total occurred despite up to 30 additional extreme fire-weather days, relative to 2002–2025 conditions, across parts of the central continent, eastern coast and Chilean Pacific coast. The key events of the 2025–2026 fire season are summarised by Anderson et al. (2026) and included:
-
In Chile, the January 2026 Penco-Lirquén fire in Biobío burned approximately 200 km2, caused 23 fatalities, destroyed thousands of houses and displaced 52 000 evacuees to 11 shelters; the wider Chile-Argentina event is treated in detail in Sect. 6.1.
-
In northern Patagonia, January 2026 fires affected the Andean forest belt and areas around Los Alerces National Park, a UNESCO World Heritage site, with reported damage exceeding approximately 445.5 km2 by late January 2026 (see Sect. 6.1).
-
The Brazilian National Institute for Space Research (INPE) recorded 3224 active fire detections across Argentina's northern provinces and Paraná basin floodplain from 23–29 August 2025, including 1074 hotspots on 29 August; Chubut recorded 529 AQUA/MODIS active fires across 21 d in January 2026, 390 % more than in the previous year.
-
Brazil recorded 136 393 active fires in INPE monitoring, 51 % fewer than in 2024, the seventh-lowest annual total since INPE monitoring began in 1998 and 37.1 % below the 1998–2024 average.
-
Within Brazil, INPE active-fire counts were approximately 96 % below the 1998–2024 average in the Pantanal and 78 % below average in the Amazon, but 26 % above average in the Caatinga and 72 % above average in the Pampa.
-
MapBiomas reported that the Cerrado and Caatinga accounted for 71 % of Brazil's total BA in 2025, despite Brazil's low national active-fire total in the INPE record.
-
The Chapada dos Veadeiros National Park fire in central Goiás burned for more than 21 d and affected at least 1110 km2, equivalent to 46 % of the park, and also reached the Avá-Canoeiro Indigenous Territory and the Kalunga Quilombola Territory.
-
Ceará was a localised Brazilian exception in the regional analysis, with fire numbers 334 % above the long-term average and BA 35 % above average, the highest fire-count anomaly and only positive BA anomaly among Brazilian states.
-
Bolivia recorded a much lower fire season than in 2024, with INPE reporting 18 608 active fire detections between February 2025 and March 2026 and national monitoring reporting 7410 km2 burned in 2025, 79 % lower than the 124 000 km2 burned in 2024.
Beyond the insights captured by the regional panel report, we report on indicators of extreme fire behaviour within South America. Our analyses show that the continent's low BA and fire carbon emissions totals masked some localised fire behaviour anomalies, but the strongest spreadsheet evidence remains concentrated in BA and emissions rather than consistently in the individual-fire diagnostics:
-
South America had low BA and fire carbon emissions overall, yet 95th percentile fire size and rate of growth were above average, at 27 % and 31 %, respectively. Peak fire radiative intensity across South America was slightly below average, at −7 %.
-
The South American temperate broadleaf and mixed forest biome had elevated peak fire radiative intensity, 62 % above average, supporting the localised southern temperate forest anomaly.
-
Chubut's strong BA and fire carbon emissions anomalies were not matched by an equally clear peak-intensity anomaly in the fire behaviour diagnostics.
-
Brazil was below average nationally for BA and fire carbon emissions, but fires that did occur were relatively large and fast-growing, with 95th percentile fire size 71 % above average and rate of growth 62 % above average.
-
Piauí was a localised Brazilian exception, with fire count 135 % above average, 95th percentile fire size 68 % above average and rate of growth 42 % above average.
3.3.7 Focal Regions
For this report, we select three focal regions that experienced significant impacts and anomalously high BA and emissions (see Sect. 2.3). In each case we analyse the nature and impact of the event, the contributing hydroclimatic drivers, and attribution to climate change today and in future projections. Our focal regions and event periods are: Midwestern Canadian Shield Forests (July–August 2025); the Northwest Iberian Peninsula (which we refer to as Northwest Iberia) (August 2025); the Chilean Temperate Forests and Matorral (January–February 2026).
4.1 Nature and Impact of the Event
Midwestern Canadian Shield Forests were selected as a focal region because the 2025 fires formed the central Canadian core of a third consecutive extreme wildfire season in Canada (Chen et al., 2026a; Tymstra and Flannigan, 2025; Jones et al., 2026a), with exceptional BA and fire carbon emissions concentrated across the boreal forest regions of Saskatchewan, Manitoba, and Ontario (Fig. 7). The fires developed from mid-May and continued through summer. By the end of 2025, Saskatchewan had burned almost 23 000 km2, Manitoba over 19 000 km2, and Ontario almost 5000 km2, together accounting for more than half of Canada's BA in 2025 (Canadian Interagency Forest Fire Centre, 2025; Skakun et al., 2024; Sect. 3.3.4). While many of these fires were large in size, consistent with boreal forest fires in Canada, they were also unusually long duration fires, with many igniting or flaring up in mid-May and burning well into September and October, for a much longer than normal fire season.
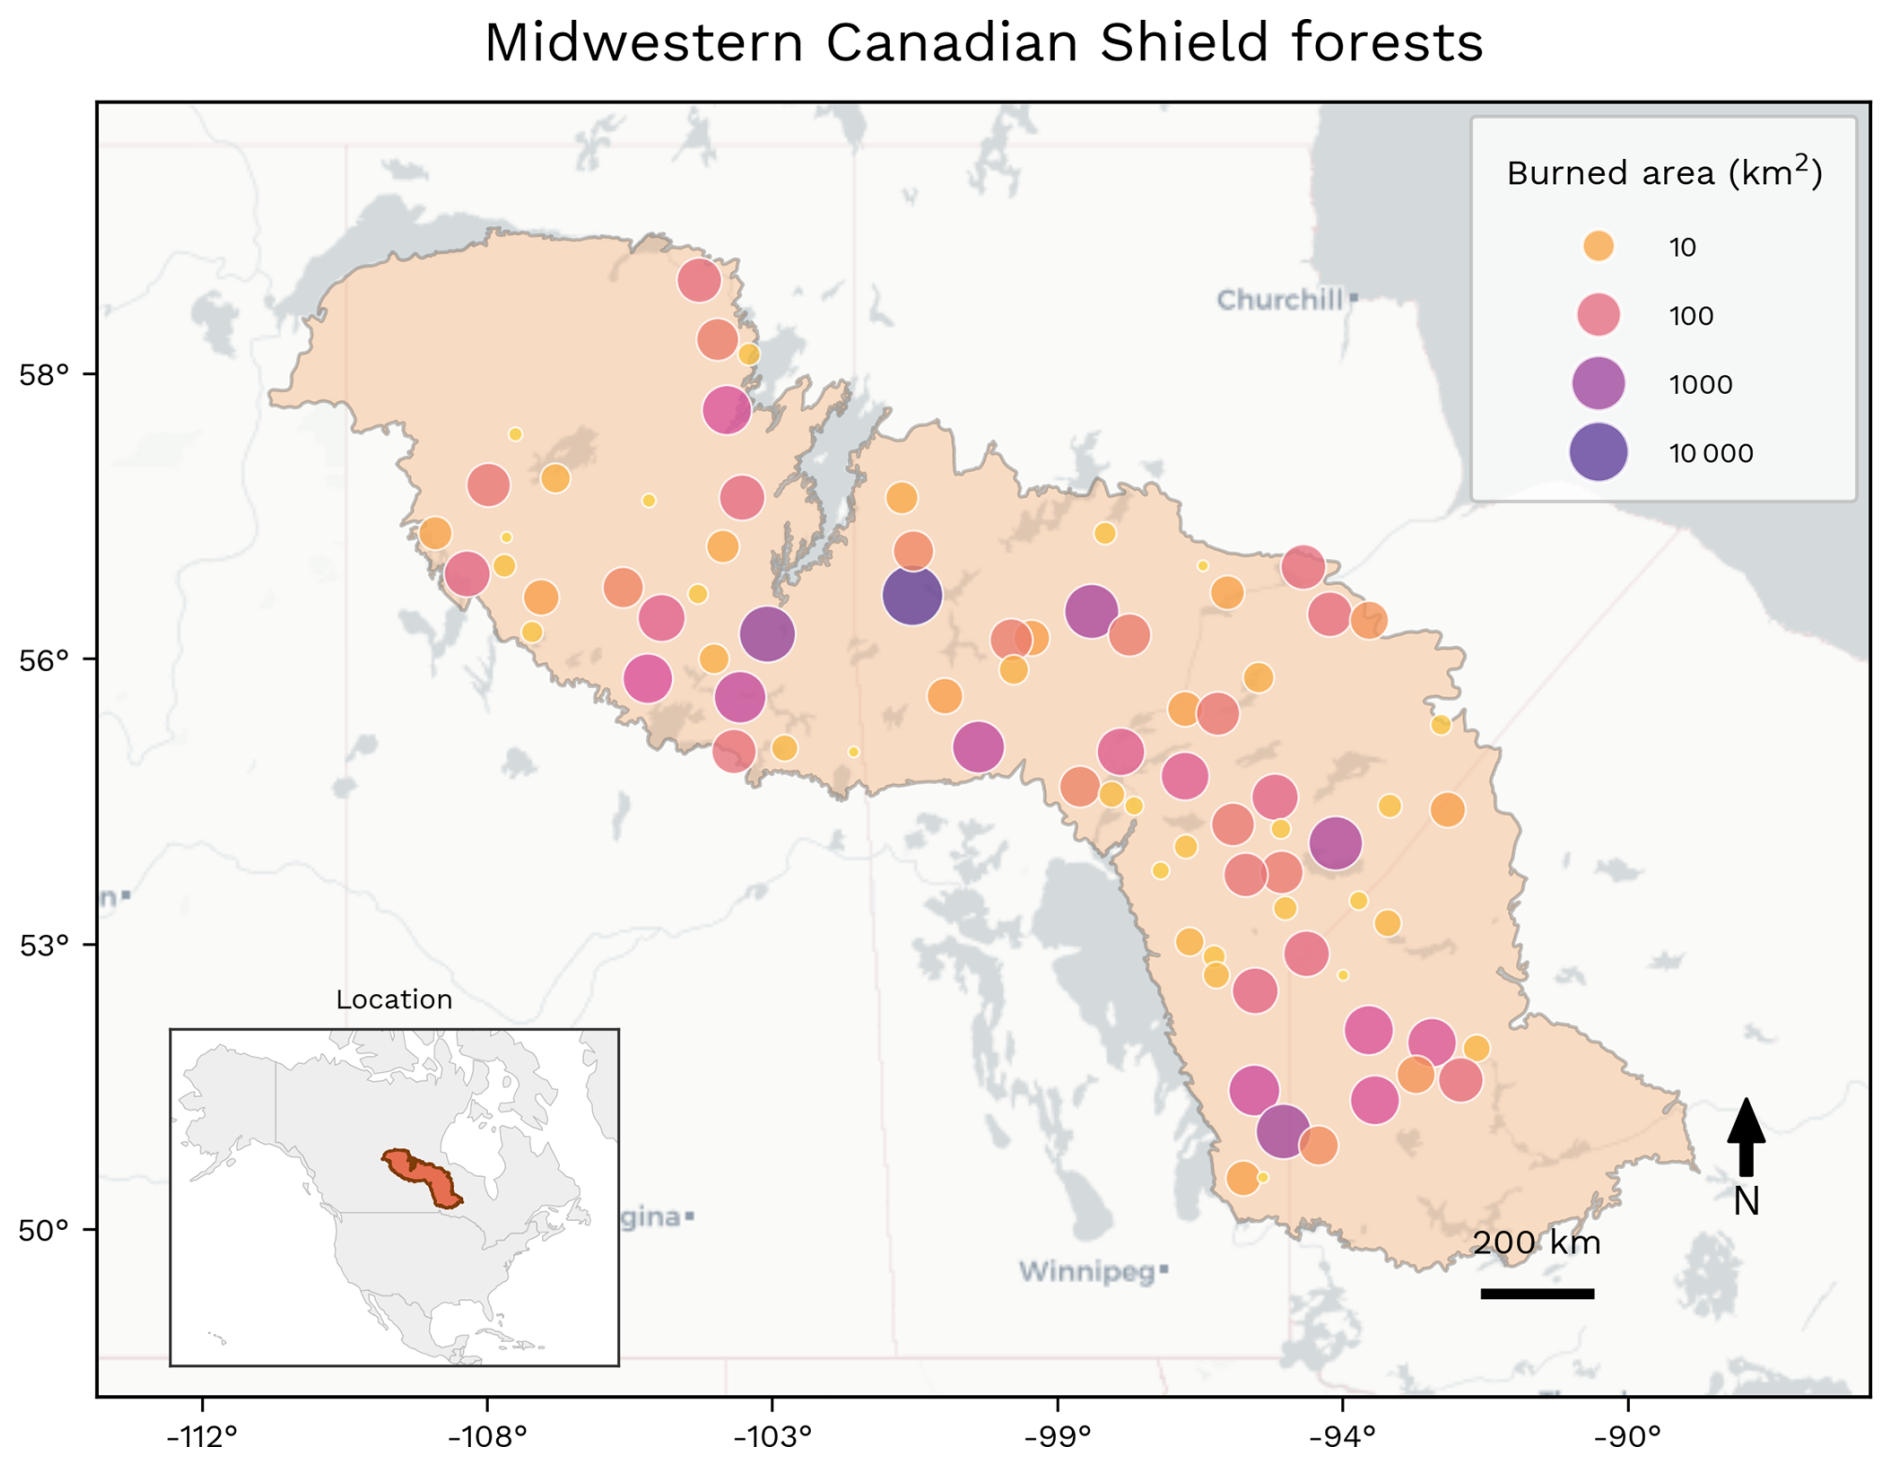
Figure 7Spatial distribution of BA in Midwestern Canadian Shield forests during the fire season (March 2025–February 2026). For display purposes, MODIS BA is first pre-aggregated from the 500 m native resolution to a 5 km grid, then neighbouring 5 km cells that burned during the period are grouped into contiguous clusters. The figure provides an overview of the spatial extent and organisation of the season's BA, rather than the precise location or perimeter of individual fires. Most of the BA occurred during July and August 2025.
Consistent with large wildfire years in the boreal forests of Canada, the focal region experienced a prolonged heat wave in early May 2025 with substantial drying across the central portion of the Canadian shield. This built on a relatively dry winter and facilitated high ignition rates both from new lightning strikes across the region and an unusually high number of overwintering fires that had smoldered in the duff since the 2024 fire season (Saskatchewan Public Safety Agency, 2026), a phenomenon that has been increasing in frequency across Canada and boreal forests globally (Scholten et al., 2021). While provincial wildfire services in Canada generally have limited ability to suppress wildfires in remote areas and instead focus on protection of critical resources and communities, the 2025 fire season impacted so many remote communities (particularly First Nations Indigenous communities) in Saskatchewan, Manitoba, and northern Ontario that it strained provincial emergency response capability substantially. The Canadian Armed Forces supported evacuations and logistics in Manitoba and Ontario, while firefighters were deployed to Canada from the United States, Australia, New Zealand, Costa Rica and Mexico including about 700 firefighters from the United States Forest Service in August 2025.
By 29 May, Saskatchewan had already declared a provincial emergency (Saskatchewan Public Safety Agency, 2026), while the Canadian Interagency Forest Fire Centre had already raised the Preparedness Level to 5 (the maximum), signalling that all provincial and territorial firefighting resources were in use and that additional resources were also needed. Further, these fires exhibited extreme behavior that produced tragic consequences when two civilians were killed in Manitoba on 13 May near Lac du Bonnet, northeast of Winnipeg. By early June, over 25 000 people had already been forced to evacuate, and a second wave of fires in July produced additional evacuations across the region. Public Safety Canada reported that over 70 000 people were evacuated from 116 communities in 2025 across the country, with 64 % of evacuees coming from 72 First Nations communities (Public Safety Canada, 2025). These evacuations were prolonged for many communities (weeks-to-months), and as most were in the Midwestern Canada boreal forest fires, the limited availability of housing and hotel rooms available for evacuees forced many to neighboring provinces hundred of kilometers away (Province of Manitoba, 2026).
The regional event had substantial economic, infrastructure and smoke-related impacts. Insured wildfire losses in Manitoba and Saskatchewan approached CAD 300 million (approximately USD 215 million), including CAD 249 million (approximately USD 180 million) around Flin Flon, Manitoba (The Insurer, 2025). A media analysis estimated more than CAD 500 million (approximately USD 360 million) in direct expenses, including insured damages, evacuations, emergency costs and health-related costs (The Narwhal, 2025). Among the most culturally significant buildings destroyed was the Robertson Trading Post near La Ronge, which had held hundreds of Indigenous artefacts (CTV News, 2025). The fires also damaged or destroyed significant utility infrastructure across the Prairie Provinces (Province of Manitoba, 2025).
While less area burned in British Columbia in 2025, compared with 2023 and 2024, British Columbia still experienced an impactful fire season. Intensifying drought in the first half of August led to major fire events on Vancouver island with evacuations in both Nanaimo and Port Alberni. Nova Scotia and Newfoundland and Labrador also experienced above average fire seasons because of extreme drought and fire weather conditions in August. Notably, the Kingston fire in Newfoundland and Labrador led to the evacuation of 3000 people and the loss of almost 200 homes resulting in over CAD 70 million in insured losses (Insurance Bureau of Canada, 2025).
Smoke from the fires produced repeated and widespread air quality impacts across central Canada, the United States and beyond (Copernicus, 2025; NASA Earth Observatory, 2025). Environment and Climate Change Canada began issuing air quality warnings for Saskatchewan and Manitoba in mid-May and as fires expanded in early June, smoke caused severe air quality conditions in northwest Ontario. Smoke subsequently drifted east and prompted air quality warnings across eastern Canada. Toronto and Montreal were at times ranked among the most polluted major cities globally and poor air quality was also reported across parts of the US Upper Midwest. A second major smoke episode occurred in July as fires intensified again, with much of central Canada and the US Upper Midwest region experiencing unhealthy smoke levels and Toronto again ranking among the most polluted major cities globally. In August, renewed air quality warnings or alerts were issued across Canada and to around 81 million people across 14 US states.
The event also brought substantial long-term ecological and carbon-cycle effects. The focal region lies within carbon-rich boreal forest ecosystems where large, high-intensity fires are a natural disturbance process, but where repeated extreme fire years can increase the proportion of landscape in recently burned or degraded states and weaken post-fire vegetation and carbon recovery (Jones et al., 2026a; Baltzer et al., 2021). Around 70 % of Canada's exceptional boreal forest fire emissions in 2025 came from the Midwestern Shield and Mid-Continental forests of Saskatchewan, Manitoba and Ontario, where emissions were around seven times the average (Jones et al., 2026a; Sect. 3.1).
The wildfire smoke emissions generated substantial aerosol optical depth (AOD) increases over central Canada, with smoke transported across eastern Canada, eastern US and the North Atlantic. This led to a pronounced reduction in net downward radiative flux, increased cloud cover and decreased precipitation over large areas downwind of the source region (Roşu et al., 2026b). Weather was altered regionally by the smoke, with strong surface cooling across eastern Canada and eastern US: modelling work by Roşu et al. (2026b) indicates average temperature anomalies of −0.7 °C and local anomalies as great as −1.7 °C.
4.2 Hydroclimatic Drivers
According to our analysis, the extreme fire activity during the 2025 fire season in Canada was driven by the combined effects of prolonged precipitation deficits, severe soil moisture depletion, and widespread fuel desiccation that progressively developed over several months before the onset of the most intense burning.
The large Midwest Canadian Shield Forest experienced sustained below-average precipitation during the months preceding the peak fire activity, with precipitation anomalies remaining consistently negative up to 4 months before the start of the main event (Fig. 8a). This prolonged lack of rainfall progressively depleted both surface and subsurface moisture reservoirs, producing severe deep-layer soil depletion and critically low deep-soil moisture conditions. The persistence of these deficits meant that vegetation entered the fire season under long-term hydrological stress rather than only transient meteorological drought. As a consequence, both live and dead fuels became exceptionally dry and highly combustible over extensive areas, with fuel moisture conditions reaching among the driest portions of the historical record (z-score > 2.5 corresponding to 99th of the record) and indicating an extreme level of landscape-scale flammability.
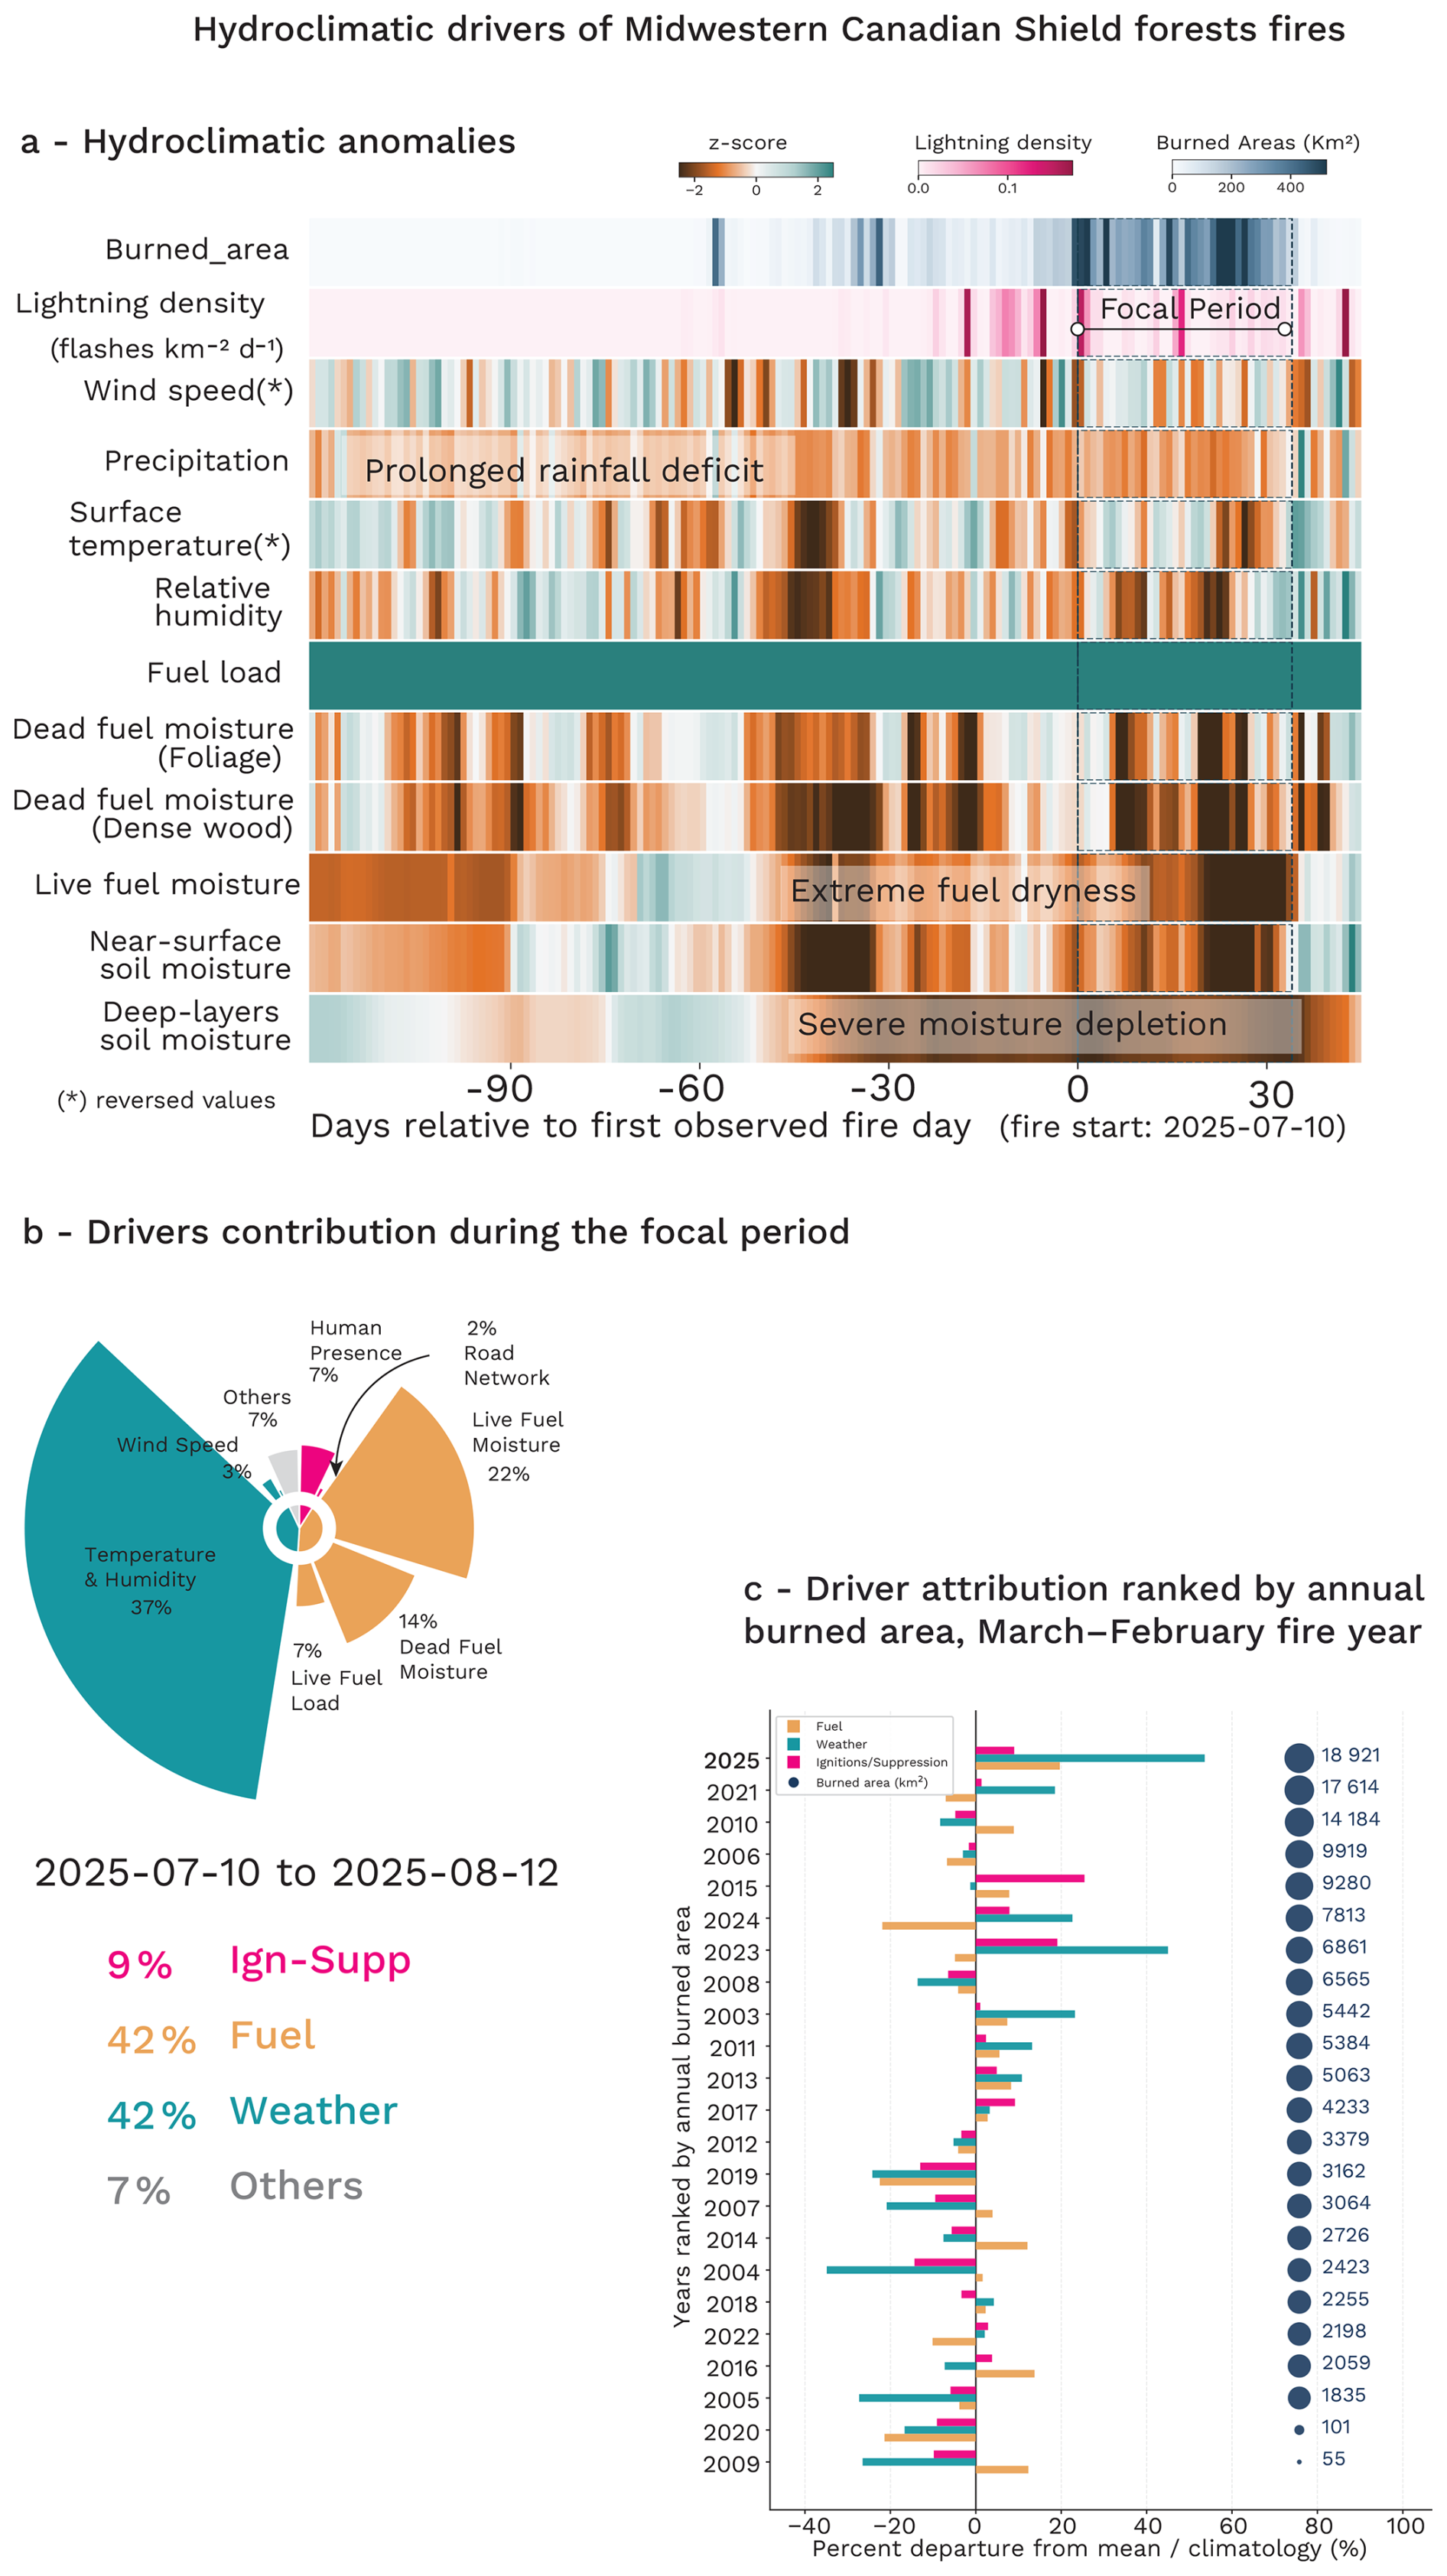
Figure 8Hydroclimatic evolution and SHAP-based model attribution analysis of the focal Canada fire event. (a) Standardised hydroclimatic anomalies (z-scores) from 120 d before to 30 d after the onset of the main fire event, showing the temporal evolution of key atmospheric and fuel-related drivers relative to the 2003–2024 climatology. The main focal event is highlighted and represents the period over which the drivers are attributed in panel (b). (c) Grouped attribution analysis of BA anomalies for all fire seasons from 2003 to the present, showing the relative contribution of fuel-related (Fuel, orange), weather-related (Weather, green), and ignition/suppression-related (Ign-Supp, pink) drivers to interannual fire variability. Years are ranked according to the observed BA over the reporting year, defined from March to February. Note that this panel (c) compares fire activity over the full reporting year, while panel (b) focuses on the main active period to provide a more event-specific attribution.
During the peak burning periods, repeated episodes of anomalously warm and dry atmospheric conditions further intensified fire danger by accelerating evapotranspiration and fuel curing. Temperature anomalies frequently exceeded typical conditions (z-score 0.25 to 0.8) during the most intense fire episodes, while relative humidity remained persistently below normal, indicating strong evaporative demand. These episodes substantially accelerated the desiccation of already stressed fuels and favoured rapid fire growth. Strong wind anomalies also contributed to fire spread and extreme fire behaviour, with several episodes associated with wind conditions stronger than usual enhancing oxygen supply and promoting long-range spotting processes. In Canada, wind acted as an amplifying factor superimposed on an already dry landscape.
Our formal SHAP-based model attribution indicates the dominant role of hydroclimatic and fuel drivers during the 2025 event relative to previous fire seasons (Fig. 8b, c). In particular, anomalies in temperature and humidity represented the single largest positive contribution to the BA anomaly, accounting for approximately 37 % of the anomalous prediction signal in 2025, substantially exceeding most previous years in the record. Fuel moisture variables also showed exceptionally strong positive contributions, with live fuel moisture and dead fuel moisture contributing around 22 % and 14 %, respectively, highlighting the importance of prolonged vegetation desiccation and critically dry fuel conditions. In contrast, variables associated with ignition processes and static landscape characteristics contributed relatively little to the overall anomaly when aggregated over the full period. Human presence and road network nonetheless contributed positively (around 7 % and 2 %, respectively), indicating that background exposure and ecosystem characteristics modulated the final extent of the event.
Compared with the historical attribution patterns observed between 2003 and 2024, the 2025 season stands out for the simultaneous amplification of both atmospheric fire-weather controls and vegetation dryness (Fig. 8d). While previous extreme years were often dominated either by temperature and humidity anomalies or by fuel-load-related contributions, the 2025 event exhibited strong concurrent contributions from atmospheric dryness, live fuel stress, and dead fuel desiccation. This compound signal suggests that persistent precipitation deficits and soil moisture depletion progressively weakened ecosystem moisture resilience prior to the event, while extreme atmospheric dryness and episodic wind conditions ultimately controlled the timing, spread, and severity of the fires.
4.3 Influence of Climate Change
4.3.1 Changes in Fire Weather
From our assessment of climate change impacts on fire weather over July–August 2025, we find that climate change has nearly doubled the probability of extreme fire weather in the Midwestern Canadian Shield Forests. Continued warming could double the risk again of high fire weather under +3.0 °C global mean warming above pre-industrial (Fig. 9, Table 6).
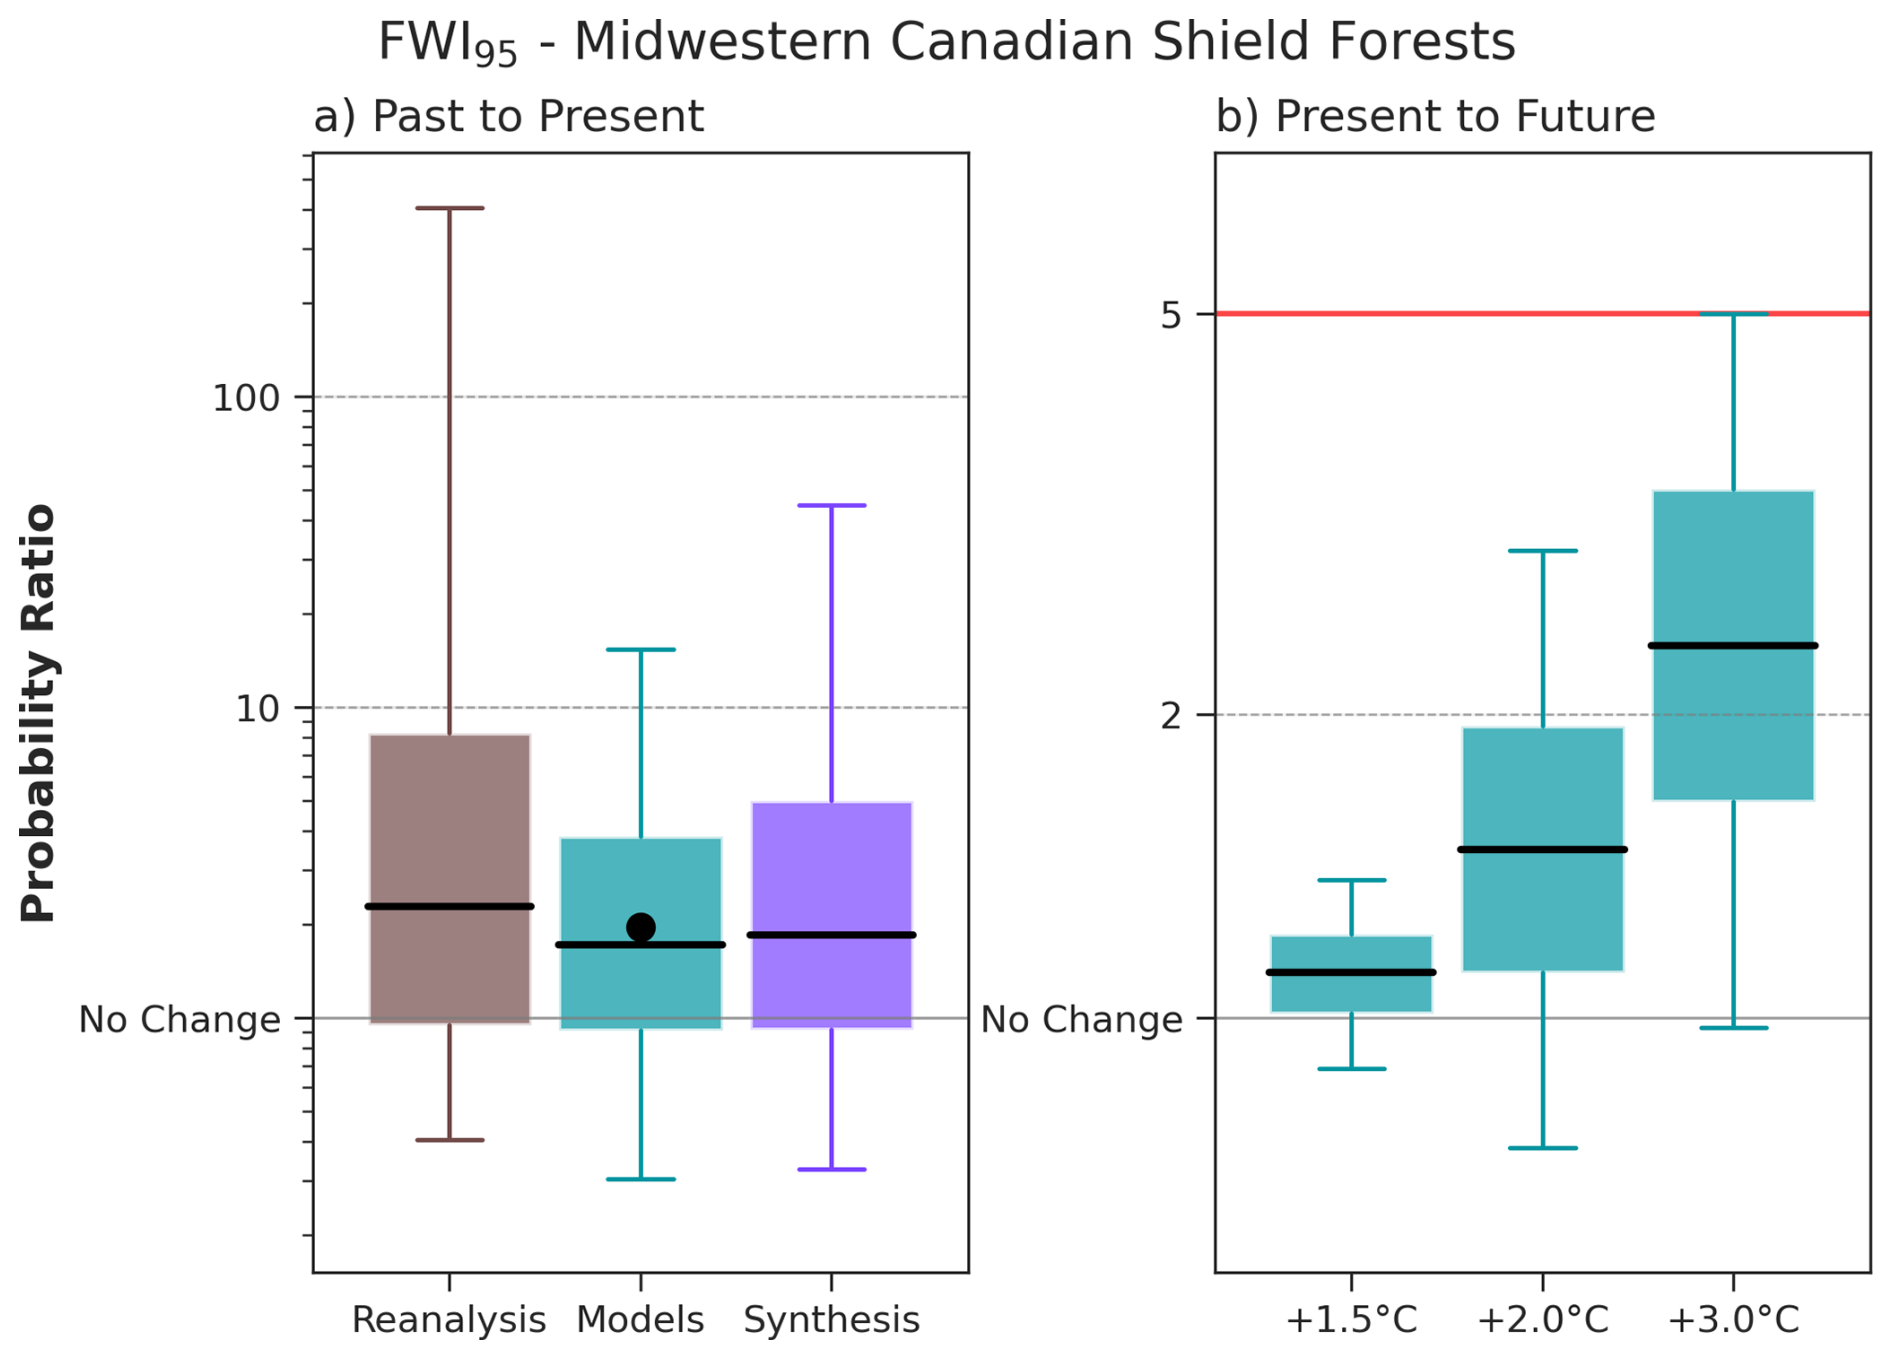
Figure 9FWI95 Probability Ratio (PR) for present day and future GWLs. Summary of attribution results for FWI95 (95th percentile of the FWI over the focal region and time period July–August 2025 for the Midwestern Canadian Shield Forests). The box and whisker plots show the 5th, 25th, 50th, 75th and 95th percentiles of the bootstrapped PR for each data set. The left panel shows the PR (the ratio between current and pre-industrial probabilities) due to human-caused climate change (defined here as a 1.3 °C change) in reanalysis, climate models and a synthesis of all data (in logarithmic scale). The dot on the model bar shows the PR according to the SST driven HadGEM3-A ensemble. The right panel shows the projected change in the event probability according to the same set of models to GWLs of +1.5, +2.0, and +3.0 °C above preindustrial relative to a 2025–2026 value taken as +1.3 °C – the red line corresponds to the inverse of the present day return period, and so marks the PR at which the event would be expected nearly every year. Both scales are logarithmic.
While reanalysis data suggest a wide range of PR values at the 5 %–95 % confidence intervals (0.405, 406), the best estimate of around 2 is similar across reanalysis (2.28), models (1.72) and HadGEM3-A (1.96). The synthesis of the model and reanalysis results suggests that extreme fire weather is nearly twice as likely (1.85) in this region due to climate change. Looking at the 7 d of highest fire weather within the period, FWI7X gives a PR of 1.61 across the CMIP6 model synthesis, with a 5–95th confidence interval ranging from 1.34 to 1.95 (Fig. S6), signifying that the probability of seeing more prolonged extreme fires has increased by 61 %.
We find a slight increase in probability of extreme fire weather at GWL +1.5 °C of around 10 % (best estimate PR 1.11) due to climate change, and higher probability of FWI increase at higher GWLs of around 50 % at +2.0 °C (1.47) and a doubling at +3.0 °C (2.34) although with higher uncertainty (Fig. 9b). At +3.0 °C of global mean warming above pre-industrial, it is very likely from these results that extreme fire weather will increase, with some members suggesting it could increase fivefold with the potential for an event similar to 2025–2026 to occur every year at the most extreme end. For the FWI7X, a similar increase in the likelihood of extreme fire weather is projected under a +1.5 °C warming scenario (Table 6), with events of comparable magnitude estimated to become 1.07 times more likely (5–95th confidence interval: 1.04–1.10). At higher warming levels, the PR is slightly smaller than for FWI95; 1.25 (1.15–1.36) at +2.0 °C, and 1.67 (1.36–1.99) at +3.0 °C. The confidence intervals remain entirely above unity at all warming levels, providing strong evidence that climate change substantially increases the likelihood of extreme fire weather as measured by FWI7X. While uncertainty increases with warming level, the overall trend is clear and consistent across models, indicating progressively greater fire weather risk under future climate change.
Projections for 21st century changes in absolute seasonal fire weather values from the CMIP6 ensemble are presented for multiple SSPs (Fig. S7). While model consensus exhibits some variation, increases in seasonal mean FWI are generally modest in the early decades but become more consistent from mid-century onwards, with the rate of change accelerating under higher emissions scenarios. By the late century, scenario divergence is pronounced, with limited changes under SSP1-2.6 but substantial increases under SSP5-8.5, where mean changes exceed FWI values of 10. The spread across models also increases over time, particularly for higher emissions pathways. Changes in annual maxima are larger and more variable than those in seasonal means, with some models projecting increases exceeding 20 by the end of the century, indicating a disproportionate amplification of extreme fire weather conditions. Despite the overall positive trend, some models simulate weak or negative changes, highlighting persistent uncertainty in projections.
4.3.2 Changes in BA
Total anthropogenic climate forcing very likely (97 % likelihood) increased BA across the Midwestern Canadian Shield Forests during July–August 2025. Across ConFLAME simulations, BA was 8.68 (5th to 9th percentile range of 1.04 to > 100) times larger under factual conditions than in a counterfactual climate without anthropogenic climate forcing (Table 6). Events of comparable magnitude are estimated to be 10.64 (0.97 to > 100, 87 % likelihood) times more likely (PR) under current climatic conditions (Table 6). Supporting the assessment of hydroclimatic drivers above, the increase in BA was very likely driven primarily by drier conditions, with dryness alone producing an amplification of 7.97 (0.79 to > 100), with a 93 % likelihood (Table S7). Drier conditions under similar fuel loads are often associated with more intense fires (Haas et al., 2022), suggesting that climate change may also have contributed to increased fire intensity.
Sub-regional extremes – grid cells within the upper 5 % of BA, exhibited a stronger response with AF 10.55 (1.18 to > 100) and a 97 % likelihood that anthropogenic climate forcing increased BA (Fig. S8). This pattern is consistent with the spatial attribution maps, where the strongest signals occurred in areas that experienced substantial burning (Fig. 10) and the likelihood of increased BA exceeded 99 % (virtually certain). In contrast, areas with little or no burning showed lower likelihoods (66 %–99 %), indicating that while increases remain more likely than decreases, a reduction in BA due to climate forcing cannot be entirely excluded. BA amplification was generally strongest in the southern edges of the region, where AF exceeded 5.
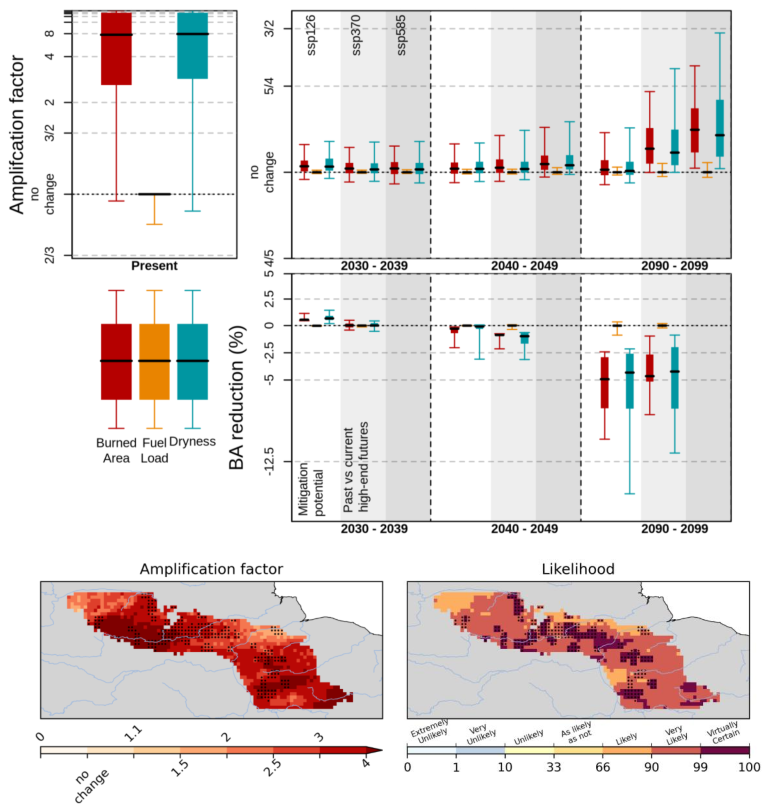
Figure 10Top panels: Amplification of BA due to anthropogenic climate forcing and future climate change during July and August 2025. The left panel shows attribution results for the focal event, with amplification factors (AF) for BA due to anthropogenic climate forcing. The right panel shows projected amplification under future climate scenarios relative to the 2010–2019 baseline. Boxes indicate the interquartile range (IQR) of AF derived from the ConFLAME posterior distribution, whiskers represent the 5 %–95 % uncertainty range, and the solid black line denotes the median. 2nd row, BA reduction represents the proportional decrease in BA for events equivalent in magnitude to the focal event. Here, “Past vs current high-end futures” quantifies the difference in BA between the SSP5-8.5 and SSP3-7.0 scenarios, while “Mitigation Potential” identifies the further reductions achievable by transitioning from SSP3-7.0 to SSP1-2.6 pathway. Colours indicate the contributing drivers: BA (red), fuel load (orange), and dryness (cyan), with each factor representing the effect of varying that component alone. Amplification factors greater than 1 indicate an increase in BA due to anthropogenic forcing or climate change. The lower maps show spatial patterns of attribution. The left map presents the AF of BA due to total anthropogenic forcing, while the right map shows the likelihood of increased BA, calculated as the proportion of the ConFLAME distribution with AF > 1. Dots indicate the grid cells that experienced 95 % of the region's burned area during target months.
Future projections indicate a relatively uncertain increase in BA for events such as 2025–2026 (red bars, Fig. 10). Across all emissions scenarios, a clear increase in BA only emerges by the 2070s (Fig. S8) and remains modest in magnitude. Under SSP1-2.6, BA increases by up to 10 % (AF up to 1.09) with only 82 % likelihood of increase in 2030–2039, dropping to 60 % by 2090–2099 (Table S7). Larger increases are projected under higher-emissions pathways, reaching up to 25 % in SSP3-7.0 (AF 1.0–1.25, 95 % likelihood) and up to 37 % in SSP5-8.5 (AF 1.01–1.37, 97 % likelihood).
Changes in event likelihood are smaller than changes in event magnitude. The projected PR only reaches at most approximately 1.05 (0.99 to 1.28) under SSP5-8.5, indicating 5 % increase in the frequency of events such as 2025–2026 (Table 6). These results suggest that future change is expressed primarily through larger BA during extreme events, rather than through a substantial increase in the frequency of such events (Fig. 10).
Table 6Synthesis of attribution and projection results from WWA, HadGEM3-A, CMIP6 and ConFLAME for BA and the FWI. Metrics include the amplification factor (AF; the ratio of BA under the influence of the assessed factor relative to the counterfactual) and the Probability Ratio (PR). Mitigation shows the % differences between SSP5-8.5 and SSP3-7.0 AF (in SSP3-7.0 columns) and SSP3-7.0 and SSP1-2.6 (in SSP1-2.6 columns), expressed as 100× (1−lower/high emissions BA). Values are reported as median (and 5th–95th percentile ranges), with likelihoods indicating the confidence that the factor contributed to increased burning or extreme fire weather. Colours indicate IPCC-defined confidence or likelihood categories (Mastrandrea et al., 2010).
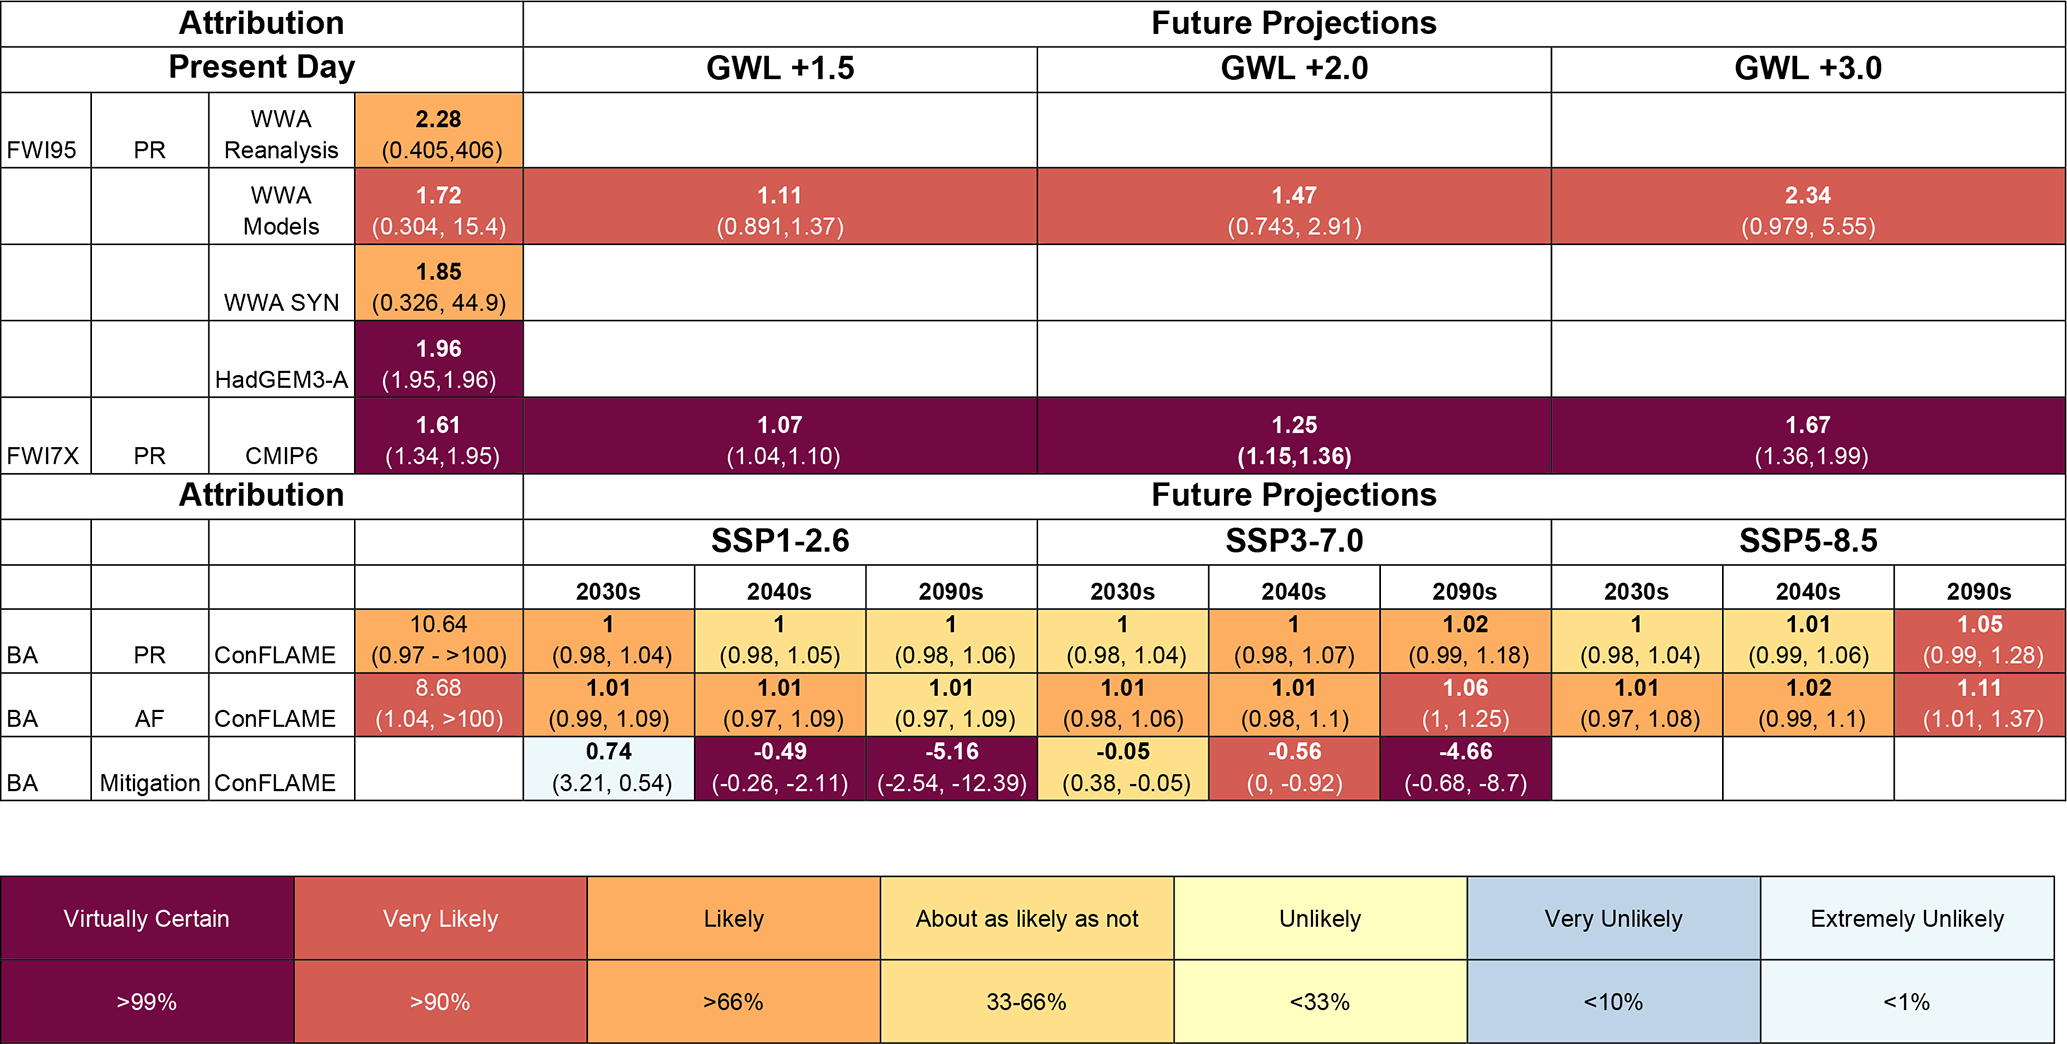
The projected increase in BA is driven mainly by changes in dryness (Fig. 10). Though the influence of dryness remains uncertain in the early part of the century, it becomes very likely under SSP3-7.0 and SSP5-8.5 from the 2070s onwards (Fig. S8). By the 2090s, dryness-driven amplification reaches up to 30 % under SSP3-7.0 and 45 % under SSP5-8.5, with high confidence (97 % and 98 % respectively; Table S7). Fuel load changes contribute little to future BA, with amplification factors not exceeding 1.02 over all SSPs.
Although SSP5-8.5 is now considered an unlikely future pathway and is not expected to be included in CMIP7, comparison with SSP3-7.0, which is considered a more plausible high-end emissions trajectory, suggests that projected BA amplification is lower than under the very high-emissions futures that were once considered plausible, reflecting evolving expectations of future emissions pathways.
By the 2090s, extreme events in SSP3-7.0 are estimated to be 4.66 % (0.68 % to 8.7 %) smaller than those projected under SSP5-8.5 (Table 6). Further mitigation could yield even larger benefits. Relative to SSP3-7.0, SSP1-2.6 reduces projected BA for comparable extreme events 5.16 % (2.54 % to 12.39 %) on average by the 2090s, with a virtually certain (>99 %) likelihood of lower BA. The largest benefits occur in the most severely affected areas. Under SSP3-7.0, sub-regional extreme BAs are projected to increase by 23 % (AF 1.23, uncertainty range of 1.04–1.52) by the 2090s, with virtually certain confidence (99 % Table S8). Relative to SSP3-7.0, however, SSP1-2.6 reduces sub-regional extreme BA by 15.73 (6.67 % to 17.12 %) by the 2090–2099 and by 2.46 % (1.22 %–6.59 %) by the 2040s. These reductions substantially exceed those already achieved through the divergence between SSP5-8.5 and SSP3-7.0, where sub-regional extremes are reduced by only 3.03 % (1.94 %–3.78 %) by 2090–2099 and show no confident reduction by 2040–2049. These avoided impacts are driven almost entirely by reductions in adverse fire weather conditions.
Future projections indicate a relatively uncertain increase in BA for events such as 2025–2026 (Fig. 10). These projected amplification factors are substantially smaller than those estimated from the BA attribution analysis above. This may be because the attribution analysis is constrained by the observed near present-day climate conditions, whereas future projections are derived from GCM-simulated climates and quantify changes in events of comparable rarity in GCM output rather than the observed event itself.
4.3.3 Changes in Typical Fire Behaviour
We also use the BuRNN model to project future changes in annual average BA AF. Relative to the 2010–2019 baseline, annual BA is projected to increase by 13 % under SSP1-2.6 and SSP5-8.5, and by 19 % under SSP3-7.0 during 2030–2039 (Fig. S9). By 2040–2049, the increase is more modest under SSP1-2.6 (11 %), but rises to 27 % and 23 % under SSP3-7.0 and SSP5-8.5, respectively. By the end of the century, annual BA is projected to range from near present-day levels under SSP1-2.6 to 1.63 times under SSP3-7.0 and 1.8 times the 2010–2019 average in SSP5-8.5.
Additional context is provided by ConFLAME projections, here applied to annual average BA (decadal averages rather than for events similar to focal month BAs in Sect. 4.3.2), which allows for the explicit quantification of uncertainty in BA responses. These show no clear change in mean annual BA in the near- to mid-term, with AFs ranging from 0.99 to 1.08 across all SSPs over the next few decades to mid-century (Fig. S10). Divergence between scenarios only begins to emerge from the 2070s onwards. By the 2090s, central estimates suggest modest increases in BA: AF of 1.00 under SSP1-2.6 (66 %, likely), 1.03 under SSP3-7.0 (85 %, likely), and 1.04 under SSP5-8.5 (89 %, likely). However, uncertainty remains substantial, particularly under higher-emission scenarios, with an upper bound of 1.27 under SSP5-8.5, compared to 1.2 under SSP3-7.0 and 1.08 under SSP1-2.6 (Table S9). These results highlight that while increases in BA are generally more likely than decreases, the magnitude of change remains uncertain.
This uncertainty is also reflected in the Haas et al., GLM projections (Fig. S11), although with a different pattern of model agreement. Using CMIP5 scenarios, Haas et al., show no clear consensus on BA changes by 2100, but with stronger agreement on increases under the lower-emissions RCP2.6 scenario, and more mixed responses under RCP6.0. However, where increases do occur, RCP6.0 tends to show larger mean responses across models, indicating greater, but more uncertain, potential for increased BA under higher forcing. Despite large uncertainties in the pattern of BA, the Haas et al., fire size model shows model agreement on an increase in fire size by the end of the century under both RCP2.6 and RCP6.0. There is no agreement on the direction of change of fire intensity.
Despite structural differences between models, all three approaches indicate a tendency towards increasing BA under future climate change. The BuRNN projections generally fall within ConFLAME's uncertainty range, lending consistency across methods. Notably, both ConFLAME and Haas indicate greater uncertainty under scenarios closest to current emission trajectories, reflecting a wider range of possible outcomes, including moderate increases and, in some cases, little change or decreases.
Comparison with extreme event attribution (Sect. 4.3.2) shows that changes in mean BA are generally more muted and uncertain than changes in extreme BA. This suggests that even where average BA shows only modest increases, the most extreme fire events may intensify more strongly, highlighting the importance of considering both mean and extreme responses when assessing future fire risk.
5.1 Nature and Impact of the Event
Northwest Iberia was selected as a focal region because it was the principal centre of Europe's record-breaking 2025 wildfire season (Sect. 3.3.3). For a closely matching Northwest Iberia study region, though not precisely identical to the focal region used here, Sánchez-Hernández et al. (2025) estimated that more than half of the total area burned across Europe in 2025 was in Northwest Iberia.
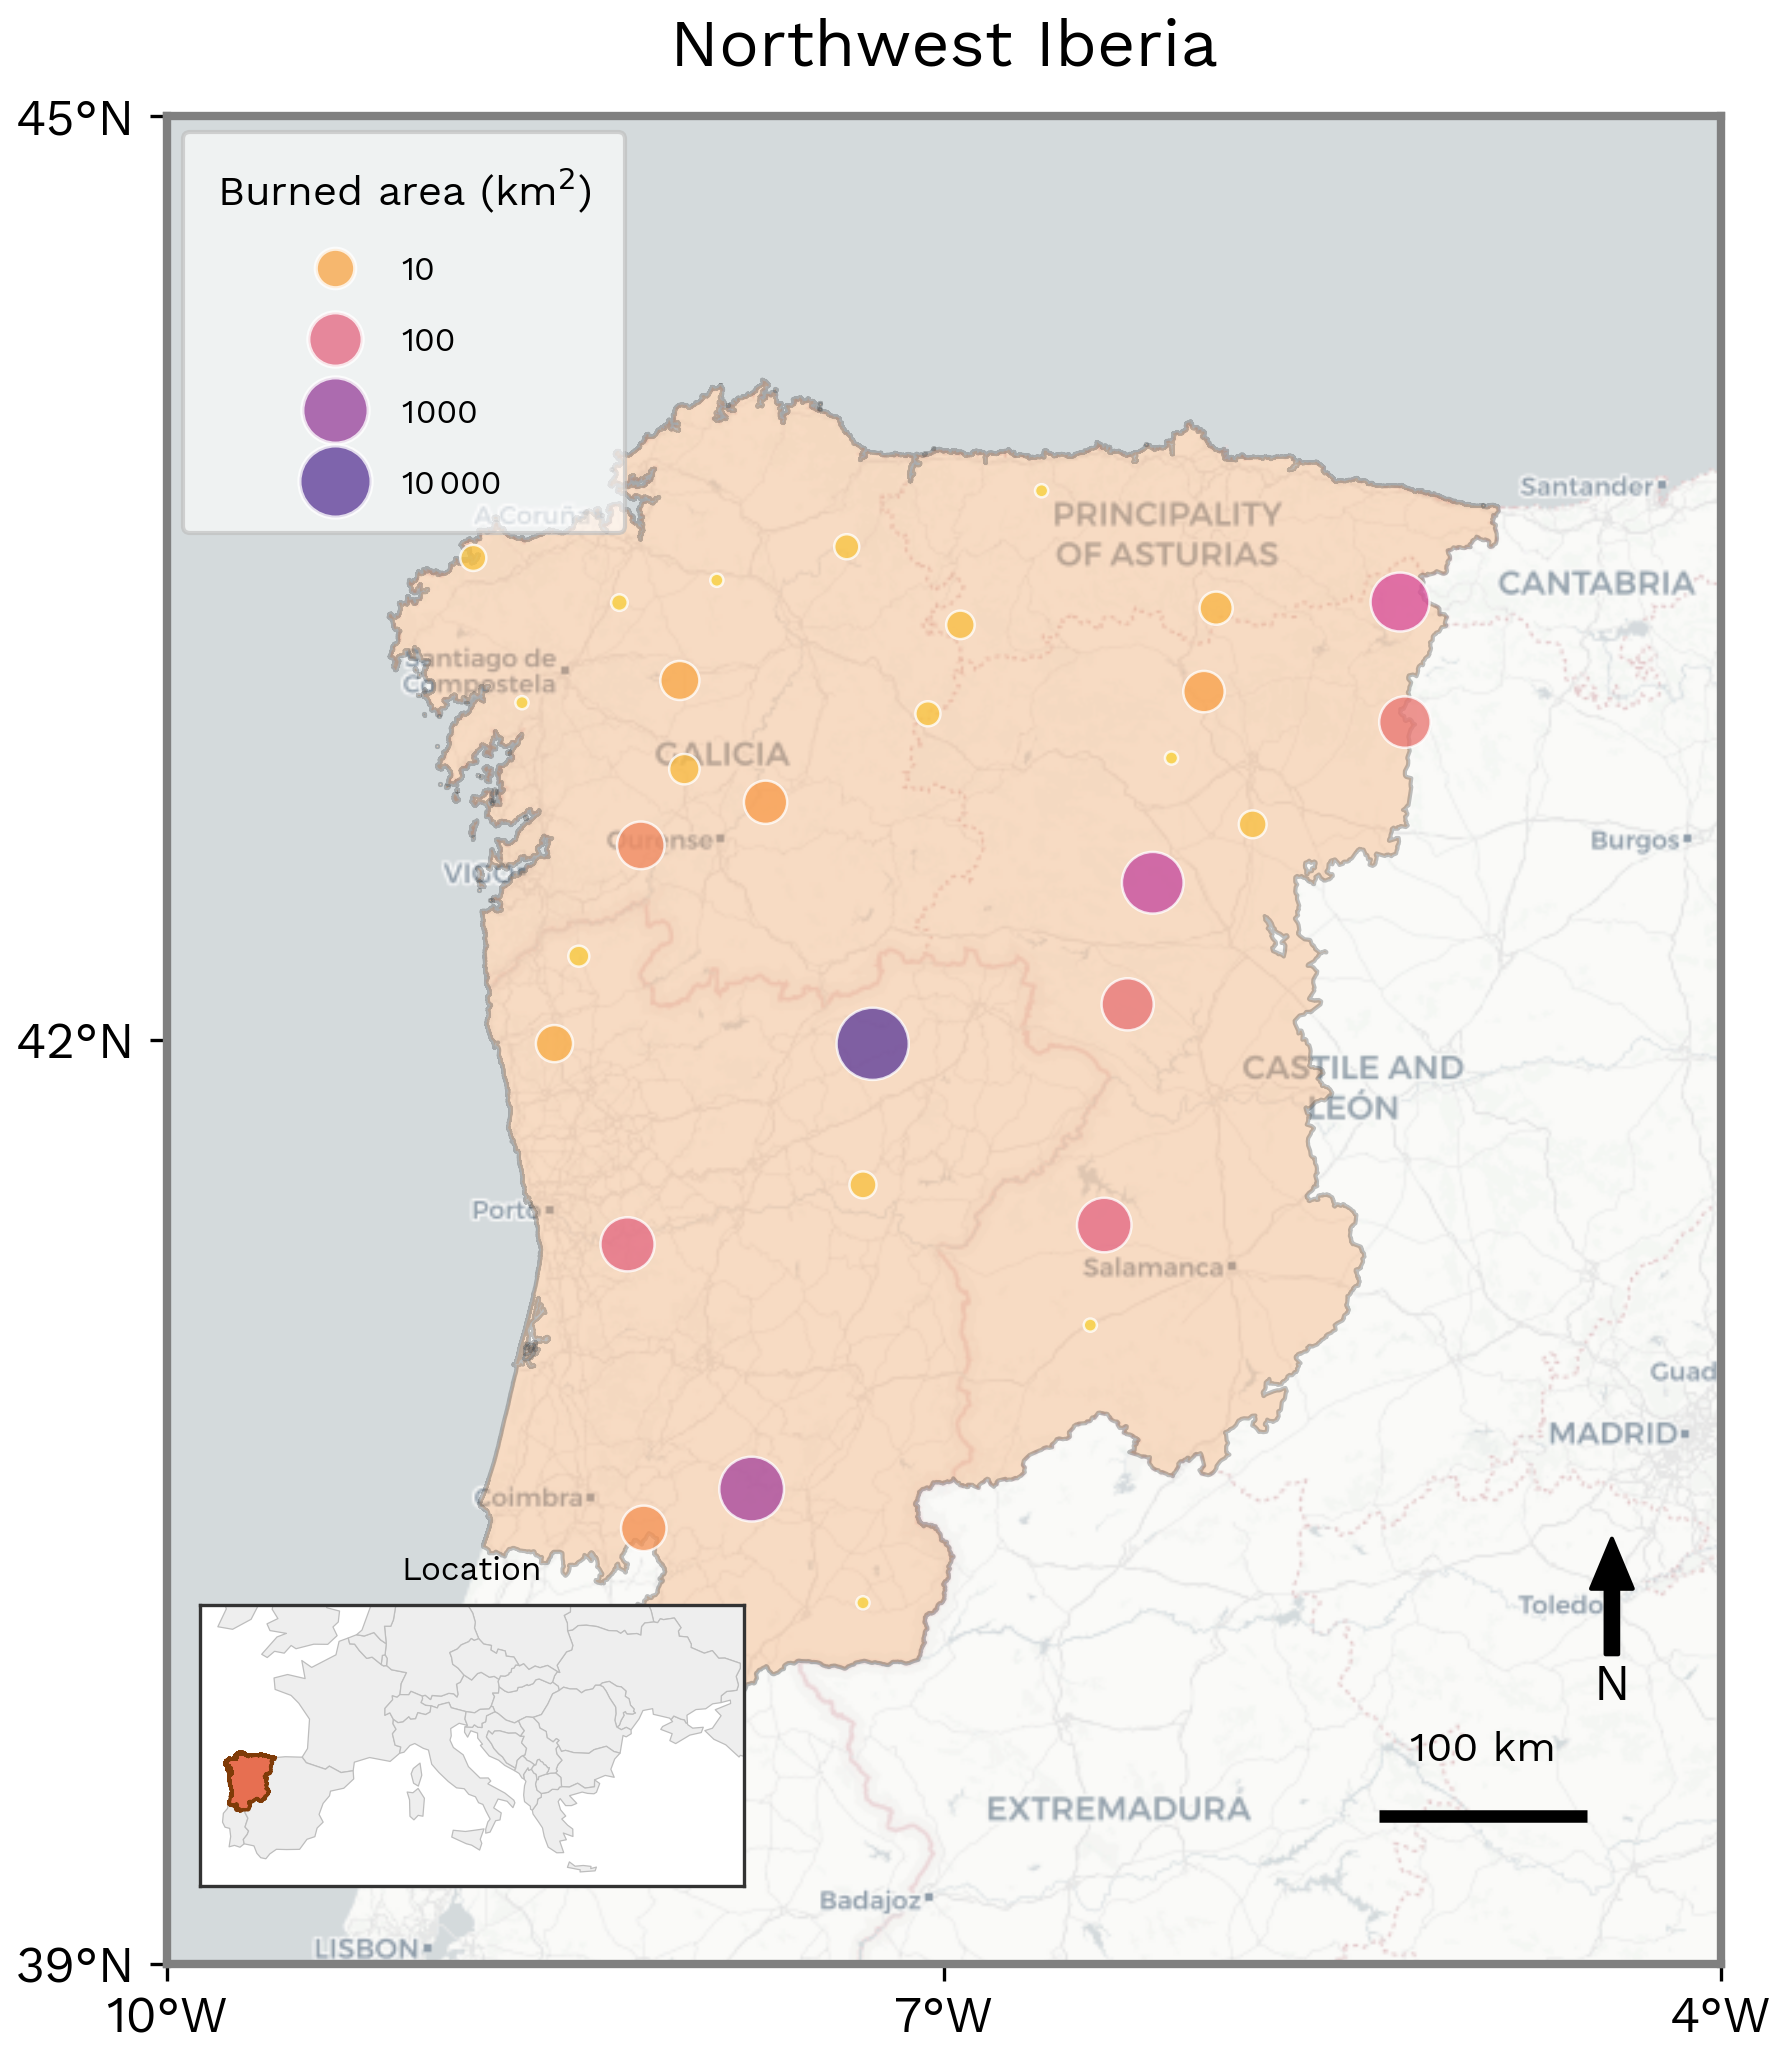
Figure 11Spatial distribution of BA clusters, highlighting the cumulative extent and spatial organisation of fire activity in Northwest Iberia during the fire season (March 2025–February 2026). For display purposes, MODIS BA is first pre-aggregated from the 500 m native resolution to a 5 km grid, then neighbouring 5 km cells that burned during the period are grouped into contiguous clusters. The figure provides an overview of the spatial extent and organisation of the season's BA, rather than the precise location or perimeter of individual fires. Most of the BA occurred during August 2025.
The fires developed primarily over July and August, but mostly from 8 to 26 August, and included multiple large fires burning concurrently across central and northern Portugal and northwest Spain (Keeping et al., 2025; Sánchez-Hernández et al., 2025). Satellite-derived fire mapping shows that 14 of these fires exceeded 100 km2, meeting the commonly used threshold for megafires (Sánchez-Hernández et al., 2025). August 2025 was also the highest BA month in the closely matching Northwest Iberia region during the 1985–2025 record, exceeding other major fire events including October 2017, when destructive fires affected Portugal and Galicia (Spain) during the exceptional wind conditions associated with Hurricane Ophelia (Sánchez-Hernández et al., 2025; Ramos et al., 2023).
The focal region experienced repeated large, long-duration and resource-intensive fires spreading over mountainous terrain predominantly occupied by shrubland, as summarised by Fernandes et al. (2026). Spain recorded its largest and third largest wildfires ever (Sedano et al., 2026): the Molezuelas de la Carballeda fire in Zamora (Castilla y León), attaining 401 km2, and the Larouco wildfire that burned 372 km2 in Ourense (Galicia). In central Portugal, the Arganil fire lasted for 13 d and burned 654 km2, being the largest on record. Further north, the Trancoso complex grew to 560 km2 after 16 d, and maintained an average rate of spread of 3.2 km h−1 for 8 h on 14 August (Comissão Técnica Independente, 2026).
Nine of the 14 fatalities and more than 90 % of the evacuations across Spain and Portugal, (around 40 000 people), occurred in this region (Agência para a Gestão Integrada de Fogos Rurais, 2026; Dirección General de Protección Civil y Emergencias, 2026). Additional societal impacts were substantial, namely hindered circulation, poor air and water quality, power outages, and loss of agricultural production (Fernandes et al., 2026). Both countries activated the EU Civil Protection Mechanism for wildfire assistance, underlining the pressure placed on national and shared European emergency-response capacity.
The event also had substantial ecological and landscape impacts. Sánchez-Hernández et al. (2025) estimated that around 32 % of the BA lay within protected areas and Quintero et al. (2026) estimated that 44 % of BA lay within Europe's Natura 2000 sites, though no evidence was found for a difference in the severity of fires between those sites. Protected natural areas affected within or overlapping the focal region included the Peneda-Gerês National Park (Portugal) and Picos de Europa National Park (Keeping et al., 2025). Areas of high ecological and cultural value were exposed. Habitat for endangered, vulnerable, or specially protected species was damaged, including areas identified as critical for capercaillie and brown bear (Keeping et al., 2025). The Las Médulas UNESCO World Heritage and significant stretches of the Camino de Santiago pilgrimage routes, which pass through the northwest Spanish part of the focal region and typically attract large numbers of summer visitors, were also affected (Keeping et al., 2025).
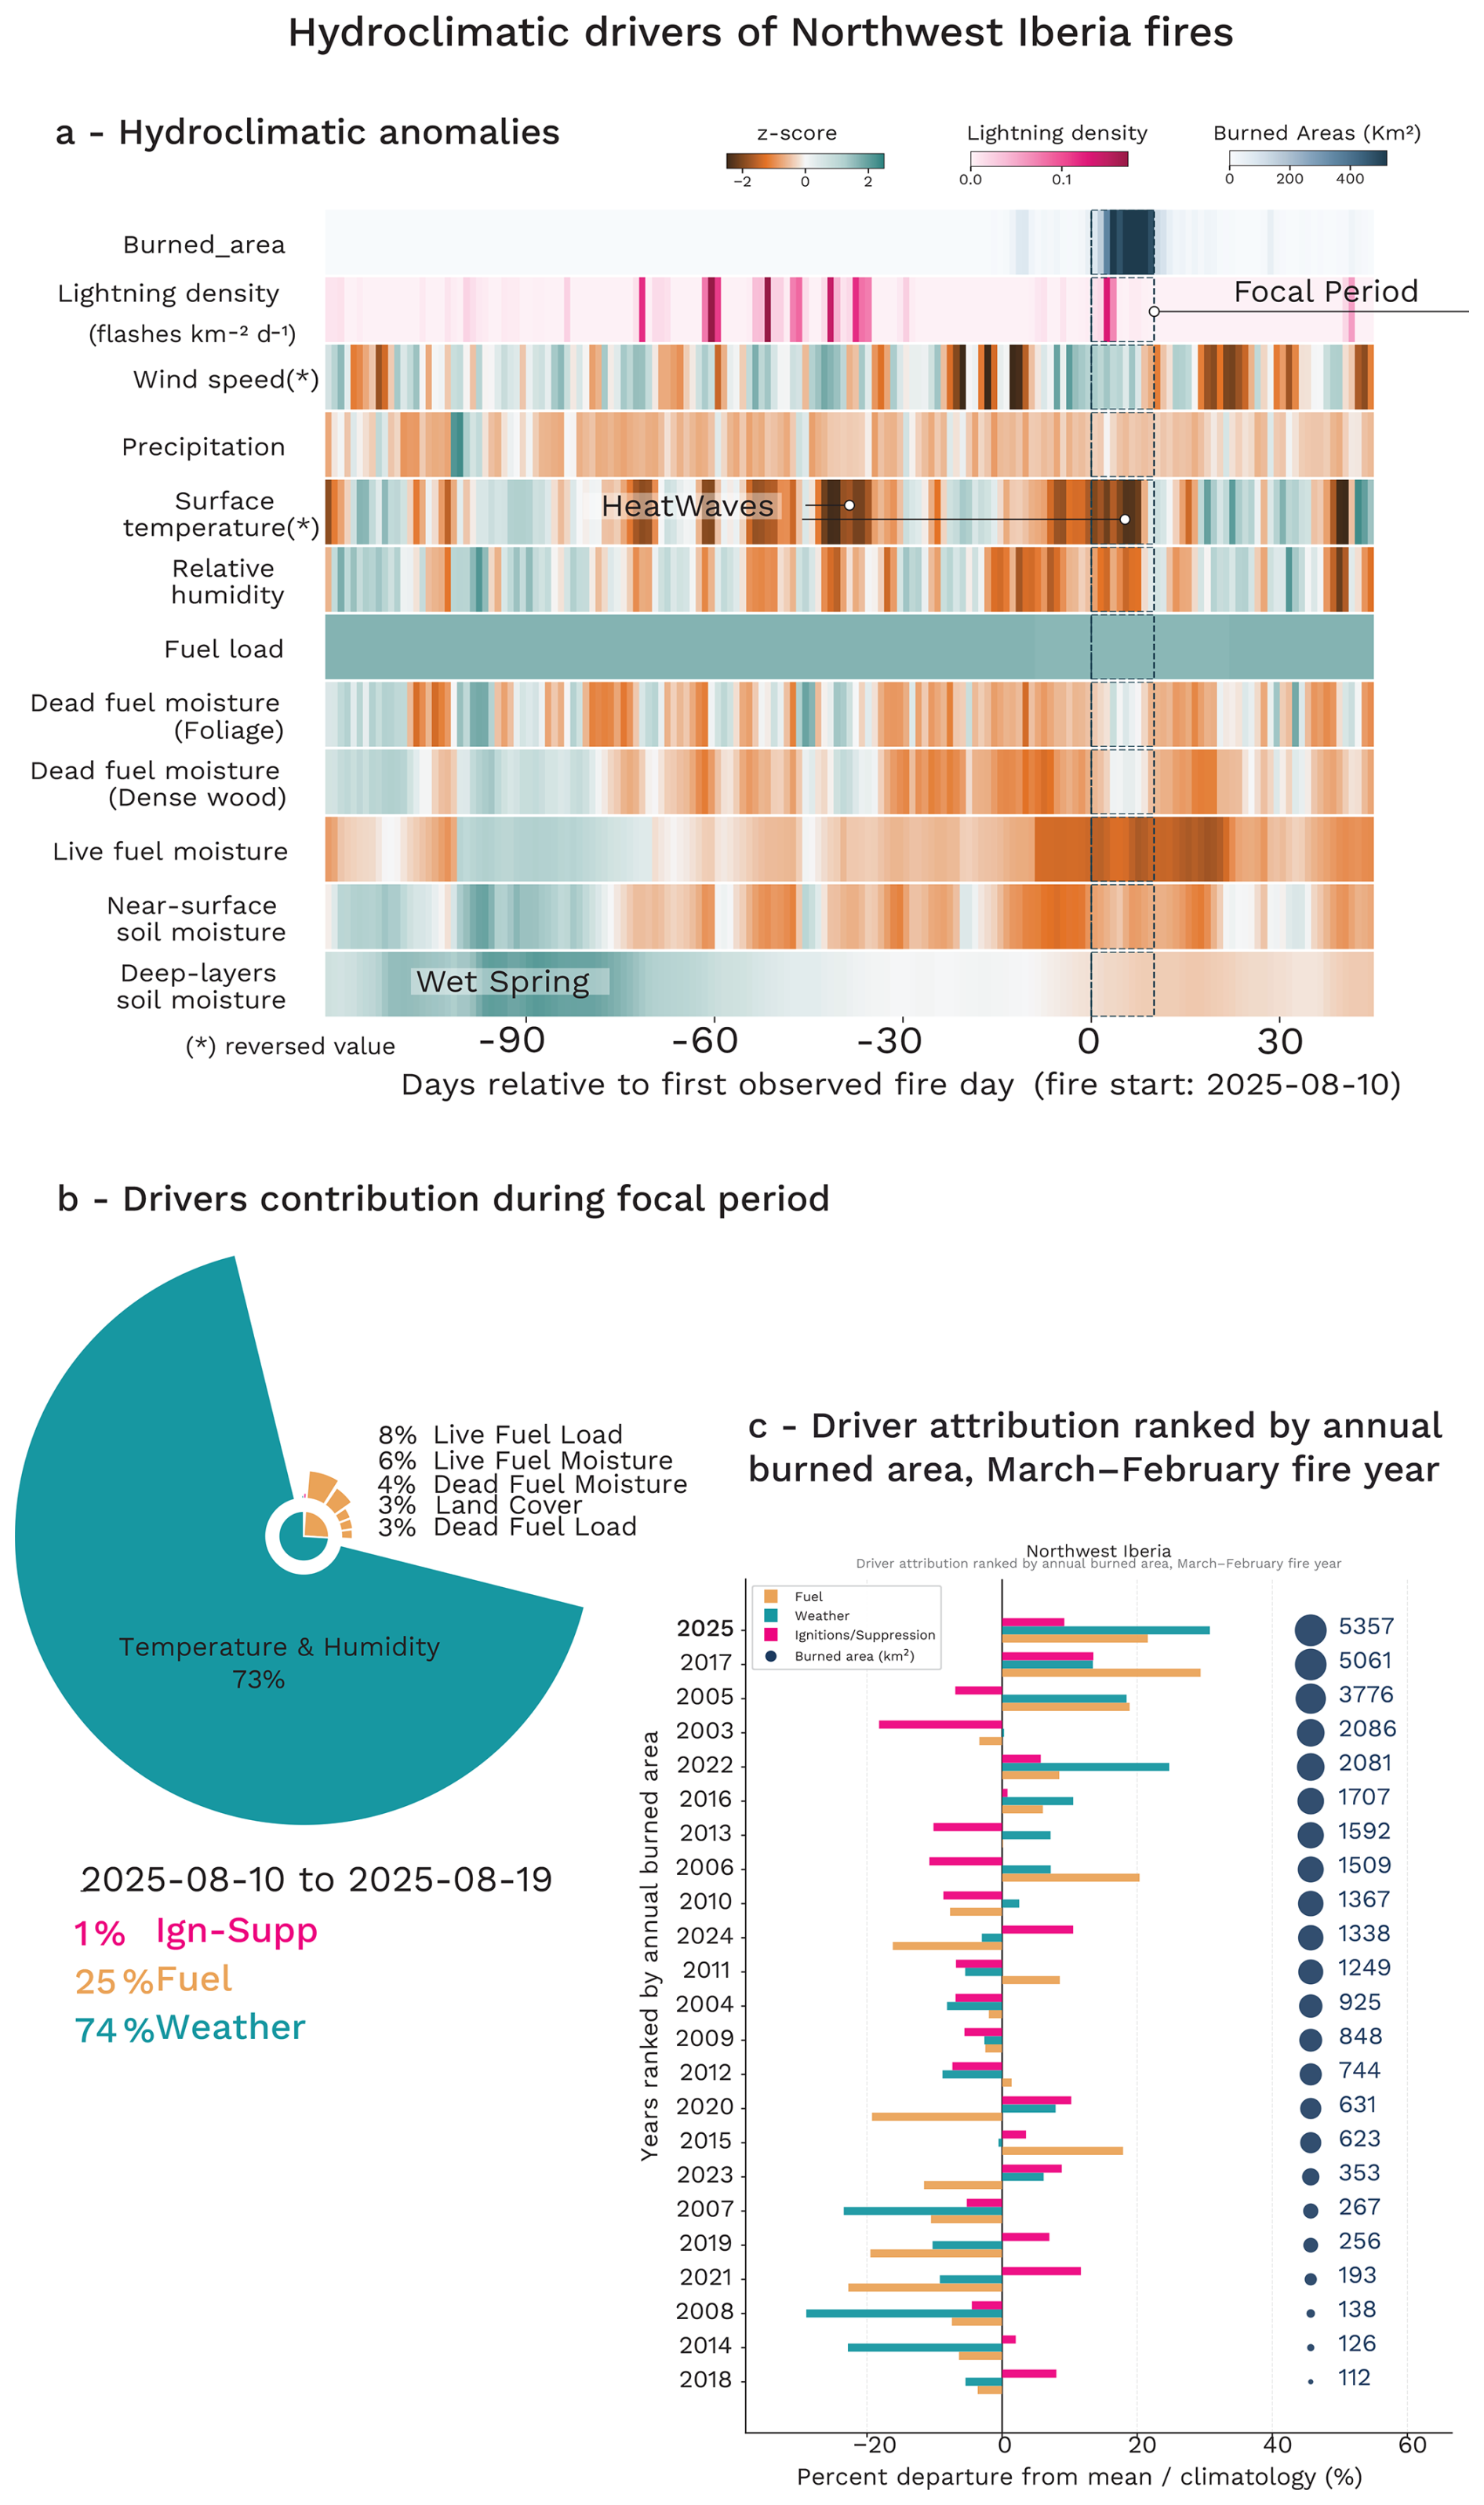
Figure 12Hydroclimatic evolution and SHAP-based model attribution analysis of the focal Iberia fire event. (a) Standardised hydroclimatic anomalies (z-scores) from 120 d before to 30 d after the onset of the main fire event, showing the temporal evolution of key atmospheric and fuel-related drivers relative to the 2003–2024 climatology. The main focal event is highlighted and represents the period over which the drivers are attributed in panel (b) as anomaly compared to the 2003–2024 baseline. (c) Grouped attribution analysis of BA anomalies for all fire seasons from 2003 to the present, showing the relative contribution of fuel-related (Fuel, orange), weather-related (Weather, green), and ignition/suppression-related (Ign-Supp, pink) drivers to interannual fire variability. Years are ranked according to the observed BA over the reporting year, defined from March to February. Note that this panel (c) compares fire activity over the full reporting year, while panel (b) focuses on the main active period to provide a more event-specific attribution.
5.2 Hydroclimatic drivers
According to our analysis (Fig. 12a), the extreme fire activity during the 2025 fire season in Northwest Iberia was strongly shaped by a hydroclimatic rebound in which an anomalously productive spring was followed by persistent summer drying and repeated heat extremes. In contrast to fire seasons driven solely by short-term weather anomalies, the landscape in Northwest Iberia became increasingly fire-prone several months in advance through the accumulation of abundant and highly connected fuels. Wet conditions during late April and early May, with precipitation anomalies locally exceeding +2 standard deviations, promoted vegetation growth and fuel build-up across the region. This antecedent productivity created a large reservoir of biomass available for burning later in the season.
From late May onward, the region transitioned into a prolonged period of precipitation deficits and progressive drying. Rainfall anomalies remained persistently negative through most of June, July, and August, while temperatures became increasingly anomalous. The first major heatwave developed at the end of June and beginning of July, when temperature anomalies exceeded +2 standard deviations over several consecutive days. A second intense warm episode occurred in late July. These periods were accompanied by strongly negative relative humidity anomalies, indicating exceptionally dry atmospheric conditions conducive to rapid fuel desiccation and fire spread. The combined effect of sustained meteorological drought and repeated heat extremes progressively made the landscape highly flammable.
This sequence of anomalously wet and productive conditions followed by hot and dry weather is consistent with the hydroclimatic rebound mechanism identified in other fire-prone Mediterranean ecosystems, where enhanced vegetation growth during wet phases subsequently amplifies fire risk once drought and heatwave conditions develop (McNorton et al., 2025).
During the most intense fire period (10 to 19 August 2025), our analysis indicates that concurrent fire-weather conditions were the dominant hydroclimatic driver of BA anomalies in Northwest Iberia. Temperature and relative humidity anomalies accounted for more than 70 % of the predictions (Fig. 12b) and 110 % of the positive anomaly relative to the climatological baseline (Fig. 12c), highlighting the overwhelming role of extreme atmospheric conditions in driving the final BA. In contrast, wind speed contributed only marginally and slightly negatively, suggesting that the severity of the fires was not primarily associated with anomalously strong wind events but rather with exceptionally hot and dry conditions.
Fuel variables also played an important enabling role. Live fuel load +8 % (an increase of 12 % compared to 2003–2024 average, live fuel moisture +6 % (and +9 % compared to previous years), dead fuel load +3 % (+5 %), and dead fuel moisture +4 % (+6 %) all contributed positively to fire activity, consistent with the antecedent hydroclimatic rebound that promoted substantial vegetation growth during spring before progressive summer drying rendered these fuels highly flammable. In particular, the positive contribution from both live and dead fuel components indicates that the landscape entered the fire season with an unusually large and continuous biomass reservoir capable of sustaining extensive fire spread once atmospheric conditions became favourable.
Anomalies in ignition-related contributions to the prediction were limited, accounting for approximately 1 % of the total attribution. Lightning activity exhibited a slightly negative contribution relative to climatology (−4 %). This does not imply that lightning was unimportant, but rather that its relative contribution to the exceptional fire season was smaller than in previous years, with fuel and weather conditions playing a comparatively larger role. Static landscape and anthropogenic variables, including vegetation type, land cover, road networks, and human presence, remained close to their climatological conditions and therefore primarily acted as background preconditioning factors rather than direct drivers of the extreme event.
Overall, the hydroclimatic driver analysis highlights a compound mechanism in which antecedent fuel accumulation created the conditions for large fire growth, while exceptional heat and atmospheric dryness ultimately controlled the timing and severity of the extreme BA event.
5.3 Influence of Climate Change
5.3.1 Changes in Fire Weather
The reanalysis data for FWI over Northwest Iberia shows that the event observed in August 2025 would have been virtually impossible in the preindustrial climate at every level of the confidence interval, with the infinite PR in the reanalysis represented by a star in Fig. 13. The multi-model assessment gives a wide range of uncertainty in the PR (5–95th percentile 0.140, 657, Table 7), but with a best estimate of an over 3-fold increase (3.63, Table 7) in probability of extreme fire weather like we saw in 2025 due to climate change. Analysis from the large ensemble HadGEM3-A supports a similar but slightly lower increase in probability, showing an increase by a factor of 1.61, within the multi-model 25–75th confidence interval of 1.11–13.5. As the synthesis is the formal combination of the reanalysis and the models we cannot give a number here, as the PR is infinite between preindustrial and now in the reanalysis (i.e. near zero chance before warming). For FWI7X, the synthesis based on CMIP6 models indicates a 2.68-fold increase in the likelihood of extreme fire weather (5–95th confidence interval: 2.12–3.55) due to climate change (Table 7).
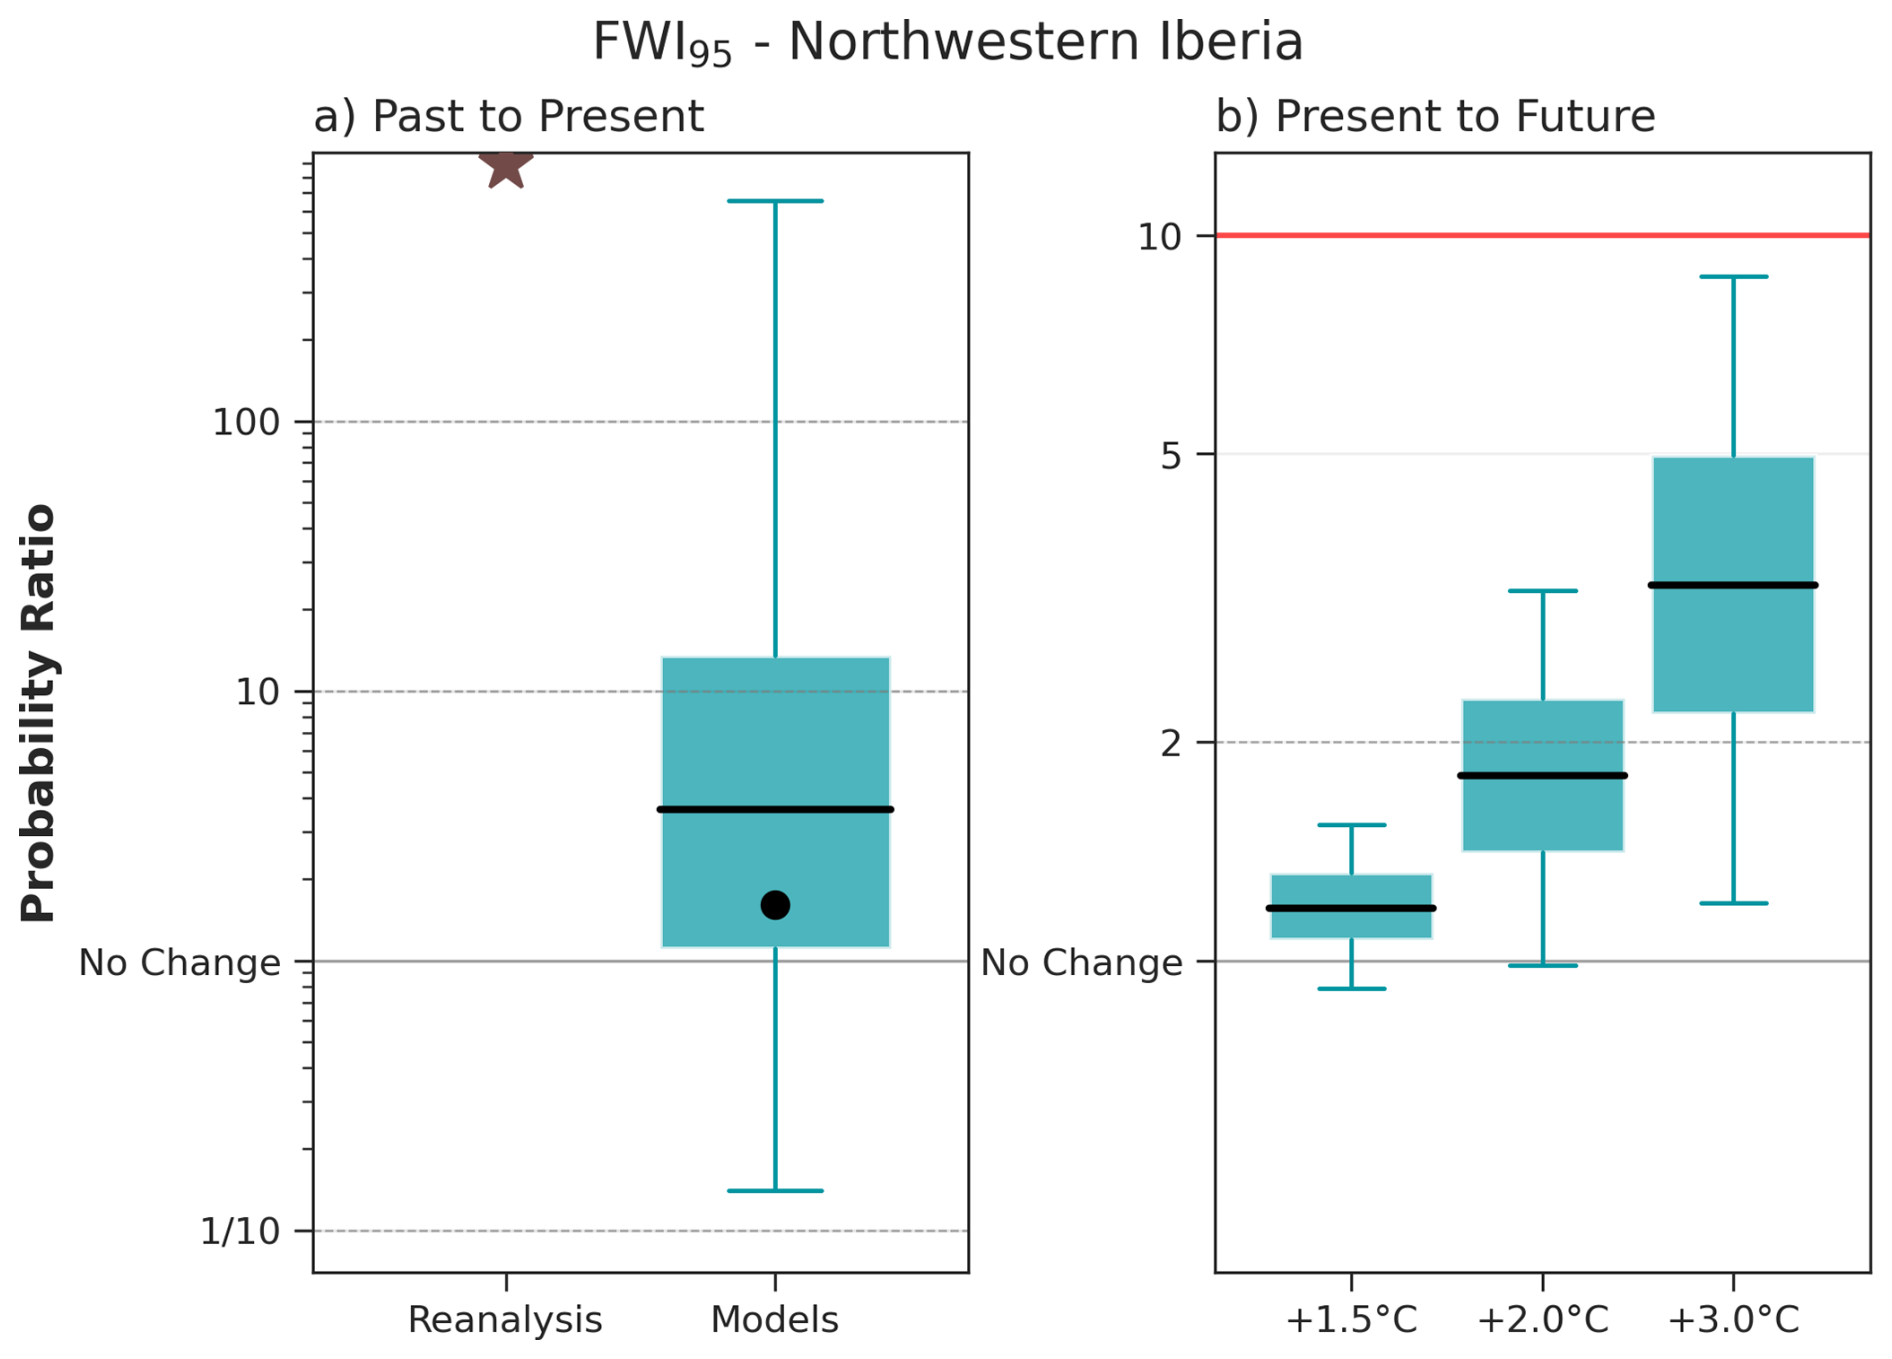
Figure 13FWI95 Probability Ratio (PR) for present day and future GWLs. Summary of attribution results for FWI95 (95th percentile of the FWI over the focal region and time period August 2025 for Northwest Iberia). The box and whisker plots show the 5th, 25th, 50th, 75th and 95th percentiles of the bootstrapped probability ratio (PR) for each data set. The left panel shows the PR (the ratio between current and pre-industrial probabilities) due to human-caused climate change (defined here as a 1.3 °C change) in reanalysis and climate models. The dot on the model bar shows the PR according to the SST driven HadGEM3-A ensemble. The right panel shows the projected change in the event probability according to the same set of models to GWLs of +1.5, +2.0, and +3.0 °C above preindustrial relative to a 2025–2026 value taken as +1.3 °C – the red line corresponds to the inverse of the present day return period, and so marks the PR at which the event would be expected nearly every year. N.B. Due to the event having been impossible in a preindustrial climate according to observations, the PR for reanalysis and the synthesis data are not displayed, with the infinite PR in reanalysis indicated by the asterisk on the left panel. Both scales are logarithmic.
Table 7Synthesis of attribution and projection results from WWA, HadGEM3-A, CMIP6 and ConFLAME for BA and the FWI. Metrics include the amplification factor (AF; the ratio of BA under the influence of the assessed factor relative to the counterfactual) and the Probability Ratio (PR). Mitigation shows the % differences between SSP5-8.5 and SSP3-7.0 AF (in SSP3-7.0 columns) and SSP3-7.0 and SSP1-2.6 (in SSP1-2.6 columns), expressed as 100× (1−lower/high emissions BA). Values are reported as median (and 5th–95th percentile ranges), with likelihoods indicating the confidence that the factor contributed to increased burning or extreme fire weather. Colours indicate IPCC-defined confidence or likelihood categories (Mastrandrea et al., 2010).
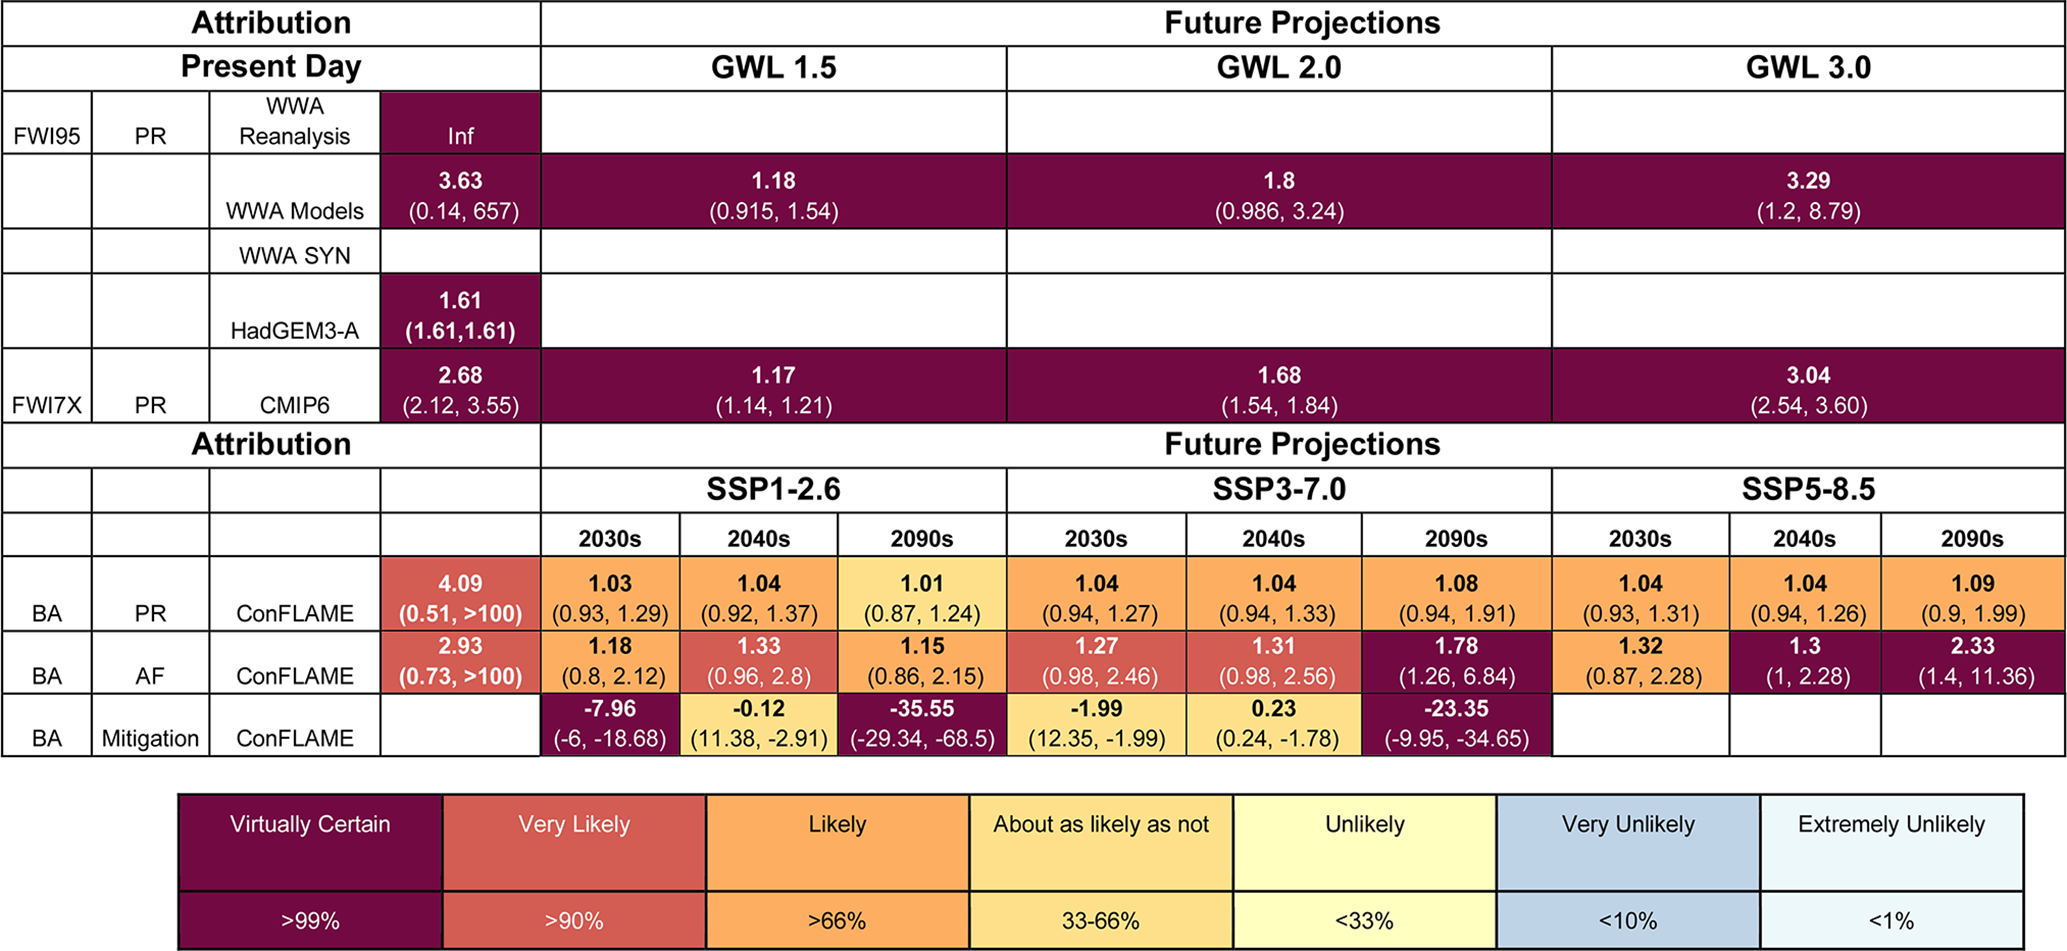
For the future projections we see a marked increase in the probability of extreme fire weather with GWL, with results showing a confident increase at every level of warming (Fig. 13). Models project a best estimate of a 1.18 PR at GWL +1.5 °C, 1.80 at +2.0 °C, and 3.29 at +3.0 °C, signifying a greater than 3-fold increase in probability of extreme fire weather occurring with 3 °C of warming above pre-industrial levels, compared to today. The results for FWI7X are similar, with the corresponding best-estimate PRs of 1.17 at +1.5 °C, 1.68 at +2.0 °C and 3.04 at +3.0 °C (Table 7).
Projections for 21st century changes in seasonal fire weather using the CMIP6 ensemble in Northwest Iberia show a stronger and earlier emergence of increasing FWI relative to other regions (Fig. S14). Increases in seasonal mean FWI are already evident by the 2030s compared to the 2010–2020s, and become clearly distinguishable from zero by the mid-21st century across most scenarios. The magnitude of change is large across all SSPs, with SSP3-7.0 and SSP5-8.5 showing pronounced late century amplification exceeding FWI values of 10–15. Inter-scenario differences are also more apparent in comparison to other focal regions, with a clear increase in response to higher radiative forcing. As observed for the Midwestern Canadian Shield Forests, changes in annual maxima are again larger and more variable than for seasonal means, with some models projecting increases exceeding 20. Negative or near-zero changes become increasingly rare after mid-century, indicating a robust intensification of fire weather conditions.
5.3.2 Changes in BA
Anthropogenic climate forcing likely increased BA across Northwest Iberia during August 2025, with simulations indicating that BA was 2.93 (0.73 to > 100) times larger under factual conditions than in a counterfactual climate (Fig. 14, Table 7). The central estimate indicates a substantial amplification of burned area, with anthropogenic climate forcing very likely (94 %) increasing burned area. A broad uncertainty range allows for the possibility of substantially larger amplification. In ConFLAME, this response was driven primarily by drier conditions, which very likely increased BA by 2.64 (0.94 to > 100) (Table S10) times. The estimated PR indicates that events of this magnitude are around 4.09 (0.51 to > 100) (Table 7) more likely under current climate conditions, suggesting moderate increases in both the likelihood and severity of fire activity.
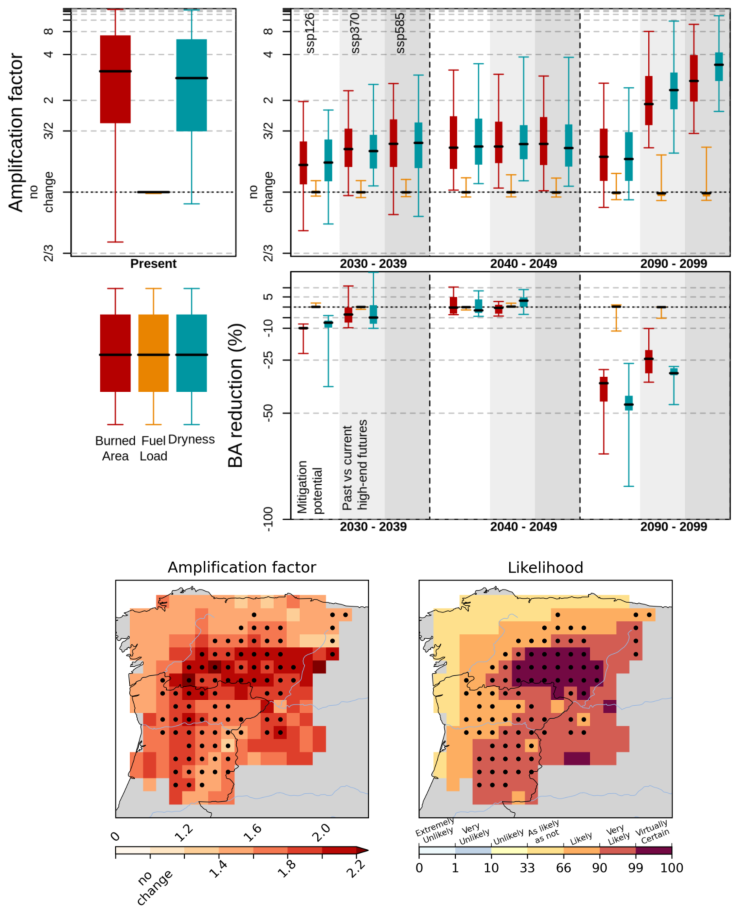
Figure 14Top panels: Amplification of extreme BA due to anthropogenic climate forcing and future climate change. The left panel shows attribution results for the focal event, with amplification factors (AF) for extreme BA due to anthropogenic climate forcing. The right panel shows projected amplification under future climate scenarios relative to the 2010–2019 baseline. Boxes indicate the interquartile range (IQR) of AF derived from the ConFLAME posterior distribution, whiskers represent the 5 %–95 % range, and the solid black line denotes the median. 2nd row, BA reduction represents the proportional decrease in BA for events equivalent in magnitude to the focal event. Here, “Past vs current high-end futures” quantifies the difference in BA between the SSP5-8.5 and SSP3-7.0 scenarios, while “Mitigation Potential” identifies the further reductions achievable by transitioning from SSP3-7.0 to SSP1-2.6 pathway. Colours indicate the contributing drivers: BA (red), fuel load (orange), and dryness (green), with each factor representing the effect of varying that component alone. Amplification factors greater than 1 indicate an increase in BA due to anthropogenic forcing or climate change. Bottom panels: The lower maps show spatial patterns of attribution. The left map presents the AF of BA due to total anthropogenic forcing, while the right map shows the likelihood of increased BA, calculated as the proportion of the ConFLAME distribution with AF > 1. Dots indicate the grid cells that experienced 95 % of the region's burned area during target months.
Spatially, the influence of anthropogenic forcing was strongest across many of the areas that experienced the highest BA in August 2025 (Fig. 14, maps). AF ranged between 1.4–2.0 and increases in BA were very likely (> 90 %) or virtually certain (> 99 %) around Zamora. Some areas with lower BA in the north east showed weaker or potentially negative responses, indicating that anthropogenic forcing may have slightly reduced BA locally. Nevertheless, when considered across the region, the overall effect was an increase in BA.
The signal in the most severely affected locations is broadly similar, with the top 5 % of BA grid cells showing a very likely increase attributable to anthropogenic forcing, corresponding to AF of 3.11 (0.93 to > 100, 94 % likelihood) (Table S11; Fig. S16).
Future projections indicate that BA similar to that experienced in 2025 is likely to increase across all emissions scenarios, possibly from the 2030s, though with relatively low likelihoods (69 % SSP1-2.6 and 78 % SSP3-7.0, Table S10; Fig. 14), though when they do occur, we have higher confidence that they will have higher BAs (central estimate for AF of 1.18, 1.27 1.32 (Table 7) with 82 %, 94 % and 87 % (Table S10) for each SSP respectively). Differences between scenarios remain relatively small through the first half of the century but become more apparent by the 2090s (Fig. S16). The largest increases occur under SSP5-8.5, where BA amplification reaches 2.33 (1.4 to 11.36), more than twice the BA for an event with a likelihood comparable to that of August 2025. This increase is driven almost entirely by drier conditions, which show an AF of 3.10 (1.75 to 25.89) mirroring projections of FWI, while fuel load changes remain minimal at 0.99 (0.90 to 1.32). Comparisons across scenarios highlight the influence of emissions reductions on future fire risk. Relative to SSP5-8.5, increases in dryness are substantially smaller under SSP3-7.0, resulting in a BA reduction of 23.35 % (9.95 %–34.65 %) (Table S10) by the 2090s. Divergence is less evident by the 2030s, when projected increases in BA are about 1.99 % (67 % likelihood of reduction) lower under SSP3-7.0 than under SSP5-8.5. Differences between SSP3-7.0 and SSP1-2.6 are larger, and by the end of the century, keeping to SSP1-2.6 results in an AF of only 1.15 (0.86–2.15) than under SSP3-7.0 (AF 1.78; 1.26–6.8), representing a reduction in BA of 35.55 % (29.34–68.5) though decreases in earlier BA is less certain with BA similar between the two scenarios at 2040s.
Changes in the likelihood of events such as August 2025 remain relatively small. Median PR ranges from about 1.01–1.09 across scenarios and periods (Table 7), though with considerable uncertainty (5th percentile as low as 0.87 for SSP1.2-6, 2090–2099 95th percentile as high as 1.91 and 1.99 for SSP3-7.0 and SSP5-8.5 respectively in 2090–2099). This indicates that future changes are driven mainly by increases in the severity of extreme fire events rather than large increases in their frequency, consistent with a BA distribution characterised by many low burn months and relatively few high-impact extremes.
5.3.3 Changes in Typical Fire Behaviour
According to BuRNN projections, the annual average BA in Northwest Iberia is projected to increase substantially in the near term. Relative to the 2010–2019 baseline, BA increases by 25 % under SSP5-8.5, 38 % under SSP3-7.0, and by 135 % under SSP1-2.6 during 2030–2039 (Fig. S17). By 2040–2049, BA under SSP1-2.6 returns to approximately present-day levels, while increases of 72 % and 109 % are projected under SSP3-7.0 and SSP5-8.5, respectively. By the end of the century, annual BA increases by 4.1 times under SSP5-8.5 and 2.9 times under SSP3-7.0. Under SSP1-2.6, BA remains substantially lower, reaching 1.61 times present-day levels by 2100.
ConFLAME projections of mean annual BA broadly support the increases projected by BuRNN, while additionally quantifying the uncertainty associated with these changes (Fig. S18; Table S12). During the 2030s, projected amplification factors (AFs) are 1.15 (0.99–1.87), 1.17 (0.97–2.04), and 1.24 (0.99–2.07) under SSP1-2.6, SSP3-7.0, and SSP5-8.5, respectively. Although uncertainty remains substantial during this period, climate change-driven increases in BA are already very likely under all scenarios (92 %, 90 %, and 95 % likelihood, respectively). By 2040–2049, SSP1-2.6 and SSP3-7.0 continue to show only modest central increases in BA, with AFs of 1.18 (1.00–2.45) and 1.20 (1.00–2.67), respectively, although much larger increases remain possible within the uncertainty ranges. Consistent with the BuRNN projections, clearer divergence between scenarios only begins to emerge after mid-century Fig. S18. SSP3-7.0 and SSP5-8.5 remain relatively similar through to 2080–2089, with BA under SSP3-7.0 typically around 10 % lower than under SSP5-8.5. However, unlike BuRNN, ConFLAME indicates that this reduction is already very likely (97 % likelihood by 2080–2089). By 2090–2099, the scenarios diverge more substantially, with AFs of 1.52 (1.09–5.31) under SSP3-7.0 and 1.98 (1.16–7.58) under SSP5-8.5 – a 23.15 % (6.3 % to 37.08 %) (Table S12). Both scenarios show virtually certain increases in BA relative to present-day conditions.
The performance of the Haas et al. (2023d), BA model under present day conditions was not considered good enough to report future projections (Table S6). While total BA and fire size are captured reasonably well, spatial patterns are poorly represented, with systematic underestimation in regions such as the eucalyptus-dominated belt. This likely reflects insufficient representation of vegetation heterogeneity and fuel types at finer spatial scales. Fire intensity is more uncertain than either BA or fire size. As such, results from the Haas et al., models in this region (Fig. S19) should be interpreted with caution due to weaker model performance. In a region where fuel conditions are an important control on fire behaviour, improving confidence in intensity projections will require better representation of future vegetation dynamics and fire-fuel feedback.
BuRNN suggests larger increases in BA under higher-emissions pathways consistent with current trajectories, and smaller (or even decreasing) responses under mitigation scenarios. ConFLAME, however, indicates that increases remain possible even under SSP1-2.6, with the Haas et al., fire size model also showing more agreement under SSP1-2.6. Overall, this suggests a likely but uncertain reduction in BA under mitigation, but with increases still possible. Importantly, all approaches agree that, regardless of emissions pathway, climate change is expected to lead to at least some level of increase in BA in the region.
6.1 Nature and Impact of the Event
Chile and northern Patagonia were selected as a focal region because the January 2026 fires combined a deadly urban-interface disaster in south-central Chile with contemporaneous fires in Andean temperate forests in south-central Chile and western Argentina. The selected region is defined very similarly to the regions analysed by Barnes et al. (2026): a Chilean region spanning the most affected areas around Ñuble, Biobío and La Araucanía, and a northern Patagonian region across the Chile-Argentina border that included the areas around Los Alerces and Lago Puelo National Parks. A detailed report on the impacts are presented in Barnes et al. (2026) and a summary can be read in Anderson et al. (2026).
The Chilean part of the focal region experienced substantial loss of life, displacement and damage to the built environment, detailed on the report by Barnes et al. (2026) and as summarised by Anderson et al. (2026). In the Biobío and Ñuble regions, fires started on 14 December and escalated to large-scale fires on 16 January, spreading rapidly to the south and east, in the direction of La Araucanía. On 17 January 2026, the most destructive activity occurred near Concepción, where three nearby ignition points merged into the Penco-Lirquén fire. This fire remained active for approximately 36–48 h, burned about 200 km2, spread towards the coastal settlements of Penco-Lirquén and Punta Parra, and caused 23 fatalities, destroyed thousands of houses and damaged critical infrastructure, with 52 000 evacuations displaced to 11 shelters (Barnes et al., 2026). It was declared a state of catastrophe by Chile's President on the 18 January 2026.
In northern Patagonia, in the northernmost parts of Patagonia, fires affected temperate forests, protected areas and regional tourism. Fires began on the 5 January, in the Puerto Patriada area, during the height of the tourist season, when more than 3000 visitors were present. In one day, fires burned 18 km2, forcing the entire village to evacuate. On 21 January, the government declared a state of emergency in the Argentine Patagonia region, with the evacuation of at least 3000 people, including tourists and residents from El Hoyo, Puerto Patriada and Epuyén (ECHO, 2026). By early February, more than 450 km2 of native and planted forest, shrublands and grasslands burned, including an estimated burned loss of 75 % of Epuyén's native forests (Barnes et al., 2026).
The event also had substantial ecological and landscape impacts. In Chile, the Penco-Lirquén fire burned through a landscape dominated by non-native forest plantations, including Pinus radiata and Eucalyptus species, adjacent to settlements (Barnes et al., 2026). In Argentina, the fires affected native forest, shrublands and grasslands, with native forest reported as the most affected vegetation type in Chubut wildfire records and with important consequences for wildlife, soils and water resources (Secretaría de Bosques, 2025; Anderson et al., 2026; Barnes et al., 2026). Barnes et al. (2026) emphasise that fires in Patagonia placed pressure on endemic and vulnerable species, including huemul and pudú, as well the Patagonian black woodpecker, and encroached on Los Alerces National Park, a UNESCO World Heritage Site known for ancient alerce trees.
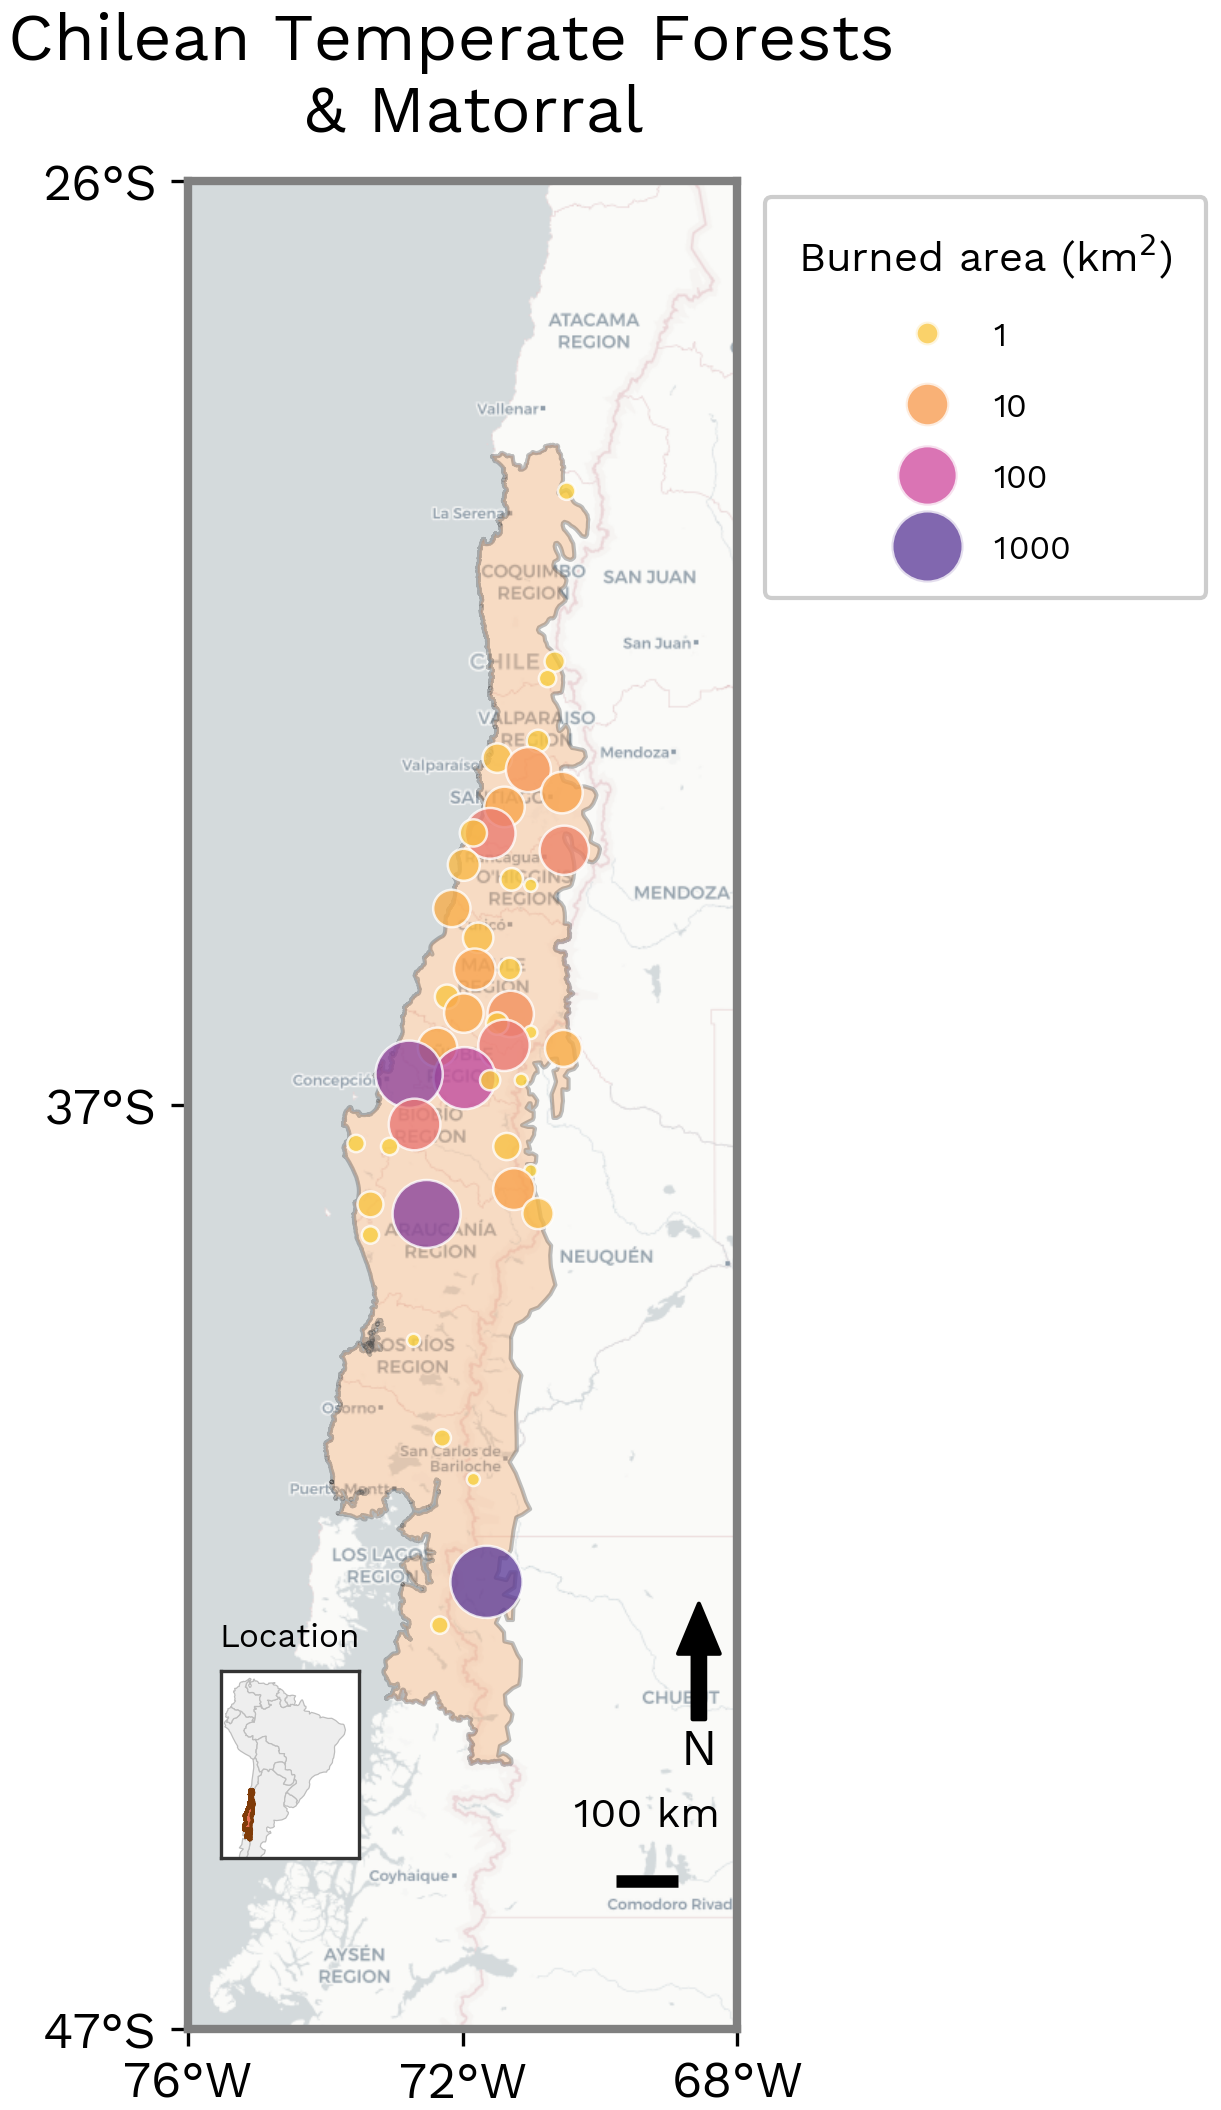
Figure 15Spatial distribution of BA clusters, highlighting the cumulative extent and spatial organisation of fire activity in Chilean Temperate Forests and Matorral during the fire season (March 2025–February 2026). For display purposes, MODIS BA is first pre-aggregated from the 500 m native resolution to a 5 km grid, then neighbouring 5 km cells that burned during the period are grouped into contiguous clusters. The figure provides an overview of the spatial extent and organisation of the season's BA, rather than the precise location or perimeter of individual fires. Most of the BA occurred during January 2026.
6.2 Hydroclimatic Drivers
The hydroclimatic evolution of the 2026 Chile fire event was characterised by a prolonged period of anomalously dry conditions followed by the emergence of extreme wind conditions during the peak burning phase (Fig. 16a). Although daily precipitation anomalies were predominantly negative during the months preceding the event, precipitation is inherently intermittent and daily z-scores are less informative than integrated hydrological indicators. The cumulative impact of the rainfall deficit is therefore better reflected by the persistent negative anomalies in soil moisture, vegetation condition, and fuel moisture, indicating sustained moisture deficits and limited hydrological recovery across the landscape. These prolonged dry conditions likely contributed to progressive fuel desiccation and the depletion of ecosystem water reserves, particularly in deep-layer soil moisture, well before the onset of extreme fire activity.
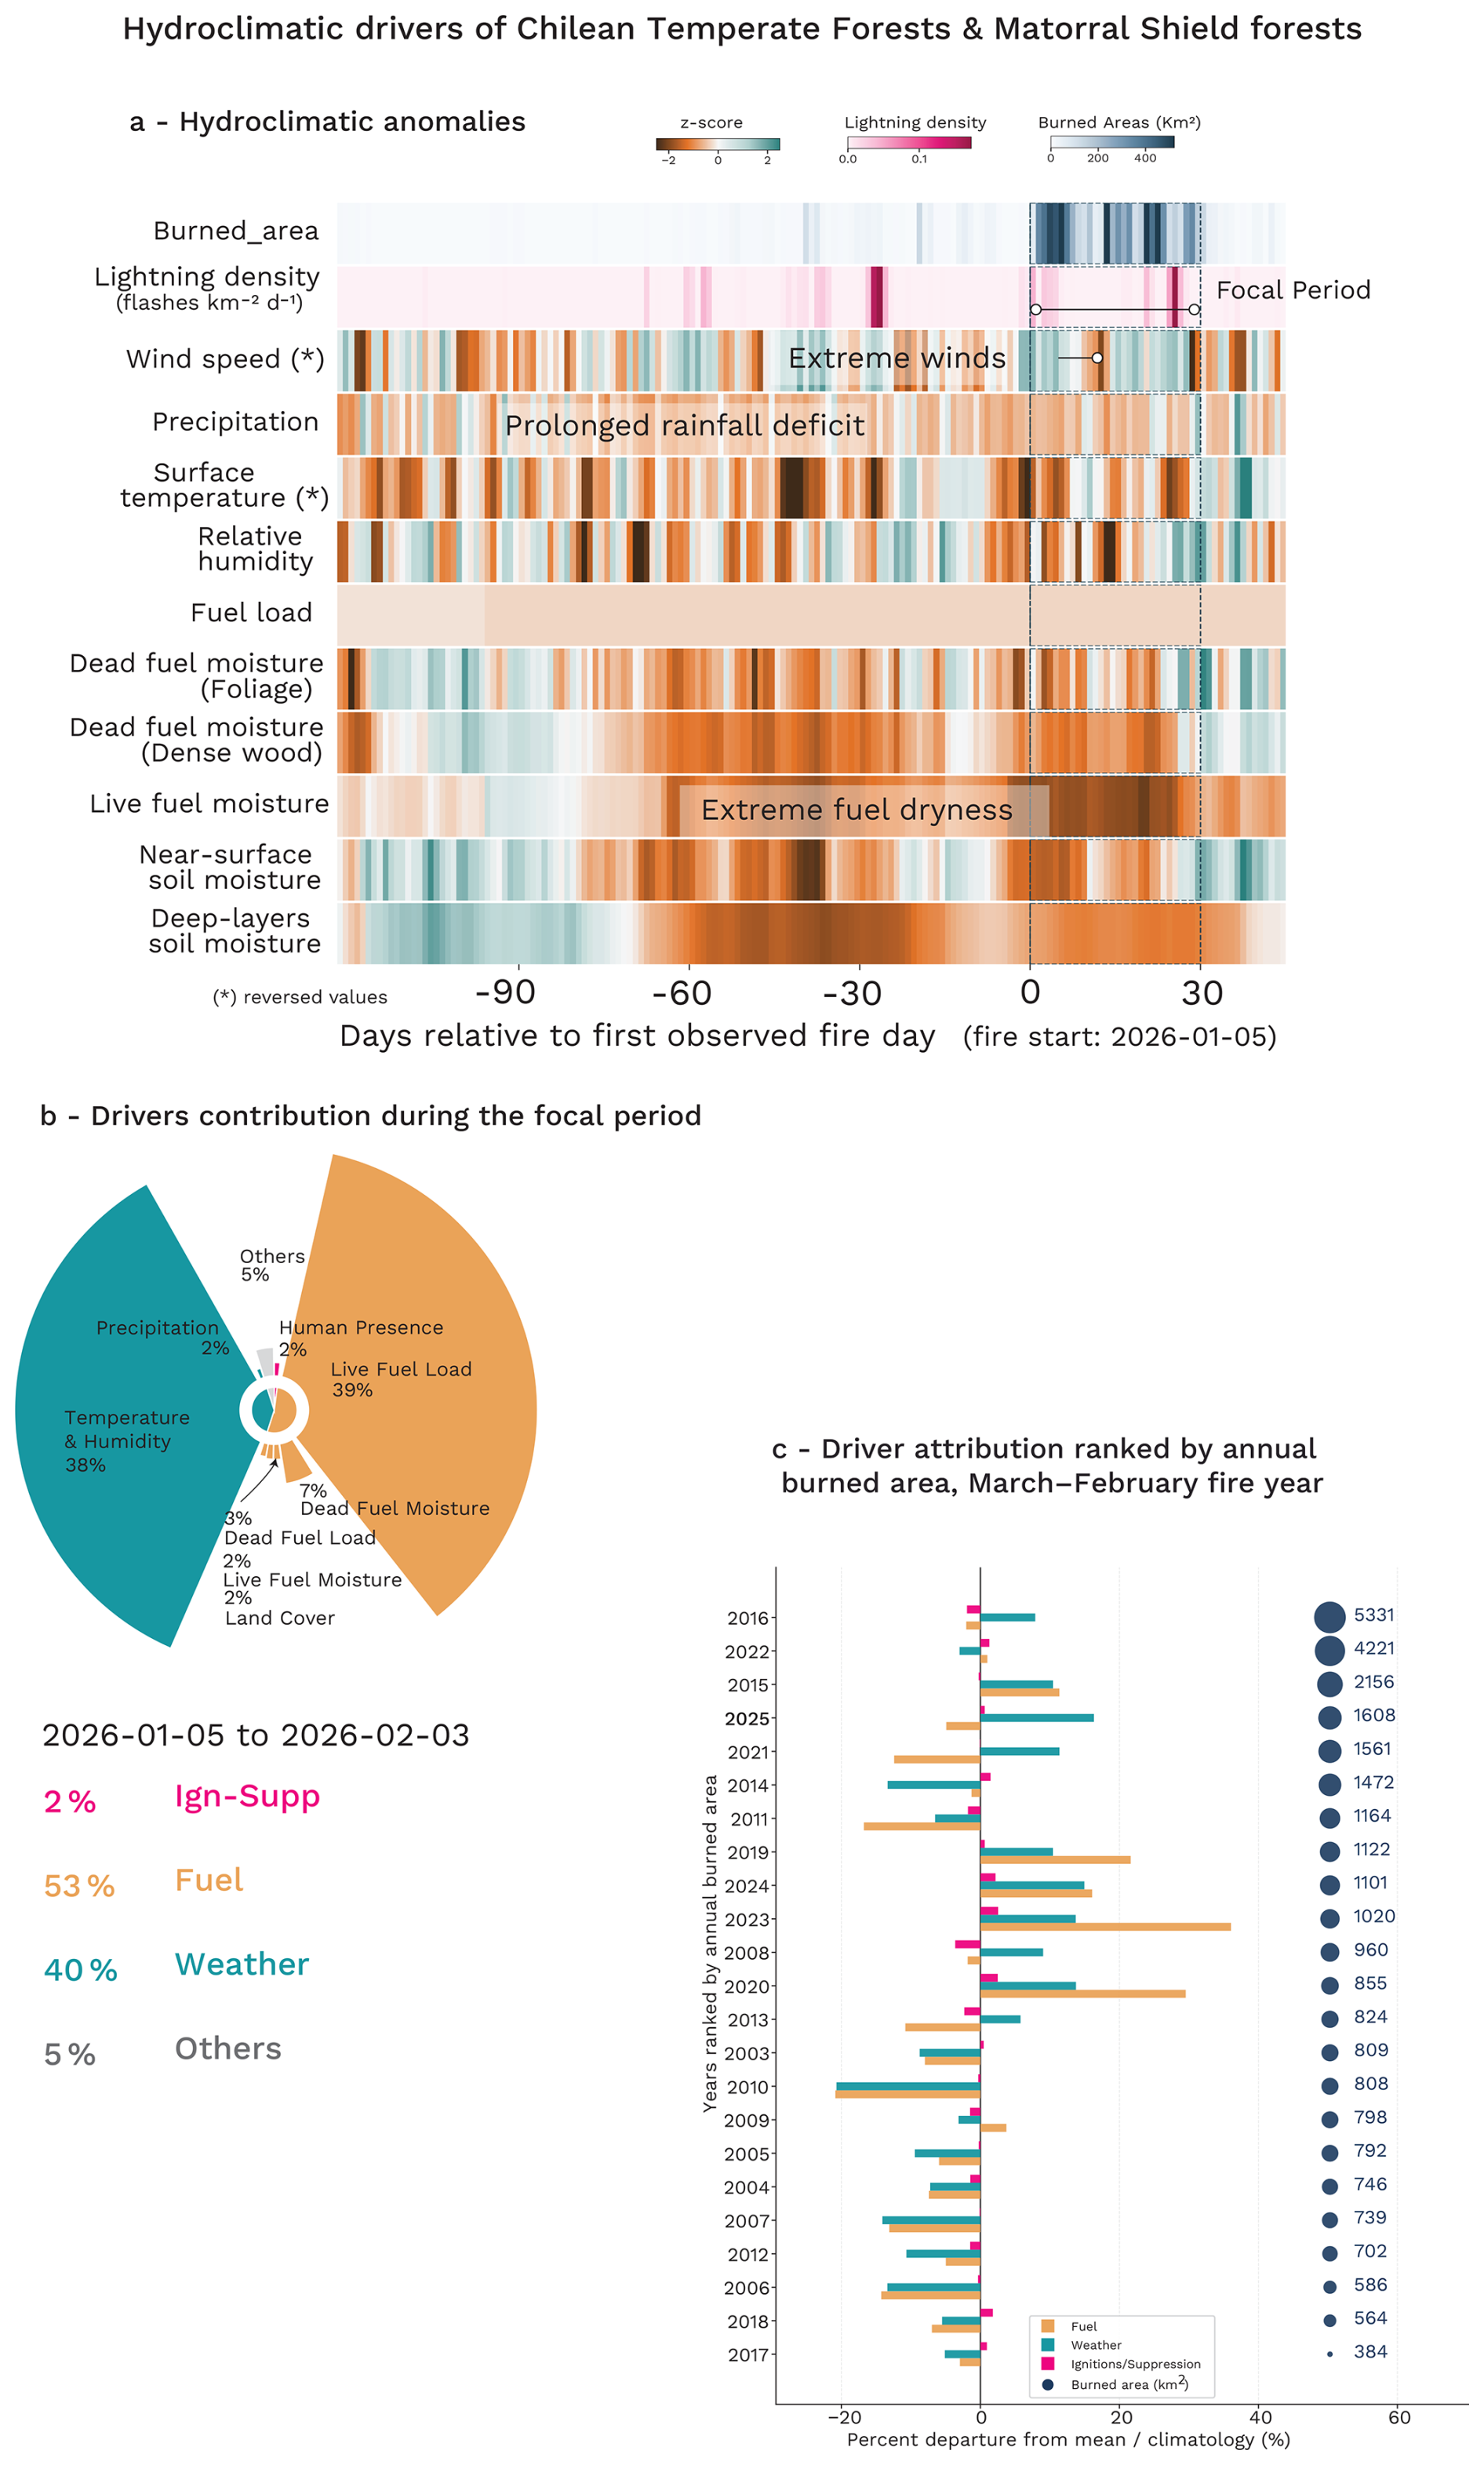
Figure 16Hydroclimatic evolution and SHAP-based model attribution analysis of the focal Chilean fire event. (a) Standardised hydroclimatic anomalies (z-scores) from 120 d before to 30 d after the onset of the main fire event, showing the temporal evolution of key atmospheric and fuel-related drivers relative to the 2003–2024 climatology. The main focal event is highlighted and represents the period over which the drivers are attributed in panel (b) as anomaly compared to the 2003–2024 baseline. (c) Grouped attribution analysis of BA anomalies for all fire seasons from 2003 to the present, showing the relative contribution of fuel-related (Fuel, orange), weather-related (Weather, green), and ignition/suppression-related (Ign-Supp, pink) drivers to interannual fire variability. Years are ranked according to the observed BA over the reporting year, defined from March to February. Note that this panel (c) compares fire activity over the full reporting year, while panel (b) focuses on the main active period to provide a more event-specific attribution.
The evolution of fuel moisture further supports this interpretation. Both live and dead fuel moisture exhibited persistent negative anomalies throughout the preconditioning phase, reflecting widespread vegetation stress and critically dry fine fuels prior to ignition and rapid fire spread. These conditions are consistent with prolonged hydroclimatic drying and reduced soil moisture availability, which together weakened ecosystem moisture resilience and increased landscape flammability. The persistence of these fuel-moisture anomalies indicates that the extreme fire event was not driven solely by short-term fire weather, but by a cumulative drying process that developed over several weeks to months.
During the central phase of the event (around 10 January), atmospheric dynamics became increasingly important. Wind speed anomalies intensified sharply around the peak burning period, locally exceeding +2 to +3 standard deviations, indicating exceptionally strong and anomalous wind conditions compared to climatology. These episodic wind extremes likely played a critical role in accelerating fire spread, enhancing spotting processes, and increasing fire-line intensity once fuels had already reached critically dry states. The combination of antecedent drying and extreme winds was the primary mechanism controlling the extent of the Chile event.
The hydroclimatic driver analysis for the central phase of the Chile event reveals an exceptionally strong compound influence of both fire weather and fuel-related drivers relative to all previous years in the record (Fig. 16b). Weather-related factors accounted for approximately 40 % of the anomalous BA prediction, while fuel-related contributions exceeded 53 %, making this particular event one of the most strongly fuel-driven fire seasons in the entire time series (Fig. 16c). In contrast, ignition and suppression related variables contributed only weakly (∼ 2 %), indicating that the extreme fire activity cannot primarily be explained by anomalous ignition occurrence or human activity, but instead resulted from the interaction between highly conducive environmental conditions and unusually flammable landscapes.
Looking at the fire season as a whole and comparing it with previous fire years (Fig. 16c), the 2025–2026 season does not stand out as exceptionally fuel-driven, with weather-related contributions remaining largely positive and fuel-related contributions only slightly negative. This reflects the fact that the annual attribution integrates the entire fire season rather than focusing on the peak burning period. Nevertheless, only a few historical seasons, notably 2020, 2023, and 2024, showed comparable fuel-related signals, indicating that antecedent hydroclimatic conditions still played an important role in shaping the season.
These results suggest that the 2026 event emerged from a compound hydroclimatic configuration in which prolonged antecedent drying and fuel accumulation created highly vulnerable conditions that were subsequently amplified by severe atmospheric fire weather during the active burning phase. More broadly, this event highlights the importance of considering both slow hydrological processes and concurrent atmospheric extremes when interpreting the drivers of catastrophic wildfire events.
6.3 Influence of Climate Change
6.3.1 Changes in Fire Weather
For the Chilean Temperate Forests and Matorral region, we find that climate change has increased the probability of extreme fire weather by approximately 50 %, with reanalysis results showing the observed FWI95 values were nearly 800 times more likely with current warming compared to the pre-industrial era. Projections suggest an increase in probability of extreme fire weather at all GWLs, with another 50 % increase in probability compared to today under +3.0 °C of warming.
Reanalysis results suggest a best estimate of an increase in PR of 797 (Table 8), with the upper end of the 95th percent confidence interval far exceeding this figure (Table 8). While not impossible, these extremely high values point to the possibility of an event like the one experienced across January and February 2026 being extremely unlikely in a pre-industrial climate compared to today. The model results simulate a more modest increase in PR with climate change, giving an overall synthesis estimate of 1.67 (0.631, 11.7) (Fig. 17, Table 8).
Table 8Synthesis of attribution and projection results from WWA, HadGEM3-A, CMIP6, and ConFLAME for BA and the FWI. Metrics include the amplification factor (AF; the ratio of BA under the influence of the assessed factor relative to the counterfactual) and the Probability Ratio (PR). Mitigation shows the % differences between SSP5-8.5 and SSP3-7.0 AF (in SSP3-7.0 columns) and SSP3-7.0 and SSP1-2.6 (in SSP1-2.6 columns), expressed as 100× (1−lower/high emissions BA). Values are reported as median (and 5th–95th percentile ranges), with likelihoods indicating the confidence that the factor contributed to increased burning or extreme fire weather. Colours indicate IPCC-defined confidence or likelihood categories (Mastrandrea et al., 2010).
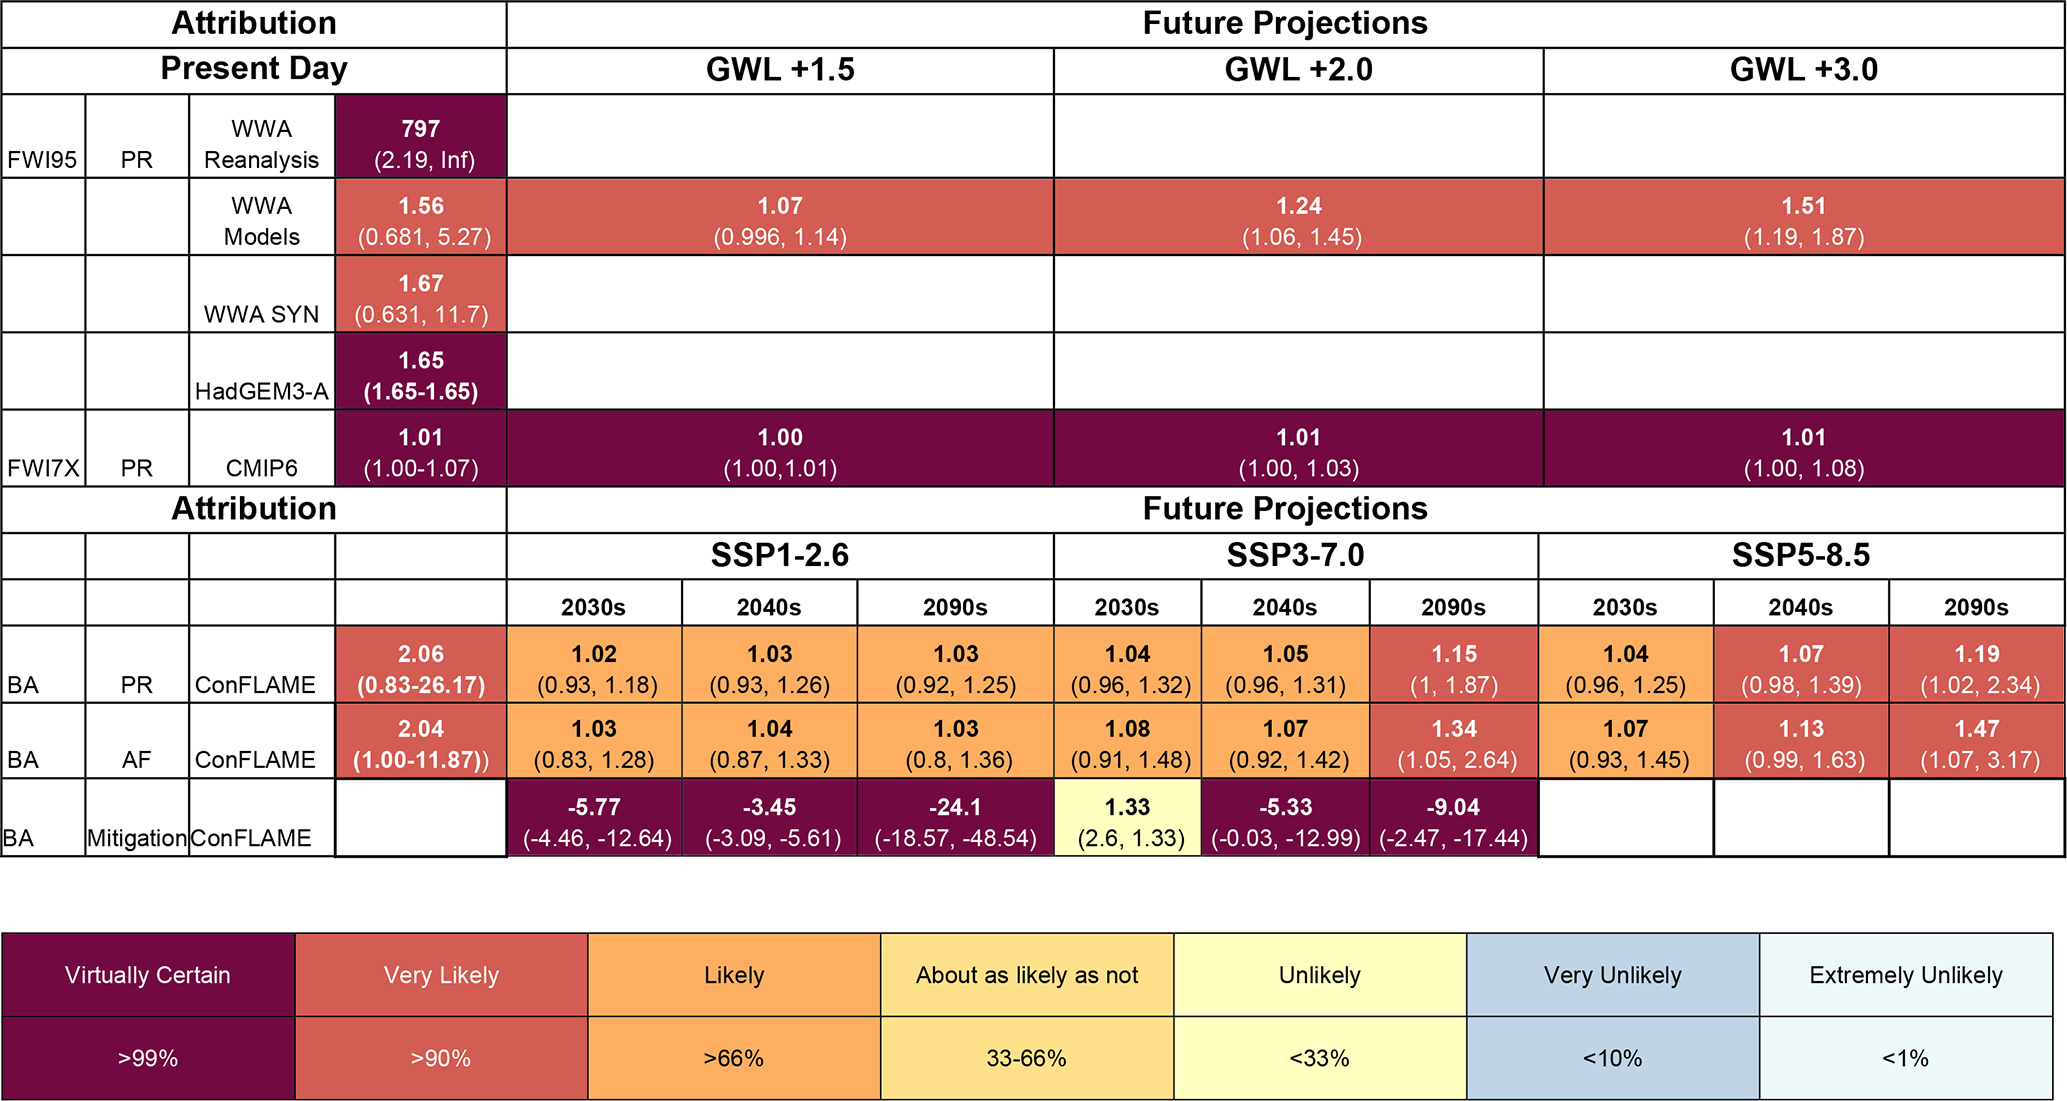
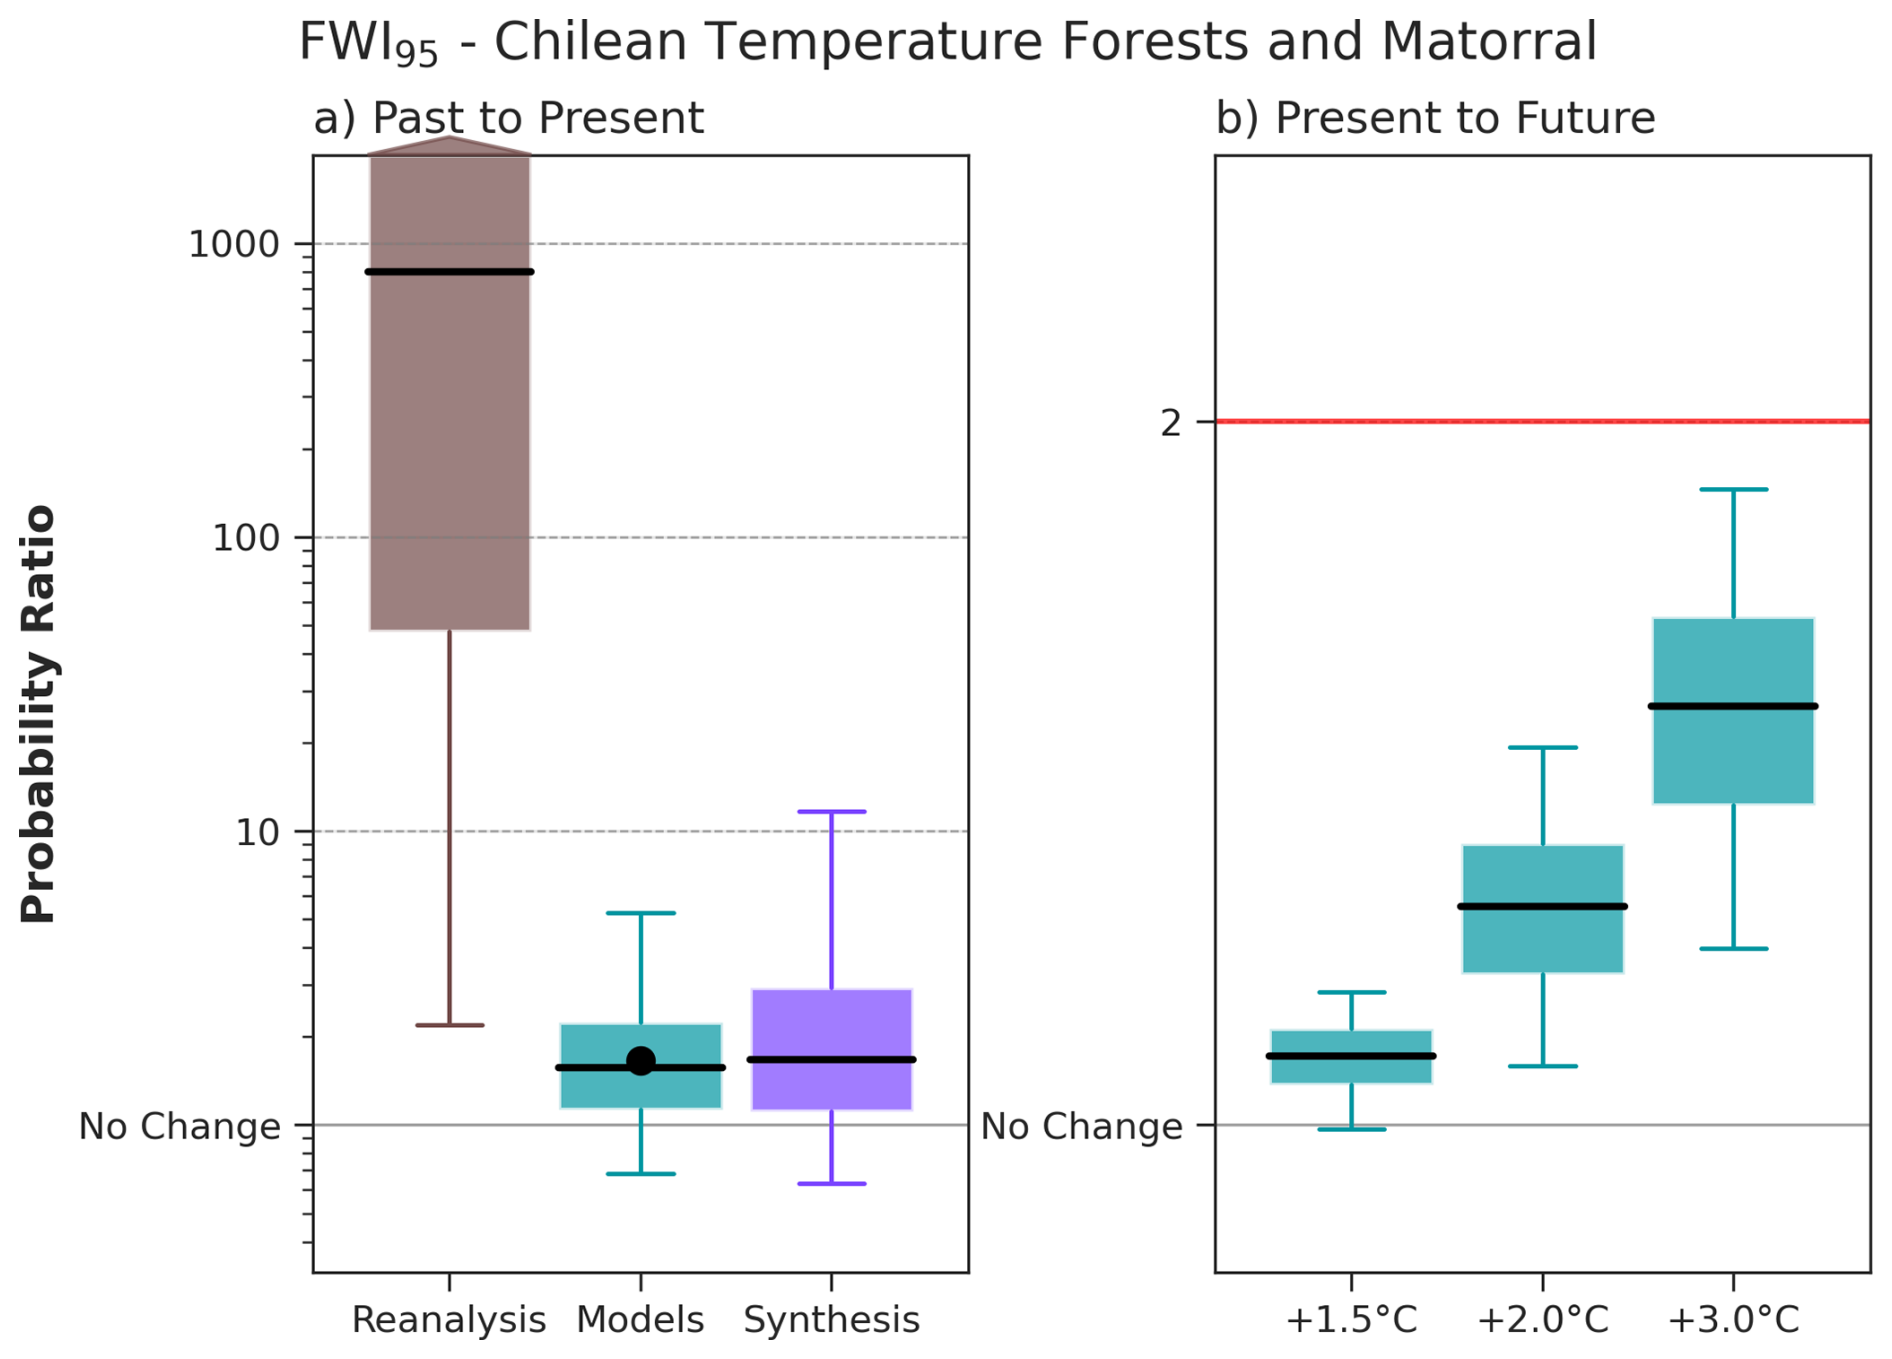
Figure 17FWI95 Probability Ratio (PR) for present day and future GWLs. Summary of attribution results for FWI95 (95th percentile of the FWI over the focal region and time period January–February 2026 for the Chilean Temperate Forest and Matorral). The box and whisker plots show the 5th, 25th, 50th, 75th and 95th percentiles of the bootstrapped probability ratio (PR) for each data set. The left panel shows the PR (the ratio between current and pre-industrial probabilities) due to human-caused climate change (defined here as a 1.3 °C change) in reanalysis, climate models and a synthesis of all data. The dot on the synthesis panel shows the PR according to the SST driven HadGEM3-A ensemble. The right panel shows the projected change in the event probability according to the same set of models to GWLs of +1.5, +2.0, and +3.0 °C above preindustrial relative to a 2025–2026 value taken as +1.3 °C – the red line corresponds to the inverse of the present day return period, and so marks the PR at which the event would be expected nearly every year. N.B. that as the 75th and 95th percentiles were much higher than 1000, an arrow was added to the interquartile range to illustrate this. Both scales are logarithmic.
The substantial difference between the models and reanalysis results is driven by a high PR sensitivity in cases where extreme events are very rare; once the counterfactual probability approaches zero, the PR increases exponentially. There are several reasons why this is the case. We know that hot extremes lead/lag in models in different regions, and results from Schumacher et al. (2026) and Keeping et al. (2026) indicate that this may explain the very high PR in reanalysis for Chile and Iberia. For example, in extreme hot, dry weather events models may underestimate warming effects resulting from the decline in aerosols, or related changes in circulation. Models tend to smooth extremes and underestimate local feedback due to coarser resolution, producing a less extreme tail in the simulated distribution. Thus while the event is still rare in the model counterfactual climate, it is not nearly impossible as it is in the reanalysis pre-industrial era. There are also known biases in the reanalysis data in Chile, particularly in the west, that may contribute to the differences (e.g. Liu et al., 2024). The probability in today's climate may be the same in both models and reanalysis, but with a very low probability in the pre-industrial climate (the denominator of the PR) and long tails of the distribution, the resultant PR can vary greatly. We show the models and reanalysis estimates separately, as these are effectively two different lines of evidence. The reanalysis results show how rare an event is and how that changes with global mean temperature, however as confounding factors such as the effect of land-use change on regional weather may affect this, full attribution requires the synthesis of this information with climate models – where such factors can be discounted. We therefore take both lines together in calculating the synthesis.
Results from the HadGEM3-A large ensemble sit within the 25 %–75 % CI of the multi-model assessment (0.68–5.27), giving a PR of 1.65 (Table 8). For FWI7X, the uncertainty range is relatively narrow and centred close to unity. The results show a best estimate PR of 1.01, with a 90 % confidence interval of 1.00–1.07, suggesting only a very small increase in the likelihood of prolonged extreme fire weather under climate change simulated by models (Fig. S21).
For future projections, the multi-model analysis shows a confident increase in the probability of extreme fire weather compared to today, increasing with GWLs. At GWL +1.5 °C above pre-industrial we see a small increase in PR (1.07), increasing to 1.51 (50 % increase) at GWL +3.0 °C (Fig. 17, Table 8). For FWI7X, changes in likelihood remain small but also show a consistent increase with higher GWLs. The PR ranges from 1.00–1.01 at +1.5 °C warming to 1.00–1.08 at +3.0 °C, indicating a weak but virtually certain (> 99 % likelihood) strengthening signal of increased extreme fire weather under higher levels of warming (Fig. S21).
Projections for seasonal FWI using the CMIP6 ensemble indicate a moderate but consistent increase in fire weather over the 21st century (Fig. S22). Increases in seasonal mean FWI emerge by the mid-21st century and evolve steadily thereafter. The magnitude of change remains modest under SSP1-2.6 and increases progressively under higher emissions pathways, reaching up to 10 under SSP5-8.5 by the end of the century. Changes in annual maxima are larger than those in seasonal means and exhibit greater variability, particularly under higher emissions scenarios. While a positive signal dominates, some models continue to simulate weak or near-zero changes.
6.3.2 Changes in BA
During January–February 2026, anthropogenic climate forcing very likely (95 % likelihood) increased BA across the Chilean Temperate Forests and Matorral region (Fig. 18, Table 8). BA was 2.04 (1.00 to 11.87) times larger under present-day conditions than in a counterfactual climate. The increase was driven primarily by dry conditions, which were very likely to have enhanced BA and produced an AF of 1.94 (1.07 to 10.42) (Table S13), in line with results from the FWI analysis.
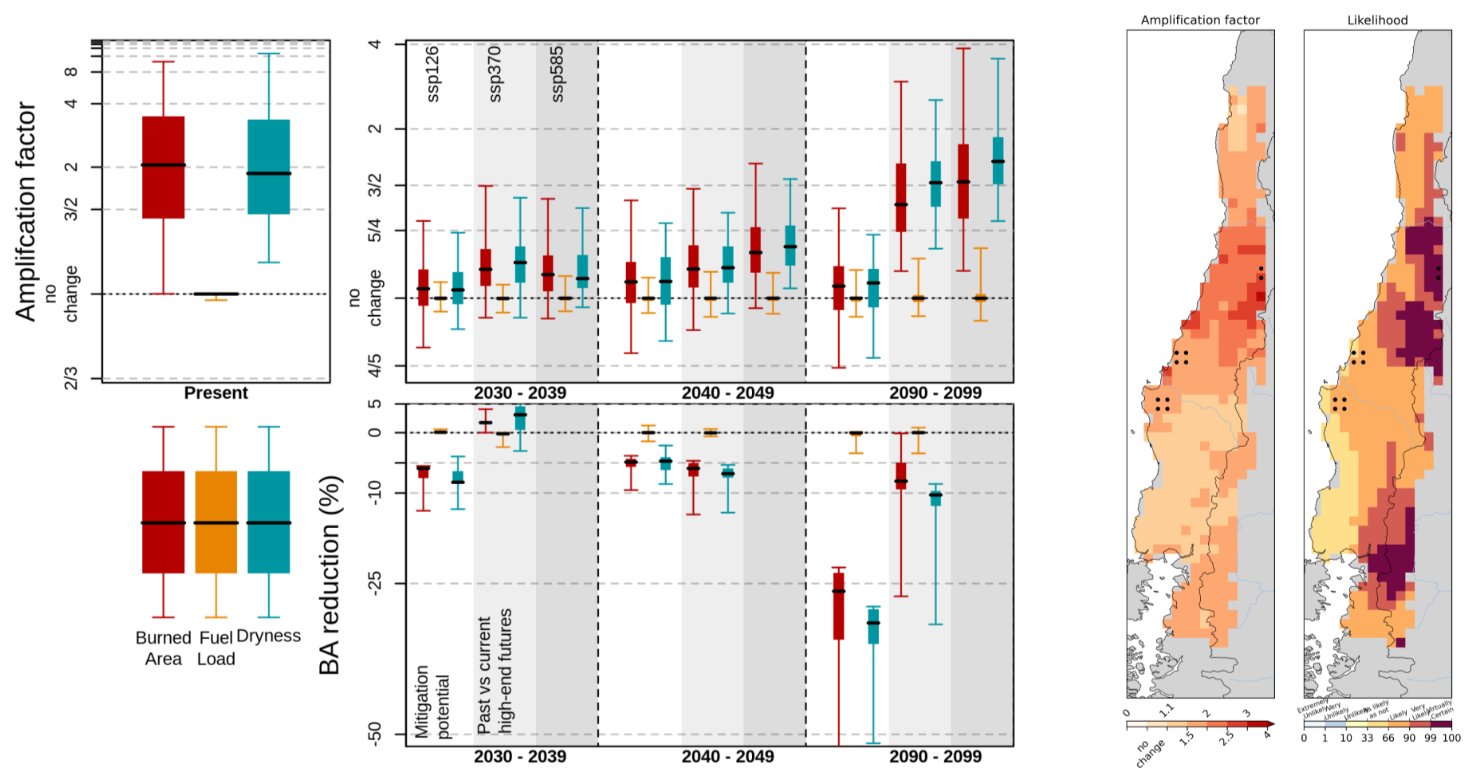
Figure 18Top panels: Amplification of extreme BA due to anthropogenic climate forcing and future climate change. The left panel shows attribution results for the focal event, with amplification factors (AF) for BA due to anthropogenic climate forcing. The right panel shows projected amplification under future climate scenarios relative to the 2010–2019 baseline. Boxes indicate the interquartile range (IQR) of AF derived from the ConFLAME posterior distribution, whiskers represent the 5 %–95 % uncertainty range, and the solid black line denotes the median. 2nd row, BA reduction represents the proportional decrease in BA for events equivalent in magnitude to the focal event. Here, “Past vs current high-end futures” quantifies the difference in BA between the SSP5-8.5 and SSP3-7.0 scenarios, while “Mitigation Potential” identifies the further reductions achievable by transitioning from SSP3-7.0 to SSP1-2.6 pathway. Colours indicate the contributing drivers: BA (red), fuel load (orange), and dryness (teal), with each factor representing the effect of varying that component alone. Amplification factors greater than 1 indicate an increase in BA due to anthropogenic forcing or climate change. The lower maps show spatial patterns of attribution. The left map presents the AF of BA due to total anthropogenic forcing, while the right map shows the likelihood of increased BA, calculated as the proportion of the ConFLAME distribution with AF > 1. Dots indicate the grid cells that experienced 95 % of the region's burned area during target months.
The largest increases were concentrated in the central part of the region, where BA was amplified by a factor of two with high likelihood. The most severely affected locations, represented by the top 5 % of BA grid cells, also experienced increased BA (Fig. S23, Table S14), with an AF of 2.02 (1.01 to 96.5), although confidence in this signal was lower at 97 % likelihood than for the region as a whole.
Future changes in BA across the Chilean Temperate Forests and Matorral become significant (> 90 % likelihood) starting in the 2070s. However, there is potential for substantial, though uncertain, increases much earlier in the century, with some SSP3-7.0 projections suggesting AFs of up to 1.48 by the 2030s. By the 2090s, SSP5-8.5 projects a very likely (98 % likelihood) increase in BA, with AF reaching 3.17 for events with a likelihood comparable to the January–February 2026 event. This increase is driven primarily by changes in weather conditions. Weather-related amplification is virtually certain (> 99 % likelihood), with a central estimate of approximately 1.66 and values of up to 2.6 by the end of the century. In contrast, fuel responses remain uncertain and appear to be the dominant source of uncertainty in the overall BA response. Fuel-related amplification ranges from 0.94 (a ∼ 6 % reduction) to 1.16 (a 16 % increase), and is only as likely as not (41 %) to contribute to increased burning, though this range is large enough to have a substantial impact on the final BA (Table S13).
Under SSP3-7.0, the projected increase is smaller but remains significant, with a very likely (97 %) increase in BA and an AF of 1.34 (1.05–2.64) by the 2090s. This corresponds to a 9.04 % (2.47 % to 17.44 %) lower BA than projected under SSP5-8.5, reflecting evolving expectations of future high-emissions trajectories. These benefits may emerge well before the end of the century, with projected BA reductions of around 5.33 % (0.03 %–12.99 %) by the 2040s relative to SSP5-8.5. However, substantially larger benefits remain achievable through stronger mitigation. Compared with SSP3-7.0, SSP1-2.6 is associated with a likely (66 %) and much more limited increase in BA by the 2090s, with AF constrained to 1.03 (0.80–1.36). Relative to SSP3-7.0, SSP1-2.6 leads to a virtually certain (> 99 %) reduction in BA of around 24.1 % (18.57 % to 48.54 %) by 2090–2099. Benefits also emerge in the near term, with virtually certain reductions relative to SSP3-7.0 of 5.77 % (4.46 %–12.64 %) by 2030–2039 and 3.45 % (3.09 %–5.61 %) by 2040–2049.
6.3.3 Changes in Typical Fire Behaviour
According to BuRNN projections, annual average BA in the Chilean Temperate Forests and Matorral shows relatively limited change in the near term. Relative to the 2010–2019 baseline, BA is projected to decrease by 12 % in 2030–2039 under SSP1-2.6, while remaining broadly unchanged under SSP3-7.0 and SSP5-8.5 (Table S15). Similar patterns persist into 2040–2049. By the end of the century, BA declines slightly under SSP1-2.6 (10 % below present-day levels), while modest increases emerge under higher-emissions scenarios, reaching 19 % under SSP3-7.0 and 31 % under SSP5-8.5.
ConFLAME projections of mean annual BA broadly support the patterns identified by BuRNN, although they additionally quantify substantial uncertainty around these projections and indicate that larger changes, while unlikely, cannot be ruled out. Central estimates remain relatively modest across all scenarios (Fig. S25). The largest projected increase occurs under SSP5-8.5, reaching an AF of 1.29 (1.04–2.94) by 2090–2099 with a 97 % likelihood for a climate-driven increase (Table S15). Under SSP3-7.0, significant increases in BA emerge from 2060–2069 onwards (Fig. S25), reaching an AF of 1.23 (1.02–2.27) by 2090–2099. In contrast, SSP1-2.6 shows only small changes in the central estimate, and the lower bound suggests BA could decline by around 10 % by 2030–2039 (AF of 0.9 to 1.21) and up to 15 % by 2090–2099 (AF of 0.85 to 1.17). BuRNN projections generally fall within the ConFLAME uncertainty ranges, except for SSP1-2.6 during 2030–2039. Haas et al. (2023d), projections provide additional context, suggesting that this muted regional signal may mask substantial spatial variability (Fig. S26). Under RCP2.6 in particular, some areas show consistent decreases in BA across models, while parts of the coastal regions show emerging increases. This spatial heterogeneity might be contributing to the weak signal in the regional mean BA seen in BuRNN and ConFLAME (Table S15).
Despite this uncertainty in mean BA, there is a clearer signal in dryness-driven changes in ConFLAME results (Fig. S25). When considering the influence of dryness alone, ConFLAME indicates substantial, virtually certain increases in BA, with AFs of 1.30 (1.10 to 1.94) to under SSP3-7.0 and 1.40 (1.17 to 2.80) under SSP5-8.5 (99 % and > 99 % likelihood, respectively) by 2090–2099 (Table S15). This suggests that increasing dryness represents a strong underlying pressure towards greater fire activity. This drying is not seen in SSP1-2.6, which explains the large BA reduction under potential future mitigation – 18.3 % (13.29 % to 48.51 %) reduction in BA under SSP1-2.6 vs SSP3-7.0 by 2090–2099, explained entirely by changes in dryness.
This has implications for fire behaviour beyond BA. Haas et al.'s (2023d) projections of fire size show relatively strong and consistent increases, particularly under RCP2.6, where all models agree (Fig. S26). Agreement weakens under RCP6.0, although the overall tendency towards increasing fire size remains. In contrast, projections of fire intensity are more uncertain. Results show a mixed spatial pattern, with areas of increasing and decreasing intensity, as well as regions where intensity emerges in the future despite being absent in the baseline. These results should be interpreted cautiously, as the model does not fully capture fuel dynamics, which are a key control on fire intensity in this region.
New and updated datasets are listed in Table 9.
Table 9Details of new and updated datasets used within the analysis in Sects. 3–6 of this report.
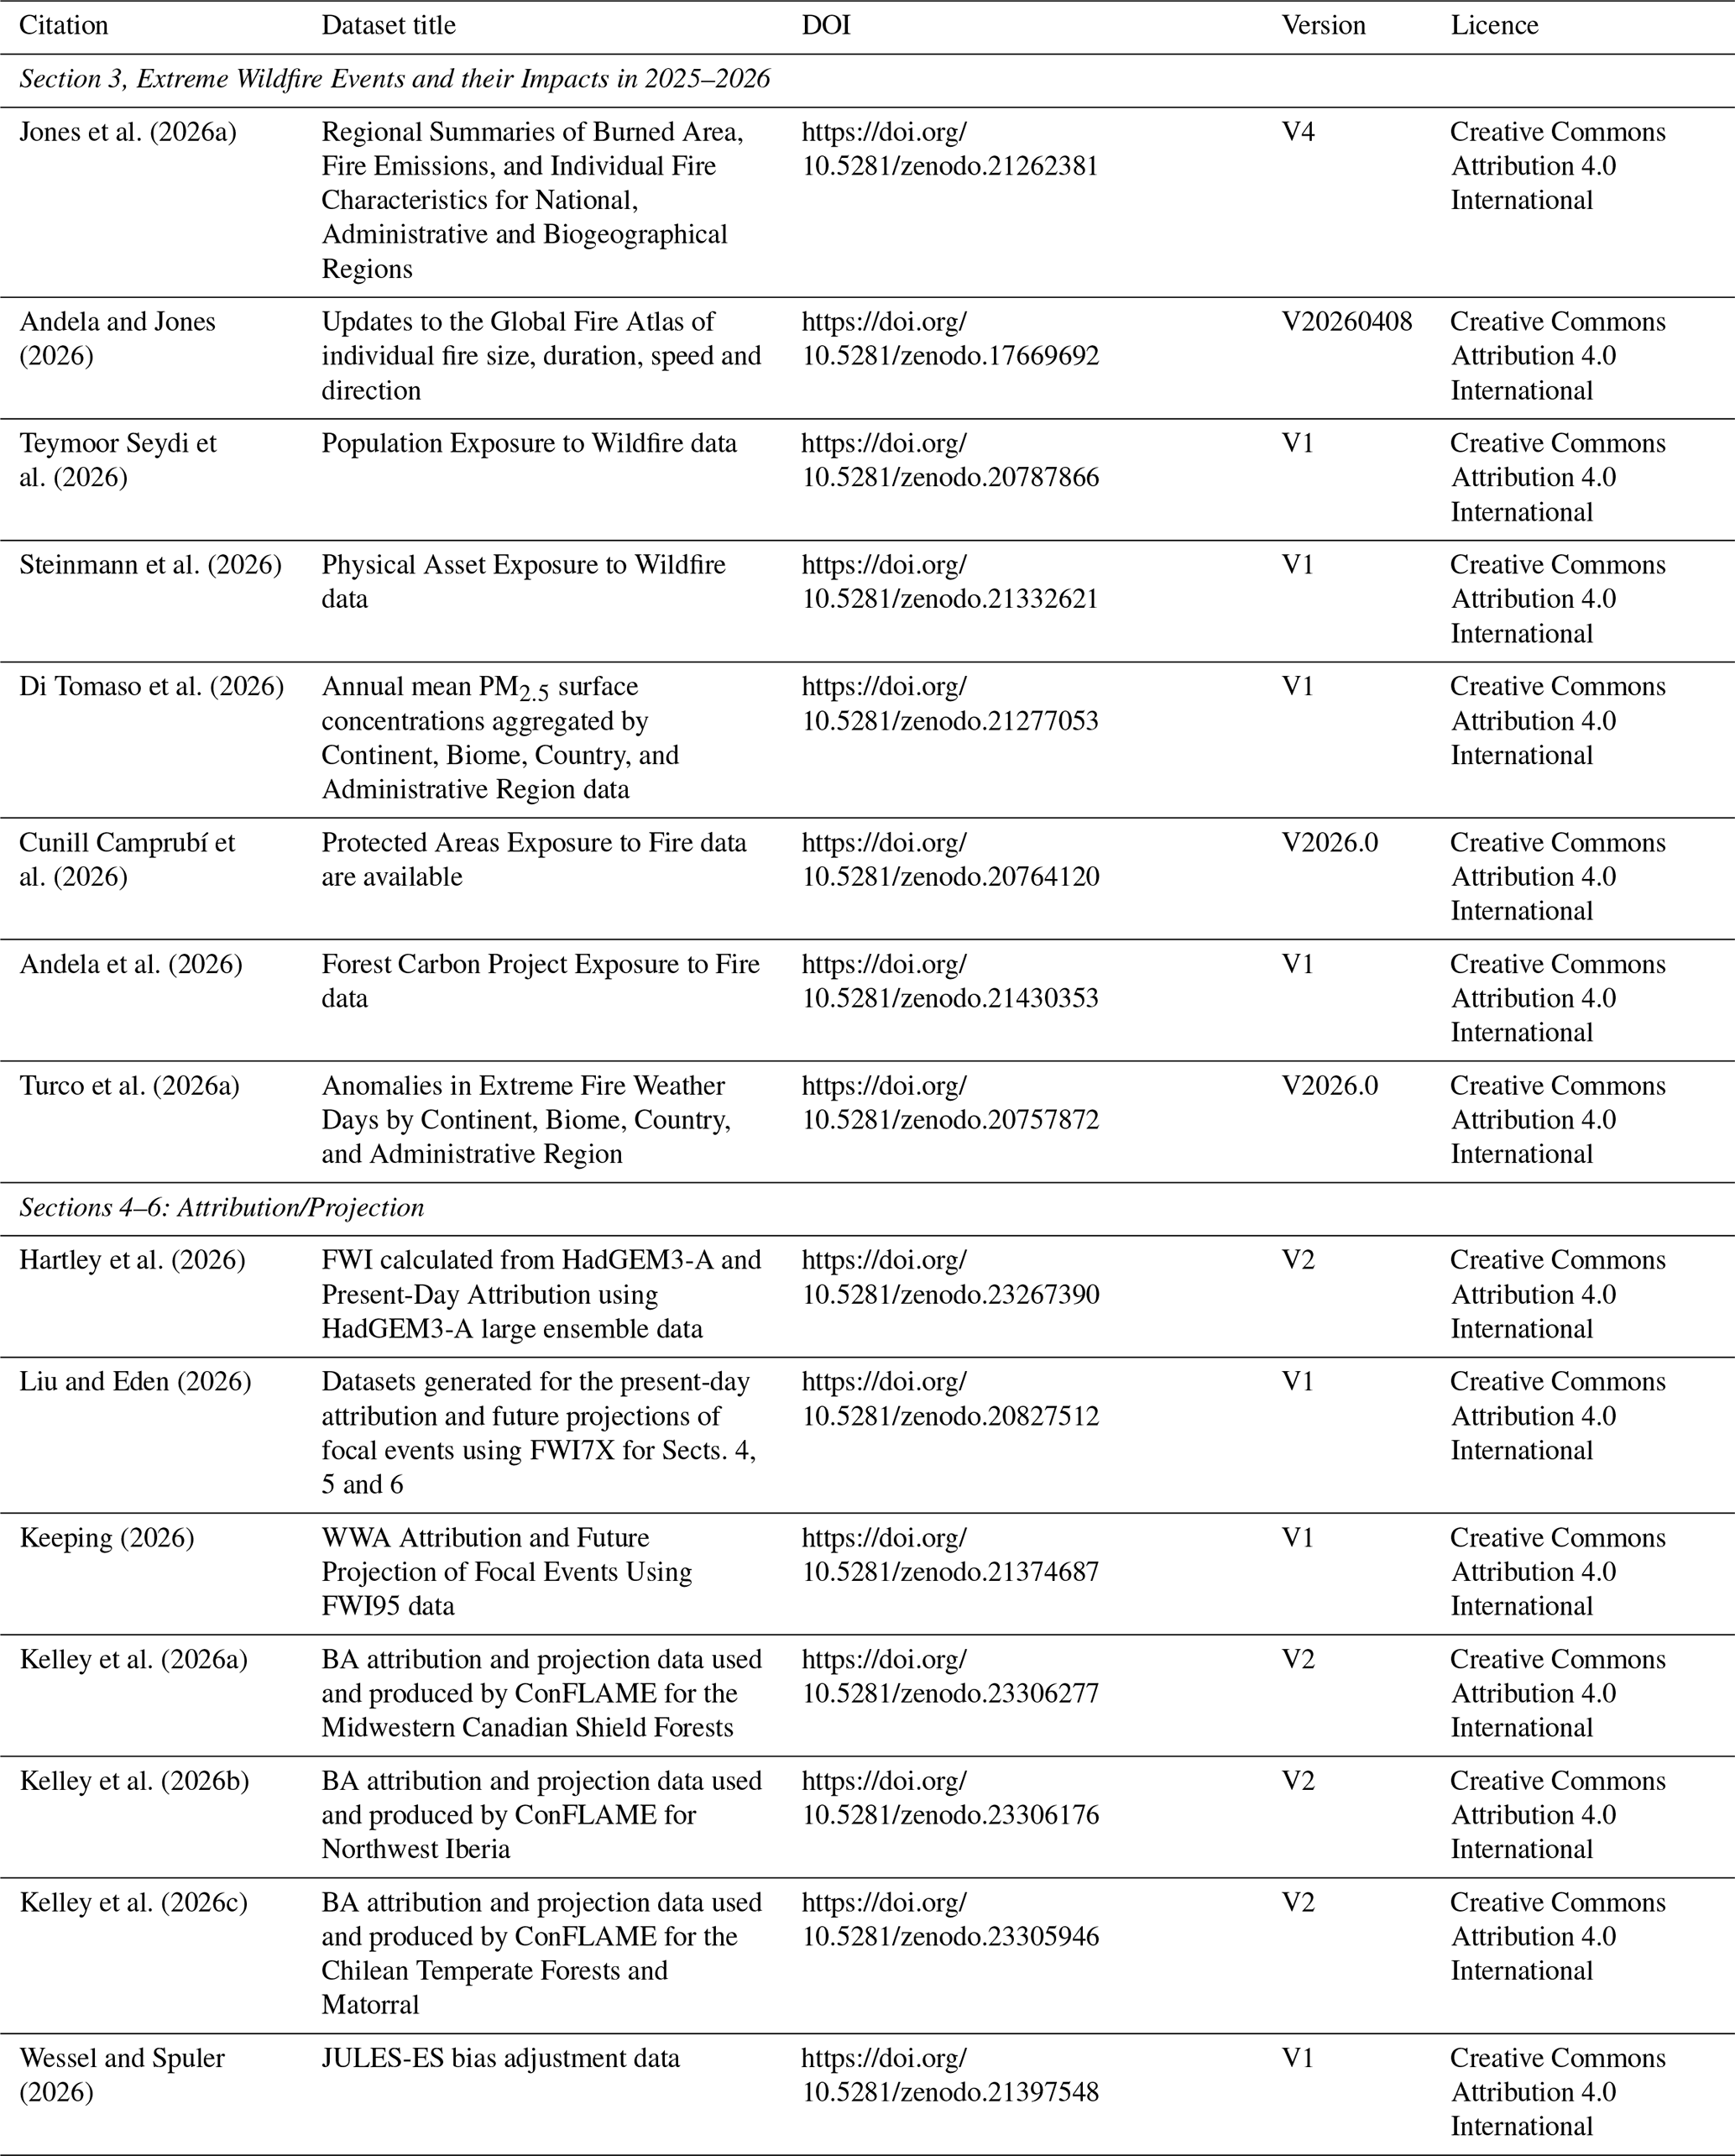
Section 3, Extreme Wildfire Events and their Impacts in 2025–2026: The data products associated with the study by Roşu et al. (2026b) concerning the modelled large-scale impacts of the 2025 Canadian wildfires is available at Roşu et al. (2026a, https://doi.org/10.5281/zenodo.20523005).
Sections 4–6, Hydroclimatic Drivers: The input meteorological data used for training the PoF model and deriving driving variable anomalies are taken from the ERA5-Land dataset are available from the Copernicus Climate Change Service (2019, https://doi.org/10.24381/cds.e2161bac).
The fuel characteristic dataset, updated from McNorton and Di Giuseppe (2024), is available from the ECMWF (2025, https://doi.org/10.24381/378d1497).
The lightning intensity used for the hydroclimatic drivers analysis is taken from the operational ECMWF IFS model.
Sections 4–6: Attribution/Projection: HadGEM3-A historical data are available from the Met Office (2016, http://catalogue.ceda.ac.uk/uuid/99b29b4bfeae470599fb96243e90cde3, last access: 22 July 2026).
The 1901–2019 burned area simulation of BuRNN is available on Zenodo as well along with all raw and pre-processed data to train BuRNN (https://doi.org/10.5281/zenodo.17778519, Lampe, 2025a) as used in Lampe et al. (2026).
Haas et al., Burned area, fire size and fire intensity projections data are available from Haas (2023a, https://doi.org/10.6084/m9.figshare.24764589) as used in Haas et al. (2026).
The code used to generate the probability ratios for the present-day attribution and future projections of focal events using FWI7X for Sects. 4, 5 and 6 is available from Liu and Eden (2026) at https://doi.org/10.5281/zenodo.20827512.
The code used to generate the probability ratios for the present-day attribution and future projections of focal events using FWI95 for Sects. 4, 5, and 6 is available from Keeping (2026) at https://doi.org/10.5281/zenodo.21374687.
The code used to produce the FWI HadGEM3-A attribution results is available from Potts and Burton (2026, https://doi.org/10.5281/zenodo.23303789).
The code associated with the study by Roşu et al. (2026a) concerning the modelled large-scale impacts of the 2025 Canadian wildfires is available at Roşu et al. (2026b, https://doi.org/10.5281/zenodo.20523005).
The code to compute the physical asset exposure is available from Steinmann (2026) at https://doi.org/10.5281/zenodo.21393395.
The ConFLAME model used for BA attribution and projections is available from Kelley et al. (2026d) at https://doi.org/10.5281/zenodo.11421746.
The BURNN model for BA projection is openly accessible on GitHub (https://github.com/VUB-HYDR/BuRNN, last access: 21 July 2026) and is archived on Zenodo under copyright license CC BY 4.0 (https://doi.org/10.5281/zenodo.17834206, Lampe, 2025b) as used in Lampe et al. (2026)
Haas et al., Burned area, fire size and fire intensity projections code as used in Haas et al. (2026) is available from Haas (2023b) at https://doi.org/10.6084/m9.figshare.24764583 (for processing data and setting up model); Haas (2023c) https://doi.org/10.6084/m9.figshare.24764577 (for running the model) and Haas (2023d) at https://doi.org/10.6084/m9.figshare.24764571 (for analysing results)
A free-to-use version of SPARKY-PoF is available through a public GitHub repository (https://github.com/ecmwf/AI-Probability-of-Fire, last access: 27 October 2026), and the version used in this study is archived on Zenodo (McNorton et al., 2026, https://doi.org/10.5281/zenodo.23691112).
9.1 Extreme Wildfires of 2025–2026
Impacts from extreme fires over 2025–2026 include widespread human, ecological and economic losses, deteriorated air quality, and burning of protected areas and forest carbon projects. These impacts were driven by a pattern of regionally extreme wildfire events rather than widespread anomalously high BA globally.
While global BA was below average, in line with continued decreases in savannahs and grasslands in the past two decades, a variety of anomalous fire seasons and extreme individual fires were consequential at regional scales. Within this globally subdued fire year, several distinct regional extremes emerged. The clearest positive fire carbon emissions anomaly occurred in North America, where continental emissions reached 417.4 TgC, 184 % above average and the third-highest total since 2003. Fire carbon emissions in Canada reached 315 TgC, 195 % above average and the second-highest in the record. Fires in Canada forced 70 000 evacuations, triggered the declaration of Canada's maximum firefighting preparedness level, and reportedly caused direct losses of USD 360 million. Europe also faced exceptional fire activity in 2025–2026, with regional EFFIS statistics showing the largest BA total on record (301 % above its 2006–2024 average). Spain's 95th-percentile fire size and rate of growth were also 790 % and 504 % above average, respectively, while a fire complex in Scotland became the UK's first recorded megafire. In Australia, the number of mapped fires was 88 % above average and the highest in the record, although national BA and fire carbon emissions totals remained close to or below average. In Asia, record or near-record BA occurred in several countries, but South Korea was the clearest outlier: BA was 896 % above average and fires caused 32 fatalities and triggered the evacuation of approximately 37 000 people.
These regional extremes were accompanied by contrasting patterns of human, economic and ecological exposure. Africa recorded its lowest continental BA in the MODIS record, yet an estimated 20.93 million people were within fire perimeters, 1.57 million more than average. Europe had USD 4.11 billion in physical assets within fire perimeters, 2.2 times the average, including USD 2.05 billion in Greece. Fire-related PM2.5 produced above-average numbers of population-weighted poor air quality days in 45 countries; Albania experienced 10 additional poor air quality days, while Norrbotten, Newfoundland and Labrador, and Saskatchewan recorded 13, 12 and 10 exceedance days, respectively, despite having none under climatological fire emissions. Although the global extent of protected-area burning was the lowest in the 24-year record, the percentage of national protected-area extent burned reached record levels in South Korea, Cyprus, Bangladesh, the UK and Spain, at 56.1, 16.4, 6.2, 5.4 and 4.8 times their respective averages. Fire also affected 235 of the 1798 assessed forest carbon projects and burned 27 400 km2 within their boundaries; in Europe, project area burned was 4.8 times the average.
Although wildfire impacts were observed across many parts of the world, three focal regions stand out as representative examples of the extreme fire activity seen during 2025–2026: the Midwestern Canadian Shield Forests; Northwest Iberia; the Chilean Temperate Forests and Matorral. These regions experienced substantial societal and ecological impacts alongside anomalously high BA and emissions, making them a useful lens through which to understand the drivers of extreme fire seasons.
BA and fire carbon emissions were among the highest on record in Canada for a third consecutive year, impacting air quality in Canada, the US and beyond. Fires were concentrated in Manitoba and Saskatchewan, where there were a total of two civilian deaths, 57 000 total evacuations, and fire carbon emissions anomalies were 11.7 and 4.77 times their respective averages. These fires drove high carbon losses from forests and affected local weather, reinforcing a positive fire-climate feedback. Indeed, climate change has doubled the likelihood of the extreme fire weather conditions seen during the 2025–2026 fire season in the Midwestern Canadian Shield Forests, and has made its extreme BA 9 times larger and 10 times more likely.
In Europe, Iberia experienced a total of 14 megafires over August 2025, causing 14 fatalities and evacuations of over 40 000 people. Northwest Iberia experienced some of its largest fires on record, with BA ∼ 3 times larger larger as a result of anthropogenic climate change. This extreme fire activity caused widespread ecological and landscape damage, impacting national parks and protected species, and led to the EU Civil Protection Mechanism for wildfire assistance being activated across several countries simultaneously, placing pressure on Europe's shared emergency-response capacity. If warming continues under SSP3-7.0, we could see 78 % more BA for events like the 2025–2026 fire season in this region by the 2090s, with some projections within the same scenario suggesting increases of around sevenfold. Extreme fires could be up to 8 % more likely, indicating greater future pressure on response systems. Ongoing policies to reduce greenhouse gas emissions have likely already reduced this projected increase by around 23 %, and further progress towards the Paris Agreement goals could reduce it by another 30 % to 70 % by the 2090s, with some substantial reductions (∼ 8 %) even in the next 20 years.
The area affected by the deadly fires in Chile was around doubled due to anthropogenic climate change. These fires caused substantial loss of life, with 23 fatalities, displaced 52 000 people, and incurred damage to thousands of houses and critical infrastructure. Native ecosystems burned, impacting endemic wildlife, soil and water resources. Looking ahead, the factors that contributed to these deadly fires are projected to become more severe. Under a very high-emissions future (SSP5-8.5), events comparable to those of January–February 2026 could become more than three times larger by the 2090s. Reflecting evolving expectations of future emissions pathways over the past two decades, fires under SSP3-7.0 are estimated to be around 9 % smaller than under SSP5-8.5 by the end of the century. However, the greatest benefits remain in the future: achieving pathways consistent with the Paris Agreement could reduce BA during similar extreme events by around 24 % relative to SSP3-7.0, with benefits emerging within the next two decades. Nevertheless, even under strong mitigation, some increase in BA remains likely, suggesting that part of the future increase in extreme fire risk is already committed and will require adaptation as well as mitigation.
Across all focal regions, the likelihood of extreme fire weather like we saw in 2025–2026 has increased due to climate change, and is projected to continue increasing at the same rate with continued warming. This corresponds to approximately a doubling in Canada today (0.33–44.9, median 1.85) and at GWL +3 °C (0.98–5.55, median 2.34), a 3-fold increase in Iberia (modelled 0.14–657, median 3.63 today; 1.2–8.79, 3.29 at GWL +3 °C), and a 50 % increase (0.63–11.7, 1.56 today; 1.19–1.87, 1.51 at GWL +3 °C) in Chile. This behaviour is consistent across focal regions despite differences in baseline fire regimes, suggesting a broadly consistent scaling of extreme fire weather probability in a warming world. We also find that continued warming drives increases in the expected total BA for future extreme events similar to those of 2025–2026, and individual fires that do occur are likely to be larger and more intense as a result of climate change. Without recent emissions reductions, these future BAs could have been much larger. Further progress towards the Paris Agreement goals could reduce BA during events like these by a further 5 %–36 %, and help limit the growth of individual fire sizes. Therefore, while we are already witnessing the effects of climate change on extreme fires around the world, concerted efforts to reduce emissions and limit further warming can still help mitigate the worst impacts.
Across the three focal regions, a common pattern of hydroclimatic drivers emerges from our analysis. The most severe fire activity did not arise solely from short-lived weather extremes, but from the interaction between long-term hydroclimatic preconditioning and acute atmospheric fire-weather conditions. In all three regions, fire-prone conditions developed progressively over weeks to months as persistent dry anomalies increased landscape flammability. In Canada and Chile, prolonged precipitation deficits led to deep-soil moisture depletion and widespread fuel desiccation. In Northwest Iberia, an anomalously wet spring promoted exceptional vegetation growth, which was subsequently transformed into abundant, highly flammable fuel by drought and heat. Despite these differing pathways, all regions entered the fire season with elevated fuel loads or aridity that greatly amplified the effects of extreme fire weather. During the peak burning phases, atmospheric conditions became the primary control on fire growth, although the dominant mechanisms varied regionally. Canada experienced a combination of heat, wind, and lightning-driven ignitions; Iberia was overwhelmingly influenced by repeated heatwaves and very low humidity; and Chile was characterised by exceptionally strong wind events superimposed on already desiccated fuels. Driver quantification analyses consistently show that fuel-related processes and atmospheric fire weather acted together rather than independently, producing compound conditions that exceeded those observed in most previous years. Collectively, these events highlight a broader emerging pattern in extreme wildfire seasons: catastrophic fire activity is increasingly associated with the cascading interaction of slow hydrological processes that precondition fuels, and short-term extreme fire weather that determines when and how rapidly fires spread (Richardson et al., 2022; Abatzoglou et al., 2021; Libonati et al., 2022).
Despite interannual variability, implying that not every year is expected to become a large fire year, and decreases in BA driven by fuel fragmentation that continue to dominate the global trend, a persistent influence of climate change on regional extremes is clearly noticeable. Over the last three years of the State of Wildfires reports, we have reported on exceptional fires in carbon-rich forests and peatlands across western Canada, Amazonia, Pantanal, and the Congo Basin, driven by prolonged hydroclimatic drying prior to extreme fire weather. In contrast, fuel-limited regions including Northwest Iberia and Los Angeles experienced a hydroclimatic rebound, with enhanced vegetation growth after anomalously wet conditions, followed by rapid drying and extreme heat and drought. Both patterns are symptomatic of already visible effects of climate change; longer and hotter dry seasons driving more fires in fuel-abundant regions, and warmer, wetter winters followed by hotter, drier summers propelling abnormally intense fires in fire-adapted ecoregions. Overlaid on the signal of background warming, large-scale modes of variability such as El Niño Southern Oscillation can drive significant weather and fire extremes (Chen et al., 2017). With a strengthening El Niño over 2026 (World Meteorological Organization, 2026), we can expect further records to be broken over the coming months (Di Giuseppe and Burton, 2026).
9.2 Progress in the State of Wildfires Report
Now in its third year, the State of Wildfires Report aims to be as community-driven as possible to capture the widest breadth of cutting-edge knowledge from across the fire sciences. This edition has seen improvements across all sections of the report, including BA measurement and impacts analysis, drivers, attribution, and projections science.
For the extreme identification section of the report, we have now moved to GFED5.1 emissions which gives an improved estimate of total carbon emissions, including small fires and agricultural fires, and updated emission factors. While the overall magnitude of emissions is higher than previous versions of GFED, the trends remain consistent and therefore we continue to report anomalies in these reports to understand year to year variations. We also update the source of FRP observations, and the calculations of carbon emission anomalies and peak fire intensity. New for the impacts section this year, we include an assessment of BA exposure in Protected Areas.
The drivers analysis of the focal case studies demonstrates the value of moving beyond traditional fire-weather assessments to an integrated hydroclimatic framework that links antecedent water availability, fuel dynamics, and atmospheric conditions. Across all events, a common feature was strong long-term fuel memory, whereby persistent precipitation deficits, soil moisture depletion, vegetation stress, and periods of anomalous fuel accumulation preconditioned landscapes for extreme fire activity over weeks to months before fire seasons began. This indicates that much of the predictive information needed to anticipate extreme wildfire events is stored within the fuel system rather than the atmosphere alone, meaning that conventional fire danger indices may fail to capture the longer-term pathways through which hydroclimatic anomalies influence fuel availability and flammability. Since the State of Wildfires project began we have already made significant progress in improving the representation of fuel and therefore the hydrological memory of the predictive system, as well as the data used to train the models. Future early-warning systems could also benefit from incorporating direct observations and forecasts of fuel conditions, using satellite data, land-surface models, and vegetation monitoring to track fuel status in near real time and project future risks. Such an approach would provide a more complete representation of the processes governing wildfire activity, enabling earlier and more physically grounded warnings of extreme fire risk and improving preparedness for the most consequential wildfire events.
For the attribution analysis, the collaboration with World Weather Attribution (WWA) enables a wider range of model attribution to be performed and lessons learned from the Rapid Attribution Studies regularly performed by WWA helped strengthen community input into the process. Diagnosing the fire weather conditions that play a key part in the attribution of extreme events was further improved with the addition of the FWI7X metric to give a more holistic view of fire weather, representing both short-term peaks and longer duration fire anomalies. Through the three methods presented in this report, we are also able to report on different aspects of the attribution question: emergence from natural variability through the WWA approach (“are events like this becoming more likely because of climate change?”); attribution to external forcing through the CMIP6 large ensemble (“how much does climate change influence events of this magnitude?”); and event-specific attribution using HadGEM3-A (“how much did climate change influence this specific event?”). Quantifying these different measures of uncertainty results in different levels of confidence around the central estimate, but ultimately, the results all broadly agree; climate change has increased the probability of an extreme event such as the ones witnessed in 2025–2026, and this gives us an improved understanding of how anthropogenic forcing is altering extremes.
Other areas of progression in this ongoing community effort include the expansion of multiple independent fire models in the future projection analysis. In addition to ConFLAME projections, we incorporate FWI-based projections that isolate atmospheric drivers and include results from the BuRNN and Haas et al., models, which assess changes in mean BA with fire size, for the first time, allowing us to assess other fire characteristics beyond BA. This builds on lessons from last year, in which reliance on a single model made interpreting region-specific results more challenging, particularly when competing mechanisms yielded uncertain signals (see Southern California in Kelley et al., 2025). Bringing together these complementary methods developed across multiple research groups strengthens confidence in the overall direction of change.
However, our results this year also highlight both the strengths and remaining limitations of current climate models. Across multiple results, the reanalysis, numerical models and GCMs generally agree on the direction of large-scale influences of climate change, consistently indicating an increase in the likelihood and severity of extreme fire weather and BA. This agreement across independent models and methods provides greater confidence in the robustness of the overall signal, especially for future projections where there is still no alternative to using GCMs. However, differences do emerge primarily in the magnitude of the response. We see this in the FWI attribution for both Iberia and Chile, with the very different scale of results between the models and reanalysis, and in the ConFLAME BA where the future influence of climate change from modelled climate is much weaker than in the present-day climate constrained by observations. These differences reflect the continuing challenge of capturing the most extreme events and their tail risks, rather than disagreement over the underlying direction of change, and suggests a more blended approach of data and models could help improve our understanding of the influence of climate change on extremes.
Finally, a key next step is to strengthen the report's role as a policy-relevant evidence base, by more explicitly connecting its strands of analysis to impacts, and broadening the range of contributing expertise. While the report has made strong progress as a community-driven effort, key areas such as hydroclimatic driver analysis, attribution, and future projection modelling remain dominated by contributions from Europe and parts of the Americas. Expanding participation from other regions, and strengthening links with international modelling efforts such as FireMIP, will not only improve the robustness of the science but also ensure that the evidence base reflects a wider range of fire regimes and expertise. Together, these advances will enhance the relevance, credibility, and usability of the report, providing a stronger foundation for informing policy and decision-making.
9.3 Linking science to action
This report's findings give wildfire policy a stronger scientific base. Its value, though, depends on what happens next: how these findings move from research into decisions, training, tools and day-to-day fire management, linking to action. Scientific advances have substantially improved our ability to analyse weather, climate, fuels, and fire impacts, but reducing wildfire risk also depends on how people prepare for, respond to, and recover from fire events. In this sense, a complementary report is being developed that will focus specifically on these societal dimensions, extending the physical assessment presented here. Organisations such as Global Fire Management Hub (FAO, 2026a, b) hosted by FAO can also help fill this gap. Coordinated platforms for integrated fire management can help turn the report's evidence into practical support for countries, regions and local teams, serving as a central platform for practitioners. This could include capacity-building, technical guidance, policy advice and tools that can be adapted to different ecosystems and fire-risk contexts, as well as space for peer-to-peer exchange between practitioners, researchers and policymakers. This matters because, as we highlight in this report, there can be very different fire challenges across regions. In some places, fires are becoming more severe in ecosystems that are not adapted to burn. In others, especially in Arctic and subarctic areas, wildfire risk is emerging in ways that demand faster learning and adjustment.
By linking the report's findings with implementation work, scientific evidence can move closer to the people designing and applying wildfire risk reduction strategies on the ground. That connection is essential if countries are to respond to changing fire regimes with approaches that are both evidence-based and suited to local realities. Many projects are now applying current scientific findings to regional and national programs to help improve their ability to adapt, mitigate and manage fires. Recent political commitments have also solidified the rationale for an increased integrated fire management. The Kananaskis Wildfire Charter endorsed by G7 nations in June 2025 (Prime Minister of Canada, 2025), the Leader's Call to Action on Integrated Fire Management and Wildfire Resilience at COP30 in Brazil (FAO, 2026), the 7th Session of the United Nations Environment Assembly (UNEA-7) on strengthening the Global Management of Wildfires (PIB Delhi, 2025) and the two resolutions regarding disaster risk reduction adopted by the UN General Assembly in 2024 and 2025 (United Nations, 2025), called for enhanced action on fire management. These political commitments demonstrate the need for better data, a greater emphasis on innovation, stronger recognition of Indigenous fire stewardship and more investment in risk reduction and preparedness, converting declarations into action. The findings of this report support these commitments by providing crucial information needed for integrated fire management.
The supplement related to this article is available online at https://doi.org/10.5194/essd-18-8037-2026-supplement.
Conceptualisation and Project Administration: CAB, FDG, MWJ, DIK. Data Curation, Resources, and Software: CAB, FDG, MWJ, DIK, MLFB, EBr, JRM, TRK, ZL, BP, JME, AC, EDT, AJH, SL, GM, YQ, FRS, CBS, MAT-V, DvW, JBW, NA, EC, LG, MP, MT, GRvdW, SV. Formal Analysis: CAB, FDG, MWJ, DIK, MLFB, JRM, TRK, BP, ZL, JME, OH, SL, EBr, LF, AJH, SL, GM, YQ, FRS, CBS, MAT-V, DvW, JBW. Visualisation: CAB, FDG, MWJ, DIK, MLFB, JRM, TRK, ZL, JME, LF, SL, FRS, MAT-V, JBW, NA, RP. Writing – Original Draft Preparation: CAB, FDG, MWJ, DIK, MLFB, EBr, JRM, ZL, AC, EDT, LF, AJH, TRK, SL, YQ, PSS, FRS, CBS, MAT-V, JBW, CMdB, VMD, SHar, EAK, CS, JS, JA, NA, DSH, SHan, SM, MP, MT, LOA, HC, PMF, CAK, J-LK, BP. Writing – Review & Editing: All authors.
At least one of the (co-)authors is a member of the editorial board of Earth System Science Data. The peer-review process was guided by an independent editor. Niels Andela and Dave van Wees are employees of BeZero Carbon Ltd., a carbon credit ratings agency for the voluntary carbon market.
Publisher's note: Copernicus Publications remains neutral with regard to jurisdictional claims made in the text, published maps, institutional affiliations, or any other geographical representation in this paper. The authors bear the ultimate responsibility for providing appropriate place names. Views expressed in the text are those of the authors and do not necessarily reflect the views of the publisher.
We would like to acknowledge Fraser Lott in helping to retrieve a lot of HadGEM3-A data for this study, and Josh Hall for his help keeping us on track.
AI tools (Microsoft Co-Pilot, ChatGPT-4, GrammerlyGO) were used to improve the quality of the written text while drafting, although all authors edited the final text and take full responsibility for what is written.
CAB, BP, AJH and AC were supported by the Met Office Hadley Centre Climate Programme funded by DSIT, and CB and AH were also supported by the Met Office Climate Science for Service Partnership (CSSP) Brazil project under the International Science Partnerships Fund (ISPF).
MWL was funded by the UK Natural Environment Research Council (grant nos. NE/V01417X/1, UKRI2668, NE/C002668/1).
FDG and JRM are supported by the EU fundings through the Copernicus Emergency Management Service contract (942604).
EBr was funded by the UK NERC ARIES Doctoral Training Partnership (grant no. NE/S007334/1).
LOA acknowledges funding from The Natural Environment Research Council (NERC AMAZON SOS-NE/X019055/1) and the National Council for Scientific and Technological Development (CNPq) projects CAPOEIRA (grant no. 443849/2024-2) and Productivity scholarship (grant no. 307364/2025-9).
SL was supported by a PhD Fundamental Research Grant by Fonds Wetenschappelijk Onderzoek-Vlaanderen (FWO; 11M7725N). E.B was supported by the Natural Environment Research Council and the ARIES Doctoral Training programme, grant number NE/S007334/1.
JKS received funding support from Google.
GM acknowledges funding from the São Paulo Research Foundation (FAPESP) under grants 2025/07124-4 and 2025/28244-8.
PMF was supported by National Funds by FCT – Portuguese Foundation for Science and Technology, under projects UID/04033/2025: Centre for the Research and Technology of Agro-Environmental and Biological Sciences and LA/P/0126/2020 (https://doi.org/10.54499/LA/P/0126/2020).
EAK was funded by the State Assignment Project (grant no. FWES-2024-0040).
ECh and MAT have been funded by the European Space Agency (ESA) Climate Change Initiative (CCI) project FireCCI, contract number 4000126706/19/I-NB.
The contributions of YQ and SV were supported by the European Research Council (ERC) through a Consolidator grant under the European Union’s Horizon 2020 research and innovation programme (grant no. 101000987), awarded to SV.
EDT and MP are part of the Copernicus Atmosphere Monitoring Service, which is operated by the European Centre for Medium-Range Weather Forecasts (ECMWF) on behalf of the European Commission as part of the Copernicus Programme.
IAR was funded through the AXA Research Fund (project “AXA Chair in Wildfires and Climate”, CPO00163217) and of the Leverhulme Trust (grant no. RC-2018-023) through the Leverhulme Centre for Wildfires, Environment and Society.
MS was supported by US NSF grant no. 2521103.
TRK received support from the Bezos Earth Fund.
HC was funded by the Australian Research Council via an Industry Fellowship (IM240100046).
SM was supported by the Swiss National Science Foundation, grant number PZ001_232901.
DIK and ZL were funded by the UK Natural Environment Research Council (NERC) as part of the LTSM2 TerraFIRMA project. MLFB was funded by NC-International programme (grant no. NE/X006247/1) delivering National Capability.
CSG was funded by the UK Natural Environment Research Council (grant no. UKRI2668).
This paper was edited by Hanqin Tian and reviewed by two anonymous referees.
Abatzoglou, J. T., Rupp, D. E., O'Neill, L. W., and Sadegh, M.: Compound Extremes Drive the Western Oregon Wildfires of September 2020, Geophys. Res. Lett., 48, e2021GL092520, https://doi.org/10.1029/2021GL092520, 2021.
Abatzoglou, J. T., Kolden, C. A., Cullen, A. C., Sadegh, M., Williams, E. L., Turco, M., and Jones, M. W.: Climate change has increased the odds of extreme regional forest fire years globally, Nat. Commun., 16, 6390, https://doi.org/10.1038/s41467-025-61608-1, 2025.
Agência para a Gestão Integrada de Fogos Rurais: Relatório de Atividades do Sistema de Gestão Integrada de Fogos Rurais, Portugal, https://www.agif.pt/pt/relatorios-anuais (last access: 22 July 2026), 2026.
Andela, N. and Jones, M. W.: Update of: The Global Fire Atlas of individual fire size, duration, speed and direction, Zenodo [data set], https://doi.org/10.5281/zenodo.17669692, 2026.
Andela, N., Jones, M. W., and van Wees, D.: State of Wildfires 2025–2026: Forest Carbon Project Exposure to Fire, Zenodo [data set], https://doi.org/10.5281/zenodo.21430353, 2026.
Andela, N., Morton, D. C., Giglio, L., Chen, Y., van der Werf, G. R., Kasibhatla, P. S., DeFries, R. S., Collatz, G. J., Hantson, S., Kloster, S., Bachelet, D., Forrest, M., Lasslop, G., Li, F., Mangeon, S., Melton, J. R., Yue, C., and Randerson, J. T.: A human-driven decline in global burned area, Science, 356, 1356–1362, https://doi.org/10.1126/science.aal4108, 2017.
Andela, N., Morton, D. C., Giglio, L., Paugam, R., Chen, Y., Hantson, S., van der Werf, G. R., and Randerson, J. T.: The Global Fire Atlas of individual fire size, duration, speed and direction, Earth Syst. Sci. Data, 11, 529–552, https://doi.org/10.5194/essd-11-529-2019, 2019.
Anderson, L. O., Di Bella, C. M., Selaya, G., Bilbao, B. A., de la Barrera, F., Segura-Garcia, C., and Silva-Junior, C. H. L.: State of Wildfires in South America 2025–2026, SSRN [preprint], https://doi.org/10.2139/ssrn.7037658, 2026.
ArcGIS Hub: World Continents, ArcGIS Hub, [data set], https://hub. arcgis.com/maps/CESJ::world-continents (last access: 22 July 2026), 2024.
Aznar-Siguan, G. and Bresch, D. N.: CLIMADA v1: a global weather and climate risk assessment platform, Geosci. Model Dev., 12, 3085–3097, https://doi.org/10.5194/gmd-12-3085-2019, 2019.
Baltzer, J. L., Day, N. J., Walker, X. J., Greene, D., Mack, M. C., Alexander, H. D., Arseneault, D., Barnes, J., Bergeron, Y., Boucher, Y., Bourgeau-Chavez, L., Brown, C. D., Carrière, S., Howard, B. K., Gauthier, S., Parisien, M.-A., Reid, K. A., Rogers, B. M., Roland, C., Sirois, L., Stehn, S., Thompson, D. K., Turetsky, M. R., Veraverbeke, S., Whitman, E., Yang, J., and Johnstone, J. F.: Increasing fire and the decline of fire adapted black spruce in the boreal forest, P. Natl. Acad. Sci. USA, 118, e2024872118, https://doi.org/10.1073/pnas.2024872118, 2021.
Barbosa, M. L. F., Kelley, D. I., Burton, C. A., Ferreira, I. J. M., da Veiga, R. M., Bradley, A., Molin, P. G., and Anderson, L. O.: FLAME 1.0: a novel approach for modelling burned area in the Brazilian biomes using the maximum entropy concept, Geosci. Model Dev., 18, 3533–3557, https://doi.org/10.5194/gmd-18-3533-2025, 2025.
Barnes, C., Keeping, T., Rivera, J. A., Pessacg, N. L., Garreaud, R., Zachariah, M., Clarke, B., Corradi, M. R., Kadhasanoglu, A., Mejía, A., Santos-Vega, M., Vahlberg, M., Ganguly, S., Bazo, J., and Otto, F.: Climate change fuels the destruction of world's oldest trees, https://doi.org/10.25560/127727, 2026.
Bayar, A. S., Pinto, J. G., Gouveia, C. M., and Ramos, A. M.: Strong intensification of extreme fire weather in Europe under 3 °C compared to 2 °C global warming, Earth Syst. Dynam., 17, 929–954, https://doi.org/10.5194/esd-17-929-2026, 2026.
Bilbao, B. A., Ferrero, B. G., Falleiro, R. M., Moura, L. C., and Fagundes, G. M.: Traditional Fire Uses by Indigenous Peoples and Local Communities in South America, in: Fire in the South American Ecosystems, edited by: Fidelis, A. and Pivello, V. R., Springer Nature Switzerland, Cham, 39–81, https://doi.org/10.1007/978-3-031-89372-8_3, 2025.
Binte Shahid, S., Lacey, F. G., Wiedinmyer, C., Yokelson, R. J., and Barsanti, K. C.: NEIVAv1.0: Next-generation Emissions InVentory expansion of Akagi et al. (2011) version 1.0, Geosci. Model Dev., 17, 7679–7711, https://doi.org/10.5194/gmd-17-7679-2024, 2024.
Boschetti, L. and Roy, D. P.: Defining a fire year for reporting and analysis of global interannual fire variability, J. Geophys. Res.-Biogeo., 113, G03020, https://doi.org/10.1029/2008JG000686, 2008.
Bowman, D. M. J. S., Balch, J. K., Artaxo, P., Bond, W. J., Carlson, J. M., Cochrane, M. A., D'Antonio, C. M., DeFries, R. S., Doyle, J. C., Harrison, S. P., Johnston, F. H., Keeley, J. E., Krawchuk, M. A., Kull, C. A., Marston, J. B., Moritz, M. A., Prentice, I. C., Roos, C. I., Scott, A. C., Swetnam, T. W., van der Werf, G. R., and Pyne, S. J.: Fire in the Earth System, Science, 324, 481–484, https://doi.org/10.1126/science.1163886, 2009.
Bowman, D. M. J. S., Kolden, C. A., Abatzoglou, J. T., Johnston, F. H., van der Werf, G. R., and Flannigan, M.: Vegetation fires in the Anthropocene, Nat. Rev. Earth Environ., 1, 500–515, https://doi.org/10.1038/s43017-020-0085-3, 2020.
Brando, P. M., Barlow, J., Macedo, M. N., Silvério, D. V., Ferreira, J. N., Maracahipes, L., Anderson, L., Morton, D. C., Alencar, A., Paolucci, L. N., Jacobs, S., Stouter, H., Randerson, J., Flores, B. M., Starinchak, B., Coe, M., Pires, M. M., Rattis, L., Armenteras, D., Artaxo, P., Ordway, E. M., Trumbore, S., Staver, C., Berenguer, E., Menor, I. O., Maracahipes-Santos, L., Potter, N., Spracklen, D. V., and Uribe, M.: Tipping Points of Amazonian Forests: Beyond Myths and Toward Solutions, Annu. Rev. Environ. Res., 50, 97–131, https://doi.org/10.1146/annurev-environ-111522-112804, 2025.
Burton, C., Lampe, S., Kelley, D. I., Thiery, W., Hantson, S., Christidis, N., Gudmundsson, L., Forrest, M., Burke, E., Chang, J., Huang, H., Ito, A., Kou-Giesbrecht, S., Lasslop, G., Li, W., Nieradzik, L., Li, F., Chen, Y., Randerson, J., Reyer, C. P. O., and Mengel, M.: Global burned area increasingly explained by climate change, Nat. Clim. Change, 14, 1186–1192, https://doi.org/10.1038/s41558-024-02140-w, 2024a.
Burton, C., Kelley, D. I., Burke, E., Mathison, C., Jones, C. D., Betts, R. A., Robertson, E., Teixeira, J. C. M., Cardoso, M., and Anderson, L. O.: Fire weakens land carbon sinks before 1.5 °C, Nat. Geosci., 17, 1108–1114, https://doi.org/10.1038/s41561-024-01554-7, 2024b.
C3S/ECMWF and WMO: C3S-WMO European State of the Climate 2025, https://doi.org/10.24381/zy93-sb27, 2026.
Canadian Interagency Forest Fire Centre: National Fire Situation Report For: 30 September 2025, https://ciffc.net/situation/2025-09-30 (last access: 22 July 2026), 2025.
Centre for Research on the Epidemiology of Disasters: EM-DAT International Disaster Database, Centre for Research on the Epidemiology of Disasters, Centre for Research on the Epidemiology of Disasters [data set], https://www.emdat.be/ (last access: 13 October 2026), 2026.
Chen, Y., Morton, D. C., Andela, N., van der Werf, G. R., Giglio, L., and Randerson, J. T.: A pan-tropical cascade of fire driven by El Niño/Southern Oscillation, Nat. Clim. Change, 7, 906–911, https://doi.org/10.1038/s41558-017-0014-8, 2017.
Chen, Y., Hall, J., van Wees, D., Andela, N., Hantson, S., Giglio, L., van der Werf, G. R., Morton, D. C., and Randerson, J. T.: Multi-decadal trends and variability in burned area from the fifth version of the Global Fire Emissions Database (GFED5), Earth Syst. Sci. Data, 15, 5227–5259, https://doi.org/10.5194/essd-15-5227-2023, 2023.
Chen, Y., Field, R. D., Scholten, R. C., and Randerson, J. T.: Persistent 2023–2025 Wildfire Extremes in Canada Produced Unprecedented Emissions and Air-Quality Impacts, Glob. Change Biol., 32, e70891, https://doi.org/10.1111/gcb.70891, 2026a.
Chen, Y., van der Werf, G. R., Mu, M., van Wees, D., Hall, J. V., Giglio, L., Vernooij, R., Morton, D. C., Xu, L., Liu, T., Scholten, R. C., Coffield, S. R., Follette-Cook, M. B., Ott, L., and Randerson, J. T.: Tracking recent extremes and interannual variability of global fire emissions using a near-real-time extension to the Global Fire Emissions Database, Earth Syst. Sci. Data, 18, 7535–7555, https://doi.org/10.5194/essd-18-7535-2026, 2026b.
Chuvieco, E., Roteta, E., Sali, M., Stroppiana, D., Boettcher, M., Kirches, G., Storm, T., Khairoun, A., Pettinari, M. L., Franquesa, M., and Albergel, C.: Building a small fire database for Sub-Saharan Africa from Sentinel-2 high-resolution images, Sci. Total Environ., 845, 157139, https://doi.org/10.1016/j.scitotenv.2022.157139, 2022.
Ciais, P., Bastos, A., Chevallier, F., Lauerwald, R., Poulter, B., Canadell, J. G., Hugelius, G., Jackson, R. B., Jain, A., Jones, M., Kondo, M., Luijkx, I. T., Patra, P. K., Peters, W., Pongratz, J., Petrescu, A. M. R., Piao, S., Qiu, C., Von Randow, C., Regnier, P., Saunois, M., Scholes, R., Shvidenko, A., Tian, H., Yang, H., Wang, X., and Zheng, B.: Definitions and methods to estimate regional land carbon fluxes for the second phase of the REgional Carbon Cycle Assessment and Processes Project (RECCAP-2), Geosci. Model Dev., 15, 1289–1316, https://doi.org/10.5194/gmd-15-1289-2022, 2022.
Ciavarella, A., Christidis, N., Andrews, M., Groenendijk, M., Rostron, J., Elkington, M., Burke, C., Lott, F. C., and Stott, P. A.: Upgrade of the HadGEM3-A based attribution system to high resolution and a new validation framework for probabilistic event attribution, Weather Climate Extremes, 20, 9–32, https://doi.org/10.1016/j.wace.2018.03.003, 2018.
Comissão Técnica Independente: Comissão Técnica Independente para avaliação dos incêndios de agosto de 2025 em território de Portugal continental, https://www.parlamento.pt/Parlamento/Paginas/CTI.aspx (last access: 22 July 2026), 2026.
Copernicus: 2025 sees intense wildfire year in the Northern Hemisphere, https://atmosphere.copernicus.eu/2025-sees-intense-wildfire-year-northern-hemisphere (last access: 22 July 2026), 2025.
Copernicus Atmosphere Monitoring Service (CAMS): CAMS global biomass burning emissions based on fire radiative power (GFAS), C3S CDS [data set], https://doi.org/10.24381/a05253c7, 2022.
Copernicus Climate Change Service: ERA5-Land hourly data from 1950 to present, C3S CDS [data set], https://doi.org/10.24381/CDS.E2161BAC, 2019.
CTV News: “State of shock”: Dock burned in Sask. wildfires show ferocity of flames, https://www.ctvnews.ca/saskatoon/article/a-moccasin-is-not-just-a-slipper-sask-wildfire-destroys-historic-la-ronge-trading-post/ (last access: 22 July 2026), 2025.
Cunill Camprubí, À., Jones, M., and Resco de Dios, V.: State of Wildfires 2025–2026: Protected Areas Exposure to Fire, Zenodo [data set], https://doi.org/10.5281/zenodo.20764120, 2026.
Cunningham, C. X., Williamson, G. J., and Bowman, D. M. J. S.: Increasing frequency and intensity of the most extreme wildfires on Earth, Nat. Ecol. Evol., 1–6, https://doi.org/10.1038/s41559-024-02452-2, 2024.
Di Giuseppe, F. and Burton, C.: The Return of El Niño? What a Potential 2026 Event Could Mean for Wildfires Around the World, State of Wildfires Project, https://stateofwildfires.com/news/the-return-of-el-nino-what-a-potential-2026-event-could-mean-for-wildfires-around-the-world/ (last access: 22 July 2026), 2026.
DiMiceli, C., Carroll, M., Sohlberg, R., Kim, D.-H., Kelly, M., and Townshend, J.: MOD44B MODIS/Terra Vegetation Continuous Fields Yearly L3 Global 250m SIN Grid V006, NASA EOSDIS Land Processes Distributed Active Archive Center [data set], https://doi.org/10.5067/MODIS/MOD44B.006, 2015.
Dintwe, K., Elgamri A. I., M., Kouassi, J.-L., Amissah, L., Gilson, H., Muthiuru, A., N'Dri, B., Strydom, T., and Archibald, S.: State of Wildfires in Africa 2025–2026, SSRN [preprint], https://doi.org/10.2139/ssrn.7033898, 1 June 2026.
Dirección General de Protección Civil y Emergencias: Informe anual de incendios forestales 2025, Ministerio dfel Interior, Gobierno de España, Spain, https://www.forestales.net/contenidos/informe-anual-de-incendios-forestales-2025 (last access: 22 July 2026), 2026.
Di Tomaso, E., Parrington, M., Di Giuseppe, F., Hamilton, D., Jones, M. W., Razinger, M., and Russo, E.: State of Wildfires 2025–2026: Daily mean PM2.5 surface concentrations aggregated by Continent, Biome, Country, and Administrative Region, Zenodo [data set], https://doi.org/10.5281/zenodo.21277053, 2026.
Doxsey-Whitfield, E., MacManus, K., Adamo, S. B., Pistolesi, L., Squires, J., Borkovska, O., and Baptista, S. R.: Taking Advantage of the Improved Availability of Census Data: A First Look at the Gridded Population of the World, Version 4, Pap. Appl. Geogr., 1, 226–234, https://doi.org/10.1080/23754931.2015.1014272, 2015.
Driscoll, D. A., Macdonald, K. J., Gibson, R. K., Doherty, T. S., Nimmo, D. G., Nolan, R. H., Ritchie, E. G., Williamson, G. J., Heard, G. W., Tasker, E. M., Bilney, R., Porch, N., Collett, R. A., Crates, R. A., Hewitt, A. C., Pendall, E., Boer, M. M., Gates, J., Boulton, R. L., Mclean, C. M., Groffen, H., Maisey, A. C., Beranek, C. T., Ryan, S. A., Callen, A., Hamer, A. J., Stauber, A., Daly, G. J., Gould, J., Klop-Toker, K. L., Mahony, M. J., Kelly, O. W., Wallace, S. L., Stock, S. E., Weston, C. J., Volkova, L., Black, D., Gibb, H., Grubb, J. J., McGeoch, M. A., Murphy, N. P., Lee, J. S., Dickman, C. R., Neldner, V. J., Ngugi, M. R., Miritis, V., Köhler, F., Perri, M., Denham, A. J., Mackenzie, B. D. E., Reid, C. A. M., Rayment, J. T., Arriaga-Jiménez, A., Hewins, M. W., Hicks, A., Melbourne, B. A., Davies, K. F., Bitters, M. E., Linley, G. D., Greenville, A. C., Webb, J. K., Roberts, B., Letnic, M., Price, O. F., Walker, Z. C., Murray, B. R., Verhoeven, E. M., Thomsen, A. M., Keith, D., Lemmon, J. S., Ooi, M. K. J., Allen, V. L., Decker, O. T., Green, P. T., Moussalli, A., Foon, J. K., Bryant, D. B., Walker, K. L., Bruce, M. J., Madani, G., Tscharke, J. L., Wagner, B., Nitschke, C. R., Gosper, C. R., Yates, C. J., Dillon, R., Barrett, S., Spencer, E. E., Wardle, G. M., Newsome, T. M., Pulsford, S. A., Singh, A., Roff, A., Marsh, K. J., Mcdonald, K., Howell, L. G., Lane, M. R., Cristescu, R. H., Witt, R. R., Cook, E. J., Grant, F., Law, B. S., Seddon, J., Berris, K. K., Shofner, R. M., Barth, M., Welz, T., Foster, A., Hancock, D., Beitzel, M., Tan, L. X. L., Waddell, N. A., Fallow, P. M., Schweickle, L., Le Breton, T. D., Dunne, C., Green, M., Gilpin, A. -M., Cook, J. M., Power, S. A., Hogendoorn, K., Brawata, R., Jolly, C. J., Tozer, M., Reiter, N., and Phillips, R. D.: Biodiversity impacts of the 2019–2020 Australian megafires, Nature, 635, 898–905, https://doi.org/10.1038/s41586-024-08174-6, 2024.
Eberenz, S., Stocker, D., Röösli, T., and Bresch, D. N.: Asset exposure data for global physical risk assessment, Earth Syst. Sci. Data, 12, 817–833, https://doi.org/10.5194/essd-12-817-2020, 2020.
ECMWF: Observation and ERA5-Land derived 9 km global daily fire fuel characteristics since 2003, ECMWF Cross Data Store [data set], https://doi.org/10.24381/378D1497, 2025.
EU Eurostat: Countries – GISCO – Eurostat, https://ec.europa.eu/eurostat/web/gisco/geodata/administrative-units/countries (last access: 13 October 2026), 2020.
European Civil Protection and Humanitarian Operations (ECHO): Argentina – Wildfires, update (JRC GWIS, IFRC, media, Government of Chubut province) (ECHO Daily Flash of 13 January 2026), https://reliefweb.int/report/argentina/argentina-wildfires-update-jrc-gwis-ifrc-media-government-chubut-province-echo-daily-flash-13-january-2026 (last access: 22 July 2026), 2026.
European Forest Fire Information System: European Forest Fire Information System (EFFIS), https://forest-fire.emergency.copernicus.eu/ (last access: 22 July 2026), 2026.
Eyring, V., Bony, S., Meehl, G. A., Senior, C. A., Stevens, B., Stouffer, R. J., and Taylor, K. E.: Overview of the Coupled Model Intercomparison Project Phase 6 (CMIP6) experimental design and organization, Geosci. Model Dev., 9, 1937–1958, https://doi.org/10.5194/gmd-9-1937-2016, 2016.
FAO: Call to Action on Integrated Fire Management and Wildfire Resilience, GlobalFireManagement, https://www.fao.org/partnerships/fire-hub/about/call-to-action-on-integrated-fire-management-and-wildfire-resilience/en (last access: 13 October 2026), 2026a.
FAO (Food and Agriculture Organization of the United Nations): Global Fire Management Hub, GlobalFireManagement, https://www.fao.org/partnerships/fire-hub/en (last access: 22 July 2026), 2026b.
Fernandes, P. M., Santin, C., Ascoli, D., Doerr, S. H., Ruffault, J., Sjöström, J., and Xanthopoulos, G.: State of Wildfires in Europe 2025–2026, SSRN [preprint], https://doi.org/10.2139/ssrn.6976539, 16 June 2026.
Freeborn, P. H., Wooster, M. J., Roy, D. P., and Cochrane, M. A.: Quantification of MODIS fire radiative power (FRP) measurement uncertainty for use in satellite-based active fire characterization and biomass burning estimation, Geophys. Res. Lett., 41, 1988–1994, https://doi.org/10.1002/2013GL059086, 2014.
Frieler, K., Volkholz, J., Lange, S., Schewe, J., Mengel, M., del Rocío Rivas López, M., Otto, C., Reyer, C. P. O., Karger, D. N., Malle, J. T., Treu, S., Menz, C., Blanchard, J. L., Harrison, C. S., Petrik, C. M., Eddy, T. D., Ortega-Cisneros, K., Novaglio, C., Rousseau, Y., Watson, R. A., Stock, C., Liu, X., Heneghan, R., Tittensor, D., Maury, O., Büchner, M., Vogt, T., Wang, T., Sun, F., Sauer, I. J., Koch, J., Vanderkelen, I., Jägermeyr, J., Müller, C., Rabin, S., Klar, J., Vega del Valle, I. D., Lasslop, G., Chadburn, S., Burke, E., Gallego-Sala, A., Smith, N., Chang, J., Hantson, S., Burton, C., Gädeke, A., Li, F., Gosling, S. N., Müller Schmied, H., Hattermann, F., Wang, J., Yao, F., Hickler, T., Marcé, R., Pierson, D., Thiery, W., Mercado-Bettín, D., Ladwig, R., Ayala-Zamora, A. I., Forrest, M., and Bechtold, M.: Scenario setup and forcing data for impact model evaluation and impact attribution within the third round of the Inter-Sectoral Impact Model Intercomparison Project (ISIMIP3a), Geosci. Model Dev., 17, 1–51, https://doi.org/10.5194/gmd-17-1-2024, 2024.
Frieler, K., Lange, S., Schewe, J., Mengel, M., Treu, S., Otto, C., Volkholz, J., Reyer, C. P. O., Heinicke, S., Jones, C., Blanchard, J. L., Harrison, C. S., Petrik, C. M., Eddy, T. D., Ortega-Cisneros, K., Novaglio, C., Heneghan, R., Tittensor, D. P., Maury, O., Büchner, M., Vogt, T., Quesada-Chacón, D., Emanuel, K., Lee, C.-Y., Camargo, S. J., Hamester, L., Jägermeyr, J., Rabin, S., Klar, J., Vega del Valle, I. D., Novak, L., Sauer, I. J., Lasslop, G., Chadburn, S., Burke, E., Gallego-Sala, A., Smith, N., Chang, J., Hantson, S., Burton, C., Gädeke, A., Li, F., Gosling, S. N., Müller Schmied, H., Hattermann, F., Hickler, T., Marcé, R., Pierson, D., Thiery, W., Mercado-Bettín, D., Ladwig, R., Ayala, A. I., Forrest, M., Bechtold, M., Reinecke, R., de Graaf, I., Kaplan, J. O., Koch, A., Lengaigne, M., Kumar, R., and Strokal, M.: Scenario set-up and the new CMIP6-based climate-related forcings provided within the third round of the Inter-Sectoral Model Intercomparison Project (ISIMIP3b, group I and II), Geosci. Model Dev., 19, 4095–4135, https://doi.org/10.5194/gmd-19-4095-2026, 2026.
Gallo, C., Eden, J. M., Dieppois, B., Drobyshev, I., Fulé, P. Z., San-Miguel-Ayanz, J., and Blackett, M.: Evaluation of CMIP6 model performances in simulating fire weather spatiotemporal variability on global and regional scales, Geosci. Model Dev., 16, 3103–3122, https://doi.org/10.5194/gmd-16-3103-2023, 2023.
Gallo, C., Dieppois, B., Quilcaille, Y., Chiriacò, M. V., Fulé, P. Z., Drobyshev, I., San-Miguel-Ayanz, J., Blackett, M., and Eden, J. M.: Future Impacts of Climate Change on Global Fire Weather: Insight from Weighted CMIP6 Multimodel Ensembles, J. Climate, 38, 6445–6462, https://doi.org/10.1175/JCLI-D-24-0540.1, 2025.
Gauthier, E. and Bevacqua, E.: Human-induced climate change intensifies spatially compounding fire weather extremes across European countries, npj Nat. Hazards, 3, 39, https://doi.org/10.1038/s44304-026-00201-y, 2026.
Ghasemiazma, F., Tonini, M., Fiorucci, P., and Turco, M.: Megafires in Mediterranean Europe: the compound role of fire weather and drought, npj Nat. Hazards, 3, 33, https://doi.org/10.1038/s44304-026-00197-5, 2026.
Giglio, L.: VIIRS/NPP Burned Area Monthly L4 Global 500m SIN Grid V002, NASA Land Processes Distributed Active Archive Center [data set], https://doi.org/10.5067/VIIRS/VNP64A1.002, 2026.
Giglio, L., Randerson, J. T., and van der Werf, G. R.: Analysis of daily, monthly, and annual burned area using the fourth-generation global fire emissions database (GFED4), J. Geophys. Res.-Biogeo., 118, 317–328, https://doi.org/10.1002/jgrg.20042, 2013.
Giglio, L., Schroeder, W., and Justice, C. O.: The collection 6 MODIS active fire detection algorithm and fire products, Remote Sens. Environ., 178, 31–41, https://doi.org/10.1016/j.rse.2016.02.054, 2016.
Giglio, L., Boschetti, L., Roy, D. P., Humber, M. L., and Justice, C. O.: The Collection 6 MODIS burned area mapping algorithm and product, Remote Sens. Environ., 217, 72–85, https://doi.org/10.1016/j.rse.2018.08.005, 2018.
Giglio, L., Boschetti, L., Roy, D. P., Hall, J. V., Zubkova, M., Humber, M., Huang, H., and Oles, V.: The NASA VIIRS burned area product, global validation, and intercomparison with the NASA MODIS burned area product, Remote Sens. Environ., 331, 115006, https://doi.org/10.1016/j.rse.2025.115006, 2025.
Giglio, L., Justice, C., Boschetti, L., and Roy, D.: MODIS/Terra+Aqua Burned Area Monthly L3 Global 500m SIN Grid V061, NASA EOSDIS Land Processes Distributed Active Archive Center [data set], https://doi.org/10.5067/MODIS/MCD64A1.061, 2026.
Grau-Andrés, R., Moreira, B., and Pausas, J. G.: Global plant responses to intensified fire regimes, Global Ecolo. Biogeogr., 33, e13858, https://doi.org/10.1111/geb.13858, 2024.
Gu, Y., Fang, T., Yim, S. H.: Source emission contributions to particulate matter and ozone, and their health impacts in Southeast Asia, Environ. Int., 186, 108578, https://doi.org/10.1016/j.envint.2024.108578, 2024.
Haarsma, R. J., Roberts, M. J., Vidale, P. L., Senior, C. A., Bellucci, A., Bao, Q., Chang, P., Corti, S., Fučkar, N. S., Guemas, V., von Hardenberg, J., Hazeleger, W., Kodama, C., Koenigk, T., Leung, L. R., Lu, J., Luo, J.-J., Mao, J., Mizielinski, M. S., Mizuta, R., Nobre, P., Satoh, M., Scoccimarro, E., Semmler, T., Small, J., and von Storch, J.-S.: High Resolution Model Intercomparison Project (HighResMIP v1.0) for CMIP6, Geosci. Model Dev., 9, 4185–4208, https://doi.org/10.5194/gmd-9-4185-2016, 2016.
Haas, O:. Final data, Figshare [data set], https://doi.org/10.6084/m9.figshare.24764589, 2023a.
Haas, O.: Set up the models, Figshare [code], https://doi.org/10.6084/m9.figshare.24764583, 2023b.
Haas, O.: Run models, Figshare [code], https://doi.org/10.6084/m9.figshare.24764577, 2023c.
Haas, O.: Results scripts, Figshare [code], https://doi.org/10.6084/m9.figshare.24764571, 2023d.
Haas, O., Prentice, I. C., and Harrison, S. P.: Global environmental controls on wildfire burnt area, size, and intensity, Environ. Res. Lett., 17, 065004, https://doi.org/10.1088/1748-9326/ac6a69, 2022.
Haas, O., Prentice, I. C., and Harrison, S. P.: Wildfires on a changing planet, Nat. Commun., 17, 1599, https://doi.org/10.1038/s41467-025-68176-4, 2026.
Hantson, S., Andela, N., Goulden, M. L., and Randerson, J. T.: Human-ignited fires result in more extreme fire behavior and ecosystem impacts, Nat. Commun., 13, 2717, https://doi.org/10.1038/s41467-022-30030-2, 2022.
Hardesty, J., Myers, R., and Fulks, W.: Fire, Ecosystems, and People: A Preliminary Assessment of Fire as a Global Conservation Issue, The George Wright Forum, 22, 78–87, http://www.jstor.org/stable/43597968 (last access: 27 October 2026), 2005.
Hartley, A., Lott, F., Ciavarella, A., Burton, C., and Potts, B.: State of Wildfires 2025–2026: Present-Day Attribution using HadGEM3-A large ensemble, Zenodo [data set], https://doi.org/10.5281/zenodo.21379381, 2026.
Hersbach, H., Bell, B., Berrisford, P., Hirahara, S., Horányi, A., Muñoz-Sabater, J., Nicolas, J., Peubey, C., Radu, R., Schepers, D., Simmons, A., Soci, C., Abdalla, S., Abellan, X., Balsamo, G., Bechtold, P., Biavati, G., Bidlot, J., Bonavita, M., De Chiara, G., Dahlgren, P., Dee, D., Diamantakis, M., Dragani, R., Flemming, J., Forbes, R., Fuentes, M., Geer, A., Haimberger, L., Healy, S., Hogan, R. J., Hólm, E., Janisková, M., Keeley, S., Laloyaux, P., Lopez, P., Lupu, C., Radnoti, G., de Rosnay, P., Rozum, I., Vamborg, F., Villaume, S., and Thépaut, J.-N.: The ERA5 global reanalysis, Q. J. Roy. Meteor. Soc., 146, 1999–2049, https://doi.org/10.1002/qj.3803, 2020.
Insurance Bureau of Canada: August wildfire in Newfoundland and Labrador causes over $70 million in insured damage, https://www.ibc.ca/news-insights/news/august-wildfire-in-newfoundland-and-labrador-causes-over-70-million-in-insured-damage (last access: 22 July 2026), 2025.
Ito, A.: Disequilibrium of terrestrial ecosystem CO2 budget caused by disturbance-induced emissions and non-CO2 carbon export flows: a global model assessment, Earth Syst. Dynam., 10, 685–709, https://doi.org/10.5194/esd-10-685-2019, 2019.
Iturbide, M., Gutiérrez, J. M., Alves, L. M., Bedia, J., Cerezo-Mota, R., Cimadevilla, E., Cofiño, A. S., Di Luca, A., Faria, S. H., Gorodetskaya, I. V., Hauser, M., Herrera, S., Hennessy, K., Hewitt, H. T., Jones, R. G., Krakovska, S., Manzanas, R., Martínez-Castro, D., Narisma, G. T., Nurhati, I. S., Pinto, I., Seneviratne, S. I., van den Hurk, B., and Vera, C. S.: An update of IPCC climate reference regions for subcontinental analysis of climate model data: definition and aggregated datasets, Earth Syst. Sci. Data, 12, 2959–2970, https://doi.org/10.5194/essd-12-2959-2020, 2020.
Johnston, F. H., Williamson, G., Borchers-Arriagada, N., Henderson, S. B., and Bowman, D. M. J. S.: Climate Change, Landscape Fires, and Human Health: A Global Perspective, Annu. Rev. Publ. Health, 45, 295–314, https://doi.org/10.1146/annurev-publhealth-060222-034131, 2024.
Jones, M. W., Abatzoglou, J. T., Veraverbeke, S., Andela, N., Lasslop, G., Forkel, M., Smith, A. J. P., Burton, C., Betts, R. A., Werf, G. R. van der, Sitch, S., Canadell, J. G., Santín, C., Kolden, C., Doerr, S. H., and Quéré, C. L.: Global and Regional Trends and Drivers of Fire Under Climate Change, Rev. Geophys., 60, e2020RG000726, https://doi.org/10.1029/2020RG000726, 2022.
Jones, M. W., Veraverbeke, S., Andela, N., Doerr, S. H., Kolden, C., Mataveli, G., Pettinari, M. L., Le Quéré, C., Rosan, T. M., van der Werf, G. R., van Wees, D., and Abatzoglou, J. T.: Global rise in forest fire emissions linked to climate change in the extratropics, Science, 386, eadl5889, https://doi.org/10.1126/science.adl5889, 2024a.
Jones, M. W., Kelley, D. I., Burton, C. A., Di Giuseppe, F., Barbosa, M. L. F., Brambleby, E., Hartley, A. J., Lombardi, A., Mataveli, G., McNorton, J. R., Spuler, F. R., Wessel, J. B., Abatzoglou, J. T., Anderson, L. O., Andela, N., Archibald, S., Armenteras, D., Burke, E., Carmenta, R., Chuvieco, E., Clarke, H., Doerr, S. H., Fernandes, P. M., Giglio, L., Hamilton, D. S., Hantson, S., Harris, S., Jain, P., Kolden, C. A., Kurvits, T., Lampe, S., Meier, S., New, S., Parrington, M., Perron, M. M. G., Qu, Y., Ribeiro, N. S., Saharjo, B. H., San-Miguel-Ayanz, J., Shuman, J. K., Tanpipat, V., van der Werf, G. R., Veraverbeke, S., and Xanthopoulos, G.: State of Wildfires 2023–2024, Earth Syst. Sci. Data, 16, 3601–3685, https://doi.org/10.5194/essd-16-3601-2024, 2024b.
Jones, M. W., Andela, N., Brambleby, E., Chuvieco, E., Giglio, L., Kaiser, J. W., Parrington, M., Qu, Y., Torres-Vázquez, M. Á., van der Werf, G., and Veraverbeke, S.: State of Wildfires 2025–2026: Regional Summaries of Burned Area, Fire Emissions, and Individual Fire Characteristics for National, Administrative and Biogeographical Regions, Zenodo [data set], https://doi.org/10.5281/zenodo.21262381, 2026a.
Jones, M. W., Abatzoglou, J. T., Burton, C., Fernandes, P. M., Jain, P., Keeping, T., Tanpipat, V., and Kolden, C. A.: Wildfires in 2025, Nat. Rev. Earth. Environ., 7, 334–336, https://doi.org/10.1038/s43017-026-00793-z, 2026b.
Kaiser, J. W., Heil, A., Andreae, M. O., Benedetti, A., Chubarova, N., Jones, L., Morcrette, J.-J., Razinger, M., Schultz, M. G., Suttie, M., and van der Werf, G. R.: Biomass burning emissions estimated with a global fire assimilation system based on observed fire radiative power, Biogeosciences, 9, 527–554, https://doi.org/10.5194/bg-9-527-2012, 2012.
Kaplan, J. O., Bigelow, N. H., Prentice, I. C., Harrison, S. P., Bartlein, P. J., Christensen, T. R., Cramer, W., Matveyeva, N. V., McGuire, A. D., Murray, D. F., Razzhivin, V. Y., Smith, B., Walker, D. A., Anderson, P. M., Andreev, A. A., Brubaker, L. B., Edwards, M. E., and Lozhkin, A. V.: Climate change and Arctic ecosystems: 2. Modeling, paleodata-model comparisons, and future projections, J. Geophys. Res.-Atmos., 108, https://doi.org/10.1029/2002JD002559, 2003.
Keeping, T.: State of Wildfires 2025–2026: WWA Attribution and Future Projection of Focal Events Using FWI95, Zenodo [data set and code], https://doi.org/10.5281/zenodo.21374687, 2026.
Keeping, T., García, D. G., D. G., Trigo, R., Santos, F. L. M., Barnes, C., Vahlberg, M., Meyer, R., and Otto, F.: Extreme fire weather conditions in Spain and Portugal now common due to climate change, World Weather Attribution, https://www.worldweatherattribution.org/extreme-fire-weather-conditions-in-spain-and-portugal-now-common-due-to-climate-change/ (last access: 13 October 2026), 2025.
Keeping, T. R., Zachariah, M., Haas, O., Grillakis, M., Barnes, C., Clay, G. D., Ekberzade, B., Jaupaj, O., Ribeiro, A., Trigo, R., Voulgarakis, A., and Otto, F. E. L.: Attribution of the record breaking 2025 European fire season to climate change, Nat. Hazards Earth Syst. Sci., 26, 3761–3813, https://doi.org/10.5194/nhess-26-3761-2026, 2026.
Kelley, D., Ferreira Barbosa, M. L., Burton, C., Spuler, F., Wessel, J., Hartley, A., Ciavarella, A., Jones, M. W., Potts, B., Qu, Y., and Lott, F.: State of Wildfires 2025–2026: Midwestern Canadian Shield Forests Burned Area Attribution and Projections, Zenodo [data set], https://doi.org/10.5281/zenodo.23306277, 2026a.
Kelley, D., Ferreira Barbosa, M. L., Burton, C., Spuler, F., Wessel, J., Hartley, A., Ciavarella, A., Jones, M. W., Potts, B., Qu, Y., and Lott, F.: State of Wildfires 2025–2026: Northwest Iberia Burned Area Attribution and Projections, Zenodo [data set], https://doi.org/10.5281/zenodo.23306176, 2026b.
Kelley, D., Ferreira Barbosa, M. L., Burton, C., Spuler, F., Wessel, J., Hartley, A., Ciavarella, A., Jones, M. W., Potts, B., Qu, Y., and Lott, F.: State of Wildfires 2025–2026: Chilean Temperate Forests and Matorral Burned Area Attribution and Projections, Zenodo [data set], https://doi.org/10.5281/zenodo.23305946, 2026c.
Kelley, D., Ferreira Barbosa, M. L., Burton, C., Potts, B., Wessel, J., and Spuler, F.: State of Wildfires 2025–2026: ConFLAME, Zenodo [code], https://doi.org/10.5281/zenodo.11421746, 2026d.
Kelley, D. I., Bistinas, I., Whitley, R., Burton, C., Marthews, T. R., and Dong, N.: How contemporary bioclimatic and human controls change global fire regimes, Nat. Clim. Change, 9, 690–696, https://doi.org/10.1038/s41558-019-0540-7, 2019.
Kelley, D. I., Burton, C., Huntingford, C., Brown, M. A. J., Whitley, R., and Dong, N.: Technical note: Low meteorological influence found in 2019 Amazonia fires, Biogeosciences, 18, 787–804, https://doi.org/10.5194/bg-18-787-2021, 2021.
Kelley, D. I., Burton, C., Di Giuseppe, F., Jones, M. W., Barbosa, M. L. F., Brambleby, E., McNorton, J. R., Liu, Z., Bradley, A. S. I., Blackford, K., Burke, E., Ciavarella, A., Di Tomaso, E., Eden, J., Ferreira, I. J. M., Fiedler, L., Hartley, A. J., Keeping, T. R., Lampe, S., Lombardi, A., Mataveli, G., Qu, Y., Silva, P. S., Spuler, F. R., Steinmann, C. B., Torres-Vázquez, M. Á., Veiga, R., van Wees, D., Wessel, J. B., Wright, E., Bilbao, B., Bourbonnais, M., Gao, C., Di Bella, C. M., Dintwe, K., Donovan, V. M., Harris, S., Kukavskaya, E. A., N'Dri, A. B., Santín, C., Selaya, G., Sjöström, J., Abatzoglou, J. T., Andela, N., Carmenta, R., Chuvieco, E., Giglio, L., Hamilton, D. S., Hantson, S., Meier, S., Parrington, M., Sadegh, M., San-Miguel-Ayanz, J., Sedano, F., Turco, M., van der Werf, G. R., Veraverbeke, S., Anderson, L. O., Clarke, H., Fernandes, P. M., and Kolden, C. A.: State of Wildfires 2024–2025, Earth Syst. Sci. Data, 17, 5377–5488, https://doi.org/10.5194/essd-17-5377-2025, 2025.
Klein Goldewijk, K., Beusen, A., van Drecht, G., and de Vos, M.: The HYDE 3.1 spatially explicit database of human-induced global land-use change over the past 12,000 years, Global Ecol. Biogeogr., 20, 73–86, https://doi.org/10.1111/j.1466-8238.2010.00587.x, 2011.
Kolden, C. A., Donovan, V. M., Shuman, J., Jain, P., Abatzoglou, J. T., and Bourbonnais, M. L.: State of Wildfires in North America 2025–2026, SSRN [preprint], https://doi.org/10.2139/ssrn.7080898, 28 June 2026.
Kreider, M. R., Higuera, P. E., Parks, S. A., Rice, W. L., White, N., and Larson, A. J.: Fire suppression makes wildfires more severe and accentuates impacts of climate change and fuel accumulation, Nat. Commun., 15, 2412, https://doi.org/10.1038/s41467-024-46702-0, 2024.
Kukavskaya, E. A., Zheng, B., and Tanpipat, V.: State of Wildfires in Asia 2025–2026, SSRN [preprint], https://doi.org/10.2139/ssrn.7091518, 30 May 2026.
Lampe, S.: BuRNN: A Data-Driven Fire Model, Zenodo [data set], https://doi.org/10.5281/zenodo.17778519, 2025a.
Lampe, S.: VUB-HYDR/BuRNN: Version 1.1, Zenodo [data set and code], https://doi.org/10.5281/zenodo.17834206, 2025b.
Lampe, S., Gudmundsson, L., Kraft, B., Hantson, S., Kelley, D., Humphrey, V., Le Saux, B., Chuvieco, E., and Thiery, W.: BuRNN (v1.0): a data-driven fire model, Geosci. Model Dev., 19, 955–988, https://doi.org/10.5194/gmd-19-955-2026, 2026.
Lange, S.: Trend-preserving bias adjustment and statistical downscaling with ISIMIP3BASD (v1.0), Geosci. Model Dev., 12, 3055–3070, https://doi.org/10.5194/gmd-12-3055-2019, 2019.
Leedham, C., Allen, M., and Walsh, T.: Global Warming Index. Tracking progress to a safe climate, https://gwi-website.vercel.app/ (last access: 22 July 2026), 2026.
Libonati, R., Geirinhas, J. L., Silva, P. S., Russo, A., Rodrigues, J. A., Belém, L. B. C., Nogueira, J., Roque, F. O., DaCamara, C. C., Nunes, A. M. B., Marengo, J. A., and Trigo, R. M.: Assessing the role of compound drought and heatwave events on unprecedented 2020 wildfires in the Pantanal, Environ. Res. Lett., 17, 015005, https://doi.org/10.1088/1748-9326/ac462e, 2022.
Linley, G. D., Jolly, C. J., Doherty, T. S., Geary, W. L., Armenteras, D., Belcher, C. M., Bliege Bird, R., Duane, A., Fletcher, M.-S., Giorgis, M. A., Haslem, A., Jones, G. M., Kelly, L. T., Lee, C. K. F., Nolan, R. H., Parr, C. L., Pausas, J. G., Price, J. N., Regos, A., Ritchie, E. G., Ruffault, J., Williamson, G. J., Wu, Q., and Nimmo, D. G.: What do you mean, “megafire”?, Global Ecol. Biogeogr., 31, 1906–1922, https://doi.org/10.1111/geb.13499, 2022.
Linley, G. D., Jolly, C. J., Doherty, T. S., Geary, W. L., Armenteras, D., Belcher, C. M., Bliege Bird, R., Duane, A., Fletcher, M.-S., Giorgis, M. A., Haslem, A., Jones, G. M., Kelly, L. T., Lee, C. K. F., Nolan, R. H., Parr, C. L., Pausas, J. G., Price, J. N., Regos, A., Ritchie, E. G., Ruffault, J., Williamson, G. J., Wu, Q., and Nimmo, D. G.: “Megafire” – You May Not Like It, But You Cannot Avoid It, Global Ecol. Biogeogr., 34, e70032, https://doi.org/10.1111/geb.70032, 2025.
Liu, R., Zhang, X., Wang, W., Wang, Y., Liu, H., Ma, M., and Tang, G.: Global-scale ERA5 product precipitation and temperature evaluation, Ecol. Indic., 166, 112481, https://doi.org/10.1016/j.ecolind.2024.112481, 2024.
Liu, Z. and Eden, J.: State of Wildfires 2025–2026: Present-Day Attribution and Future Projections of Focal Events Using FWI7X, Zenodo [data set, code], https://doi.org/10.5281/zenodo.20827512, 2026.
Liu, Z., Eden, J. M., Dieppois, B., Drobyshev, I., Krikken, F., and Blackett, M.: Global assessment of historical changes in extreme fire weather: Insight from CMIP6 ensembles and implications for probabilistic attribution to global warming, Global Planet. Change, 252, 104822, https://doi.org/10.1016/j.gloplacha.2025.104822, 2025.
Lizundia-Loiola, J., Otón, G., Ramo, R., and Chuvieco, E.: A spatio-temporal active-fire clustering approach for global burned area mapping at 250 m from MODIS data, Remote Sens. Environ., 236, 111493, https://doi.org/10.1016/j.rse.2019.111493, 2020.
Lizundia-Loiola, J., Franquesa, M., Khairoun, A., and Chuvieco, E.: Global burned area mapping from Sentinel-3 Synergy and VIIRS active fires, Remote Sens. Environ., 282, 113298, https://doi.org/10.1016/j.rse.2022.113298, 2022.
Lundberg, S. M. and Lee, S.-I.: A Unified Approach to Interpreting Model Predictions, ArXiv [preprint], https://doi.org/10.48550/arXiv.1705.07874, 2017.
Maclean, K., Hankins, D. L., Christianson, A. C., Oliveras, I., Bilbao, B. A., Costello, O., Langer, E. R., and Robinson, C. J.: Revitalising Indigenous cultural fire practice: benefits and partnerships, Trends Ecol. Evol., 38, 899–902, https://doi.org/10.1016/j.tree.2023.07.001, 2023.
Mastrandrea, M. D., Field, C. B., Stocker, T. F., Edenhofer, O., Ebi, K. L., Frame, D. J., Held, H., Kriegler, E., Mach, K. J., Matschoss, P. R., Plattner, G.-K., Yohe, G. W., and Zwiers, F. W.: Guidance note for lead authors of the IPCC fifth assessment report on consistent treatment of uncertainties, Intergovernmental Panel on Climate Change (IPCC), https://www.ipcc.ch/ (last access: 22 July 2026), 2010.
Mathison, C., Burke, E., Hartley, A. J., Kelley, D. I., Burton, C., Robertson, E., Gedney, N., Williams, K., Wiltshire, A., Ellis, R. J., Sellar, A. A., and Jones, C. D.: Description and evaluation of the JULES-ES set-up for ISIMIP2b, Geosci. Model Dev., 16, 4249–4264, https://doi.org/10.5194/gmd-16-4249-2023, 2023.
McNorton, J., Barnard, C., and Di Giuseppe, F.: AI-Probability-of-Fire: Probability of Fire (PoF) Jupyter Book (v1), Zenodo [code], https://doi.org/10.5281/zenodo.23691112, 2026.
McNorton, J., Moreno, A., Turco, M., Keune, J., and Di Giuseppe, F.: Hydroclimatic Rebound Drives Extreme Fire in California's Non-Forested Ecosystems, Glob. Change Biol., 31, e70481, https://doi.org/10.1111/gcb.70481, 2025.
McNorton, J. R. and Di Giuseppe, F.: A global fuel characteristic model and dataset for wildfire prediction, Biogeosciences, 21, 279–300, https://doi.org/10.5194/bg-21-279-2024, 2024.
McNorton, J. R., Di Giuseppe, F., Pinnington, E., Chantry, M., and Barnard, C.: A Global Probability-Of-Fire (PoF) Forecast, Geophys. Res. Lett., 51, e2023GL107929, https://doi.org/10.1029/2023GL107929, 2024.
Met Office: Dataset Collection Record: EUCLEIA: European Climate and weather Events: Interpretation and Attribution, CEDA [data set], https://catalogue.ceda.ac.uk/uuid/99b29b4bfeae470599fb96243e90cde3/ (last access: 22 July 2026), 2016.
Muñoz-Sabater, J., Dutra, E., Agustí-Panareda, A., Albergel, C., Arduini, G., Balsamo, G., Boussetta, S., Choulga, M., Harrigan, S., Hersbach, H., Martens, B., Miralles, D. G., Piles, M., Rodríguez-Fernández, N. J., Zsoter, E., Buontempo, C., and Thépaut, J.-N.: ERA5-Land: a state-of-the-art global reanalysis dataset for land applications, Earth Syst. Sci. Data, 13, 4349–4383, https://doi.org/10.5194/essd-13-4349-2021, 2021.
NASA Earth Observatory: A Haze Over North America, https://science.nasa.gov/earth/earth-observatory/a-haze-over-north-america-154383/ (last access: 22 July 2026), 2025.
NASA FIRMS: Fire Information for Resource Management System. MODIS and VIIRS Fire Data, NASA FIRMS [data set], https://firms.modaps.eosdis.nasa.gov/map/ (last access: 22 July 2026), 2026.
North Australia and Rangelands Fire Information (NAFI) and Charles Darwin University: NAFI fire year summary report 2025 (1.1; NAFI), https://nafi-fire-report-2025.lkvl.net/ (last access:22 July 2026), 2026.
Olson, D. M., Dinerstein, E., Wikramanayake, E. D., Burgess, N. D., Powell, G. V. N., Underwood, E. C., D'amico, J. A., Itoua, I., Strand, H. E., Morrison, J. C., Loucks, C. J., Allnutt, T. F., Ricketts, T. H., Kura, Y., Lamoreux, J. F., Wettengel, W. W., Hedao, P., and Kassem, K. R.: Terrestrial Ecoregions of the World: A New Map of Life on Earth, BioScience, 51, 933, https://doi.org/10.1641/0006-3568(2001)051%5B0933:TEOTWA%5D2.0.CO;2, 2001.
Otto, F. E. L., Barnes, C., Philip, S., Kew, S., van Oldenborgh, G. J., and Vautard, R.: Formally combining different lines of evidence in extreme-event attribution, Adv. Stat. Clim. Meteorol. Oceanogr., 10, 159–171, https://doi.org/10.5194/ascmo-10-159-2024, 2024.
Overland, J. E., Chandra, V., and Wang, M.: Wildfires as Emerging Dominant Arctic and Subarctic Extremes, Climate, 14, 65, https://doi.org/10.3390/cli14030065, 2026.
Parrington, M., Whaley, C. H., French, N. H. F., Buchholz, R. R., Pan, X., Wiedinmyer, C., Hyer, E. J., Kondragunta, S., Kaiser, J. W., Di Tomaso, E., van der Werf, G. R., Sofiev, M., Barsanti, K. C., da Silva, A. M., Darmenov, A. S., Tang, W., Griffin, D., Desservettaz, M., Carter, T. (Tess), Paton-Walsh, C., Liu, T., Uppstu, A., and Palamarchuk, J.: Biomass burning emission estimation in the MODIS era: State-of-the-art and future directions, Elementa, 13, 00089, https://doi.org/10.1525/elementa.2024.00089, 2025.
Philip, S., Kew, S., van Oldenborgh, G. J., Otto, F., Vautard, R., van der Wiel, K., King, A., Lott, F., Arrighi, J., Singh, R., and van Aalst, M.: A protocol for probabilistic extreme event attribution analyses, Adv. Stat. Clim. Meteorol. Oceanogr., 6, 177–203, https://doi.org/10.5194/ascmo-6-177-2020, 2020.
Philip, S. Y., Kew, S. F., van Oldenborgh, G. J., Anslow, F. S., Seneviratne, S. I., Vautard, R., Coumou, D., Ebi, K. L., Arrighi, J., Singh, R., van Aalst, M., Pereira Marghidan, C., Wehner, M., Yang, W., Li, S., Schumacher, D. L., Hauser, M., Bonnet, R., Luu, L. N., Lehner, F., Gillett, N., Tradowsky, J. S., Vecchi, G. A., Rodell, C., Stull, R. B., Howard, R., and Otto, F. E. L.: Rapid attribution analysis of the extraordinary heat wave on the Pacific coast of the US and Canada in June 2021, Earth Syst. Dynam., 13, 1689–1713, https://doi.org/10.5194/esd-13-1689-2022, 2022.
PIB Delhi: India's Resolution on “Strengthening the Global Management of Wildfires” adopted at UNEA-7, in Nairobi, https://www.pib.gov.in/PressReleasePage.aspx?PRID=2203299®=3&lang=1 (last access: 22 July 2026), 2025.
Potts, B. and Burton, C.: State of Wildfires 2025-26 Attribution Pipeline For HadGEM3-A (Version V1.0.2), Zenodo [code], https://doi.org/10.5281/zenodo.23341498, 2026.
Prime Minister of Canada: Kananaskis Wildfire Charter, Prime Minister of Canada, https://www.pm.gc.ca/en/news/statements/2025/06/17/kananaskis-wildfire-chart (last access: 22 July 2026), 2025.
Province of Manitoba: 2025 Wildfire Interim After Action Review, https://news.gov.mb.ca/news/index.html?item=73482&posted=2026-04-21 (last access: 13 October 2026), 2026.
Public Safety Canada: Past Events, https://www.publicsafety.gc.ca/cnt/mrgnc-mngmnt/rspndng-mrgnc-vnts/gvrnmnt-prtns-cntr/pst-vnts-en.aspx (last access: 22 July 2026), 2025.
Quilcaille, Y., Batibeniz, F., Ribeiro, A. F. S., Padrón, R. S., and Seneviratne, S. I.: Fire weather index data under historical and shared socioeconomic pathway projections in the 6th phase of the Coupled Model Intercomparison Project from 1850 to 2100, Earth Syst. Sci. Data, 15, 2153–2177, https://doi.org/10.5194/essd-15-2153-2023, 2023.
Quintero, N., Viedma, O., and Moreno, J. M.: Protected and non-protected areas burned at a similar fire severity within the 2025 megafires in Spain, Fire Ecol., https://doi.org/10.1186/s42408-026-00512-5, 2026.
Ramos, A. M., Russo, A., DaCamara, C. C., Nunes, S., Sousa, P., Soares, P. M. M., Lima, M. M., Hurduc, A., and Trigo, R. M.: The compound event that triggered the destructive fires of October 2017 in Portugal, iScience, 26, 106141, https://doi.org/10.1016/j.isci.2023.106141, 2023.
Rantanen, M., Karpechko, A. Y., Lipponen, A., Nordling, K., Hyvärinen, O., Ruosteenoja, K., Vihma, T., and Laaksonen, A.: The Arctic has warmed nearly four times faster than the globe since 1979, Commun. Earth Environ., 3, 168, https://doi.org/10.1038/s43247-022-00498-3, 2022.
Rayner, N. A., Parker, D. E., Horton, E. B., Folland, C. K., Alexander, L. V., Rowell, D. P., Kent, E. C., and Kaplan, A.: Global analyses of sea surface temperature, sea ice, and night marine air temperature since the late nineteenth century, J. Geophys. Res.-Atmos., 108, https://doi.org/10.1029/2002JD002670, 2003.
Rémy, S., Veira, A., Paugam, R., Sofiev, M., Kaiser, J. W., Marenco, F., Burton, S. P., Benedetti, A., Engelen, R. J., Ferrare, R., and Hair, J. W.: Two global data sets of daily fire emission injection heights since 2003, Atmos. Chem. Phys., 17, 2921–2942, https://doi.org/10.5194/acp-17-2921-2017, 2017.
Resco de Dios, V., Cunill Camprubí, À., Campos-Arceiz, A., Clarke, H., He, Y., Zveushe, O. K., Domènech, R., Ying, H., and Yao, Y.: Protected Areas Show Substantial and Increasing Risk of Wildfire Globally, Fire, 8, 405, https://doi.org/10.3390/fire8100405, 2025.
Reynolds, V. A., Harris, S., Doherty, T. S., Fisher, R., Nolan, R. H., Peace, M., Pearce, H. G., Telfer, S., Yebra, M., and Clarke, H.: State of Wildfires in Oceania 2025–2026: contrasting fire regimes and emerging extremes, SSRN [preprint], https://doi.org/10.2139/ssrn.6999238, 25 June 2026.
Riahi, K., van Vuuren, D. P., Kriegler, E., Edmonds, J., O'Neill, B. C., Fujimori, S., Bauer, N., Calvin, K., Dellink, R., Fricko, O., Lutz, W., Popp, A., Cuaresma, J. C., Kc, S., Leimbach, M., Jiang, L., Kram, T., Rao, S., Emmerling, J., Ebi, K., Hasegawa, T., Havlik, P., Humpenöder, F., Da Silva, L. A., Smith, S., Stehfest, E., Bosetti, V., Eom, J., Gernaat, D., Masui, T., Rogelj, J., Strefler, J., Drouet, L., Krey, V., Luderer, G., Harmsen, M., Takahashi, K., Baumstark, L., Doelman, J. C., Kainuma, M., Klimont, Z., Marangoni, G., Lotze-Campen, H., Obersteiner, M., Tabeau, A., and Tavoni, M.: The Shared Socioeconomic Pathways and their energy, land use, and greenhouse gas emissions implications: An overview, Global Environ. Change, 42, 153–168, https://doi.org/10.1016/j.gloenvcha.2016.05.009, 2017.
Richardson, D., Black, A. S., Irving, D., Matear, R. J., Monselesan, D. P., Risbey, J. S., Squire, D. T., and Tozer, C. R.: Global increase in wildfire potential from compound fire weather and drought, npj Clim Atmos. Sci., 5, 23, https://doi.org/10.1038/s41612-022-00248-4, 2022.
Roos, C. I., Swetnam, T. W., Ferguson, T. J., Liebmann, M. J., Loehman, R. A., Welch, J. R., Margolis, E. Q., Guiterman, C. H., Hockaday, W. C., Aiuvalasit, M. J., Battillo, J., Farella, J., and Kiahtipes, C. A.: Native American fire management at an ancient wildland–urban interface in the Southwest United States, P. Natl. Acad. Sci. USA, 118, e2018733118, https://doi.org/10.1073/pnas.2018733118, 2021.
Roșu, I.-A., Mourgela, R., and Voulgarakis, A.: Data for “Large-scale modelled impacts of the 2025 Canadian wildfires” by Rosu et al., Zenodo [data set and code], https://doi.org/10.5281/zenodo.20523005, 2026a.
Roșu, I.-A., Mourgela, R.-N., and Voulgarakis, A.: Large-scale modelled impacts of the 2025 Canadian wildfires, SSRN [preprint], https://doi.org/10.2139/ssrn.6988718, 2026b.
Sánchez-Hernández, G., Turco, M., Repeto-Deudero, I., Royé, D., Baudena, M., Montávez, J. P., Pietroiusti, R., Provenzale, A., Santin, C., Torres-Vázquez, M. Á., and Pausas, J. G.: Record-Breaking 2025 European Wildfires Concentrated in Northwest Iberia, Glob. Change Biol., 31, e70649, https://doi.org/10.1111/gcb.70649, 2025.
Saskatchewan Public Safety Agency: Review of the 2025 Saskatchewan Wildfire Season, https://www.saskatchewan.ca/government/news-and-media/2026/june/12/province-announces-immediate-actions-in-response-to-independent-review-of-2025-wildfire-season (last access: 13 October 2026), 2026.
Schoenecker, J., Baur, M. J., Kohli, J., Baker, S., Jones, M., Veraverbeke, S., Konings, A. G., and Pellegrini, A. F. A.: Widespread peat carbon losses driven by the 2025 Scottish megafire, Nat. Geosci., 1–4, https://doi.org/10.1038/s41561-026-01994-3, 2026.
Scholten, R. C., Jandt, R., Miller, E. A., Rogers, B. M., and Veraverbeke, S.: Overwintering fires in boreal forests, Nature, 593, 399–404, https://doi.org/10.1038/s41586-021-03437-y, 2021.
Schumacher, D., Bauer, V., Pierini, L., Hauser, M., Gu, L., and Seneviratne, S.: Past atmospheric circulation changes prime regional heatwaves for future surprises, Research Square [preprint], https://doi.org/10.21203/rs.3.rs-9901987/v1, 3 June 2026.
Secretaría de Bosques de Chubut: Informe sobre ocurrencia de incendios forestales en Chubut, https://bosques.chubut.gov.ar/2025/11/06/ocurrencias-de-incendios-forestales-en-chubut/ (last access: 22 July 2026), 2025.
Sedano, F., Maianti, P., Boca, R., Suarez-Moreno, M., Broglia, M., Rigo, D. de, Roglia, E., Branco, A., San-Miguel-Ayanz, J., Durrant, T., Ferrari, D., Scionti, N., Nikonovas, T., Oom, D., and Artés Vivancos, T.: Advance report on forest fires in Europe, Middle East and North Africa 2025, Publications Office of the European Union, Luxembourg, https://doi.org/10.2760/3859043https://doi.org/10.2760/3859043, 2026.
Seneviratne, S. I. and Hauser, M.: Regional climate sensitivity of climate extremes in CMIP6 vs CMIP5 multi-model ensembles. Earth's Future, 8, e2019EF001474, https://doi.org/10.1029/2019EF001474, 2020.
Skakun, R., Castilla, G., and Jain, P.: Mapping wildfires in Canada with Landsat MSS to extend the National Burned Area Composite (NBAC) time series back to 1972, Int. J. Wildland Fire, 33, WF24138, https://doi.org/10.1071/WF24138, 2024.
Spuler, F. R., Wessel, J. B., Comyn-Platt, E., Varndell, J., and Cagnazzo, C.: ibicus: a new open-source Python package and comprehensive interface for statistical bias adjustment and evaluation in climate modelling (v1.0.1), Geosci. Model Dev., 17, 1249–1269, https://doi.org/10.5194/gmd-17-1249-2024, 2024.
State of Wildfires Project: State of Wildfires Project, https://stateofwildfires.com/ (last access: 22 July 2026), 2026.
Stehfest, E., Van Vuuren, D. P., Bouwman, L., and Kram, T.: Integrated assessment of global environmental change with IMAGE 3.0: Model description and policy applications., Netherlands Environmental Assessment Agency (PBL), The Hague, ISBN: 978-94-91506-71-0, https://www.pbl.nl/en/publications/integrated-assessment-of-global-environmental-change-with-image-30-model-description-and-policy-applications (last access: 13 October 2026), 2014.
Steinmann, C. B.: State-of-Wildfires_CLIMADA, Zenodo [code], https://doi.org/10.5281/zenodo.21393395, 2026.
Steinmann, C. B., Juhel, S., and Jones, M.: State of Wildfires 2025–2026: Physical Asset Exposure to Wildfire, Zenodo [data set], https://doi.org/10.5281/zenodo.21332621, 2026.
Stocker, B. D., Wang, H., Smith, N. G., Harrison, S. P., Keenan, T. F., Sandoval, D., Davis, T., and Prentice, I. C.: P-model v1.0: an optimality-based light use efficiency model for simulating ecosystem gross primary production, Geosci. Model Dev., 13, 1545–1581, https://doi.org/10.5194/gmd-13-1545-2020, 2020.
Sulla-Menashe, D., Gray, J. M., Abercrombie, S. P., and Friedl, M. A.: Hierarchical mapping of annual global land cover 2001 to present: The MODIS Collection 6 Land Cover product, Remote Sens. Environ., 222, 183–194, https://doi.org/10.1016/j.rse.2018.12.013, 2019.
Taylor, I., Kelley, D. I., Mathison, C., Bett-Williams, K. E., Hartley, A. J., Betts, R. A., Burton, C., and Barbosa, M. L. F.: Future fire weather projections show the importance of mitigation and adaptation for dynamic fire management, Nat. Hazards Earth Syst. Sci., 26, 4257–4289, https://doi.org/10.5194/nhess-26-4257-2026, 2026.
Tedim, F. and Leone, V.: The Dilemma of Wildfire Definition: What It Reveals and What It Implies, Front. For. Glob. Change, 3, https://doi.org/10.3389/ffgc.2020.553116, 2020.
Teymoor Seydi, S., Abatzoglou, J. T., Jones, M. W., Kolden, C. A., Filippelli, G., Hurteau, M. D., AghaKouchak, A., Luce, C. H., Miao, C., and Sadegh, M.: Increasing global human exposure to wildland fires despite declining burned area, Science, 389, 826–829, https://doi.org/10.1126/science.adu6408, 2025.
Teymoor Seydi, S., Sadegh, M., and Jones, M.: State of Wildfires 2025–2026: Population Exposure to Wildfire, Zenodo [data set], https://doi.org/10.5281/zenodo.20787866, 2026.
The Insurer: CatIQ: Insurers facing C$300 million hit from early summer Canada wildfires, https://www.theinsurer.com/ti/news/catiq-insurers-facing-c300-million-hit-from-early-summer-canada-wildfires-2025-09-08/ (last access: 22 July 2026), 2025.
The Narwhal: Counting up receipts: one of Canada's worst wildfire seasons cost at least $500M, https://thenarwhal.ca/manitoba-wildfire-costs/ (last access: 22 July 2026), 2026.
Thomson, D. R., Leasure, D. R., Bird, T., Tzavidis, N., and Tatem, A. J.: How accurate are WorldPop-Global-Unconstrained gridded population data at the cell-level?: A simulation analysis in urban Namibia, PLoS ONE, 17, e0271504, https://doi.org/10.1371/journal.pone.0271504, 2022.
Torres-Vázquez, M. Á., Di Giuseppe, F., Moreno-Torreira, A., Gincheva, A., Jerez, S., and Turco, M.: Large increase in extreme fire weather synchronicity over Europe, Environ. Res. Lett., 20, 024045, https://doi.org/10.1088/1748-9326/ada8c2, 2025.
Torres-Vázquez, M. Á., Segura-Garcia, C., Turco, M., Khairoun, A., Pettinari, M. L., Solano-Romero, E., García, M., Oliva, P., Jones, M. W., and Chuvieco, E.: MRBA60: Long-term consistent global burned area dataset from Sentinel-3 and MODIS products, Sci. Data, https://doi.org/10.1038/s41597-026-07959-w, in review, 2026.
Turco, M., Jones, M., and Di Giuseppe, F.: State of Wildfires 2025–2026: Anomalies in Extreme Fire Weather Days by Continent, Biome, Country, and Administrative Region, Zenodo [data set], https://doi.org/10.5281/zenodo.20757872, 2026a.
Turco, M., Moreno, A., Garnés-Morales, G., Torres-Vázquez, M. Á., Di Giuseppe, F., Bedia, J., Herrera, S., Provenzale, A., and Abatzoglou, J. T.: The emerging human fingerprint on global extreme fire weather, Sci. Adv., 12, eadx9845, https://doi.org/10.1126/sciadv.adx9845, 2026b.
Tymstra, C. and Flannigan, M.: Canada's landscape fires spreading into uncharted territory, Environ. Res. Lett., 20, 111003, https://doi.org/10.1088/1748-9326/ae1495, 2025.
UC Davis: Global Administative Areas Database, GADM.org [data set], https://gadm.org/download_world.html (last access: 22 July 2026), 2022.
United Nations: Resolution adopted by the United Nations Environment Assembly on 12 December 2025, https://www.unep.org/environmentassembly/unea7 (last access: 22 July 2026), 2025.
van der Werf, G. R., Randerson, J. T., Giglio, L., Collatz, G. J., Kasibhatla, P. S., and Arellano Jr., A. F.: Interannual variability in global biomass burning emissions from 1997 to 2004, Atmos. Chem. Phys., 6, 3423–3441, https://doi.org/10.5194/acp-6-3423-2006, 2006.
van der Werf, G. R., Randerson, J. T., Giglio, L., van Leeuwen, T. T., Chen, Y., Rogers, B. M., Mu, M., van Marle, M. J. E., Morton, D. C., Collatz, G. J., Yokelson, R. J., and Kasibhatla, P. S.: Global fire emissions estimates during 1997–2016, Earth Syst. Sci. Data, 9, 697–720, https://doi.org/10.5194/essd-9-697-2017, 2017.
van der Werf, G. R., Randerson, J. T., van Wees, D., Chen, Y., Giglio, L., Hall, J., Vernooij, R., Mu, M., Binte Shahid, S., Barsanti, K. C., Yokelson, R., and Morton, D. C.: Landscape fire emissions from the 5th version of the Global Fire Emissions Database (GFED5), Sci. Data, 12, 1870, https://doi.org/10.1038/s41597-025-06127-w, 2025.
Van Vuuren, D. P., O'Neill, B. C., Tebaldi, C., Sanderson, B. M., Chini, L. P., Friedlingstein, P., Hasegawa, T., Riahi, K., Govindasamy, B., Bauer, N., Eyring, V., Fall, C. M. N., Frieler, K., Gidden, M. J., Gohar, L. K., Högner, A., Jones, A. D., Kikstra, J., King, A., Knutti, R., Kriegler, E., Lawrence, P., Lennard, C., Lowe, J., Mathison, C., Mehmood, S., Nicholls, Z., Prado, L. F., Zhang, Q., Rose, S. K., Ruane, A. C., Sandstad, M., Schleussner, C.-F., Seferian, R., Sillmann, J., Smith, C., Sörensson, A. A., Panickal, S., Tachiiri, K., Vaughan, N., Vishwanathan, S. S., Yokohata, T., Zecchetto, M., and Ziehn, T.: The Scenario Model Intercomparison Project for CMIP7 (ScenarioMIP-CMIP7), Geosci. Model Dev., 19, 2627–2656, https://doi.org/10.5194/gmd-19-2627-2026, 2026.
Vernooij, R., Eames, T., Russell-Smith, J., Yates, C., Beatty, R., Evans, J., Edwards, A., Ribeiro, N., Wooster, M., Strydom, T., Giongo, M. V., Borges, M. A., Menezes Costa, M., Barradas, A. C. S., van Wees, D., and Van der Werf, G. R.: Dynamic savanna burning emission factors based on satellite data using a machine learning approach, Earth Syst. Dynam., 14, 1039–1064, https://doi.org/10.5194/esd-14-1039-2023, 2023.
Wessel, J. and Spuler, F.: State of Wildfires 2025–2026: JULES-ES Bias Adjustment, Zenodo [data set], https://doi.org/10.5281/zenodo.21397548, 2026.
Wiedinmyer, C., Kimura, Y., McDonald-Buller, E. C., Emmons, L. K., Buchholz, R. R., Tang, W., Seto, K., Joseph, M. B., Barsanti, K. C., Carlton, A. G., and Yokelson, R.: The Fire Inventory from NCAR version 2.5: an updated global fire emissions model for climate and chemistry applications, Geosci. Model Dev., 16, 3873–3891, https://doi.org/10.5194/gmd-16-3873-2023, 2023.
Wooster, M. J., Roberts, G. J., Giglio, L., Roy, D. P., Freeborn, P. H., Boschetti, L., Justice, C., Ichoku, C., Schroeder, W., Davies, D., Smith, A. M. S., Setzer, A., Csiszar, I., Strydom, T., Frost, P., Zhang, T., Xu, W., de Jong, M. C., Johnston, J. M., Ellison, L., Vadrevu, K., Sparks, A. M., Nguyen, H., McCarty, J., Tanpipat, V., Schmidt, C., and San-Miguel-Ayanz, J.: Satellite remote sensing of active fires: History and current status, applications and future requirements, Remote Sens. of Environ., 267, 112694, https://doi.org/10.1016/j.rse.2021.112694, 2021.
World Bank: Wealth Accounting, World Bank [data set], https://datacatalog.worldbank.org/search/dataset/0042066 (last access: 22 July 2026), 2024.
World Health Organization: WHO: WHO global air quality guidelines: particulate matter (PM2.5 and PM10), ozone, nitrogen dioxide, sulfur dioxide and carbon monoxide, https://www.who.int/publications/i/item/9789240034228 (last access: 22 July 2026), 2021.
World Meteorological Organization: WMO: Prepare for El Niño, World Meteorological Organization, https://wmo.int/news/media-centre/wmo-prepare-el-nino, (last access: 22 July 2026), 2026.
Xu, R., Ye, T., Huang, W., Yue, X., Morawska, L., Abramson, M. J., Chen, G., Yu, P., Liu, Y., Yang, Z., Zhang, Y., Wu, Y., Yu, W., Wen, B., Zhang, Y., Hales, S., Lavigne, E., Saldiva, P. H. N., Coelho, M. S. Z. S., Matus, P., Roye, D., Klompmaker, J., Mistry, M., Breitner, S., Zeka, A., Raz, R., Tong, S., Johnston, F. H., Schwartz, J., Gasparrini, A., Guo, Y., and Li, S.: Global, regional, and national mortality burden attributable to air pollution from landscape fires: a health impact assessment study, Lancet, 404, 2447–2459, https://doi.org/10.1016/S0140-6736(24)02251-7, 2024.
Yin, C., Abatzoglou, J. T., Jones, M. W., Cullen, A. C., Sadegh, M., Wang, J., and Liu, Y.: Increasing synchronicity of global extreme fire weather, Sci. Adv., 12, eadx8813, https://doi.org/10.1126/sciadv.adx8813, 2026.
Zheng, B., Ciais, P., Chevallier, F., Chuvieco, E., Chen, Y., and Yang, H.: Increasing forest fire emissions despite the decline in global burned area, Sci. Adv., 7, eabh2646, https://doi.org/10.1126/sciadv.abh2646, 2021.
- Abstract
- Introduction
- Methods
- Extreme Wildfire Events and their Impacts in 2025–2026
- Focal Region 1: Midwestern Canadian Shield Forests
- Focal Region 2: Northwest Iberia
- Focal Region 3: Chilean Temperate Forests and Matorral
- Data availability
- Code availability
- Conclusions: Summary of the State of Wildfires in 2025–2026
- Author contributions
- Competing interests
- Disclaimer
- Acknowledgements
- Financial support
- Review statement
- References
- Supplement
- Abstract
- Introduction
- Methods
- Extreme Wildfire Events and their Impacts in 2025–2026
- Focal Region 1: Midwestern Canadian Shield Forests
- Focal Region 2: Northwest Iberia
- Focal Region 3: Chilean Temperate Forests and Matorral
- Data availability
- Code availability
- Conclusions: Summary of the State of Wildfires in 2025–2026
- Author contributions
- Competing interests
- Disclaimer
- Acknowledgements
- Financial support
- Review statement
- References
- Supplement