the Creative Commons Attribution 4.0 License.
the Creative Commons Attribution 4.0 License.
 | 03 Nov 2026
The Standardized Soil Moisture-Temperature Compound Index (SSTCI): daily scale global data set and event catalogue for compound dry-hot extremes (1961–2023)
Rukhshinda Aftab
Daniel Fiifi Tawia Hagan

Baoying Shan
Syed Husnain Shah
Zhou Chensi
Wei Xikun
Fareeha Siddique
Ali Hasan Jaffry
Emmanuel Yeboah
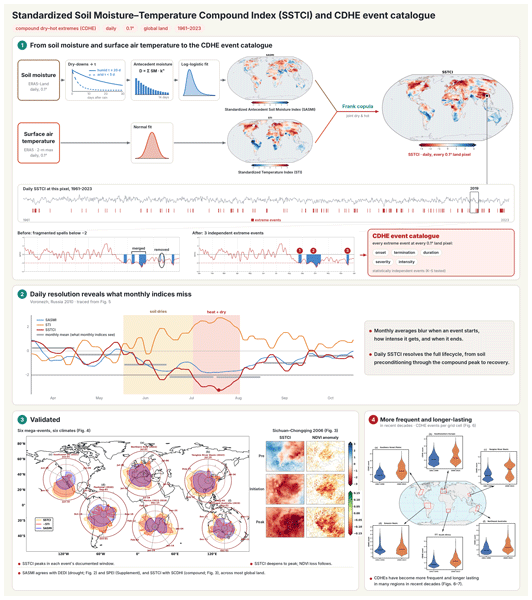
Compound dry-hot extremes (CDHEs) are among the most damaging climate hazards. Most metrics used to diagnose them are estimated at monthly or seasonal resolution or rely on precipitation-based drought proxies that can miss fast soil moisture-driven land–atmosphere feedbacks. This paper delivers two tightly linked products for global CDHE monitoring over land (excluding Antarctica) at 0.1° resolution for 1961–2023: (i) a continuous, daily severity index, i.e. the Standardized Soil Moisture–Temperature Compound Index (SSTCI), and (ii) a companion, event-based CDHE catalogue derived from SSTCI.
SSTCI is constructed by first quantifying grid specific soil moisture memory using dry-down events, fitting an exponential decay to estimate a characteristic dry-down timescale (τ). This memory is used to compute a Standardized Antecedent Soil Moisture Index (SASMI), which is paired with a daily Standardized Temperature Index (STI). SASMI and STI are then integrated using a Frank copula to represent their joint probability, which is transformed to a standardized normal variate to yield SSTCI, providing a spatially comparable daily measure of compound dry-hot stress.
To move from daily index values to physically interpretable hazards, we post-process the daily SSTCI series by discarding very short extreme spells and merging those separated by only brief interruptions, so that fragmented detections become single coherent events; the resulting catalogue carries event timing and magnitude descriptors suitable for event-based statistics. Our evaluation shows broad agreement between SASMI (SSTCI) and established drought (compound) metrics and vegetation stress. Moreover, SSTCI captures the timing and evolution of well documented CDHEs across multiple regions and timescales when applied to case studies. Together, the resulting SSTCI fields and event catalogue provide a consistent, daily scale foundation for global monitoring, process attribution of land–atmosphere feedback, and early-warning applications for compound dry-hot hazards. Data introduced in this paper are openly accessible from https://doi.org/10.5281/zenodo.18280747 (SSTCI) (Aftab et al., 2026c) and https://doi.org/10.5281/zenodo.20826759 (CDHE event catalogue) (Aftab et al., 2026b).
- Article
(12749 KB) - Full-text XML
-
Supplement
(2061 KB) - BibTeX
- EndNote


Climate extremes are increasingly disrupting societies and ecosystems, with anthropogenic warming driving more frequent and intense heatwaves and droughts across many regions (Seneviratne and Zhang, 2021). When these hazards co-occur, their combined impacts are disproportionately severe relative to either stressor alone (Miralles et al., 2014; Zscheischler et al., 2018). Historic cases clearly emphasize these escalating risks, including Europe's Mega-heatwave summers (2003, 2010), which led to excess mortality and agricultural losses (Barriopedro et al., 2011); and concurrent dry-hot (DH) conditions, which were linked to substantial crop impacts, including ∼ 20 % reductions in U.S. corn area affected by concurrent extremes and ∼ 25 % national production loss in Russia in 2010–2011 (Feng et al., 2019; Barriopedro et al., 2011). More recently, the prolonged compound dry-hot extreme (CDHE) event of 2022 in the Yangtze River basin led to widespread heatstroke, forest fires, and a reduction in lake size (Lu et al., 2023; Lu et al., 2024).
To better understand such extremes, a substantial body of work has developed diagnostic approaches spanning process based and statistical perspectives (Sabut and Mishra, 2026). Process oriented studies have characterized the soil moisture–temperature coupling that underlies compound dry-hot conditions (Miralles et al., 2012), showing how soil desiccation and atmospheric heat accumulation combine to produce mega-heatwaves (Miralles et al., 2012, 2014). In parallel, multivariate statistical approaches have been explored to quantify compound conditions directly. Among these, the copula function has proven particularly effective in capturing complex dependencies between climate variables, enabling the construction of joint distributions that integrate multiple indicators into bivariate or even multivariate indices (Hao et al., 2019a, b; Wu et al., 2020, 2021; Wang et al., 2023). Others have estimated compound events through the temporal overlap of separately standardized drought and heat series rather than by combining them into a single quantity (Shan et al., 2024).
In general, most of these compound indices are provided at monthly, seasonal or longer scales (Hao et al., 2018; Wu et al., 2021; Hosseinzadehtalaei et al., 2024). While these have been valuable for detecting broad long-term trends, such coarse temporal resolutions mask the rapid onset, intensification, and decay of shorter drought and compound events (Christian et al., 2024; Zhang et al., 2023a). This fundamentally limits accurate monitoring of flash droughts and hinders the rapid detection of compound events that can develop into severe conditions within days or weeks. Recent developments have addressed this limitation through sub-monthly formulations. For instance, compound dry-hot conditions have been characterized at sub-monthly scales using the Standardized Compound Dry-hot Index (SCDHI), which combines the Standardized Antecedent Precipitation Evapotranspiration Index (SAPEI) with the Standardized Temperature Index (STI) through a copula (Li et al., 2021); the Daily Compound Dry-hot Index (DCDHI), a daily-scale composite of precipitation, evapotranspiration and temperature anomalies (Wang et al., 2023); and a daily refined SCDHI (Zhou et al., 2025) that incorporates SAPEI (Jiang et al., 2022) with a CO2-aware modified Penman–Monteith formulation for potential evapotranspiration (Yang et al., 2019). These indices are typically limited in spatial scope (mostly are regionally computed), and their drought components are derived from precipitation-based proxies that infer moisture status from the atmospheric water balance rather than from soil moisture directly. Additionally, such proxies do not explicitly represent antecedent soil-moisture memory (McColl et al., 2017) or the regional heterogeneity of dry-down rates and can therefore misrepresent the soil moisture state that drives land–atmosphere coupling during compound events (Seneviratne et al., 2010).
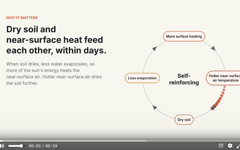
Soil moisture (SM) is recognized as fundamental in the water, energy and carbon cycles, modulating the surface energy balance (Osman et al., 2022; Seneviratne et al., 2010). When precipitation deficits deplete SM, reduced evapotranspiration causes a larger share of surface net radiation to be partitioned into sensible heat flux, thereby enhancing near-surface warming. (Tabari and Willems, 2023). This shift can accelerate the onset and increase the intensity of hot extremes (Seo and Ha, 2022). Furthermore, such land–atmosphere feedback can be critical even in regions that are typically humid. For example, analyses of the 2022 heatwave in the Yangtze River basin, China, showed that its exceptional severity was linked to a transition from an energy-limited to a water-limited coupling regime under extremely low soil moisture conditions (Ni et al., 2024). Focusing on this evolving land–atmosphere feedback is therefore essential for understanding the persistence and intensity of CDHEs. Soil moisture widely used and provide direct measures of surface moisture conditions, however many of the standardized drought indices adopted to compute compound indices remain precipitation driven, such as the Standardized Precipitation Index (Liu et al., 2024), the Standardized Precipitation–Evapotranspiration Index (Vicente-Serrano et al., 2010), the Palmer Drought Severity Index (Zhong et al., 2019), and the Standardized antecedent precipitation evaporation index (Li et al., 2020).This meteorological focus yields an indirect view that overlooks direct soil conditions and the vital antecedent SM memory (McColl et al., 2017), leading to an insufficient assessment of actual ecosystem water stress. Working directly with soil moisture is necessary but not sufficient, since the coupling is driven by accumulated antecedent depletion rather than by the moisture state on any single day. An instantaneous standardized soil moisture index describes a snapshot and omits the progressive dry-down through which soil moisture modulates temperature, and the timescale over which that depletion accumulates varies widely between fast drying semi-arid and slowly buffered humid environments (McColl et al., 2017; Rahmati et al., 2024). A soil moisture centric compound index therefore requires both a direct soil moisture state variable and a location specific representation of its memory along with temperature extremes. Consequently, a continuous, consistent global daily scale index is needed to capture the swift onset, intensification, and decay dynamics characteristic of CDHEs.
In this study, we present the Standardized Soil Moisture Temperature Compound Index (SSTCI), a global, daily (0.1° × 0.1°) dataset from 1961–2023. SSTCI integrates a standardized antecedent soil moisture index (SASMI), calculated with grid specific dry down memory of SM, and a daily standardized temperature index (STI) via a Frank copula, fitted per cell, through which the moisture and temperature signals are joined so that the dry-hot dependence carries the hydroclimatic character of each location. Thus, this continuous product provides a day to day evolution of land–atmosphere coupling. Furthermore, to facilitate immediate application for risk and impact assessment, we derived a comprehensive Global CDHE Event Catalogue from the daily SSTCI series. By applying a rigorous grid level iterative optimization technique adopted from Shan et al. (2024), in which removal and merging thresholds are searched independently at every land grid cell and retained only where the resulting events are statistically independent and belong to a genuinely extreme population, we transformed the continuous signal into a precise inventory of statistically independent, extreme events. The catalogue eliminates the computational burden of processing raw time series, providing users with exact start dates, end dates, durations, and severity metrics for every compound event detected globally over the last 63 years.
This paper offers a comprehensive overview of the datasets and methodologies employed, outlined in Sect. 2. Section 3 provides an in-depth analysis of the results, including the global event characteristics and case studies, coupled with a detailed discussion, and closes with limitations and outlook (Sect. 3.9). Section 4 delivers a concise conclusion, and the availability of the developed datasets is covered in Sect. 5
2.1 Data sources
This study utilizes global reanalysis datasets from the Copernicus Climate Data Store to calculate SSTCI. Volumetric soil water content in the uppermost soil layer (0–7 cm; variable swvl1) is taken from the ERA5-Land, land-surface reanalysis at 0.1° spatial resolution (Muñoz-Sabater et al., 2021). Given the lack of a long, spatially consistent in situ soil-moisture observing network at the global scale, we adopt ERA5-Land soil moisture for this analysis.
ERA5-Land provides multi-decadal, globally complete hourly fields and has been shown to realistically capture surface soil moisture variability and anomalies across a wide range of hydroclimatic regimes when evaluated against large in situ networks (Hagan et al., 2020; Beck et al., 2021). The 0–7 cm layer is used because SSTCI targets the daily-scale onset and evolution of compound dry-hot conditions, for which the near-surface layer is where land–atmosphere coupling is most directly expressed: it controls direct soil evaporation and is most tightly tied to the daytime surface energy balance that governs latent–sensible partitioning. It is also the layer routinely evaluated in global soil-moisture product inter-comparisons (Beck et al., 2021; Muñoz-Sabater et al., 2021), which supports comparability with the wider literature. Longer timescale moisture conditions are not lost through this choice, since the antecedent weighting in SASMI (Sect. 2.3) carries the accumulated moisture history into the index while the state variable itself retains the fast response needed to resolve sub-weekly transitions.
Temperature is obtained from ERA5 as the hourly maximum 2 m air temperature (mx2t), defined by ECMWF as the highest 2 m air temperature since the parameter was last archived, i.e. an hourly maximum rather than an instantaneous value. Because heat extremes and their impacts are governed by daytime peak temperature, a maximum-based variable is required (Perkins-Kirkpatrick and Lewis, 2020); ERA5-Land provides only the instantaneous 2 m temperature (2t), whereas ERA5 provides mx2t. We therefore source temperature from ERA5 at its native 0.25° resolution and bilinearly interpolate it to the 0.1° ERA5-Land grid, accepting the interpolation as the cost of using the physically appropriate variable. ERA5-Land provides continuous hourly land-surface fields from 1950 onward, and ERA5 provides hourly atmospheric variables from 1940 onward; here we used a 63-year subset spanning 1961–2023 and analyzed all global land grid cells (excluding Antarctica) at 0.1° resolution.
Daily values were derived as the mean of hourly data between 06:00 and 18:00 local time, computed after converting from UTC using longitude-based offsets. For temperature this yields a daytime-averaged maximum temperature representing sustained peak daytime heat rather than an instantaneous value. We subsequently used these processed daily values to calculate the indices. By focusing on daytime data, this study ensures that the data captures the time of day when the soil moisture-temperature coupling is strongest, providing a more accurate representation of conditions driving dry-hot events. Antarctica is excluded due to persistent snow/ice, and all ocean grid cells are masked.
We additionally used four independent datasets for evaluation. Vegetation response was characterized using the daily, gap-free NDVI product at 0.05° resolution (1981–2023) developed by Li et al. (2024) which applies valid observation screening and spatiotemporal sequence gap-filling to the National Oceanic and Atmospheric Administration (NOAA) daily NDVI record. For drought evaluation, we used the daily Standardized Precipitation–Evapotranspiration Index (SPEI; 1981–2021; Liu et al., 2024) and the daily Evapotranspiration Deficit Index (DEDI; 1979–2022; Zhang et al., 2023b).
To evaluate SSTCI against an established daily compound metric, we used the Standardized Compound Dry-hot Index (SCDHI; Zhou et al., 2025), which combines the precipitation-based SAPEI with STI through a copula. As published, SCDHI was developed regionally over China using NASA NEX-GDDP-CMIP6 downscaled meteorological data. Since no global compound dry-hot index was available for comparison, we reproduced the SCDHI methodology at the global scale following Zhou et al. (2025); this global SCDHI is an analysis product generated for the present evaluation rather than a pre-existing public dataset, and the period 1981–2013 is used for the consistency assessment with SSTCI. For analyses requiring direct inter-comparison among SPEI and DEDI, we restricted the evaluation to the common overlap period 2001–2021 to ensure temporal consistency.
2.2 Dry-down analysis and estimation of soil moisture dry down time (τ)
Grid-specific soil moisture memory is quantified from dry-down events, defined as periods of declining top-soil moisture following a recharge step. For each valid event, we fit an exponential decay to the observed decline,
where (SM0) is soil moisture at dry-down onset, SMwp is an effective local wilting point (taken as the grid-cell minimum over the analysis period), and (τ days) is the dry-down time estimated by least squares. The grid-level memory is represented by the median across all valid events from 1961 to 2023, with implausibly large values curtailed to ensure numerical stability. This ensures that each grid cell has a unique, physically meaningful representation of soil-moisture memory. In the drought computation below, (τ) is converted to a per-day decay factor via ().
2.3 SASMI
We compute the Standardized Antecedent Soil Moisture Index (SASMI) from daily top-layer soil moisture by assuming that recent antecedent conditions influence the present, with influence decaying exponentially in time. For each grid cell, the antecedent signal is
Where SMt−n is daily soil moisture n days prior, N=14 is the length of the antecedent window, and is the grid-specific decay constant (k) derived from the local dry-down timescale τgrid (Sect. 2.2). Contributions decay geometrically as 1, . So, effective weights differ by region: a fast draining semi-arid cell retains only a few days of memory, while a slowly buffered humid cell integrates over most of the window. Unlike SPI, SPEI and standardized soil moisture indices, which weight every day in the accumulation window equally, SASMI therefore weights antecedent days by each cell's own dry-down rate. The fourteen-day window balances responsiveness with the persistence typical of short-term droughts (Christian et al., 2024) and bounds the summation, while the decay constant determines the weighting within it.
Dt is an input feature rather than an anomaly at this stage. For each grid cell, a log-logistic distribution is fitted to the values of Dt for a specific calendar day of the year across all years of the record (1961–2023), in the same way that the normal distribution is fitted per calendar day for STI (Sect. 2.4). Dt is mapped to its percentile within that day-of-year reference distribution and transformed to a standard normal variate.
where FLL is the cumulative distribution function of the fitted log-logistic distribution and Φ−1 is the inverse standard normal (quantile) function. Negative (positive) SASMI values therefore denote drier (wetter) than normal conditions for that grid cell on that day of the year. Because the reference distribution is day of year specific, the seasonal cycle is already accounted for, and a dry extreme arises only when Dt is unusually low relative to other years on the same calendar day.
2.4 STI
The temperature for every day of the year was fitted to a normal distribution since it can be assumed that the temperature anomalies are normally distributed (Hansen et al., 2012). The STI is then determined by calculating and normalizing the cumulative probability. The following formula is used to determine the cumulative distribution probability (A) (Eq. 4):
Here, x represents the temperature series for a specific calendar day, μ and σ are the mean and standard deviation, respectively. Then the STI is calculated by standardizing A (Eq. 5). Positive STI values correspond to hotter than average conditions, whereas negative values indicate cooler conditions relative to the climatology.
2.5 SSTCI
To quantify the joint dependence between SASMI and STI, we employed the Frank copula following Aftab et al. (2026a). This choice is supported by the comparative analysis of Li et al. (2021), who demonstrated that the Frank family provides a superior fit for drought–temperature dependence compared to Clayton or Gumbel families. Crucially, the copula parameters were estimated independently for each grid cell, allowing the dependence structure to vary spatially and reflect local hydro-climatic conditions. The copula captures the dependence structure between the two variables and calculates the joint probability of experiencing concurrent DH conditions. The joint probability can be expressed as (Eq. 6).
Where X and Y denote SASMI and STI variables respectively, x and y are their threshold values, u=FX(x), v=FY(y), and C(u,v) is the fitted Frank copula. To make the cumulative joint probability (p) spatially comparable, it is transformed to a standard normal variate (Eq. 7).
where F is the cumulative distribution of p over the full record at each grid cell, and Φ−1 is the inverse standard normal (quantile) function. STCI provides a unified metric for identifying DH conditions: values near zero correspond to normal conditions, while increasingly negative SSTCI values indicate progressively more severe DH conditions. Following the categories of CDH conditions suggested by Wu et al. (2020), we define five classes of compound dry and hot conditions (Table S1 in the Supplement); this analysis concerns only the extreme class, so −2 is used as the pre-identified threshold for subsequent analysis (Sect. 2.6). That threshold defines only the tail retained in the event catalogue: SSTCI itself is continuous, and moderate compound anomalies remain fully represented in the daily field distributed with this dataset. Pooled over all land pixels and days, SSTCI is closely standard normal (mean 0.0, standard deviation 1.0, P(SSTCI < −2) =2.271 % ). Standardization constrains the exceedance rate over the full 1961–2023 record; it places no constraint on how those days are distributed in time within the record, nor on the number of coherent events they form, which is determined by the cell-wise removal–merging procedure described in Sect. 2.6. For details of the methodology, readers are referred to Aftab et al. (2026a).
2.6 Global Event Identification: The Optimization Framework
To transition from continuous daily monitoring to a discrete event inventory, we applied a rigorous post-processing framework to the daily SSTCI time series. Traditional methods typically rely on fixed thresholds (e.g., Run Theory) to define events; however, this approach often yields numerous short, insignificant spells or artificially fragments single long-duration events into multiple dependent episodes. To address these limitations, we implemented the objective event-refinement procedure proposed by Shan et al. (2024), applied individually to every grid cell (0.1°) globally. To our knowledge this procedure has not previously been applied to a compound dry-hot index. Shan et al. (2024) developed it for separately identified drought and heatwave series, whereas here it operates on the joint compound signal, so that the independence and extreme-value tests are applied to the compound quantity itself rather than to its marginals. The identification process begins with pre-identification, where potential CDH spells are flagged when daily SSTCI values drop below a fixed threshold of −2, targeting only extreme compound conditions. For each pre-identified sequence, two key metrics are calculated: duration, representing the length of the spell, and proximity, which quantifies the gap between neighboring spells. Proximity is defined as the total compound deficiency: the integrated area between the SSTCI curve and the threshold, accumulated during the non-extreme interval separating two spells. A smaller proximity value indicates that two spells are physically close and likely part of the same underlying event. We then employed a systematic optimization loop to determine the removal and merging thresholds. These are not global settings: the threshold search is carried out independently at every land grid cell, so that each pixel receives its own calibrated pair of criteria reflecting its local event structure. The algorithm iterates through candidate threshold combinations to filter out minor spells and merge adjacent dependent spells.
For each candidate combination, the resulting set of events is subjected to two statistical hypothesis tests to ensure validity. First, a Kolmogorov–Smirnov (K–S) test verifies that the inter-arrival times of the events follow an Exponential distribution, confirming that the events occur according to a Poisson process and are statistically independent. Second, a K–S test verifies that the event severities follow a Generalized Extreme Value (GEV) distribution, confirming that the catalogue captures a truly extreme population. The final thresholds are selected as the combination that satisfies both statistical hypotheses while maximizing the number of retained events. (A schematic diagram of the method is provided in Fig. S1 in the Supplement). This optimization ensures that the resulting Global CDHE Event Catalogue contains only coherent, statistically independent, and physically significant events. Because both the threshold search and the two distributional tests are evaluated cell by cell, applying this procedure across the global land surface at 0.1° amounts to an iterative optimization with goodness-of-fit verification at several million grid cells over a 63-year daily record; its computational cost is one reason we provide the resulting catalogue as a ready to use dataset. For details of the cataloguing approach, readers are referred to Shan et al. (2024) and Aftab et al. (2026a).
3.1 Global soil moisture dry-down time
Figure 1 shows the global distribution of the median soil-moisture dry-down time constant (τ), calculated from daily near-surface soil moisture time series for 1961–2023. Here, τ represents the typical e-folding timescale (days) over which soil moisture decays following a wetting event, and therefore provides a spatially explicit measure of land-surface moisture memory that is widely used to characterize dry-down dynamics. Regions dominated by humid, energy-limited hydroclimates, most prominently the Amazon Basin, Central Africa, and maritime Southeast Asia, exhibit the largest τ values (approaching or exceeding ∼ 20 d in the mapped range), implying relatively persistent moisture anomalies consistent with strong storage and buffering by vegetation and soil properties. In contrast, arid and semi-arid regions, including the Sahara, the Middle East, and much of interior Australia, show very small τ values (often < 5 d), indicating rapid post rainfall depletion typical of water-limited environments. Temperate regions across North America, Europe, and East Asia display intermediate τ values (roughly 7–15 d), suggesting transitional behavior between rapid dry downs in drylands and persistent anomalies in humid ecosystems.
The spatial structure of τ in Fig. 1 aligns with empirical evidence that dry-down timescales are systematically shaped by hydroclimate (especially aridity) and land-surface controls (McColl et al., 2017; Rahmati et al., 2024), with faster dry-downs in dry climates and slower dry-downs in wetter climates (McColl et al., 2017). The dry-down time scale (τ) is directly related to the shape of the loss function and is a key characteristic of global weather and climate models (McColl et al., 2017). We note that while τ may be overestimated in cold regions as ERA5-Land soil moisture includes frozen water (Muñoz-Sabater et al., 2021), caution is needed in such conditions due to limited freeze–thaw representation, though global wet–dry contrasts remain unaffected. ERA5-Land also does not include an explicit irrigation scheme, so anthropogenic water management is not represented in the soil moisture fields. Therefore, τ reflects natural land-surface and hydroclimatic controls as simulated by the model, and dry-down behavior in intensively irrigated regions should be interpreted with that in mind. This heterogeneity directly supports our modeling choice to move away from a single global memory parameter (Rahmati et al., 2024). Thus, translating τ into a grid-specific decay constant allows antecedent moisture weighting (and thus SASMI) to adapt to local dry-down rates rather than imposing uniform persistence everywhere.
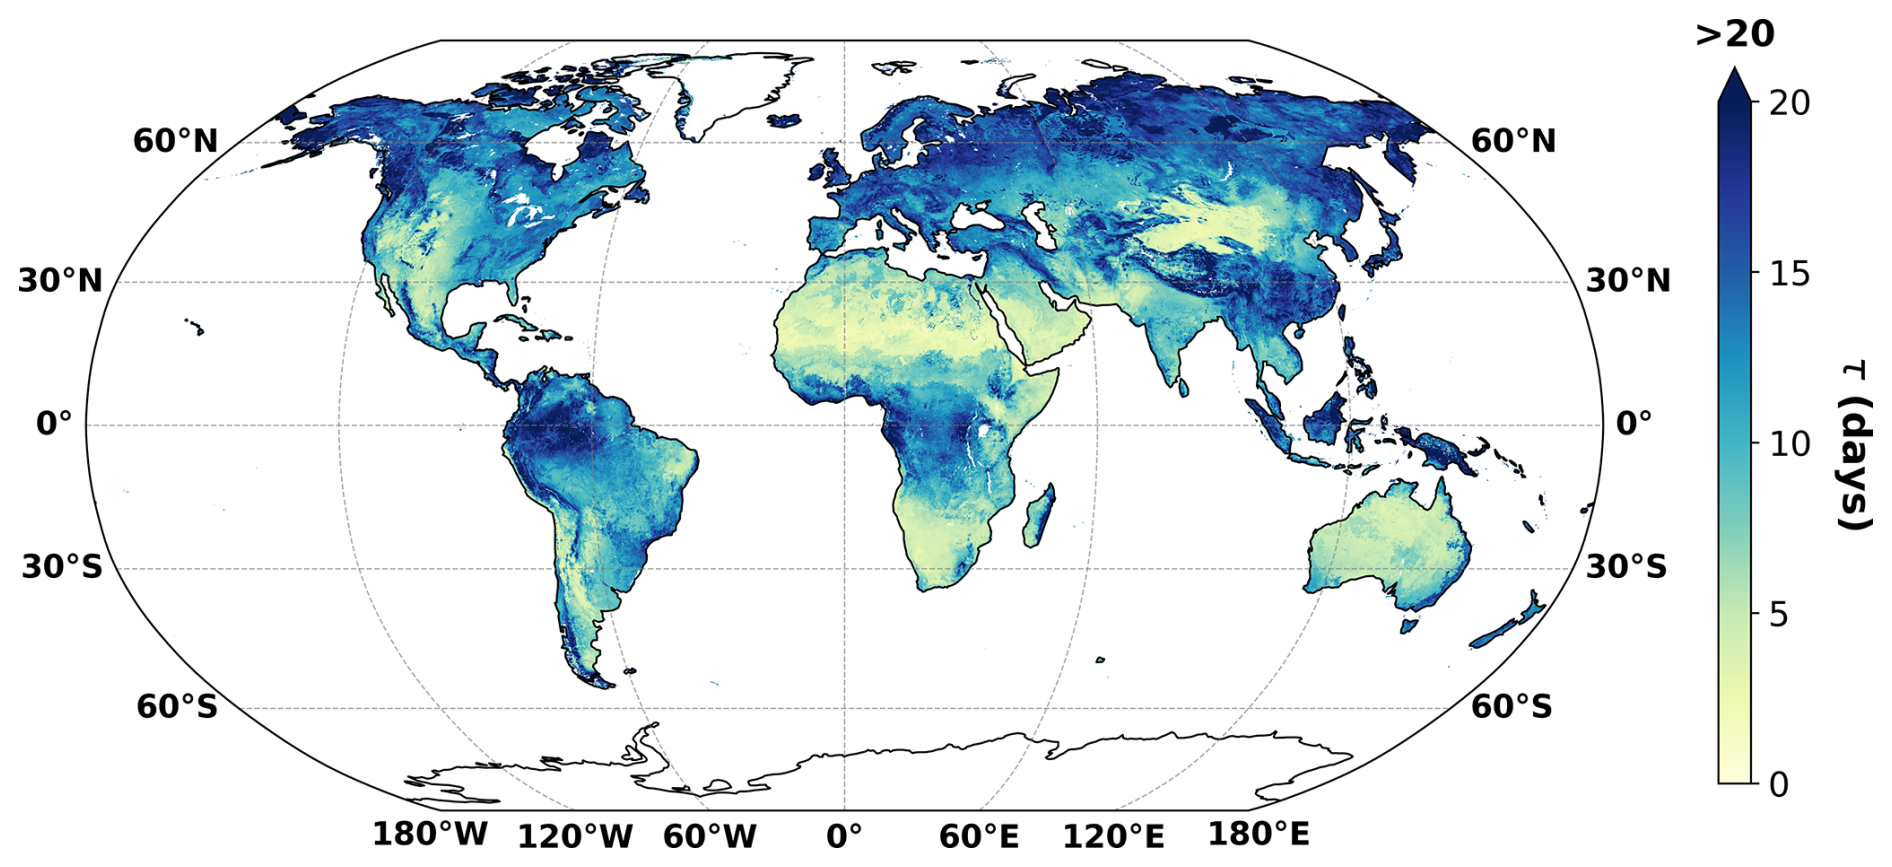
Figure 1Global distribution of the median soil-moisture dry-down time constant, τ (days), derived from daily near-surface soil moisture for 1961–2023. Higher τ values indicate slower dry-down and longer soil-moisture memory, whereas lower τ values indicate faster depletion and shorter memory.
3.2 Validation
Following the development of the proposed indices, we conduct a structured validation to establish both physical credibility and practical interpretability. We first evaluate SASMI against widely used drought metrics (Sect. 3.2.1) to confirm that it reproduces expected drought characteristics. We then assess the reliability of SSTCI as a compound dry-hot metric using four complementary lines of evidence: (i) examining its spatiotemporal coherence in comparison with an existing compound index (Sect. 3.2.2) and, (ii) extreme day agreement (iii) testing whether SSTCI extremes align with an independent vegetation stress response during a documented event (Sect. 3.2.2), and (iv) summarizing the signatures of recent well studied CDHE events to verify that SSTCI provides an event level compound severity measure (Sect. 3.2.3).
3.2.1 Agreement between SASMI and established drought metrics
We evaluated the proposed Standardized Antecedent Soil Moisture Index (SASMI) against two established daily drought indices: The Daily Evapotranspiration Deficit Index (DEDI) (Zhang et al., 2023b) and the Standardized Precipitation–Evapotranspiration Index (SPEI) (Liu et al., 2024). All three indices are analyzed at daily resolution for 2001–2021 (based on data availability). Agreement is assessed in two ways: Spearman rank correlation, which tests whether the indices co-vary from day to day, and the fraction of agreement on extreme (2σ) days, defined as the number of days both indices fall below −2 divided by the number of days either does. Figure 2 shows both for SASMI and DEDI; the SPEI comparison and the Pearson maps are provided in the Supplement (Figs. S2–S3).
The SASMI–DEDI correlation map (Fig. 2a) exhibits widespread positive and significant correlations across large portions of the tropics, subtropics, and temperate regions, forming broad, spatially coherent belts. Weaker and locally negative values appear primarily over densely vegetated tropical rainforest, because DEDI does not remove evaporation by interception loss and therefore does not explicitly reflect evaporative stress at the soil surface, whereas SASMI is more directly related to SM stress during droughts. These regions are also persistently wet, so ordinary-day variability is small and the lower correlation reflects limited dynamic range rather than a failure to detect drought. The extreme-day agreement (Fig. 2b) supports this reading. The strongest agreement occurs over the Amazon and Congo basins and maritime Southeast Asia, precisely where the correlations are weakest, together with northern Eurasia and eastern Australia. The two metrics are therefore complementary: correlation is dominated by ordinary days, while extreme-day agreement isolates the rare occasions when both indices register an extreme event. Lower agreement over the arid and semi-arid belts follows from the differing accumulation windows of the three indices (a daily deficit for DEDI, 30 d for SPEI, and ∼ 14 d for SASMI), which offset the day each crosses −2, and from the low dry–wet dynamic range of these regions, which the reference-dataset papers themselves flag as low-confidence; DEDI and SPEI agree with each other at a comparable level over the same period.
Taken together, Fig. 2 points to the reliability of SASMI for drought detection across most global land areas. The consistency of these independent comparisons indicates that SASMI captures broadly similar drought variability to existing metrics, thereby supporting its use as a reliable drought indicator in our study.
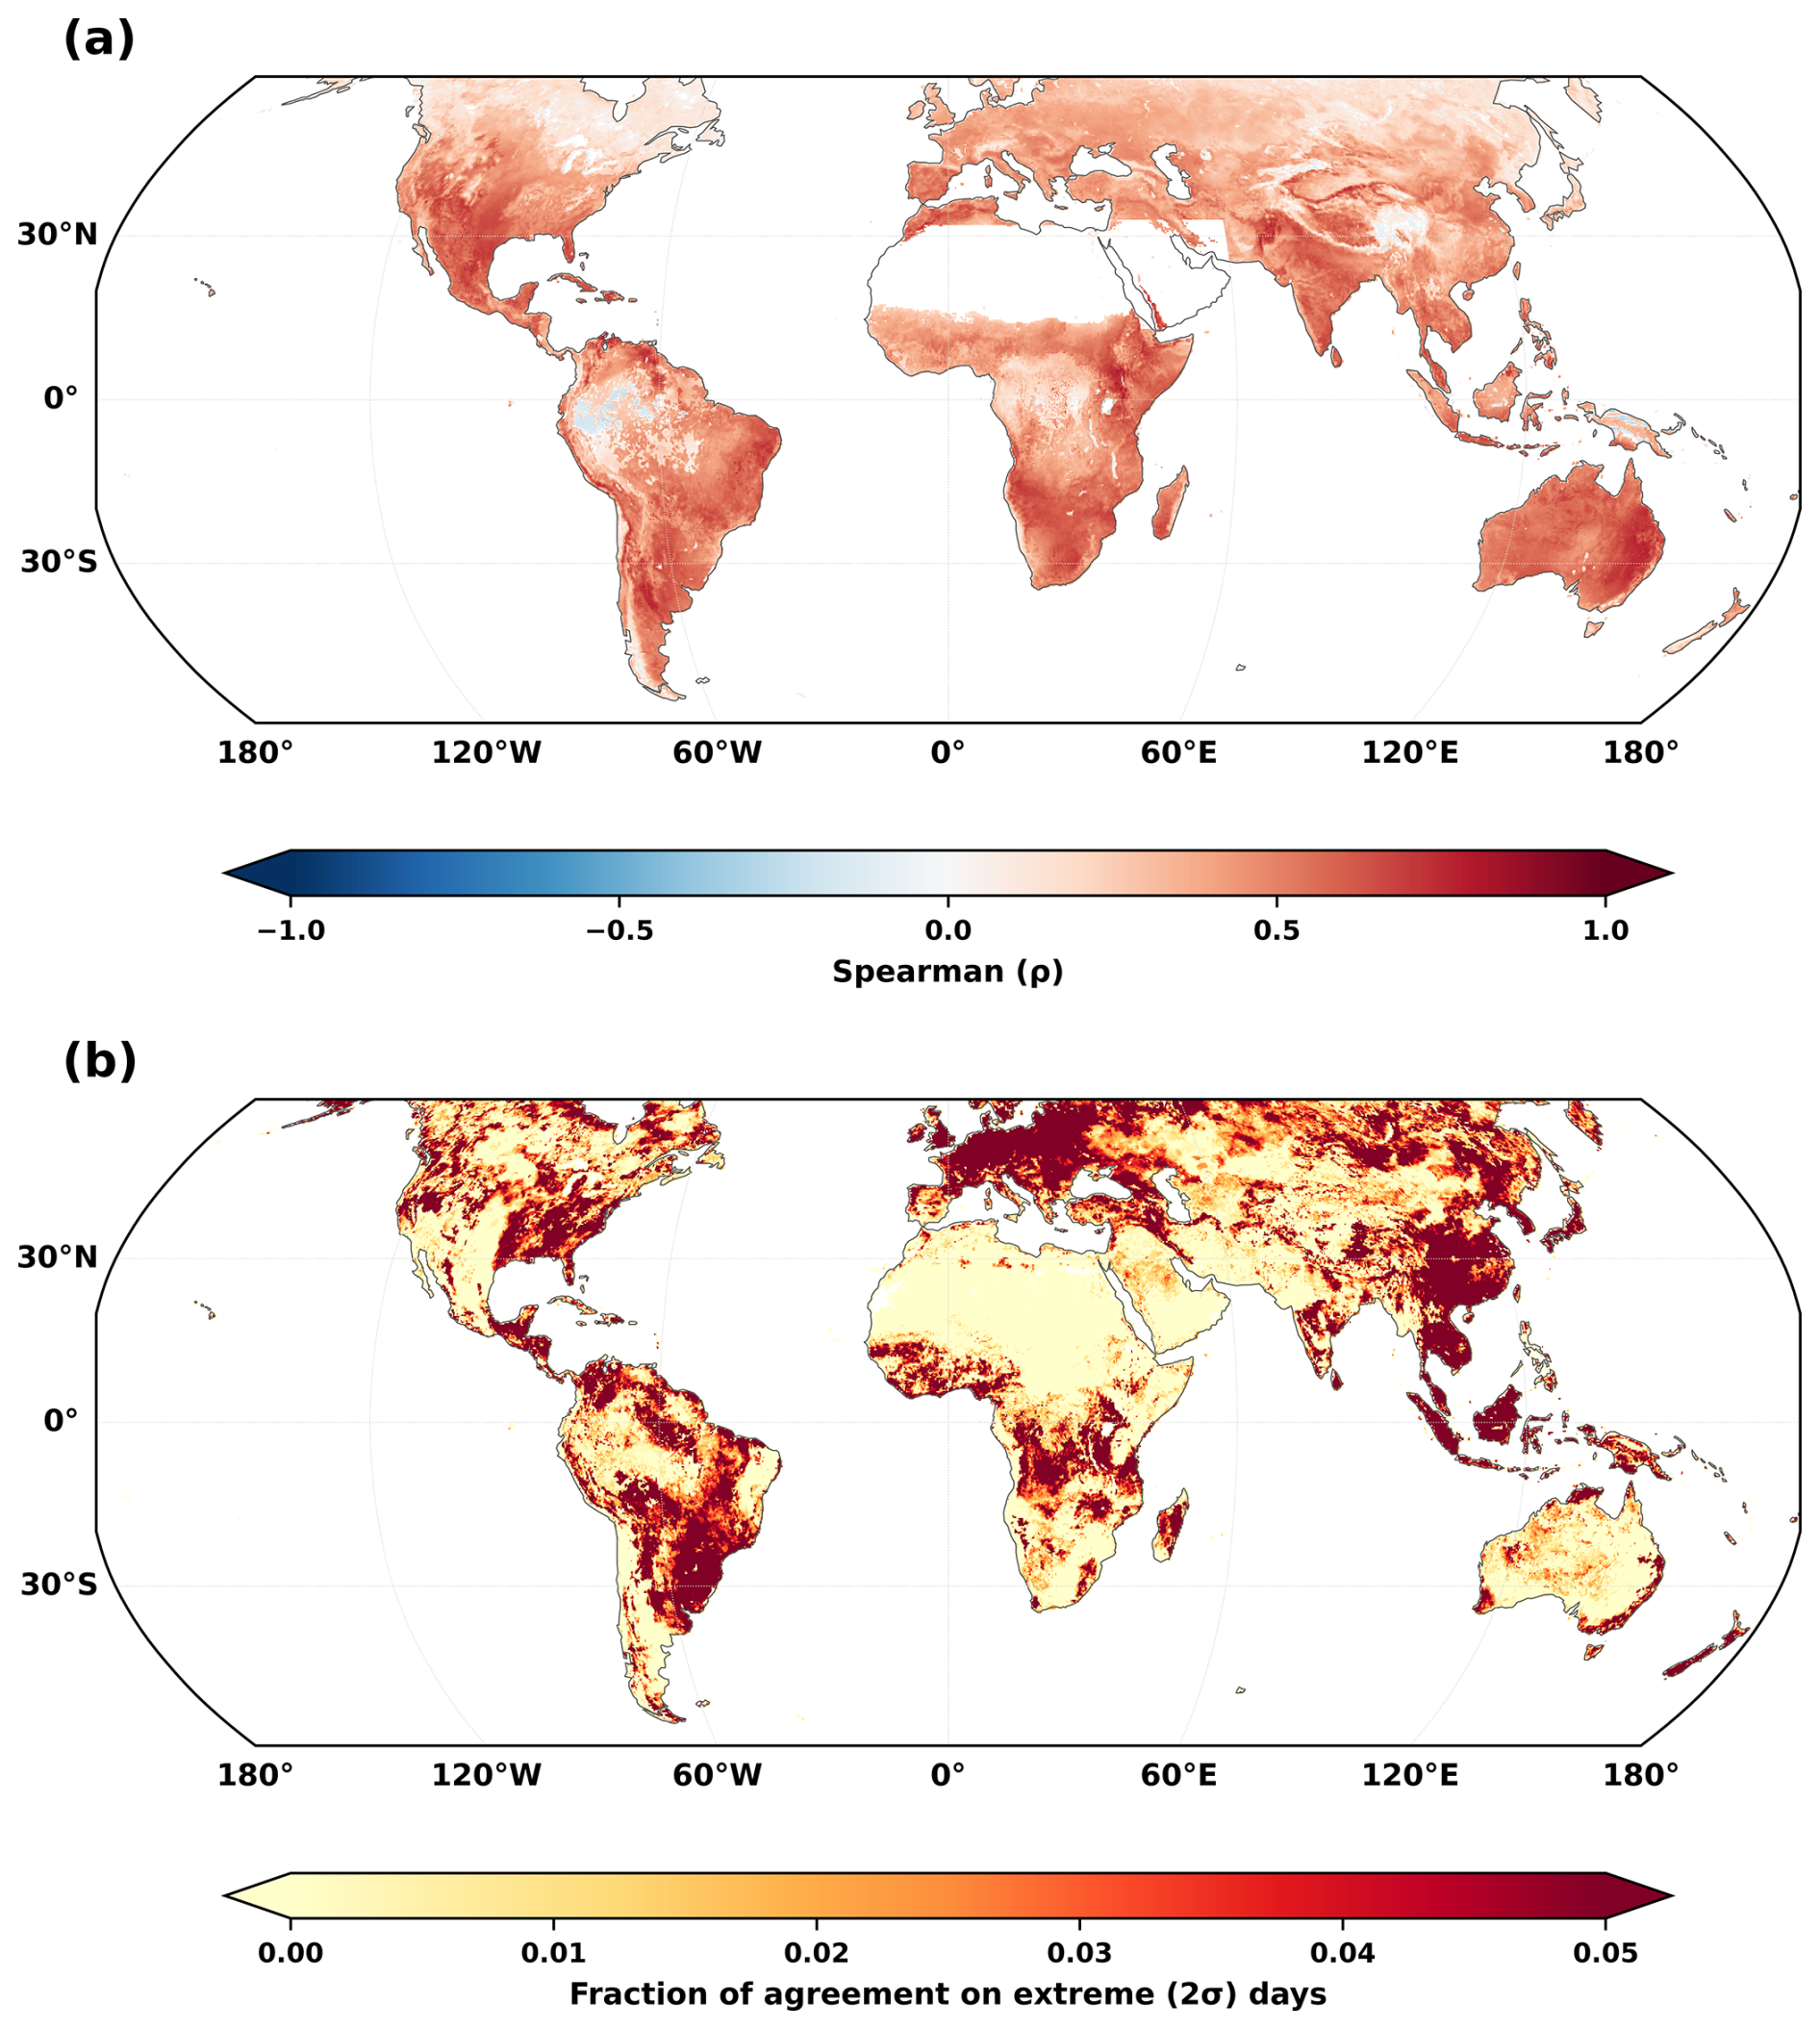
Figure 2Agreement between the Standardized Antecedent Soil Moisture Index (SASMI) and the Daily Evapotranspiration Deficit Index (DEDI), computed at daily resolution over 2001–2021. (a) Spearman rank correlation; only statistically significant values (α=0.05) are shown, and non-significant pixels are masked. Warm colors indicate positive correlation and cool colors indicate negative correlation. (b) Per-pixel fraction of agreement on extreme (2σ) days, calculated as the number of days both indices fall below −2 divided by the number of days either index falls below −2.
3.2.2 Consistency of SSTCI with SCDHI and impact-based evidence from vegetation response
Figure 3 provides complementary evidence for the robustness of SSTCI by demonstrating both global consistency with an established Standardized Compound Dry-hot Index (SCDHI) (Zhou et al., 2025) and physically meaningful linkages to impact relevant land-surface stress. At the global scale, temporal correlations between SSTCI and SCDHI are predominantly positive and statistically significant across most land areas (p<0.05; Fig. 3a), indicating coherent temporal co-variability between the two indices. Regions of high agreement are spatially widespread, whereas localized areas of weaker correspondence highlight geographic heterogeneity in index behavior, plausibly reflecting regional differences in hydroclimatic regimes and moisture–temperature coupling strength. We additionally compare the two indices on extreme (2σ) days, applying the same agreement metric used for the drought components in Sect. 3.2.1 (Fig. 3b). Because SSTCI and SCDHI are built on different drought components and accumulate windows, the day on which each crosses −2 during the same episode need not coincide. Agreement therefore improves substantially when a ±5 d tolerance is allowed, indicating that much of the exact day mismatch reflects timing offsets between the two formulations rather than disagreement over whether a compound event occurred; the exact day comparison is provided in the Supplement (Fig. S4). Agreement is strongest across the extratropics and weakest over hyper-arid and densely vegetated tropical regions, consistent with the pattern found in Sect. 3.2.1. These global results are reinforced by supplementary diagnostics showing broadly comparable seasonal spatial footprints and consistent event-phase evolution during the 2010 western Russia CDHE (Figs. S5–S6), supporting the ability of SSTCI to reproduce the large-scale and event-scale spatiotemporal characteristics.
To validate the SSTCI's capacity for CDHEs, we examined the catastrophic 2006 heatwave-drought in the Sichuan–Chongqing region; an event historically distinguished by its unprecedented duration and intensity (Zhang et al., 2008; Zhou et al., 2024). The region experienced continuous extreme temperatures from mid-June to late August 2006, representing the most severe and longest heatwave in the historical record, coincident with an exceptional (≈ 100-year) drought (Li et al., 2011). The event caused widespread societal and ecological impacts, including severe drinking-water shortages, substantial cropland losses, and numerous forest fires, prompting the highest level of local aridity warning (Wu et al., 2020). The event scale evaluation confirms that SSTCI anomalies are physically consistent with ground conditions and impact relevant. Specifically, the index effectively captures the event's temporal evolution, tracking a clear phase progression from mixed pre-event conditions to a coherent negative phase during initiation, which subsequently intensifies and expands spatially at the event's peak (Fig. 3c). This evolution is verified by independent vegetation dynamics, where we observe that vegetation stress coincides with the SSTCI trajectory, broadening and deepening from onset to peak intensity (Fig. 3d). Notably, the regions exhibiting the most severe SSTCI values are broadly collocated with the sharpest NDVI reductions. The daily time series provides further verification (Fig. 3e), revealing that sustained negative SSTCI values, during the initiation and peak phases, drive a progressive decline in vegetation health, with the NDVI minimum lagging slightly to coincide with, or immediately follow, the peak DH stress.
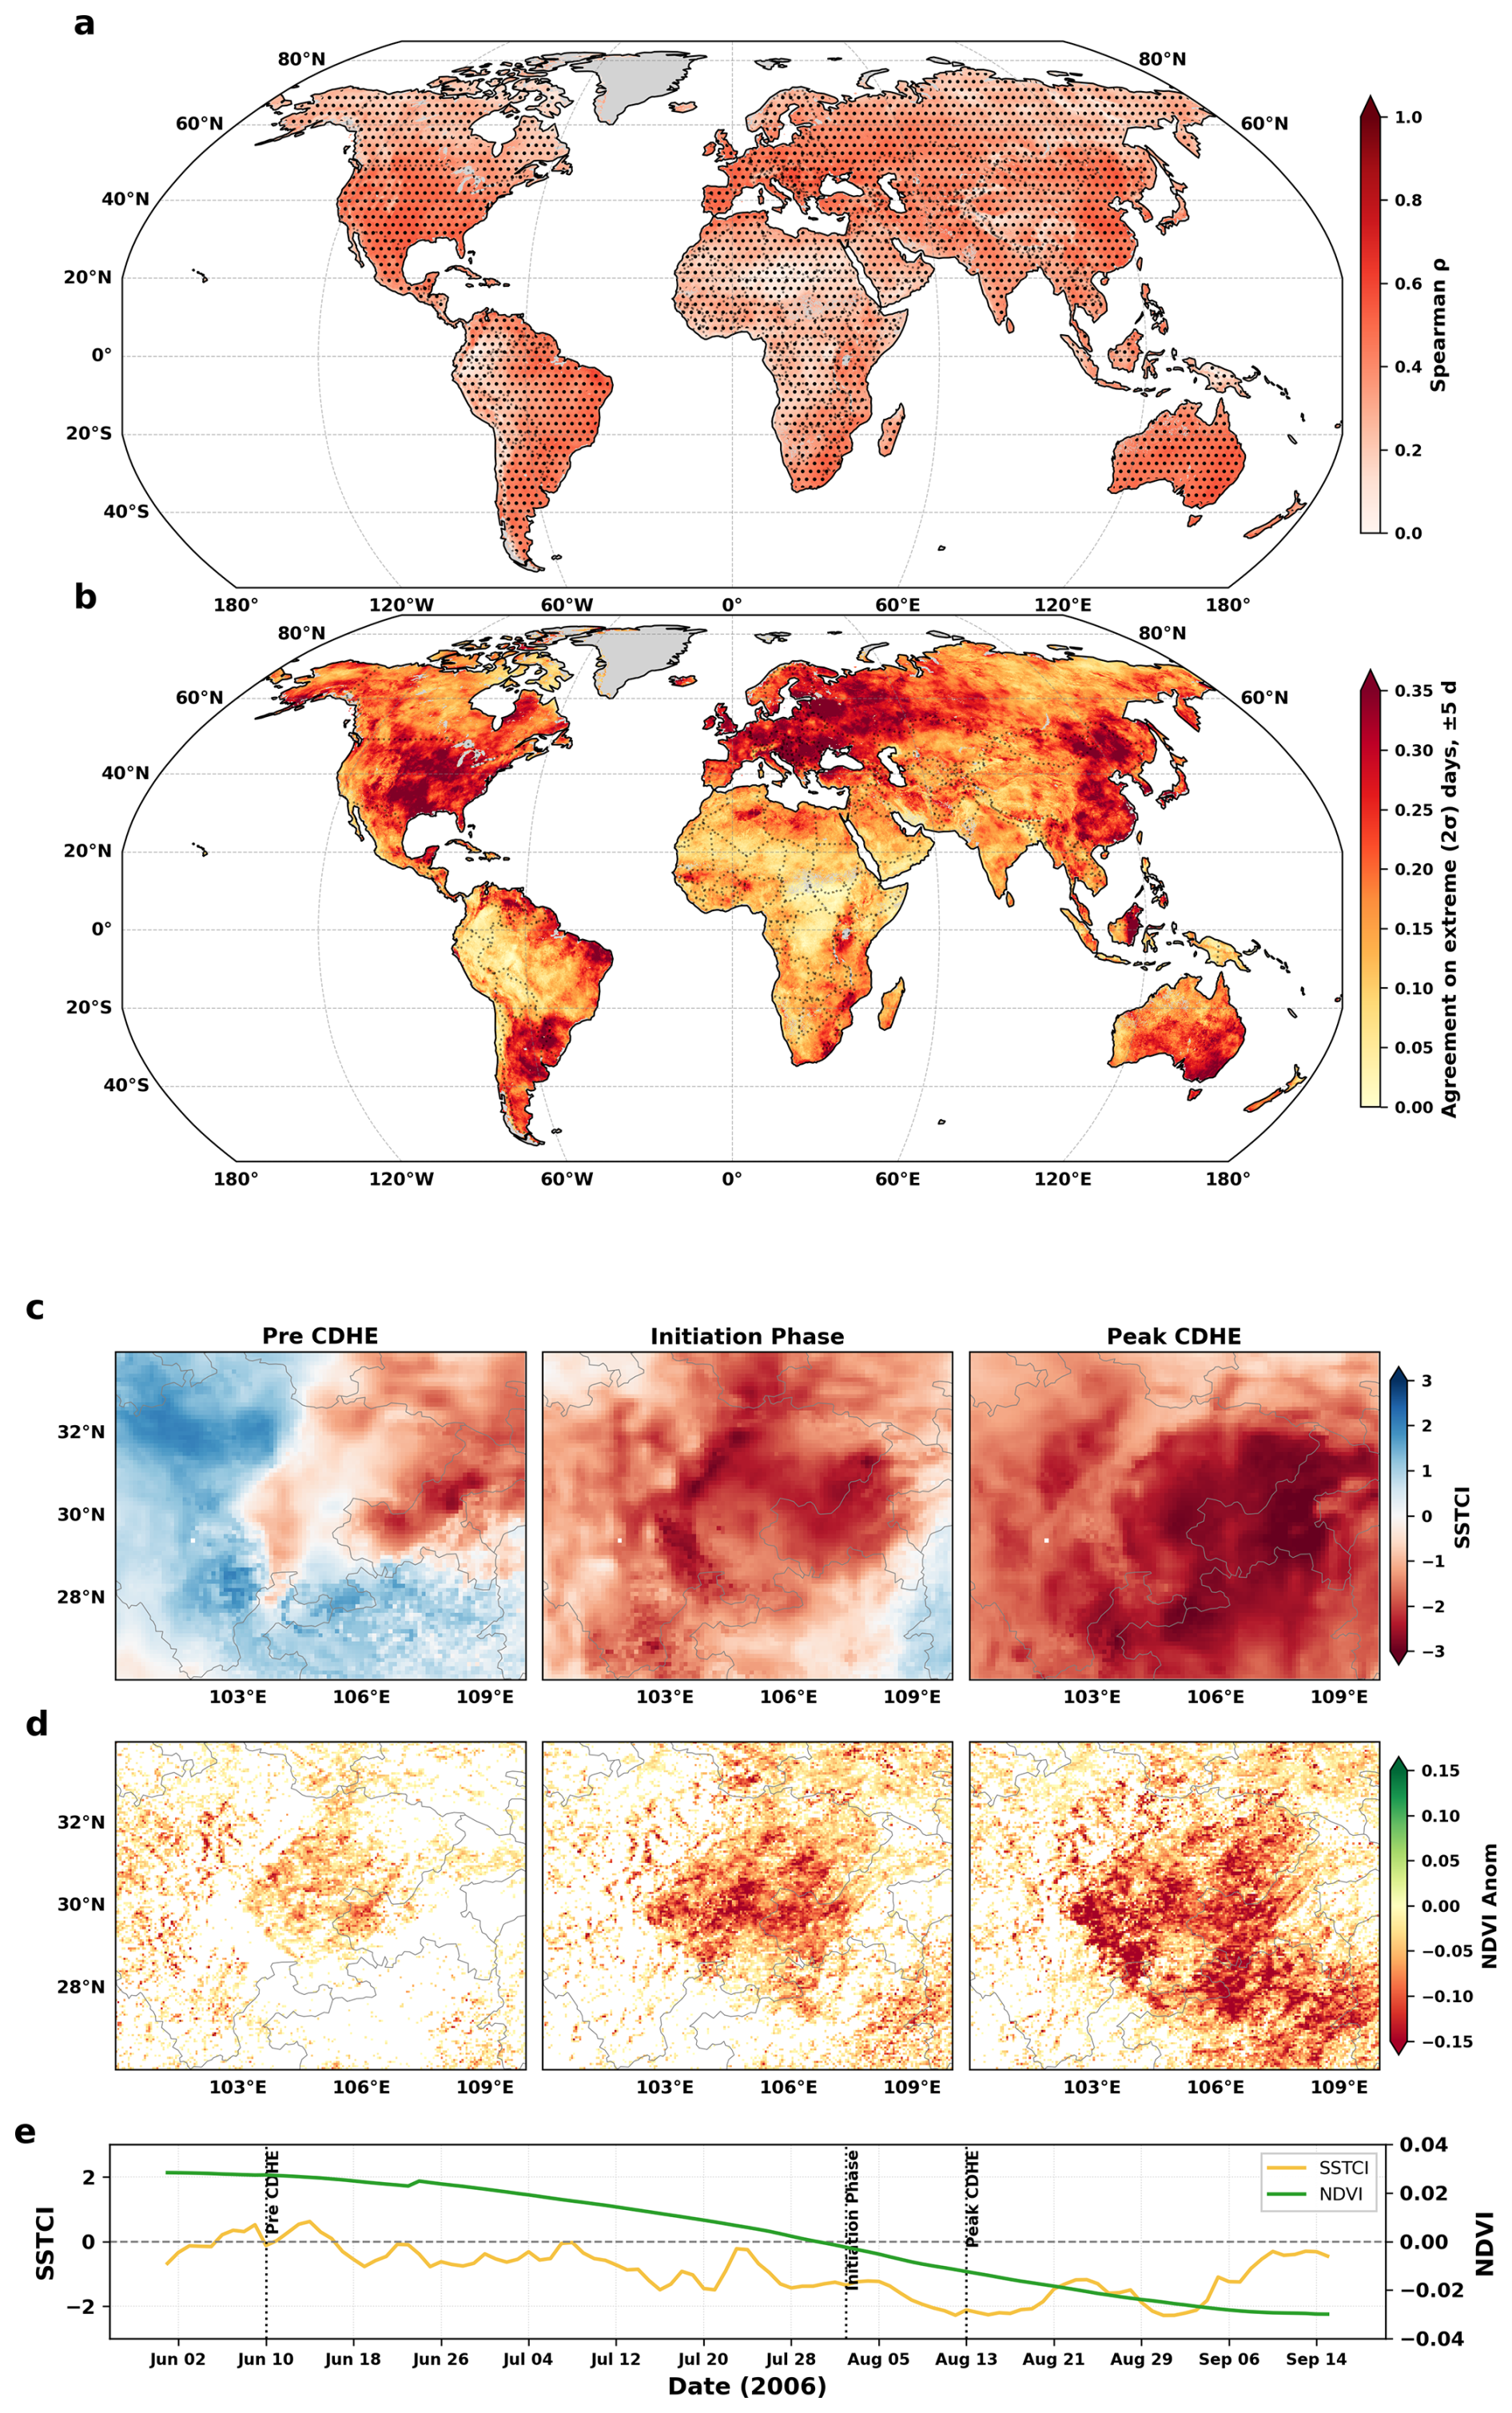
Figure 3Evaluation of SSTCI through comparison with an existing compound dry-hot index and an independent vegetation response during the 2006 Sichuan–Chongqing extreme event. (a) Global correlation between SSTCI and SCDHI over 1981–2013, showing their temporal co-variability across land areas; stippling denotes statistically significant correlations at the 5 % level. (b) Per-pixel fraction of agreement between SSTCI and SCDHI on extreme (2σ) days over the same period, allowing a ±5 d tolerance, calculated as the number of days both indices fall below −2 divided by the number of days either index does. (c) Spatial phase maps of SSTCI during the 2006 Sichuan–Chongqing CDHE, illustrating the progression from pre-event conditions through initiation to peak. (d) Corresponding maps of negative NDVI anomalies for the same phases, showing the spatial development of vegetation stress. (e) Daily time series of SSTCI and NDVI averaged over the Sichuan–Chongqing domain shown in panels (c) and (d).
3.2.3 CDHE Event Identification
To assess the diagnostic fidelity of the SSTCI across diverse climatic regimes, we conducted a retrospective analysis of six well documented recent CDHE events (Fig. 4). The temporal evolution of these events is visualized using radar plots on a circular day-of-year axis, comparing the region-mean daily dynamics of SASMI (blue), inverted STI (red; denoted as −STI), and SSTCI (yellow). In this coordinate system, the radial axis quantifies severity, extending from 0 (neutral) at the origin to −3 (extreme) at the outer perimeter; thus, outward extension signifies intensifying CDH conditions (Note: While standard STI is used for index construction, we plot −STI here solely to harmonize the directional sign of severity across all indices). Across all six events, SSTCI exhibits pronounced outward extension during the independently established peak windows in each region, demonstrating that the index robustly captures extreme CDH conditions across diverse climates and seasons. The specific geographic domains defined for these regional analyses are detailed in Supplement Table S2.
Over Northern Italy in July 2022 (Fig. 4a), the radar shows a rapid emergence of compound dry-hot conditions in mid-July, as increases in temperature activity coincide with soil-moisture deficits. SSTCI attains its largest negative magnitude during ∼ 14–25 July (centered ∼ 19–22 July) before easing at the month's end. These results are consistent with independent diagnostics for the 2022 European event that document preconditioned drying followed by an acute mid-summer dry-hot concurrence (Tripathy and Mishra, 2023; Zhang et al., 2023a). Over the Yangtze River Basin (Fig. 4b), a basin-wide compound phase spans most of August 2022, with sustained negative SSTCI supported by concurrent dryness and heat; the signal weakens only toward late August. This timing mirrors published analyses for YRB 2022 that report late-July drying, rapid early-August heat intensification, and a mid-to-late August compound maximum (Zhang et al., 2023a; Ni et al., 2024; Mei et al., 2024).
In the Southwest United States (June 2021) (Fig. 4c), a brief but intense heatwave (∼ 13–19 June) occurred over an already dry background, with −STI surging to its largest negative values while SASMI remained negative; SSTCI reached a short, sharp compound maximum during this week and then weakened as temperatures eased, consistent with evidence of drought-to-heat amplification (Osman et al., 2022). In the Pantanal (September–October 2020) (Fig. 4d), persistently dry conditions were followed by intensified temperature anomalies in late September to early October (Geirinhas et al., 2021), yielding a multi-week compound phase in SSTCI with two events from mid-September to mid-October, in agreement with the regional analysis for 2020 by Libonati et al. (2022).
In South Africa (Fig. 4e), (December 2015–February 2016) and Northeast Australia (November–December 2019), the radar panels show co-evolving heat and dryness, yielding distinct compound peaks. Over South Africa, late December to early January features strong temperature anomalies coincident with soil moisture deficits, with SSTCI maximized across ∼ 28 December–9 January and a smaller reprise in mid-February, consistent with independent reports of the El Niño-linked drought and exceptional summer heat (Funk et al., 2016, 2018; Mbokodo et al., 2023). Likewise, the Australian Government Bureau of Meteorology (Australian Government Bureau of Meteorology, 2023), declared November 2019 as the driest month across most parts of Australia. Over Northeast Australia (Fig. 4f), late November through mid-December 2019 shows sustained negative SASMI alongside elevated negative STI values, leading to SSTCI maximum in that window and a secondary heat-led pulse in late December, aligning with the documented 2019 hot–dry culmination driven by Indo-Pacific thermal forcing (Zhang et al., 2021). The cross-region analyses show that SSTCI reliably detects the actual compound phase of recent CDHEs across various climates, seasons, and event types. By using standardized, daily indices, the radar maps demonstrate that SSTCI reaches its most negative values precisely when soil moisture deficits and unusually warm conditions coincide, aligning with the peak periods identified in existing studies.
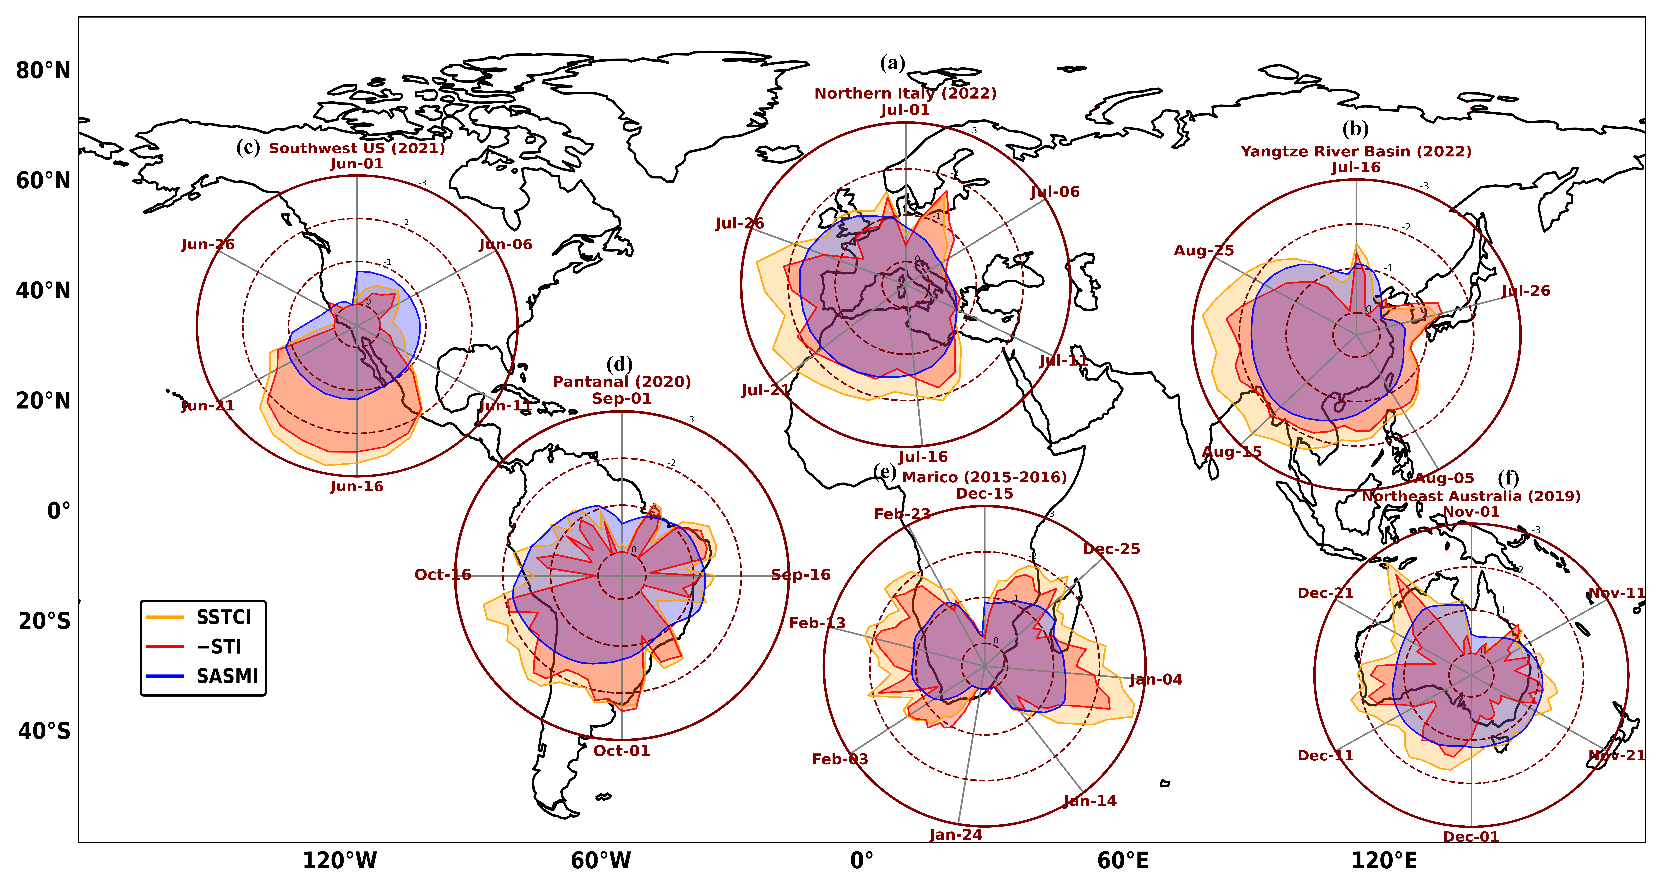
Figure 4Six documented mega CDHE events across diverse climatic regions, showing region-mean daily evolution of SASMI (blue), inverted STI (red; plotted as −STI for directional consistency), and SSTCI (yellow) on a circular day-of-year axis. The radial axis ranges from 0 at the center to −3 at the outer edge, so larger outward excursions indicate more severe dry-hot conditions. The selected case studies include (a) Northern Italy (2022), (b) the Yangtze River Basin (2022), (c) the southwestern United States (2021), (d) the Pantanal (2020), (e) South Africa (2015–2016), and (f) northeast Australia (2019).
The event signatures in Fig. 4 also illustrate a general property of the index. Because SSTCI is derived from the joint probability of low soil moisture and high temperature rather than from either component alone, extreme values require the two drivers to be jointly elevated. A day on which only one driver is anomalous (not extreme but low values) is assigned a moderate value rather than an extreme one, as can be seen in all six cases, so compound extremes are not registered where a single factor is elevated in isolation; the conditional behavior of the index across the full range of SASMI–STI combinations is documented in Aftab et al. (2026a) for the Poyang Lake Basin.
Collectively, this multifaceted evaluation establishes the SSTCI as a rigorous and physically consistent metric for global CDHE monitoring. The strong temporal co-variability with SCDHI shows the index's statistical reliability at the global scale, while the detailed event-scale case studies demonstrate its high fidelity in characterizing the spatiotemporal evolution of ground-level vegetation impacts. Furthermore, the successful detection of peak intensities across diverse climatic regimes, as evidenced by the multi-regional radar analysis, highlights the index's universality. By effectively bridging the gap between statistical detection and physical impact, the SSTCI offers a trustworthy, scale-independent framework for identifying, monitoring, and comparing compound dry-hot extremes worldwide.
3.3 Diagnosing event mechanism and Daily Evolution of CDHEs
To evaluate the SSTCI's capability in resolving event onset mechanisms and daily evolution, we studied the 2010 Russian Mega event (Voronezh region), a prototypical compound event driven by land–atmosphere feedback (Miralles et al., 2014). Figure 5 illustrates the daily co-evolution of SASMI, STI, and SSTCI for the Voronezh region during the 2010 Russian mega-heatwave. The timeline begins with a distinct dry soil pre-conditioning phase from early June through mid-July (indicated by the beige band), where the SASMI declines steadily from nearly neutral conditions to a significant deficit of approximately −1.8. Notably, during this initial drying period, the STI remains relatively stable near the climatological mean. This sequencing confirms that the event was not sparked by a sudden heat spike, but rather by a sustained, early summer depletion of soil moisture. As emphasized by Miralles et al. (2014), this early desiccation of the land surface is a critical precursor; by reducing the capacity for evaporative cooling, the surface energy partitioning shifts toward sensible heat, effectively loading the atmospheric gun for the heatwave to follow.
The transition from a simple drought to a Mega-Heatwave occurs abruptly in late July (pink shading), as the temperature index amplifies sharply to exceed +2. This atmospheric trigger hit a land surface already desiccated by the preceding weeks of dry soil moisture. The resulting synergy is vividly captured by the SSTCI (purple fill), which approaches nearly −3.5, a value far more extreme than either of its individual components. The record contains two dips below −2. The first and shorter one occurs earlier, when a brief warm spell acted on soil that was drying but not yet fully depleted, producing a compound signal of limited depth and duration. The second is the main event: by late July the soil moisture deficit had deepened, so the heat anomaly encountered a surface with little remaining capacity for evaporative cooling and the land–atmosphere feedback became self-sustaining. Because the two spells are separated by a sufficiently pronounced recovery interval, the removal–merging procedure (Sect. 2.6) retains them as two independent events rather than merging them. In this state, the already dry soil and peak temperature couple to cause an extreme dry hot event. Without this early soil desiccation, the subsequent heat anomalies would not have found the same dry ground necessary to escalate to such record breaking levels.
Here, the compound index is designed to capture this synergy. Dry and hot extremes do not merely co-occur, but amplify each other, and the resulting impacts on ecosystems and societies are disproportionately severe relative to either stressor alone (Zscheischler and Seneviratne, 2017; Feng et al., 2019). Because SSTCI is derived from the joint probability of soil moisture and temperature, it reaches its most extreme values specifically where dryness and heat coincide more strongly than their independent behaviour would imply, and therefore reflects the reinforcement between the two drivers rather than their simple superposition. Ultimately, Fig. 5 demonstrates the utility of the SSTCI as an objective diagnostic tool for tracking compound events at a daily resolution. While individual indices show only part of the story, the SSTCI successfully captures the onset of the compound threat as the two drivers converge, the peak severity (with values falling well below −2), and the subsequent decay of the stress. Notably, the SSTCI shows that the compound event persisted longer than the heatwave itself, as the index remained suppressed during the slow recovery of soil moisture in late August.
This confirms that the SSTCI provides a complete lifecycle analysis of the event, from the early summer priming through the peak compound phase to event termination.
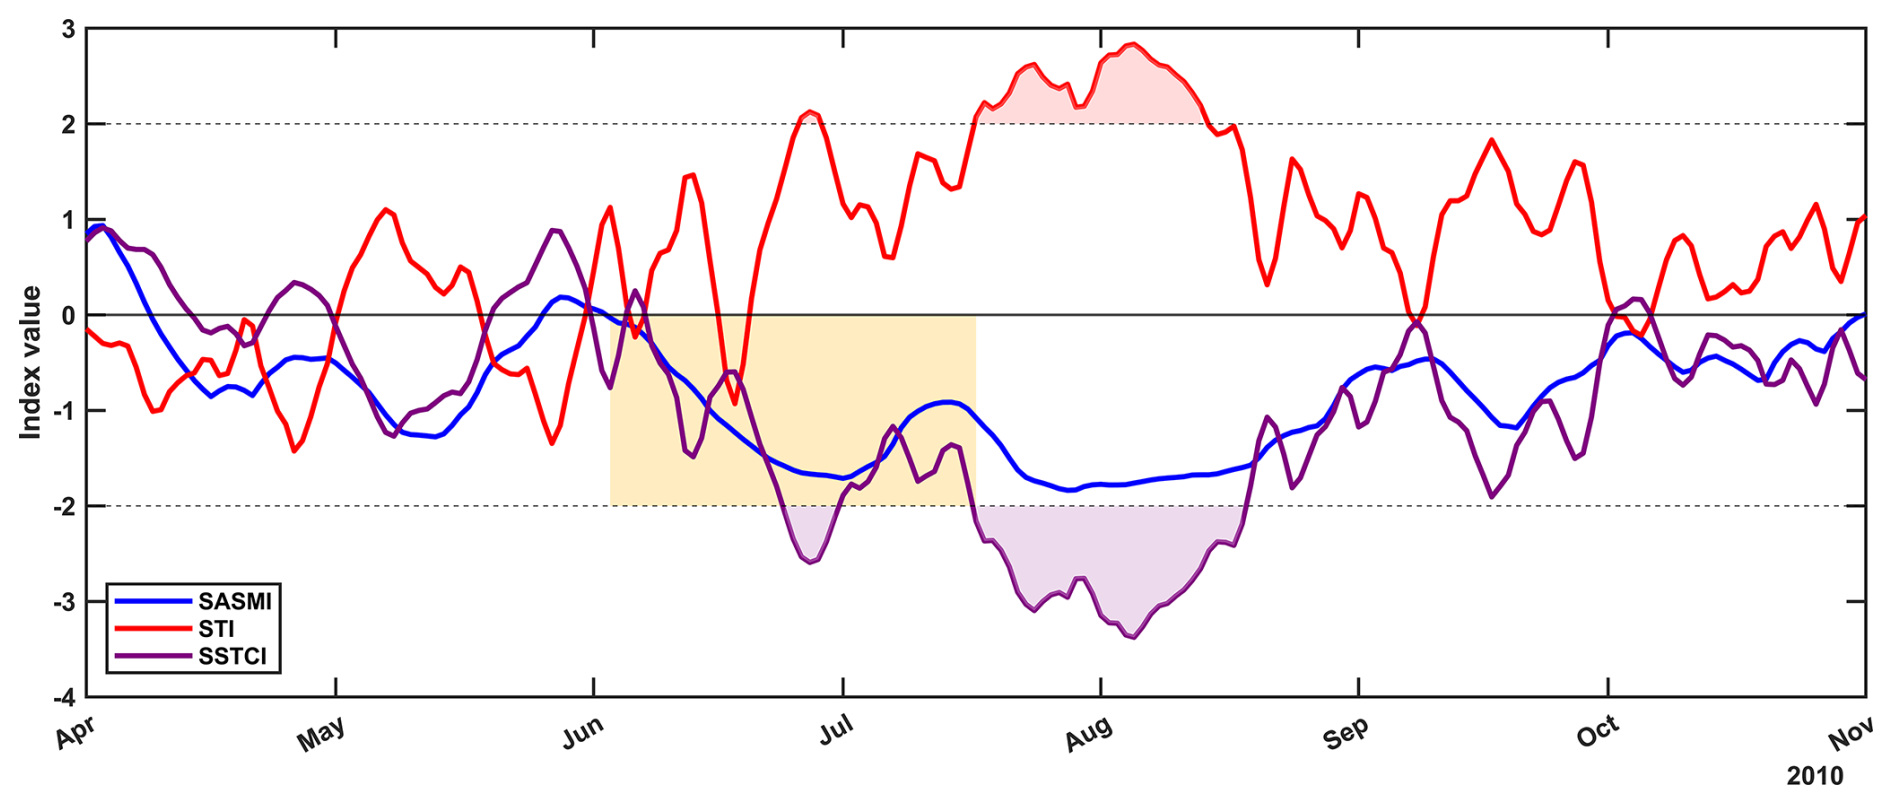
Figure 5Daily evolution of the 2010 Voronezh, Russia CDHE from April to November, illustrating the onset mechanism and full event lifecycle resolved by SSTCI. Time series show SASMI (blue), STI (red), and SSTCI (purple) from April to November 2010. The beige shaded period marks early-summer soil-moisture preconditioning. The pink-shaded interval marks the heatwave phase, and purple shades represent the compound dry-hot phase.
3.4 The Global Compound Dry-Hot Extreme Event Catalogue
To bridge the gap between continuous hydroclimate monitoring and actionable disaster risk assessment, we constructed a comprehensive Global Compound Dry-Hot Extreme (CDHE) Event Catalogue for the period 1961–2023 from SSTCI. This catalogue represents a structural shift in how compound extremes are archived. That is, rather than storing redundant daily time series, we generated a discrete, event-based inventory that captures the complete lifecycle of every extreme dry-hot event detected across the global 0.1° grid from 1961 to 2023.
The catalogue was generated by applying the removal–merging event identification procedure (described in Sect. 2.6) to the daily SSTCI time series at each grid cell. For every detected CDHE, we extracted event attributes that summarize its physical characteristics (Table 1). This event-based structure enables direct analysis of event characteristics (e.g., event counts, durations, and severities) while avoiding the computational burden of repeatedly processing non-event days. Since implementing this method across all grid cells requires considerable computational resources, we provide a ready-to-use dataset that enables users to directly access event information without repeating the full extraction procedure. To illustrate the catalogue format, an example event record for a representative grid cell is provided in Supplement Table S3.
Table 1Summary of event characteristics of the CDHE event catalogue.

Beyond hydroclimatic research, the catalogue is meant to be usable by people who just need clear answers to simple questions such as: Where did an extreme dry-hot event happen, when did it start and end, and how severe was it? This discrete list of CDHE events aims to make the dataset much easier to connect to potential operational services. The explicit event timing is especially valuable for impact studies because it would allow users to line up CDHEs with sensitive windows. For instance, for agriculture, this means identifying cases where compound heat and drought overlap with critical growth stages such as flowering or grain filling, when crops are most vulnerable. In practice, many stakeholders are less interested in the methodological details of the index and more interested in a consistent, ready-made event inventory they can query anywhere in the world. This catalogue is therefore designed to fill that need as a global, comparable archive of CDHE events that can be directly plugged into socio-economic assessments and planning workflows.
3.5 Long-term changes in CDHE occurrence frequency across key hotspot regions
The integrated Global CDHE Event Catalogue indicates a widespread increase in CDHE event occurrence frequency across hotspot regions (Fig. 6) from the historical baseline (1961–1999) to the recent warming period (2000–2023). A prominent feature of this transition is the marked acceleration in event accumulation, where although the recent window spans only 24 years (vs. 39 years in the baseline), absolute event counts in many regions are comparable to or exceed those observed in the longer historical period, implying a higher annualized occurrence rate in the 21st century. The event-identification procedure is applied only to the SSTCI series making the reported increase a property of catalogued compound events rather than of separately catalogued drought or heat events. Although the individual drivers have themselves intensified in recent decades (IPCC, 2021); the compound frequency, on the other hand, is governed not only by the marginals but by the strengthening dependence between them, so that joint occurrence rises faster than the independent combination of the two would imply (Zscheischler and Seneviratne, 2017). This dependence is captured in SSTCI through the copula. Additionally, anthropogenically forced increases in compound dry-hot frequency has been documented directly at global and continental scales (Zhang et al., 2022). The most pronounced regime shifts are observed in the Southern Great Plains and the Yangtze River Basin, where probability distributions have fundamentally transitioned to higher frequency states. In the Great Plains (Fig. 6a), the intensification is characterized by a simultaneous upward translation of the median from approximately 9 to 15 events and expansion of the extreme tail, with maximums reaching ∼ 45 events. When compared with the recent record, this corresponds to a nearly three-fold (2.7×) increase in the annual recurrence rate, suggesting the region has transitioned into a new climatic regime where previously rare statistical outliers have become the baseline expectation, showing consistency with previous research in the area (Mazdiyasni and AghaKouchak, 2015; Alizadeh et al., 2020). Similarly, the Yangtze River Basin (Fig. 6c) exhibits a spatially homogeneous shift where the median event count has more than doubled, increasing from 10 to 21 events, consistent with previous studies, which concluded frequent occurrence of CDHEs in YRB in recent decades (Mei et al., 2024; Zhang et al., 2023a). Recent studies have identified stationary anticyclones and strong land-atmosphere feedbacks; where dry soil moisture significantly amplifies surface warming, as the primary drivers of this intensification (Ni et al., 2024; Lu et al., 2024) and the westward extension of the West Pacific Subtropical High further traps heat and suppresses precipitation, exacerbating the risk of scorching summers in this region (Huang et al., 2024; Zhang et al., 2023a). Similarly, in the Amazon Basin (Fig. 6d), a quieter but still important shift is seen between the two periods. The CDHE count increases only slightly, from about 9 to 10 events, but because the recent period is much shorter, this small change translates into a much higher annualized frequency rising from ∼ 0.23 to ∼ 0.42 events yr−1 (about an 80 % increase). The distribution also becomes wider in the recent period, which suggests that event accumulation is becoming more uneven across the basin, with more areas experiencing moderate to high counts. At the same time, the upper tail stays close to ∼ 40 events, suggesting that the dominant change is faster recurrence rather than a higher absolute intensity ceiling. This pattern aligns with the basin's growing exposure to land-use disturbance and repeated drought stress as forests are degraded, the land tends to retain less soil moisture memory and provides less evaporative cooling, making DH conditions more likely to coincide and recur (IPCC, 2021; Rahmati et al., 2024).
The strongest distributional accelerations and tail expansions are indicated over North-Eastern Australia and South Africa. North-Eastern Australia (Fig. 6f) shows the strongest expansion of the extreme tail among all regions. The maximum increases from ∼ 35 events in 1961–1999 to > 60 events in 2000–2023, indicating a near-doubling of peak hazard intensity, while the median rises from ∼ 9 to ∼ 17. After accounting for the shorter recent period, a near-tripling of annual event frequency is found. Overall, the distribution shifts from bottom-heavy to strongly elongated, suggesting that extreme compound events are becoming recurrent rather than exceptional. These results align with reported high flash-drought risk in northern/eastern Australia (Nguyen et al., 2023), which have been linked to background warming interacting with ocean–atmosphere variability such as strong positive Indian Ocean Dipole phases (Ridder et al., 2020; Zhang et al., 2021). South Africa (Fig. 6e) shows the strongest relative acceleration in CDHE frequency across all regions. The median increases from ∼ 6 events per pixel in 1961–1999 to ∼ 13 in 2000–2023; after accounting for the shorter recent period, a ∼ 3.6× rise in annual event rate is implied. The upper tail also expands sharply, with the maximum increasing from ∼ 28 to ∼ 55, indicating both more frequent and more intense extremes. This shift has been linked in previous studies to anthropogenic warming superimposed on natural variability, including strengthened regional high-pressure systems (Mbokodo et al., 2023; Hosseinzadehtalaei et al., 2024). Finally, Southwestern Europe (Fig. 6b) reveals a complex bimodal evolution, reflecting a growing spatial inequality in climate risk. While some sub-regions remain relatively stable, others have deviated from the regional norm, forming localized, high-intensity clusters with event counts exceeding 40. These results are consistent with Tripathy and Mishra (2023), who identify the Iberian Peninsula, France, and Italy as the hardest hit areas with unprecedented severity and return periods exceeding 300–400 years. Ridder et al. (2020) also identify Western Europe as one of the global hotspots for multivariate compound events.
Collectively, these regional patterns demonstrate that the non-stationarity of CDHEs is an established global reality (IPCC, 2021; Zscheischler et al., 2018, Zhang et al., 2023a). The divergence in intensification patterns reflects the complex interplay between global thermodynamic warming and regional dynamical feedback, which warrants detailed study.
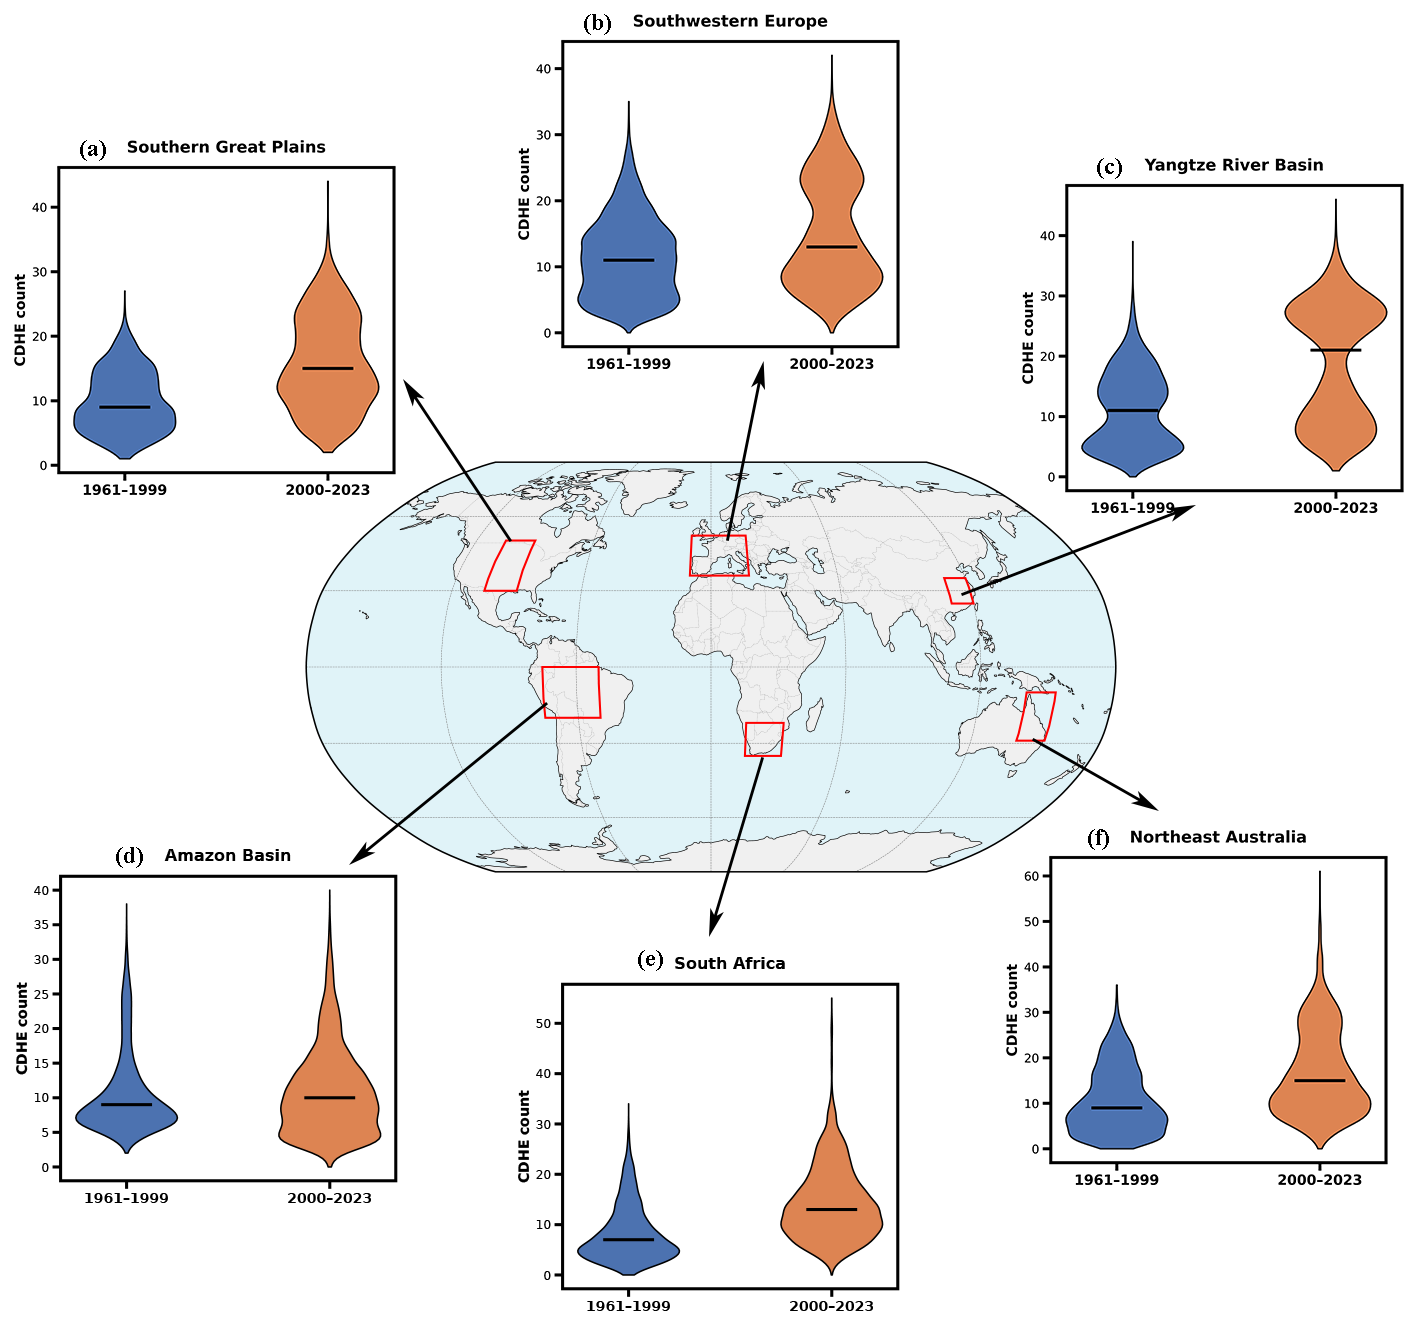
Figure 6Regional changes in CDHE occurrence frequency between the historical baseline period (1961–1999) and the recent warming period (2000–2023) across six hotspot regions: (a) Southern Great Plains, (b) Southwestern Europe, (c) Yangtze River Basin, (d) Amazon Basin, (e) South Africa, and (f) Northeast Australia. Violin plots show the distribution of CDHE event counts per grid cell within each region, with the black horizontal line marking the median. Blue denotes 1961–1999, and orange denotes 2000–2023.
3.6 Long term changes in CDHE duration
Figure 7 maps per-pixel temporal trends in CDHE duration for 1961–1999 and 2000–2023. At each grid cell, the duration of every catalogued event is regressed against the calendar year in which it occurred. Since the events are discrete and irregularly spaced, with many years containing none, the regression is fitted over the actual event years from the first to the last event at that cell. A clear shift toward positive slopes is seen in the recent period, indicating that CDHEs have tended to become longer-lasting across large parts of the global land surface since 2000. The strongest and most spatially coherent lengthening is evident across northern Eurasia and high-latitude North America, while a pronounced sign reversal is observed over tropical South America (Amazon basin), where predominantly negative slopes in 1961–1999 transition to widespread positive slopes in 2000–2023. Overall, the significant expansion of positive duration trends in 2000–2023 points to an increasing role of event persistence in shaping recent CDHE risks. This transition from the fragmented trends of the 1961–1999 period to the contiguous, high-intensity red slopes of the 21st century aligns with recent evidence of a global acceleration in compound dry-hot extremes (Zhou et al., 2019; Yuan et al., 2023).
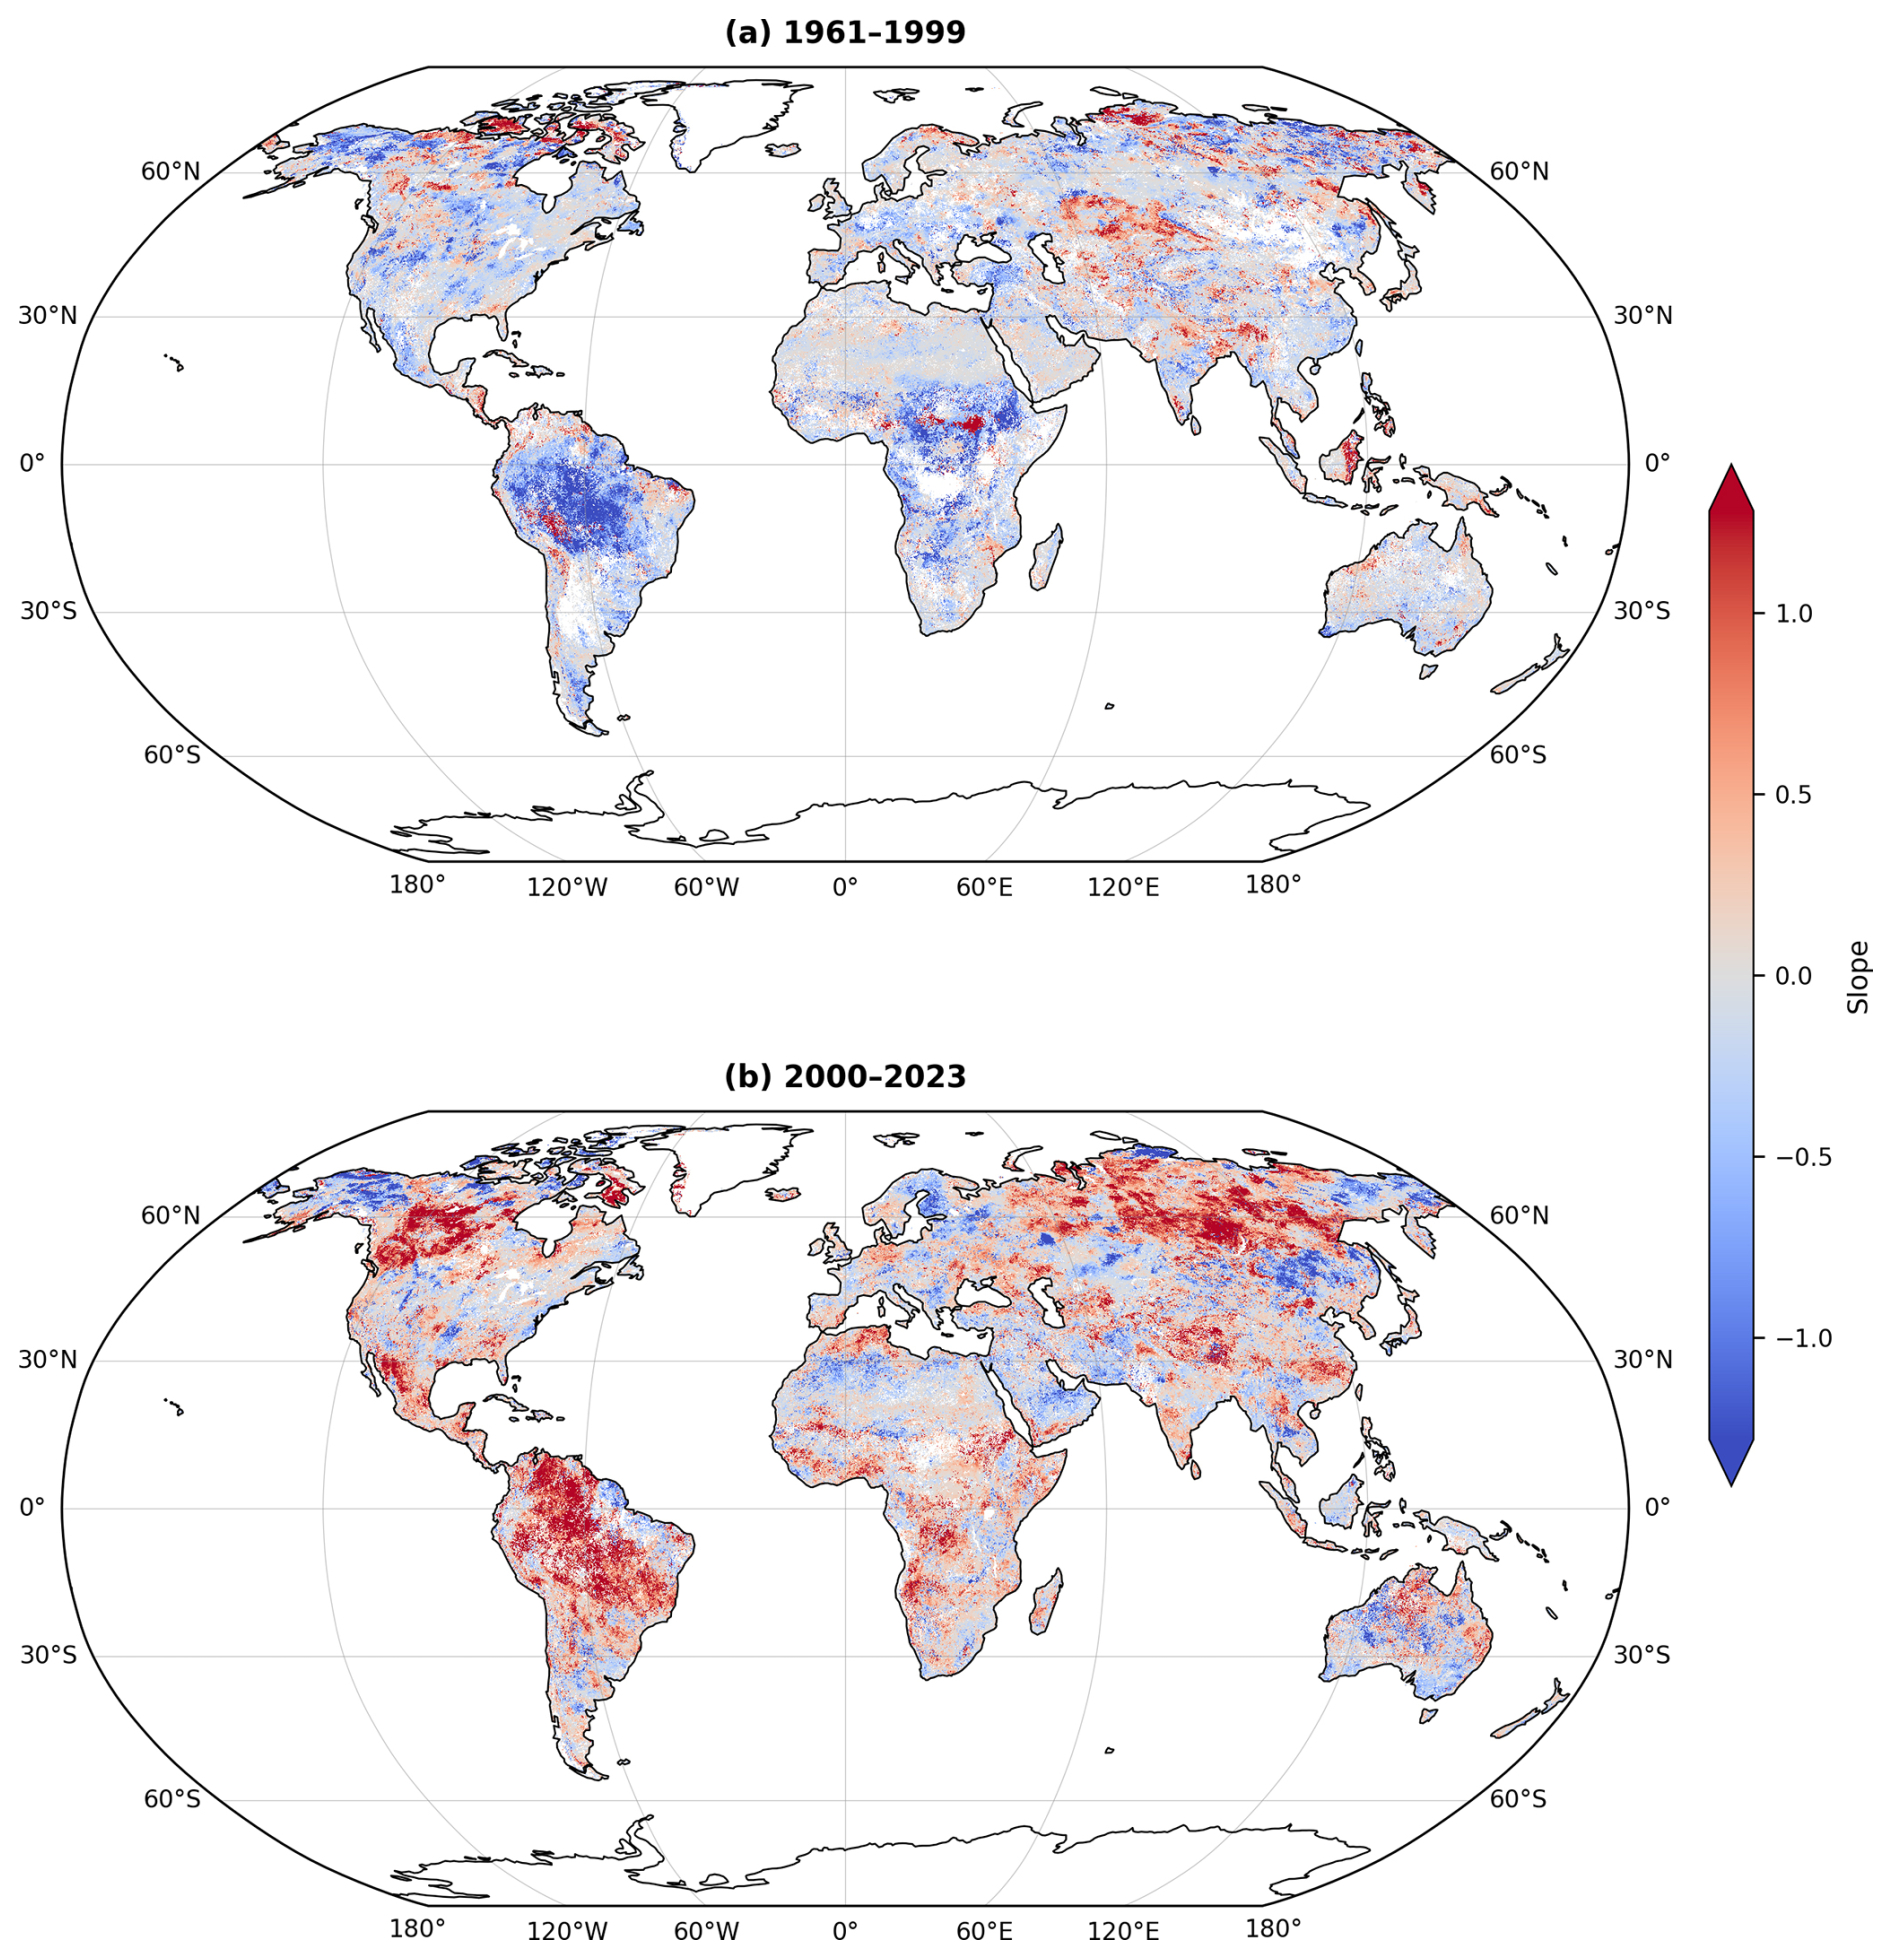
Figure 7Per-pixel trends in CDHE duration for (a) 1961–1999 and (b) 2000–2023. At each grid cell, event duration is regressed against event year; positive slopes indicate events becoming longer. Only pixels with at least five events and significant slopes (p<0.05) are shown.
The lengthening of events is accompanied by a shift in the timescales on which SSTCI varies. Continuous wavelet analysis of the daily SSTCI series over the Yangtze River Basin and the Amazon Basin, two hydro-climatically distinct hotspots, shows a post-2000 emergence of spectral power linking seasonal variability to interannual timescales in both basins, consistent with a transition from short-lived pulses to more sustained compound regimes; the full analysis is provided in the Supplement (Fig. S7).
3.7 Spatiotemporal Evolution of the 2022 Global CDHE event
To further demonstrate the utility of the Global CDHE Event Catalogue in monitoring large-scale climate anomalies, we reconstructed the spatiotemporal footprint of the 2022 Northern Hemisphere summer. Unlike raw index maps which can be noisy, Fig. 8 visualizes the binary status of active events derived from our optimized catalogue. It displays grid cells identified as experiencing a confirmed, compound event during each month from June to October 2022. This helps to visualize the monthly evolution of active CDHE events, revealing a distinct transition from localized onset to hemispheric synchronization.
In early summer (June), the event footprint was spatially fragmented. Active compound episodes were largely confined to the subtropics, including the Middle East, and parts of the Southern United States, while the Eurasian mid-latitudes remained relatively quiescent. By July, however, the anomalies began to expand significantly, where intensified drying and heating signals appeared across Western Europe and Central Asia, and nascent compound conditions emerged in the Yangtze River Basin (YRB). The event reached its mature phase in August, characterized by a hemispherical synchronized pattern. The spatial analysis reveals a massive, expansion of active CDHEs across three distinct mid-latitude centers: Western Central Europe, the Yangtze River Basin, and Western North America. The simultaneous locking of these high-impact events across longitudinally distant regions suggests the presence of a phase-locked atmospheric wave pattern rather than independent regional variability. Specifically, this tri-polar configuration aligns with the Rossby Wave-4 pattern, which has been identified as a primary driver amplifying concurrent heat extremes in these specific mid-latitude regions (Yang et al., 2024). The persistence of this wave pattern likely anchored the high-pressure systems over the continents, allowing land–atmosphere feedbacks to amplify the initial atmospheric anomalies into severe compound extremes.
In September, while the European signal had begun to dissipate, the event exhibited persistence in a few parts of the YRB and Northwestern North America, highlighting the prolonged duration of these specific blocking events (Zhang et al., 2023a). By October, a distinct meridional shift occurred. As the primary Northern Hemisphere mid-latitude anomalies terminated, the center of active compound stress migrated toward the Southern Hemisphere, with widespread event activation observed in the Amazon Basin. This transition captures the onset of the severe 2022–2023 Amazon drought, which was driven by the persistent La Niña conditions and anomalously warm Tropical North Atlantic waters (Espinoza et al., 2024). This clear shift highlights the dataset's ability to track the seasonal migration of compound climate stress from the Northern mid-latitudes to the tropics.
Thus, Fig. 8 demonstrates the SSTCI capacity to provide a coherent, noise filtered inventory of large scale events. However, validating the dataset's operational utility requires more than just global consistency; it demands pixel-level precision. To verify the index's ability to resolve the specific day-to-day evolution of these identified events, we next zoom in on the Yangtze River Basin, the epicenter of the August anomaly, to examine the granular anatomy of the 2022 event.
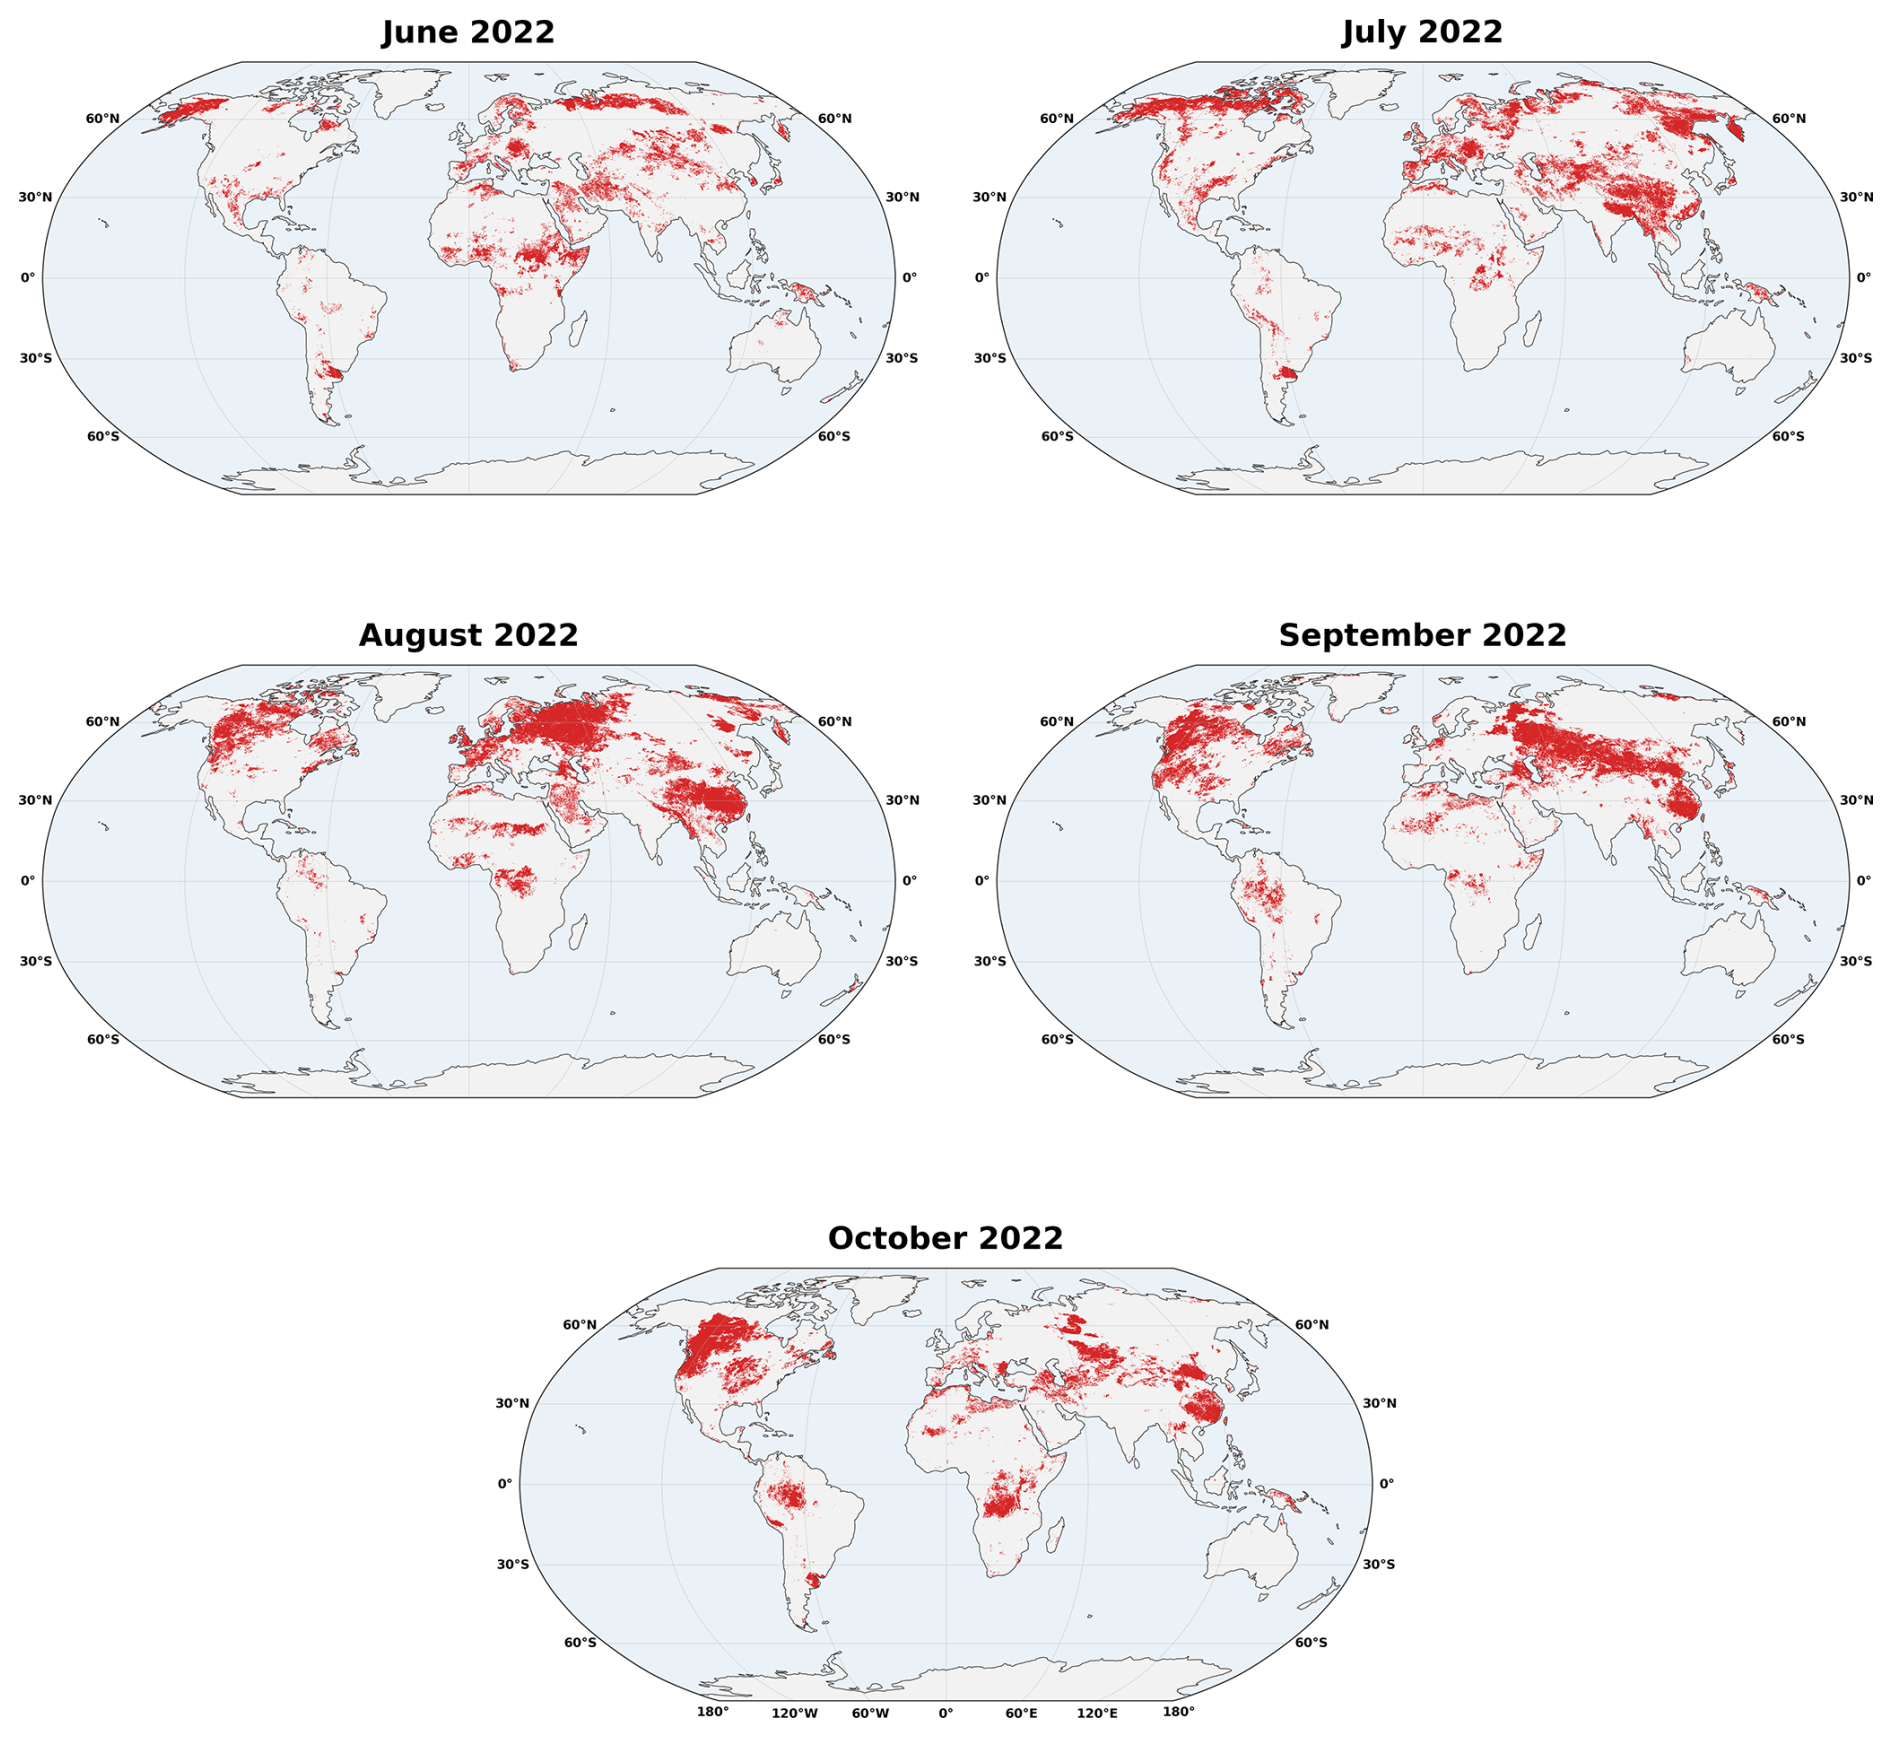
Figure 8Monthly spatiotemporal footprint of active CDHE events during June–October 2022, reconstructed from the optimized Global CDHE Event Catalogue. Red grid cells indicate locations where a confirmed extreme compound event was active during the corresponding month. The sequence reveals a clear transition from fragmented early-summer activity in June, largely confined to subtropical regions, to broad expansion in July and a hemispherically synchronized peak in August across Western/Central Europe, the Yangtze River Basin, and western North America.
3.8 Spatiotemporal evolution of the 2022 Yangtze River Basin CDHE event
Building on the large-scale patterns, the index is next evaluated at event scale by zooming into the Yangtze River Basin (YRB), the hotspot of the 2022 event. The 2022 Yangtze River Basin (YRB) CDHE event, shown in Fig. 9, is used as a representative case to examine the spatiotemporal evolution of CDHE with SSTCI. The event, marking the hottest summer since 1961 (Lu et al., 2023, 2024) combined an unprecedented heatwave with a major precipitation deficit (Zhang et al., 2023a) and ultimately triggered a severe hydrological drought-heatwave event (Ni et al., 2024), making it an excellent testbed for evaluating SSTCI. The analysis focuses on July–September 2022, using weekly composites and a daily basin mean time series to capture the onset, peak, and decay of the extreme event.
During 26 July–1 August, (i) initial drying appears over the southern YRB (SASMI ≈ −1.0 to −1.5) alongside weak temperature anomalies (STI .0), yielding near neutral SSTCI (0 to −1). (ii) 2–8 August marks the onset of the event, basin-wide soil moisture declines rapidly and warming intensifies (SASMI 1.5 to −2.0; STI 1.5 to +2.0), driving SSTCI to 1.5 to −2.0. From 9–29 August, the event sustained an intensified three-week phase: (iii) it peaked during 9–15 August with deep soil deficits (SASMI < −2.0) and severe heat (STI 2.5), yielding the most negative compound signal (SSTCI < −2.5); 16–22 August then plateaued, with partial western recovery but persistent central/eastern dryness and high temperature remains hence and slightly negative SSTCI (∼ −1.5 to −2.0); a late-August pulse (23–29 August) re-intensified conditions as drying strengthened over the south/central basin (SASMI ∼ −2.0) and warmth shifted north (STI ∼ +2.2), pushing SSTCI back below −2.0 across the central YRB. (iv) The decline phase is marked in early September as temperatures eased (STI 1.0) while soils began to recharge (SASMI trending toward −1.0); SSTCI rises toward neutral (≈ 0 to +1), with only localized negative pockets where dryness lingers. Overall, the weekly evolution of the 2022 YRB CDH event revealed distinct phases, beginning from an initiation phase in late July–early August and a three-week peak phase, to a termination phase of the event in September. This detailed temporal depiction of CDH behavior captures the event complexity, revealing details that are otherwise obscured in coarser monthly analyses.
This process chain aligns closely with the patterns seen in our indices: daily SSTCI resolves the timing of onset, peak, and termination; weekly composites map the evolving spatial and temporal footprint; and monthly aggregation consolidates the cumulative anomaly (Fig. S8). Together, these lines of evidence support SSTCI as a practical, multi timescale diagnostic for monitoring and decision support in compound hot–dry extremes.
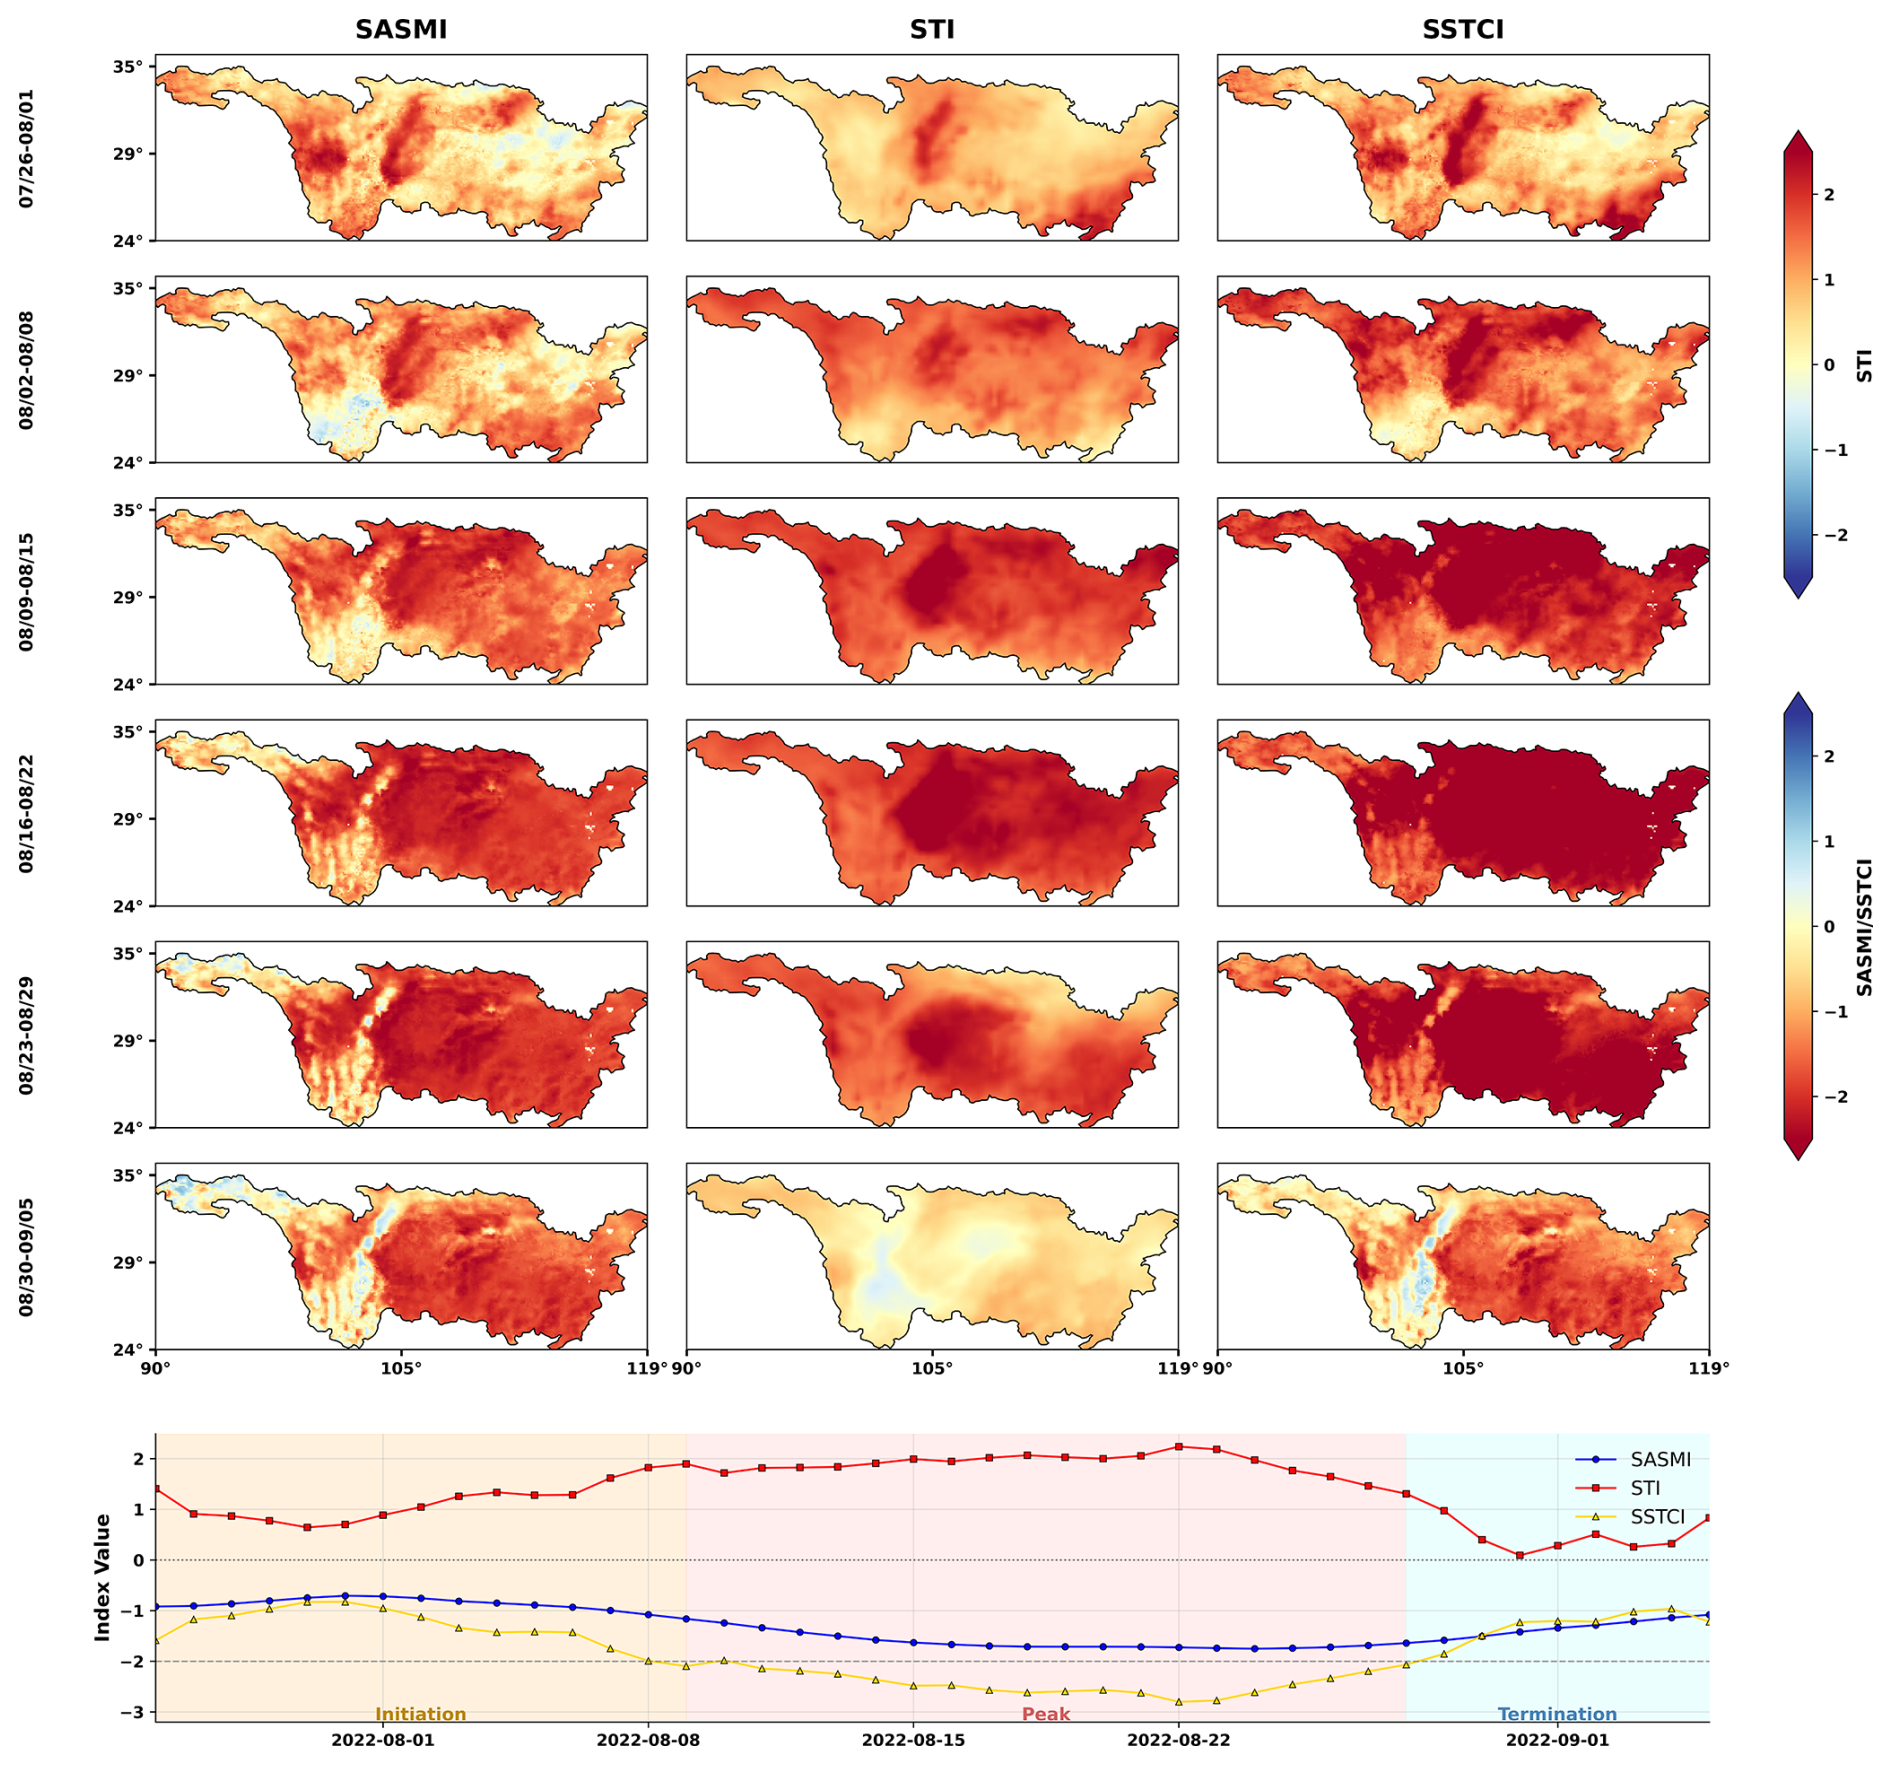
Figure 9Weekly spatiotemporal evolution of the 2022 CDHE over the Yangtze River Basin (YRB), shown using weekly composites of SASMI, STI, and SSTCI together with the daily basin-mean time series (bottom). The sequence captures the full event lifecycle from late July to early September 2022.
3.9 Limitations and outlook
The SSTCI is derived from ERA5-Land and ERA5 reanalysis, and therefore inevitably inherits uncertainties associated with model physics, parameterizations, and the uneven availability of assimilated observations. While these products provide globally consistent coverage, performance can be weaker in observation-data-sparse regions and in areas with complex surface conditions. In particular, cold and high-latitude environments require caution because near-surface soil-moisture behavior can be affected by frozen-phase processes, which may influence inferred moisture memory and the compound signal, while hyper-arid regions have negligible dry–wet dynamic range and are correspondingly low confidence and are masked in our evaluation. ERA5-Land also contains no explicit irrigation scheme, which implies that anthropogenic water management is not adequately represented in the soil moisture fields. Another limitation concerns methodological assumptions such as the characteristic dry-down timescale (τ) which is estimated as a median over 1961–2023, implicitly assuming relatively stable soil-memory behavior through time. In regions that have experienced substantial land-use change or urbanization, dry-down dynamics may have evolved, introducing uncertainty in the antecedent weighting, especially in recent decades. In addition, the event catalogue is intentionally tailored to extreme CDHEs by pre-identifying spells below a fixed SSTCI threshold (−2); this design supports a clean inventory of only extreme events, but it also means that moderate compound anomalies are not represented as discrete events, although event statistics can be sensitive to the chosen threshold. Finally, the implementation relies on top-layer soil moisture (0–7 cm). This layer is where land–atmosphere coupling is most directly characterized and is therefore appropriate to the daily-scale signal SSTCI targets. However, it does not represent the deeper root-zone constraints that govern vegetation stress and prolonged drought persistence. Thus, the index is optimized for rapid surface coupling rather than deep vegetation water stress and should be interpreted with that scope in mind.
Future work will focus on broadening the SSTCI framework beyond these stated limitations. A priority is to better quantify uncertainty by repeating the SSTCI construction with independent soil moisture products (e.g., satellite-based datasets) and benchmarking against dense in situ networks where available, thereby clarifying where reanalysis-driven biases may propagate into compound extremes. Methodologically, incorporating root zone soil moisture and allowing the dry-down memory parameter (τ) to vary in time would better represent deep vegetation water stress and account for multi-decadal land surface change, improving the physical realism of antecedent weighting in rapidly transforming regions. Furthermore, since ERA5-Land provides soil moisture at multiple depths on the same grid, a root-zone or multi-layer variant can be constructed within the present framework, and a systematic comparison across depths is a natural next step that this near-surface product is designed to enable. Furthermore, the per-grid-cell event records provided here are also the natural input to spatio-temporal clustering, from which coherent compound event objects spanning multiple grid cells could be assembled. Released openly on a uniform global daily grid, SSTCI is likewise usable as a member of a multi-index ensemble for quantifying uncertainty in compound dry-hot characterization. Likewise, since SSTCI requires only near-surface soil moisture and temperature, computing it from forecast fields is a possible route to early warning. In addition, SSTCI naturally supports a severity tiered characterization of compound dry-hot conditions (e.g., moderate, severe, extreme) through multi-threshold catalogues, enabling intensity dependent impact assessments and more systematic sensitivity testing than a single extreme cutoff. Finally, applying this daily scale event identification framework to global climate model projections (e.g., CMIP6) offers a promising avenue for assessing how the characteristics of compound extremes will evolve under future warming scenarios.
The primary dataset produced in this study is the daily Standardized Soil Moisture–Temperature Compound Index (SSTCI), which provides a continuous record of compound dry-hot stress from 1961 to 2023. This dataset covers all global land areas between 90° N and 60° S (Antarctica excluded) at a 0.1° Resolution. Derived from this primary index, we also provide the Global CDHE Event Catalogue, which identifies independent CDHE events and their associated metrics for the same period and spatial domain.
The SSTCI dataset is openly available in NetCDF format via Zenodo under the DOI https://doi.org/10.5281/zenodo.18280747 (Aftab et al., 2026c), while the CDHE event catalogue is available under the DOI https://doi.org/10.5281/zenodo.20826759 (Aftab et al., 2026b). The full source code used to compute SSTCI is publicly accessible at https://github.com/Rukhshinda-Aftab/Standarized-Soil-Moisture-Tempreture-Compound-Index-SSTCI- (last access: 29 October 2026) and https://doi.org/10.5281/zenodo.23756682 (Aftab et al., 2026d). The CDHE event catalogue is available at https://github.com/Rukhshinda-Aftab/Compound-dry-hot-extreme-CDHE-event-catalogue- (last access: 29 October 2026) and https://doi.org/10.5281/zenodo.23756427 (Aftab et al., 2026e). These data and code resources together support full reproducibility of the results presented in this study.
In this study, we present two complementary products for global CDHEs over 1961–2023: the daily Standardized Soil Moisture–Temperature Compound Index (SSTCI) at 0.1° resolution and a companion Global CDHE Event Catalogue that translates the continuous daily signal into a discrete inventory of statistically independent extreme events with explicit timing and magnitude attributes. SSTCI combines a soil moisture–centric antecedent drought signal (SASMI, informed by grid specific dry-down memory) with a standardized temperature component (STI) via a Frank copula dependence model, while the catalogue applies an objective removal–merging optimization to reduce fragmented spells and retain only independent and statistically significant extreme events.
The reliability of the framework is supported by a structured evaluation, where SASMI shows broad agreement with established daily drought metrics (SPEI and DEDI) in both correlation and agreement on extremes, SSTCI exhibits coherent co-variability and consistent extreme day agreement with an existing compound index (SCDHI), and event-scale analyses demonstrate physically meaningful correspondence with vegetation stress during a documented CDHE, alongside consistent detection of peak compound phases across multiple well studied events. Using the resulting 63-year record, we identify a clear post-2000 shift towards more persistent CDHEs, where duration lengthening emerges as the dominant change signal in several hotspots (notably the Amazon and the Yangtze River Basin). The dataset's practical value is further illustrated through reconstructions of major events, capturing early soil-moisture preconditioning ahead of the peak heat in the 2010 Russian event and revealing hemispheric-scale synchronization during the 2022 Northern Hemisphere summer while resolving the basin scale lifecycle of the Yangtze event. Collectively, SSTCI and the Event Catalogue provide a standardized daily foundation that bridges climatological monitoring with process relevant interpretation, enabling event based attribution, impact alignment, and early warning applications for compound dry hot hazards in a warming climate.
The supplement related to this article is available online at https://doi.org/10.5194/essd-18-7981-2026-supplement.
R.A., G.W., D.F.T.H., and B.S. contributed to the conceptualization and methodology of the study. R.A., D.F.T.H., and B.S developed and implemented the workflow. R.A. conducted the formal analysis, investigation, and validation, with support from S.H.S., F.S., and C.Z. in data curation and validation. F.S., E.Y., and A.H.J. contributed to visualization, writing, and review. G.W. provided supervision, resources, project administration, and funding acquisition. R.A. wrote the manuscript, with review and input from all co-authors.
The contact author has declared that none of the authors has any competing interests.
Publisher's note: Copernicus Publications remains neutral with regard to jurisdictional claims made in the text, published maps, institutional affiliations, or any other geographical representation in this paper. The authors bear the ultimate responsibility for providing appropriate place names. Views expressed in the text are those of the authors and do not necessarily reflect the views of the publisher.
We thank Diego Miralles for helpful discussions on the framework. We gratefully acknowledge funding support from the National Key Research and Development Program of China (2026YFE0100700) and the NSFC-FWO Bilateral Research Cooperation Program CausalHeat (G0AOO25N). We also acknowledge the use of AI-assisted writing tools to support language refinement, editing, and clarity improvements during manuscript preparation. The scientific content, analyses, interpretation, and conclusions remain the responsibility of the authors.
This study was supported by the National Key Research and Development Program of China (grant no. 2026YFE0100700), the National Natural Science Foundation of China (Regular Project: Causal Inference of Vegetation–Climate Interactions, Project no. 42275028), and by the research Foundation Flanders under the FWO–NSFC bilateral research project funding (CausalHeat, G0AOO25N).
This paper was edited by Alexander Gruber and reviewed by Adriaan J. (Ryan) Teuling and one anonymous referee.
Aftab, R.: The Standardized Soil Moisture-Temperature Compound Index (SSTCI): Daily scale global data set and event catalogue for compound dry–hot extremes (1961–2023), TIB AV-PORTAL [video], https://doi.org/10.5446/74082, 2026.
Aftab, R., Wang, G., Hagan, D. F. T., Shan, B., Shah, S. H., Siddique, F., Zhou, C., Wei, X., Jaffry, A. H., and Yeboah, E.: A daily soil moisture–temperature compound index for characterising dry-hot extremes, Int. J. Climatol., e70306, https://doi.org/10.1002/joc.70306, 2026a.
Aftab, R., Hagan, D. F. T., Wang, G., Shan, B., Shah, S. H., Zhou, C., Wei, X., Siddique, F., Jaffry, A. H., and Yeboah, E.: Global CDHE Event Catalogue (0.1°, 1961–2023), Zenodo [data set], https://doi.org/10.5281/zenodo.20826759, 2026b.
Aftab, R., Hagan, D. F. T., Wang, G., Shan, B., Shah, S. H., Zhou, C., Wei, X., Siddique, F., Jaffry, A. H., and Yeboah, E.: Standardized Soil Moisture–Temperature Compound Index (SSTCI) (v01), Zenodo [data set], https://doi.org/10.5281/zenodo.18280747, 2026c.
Aftab, R., Hagan, D. F. T., Wang, G., Shan, B., Shah, S. H., Zhou, C., Wei, X., Siddique, F., Jaffry, A. H., and Yeboah, E.: Rukhshinda-Aftab/Standarized-Soil-Moisture-Tempreture-Compound-Index-SSTCI-: SSTCI v1.0 (ESSD publication version) (v1.1.0), Zenodo [code], https://doi.org/10.5281/zenodo.23756682, 2026d.
Aftab, R., Hagan, D. F. T., Wang, G., Shan, B., Shah, S. H., Zhou, C., Wei, X., Siddique, F., Jaffry, A. H., and Yeboah, E.: Rukhshinda-Aftab/Compound-dry-hot-extreme-CDHE-event-catalogue-: CDHE event Catalogue v1.0 (ESSD publication version) (v1.0), Zenodo [code], https://doi.org/10.5281/zenodo.23756427, 2026e.
Alizadeh, M. R., Adamowski, J., Nikoo, M. R., AghaKouchak, A., Dennison, P., and Sadegh, M.: A century of observations reveals increasing likelihood of continental-scale compound dry-hot extremes, Sci. Adv., 6, aaz4571, https://doi.org/10.1126/sciadv.aaz4571, 2020.
Australian Government Bureau of Meteorology: Monthly Weather Review Australia: November 2019, https://www.bom.gov.au/climate/current/month/aus/archive/201911.summary.shtml (last access: 29 October 2026), 2023.
Barriopedro, D., Fischer, E. M., Luterbacher, J., Trigo, R. M., and García-Herrera, R.: The hot summer of 2010: Redrawing the temperature record map of Europe, Science, 332, 220–224, https://doi.org/10.1126/science.1201224, 2011.
Beck, H. E., Pan, M., Miralles, D. G., Reichle, R. H., Dorigo, W. A., Hahn, S., Sheffield, J., Karthikeyan, L., Balsamo, G., Parinussa, R. M., van Dijk, A. I. J. M., Du, J., Kimball, J. S., Vergopolan, N., and Wood, E. F.: Evaluation of 18 satellite- and model-based soil moisture products using in situ measurements from 826 sensors, Hydrol. Earth Syst. Sci., 25, 17–40, https://doi.org/10.5194/hess-25-17-2021, 2021.
Christian, J. I., Hobbins, M., Hoell, A., Otkin, J. A., Ford, T. W., Cravens, A. E., Powlen, K. A., Wang, H., and Mishra, V.: Flash drought: A state of the science review, Wiley Interdiscip. Rev. Water, 11, e1714, https://doi.org/10.1002/wat2.1714, 2024.
Espinoza, J.-C., Jimenez, J. C., Marengo, J. A., Schongart, J., Ronchail, J., Lavado-Casimiro, W., and Ribeiro, J. V. M.: The new record of drought and warmth in the Amazon in 2023 related to regional and global climatic features, Sci. Rep., 14, 8107, https://doi.org/10.1038/s41598-024-58782-5, 2024.
Feng, S., Hao, Z., Zhang, X., and Hao, F.: Probabilistic evaluation of the impact of compound dry-hot events on global maize yields, Sci. Total Environ., 689, 1228–1234, https://doi.org/10.1016/j.scitotenv.2019.06.373, 2019.
Funk, C., Harrison, L., Shukla, S., Korecha, D., Magadzire, T., Husak, G., Galu, G., and Hoell, A.: Assessing the contributions of local and East Pacific warming to the 2015 droughts in Ethiopia and southern Africa, B. Am. Meteorol. Soc., 97, S75–S80, https://doi.org/10.1175/BAMS-D-16-0167.1, 2016.
Funk, C., Harrison, L., Shukla, S., Pomposi, C., Galu, G., Korecha, D., Husak, G., Magadzire, T., Davenport, F., Hillbruner, C., Eilerts, G., Zaitchik, B., and Verdin, J.: Examining the role of unusually warm Indo-Pacific sea-surface temperatures in recent African droughts, Q. J. Roy. Meteor. Soc., 144, 360–383, https://doi.org/10.1002/qj.3266, 2018.
Geirinhas, J. L., Russo, A., Libonati, R., Sousa, P. M., Miralles, D. G., and Trigo, R. M.: Recent increasing frequency of compound summer drought and heatwaves in Southeast Brazil, Environ. Res. Lett., 16, abe0eb, https://doi.org/10.1088/1748-9326/abe0eb, 2021.
Hagan, D. F. T., Parinussa, R. M., Wang, G., and Draper, C. S.: An evaluation of soil moisture anomalies from global model-based datasets over the People's Republic of China, Water, 12, 117, https://doi.org/10.3390/w12010117, 2020.
Hansen, J., Sato, M., and Ruedy, R.: Perception of climate change, P. Natl. Acad. Sci. USA, 109, E2415–E2423, https://doi.org/10.1073/pnas.1205276109, 2012.
Hao, Z., Hao, F., Singh, V. P., and Zhang, X.: Changes in the severity of compound drought and hot extremes over global land areas, Environ. Res. Lett., 13, 124022, https://doi.org/10.1088/1748-9326/aaee96, 2018.
Hao, Z., Hao, F., Singh, V. P., and Zhang, X.: Statistical prediction of the severity of compound dry-hot events based on El Niño-Southern Oscillation, J. Hydrol., 572, 243–250, https://doi.org/10.1016/j.jhydrol.2019.03.001, 2019a.
Hao, Z., Phillips, T. J., Hao, F., and Wu, X.: Changes in the dependence between global precipitation and temperature from observations and model simulations, Int. J. Climatol., 39, 4895–4906, https://doi.org/10.1002/joc.6111, 2019b.
Hosseinzadehtalaei, P., Termonia, P., and Tabari, H.: Projected changes in compound hot-dry events depend on the dry indicator considered, Commun. Earth Environ., 5, https://doi.org/10.1038/s43247-024-01352-4, 2024.
Huang, H., Zhu, Z., and Li, J.: Disentangling the unprecedented Yangtze River Basin extreme high temperatures in summer 2022: Combined impacts of the reintensified La Niña and strong positive NAO, J. Climate, 37, 927–942, https://doi.org/10.1175/JCLI-D-23-0466.1, 2024.
Intergovernmental Panel on Climate Change (IPCC): Climate Change 2021 – The Physical Science Basis, Cambridge University Press, https://doi.org/10.1017/9781009157896, 2021.
Jiang, H., Wang, G., Li, S., Ullah, W., Amankwah, S. O. Y., and Lu, J.: Effect of CO2 concentration on drought assessment in China, Int. J. Climatol., 42, 7465–7482, https://doi.org/10.1002/joc.7657, 2022.
Li, H., Cao, Y., Xiao, J., Yuan, Z., Hao, Z., Bai, X., Wu, Y., and Liu, Y.: A daily gap-free normalized difference vegetation index dataset from 1981 to 2023 in China, Sci. Data, 11, https://doi.org/10.1038/s41597-024-03364-3, 2024.
Li, J., Wang, Z., Wu, X., and Xu, C.-Y.: Toward monitoring short-term droughts using a novel daily scale, standardized antecedent precipitation evapotranspiration index, J. Hydrometeorol., 21, 891–908, https://doi.org/10.1175/JHM-D-19-0298.1, 2020.
Li, J., Wang, Z., Wu, X., Zscheischler, J., Guo, S., and Chen, X.: A standardized index for assessing sub-monthly compound dry and hot conditions with application in China, Hydrol. Earth Syst. Sci., 25, 1587–1601, https://doi.org/10.5194/hess-25-1587-2021, 2021.
Li, Y., Xu, H., and Liu, D.: Features of the extremely severe drought in the east of Southwest China and anomalies of atmospheric circulation in summer 2006, Acta Meteorol. Sin., 25, 176–187, https://doi.org/10.1007/s13351-011-0025-8, 2011.
Libonati, R., Geirinhas, J. L., Silva, P. S., Russo, A., Rodrigues, J. A., Belém, L. B. C., Nogueira, J., Roque, F. O., DaCamara, C. C., Nunes, A. M. B., Marengo, J. A., and Trigo, R. M.: Assessing the role of compound drought and heatwave events on unprecedented 2020 wildfires in the Pantanal, Environ. Res. Lett., 17, 015005, https://doi.org/10.1088/1748-9326/ac462e, 2022.
Liu, X., Yu, S., Yang, Z., Dong, J., and Peng, J.: The first global multi-timescale daily SPEI dataset from 1982 to 2021, Sci. Data, 11, https://doi.org/10.1038/s41597-024-03047-z, 2024.
Lu, R., Xu, K., Chen, R., Chen, W., Li, F., and Lv, C.: Heat waves in summer 2022 and increasing concern regarding heat waves in general, Atmos. Ocean. Sci. Lett., 16, 100290, https://doi.org/10.1016/j.aosl.2022.100290, 2023.
Lu, X., Doi, T., Yuan, C., Luo, J., Behera, S. K., and Yamagata, T.: Anatomy of the 2022 scorching summer in the Yangtze River Basin using the SINTEX-F2 seasonal prediction system, Geophys. Res. Lett., 51, https://doi.org/10.1029/2024GL109554, 2024.
Mazdiyasni, O. and AghaKouchak, A.: Substantial increase in concurrent droughts and heatwaves in the United States, P. Natl. Acad. Sci. USA, 112, 11484–11489, https://doi.org/10.1073/pnas.1422945112, 2015.
Mbokodo, I. L., Bopape, M. J. M., Ndarana, T., Mbatha, S. M. S., Muofhe, T. P., Singo, M. V., Xulu, N. G., Mohomi, T., Ayisi, K. K., and Chikoore, H.: Heatwave variability and structure in South Africa during summer drought, Climate, 11, https://doi.org/10.3390/cli11020038, 2023.
McColl, K. A., Wang, W., Peng, B., Akbar, R., Short Gianotti, D. J., Lu, H., Pan, M., and Entekhabi, D.: Global characterization of surface soil moisture drydowns, Geophys. Res. Lett., 44, 3682–3690, https://doi.org/10.1002/2017GL072819, 2017.
Mei, M., Zhang, Y. X., and Wang, G. F.: Assessment and pre-assessment of compound hot and drought events over Yangtze River Basin, Environ. Res. Lett., 19, https://doi.org/10.1088/1748-9326/ad7b5e, 2024.
Miralles, D. G., van den Berg, M. J., Teuling, A. J., and de Jeu, R. A. M.: Soil moisture–temperature coupling: A multiscale observational analysis, Geophys. Res. Lett., 39, L21707, https://doi.org/10.1029/2012GL053703, 2012.
Miralles, D. G., Teuling, A. J., Van Heerwaarden, C. C., and De Arellano, J. V. G.: Mega-heatwave temperatures due to combined soil desiccation and atmospheric heat accumulation, Nat. Geosci., 7, 345–349, https://doi.org/10.1038/ngeo2141, 2014.
Muñoz-Sabater, J., Dutra, E., Agustí-Panareda, A., Albergel, C., Arduini, G., Balsamo, G., Boussetta, S., Choulga, M., Harrigan, S., Hersbach, H., Martens, B., Miralles, D. G., Piles, M., Rodríguez-Fernández, N. J., Zsoter, E., Buontempo, C., and Thépaut, J.-N.: ERA5-Land: a state-of-the-art global reanalysis dataset for land applications, Earth Syst. Sci. Data, 13, 4349–4383, https://doi.org/10.5194/essd-13-4349-2021, 2021.
Nguyen, H., Wheeler, M. C., Otkin, J. A., Nguyen-Huy, T., and Cowan, T.: Climatology and composite evolution of flash drought over Australia and its vegetation impacts, J. Hydrometeorol., 24, 1087–1101, https://doi.org/10.1175/JHM-D-22-0033.1, 2023.
Ni, Y., Qiu, B., Miao, X., Li, L., Chen, J., Tian, X., Zhao, S., and Guo, W.: Shift of soil moisture-temperature coupling exacerbated 2022 compound hot-dry event in eastern China, Environ. Res. Lett., 19, https://doi.org/10.1088/1748-9326/ad178c, 2024.
Osman, M., Zaitchik, B. F., and Winstead, N. S.: Cascading drought-heat dynamics during the 2021 Southwest United States heatwave, Geophys. Res. Lett., 49, https://doi.org/10.1029/2022GL099265, 2022.
Perkins-Kirkpatrick, S. E. and Lewis, S. C.: Increasing trends in regional heatwaves, Nat. Commun., 11, 3357, https://doi.org/10.1038/s41467-020-16970-7, 2020.
Rahmati, M., Amelung, W., Brogi, C., Dari, J., Flammini, A., Bogena, H., Brocca, L., Chen, H., Groh, J., Koster, R. D., McColl, K. A., Montzka, C., Moradi, S., Rahi, A., Sharghi S., F., and Vereecken, H.: Soil moisture memory: State-of-the-art and the way forward, Rev. Geophys., 62, https://doi.org/10.1029/2023RG000828, 2024.
Ridder, N. N., Pitman, A. J., Westra, S., Ukkola, A., Hong, X. Do, Bador, M., Hirsch, A. L., Evans, J. P., Di Luca, A., and Zscheischler, J.: Global hotspots for the occurrence of compound events, Nat. Commun., 11, https://doi.org/10.1038/s41467-020-19639-3, 2020.
Sabut, A. and Mishra, A.: A century of drought research (1900–2023): Scientific developments, methodological innovations, and emerging frontiers, Water Resour. Res., 62, e2025WR041987, https://doi.org/10.1029/2025WR041987, 2026.
Seneviratne, S. I., Corti, T., Davin, E. L., Hirschi, M., Jaeger, E. B., Lehner, I., Orlowsky, B., and Teuling, A. J.: Investigating soil moisture-climate interactions in a changing climate: A review, Earth-Sci. Rev., 99, 125–161, https://doi.org/10.1016/j.earscirev.2010.02.004, 2010.
Seneviratne, S. I. and Zhang, X.: Weather and climate extreme events in a changing climate, in: Climate Change 2021 – The Physical Science Basis, Cambridge University Press, 1513–1766, https://doi.org/10.1017/9781009157896.013, 2021.
Seo, Y. W. and Ha, K. J.: Changes in land-atmosphere coupling increase compound drought and heatwaves over northern East Asia, npj Clim. Atmos. Sci., 5, https://doi.org/10.1038/s41612-022-00325-8, 2022.
Shan, B., Verhoest, N. E. C., and De Baets, B.: Identification of compound drought and heatwave events on a daily scale and across four seasons, Hydrol. Earth Syst. Sci., 28, 2065–2080, https://doi.org/10.5194/hess-28-2065-2024, 2024.
Tabari, H. and Willems, P.: Global risk assessment of compound hot-dry events in the context of future climate change and socioeconomic factors, npj Clim. Atmos. Sci., 6, https://doi.org/10.1038/s41612-023-00401-7, 2023.
Tripathy, K. P. and Mishra, A. K.: How unusual is the 2022 European compound drought and heatwave event?, Geophys. Res. Lett., 50, https://doi.org/10.1029/2023GL105453, 2023.
Vicente-Serrano, S. M., Beguería, S., and López-Moreno, J. I.: A multiscalar drought index sensitive to global warming: The standardized precipitation evapotranspiration index, J. Climate, 23, 1696–1718, https://doi.org/10.1175/2009JCLI2909.1, 2010.
Wang, H., Zhang, G., Zhang, S., Shi, L., Su, X., Song, S., Feng, K., Zhang, T., and Fu, X.: Development of a novel daily-scale compound dry and hot index and its application across seven climatic regions of China, Atmos. Res., 287, https://doi.org/10.1016/j.atmosres.2023.106700, 2023.
Wu, H., Su, X., and Singh, V. P.: Blended dry and hot events index for monitoring dry-hot events over global land areas, Geophys. Res. Lett., 48, https://doi.org/10.1029/2021GL096181, 2021.
Wu, X., Hao, Z., Zhang, X., Li, C., and Hao, F.: Evaluation of severity changes of compound dry and hot events in China based on a multivariate multi-index approach, J. Hydrol., 583, https://doi.org/10.1016/j.jhydrol.2020.124580, 2020.
Yang, X., Zeng, G., Zhang, S., Iyakaremye, V., Shen, C., Wang, W. C., and Chen, D.: Phase-locked Rossby wave-4 pattern dominates the 2022-like concurrent heat extremes across the Northern Hemisphere, Geophys. Res. Lett., 51, https://doi.org/10.1029/2023GL107106, 2024.
Yang, Y., Roderick, M. L., Zhang, S., McVicar, T. R., and Donohue, R. J.: Hydrologic implications of vegetation response to elevated CO2 in climate projections, Nat. Clim. Change, 9, 44–48, https://doi.org/10.1038/s41558-018-0361-0, 2019.
Yuan, X., Wang, Y., Ji, P., Wu, P., Sheffield, J., and Otkin, J. A.: A global transition to flash droughts under climate change, Science, 380, 187–191, https://doi.org/10.1126/science.abn6301, 2023.
Zhang, L., Yu, X., Zhou, T., Zhang, W., Hu, S., and Clark, R.: Understanding and attribution of extreme heat and drought events in 2022: Current situation and future challenges, Adv. Atmos. Sci., 40, 1941–1951, https://doi.org/10.1007/s00376-023-3171-x, 2023a.
Zhang, Q., Yang, J., and Wang, W.: The summer drought and heat wave in Sichuan and Chongqing in 2006, Clim. Environ. Res., 13, 317–325, 2008.
Zhang, W., Mao, W., Jiang, F., Stuecker, M. F., Jin, F. F., and Qi, L.: Tropical Indo-Pacific compounding thermal conditions drive the 2019 Australian extreme drought, Geophys. Res. Lett., 48, https://doi.org/10.1029/2020GL090323, 2021.
Zhang, X., Duan, J., Cherubini, F., and Ma, Z.: A global daily evapotranspiration deficit index dataset for quantifying drought severity from 1979 to 2022, Sci. Data, 10, https://doi.org/10.1038/s41597-023-02756-1, 2023b.
Zhang, Y., Hao, Z., Zhang, X., and Hao, F.: Anthropogenically forced increases in compound dry and hot events at the global and continental scales, Environ. Res. Lett., 17, 024021, https://doi.org/10.1088/1748-9326/ac43e0, 2022.
Zhong, Z., He, B. I. N., Guo, L., and Zhang, Y.: Performance of various forms of the Palmer Drought Severity Index in China from 1961 to 2013, J. Hydrometeorol., 20, 1867–1885, https://doi.org/10.1175/JHM-D-18-0247.1, 2019.
Zhou, C., Wang, G., Jiang, H., Li, S., Shi, X., Hu, Y., and Cabral, P.: Spatio-temporal patterns of compound dry-hot extremes in China, Atmos. Res., 314, https://doi.org/10.1016/j.atmosres.2024.107795, 2025.
Zhou, J., Zhao, J., Li, Y., Bai, Y., Wu, Y., Xiang, B., and Zhu, H.: The hottest center: characteristics of high temperatures in midsummer of 2022 in Chongqing and its comparison with 2006, Theor. Appl. Climatol., 155, 151–162, https://doi.org/10.1007/s00704-023-04609-8, 2024.
Zhou, S., Williams, A. P., Berg, A. M., Cook, B. I., Zhang, Y., Hagemann, S., Lorenz, R., Seneviratne, S. I., and Gentine, P.: Land–atmosphere feedbacks exacerbate concurrent soil drought and atmospheric aridity, P. Natl. Acad. Sci. USA, 116, 18848–18853, https://doi.org/10.1073/pnas.1904955116, 2019.
Zscheischler, J. and Seneviratne, S. I.: Dependence of drivers affects risks associated with compound events, Sci. Adv., 3, e1700263, https://doi.org/10.1126/sciadv.1700263, 2017.
Zscheischler, J., Westra, S., Van Den Hurk, B. J. J. M., Seneviratne, S. I., Ward, P. J., Pitman, A., Aghakouchak, A., Bresch, D. N., Leonard, M., Wahl, T., and Zhang, X.: Future climate risk from compound events, Nat. Clim. Change, 8, 469–477, https://doi.org/10.1038/s41558-018-0156-3, 2018.