the Creative Commons Attribution 4.0 License.
the Creative Commons Attribution 4.0 License.
 | 28 Oct 2026
BorFIT: a novel LiDAR-based training dataset for individual tree segmentation and species detection in northern boreal forests
Jacob Schladebach

Birgit Heim
Léa Enguehard
Mareike Wieczorek
Jakob Broers
Robert Jackisch
Josias Gloy
Kunyan Hao
James Tretton
Anna Gorshunova
BorFIT is a novel northern boreal forest training dataset designed to assist in the segmentation of individual trees and the detection of species from uncrewed aerial vehicle (UAV)-LiDAR point clouds, thus contributing to deep learning-based forestry applications. Recent advancements in AI-supported individual tree detection have shown significant progress; however, satisfactory results remain elusive in dense and structurally-complex boreal forests. We compiled a training dataset designed to remedy this issue. BorFIT comprises 384 UAV-LiDAR point clouds, each with an area of 20 m × 20 m, in the form of reference plots, with up to 200 manually segmented and species classified trees per point cloud. The BorFIT training dataset is derived from UAV-LiDAR surveys at 146 sites carried out between 2021 and 2024 in East Siberia (Yakutia), northwest Canada, and Alaska (USA). The sites were selected along bioclimatic gradients to represent the circumboreal region. From each UAV-LiDAR transect derived point cloud, we extracted a minimum of four reference plots (each 20 m × 20 m) based on maximum tree heights within the plots to systematically sample the apparent tree density gradient. We manually segmented identifiable trees within each reference plot point cloud leading to 16 530 individual trees in total. Following individual tree segmentation, we trained four random forest classifiers for different regions to predict the species of every segmented tree. The predicted tree species include: Picea mariana Britton, Sterns & Poggenb., Picea sitchensis Bong. Carrière, Picea glauca Moench, Voss, Pinus contorta Douglas ex Loudon, Abies lasiocarpa Hook., Nutt., Larix laricina Du Roi, K. Koch, Betula papyrifera Marshall, Betula neoalaskana Regel, Ashburner McAll., Populus balsamifera L., Populus tremuloides Michx., Pinus sylvestris Thunb. and Alnus spp. The data offer the means for 3D space analysis of species distribution and stand structure around the circumboreal region. Furthermore, it can be used as a training dataset for artificial intelligence (AI) applications, and thereby improve our understanding of the boreal forest's vegetation reorganization in response to significant global warming (https://doi.org/10.1594/PANGAEA.980505, Kruse et al., 2026).
- Article
(10604 KB) - Full-text XML
- BibTeX
- EndNote


The boreal forest occupies approximately 25 % of the world's forested land and plays a pivotal role in climate change mitigation (Thiffault, 2019; Kauppi, 2014). This northernmost forest biome is located between the tundra and temperate deciduous forests, accounting for about 12 % of global forest biomass (Pan et al., 2013). The high latitudes, and therefore the boreal region, are warming twice as fast as the global average, which leads to significant changes in vegetation structure (Scheffer et al., 2012). These changes have resulted in alterations in biomass distribution in boreal forests extending beyond the Arctic treeline, and an advancement of broadleaf tree species into previously conifer-dominated stands at the southern boundary (Myneni et al., 1997).
Monitoring the development of the Northern boreal biome under significant global warming is crucial due to its ecological contributions, e.g. carbon sequestration. Assessing climate driven shifts in forest species composition requires detailed insights at tree level. Very high resolution remote sensing such as using drones and planes as platforms enables the detection, segmentation, and subsequent species identification of individual tree crowns over larger areas. This tree level detail allows the assessment of satellite derived forest cover products and therefore an increase in detail in timeseries analysis. Passive, optical sensors are still widely used for this purpose. Approaches for tree segmentation using 2D true-color images, infrared photography, or 3D-derived canopy height models (CHM) from Structure-from-Motion (SfM) previously relied on area-based techniques. Today, there is a strong shift toward 2D deep learning (DL) approaches for delineating crowns and extracting individual trees(Jaafar et al., 2018; Tong and Zhang, 2025; Aldaeri et al., 2026). Using these area-based methods, trees tend to be not optimally detected, especially when dealing with thin and overlapping crowns coupled with a dense understory layer, as we experienced for high latitude forests (Brieger et al., 2019). In contrast to passive optical imaging sensor acquisitions, light detection and ranging (LiDAR) is nowadays an active remote sensing method successfully used specifically in forestry. Active sensors are mounted on airborne (ALS), droneborne (ULS) and mobile platforms (MLS) and present a cost-effective method to monitor vegetation development at stand scale. Discrete return LiDAR sensors, as used for this study, obtain detailed 3D point clouds of objects like trees and shrubs using laser pulses sent by the sensor. The pulses are reflected by a given object and the return-signal is recorded by the sensor. This allows to differentiate between twigs, branches, vegetation and ground, depending on the spatial resolution of the LiDAR acquisition. Less common are LiDAR sensors that record the full waveform of the returning pulse. The data acquired by these sensors require more processing steps and are computationally demanding. However, they offer higher accuracy when detecting vegetation density below the canopy (Crespo-Peremarch et al., 2020). With the optimization of capturing 3D point clouds of forest structure from LiDAR and SfM, specific techniques and algorithms for individual tree detection evolved. Point cloud voxelization and deep learning are more recent approaches for individual tree segmentation from 3D point cloud data (Jaafar et al., 2018; Brunner and Houtmeyers, 2022; Liu et al., 2023). High quality tree segmentation is a prerequisite for object-based analysis like species classification. Segmentation quality is critical, as misclassifications in object-based analysis often stem directly from segmentation errors (Shcherbacheva et al., 2024). The performance of deep learning models for tree segmentation is highly dependent on selecting suitable algorithms and locally acquired training data, with dense and biodiverse forests posing additional difficulties (Falkowski et al., 2008; Hastings et al., 2020; Ma et al., 2022). Therefore, a high-quality training dataset with individual trees and species specifically tailored to the region of interest is essential to aid individual tree analysis.
There are several forest structure datasets available for central European mixed forests to serve as benchmarking datasets for AI agorithms (Weiser et al., 2022; Henrich et al., 2024; Andreas et al., 2025). Weiser et al. (2022) published a dataset with individual tree point clouds from 12 different forest plots located in Germany, combining UAV-LiDAR, terrestrial laser scanning (TLS) and airborne laser scanning (ALS). The data can be used to extract individual tree metrics or for radiative transfer modeling. TreeLearn (Henrich et al., 2024) provides both a dataset of individual tree point clouds and an algorithm, that was trained on that data, specifically aimed at individual tree segmentation. Overall, there is good representation of such datasets for European forests with a considerably lower number available for other world regions. Chavana-Bryant et al. (2026) provide ForestScan a multiscale dataset from ground based tree census to UAV and airborne LiDAR point clouds with 3D forest structure of global tropical forests without individually segmented trees. ForestScan is not considered a training dataset but provided as a validation dataset for earth observation (EO) missions, rather than segmentation algorithm training.
High-resolution datasets covering a diverse range of tree species and environmental conditions from the boreal region remain scarce. van Geffen et al. (2022) provided SfM point clouds of forest plots, which include CHM and orthoimages for the Eastern Siberian boreal forest, but not individual trees. The LiPheStream dataset by Wittke et al. (2024) includes point clouds of 458 individual boreal trees from Finland and offers high temporal resolution through an 18-month monitoring phase, covering the phenological dynamics over two growing seasons. Specifically catered towards training AI applications is the FOR-Instance UAV laser scanning benchmark dataset for semantic and instance segmentation of individual trees provided by Puliti et al. (2023). It contains individual tree point clouds from various regions, including the European boreal zone.
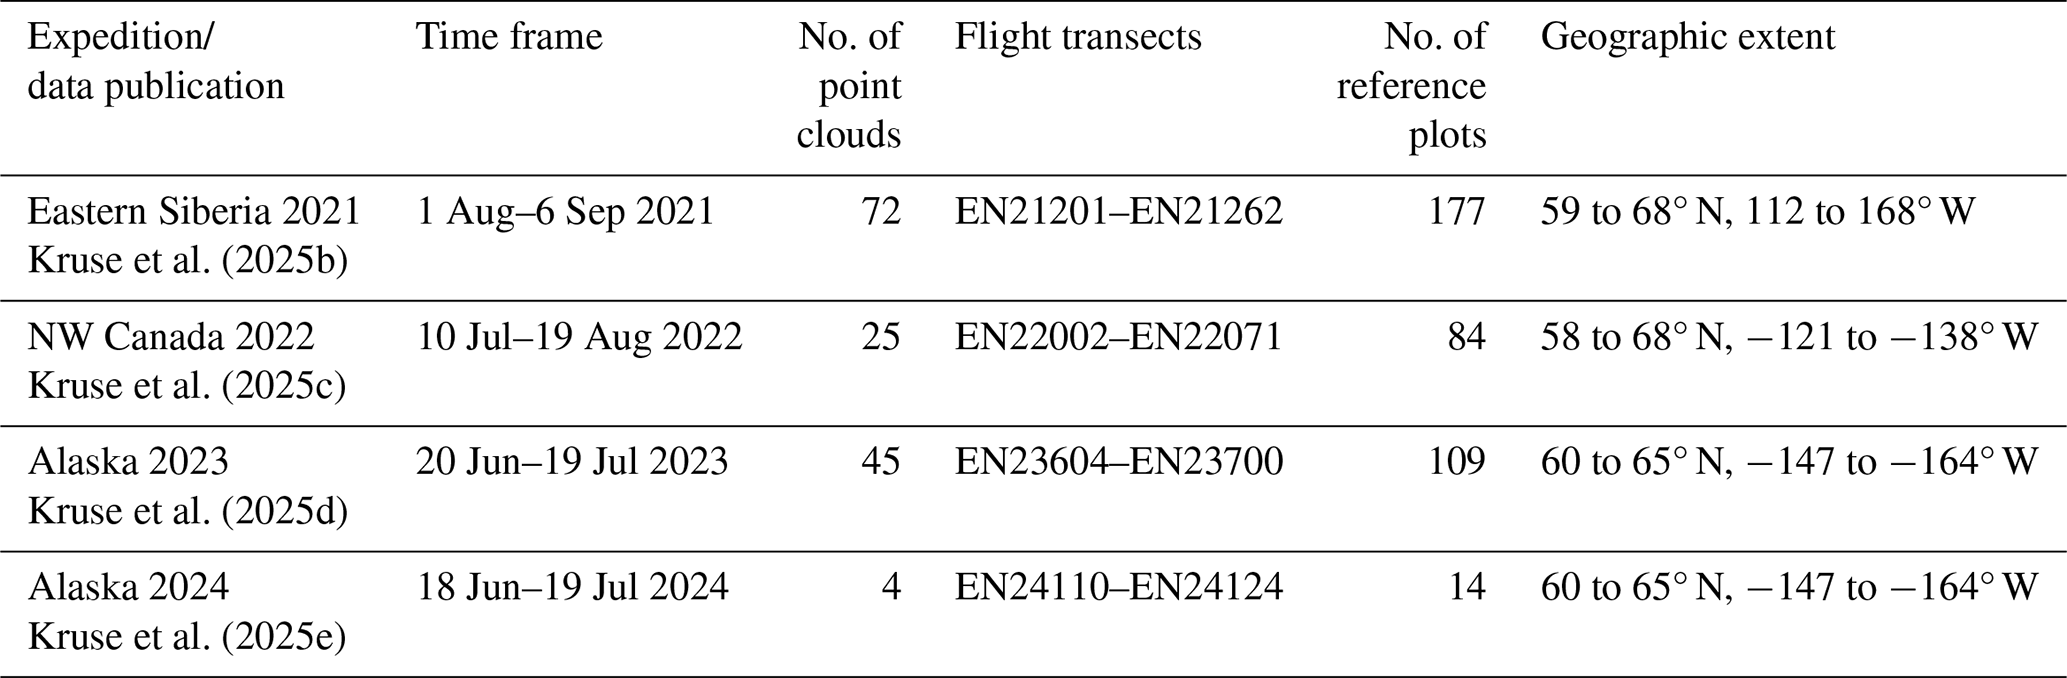
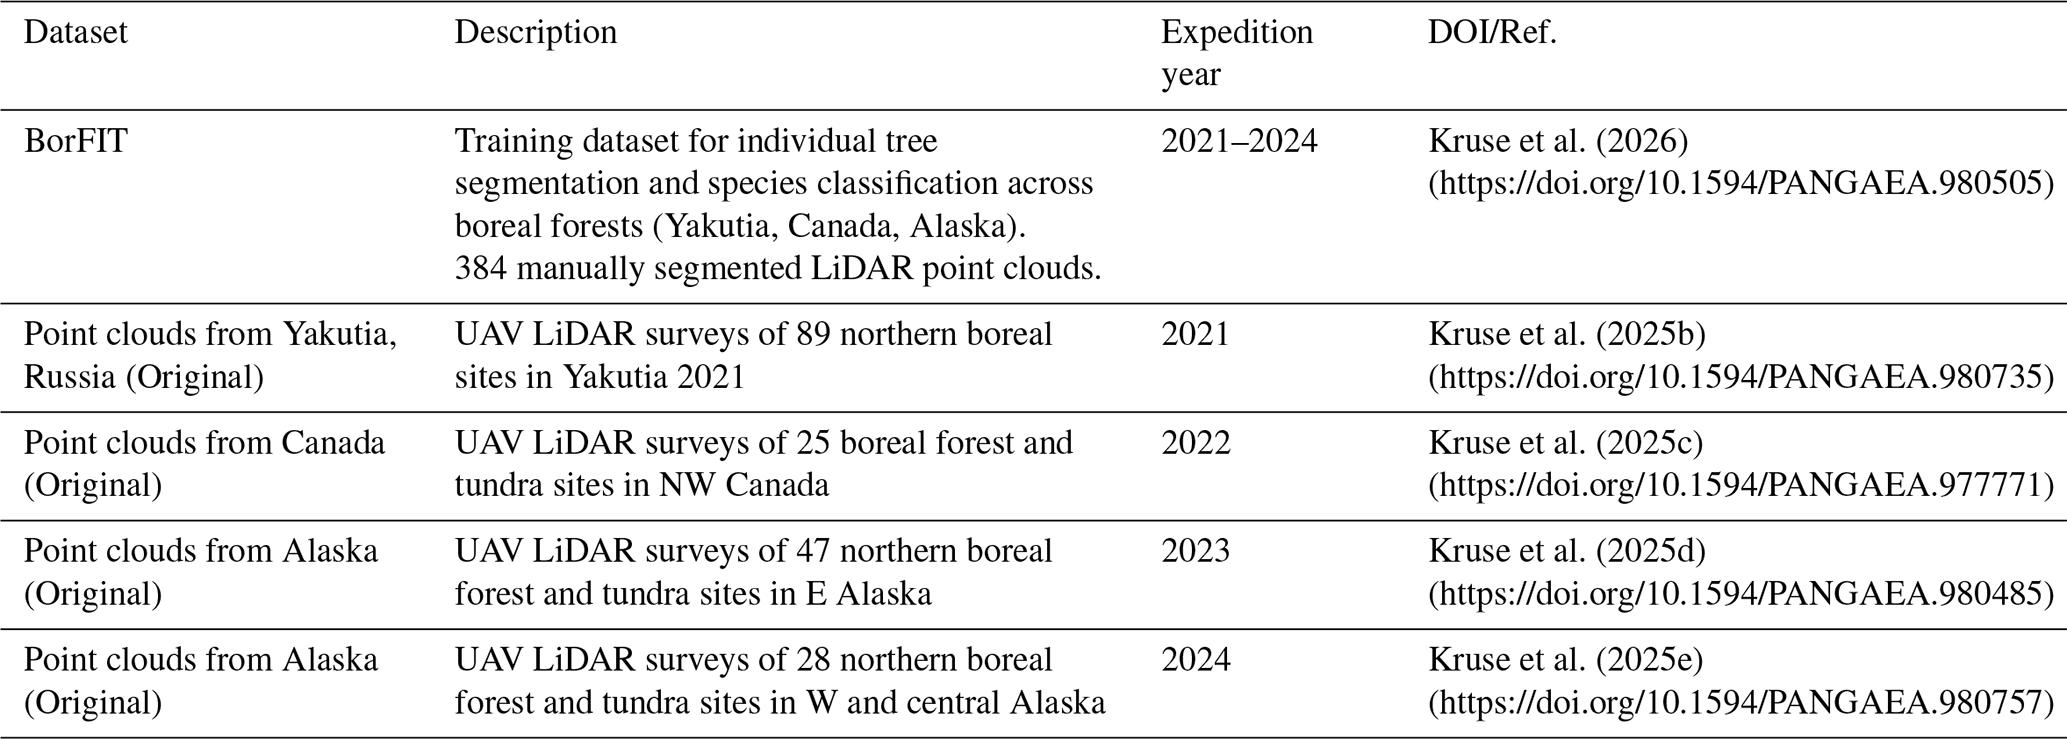
Kruse et al. (2025b)Kruse et al. (2025c)Kruse et al. (2025d)Kruse et al. (2025e)Table 1Overview of the data publications of the LiDAR point clouds related to the AWI Expeditions, flight transect numbers and number of the BorFIT of reference plots.
Here, we present the novel reference dataset “Boreal Forest Individual Tree” (BorFIT) (Kruse et al., 2026), designed for artificial intelligence applications in individual tree segmentation. BorFIT comprises 384 LiDAR point clouds collected across 146 locations along bioclimatic gradients in Alaska, Canada, and Eastern Siberia, featuring up to 200 manually segmented trees per point cloud. Tree species were assigned using a Random Forest classifier trained on both structural (LiDAR) and spectral (RGB) metrics. By providing detailed tree-level training data across the northern boreal zone, BorFIT facilitates the assessment and validation of large-scale landcover and forest structure maps upscaled via spaceborne LiDAR (e.g., GEDI, ICESat-2), Synthetic Aperture Radar (SAR) or optical satellite data. Ultimately, dataset resources like BorFIT are essential for effective boreal forest monitoring, offering critical baseline information to evaluate climate change impacts on species distribution patterns.
The methods used to obtain the final data are described in the following sections. The UAV surveys conducted during expeditions yielded raw point cloud data (n=146) which went through several processing steps including manual tree segmentation and species classification (ntree = 16 530) (Fig. 1).
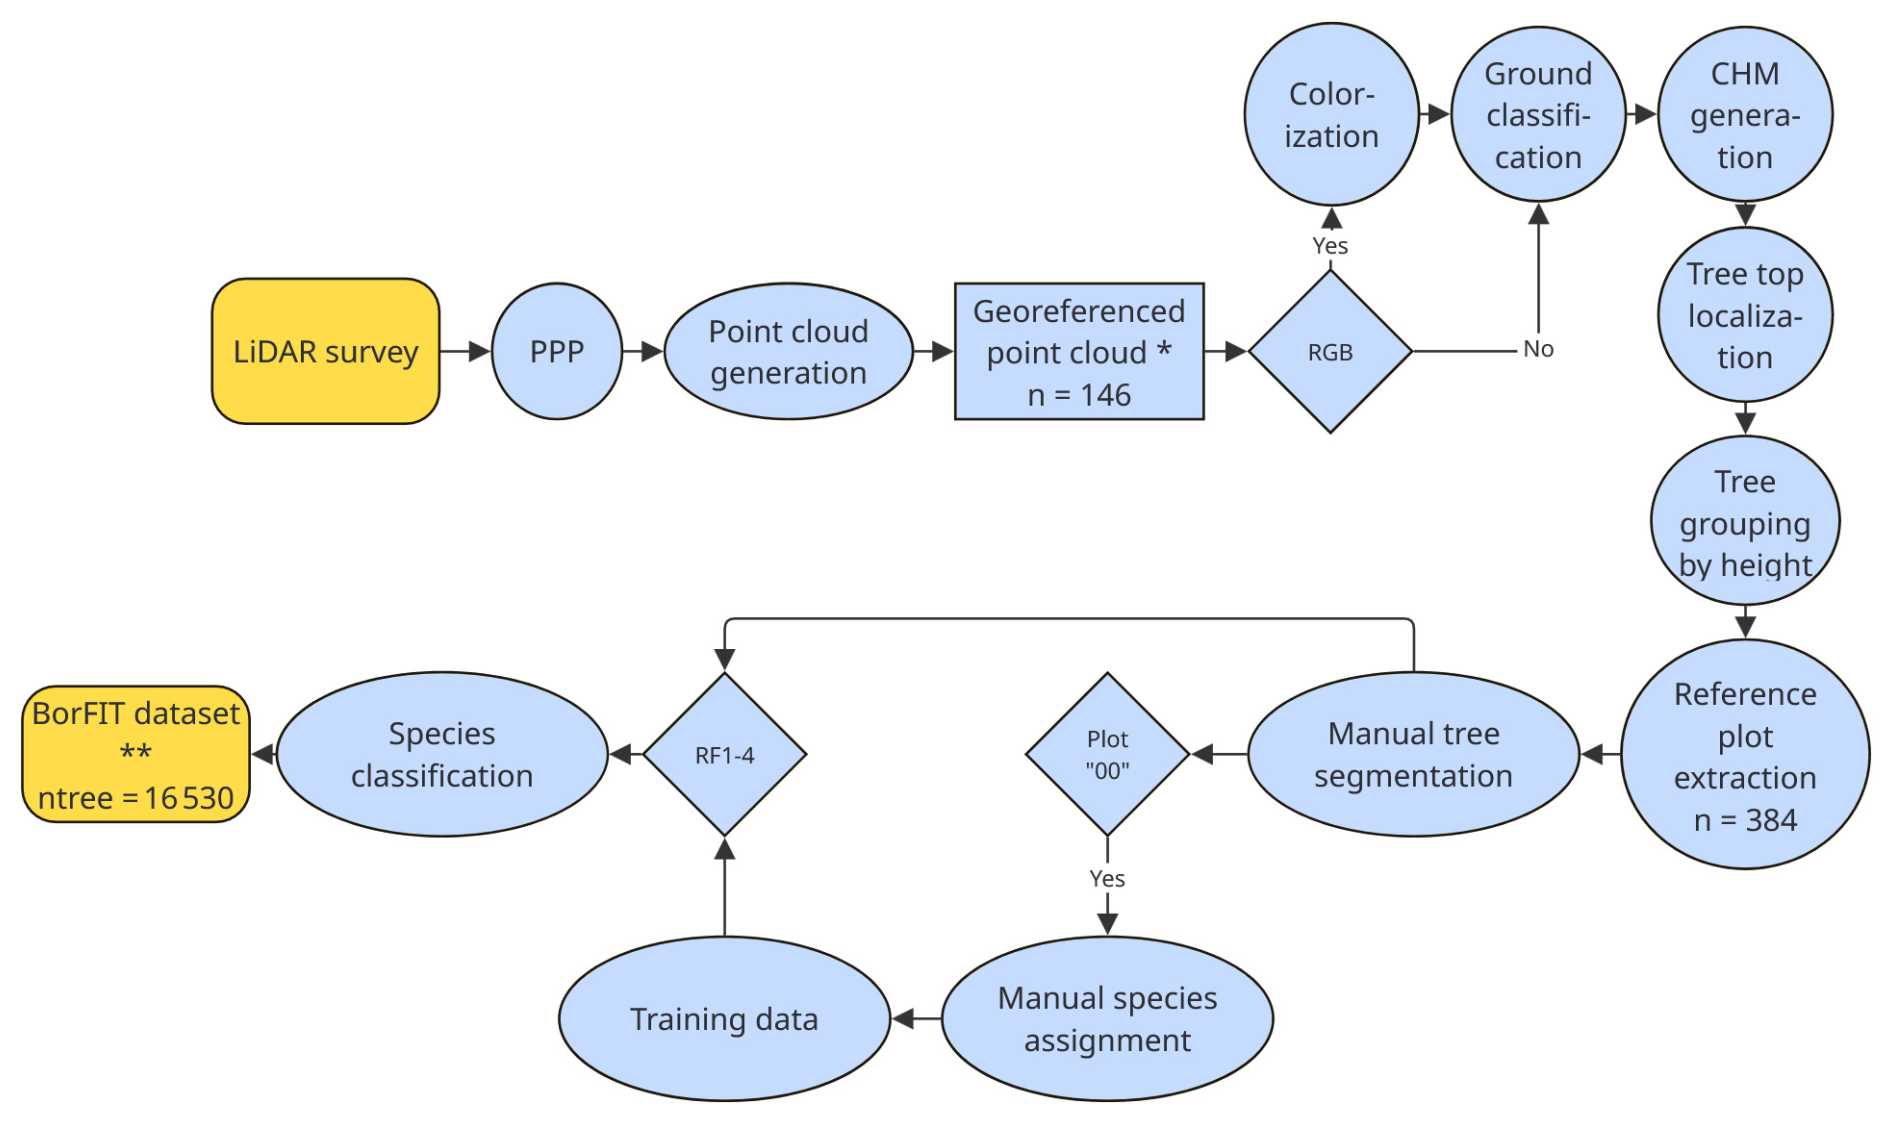
Figure 1Flow chart of processing steps from UAV survey to BorFIT dataset. Abbreviations: Precise Point Positioning (PPP), Canopy Height Model (CHM), Red Green Blue (RGB), random forest models 1–4 (RF1–4), * Kruse et al. (2025b, c, d, e), Kruse et al. (2026).
2.1 Study region
Since 2021, we carried out UAV-LiDAR surveys in addition to drone overflights using other sensors, e.g. multispectral and hyperspectral, in various locations within the boreal region of Eastern Siberia (Morgenstern et al., 2023), Canada, and Alaska (Fig. 2, Table 1). In each region, we established forest transects covering both the tundra-taiga-ecotone where the forest transitions into tundra grasslands and the dense mixed forests further to the south. In Northwest Canada and Alaska, the latitudinal treeline represents the northernmost extent of the research area. In Northwest Canada the transect reaches from the broadleaf forest in British Columbia up to the Mackenzie Delta in the North where sparse forests dissolve into the tundra. The Alaskan transect begins at the southern coastal region, reaching northward into interior Alaska up to the southern slopes of the Brooks range. The 2024 expedition covers the Seward Peninsula in western Alaska. Alaska was therefore sampled in two consecutive years; however, the BorFIT dataset includes observations from only one time point per plot. In eastern Siberia (in 2021) the transect is located between the Lena and Aldan river interfluve traversing through the central Yakutian lowland up to the Verkhoyansk mountain region. Transects were established to enable long-term monitoring of ecosystem dynamics and responses to climate change and disturbances, such as wildfires. Sampling locations along these transects were selected prior to fieldwork based on topography, forest types, and proximity to highways for logistical accessibility. Site selection was guided by satellite-derived change detection and forest density metrics, alongside visual indicators of fire history, such as fire scars and time-since-fire products derived from datasets like the Hansen global forest cover change product (Hansen et al., 2013). All sites are natural, unmanaged forests. An example of the different stand structures and densities is provided in Fig. A1 (low density) to Fig. A3 (high density) (showing photos from the field plots in Canada 2022).
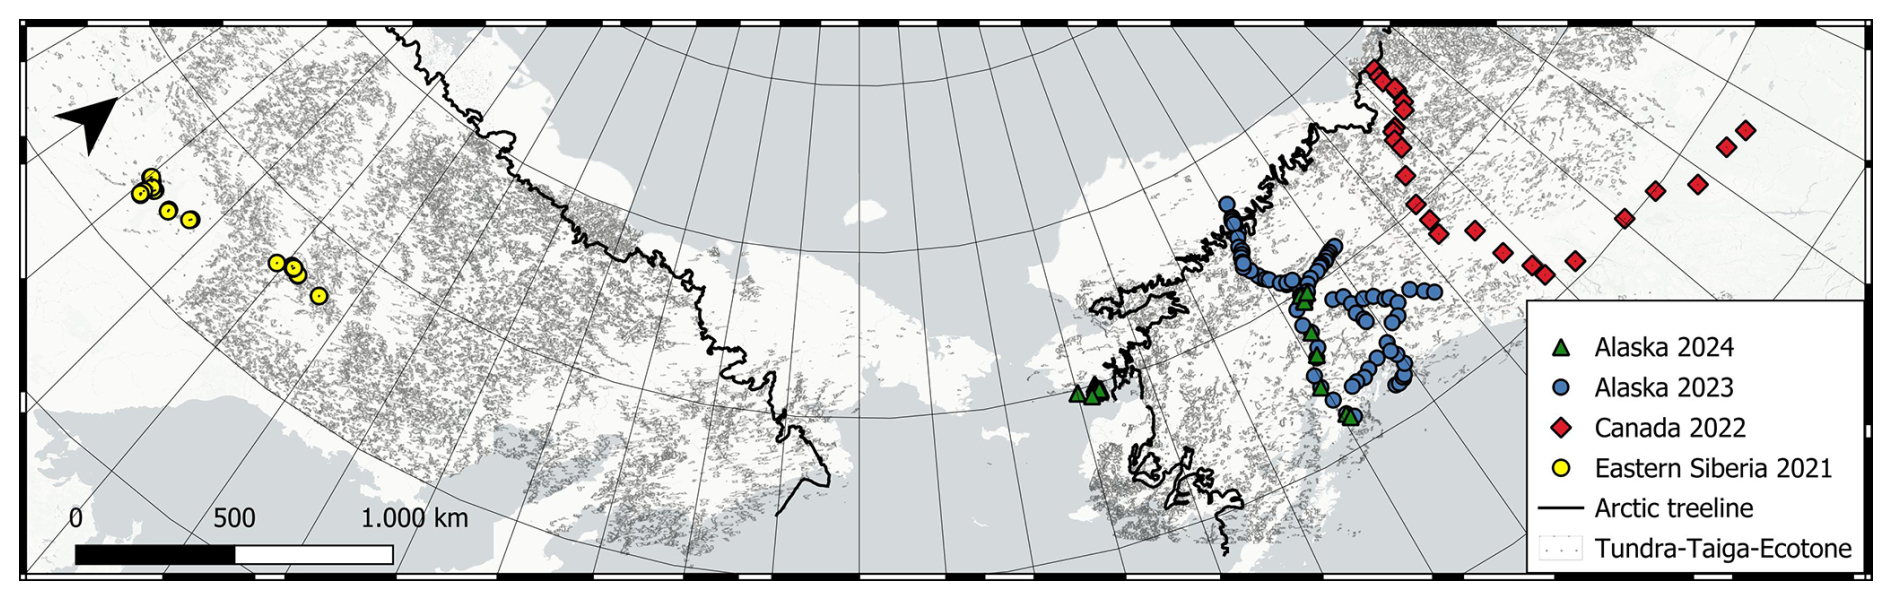
Figure 2Overview of the research area and the location of the BorFIT reference sites from AWI expeditions (colour coded symbols). Gray hatched areas are covered by forests belonging to the Tundra-Taiga-Ecotone (TTE) derived from the Tree-Canopy-Cover (Ranson et al., 2014). Please note that south of the TTE is the denser boreal Ecotone that is also covered by our expedition sites in Siberia and Northwest America, not visualised by another landcover type in this figure. The black colour-coded treeline was defined by the Circum Arctic Vegetation Mapping (CAVM) (Walker et al., 2005); Basemap: Esri|Powered by Esri.
2.2 Data acqusition and postprocessing
UAVs (DJI Matrice M300 RTK) were used to conduct transect overflights covering at least 500×50 m. For these flights, a LiDAR sensor (YellowScan Mapper; Table A1) was employed. In addition, a Yellowscan RGB camera module was used during the 2022 to 2024 acquisitions. The drone flights were conducted at an altitude of 70 me with a speed of 5 m s−1, resulting in approximately 400 points per m2. The LiDAR mapper followed a predetermined initiation pattern for Inertial Measurement Unit (IMU) initialization; this pattern is designed to ensure accurate calibration of the IMU sensors by stabilizing the device and minimizing drift errors before data acquisition begins. Precise Point Positioning (PPP) was implemented using coordinates from an EMLID Reach GNSS Basestation and the POSPac UAV software version 8.8 for accurate flight trajectory inertial corrections and georeferencing. For the 2022 to 2024 transects we could also use POSPac created timestamps for the images recorded by the YellowScan RGB module, which are essential for later colourization of the point cloud. Using Yellowscan CloudStation software (version 2206), unwanted trajectory strips were removed to prevent unrealistic point density from overlapping recordings. Ultimately, the point clouds were generated and linked with the RGB images via their timestamps, enabling effective colourization and enhanced visualization of the collected data. The point clouds from Yakutia 2021 are not colourised, as they were recorded without the additional RGB module. The 3D point clouds of all transects were classified into ground points and above-ground points. Ground classification was performed using the software LASTools (v2.0.2) as described by Isenburg (2023). The point clouds have not been terrain normalized to keep the information in their true-dimensional space with height values on the z axis representing above sea level. These georeferenced point clouds are projected in region specific UTM zones, with ground point classification from four AWI expeditions are published as Kruse et al. (2025b, c, d, e) and are the base for the BorFIT referernce plot generation.
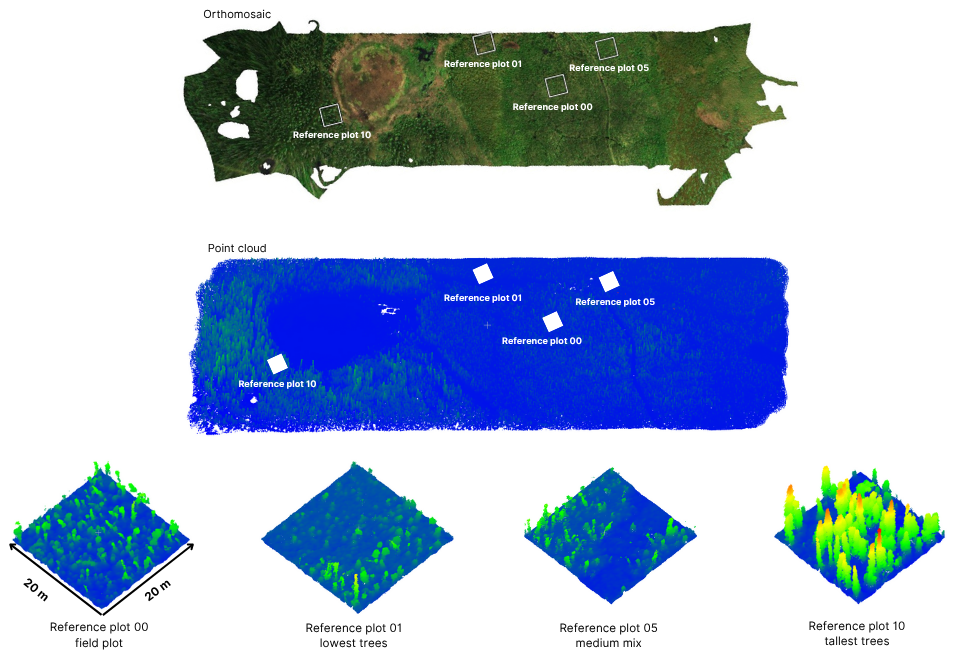
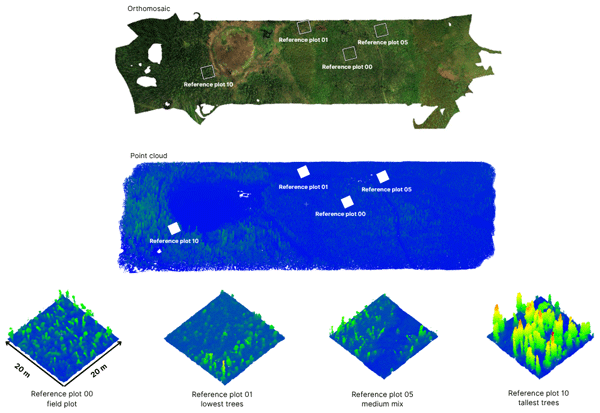
Figure 3Schematic diagram of the BorFIT 20 m × 20 m reference plots (00, 01, 05 and 10). On top is the MICASENSE camera derived RGB true color orthomosaic, visualising the forest landscape. Below is the LiDAR point cloud by height colourised from blue (low) to green-yellow-red (higher). Below are the by height colourised point clouds of the reference plots representing the site. On plot 00, detailed inventory during field work was carried out. Plots 01 to 10 refer to the size of the trees (01 lowest trees, 10 highest trees).
2.3 Reference plot generation
To create representative forest structure subsets of the point cloud data, we extracted 20 m × 20 m reference plots from the original point cloud datasets (Kruse et al., 2025b, c, d, e) (Fig. 3 showing the schematic diagram). This size was chosen because it allows for the segmentation of up to 200 trees per point cloud without cutting off branches. An area of 20 m × 20 m was found to be a good balance between file size, easy handling in CloudCompare and number of complete trees. A canopy height model (CHM) was generated to identify tree tops within the point cloud through a point-to-raster (p2r) algorithm. The heights of the trees served as the basis for determining the locations of the reference plot segment. Trees were categorised by their height from smallest to tallest into 10 subgroups, and one tree from all subgroups, was randomly selected to represent the center of a reference plot. The number of subgroups was chosen to strike a balance between structural granularity and practical sample size, ensuring that the full vertical canopy profile of boreal forests was adequately captured without over fragmenting the tree height distribution. Subsequently, a 20 m × 20 m buffer was established around each selected tree, and the corresponding subsets were segmented. Each reference plot was then exported with a designation corresponding to its respective tree height group (1 to 10), ensuring a systematic representation of tree height variation across the study area. To balance data processing efficiency with structural representation, tree selection prioritized canopy extremes and median height classes (groups 1, 5, and 10). Groups 3 and 8 were processed secondarily for gap-filling afterwards. Additionally, a fourth 20 m × 20 m segment was generated if a detailed forest inventory was performed in the field. This plot was then labelled with “00” and acts as the ground reference for the creation of a training dataset for species assignment (Figs. 1 and 3).
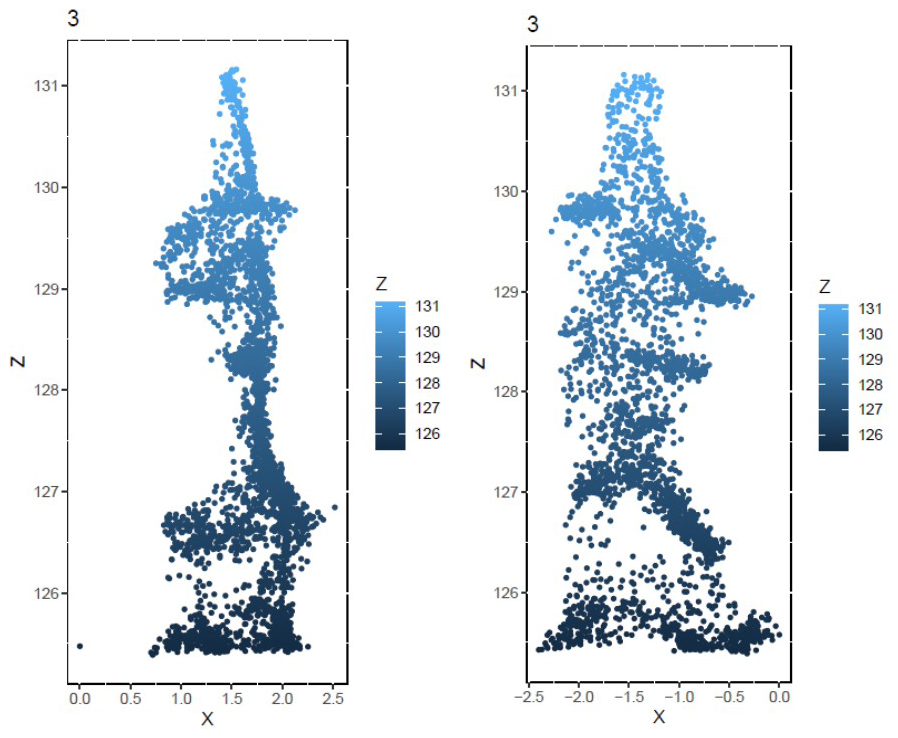
Figure 4Example point cloud of a tree of the Picea mariana species from two viewing angles, used for quality control. Z is height in m above sea level.
2.4 Tree segmentation
The segmentation of individual trees, within the 20×20 m reference plots, was conducted manually using CloudCompare (version 2.13) [GPL software] (2025) retrieved from http://www.cloudcompare.org/ (last access: 1 September 2024). Trees that were visually distinguishable by their crowns were extracted and assigned with unique IDs, following a consistent coding scheme established during ground classification. In this scheme, ID 1 represents unclassified points (including shrubs and unidentified tree parts), ID 2 denotes ground classified points, and individual trees are numbered starting from ID 3. A new scalar field named “Tree” was created to incorporate this coding system (data type uint64). While this manual approach promised to be more flexible to different forest structures, accurately separating trees was still difficult. Issues arose when shrub layers were inadvertently included with the trees, or when branches from overhanging trees complicated the segmentation process. The broadleaf forests in the dataset were particularly challenging for precise individual tree separation. To ensure good quality segments in the final dataset despite these complexities, the process involved multiple quality control mechanisms. We created a visualization of every tree from two different angles (example Fig. 4) and checked for outlying points. We manually segmented 16 530 trees.
2.5 Manual species assignment
Two training datasets, one for Northwest America, another for Yakutia, were created based on the reference plots annotated with “00” where species were documented during the expeditions. Individual trees were manually assigned a species label. Orthorectified images from photogrammetry missions, along with 360° panorama images (Kruse et al., 2025a) captured from the ground at plot center, were used for orientation within the point cloud. This information enabled the assignment of species, which were recorded in an additional scalar field labeled “Species” (data type uint8). The coding scheme for this field continued from the segmentation: ID 1 for unclassified points, ID 2 for ground points and beginning with ID 3, the number coded species. To enhance the species classification model's predictive accuracy, two separate training datasets, based on the “00” plots were created – one for Northwest America and another for Siberia, due to the significant differences in species composition between these regions. For Northwest America, the coding scheme (Table 2) for species assignment was established to reflect the specific tree species identified in the reference plots, ensuring a tailored approach to dataset creation that aligns with regional biodiversity.
Table 2List of tree species with their scalar field IDs, scientific names and abbreviations for the Northwest American BorFIT dataset.
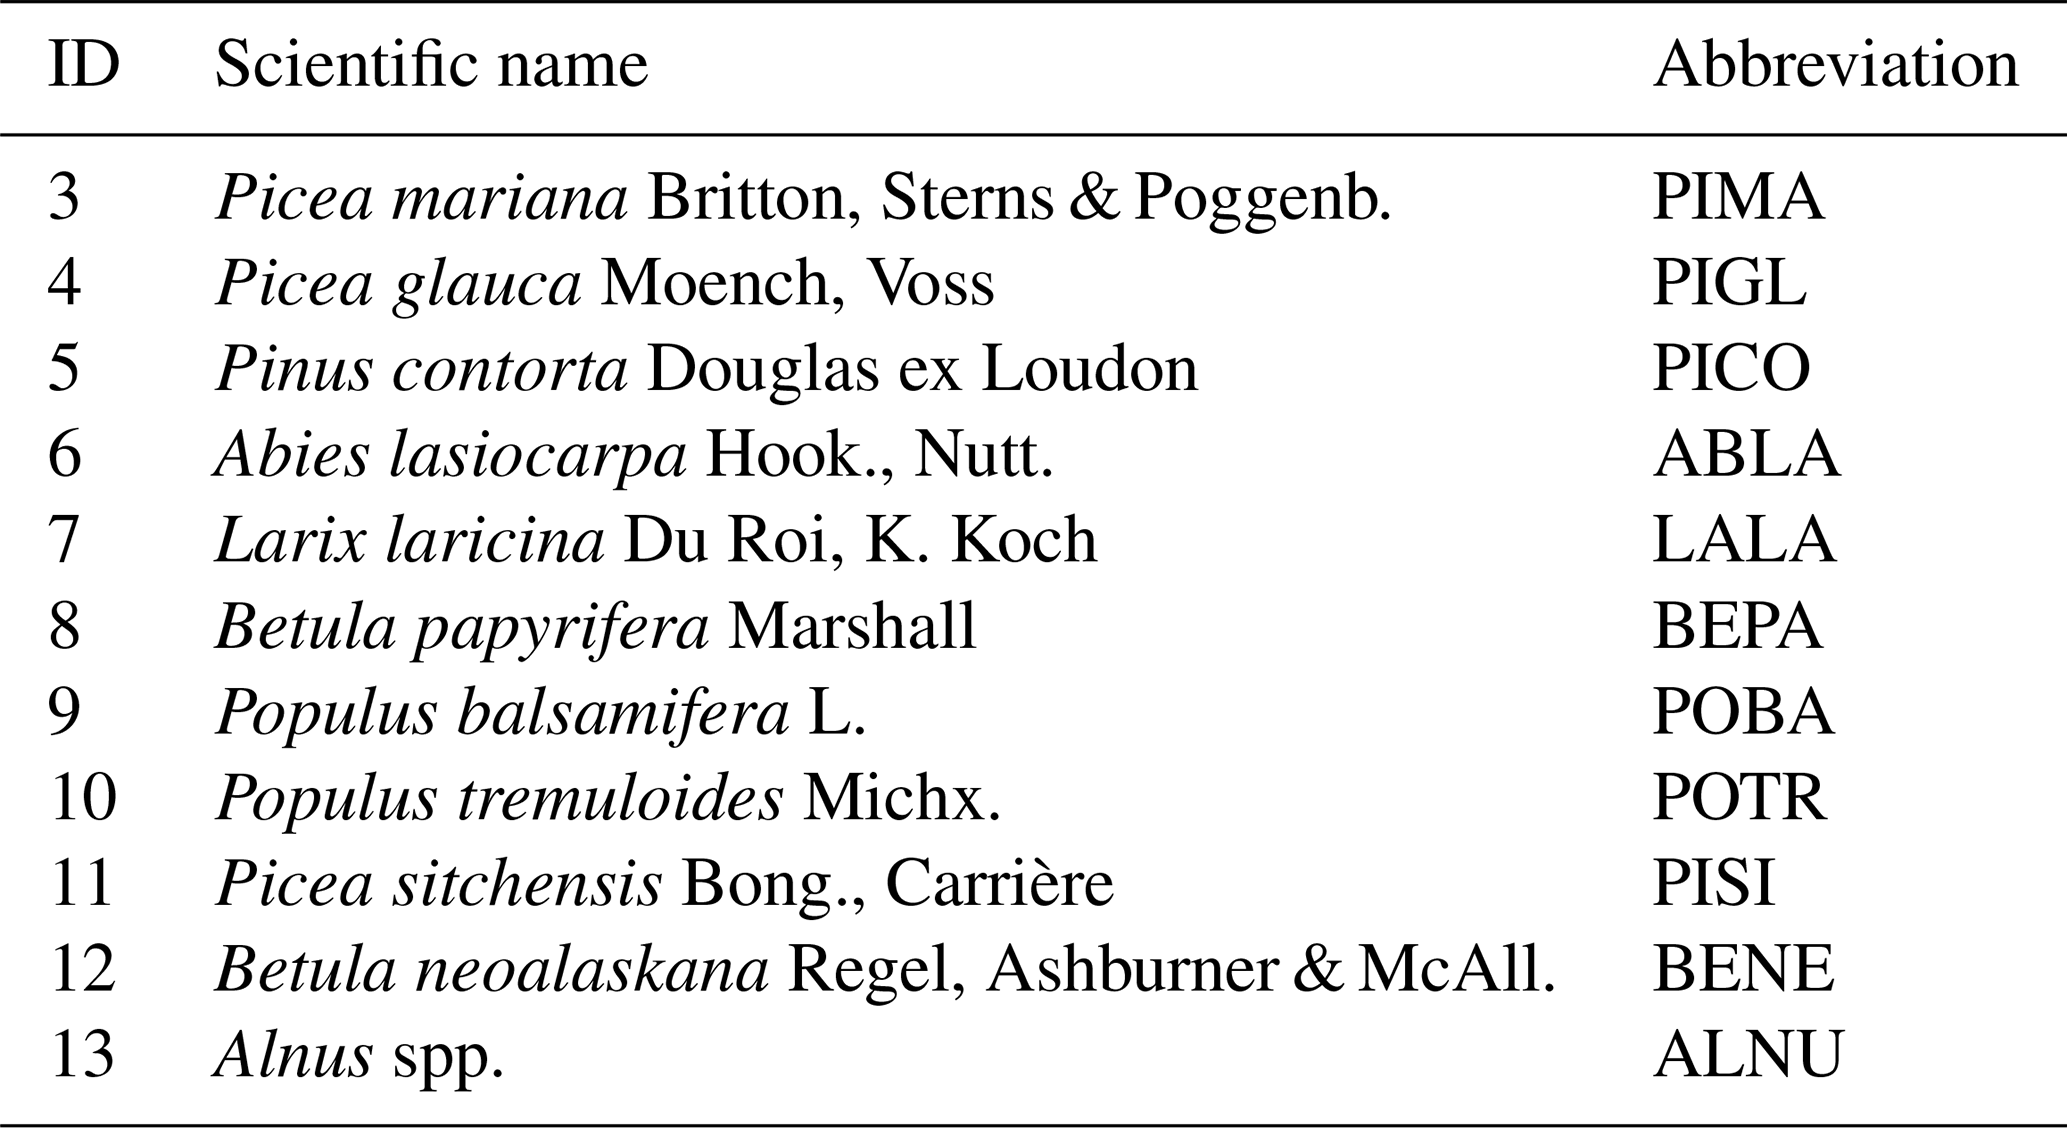
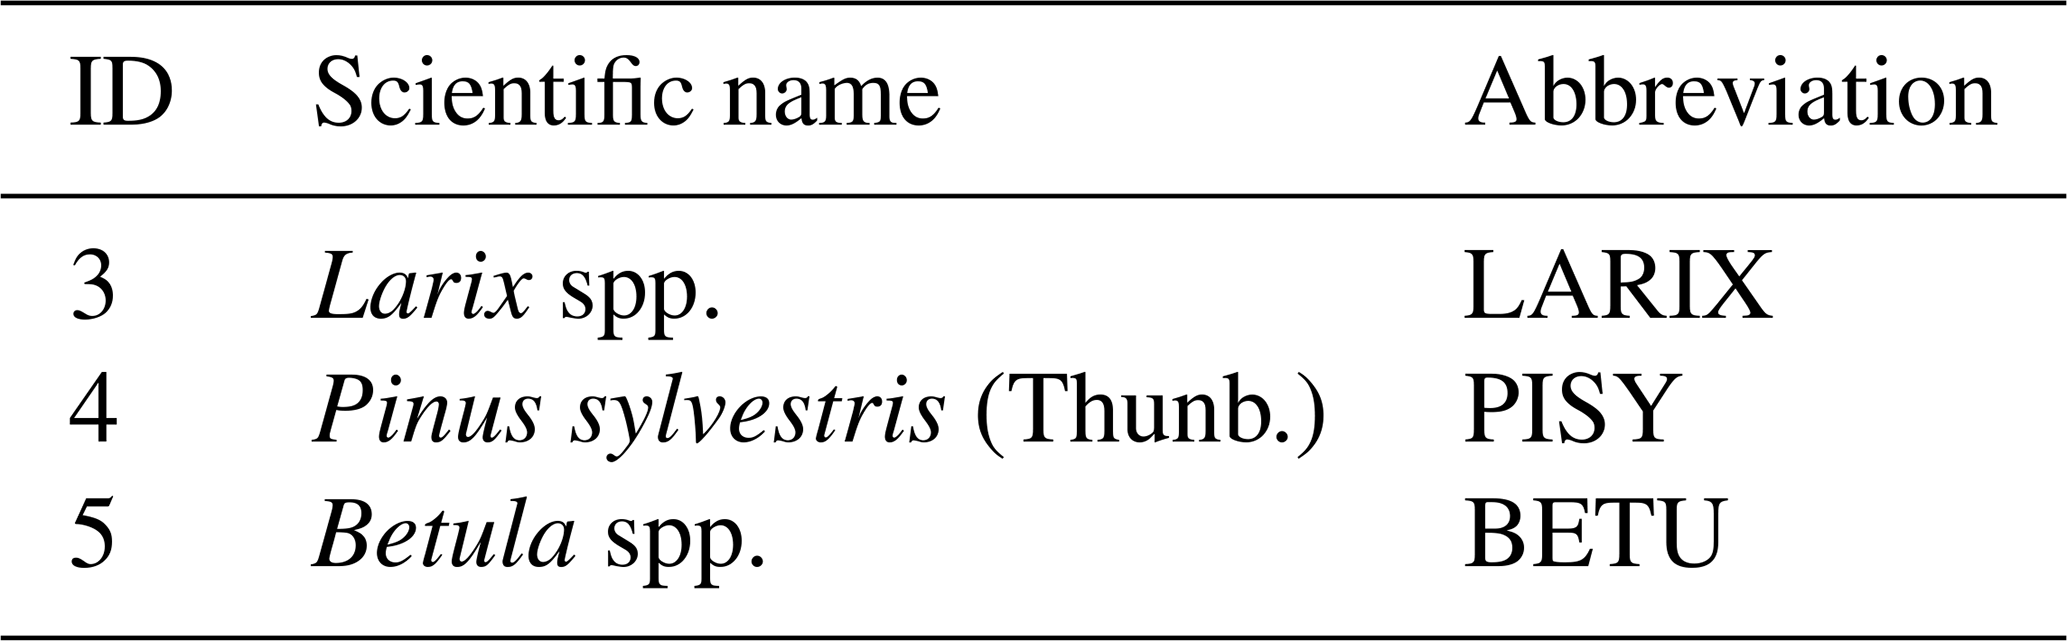
In Northwest America trees of the Picea genus are the most abundant across most of the sites, while Larix spp. was the most abundant in Yakutia. To balance this, the training dataset were equalised to a maximum of 50 individuals per species, that were randomly selected. In Yakutia, the species composition of the boreal zone differs from the one found in North America. The most dominant genus is Larix Mill., represented by the species L. sibirica Ledeb. and L. gmelinii Rupr. While both species are found in different parts of Siberia, their appearances hardly differ (Schulte et al., 2022). Thus, we focus on the genus level for Larix spp. since a separation of the species based only on structural parameters is not to be expected. The same is true for Betula pendula Roth and Betula platyphylla Sukaczev, therefore we decided for Betula spp. The coding scheme for Yakutia is presented in Table 3.
Table 3List of tree species with their scalar field IDs, scientific names and abbreviations for the Yakutian BorFIT dataset.
2.6 Extracting tree structural and spectral variables
A total of eleven structural and two spectral variables from the UAV-LiDAR and RGB camera module (Table 4) were calculated to train the first random forest classifier for the Northwest American dataset. The spectral variables were derived from the RGB-camera derived colourization of the point cloud. Given that only the three visible light bands (Red, Green, Blue) are available, we calcuated the pseudo NDVI known as Normalised Green-Red Difference Index (NGRDI), which has been proven to correlate with NDVI (Tucker, 1979; Al Rosyid et al., 2022), and the Visible Atmospherically Resistant Index (VARI) (Gitelson et al., 2002; Andrade et al., 2019) (Table 4).
Tucker (1979)Gitelson et al. (2002)Iusem and Seeger (2005)Atkins et al. (2023)Zhao et al. (2011)Qian et al. (2023)Qian et al. (2023)Qian et al. (2023)Irwin et al. (2024)Table 4Summary of LiDAR derived structural and RGB derived spectral variables, their equations and references.
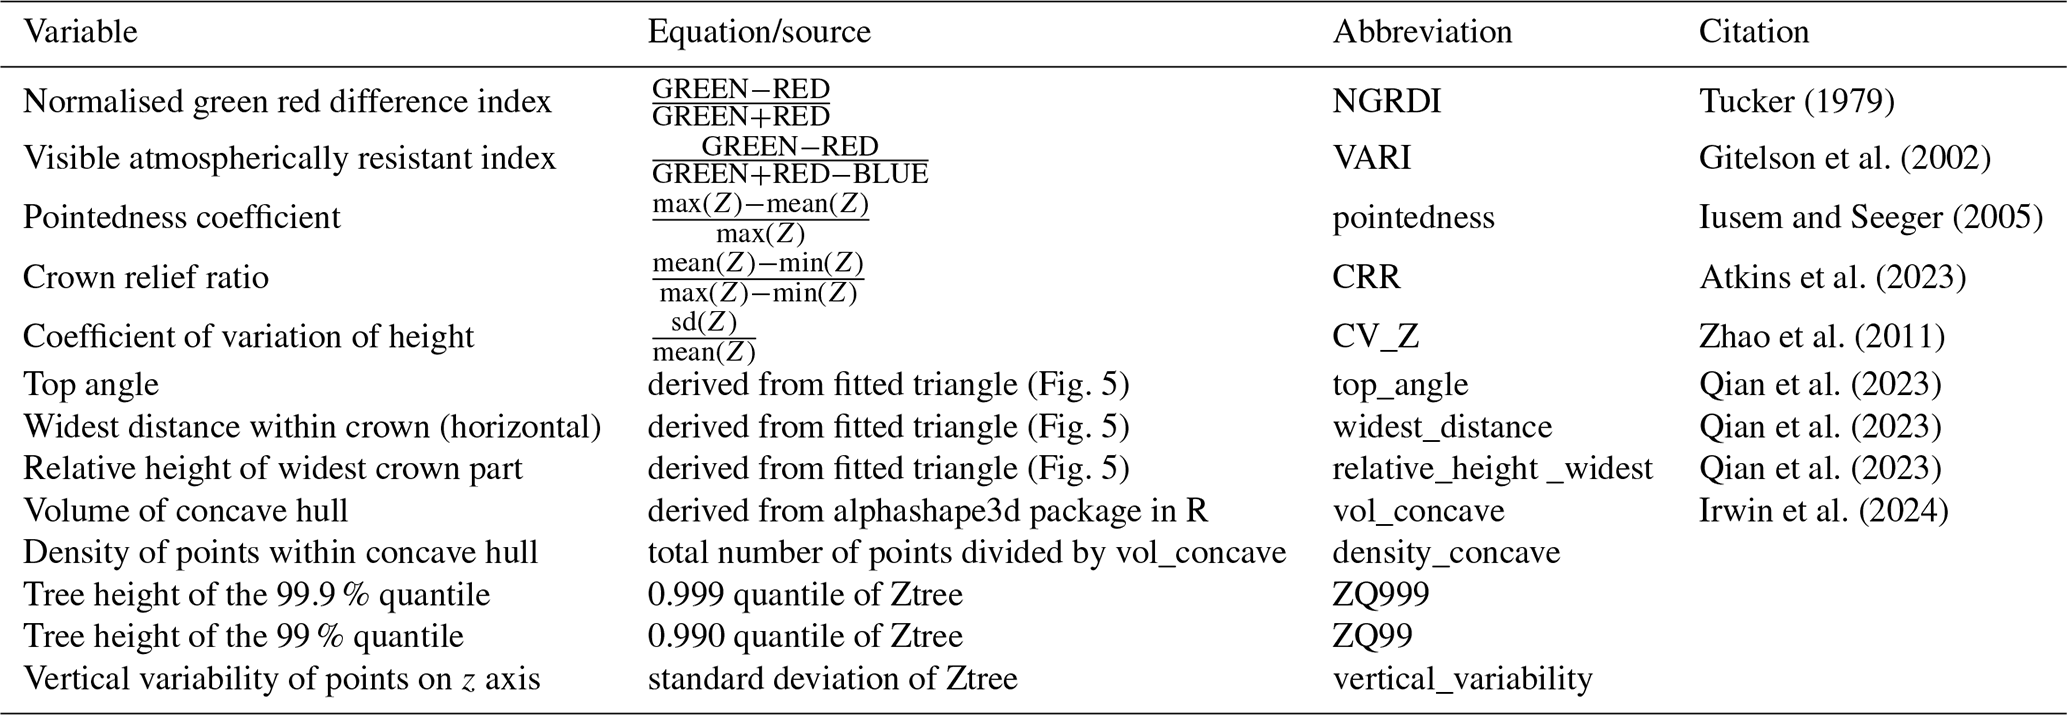
In addition to spectral indices, we calculated 11 structural parameters to quantify tree shapes (Table 4). These include the pointedness coefficient, the crown relief ratio (CRR) and the coefficient of variation of height (CV_Z), calculated as shown in Table 4. The vertical variability, defined as the standard deviation of tree height (Ztree), and the 99.9th percentile (Zq999) were also included. We assessed point density and volume within the concave hull, utilizing the alphashape3d (Fig. 5a) package in R, following the methodology proposed by Irwin et al. (2024) and Vauhkonen et al. (2009). Inspired by Qian et al. (2023), who fitted geometric shapes into tree crown point clouds to differentiate species, we fitted triangles from the widest part of the crown to the top of the tree using a 2D projection of the trees point cloud (Fig. 5b). This approach allowed us to derive further structural parameters: the top angle of the triangle, the length of the lower leg, and the height of the lower leg relative to tree height. These parameters (Fig. 5b) are intended to quantify whether the tree crown is wide or narrow and to identify the height at which the widest part of the crown is located. These metrics were extracted for every tree that was assigned a species manually. The resulting dataset, with two spectral and 11 structural variables, is the basis for training the random forest classifier for Northwest America. The point clouds from Yakutia 2021 do not contain the RGB data, and neither do six point clouds from Canada 2022. The according tree species were instead predicted using a random forest classifier that was based only on structural parameters.
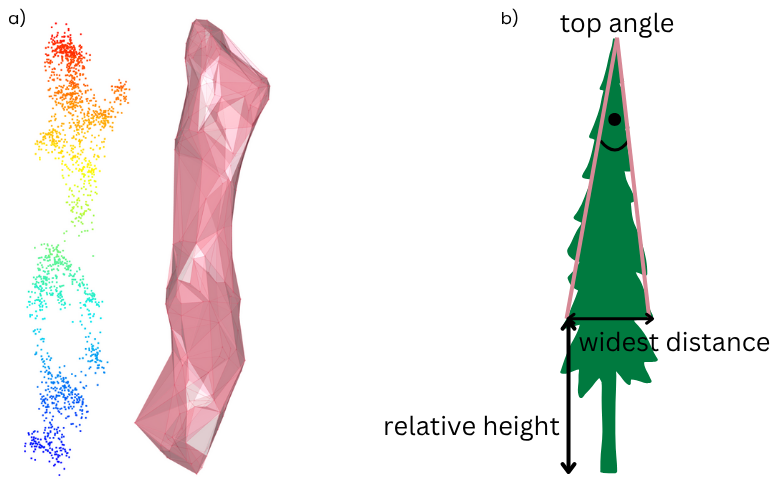
Figure 5(a) Example point cloud of individual tree and alphashape (α=1). (b) Graphical representation of the fitted triangle on an individual tree for extracting the widest distance, its relative height and the top angle.
2.7 Modeling and prediction
Due to variations in data availability (with and without RGB) and differences in species composition across biomes such as Yakutia, the Seward Peninsula, and continental Northwest America, we had to develop four random forest classifiers (Fig. 6) based on distinct training data subsets. Two models utilised structural variables exclusively from point clouds in Yakutia (RF4) and non-colourised point clouds from Canada (RF3) due to missing RGB data. RF3 was trained using the structural information from all point clouds recorded in Canada. The other two models incorporated RGB information along with related variables (VARI, NGRDI) to predict data from Northwest Canada and Alaska (RF1), and the Seward Peninsula (RF2). The classifiers were constructed using the caret package in R (Kuhn, 2008). Hyperparameter tuning was performed to determine optimal values for mtry and ntree (mtry equals the number of variables tried at each split, ntree equals the number of decision trees built by the model).
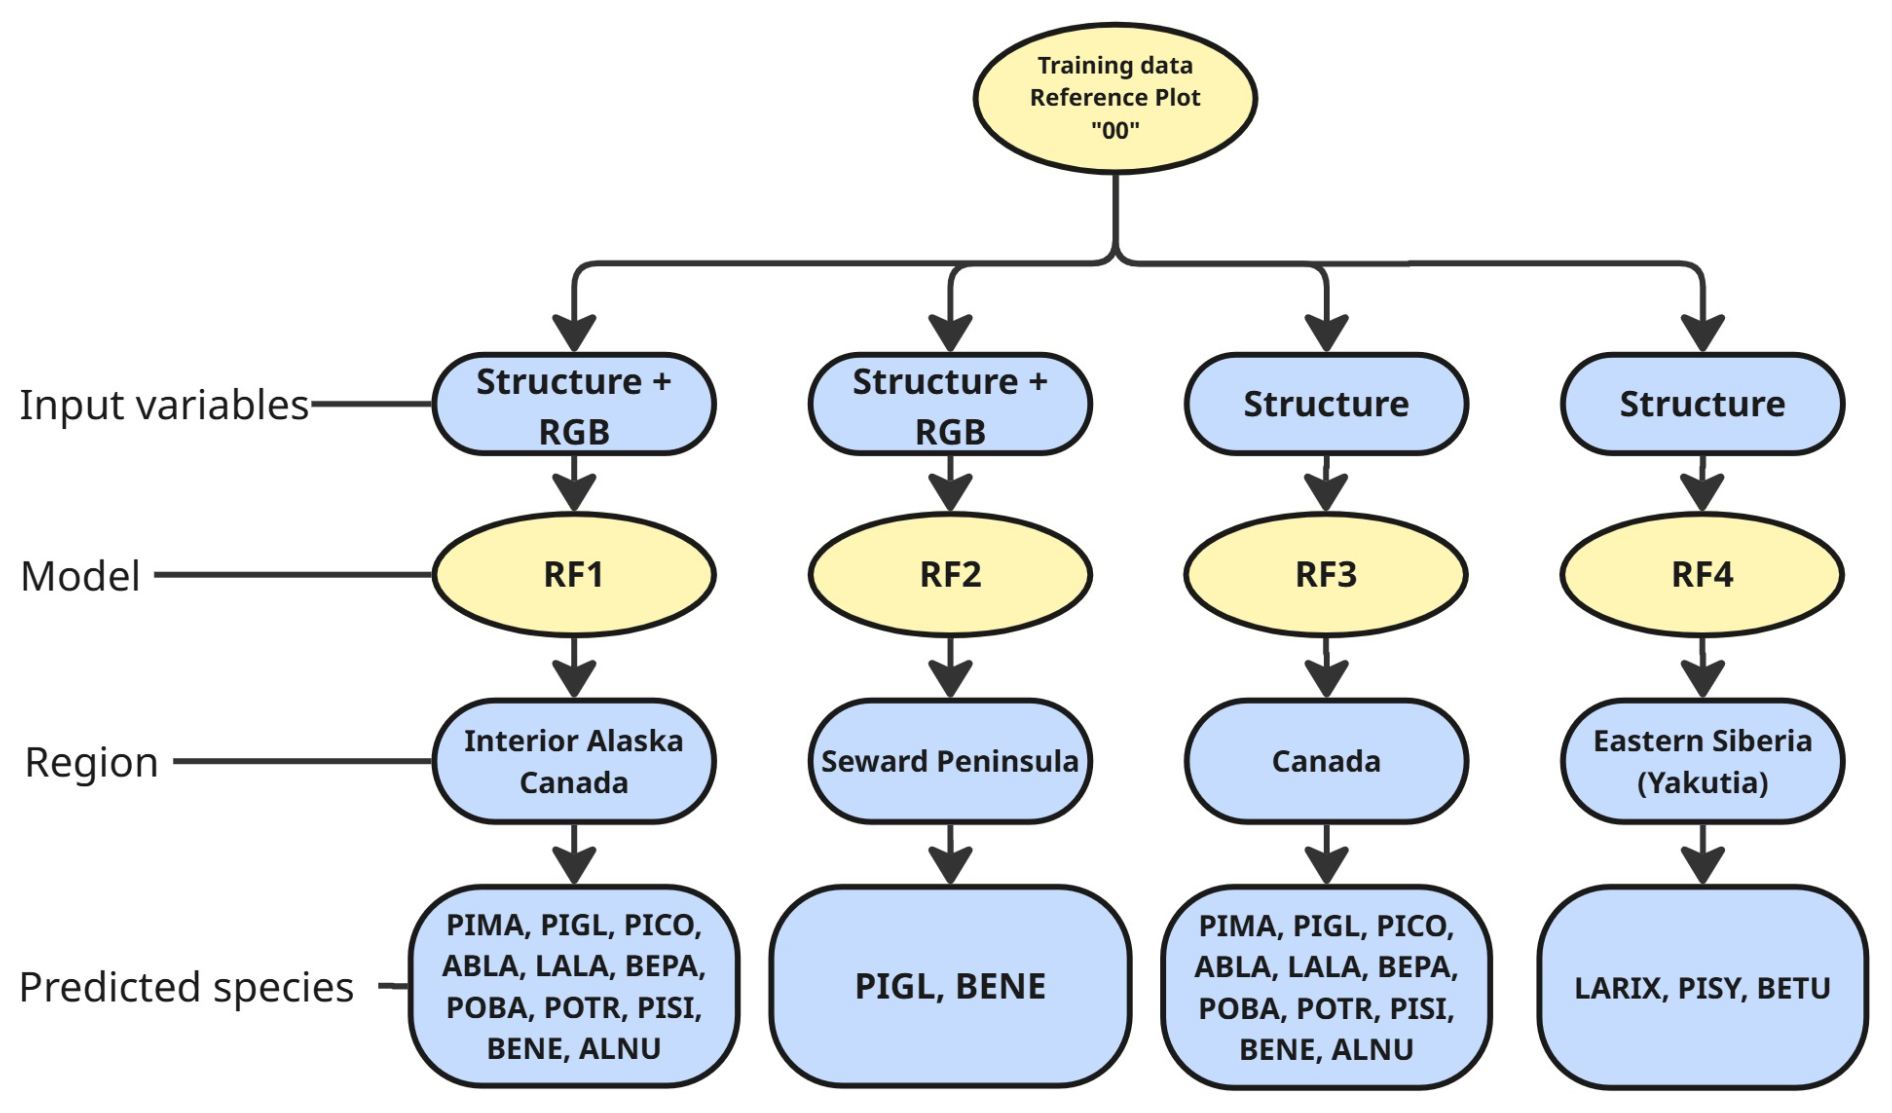
Figure 6Schematic representation of the four used random forest classifiers (RF1–RF4). Depicted are the variables used to train and the region with the corresponding species. (Tree species abbreviations are described in Table 2 for Northwest American tree species and Table 3 for Siberian tree species.)
The four different random forest models were used to predict the species of all segmented trees within the point clouds of the corresponding region. We added two scalar fields: “Species”, which contains a numeric value representing the predicted species, and “Probability”, which range from 0 to 1 to indicate prediction certainty (1 = perfect match). Predictions for various regions in Northwest America were manually modified based on regional biodiversity. For instance, RF1 was used for Alaska and Canada, where predictions such as Betula neoalaskana in Canada were reassigned to Betula papyrifera due to local biodiversity considerations. This supervised approach aimed to enhance dataset quality, as the model sometimes struggles to distinguish between species of the same genus. The following prediction translations were applied:
-
Betula neoalaskana in Canada was translated to Betula papyrifera
-
Picea sitchensis in Canada was translated to Picea genus with highest probability
-
Abies lasiocarpa in Alaska was translated to Picea genus with highest probability
A file with metadata was created for every point cloud file, including the structural and (if applicable) spectral variables and prediction probability for every single tree on which the prediction was made.
2.8 Validation
Model validation was performed to assess the predictive performance and robustness of the four random forest classifiers. We used 10-fold cross-validation (Kohavi, 1995) implemented using the caret package (Kuhn, 2008) in R. The data was partitioned into 10 folds, with stratified sampling to preserve class proportions. Within each iteration, the model was trained on 9 out of the 10 folds and tested on the remaining data. The classification performance was evaluated for each class, resulting in class specific error rates and overall accuracy. Confusion matrices were generated to identify patterns of misclassification. Based on these insights, the reassignment to more likely species (as described in chap. 2.7) was established. This validation approach offers robust estimation of out-of-sample model performance and detailed insights into class-wise prediction quality.
3.1 Representativness of BorFIT plots
The BorFIT sites cover both lowland and mountainous regions and are thereby representative for a broader boreal region. Especially in Northwest America, our sites are evenly spread across the present topographic conditions, providing rare data on the Northern forest edge including taiga-tundra biomes, while the Yakutian sites show one cluster at lower elevations in the central Yakutian lowland, and a second cluster in the Verkhoyansk mountain range, and not covering the Northern taiga-tundra biome (Fig. 7). To avoid including poor classification results, we subsetted the data for the following data visualization (Figs. 8, 9 and 14) using only trees with a prediction probability of over 0.8, which significantly reduces the number of trees included to 1497 (out of 6085) for Yakutia and 3060 (out of 10 445) for Northwest America. The most abundant species in our Northwest American dataset is Picea glauca followed by Picea mariana while the dataset in Yakutia is dominated by Larix spp. (Fig. 8). This is in agreement with previous studies on boreal forest biodiversity (Ivanov, 2023; Xi et al., 2024). The predicted species distributions with environmental variables in BorFIT reveals patterns consistent with our field observations: in Yakutia, warmer lowlands are inhabited by Pinus sylvestris in the sandy soils of the Eastern Lena river bank, Larix spp., and Betula spp., while colder mountainous areas are dominated by Larix spp. In Northwest America, northern regions are dominated by Picea spp., often in mixed stands, and broadleaf trees like Populus balsamifera and conifers such as Abies lasiocarpa are more common in the mixed forests of, for example, British Columbia in Northwest Canada – patterns that are reflected in the BorFIT predictions against environmental factors (Fig. 9).
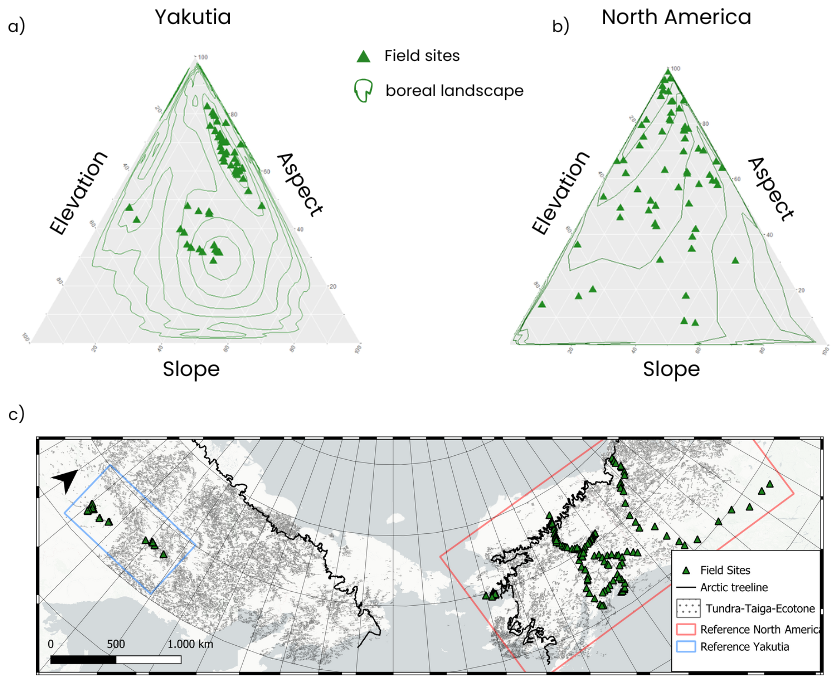
Figure 7Ternary plots of field sites within the diversity range of (a) Yakutian and (b) Northwest American boreal forest topography (contour density lines) for elevation between 0 to 3141 m a.s.l. (Northwest America) and 65 to 2572 m a.s.l. (Yakutia), slope angles of 0 to 53° (Northwest America) and 3 to 79° (Yakutia) and all ranges of aspect (Ensemble Digital Terrain Model, EDTM; Ho et al., 2023) within the boundaries depicted in the (c) reference map. Basemap: Esri|Powered by Esri.
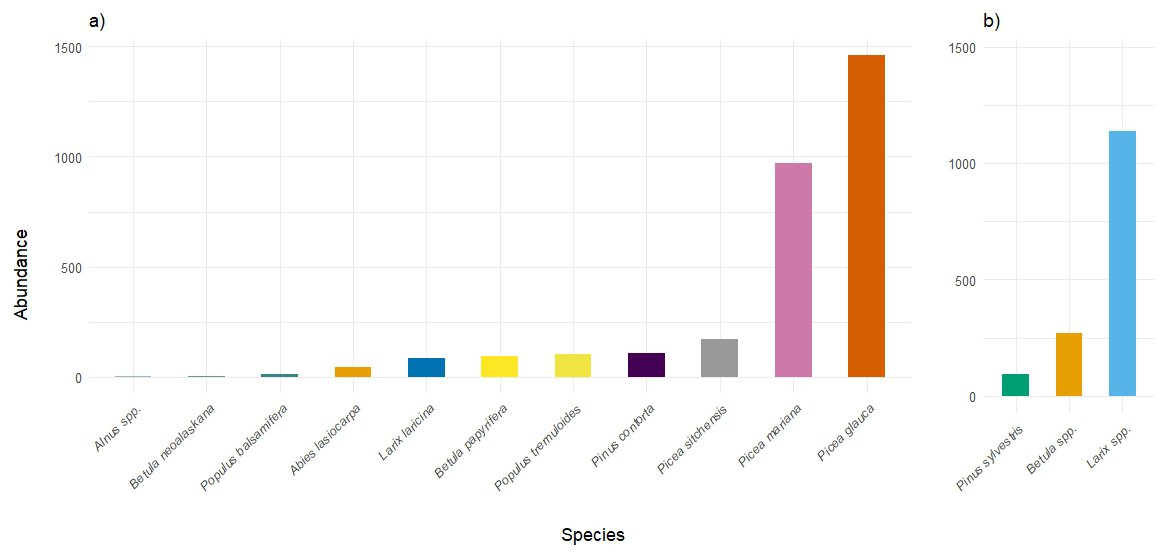
Figure 8Predicted abundance (number of trees) of different tree species (subsets with prediction probability > 0.8) in the BorFIT dataset. (a) Northwest America (n=3060); (b) Yakutia (n=1497).
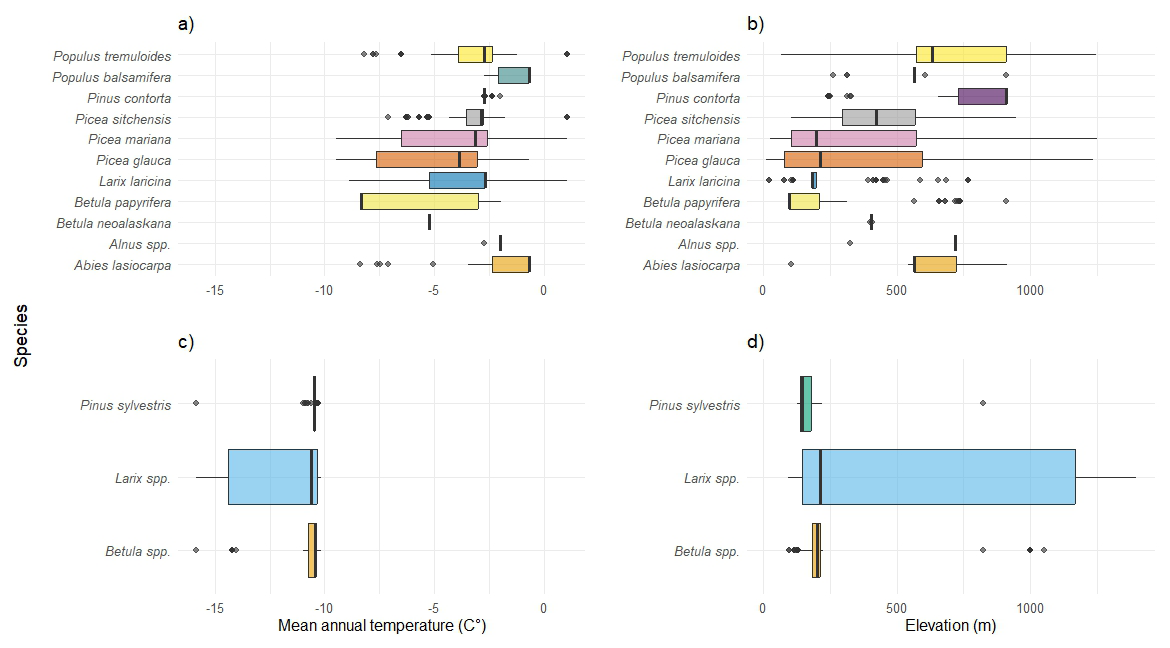
Figure 9Boxplots of species distribution (subsets with prediction probability > 0.8) against environmental variables. (a) Northwest American species against mean annual temperature (MAT °C); (b) Northwest American species against elevation (m); (c) Yakutian species against MAT (°C); (d) Yakutian species against elevation (m); MAT derived from WorldClim (Fick and Hijmans, 2017); Elevation from Copernicus Global DEM (European Space Agency, 2024).
3.2 BorFIT validation results
The validation of the four tailored classifiers, that were trained accounting for the different regions and sensor configurations included in the BorFIT dataset, shows an overall good internal performance during model construction. Table 5 gives an overview of the different models performance metrics, with the mean accuracy across the 10 folds of the cross validation, the out-of-bag (oob) error, as well as the values for mtry and ntree, defined through hyperparameter tuning.
Table 5Overview of the random forest models' performances and data (mtry is the number of variables tried at each split, ntree is the number of decision trees built by the model, OOB refers to out of bag, the internal validation metric for model performance (the lower the better) (Overview on spectral and structural variables is shown in Table 4, the abbreviations of tree species are shown in Table 2 for Northwest America and Table 3 for Siberia).
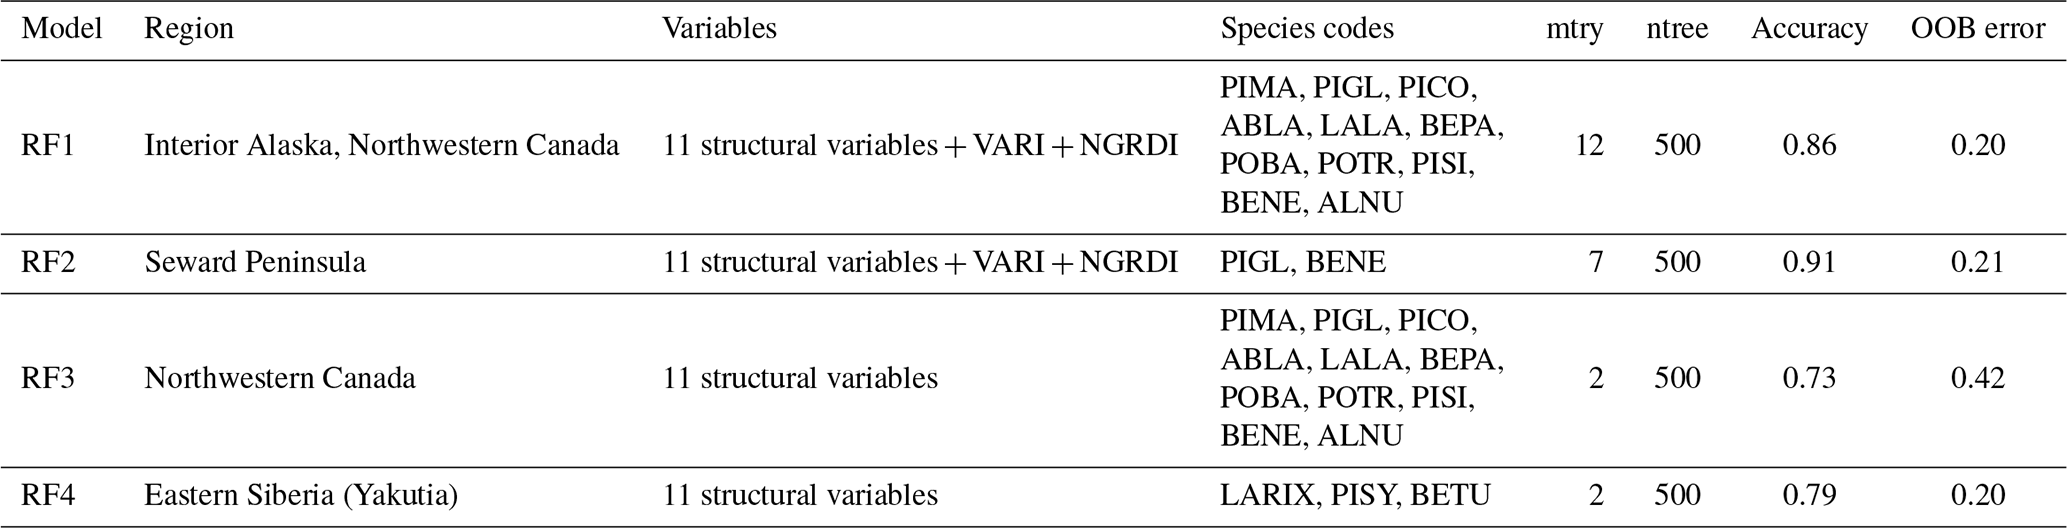
While most species predictions had class errors between 0 and 0.26, certain species, such as Picea Sitchensis and Populus tremuloides, presented greater challenges, with errors reaching up to 0.70. A full overview of the models class errors is provided in the Table 6a–d. Class errors varied among models. For RF1, error rates were generally low (< 0.20) for most classes, with notably high accuracy for Alnus spp. and Picea mariana (both 0) and the poorest performance for Larix laricina (0.33) and Picea glauca (0.26). RF2 achieved perfect classification for Betula neoalaskana (0) and likewise performed well on Picea glauca (0.09). In contrast, RF3 showed greater variability: Picea sitchensis and Populus tremuloides exhibited the highest class errors (0.70 and 0.54), whereas Pinus contorta and Populus balsamifera were classified most accurately (0.07 and 0.07). RF4 errors were moderate overall, ranging from 0.18 for Larix spp. to 0.21 for Betula spp., indicating more uniform but slightly lower precision across classes compared to RF1 and RF2. Overall, the species class was predicted for the 16 530 individual trees of the dataset with a mean probability of 0.67.
Table 6Class errors for random forest models: (a) RF1: Interior Alaska, Northwestern Canada, structural and spectral variables; (b) RF2: Seward Peninsula, structural and spectral variables; (c) RF3: Northwestern Canada, structural variables; (d) RF4: Eastern Siberia, structural variables.

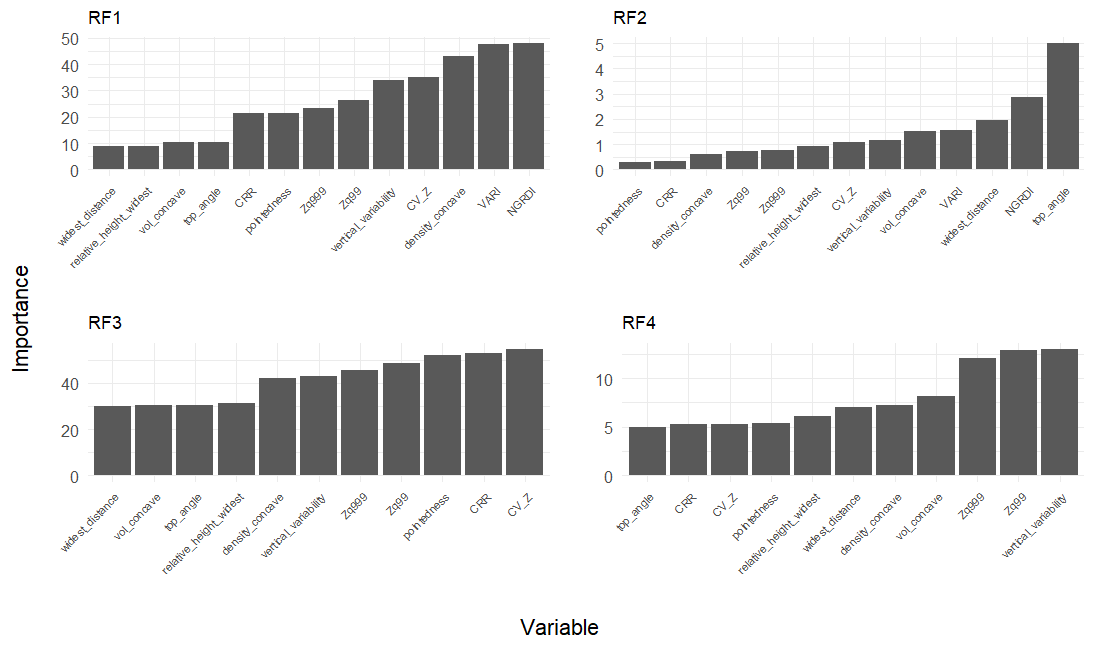
Figure 10Variable importance of the four random forest classifiers (RF1–RF4) (Variable overview and abbreviations are shown in Table 4). Notably the models with RGB (RF1, RF2) relied heavily on spectral variables.
3.3 BorFIT feature importance
The models feature importances (Fig. 10) indicate how the models distinguished between the different species. The most important features vary between the four different classifiers. In RF1 the two most important features for species prediction, were the spectral variables NGRDI and VARI. Species-level variations in spectral response were more informative than differences in structure or shape. Shape differs between species, but also between individuals and age (height). This is clearly visible when looking at the relation of a species pointedness and height (Fig. 11), and the overlap of density functions of structural features for each species (Figs. 12 and 13). Therefore, structural features tend to be less distinctive at the species level because many species share similar structural forms, especially within mixed stands or complex forests. In RF2 the angle from the top of the crown to the widest part of the crown was most distinctive. This is expected because in Betula neoalaskana, the widest part of the crown is typically higher relative to the tree height compared to Picea glauca. In RF3 the differences in the importance between the features are less distinct, as the model uses most of its predictors evenly. In RF4 the most important features were point distribution variables (vertical variability and Zq99). Some species share similarities across multiple attributes, making differentiation more difficult and increasing uncertainty. Notably, various Betula and Picea species share structural similarities and are primarily differentiated by their spectral attributes (Fig. 12).
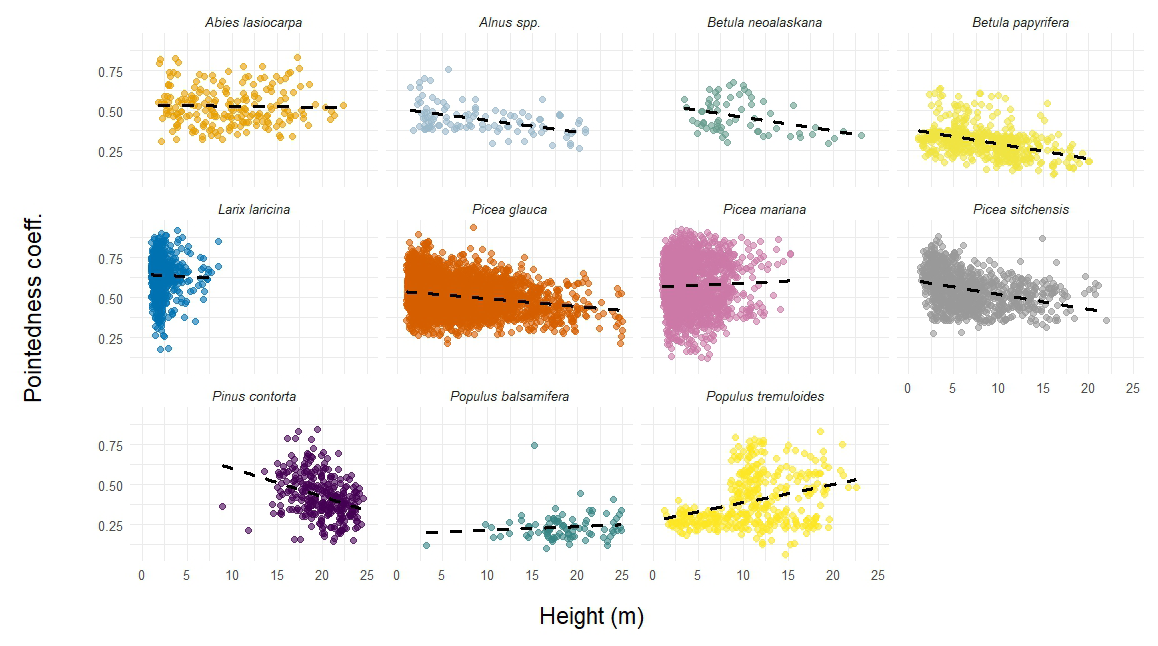
Figure 11Scattergrams of tree height vs. pointedness coefficient (Table 4) of Northwest American species.
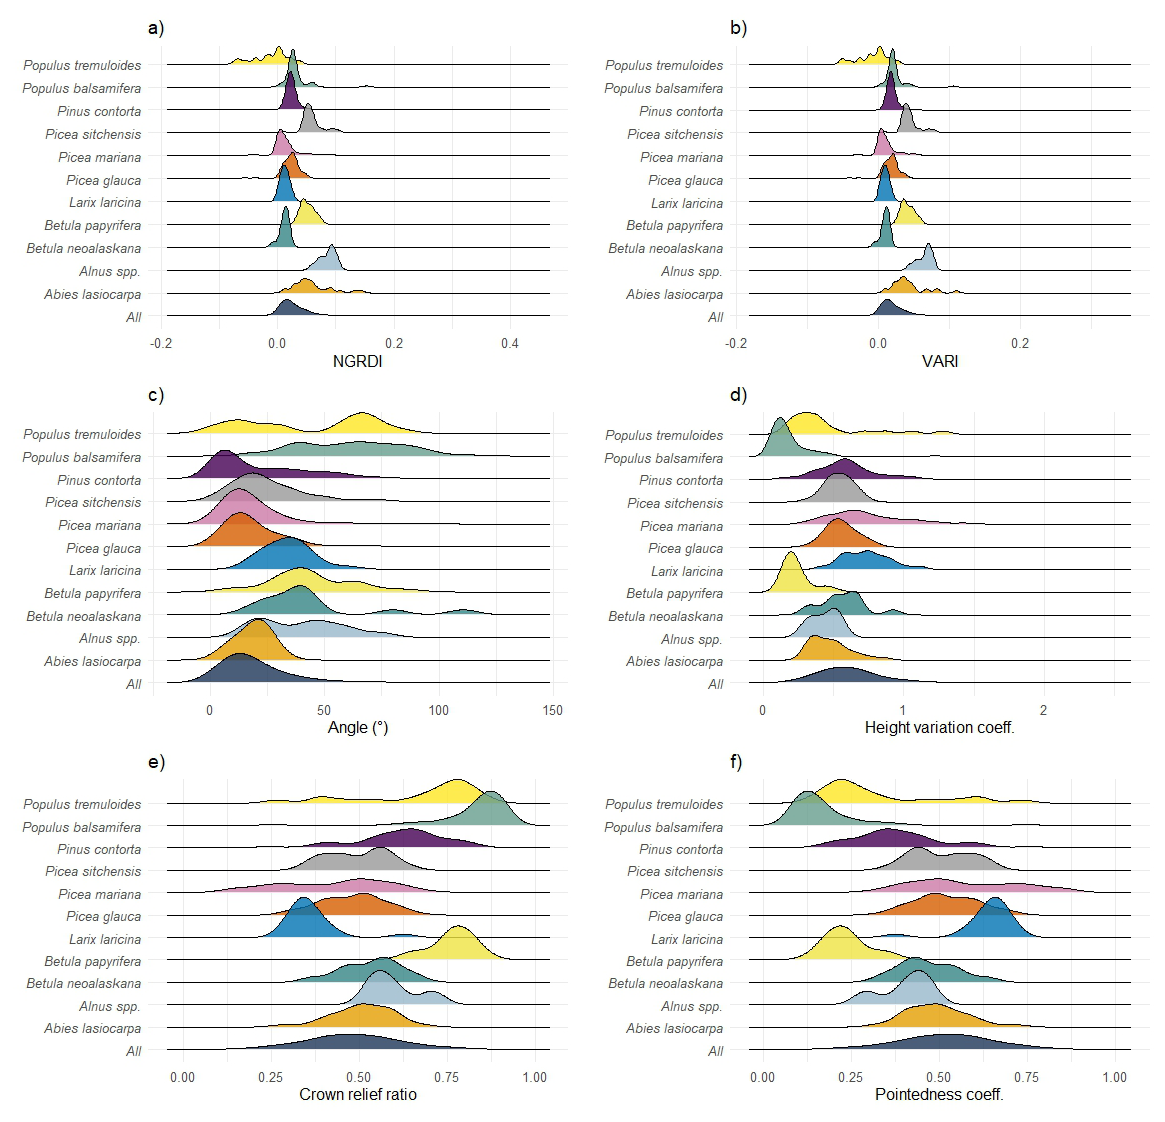
Figure 12Density of species' distribution in Northwest America against structural and spectral variables (a) predicted species against NGRDI; (b) predicted species against VARI; (c) predicted species against top angle; (d) predicted species against coefficient of variation of height; (e) predicted species against CRR; (f) predicted species against pointedness coefficient.
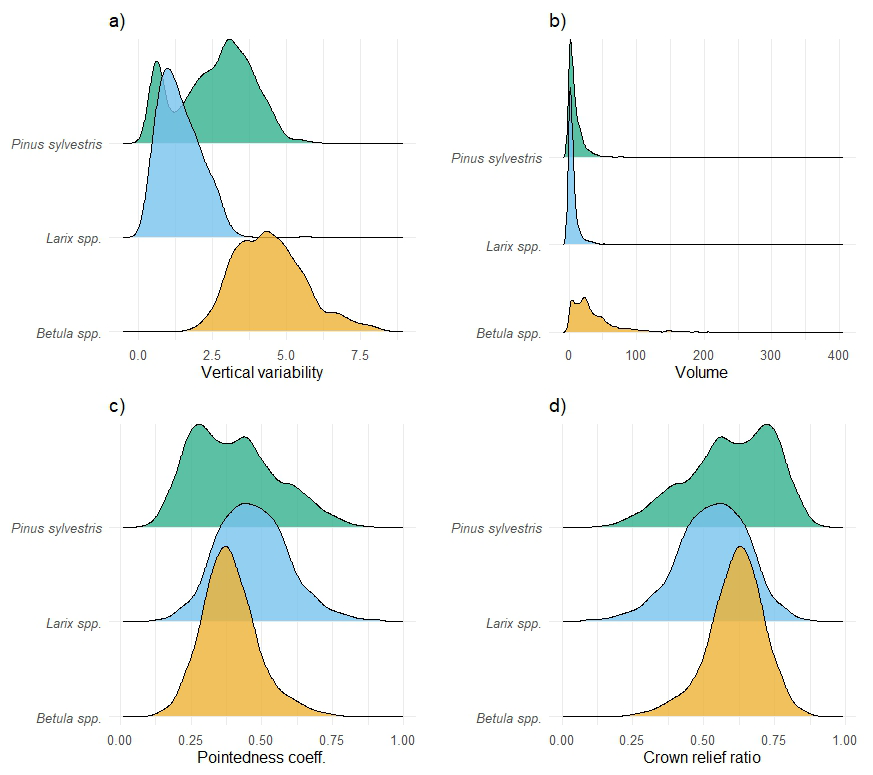
Figure 13Density of species' distribution in Eastern Siberia against structural and spectral characteristics (a) predicted species against Vertical variability; (b) predicted species against alphashape volume; (c) predicted species against pointedness coefficient; (d) predicted species against crown relief ratio.
3.4 BorFIT dataset properties
The primary objective of the BorFIT project was to create a comprehensive database of individual tree point clouds from the boreal biome, specifically of its Northern forest edge of evergreen needleleaf boreal forest in Northwest America, and also of summergreen needleleaf boreal forest in Eastern Siberia. We successfully segmented 16 530 trees across 14 taxa. While the number of reference plots is similar in Yakutia (N=177) and Northwest America (N=207), the segmented tree counts differ significantly: over 10 000 trees were segmented in Northwest America compared to 6085 in Yakutia. This discrepancy is attributed to the less dense stands of taller Larix spp. trees in Yakutia, compared to the denser populations of Picea mariana found near the arctic tree line in Canada and Alaska, where up to 200, mostly shorter, individuals can grow within a 20 m × 20 m reference plot. The smallest trees in our dataset are approximately 50 cm tall.
This is due to difficulties in the segmentation process, when distinguishing between young trees and shrubs. According to our dataset, in Northwest America the mean tree height is 6.3 m, in Yakutia it is 8.3 m; while some individuals in Northwest America reach over 30 m, while the maximum tree height in Yakutia is below 25 m. The random forest classifier was trained to identify structural variables of tree species regardless of their growth stage; however, mature individuals of, e.g. Picea mariana, exhibit fundamentally different structures compared to younger trees, complicating the learning process across most species.
The relationship between the height and width of BorFIT trees changes as they grow. Some species (Alnus spp., Betula neoalaskana, Betula papyrifera, Picea glauca, Picea sitchensis, Pinus contorta) become less pointed with size, while others (Picea mariana, Populus balsamifera, Populus tremuloides) become more pointed (Fig. 11). This variability complicates species classification by the random forest classifier. In addition, similarities in structural and spectral traits between species make accurate classification even more difficult. In contrast, Figs. 12 and 13 highlight the distinct differences that allowed robust classification results.
The predicted distribution of Northwest American BorFIT trees is mapped in Fig. 14. Clearly visible is the dominance of the Picea genus in Alaska and Northwestern Canada within our dataset. Other species, e.g. Betula neoalaskana and Alnus spp. are underrepresented. This is due to the subset of the dataset that was used for the mapping (probability > 0.8) since these species yielded higher class errors during prediction (Table 6a–d).
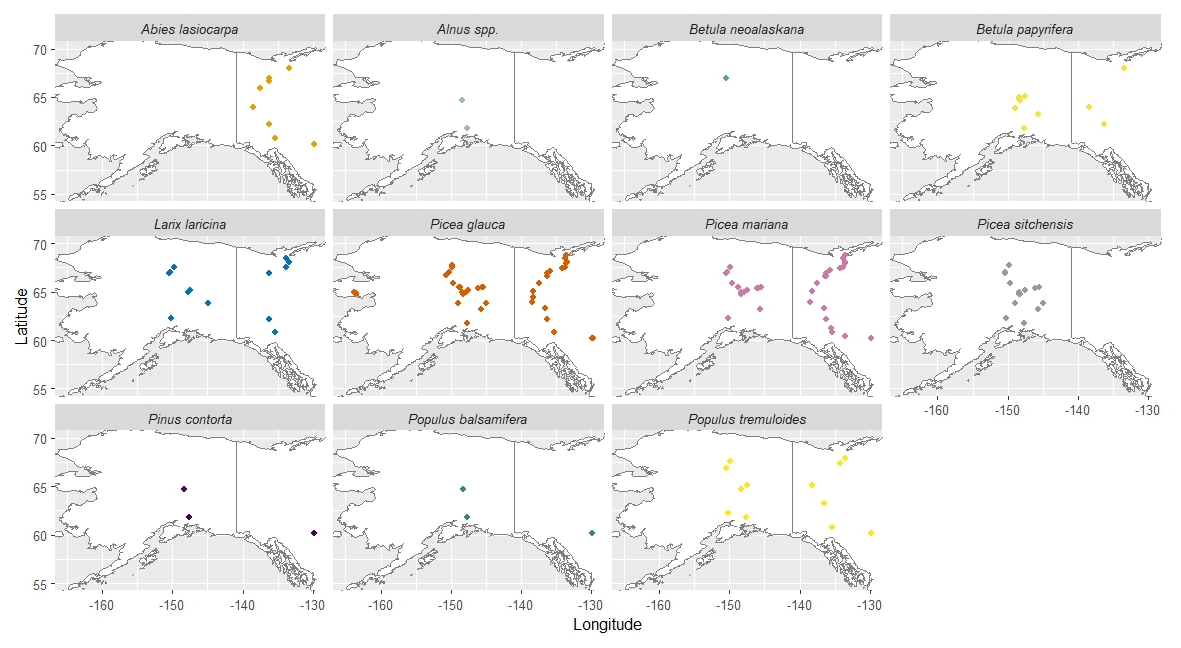
Figure 14Predicted species distribution in Northwest America by abundance maps (visualised by colour-coded points) of 11 tree species; (data subset (with probability > 0.8).
4.1 Importance of manual segmentation
The segmentation of over 16 000 individual trees across diverse boreal regions provides a unique dataset to assess forest structure and species composition at novel scales, in Alaska, Northwestern Canada and Eastern Siberia. Segmenting individual trees from forest point clouds remains a bottleneck for retrieving stand structure and species distribution patterns. Studies that produced datasets that contain similar quantities of individual tree point clouds have focused either on local maximum filtering for tree segmentation (Dubrovin et al., 2024) (3600 trees) or on various segmentation techniques, including canopy height based techniques (Puliti et al., 2025) (20 000 trees). Segmentation based on 2D representations of the canopy tends to overlook trees when dealing with overlapping crowns, as our experience shows in the Eastern Siberian treeline (Brieger et al., 2019). More advanced techniques based on deep learning require suitable trainig datasets, tailored towards the respective tree and stand structure (Chehreh et al., 2023). Regardless of the method used, high quality segmentation often requires manual refinement (Puliti et al., 2025). Therefore, the segmentation of BorFIT trees was performed manually to acquire high quality segments without requiring a tailored training dataset. This process is labor-intensive and subject to errors, particularly in dense broadleaf forests where overlapping canopies and understory vegetation confound structural and spectral feature extraction. Measures for quality control (as described in Sect. 2.4) are compulsory to ensure an accurate segmentation result.
4.2 Validation metrics comparison
The robust performance of our random forest models (accuracies ranging from 0.73 to 0.91) can be attributed to the efforts invested in manual segmentation of trees and tailoring different models for distinct biomes. These scores are consistent with previous studies employing similar methodologies (Persson A., 2004; Shi et al., 2018; You et al., 2020). Michałowska and Rapiński (2021) reviewed studies discriminating tree species using attributes derived from LiDAR point clouds with various algorithms including random forest, noting that overall accuracy tends to decrease as the number of species to distinguish increases. The maximum number of species in any of the studies reviewed by Michałowska and Rapiński (2021) was six, yielding overall accuracies between 0.57 and 0.79. In contrast, RF1 from our study was trained on 11 different species and achieved an overall accuracy of 0.86, supported by the inclusion of spectral variables that ranked among the most important during classification. RF3, which excluded spectral attributes but still differentiated 11 species, resulted in an overall accuracy of 0.73, a performance that remains robust compared to the studies reviewed by Michałowska and Rapiński (2021). RF2, classifying only two species with spectral variables, achieved the highest accuracy of 0.91, as expected, while RF4 classified three species using only structural variables with an accuracy of 0.79, falling within the 0.62 to 0.95 accuracy range reported by Michałowska and Rapiński (2021) for similar scenarios.
The class errors reveal the robustness of the prediction for the different species, indicating robust model performance for the most common species, which are well represented in the training data. The training data was equalized to maximum 50 individuals per species. However, only 18 individuals of Alnus spp. were included in the training data. Despite this low abundance in the training data, Alnus spp. shows low class error in RF1 (see Table 6a), that we assume is due to its structure. It grows very differently compared to the other species, it is a shrub without a vertical central stem. Therefore, differentiation was successful, which led to no misclassifications by the random forest model. The low class error of Picea mariana during classification, and no misclassification as Picea glauca was not to be expected, since they share structural similarities. However, the prediction on unseen data reveals, that misclassification does happen. Sites inhabited only by one species of Picea (according to our own forest inventories) were frequently predicted to be shared by both Picea mariana and Picea glauca. Users should therefore consider this bias when analyzing predicted distributions and training species classifiers using BorFIT. A possible solution would be to focus on the genus level, as the differentiation from other genera can be considered very robust, or to focus on the included files with manually assigned tree species, since the manual classification based on field work data is precise. Underrepresentation of species such as Alnus spp. and Betula neoalaskana in the training data led to reduced classification accuracy for these taxa, highlighting a common challenge in ecological remote sensing: that is the scarcity of annotated data for less common species. This limitation, well-documented in machine learning literature (Jafarigol and Trafalis, 2023), shows that insufficient or imbalanced datasets can significantly hinder model generalizability and performance, as reflected by considerably lower class accuracies for species with fewer training samples. Furthermore, our results emphasize the importance of spectral features in distinguishing tree species; RF3, relying solely on structural data, produced lower overall accuracy and higher out-of-bag errors compared to models including spectral variables. These findings underscore the critical role of balanced training datasets and the integration of spectral and structural information to achieve robust species classification. In conclusion, our classification yielded robust results, providing users with a high-quality product for the analysis of spectral and structural traits of boreal trees.
4.3 Reliability of predicted species distribution
The dominant trees, e.g. Larix spp. in Eastern Siberia and Picea spp. in Northwestern America, were reliably predicted and differentiated from the common broadleaf species, with some misclassification between different species of the Picea genus. Some species are underrepresented in the training data, leading to misclassifications and irregularities in their predicted distribution, e.g. Populus tremuloides and Picea sitchensis have been predicted in point clouds sourced from regions far north of the Arctic Circle where the species have not been observed during field work. P. mariana and P. glauca are the most dominant species in our Northwest American study region, often found in mixed stands, this pattern is reflected in their predicted distribution. However, Roland et al. (2013) report specific site preferences for the two species (Picea mariana dominating at lower elevation compared to Picea glauca). These are not clearly visible within our data, as they were predicted to share stands in both high- and lowland areas. However, most of the geographical distribution patterns visible in Fig. 9 (against environmental variables) and Fig. 14 (spatial) align with our experiences during field work. A clear dominance of Picea spp. in Northwest America is visible. The Same is true for Larix spp. in Eastern Siberia while the other species are bound to warmer regions (Populus tremuloides, Populus balsamifera, Abies lasiocarpa, Pinus sylvestris, Betula spp.) compared to their respective dominant competitors. In summary, the BorFIT training dataset derived from LiDAR (and RGB) delivers robustly classified tree species across the Northern boreal region that can be used for further AI classification of tree species from LiDAR point clouds. However, it should be noted that the overall plausible geographical and ecological pattern visible in our data is highly linked to sufficient samples in the training data and the availability of spectral attributes.
4.4 Usability of the BorFIT dataset
The BorFIT dataset bridges the gap between small-scale individual tree assessments (Wittke et al., 2024) and large-scale remote sensing products for stand structure analysis (van Geffen et al., 2022). Complementary, the FOR-instance dataset (Puliti et al., 2023) provides a global benchmarking and training resource for AI-based tree segmentation – comprising segmented individual trees in point clouds from various regions. However, the boreal trees represent European forests and the trees do not contain species annotations. BorFIT is the first dataset of its kind to cover Northwest American and Siberian boreal regions with species-level classification, filling a critical gap for large-scale, species-resolved analyses in these areas, as it was provided for other world regions by Puliti et al. (2023), Puliti et al. (2025) and Dubrovin et al. (2024). There are interesting ecological applications that can be carried out using single trees with an assigned species. In Enguehard et al. (2025) we used single trees assigned a plant functional type (evergreen, needleleaf versus decidious) for the same Northwest American sites as used in BorFIT, for analysing community networks and to assign successional stages after disturbances in boreal forests. However, the study by Enguehard et al. (2025) did not yet contain the species assignment. The employment of species-resolved analyses and high-quality automated segmentation has the potential to enhance the precision and detail of studies examining community networks and successional stages (Enguehard et al., 2025). Products like the ESA (2017) CCI landcover, could be assessed through the species resolved reference plots of BorFIT. Furthermore, spaceborne LiDAR missions like GEDI or ICESat that provide forest structure could be assessed using BorFIT. Algorithms that are developed to automatically segment tree instances (Xiang et al., 2024; Burmeister M., 2025) could be retrained using BorFIT to perform better in boreal environments, or their performance could be assessed against manual segementation. Species-annotated tree point clouds like BorFIT enable a wide range of advanced forestry and ecological applications. They can be used to support the development of AI-driven monitoring tools for forest health, biomass estimation, and carbon stock assessments. Such datasets also facilitate studies of species-specific growth patterns, competition, and responses to environmental change, enhancing our understanding of forest dynamics and biodiversity.
The BorFIT dataset is published on the PANGAEA data repository (Felden et al., 2023). Table 7 provides an overview of all published datasets that were used for the creation of BorFIT, and includes the reference to the training dataset.
The R code used for training the random forest classifier and predicting the species is publicly available on GitHub (https://github.com/StefanKruse/BorFIT/tree/main, Schladebach, 2026). The files are named based on our expedition event number, representing the site of the drone overflights, e.g. EN23604_Lidar. “23” is the year of the expedition, in this case Alaska 2023, while 604 is the site number. The reference plot number, e.g. “00”, is also indicated in the filename (reference_plot_00_predicted.laz). The added scalar fields “Species” and “Tree” are extra bytes in the .laz files, which needs to be considered when loading the data.
Table 7Overview of the BorFIT and related UAV LiDAR point cloud datasets (The point clouds referenced as “Original” correspond to expedition-specific UAV surveys used in BorFIT development.)
We introduce a novel, large-scale boreal forest individual tree species reference dataset BorFIT was derived from UAV-LiDAR and spectral (RGB) data from Northwestern American and Eastern Siberian flight transects, enabling extraction of structural and spectral (RGB) parameters for 14 tree taxa and segmentation/classification algorithm training. The dataset's diversity in bioclimatic and topographic conditions, combined with robust species prediction results, supports representative analyses of boreal forest composition and structure. Limitations include restricted spectral information from RGB sensors and lower prediction accuracies for species with either structural/spectral similarities to other taxa or low representation in the training data, such as Alnus spp., Picea sitchensis, and Betula neoalaskana. Despite these challenges, the random forest based predictions using four separate models for the different regions and sensor configurations, produced plausible results and offers substantial value for future research. Integrating additional data sources, such as hyperspectral or full waveform LiDAR, could further enhance classification accuracy, as suggested by other studies (Shi et al., 2018; Axelsson et al., 2018; Heinzel, 2012; Korpela et al., 2023). BorFIT enables the digital representation of 3D forest structure which is representative of forest condition, functionality, biodiversity and evolution (Hall et al., 2011). 3D forest structure can be upscaled using spaceborne LiDAR (e.g., GEDI, ICESat-2) or synthetic aperture radar (SAR). Thus, improving the accuracy of large-scale forest structure and composition landcover maps. In summary, datasets like BorFIT are essential for effective boreal forest monitoring. Such datasets not only facilitate the assessment of large scale landcover products but also provide critical information for evaluating the impacts of climate change on species distribution patterns.
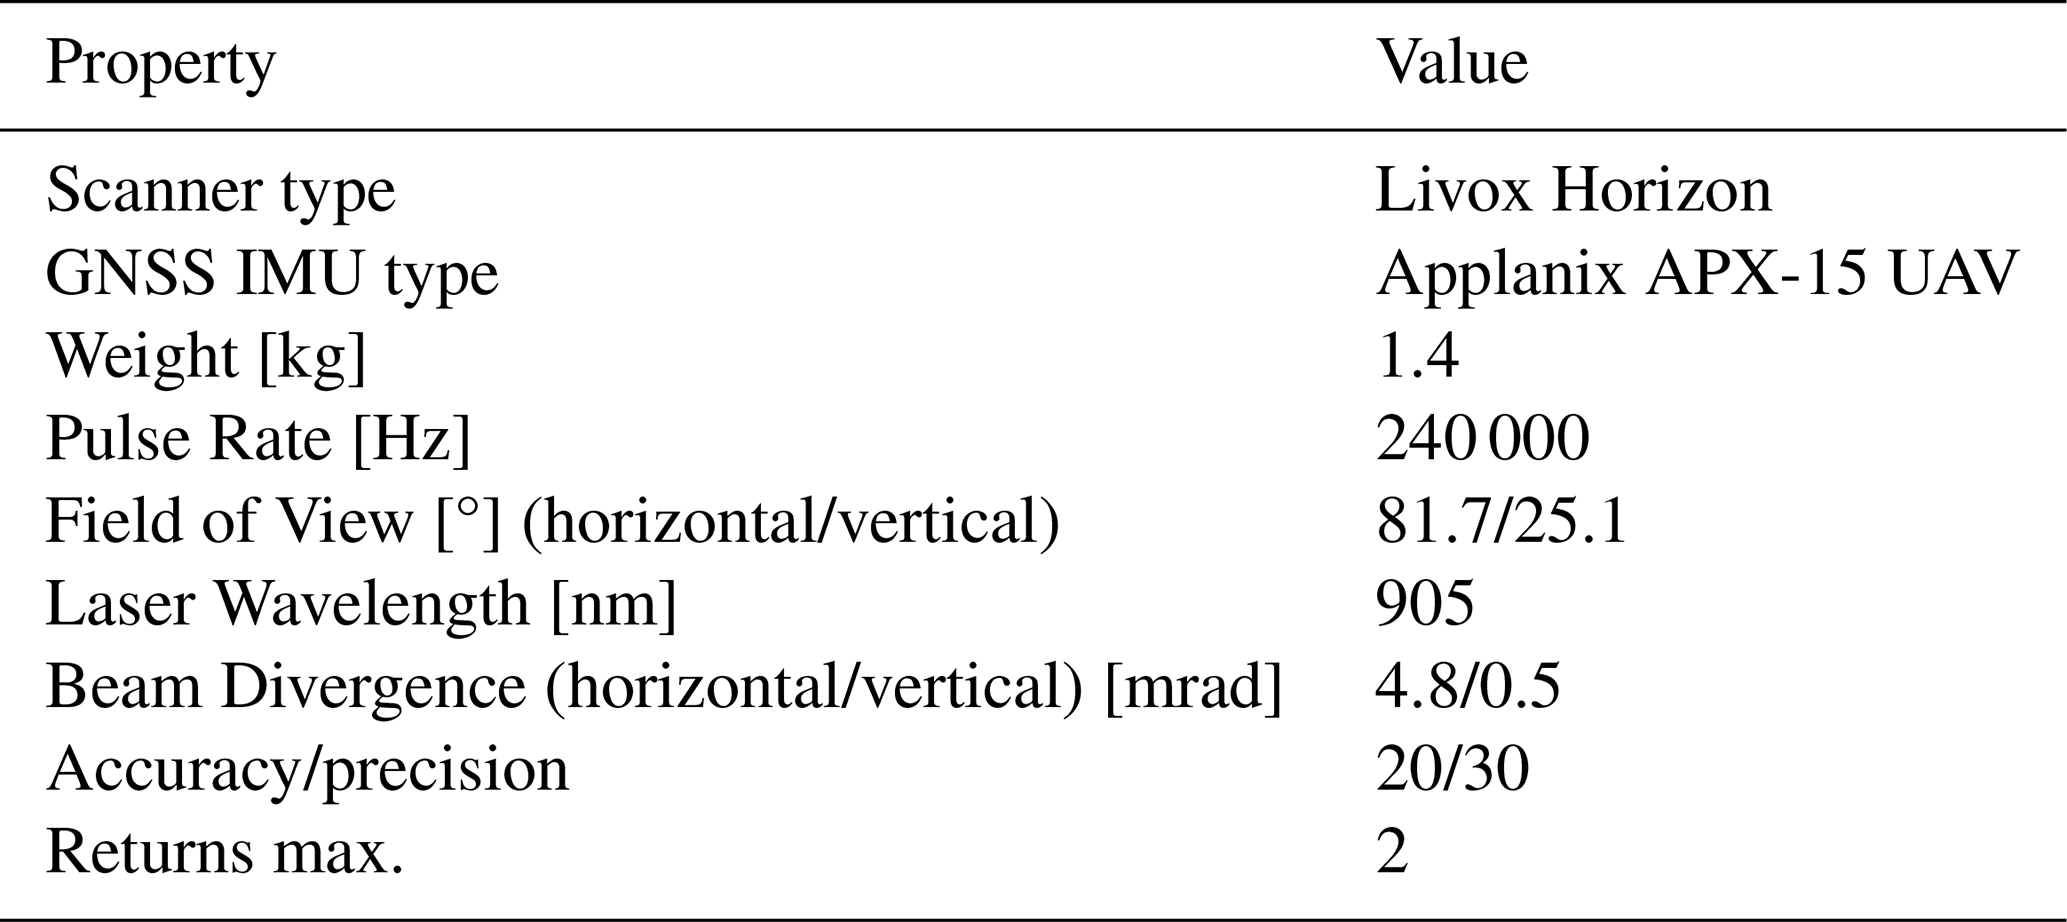
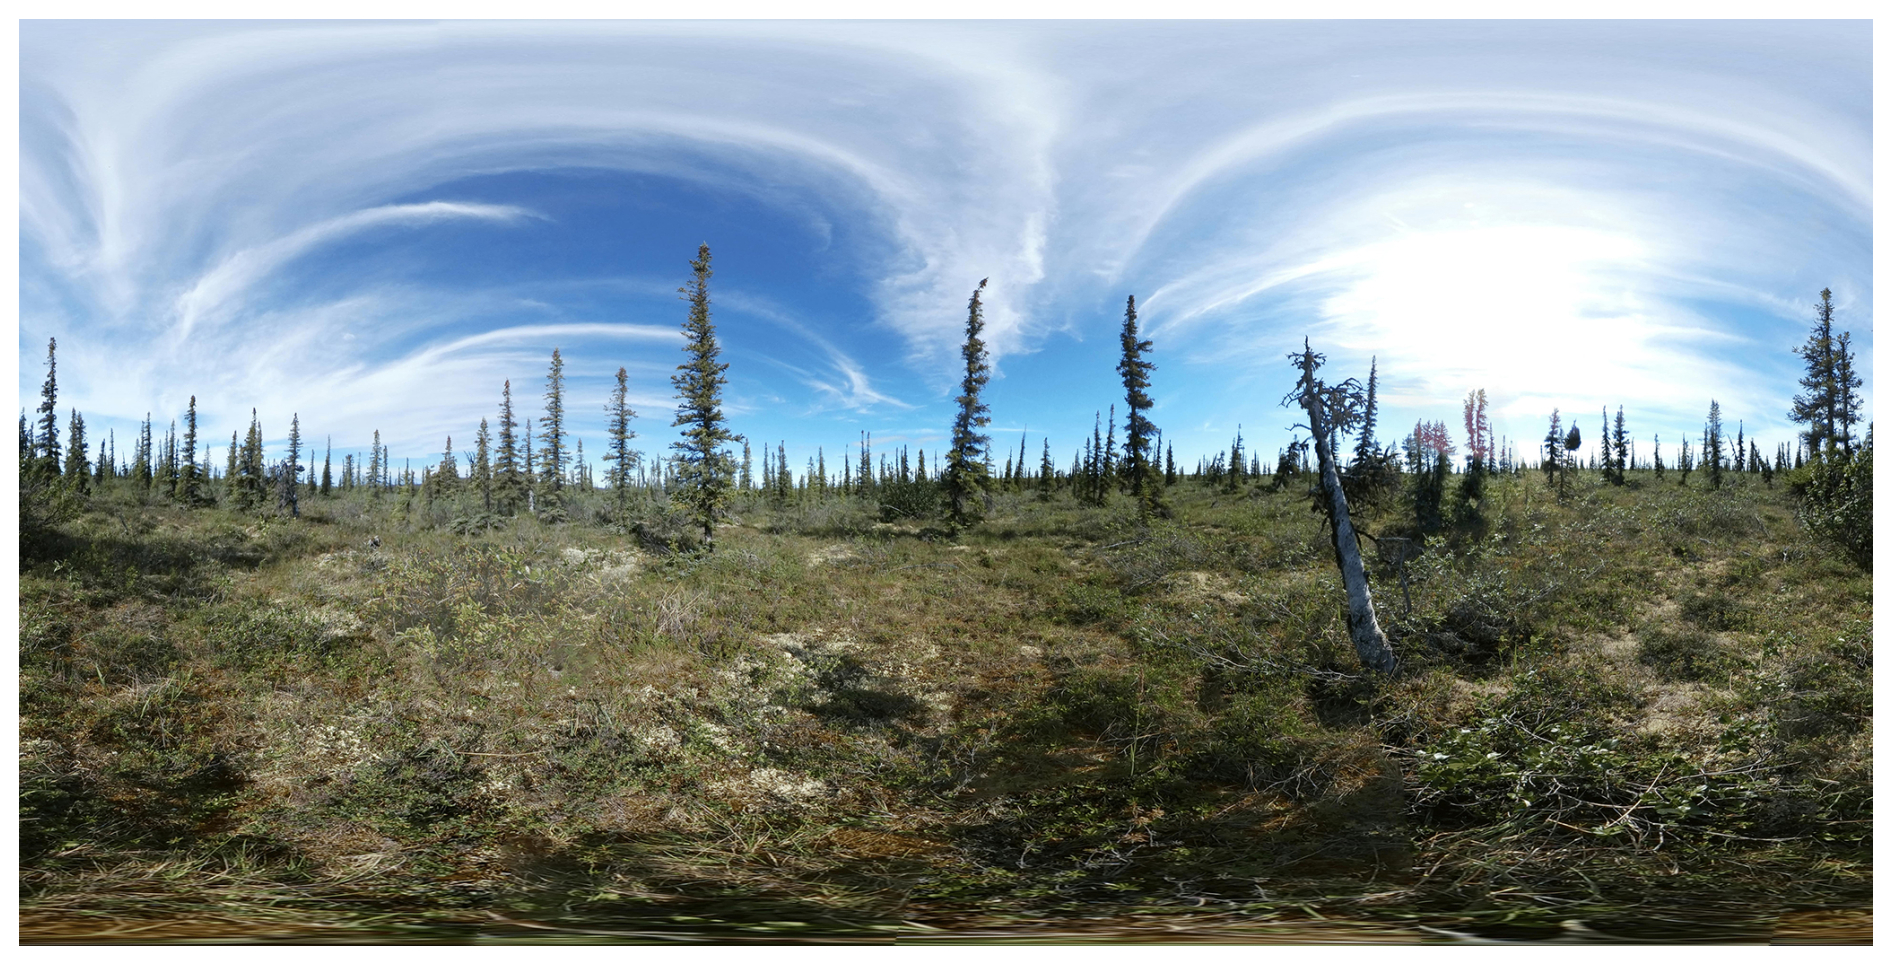
Figure A1Full panoramic image of field site EN22006 north of Inuvik (Northwestern Territories, Canada).
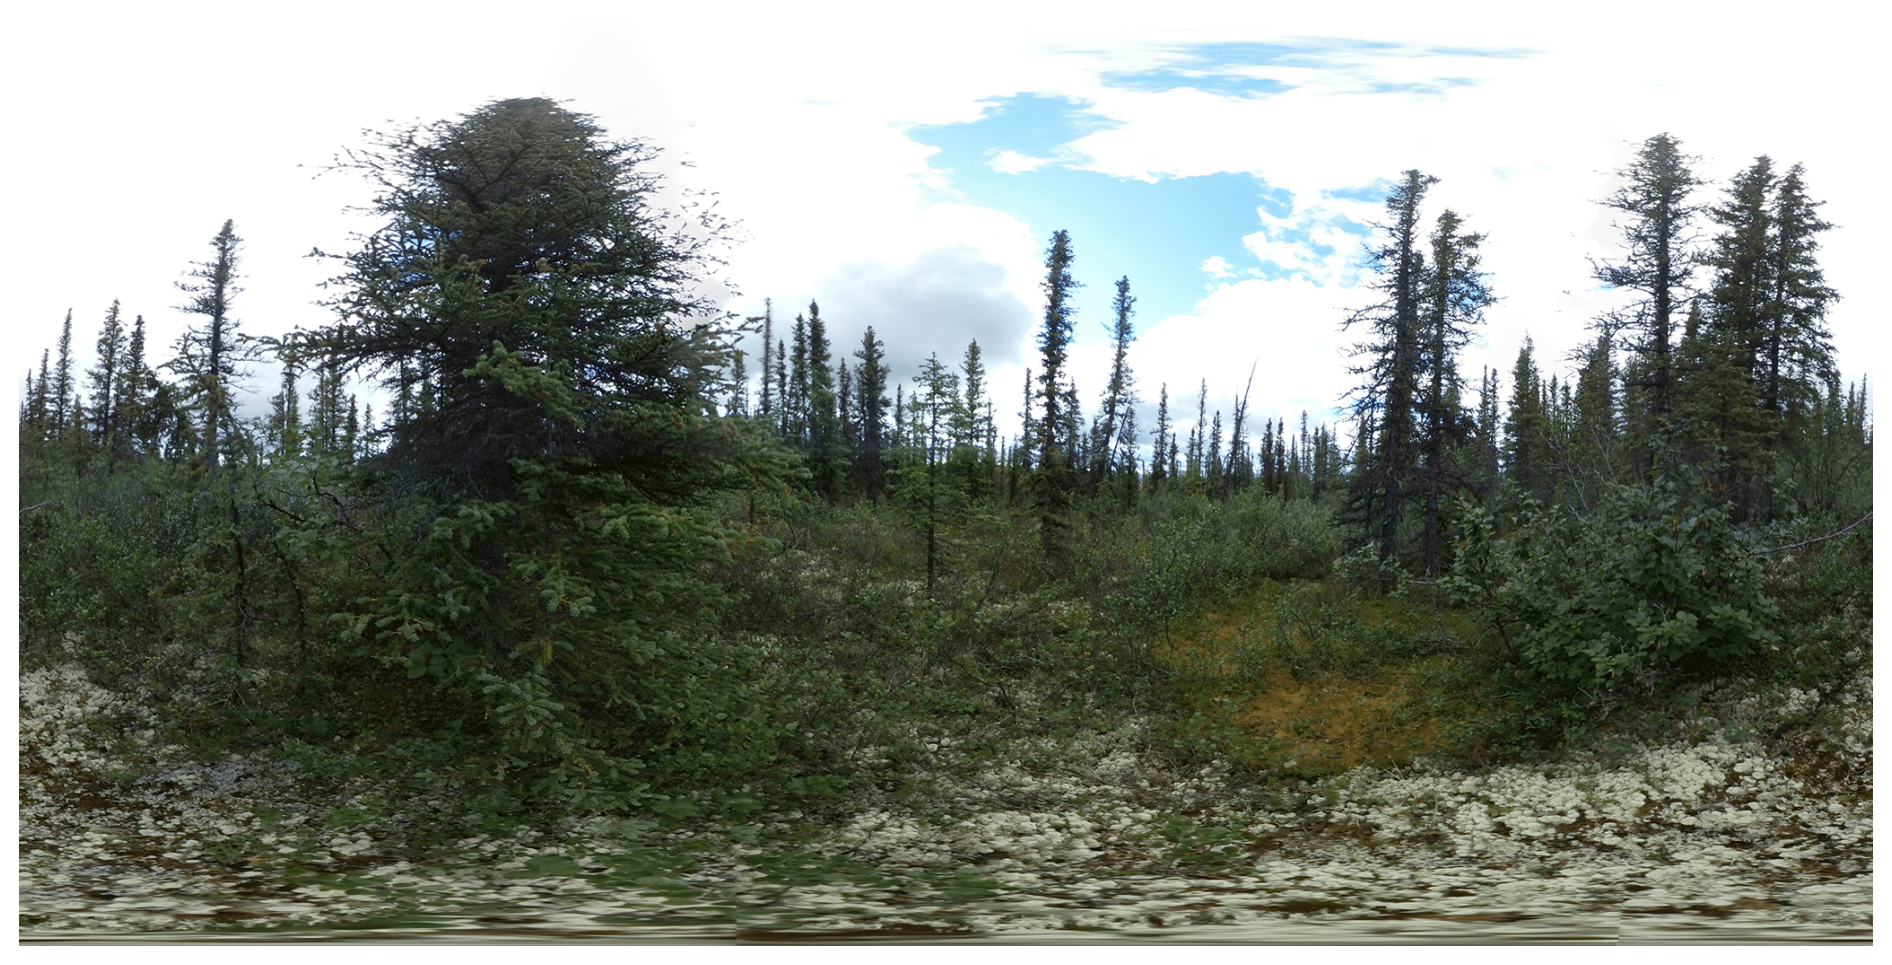
Figure A2Full panoramic image of field site EN22033 south of Fort McPherson (Northwestern Territories, Canada).
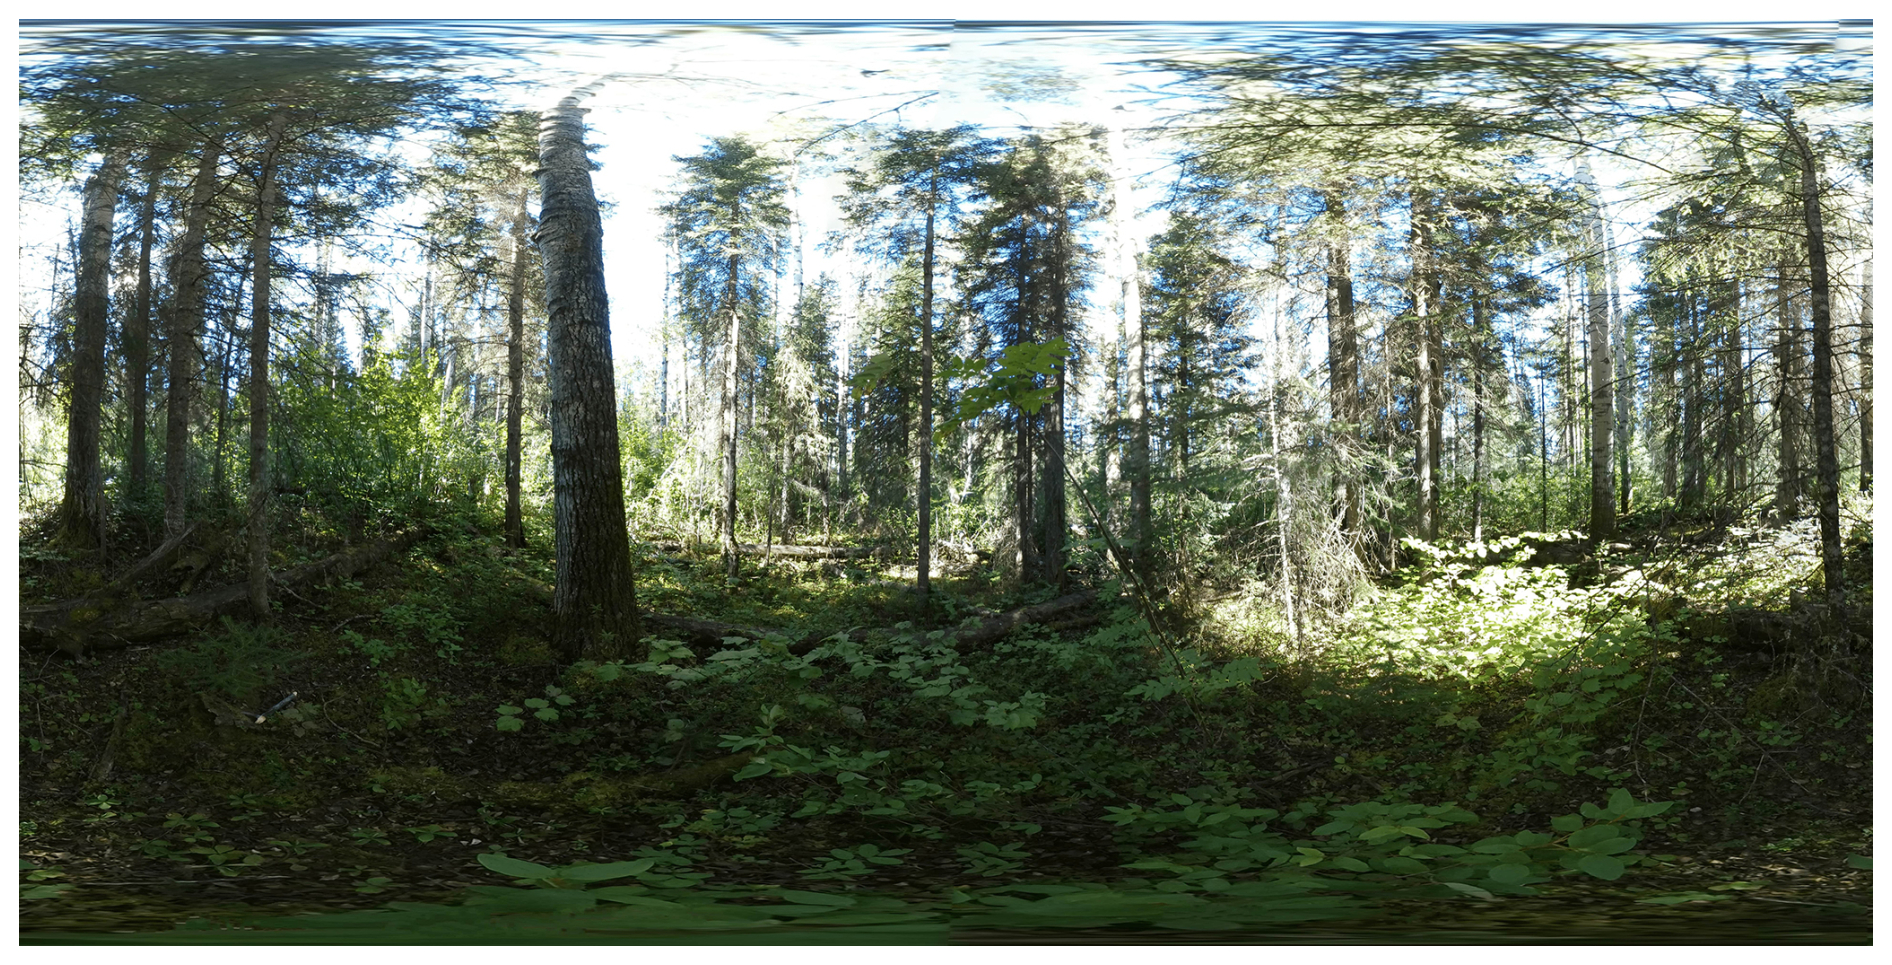
Figure A3Full panoramic image of field site EN22071 near Fort Nelson (British Columbia, Canada),
According to CRediT: SK: Conceptualization-Lead, Investigation, Resources, Writing – Review and editing, Supervision, Project administration, Funding acquisition. JS: Conceptualization, Investigation, Methodology, Formal analysis, Data curation, Writing – Original draft, Writing – review and editing, Supervision. LE: Data Curation, Investigation. JB: Data curation. JT: Data curation. AG: Data curation. MW: Data curation, Writing – Review and editing. RJ: Data curation, Writing – Review and editing, Investigation. JG: Data curation, Investigation. KH: Data curation. BH: Writing – Review and editing, Data curation.
At least one of the (co-)authors is a member of the editorial board of Earth System Science Data. The peer-review process was guided by an independent editor, and the authors also have no other competing interests to declare.
Publisher's note: Copernicus Publications remains neutral with regard to jurisdictional claims made in the text, published maps, institutional affiliations, or any other geographical representation in this paper. The authors bear the ultimate responsibility for providing appropriate place names. Views expressed in the text are those of the authors and do not necessarily reflect the views of the publisher.
The project was funded by the DataHub Information Infrastructure funds, project BorFIT. Additional funding for equipment was provided by the “Potsdamer InnoLab für Arktisforschung” grant no. F221-08-AWI/001/002, namely the Brandenburg Ministry for Science, Research and Culture. The project was funded by HELMHOLTZ IMAGING, a platform of the Helmholtz Information & Data Science Incubator [project POINTR, grant no. ZT-I-PF-4-076] I acknowledge the use of Perplexity (https://www.perplexity.ai, last access: 27 October 2026) to assist with rewriting and improving the clarity and style of certain sections of this manuscript. The tool was used to rephrase and edit text based on my original drafts; all content was critically reviewed and revised by the author prior to submission.
The article processing charges for this open-access publication were covered by the Alfred-Wegener-Institut Helmholtz-Zentrum für Polar- und Meeresforschung.
This paper was edited by Yuhan (Douglas) Rao and reviewed by three anonymous referees.
Aldaeri, A. S. T. M., Kit, C. Y., Ting, L. S., and Abdul Rahman, M. R. B.: Deep Learning for Tree Crown Detection and Delineation Using UAV and High-Resolution Imagery for Biometric Parameter Extraction: A Systematic Review, Forests, 17, https://doi.org/10.3390/f17020179, 2026. a
Al Rosyid, A. N. I., Astika, I. W., Setiawan, Y., Muttaqin, K. H., Impron, Imantho, H., Sugiarto, S. W., Endiviana, O. A., and Yuliawan, T.: Visible Band Optimation of Unmanned Aerial Vehicle for Estimating Synthetic NDVI on Rice Vegetation, J. Keteknikan Pertanian, 10, 281–290, https://doi.org/10.19028/jtep.010.3.281-290, 2022. a
Andrade, R. G., Hott, M. C., Coelho Pereira de Magalhães Junior, W., D'Oliveira, P. D., and Silva e Oliveira, J.: Monitoring of corn growth stages by UAV platform sensors, International J. Adv. Eng. Res. Sci., 6, 54–58, https://doi.org/10.22161/ijaers.69.5, 2019. a
Andreas, T., Burmeister, J.-M., Christoph, G., Tim, R., and Arne, N.: LAUTx – Individual Tree Point Clouds From Austrian Forest Inventory Plot, Zenodo [data set], https://doi.org/10.5281/zenodo.16910335, 2025. a
Atkins, J. W., Costanza, J., Dahlin, K. M., Dannenberg, M. P., Elmore, A. J., Fitzpatrick, M. C., Hakkenberg, C. R., Hardiman, B. S., Kamoske, A., LaRue, E. A., Silva, C. A., Stovall, A. E. L., and Tielens, E. K.: Scale dependency of lidar-derived forest structural diversity, Meth. Ecol. Evol., 14, 708–723, https://doi.org/10.1111/2041-210X.14040, 2023. a
Axelsson, A., Lindberg, E., and Olsson, H.: Exploring Multispectral ALS Data for Tree Species Classification, Remote Sens., 10, 183, https://doi.org/10.3390/rs10020183, 2018. a
Brieger, F., Herzschuh, U., Pestryakova, L., Bookhagen, B., Zakharov, E., and Kruse, S.: Advances in the Derivation of Northeast Siberian Forest Metrics Using High-Resolution UAV-Based Photogrammetric Point Clouds, Remote Sens., 11, 1447, https://doi.org/10.3390/rs11121447, 2019. a, b
Brunner, A. and Houtmeyers, S.: Segmentation of conifer tree crowns from terrestrial laser scanning point clouds in mixed stands of Scots pine and Norway spruce, Eur. J. Forest Res., 141, 909–925, https://doi.org/10.1007/s10342-022-01481-5, 2022. a
Burmeister, M., Tockner, A., Reder, S., Engel, M., Richter, R., Mund, J., and Döllner, J.: treeX: Unsupervised Tree Instance Segmentation in Dense Forest Point Clouds, arXiv [preprint], https://doi.org/10.48550/arXiv.2509.03633, 2025. a
Chavana-Bryant, C., Wilkes, P., Yang, W., Burt, A., Vines, P., Bennett, A. C., Pickavance, G. C., Cooper, D. L. M., Lewis, S. L., Phillips, O. L., Brede, B., Lau, A., Herold, M., McNicol, I. M., Mitchard, E. T. A., Coomes, D. A., Jackson, T. D., Makaga, L., Milamizokou Napo, H. O., Ngomanda, A., Ntie, S., Medjibe, V., Dimbonda, P., Soenens, L., Daelemans, V., Proux, L., Nilus, R., Labrière, N., Jeffery, K., Burslem, D. F. R. P., Clewley, D., Moffat, D., Qie, L., Bartholomeus, H., Vincent, G., Barbier, N., Derroire, G., Abernethy, K., Scipal, K., and Disney, M.: ForestScan: a unique multiscale dataset of tropical forest structure across 3 continents including terrestrial, UAV and airborne LiDAR and in-situ forest census data, Earth Syst. Sci. Data, 18, 1243–1274, https://doi.org/10.5194/essd-18-1243-2026, 2026. a
Chehreh, B., Moutinho, A., and Viegas, C.: Latest Trends on Tree Classification and Segmentation Using UAV Data – A Review of Agroforestry Applications, Remote Sens., 15, 2263, https://doi.org/10.3390/rs15092263, 2023. a
Crespo-Peremarch, P., Fournier, R. A., Nguyen, V.-T., van Lier, O. R., and Ángel Ruiz, L.: A comparative assessment of the vertical distribution of forest components using full-waveform airborne, discrete airborne and discrete terrestrial laser scanning data, Forest Ecol. Manag., 473, 118268, https://doi.org/10.1016/j.foreco.2020.118268, 2020. a
Dubrovin, I., Fortin, C., and Kedrov, A.: An open dataset for individual tree detection in UAV LiDAR point clouds and RGB orthophotos in dense mixed forests, Sci. Rep., 14, 21938, https://doi.org/10.1038/s41598-024-72669-5, 2024. a, b
Enguehard, L., Heim, B., Herzschuh, U., Dinkel, V., Juday, G., Panda, S., Falco, N., Schladebach, J., Broers, J., and Kruse, S.: Investigating boreal forest successional stages in Alaska and Northwest Canada using UAV-LiDAR and RGB and a community detection network, Remote Sens. Ecol. Conserv., 12, 129–147, https://doi.org/10.1002/rse2.70029, 2025. a, b, c
ESA: Land Cover CCI Product User Guide Version 2.0, Technical Report CCI-LC-PUGv2, ESA – European Space Agency, http://maps.elie.ucl.ac.be/CCI/viewer/download/ESACCI-LC-Ph2-PUGv2_2.0.pdf (last access: 23 October 2024), 2017. a
European Space Agency: Copernicus Global Digital Elevation Model, https://doi.org/10.5069/G9028PQB, 2024. a
Falkowski, M., Smith, A., Gessler, P., Hudak, A., Vierling, L., and Evans, J.: The influence of conifer forest canopy cover on the accuracy of two individual tree measurement algorithms using lidar data, Can. J. Remote Sens., 34, S338–S350, https://doi.org/10.5589/m08-055, 2008. a
Felden, J., Möller, L., Schindler, U., Huber, R., Schumacher, S., Koppe, R., Diepenbroek, M., and Glöckner, F. O.: PANGAEA – Data Publisher for Earth & Environmental Science, Sci. Data, 10, 347, https://doi.org/10.1038/s41597-023-02269-x, 2023. a
Fick, S. and Hijmans, R.: WorldClim 2: new 1 km spatial resolution climate surfaces for global land areas, Int. J. Climatol., 37, 4302–4315, 2017. a
Gitelson, A., Kaufman, Y., Stark, R., and Rundquist, D.: Novel Algorithms for Remote Estimation of Vegetation Fraction, Remote Sens. Environ. 80, 76–87, https://doi.org/10.1016/S0034-4257(01)00289-9, 2002. a, b
Hall, F. G., Bergen, K., Blair, J. B., Dubayah, R., Houghton, R., Hurtt, G., Kellndorfer, J., Lefsky, M., Ranson, J., Saatchi, S., Shugart, H., and Wickland, D.: Characterizing 3D vegetation structure from space: Mission requirements, Remote Sens. Environ., 115, 2753–2775, https://doi.org/10.1016/j.rse.2011.01.024, 2011. a
Hansen, M. C., Potapov, P. V., Moore, R., Hancher, M., Turubanova, S. A., Tyukavina, A., Thau, D., Stehman, S. V., Goetz, S. J., Loveland, T. R., Kommareddy, A., Egorov, A., Chini, L., Justice, C. O., and Townshend, J. R. G.: High-Resolution Global Maps of 21st-Century Forest Cover Change, Science, 342, 850–853, https://doi.org/10.1126/science.1244693, 2013. a
Hastings, J., Ollinger, S., Ouimette, A., Sanders-DeMott, R., Palace, M., Ducey, M., Sullivan, F., Basler, D., and Orwig, D.: Tree Species Traits Determine the Success of LiDAR-Based Crown Mapping in a Mixed Temperate Forest, Remote Sens., 12, 309, https://doi.org/10.3390/rs12020309, 2020. a
Heinzel, B.: Investigating multiple data sources for tree species classification in temperate forest and use for single tree delineation, Int. J. Appl. Earth Obs. Geoinf., 18, 101–110, https://doi.org/10.1016/j.jag.2012.01.025, 2012. a
Henrich, J., van Delden, J., Seidel, D., Kneib, T., and Ecker, A. S.: TreeLearn: A deep learning method for segmenting individual trees from ground-based LiDAR forest point clouds, Ecol. Inform., 84, 102888, https://doi.org/10.1016/j.ecoinf.2024.102888, 2024. a, b
Ho, Y.-F., Hengl, T., and Parente, L.: Ensemble Digital Terrain Model (EDTM) of the world (1.1), Zenodo [data set], https://doi.org/10.5281/zenodo.7676373, 2023. a
Irwin, L., Coops, N., Riofrío, J., Grubinger, S., Barbeito, I., Achim, A., and Roeser, D.: Prioritizing commercial thinning: quantification of growth and competition with high-density drone laser scanning, Forestry, 98, 293–307, https://doi.org/10.1093/forestry/cpae030, 2024. a, b
Isenburg, M.: LAStools – efficient tools for LiDAR processing, version 230914, http://lastools.org (last access: 10 June 2023), 2023. a
Iusem, A. N. and Seeger, A.: Axiomatization of the Index of Pointedness for Closed Convex Cones, Comput. Appl. Math., 24, 245–283, https://doi.org/10.1590/S0101-82052005000200006, 2005. a
Ivanov, A., Darman, G., and Solovyov, I.: Species Diversity in Larch Forests of Amur Oblast and the Republic of Sakha (Yakutia), Contemp. Problems Ecol., 16, 964–971, https://doi.org/10.1134/S1995425523070041, 2023. a
Jaafar, W., Nelson, R. F., Zolkos, S., Russell, M., Lindsell, J., Abu Salim, K., and Dubayah, R.: Improving individual tree crown delineation and attributes estimation of tropical forests using airborne LiDAR data, Remote Sens., 10, 854, https://doi.org/10.3390/rs10060854, 2018. a, b
Jafarigol, E. and Trafalis, T.: A Review of Machine Learning Techniques in Imbalanced Data and Future Trends, arXiv [preprint], https://doi.org/10.48550/arXiv.2310.07917, 2023. a
Kauppi, P.: Large Impacts of Climatic Warming on Growth of Boreal Forests since 1960, PLOS ONE, 9, 1–6, https://doi.org/10.1371/journal.pone.0111340, 2014. a
Kohavi, R.: A study of cross-validation and bootstrap for accuracy estimation and model selection, in: Proceedings of the 14th International Joint Conference on Artificial Intelligence – Volume 2, IJCAI'95, Morgan Kaufmann Publishers Inc., San Francisco, CA, USA, 1137–1143, ISBN 1558603638, 1995. a
Korpela, I., Polvivaara, A., Papunen, S., Jaakkola, L., Tienaho, N., Uotila, J., Puputti, T., and Flyktman, A.: Airborne dual-wavelength waveform LiDAR improves species classification accuracy of boreal broadleaved and coniferous trees, Silva Fennica, 56, 22007, https://doi.org/10.14214/sf.22007, 2023. a
Kruse, S., Haupt, S., and Farkas, L.: Full panorama images of 33 field plot centres during the expedition to Northwest Canada, summer 2022, PANGAEA [data set], https://doi.org/10.1594/PANGAEA.974472, 2025a. a
Kruse, S., Jackisch, R., Gloy, J., Farkas, L., Schladebach, J., Hao, K., Heim, B., Kolmogorov, A., Zakharov, E. S., Pestryakova, L. A., Förster, M., Kleinschmit, B., and Herzschuh, U.: Point clouds with ground point classification and individual tree segmentation of 89 northern boreal forest and tundra sites from UAV-based lidar surveys in Yakutia, Russia in 2021, PANGAEA [data set], https://doi.org/10.1594/PANGAEA.980735, 2025b. a, b, c, d, e
Kruse, S., Gloy, J., Farkas, L., Schladebach, J., Hao, K., Döpper, V., and Heim, B.: Point clouds with ground point classification and individual tree segmentation of 25 northern boreal forest and tundra sites from UAV-based lidar surveys in northwestern Canada in 2022, PANGAEA [data set], https://doi.org/10.1594/PANGAEA.977771, 2025c. a, b, c, d, e
Kruse, S., Enguehard, L., Juday, G., Santosh, P., Badola, A., Broers, J., Farkas, L., Schladebach, J., Hao, K., Jackisch, R., Döpper, V., and Heim, B.: Point clouds with ground point classification and individual tree segmentation of 47 northern boreal forest and tundra sites from UAV-based lidar surveys in the eastern part of Alaska in 2023, PANGAEA [data set], https://doi.org/10.1594/PANGAEA.980485, 2025d. a, b, c, d, e
Kruse, S., Enguehard, L., Juday, G., Santosh, P., Badola, A., Broers, J., Farkas, L., Schladebach, J., Hao, K., Jackisch, R., Döpper, V., and Heim, B.: Point clouds with ground point classification and individual tree segmentation of 28 northern boreal forest and tundra sites from UAV-based lidar surveys in western and central parts of Alaska in 2024, PANGAEA [data set], https://doi.org/10.1594/PANGAEA.980757, 2025e. a, b, c, d, e
Kruse, S., Schladebach, J., Broers, J., Hao, K., Tretton, J., and Gorshunova, A.: Reference dataset of individual trees from the Tundra-Taiga-Ecotone and Northern boreal forests BorFIT, PANGAEA [data set], https://doi.org/10.1594/PANGAEA.980505, 2026. a, b, c, d
Kuhn, M.: Building Predictive Models in R Using the caret Package, J. Stat. Softw., 28, 1–26, https://doi.org/10.18637/jss.v028.i05, 2008. a, b
Liu, Y., You, H., Tang, X., You, Q., Huang, Y., and Chen, J.: Study on Individual Tree Segmentation of Different Tree Species Using Different Segmentation Algorithms Based on 3D UAV Data, Forests, 14, https://doi.org/10.3390/f14071327, 2023. a
Ma, K., Chen, Z., Fu, L., Tian, W., Jiang, F., Yi, J., Du, Z., and Sun, H.: Performance and Sensitivity of Individual Tree Segmentation Methods for UAV-LiDAR in Multiple Forest Types, Remote Sens., 14, 298, https://doi.org/10.3390/rs14020298, 2022. a
Michałowska, M. and Rapiński, J.: A Review of Tree Species Classification Based on Airborne LiDAR Data and Applied Classifiers, Remote Sens., 13, 353, https://doi.org/10.3390/rs13030353, 2021. a, b, c, d
Morgenstern, A., Heim, B., Pestryakova, L. A., Bolshiyanov, D. Y., Grigoriev, M. N., Ayunov, D., Dill, A., and Jünger, I.: Russian-German Cooperation: Expeditions to Siberia in 2021, in: vol. 772 of Berichte zur Polar- und Meeresforschung = Reports on polar and marine research, Alfred-Wegener-Institut Helmholtz-Zentrum für Polar- und Meeresforschung, https://doi.org/10.57738/BzPM_0772_2023, 2023. a
Myneni, R., Keeling, C., Tucker, C., Asrar, G., and Nemani, R.: Increased plant growth in the northern high latitudes from 1981 to 1991, Nature, 386, 698–702, https://doi.org/10.1038/386698a0, 1997. a
Pan, Y., Birdsey, R., Phillips, O., and Jackson, R.: The Structure Distribution and Biomass of the World's Forests, Annu. Rev. Ecol. Evol. System., 44, 593–622, https://doi.org/10.1146/annurev-ecolsys-110512-135914, 2013. a
Persson A., H. J.: Identifying species of individual trees using airborne laser scanner, Remote Sens. Environ., 90, 415–423, https://doi.org/10.1016/S0034-4257(03)00140-8, 2004. a
Puliti, S., Pearse, G., Surový, P., Wallace, L., Hollaus, M., Wielgosz, M., and Astrup, R.: FOR-instance: a UAV laser scanning benchmark dataset for semantic and instance segmentation of individual trees, arXiv [preprint], https://doi.org/10.48550/arXiv.2309.01279, 2023. a, b, c
Puliti, S., Lines, E. R., Múllerová, J., Frey, J., Schindler, Z., Straker, A., Allen, M. J., Winiwarter, L., Rehush, N., Hristova, H., Murray, B., Calders, K., Coops, N., Höfle, B., Irwin, L., Junttila, S., Krůček, M., Krok, G., Král, K., Levick, S. R., Luck, L., Missarov, A., Mokroš, M., Owen, H. J. F., Stereńczak, K., Pitkänen, T. P., Puletti, N., Saarinen, N., Hopkinson, C., Terryn, L., Torresan, C., Tomelleri, E., Weiser, H., and Astrup, R.: Benchmarking tree species classification from proximally sensed laser scanning data: Introducing the FOR-species20K dataset, Meth. Ecol. Evol., 16, 801–818, https://doi.org/10.1111/2041-210X.14503, 2025. a, b, c
Qian, C., Yao, C., Ma, H., Xu, J., and Wang, J.: Tree Species Classification Using Airborne LiDAR Data Based on Individual Tree Segmentation and Shape Fitting, Remote Sens., 15, 406, https://doi.org/10.3390/rs15020406, 2023. a, b, c, d
Ranson, K., Montesano, P., and Nelson, R.: Tree Canopy Cover for the Circumpolar Taiga-Tundra Ecotone: 2000–2005, ORNL DAAC [data set], https://doi.org/10.3334/ORNLDAAC/1218, 2014. a
Roland, C., Schmidt, J., and Nicklen, E.: Landscape-scale patterns in tree occupancy and abundance in subarctic Alaska, Ecol. Monogr., 83, 19–48, https://doi.org/10.1890/11-2136.1, 2013. a
Scheffer, M., Hirota, M., Holmgren, M., Nes, E. H. V., and Chapin, F. S.: Thresholds for boreal biome transitions, P. Natl. Acda. Sci. USA, 109, 21384–21389, https://doi.org/10.1073/pnas.1219844110, 2012. a
Schladebach, J.: BorFIT, GitHub [code], https://github.com/StefanKruse/BorFIT/tree/main (last access: 27 October 2026), 2026. a
Schulte, L., Meucci, S., Stoof-Leichsenring, K., Heitkam, T., Schmidt, N., von Hippel, B., Andreev, A., Diekmann, B., Melles, M., Pestryakova, L., Alsos, I., Clarke, C., Krutovsky, K., and Herzschuh, U.: Larix species range dynamics in Siberia since the Last Glacial captured from sedimentary ancient DNA, Commun. Biol., 5, 570, https://doi.org/10.1038/s42003-022-03455-0, 2022. a
Shcherbacheva, A., Campos, M. B., Wang, Y., Liang, X., Kukko, A., Hyyppä, J., Junttila, S., Lintunen, A., Korpela, I., and Puttonen, E.: A study of annual tree-wise LiDAR intensity patterns of boreal species observed using a hyper-temporal laser scanning time series, Remote Sens. Environ., 305, 114083, https://doi.org/10.1016/j.rse.2024.114083, 2024. a
Shi, Y., Skidmore, A., Wang, T., Holzwarth, S., Heiden, U., Pinnel, N., Zhu, X., and Heurich, M.: Tree species classification using plant functional traits from LiDAR and hyperspectral data, Int. J. Appl. Earth Obs. Geoinf., 73, 207–219, https://doi.org/10.1016/j.jag.2018.06.018, 2018. a, b
Thiffault, E.: Boreal forests and soils, in: vol. 36 of Developments in Soil Science, Elsevier, https://doi.org/10.1016/B978-0-444-63998-1.00005-7, 2019. a
Tong, F. and Zhang, Y.: Individual tree crown delineation in high resolution aerial RGB imagery using StarDist-based model, Remote Sens. Environ., 319, 114618, https://doi.org/10.1016/j.rse.2025.114618, 2025. a
Tucker, C. J.: Red and Photographic Infrared Linear Combinations for Monitoring Vegetation, Remote Sens. Environ., 8, 127–150, https://doi.org/10.1016/0034-4257(79)90013-0, 1979. a, b
van Geffen, F., Heim, B., Brieger, F., Geng, R., Shevtsova, I. A., Schulte, L., Stuenzi, S. M., Bernhardt, N., Troeva, E. I., Pestryakova, L. A., Zakharov, E. S., Pflug, B., Herzschuh, U., and Kruse, S.: SiDroForest: a comprehensive forest inventory of Siberian boreal forest investigations including drone-based point clouds individually labeled trees synthetically generated tree crowns and Sentinel-2 labeled image patches, Earth Syst. Sci. Data, 14, 4967–4994, https://doi.org/10.5194/essd-14-4967-2022, 2022. a, b
Vauhkonen, J., Tokola, T., Packalén, P., and Maltamo, M.: Identification of Scandinavian Commercial Species of Individual Trees from Airborne Laser Scanning Data Using Alpha Shape Metrics, Forest Sci., 55, 37–47, https://doi.org/10.1093/forestscience/55.1.37, 2009. a
Walker, D. A., Raynolds, M. K., Daniëls, F. J., Einarsson, E., Elvebakk, A., Gould, W. A., Katenin, A. E., Kholod, S. S., Markon, C. J., Melnikov, E. S., Moskalenko, N. G., Talbot, S. S., and Yurtsev, B. A.: The Circumpolar Arctic vegetation map, J. Veg. Sci., 16, 267–282, https://doi.org/10.1111/j.1654-1103.2005.tb02365.x, 2005. a
Weiser, H., Schäfer, J., Winiwarter, L., Krašovec, N., Fassnacht, F. E., and Höfle, B.: Individual tree point clouds and tree measurements from multi-platform laser scanning in German forests, Earth Syst. Sci. Data, 14, 2989–3012, https://doi.org/10.5194/essd-14-2989-2022, 2022. a, b
Wittke, S., Campos, M., Ruoppa, L., Echriti, R., Wang, Y., Golos, A., Kukko, A., Hyyppä, J., and Puttonen, E.: LiPheStream – A18-month high spatiotemporal resolution point cloud time series of Boreal trees from Finland, Sci. Data, 11, 1281, https://doi.org/10.1038/s41597-024-04143-w, 2024. a, b
Xi, Y., Zhang, W., Wei, F., Fang, Z., and Fensholt, R.: Boreal tree species diversity increases with global warming but is reversed by extremes, Nat. Plants, 10, 1473–1483, 2024. a
Xiang, B., Wielgosz, M., Kontogianni, T., Peters, T., Puliti, S., Astrup, R., and Schindler, K.: Automated forest inventory: Analysis of high-density airborne LiDAR point clouds with 3D deep learning, Remote Sens. Environ., 305, 114078, https://doi.org/10.1016/j.rse.2024.114078, 2024. a
You, H., Lei, P., Li, M., and Ruan, F.: Forest species classification based on three-dimensional coordinate and intensity information of airborne LiDAR data with random forest method, Int. Arch. Photogram. Remote Sens. Spat. Inf. Sci., XLII-3/W10, 117–123, https://doi.org/10.5194/isprs-archives-XLII-3-W10-117-2020, 2020. a
Zhao, F., Popescu, S., and Meng, X.: Characterizing forest canopy structure with lidar data: Applications to forest management and ecosystem studies, Remote Sens. Environ., 115, 1237–1252, https://doi.org/10.1016/j.rse.2011.04.001, 2011. a