the Creative Commons Attribution 4.0 License.
the Creative Commons Attribution 4.0 License.
 | 26 Oct 2026
Surface sediment grain-size characteristics of the Bohai, Yellow, and East China seas: a comprehensive survey based on unified laser diffraction analysis
Xiaoyong Duan

Bin Chen
Meina Li
Shuang Wang
Ping Yin
Bin Chen
Jian Zhang
This paper presents a comprehensive grain-size dataset comprising 744 surface sediment samples collected from the Bohai Sea, Yellow Sea, and East China Sea – the three major continental shelf seas of China. Samples were obtained over an extended period from 2001 to 2019 using box samplers in accordance with the national marine survey standard (GB/T 12763.8–2007). All samples were analyzed by a Malvern Mastersizer 2000 laser diffraction particle size analyzer following hydrogen peroxide pretreatment for organic matter removal.
The dataset provides the full grain-size distribution at 0.25 Φ intervals from −1 Φ to > 10 Φ. The instrument measures directly in micrometres (0.02–2000 µm); we provide two companion data files – one in Φ (phi) scale and one in micrometres (µm) – to accommodate both sedimentological convention and direct instrumental units. The dataset also includes derived Folk–Ward statistical parameters including mean grain size (Mz), sorting coefficient (σi), skewness (Ski), and kurtosis (Kg). Ternary fractions of sand (−1 to 4 Φ), silt (4 to 8 Φ), and clay (> 8 Φ) are also included.
Across the dataset, sand content ranges from 0 % to 100 % (mean 40.5 %), silt from 0 % to 76.8 % (mean 41.1 %), and clay from 0 % to 50.3 % (mean 18.4 %). Mean grain size (Mz) ranges from 1.51 to 8.13 Φ (mean 5.23 Φ, corresponding to approximately 27 µm). The dataset is expected to support research on sediment dynamics, paleoenvironmental reconstruction, benthic habitat mapping, and marine engineering across the Chinese continental margin. All data are archived in an open-access repository with a CC BY 4.0 license. The dataset is archived at Science Data Bank and is available at https://doi.org/10.57760/sciencedb.41730 (Duan et al., 2026).
- Article
(9451 KB) - Full-text XML
- BibTeX
- EndNote


Grain-size distributions of marine sediments serve as fundamental physical properties that record information about sediment sources, transport pathways, hydrodynamic conditions, and depositional environments (Folk, 1966; McLaren, 1981). In continental shelf settings, the spatial variability of sediment texture directly reflects the interplay between terrestrial sediment supply, tidal and wave energy regimes, and biological activity (Gao and Collins, 2014). Systematic grain-size data are therefore essential for a wide range of applications, including sediment budget estimation, numerical modeling of sediment transport, benthic habitat characterization, paleoenvironmental reconstruction, and marine spatial planning.
The Chinese continental shelf seas – the Bohai Sea, Yellow Sea, and East China Sea – constitute one of the world's most extensive and sedimentologically dynamic shelf systems. These marginal seas receive enormous sediment inputs from major rivers including the Yellow River (Huanghe) and the Yangtze River (Changjiang), while being shaped by the East Asian monsoon, strong tidal currents, and the Kuroshio Current system (Milliman and Farnsworth, 2011; Bianchi and Allison, 2009). Extensive geological surveys have been conducted across these seas over recent decades, producing large volumes of grain-size data. However, much of this information remains dispersed across individual research publications, institutional reports, and proprietary databases, with varying measurement protocols and data formats. The absence of a unified, machine-readable, quality-controlled grain-size dataset has hindered regional synthesis studies and data-driven modeling efforts.
To address this gap, we present a standardized dataset of laser diffraction grain-size measurements for 744 surface sediment samples collected from 2001 to 2019 across the Bohai Sea, Yellow Sea, and East China Sea. All samples were processed using a consistent laboratory protocol – Malvern Mastersizer 2000 laser diffraction analyzer following hydrogen peroxide pretreatment – and the resulting data include full grain-size distributions at 0.25 Φ resolution, derived Folk–Ward statistical parameters, and sample metadata (location coordinates, sample identifiers). This dataset aims to provide a high-quality, open-access reference for researchers working on sediment dynamics, marine geology, and Earth system modeling in the East Asian marginal seas.
The study area encompasses the three major continental shelf seas of China: the Bohai Sea, the Yellow Sea, and the East China Sea (Fig. 1).
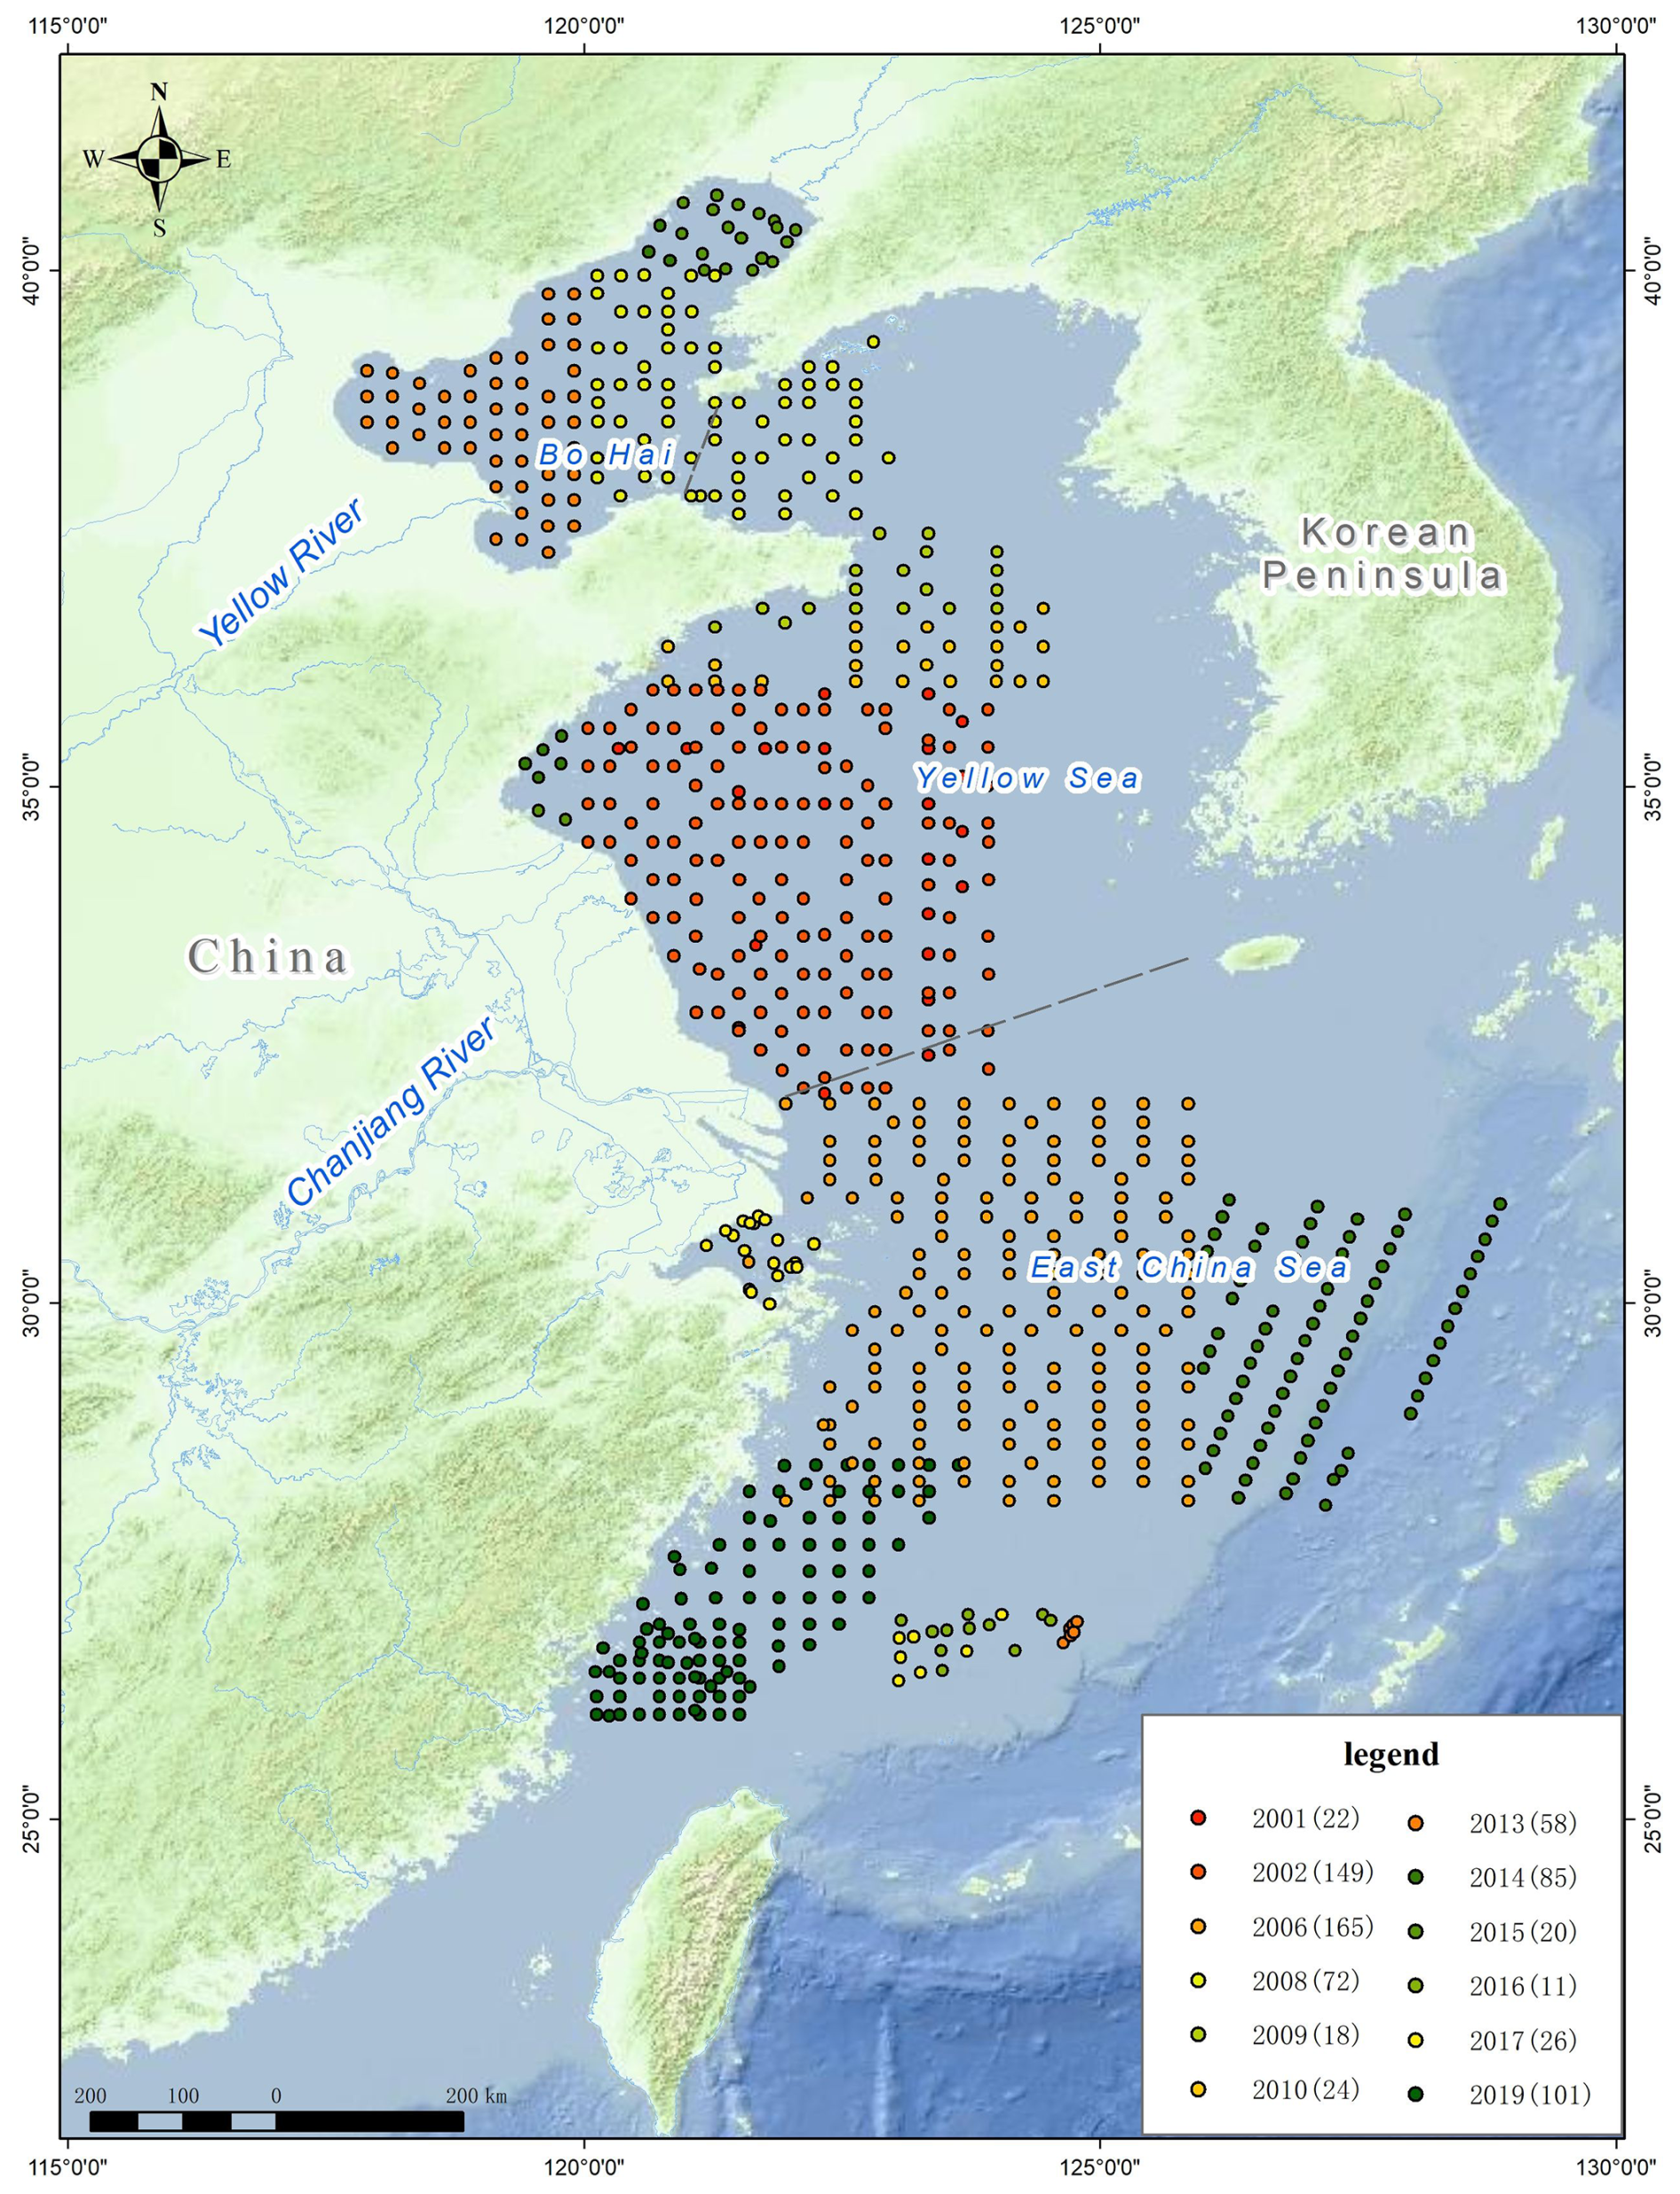
Figure 1Study area and distribution of the 744 sampling stations. Stations are colored by sampling year; numbers in parentheses denote sample count for each year. Dashed lines indicate approximate boundaries of the Bohai Strait and the Yellow Sea–East China Sea transition.
The Bohai Sea is a semi-enclosed embayment bounded by the Liaodong Peninsula to the north, the Shandong Peninsula to the south, and connected to the Yellow Sea through the narrow Bohai Strait. It has an average water depth of approximately 18 m, receives substantial sediment discharge from the Yellow River (∼ 1.1 × 10⁹ t yr−1 historically, though greatly reduced in recent decades), and is characterized by fine-grained sedimentation in its central basins and coarser deposits near the strait (Qin et al., 1990; Wang et al., 2010).
The Yellow Sea is a semi-enclosed epicontinental sea between mainland China and the Korean Peninsula (our sampling stations are concentrated in the central and western Yellow Sea, extending eastward to 124.45° E), with an average depth of 44 m. It can be divided into the North Yellow Sea (north of ∼ 37° N) and the South Yellow Sea, which is influenced by the discharge of the Yangtze River and characterized by a central mud deposit (the South Yellow Sea Mud) that has accumulated since the Holocene (Yang et al., 2003). The Yellow Sea Warm Current and coastal currents exert strong controls on sediment dispersal.
The East China Sea is a broad epicontinental shelf sea with an average depth of 72 m in the shelf region (to the 200 m isobath). It receives the Yangtze River discharge (∼ 4.7 × 10⁸ t yr−1) and is characterized by along-shelf mud deposits and extensive relict sandy sediments on the outer shelf (Liu et al., 2007; Xu et al., 2012). This region is influenced by the Kuroshio Current, Taiwan Warm Current, and the East China Sea coastal current system.
3.1 Sample Collection
Surface sediment samples were collected during multiple cruises between 2001 and 2019 using box samplers, following the Specifications for Oceanographic Survey (GB/T 12763.8–2007). Samples obtained after 2005 were primarily collected from the R/V Yezhizheng (operated by the Qingdao Institute of Marine Geology and renamed R/V Marine Geology NO. 7 in 2020), whereas pre-2005 samples were collected from chartered vessels, for which detailed vessel records are no longer available. The top 0–5 cm of sediment was subsampled from each box core, placed in sealed polyethylene bags, and stored at room temperature prior to laboratory analysis. A total of 744 samples were collected, distributed as follows: 107 from the Bohai Sea, 250 from the Yellow Sea, and 387 from the East China Sea (Fig. 1). Each sample is identified by a unique sample ID and its sampling station ID.
3.2 Laboratory Analysis
All grain-size analyses were performed at the Qingdao Institute of Marine Geology, China Geological Survey, using a Malvern Mastersizer 2000 laser diffraction particle size analyzer (Malvern Panalytical, UK). The instrument measures particle sizes in the range of 0.02–2000 µm with an accuracy of ±1 % on volume median diameter for standard reference materials.
Prior to measurement, approximately 1–2 g of homogenized sediment was treated with 30 % hydrogen peroxide (H2O2) at room temperature for 24–48 h to remove organic matter, following the national standard GB/T 12763.8–2007. After digestion, samples were dispersed in deionized water with sodium hexametaphosphate ([NaPO3]6) as a dispersant (0.5 mol L−1, following GB/T 12763.8–2007) and ultrasonicated for 60 s immediately before measurement to ensure complete disaggregation. Each sample was measured in triplicate, and the average volume percentage for each size bin was reported.
The instrument output consists of volume percentages for 100 size bins spanning 0.02–2000 µm. For this dataset, the distribution was resampled to 45 Φ-scale bins at 0.25 Φ intervals from −1 Φ (2000 µm) to > 10 Φ( < 0.98 µm), using the transformation with reference diameter d0= 1 mm.
3.3 Data Processing
Folk and Ward (1957) graphical statistical parameters were calculated from the cumulative grain-size distribution curves: Mz = (; ; Ski ; Kg . The graphical (Folk–Ward) method was chosen over moment statistics because it is the de facto standard in sedimentological practice, is robust to outliers and to the truncated fine tail inherent in laser-diffraction data, is defined directly on the cumulative distribution curve, and ensures direct comparability with most published shelf-sediment datasets; moment-method parameters are nonetheless provided in the data files for cross-reference (Sect. 4.1). Percentile values (Dx) were obtained by linear interpolation between adjacent Φ bins of the cumulative volume curve. Sediment textural classification follows the Udden–Wentworth scale: sand (−1 to 4 Φ, 63–2000 µm), silt (4 to 8 Φ, 3.9–63 µm), and clay (> 8 Φ, < 3.9 µm).
3.4 Spatial Mapping
The spatial distribution maps of textural fractions (Fig. 3) and grain-size statistical parameters (Fig. 4) were produced by ordinary point kriging of the station values onto a regular 0.1° grid, using a spherical variogram model, with interpolation restricted to the surveyed shelf area. Because sand, silt, and clay contents are compositional data (bounded to 0 %–100 % and summing to 100 %), the interpolated maps should be interpreted as smoothed representations of broad regional trends rather than as precise local estimates; interpolation of compositional data involves specific statistical considerations (Aitchison, 1982; Lark et al., 2012; Stephens and Diesing, 2015).
4.1 Dataset Structure
The dataset is provided as two companion Microsoft Excel (.xlsx) files, each containing 744 rows (samples) and 77 columns: (1) a Φ-unit version (grain_size_chinese_shelf_seas_744_phi.xlsx) with grain-size bins and statistical parameters expressed in φ scale, and (2) a µm-unit version (grain_size_chinese_shelf_seas_744_micron.xlsx) with bin boundaries and length-scale parameters (Mz, Md, Dx, φ percentiles) expressed in micrometres (bin boundaries reflect the original instrument output; φ-derived statistical parameters are presented in µm via ), while sorting () and shape parameters (Ski, Ski*, Kg, Kg*) remain in φ-scale or dimensionless. Both files include a Sea Area column (Bohai Sea, Yellow Sea, or East China Sea). The data columns are organized in the following groups: (1) Sample identification and location: sample ID, station ID, sampling year, and longitude/latitude coordinates (WGS84); (2) Sea area classification; (3) Grain-size distribution: volume percentages in 45 φ-interval bins from −1 φ to > 10 φ at 0.25 φ resolution; (4) Textural fractions: sand (−1 to 4 φ, %), silt (4 to 8 φ, %), clay (> 8 φ, %); (5) Percentile parameters: D5, D16, D25, D50, D75, D84, D95 expressed in φ (Φ-unit file) or µm (µm-unit file); (6) Folk–Ward parameters: mean grain size Mz (φ or µm), sorting coefficient σi, skewness Ski, kurtosis Kg.
4.2 Spatial Distribution of Samples
The 744 samples, one per sampling station, cover the continental shelf areas of the three marginal seas at water depths ranging from less than 10 m in nearshore Bohai Sea to approximately 200 m at the outer East China Sea shelf edge (Fig. 1). The Yellow Sea and East China Sea samples form broad latitudinal transects, whereas the Bohai Sea samples are concentrated within the Bohai embayment. Sampling density is generally higher in the Yellow Sea (especially the South Yellow Sea) and the inner East China Sea shelf, while the outer East China Sea shelf and the northernmost Yellow Sea have relatively sparse coverage (Fig. 1).
4.3 Grain-Size Characteristics
The dataset exhibits a broad range of sediment types from pure sand to silty clay, reflecting the diverse depositional environments across the Chinese continental shelf. Summary statistics for the principal grain-size parameters are presented in Table 1 and Fig. 2.
Table 1Summary statistics of grain-size parameters for the full dataset and each sea area.
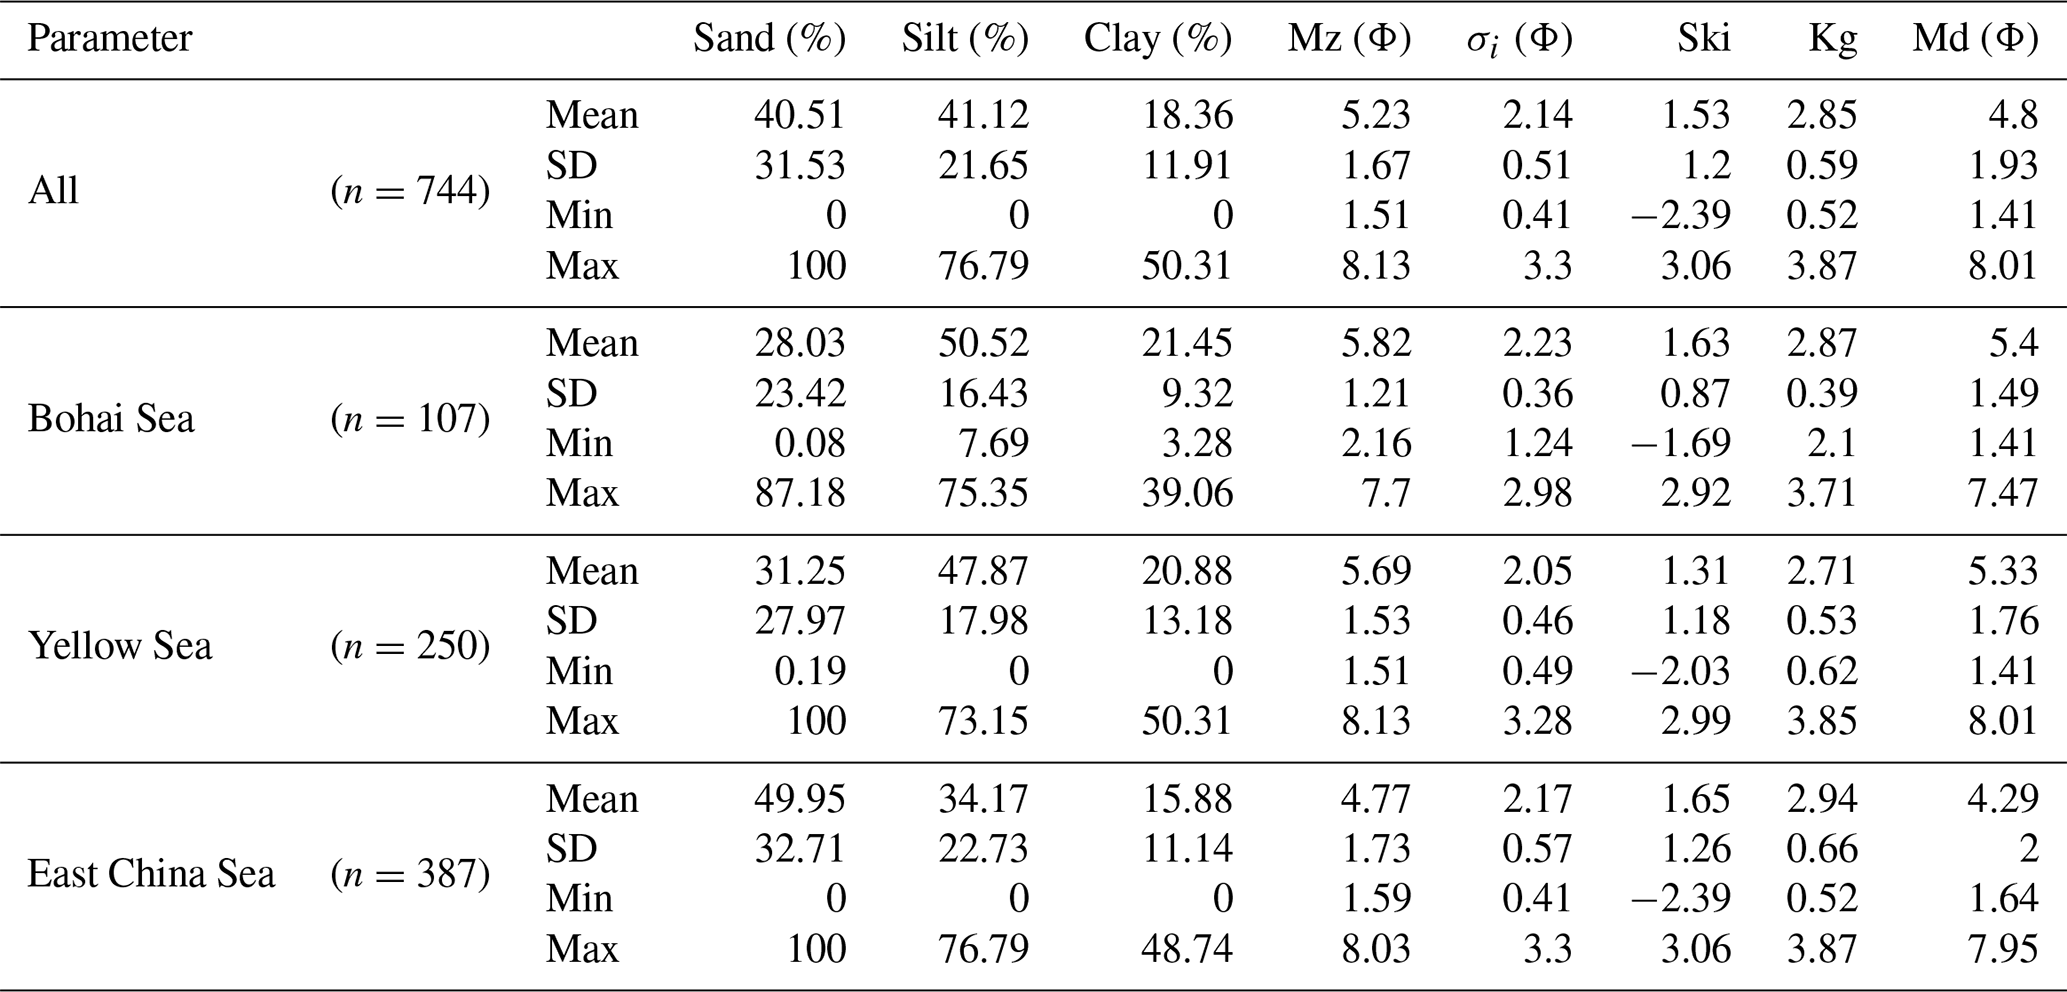
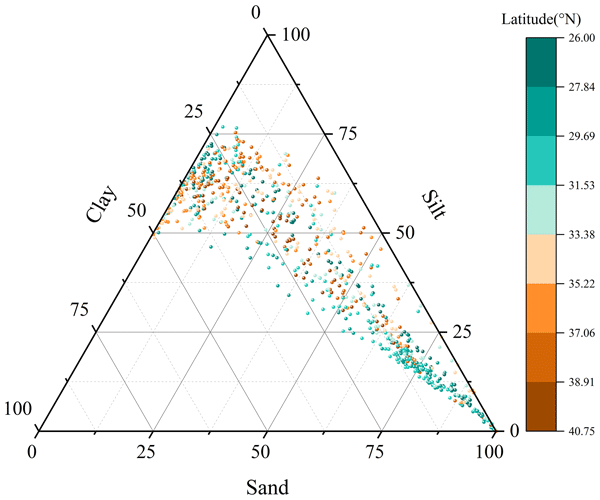
Sand content varies from 0 % to 100 % (mean 40.5 %, SD 31.5 %), silt from 0 % to 76.8 % (mean 41.1 %, SD 21.6 %), and clay from 0 % to 50.3 % (mean 18.4 %, SD 11.9 %). On the Shepard ternary diagram (Fig. 2), the samples plot across all textural classes, with a pronounced cluster in the silt and sandy silt region.
The mean grain size (Mz) ranges from 1.51 to 8.13 Φ (mean 5.23 Φ, SD 1.67 Φ), encompassing very coarse sand to clay. For reference, the overall mean Mz of 5.23 φ corresponds to approximately 27 µm (). The sorting coefficient (σi) ranges from 0.41 (well sorted) to 3.30 (very poorly sorted), with a mean of 2.14, indicating predominantly poor sorting typical of fluvial-influenced shelf environments. Skewness (Ski) ranges from −2.39 (strongly coarse-skewed) to 3.06 (strongly fine-skewed), with a mean of 1.53, reflecting a prevalence of fine-skewed distributions characteristic of muddy shelf deposits.
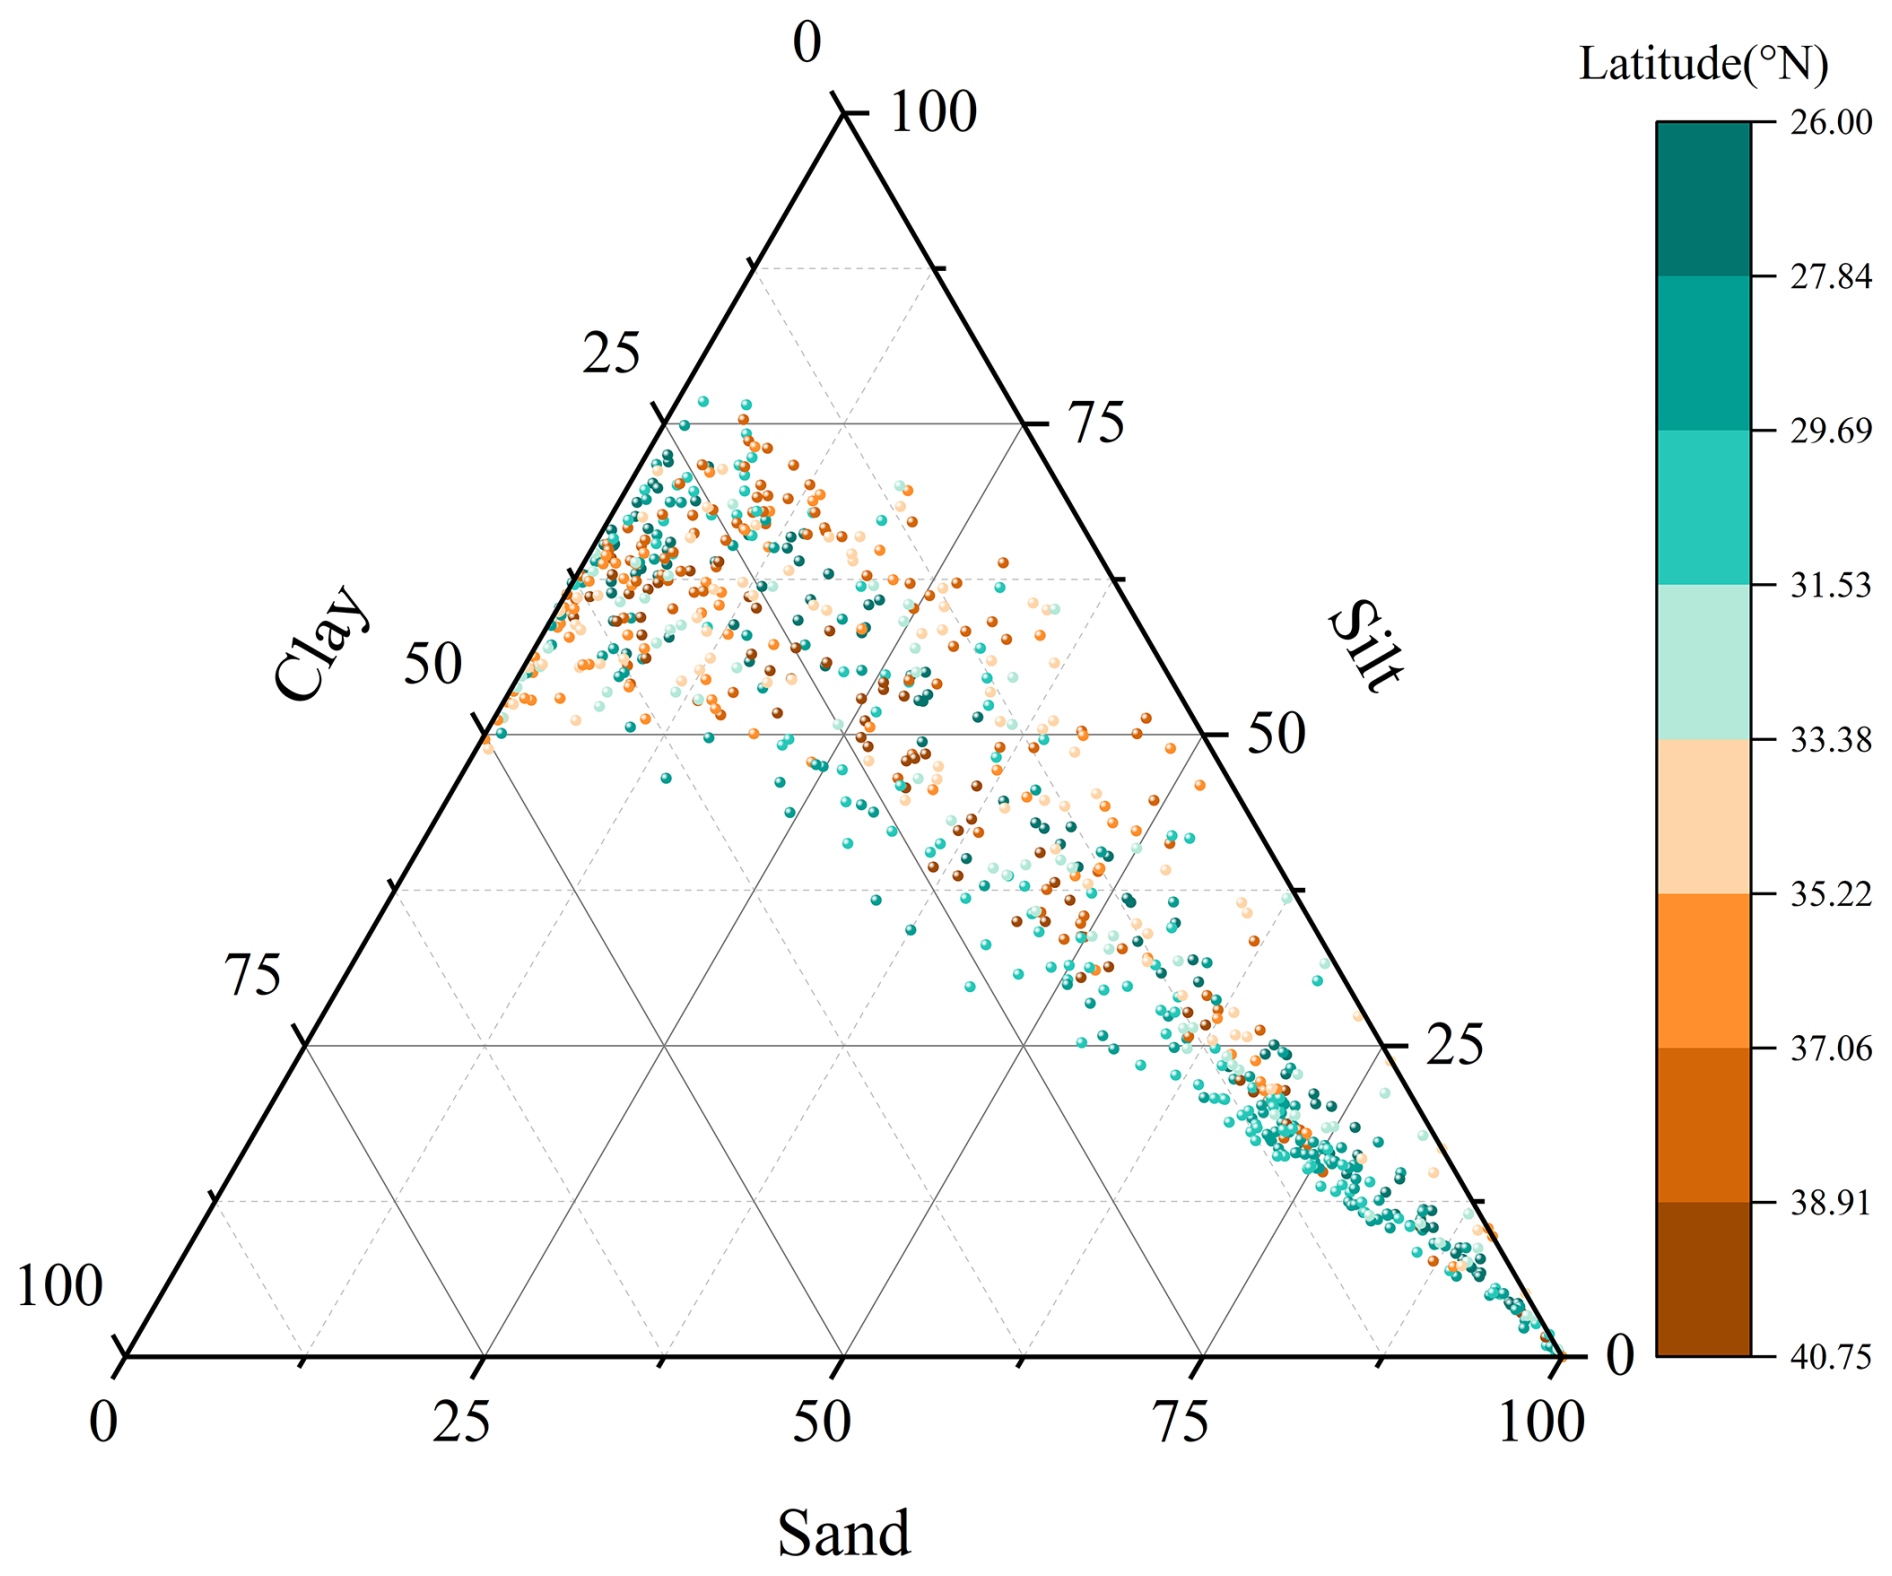
Figure 2Shepard ternary diagram of sand–silt–clay composition for all 744 samples, colored by latitude bands.
4.4 Spatial Patterns
Clear regional differences in sediment texture are evident from the spatial distribution maps (Fig. 3). The Bohai Sea samples are predominantly fine-grained (mean Mz =5.82 Φ), with silt and clay fractions collectively exceeding 70 % at most stations, reflecting the dominant influence of Yellow River-derived fine sediment. The Yellow Sea samples in our survey area are predominantly fine-grained, with silt-dominated textures concentrated in the central South Yellow Sea mud deposit. The East China Sea samples display the greatest textural diversity, with inner shelf mud deposits near the Yangtze estuary (fine-grained), extensive relict sandy deposits on the outer shelf (coarse-grained), and transitional mixed sediments on the mid-shelf.
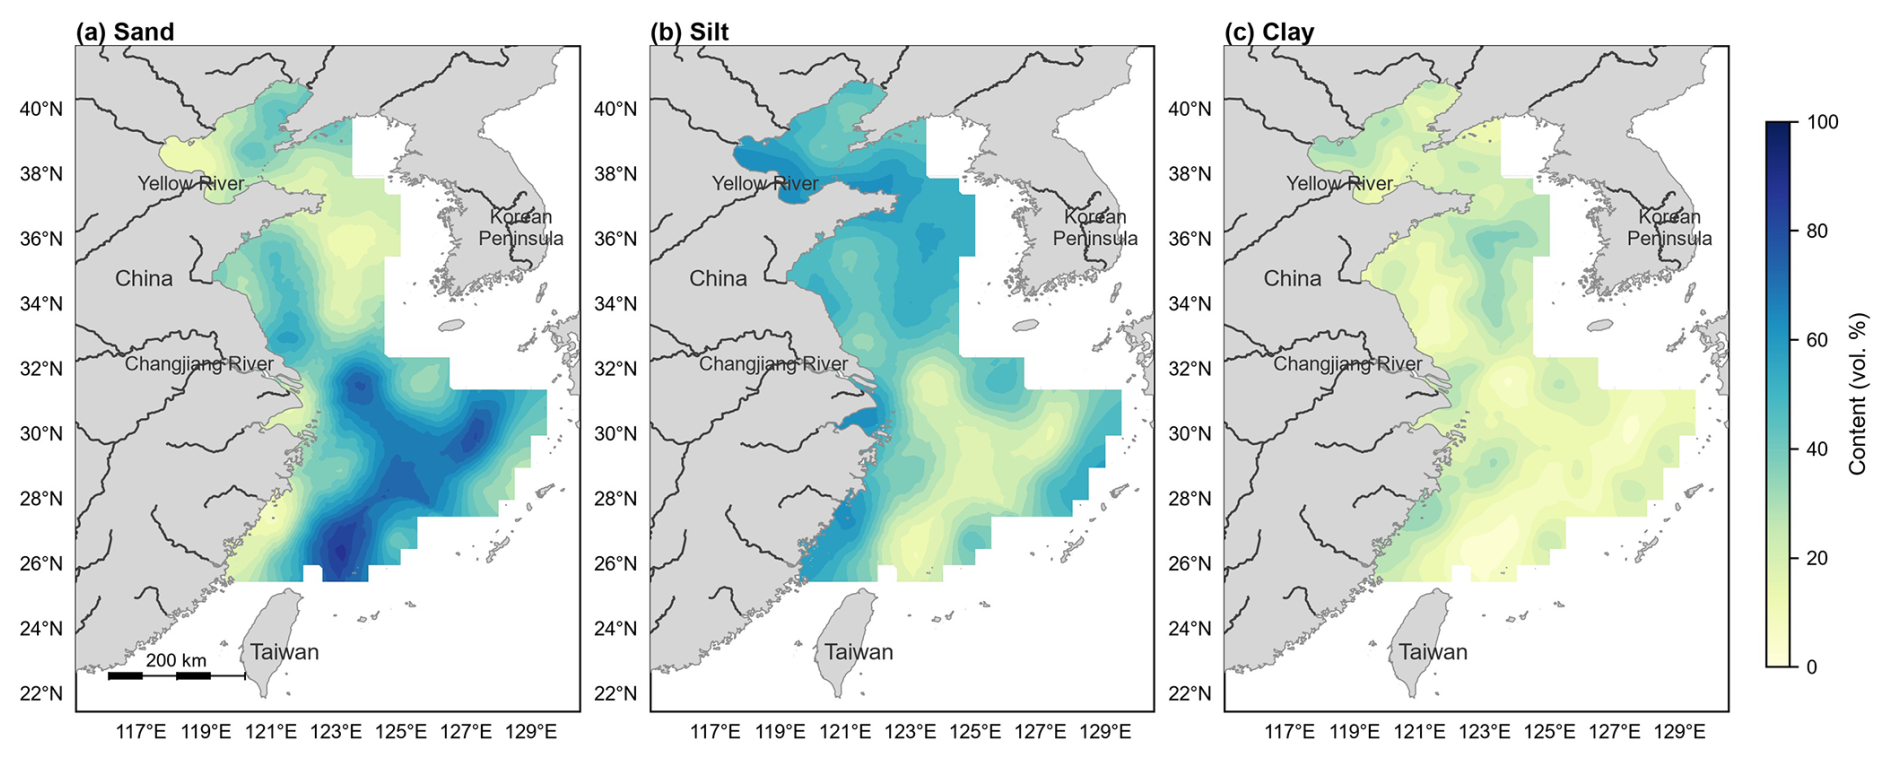
Figure 3Spatial distribution of (a) sand content, (b) silt content, and (c) clay content. Sand: 63–2000 µm; silt: 3.9–63 µm; clay: < 3.9 µm (after the Udden–Wentworth classification). Maps are based on ordinary kriging interpolation of the station values (Sect. 3.4).
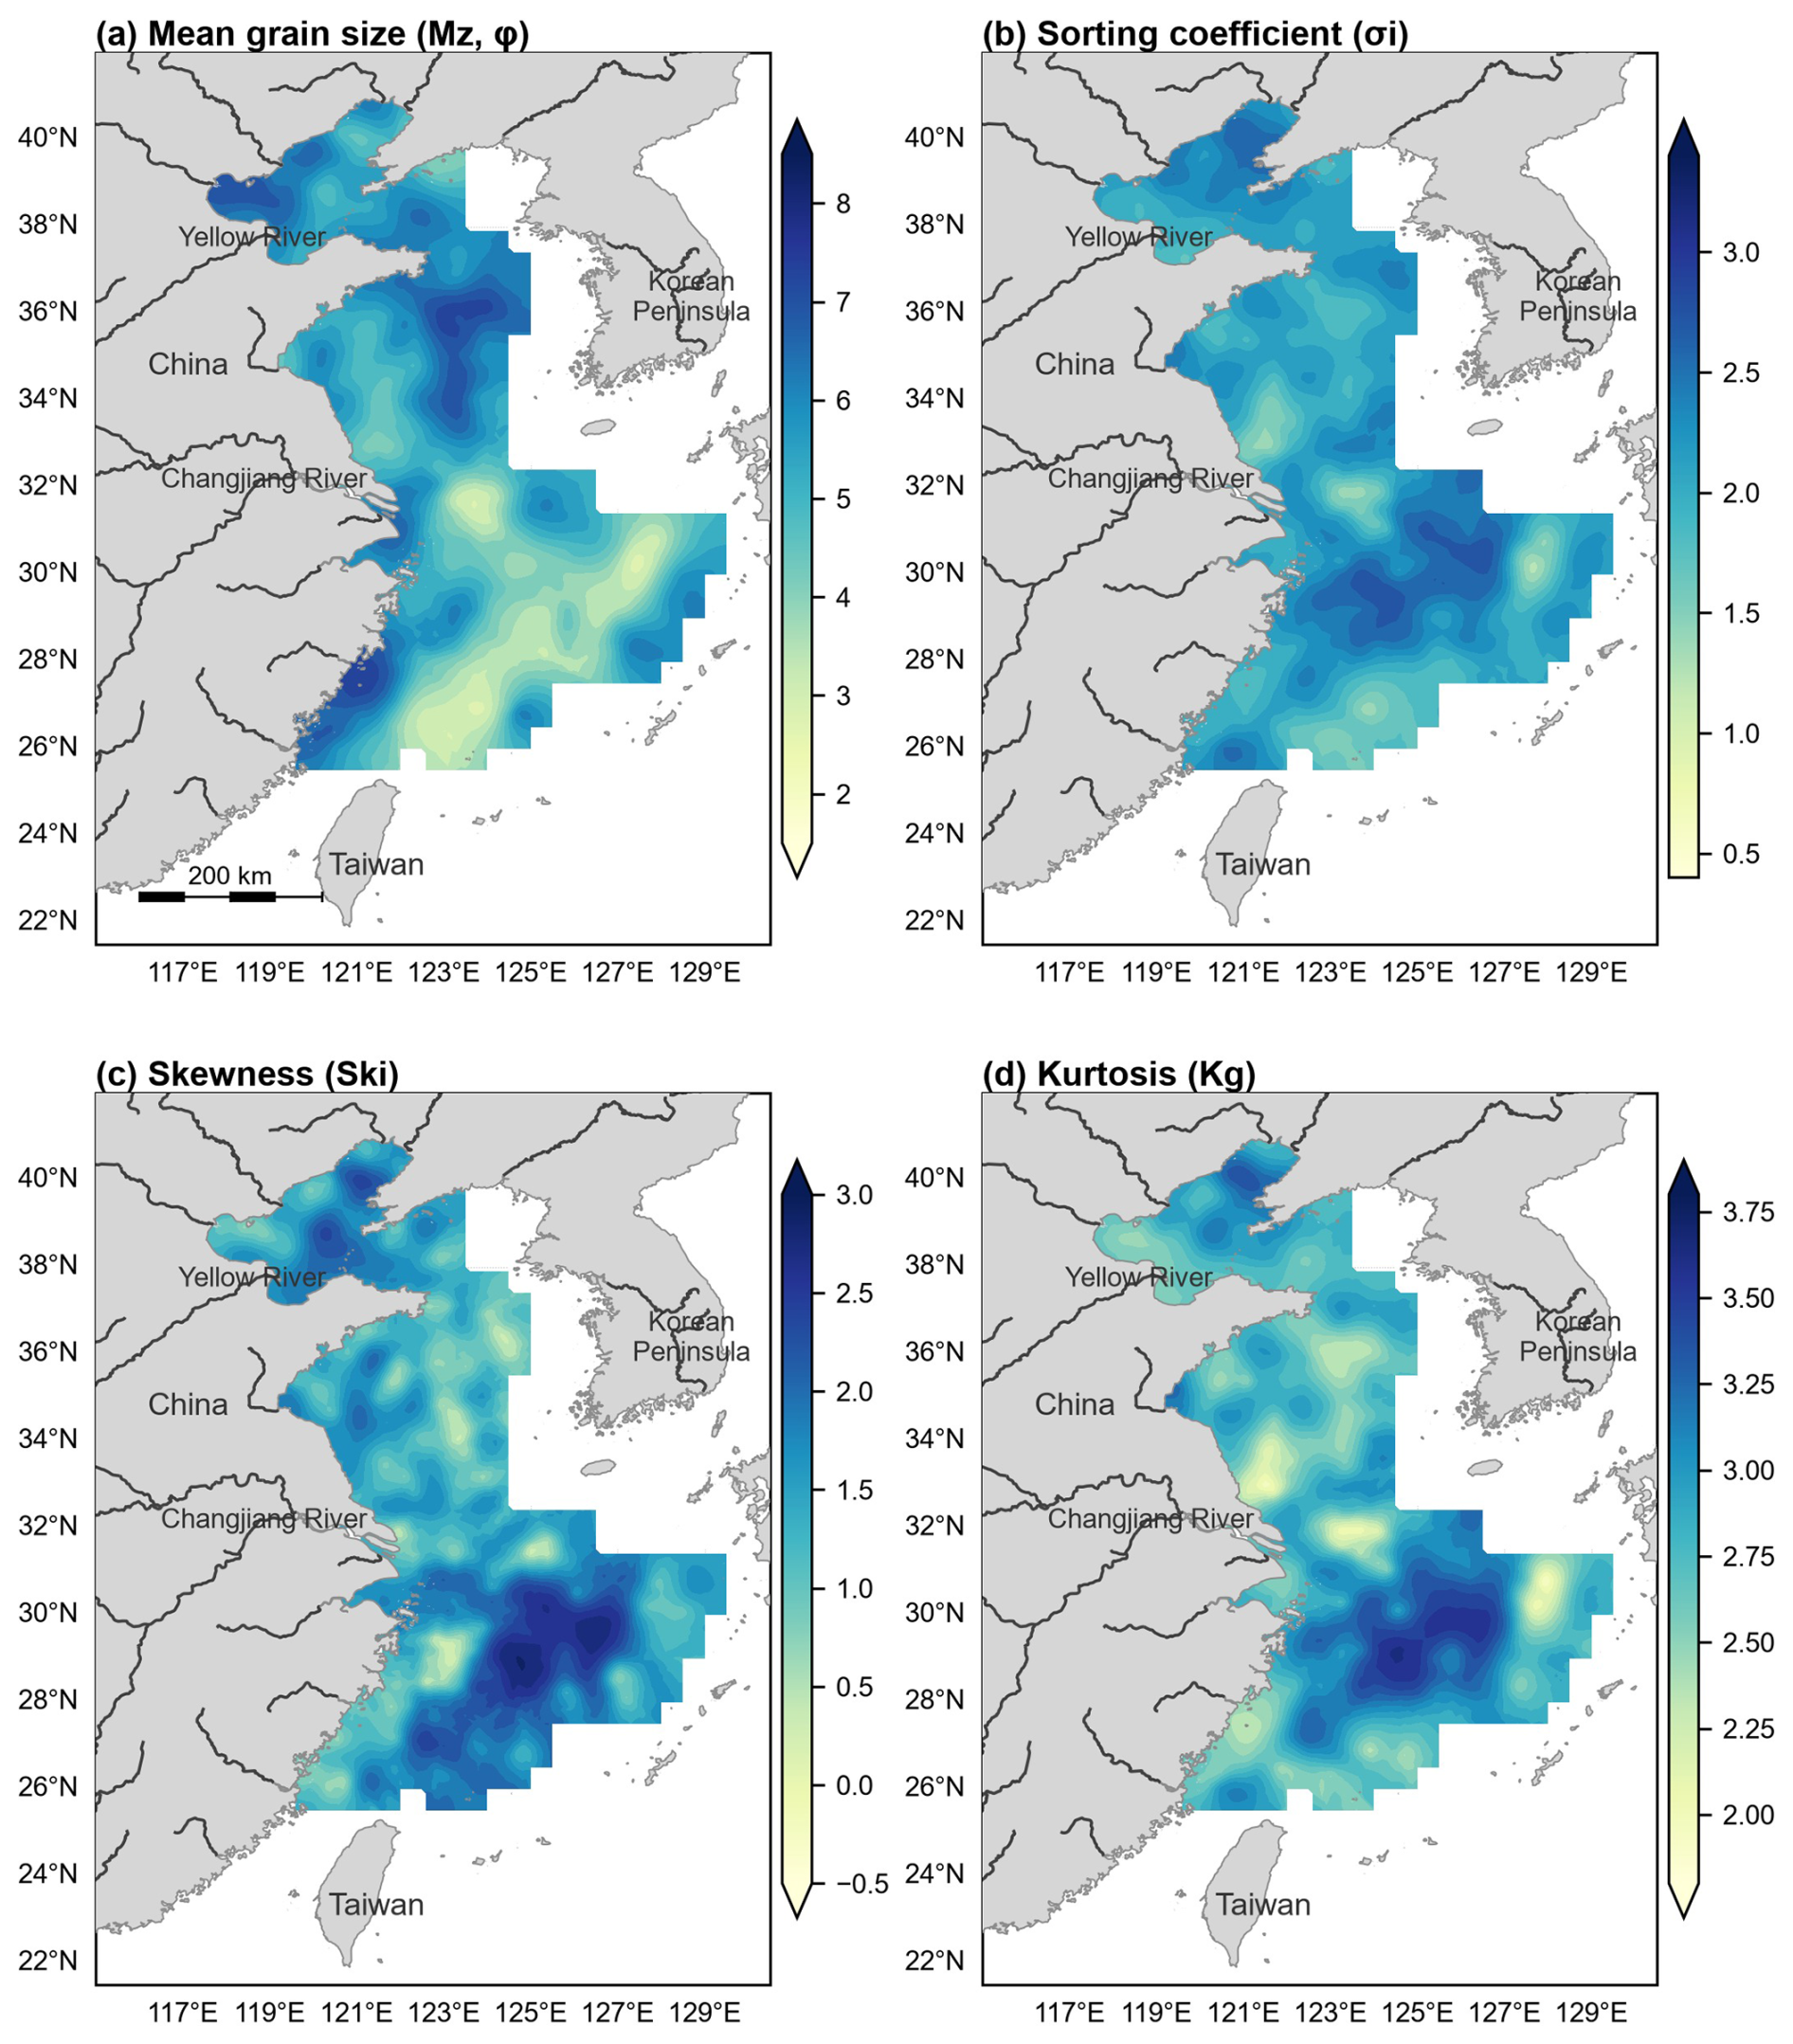
Figure 4Spatial distributions of grain size parameters (Mz, σi, Ski, Kg) of surface sediments in the Bohai Sea, Yellow Sea and East China Sea. (a) Mean grain size (Mz, φ); (b) Sorting coefficient (σi); (c) Skewness (Ski); (d) Kurtosis (Kg). Mz values are in φ units; the companion µm-unit data file provides corresponding micrometre values (conversion: ). Maps are based on ordinary kriging interpolation of the station values (Sect. 3.4).
5.1 Measurement Precision
Analytical precision was assessed through triplicate measurements of each sample following repeat dispersion. The coefficient of variation (CV) for D50 was typically below 3 % for silty and clayey samples and below 5 % for sandy samples with bimodal distributions. The median grain size (D50) showed the highest reproducibility, followed by D16 and D84, consistent with the expectation that distribution tails are inherently more variable in laser diffraction analysis.
5.2 Methodological Considerations
Laser diffraction is now the standard method for grain-size analysis in marine sedimentology due to its speed, high resolution, and excellent reproducibility (Loizeau et al., 1994; McCave et al., 2006). However, several considerations should be noted when using this dataset:
-
Organic matter removal. The H2O2 pretreatment effectively removes labile organic matter, but refractory organic matter and bio-mineral aggregates may persist. For sediments with high organic carbon content (> 2 %), the reported grain-size distribution may be slightly coarser than the in situ grain-size spectrum of mineral particles alone.
-
Clay fraction quantification. Laser diffraction tends to underestimate the clay fraction relative to the pipette method, particularly for platy clay minerals such as illite and smectite dominant in Chinese shelf sediments (Konert and Vandenberghe, 1997). Users comparing this dataset with historical pipette-method data should apply caution, especially for clay-dominated samples.
-
Coarse-fraction characterization. The laser analyzer resolves particle sizes between 0.02 and 2000 µm; material coarser than 2 mm (gravel and very coarse material) is therefore not characterized, whereas sieving would directly capture the coarsest fractions. The sand fraction reported here consequently represents the 63–2000 µm component. Within its measurement range, however, laser diffraction offers far finer size resolution (100 bins per measurement versus typical half-Φ sieve intervals), better reproducibility, and much smaller sample requirements, which underlies its adoption as the standard method for fine-grained marine sediments (Konert and Vandenberghe, 1997; McCave et al., 2006).
-
Carbonate content. No acid pretreatment was applied for carbonate removal. In the study area, biogenic carbonate content is generally low (< 5 %) in most shelf sediments, though locally elevated carbonate concentrations (e.g., shell hash layers) may bias the grain-size distribution toward coarse fractions.
-
Spatial sampling bias. Sampling density is uneven across the study area. The inner East China Sea shelf and South Yellow Sea are relatively well represented, whereas the outer shelf of the East China Sea and some estuarine zones have sparse coverage.
5.3 Comparison with Existing Data
To our knowledge, this dataset represents the most comprehensive open-access compilation of uniformly measured grain-size data for surface sediments across all three Chinese marginal shelf seas. Previous regional datasets were typically limited to single sea areas or specific survey transects. The consistent analytical protocol (single instrument, single laboratory, unified pretreatment) ensures internal comparability across the entire study region, which is a significant advantage for basin-scale synthesis studies.
The dataset described in this paper is archived at Science Data Bank and is available under the Creative Commons Attribution 4.0 International license (CC BY 4.0). The dataset can be accessed at: https://doi.org/10.57760/sciencedb.41730 (Duan et al., 2026).
The dataset comprises two companion files: the primary data file (grain_size_chinese_shelf_seas_744_phi.xlsx, Φ-unit version) and companion file (grain_size_chinese_shelf_seas_744_micron.xlsx, µm-unit version), each containing 744 rows and 77 columns as described in Sect. 4. Both files are accompanied by a README.txt file with descriptions of all variables, measurement methods, unit conventions, and quality flags.
For any questions regarding the dataset, please contact the corresponding author at duan-xy@qq.com.
This paper presents a uniformly measured laser diffraction grain-size dataset for 744 surface sediment samples covering the Bohai Sea, Yellow Sea, and East China Sea. The dataset provides full grain-size distributions, derived Folk–Ward statistical parameters, and textural fractions (sand, silt, clay), all generated under a consistent analytical protocol at a single laboratory.
The spatial coverage spans over 14° latitude and 11° longitude, encompassing environments from nearshore estuarine muds to outer shelf relict sands. This dataset is expected to facilitate a wide range of applications, including regional sediment transport modeling, paleoenvironmental studies, benthic habitat mapping, calibration of remote sensing algorithms, and baseline surveys for marine environmental monitoring. We encourage the scientific community to use and build upon this dataset. Future updates may include additional samples from under-represented areas and integration with geochemical and mineralogical datasets.
XD conceptualized the study, curated the data, performed the formal analysis, conducted the investigation, developed the methodology, created the visualizations, and wrote the original draft. BC (second author), SW, and JZ contributed to sample collection and data organization. ML performed data processing and figure preparation. PY contributed to the overall study design and methodology. BC (last one) performed data trend analysis and supervised the project. All authors reviewed and approved the final manuscript.
The contact author has declared that none of the authors has any competing interests.
Publisher's note: Copernicus Publications remains neutral with regard to jurisdictional claims made in the text, published maps, institutional affiliations, or any other geographical representation in this paper. The authors bear the ultimate responsibility for providing appropriate place names. Views expressed in the text are those of the authors and do not necessarily reflect the views of the publisher.
We thank all crew members and scientific staff who participated in the sampling cruises from 2001 to 2019. Laboratory technicians at the Qingdao Institute of Marine Geology are gratefully acknowledged for their assistance with grain-size analyses.
This work was supported by the National Geological Survey Project of China (grant no. 20190237), National Natural Science Foundation of China (grant no. 42176091), and the Asia Cooperation Fund project “Cooperative Research on Marine Geological Environment and Disasters in the Yangtze River Delta and Red River Delta”.
This paper was edited by Sabine Schmidt and reviewed by Benjamin Misiuk.
Aitchison, J.: The statistical analysis of compositional data, J. R. Stat. Soc. B, 44, 139–177, https://doi.org/10.1111/j.2517-6161.1982.tb01195.x, 1982.
Bianchi, T. S. and Allison, M. A.: Large-river delta-front estuaries as natural “recorders” of global environmental change, P. Natl. Acad. Sci. USA, 106, 8085–8092, https://doi.org/10.1073/pnas.0812878106, 2009.
Duan, X., Chen, B., Li, M., Wang, S., Yin, P., Chen, B., and Zhang, J.: Surface sediment grain-size dataset of the Bohai, Yellow, and East China seas based on unified laser diffraction analysis (2001–2019)[DS/OL], V1, Science Data Bank [data set], https://doi.org/10.57760/sciencedb.41730, 2026.
Folk, R. L.: A review of grain-size parameters, Sedimentology, 6, 73–93, https://doi.org/10.1111/j.1365-3091.1966.tb01572.x, 1966.
Folk, R. L. and Ward, W. C.: Brazos River bar: a study in the significance of grain size parameters, J. Sediment. Petrol., 27, 3–26, https://doi.org/10.1306/74d70646-2b21-11d7-8648000102c1865d, 1957.
Gao, S. and Collins, M. B.: Holocene sedimentary systems on continental shelves, Mar. Geol., 352, 352–366, https://doi.org/10.1016/j.margeo.2014.03.021, 2014.
Konert, M. and Vandenberghe, J.: Comparison of laser grain size analysis with pipette and sieve analysis, Sedimentology, 44, 523–535, https://doi.org/10.1046/j.1365-3091.1997.d01-38.x, 1997.
Lark, R. M., Dove, D., Green, S. L., Richardson, A. E., Stewart, H., and Stevenson, A.: Spatial prediction of seabed sediment texture classes by cokriging from a legacy database of point observations, Sediment. Geol., 281, 35–49, https://doi.org/10.1016/j.sedgeo.2012.07.009, 2012.
Liu, J. P., Xu, K. H., Li, A. C., Milliman, J. D., Velozzi, D. M., Xiao, S. B., and Yang, Z. S.: Flux and fate of Yangtze River sediment delivered to the East China Sea, Geomorphology, 85, 208–224, https://doi.org/10.1016/j.geomorph.2006.03.023, 2007.
Loizeau, J.-L., Arbouille, D., Santiago, S., and Vernet, J.-P.: Evaluation of a wide range laser diffraction grain size analyser for use with sediments, Sedimentology, 41, 353–361, https://doi.org/10.1111/j.1365-3091.1994.tb01410.x, 1994.
McCave, I. N., Hall, I. R., and Bianchi, G. G.: Laser vs. settling velocity differences in silt grainsize measurements, Sedimentology, 53, 919–928, https://doi.org/10.1111/j.1365-3091.2006.00783.x, 2006.
McLaren, P.: An interpretation of trends in grain size measures, J. Sediment. Petrol., 51, 611–624, https://doi.org/10.1306/212f7cf2-2b24-11d7-8648000102c1865d, 1981.
Milliman, J. D. and Farnsworth, K. L.: River Discharge to the Coastal Ocean: A Global Synthesis, Cambridge University Press, https://doi.org/10.1017/CBO9780511781247, 2011.
Qin, Y. S., Zhao, Y. Y., Chen, L. R., and Zhao, S. L.: Geology of the Bohai Sea, China Ocean Press, Beijing, ISBN 9787502708627, https://catalog.hathitrust.org/Record/007209443 (last access: 20 October 2026), 1990.
Stephens, D. and Diesing, M.: Towards quantitative spatial models of seabed sediment composition, PLOS ONE, 10, e0142502, https://doi.org/10.1371/journal.pone.0142502, 2015.
Wang, H. J., Wang, A. M., Bi, N. S., Zeng, X. M., and Xiao, H. H.: Recent changes in sediment delivery by the Huanghe (Yellow River) to the sea, J. Hydrol., 391, 302–313, https://doi.org/10.1016/j.jhydrol.2010.07.030, 2010.
Xu, K. H., Li, A. C., Liu, J. P., Milliman, J. D., Yang, Z. S., Liu, C. S., Kao, S. J., Wan, S. M., and Xu, F. J.: Provenance, structure, and formation of the mud wedge along inner continental shelf of the East China Sea, Mar. Geol., 291–294, 176–191, https://doi.org/10.1016/j.margeo.2011.06.003, 2012.
Yang, S. Y., Jung, H. S., Lim, D. I., and Li, C. X.: A review on the provenance discrimination of sediments in the Yellow Sea, Earth-Sci. Rev., 63, 93–120, https://doi.org/10.1016/S0012-8252(03)00033-3, 2003.