the Creative Commons Attribution 4.0 License.
the Creative Commons Attribution 4.0 License.
 | 16 Oct 2026
Airborne measurements of turbulence and cloud microphysics during PaCE 2022 using the Advanced Max Planck CloudKite Instrument (MPCK+)
Oliver Schlenczek
Freja Nordsiek
Claudia E. Brunner
Venecia Chávez-Medina
Birte Thiede
Eberhard Bodenschatz
Gholamhossein Bagheri

This paper presents the data set collected with the Advanced Max Planck CloudKite instrument (MPCK+) during the Pallas Cloud Experiment (PaCE), conducted at Pallas, Finland, between 19 and 26 September 2022. The data set includes measurements of turbulence, wind shear, and cloud microphysics in the cloudy planetary boundary layer between 0 and 1200 m above ground with flight durations between 1.5 and 3 h. This data set is intended for researchers studying microphysics of boundary layer clouds in the sub-arctic at temperatures above freezing level, providing high-resolution airborne measurements of meteorological variables together with cloud droplet concentration and size distribution data. In particular, the high spatial resolution of less than 10 m between two cloud droplet size distribution samples, the low altitude and the long flight time allow unprecedented insights into stratocumulus and cumulus clouds. The aim of this paper is to describe the data collection process, the structure of the data set, and guidelines for potential users. The data set is available at https://doi.org/10.5281/zenodo.15700506 (Bagheri et al., 2025a) in NetCDF format.
- Article
(5014 KB) - Full-text XML
- BibTeX
- EndNote


The interplay of clouds and turbulence, in particular the formation of warm rain, is subject to ongoing research efforts worldwide in order to improve numerical climate and weather predictions. Due to the high degree of turbulence in a typical cumulus cloud, measurements in the laboratory are generally not suitable to yield a deeper understanding of the droplet dynamics and microphysics under real atmospheric conditions. Our approach is to perform in situ measurements using a tethered balloon system. As opposed to research aircraft, the air speed measured by a tethered balloon instrument is much lower, which allows for much higher spatial and temporal resolution and avoids effects like adiabatic heating of inlets and shattering of droplets or ice crystals. While airplanes fly at 50 to 150 m s−1, the air speed of a tethered balloon system is that of the wind itself, on the order of 5 to 10 m s−1, thus increasing the spatial resolution by a factor of 5 to 30. Another advantage of a tethered balloon system is the possibility to fly under conditions which are too risky for pilots of airplanes, e.g. at low altitude over complex terrain.
Our approach combines various sensors for different atmospheric and cloud variables into one scientific payload: the Advanced Max Planck CloudKite instrument (MPCK+) (Stevens et al., 2021; Schröder, 2023; Thiede et al., 2025a). The MPCK+ is the first instrument developed in-house for the Max Planck CloudKite (MPCK) platform, which is equipped with advanced imaging modules, i.e. Particle Imaging Velocimetry (PIV) and inline holography modules. The PIV module is designed to measure turbulence features, while the holography module provides the droplet size and concentration needed to study cloud microphysics. We have also developed anemometer-like instruments without imaging modules for the MPCK platform, such as the mini-MPCK (Stevens et al., 2021; Schröder, 2023) and WinDarts (Chávez-Medina et al., 2026).
Details about the field campaign, the MPCK platform, the instrumentation and the measurement flights are presented in Sect. 2. The data structure with examples is described in Sect. 3. Section 5 is dedicated to providing information on the usage of the data.
2.1 The PaCE 2022 field campaign
The aim of the Pallas Cloud Experiment (PaCE) was the characterisation of aerosols and clouds in the vertical column at high resolution around the Pallas-Sodankylä Global Atmospheric Watch (GAW) Sammaltunturi station in Finnish Lapland, approximately 160 km north of the Arctic Circle (Doulgeris et al., 2022; Bagheri et al., 2025b; Gratzl et al., 2025). The field campaign took place from 15 September to 15 December 2022 and was organised by the Finnish Meteorological Institute (FMI). Besides the Max Planck Institute for Dynamics and Self-Organization (MPI-DS) and the FMI, the Swiss Federal Institute of Technology Lausanne, the Karlsruhe Institute of Technology, the University of Hertfordshire, and the Vienna University of Technology participated in this campaign. The measurements were taken via fixed-wing and multi-copter drones, tethered balloon systems, mountain-top stations, ground stations and remote sensing instruments. A general overview within this Special Issue is given in Bagheri et al. (2025b). In this paper we present data obtained with the MPCK+ via in-situ measurements aboard the tethered balloon system MPCK platform between 19 and 26 September 2022.
The site from which the balloons with the instruments were launched is within the Pallas-Yllästunturi National Park in Finnish Lapland at the western shoreline of lake Pallasjärvi, approximately 280 m above mean sea level (a.m.s.l.) 1. Northwest of the site is a range of hills with up to 640 m a.m.s.l. The site itself is grassland, which is surrounded by boreal forest. The two main wind directions are south-west (towards the lake) and east (from the lake). The lake has a strong influence on temperature and wind in the lower atmospheric boundary layer (ABL) around the site, in particular during early summer (colder than the surrounding area) and late autumn (warmer than the surrounding area). More details about the site and the campaign can be found in Chávez-Medina et al. (2026) and Bagheri et al. (2025b).
2.2 The Max Planck CloudKite (MPCK) platform
In this section, we introduce the Max Planck CloudKite platform for airborne atmospheric measurements, abbreviated MPCK platform. It consists of one or more helium-filled tethered Helikites (type Desert Star Helikite by Allsopp Helikites Ltd.) and the accessories needed for flight operation (ground anchor, pulley, motor winch with main tether, etc.). The MPCK platform can carry different scientific payloads, such as the MPCK+ (Stevens et al., 2021) or the WinDarts (Chávez-Medina et al., 2026).
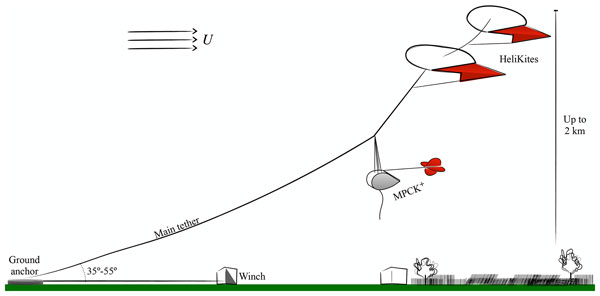
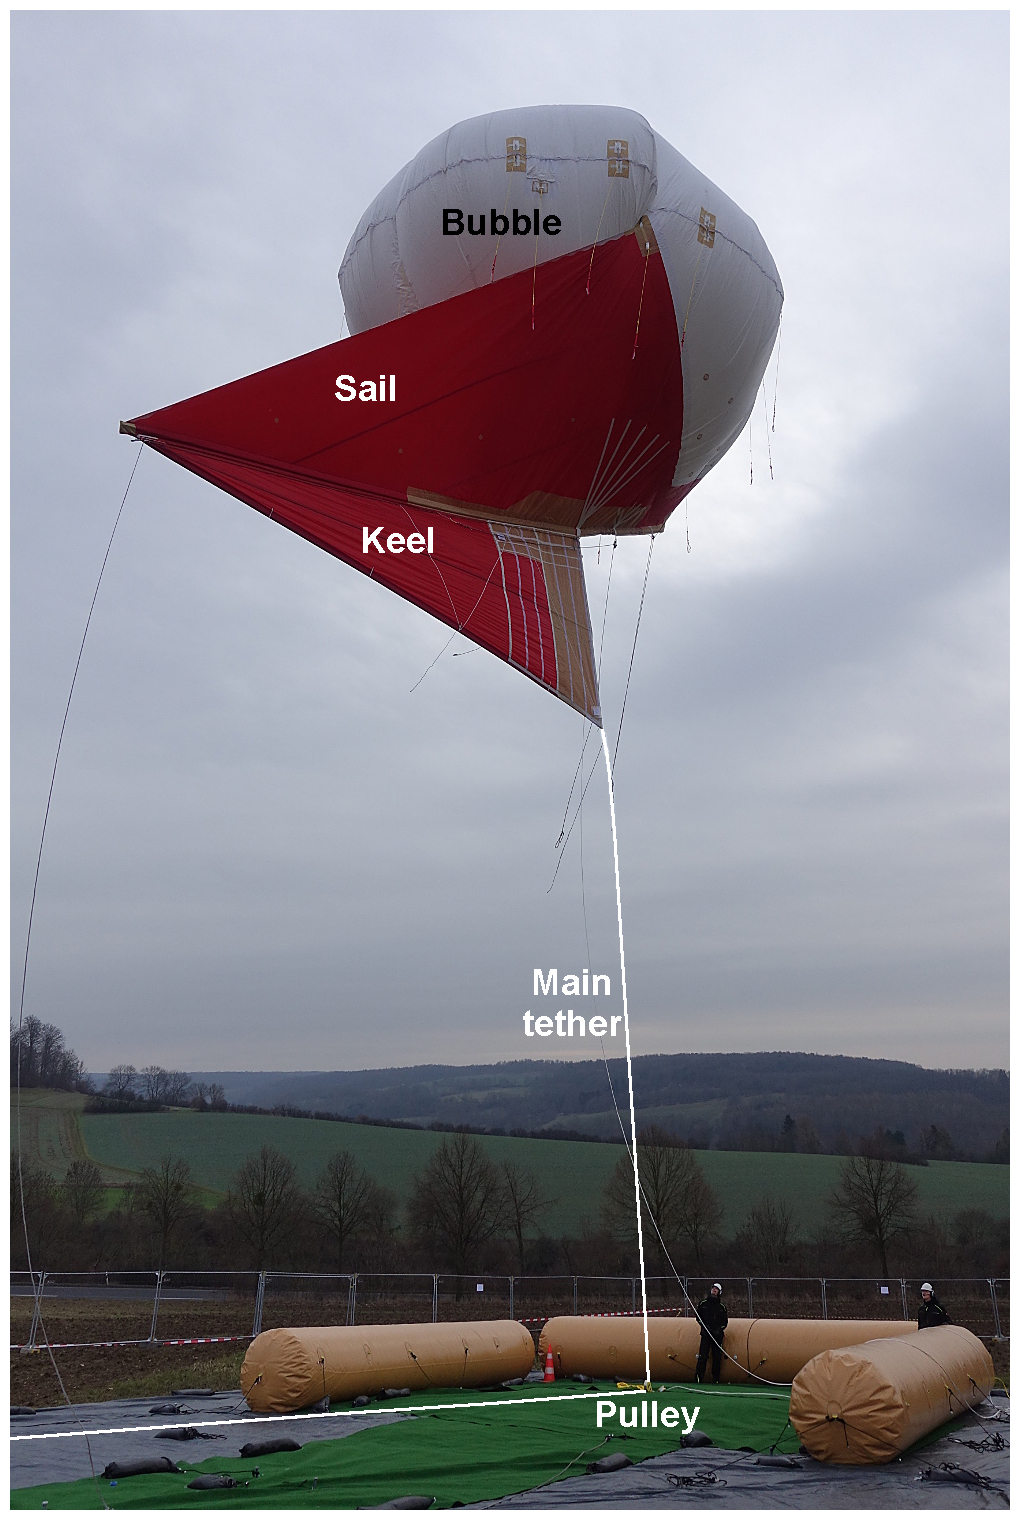
A Helikite is a balloon-kite combination whose main advantage over an ordinary balloon is the stable position in windy conditions. While ordinary balloons are being pushed towards the ground, a Helikite is stabilised by keel and sail underneath the bubble at a 45° angle to the vertical. The flight altitude, typically up to 2 km, is controlled by a motorised winch reeling in/out the main tether. By changing the tether length, the flight altitude is regulated. The maximum recommended wind speed for use is 25 m s−1. During PaCE 2022, the wind speed was always below 20 m s−1. A photo from a test site next to the MPI-DS shows the MPCK platform with one 250 m3 Helikite (Fig. 1). During most of the PaCE 2022 flights, we operated a tandem configuration with one 250 m3 Helikite as the lower balloon and one 34 m3 Helikite as the higher balloon. This tandem configuration increases the static lift by 10 %, and, due to the stabilising effect by the small Helikite, take-off and landing of the big Helikite can be performed under much safer conditions, in particular in gusty winds. Flight strategies with the MPCK platform include constant altitude flights, vertical profiles, and staircase flights. The static and dynamic lift generated by the Helikites was sufficient to reach altitudes of more than 1200 m above ground with a 100 kg payload.
While the MPCK platform has been used for flying different scientific payloads during PaCE 2022, we focus on the MPCK+ instrument in this paper. An overview of the MPCK+ installation on the main tether is shown in Fig. 2. This type of installation was chosen in order to minimise the influence of the balloons on the dynamics measured by the MPCK+ instrument. A particular challenge is the measurement of atmospheric variables under ambient conditions, i.e. the measurements not being influenced by the instrument deployment or instrument geometry. Here, the MPCK+ instrument is hanging on the main tether at least 50 to 100 m below the 250 m3 Helikite, which is the equivalent vertical distance of 5 to 10 balloon diameters. This mounting option is called tether-mount in Bagheri et al. (2026). One side effect of this setup is the non-linear relationship between line length and instrument altitude due to the catenary, which means that the gain of altitude decreases with increasing line length.
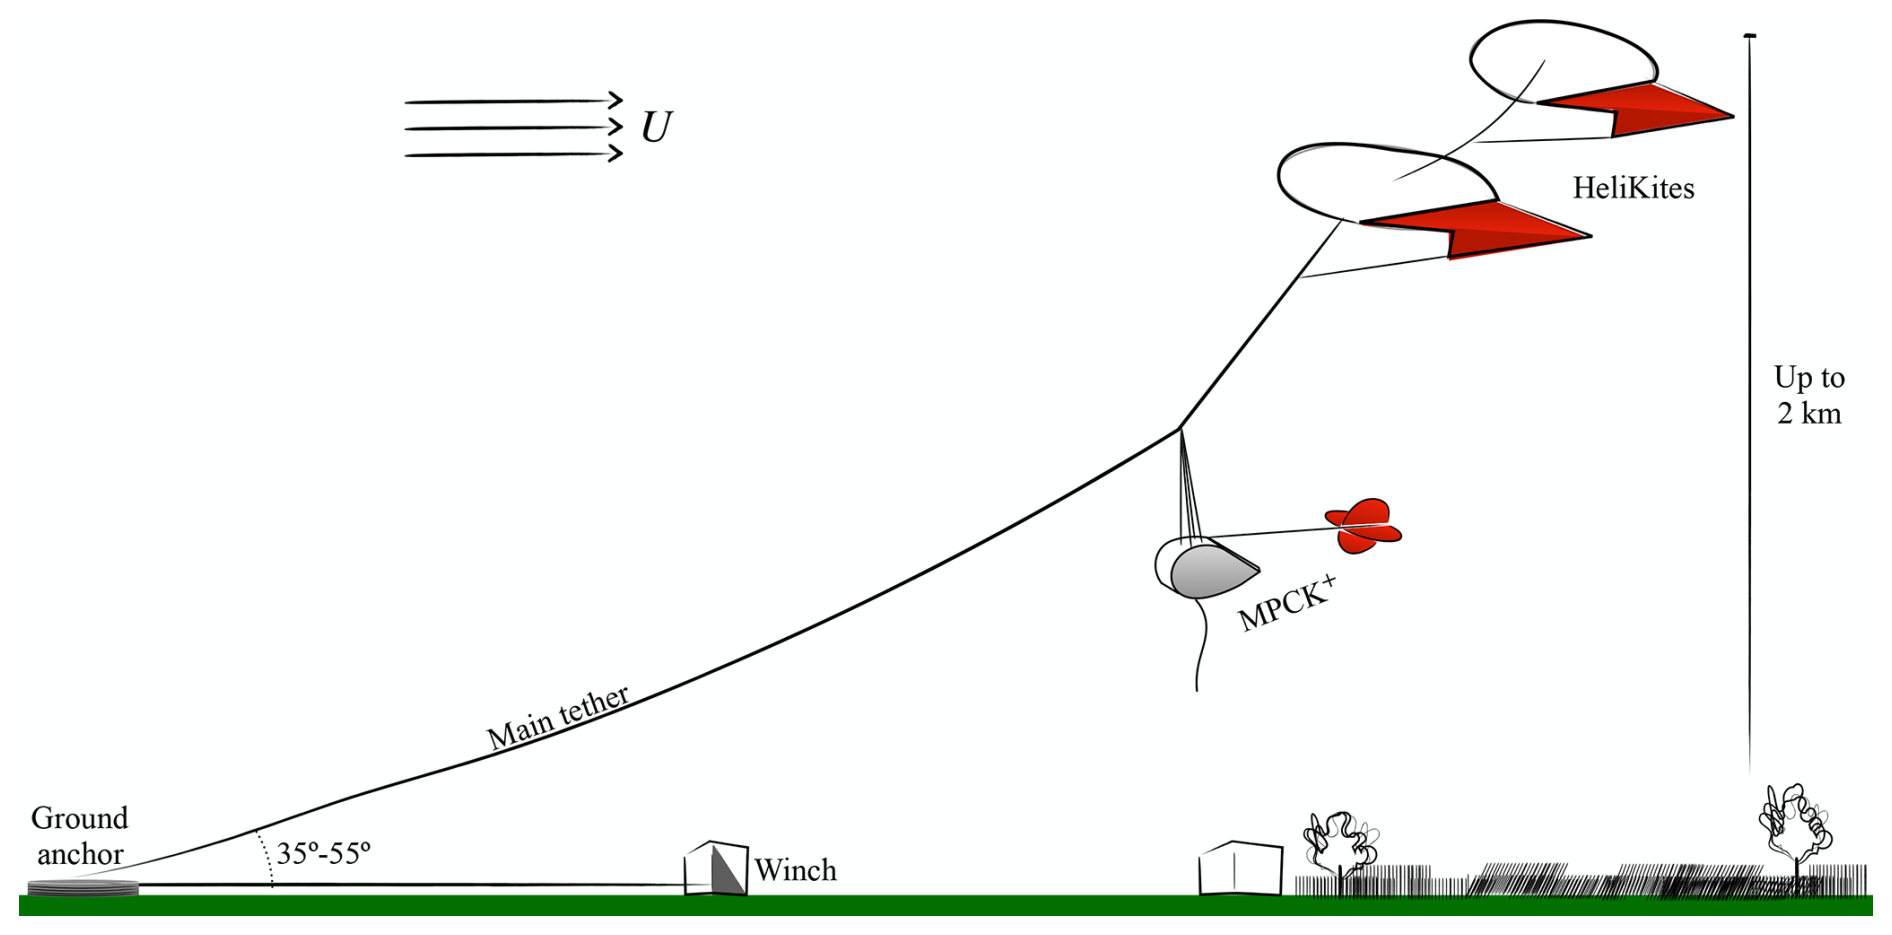
Figure 2Illustration of the MPCK platform with MPCK+ as scientific payload, installed on the main tether, with tandem helikite configuration.
2.3 Instrumentation: the MPCK+
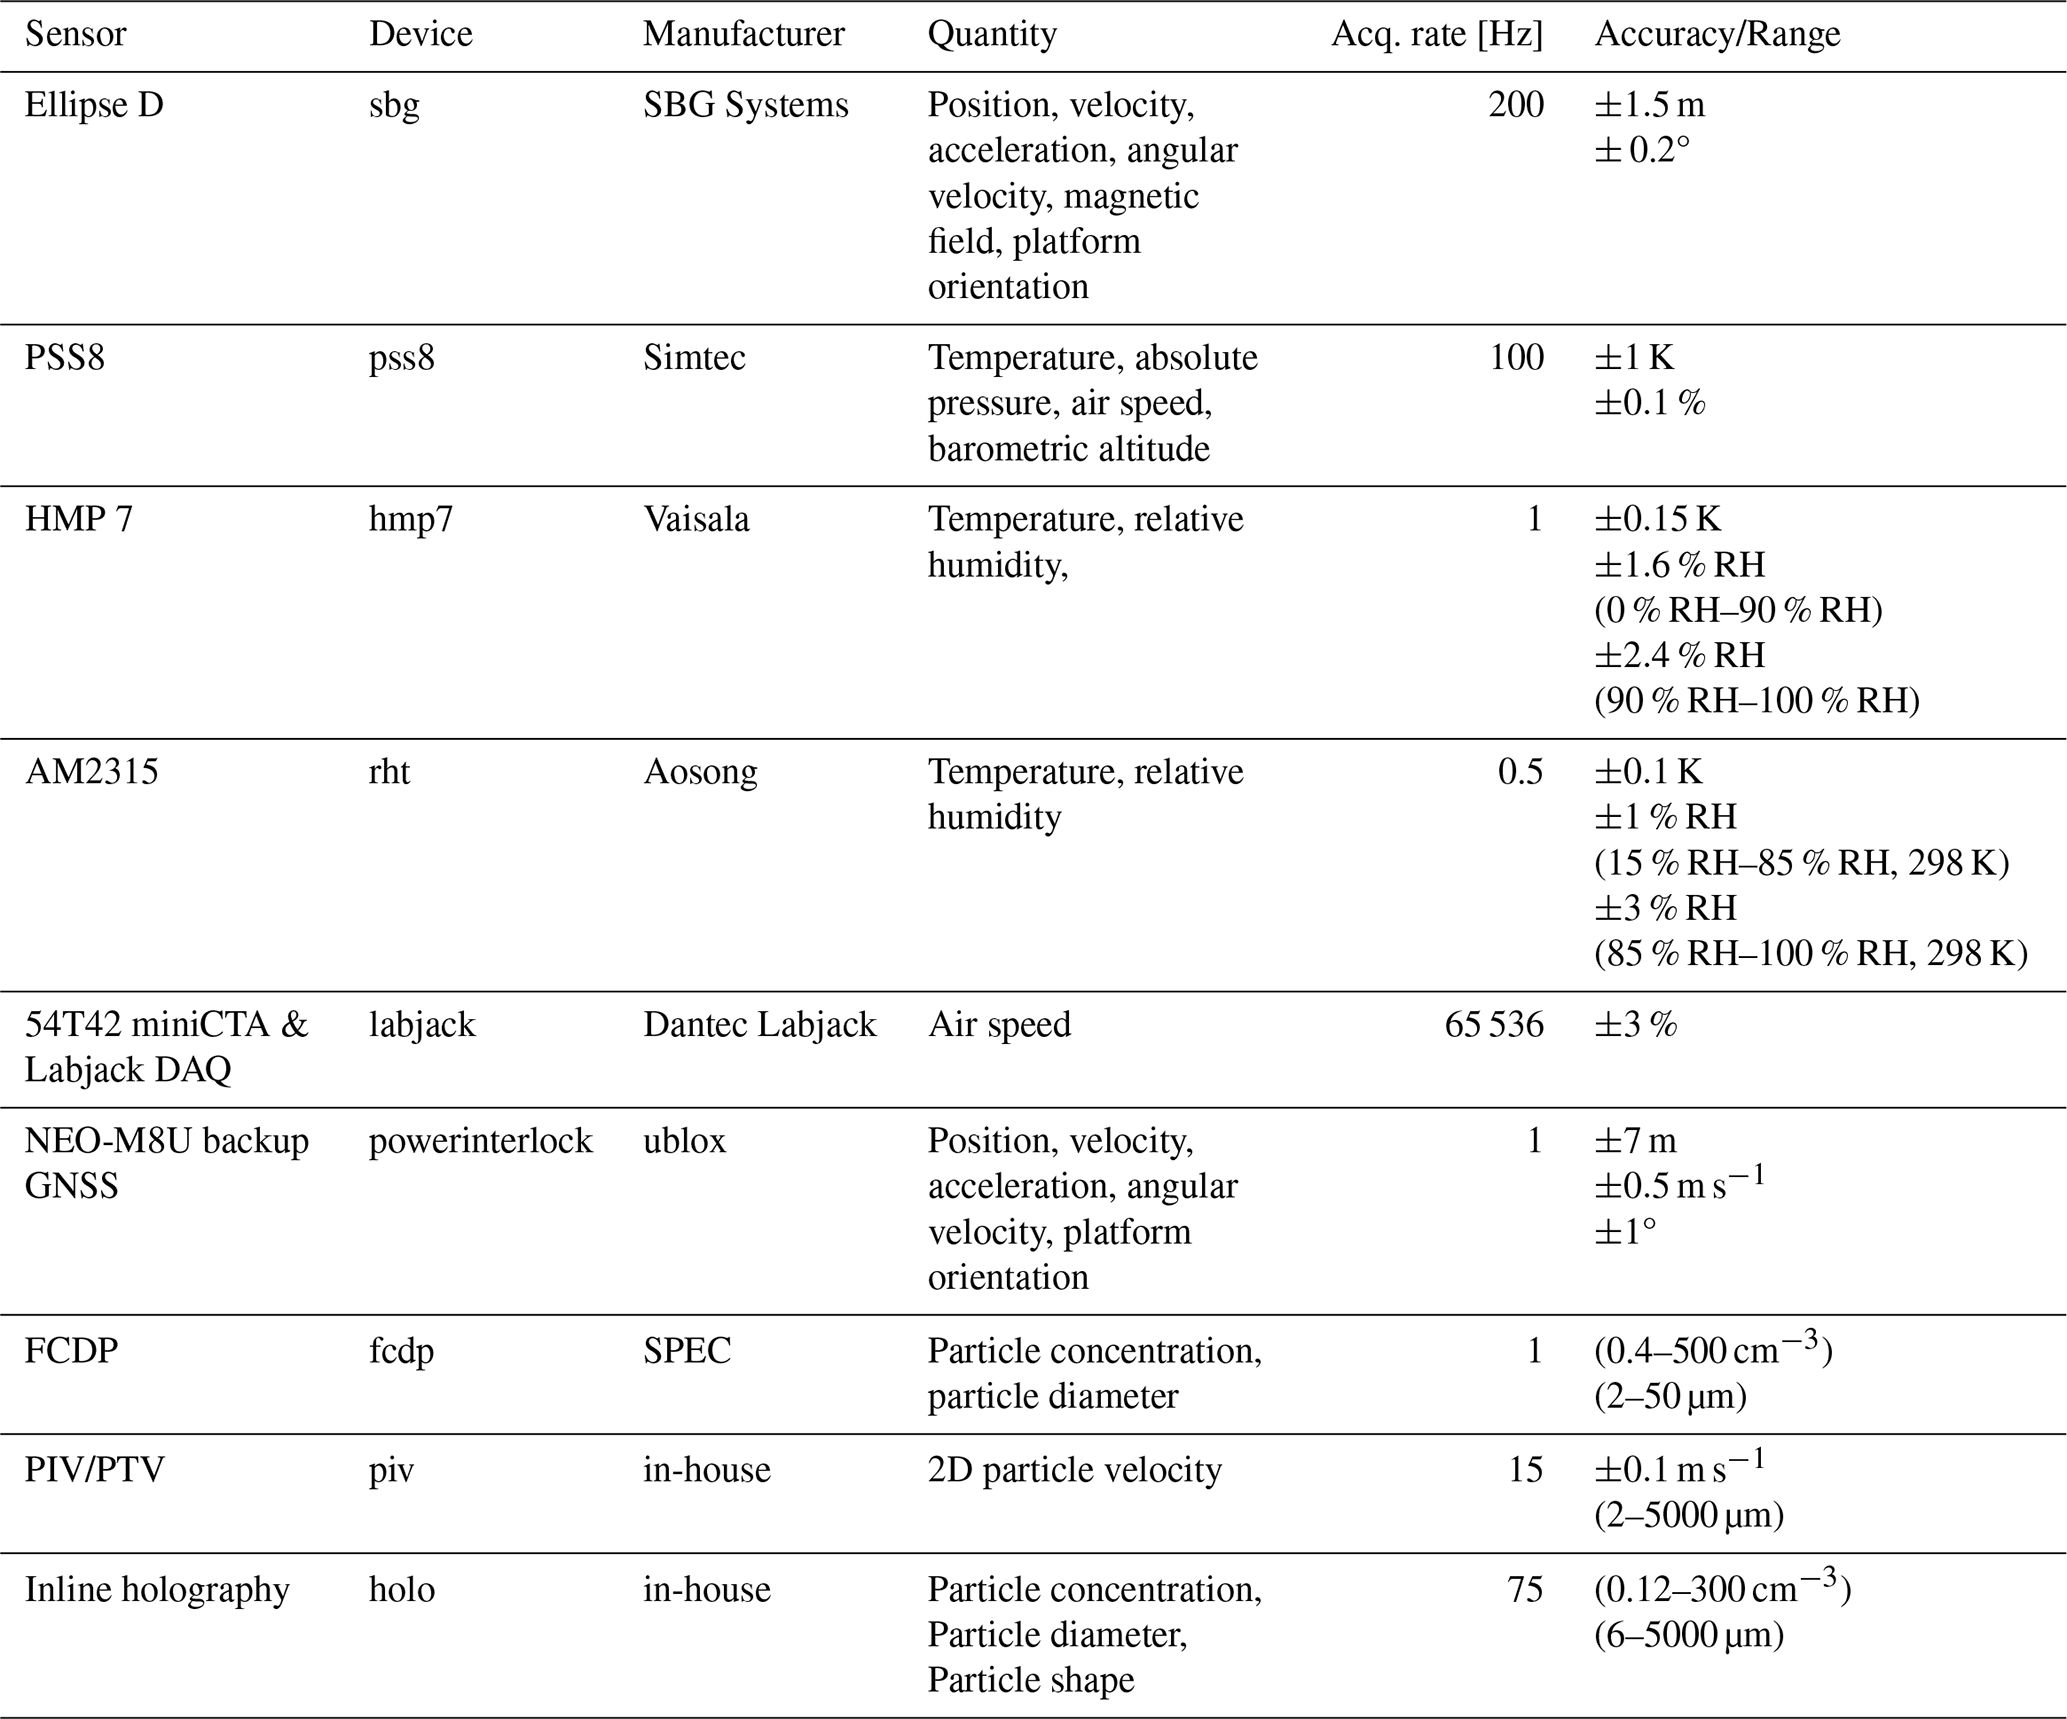
The MPCK+ consists of nine devices to measure different platform and atmospheric properties. A summary of the instrument specifications is given in Table 1. The core unit consists of a one-dimensional (1D) pitot static system (Model type PSS8, Simtec AG) for measurement of air speed, barometric altitude and temperature, an inertial navigation system (Model Ellipse D, SBG Systems) for measurement of the platform position, orientation, velocity, angular velocity, acceleration and angular acceleration, a humidity and temperature sensor unit (labeled “rht” in Table 1) with an AM2315 sensor (Guangzhou Aosong Electronic Co., Ltd.) and a nearby HMP7 sensor (Vaisala), a backup global navigation satellite system (GNSS), model NEO-M8U (uBlox), and a thermal anemometry unit, which comprises a 54T42 mini-CTA (Dantec Dynamics) and a T7 Data Acquisition unit (LabJack Corporation). Particle size and concentration in 1D are measured by a Fast Cloud Droplet Probe (FCDP) from Stratton Park Engineering Company (SPEC Inc.). The basic variables are measured by multiple sensors to allow for redundancy of essential variables and in-situ instrument intercomparison. For measurement of 3D particle position, size and shape, an in-house-built digital inline holography unit is used. Particle velocity in the stream-wise-vertical plane is measured with an in-house-built Particle Imaging Velocimetry (PIV) unit. Inline holography and PIV have a partially overlapping sample volume. In addition, every fifth hologram (75 Hz recording rate) has a corresponding PIV image pair (15 Hz recording rate) at exactly the same time. This unique design allows in-situ inter-instrument calibration as cloud droplets are detected by both instruments in the overlapping volume. The low air speed together with the high image acquisition rate yields inter-hologram distances on the order of 5 to 6 cm. One feature of the MPCK+ control software is that particles detected by the FCDP above a given size and concentration threshold can be used to automatically trigger the holography and PIV unit. Data acquired by the two imaging units are not part of the published data set, but the flight table provides information about availability of these data.
Table 1Instrumentation of the MPCK+ instrument. Sensor range is given in parentheses, sensor accuracy begins with ±. If not stated otherwise, the accuracy is given for the temperature range during the PaCE 2022 flights. All values for commercially available sensors were taken from the respective manufacturer. For the inertial navigation systems, the configuration with highest uncertainty was assumed.
Our measurements provide valuable insights into clouds on spatial scales typically smaller than 10 m, depending on wind speed and acquisition rate. Also, the thermodynamic and dynamic properties of the atmospheric boundary layer can be studied using these data, for example the role of wind shear and convection in different meteorological conditions. The details of the MPCK+ are summarised in another paper (Bagheri et al., 2026).
Besides the MPCK+ instrument, additional scientific instruments were operating simultaneously: the WinDarts (see Chávez-Medina et al., 2026), and the FishBox, which was developed by the Finnish Meteorological Institute (FMI) team and comprises several aerosol particle size spectrometers, a GPS and meteorological instrumentation (see Bagheri et al., 2025b, for details). Along with the MPCK platform and its scientific payloads, we operated a ground weather station next to the launch site. This weather station was equipped with a WS500 UMB combined weather monitor (Lufft) (for static air pressure, temperature, relative humidity and 2D wind), a uSonic Class A-MP 3D sonic anemometer (for high-resolution 3D wind and temperature), a LI-7500DS optical trace gas analyser (for high resolution data of static air pressure, temperature, water vapour and CO2 concentration), and a CS 110 field mill (for the vertical component of the atmospheric electric field). In addition to these instruments, we operated a LD 250 lightning detector and a pingStation Mode S and ADS-B receiver for safety reasons (uAvionix), i.e. to monitor the risk of thunderstorms and lightning and to monitor the airspace. More details about the ground monitoring and a schematic of the setup are presented in Chávez-Medina et al. (2026).
2.4 Flight overview
Between 19 and 26 September 2022, we performed eight flights with the MPCK+ with a total flight time of 19 h and 37 min. The longest flight took 3 h and 12 min, the shortest flight was 1 h and 32 min long. While the lowest flight had a maximum altitude of 240 m above ground, the highest flight was at maximum 1210 m above ground. A summary of all the flights is given in Table 2. The flight identifier is the date of departure, followed by the take-off UTC time (hours and minutes).
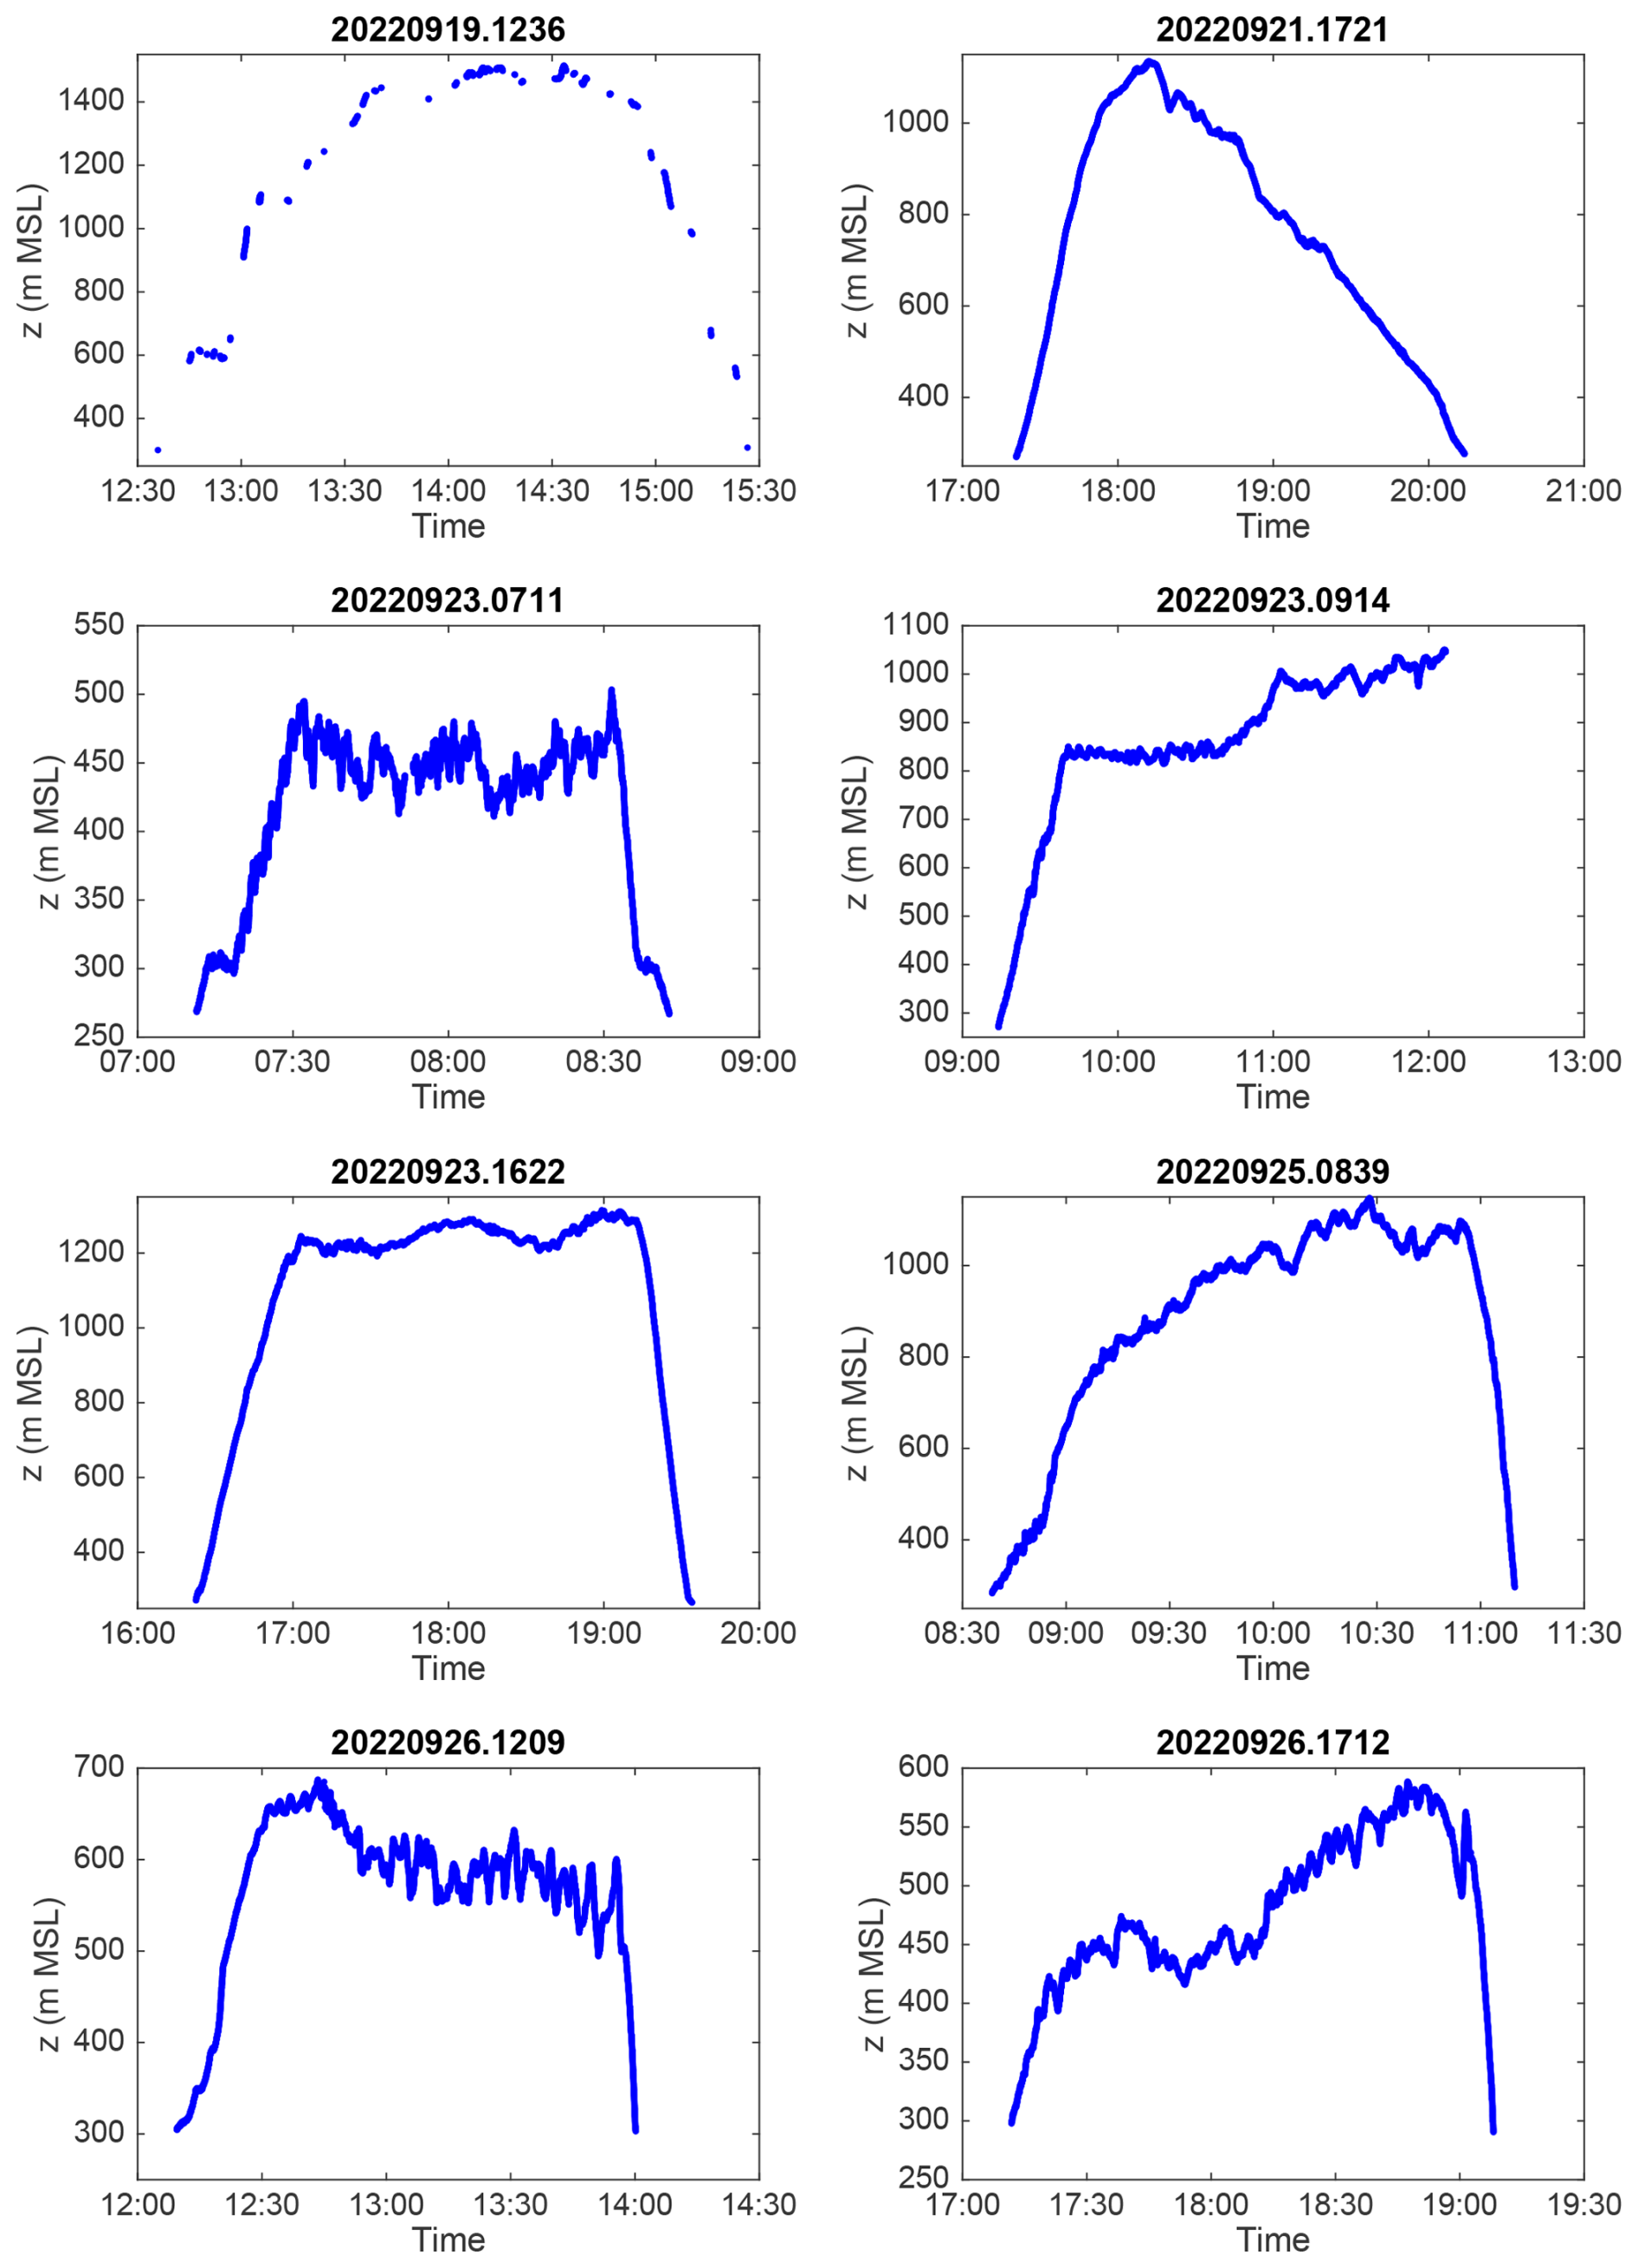
Figure 3Time series of barometric altitude measured with the pss8 device aboard the MPCK+ instrument, the flight numbers are given in each panel title. Flight 20220919.1236 (top row) had issues with the power supply, resulting in visible gaps of the data record.
Table 2Overview of flights with the MPCK+ during the PaCE field campaign. The times for take-off and landing are approximations derived from altitude data. Altitude is given in m above ground. Our naming convention is MPDS.MPCKplus.b1.yyyymmdd.hhmm.nc, where: MPDS is the institute identifier, MPCKplus is the instrument identifier, b1 indicates the data file processing level, yyyymmdd denotes the file date (UTC) in year, month, day format, and hhmm represents the take-off time (UTC) in hours and minutes format. The cumulative flight duration across all flights totals 19 h and 37 min.
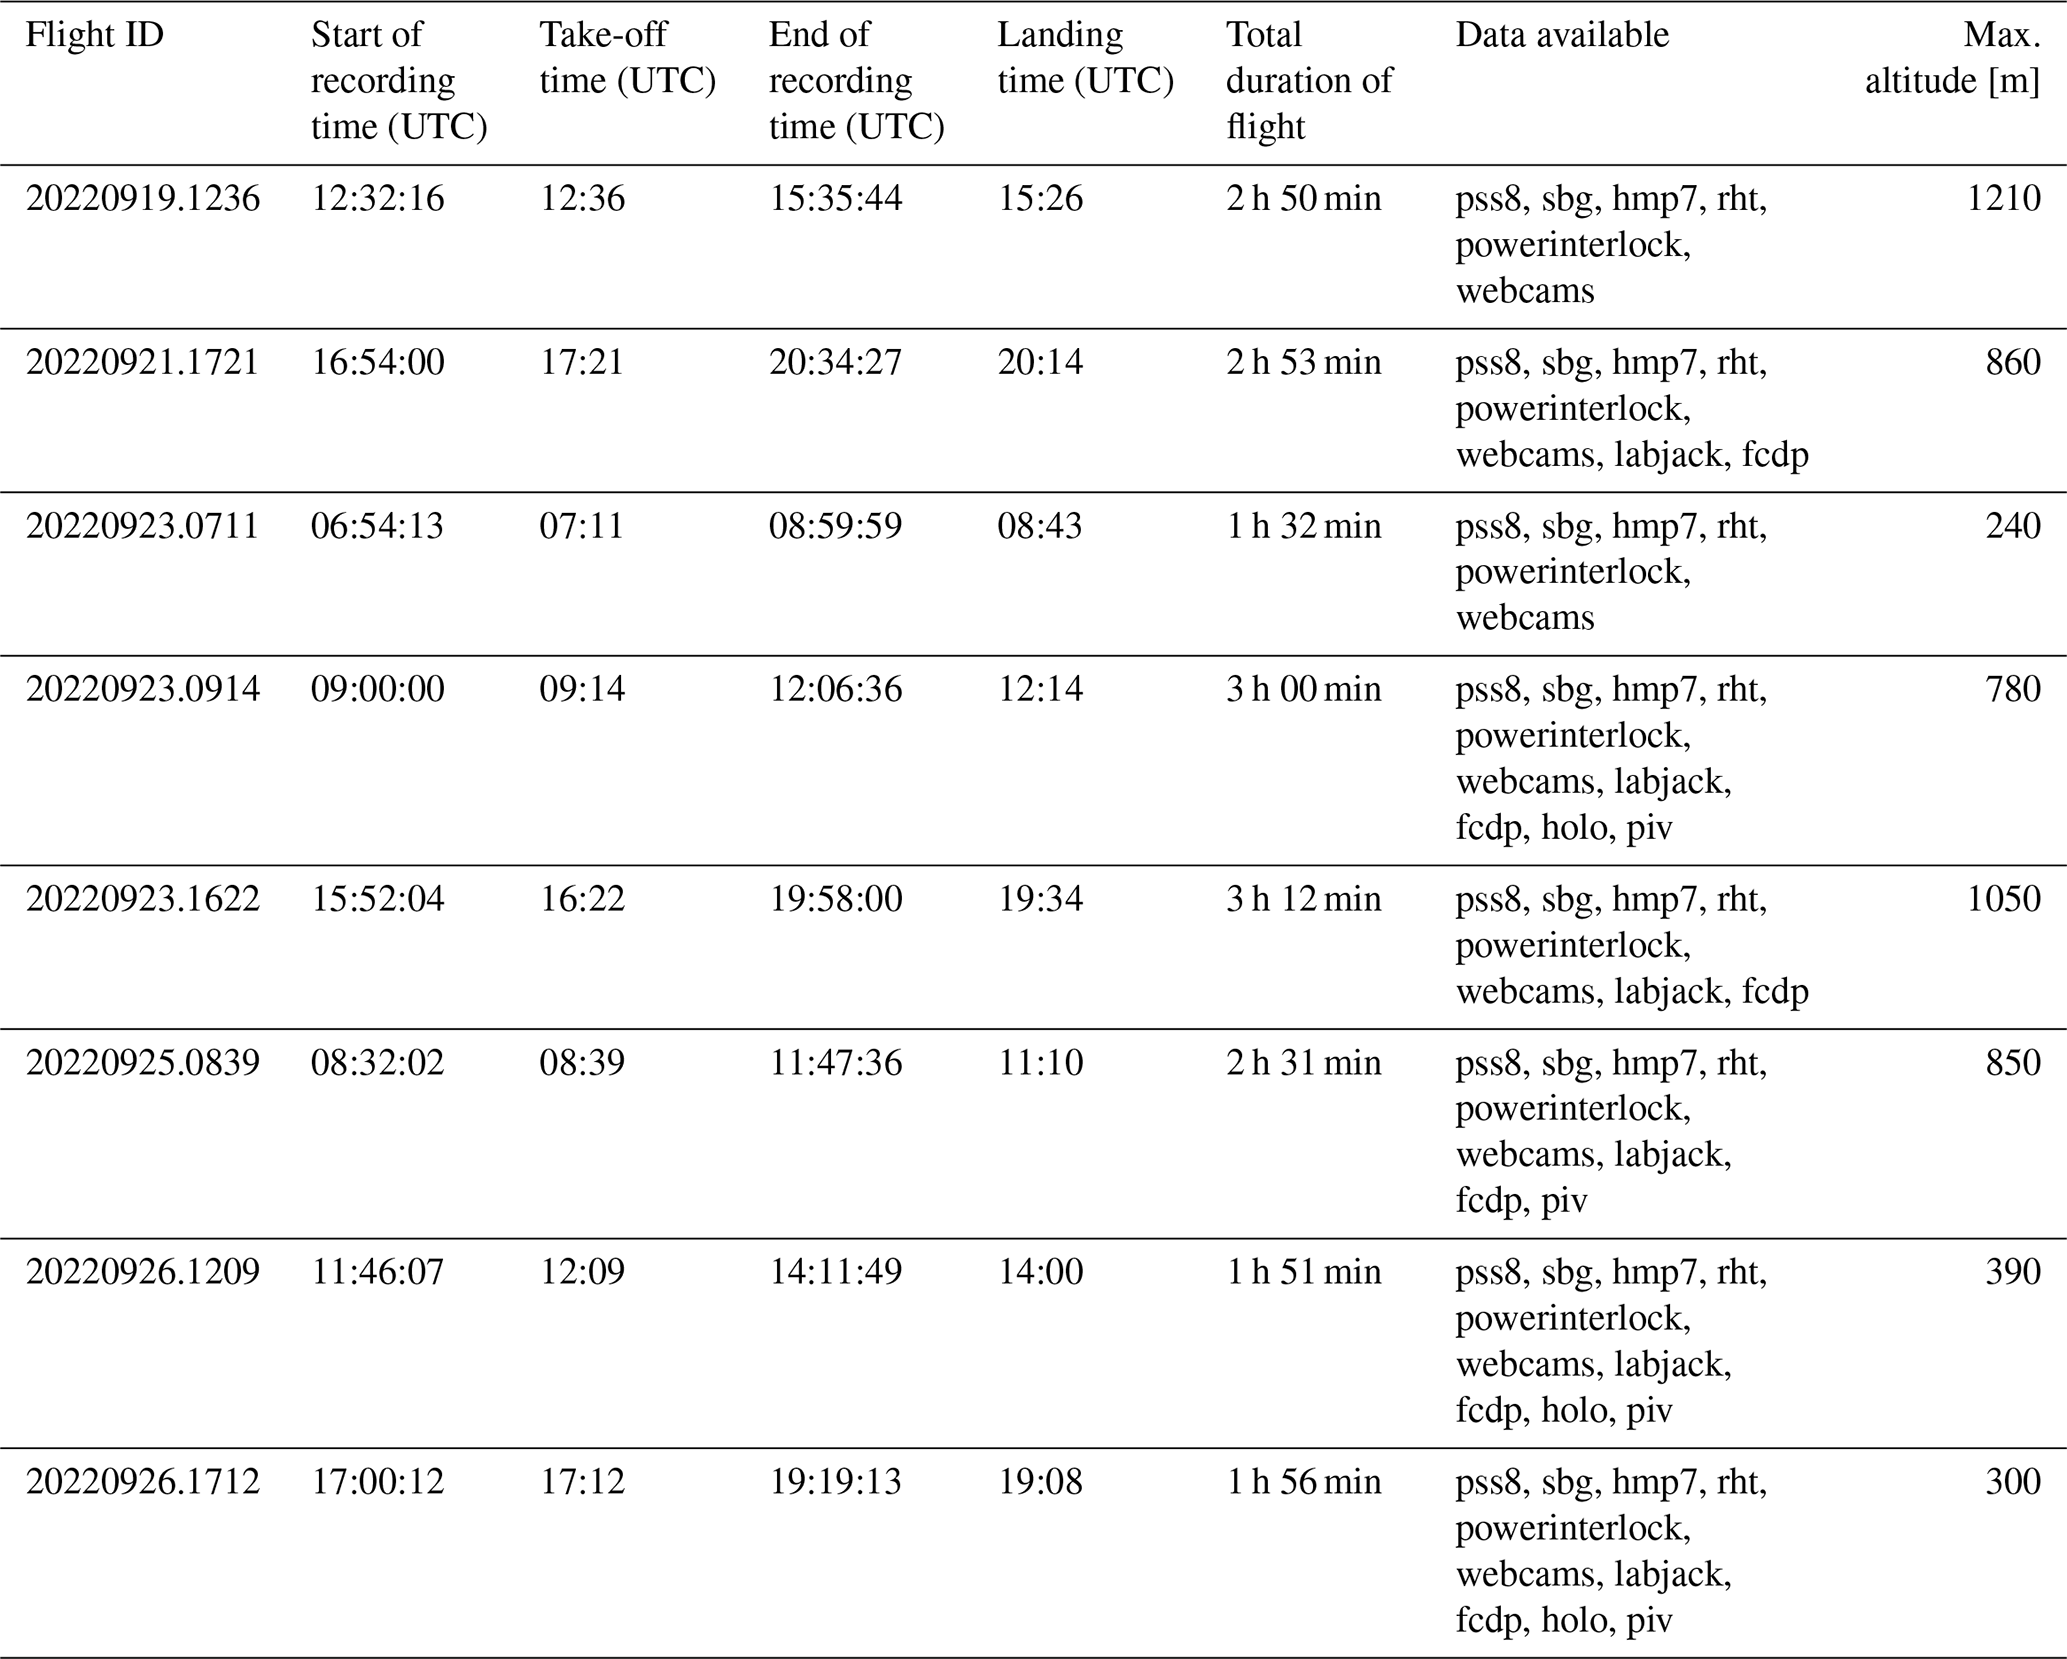
Figure 3 shows the barometric altitude time series records for flights 20220919.1236, 20220921.1721, 20220923.0711, 20220923.0914, 20220923.1622, 20220925.0839, 20220926.1209 and 20220926.1712. The first six flights were done with the tandem configuration whereas the flights on 26 September 2022 were done with just the 250 m3 Helikite. Flights 20220923.0711, 20220925.0839 and 20220926.1209 had at least one WinDart measuring simultaneously with the MPCK+ at a different altitude. These data are published in Chávez-Medina et al. (2026).
Flight 20220919.1236
This flight had broken cumulus and stratocumulus with no precipitation and northerly wind. During this flight there was an issue with the power supply of the devices, which is visible by the data gaps of the altitude time series. The issue with the power supply was fixed and did not occur during any of the other flights.
Flight 20220921.1721
This flight had south-westerly wind and broken altocumulus and altostratus. The cloud base was not reached by the MPCK+. This flight was the one with the strongest measured temperature inversion as shown in Sect. 3.5.
Flight 20220923.0711 and 20220923.0914
These flights had broken cumulus and stratocumulus with southerly wind and the MPCK+ stayed below cloud base again. The cloud and wind conditions did not change much until the end of Flight 20220923.0914, in which the MPCK+ recorded some brief cloud events.
Flight 20220923.1622
This flight had southerly wind and few cumulus clouds; the MPCK+ did not reach the cloud layer.
Flight 20220925.0839
This flight had broken to overcast stratocumulus and southerly wind; the MPCK+ recorded a few brief cloud events. During this flight, there were some issues with the measured air speed.
Flight 20220926.1209
This flight had low overcast cumulus with drizzle and south-easterly wind and the MPCK+ stayed in the cloud during most of the flight time. This flight has the largest data set of good quality holograms, the holographic data covering almost 9 min of flight time. An example is shown in Sect. 3.6. However, there was again an issue with the measured air speed, which happened around 13:03 UTC. We believe there was water inside the tubing which connects the pitot tube and the pressure transducer.
Flight 20220926.1712
This flight had low overcast cumulus with rain and south-easterly wind and cloud conditions similar to the previous flight. Again, the MPCK+ stayed inside the cloud during most of the flight time. This time, the velocity measurement is valid until 19:00 UTC but the number of high quality holograms covers only one minute of the time series.
3.1 File Structure
The data are provided in NetCDF format, following a common file naming structure. This structure is as follows: MPDS.MPCKplus.b1.yyyymmdd.hhmm.nc, where:
-
MPDS is the institute identifier (Max Planck Institute for Dynamics and Self-Organization).
-
MPCKplus is the instrument identifier (Advanced Max Planck CloudKite).
-
b1 indicates the data file processing level, with quality control (QC) checks applied; missing data points or those with bad values can be eliminated by filtering values to be smaller than 9×1036.
-
yyyymmdd.hhmm is the flight identifier (flight ID).
-
yyyymmdd denotes the file date (UTC) in year, month, day format.
-
hhmm represents the file start time (UTC) in hours and minutes format.
-
.nc is the file extension for the NetCDF.
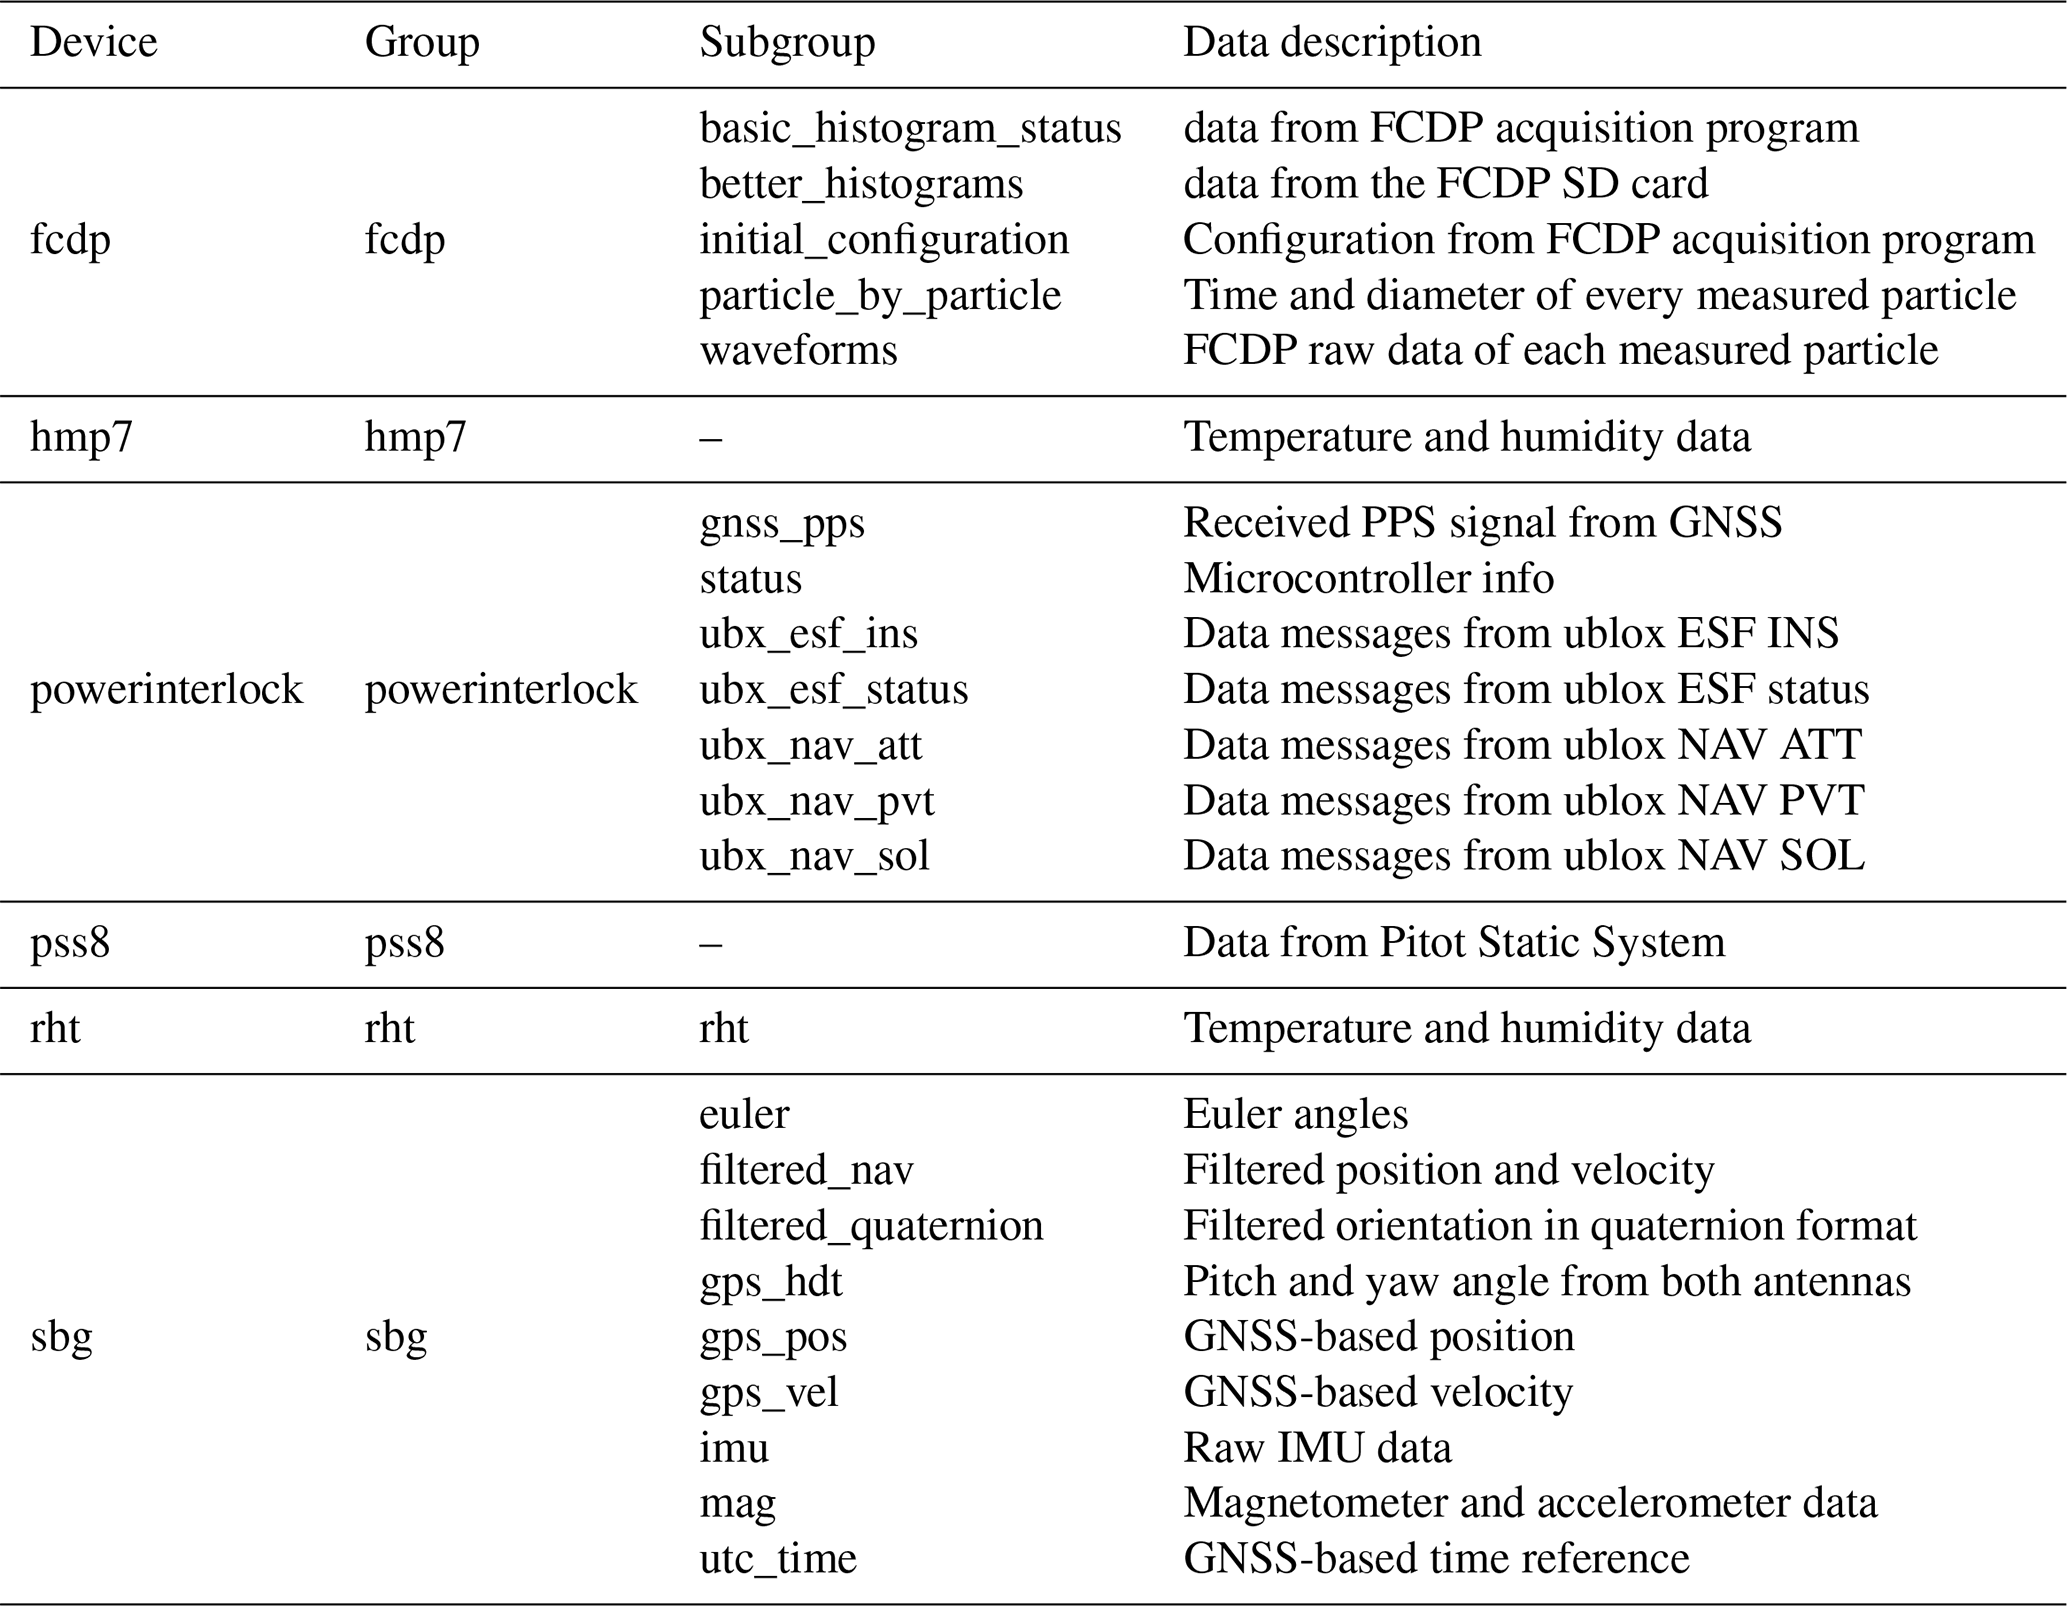
Each data file contains 50 attributes (institution, contact information, standard name vocabulary, campaign time, campaign location, flight number and many more) and one group, which is labeled “Level_1”. This group contains 10 subgroups and 51 attributes. Each subgroup represents one particular measurement device. The device names are summarised in Table 1. An overview of the data structure for the different devices is given in Table 3. Each group and data set contains attributes that describe the type of data, the calibration factors applied, and the physical units.
Not all devices mentioned in Table 2 are included in the data published in this paper. The additional groups, which are excluded from the published data, are labjack, holo, piv and serialcameras due to ongoing QC/QA (quality control/quality assurance) procedures.
Table 3Structure of data groups and subgroups for each device.
Within the comprehensive list of variables contained in the published NetCDF files, there is a subset of core variables that have been used to do the analyses and generate the figures presented in this paper. Table 4 lists and describes the most important variables, which are usually enough for most users. For generating these variables, the calibration polynomials either from the manufacturer or an in-house calibration have been applied to the raw data. Especially for the true air velocity values, which are also required for the calculation of the droplet concentration, corrections of the air velocity values are necessary due to the geometry of the MPCK+, more on this is provided in Sect. 5. For relative humidity, temperature and dew point, we recommend using the data in group corrected_rht as described in Table 5.
Table 4Core variables in the published netCDF files discussed in this paper.
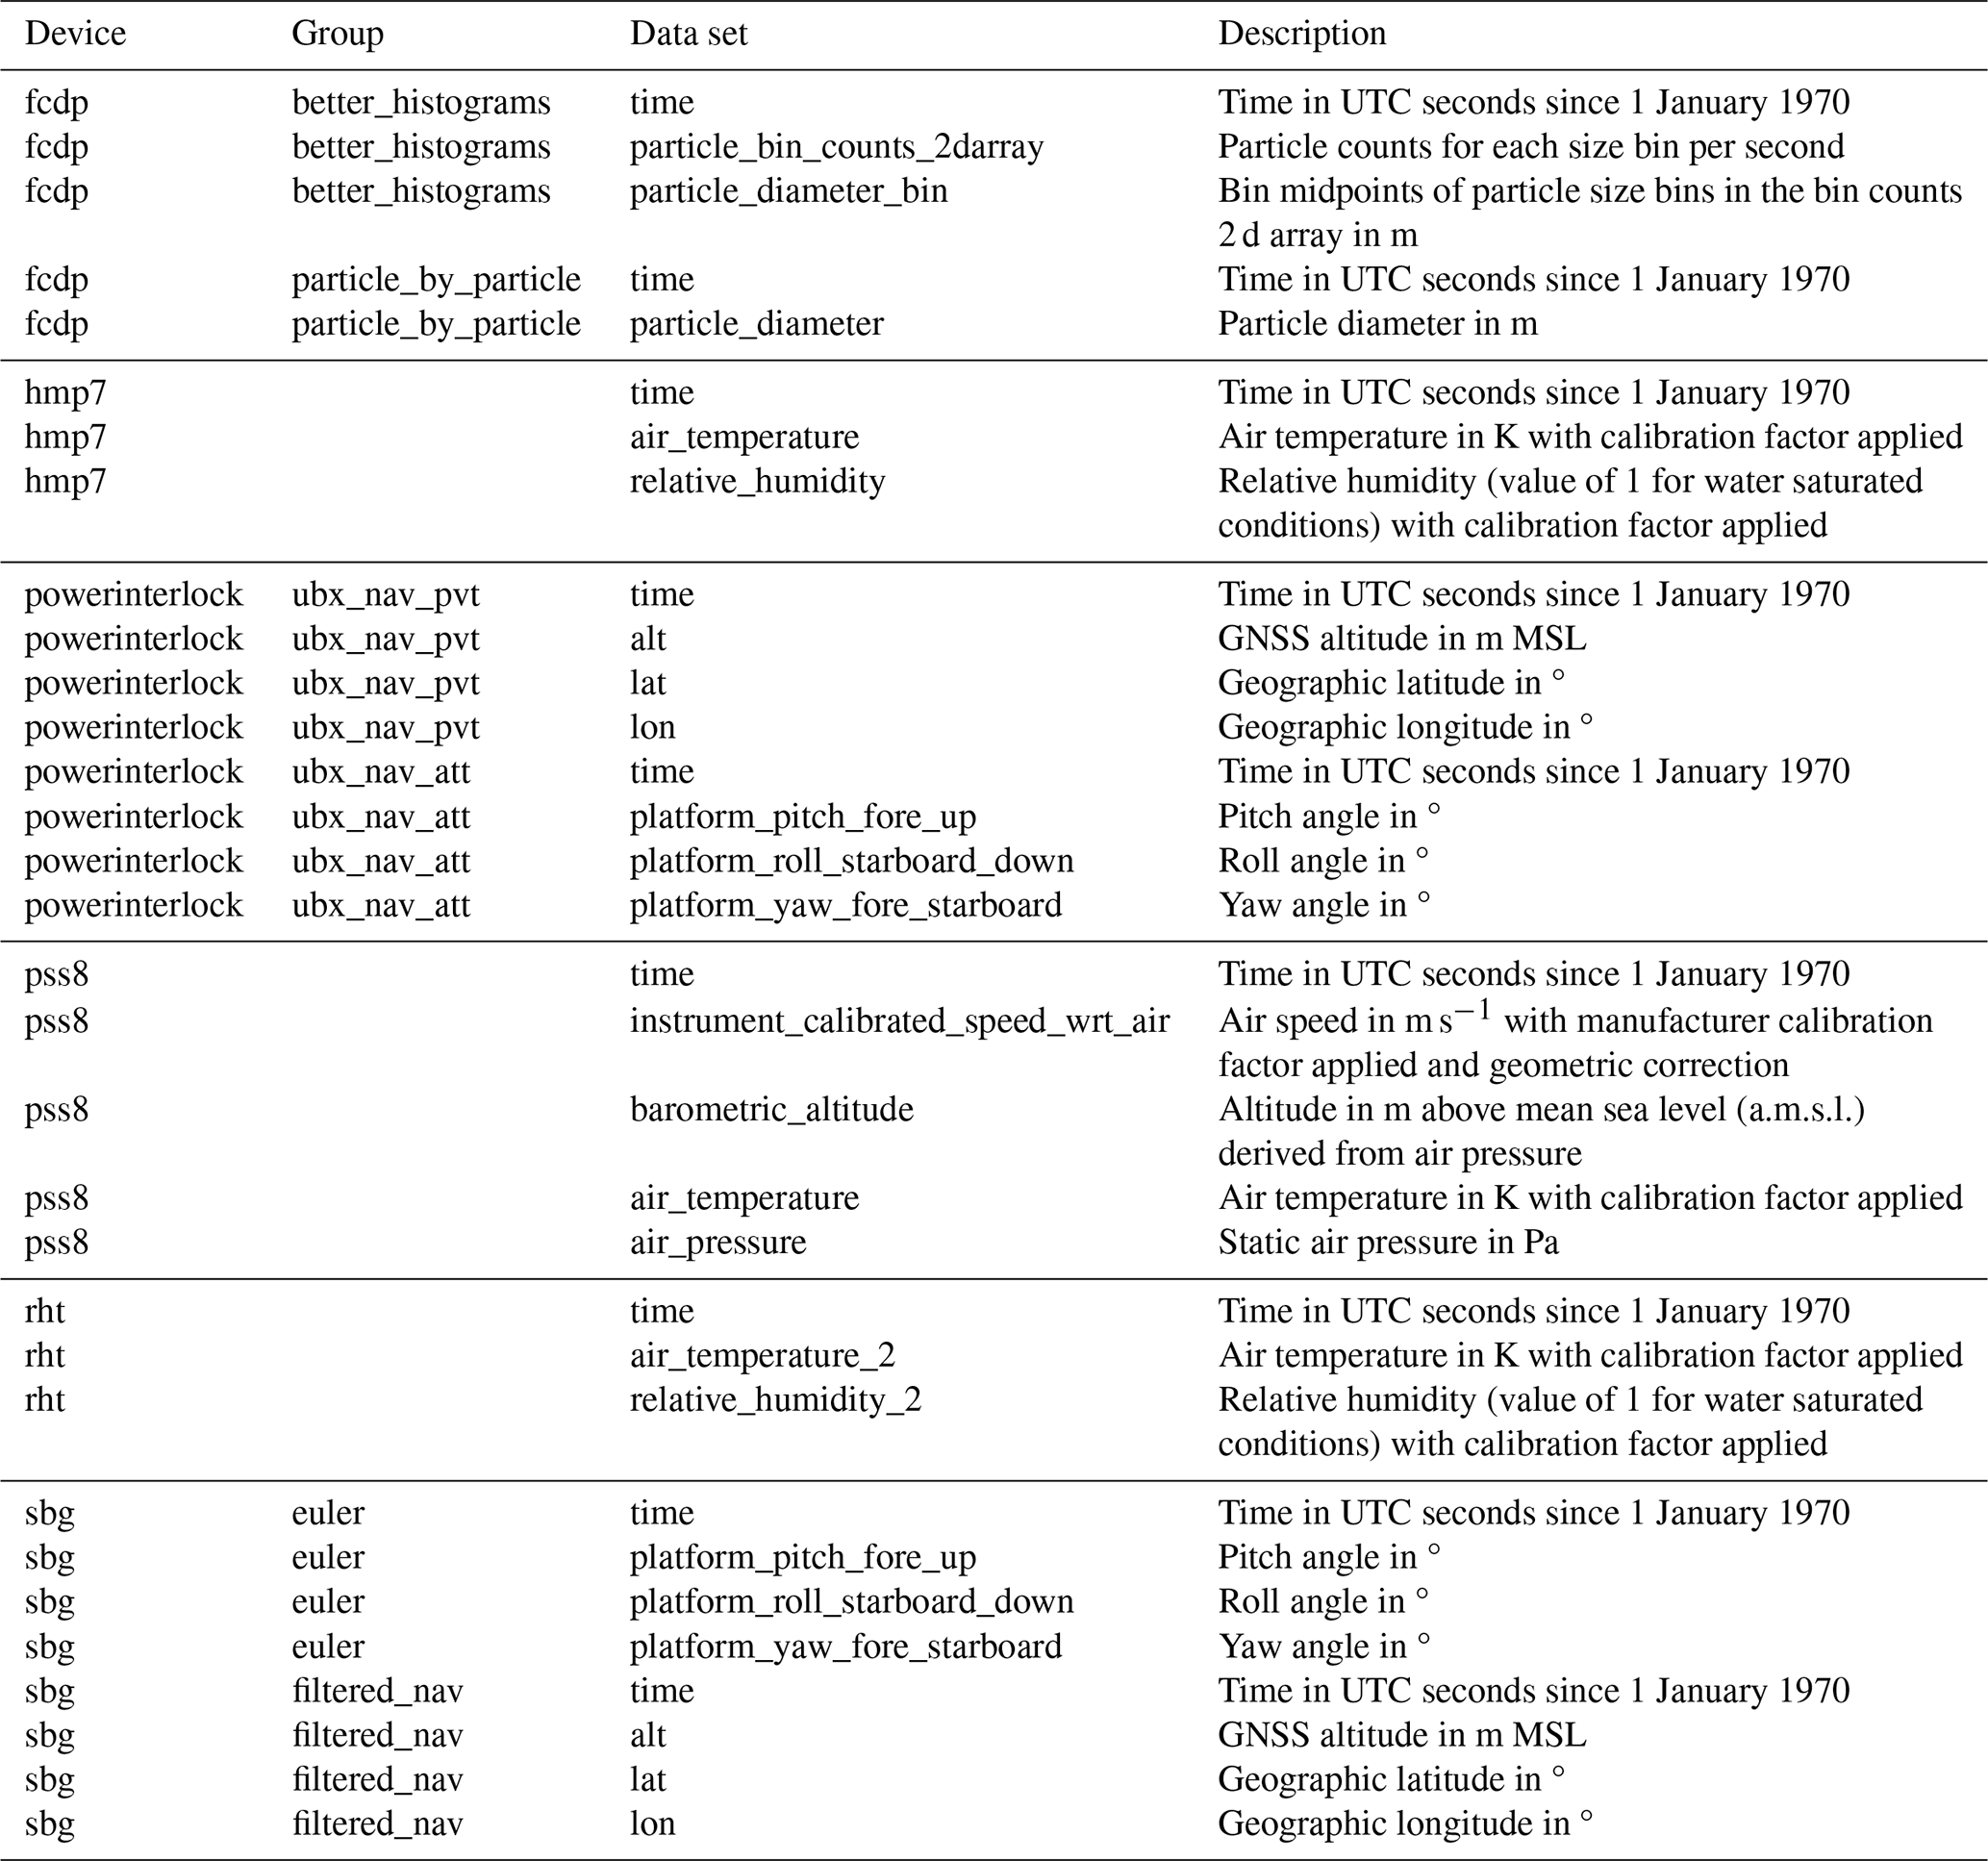
Table 5Additional data from combining data of two instruments.

At this point, it needs to be mentioned that there are two more correction factors. These correction factors result from tests with the MPCK+ in our wind tunnel to determine the disparity between undisturbed and measured air speed at the pitot tube and other locations, e.g. at the probing volume of the FCDP for calculation of droplet concentration. The calibrated air speed from the pss8 has already been corrected to air speed at infinity by applying the correction factor 1/0.647. At the sample volume of the FCDP, the actual air speed is the air speed at infinity multiplied by 1.09. The second correction factor is included in the sample Python code linked to this document to ensure that users are given clear instructions on how to calculate the concentration and apply various corrections, and to facilitate the use of data.
3.2 Level 1 data generation
Different devices and microcontrollers acquire the data of the various instruments of the MPCK+. This requires time synchronisation of all instruments against one master clock. The synchronisation is the very first step in the data processing from raw data to Level 1 processed data. After synchronisation, the data are checked for physical plausibility to detect obvious issues due to a broken sensor, a loose connection or other reasons. In the next step, the calibration polynomials are applied to the raw data; they are either from a calibration certificate of the manufacturer or based on an in-house calibration. Data sets of a missing sensor have all values above 9.9×1036. Anything larger than 264 is considered invalid data or missing data.
3.3 Temperature and relative humidity data
The accuracy of temperature and relative humidity sensors given by the manufacturer is summarised in Table 1. However, these values are valid under laboratory conditions. To clarify the accuracy of humidity measurements, we chose flights that had clouds at the instrument altitude. For this reason we selected flights 20220925.0839 and 20220926.1209 as examples. Starting with Flight 20220925.0839 as shown in Fig. 4, we see a strong positive deviation of the pss8 temperature data compared to the rht and hmp7 units of about +3.5 K. The hmp7 dew point and temperature data suggest high humidity during the entire period while the FCDP detected particles in a few short events during the flight. As the deviation between the rht and hmp7 units in temperature is typically smaller than 200 mK, we trust both sensors but prefer the rht temperature data over the hmp7 temperature data due to the fact that the rht sensor is not heated. However, the rht dew point is too low in those sections where the FCDP detected cloud droplets. Therefore, we prefer the hmp7 dew point over the rht dew point.
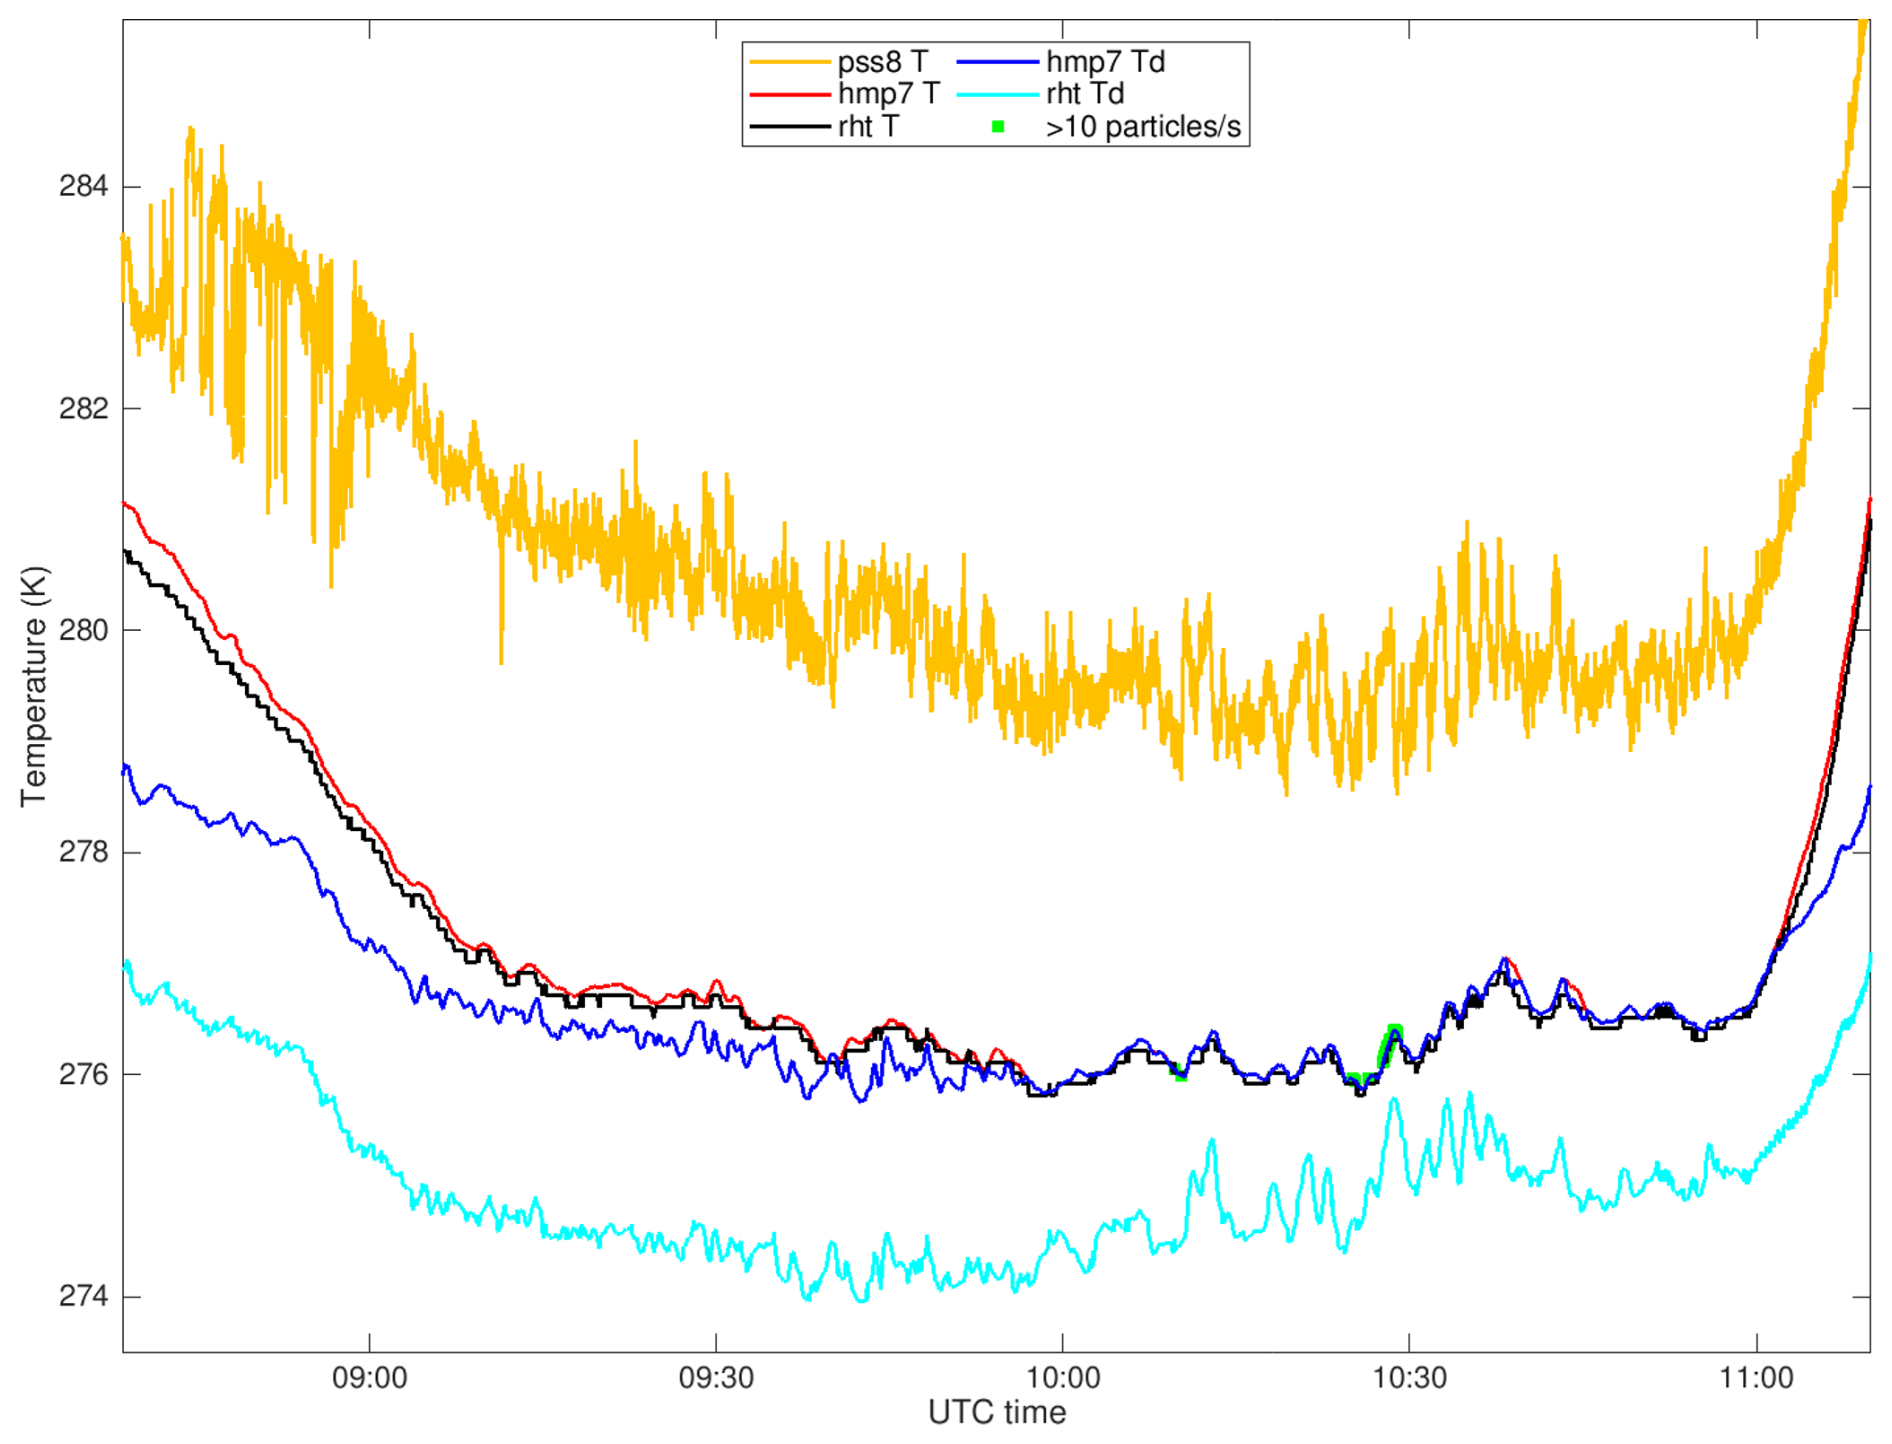
Figure 4Temperature (orange, red and black lines) and dew point temperature (blue and cyan lines) measured by or calculated from different MPCK+ sensors for Flight 20220925.0839 as a function of time. Shown are temperature data from the pss8 system (orange), temperature data from the hmp7 sensor (red), temperature data from the rht sensor (black), dew point data from the hmp7 sensor (blue), and dew point data from the rht sensor (cyan). In addition, the green squares indicate times when the FCDP measured 10 or more particles larger than 10 µm, which indicates the presence of a cloud.
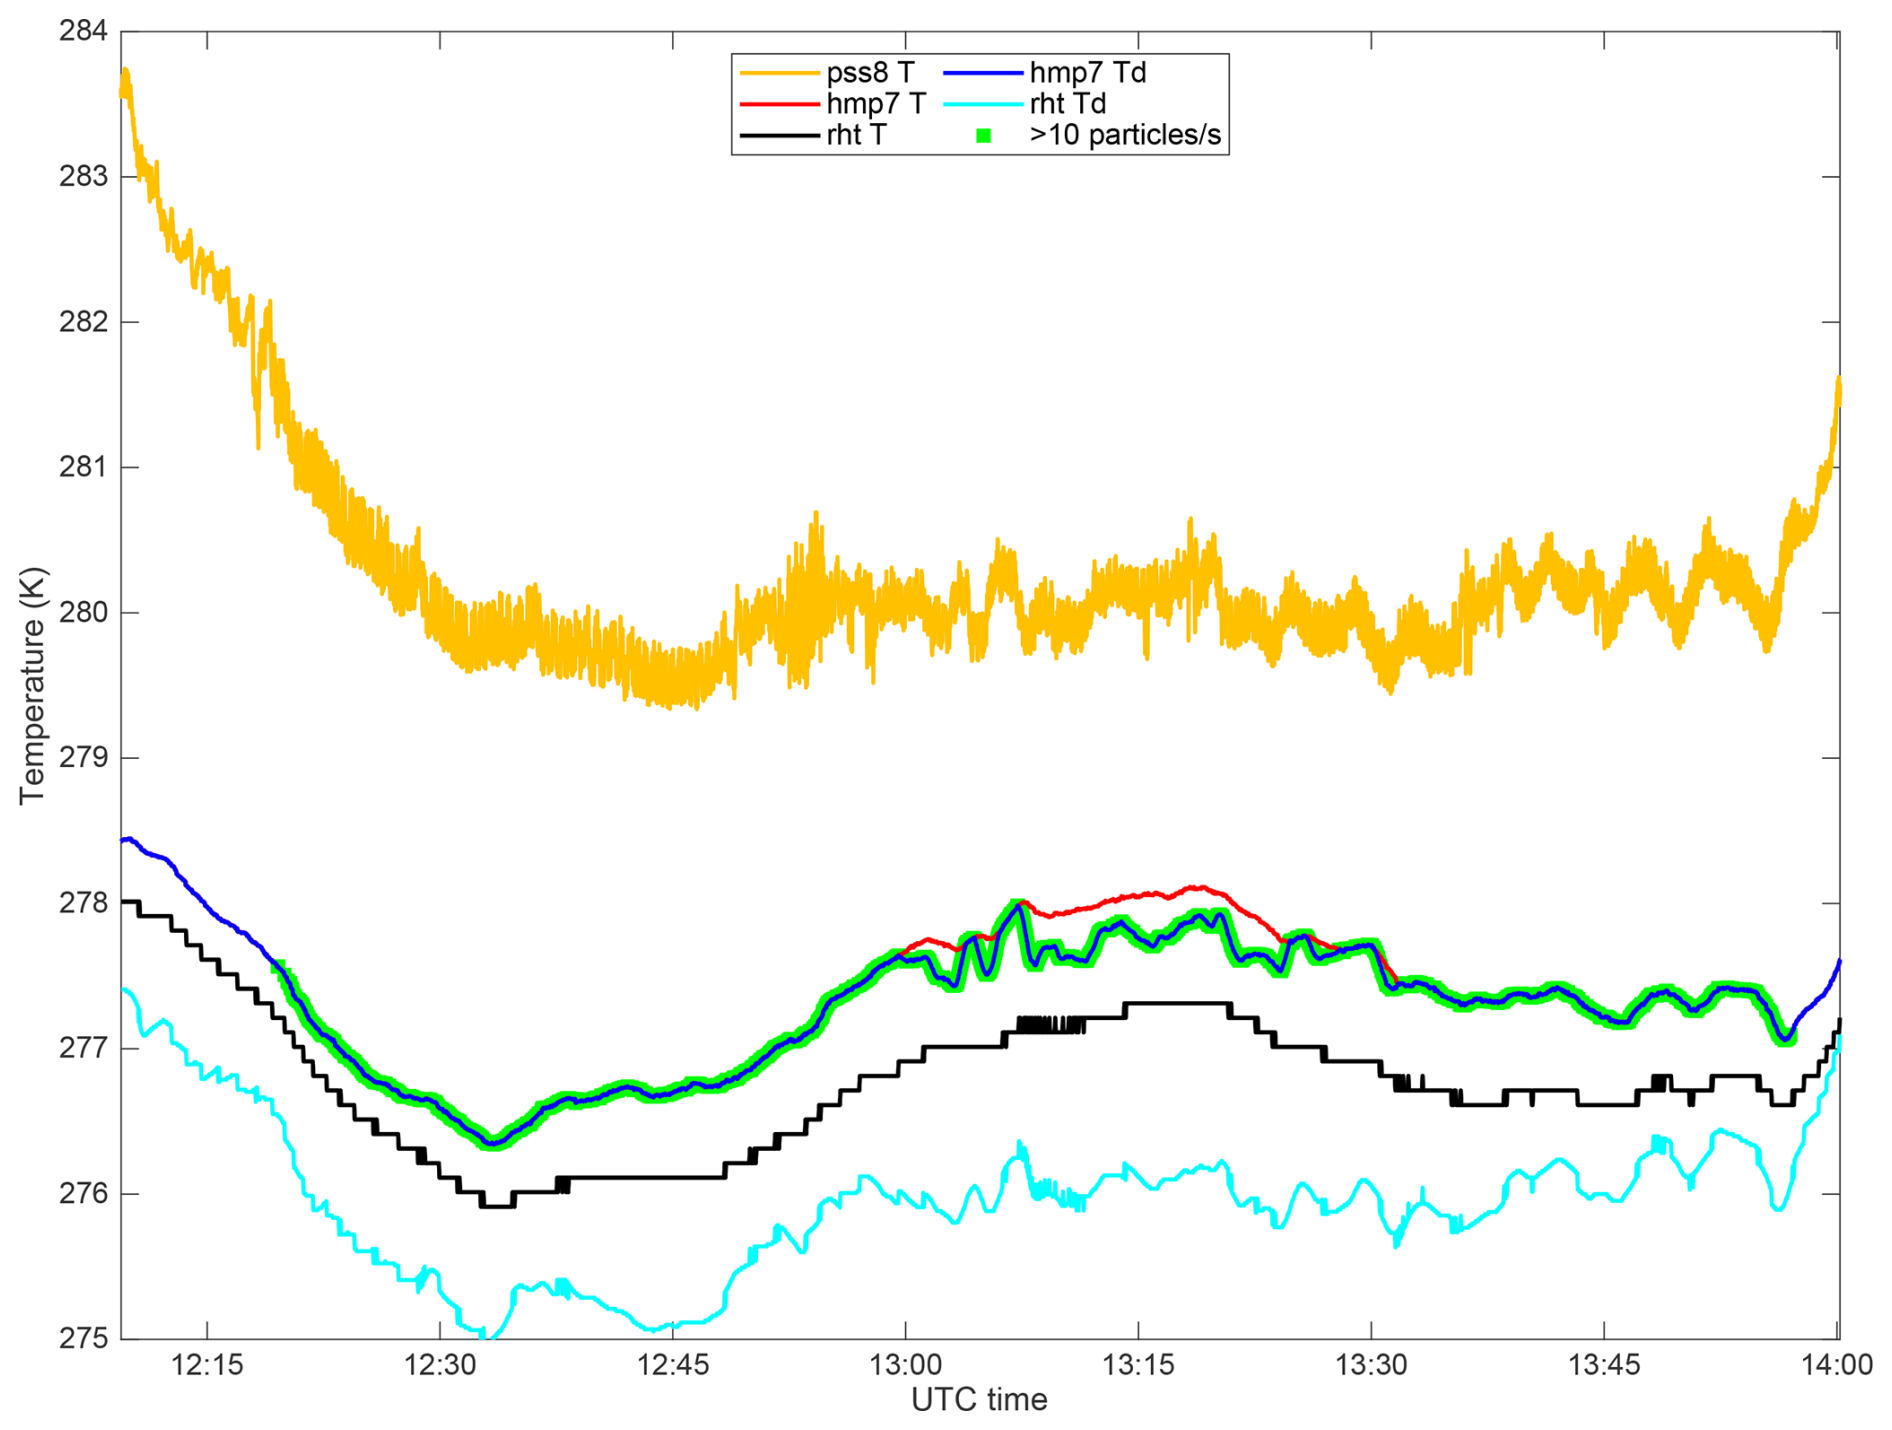
A different example is shown in Fig. 5 for Flight 20220926.1209. Here, the instrument was flying in clouds for most of the flight time. Again, we see little deviation in the temperature data between rht and hmp7. The strong deviation in the dew point temperature is about the same as in the previous example, and also here, the dew point from the hmp7 sensor is more trustworthy than the dew point data from the rht sensor. Based on the results shown in Figs. 4 and 5, we decided to show only rht temperature, hmp7 dew point and ground station temperature in the following graphs instead of plotting data for each individual sensor.
3.4 In-situ measurements with and without clouds
In this section we present example time series data from the different sensors of MPCK+ during two selected flights. One of them was without clouds at the instrument altitude, during the other one the instrument was inside the cloud throughout most of the flight time.
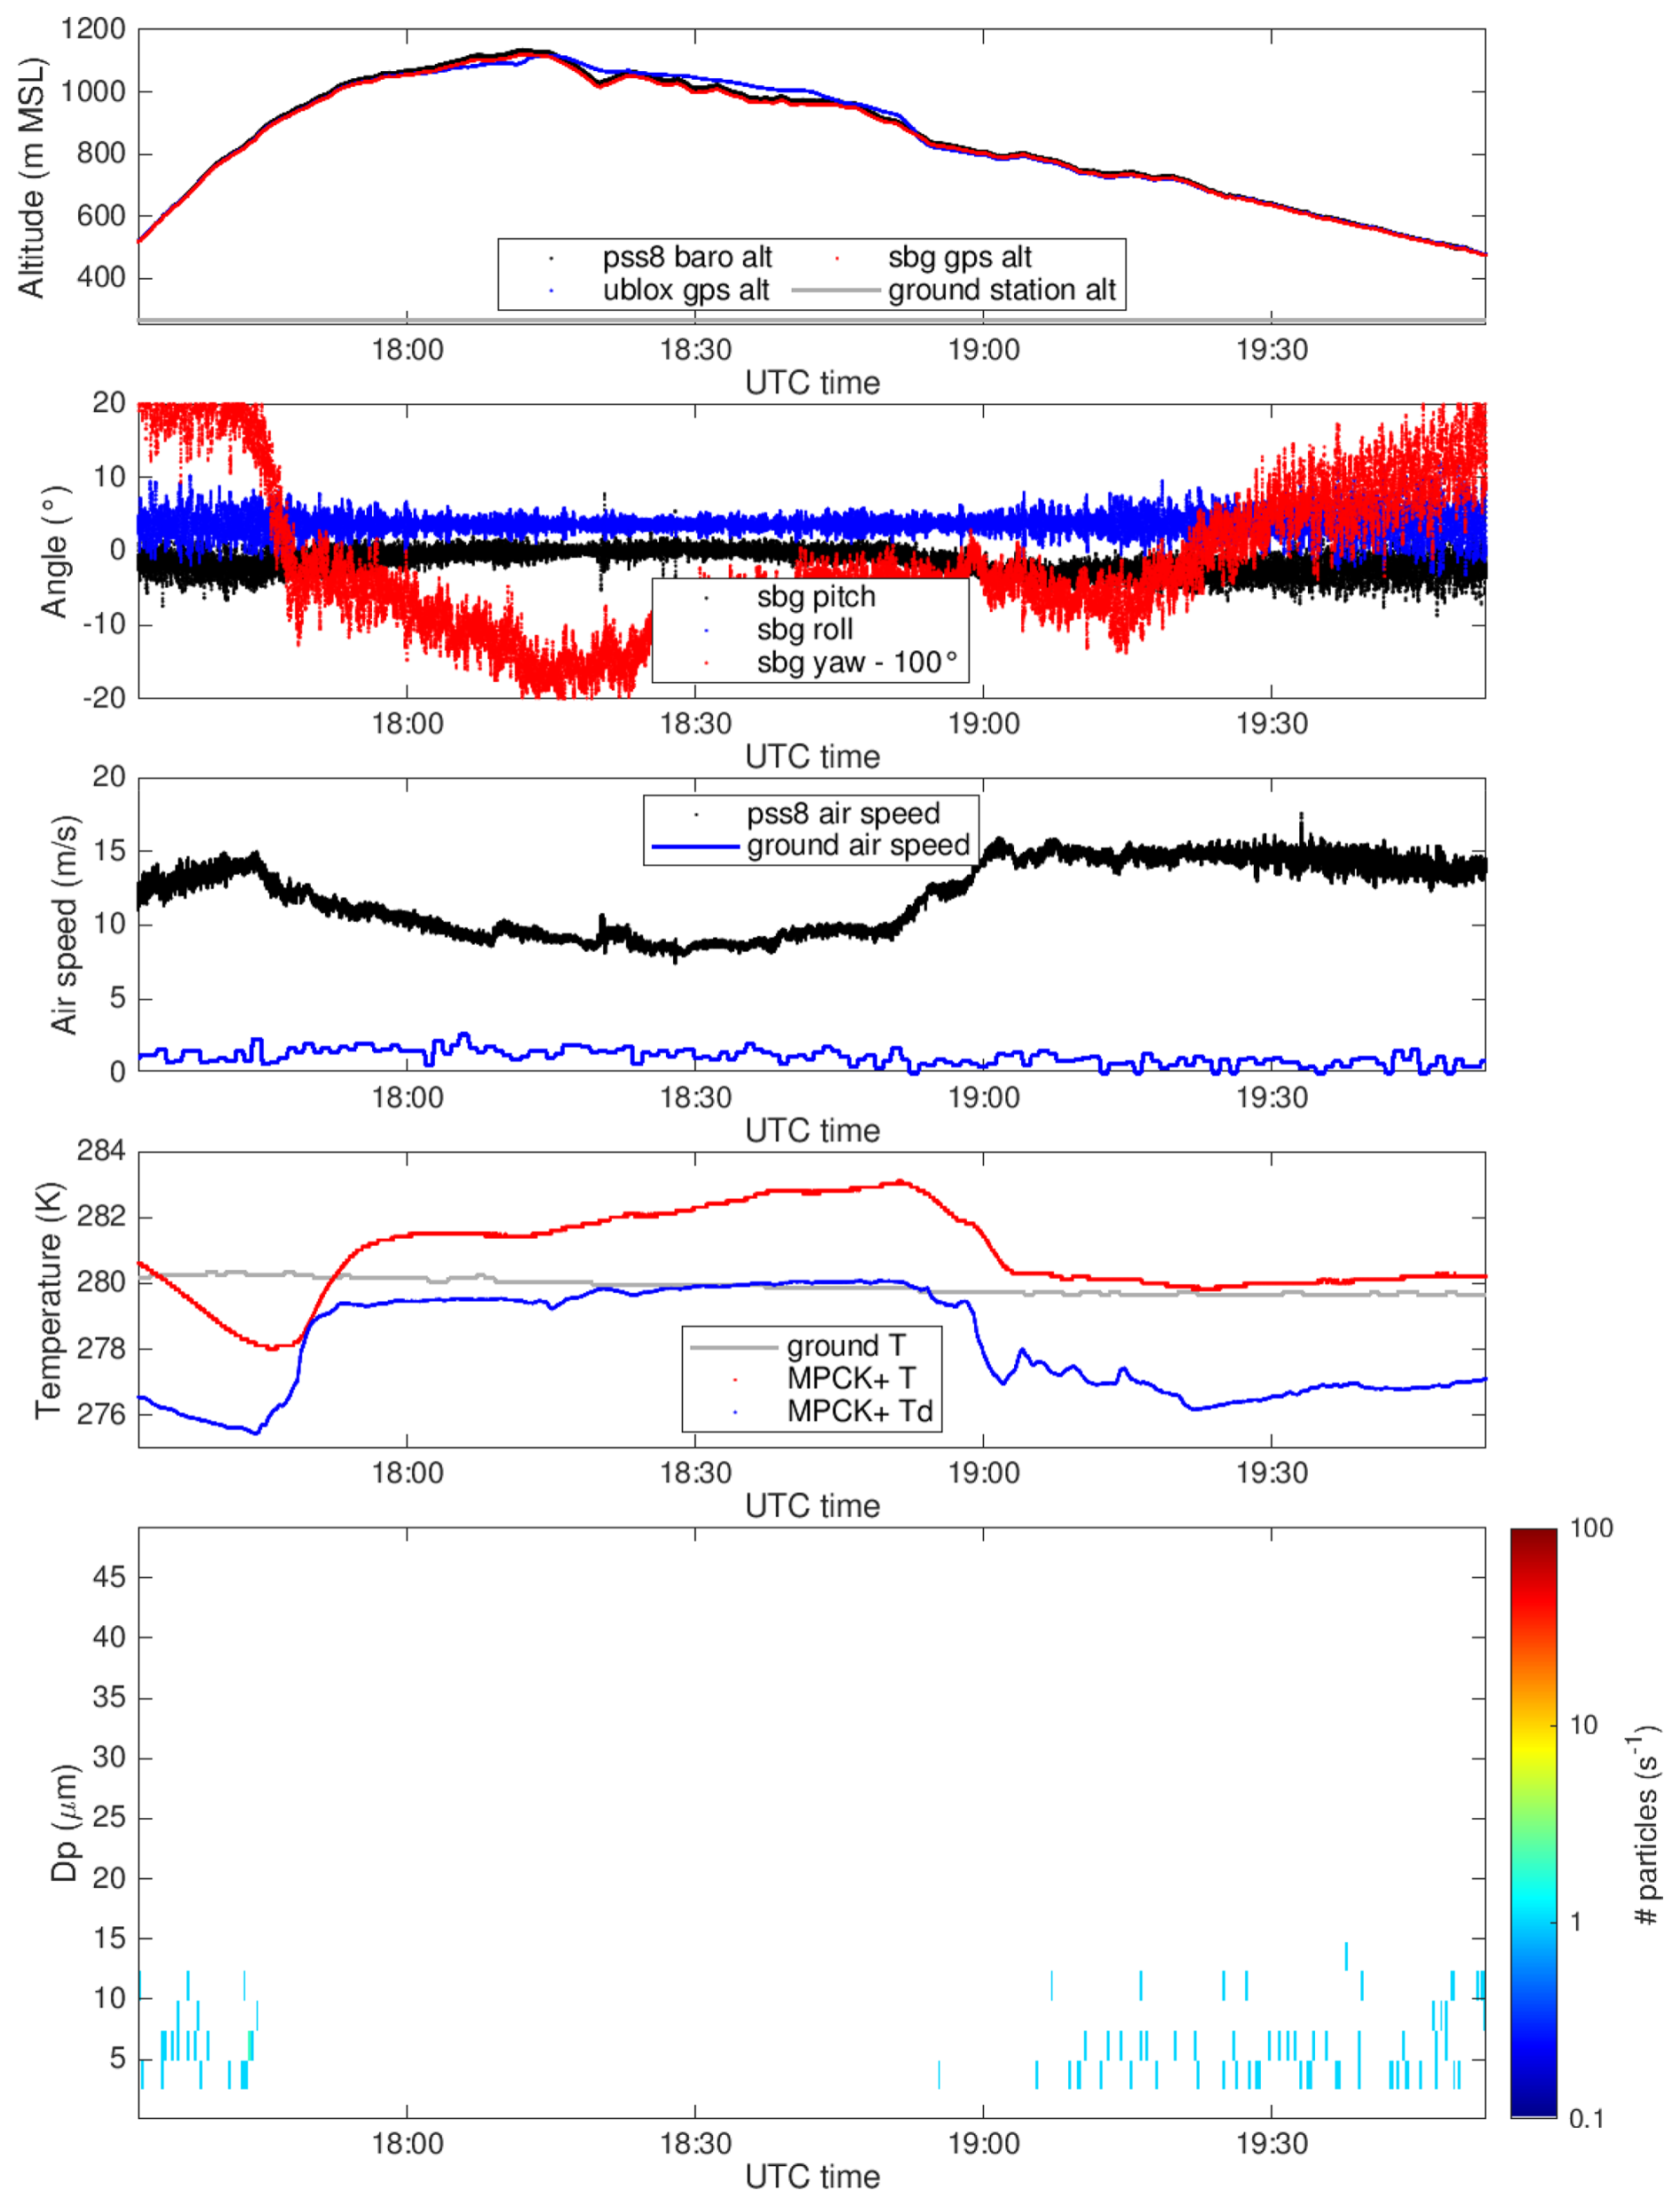
Figure 6Time series data of altitude measurements (top panel), platform orientation (second panel), wind speed (third panel), temperature and dew point (fourth panel), and particle size and concentration measured by the FCDP (bottom panel) during Flight 20220921.1721. Instrument and quantity names in panels (1)–(4) are mentioned in each legend. All times are presented in UTC, with local time being UTC+3 h.
One example of data from a flight without clouds and precipitation (Flight 20220921.1721) is presented in Fig. 6. The barometric altitude and GPS altitude in the top panel have little deviation before 18:10 and after 18:50 UTC. In between, there is a deviation of 15 to 20 m between the sbg altitude and ublox altitude, which is at least partly due to the fact that the sbg has a dual-band GNSS. The second row of Fig. 6 shows the pitch and roll angle of the MPCK+. At lower air speed (around 10 m s−1 visible in the third row of Fig. 6), the instrument orientation is almost ideal (pitch angle close to zero, roll angle slightly positive). With stronger wind, the pitch angle becomes negative, but no more than 10°. At these angles, the velocity measurement is not impaired by non-ideal platform orientation. In comparison to the wind speed at ground level (blue line in the third row of Fig. 6), the upper air wind speed is between 8 and 15 m s−1 higher. The second to last panel in Fig. 6 shows temperature and dew point as defined in the previous section along with the temperature measured by the ground station. The bottom panel in Fig. 6 shows the particle size and concentration measured by the FCDP as a function of time. There are particle counts at low concentration between 3 and 15 µm particle diameter, which most likely correspond to a few large aerosol particles. These particles were present below 800 m a.m.s.l.
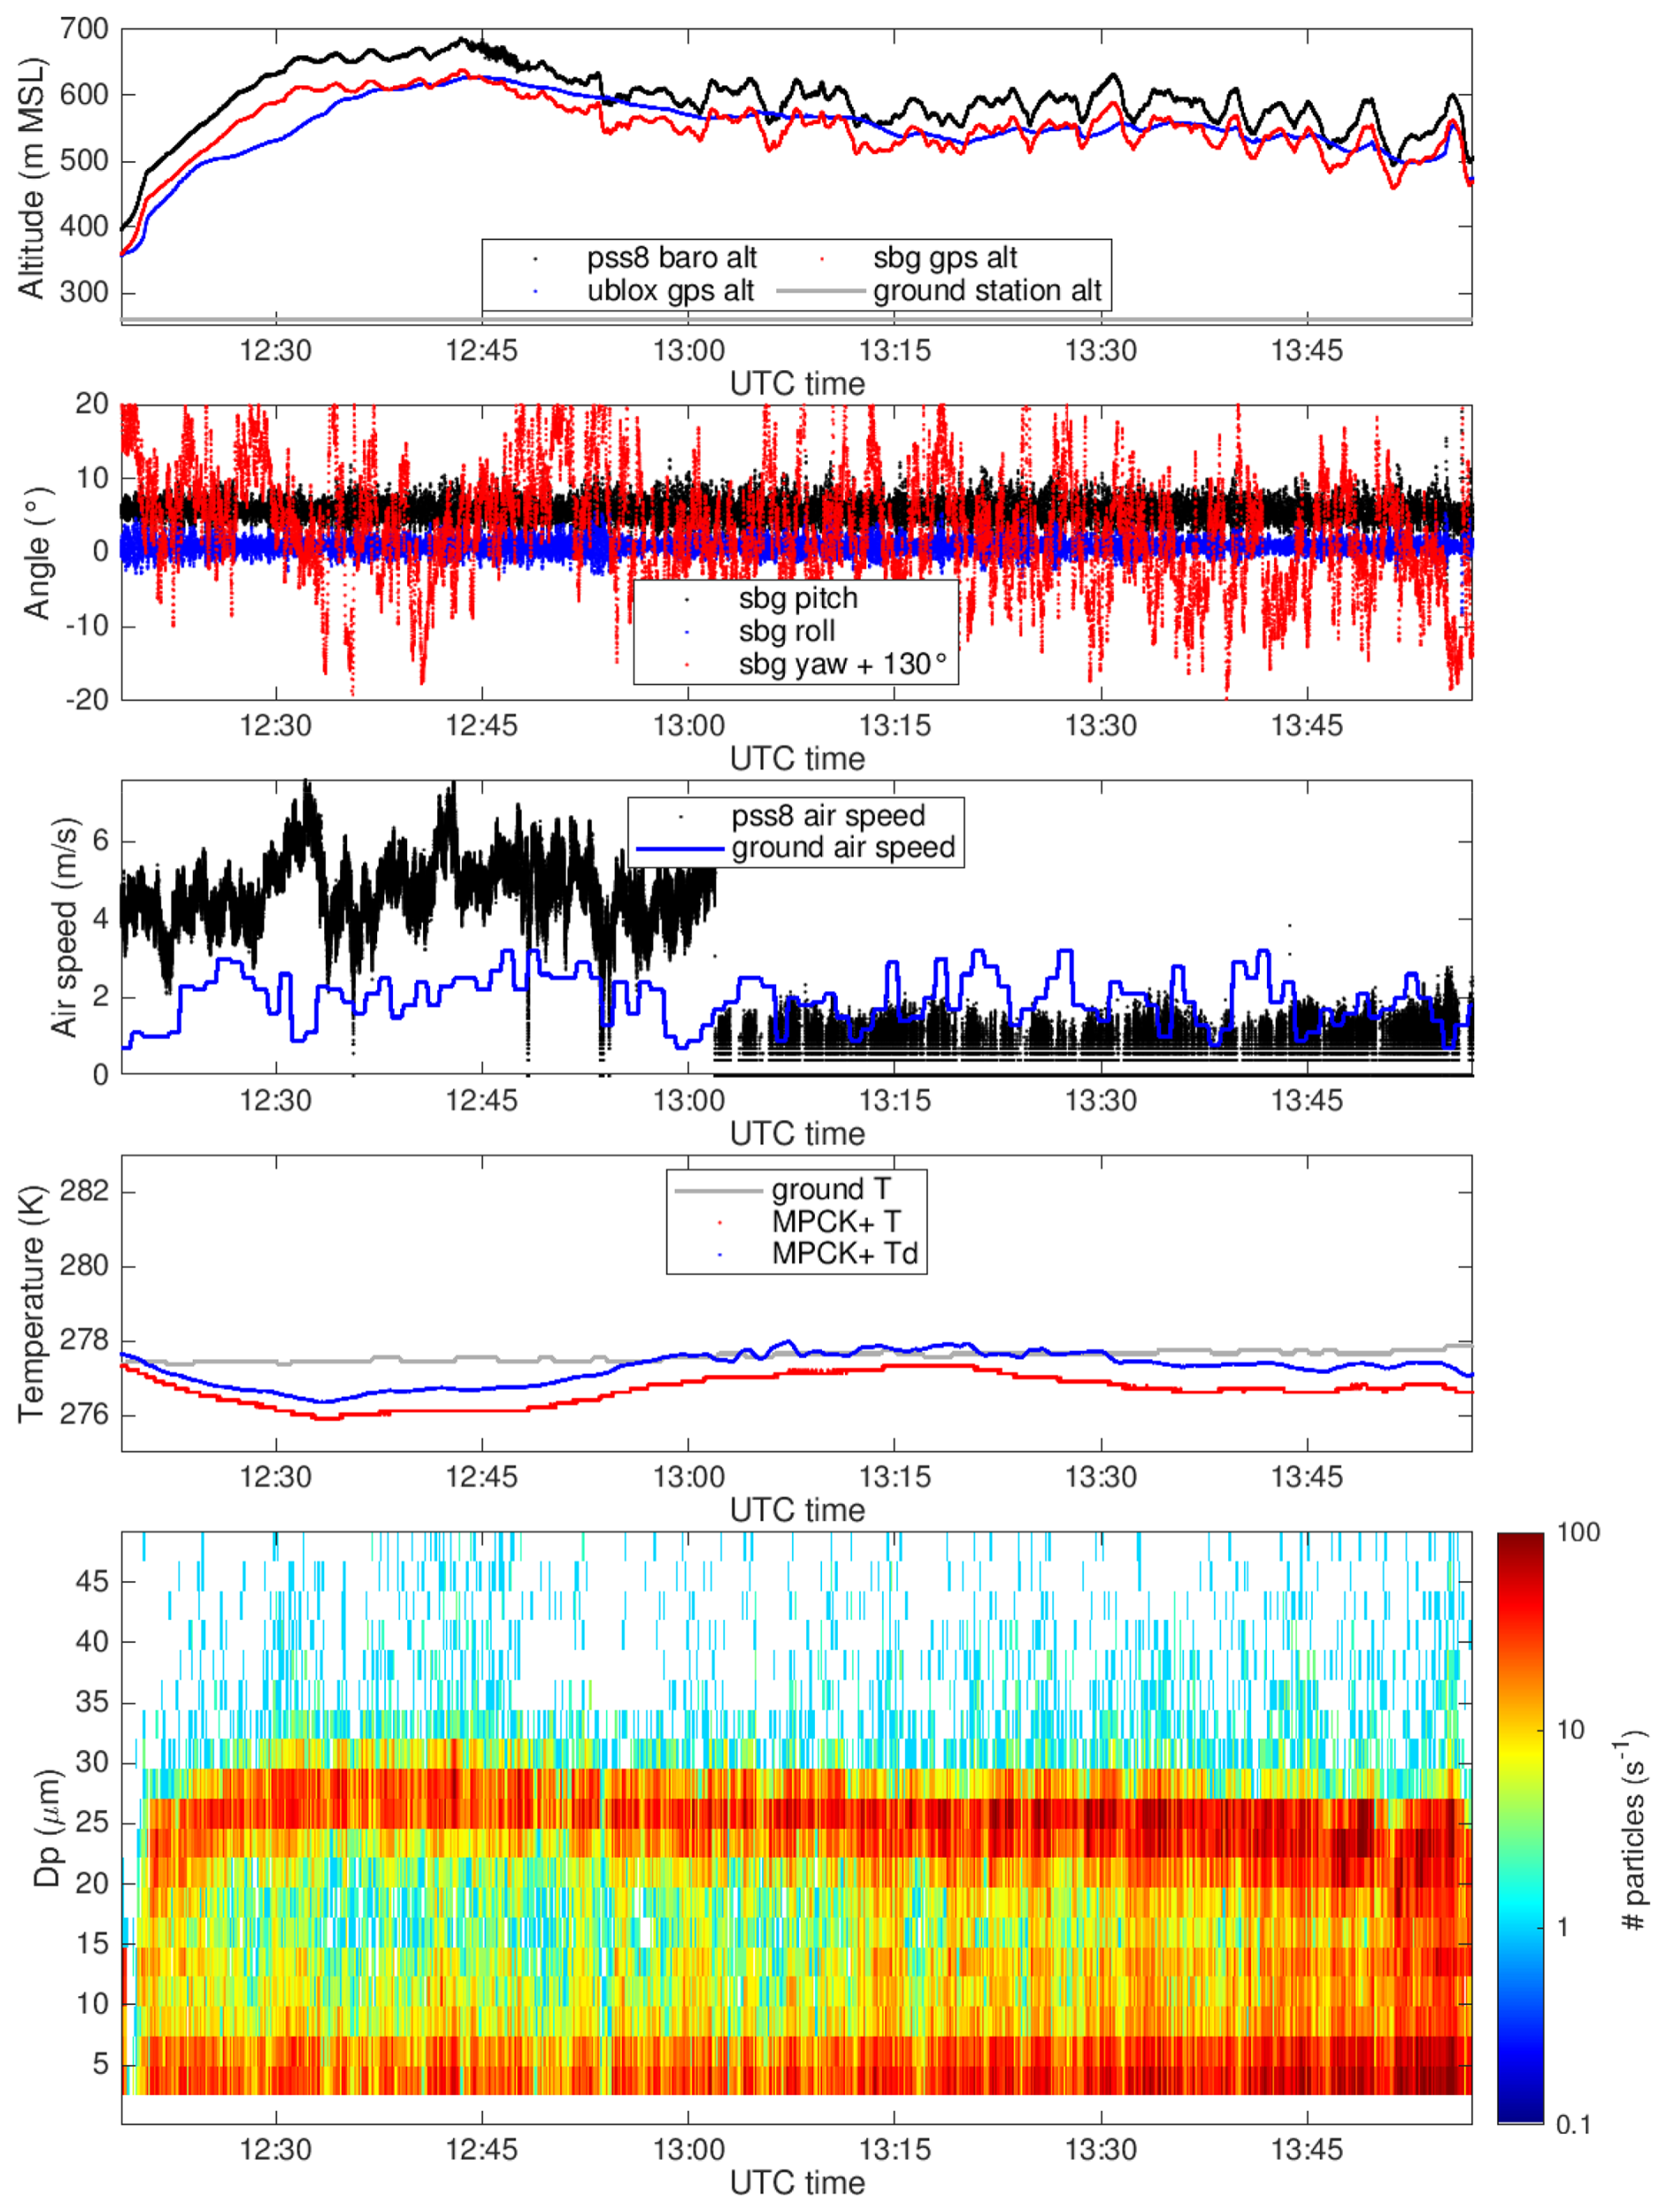
In contrast to Flight 20220921.1721, Flight 20220926.1209 was mostly inside clouds as shown in Fig. 7. This is indicated by much higher particle concentration in the FCDP data. The cloud base was reached only about 70 m above ground during this flight, and particle data from the FCDP indicate a bimodal cloud droplet size distribution (CDSD) throughout the sampled cloud portion. The primary mode is around 5 µm, while the secondary mode is around 20–25 µm. There is also a strong signal of particles larger than 40 µm diameter, which may be attributable to those droplets that turn into drizzle by collision and coalescence. The analysis of the entire CDSD of this cloud, including droplets larger than 50 µm, is subject to a follow-up study with additional data from the inline holography and PIV units. The dew point stays slightly above the temperature during the entire time series of this flight, which indicates water-saturated to water-supersaturated conditions. However, the trend in air speed measured by the pss8 around 13:00 UTC is artificial as the tubing of the system got clogged by cloud water. Such events need to be identified manually as there is no sensor within the system which could automatically detect water inside the tubing. The instrument orientation was very stable in pitch and roll angle, but the yaw angle is characterised by sudden changes of more than 30° within a few seconds. Vertical wind shear and convection may partly explain this trend, as the balloon might have been exposed to a different wind speed and direction than the MPCK+.
3.5 Temperature and humidity profiles
In addition to the time series data, the vertical profile data of temperature and dew point allow some conclusions about the meteorological situation during the measurements. For all eight flights, these profiles are summarised in Fig. 8. In the data of Flight 20220921.1721 we see an almost isothermal layer from the ground to 800 m altitude above mean sea level with an inversion layer between 800 and 900 m altitude. While the FCDP data in Fig. 6 indicate few particles below 800 m a.m.s.l. (which is about 500 m above ground), there are no particles detected at higher altitude. So we can conclude that the aerosol particles in the boundary layer did not reach the free atmosphere during this measurement. Two more contrasting examples are Flight 20220923.0914 and Flight 20220925.0839 as the temperature profile decreases with altitude and the dew point data indicate water-saturated conditions at some altitude. During these two days, there was cumulus convection and a few clouds were sampled with the MPCK+. The trend in temperature and dew point during Flight 20220926.1209 is quite interesting as the data indicate a rapid cooling around 270 m above ground. However, for flights 20220926.1209 and 20220926.1712, the dew point temperature is about 0.5 K higher than the air temperature, which is unphysical. This discrepancy can be attributed to measurement uncertainties arising from the combination of two sensors used to derive and correct these quantities, leading to a systematic bias in these two flights, both conducted in near-saturated conditions.
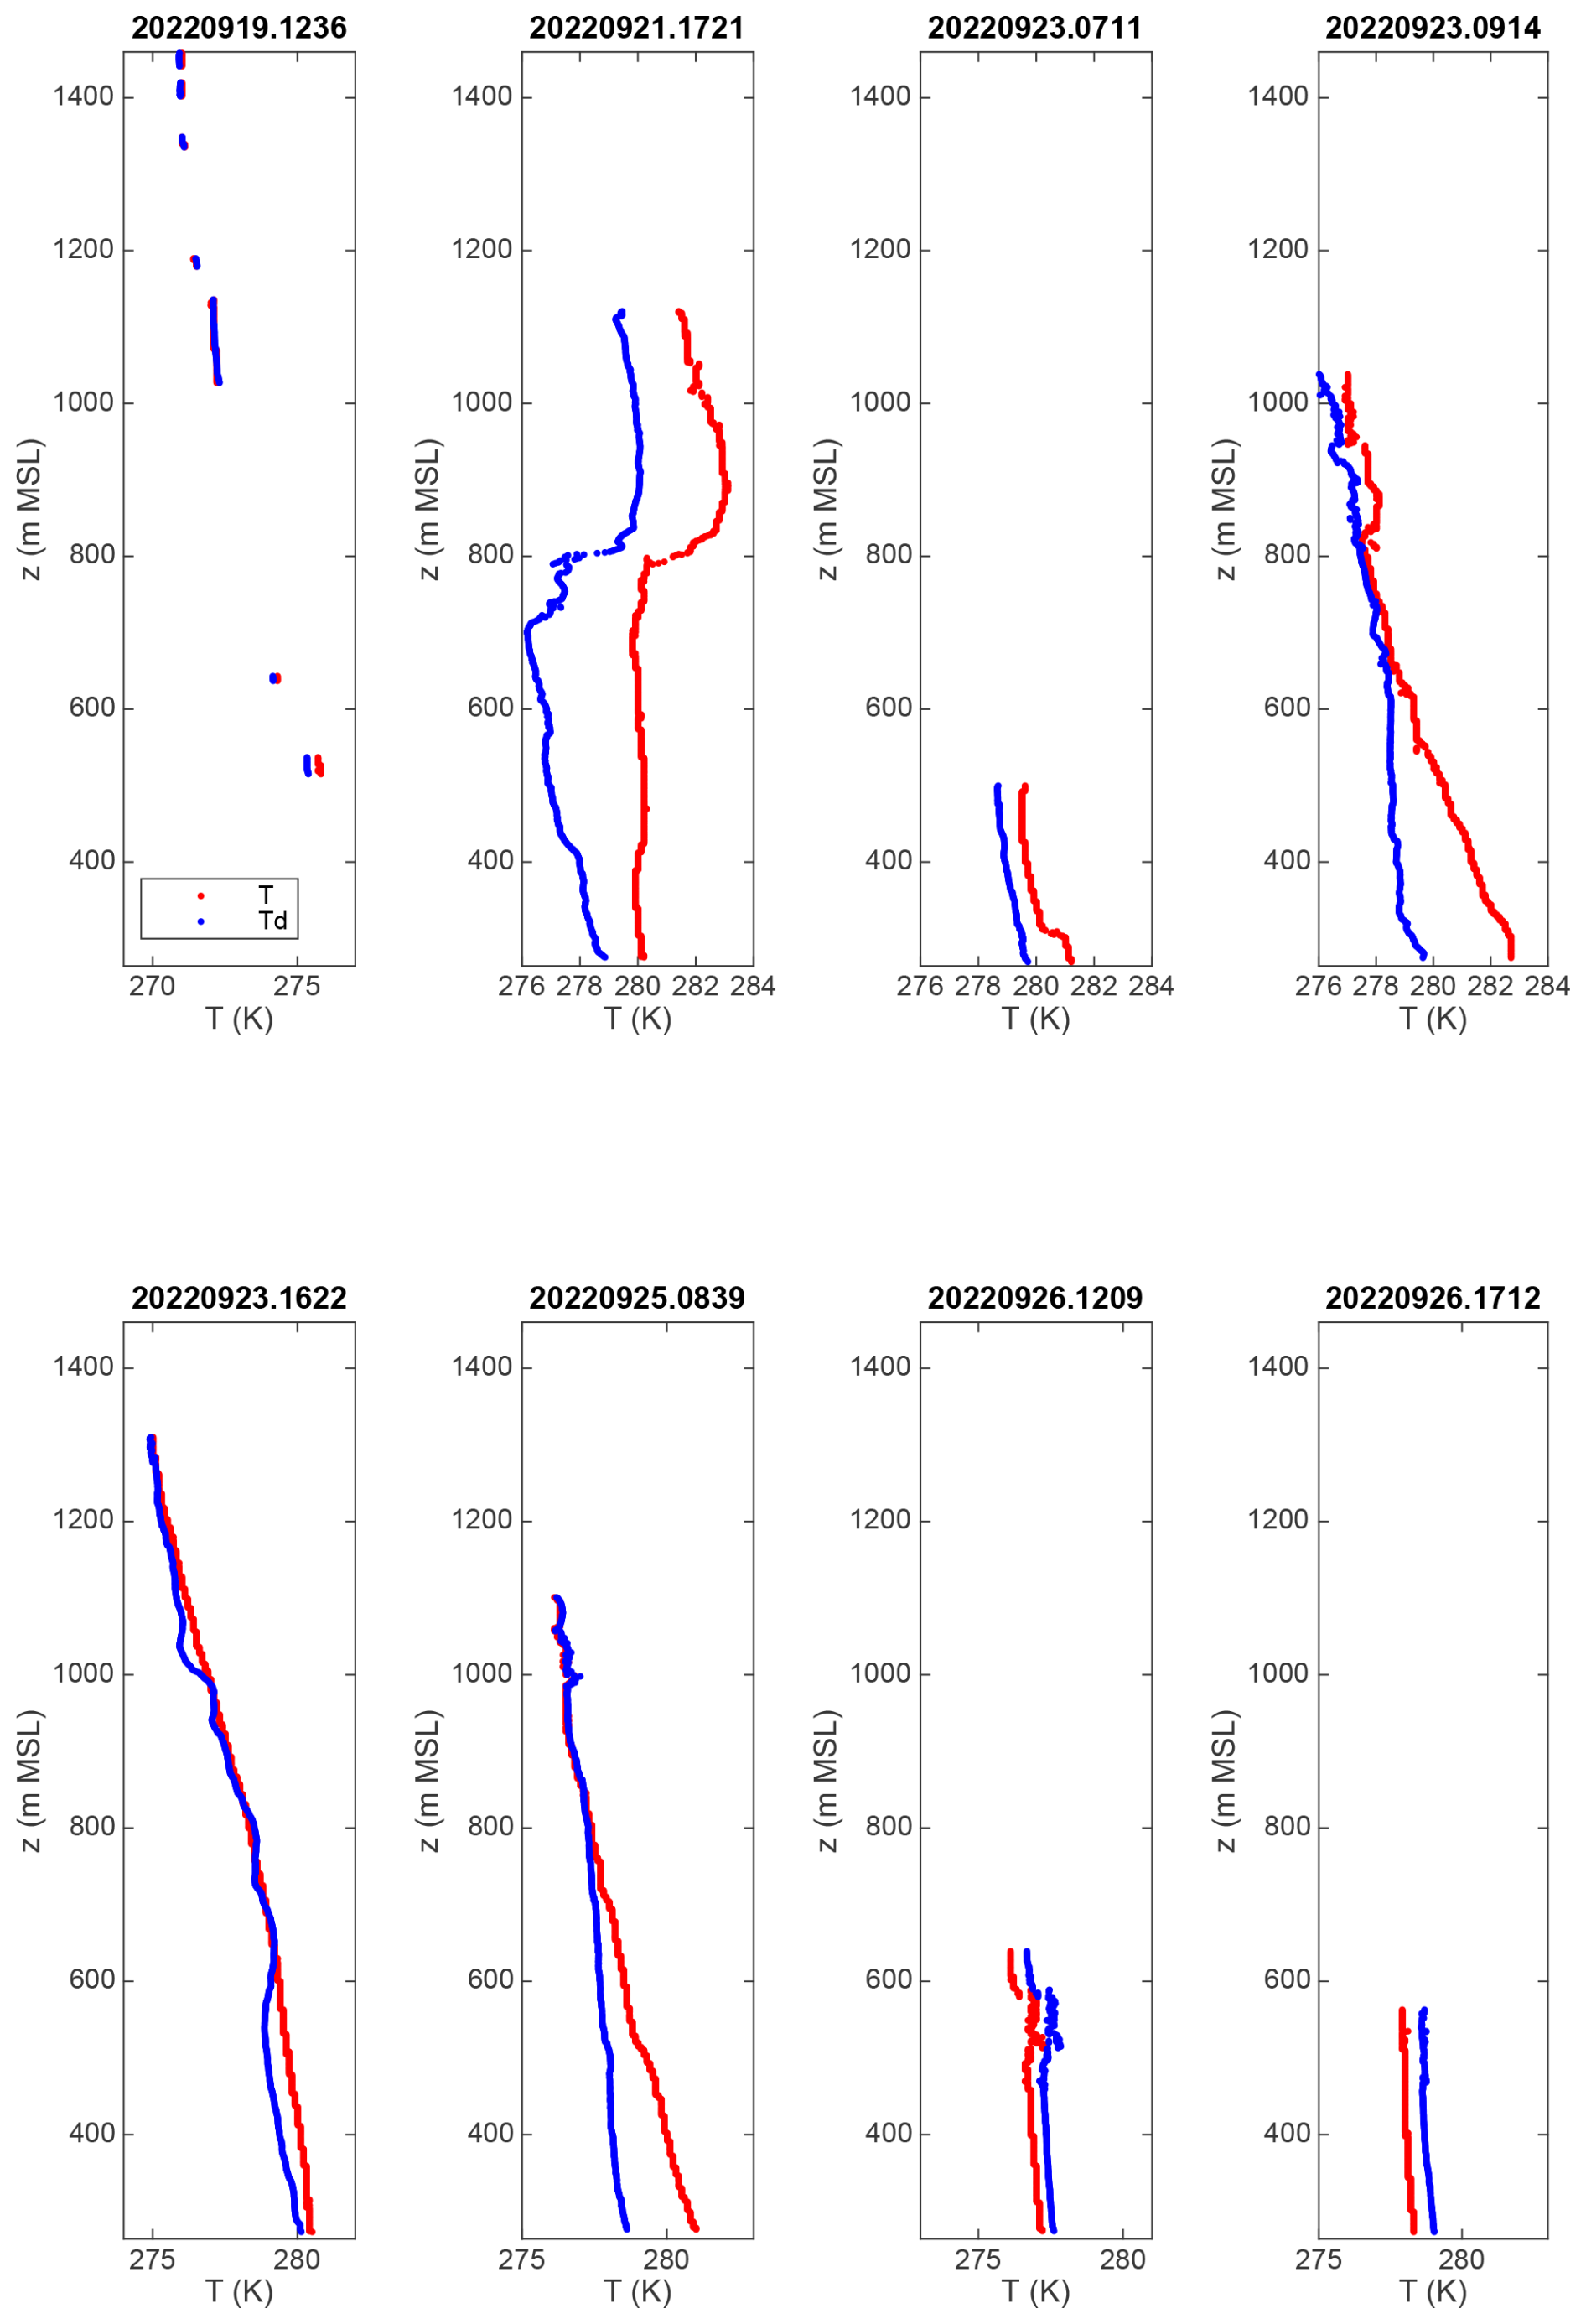
Figure 8Vertical profiles of temperature and dew point for all eight MPCK+ flights. Shown are temperature (red) and dew point (blue) as defined in Sect. 3.3 as a function of GPS altitude above mean sea level. The flight names are given in the title of each panel.
3.6 Examples of holography data
As already mentioned in the data description, the published data set does not contain holograms or processed holograms from the MPCK+ holography unit. Nevertheless, we would like to show an example of the particle data that can be derived from a single image. Details about the hologram processing and data extraction are presented in Thiede et al. (2025b). Figure 9 displays the position of each droplet with colour-coded diameter in the top panel, and the logarithmically weighted droplet size distribution in the bottom panel. Each dot in the top panel represents one droplet. This allows a detailed look into the spatial distribution of droplets to examine droplet clustering, the presence of vortices or other phenomena which are not accessible by one-dimensional data from e.g. FCDP measurements. The droplet size distribution in the bottom panel has its maximum close to 20 µm and another local maximum around 40 µm, which is in agreement with the droplet size distribution measured by the FCDP (compare the red and the blue curve in Fig. 9). The primary mode around 5 µm droplet diameter in the FCDP data is too small to be measured by the holography unit, as its effective pixel pitch is 3 µm and objects smaller than 2 pixels in diameter are not distinguishable from background noise. As found in previous studies, the droplet concentration measured with the holography unit is in the same range as the FCDP data for particles with at least 11 µm diameter. On the other hand, we see a statistical effect when comparing the particle concentration around 40 µm diameter: There was one droplet in the holographic sample volume of 8.6 cm3 within this size bin whereas the FCDP detected two droplets in a volume of less than 1.5 cm3. The size distribution statistics from the holography unit are more robust compared to the FCDP data, thanks to the sample volume, which is about 6 times larger. The effect of counting statistics is also visible in the shaded area and in the FCDP median concentration in the bottom panel of Fig. 9.
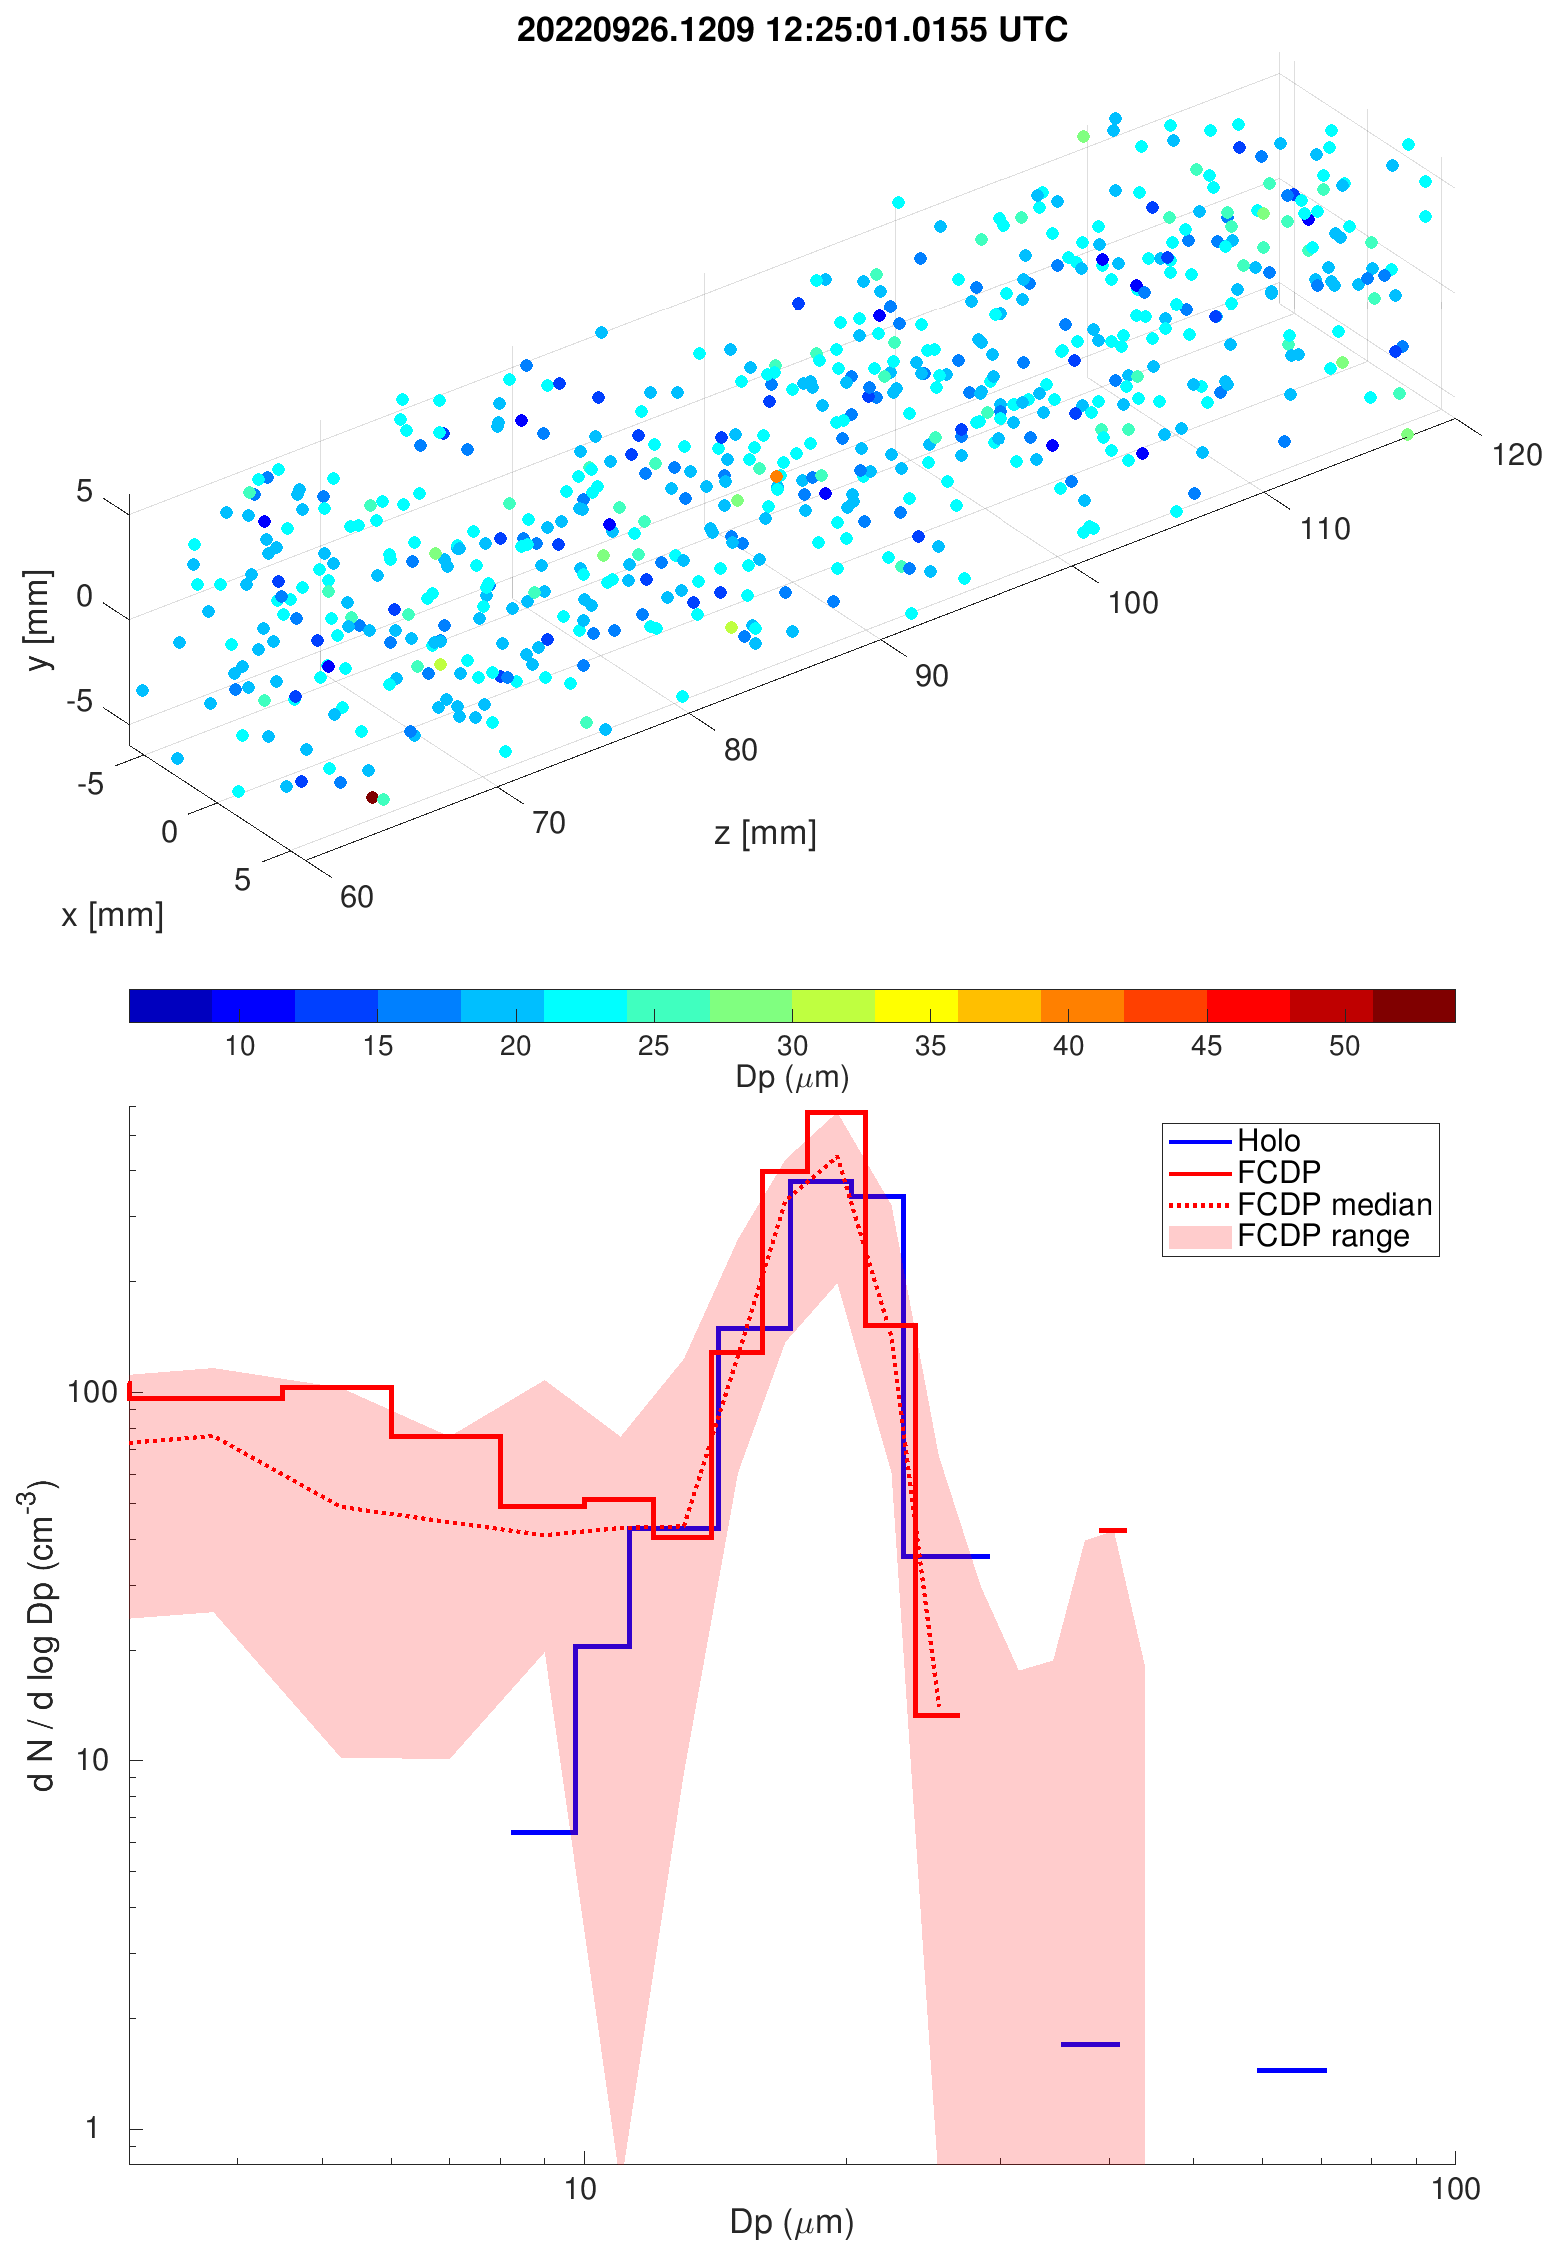
Figure 9Example data from one hologram (number 86 in the series of Flight 20220926.1209) with particle position and colour-coded particle diameter in the top panel, and particle size distribution () in the bottom panel. The blue curve represents the holography data, the red curve represents the FCDP data from the same second as the hologram was taken. The red shaded area reflects minimum and maximum droplet concentration measured by the FCDP from 10 s before until 10 s after the time the hologram was taken. The dotted red curve represents the median concentration of the entire 20 s period of FCDP data. Please keep in mind that the holography data are not included in the netCDF data linked to this paper.
3.7 Platform orientation
The orientation of the MPCK+ measured with the primary (sbg) and backup (powerinterlock) INS is summarised in Fig. 10 and Table 6. Flight 20220919.1236 was excluded from the analysis as the repeated power outages precluded a GNSS fix of both INS. The median pitch angle measured by the sbg device was between −1.6 and +5.9° with the higher values in the last three flights. However, we see the exact opposite trend in the roll angle statistics with higher angles in the first five flights. The agreement between sbg and powerinterlock is better than 1° for the median pitch and roll angle. The highest variability, as expressed by the standard deviation, is seen in the yaw angle statistics. As the yaw angle is primarily determined by the course of the Helikite, wind shear in the boundary layer may contribute to the high variability. The histograms in Fig. 10 show a relatively narrow angular distribution with a full width at half maximum (FWHM) of 3–6° with a maximum close to zero. We conclude that the orientation of the MPCK+ was stable and nearly horizontal.
Table 6Statistical summary of the measured MPCK+ instrument orientation expressed in Euler angles. Displayed are median, standard deviation (SD), minimum and maximum of each angle from the respective device for 7 of the 8 flights. Data for Flight 20220919.1236 are not shown due to issues getting a GNSS fix.
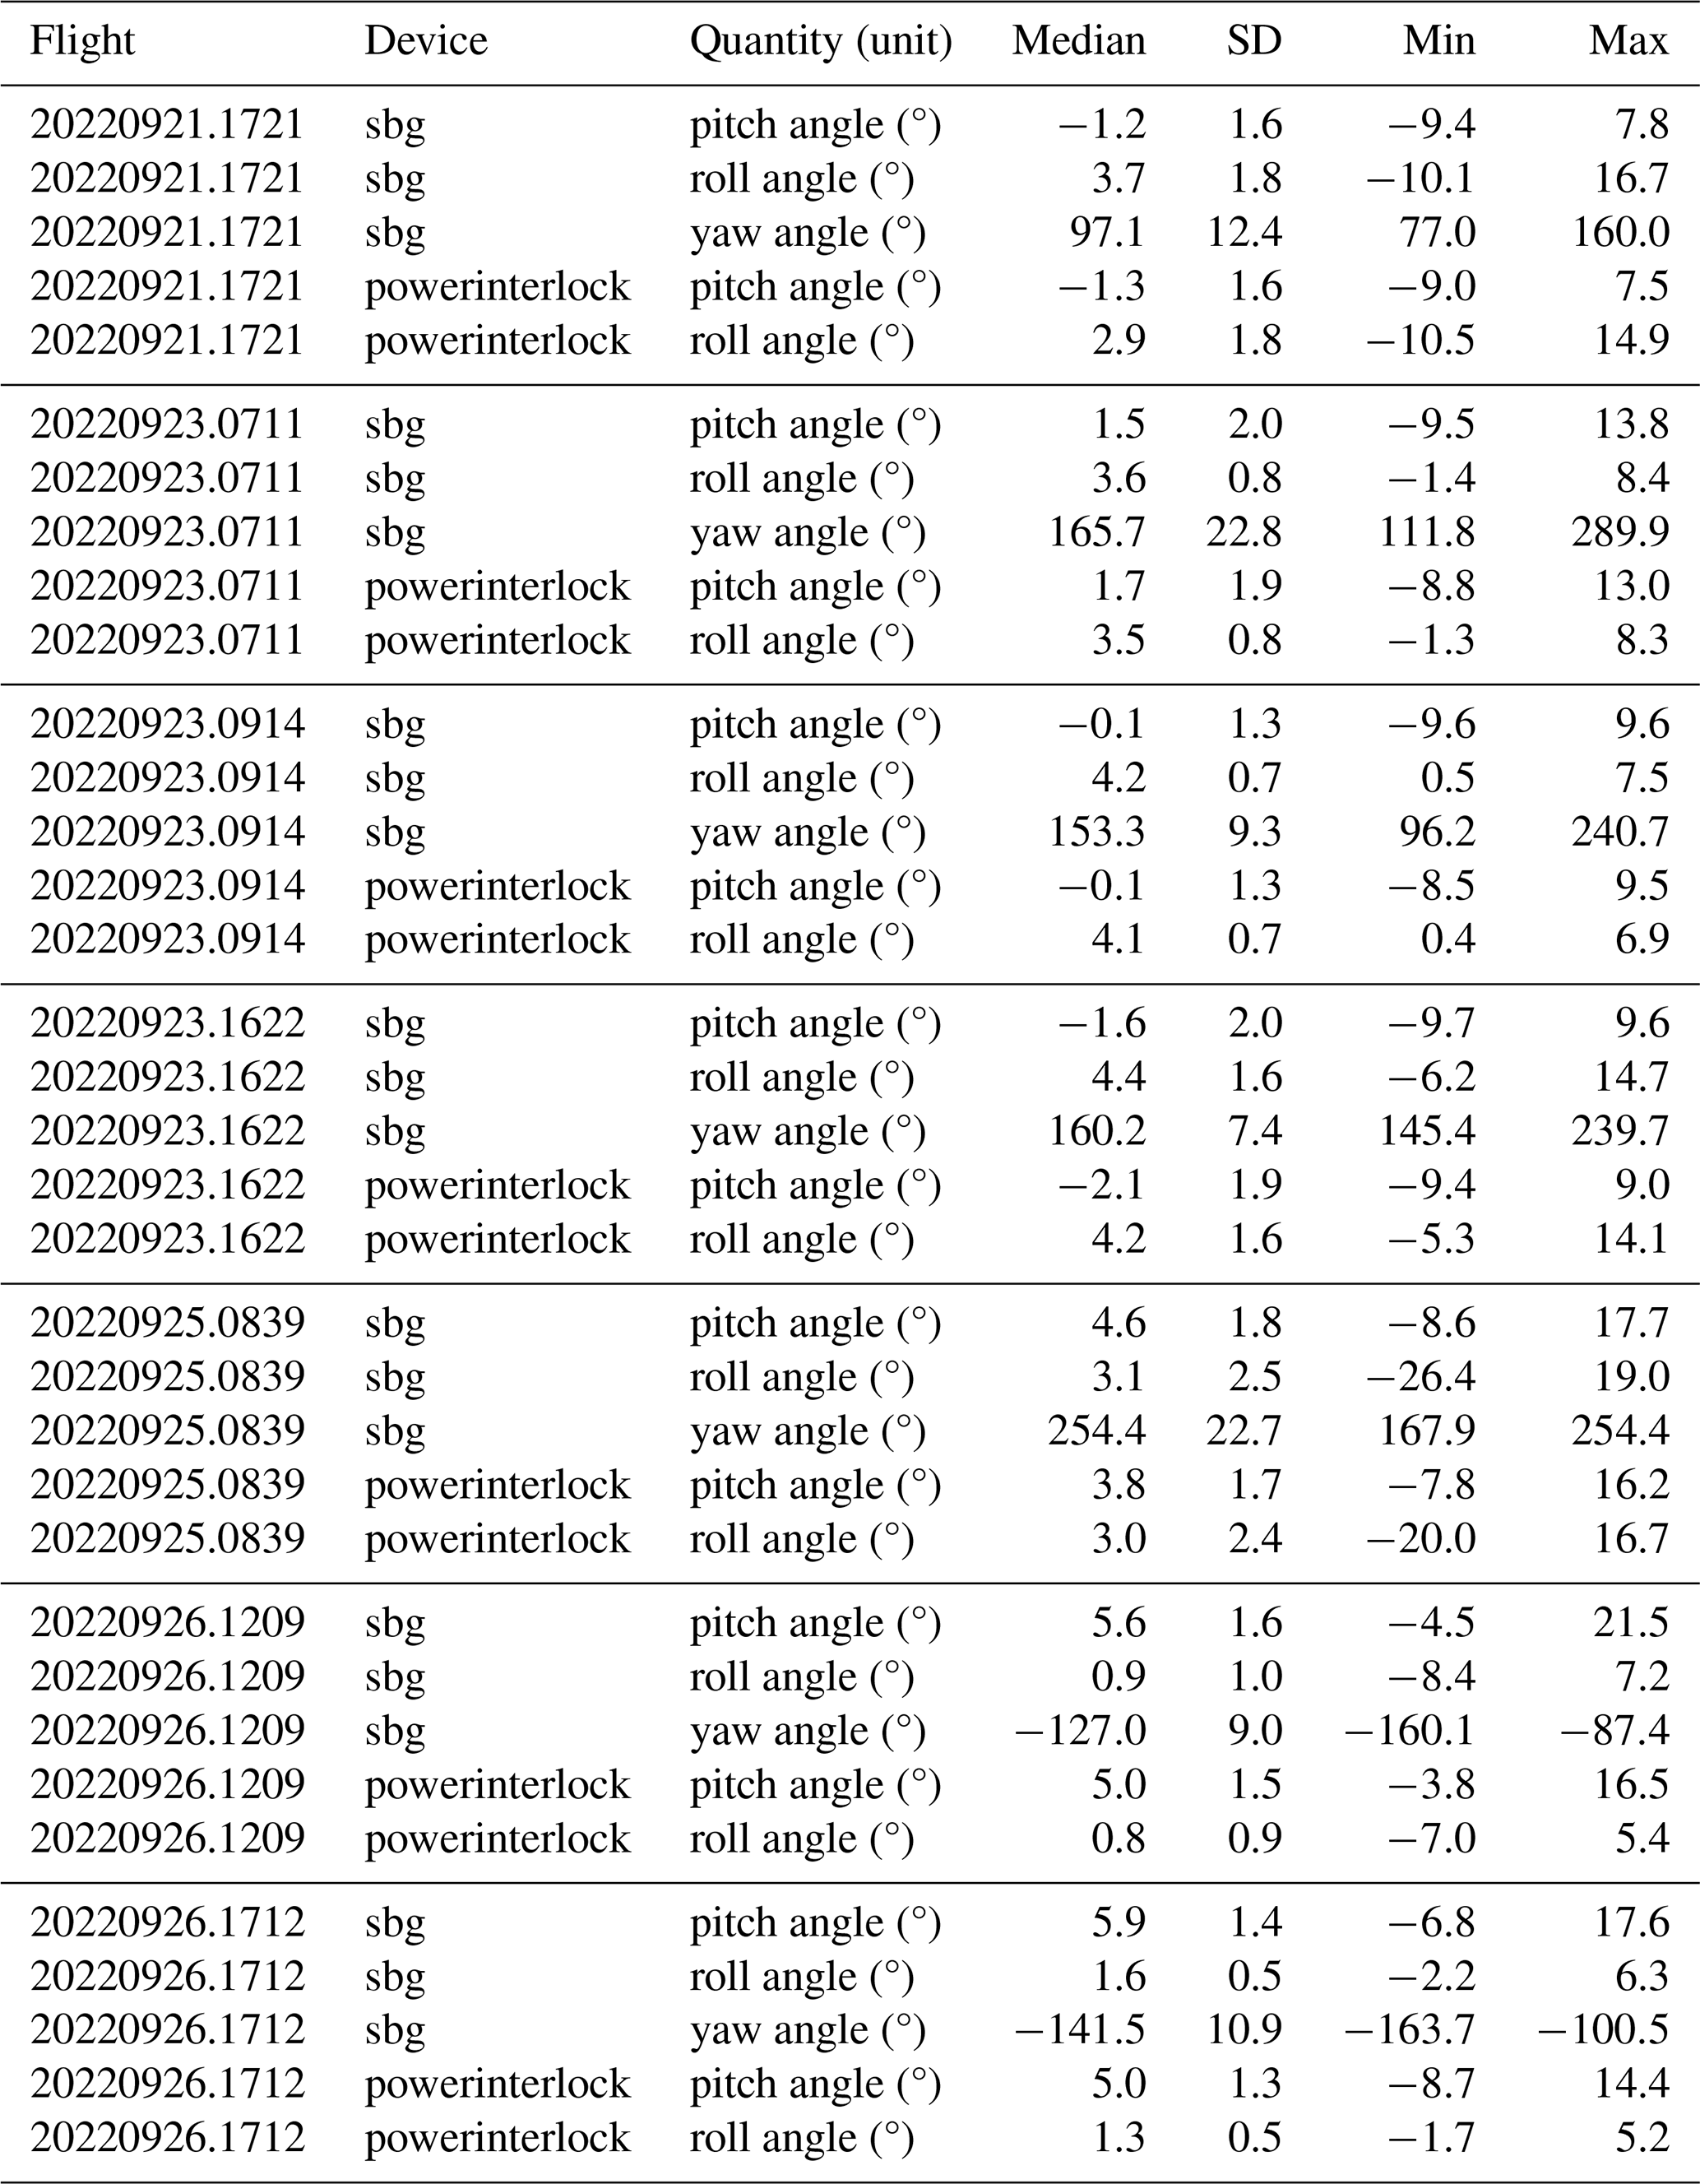
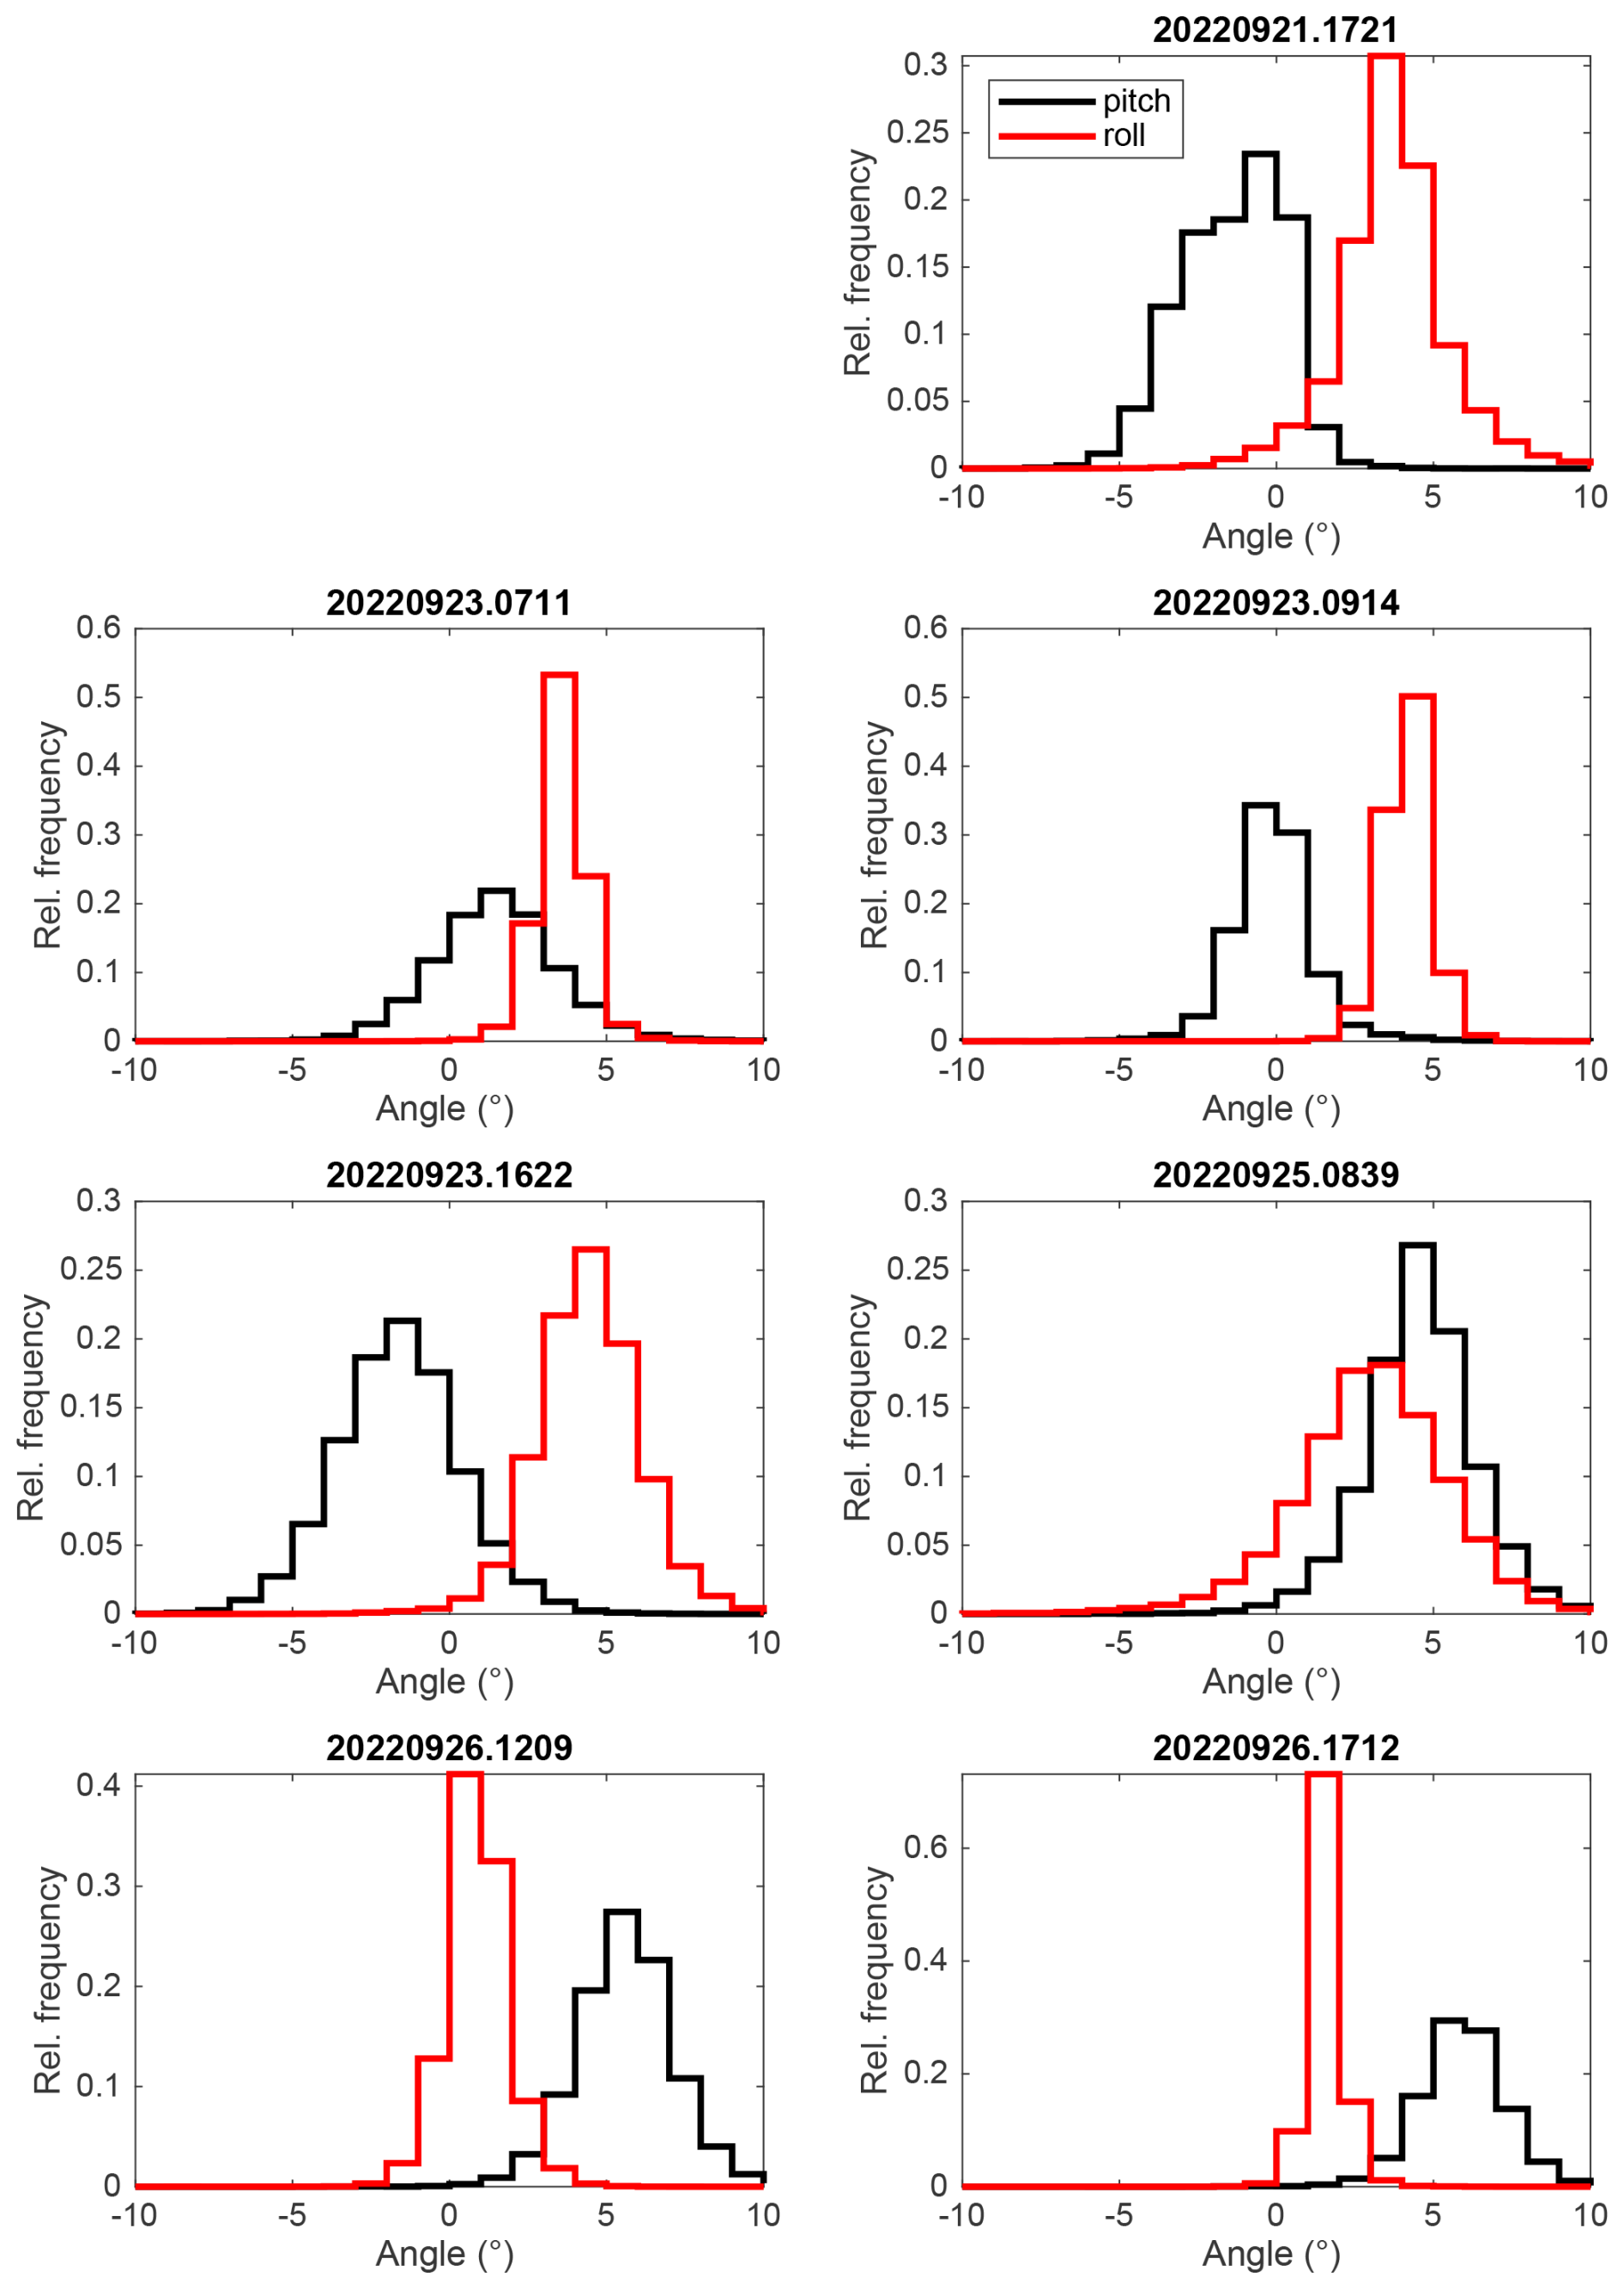
Figure 10Histograms of pitch and roll angle for seven of the eight flights with MPCK+. Data were taken for those times where the MPCK+ was 50 m or higher above the ground.
3.8 Technical Validation
Sensor calibration
The hmp7 sensor was factory calibrated before the field campaign. The rht sensor was temperature calibrated in-house against a calibrated NTC (which was calibrated against a NIST-traceable LakeShore Pt-100 reference thermistor with a calibration uncertainty of ±20 mK). Humidity calibration was done by placing the sensor in a sealed chamber above a saturated brine with both air temperature and solution temperature logged. The humidity fixed points of different salts were taken from Greenspan (1977). We used lithium chloride, potassium acetate, magnesium chloride, potassium carbonate, sodium bromide, sodium chloride, potassium chloride and potassium sulfate in a temperature range between 20 and 25 °C. In addition, we calibrated the rht sensor against water saturation (sensor was placed above a reservoir of distilled water) and against zero relative humidity (air was replaced by pure dry nitrogen). It should be noted that conditions during a balloon flight are different from conditions in an air-conditioned laboratory environment. Consequently, we found deviations from the idealised test conditions in particular in the relative humidity measurements (hmp7 reported too high relative humidity whereas rht reported too low relative humidity). Also, the sensors are not perfectly protected against rain, which can lead to very high relative humidity values even under water-subsaturated conditions.
Plausibility checking and processing
During the Level 1 data processing scheme, the different instrument clocks are synchronised. In addition, the data are parsed and checked for sanity. Missing data or implausible values (e.g. static air pressure below 700 hPa despite a maximum tether length of 2 km) receive a flag to mark these data as not consistent. A quality flag value of 0 indicates valid data.
The barometric altitude of the pss8 device was taken directly from the air data computer. Both pss8 and sbg altitude data show the same trend in the time series, but there is an altitude-dependent offset between them. As the flights were short compared to meteorologically caused changes in surface air pressure, the barometric altitude was corrected by applying a linear correction based on intercomparison with GPS altitude from the sbg device. This results in an absolute accuracy of ±15 m.
All files are archived under individual DOIs at the Zenodo Open Science data archive (zenodo.org) where a dedicated community, Pallas Cloud Experiment – PaCE2022, has been established. The data files are available under the following DOI: https://doi.org/10.5281/zenodo.15700506 (Bagheri et al., 2025a). This community hosts the data files along with additional metadata related to the data sets. Source code (in Python) for reading the netCDF files and plotting some of the core variables is published along with the data files.
The data set derived from the MPCK+ instrument is intended for atmospheric scientists who study turbulence in the atmospheric boundary layer and cloud-turbulence interactions. To get the full picture of boundary layer dynamics and thermodynamics, we recommend combining this data set with the WinDarts and ground weather station data sets published in Chávez-Medina et al. (2026).
The data set provides
-
Examples of clouds in the lower atmospheric boundary layer
-
Inputs for model development
-
Synergies with complementary measurements during PaCE 2022, including remote sensing data, UAV observations, WinDart data and ground weather station data
As already stated in Sect. 3.3, there are some known issues with the temperature and humidity calibration. First, the pss8 temperature sensor is positively biased w.r.t. the temperature computed from the hmp7 and rht sensor. Moreover, the hmp7 sensor is heated, which may lead to a positive bias in temperature. Due to that, we recommend using the temperature recordings of the rht sensor and the relative humidity and dew point data in the corrected_rht data group.
Following the discussion in Sect. 3.1, corrections have been applied to the measured air speed in order to obtain the undisturbed air speed, i.e., the air speed far from the MPCK+. Additional corrections are necessary for computing the FCDP's swept volume, which relies on a further refined air speed. Moreover, the air speed measured by the pss8 and the particle counts recorded by the FCDP differ in both sampling frequency and timestamps, and each data set includes its own validity flags and missing values. Consequently, users must determine how best to interpolate and filter the air speed data when computing droplet concentration. To assist with this process, we provide a Python code sample along with the data that can serve as a starting point. This code applies the required corrections and generates essential variables, including droplet concentration, for those who wish to work directly with the supplied data.
GB, FN and OS designed and assembled the instrument. Mechanical parts and electronics were developed in collaboration with and manufactured by the in-house machine shop and scientific electronics teams. FN, OS, CEB, and EB performed in-situ measurements and collected the data. GB, FN and OS developed the software for data acquisition and data analysis. OS performed the data analysis, prepared the figures and wrote the first draft of this manuscript. BT and OS processed the holograms and analysed the holographic data. FN performed the level 1 data processing and VCM reprocessed the netCDF files for this publication. All authors contributed to writing the final version of the manuscript.
The contact author has declared that none of the authors has any competing interests.
Publisher's note: Copernicus Publications remains neutral with regard to jurisdictional claims made in the text, published maps, institutional affiliations, or any other geographical representation in this paper. While Copernicus Publications makes every effort to include appropriate place names, the final responsibility lies with the authors. Views expressed in the text are those of the authors and do not necessarily reflect the views of the publisher.
This article is part of the special issue “Data generated during the Pallas Cloud Experiment 2022 campaign”. It is not associated with a conference.
We would like to thank David Brus from the Finnish Meteorological Institute for making it possible for us to take part in the campaign and for his active support during our field work. We thank the staff of the MPI-DS machine shop and research electronics group for their support in preparing the components of the MPCK+ instrument, the ground anchors and additional parts necessary for flying the MPCK+. Furthermore, we would like to acknowledge the support by the MPI-DS High Performance Computation (HPC) team in configuring and installing the HPC unit inside the Mobile Cloud Laboratory vehicle. Thanks go to Andreas Kopp and Dr. Artur Kubitzek for organising the campaign logistics, and to Constantin Schettler and Marcel Meyer for operating the MPCK and supporting the scientists at the launch site.
Development of the MPCK platform and the MPCK+ instrument were funded by internal funds of the Max Planck Society. This work was partly supported by the Fraunhofer-Max Planck cooperation program through the TWISTER project.
The article processing charges for this open-access publication were covered by the Max Planck Society.
This paper was edited by Iolanda Ialongo and reviewed by two anonymous referees.
Bagheri, G., Schlenczek, O., Nordsiek, F., Chavez Medina, V., and Bodenschatz, E.: PaCE2022 Advanced Max Planck CloudKite data, Zenodo [data set, code], https://doi.org/10.5281/zenodo.15700506, 2025a. a, b
Bagheri, G., Böhmländer, A., Girdwood, J., Doulgeris, K., Carlson, D., and Ialongo, I. (Eds.): Data generated during the Pallas Cloud Experiment 2022 campaign, Earth Syst. Sci. Data, https://essd.copernicus.org/articles/special_issue1296.html, 2025b. a, b, c, d
Bagheri, G., Nordsiek, F., Schlenczek, O., Kim, Y., Thiede, B., Chávez-Medina, V., Höhne, P., Neumann, T., and Bodenschatz, E.: The Max Planck CloudKite (MPCK): High-Resolution Airborne Measurements of Turbulence and Cloud Microphysics, EGUsphere [preprint], https://doi.org/10.5194/egusphere-2026-3456, 2026. a, b
Chávez-Medina, V., Khodamoradi, H., Schlenczek, O., Nordsiek, F., Brunner, C. E., Bodenschatz, E., and Bagheri, G.: Max Planck WinDarts: atmospheric boundary layer measurements with the Max Planck CloudKite platform and ground weather station – a data overview, Earth Syst. Sci. Data, 18, 4263–4278, https://doi.org/10.5194/essd-18-4263-2026, 2026. a, b, c, d, e, f, g
Doulgeris, K. M., Lihavainen, H., Hyvärinen, A.-P., Kerminen, V.-M., and Brus, D.: An extensive data set for in situ microphysical characterization of low-level clouds in a Finnish sub-Arctic site, Earth Syst. Sci. Data, 14, 637–649, https://doi.org/10.5194/essd-14-637-2022, 2022. a
Gratzl, J., Brus, D., Doulgeris, K., Böhmländer, A., Möhler, O., and Grothe, H.: Fluorescent aerosol particles in the Finnish sub-Arctic during the Pallas Cloud Experiment 2022 campaign, Earth Syst. Sci. Data, 17, 3975–3985, https://doi.org/10.5194/essd-17-3975-2025, 2025. a
Greenspan, L.: Humidity Fixed Points of Binary Saturated Aqueous Solutions, Journal of Research of the National Bureau of Standards – A. Physics and Chemistry, 81A, https://doi.org/10.6028/jres.081A.011, 1977. a
Schröder, M.: Cloud Microphysics Investigations with the Cloudkite Laboratory, PhD thesis, Georg-August-Universität Göttingen 2023. a, b
Stevens, B., Bony, S., Farrell, D., Ament, F., Blyth, A., Fairall, C., Karstensen, J., Quinn, P. K., Speich, S., Acquistapace, C., Aemisegger, F., Albright, A. L., Bellenger, H., Bodenschatz, E., Caesar, K.-A., Chewitt-Lucas, R., de Boer, G., Delanoë, J., Denby, L., Ewald, F., Fildier, B., Forde, M., George, G., Gross, S., Hagen, M., Hausold, A., Heywood, K. J., Hirsch, L., Jacob, M., Jansen, F., Kinne, S., Klocke, D., Kölling, T., Konow, H., Lothon, M., Mohr, W., Naumann, A. K., Nuijens, L., Olivier, L., Pincus, R., Pöhlker, M., Reverdin, G., Roberts, G., Schnitt, S., Schulz, H., Siebesma, A. P., Stephan, C. C., Sullivan, P., Touzé-Peiffer, L., Vial, J., Vogel, R., Zuidema, P., Alexander, N., Alves, L., Arixi, S., Asmath, H., Bagheri, G., Baier, K., Bailey, A., Baranowski, D., Baron, A., Barrau, S., Barrett, P. A., Batier, F., Behrendt, A., Bendinger, A., Beucher, F., Bigorre, S., Blades, E., Blossey, P., Bock, O., Böing, S., Bosser, P., Bourras, D., Bouruet-Aubertot, P., Bower, K., Branellec, P., Branger, H., Brennek, M., Brewer, A., Brilouet , P.-E., Brügmann, B., Buehler, S. A., Burke, E., Burton, R., Calmer, R., Canonici, J.-C., Carton, X., Cato Jr., G., Charles, J. A., Chazette, P., Chen, Y., Chilinski, M. T., Choularton, T., Chuang, P., Clarke, S., Coe, H., Cornet, C., Coutris, P., Couvreux, F., Crewell, S., Cronin, T., Cui, Z., Cuypers, Y., Daley, A., Damerell, G. M., Dauhut, T., Deneke, H., Desbios, J.-P., Dörner, S., Donner, S., Douet, V., Drushka, K., Dütsch, M., Ehrlich, A., Emanuel, K., Emmanouilidis, A., Etienne, J.-C., Etienne-Leblanc, S., Faure, G., Feingold, G., Ferrero, L., Fix, A., Flamant, C., Flatau, P. J., Foltz, G. R., Forster, L., Furtuna, I., Gadian, A., Galewsky, J., Gallagher, M., Gallimore, P., Gaston, C., Gentemann, C., Geyskens, N., Giez, A., Gollop, J., Gouirand, I., Gourbeyre, C., de Graaf, D., de Groot, G. E., Grosz, R., Güttler, J., Gutleben, M., Hall, K., Harris, G., Helfer, K. C., Henze, D., Herbert, C., Holanda, B., Ibanez-Landeta, A., Intrieri, J., Iyer, S., Julien, F., Kalesse, H., Kazil, J., Kellman, A., Kidane, A. T., Kirchner, U., Klingebiel, M., Körner, M., Kremper, L. A., Kretzschmar, J., Krüger, O., Kumala, W., Kurz, A., L'Hégaret, P., Labaste, M., Lachlan-Cope, T., Laing, A., Landschützer, P., Lang, T., Lange, D., Lange, I., Laplace, C., Lavik, G., Laxenaire, R., Le Bihan, C., Leandro, M., Lefevre, N., Lena, M., Lenschow, D., Li, Q., Lloyd, G., Los, S., Losi, N., Lovell, O., Luneau, C., Makuch, P., Malinowski, S., Manta, G., Marinou, E., Marsden, N., Masson, S., Maury, N., Mayer, B., Mayers-Als, M., Mazel, C., McGeary, W., McWilliams, J. C., Mech, M., Mehlmann, M., Meroni, A. N., Mieslinger, T., Minikin, A., Minnett, P., Möller, G., Morfa Avalos, Y., Muller, C., Musat, I., Napoli, A., Neuberger, A., Noisel, C., Noone, D., Nordsiek, F., Nowak, J. L., Oswald, L., Parker, D. J., Peck, C., Person, R., Philippi, M., Plueddemann, A., Pöhlker, C., Pörtge, V., Pöschl, U., Pologne, L., Posyniak, M., Prange, M., Quiñones Meléndez, E., Radtke, J., Ramage, K., Reimann, J., Renault, L., Reus, K., Reyes, A., Ribbe, J., Ringel, M., Ritschel, M., Rocha, C. B., Rochetin, N., Röttenbacher, J., Rollo, C., Royer, H., Sadoulet, P., Saffin, L., Sandiford, S., Sandu, I., Schäfer, M., Schemann, V., Schirmacher, I., Schlenczek, O., Schmidt, J., Schröder, M., Schwarzenboeck, A., Sealy, A., Senff, C. J., Serikov, I., Shohan, S., Siddle, E., Smirnov, A., Späth, F., Spooner, B., Stolla, M. K., Szkółka, W., de Szoeke, S. P., Tarot, S., Tetoni, E., Thompson, E., Thomson, J., Tomassini, L., Totems, J., Ubele, A. A., Villiger, L., von Arx, J., Wagner, T., Walther, A., Webber, B., Wendisch, M., Whitehall, S., Wiltshire, A., Wing, A. A., Wirth, M., Wiskandt, J., Wolf, K., Worbes, L., Wright, E., Wulfmeyer, V., Young, S., Zhang, C., Zhang, D., Ziemen, F., Zinner, T., and Zöger, M.: EUREC4A, Earth Syst. Sci. Data, 13, 4067–4119, https://doi.org/10.5194/essd-13-4067-2021, 2021. a, b, c
Thiede, B., Larsen, M. L., Nordsiek, F., Schlenczek, O., Bodenschatz, E., and Bagheri, G.: Highly Localised Droplet Clustering in Shallow Cumulus Clouds, arXiv [preprint], https://doi.org/10.48550/arXiv.2502.19272, 2025a. a
Thiede, B., Schlenczek, O., Stieger, K., Ecker, A., Bodenschatz, E., and Bagheri, G.: In-line holographic droplet imaging: accelerated classification with convolutional neural networks and quantitative experimental validation, Atmos. Meas. Tech., 18, 6291–6314, https://doi.org/10.5194/amt-18-6291-2025, 2025b. a
For location details, visit https://en.ilmatieteenlaitos.fi/pallas-atmosphere-ecosystem-supersite (last access: 2 August 2026).