the Creative Commons Attribution 4.0 License.
the Creative Commons Attribution 4.0 License.
 | 15 Oct 2026
A standardized permafrost ground temperature collection for Canada 2025
Olivia Meier-Legault

Larry Adjun
Michel Allard
Alejandro Alvarez
Maude Auclair
Alex Bevington
Samuel Bilodeau
William Cable
Olivia Carpino
Ariane Castagner
Lin Chen
Alexandre Chiasson
Ryan Connon
Stephanie Coulombe
Jeffrey Crompton
Derek Cronmiller
Gautier Davesne
Mason Dominico
Marc-André Ducharme
Timothy Ensom
Louise Farquharson
Vanessa Foord
Daniel Fortier
Philippe Fortier
Duane Froese
Samuel Gagnon
Francis Gauthier
Marten Geertsema
Etienne Godin
Galina Jonat
Steven V. Kokelj
Michelle Landry
Antoni Lewkowicz
Panya Lipovsky
Emmanuel L'Hérault
Hannah Macdonell
Lancelot Massé
Dmitry Nicolsky
Moya Painter
Leesee Papatsie
Victor Pozsgay
William Quinton
Vladimir Romanovsky
Ashley C. A. Rudy
Denis Sarrazin
Emilie Stewart-Jones
Donald Walker
Thomas Wright
Joseph Young
Stephan Gruber
Ground temperature (GT) is an essential variable for monitoring the thermal state of permafrost, developing models, and conducting fundamental research. However, the usability of GT data in Canada is often hampered by inconsistent file formats, a lack of metadata standardization between organizations, and varied temporal resolutions. This fragmentation has prevented the development of a comprehensive benchmark dataset, leaving researchers reliant on small, ad-hoc data subsets for model evaluation.
To address this gap, we present a new, standardized collection of GT and ground surface temperature (GST) data from across Canada, designed to serve as a benchmark for synthesis and model evaluation. The collection integrates data from 29 published datasets and 13 unpublished contributions, encompassing 427 GT and 491 GST sites across British Columbia, Labrador, Northwest Territories, Nunavut, Québec, and Yukon. The dataset includes records from 1960 through 2025 and observations range in depth from 0 to 300 m. The longest individual time series comprises 34 consecutive years of daily data with no more than 10 % missing data per year. On average for all sites and depths, this value is 6 years.
All included time series feature at least one year of measurements at daily resolution. We performed quality control and standardization using tempcf – a newly-developed python software tool – to document and remove anomalies, outliers, and drilling disturbances. Then we aggregated sub-daily data to daily means. The dataset is standardized into NetCDF files adhering to CF, ACDD, and IOOS metadata standards as well as a compatible permafrost-specific metadata profile. Data are provided as both individual NetCDF files and text files. They are fully accessible at https://doi.org/10.5281/zenodo.18022924 (version 0.9.1) (Meier-Legault et al., 2025) and via an ERDDAP server (https://data.permafrostnet.ca/erddap, last access: 21 July 2026), following FAIR principles.
Several limitations remain, including time zone uncertainty in some datasets, and the lack of a standardized methodology for harmonizing site description metadata. Nevertheless, this collection improves the accessibility and usability of Canadian ground temperature data for national-scale permafrost research.
- Article
(4472 KB) - Full-text XML
-
Supplement
(3350 KB) - BibTeX
- EndNote


Ground temperature is an essential variable for the study and monitoring of permafrost (Sessa and Dolman, 2008). Temperatures are often measured at multiple discrete depths in boreholes equipped with a temperature sensor chain. However, surface measurements, typically obtained from a single logger–sensor configuration located in the uppermost ground layers, are also commonly collected. While individual time series are useful for investigating local-scale phenomena, often in conjunction with other data sources (e.g., Hasler et al., 2012; Wirz et al., 2016), large collections of data are used to evaluate models (Fiddes et al., 2015; Melton et al., 2019; Cao et al., 2020), monitor the thermal state of permafrost (Biskaborn et al., 2015; Smith et al., 2022), and investigate regional-scale patterns (Boeckli et al., 2012). However, the availability and usability of ground temperature data are hampered by several challenges (Brown et al., 2024).
Permafrost data, as with many other types of cryospheric data, are often not standardized and remain in a wide variety of formats (Bavay et al., 2020). Recent work has contributed to the creation of large, standardized data compilations from historic or unpublished collections (Mohammadi and Hayley, 2025; Herring et al., 2024; Devoie et al., 2022), and to the standardization of ground temperature data at the organizational level (e.g. Lipovsky et al., 2022; Karunaratne et al., 2015; Biskaborn et al., 2015). Despite this progress, much ground temperature data remains inaccessible or scattered across multiple publications in a variety of formats. Community standards and data access pipelines are still in their early stages. Consequently, a great deal of effort is still required to produce a comprehensive dataset suitable for national-scale analysis.
Software tools to help harmonize these long-tail data have been developed (Brown, 2022), but they are not yet automated to gather data from different sources, requiring manual downloads that slow compilation. In addition, inconsistencies in measurement frequency between published datasets limit their usability. While monthly and annual means aggregated from high-frequency measurements have been used to evaluate model performance (Melton and Arora, 2016) and temperature change (Biskaborn et al., 2019), daily measurements are required to compute certain temperature-derived metrics (Harp et al., 2016) and to enable more precise model evaluation (Schmid et al., 2012). Furthermore, daily measurements offer greater flexibility, as they can always be aggregated to coarser temporal resolutions, and ensure transparency and reproducibility when aggregate values are reported.
Whereas reference datasets are commonly used to benchmark software including land surface models (Pastorello et al., 2020), hydrological models (Arsenault et al., 2016), and computer vision (e.g., Deng et al., 2009; Lin et al., 2014), permafrost models are often evaluated using ad-hoc methods based on small and differing sets of data. While frameworks for consistently comparing permafrost model performance are being developed (Macdonell, 2025), suitable benchmark datasets against which model results can be compared hardly exist.
Wanting to support research that advances understanding of permafrost conditions, we gather, standardize, and quality-check ground temperature (GT) and ground surface temperature (GST) data from across Canada. This collection is intended to serve as a dataset for synthesis and model evaluation, while individual datasets should be cited directly when used independently or for local studies which benefit from the additional context or finer temporal resolution which may be available in the source data.
Finally, we provide complementary considerations toward establishing a disciplinary norm of data sharing and interoperability in permafrost science that arise from our work.
2.1 Data sources
We searched for GT and GST data from scientific, northern- and permafrost-specific data repositories and databases including Nordicana D, the Yukon Geological Survey's Permafrost Database, the Northwest Territories Geological Survey's (NTGS) Geoscience Publications and Reports database, Arctic Data Center, Borealis, Mendeley Data, and Natural Resources Canada's (NRCan) Open S&T Repository. In addition to published datasets, we also sent personal requests and received contributions of unpublished ground temperature data from individuals.
Criteria for inclusion
The dataset contains GT and GST datasets with at least one year of measurements at daily resolution. Shorter durations and data with coarser temporal resolution were excluded.
We classify monitoring sites as GST when the deepest sensor is installed 20 cm deep or shallower; deeper installations are classified as GT. Sites were retained if they fell within the permafrost zones defined by Heginbottom et al. (1995). However, permafrost is not always reached and, consequently, not all GT sites record permafrost temperatures.
The minimum metadata requirements for inclusion were site coordinates, and contact information for the principal investigator (PI). We used the Google Maps Elevation API to provide elevation data for sites with missing elevations. For unpublished datasets, PIs were also provided with the metadata template developed by the Northwest Territories Permafrost Database Technical Working Group (2019) and asked to complete sections describing the site location, conditions, and sensor installation. All metadata sheets were subsequently merged and edited for consistency and brevity.
2.2 Software tools
We use the tempcf tool, a program with a graphical user interface for inspecting and cleaning ground temperature data (Brown et al., 2025). It allows the read-in of a variety of different file formats supported by TSP, a python library for working with permafrost ground temperature data (Brown, 2022). Data cleaning operations performed in tempcf are automatically documented in a log file, making the resulting data easily traceable to the original observations, which is foundational for reproducibility. For final data output, this tool is also used to create both text and NetCDF files. The former files were exported using TSP into a standardized ground temperature data format (the definition of which is included as File S2 in the Supplement), and the latter are based on the NSERC PermafrostNet ground temperature NetCDF template.
2.3 Data processing
Data processing consisted of three main components: (1) compiling metadata sheets for unpublished datasets and extracting baseline metadata for all datasets according to CF conventions, (2) quality checking GT and GST data, and (3) generating the final data outputs. These steps and their relationships are summarized in Fig. 1.
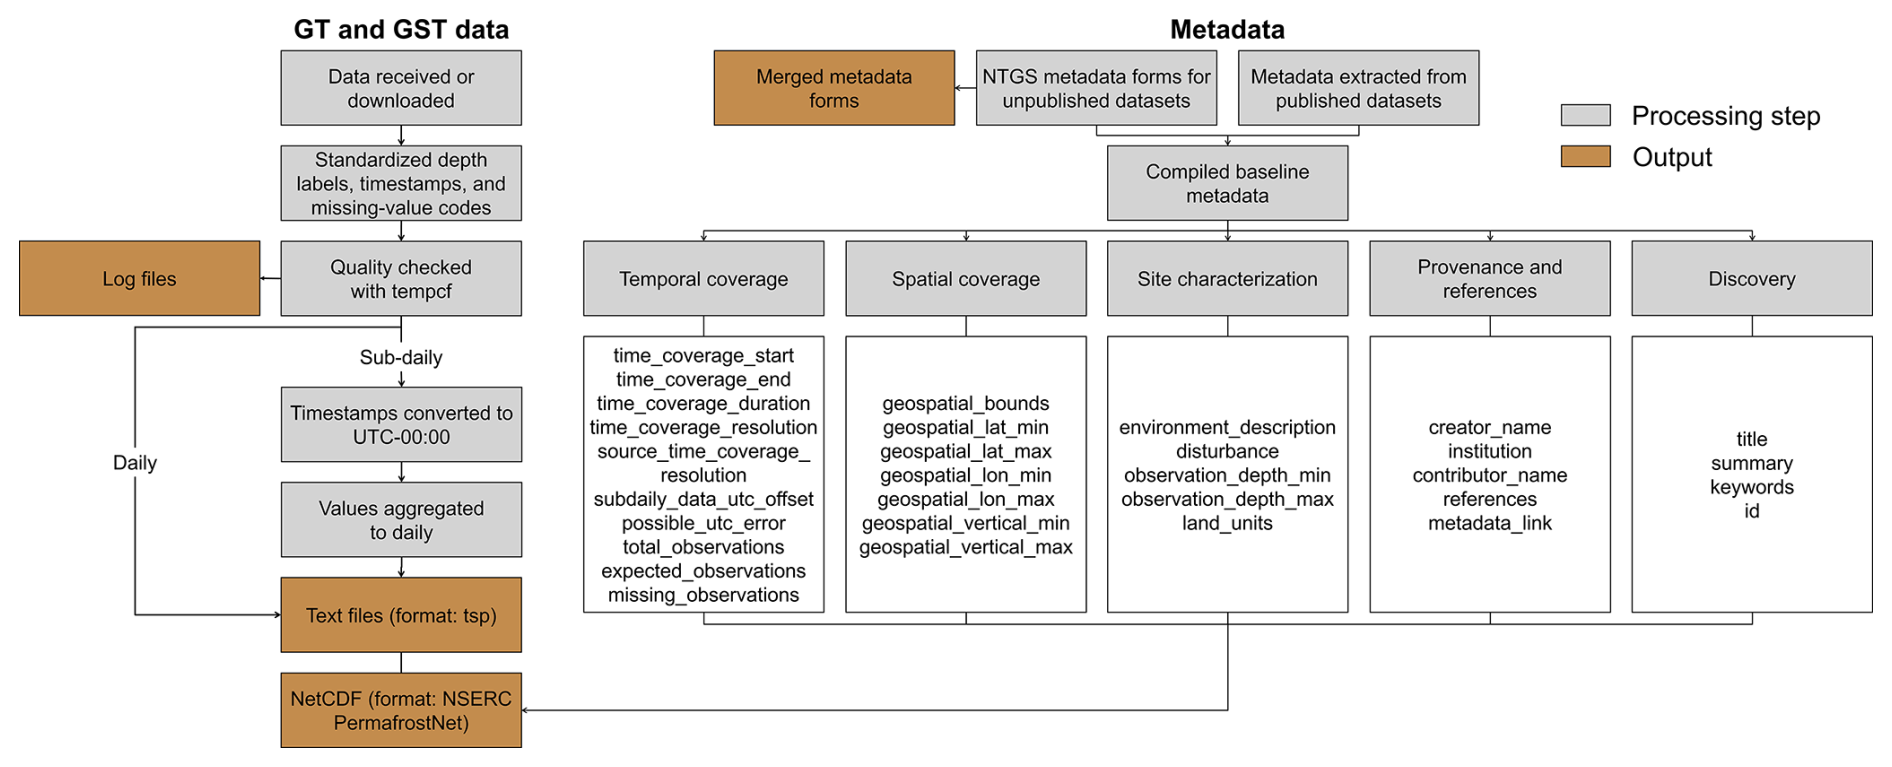
Figure 1Workflow summarizing the GT, GST, and metadata standardization procedure. Temperature data are handled according to whether they contain sub-daily measurements or pre-aggregated daily values, before being merged into the final data products. NTGS metadata forms for unpublished datasets and published site metadata are used to provide the final baseline metadata requirements, which are organized into temporal, spatial, provenance & attribution, site-characterization, and discovery components using standardized attribute names. The NetCDF outputs incorporate the baseline metadata, while the text-file outputs follow the tsp format for ground-temperature time series.
2.3.1 Source data validation
In-situ temperature sensors are liable to sensor drift, displacement from their reference position, thermal disturbance from drilling, and short-circuiting. Each sensor time series was manually inspected using the tempcf tool to identify or remove anomalous values (Fig. 2). For a given time period, values diverging from the normal readings of other sensors within the same borehole were removed. Furthermore, following drilling or sensor installation, ground temperatures can be temporarily elevated as the boreholes equilibrate to subsurface conditions. The heat imparted by drilling and the refreezing of water in boreholes can lengthen the equilibration time, especially in ground near 0 °C. Measurements influenced by these effects were manually inspected and excluded up to the point where the temperatures stabilized. Any modifications made to the original files are automatically documented in log files included with the dataset. Conversely, because sensor drift or sensor displacement from frost jacking or subsidence can resemble true signals and trends, values from suspected cases were not removed. Instead, these potential anomalies were documented in the possible_anomaly_comments field in the NetCDF files and in the metadata table.
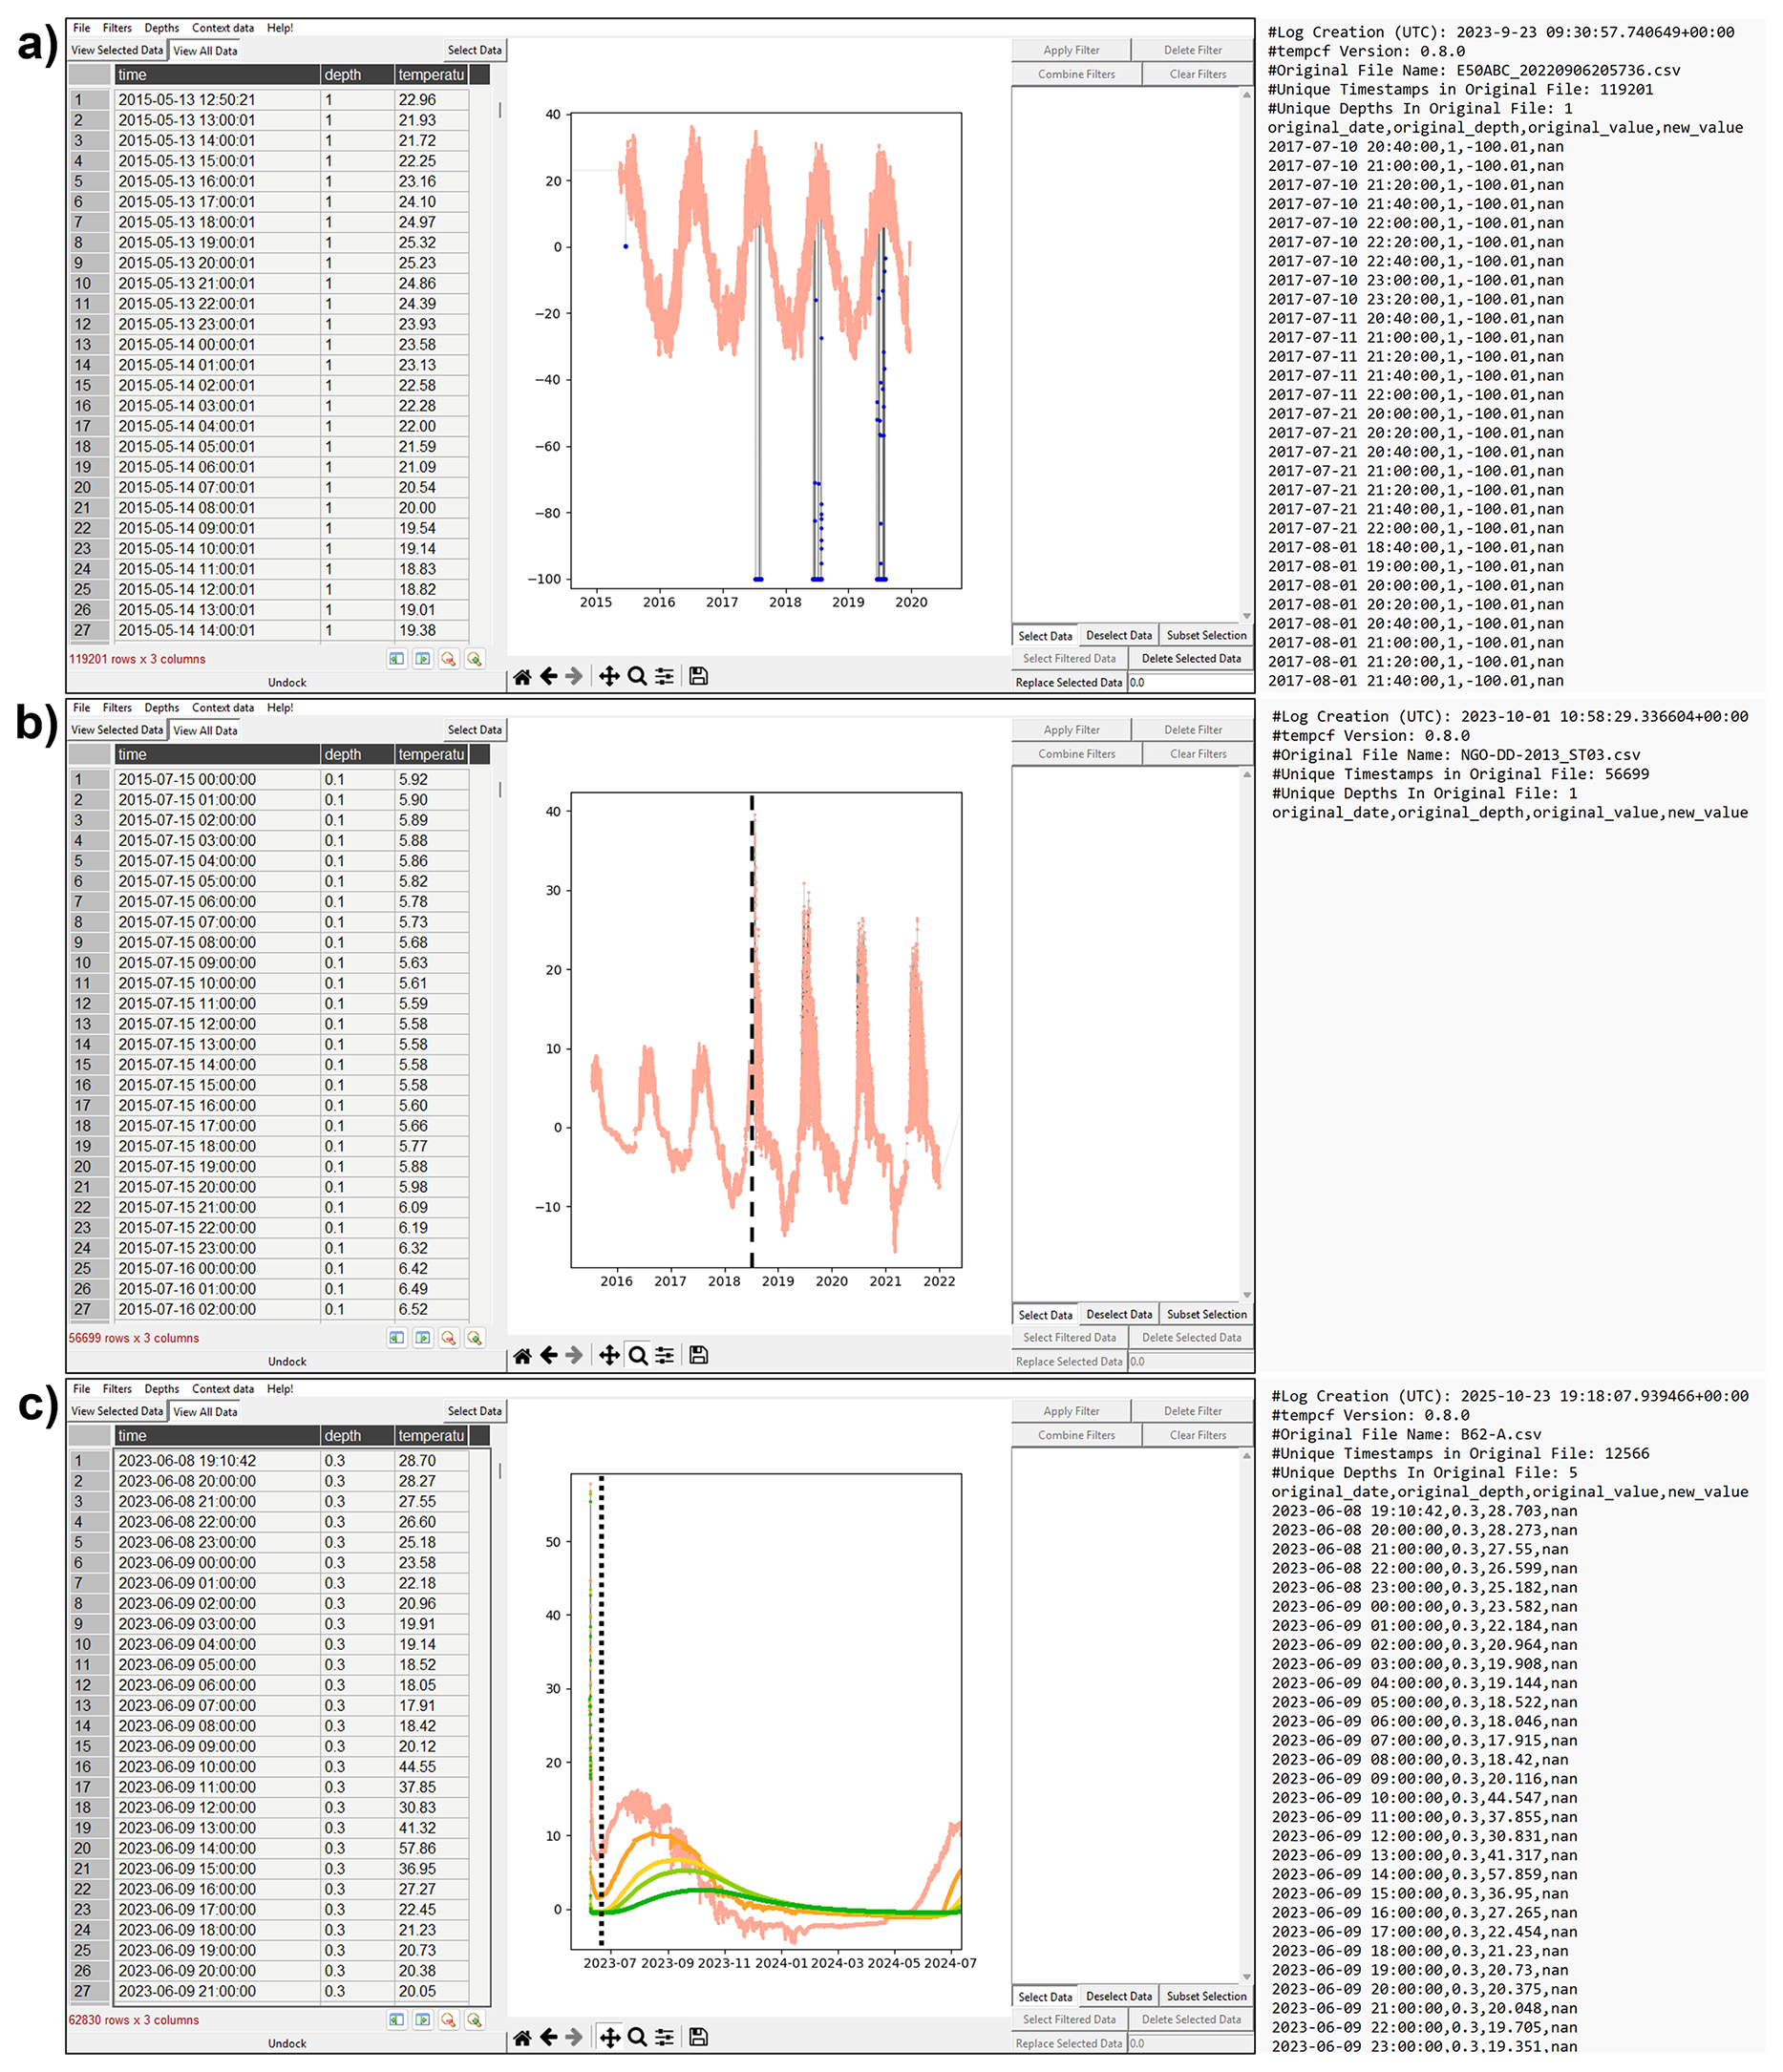
Figure 2Sample tempcf cleaning and documentation workflow for two GST and one GT time series. The x-axis shows date and the y-axis temperature [°C]. (a) Inaccurate readings (blue dots) caused by short-circuiting of the sensor were selected in the tempcf GUI, deleted, and automatically documented in the corresponding output log file (right panel). (b) The increasing amplitude and noise following the date marked by the dashed line indicate displacement of the GST sensor to a shallower depth. The issue was noted and no values were deleted, as shown in the empty log file. (c) The temperature to the left of the dotted line equilibrates to the natural ground temperature. Values up until the dotted line were deleted and documented in the output log file.
2.3.2 Data harmonization
Following quality control, sub-daily measurements recorded in local time were converted to Coordinated Universal Time (UTC−00:00). In some cases, time zones were unknown and could not be converted to UTC time prior to aggregating to daily averages. In other cases, daily means were already aggregated from sub-daily measurements recorded in local time or had unknown timezones. The time zone for which the daily values are calculated is specified in the subdaily_data_utc_offset field in the NetCDF files and in the metadata table. When unknown, the possible UTC offset error is specified under the variable possible_utc_error. All measurements were then aggregated to daily means regardless of missing measurements and all final data are reported in UTC time (see discussions below on errors associated with UTC offsets).
Some sites exhibited varying measurement frequencies over their recording periods. These can be identified from the NetCDF expected_observations variable, which can vary in time. Initial measurements at certain sites were taken manually at irregular intervals, and while these data are included, users should exercise caution when interpreting them, as they do not represent daily means derived from sub-daily records.
In most cases, measurements were recorded every two hours or more frequently. In the Environment and Climate Change Canada (ECCC) dataset, temperatures were recorded twice daily at 08:00 and 15:00 (local times). However, due to the frequent absence of afternoon measurements, and following Qian et al. (2011), only the morning observations were retained in order to keep as many records as possible without introducing a time-dependent bias in the daily averages.
Source metadata, site descriptions, and photographs, were used to determine whether each site was disturbed and whether it was drilled directly into bedrock. These attributes are included in the site description metadata. While it is not feasible to harmonize all metadata attributes, these two can more easily be summarized across datasets by treating them as a binary variable. Note however, that neither the threshold for disturbance nor the categories of disturbance are well-standardized (see discussions below on error and interoperability). In some cases, disturbances far from sites were included in source metadata to provide context.
2.3.3 Automated quality control
In addition to the manual validation, we performed automated quality control tests to detect common problems with ground temperature datasets. First, we applied strict limits on allowable temperature values. Ground temperatures outside the range −50 to 30 °C and ground surface temperature outside the range −65 to 40 °C were removed. Cutoff values were based on an established permafrost data quality workflow (Lange et al., 2021).
2.3.4 Estimating observation frequency
The accuracy of daily averages is determined in part by data completeness. However, the intended observation frequency was not always available for each dataset. In some cases, observation frequencies changed multiple times over the dataset. We estimate the number of expected and missing data points in each day using a multi-step approach. First, the time deltas between successive observations were calculated, and a rolling median filter was applied to eliminate noise caused by missing data. Next, to estimate data completeness for each day, we used a binary segmentation algorithm to partition the time series into discrete, piecewise constant regimes. Each regime represents a period with a fixed sampling rate: the median value was used as the expected sampling frequency, f. Finally, unrealistic sampling frequencies (i.e., those not evenly dividing a 24 h period) were removed and replaced with the values of the previous interval. The expected and missing number of observations per day were calculated as:
For each discrete sampling period. These are stored under the fields expected_observations and missing_observations in the NetCDF files.
2.3.5 Interoperability frameworks
The standardization of permafrost data and metadata, like much cryospheric data, is often done using ad-hoc conventions if it is done at all (Bavay et al., 2020; Brown et al., 2024). Recently some organizations have developed standardized metadata templates and data formats (e.g., Karunaratne et al., 2015; Biskaborn et al., 2015). Although software has been developed to harmonize data formats (e.g., Brown, 2022), there are few resources to translate between the different metadata (categories of site disturbance, for example). Nor do these metadata and formats align with broader scientific standards or initiatives. This makes metadata elements difficult to integrate between datasets.
To increase the ability of permafrost data to interoperate with other datasets and disciplines, we have adopted for netCDF files the Attribute Convention for Data Discovery (ACDD) and Integrated Ocean Observing System (IOOS) metadata naming conventions, which build upon the Climate and Forecast (CF) conventions (Hassell et al., 2017). These standards define consistent attribute names for project information, provenance, references, and other high-level site descriptors.
Furthermore, within NSERC PermafrostNet we have described a NetCDF metadata profile that recommends a way to include relevant site characterization information such that it is documented and can be more easily linked to other standards (Brown, 2026). A number of permafrost-relevant variables have recently been added to the CF standard names database (Brown et al., 2024). This has made it easier for geotechnical borehole variables (e.g., excess ice content, frozen bulk density) to also be standardized in a harmonized way.
As a demonstrator example, we have also included landform descriptions for sites where this information is provided in the site_description field or has otherwise been clearly communicated. For example, a site description such as “North edge of lithalsa a few meters south of powerline cutline” would be marked as “lithalsa”. This data field uses the same list of terms as the Canadian Permafrost Electrical Resistivity (CPERS) database (Herring et al., 2024). Those vocabulary terms have been provided with a stable identifier using the w3id system (e.g. https://w3id.org/permafrost/v/cperslandforms/lithalsa, last access: 21 July 2026). Terms have also been formalized using the simple knowledge organization system (SKOS). Such a representation is a step towards developing more complex systems that facilitate translation between metadata systems (e.g., Verhey et al., 2023) or linking to other resources such as glossaries (e.g., Lewkowicz et al., 2025) to provide additional context. It also follows the FAIR (findable, accessible, interoperable, reuseable) principles (Cox et al., 2021).
While there is a well-developed ecosystem for netCDF file description, there is no equivalent for text files. We use the ground temperature file format defined in the tsp library (Brown, 2022). A copy of the format definition is included as File S2.
2.4 Automating data access with ERDDAP
The standardization of this dataset using the CF and NetCDF ecosystem allows us to also make it available on an ERDDAP endpoint (https://data.permafrostnet.ca/erddap). Although a permafrost-specific data distribution software does not yet exist and there are several choices of existing platforms for this purpose, ERDDAP offers several features that make it valuable for distribution of permafrost data (Brown et al., 2024). It is already well-established and supports common standards (WMS, ISO-19115, DAP) for data transport and metadata description. This makes the data more FAIR (Wilkinson et al., 2016) – for example, by making it discoverable on data aggregators such as Google dataset search – and also serves to integrate it within the broader earth science data ecosystem. Because it is general-purpose, it is possible to accommodate both discrete observations like ground temperature alongside model output and gridded products. The interface provides both interactive and programmatic ways to access, query, and download the data. Finally, ERDDAP servers from different organizations can be federated in such a way as to make data collections searchable across organizational boundaries.
3.1 Data contributions
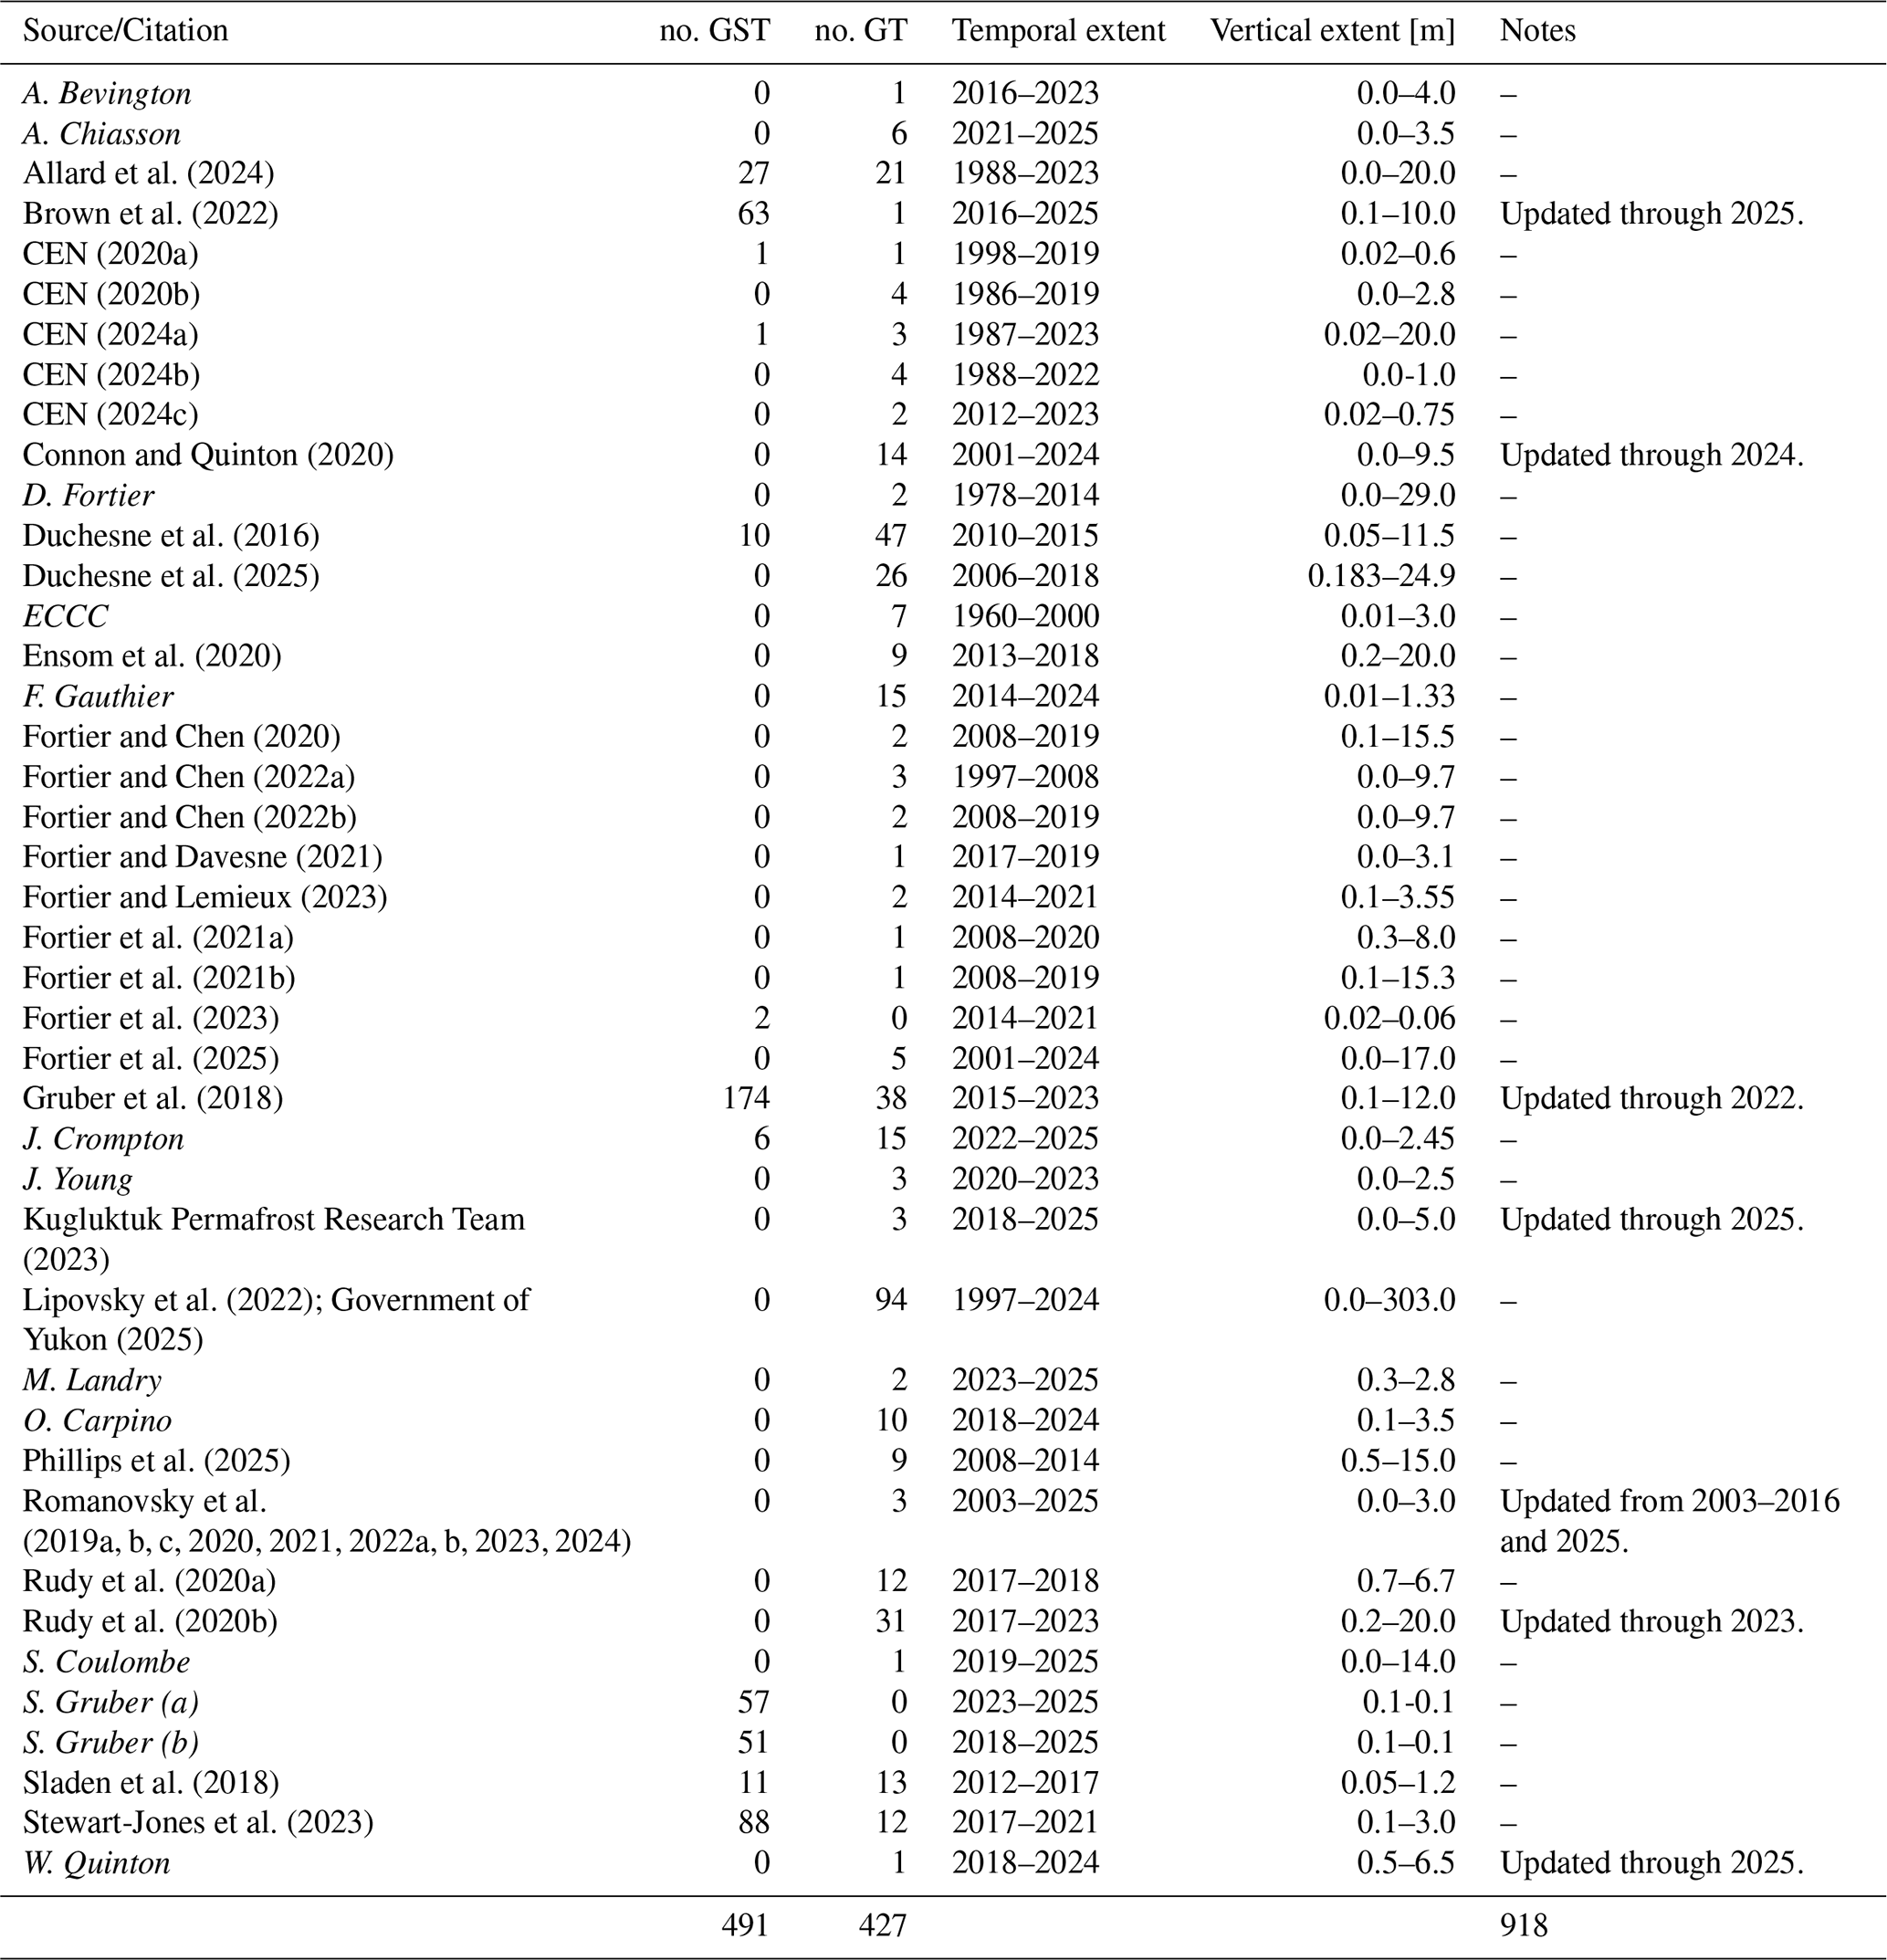
The dataset combines 13 unpublished datasets and 29 published, including six with updates to the original releases (Table 1).
Unpublished datasets were supplied by university and government researchers. One dataset was provided directly by ECCC and is distributed under their license agreement (see File S1). Published datasets were sourced from online generalist and northern-focused repositories and databases.
The datasets by Duchesne et al. (2025) and Phillips et al. (2025) that we retrieved from Mendeley Data are distributed under a Creative Commons Attribution 4.0 International (CC BY 4.0) licence (https://creativecommons.org/licenses/by/4.0/, last access: 21 July 2026) without additional endorsement from the authors for this publication. The original datasets were modified for use in this study and all modifications are documented in the log files included with the final compiled dataset. Full creator names, dataset titles, and DOIs are provided in the references.
Data reproduced from the Report on 2010–2015 Permafrost Thermal Investigations in the Yellowknife Area, Northwest Territories and the Report on 2012–2017 Shallow Ground Thermal Investigations on the Tibbitt to Contwoyto Winter Road Portages, Northwest Territories, both published by the Geological Survey of Canada (NRCan), are included in this compilation. This reproduction is a copy of official NRCan works and has not been produced in affiliation with, or with the endorsement of, NRCan.
Allard et al. (2024)Brown et al. (2022)CEN (2020a)CEN (2020b)CEN (2024a)CEN (2024b)CEN (2024c)Connon and Quinton (2020)Duchesne et al. (2016)Duchesne et al. (2025)Ensom et al. (2020)Fortier and Chen (2020)Fortier and Chen (2022a)Fortier and Chen (2022b)Fortier and Davesne (2021)Fortier and Lemieux (2023)Fortier et al. (2021a)Fortier et al. (2021b)Fortier et al. (2023)Fortier et al. (2025)Gruber et al. (2018)Kugluktuk Permafrost Research Team (2023)Lipovsky et al. (2022); Government of Yukon (2025)Phillips et al. (2025)Romanovsky et al. (2019a, b, c, 2020, 2021, 2022a, b, 2023, 2024)Rudy et al. (2020a)Rudy et al. (2020b)Sladen et al. (2018)Stewart-Jones et al. (2023)Table 1GST and GT datasets compiled from published and unpublished sources. Unpublished datasets are labeled by the name of the principal investigator and are italicized. Some datasets are only partially available in the cited sources, with relevant updates noted.
3.2 Dataset statistics
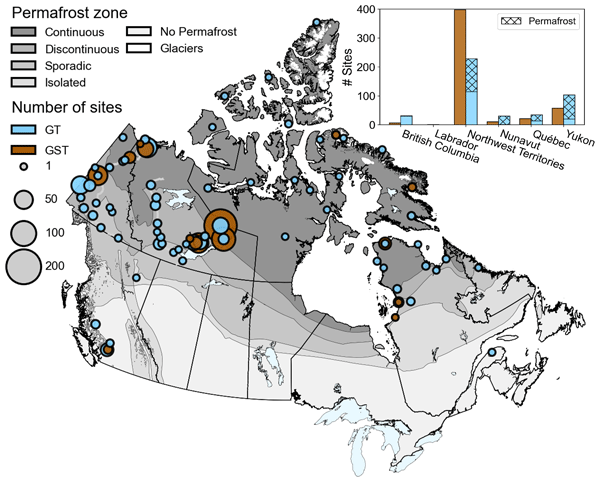
The dataset includes 427 GT and 491 GST sites located across British Columbia, Northwest Territories, Nunavut, Québec, and Yukon, with 60 % of the GT sites recording permafrost (Fig. 3). Approximately 90 % of the recording depths are shallower than 10 m and have measurements that occur after 2008 (Fig. 4).
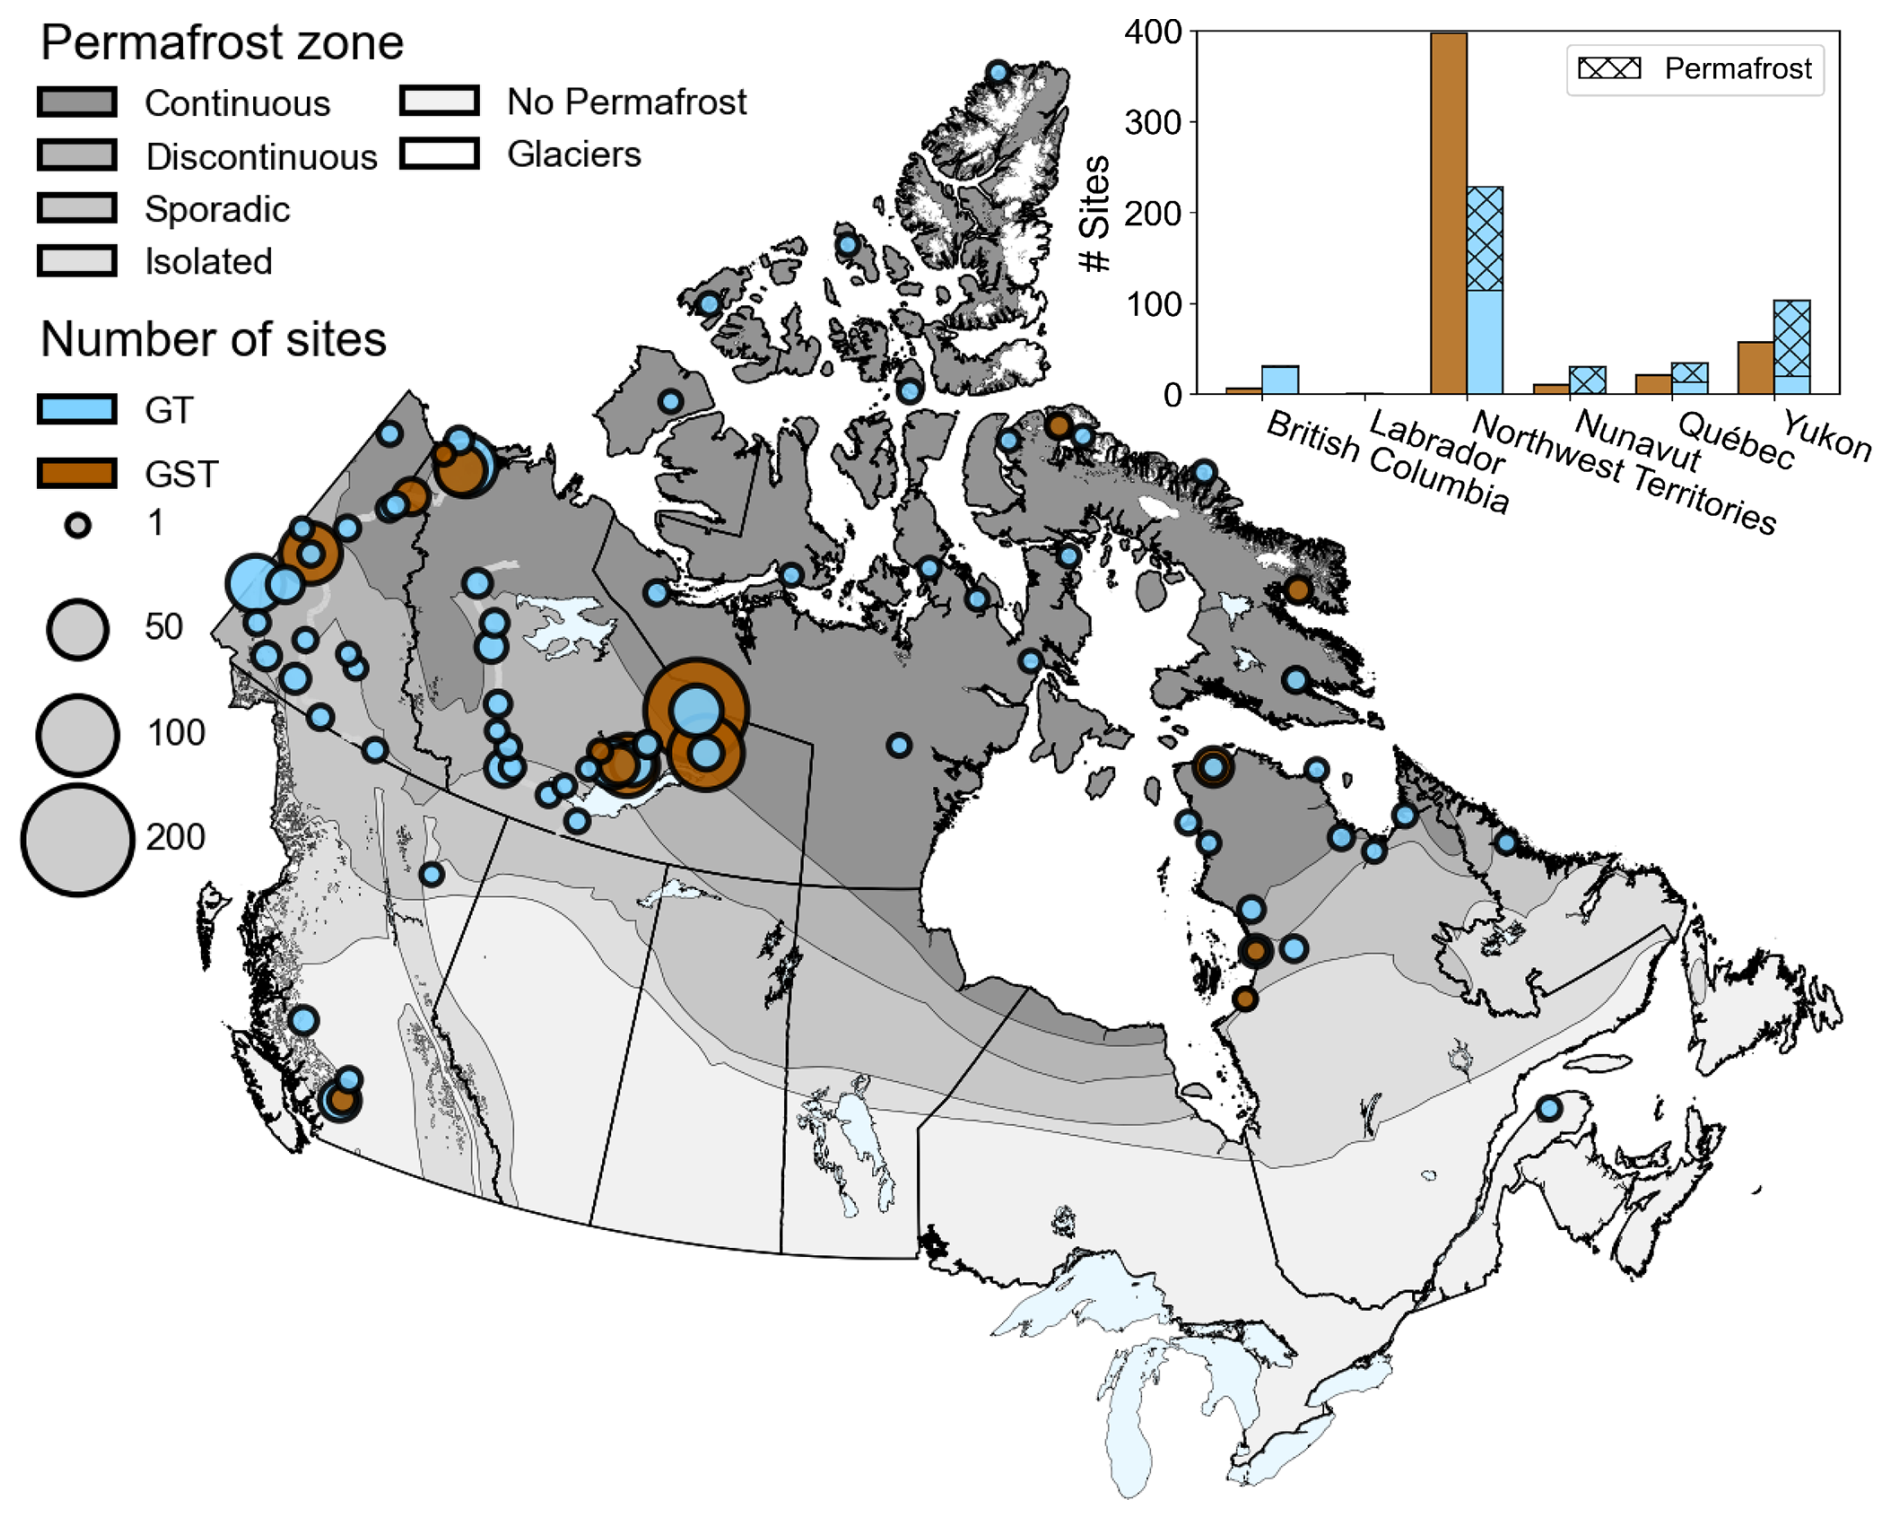
Figure 3Overview of the 427 GT and 491 GST sites. The size of each point on the map reflects the number of sites within 100 km grid cells, displayed at the average location of the sites within that cell to improve visual clarity and location accuracy. Many sites in the Yukon and Northwest Territories are situated near major transportation corridors (light gray lines). Permafrost zones are based on Heginbottom et al. (1995). In the upper right corner, the number of GT and GST sites by territory and province, as well as the proportion of GT sites that record permafrost are displayed. Labrador contains only one GT site, which does not record permafrost. Permafrost presence is determined from at least two years of daily measurements during which no temperatures exceed 0 °C.
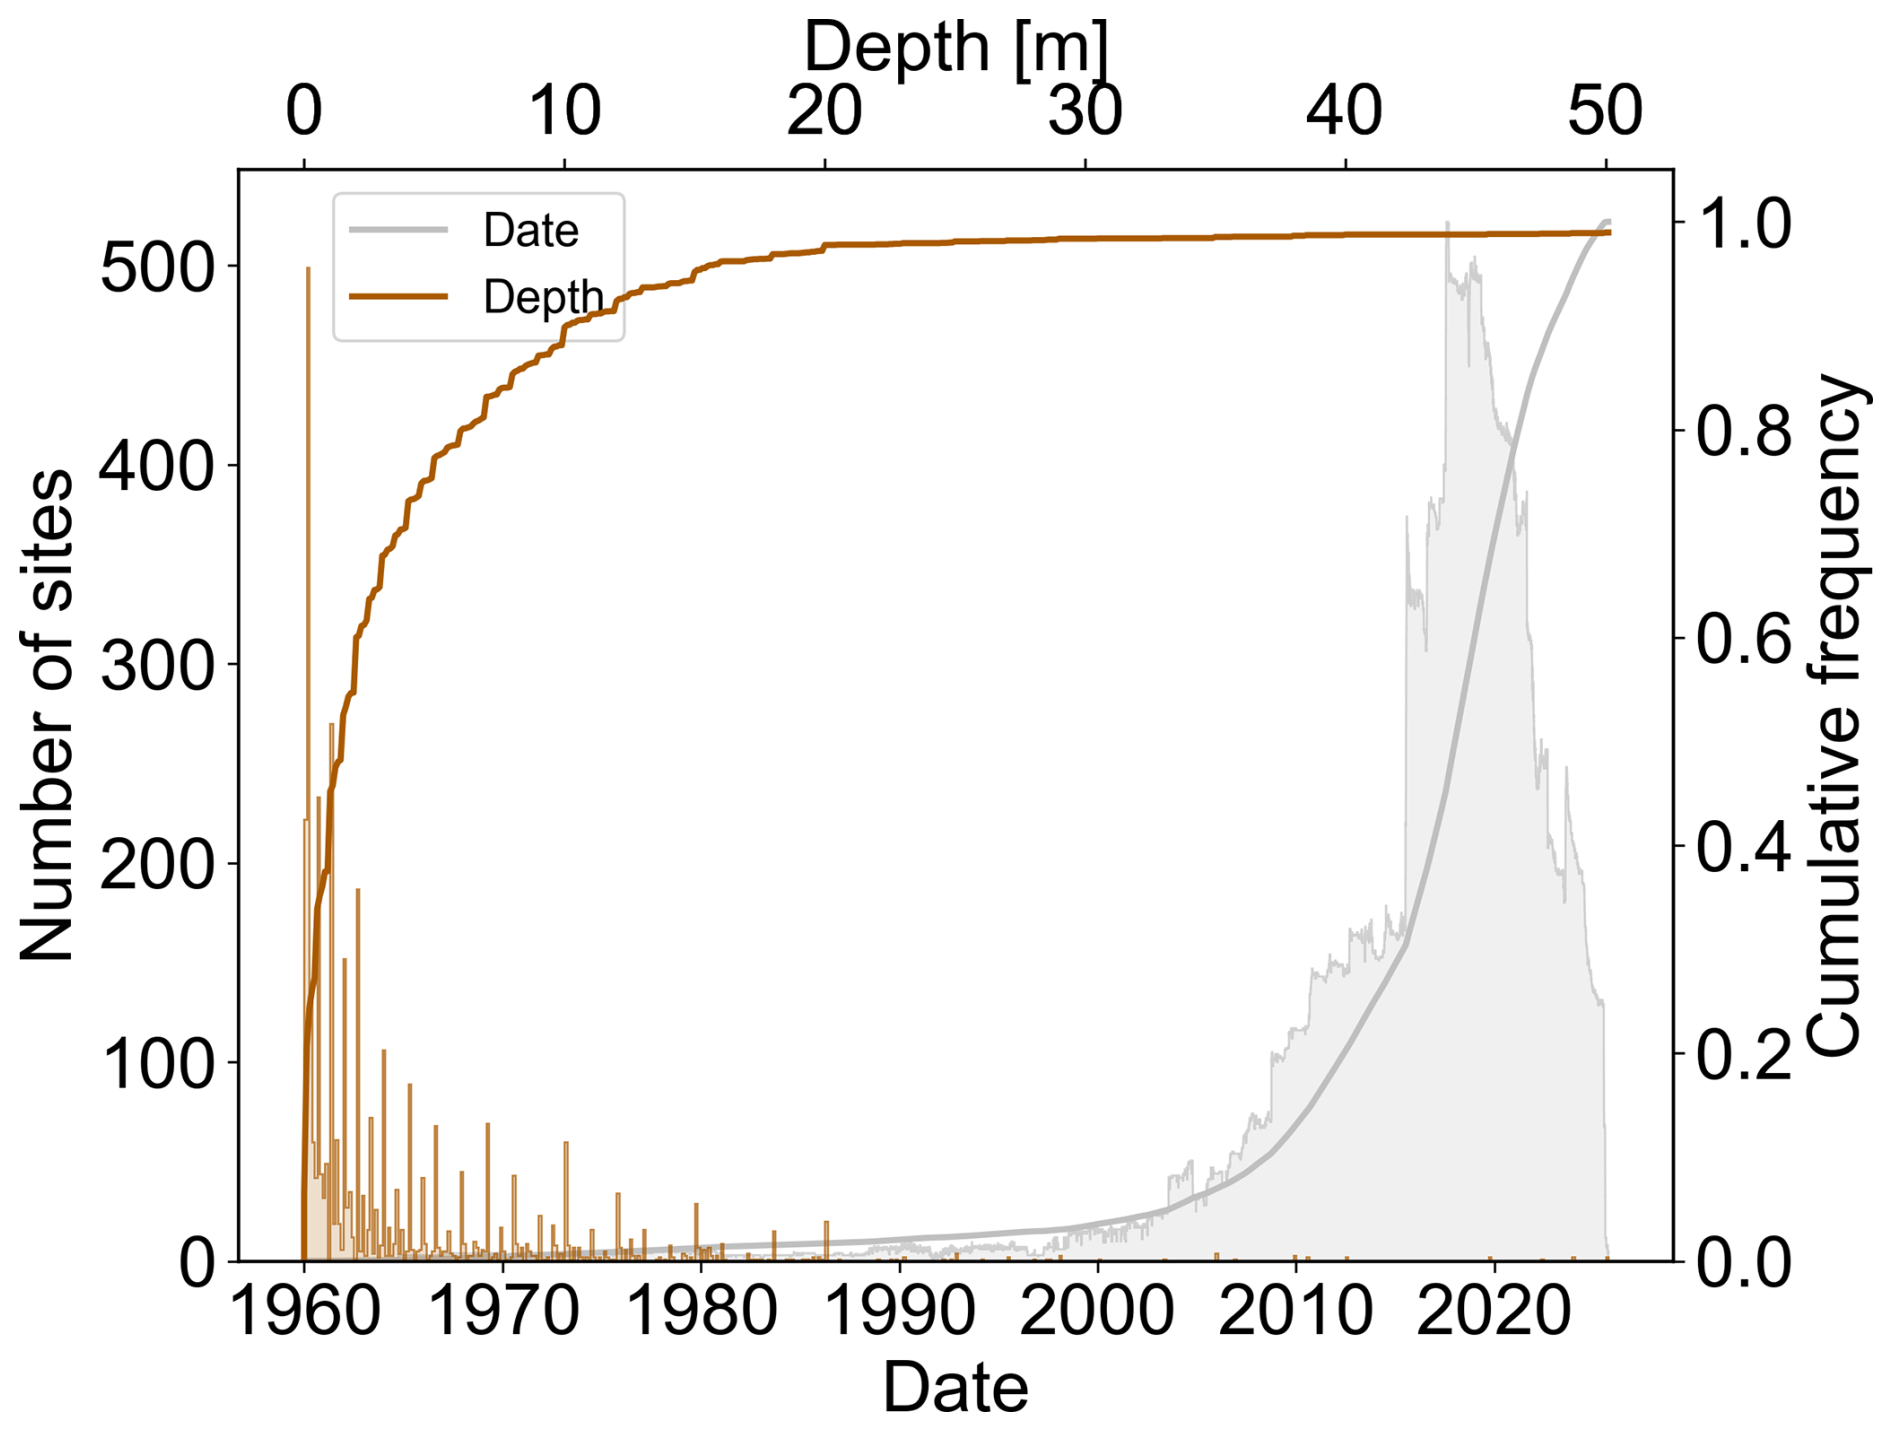
Figure 4Data availability by depth and measurement date. Depths are grouped into 0.1 m bins, and measurement dates are at daily resolution. The shaded regions represent the total site count for a given depth and date (left axis), while the solid lines represent their cumulative distributions (right axis). Note the deepest sensor depth is 303 m but the depth (top axis) is cut off at 50 m. Only 9 sites have sensors deeper than 50 m.
Temperatures in the dataset range from −49.8 to 33.6 °C. The distribution of temperatures is negatively skewed for both ground surface (μ = −2.16 °C, median = −0.84 °C) and deeper ground temperatures (μ = −2.10 °C, median = −0.75 °C). Both distributions are strongly leptokurtic and this is more pronounced for observations below 20 cm than for observations at the surface (Fig. 5a). Few boreholes extend past 20 m and there are clear preferential measurement depths (e.g., at 10, 12, 15, and 18 m) corresponding to greater observed ranges (Fig. 5b).
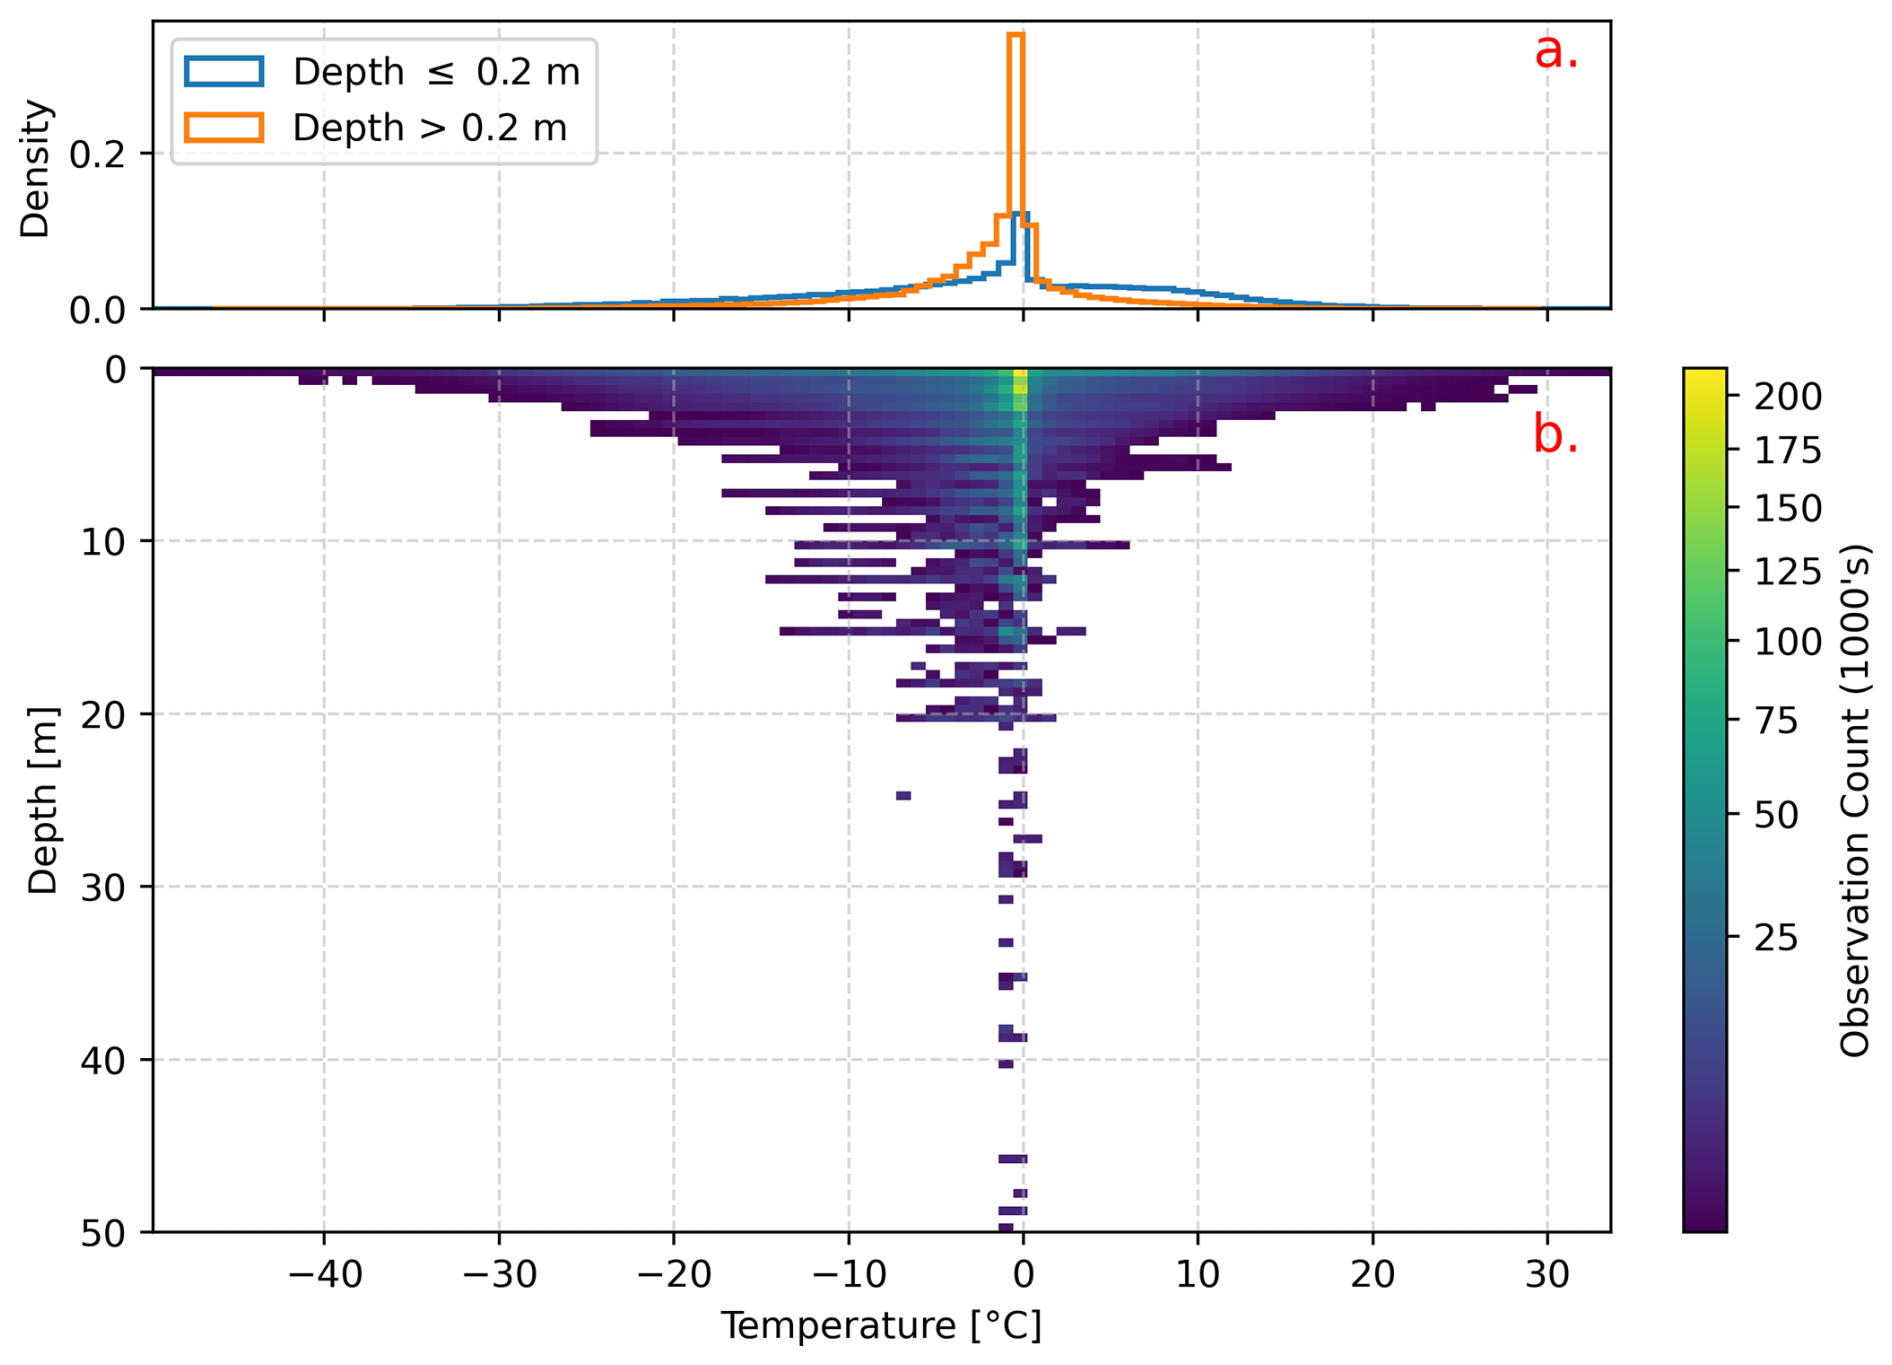
Figure 5(a) The distribution of observed temperatures for sensors above (blue) and below (orange) the 0.2 m GT-GST classification threshold. Here, observations are grouped strictly according to depth instead of GT-GST site classification because some GT sites may have near-surface sensors in the borehole. (b) A heatmap of observation density highlights the abundance of observations at or just below 0 °C at all depths. Observations below 50 m are not shown to preserve figure clarity; these represent less than 0.5 % of all observations.
3.3 Data availability and file structure
The complete dataset is freely available for download at https://doi.org/10.5281/zenodo.18022924 (Meier-Legault et al., 2025) and via an ERDDAP server (https://data.permafrostnet.ca/erddap).
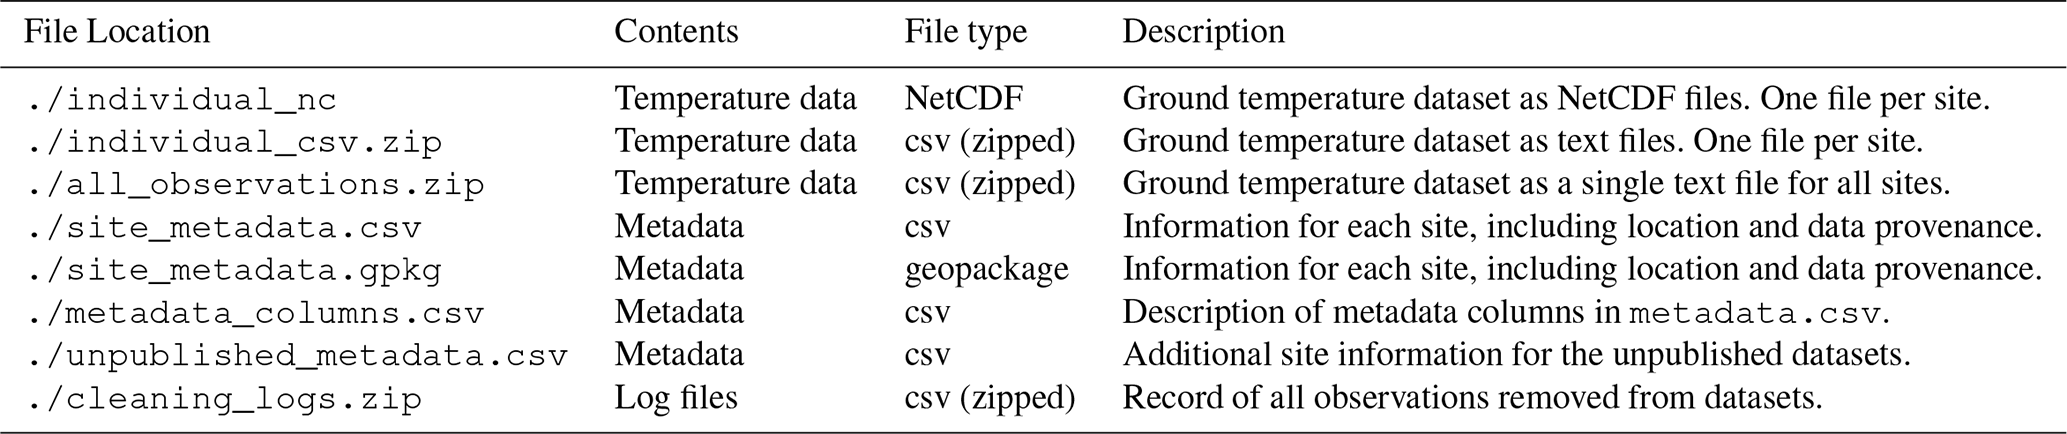
Data are provided in several formats to ensure the broadest possible user base (Table 2). Individual sites are exported as NetCDF datasets using the “Time Series of Profiles” discrete feature geometry available in the CF conventions (Eaton et al., 2020). These site-level datasets are self-describing and include relevant information on provenance and, where available, links to the original publication.
Table 2Summary of files included in dataset and their file types.
Permafrost dynamics are strongly affected by surface conditions (Brown, 1963; Goodrich, 1982). Best-practice for the establishment of monitoring sites involves descriptions of relevant surface variables and parameters describing vegetation, propensity for snow accumulation, moisture, and solar aspect. Despite progress in the standardization of this kind of metadata and auxiliary data within databases maintained by organizations (e.g. Karunaratne et al., 2015; Biskaborn et al., 2015; Cremonese et al., 2011), these values are still rarely reported and conventions are not fully harmonized between organizations. The standardization of metadata templates and vocabularies is beyond the scope of this work. Instead, those interested in using subsets of these temperature data for site-specific applications are encouraged to refer to the original data and related publications and cite them accordingly.
In-situ temperature sensors are subject to a range of issues that can affect the reliability and quality of the data. Some of these issues, such as temperature spikes or the surfacing of sensors by animals, are more apparent while others, such as sensor drift, are more subtle and can mimic real-world trends making them difficult to diagnose. Data owners are often in the best position to identify and interpret the causes of such aberrations. The documentation of QA/QC procedures is variable – from internal checks that are not reported in publications (e.g., Gruber et al., 2018) to detailed descriptions of issues and corrections (e.g., Fortier et al., 2025). The type of temperature sensor and its calibration status introduce additional uncertainty into the reported measurements, as sensor accuracy, precision, and resolution vary among instruments. Similarly, the positional accuracy of borehole coordinates depends on the method of acquisition. Where available, the original data sources should be consulted for documentation on study design, potential sensor failure, and surface and subsurface properties.
4.1 Instrumental error
Although the specific instrument used to measure ground temperature is sometimes provided in the source datasets, this is not always the case. However, the accuracy, resolution, and drift for common ground temperature sensors are tabulated in Brown and Gruber (2025), and these can be used alongside typical instrument precisions reported in this dataset to estimate instrumental error when it is missing. Reported accuracies from manufacturers range from 5 to 400 mK and precision ranges from <1 to 40 mK. We recommend conservative estimates of 400 and 40 mK for the instrumental accuracy and precision, respectively, for sites where these values are not provided. Instrumental noise, but not bias, will be reduced by daily averaging. Sensor drift reported by manufacturers is between 0.002 and 0.1 °C yr−1, but studies suggest it is often a nonlinear phenomenon caused by degradation of equipment under field conditions (Brown and Gruber, 2025). Drift is most readily detected at the ground surface via change to temperatures in successive zero-curtains (periods during thaw or freeze when temperature is steady near 0 °C). Drift at depths beneath the influence of seasonal temperature fluctuations can be suspected when a trend is present that is not visible in neighboring sensors. For this contributions, we checked for obvious signs of sensor drift during the manual inspection phase; confirmed drifting data was removed and suspected drift was flagged.
4.2 Calculation of daily means
The calculation of daily means from data of differing sampling frequencies introduces frequency- and amplitude-dependent error. We can consider the possible bias by approximating the daily temperature fluctuation as:
where Tavg is the true daily mean, A is the amplitude, and P is the period (1 d).
For data with only one observation per day, the sampling frequency is less than the Nyquist frequency for the diurnal signal and the observation can differ significantly from the true daily mean; biases as large as the amplitude A are possible.
For single observations per day, if we assume the sampling time-of-day is randomly distributed, we can use the definition of the standard error of the mean (SE)
along with the standard deviation for a sine wave (Smith, 1999).
to quantify more precisely the standard error of the mean as:
which, for n=1 yields .
Sampling rates between twice-daily and 2-hourly, while greater than the Nyquist frequency for the diurnal signal, are subject to bias that will depend on how much the daily temperatures deviate from a simple harmonic behaviour. These errors are difficult to quantify but will change in time and with different ground conditions. Zero-curtain behaviour in ice-rich ground will, for example, tend to worsen estimates of the daily mean.
For daily means calculated from sensors sampling at greater frequencies, we can estimate bias in a worst-case scenario where missing data is concentrated at the warmest or coldest part of the day:
which, for completeness ratios α of 70 % , 80 % and 90 % of available daily data evaluates to maximum (worst-case scenario) biases of roughly 36 %, 23 %, and 11 % of the amplitude at any given depth, based on Eq. (8). Completeness ratios can be estimated using the expected and total number of observations provided in the data (netcdf and aggregated csv file only: see Table 2). A description of typical amplitudes are provided below.
In all cases, averaging error is expected to scale with amplitude. In near-surface sensors, the amplitude changes significantly with both depth and season. Empirically, we find that the distribution of amplitude values is positively skewed and when partitioned according to whether the daily minimum temperature is above or below zero, the median amplitude is 3.28 °C in warm, unfrozen conditions (IQR = 5.20 °C) and 0.17 °C in cold conditions (IQR = 0.50 °C). Importantly, for depths below 1.8 m, the error on daily means is negligible (Appendix A).
Errors associated with the estimation of daily mean will affect applications comparing daily values between locations. However, this error is less significant when comparing trends between sites. Daily mean temperature bias caused by incomplete sampling or instrument bias will persist when calculating mean annual values.
The assumption of a simple harmonic diurnal cycle is most appropriate for conditions where latent heat effects are negligible. In near-zero temperature conditions where the effects of phase change dampen or distort the diurnal signal, the true bias may be greater than the worst-case estimates provided here. Riseborough and Burgess (1996), working with empirical ground temperature data to estimate MAGT in a context where latent heat effects are present, report a qualitatively similar pattern of estimation error: uncertainty increases with both temperature amplitude and sampling interval. This corroborates the behaviour predicted by our analytical approach.
4.3 UTC offsets
At 134 sites, the UTC offset of source datasets was not known with certainty. In these cases, we treated the data as though they were in UTC time. Within Canada, UTC offset ranges from −03:30 to −08:00. This introduces up to an 8 h offset in the means.
At an additional 64 sites, data were obtained as daily averages from observations in local time. Without original sub-daily measurements it was not possible to perform a time zone correction. For internal consistency and ease of use, we present all data as UTC daily means. However, for the 200 sites mentioned above, there is an additional source of error corresponding to the shift in sampling period. This is indicated as “possible_utc_error” in the data.
While the exact magnitude of these errors will depend on daily variability in the timing and magnitude of temperature peaks we can use a simplified model to get a first order approximation. Although the simple harmonic model described in Eq. (3) will not be affected by the UTC shift, we can add a linear temperature trend of magnitude b °C d−1. In this case, a shifted daily averaging window will introduce a bias of where Δt is the magnitude of the offset in hours. Bias will be greater when temperatures change more quickly: at shallower depths and unfrozen conditions. For this dataset, we calculate median GST changes using a 2 d lag to be 0.23 °C d−1 (IQR = 0.52 °C d−1) in cryotic conditions and 0.41 °C d−1 (IQR = 0.72 °C d−1) in non-cryotic conditions. For GT these values are 0.01 °C d−1 (IQR = 0.05 °C d−1) and 0.05 °C d−1 (IQR = 0.14 °C d−1) for cryotic and non-cryotic conditions, respectively. For a worst-case scenario of an 8 h offset in unfrozen ground near the surface, this corresponds to a bias of roughly 0.07 °C (median) up to 0.52 °C (90th percentile).
This bias, while typically small, will have the greatest impact when comparing data from affected sites to other records such as daily model outputs or meteorological observations. Site-level trends will be unaffected. Coarser aggregation to monthly or yearly averages will render the relative magnitude of the error insignificant, as will estimation of quantities like active layer thickness or depth of zero annual amplitude.
4.4 Estimation of expected sampling frequencies
Where available in the source publications, sampling frequencies were provided for pre-aggregated sites, whereas sampling frequencies for the subdaily sites were estimated using a binary segmentation algorithm. This was found to be reliable when data completeness was high or when measurement frequency did not change. However, at sites where data completeness is extremely sporadic, there is a greater uncertainty on estimates of data completeness. Also, during the transition period between sampling regimes, there will inherently be a day which is considered under sampled in the faster sampling regime but may be fully sampled in the slower sampling regime.
4.5 Sensor location
The accuracy of the site coordinates is not available for all sites. Where instrumental accuracies of coordinates are not provided, we estimate them to be on the order of 10 m for sites with data dating back to 2010 (recently established locations: modern GPS devices using multiple constellations), 20 m for sites with data dating back to 2000 (after which selective availability on GPS was turned off), and 50 m for sites with data dating back to before 2000 (based on GPS with selective availability or careful positioning on local maps).
Where elevation data were not available from primary sources, values were obtained using the Google Maps Elevation API. However, Google does not publicly disclose the underlying digital elevation model(s) used by this service, and the data sources may vary by geographic region and change over time as Google updates its mapping products. Consequently, the vertical accuracy of these elevation values cannot be independently verified or consistently reproduced in future studies. This represents a limitation of the present dataset, and users should be aware that any replication of this workflow at a later date may yield slightly different elevation values for the same locations. Error in sensor position will also increase the error of our “gap-filled” elevation estimates using the Google Maps API. Elevation uncertainty is rarely provided and should be conservatively estimated to be on the order of tens of metres.
4.6 Sensor depth
For individual GST loggers buried in the ground, the datalogger orientation, definition of the ground surface, and differences in protocols between research groups means depth values should be treated with uncertainties of ±5 cm. For ground temperature cables in boreholes, depths should also be assumed accurate to within ±5 cm. The spacing between sensors on thermistor strings in GT sites can be measured in advance and can be considered accurate to within 1 cm.
The depth at which sensors are positioned can change over time due to ground subsidence or frost-jacking of the borehole in which thermistors are installed. The effect of this can include the appearance of spurious temperature trends and changes to the amplitude of the daily and annual fluctuations over time. Although the most obvious of these errors will have been removed during the manual inspection process, there is still the possibility that more subtle errors persist. While these errors can be confidently detected by measuring changes to stick-up height – the distance between the ground surface and the top of the borehole – these measurements are rarely provided.
If changes in sensor position remain undetected, measurements will not be comparable across sites (e.g., temperatures from a subsidence-affected site compared with a bedrock site). Additionally, observations may not be directly comparable to model results during evaluation, unless the model explicitly represents processes such as ice loss and subsidence.
4.7 Bedrock and disturbance classification
Classification of sites as being disturbed or within bedrock was done based on site descriptions, photos, or existing classifications in the source datasets. Values of 1 (disturbed) should be treated with higher degree of confidence than 0 (undisturbed) because evidence of disturbance may have been missed, or not included in the source dataset. Values of −1 (unknown) were reserved for sites lacking any sort of supporting evidence but will likely tend to be undisturbed rather than disturbed because of the overall tendency of datasets to report disturbance explicitly. Therefore, applications categorizing sites into disturbance categories may find some success in treating unknown sites as undisturbed. Importantly, the categorization and significance of the disturbance is not universally standardized; natural background variation caused by proximity to a water body is treated the same as sites instrumented within a road. The group of disturbed sites should be expected to have more significant conceptual variability.
4.8 Spatial sampling bias
Although the dataset represents a variety of different climatic settings and terrain types, the spatial sampling of ground temperature monitoring is inherently biased. The drilling equipment used to establish permafrost monitoring sites is more suitable for fine-grained soils than diamicts, coarse blocky material, or bedrock. For this reason, we expect an over-representation of fine-grained soil among GT sites. Similarly, open areas are easier to drill and instrument than swamps, bogs, or dense bushes, so there will be a bias towards certain surface conditions. Nor should ground surface loggers be considered randomly sampled; in a given study region they may be intentionally placed to investigate the maximum variability within the landscape (e.g., Gruber et al., 2018), or to study a particular phenomena or terrain type. The sampling locations within the dataset are more numerous in the Yukon and Northwest Territories and in areas of relatively low relief. Conclusions about the general behaviour of permafrost must take into consideration this spatial bias.
For applications in which individual sensors were used to represent a larger area or grid cell, we would expect a slight cold bias in discontinuous or sporadic permafrost zones where sensors are often placed preferentially in colder ground that is more likely to be underlain by permafrost.
4.9 Depth bias
Individual sites have been separated by maximum measurement depth into ground surface temperature (<0.2 m) and ground temperature (>0.2 m) for ease of use. Ground temperature records may also include shallow measurements within the upper 0.2 m.
Sensor intervals for the ground temperature sites are variable and generally increase with depth. This can impact the reliability of derived information, including thaw depth estimates and talik detection. Maximum measurement depths are restricted by drilling equipment, subsurface conditions, or are determined by research specific purposes. As a result, sites with similar depths and sensor spacing often cluster according to drilling campaigns, and some boreholes may represent similar subsurface materials, as instrumentation frequently fails when encountering coarser materials.
5.1 Future standardization efforts
One limitation of the dataset presented here is the lack of detailed site metadata. This is due, in part, to the absence of such information in the source material, but also to the challenge of interoperability between data sources when such information exists. Records of “disturbance” for example are common in metadata descriptions but use different terminology, which often lacks a simple one-to-one correspondence (Karunaratne et al., 2015; Lipovsky et al., 2022).
Several metadata templates and sampling protocols for permafrost data have been developed by research programs and institutions (Karunaratne et al., 2015; Boike et al., 2022). These typically describe one or more of the following: what data should be collected, how it should be collected, how it should be stored (file type, structure, or schema), or how it should be shared (web protocols). Although a single, unified metadata or dataset template is unrealistic because of the differing needs of programs and organizations, it should be a priority to increase interoperability of data between existing organizations. There are a few first steps that can be taken to support this.
First, organizations with developed data or metadata templates should describe them fully to encourage adoption by others. Iterations should be versioned to allow for modification while ensuring that older data remains well-documented. Clear descriptions of file formats also make it possible to integrate them into unifying software libraries (e.g., Brown, 2022). To this end, we have included a detailed description of the file format standard for permafrost ground temperature data used by this dataset. It is included as File S2. The format is designed for ground temperature data and can be extended to include borehole data (interval measurements) and other non-temperature sensor data.
Second, the development of shared vocabularies within and across institutions will allow better site-level description across data sources. Authoritative community resources such as the permafrost glossary developed by Lewkowicz et al. (2025) can be used as a rich source for permafrost-specific terms such as landforms. These also have the benefit of including an agreed-upon definition. From a technical standpoint, a good start can be made by adopting and adapting tools and practices from other scientific disciplines to turn these vocabularies into digital resources (e.g., Intergovernmental Oceanographic Commission of UNESCO, 2019; Leadbetter et al., 2014). This will allow equivalencies or crosswalks to be made between different metadata terms to aggregate them in a repeatable, traceable way.
Finally, it is essential that the development of data and metadata protocols be done through collaboration between both permafrost modelers and field practitioners; increasingly, large monitoring installations will be made, and funded, in the context of Northern infrastructure projects where contributing to a global monitoring network is, at most, a secondary priority. Creating these interfaces will be a multi-year process requiring persistent investment and time commitment. It will also be an opportunity for better integrating field practices between differing groups and organizations, and for introducing new field practices that will be robust in a future when permafrost is increasingly dominated by thaw phenomena (Brown and Gruber, 2025).
5.2 Considerations toward a disciplinary norm
The Canadian Tri-Agency Research Data Management Policy (CIHR-NSERC-SSHRC, 2021) requires that digital research data supporting published conclusions be deposited in a trusted repository, while acknowledging that what counts as relevant data remains subject to disciplinary norms. In permafrost science, norms for sharing remain inconsistent despite clear calls for open data and interoperability (Laurie, 2017; Karunaratne et al., 2025). While capacity constraints limit the ability to manage and publish data, fears of being scooped, losing publication opportunities, or misuse of data also continue to limit sharing behaviour, a pattern observed broadly across science and known to reduce research impact and efficiency (e.g., Christensen et al., 2019; Tedersoo et al., 2021; Colavizza et al., 2024).
Progress toward stronger data stewardship is underway in Canada through inter-agency cooperation (Karunaratne et al., 2025), investments in tools and standards (Brown, 2022; Brown et al., 2025), and community building through events (e.g., Brown et al., 2020; Laurie, 2017) and efforts such as this contribution. Establishing a durable disciplinary norm will require socio-technical support that lowers the burden on data providers and encourages across government, academia, and professional societies. This must also coincide with support and continued funding for field specialists and technicians without whom the instrumentation, maintenance, and data acquisition would not be possible.
As an Arctic nation, Canada has both a responsibility and an opportunity to lead in the stewardship of permafrost data (see also Gruber et al., 2023). Building scientific sovereignty – maintaining the capacity to generate, manage, and interpret northern data – can go hand in hand with enabling collaboration and contributing high-quality, interoperable data for global benefit.
A stable, archived version of the data is available at https://doi.org/10.5281/zenodo.18022924 (Meier-Legault et al., 2025). Data can also be accessed from https://data.permafrostnet.ca/erddap/tabledap/canadian_ground_temperature (last access: 21 July 2026) using either a browsable web interface or an API.
The python packages teaspoon and tspmetrics used to process the ground temperature data are available on PyPi.
The permafrost ground temperature collection was created to increase the accessibility and usability of ground temperature observations for national-scale aggregate permafrost research in Canada. The collection was enabled by contributions from universities and from federal and territorial governments, encompassing 427 GT and 491 GST sites across British Columbia, Labrador, Northwest Territories, Nunavut, Québec, and Yukon. Without increased accessibility and usability, the societal benefits from the large public investment in permafrost ground-temperature monitoring cannot materialize completely. Future efforts toward standardized data and metadata practices, along with increased publication of ground temperature records, will support more coordinated assessments of permafrost change.
To estimate the cut-off depth below which daily variation can be ignored in the calculation of daily means, we consider the behaviour of temperature oscillations in quartz. We choose this for its high thermal diffusiviy as a reasonable end-member material which will most closely approximate quartzite bedrock. According to the heat flow equation (Monteith and Unsworth, 2013), temperature amplitude attenuates with depth according to:
where z is depth, k is thermal conductivity, c is volumetric heat capacity, ω is angular frequency (86 400 s−1 for the daily temperature oscillation), and A0 is the amplitude at the boundary. For quartzite, we use an estimate of m2 s−1 for the thermal diffusivity κ (Monteith and Unsworth, 2013). We empirically estimate A0 by calculating the greatest rolling 24 h range for the observation period at each site with sub-daily data and using the 99.5th percentile as a maximum A0 value. A total of 558 sites were used, and resulted in an A0 value of 20 °C.
To find a cutoff depth at which the amplitude is attenuated to less than 0.1 °C, we solve
to get a cut-off depth of 1.8 m.
The supplement related to this article is available online at https://doi.org/10.5194/essd-18-7515-2026-supplement.
Conceptualization: NB, OML, SG, ACh, DFo, DC, DFr, FG, JY, MAl, ML, MP, PL, RC, SC, WQ; Data curation: AA, ACh, ACa, ESJ, EG, GJ, GD, HM, JY, LM, LM, LC, ML, MP, NB, OML, PF, SB, SG, SG, SC, VP; Formal analysis: AA, ACh, EG, GD, JY, LM, LM, LC, ML, OC, PF, SG; Funding acquisition: DFo, DC, DFr, FG, JC, LP, NP, SG, WQ; Investigation: AA, AB, AL, ACa, AR, DS, DC, ESJ, EL, GJ, GA, HM, LM, LA, LP, MAD, MG, MAl, NB, OC, OML, PF, SB, SG, SC, SK, VF, VP; Methodology: DC, GD, LM, LC, MP, NB, OC, PL, RC, SG, WQ; Project administration: DFo, DFr, GA, LA, LP, MAD, MAl, MP, NP, PL; Resources: DC, JC; Software: ESJ, HM, NB, OML, SG, VP; Supervision: DC, FG, GA, JC, LA, MAD, SG; Validation: LM; Visualization: MP; Writing – original draft: ESJ, NB, VP; Writing – review & editing: AR, DC, NB, OML, RC, SG, VP.
Note that author contributions have been solicited from data contributors to reflect the contributions to the source datasets.
Stephan Gruber is the owner of Cryogeeks (13756378 Canada Inc.), which distributes GeoPrecision equipment, referred to in this study for describing sensing systems. The authors declare that they have no other competing interests.
Publisher's note: Copernicus Publications remains neutral with regard to jurisdictional claims made in the text, published maps, institutional affiliations, or any other geographical representation in this paper. The authors bear the ultimate responsibility for providing appropriate place names. Views expressed in the text are those of the authors and do not necessarily reflect the views of the publisher.
The authors would like to acknowledge the colleagues and organizations that supported the research and data compilation referenced in this work. For contributions to the published datasets, we thank Jean-Michel Lemieux, Richard Fortier, Michel Allard, and Denis Sarrazin for Fortier et al. (2025), with additional thanks to Jean-Michel Lemieux and Denis Sarrazin for their work on Fortier et al. (2023). We are grateful to Gerry Atatahak for his contribution to Kugluktuk Permafrost Research Team (2023). We thank Kumari Karunaratne and Julia Riddick for their contributions to Gruber et al. (2018) and Brown et al. (2022); to Christian Peart, Steven V. Kokelj, and Olivia Meier-Legault for additional work on Gruber et al. (2018); to Barrett Elliot for funding support for Gruber et al. (2018); and to Rupesh Subedi for his contributions to both Gruber et al. (2018) and Stewart-Jones et al. (2023). We also thank Thomas Knecht and Stuart MacDonald for their work on Stewart-Jones et al. (2023). For Kugluktuk Permafrost Research Team (2023), we extend our sincere thanks to OJ Berhardt, Eustace Andy, Liam Mulgrew, Andrew Jack Atatahak, Zachary Kunana, Kevin Kamoayok, Aili Pedersen, Jasmine Tiktalek, Shannon Evetalegak, Alysha Maksagak, Jennifer Kilabuk, Joanna MacDonald, Samantha Page, Sara Holzman, the Kugluktuk HTO. For Ensom et al. (2020) we thank Kelly Kamo McHugh. We acknowledge the valuable contribution of data to the Yukon Permafrost Database by Western Copper and Gold Corporation, Newmont Corporation, Highways and Public Works (Yukon Government), Assessment and Abandoned Mines (Yukon Government), and Parks Canada.
For unpublished datasets, we thank John Clague for his guidance during the early development and data collection for the F. Gauthier dataset at Simon Fraser University, which was also supported by the Fonds institutionnel de recherche (FIR) from the Université du Québec à Rimouski. For site installation, we thank Pia Blake for the S. Gruber (a) dataset, and Ariane Castagner and Steven V. Kokelj for the S. Gruber (b) dataset. We are also grateful to Mederic Lorry, Jeffrey Campbell, and Jonathan Yakeleya for their assistance with the A. Chiasson, J. Young, and M. Landry datasets. We thank Andrew Leung for pointing us to the existence of the ECCC ground temperature data that is now contained in this report.
We gratefully acknowledge the Indigenous Peoples on whose lands these data were collected, including the Sahtu Dene and Métis of the Central Mackenzie Valley, the Dehcho First Nations, including the Liidlii Kue First Nation, Jean-Marie River First Nation and Sambaa K'e First Nation, the Tłıçho̧ First Nations, the Akaitcho Dene First Nations, Teslin Tlingit Council, Champagne and Aishihik First Nations, Kluane First Nation, White River First Nation, Nacho Nyak Dun First Nation, Kwanlin Dün First Nation, Ta'an Kwäch'än Council, Kaska Dena First Nation, Little Salmon Carmacks First Nation, Selkirk First Nation, Tr'ondek Hwëch'in First Nation, Vuntut Gwitchin First Nation, Tetlit Gwich'in, Beaver First Nation, the St'at'imc First Nations, the Tŝilhqot'in First Nations, the Squamish First Nations, the Nuxalkmc, the Inuvialuit, the Inuit of Nunavik, Québec, the Mi'kmaq of the Gaspé Peninsula, Québec, the Inuit of Nunatsiavut, Labrador, and the community of Tulít'a, the Hamlets of Kugluktuk and Cambridge Bay, and the Scotty Creek Research Station.
Note that acknowledgments have been solicited from all data contributors to appropriately reflect contributions to the source datasets.
This is YGS Contribution No. 086 and NTGS Contribution No. 0171.
This work was made possible through significant funding and logistical support. The Slave Province Surficial Materials and Permafrost Study (SPSMPS), supported by the Canadian Northern Economic Development Agency (CanNor), Dominion Diamond Mines, and the Northwest Territories Geological Survey for Gruber et al. (2018). Additional funding was provided by the Polar Continental Shelf Program (Project #65115), ArcticNet (“Permafrost research for northern infrastructures and improved community life”), and equipment was available via the “Quantifying the Hidden Thaw” project, supported by the Canada Foundation for Innovation and the Ontario Research Fund. Funding for the A. Chiasson (unpublished) dataset was made available through the Fonds de recherche du Québec – Nature et technologie and the Weston Family Awards in Northern Research. The S. Coulombe (unpublished dataset) and (Kugluktuk Permafrost Research Team, 2023) was supported by Crown-Indigenous Relations and Northern Affairs Canada via the “Climate Change Preparedness in the North Program”. Funding for the J. Crompton (unpublished) dataset was provided by NRCan through their Natural Hazards and Climate Change Geoscience Program and by NSERC through the Postdoctoral Fellowships program.
This research has been supported by the Natural Sciences and Engineering Research Council of Canada (grant nos. NETGP 523228-18, RGPIN-2015-06456, RGPIN-2016-05839, RGPIN-2020-04783, RGPIN-2020-07229, and ALLRP 572203-22), the ArcticNet (grant no. P02), and the National Science Foundation (grant nos. OPP-0120736, ARC-0632400, ARC-0520578, ARC-0612533, ARC-1304271, and ARC-1832238).
This research was supported by NSERC PermafrostNet (NETGP 523228-18) and enabled by support provided by Compute Ontario and the Digital Research Alliance of Canada (RPP 772). Additional support was received from the Government of Canada via the project Development of a Performant Permafrost Climate Services Framework (GCXE26S061).
This paper was edited by Achim A. Beylich and reviewed by two anonymous referees.
Allard, M., Sarrazin, D., and l'Hérault, E.: Températures du sol dans des forages et près de la surface dans le nord-est du Canada, v. 1.6.0 (1998–2023), D8, Nordicana [data set], https://doi.org/10.5885/45291SL-34F28A9491014AFD, 2024. a
Arsenault, R., Bazile, R., Ouellet Dallaire, C., and Brissette, F.: CANOPEX: A Canadian hydrometeorological watershed database, Hydrol. Process., 30, 2734–2736, https://doi.org/10.1002/hyp.10880, 2016. a
Bavay, M., Fiddes, J., and Godøy, Ø.: Automatic data standardization for the Global Cryosphere Watch Data Portal, Data Sci. J., 19, https://doi.org/10.5334/dsj-2020-006, 2020. a, b
Biskaborn, B. K., Lanckman, J.-P., Lantuit, H., Elger, K., Streletskiy, D. A., Cable, W. L., and Romanovsky, V. E.: The new database of the Global Terrestrial Network for Permafrost (GTN-P), Earth Syst. Sci. Data, 7, 245–259, https://doi.org/10.5194/essd-7-245-2015, 2015. a, b, c, d
Biskaborn, B. K., Smith, S. L., Noetzli, J., Matthes, H., Vieira, G., Streletskiy, D. A., Schoeneich, P., Romanovsky, V. E., Lewkowicz, A. G., Abramov, A., Allard, M., Boike, J., Cable, W. L., Christiansen, H. H., Delaloye, R., Diekmann, B., Drozdov, D., Etzelmüller, B., Grosse, G., Guglielmin, M., Ingeman-Nielsen, T., Isaksen, K., Ishikawa, M., Johansson, M., Johannsson, H., Joo, A., Kaverin, D., Kholodov, A., Konstantinov, P., Kröger, T., Lambiel, C., Lanckman, J.-P., Luo, D., Malkova, G., Meiklejohn, I., Moskalenko, N., Oliva, M., Phillips, M., Ramos, M., Sannel, A. B. K., Sergeev, D., Seybold, C., Skryabin, P., Vasiliev, A., Wu, Q., Yoshikawa, K., Zheleznyak, M., and Lantuit, H.: Permafrost is warming at a global scale, Nat. Commun., 10, 264, https://doi.org/10.1038/s41467-018-08240-4, 2019. a
Boeckli, L., Brenning, A., Gruber, S., and Noetzli, J.: A statistical approach to modelling permafrost distribution in the European Alps or similar mountain ranges, The Cryosphere, 6, 125–140, https://doi.org/10.5194/tc-6-125-2012, 2012. a
Boike, J., Chadburn, S., Martin, J., Zwieback, S., Althuizen, I. H., Anselm, N., Cai, L., Coulombe, S., Lee, H., Liljedahl, A. K., Schneebeli, M., Sjöberg, Y., Smith, N., Smith, S. L., Streletskiy, D. A., Stuenzi, S. M., Westermann, S., and Wilcox, E. J.: Standardized monitoring of permafrost thaw: a user-friendly, multiparameter protocol, Arctic Science, 8, 153–182, https://doi.org/10.1139/as-2021-0007, 2022. a
Brown, N.: tsp (“Teaspoon”): a library for ground temperature data, Journal of Open Source Software, https://doi.org/10.21105/joss.04704, 2022. a, b, c, d, e, f
Brown, N.: PermafrostNet ERDDAP metadata profile, Zenodo, https://doi.org/10.5281/ZENODO.18112261, 2026. a
Brown, N. and Gruber, S.: Beyond MAGT: learning more from permafrost thermal monitoring data with additional metrics, The Cryosphere, 20, 1771–1796, https://doi.org/10.5194/tc-20-1771-2026, 2026. a, b, c
Brown, N., Gruber, S., Pulsifer, P., and Stewart-Jones, E.: Permafrost Data Workshop 2020: Final Report, Tech. rep., Carleton University, Ottawa, https://doi.org/10.22215/pn/10120001, 2020. a
Brown, N., Stewart-Jones, E., Riddick, J., Meier-Legault, O., Kokelj, S., Karunaratne, K., and Gruber, S.: Air and ground temperature, air humidity and site characterization data from the Canadian Shield taiga near Yellowknife, Northwest Territories, Canada, v. 1.0 (2016–2021), D108, Nordicana [data set], https://doi.org/10.5885/45810XD-C9F549F3E93040BD, 2022. a, b
Brown, N., Gruber, S., Pulsifer, P., and Hayes, A.: A prototype field-to-publication data system for a multi-variable permafrost observation network, Environ. Modell. Softw., 175, 106006, https://doi.org/10.1016/j.envsoft.2024.106006, 2024. a, b, c, d
Brown, N., Gao, A., and Parker, R.: tempcf: cleaning and filtering for ground temperature data, Zenodo, https://doi.org/10.5281/zenodo.17469293, 2025. a, b
Brown, R. J. E.: Influence of vegetation on permafrost, in: Permafrost International Conference, 20–25, Building Research Advisory Board at Purdue University, Collection/Collection: NRC Publications Archive/Archives des publications du CNRC, https://nrc-publications.canada.ca/eng/view/object/?id=4c989143-5d15-4404-9363-db1742108798 (last access: 21 July 2026), 1963. a
Cao, B., Gruber, S., Zheng, D., and Li, X.: The ERA5-Land soil temperature bias in permafrost regions, The Cryosphere, 14, 2581–2595, https://doi.org/10.5194/tc-14-2581-2020, 2020. a
CEN (Centre d'études nordiques): Données des stations climatiques de la région de Whapmagoostui-Kuujjuarapik au Nunavik, Québec, Canada, v. 1.5 (1987–2019), D4, Nordicana [data set], https://doi.org/10.5885/45057SL-EADE4434146946A7, 2020a. a
CEN (Centre d'études nordiques): Données des stations climatiques de la région du Lac à l'Eau claire au Nunavik, Québec, Canada, v. 1.1 (1986–2019), D57, Nordicana [data set], https://doi.org/10.5885/45475SL-5A33FE09B0494D92, 2020b. a
CEN (Centre d'études nordiques): Données des stations climatiques de la région de Salluit au Nunavik, Québec, Canada, v. 1.7.0 (1987–2023), D3, Nordicana [data set], https://doi.org/10.5885/45048SL-4708BCCDFA124359, 2024a. a
CEN (Centre d'études nordiques): Données des stations climatiques de la région de la rivière Boniface au Nunavik, Québec, Canada, v. 1.4.0 (1988–2022), D7, Nordicana [data set], https://doi.org/10.5885/45129SL-DBDA2A77C0094963, 2024b. a
CEN (Centre d'études nordiques): Données des stations climatiques d'Umiujaq au Nunavik, Québec, Canada, v. 1.9.0 (1997–2023), D9, Nordicana [data set], https://doi.org/10.5885/45120SL-067305A53E914AF0, 2024c. a
Christensen, G., Dafoe, A., Miguel, E., Moore, D. A., and Rose, A. K.: A study of the impact of data sharing on article citations using journal policies as a natural experiment, PLOS ONE, 14, e0225883, https://doi.org/10.1371/journal.pone.0225883, 2019. a
CIHR-NSERC-SSHRC: Tri-Agency Research Data Management Policy, Government of Canada: Canadian Institutes of Health Research (CIHR), Natural Sciences and Engineering Research Council of Canada (NSERC), Social Sciences and Humanities Research Council of Canada (SSHRC), https://science.gc.ca/site/science/en/interagency-research-funding/policies-and-guidelines/research-data-management/tri-agency-research-data-management-policy (last access: 27 October 2025), 2021. a
Colavizza, G., Cadwallader, L., LaFlamme, M., Dozot, G., Lecorney, S., Rappo, D., and Hrynaszkiewicz, I.: An analysis of the effects of sharing research data, code, and preprints on citations, PLoS ONE, 19, https://doi.org/10.1371/journal.pone.0311493, 2024. a
Connon, R. and Quinton, W.: Permafrost ground temperature report: Scotty Creek Research Station, Northwest Territories, NWT Open Report 2019-007, Northwest Territories Geological Survey, https://doi.org/10.46887/2019-007, 2020. a
Cox, S. J., Gonzalez-Beltran, A. N., Magagna, B., and Marinescu, M. C.: Ten simple rules for making a vocabulary FAIR, PLoS Comput. Biol., 17, 1–15, https://doi.org/10.1371/journal.pcbi.1009041, 2021. a
Cremonese, E., Gruber, S., Phillips, M., Pogliotti, P., Boeckli, L., Noetzli, J., Suter, C., Bodin, X., Crepaz, A., Kellerer-Pirklbauer, A., Lang, K., Letey, S., Mair, V., Morra di Cella, U., Ravanel, L., Scapozza, C., Seppi, R., and Zischg, A.: Brief Communication: “An inventory of permafrost evidence for the European Alps”, The Cryosphere, 5, 651–657, https://doi.org/10.5194/tc-5-651-2011, 2011. a
Deng, J., Dong, W., Socher, R., Li, L., Li, K., and Fei-Fei, L.: ImageNet: a large-scale hierarchical image database, in: 2009 IEEE Conference on Computer Vision and Pattern Recognition (CVPR), Institute of Electrical and Electronics Engineers (IEEE), 248–255, https://doi.org/10.1109/CVPR.2009.5206848, 2009. a
Devoie, É. G., Gruber, S., and McKenzie, J. M.: A repository of measured soil freezing characteristic curves: 1921 to 2021, Earth Syst. Sci. Data, 14, 3365–3377, https://doi.org/10.5194/essd-14-3365-2022, 2022. a
Duchesne, C., Morse, P. D., Wolfe, S. A., and Kokelj, S. V.: Report on 2010-2015 permafrost thermal investigations in the Yellowknife area, Northwest Territories, Tech. Rep. Open File 8093, Geological Survey of Canada, https://doi.org/10.4095/299189, 2016. a
Duchesne, C., Smith, S., Chartrand, J., and Parker, R.: Daily ground temperatures from selected sites between 2006–2018 in the Mackenzie Valley, Northwest Territories, Canada, Mendeley Data [data set], https://doi.org/10.17632/w6jypmm87c.1, 2025. a, b
Eaton, B., Gregory, J., Drach, B., Taylor, K., Hankin, S., Caron, J., Signell, R., Bentley, P., Rappa, G., Höck, H., Pamment, A., Juckes, M., Raspaud, M., Horne, R., Whiteaker, T., Blodgett, D., Zender, C., and Lee, D.: NetCDF Climate and Forecast (CF) metadata conventions v1.8, http://cfconventions.org/Data/cf-conventions/cf-conventions-1.8/cf-conventions.html (last access: 21 July 2026), 2020. a
Ensom, T., Kokelj, S. V., and Kamo McHugh, K.: Permafrost ground temperature report: Inuvik to Tuktoyaktuk Highway stream crossing and alignment sites, Northwest Territories, NWT Open Report 2019-014, Northwest Territories Geological Survey, https://doi.org/10.46887/2019-014, 2020. a, b
Fiddes, J., Endrizzi, S., and Gruber, S.: Large-area land surface simulations in heterogeneous terrain driven by global data sets: application to mountain permafrost, The Cryosphere, 9, 411–426, https://doi.org/10.5194/tc-9-411-2015, 2015. a
Fortier, D. and Chen, L.: Températures au sol de la sous-base et du sol de remblai à Beaver Creek, Yukon – tronçon expérimental routier 2008-2018, v. 1.0 (2008–2018), D68, Nordicana [data set], https://doi.org/10.5885/45642CE-6883D8FF051E4E4B, 2020. a
Fortier, D. and Chen, L.: Température du sol sous remblai non atténué et en milieu naturel le long de la Alaska Highway au Beaver Creek – tronçon expérimental routier, Yukon, Canada (1997–2007), v. 1.0 (1997–2007), D102, Nordicana [data set], https://doi.org/10.5885/45789CE-B06C83701915428A, 2022a. a
Fortier, D. and Chen, L.: Température du sol sous remblai non atténué le long de la Alaska Highway au Beaver Creek - tronçon expérimental routier, Yukon, Canada (2008–2018), v. 1.0 (2008–2018), D103, Nordicana [data set], https://doi.org/10.5885/45792CE-4ED6653E854B44F1, 2022b. a
Fortier, D. and Davesne, G.: Le régime d'enneigement et de température d'une plaque glace permanente, île Ward Hunt, Nunavut, Canada, v. 1.0 (2017–2019), D91, Nordicana [data set], https://doi.org/10.5885/45720CE-0F556C84D96948F7, 2021. a
Fortier, D., Sliger, M., Gagnon, S., and Rioux, K.: Température du sol et de l'air sous deux abris le long de la Alaska Highway au Beaver Creek Road Experimental Site, Yukon, Canada, v. 1.0 (2008–2019), D89, Nordicana [data set], https://doi.org/10.5885/45708CE-073B968F9A2B496E, 2021a. a
Fortier, D., Sliger, M., Gagnon, S., and Rioux, K.: Température du sol en milieu naturel le long de la Alaska Highway au Beaver Creek Road Experimental Site, Yukon, Canada, v. 1.0 (2008–2020), D94, Nordicana [data set], https://doi.org/10.5885/45738CE-D75F3C9342D34C83, 2021b. a
Fortier, P. and Lemieux, J.-M.: Données de teneur en eau volumétrique et de température du sol, vallée Tasiapik, Nunavik, Canada (2014–2021), D109, Nordicana [data set], https://doi.org/10.5885/45774CE-134B067EE2A54B11, 2023. a
Fortier, P., Lemieux, J.-M., and Sarrazin, D.: Données de flux de chaleur et de température à la surface du sol, vallée Tasiapik, Nunavik, Canada (2014–2021), v. 1.0 (2014–2021), D111, Nordicana [data set], https://doi.org/10.5885/45780CE-5B08A469E16041D5, 2023. a, b
Fortier, P., Fortier, R., Allard, M., Lemieux, J.-M., and Sarrazin, D.: Subsurface ground temperature data from an instrumented permafrost mound, Tasiapik Valley, Umiujaq, Nunavik, Québec, Canada (2001–2024), Borealis [data set], https://doi.org/10.5683/SP3/QSRW0I, 2025. a, b, c
Goodrich, L. E.: The influence of snow cover on the ground thermal regime, Can. Geotech. J., 19, 421–432, https://doi.org/10.1139/t82-047, 1982. a
Government of Yukon: Yukon permafrost database, https://service.yukon.ca/permafrost, last access: 18 September 2025. a
Gruber, S., Brown, N., Stewart-Jones, E., Karunaratne, K., Riddick, J., Peart, C., Subedi, R., and Kokelj, S.: Température de l'air et du sol, humidité de l'air et données de caractérisation des sites dans une région de toundra du bouclier canadien, Lac de Gras, Territoires du Nord-Ouest, Canada, v. 1.0 (2015–2017), D39, Nordicana [data set], https://doi.org/10.5885/45561XD-2C7AB3DCF3D24AD8, 2018. a, b, c, d, e, f, g, h
Gruber, S., Hayley, J., Karunaratne, K., King, J., MacLean, T., Marshall, S., and Moore, D.: Considerations toward a vision and strategy for permafrost knowledge in Canada, Arctic Science, https://doi.org/10.1139/as-2023-0016, 2023. a
Harp, D. R., Atchley, A. L., Painter, S. L., Coon, E. T., Wilson, C. J., Romanovsky, V. E., and Rowland, J. C.: Effect of soil property uncertainties on permafrost thaw projections: a calibration-constrained analysis, The Cryosphere, 10, 341–358, https://doi.org/10.5194/tc-10-341-2016, 2016. a
Hasler, A., Gruber, S., and Beutel, J.: Kinematics of steep bedrock permafrost, J. Geophys. Res., 117, F01016, https://doi.org/10.1029/2011JF001981, 2012. a
Hassell, D., Gregory, J., Blower, J., Lawrence, B. N., and Taylor, K. E.: A data model of the Climate and Forecast metadata conventions (CF-1.6) with a software implementation (cf-python v2.1), Geosci. Model Dev., 10, 4619–4646, https://doi.org/10.5194/gmd-10-4619-2017, 2017. a
Heginbottom, J. A., Dubreuil, M. A., and Harker, P. T.: Canada, permafrost, Natural Resources Canada, https://doi.org/10.4095/294672, 1995. a, b
Herring, T., Lewkowicz, A. G., Chiasson, A., Wang, Y., Way, R. G., Young, J. M., Froese, D., Smith, S. L., Andersen, B., Bellehumeur-Génier, O., Bevington, A. R., Bonnaventure, P. P., Duguay, M. A., Etzelmüller, B., Gooseff, M. N., Godsey, S. E., and Miceli, C. M.: The Canadian permafrost electrical resistivity survey (CPERS) database: 15 years of permafrost resistivity data, Arctic Science, 10, 850–856, https://doi.org/10.1139/as-2023-0058, 2024. a, b
Intergovernmental Oceanographic Commission of UNESCO: Ocean Data Standards, Vol. 4: Technology for SeaDataNet controlled vocabularies for describing marine and oceanographic datasets – a joint proposal by SeaDataNet and ODIP projects, IOC Manuals and Guides 54, Vol. 4, IODE/UNESCO, Ostend, Belgium, https://unesdoc.unesco.org/ark:/48223/pf0000187831 (last access: 21 July 2026), 2019. a
Karunaratne, K., Kokelj, S., Palmer, M., Wolfe, S., and Gruber, S.: Metadata protocol for ground temperature records in the Northwest Territories, in: Proceedings of the GeoQuebec 2015 Conference, 20–23 September, Quebec, Canada, 8 pp., 2015. a, b, c, d, e
Karunaratne, K., Relf, C., and Talwar, S.: Working collaboratively to improve permafrost data availability for Canada, in: GeoManitoba 2025: 78th Annual CGS Conference & 9th Canadian Permafrost Conference, Winnipeg, Manitoba, Canada, presented at the RBC Convention Centre, The Canadian Geotechnical Society, 2025. a, b
Kugluktuk Permafrost Research Team: Température du sol à Kugluktuk, Nunavut, Canada, v. 1.1.0 (2019–2023), D120, Nordicana [data set], https://doi.org/10.5885/45852CE-5C9390F6248C47D1, 2023. a, b, c, d
Lange, S., Grünberg, I., Bornemann, N., Lehr, C., Cable, W., and Boike, J.: Permafrost long term observatories of the Alfred-Wegener-Institute, Zenodo, https://doi.org/10.5281/ZENODO.4786984, 2021. a
Laurie, M.: Workshop report: toward a Canadian permafrost network, Tech. rep., NSERC PermafrostNet, Ottawa, Canada, https://doi.org/10.22215/pn/10117001, 2017. a, b
Leadbetter, A. M., Lowry, R. K., and Clements, D. O.: Putting meaning into NETMAR – the open service network for marine environmental data, Int. J. Digit. Earth, 7, 811–828, https://doi.org/10.1080/17538947.2013.781243, 2014. a
Lewkowicz, A., O'Neill, H., Wolfe, S., Roy-Léveillée, P., Roujanski, V. E., Hoeve, E., Gruber, S., Brooks, H., Rudy, A., Koenig, C., Brown, N., and Bonnaventure, P.: Glossary of permafrost science and engineering, University of Toronto Press, Canadian Permafrost Association, https://doi.org/10.3138/cpa-gpse, 2025. a, b
Lin, T., Maire, M., Belongie, S., Hays, J., Perona, P., Ramanan, D., Dollár, P., and Zitnick, C. L.: Microsoft COCO: Common Objects in Context, in: Computer Vision – ECCV 2014, vol. 8693 of Lecture Notes in Computer Science, 740–755, Springer, https://doi.org/10.1007/978-3-319-10602-1_48, 2014. a
Lipovsky, P., Humphries, J., Stewart-Jones, E., and Cronmiller, D.: Yukon Permafrost Database: A new baseline data resource, in: Yukon Exploration and Geology 2021, edited by: MacFarlane, K., 37–49, Yukon Geological Survey, 2022. a, b, c
Macdonell, H. G.: A statistical ranking framework for ground temperature simulations in permafrost environments, Master's thesis, Carleton University, https://doi.org/10.22215/etd/2025-16379, 2025. a
Meier-Legault, O., Brown, N., Gruber, S., Adjun, L., Allard, M., Alvarez, A., Atatahak, G., Auclair, M., Bevington, A., Bilodeau, S., Cable, W., Carpino, O., Castagner, A., Chen, L., Chiasson, A., Connon, R., Coulombe, S., Crompton, J., Cronmiller, D., Davesne, G., Dominico, M., Ducharme, M.-A., Ensom, T., Farquharson, L., Foord, V., Fortier, D., Fortier, P., Froese, D., Gagnon, S., Gauthier, F., Geertsema, M., Godin, E., Jonat, G., Kokelj, S. V., Landry, M., Lewkowicz, A., Lipovsky, P., L’Hérault, E., Macdonell, H., Massé, L., Nicolsky, D., Painter, M., Papatsie, L., Pozsgay, V., Quinton, W., Romanovsky, V., Rudy, A. C., Sarrazin, D., Stewart-Jones, E., Walker, D., Wright, T., and Young, J.: A standardized permafrost ground temperature collection for Canada 2025, Zenodo [data set], https://doi.org/10.5281/zenodo.18022924, 2025. a, b, c
Melton, J. R. and Arora, V. K.: Competition between plant functional types in the Canadian Terrestrial Ecosystem Model (CTEM) v. 2.0, Geosci. Model Dev., 9, 323–361, https://doi.org/10.5194/gmd-9-323-2016, 2016. a
Melton, J. R., Verseghy, D. L., Sospedra-Alfonso, R., and Gruber, S.: Improving permafrost physics in the coupled Canadian Land Surface Scheme (v.3.6.2) and Canadian Terrestrial Ecosystem Model (v.2.1) (CLASS-CTEM), Geosci. Model Dev., 12, 4443–4467, https://doi.org/10.5194/gmd-12-4443-2019, 2019. a
Mohammadi, Z. and Hayley, J. L.: Compilation and analysis of thaw settlement test results: implications for prediction tools and stress–strain characterization in permafrost, Earth Syst. Sci. Data, 17, 3921–3947, https://doi.org/10.5194/essd-17-3921-2025, 2025. a
Monteith, J. L. and Unsworth, M. H.: Principles of environmental physics: plants, animals, and the atmosphere, Academic Press, Oxford, 4th edn., ISBN 9780123869104, 2013. a, b
Northwest Territories Permafrost Database Technical Working Group: Guide to producing a ground temperature report, NWT Open Report 2017-008, Northwest Territories Geological Survey, https://doi.org/10.46887/2017-008, 2019. a
Pastorello, G., Trotta, C., Canfora, E., Chu, H., Christianson, D., Cheah, Y.-W., Poindexter, C., Chen, J., Elbashandy, A., Humphrey, M., Isaac, P., Polidori, D., Reichstein, M., Ribeca, A., van Ingen, C., Vuichard, N., Zhang, L., Amiro, B., Ammann, C., Arain, M. A., Ardö, J., Arkebauer, T., Arndt, S. K., Arriga, N., Aubinet, M., Aurela, M., Baldocchi, D., Barr, A., Beamesderfer, E., Marchesini, L. B., Bergeron, O., Beringer, J., Bernhofer, C., Berveiller, D., Billesbach, D., Black, T. A., Blanken, P. D., Bohrer, G., Boike, J., Bolstad, P. V., Bonal, D., Bonnefond, J.-M., Bowling, D. R., Bracho, R., Brodeur, J., Brümmer, C., Buchmann, N., Burban, B., Burns, S. P., Buysse, P., Cale, P., Cavagna, M., Cellier, P., Chen, S., Chini, I., Christensen, T. R., Cleverly, J., Collalti, A., Consalvo, C., Cook, B. D., Cook, D., Coursolle, C., Cremonese, E., Curtis, P. S., D’Andrea, E., da Rocha, H., Dai, X., Davis, K. J., Cinti, B. D., Grandcourt, A. d., Ligne, A. D., De Oliveira, R. C., Delpierre, N., Desai, A. R., Di Bella, C. M., Tommasi, P. d., Dolman, H., Domingo, F., Dong, G., Dore, S., Duce, P., Dufrêne, E., Dunn, A., Dušek, J., Eamus, D., Eichelmann, U., ElKhidir, H. A. M., Eugster, W., Ewenz, C. M., Ewers, B., Famulari, D., Fares, S., Feigenwinter, I., Feitz, A., Fensholt, R., Filippa, G., Fischer, M., Frank, J., Galvagno, M., Gharun, M., Gianelle, D., Gielen, B., Gioli, B., Gitelson, A., Goded, I., Goeckede, M., Goldstein, A. H., Gough, C. M., Goulden, M. L., Graf, A., Griebel, A., Gruening, C., Grünwald, T., Hammerle, A., Han, S., Han, X., Hansen, B. U., Hanson, C., Hatakka, J., He, Y., Hehn, M., Heinesch, B., Hinko-Najera, N., Hörtnagl, L., Hutley, L., Ibrom, A., Ikawa, H., Jackowicz-Korczynski, M., Janouš, D., Jans, W., Jassal, R., Jiang, S., Kato, T., Khomik, M., Klatt, J., Knohl, A., Knox, S., Kobayashi, H., Koerber, G., Kolle, O., Kosugi, Y., Kotani, A., Kowalski, A., Kruijt, B., Kurbatova, J., Kutsch, W. L., Kwon, H., Launiainen, S., Laurila, T., Law, B., Leuning, R., Li, Y., Liddell, M., Limousin, J.-M., Lion, M., Liska, A. J., Lohila, A., López-Ballesteros, A., López-Blanco, E., Loubet, B., Loustau, D., Lucas-Moffat, A., Lüers, J., Ma, S., Macfarlane, C., Magliulo, V., Maier, R., Mammarella, I., Manca, G., Marcolla, B., Margolis, H. A., Marras, S., Massman, W., Mastepanov, M., Matamala, R., Matthes, J. H., Mazzenga, F., McCaughey, H., McHugh, I., McMillan, A. M. S., Merbold, L., Meyer, W., Meyers, T., Miller, S. D., Minerbi, S., Moderow, U., Monson, R. K., Montagnani, L., Moore, C. E., Moors, E., Moreaux, V., Moureaux, C., Munger, J. W., Nakai, T., Neirynck, J., Nesic, Z., Nicolini, G., Noormets, A., Northwood, M., Nosetto, M., Nouvellon, Y., Novick, K., Oechel, W., Olesen, J. E., Ourcival, J.-M., Papuga, S. A., Parmentier, F.-J., Paul-Limoges, E., Pavelka, M., Peichl, M., Pendall, E., Phillips, R. P., Pilegaard, K., Pirk, N., Posse, G., Powell, T., Prasse, H., Prober, S. M., Rambal, S., Rannik, U., Raz-Yaseef, N., Rebmann, C., Reed, D., Dios, V. R. d., Restrepo-Coupe, N., Reverter, B. R., Roland, M., Sabbatini, S., Sachs, T., Saleska, S. R., Sánchez-Cañete, E. P., Sanchez-Mejia, Z. M., Schmid, H. P., Schmidt, M., Schneider, K., Schrader, F., Schroder, I., Scott, R. L., Sedlák, P., Serrano-Ortíz, P., Shao, C., Shi, P., Shironya, I., Siebicke, L., Šigut, L., Silberstein, R., Sirca, C., Spano, D., Steinbrecher, R., Stevens, R. M., Sturtevant, C., Suyker, A., Tagesson, T., Takanashi, S., Tang, Y., Tapper, N., Thom, J., Tomassucci, M., Tuovinen, J.-P., Urbanski, S., Valentini, R., van der Molen, M., van Gorsel, E., van Huissteden, K., Varlagin, A., Verfaillie, J., Vesala, T., Vincke, C., Vitale, D., Vygodskaya, N., Walker, J. P., Walter-Shea, E., Wang, H., Weber, R., Westermann, S., Wille, C., Wofsy, S., Wohlfahrt, G., Wolf, S., Woodgate, W., Li, Y., Zampedri, R., Zhang, J., Zhou, G., Zona, D., Agarwal, D., Biraud, S., Torn, M., and Papale, D.: The FLUXNET2015 dataset and the ONEFlux processing pipeline for eddy covariance data, Sci. Data, 7, https://doi.org/10.1038/s41597-020-0534-3, 2020. a
Phillips, M. R., Duchesne, C., Smith, S. L., and Chartrand, J.: Daily ground temperatures between 2008–2014 in Nunavut, Canada, Mendeley Data [data set], https://doi.org/10.17632/3fwyr9j9rs.1, 2025. a, b
Qian, B., Gregorich, E. G., Gameda, S., Hopkins, D. W., and Wang, X. L.: Observed soil temperature trends associated with climate change in Canada, J. Geophys. Res.-Atmos., 116, https://doi.org/10.1029/2010JD015012, 2011. a
Riseborough, D. W. and Burgess, M. M.: Measurement interval and the accurate assessment of ground temperature trends, Permafrost Periglac., 7, 321–335, https://doi.org/10.1002/(sici)1099-1530(199610)7:4<321::aid-ppp233>3.0.co;2-j, 1996. a
Romanovsky, V., Kholodov, A., Dolgikh, K., Hasson, N., and Lane, T.: Thermal state of permafrost in North America – continuously observed ground temperatures, 2017–2018, Arctic Data Center [data set], https://doi.org/10.18739/A2D795976, 2019a. a
Romanovsky, V., Kolodov, A., Hasson, N., Nicolsky, D., and Wright, T.: Thermal state of permafrost in North America – continuously observed ground temperatures, 2016–2017, Arctic Data Center [data set], https://doi.org/10.18739/A24J09X6N, 2019b. a
Romanovsky, V., Kolodov, A., Hasson, N., Nicolsky, D., and Wright, T.: Thermal state of permafrost in North America – continuously observed ground temperatures, 2015–2016, Arctic Data Center [data set], https://doi.org/10.18739/A28911R1W, 2019c. a
Romanovsky, V., Kholodov, A., Hasson, N., Nicolsky, D., and Wright, T.: Thermal state of permafrost in North America – continuously observed ground temperatures, 2018–2019, Arctic Data Center [data set], https://doi.org/10.18739/A2W37KW4J, 2020. a
Romanovsky, V., Kholodov, A., Nicolsky, D., and Wright, T.: Thermal state of permafrost in North America – continuously observed ground temperatures, 2019–2020, Arctic Data Center [data set], https://doi.org/10.18739/A29G5GF47, 2021. a
Romanovsky, V., Kholodov, A., Nicolsky, D., and Wright, T.: Thermal state of permafrost in North America – continuously observed ground temperatures, 2020-2021, Arctic Data Center [data set], https://doi.org/10.18739/A2F47GV9K, 2022a. a
Romanovsky, V., Kholodov, A., Nicolsky, D., and Wright, T.: Thermal state of permafrost in North America – continuously observed ground temperatures, 2021–2022, Arctic Data Center [data set], https://doi.org/10.18739/A2TD9N93H, 2022b. a
Romanovsky, V., Kholodov, A., Nicolsky, D., and Wright, T.: Thermal state of permafrost in North America – continuously observed ground temperatures, Canada & United States, 2022–2023, Arctic Data Center [data set], https://doi.org/10.18739/A2513TX7M, 2023. a
Romanovsky, V., Kholodov, A., Nicolsky, D., and Wright, T.: Thermal state of permafrost in North America – continuously observed ground temperatures, Canada & United States, 2023–2024, Arctic Data Center [data set], https://doi.org/10.18739/A2K35MG41, 2024. a
Rudy, A. C., Kokelj, S. V., and Ensom, T.: Permafrost ground temperature report: Inuvik to Tuktoyaktuk Highway embankment sites, Northwest Territories, NWT Open Report 2019-016, Northwest Territories Geological Survey, https://doi.org/10.46887/2019-016, 2020a. a
Rudy, A. C., Kokelj, S. V., Morse, P. D., and Ensom, T.: Permafrost ground temperature report: Inuvik to Tuktoyaktuk Highway Sentinel sites, NWT Open Report 2019-017, Northwest Territories Geological Survey, https://doi.org/10.46887/2019-017, 2020b. a
Schmid, M.-O., Gubler, S., Fiddes, J., and Gruber, S.: Inferring snowpack ripening and melt-out from distributed measurements of near-surface ground temperatures, The Cryosphere, 6, 1127–1139, https://doi.org/10.5194/tc-6-1127-2012, 2012. a
Sessa, R. and Dolman, H.: Terrestrial essential climate variables for climate change assessment, mitigation and adaptation, Tech. rep., Food and Agriculture Organization of the United Nations, Rome, Italy, https://openknowledge.fao.org/handle/20.500.14283/i0197e (last access: 21 July 2026), 2008. a
Sladen, W. E., Morse, P. D., and Wolfe, S. A.: Report on 2012-2017 shallow ground thermal investigations on the Tibbitt to Contwoyto Winter Road portages, Northwest Territories, Tech. Rep. Open File 8274, Geological Survey of Canada, https://doi.org/10.4095/306454, 2018. a
Smith, S. L., O'Neill, H. B., Isaksen, K., Noetzli, J., and Romanovsky, V. E.: The changing thermal state of permafrost, Nature Reviews Earth and Environment, https://doi.org/10.1038/s43017-021-00240-1, 2022. a
Smith, S. W.: The Scientist and Engineer's Guide to Digital Signal Processing, California Technical Publishing, San Diego, CA, 2nd edn., ISBN 0-9660176-7-6, http://www.dspguide.com (last access: 21 July 2026), 1999. a
Stewart-Jones, E., Castagner, A., Subedi, R., Knecht, T., MacDonald, S., Macdonnell, H., Jonat, G., Meier-Legault, O., Brown, N., and Gruber, S.: Température de l'air et du sol, humidité de l'air et données de caractérisation des sites dans une région de taïga du bouclier canadien, Kennady Lake, Territoires du Nord-Ouest, Canada, v. 1.0 (2017–2021), D123, Nordicana [data set], https://doi.org/10.5885/45804XD-592E48652C5840F9, 2023. a, b, c
Tedersoo, L., Arika, T., Anslan, S., and Bahram, M.: Data sharing practices and data availability upon request differ across scientific disciplines, Sci. Data, 8, 192, https://doi.org/10.1038/s41597-021-00981-0, 2021. a
Verhey, C., Minch, M., and Payne, K.: Polar federated search: new infrastructure to support the polar community, Polar Sci., 36, 100947, https://doi.org/10.1016/j.polar.2023.100947, 2023. a
Wilkinson, M. D., Dumontier, M., Aalbersberg, I. J., Appleton, G., Axton, M., Baak, A., Blomberg, N., Boiten, J.-W., da Silva Santos, L. B., Bourne, P. E., Bouwman, J., Brookes, A. J., Clark, T., Crosas, M., Dillo, I., Dumon, O., Edmunds, S., Evelo, C. T., Finkers, R., Gonzalez-Beltran, A., Gray, A. J., Groth, P., Goble, C., Grethe, J. S., Heringa, J., 't Hoen, P. A., Hooft, R., Kuhn, T., Kok, R., Kok, J., Lusher, S. J., Martone, M. E., Mons, A., Packer, A. L., Persson, B., Rocca-Serra, P., Roos, M., van Schaik, R., Sansone, S.-A., Schultes, E., Sengstag, T., Slater, T., Strawn, G., Swertz, M. A., Thompson, M., van der Lei, J., van Mulligen, E., Velterop, J., Waagmeester, A., Wittenburg, P., Wolstencroft, K., Zhao, J., and Mons, B.: The FAIR Guiding Principles for scientific data management and stewardship, Sci. Data, 3, 160018, https://doi.org/10.1038/sdata.2016.18, 2016. a
Wirz, V., Gruber, S., Purves, R. S., Beutel, J., Gärtner-Roer, I., Gubler, S., and Vieli, A.: Short-term velocity variations at three rock glaciers and their relationship with meteorological conditions, Earth Surf. Dynam., 4, 103–123, https://doi.org/10.5194/esurf-4-103-2016, 2016. a
- Abstract
- Introduction
- Methodology
- Results and discussion
- Sources of error and limitations
- Collaborative steps for permafrost data
- Code and data availability
- Conclusions
- Appendix A: Estimation of maximum daily variation
- Author contributions
- Competing interests
- Disclaimer
- Acknowledgements
- Financial support
- Review statement
- References
- Supplement
- Abstract
- Introduction
- Methodology
- Results and discussion
- Sources of error and limitations
- Collaborative steps for permafrost data
- Code and data availability
- Conclusions
- Appendix A: Estimation of maximum daily variation
- Author contributions
- Competing interests
- Disclaimer
- Acknowledgements
- Financial support
- Review statement
- References
- Supplement