the Creative Commons Attribution 4.0 License.
the Creative Commons Attribution 4.0 License.
 | 13 Oct 2026
Coastal Atmosphere & Sea Time Series (CoASTS) and Bio-Optical mapping of Marine optical Properties (BiOMaP): the hyperspectral absorption coefficients by optically significant constituents
Jean-François Berthon

Giuseppe Zibordi
The Coastal Atmosphere & Sea Time Series (CoASTS) and the Bio-Optical mapping of Marine optical Properties (BiOMaP) programs were conceived and implemented to assist ocean color applications with field measurements of apparent and inherent optical properties, as well as concentration of optically significant water constituents. The CoASTS program led to the creation of time-series of bio-optical measurements at the “Acqua Alta” Oceanographic Tower (AAOT) site in the northern Adriatic Sea continued from 1995 up to 2016. The BiOMaP program supported the collection of equivalent bio-optical measurements across European Seas from 2000 up to 2022. This work focusses on CoASTS and BiOMaP hyperspectral absorption coefficients of optically significant constituents as determined applying standardized instruments, community measurement methods, extended quality control schemes and consolidated processing. The work, which complements a previous one by Zibordi and Berthon (2024) centred on multi-spectral data, presents the CoASTS and BiOMaP hyperspectral absorption coefficients of pigmented and non-pigmented particles in the 400–750 nm interval, and colored dissolved organic matter in the 350–680 nm one, both with a 3 nm spectral resolution at 2 nm increment. The data are available at https://doi.org/10.1594/PANGAEA.993510 (Berthon and Zibordi 2026).
- Article
(7072 KB) - Full-text XML
- Companion paper
- BibTeX
- EndNote


Extensive and comprehensive field reference measurements are essential for any satellite ocean color program (e.g.: Werdell et al., 2003; Valente et al., 2022; Massicotte et al., 2023; Nechad et al., 2015). In line with this need, over a period exceeding two decades, the Coastal Atmosphere & Sea Time Series (CoASTS) and the Bio-Optical mapping of Marine optical Properties (BiOMaP) field programs led to the collection of field bio-optical measurements to support ocean color applications embracing bio-optical modelling and satellite ocean color validation (Zibordi and Berthon, 2024). The CoASTS and BiOMaP programs, established by the Marine Optical Laboratory of the Joint Research Centre (JRC) in collaboration with several European research institutions, ensured: (i) time-series measurements at the “Acqua Alta” Oceanographic Tower (AAOT) site in the northern Adriatic Sea characterized by moderately optically complex waters (Berthon et al., 2002; Zibordi et al., 2002); and (ii) geographically distributed ship-based measurements across major European Seas exhibiting a variety of water types (Berthon et al., 2008; Zibordi et al., 2011).
This work presents the CoASTS-BiOMaP data set of hyperspectral absorption coefficients determined applying spectrophotometric methods to field marine water samples. Opposite to the multi-spectral absorption coefficients included in the previous dataset of radiometric data products (Zibordi and Berthon 2024), this complementary dataset comprises absorption coefficients exhibiting 3 nm spectral resolutions at 2 nm increment for pigmented and non-pigmented particles in the 400–750 nm interval, and for colored dissolved organic matter in the 350–680 nm one. This unique dataset is expected to fulfil application needs for bio-optical investigations supporting the new generation of hyperspectral satellite ocean color sensors (e.g., Werdell et al., 2026).
CoASTS time-series started in 1995 with monthly sampling frequency, later reduced to bi-monthly (or less) up to the end of the program in 2016. CoASTS measurements comprised in-water optical and hydrographic profiles, water samples from near surface, 8 and 14 m depth, meteorological data, and cloud cover and sea state observations. Bio-optical characteristics (Berthon et al., 2002) are representative of marine regions with optical properties generally determined by moderate concentrations of sediments and colored dissolved organic matter (CDOM) and occasionally by phytoplankton and its degradation components, i.e., Case-1 waters (IOCCG, 2000).
BiOMaP ship-based campaigns were performed from 2000 up to 2022 in the major European seas (Berthon et al., 2008; Zibordi et al., 2011): the Baltic Sea exhibiting waters characterized by a high concentration of CDOM; the Adriatic Sea, Black Sea, Iberian Shelf, Greenland Sea, Ligurian Sea, and North Sea, exhibiting diverse concentrations of CDOM and suspended particulate matter (SPM); and finally the Eastern and Western Mediterranean Seas with oligotrophic and mesotrophic Case-1 waters. BiOMaP stations included the same measurements and observations as CoASTS, but water sampling was limited to the near-surface layer.
Data consistency across the two programs was ensured through the application of standardized instruments, community measurement methods, extended quality control schemes and consolidated processing.
Out of the 176 CoASTS field campaigns, only the 125 performed from December 1998 leading to a total of 634 stations were considered for the creation of the current dataset. This choice has been suggested by the objective to populate the dataset with those data fulfilling standardized methods and data reduction processes. Conversely, all the 36 BiOMaP campaigns for a total of 1915 stations, were considered.
Details on the CoASTS and BiOMaP measurement stations included in this work are summarized in Tables 1 and 2, respectively. The reader is also addressed to Zibordi and Berthon (2024) for figures presenting the temporal and geographic distribution of the overall CoASTS and BiOMaP stations, respectively.
Table 1CoASTS campaign identifiers, marine region, year, number of stations, research platform, collaborating institution (adapted from Zibordi and Berthon, 2024).

Table 2BiOMaP campaign identifiers, marine regions, year, number of stations, research vessels, collaborating institutions (after Zibordi and Berthon, 2024).
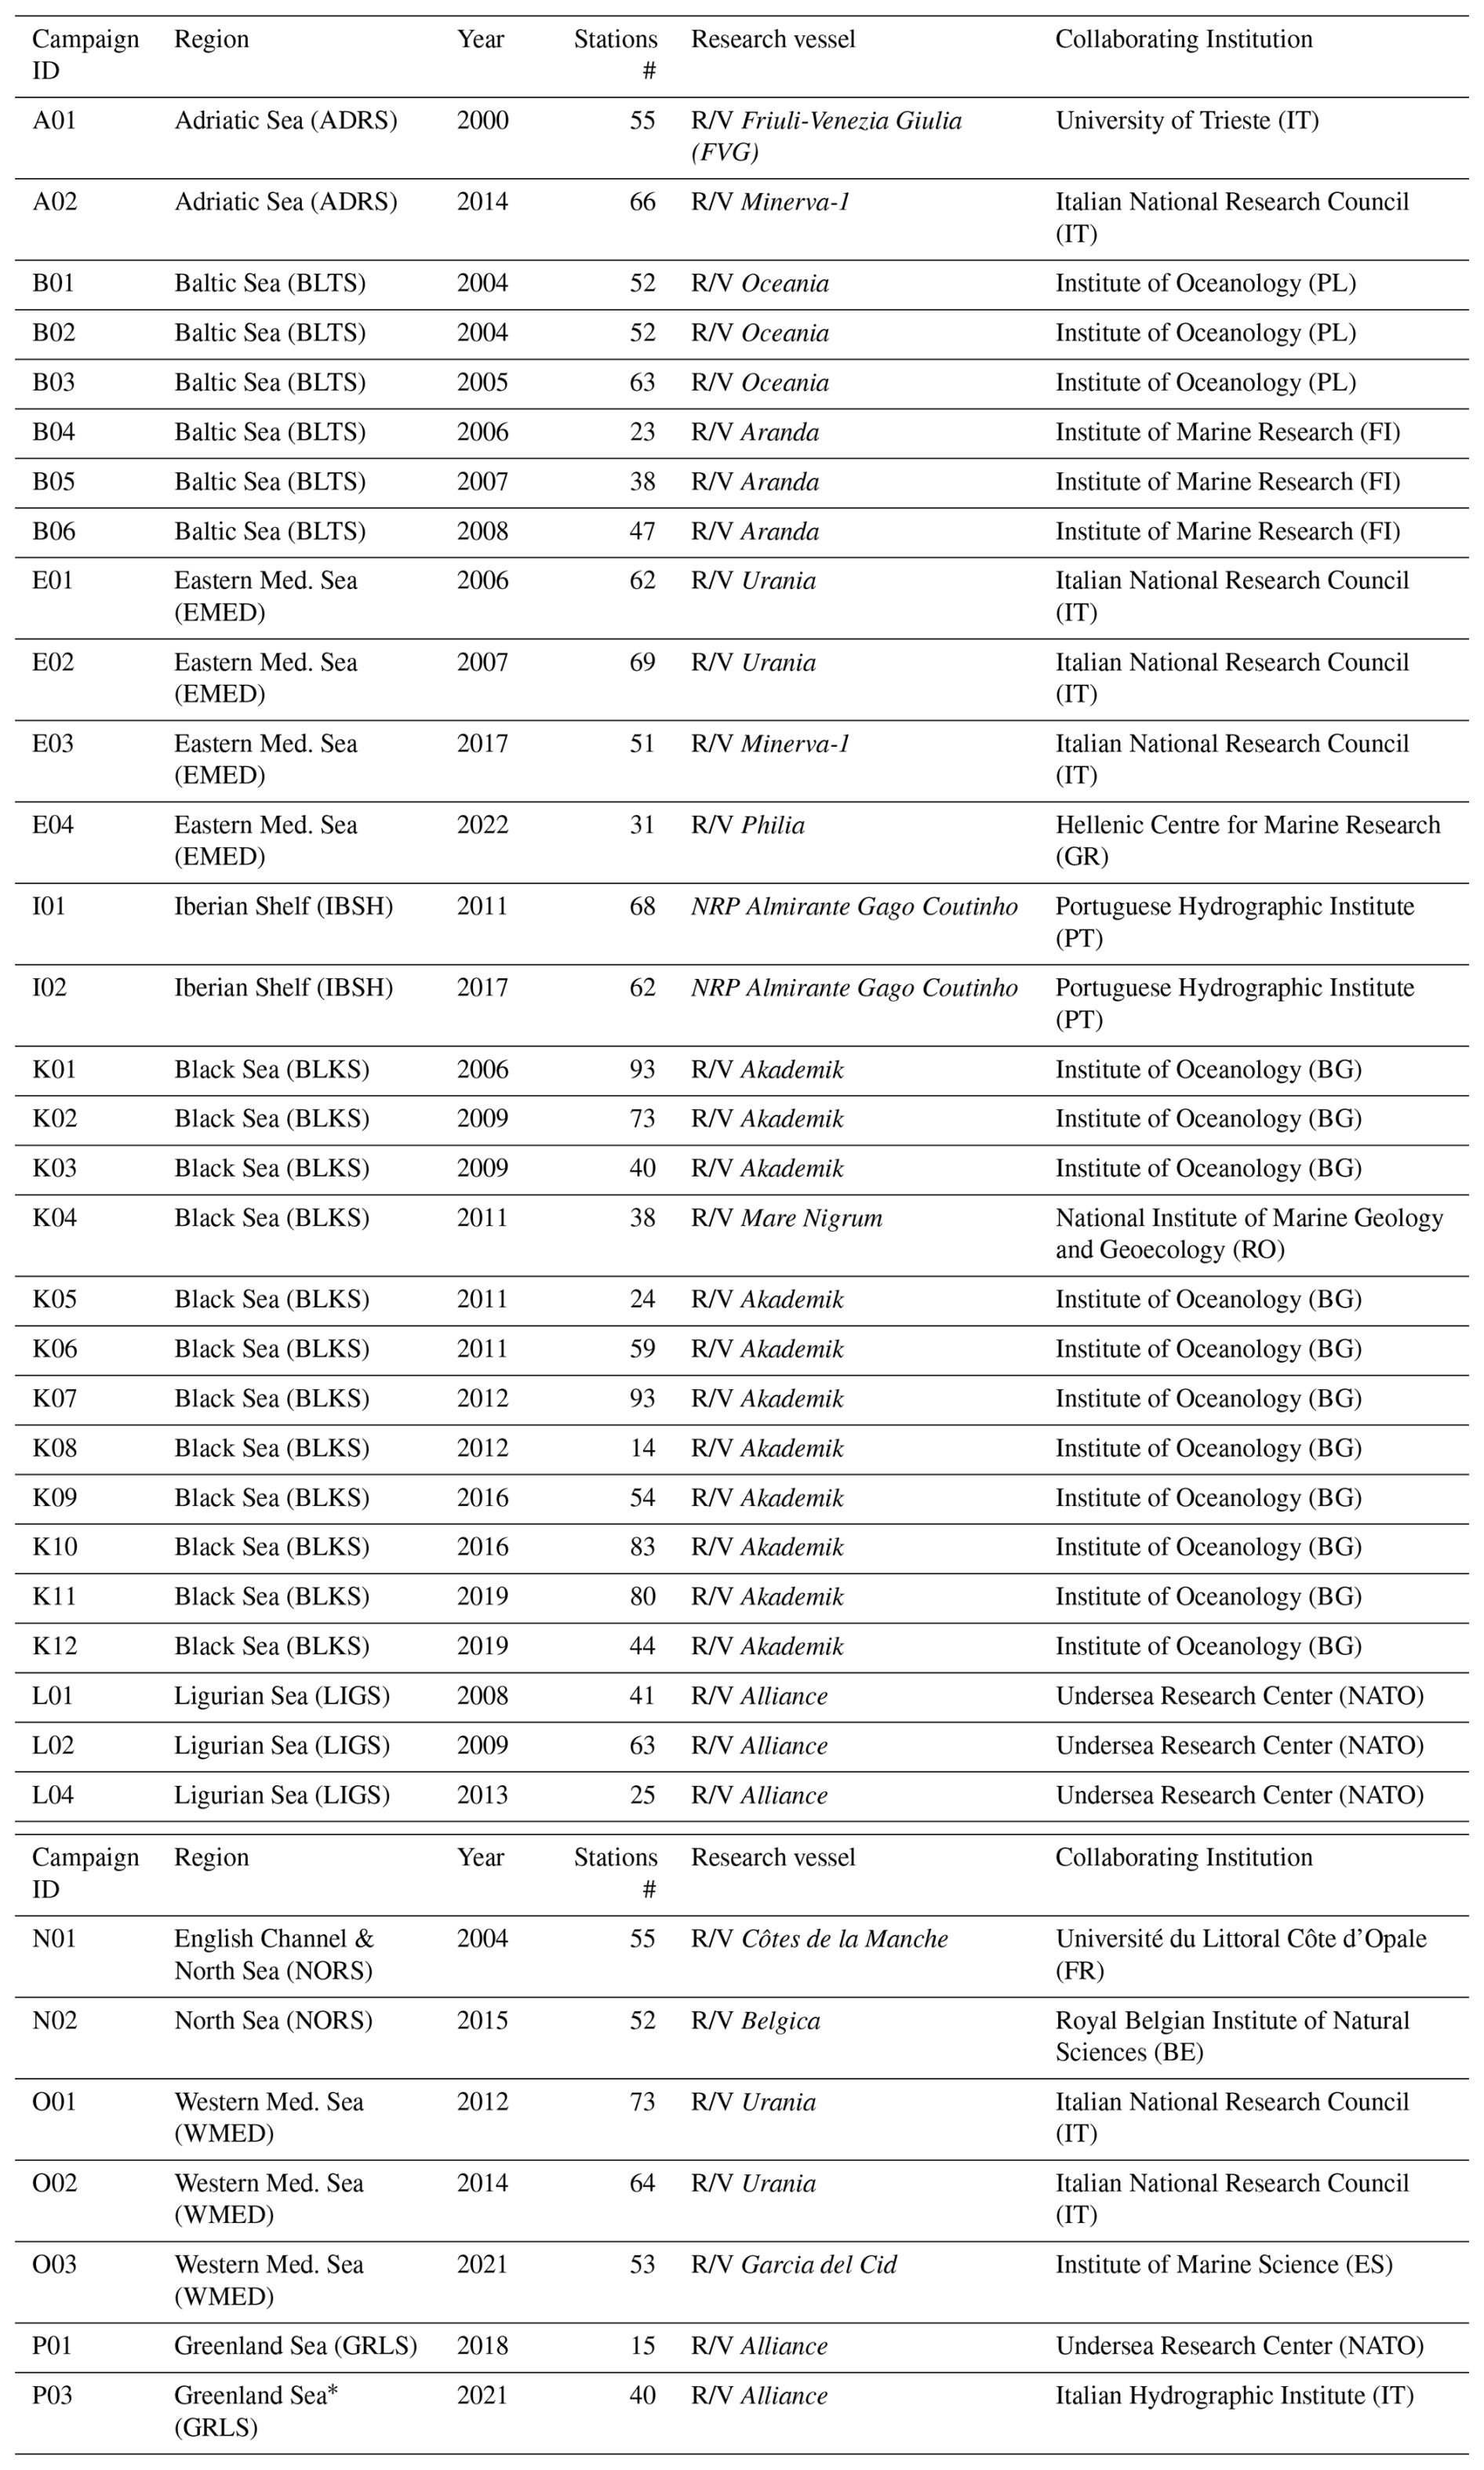
* It includes stations from the Norwegian Sea.
CoASTS and BiOMaP laboratory measurements ensured the determination of the following spectral absorption coefficients from discrete water samples collected at approximately 1 m depth:
-
aph and adt for pigmented and for non-pigmented particles, respectively;
-
ays for CDOM.
Details on the applied measurement methods are given in the following subsections.
3.1 Absorption coefficient of particulate matter
The Transmittance-Reflectance (T-R) method by Tassan and Ferrari (1995, 2002), shown appropriate for any particle type including highly scattering minerals and highly absorbing sediments, was applied to determine the absorption coefficients by water particles collected on glass fiber filter. The T-R method combines light transmittance (T) and light reflectance (R) measurements carried out using an integrating sphere combined with a dual-beam spectrophotometer. The method enables the measurement of both forward-scattered (T-mode) and backward-scattered (R-mode) light resulting from the interaction with the particles on the filter. Data analysis is supported by a theoretical model that minimizes the impact of differences in the light backscattered by the particles. The method was initially applied using a Perkin Elmer Lambda-19 spectrometer, replaced by a Lambda-950 from 2004 onward.
Whatman GF/F glass fibre filters with 0.7 µm pore size and 25 mm diameter were used to collect water particles from known water volumes. Following Tassan and Ferrari (2002), the total absorption coefficient ap(λ) of the equivalent particle suspension was determined in the 400–750 nm spectral interval with 1 nm resolution from
where Vw, Fa and As(λ) are the filtered water volume, the filter clearance area and the equivalent particle suspension absorbance obtained with the T-R method, respectively.
A solution of sodium hypochlorite (NaClO) was applied to the sample to discriminate the non-pigmented fraction adt(λ) from the total ap(λ), which allowed to determine the pigmented fraction as .
The bleaching approach, which rapidly acts on pigment molecules and only slowly on detritus, is comprehensively discussed in Tassan and Ferrari (1995) and in Ferrari and Tassan (1999). Building on that approach, since 2003 a more controlled depigmentation methodology was implemented. This combines the chemical bleaching based on sodium hypochlorite solution with photo-bleaching, and additionally applies a real-time control of the depigmentation process through the monitoring of the sample reflectance in the red spectral region (Zibordi and Sciuto, 2022). Such a methodology accelerates the bleaching process and prevents successive measurement trials to achieve an optimal depigmentation of the particles on the filter. In fact, the original approach requires successive additions of oxidizing agent and rinsing of the filter to remove the oxidation products. This implies an incremental determination of the absorbance by bleached particles, which leads to an unavoidable perturbation of particles distribution on the filter. Definitively, the implementation of the improved methodology allowed for the standardization of the bleaching process and warranted a better accuracy and reproducibility of the derived absorption coefficients.
Quality control was systematically performed by visually inspecting each absorption spectrum. This comprised a check for residual absorption by pigments affecting adt(λ) as evidenced by shoulders in the blue-green and additionally by slight peaks in the red spectral regions. In the presence of evident perturbations due to a poor bleaching, the duplicate sample (which was always collected for each measurement station) was analysed and the derived absorption spectra, when improved, considered for inclusion in the dataset.
Final adt(λ) and aph(λ) data products were determined with 3 nm spectral resolution at 2 nm increment. The spectral averaging applied to the actual laboratory measurements performed with 1 nm resolution, makes the adt(λ) and aph(λ) final data products less dependent on measurement noise, still at the expense of a reduced spectral resolution.
Well appreciating any previous effort addressing the accuracy of the T-R method (e.g., Tassan and Ferrari, 1995, and Tassan et al., 2000), uncertainties for aph(λ) and adt(λ) are not available. Because of this, results from the analysis of ap(λ) measurement precision by Zibordi et al. (2002) are further recalled. That specific investigation addressed the precision of ap(λ) determined with the T-R method through: (i) ap(λ) from repeated measurements of the same sample and (ii) ap(λ) from replicated measurements of independent samples, still obtained from the same water volume. Results are summarized in Table 3 at the 443, 555 and 665 nm center-wavelengths through mean absolute percent differences (MAPD). Results show increasing MAPD values in agreement with a decrease with wavelength of the absorption values. MADP for the absorption coefficients from repeated measurements of the same sample are mostly explained by: (i) the sensitivity of the method, and (ii) the lack of precision in re-positioning the filter in front of the aperture of the integrating sphere. The increased MADP of replicated measurements with respect to the repeated ones, are explained by: (i) differences resulting from uneven distributions of particles on filters among replicates; (ii) inhomogeneity of particles spreading in the water volumes collected to produce the samples; (iii) uncertainty in the determination of the water volume.
Table 3Absolute mean percent differences (MAPD) ± their standard deviation for repeated and replicated measurements of ap at 443, 555 and 665 nm.The values in parenthesis indicate the average of the ap spectral values ± their standard deviation, in units of m−1. N is the number of samples.
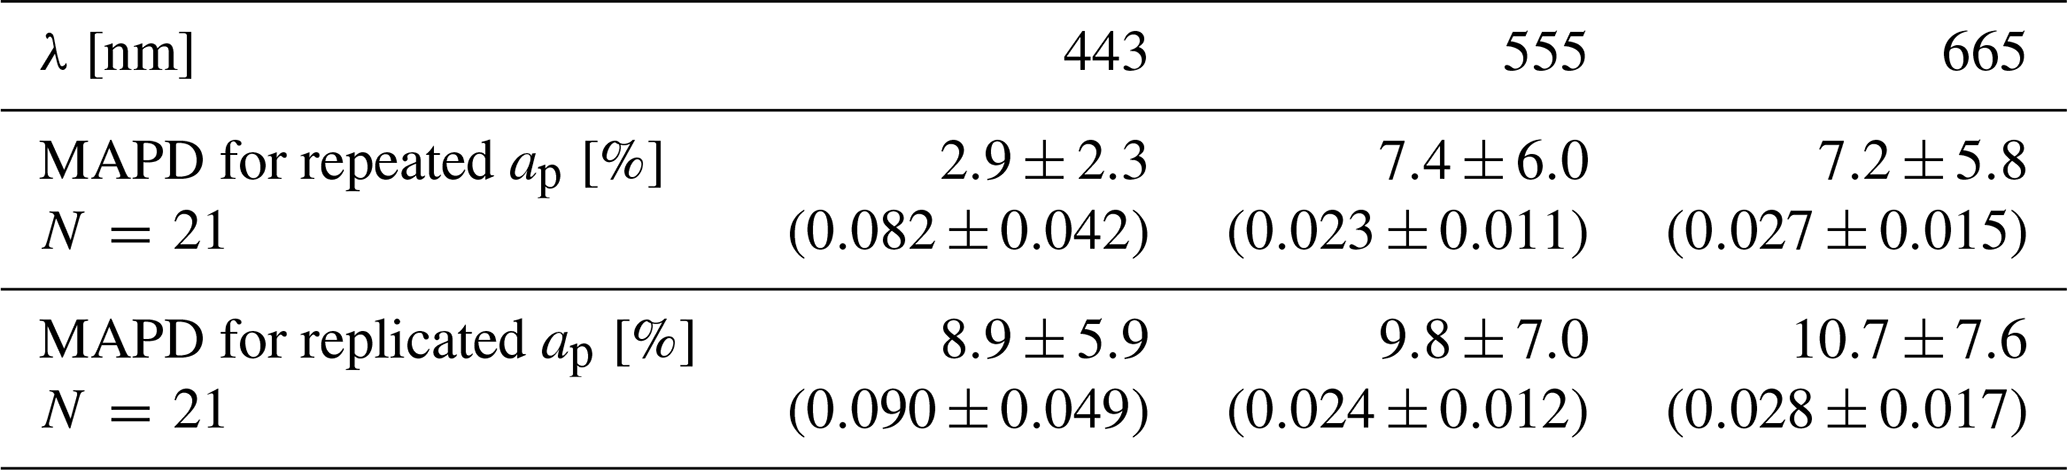
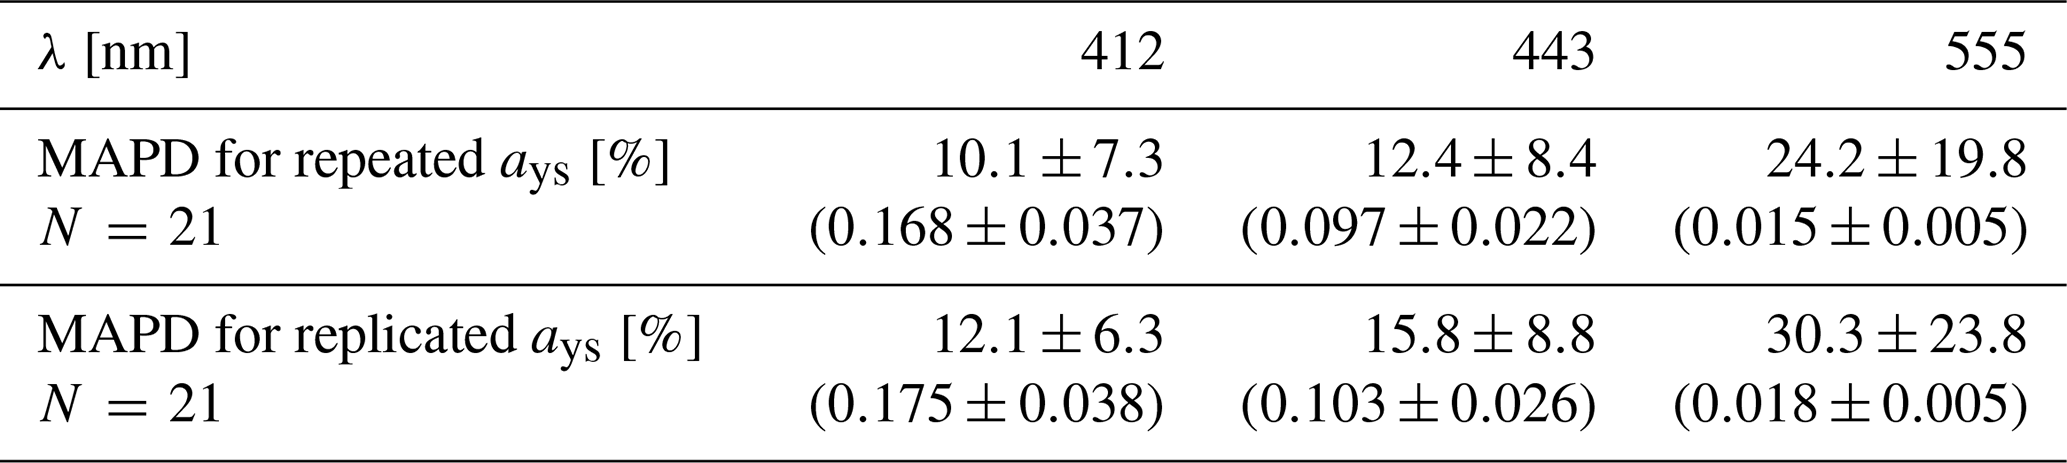
Table 4Absolute MAPD ± their standard deviation, determined for repeated and replicated measurements of ays at 412, 443 and 555 nm. The values in parenthesis indicate the average of the ays spectral values ± their standard deviation, in units of m−1. N is the number of samples.
3.2 Absorption coefficient of CDOM
A Perkin Elmer Lambda-12 dual-beam spectrometer, and a Lambda-35 from 2010 onward, were used to determine ays(λ) applying the method by Ferrari et al. (1996). Field samples were obtained by filtering water on Millipore 0.22 µm pore size cellulose filters. To prevent bacteria growth, 1 mL of a solution of 10 g L−1 of NaN3 was added to each 100 mL water sample.
Spectrometric measurements were performed in the 350–750 nm spectral interval with 1 nm resolution by placing a 10 cm quartz cuvette containing the sample in the optical path of the spectrometer beam and an identical cuvette containing milli-Q water in the optical path of the reference beam. Definitively, a 10 cm path-length may decrease the accuracy of measurements performed on samples exhibiting low CDOM absorption. Still, the need for standardizing measurements across the CoASTS and BiOMaP measurement programs embracing diverse geographic regions was a priority.
With reference to Ferrari et al. (1996) the absorption coefficient ays(λ) was computed from the absorbance Ays(λ) resulting from the difference between the sample and reference ones, as
where Lc is the pathlength of the cuvette.
As for the particulate absorption, quality control was systematically performed for ays(λ) by visually inspecting each spectrum. This included checking for (i) any potential non-ideal exponential decay of the absorption spectrum as evidenced by the occurrence of shoulders in the blue-green region, and (ii) the presence of any significant background value in the red. For questionable ays(λ), the analysis was repeated using an additional fraction of the 100 mL sample collected for each measurement station. This often implied a re-filtering of the water sample through a Millipore 0.22 µm pore size cellulose filter.
Assuming that CDOM absorption is null in the red, the final absorption coefficients were obtained by subtracting the mean of the ays(λi) spectral values for any λi∈ 670–680 nm, to the ays(λ) determined with Eq. (2). Consistent with aph(λ) and adt(λ), also the final ays(λ) values are made available with 3 nm spectral resolution at 2 nm increment, but for the 350–680 nm interval.
Comprehensive uncertainty analysis are also not available for ays(λ). Because of this, results from ays(λ) precision analysis from Zibordi et al. (2002) are summarized too in Table 4 at the center-wavelenghts 412, 443 and 555 nm. This specific investigation looked at measurement precision through: ays(λ) from repeated measurements of the same sample and ii. ays(λ) from replicated measurements of independent samples, still obtained from the same water volume. Similar to results obtained for ap(λ), MAPD determined for ays(λ) exhibit values largely increasing with wavelength consistently with the exponential decrease of ays(λ) toward the red. MADP from repeated measurements are largely due to the precision of the method. Unavoidable differences affecting sample replicates are responsible for the increase of MAPD of replicated measurements with respect to those of the repeated ones.
CoASTS-BiOMaP hyperspectral data of absorption coefficients are accessible in tabular form at https://doi.org/10.1594/PANGAEA.993510.
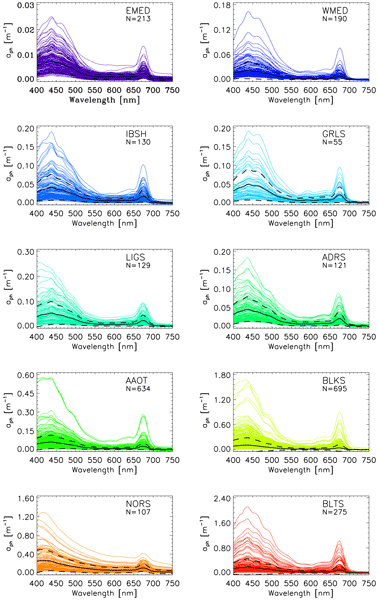
Details on the quantities constituting the dataset are provided in Table 5. Nevertheless, the reader is addressed to Zibordi and Berthon (2024) for a comprehensive description of all the field and laboratory measurements complementing the hyperspectral absorption coefficients matter of this work. It is anticipated that the number of measurement stations included in the present dataset is slightly higher than the one constituting the multi-spectral dataset. This is explained by the quality control applied to hyperspectral data solely centred on absorption coefficients and fully independent of radiometric quantities (see Zibordi and Berthon, 2024). This solution allows for maximizing the number of quality data included in each dataset, which may not necessarily support the same scientific investigations. Specifically, some ays spectra were not included in the hyperspectral dataset because of unrealistically low values in the ultraviolet and blue spectral regions. Figures 1–3 display BioMaP and CoASTS aph(λ), adt(λ) and ays(λ) spectra for the different marine regions. These spectra exhibit bio-optical features typical of the Eastern and Western Mediterranean Seas (EMED and WMED) oligotrophic/mesotrophic waters, and of the Baltic Sea (BLTS) CDOM dominated waters. Between these two extremes, there are spectra exhibiting optical characteristics determined by variable concentrations of SPM and CDOM such as those from the Black Sea (BLKS) and Adriatic Sea (AAOT and ADRS), and those from the North Sea (NORS) characterized by relatively high concentrations of non-organic particles.
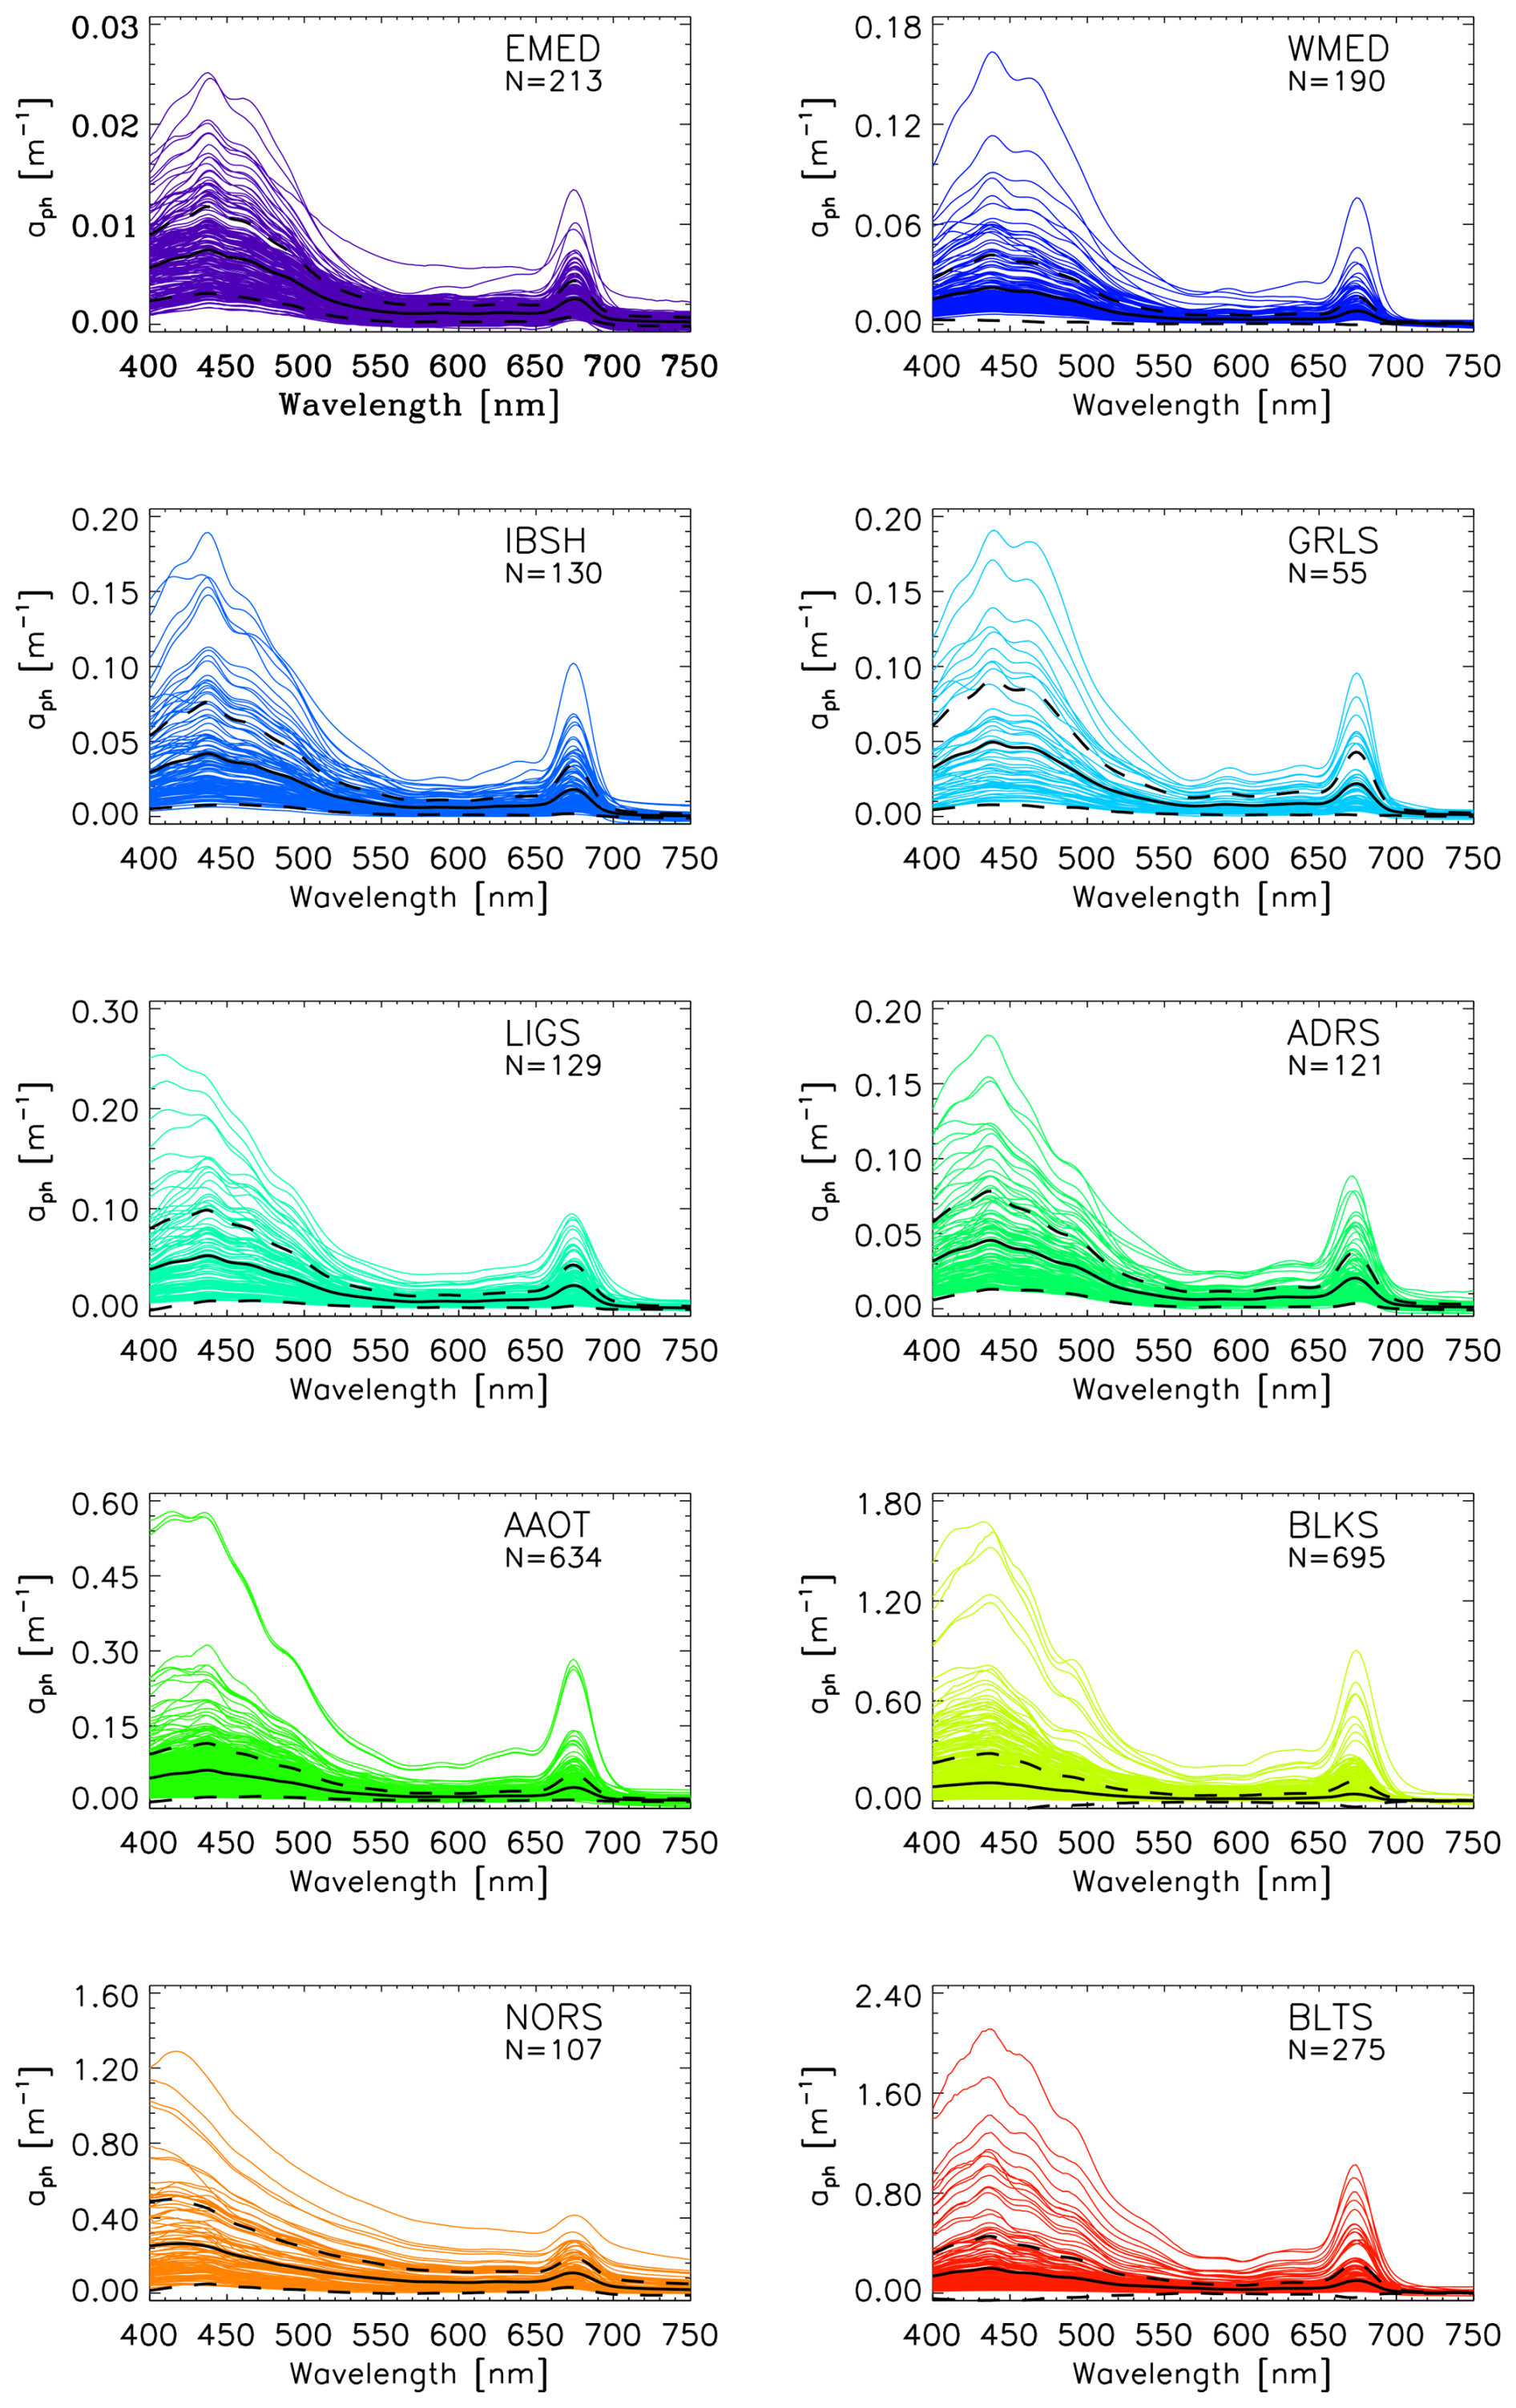
Figure 1Spectra of aph(λ) for the various marine regions. N is the number of spectra. The continuous thick black lines indicate mean values while the dashed lines indicate ± 1 standard deviation. Note that the y-axis scale varies across panels.
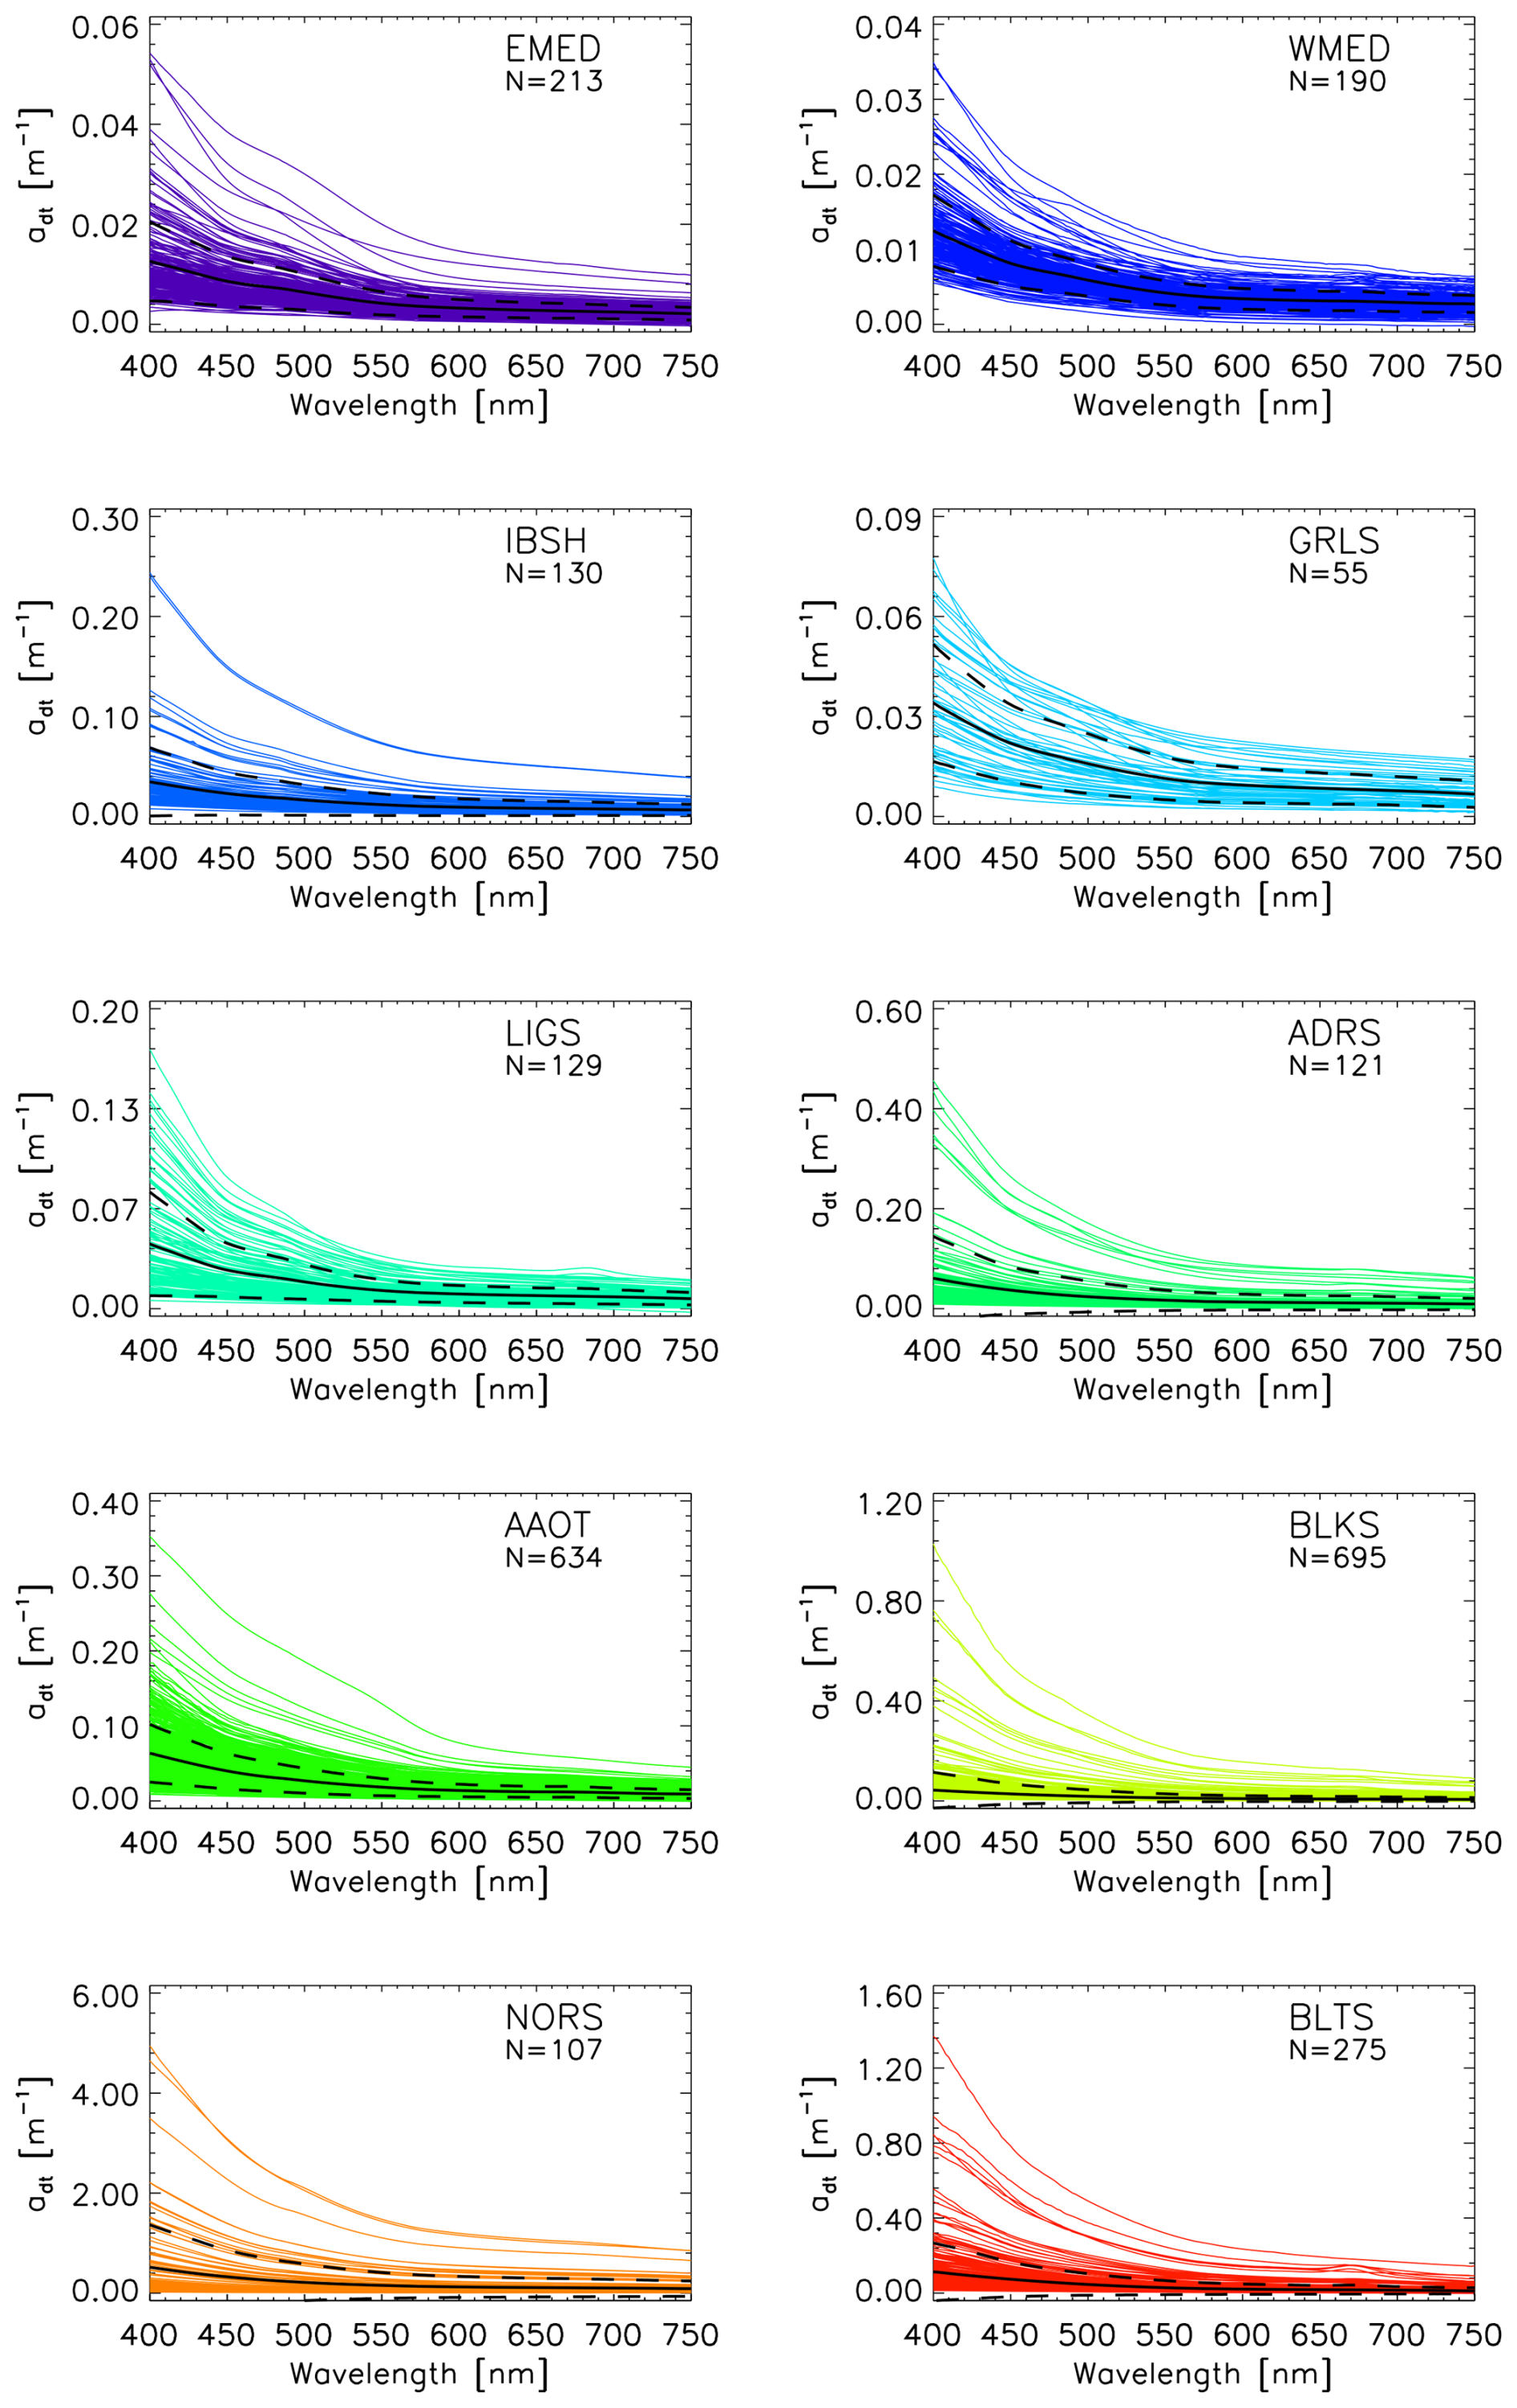
Figure 2Spectra of adt(λ) for the various marine regions. N is the number of spectra. The continuous thick black lines indicate mean values while the dashed lines indicate ± 1 standard deviation. Note that the y-axis scale varies across panels.
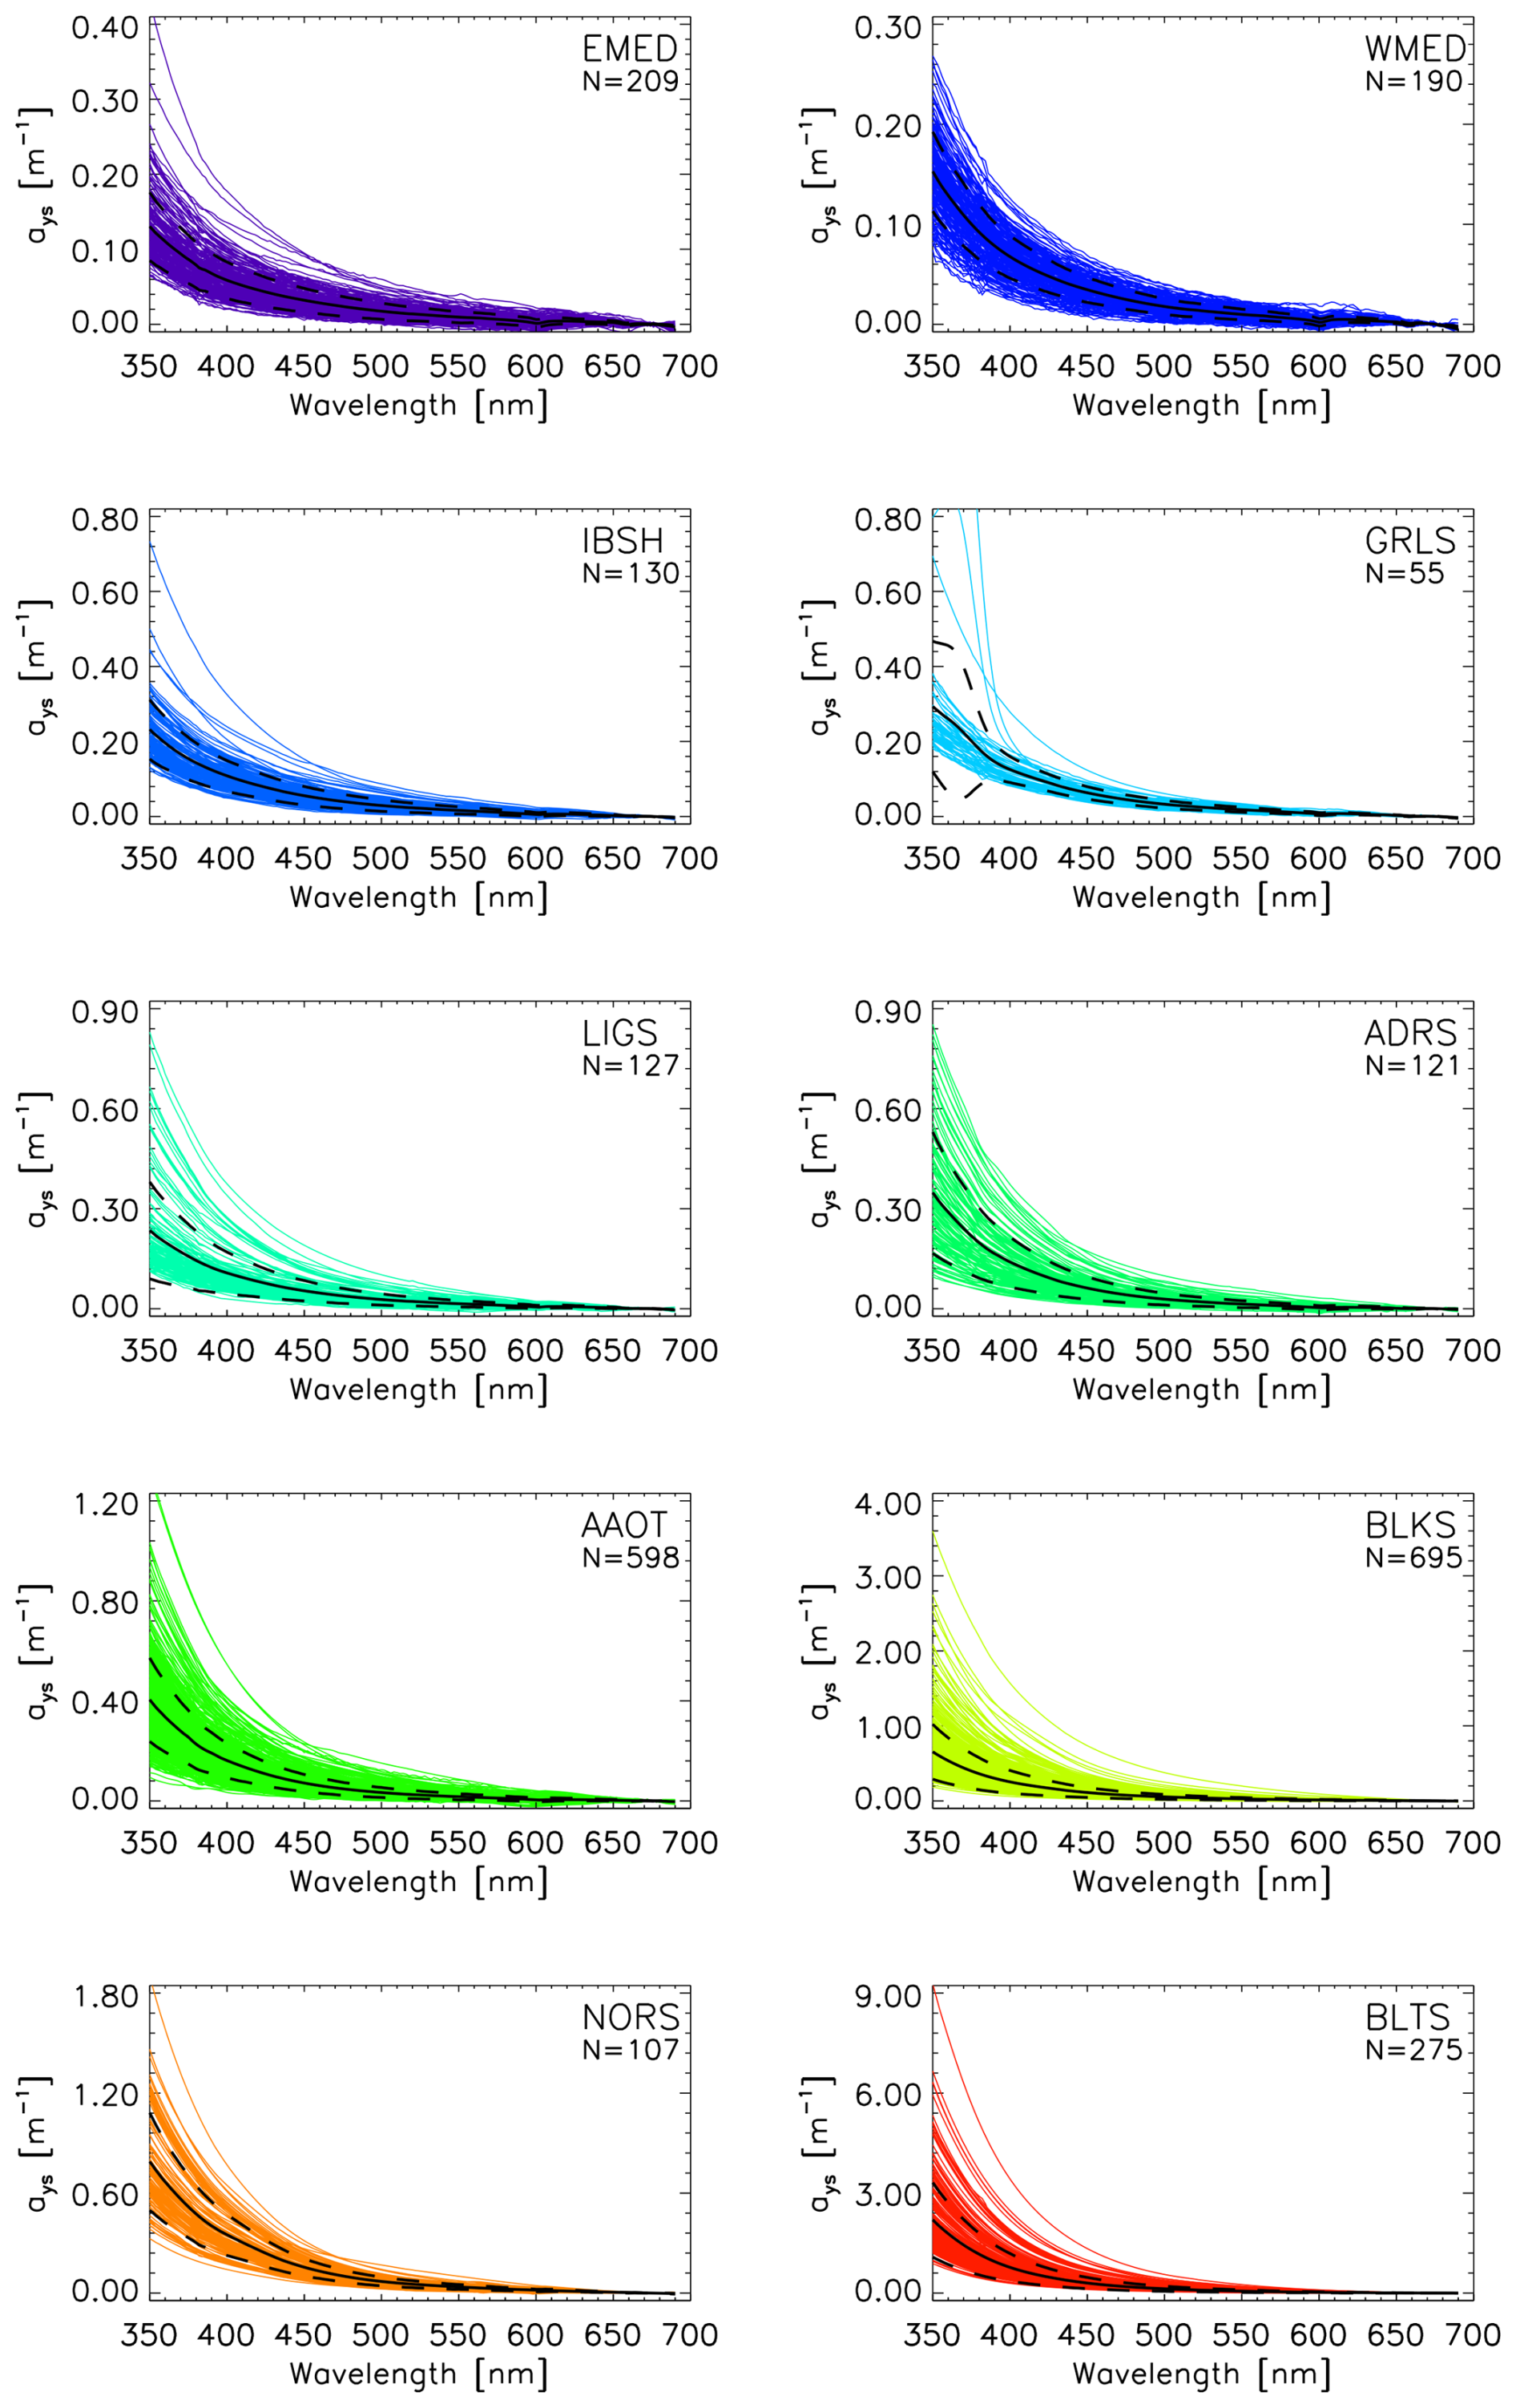
Figure 3Spectra of ays(λ) for the various marine regions. N is the number of spectra. The continuous black lines indicate mean values while the dashed lines indicate ± 1 standard deviation. Note that the y-axis scale varies across panels.
Table 5Details on the quantities included in the CoASTS-BiOMaP hyperspectral dataset defined in agreement with the notations already used in Zibordi and Berthon (2024).
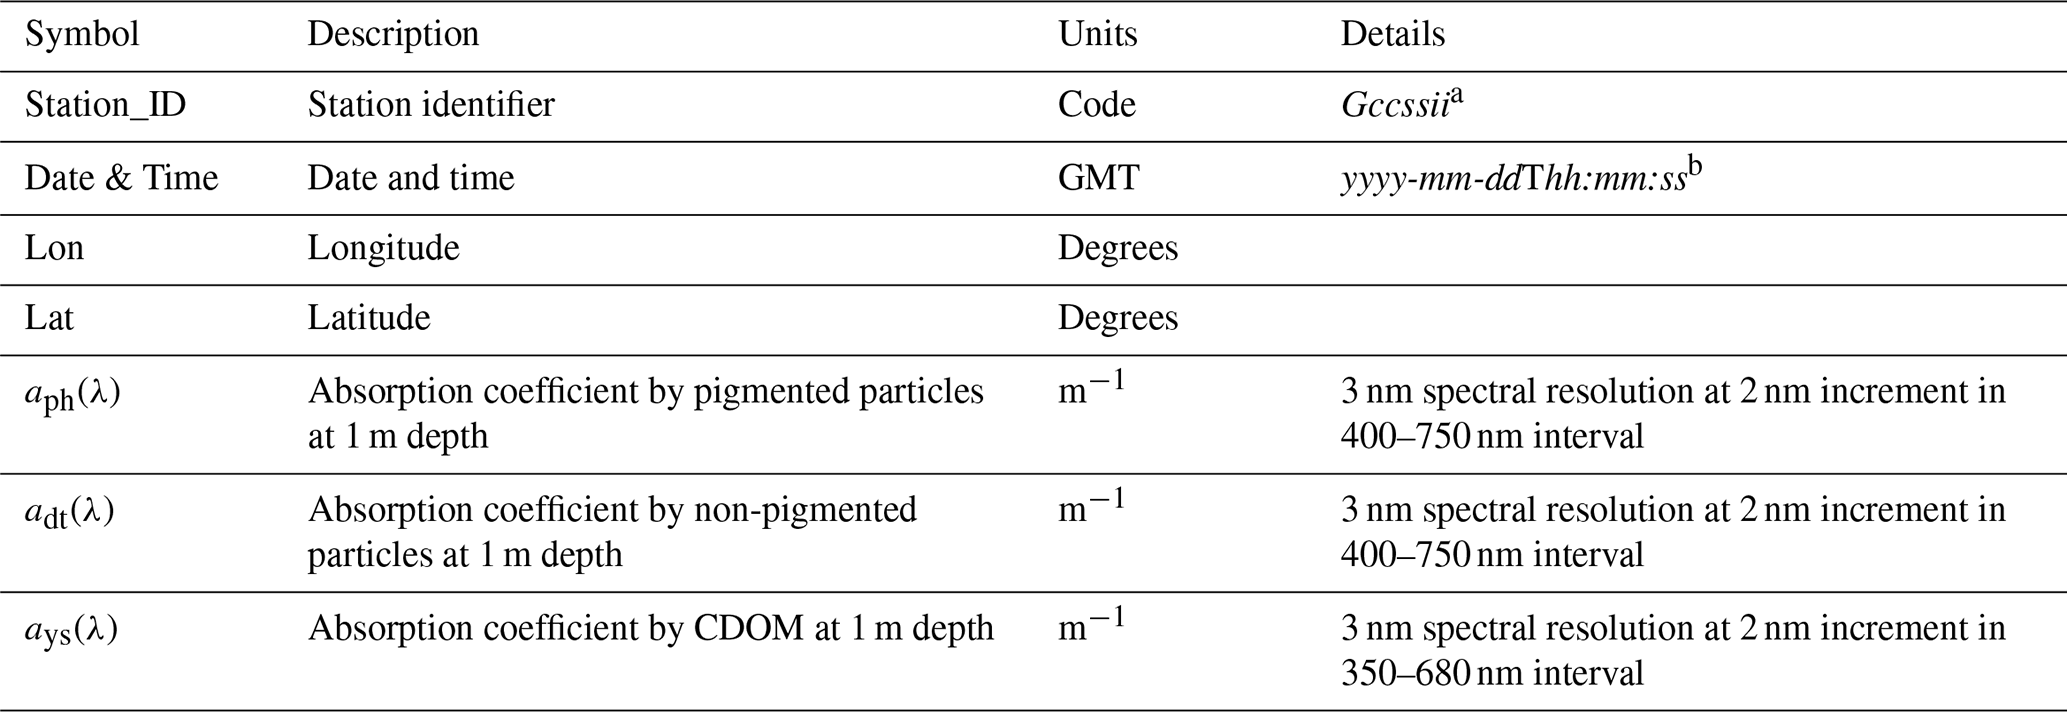
a G indicates the site or geographic region (V and W for AAOT, A for Adriatic Sea, B for Baltic Sea, E for Eastern Mediterranean Sea, K for Black Sea, L for Ligurian Sea, N for North Sea, O for Western Mediterranean Sea, I for Iberian Shelf, P for Greenland Sea), while cc indicates the campaign number for the specific region, ss the station number and ii the cast number. b The letters yyyy indicate the year, mm the month, dd the day hh, the hours, mm the minutes and ss the seconds.
Figure 1 displays the aph spectra for the various marine regions. The increase in the mean values of aph(λ) around 440 nm from approximately 0.01 m−1 for the Eastern Mediterranean Sea (EMED) waters to values approaching 0.2 m−1 for the Baltic Sea (BLTS) and North Sea (NORS) ones, is noteworthy. Some North Sea spectra from samples collected off the Belgian coast exhibit values of aph higher at 400 nm than at 440 nm. This is explained by high concentrations of pheophytin leading to an increase of the absorption coefficient toward 400 nm. Finally, a few aph spectra were noted to exhibit unrealistic negative values beyond approximately 500 nm. This is explained by limits of the measurement methodology in the presence of a low concentration of particles largely associated with oligotrophic regions. These spectra were not excluded from the data set expecting their application can be still relevant if the absorption coefficients are corrected for their background in the near-infrared.
The adt(λ) spectra displayed in Fig. 2 exhibit the expected exponential decay from 400 to 750 nm, even though sometimes affected by minor irregularities such as the shoulders in the blue-green or small residual peaks in the red spectral regions, which indicate a potential uncomplete bleaching of accessory pigments. Mean values of adt at 400 nm consistently increase from approximately 0.01 m−1 for the Mediterranean Sea (either EMED and WMED) waters, exceed 0.06 m−1 for the Adriatic Sea (AAOT) ones, and reach 0.11 m−1 for the Baltic Sea (BLTS). The background values of adt(λ) in the near-infrared reflect actual absorption by non-living particles. Figure 3 displays the ays(λ) spectra in the 350–680 nm spectral interval. The mean values of ays at 350 nm largely vary across marine regions. In agreement with the oligotrophic nature of the Eastern Mediterranean Sea (EMED) waters and the highly absorbing Baltic Sea (BLTS) ones, a minimum value of 0.13 m−1 is observed for the first while a maximum of 2.2 m−1 characterizes the second.
Of major interest are the slopes Sdt and Sys defining the exponential decay with wavelength of adt(λ) and ays(λ). These are determined through the exponential fit of adt(λ) and ays(λ) versus λ as
and
where Adt and Ays indicate the absorption coefficients fitted at 412 nm, Sdt and Sys the slope of the exponential function, and Bdt and Bys account for the background. The background term Bys in Eq. (4) is included to account for any non-null value that may still affect ays(λ) in the red spectral region regardless of the removal of the bias determined in the 670–680 nm interval for each spectrum (see Sect. 3.2).
Zibordi and Berthon (2024) constructed multispectral adt(λ) and ays(λ) values at the nominal center-wavelengths 412, 443, 490, 510, 555, 665 nm with a spectral resolution of 10 nm from the hyperspectral values presented in this work, but imposing a generic exponential decay with wavelength of the absorption coefficients. This solution, not detailed in Zibordi and Berthon (2024), was suggested by the need to minimize any intra-band noise that may impact bio-optical applications. The slopes Sdt determined with the multispectral adt(λ) data in the 412–665 nm interval (see Zibordi and Berthon, 2024) exhibit mean values varying from 0.009 nm−1 for the Eastern Mediterranean Sea (EMED) up to 0.013 for the North Sea (NORS). Similarly, the slopes Sys determined with the multispectral ays(λ) data also restricted to the 412–665 nm interval, show mean values ranging from 0.012 nm−1 for the Eastern Mediterranean Sea (EMED) up to 0.019 nm−1 for the Baltic Sea (BLTS).
This new work provides the opportunity to explore the fitting parameters determined with Eqs. (3) and (4), using hyperspectral adt(λ) and ays(λ) values. The additional analysis has relevance to address the impact of residual pigments absorption in adt(λ), and also the impact of diverse fitting intervals for ays(λ) benefitting of measurements extending down to 350 nm. In all cases, Eqs. (3) and (4) have been solved using the Interactive Data Language (IDL; NV5 Geospatial Solutions, Broomfield, CO, USA) Curvefit function relying on a gradient-expansion algorithm to compute the non-linear least squares fit.
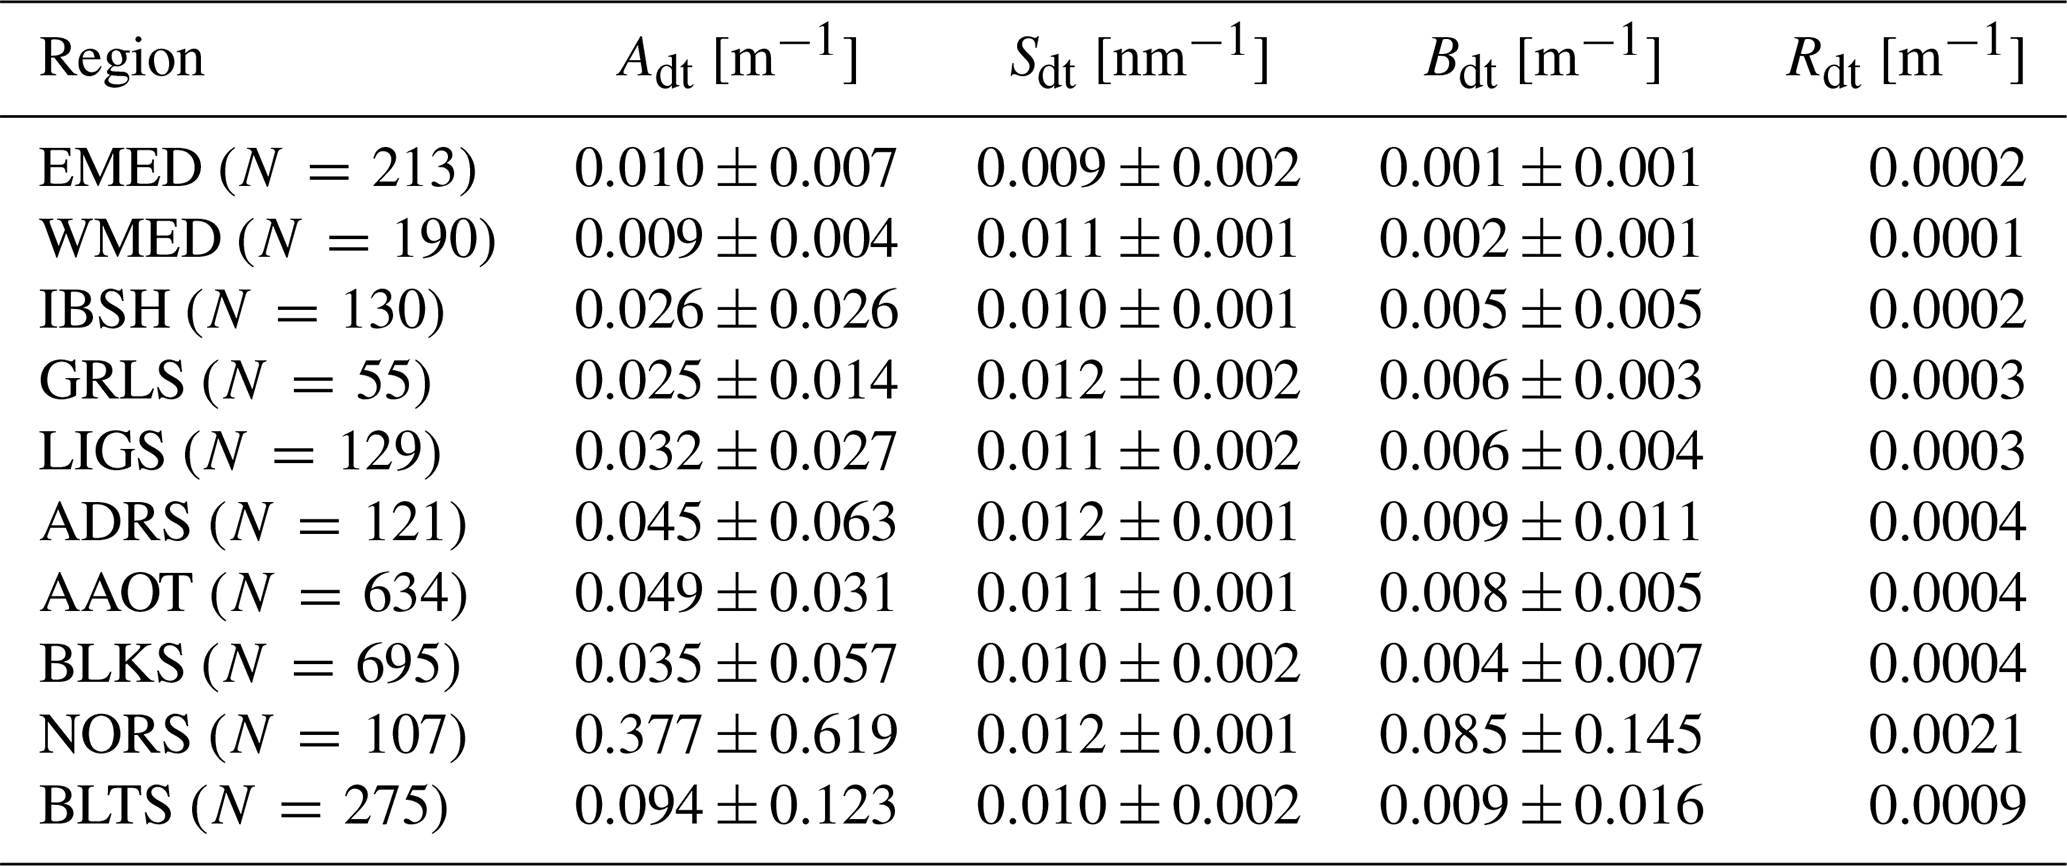
Fitting results for the adt(λ) hyperspectral data are summarized in Table 6 for the 400–730 nm interval and alternatively in Table 7 for the combined 400–412 & 480–620 & 710–730 nm ones. These latter results are intended to support an evaluation of the impact of residual pigments absorption affecting adt(λ), clearly evident in some spectra illustrated in Fig. 2 between 410 and 480 nm, as well as between 620 and 710 nm.
Table 6Mean Adt, Sdt and Bdt values ± their standard deviation, determined from the exponential fitting of the hyperspectral adt(λ) in the 400–730 nm interval. The quantity Rdt indicates the spectral average of absolute differences (i.e., residuals) between actual and fitted values in the considered spectral interval.
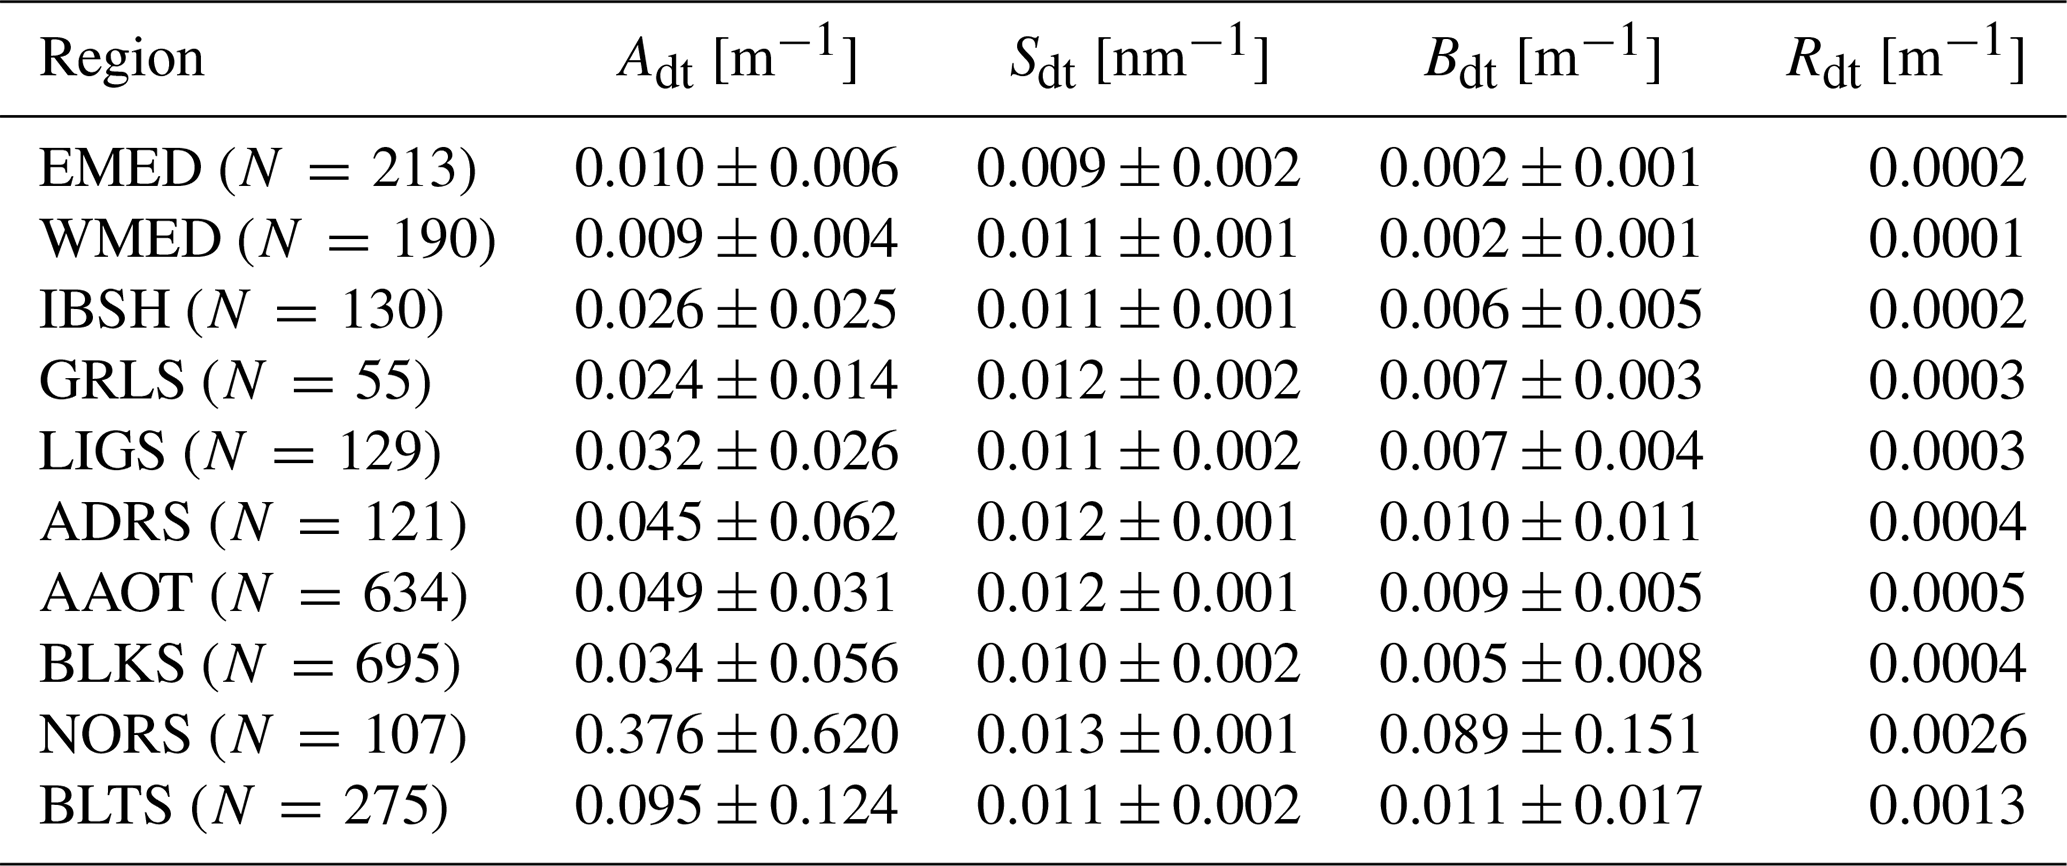
Table 7Mean Adt, Sdt and Bdt values ± their standard deviation, determined from the exponential fitting of the hyperspectral adt(λ) determined in the combined 400–412 & 480–620 & 710–730 nm intervals. The quantity Rdt indicates the spectral average of absolute differences (i.e., residuals) between actual and fitted values in the considered combined spectral intervals.
Fitting results for the ays(λ) hyperspectral data are given in Table 8 for the 350–650 nm interval and alternatively in Table 9 for the 350–550 nm interval. This latter interval is here preferred to the 350–500 nm commonly applied for determining Sys. The choice is supported by the need to enforce a more robust fit of the ays(λ) data from the Eastern Mediterranean Sea (EMED) oligotrophic waters most affected by measurement uncertainties (see Sect. 3.2).
Table 8Mean Ays, Sys and Bys values ± their standard deviation, determined from the exponential fitting of the hyperspectral ays(λ) determined in the 350–650 nm interval. The quantity Rys indicates the spectral average of absolute differences (i.e., residuals) between actual and fitted values in the considered spectral interval.
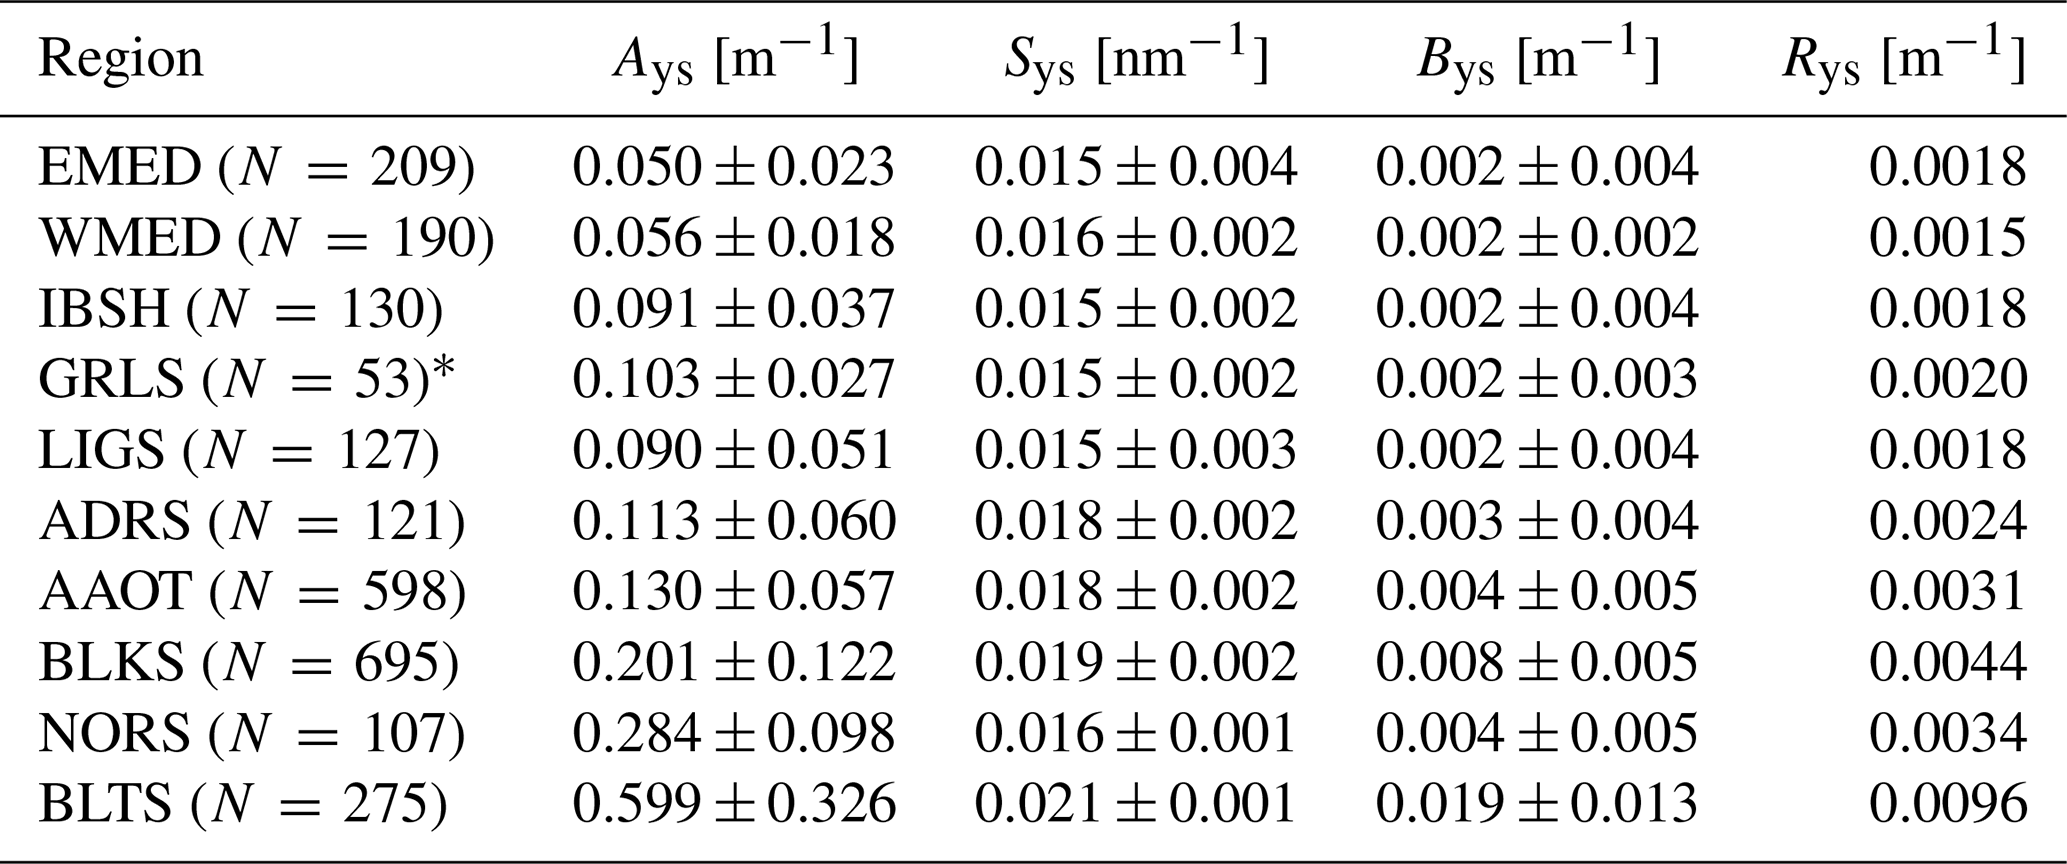
* The two spectra P011201 and P011301 (i.e., those well exceeding 0.7 m−1 at 350 in Fig. 3) were not included in the analysis due to their poor exponential fit.
Table 9Mean Ays, Sys and Bys values ± their standard deviation, determined from the exponential fitting of the hyperspectral ays(λ) determined in the 350–550 nm interval. The quantity Rys indicates the spectral average of absolute differences (i.e., residuals) between actual and fitted values in the considered spectral interval.
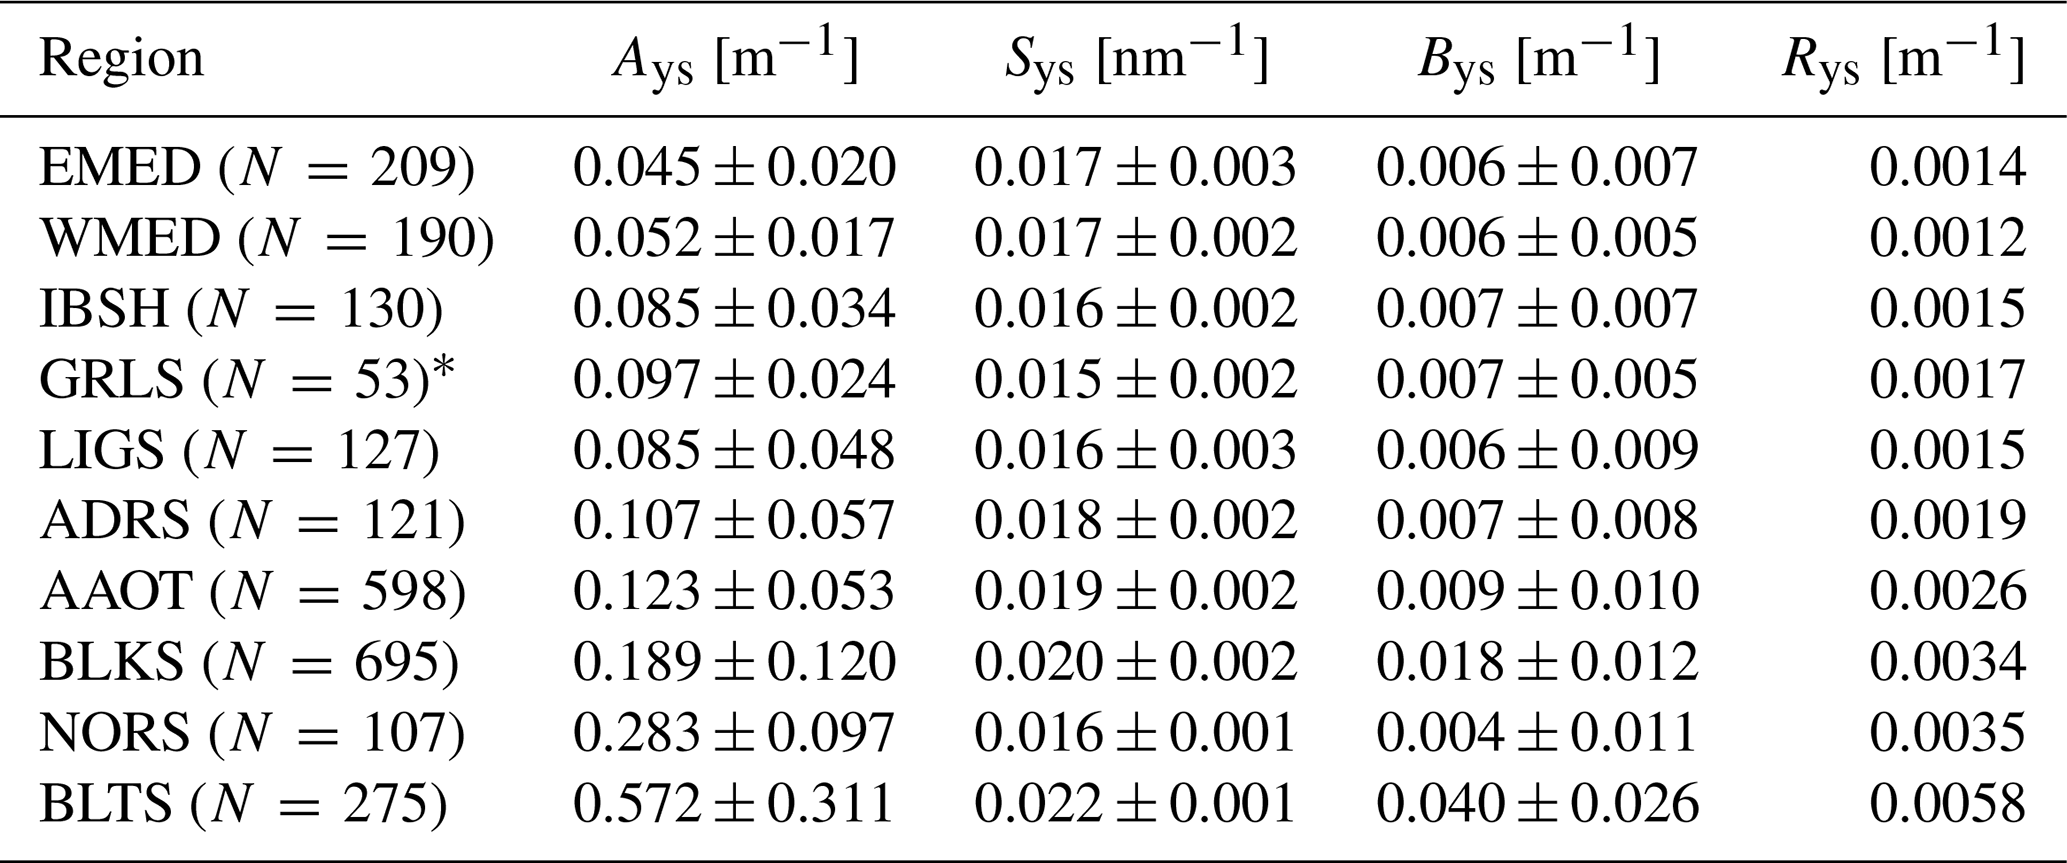
* The two spectra P011201 and P011301 (i.e., those well exceeding 0.7 m−1 at 350 in Fig. 3) were not included in the analysis due to their poor exponential fit.
The comparison of the mean Adt and Sdt values in Tables 6 and 7 for the diverse marine regions exhibits equivalent results regardless of the fitting interval (i.e., the values show maximum differences generally within 0.001 m−1 for the same region), which suggests minor impact of residual pigment absorption in adt(λ) fit. Still, the slightly lower mean residuals Rdt characterizing some the marine regions and increasing with the range of the adt(λ) values, indicate better fitting when restricting the analysis to the combined 400–412 & 480–620 & 710–730 nm intervals.
As expected, the Adt and Sdt values in Tables 6 and 7 well compare with those presented in Zibordi and Berthon (2024). This confirms the appropriateness of the solution applied to construct the multispectral data from the hyperspectral ones. Nevertheless, the mean Rdt values shown in Tables 6 and 7 are much higher than from those previously determined for the multispectral data (see Table 6 in Zibordi and Berthon, 2024). These differences are explained by the exponential fit applied for the determination of the multispectral data minimizing intra-band noise and consequently increasing fitting performance.
The comparison of the mean Ays and Sys in Tables 8 and 9 shows decreased values of the first and often slightly increased values of the latter, when restricting the fit to the 350–550 nm spectral interval with respect to 350–650 nm. The differences with the mean Sys determined with the multispectral values in the 412–665 nm interval (see Table 7 in Zibordi and Berthon, 2024) are explained by the lack of ays(λ) values below 412 nm.
Equivalent to Rdt, the mean Rys across the diverse marine regions naturally increases with the range of the ays(λ) values and exhibit appreciable lower values for the fitting restricted to 350–550 nm with respect to 350–650 nm. Still, residuals Rys in Table 9 would exceed those in Table 8 when quantified for the same spectral interval 350–650 nm. As per adt(λ), the much lower mean residuals Rys given in Zibordi and Berthon (2024) with respect to those shown in Tables 8 and 9, are explained by the method applied for the construction of the ays(λ) multispectral data to minimize intra-band noise.
Ternary plots of ays, adt and aph at 442 nm as a percent of the total absorption (i.e., ) are shown in Fig. 4. Consistent with the equivalent plots presented in Zibordi and Berthon (2024), very few cases suggest dominance of absorption by particles with aph and adt values clustering near the upper and lower right vertices, respectively. Indeed, the majority of cases show predominance of absorption by CDOM with ays values clustered nearby the lower left vertex. While this is naturally expected for the Black Sea (BLKS) optically complex waters and for all the Baltic Sea (BLTS) highly absorbing ones, peculiar is the pronounced clustering observed for the Eastern Mediterranean Sea (EMED) oligotrophic waters, and also for some of the Western Mediterranean Sea (WMED) oligotrophic/mesotrophic ones. This outcome for either EMED and WMED waters, conflicts with the Case-1 water classification. Still, equivalent findings were reached by Pérez et al. (2016), further confirming the presence of a significant CDOM background in the Mediterranean Sea waters
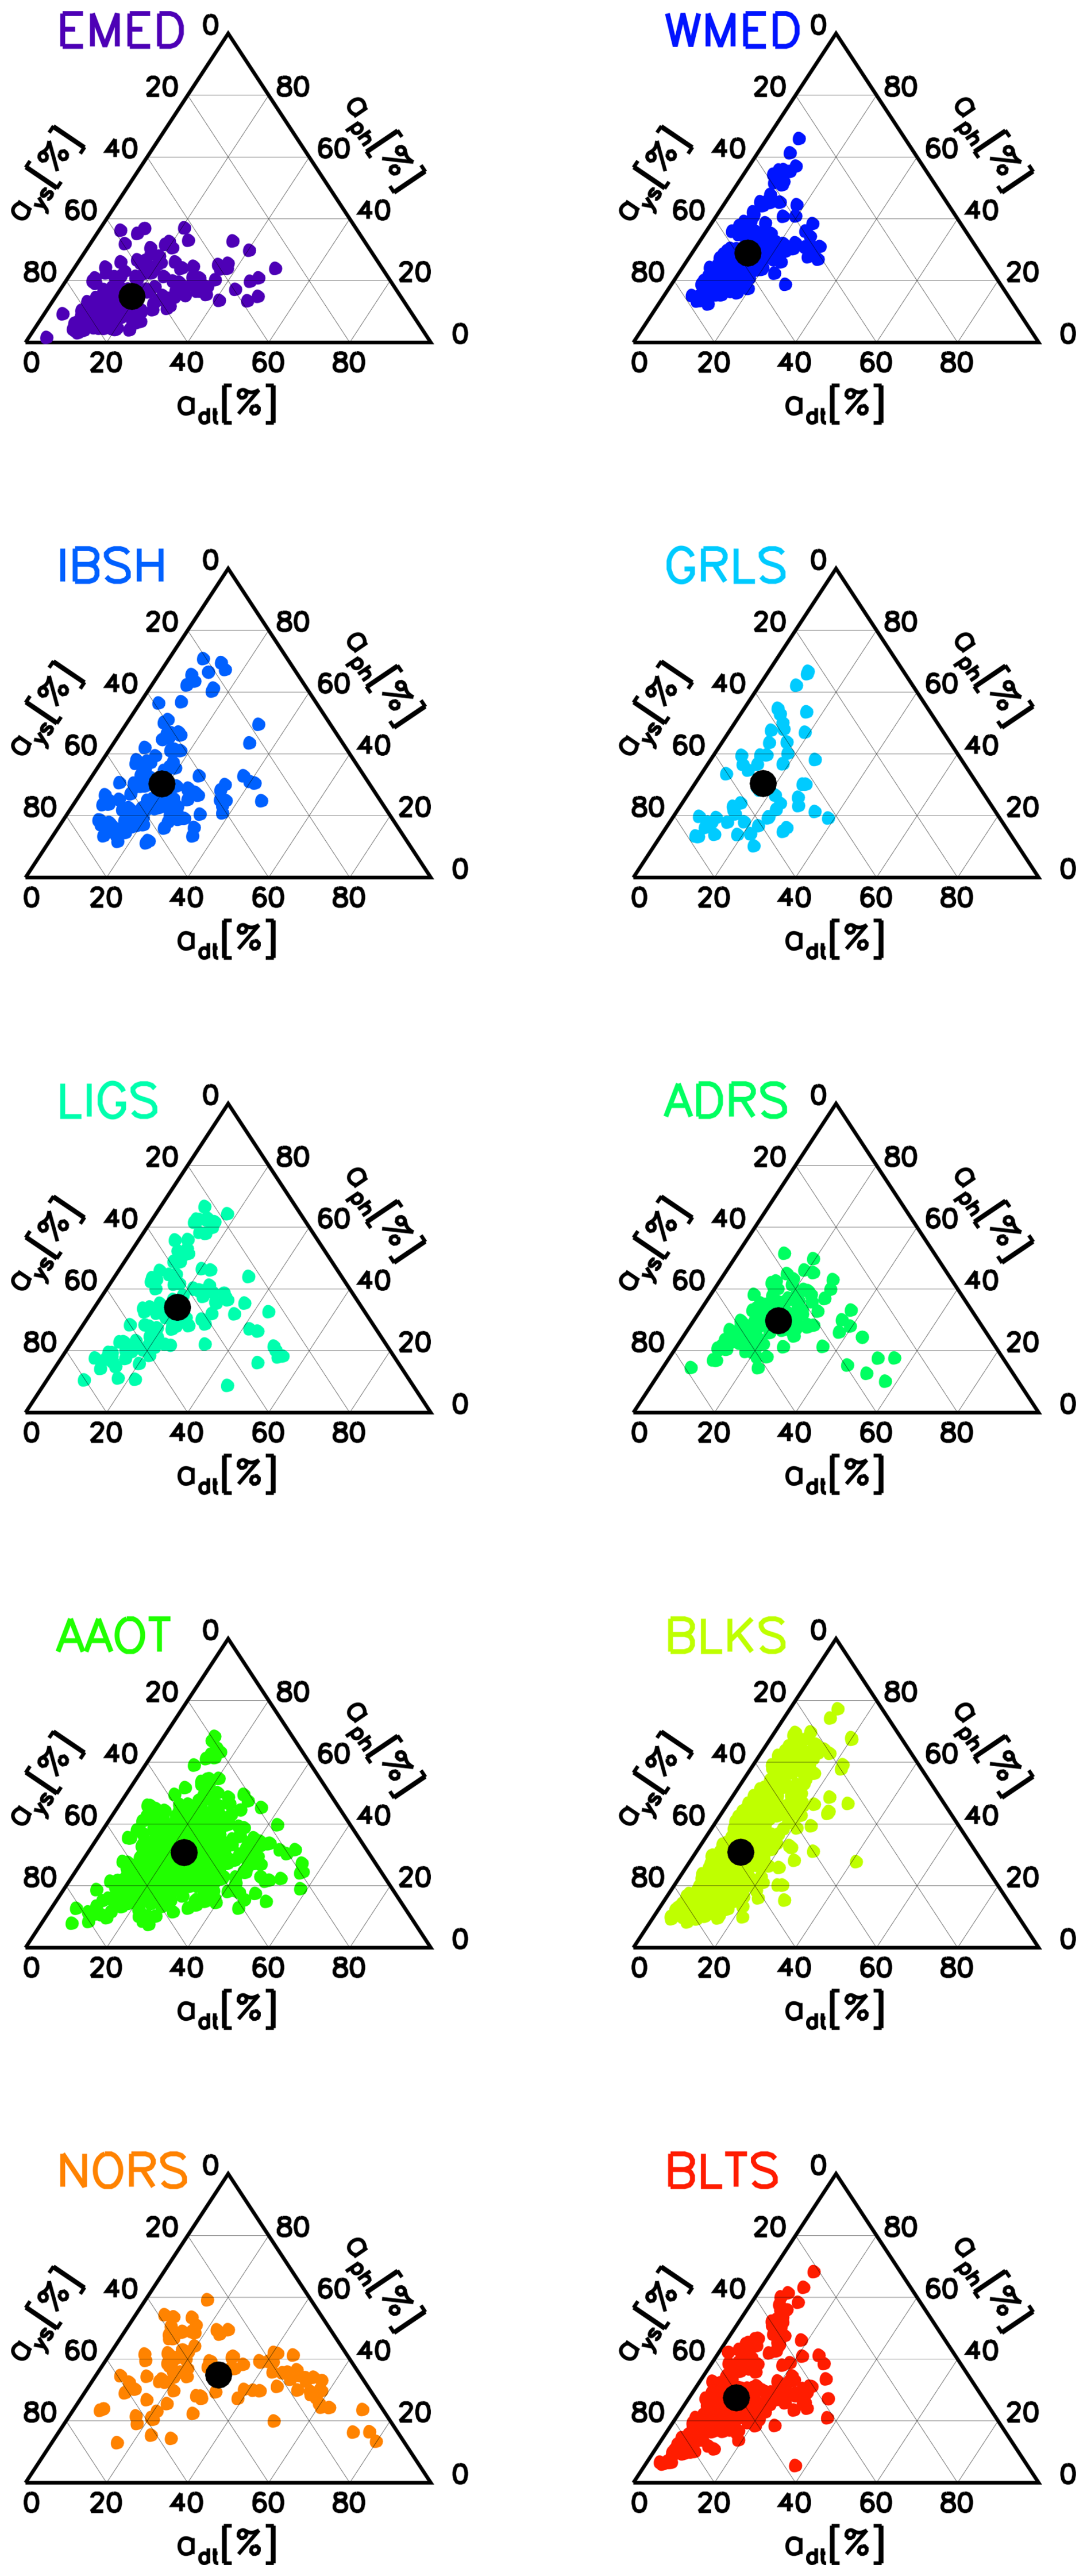
Figure 4Ternary plots of the absorption coefficients ays, adt and aph expressed in percent of the total (except sea water) absorption (i.e., with respect to ) at the 442 nm center-wavelength. The filled black circles indicate the mean of the plotted values.
Minor differences between Fig. 4 and the equivalent one published in Zibordi and Berthon (2024) are explained by the diverse number of spectra (see Sect. 4 and compare the values of N provided in Table 7 of Zibordi and Berthon (2024) with those in Tables 6–9 of this work).
As an additional analysis, scatter plots of aph(442) versus aph(676) in m−1 are displayed in Fig. 5 to address the impact of regional pigments. The corresponding correlation coefficients (not shown) are within 0.96–0.99, thus indicating consistent linear relationships. The average of the ratios, as expressed by the values of μ, decreases from oligotrophic (i.e., EMED and WMED) to more eutrophic waters (e.g., NORS and BLTS), with the exception of the high value observed for the Black Sea (BLKS). This is explained by a higher mean cell size of phytoplankton in eutrophic environments (Margalef, 1978; Chisholm, 1992), and consequently by an increased packaging effect in conjunction with a lower proportion of photoprotective pigments (Bricaud et al., 1995; Ciotti et al., 2002), which lead to lower ratios with respect to oligotrophic environments (Ciotti et al., 2002; Babin et al., 2003).
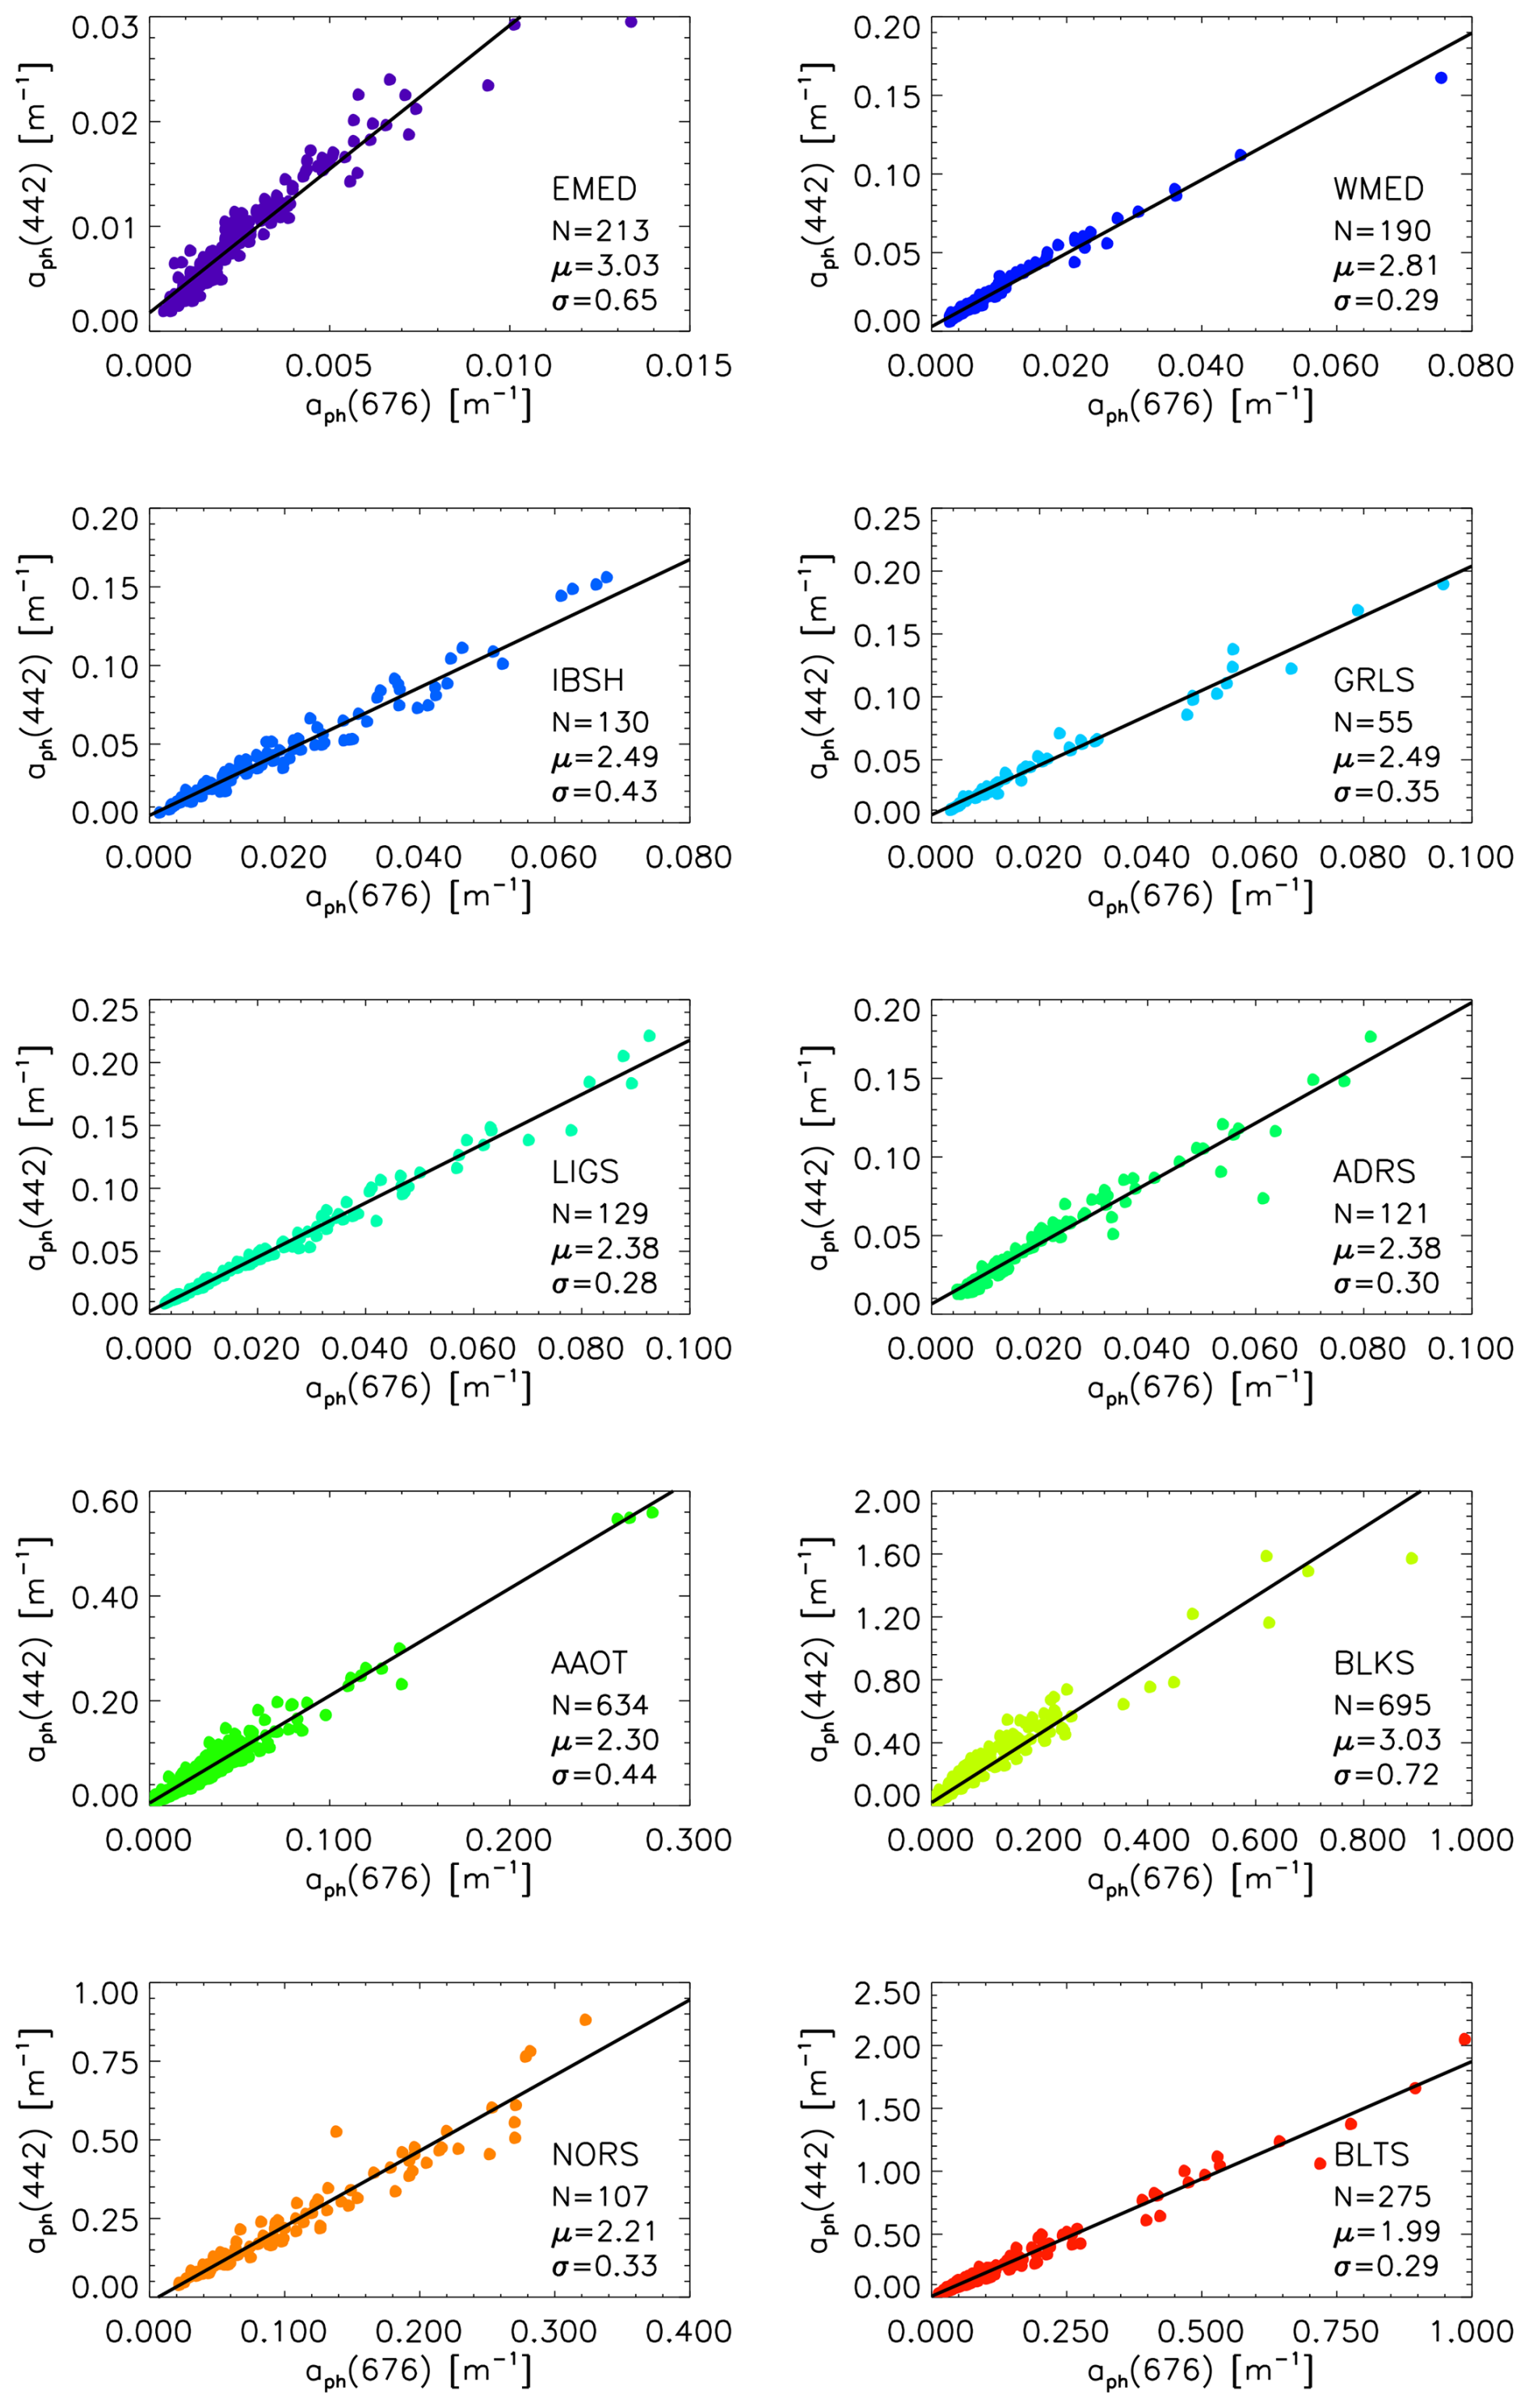
Figure 5Scatter plots of aph(442) versus aph(676) in m−1 for the various geographic regions. N is the number of spectra, while μ and σ are the mean and standard deviation of the ratio , respectively. The continuous thick black lines indicate the linear regression fits.
A comparison of the present dataset with published data for diverse geographical areas is a subtle task which encompasses most of the difficulties intrinsic of assembling measurements from different sources. Nevertheless, such a comparison is attempted for some marine regions. For example, regarding the average aph around 440 nm, the gradient observed between the oligotrophic Western Mediterranean Sea (WMED) and, the eutrophic Baltic (BLTS) and North (NORS) seas (0.02±0.02 to 0.25±0.20 m−1, respectively, where the complementary ± value refers to 1 standard deviation) is consistent with that provided in Babin et al. (2003; 0.01–0.1 to 0.1–0.9 m−1, respectively). The intermediate values reported for the Adriatic Sea (0.05±0.03 m−1) are in the lower side of the range of values observed by Babin et al. (2003; 0.10–0.50 m−1). The average aph(440) determined for the Greenland Sea (GRLS; 0.05±0.03 m−1), is comparable to that observed by Kowalczuk et al. (2019) in the Arctic (0.03–0.09 m−1). Finally, some poor correspondence is observed for the Black Sea (BLKS) between Churilova et al. (2025; 0.01–0.13 m−1) and the present study (0.11±0.17 m−1), still explained by differences in the sampled regions of the same basin.
As additional comparisons, the slopes characterizing the exponential decrease of adt and ays with wavelength are analysed and results presented in Tables 10 and 11 for Sdt and Sys, respectively. A general agreement among studies is evident for both Sdt and Sys, although the spectral fitting intervals applied in the various studies might differ. These agreements also confirm that Sys and Sdt show values in the range of approximately 0.016–0.022 m−1 and 0.010–0.013 m−1, respectively, across marine regions.
A more detailed comparison is considered worthless. In fact the variability due to the sampling in diverse sub-regions and seasons, combined with the use of diverse instrumentation, sampling and analysis protocols, may largely mark differences in the observed natural variability of individual quantities. This is a major reason for the recent attempt to impose standardization of measurement protocols and processing schemes, or at least the provision of related meta-data information for measurements resulting from multiple sources (Werdell et al., 2003). One important feature of the CoASTS-BiOMaP dataset is thus the adoption of identical and consolidated instrumentation, sampling and analysis protocols and also processing solutions applied across different times and geographical regions.
Table 10Mean values ± their standard deviation, or alternatively the measured range, of Sdt inferred from Babin et al. (2003) (B2003), Churilova et al. (2025) (C2025) and those from this study. The spectral interval applied for determining Sdt might differ among studies.

Table 11Mean values ± their standard deviation, or alternatively the measured range, of Sys inferred from Babin et al. (2003) (B2003), Churilova et al. (2025) (C2025), Kowalczuk et al. (2006) (K2006) and those from this study. The spectral interval applied for determining Sys might differ among studies.

Interested researchers can download the CoASTS-BiOMaP data set at https://doi.org/10.1594/PANGAEA.993510 (Berthon and Zibordi, 2026).
The CoASTS and BiOMaP measurement programs, established by the JRC Marine Optical Laboratory in collaboration with various European institutions, from 1995 up to 2022 produced a time-series and geographically distributed bio-optical data at the AAOT site in the northern Adriatic Sea and in European Seas, respectively. The measurements from the two programs included the same quantities rigorously obtained by applying standardized instruments, community measurement methods, extended quality control schemes and consolidated processing.
Complementary to a previous work that introduced the CoASTS-BiOMaP dataset comprising the near surface multispectral bio-optical data (see Zibordi and Berthon, 2024), this work describes the CoASTS and BiOMaP dataset of hyperspectral absorption coefficients aph(λ) and adt(λ) by pigmented and non-pigmented particles, respectively, as well as those by colored dissolved organic matter ays(λ), obtained applying spectrophotometric measurements to field samples.
The slopes Sdt determined from the exponential fit of adt(λ) in the 400–730 nm interval exhibit mean values varying from 0.009 nm−1 for the Eastern Mediterranean Sea up to 0.013 for the North Sea. These values do not significantly vary when restricting the fit to the combined 400–412 & 480–620 & 710–730 nm intervals minimizing the potential impact of residual pigments absorption in adt(λ).
The slopes Sys determined with ays(λ) in the 350–650 nm interval show mean values ranging from 0.015 nm−1 for the Eastern Mediterranean Sea up to 0.021 nm−1 for the Baltic Sea. These values slightly increase when restricting the fit to the 350–550 nm interval as a result of an higher weight of the short wavelength values.
An analysis focussed on aph(λ) shows ratios decreasing from oligotrophic to eutrophic waters. This is explained by an increasing mean cell size of phytoplankton toward eutrophic waters.
This unique dataset has relevance for bio-optical investigations supporting the exploitation of advanced hyperspectral satellite ocean color sensor data.
| AAOT | “Acqua Alta” Oceanographic Tower |
| ADRS | Adriatic Sea |
| BiOMaP | Bio-Optical mapping of Marine Properties |
| BLKS | Black Sea |
| BLTS | Baltic Sea |
| CDOM | Colored Dissolved Organic Matter |
| CoASTS | Coastal Atmosphere and Sea Time-Series |
| EMED | Eastern Mediterranean Sea |
| GRLS | Greenland Sea |
| IBS | Iberian Shelf |
| LIGS | Ligurian Sea |
| MAPD | Mean Absolute Percent Differences |
| JRC | Joint Research Center |
| NORS | North Sea |
| SPM | Suspended Particulate Matter |
| T-R | Transmittance-Reflectance spectrophotometric method |
| WMED | Western Mediterranean Sea |
Jean-François Berthon and Giuseppe Zibordi, who co-led the CoASTS and BiOMaP programs, equally contributed to the generation of the dataset and to the writing of the manuscript. Giuseppe Zibordi was a JRC Scientific Officer since the conception and up to the end of the CoASTS and BiOMaP programs.
The contact author has declared that neither of the authors has any competing interests.
Publisher's note: Copernicus Publications remains neutral with regard to jurisdictional claims made in the text, published maps, institutional affiliations, or any other geographical representation in this paper. The authors bear the ultimate responsibility for providing appropriate place names. Views expressed in the text are those of the authors and do not necessarily reflect the views of the publisher.
The authors acknowledge the contribution to field and laboratory activities by the many JRC and international colleagues whose commitment made possible the execution of the multi-annual CoASTS and BiOMaP programs. Particular recognition is due to: Cristina Targa, Stefania Grossi, Dirk Van der Linde, Lukasz Jankowski, Lyudmila Kamburska, Davide D'Alimonte, Marco Talone, Pietro Sciuto, Ilaria Cazzaniga, Jean Verdebout, Elisabetta Canuti, Alessandro Marchetti, Violeta Slabakova, Natalia Slabakova, Carolina Sa', Simone Colella, Gianluca Volpe, Seppo Kaitala, Jukka Seppala, Aleksandra Mazur.
Finally, Piotr Kowalczuk and Vittorio Brando are acknowledged for their constructive comments to the submitted manuscript.
Direct or indirect (through ship time) support to CoASTS and BiOMaP activities was provided by: the JRC through the EOSS and COLORS institutional projects, the European Union through the MAST-III, EUROFLEETS and JERICO programs, the North Atlantic Treaty Organization (NATO) through the Science for Peace Program, the US National Aeronautics and Space Administration (NASA), the European Space Agency (ESA), the Romanian Space Agency (ROSA), the Institute of Oceanology of the Bulgarian Academy of Sciences, the Institute of Oceanology of the Polish Academy of Sciences, the Finnish Environment Institute, the Italian National Research Council, the Portuguese Hydrographic Institute, the Italian Hydrographic Institute, the Royal Belgian Institute of Natural Sciences, the Hellenic Centre for Marine Research, the Université du Littoral Côte d' Opale.
The contribution of Giuseppe Zibordi to the finalization of this work was supported by the National Aeronautics and Space Administration through the GESTAR-II program under award number 80NSSC22M0001, while the contribution of Jean-François Berthon was supported by DG DEFIS (the European Commission Directorate-General for Defence Industry and Space) and the Copernicus Programme.
This paper was edited by Salvatore Marullo and reviewed by Piotr Kowalczuk and Vittorio Brando.
Babin, M., Stramski, D., Ferrari, G. M., Claustre, H., Bricaud, A., Obolensky, G., and Hoepffner, N.: Variations in the light absorption coefficients of phytoplankton, nonalgal particles, and dissolved organic matter in coastal waters around Europe, J. Geophys. Res.-Oceans, 108, 3211–13230, 2003.
Berthon, J.-F. and Zibordi, G.: Coastal Atmosphere & Sea Time Series (CoASTS) and Bio-Optical mapping of Marine optical Properties (BiOMaP): the water hyperspectral absorption coefficients, PANGAEA [data set], https://doi.org/10.1594/PANGAEA.993510, 2026.
Berthon, J.-F., Zibordi, G., Doyle, J. P., Grossi, S., van der Linde, D., and Targa, C.: Coastal Atmosphere and Sea Time Series (CoASTS), Part 2: Data Analysis, NASA Tech. Memo. 2002–206892, Vol. 20, edited by: Hooker, S. B. and Firestone, E. R., NASA Goddard Space Flight Center, Greenbelt, Maryland, 25 pp., 2002.
Berthon, J. F., Mélin, F., and Zibordi, G.: Ocean colour remote sensing of the optically complex European seas, in: Remote sensing of the European seas, 35–52, Springer, Dordrecht, https://doi.org/10.1007/978-1-4020-6772-3_3, 2008.
Bricaud, A., Babin, M., Morel, A., and Claustre, H.: Variability in the chlorophyll-specific absorption coefficients of natural phytoplankton: Analysis and parameterization, J. Geophys. Res.-Oceans, 100, 13321–13332, 1995.
Chisholm, S. W.: Phytoplankton size, in: Primary Productivity and Biogeochemical Cycles in the Sea, edited by: Falkowski, P. G. and Woodhead, A. D., 213–237, Plenum Press, New York, https://doi.org/10.1007/978-1-4899-0762-2_12, 1992.
Churilova, T., Efimova, T., Moiseeva, N., Skorokhod, E., Krivenko, O., and Suslin, V.: Light Absorption Properties and Absorption Budget of the Black Sea, J. Marine Syst., 249, https://doi.org/10.1016/j.jmarsys.2025.104069, 2025.
Ciotti, A. M., Lewis, M. R., and Cullen, J. J.: Assessment of the relationships between dominant cell size in natural phytoplankton communities and the spectral shape of the absorption coefficient, Limnol. Oceanogr., 47, 404–417, 2002.
Ferrari, G. M. and Tassan, S.: A method using chemical oxidation to remove light absorption by phytoplankton pigments, J. Phycol., 35, 1090–1098, 1999.
Ferrari, G. M., Dowell, M. D., Grossi, S., and Targa, C.: Relationship between the optical properties of chromophoric dissolved organic matter and total concentration of dissolved organic carbon in the southern Baltic Sea region, Mar. Chem., 55, 299–316, 1996.
IOCCG: Remote Sensing of Ocean Colour in Coastal, and Other Optically-Complex, Waters, edited by: Sathyendranath, S., Reports of the International Ocean-Colour Coordinating Group, No. 3, IOCCG, Dartmouth, Canada, ISBN 978-1-896246-54-3, 2000.
Kowalczuk, P., Stedmon, C. A., and Markager, S.: Modeling absorption by CDOM in the Baltic Sea from season, salinity and chlorophyll, Mar. Chem., 101, 1–11, 2006.
Kowalczuk, P., Borzycka, K., Sagan, S., Makarewicz, A., Zabłocka, M., Meler, J., Zdun, A., Konik, M., Darecki, M., Granskog, M. A., and Pavlov, A. K.: Bio-optical Properties of Surface Waters in the Atlantic Water Inflow Region off Spitsbergen (Arctic Ocean), J. Geophys. Res.-Oceans, 124, 1964–1987, 2019.
Margalef, R.: Life-forms of phytoplankton as survival alternatives in an unstable environment, Oceanol. Acta, 1, 493–509, 1978.
Massicotte, P., Babin, M., Fell, F., Fournier-Sicre, V., and Doxaran, D.: The Coastal Surveillance Through Observation of Ocean Color (COASTℓOOC) dataset, Earth Syst. Sci. Data, 15, 3529–3545, https://doi.org/10.5194/essd-15-3529-2023, 2023.
Nechad, B., Ruddick, K., Schroeder, T., Oubelkheir, K., Blondeau-Patissier, D., Cherukuru, N., Brando, V., Dekker, A., Clementson, L., Banks, A. C., Maritorena, S., Werdell, P. J., Sá, C., Brotas, V., Caballero de Frutos, I., Ahn, Y.-H., Salama, S., Tilstone, G., Martinez-Vicente, V., Foley, D., McKibben, M., Nahorniak, J., Peterson, T., Siliò-Calzada, A., Röttgers, R., Lee, Z., Peters, M., and Brockmann, C.: CoastColour Round Robin data sets: a database to evaluate the performance of algorithms for the retrieval of water quality parameters in coastal waters, Earth Syst. Sci. Data, 7, 319–348, https://doi.org/10.5194/essd-7-319-2015, 2015.
Pérez, G. L., Galí, M., Royer, S. J., Sarmento, H., Gasol, J. M., Marrasé, C., and Simó, R.: Bio-optical characterization of offshore NW Mediterranean waters: CDOM contribution to the absorption budget and diffuse attenuation of downwelling irradiance, Deep-Sea Res. Pt. I, 114, 111–127, 2016.
Tassan, S. and Ferrari, G. M.: An alternative approach to absorption measurements of aquatic particles retained on filters, Limnol. Oceanogr., 40, 1358–1368, 1995.
Tassan, S. and Ferrari, G. M.: A sensitivity analysis of the “Transmittance–Reflectance” method for measuring light absorption by aquatic particles, J. Plankton Res., 24, 757–774, 2002.
Tassan, S., Ferrari, G. M., Bricaud, A., and Babin, M.: Variability of the amplification factor of light absorption by filter-retained aquatic particles in the coastal environment, J. Plankton Res., 22, 659–668, 2000.
Valente, A., Sathyendranath, S., Brotas, V., Groom, S., Grant, M., Jackson, T., Chuprin, A., Taberner, M., Airs, R., Antoine, D., Arnone, R., Balch, W. M., Barker, K., Barlow, R., Bélanger, S., Berthon, J.-F., Beşiktepe, Ş., Borsheim, Y., Bracher, A., Brando, V., Brewin, R. J. W., Canuti, E., Chavez, F. P., Cianca, A., Claustre, H., Clementson, L., Crout, R., Ferreira, A., Freeman, S., Frouin, R., García-Soto, C., Gibb, S. W., Goericke, R., Gould, R., Guillocheau, N., Hooker, S. B., Hu, C., Kahru, M., Kampel, M., Klein, H., Kratzer, S., Kudela, R., Ledesma, J., Lohrenz, S., Loisel, H., Mannino, A., Martinez-Vicente, V., Matrai, P., McKee, D., Mitchell, B. G., Moisan, T., Montes, E., Muller-Karger, F., Neeley, A., Novak, M., O'Dowd, L., Ondrusek, M., Platt, T., Poulton, A. J., Repecaud, M., Röttgers, R., Schroeder, T., Smyth, T., Smythe-Wright, D., Sosik, H. M., Thomas, C., Thomas, R., Tilstone, G., Tracana, A., Twardowski, M., Vellucci, V., Voss, K., Werdell, J., Wernand, M., Wojtasiewicz, B., Wright, S., and Zibordi, G.: A compilation of global bio-optical in situ data for ocean colour satellite applications – version three, Earth Syst. Sci. Data, 14, 5737–5770, https://doi.org/10.5194/essd-14-5737-2022, 2022.
Werdell, P. J., Bailey, S., Fargion, G., Pietras, C., Knobelspiesse, K., Feldman, G., and McClain, C.: Unique data repository facilitates ocean color satellite validation, Eos, 84, 377–387, 2003.
Werdell, P. J., Cairns, B., Caplan, S. A., Cetinić, I., Foley, S. R., Franz, B. A., Gao, M., Fasnacht, Z. T., Huemmrich, K. F., Ibrahim, A., and Knobelspiesse, K. D.: Advancing Earth System Science With the NASA Plankton, Aerosol, Cloud, Ocean Ecosystem (PACE) Satellite Mission, Glob. Change Biol., 32, https://doi.org/10.1111/gcb.70869, 2026.
Zibordi, G. and Sciuto, P.: Advances in Marine Optics Technology, EUR 30996 EN, Publications Office of the European Union, Luxembourg, JRC128393, ISBN 978-92-76-47719-8, https://doi.org/10.2760/387681, 2022.
Zibordi, G. and Berthon, J.-F.: Coastal Atmosphere and Sea Time Series (CoASTS) and Bio-Optical mapping of Marine Properties (BiOMaP): the CoASTS-BiOMaP dataset, Earth Syst. Sci. Data, 16, 5477–5502, https://doi.org/10.5194/essd-16-5477-2024, 2024.
Zibordi, G., Berthon, J.-F., Doyle, J. P., Grossi, S., van der Linde, D., Targa, C., and Alberotanza, L.: Coastal Atmosphere and Sea Time Series (CoASTS), Part 1: A Tower-Based Long-Term Measurement Program, NASA Tech. Memo. 2002–206892, Vol. 19, edited by: Hooker, S. B. and Firestone, E. R., NASA Goddard Space Flight Center, Greenbelt, Maryland, 29 pp., 2002.
Zibordi, G., Berthon, J.-F., Mélin, F., and D'Alimonte, D.: Cross-site consistent in situ measurements for satellite ocean color applications: The BiOMaP radiometric dataset, Remote Sens. Environ., 115, 2104–2115, 2011.
- Abstract
- Introduction
- The CoASTS and BiOMaP paired measurement programs
- Details on the absorption measurement methods
- The CoASTS and BiOMaP dataset of hyperspectral absorption coefficients
- Data availability
- Summary and conclusions
- Appendix A: Acronyms
- Author contributions
- Competing interests
- Disclaimer
- Acknowledgements
- Financial support
- Review statement
- References
- Abstract
- Introduction
- The CoASTS and BiOMaP paired measurement programs
- Details on the absorption measurement methods
- The CoASTS and BiOMaP dataset of hyperspectral absorption coefficients
- Data availability
- Summary and conclusions
- Appendix A: Acronyms
- Author contributions
- Competing interests
- Disclaimer
- Acknowledgements
- Financial support
- Review statement
- References