the Creative Commons Attribution 4.0 License.
the Creative Commons Attribution 4.0 License.
 | 12 Oct 2026
The OpenSat4Weather dataset: Ku-band satellite link data for precipitation monitoring

Maximilian Graf
Greta Cazzaniga
François Mercier
Maxime Turko
The TV-SAT signals received by the ground antennas of Satellite Microwave Links (SMLs) can be opportunistically used for detecting and quantifying precipitation. Consequently, SMLs have the potential to serve as low-cost rainfall sensors complementing conventional instruments. However, a major challenge for opportunistic sensors, including both SMLs and their terrestrial counterpart – Commercial Microwave Links (CMLs) – is related to data ownership and accessibility constraints, possibly hindering progress in the development of processing tools and validation studies. This limitation highlights the importance of openly accessible datasets. While CML open datasets are already available, there are no large-scale SML datasets in public repositories. To address this gap, we introduce the OpenSat4Weather dataset, a comprehensive and openly accessible collection of measurements from 215 SML sensors deployed in Southern France, over a five-month period from August to December 2022. The dataset is accessible at https://doi.org/10.5281/zenodo.16530166 (Nebuloni et al., 2025b). OpenSat4Weather also includes concurrent conventional measurements, namely, 6 min rainfall depths from 113 operational rain gauges, and radar-based estimates of rainfall intensity along each SML path. The radar data were derived from the gauge-adjusted weather radar product PANTHERE provided by Météo-France. Additionally, the dataset stores ERA5 reanalysis data of the 0 °C isotherm height for rain height estimation, which are essential for accurately converting the received signal level into rainfall intensity.
In this paper, we detail the OpenSat4Weather data preparation process and draw statistics of data availability. We then provide a descriptive analysis of the dataset, including rainfall characteristics, derived from rain gauges, statistical properties of the SML received signal levels, and a comparison between SML and radar data. In addition, we illustrate examples of disturbances and anomalous patterns observed in raw SML signals. Finally, we provide some practical guidelines for processing and analyzing SML data. Our ultimate goal is to promote open research initiatives aimed at accelerating the development of SML-based applications. Enhancing rainfall monitoring by opportunistic sensors has the potential to provide substantial benefits, particularly in regions where conventional networks are sparse or unavailable.
- Article
(5401 KB) - Full-text XML
- BibTeX
- EndNote


The impact of rainfall on satellite communications has been investigated for decades as rain-induced signal fades can substantially degrade the performance of satellite links operating in the Ku band and above (Crane, 1996; ITU-R P.838-3, 2005). On the other hand, the large deployment of geostationary fixed satellite services such as TV-SAT and satellite internet operating in rain-sensitive bands paved the way for the exploitation of satellite communication signals for rainfall monitoring. Satellite Microwave Links (SMLs) provide raw data in the form of time series of the Received Signal Level (RSL), corresponding either to the received power at the ground terminal (typically expressed in dBm) or the signal-to-noise ratio (in dB), averaged over an appropriate period of time. The RSL time series undergo a processing chain aimed at identifying the rainy periods, separating the effects of rain from the ones of disturbances, and finally converting the cleaned up signal into rainfall intensity estimates (Arslan et al., 2017).
Two distinct configurations have been proposed to implement the opportunistic sensing paradigm based on SMLs. The first approach relies on commercial-grade low-cost equipment consisting of a satellite dish antenna, a receiver and a data logger storing TV-SAT broadcast signals. The data collected in-situ by several of such devices are transferred to a central server for processing via cellular or Wi-Fi connectivity, thereby setting-up a real-time rainfall monitoring network (Colli et al., 2019; Gelbart et al., 2025). Flexibility is another key advantage of this approach as the sensors can be rapidly deployed wherever is needed. An alternative scheme relies on satellite-based IoT services or satellite internet systems, which use bidirectional links (Giannetti et al., 2019). In this case, the signal received by the ground user terminal is transmitted back to the gateway via the satellite return channel. Measurements collected from many user terminals can be aggregated and processed by a centralized server. Please note the difference between the two approaches. In the first configuration, an additional infrastructure must be deployed and the raw data are accessible to anybody willing to install a ground receiver. In contrast, the second configuration does not require any additional infrastructure, as the RSL is transmitted through the return channel (alongside user traffic) for operational purposes, for instance, to optimize link performance according to current channel conditions. However, in this case, the satellite operator is the owner of the data. Both SML schemes can provide very high temporal resolution data, in the order of 1 min or even less.
Research on SMLs as opportunistic rainfall sensors has been inspired by similar studies on terrestrial backhaul links, namely Commercial Microwave Links (CMLs), which emerged nearly twenty years ago (Messer et al., 2006; Leijnse et al., 2007a). A major advantage of CML data is their ubiquitous coverage, as wireless backhauling is employed in most mobile networks in the world. The exploitation scheme of CML data is similar to the one of bidirectional SMLs as in both cases data are generated as by products of network management activities conducted by the network operator. However, the processing chain of SML data differs from the one of CMLs in some important aspects. These differences depend on the geometry of the satellite link, which traverses the entire atmosphere, and on the characteristics of the transmitter, i.e. a geostationary satellite. In particular, only a small part of the link extending from the ground to the height where ice particles have melted into raindrops is affected by rain. Therefore, the knowledge of the rain height is essential for the correct conversion process from RSL to rainfall intensity as signal attenuation is proportional to the rainy propagation path (Giannetti et al., 2017). The rain height can be estimated using weather radar measurements or radiosoundings (when available), models, or forecasts produced by Numerical Weather Prediction (NWP) models. Moreover, significant errors in rainfall intensity estimates may be caused by the additional RSL loss due to the presence of the melting layer, that is, the thin atmospheric region above the rainy layer where frozen particles are melting. Finally, the transmitted power of the satellite is neither known nor constant and satellite perturbations induced by gravitational effects can introduce additional RSL fluctuations that may overlap the ones due to rain. Despite the complexity of data processing, several studies demonstrated the capability of SMLs to detect dry/wet periods (Angeloni et al., 2024; Gianoglio et al., 2024) as well as to quantify precipitation (Barthès and Mallet, 2013; Mercier et al., 2015; Colli et al., 2020; Adirosi et al., 2021). The reference data used in the validation process are direct measurements collected from operational networks of rain gauges, disdrometers, or radar-based precipitation maps.
It is very important to unlock CML and SML datasets, which may have ownership issues. Open data will help developing processing tools and carrying out validation studies, especially when concurrent datasets of conventional rainfall data are available. Research based on open data can assess the quality of opportunistic rainfall data and whether they can be used in operational scenarios, paving the way for implementing new business models. Several open CML datasets are already available in the literature. For instance, the OpenMRG dataset includes raw data collected from 364 bidirectional links deployed in the urban area of Goteborg (Sweden) over a three-month summer period (Andersson et al., 2022). Another large-scale dataset includes a countywide network of 1818 links covering the Netherlands and spanning the period from January 2011 to March 2015 (with gaps) (Overeem et al., 2016). These links are part of the network of one of the three mobile network operators active in the Netherlands. Two years of data (2021 and 2022) collected from about 150 CMLs in the region of Emilia-Romagna (Italy) are available for open access on the Zenodo platform (Covi and Roversi, 2024). Finally, data from 100 links operated by the NYC Community Mesh network have also recently been published (Jacoby et al., 2025).
To the best of the authors' knowledge, however, no widespread SML open datasets are accessible. This work fills the gap, presenting OpenSat4Weather (Nebuloni et al., 2025b), an open dataset comprising RSL data from 215 SML sensors deployed in Southern France over a five-month period in 2022. The dataset also includes concurrent rainfall intensity measurements and 0 °C isotherm height data. OpenSat4Weather is presented in Sect. 2. Section 3 discusses preprocessing methods and data formats. Section 4 illustrates descriptive statistics of the dataset, while Sect. 5 shows examples of anomalous RSL patterns. Section 6 provides some practical recommendations for SML data processing, and, finally, the conclusions are given in Sect. 8.
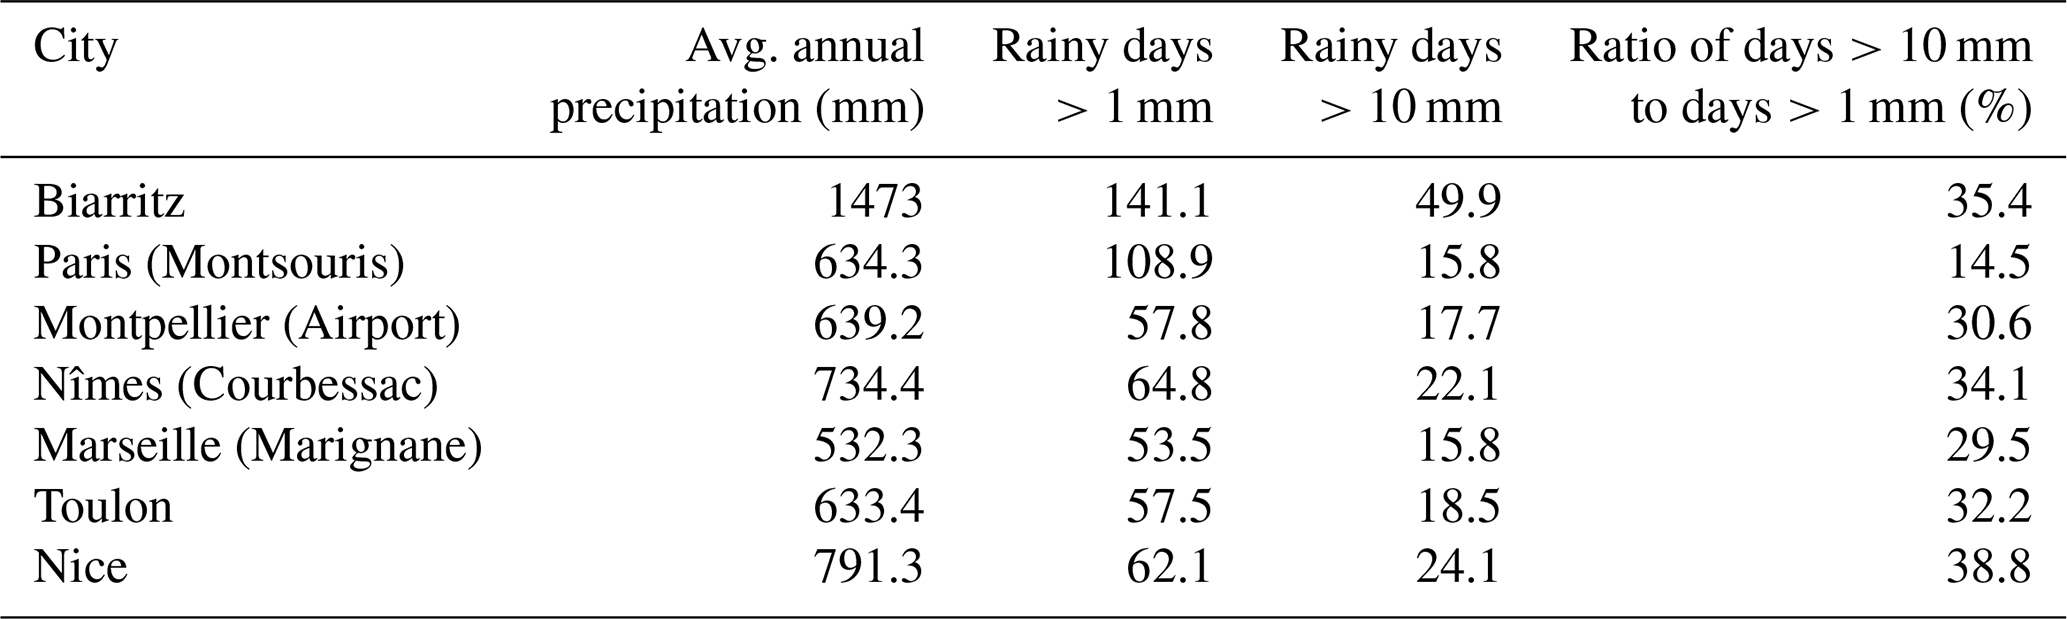
The dataset includes most of the coastal region near the Mediterranean Sea in southeastern France and covers the period from August to December 2022 (Fig. 1). The case study area is characterized by a Mediterranean climate, with mild winters, hot and dry summers, and wetter springs and autumns. Rainfall exhibits a pronounced seasonal cycle (Mimeau et al., 2021). In addition, rainfall is often associated with thunderstorms, which contribute approximately 40 % of the annual precipitation and account for around 35 % of all rainy days (Table 1). This proportion is significantly higher compared to northern France (illustrated by the example of Paris in the table). On the other hand, total accumulation is relatively low in the southeastern region compared to the southwestern region, with Biarritz being an extreme example. In 2022, temperatures were above normal across most of France, contributing to record-breaking drought conditions that persisted until mid-November in Southern France. Precipitation, including snowfall, remained below average, and Southern France did not experience any major storms or significant Mediterranean episodes during this period. Nevertheless, several severe convective events were recorded, notably on 16–17 August (including episodes of hail), as well as on 6–7, 13–14, and 23–24 September (Météo-France, 2025b).
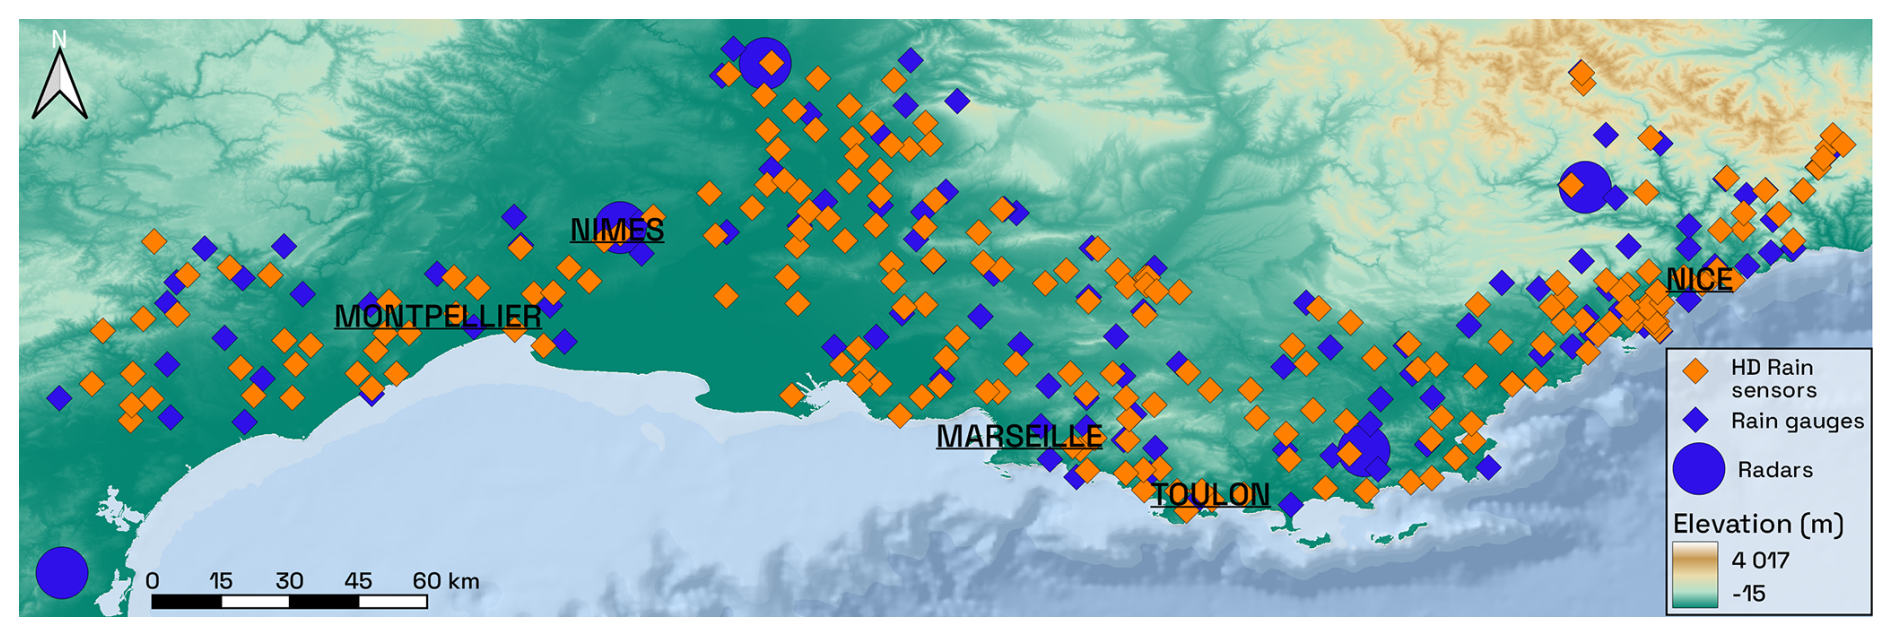
Figure 1Position of the HD Rain SML stations, of rain gauges and radars in the coastal area near the Mediterranean Sea in southeastern France.
Table 1Average precipitation and statistics of rainy days per year (1991–2020) for selected French cities (Météo-France, 2025a).
It is important to highlight that a dataset spanning a few months is insufficient to represent the full seasonal cycle and interannual variability of rainfall. This limitation has important implications for the use of OpenSat4Weather in the development and evaluation of rainfall retrieval algorithms. In particular, it increases the risk of overfitting during SML calibration, potentially resulting in biased model parameter estimates. Moreover, model validation is constrained by the reduced statistical robustness of key performance indicators
The following subsections describe the four data types that constitute the OpenSat4Weather dataset.
2.1 SML
SML data were provided by HD Rain, a French company specializing in weather monitoring and forecasting services. The deployment of HD Rain terminals in this region is motivated by its exposure to significant environmental and meteorological hazards. The study area is affected by “épisodes cévenols”, that is, intense Mediterranean rainfall events that can trigger severe flash floods. Given the high flood risk, high-resolution precipitation measurements are essential for improving early warning systems and hydrometeorological models. This need is particularly critical in this region, which comprises large densely urbanized areas where pluvial flooding represents a major hazard. Additionally, the region's complex topography results in highly variable rainfall patterns, which limits the representativeness of conventional rain gauge measurements. SML terminals help address this limitation by providing low cost decentralised fine-scale precipitation data, thereby enhancing meteorological observations in mountainous environments. In addition to precipitation monitoring, the integration of temperature and humidity sensors into these devices (Fig. 2) enables their use in forest fire risk assessment and management. This capability is particularly relevant in the study region, which is highly susceptible to wildfires.
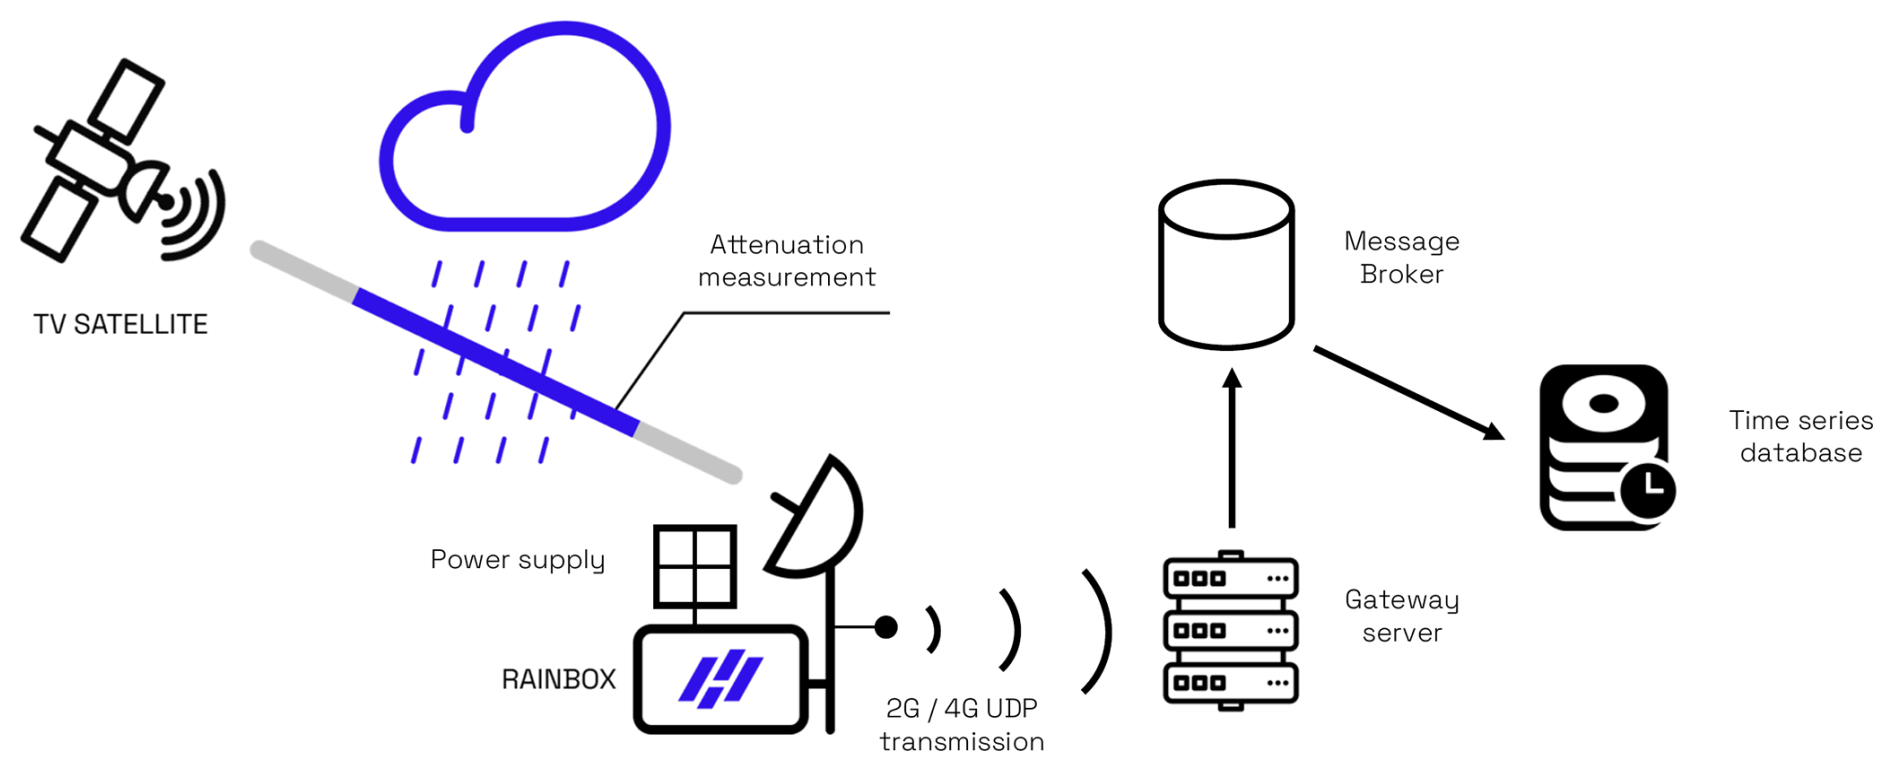
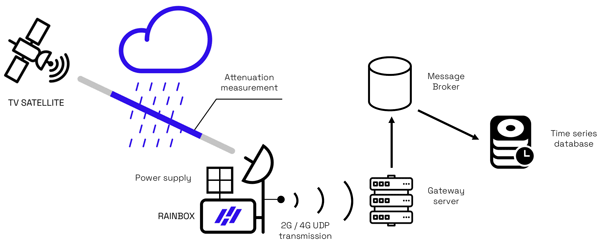
The SML sensor measures the loss of signal power, i.e. rain attenuation, caused by rainfall along the propagation path of the microwave signal transmitted by a broadcasting satellite (Fig. 2). The average rain intensity between the receiving ground station and the rain-snow transition level is directly related to rain attenuation.
Each HD Rain SML consists of a satellite dish (around 75 cm in diameter) equipped with a standard TV Low-Noise Block (LNB) receiver, a solar panel providing autonomous power supply, a GSM antenna, and a device called Rainbox. The Rainbox incorporates a data logger that enables high-frequency measurements of the signal power received from the satellite and resamples these measurements by averaging them over 15 s intervals. It also contains a SIM card that provides connectivity through multiple mobile operators worldwide. The raw data are transmitted via the GSM network to a central server, where they are processed by a message broker before being stored in a time-series database for subsequent analysis.
The OpenSat4Weather dataset includes measurements from 215 HD Rain stations. Among these, 147 receive the signal from the Astra 19.2° E (Astra 1L) satellite, 67 from Hotbird 13° E (Hotbird 13F), and one from Astra 23.5° E (Astra 3B). Since these three satellites occupy nearby orbital positions, the satellite dishes have similar elevation and azimuth angles (Table 2). Two hardware versions are represented in the dataset: RBV2 (23 stations) and RBV3 (192 stations). RBV3 is the latest generation and, while providing the same measurements as RBV2, features updated electronic components and a larger solar panel to improve energy autonomy. The stations are deployed at elevations ranging from 0 to 1622 (above sea level), with a median elevation of 94 m and an average of 173.3 m. Each station collects data at two frequency bands and two polarizations. For each frequency–polarization combination, the Rainbox module records the RSL. The OpenSat4Weather dataset includes measurements from signals transmitted at horizontal polarization in the upper Ku-band. Specifically, the RSL in the dataset corresponds to the integration of the received satellite signal over the 11.70–12.75 GHz frequency range, which provides the highest RSL for the broadcasting satellites operating over France. Station identifiers follow the format “FRA-NNNNN”, where “FRA” denotes the country code and “NNNNN” is a unique five-digit integer station identifier (e.g. “FRA-00002”).
Table 2Satellite characteristics and number of associated HD Rain SML stations.

The dataset consists of RSL time series in dBm recorded at a 1 min temporal resolution with a precision of 0.01 dBm, together with the corresponding time stamps, expressed in UTC. The data cover the period from 1 August to 31 December 2022. Figure 3a presents a 2D picture of all RSL samples, labeled in three classes: missing data (NA), invalid observations, and valid observations. Figure 3b reports selected RSL quantiles. Considering all stations and the entire observation period, the RSL values exhibit a median value of −16.4 dBm, with minimum and maximum values of −60.5 and −8.8 dBm, respectively. The absolute RSL value is not a critical parameter provided it remains within an acceptable operating range, as it is directly influenced by the antenna cable length between the dish and the Rainbox unit. However, values below approximately −40 dBm are generally considered suspicious and should be flagged as invalid observations. Such anomalously low values may result from several factors, including excessive cable length, which introduces additional signal loss, inaccurate satellite alignment, or a malfunctioning LNB, among others. In any case, an analysis of the magnitude of the RSL must be always considered in relation to its variability over time. Only five stations in the dataset (FRA-00038, FRA-00309, FRA-00332, FRA-00348, and FRA-00375) recorded RSL values below −40 dBm. The proportion of missing values (NAs) varies between 0.04 % and 20.6 % across stations, with a median of 0.09 % and a mean of 0.90 %, respectively.
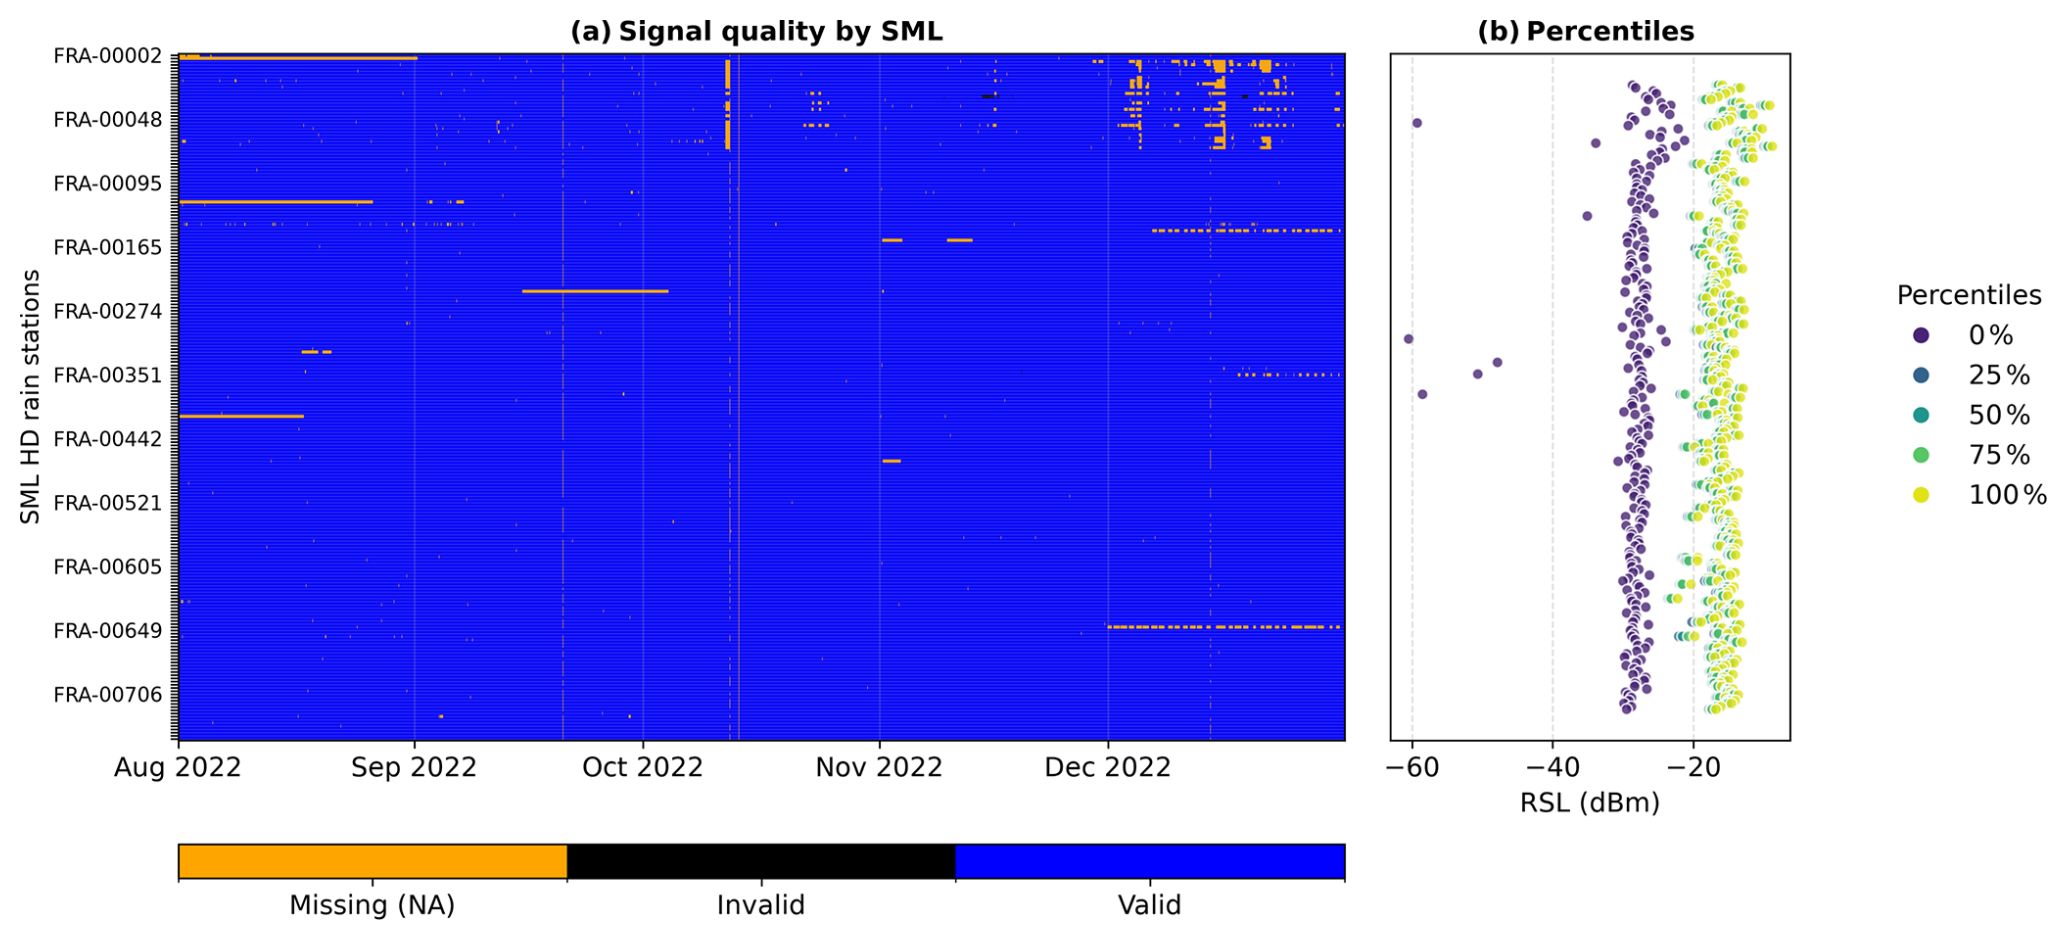
Figure 3Quality assessment of the RSL data collected by the 215 HD Rain SML stations during the five-month observation period. (a) RSL time series as a two-dimensional matrix, where each pixel represents a 1 min observation from a single station. Missing data (NA) are plotted in orange, invalid observations (i.e. RSL values below −40 dBm) in black, and valid observations in blue. (b) Distribution of RSL values for each station in terms of selected quantiles (dBm). Stations are sorted by increasing SML identifier from top to bottom.
2.2 Rain gauges
The OpenSat4Weather dataset includes ground-based rainfall measurements collected by the operational rain gauge network of Météo-France. These data are freely available through the Météo-France API portal and the open-data platform (http://meteo.data.gouv.fr, last access: 19 May 2026). Rain gauge measurements undergo a data quality control process, which assigns a quality code to each observation as follows; “9 ” denotes filtered data, “0” denotes protected data, that have been validated through manual inspection, “1” denotes validated data either automatically or through manual inspection, and, “2” indicates questionable observations (according to the automatic procedure).
The rain gauge dataset provides rainfall accumulations at a 6 min temporal resolution with a precision of 0.1 mm, covering the same period as the SML dataset (1 August–31 December 2022). A total of 113 rain gauges located within 10 km from at least one SML station were selected for inclusion in the dataset. The rain gauges are installed at elevations ranging from 1 to 1464 , with median and mean elevations of 184 m and 313 , respectively.
Figure 4 summarizes the statistical characteristics of the rain gauge observations using the same graphical representation as in Fig. 3. A total of 41 % (46 out of 113) of the rain gauges contain missing or invalid data. The maximum percentage of missing or invalid data for a single sensor was 11.4 %, with an average of 1.1 % across all stations. Zero rainfall was recorded from 86.7 % to 99.0 % of the 6 min intervals, with an average occurrence of 97.5 %. The maximum recorded rainfall accumulation over a 6 min interval was 26.9 mm.
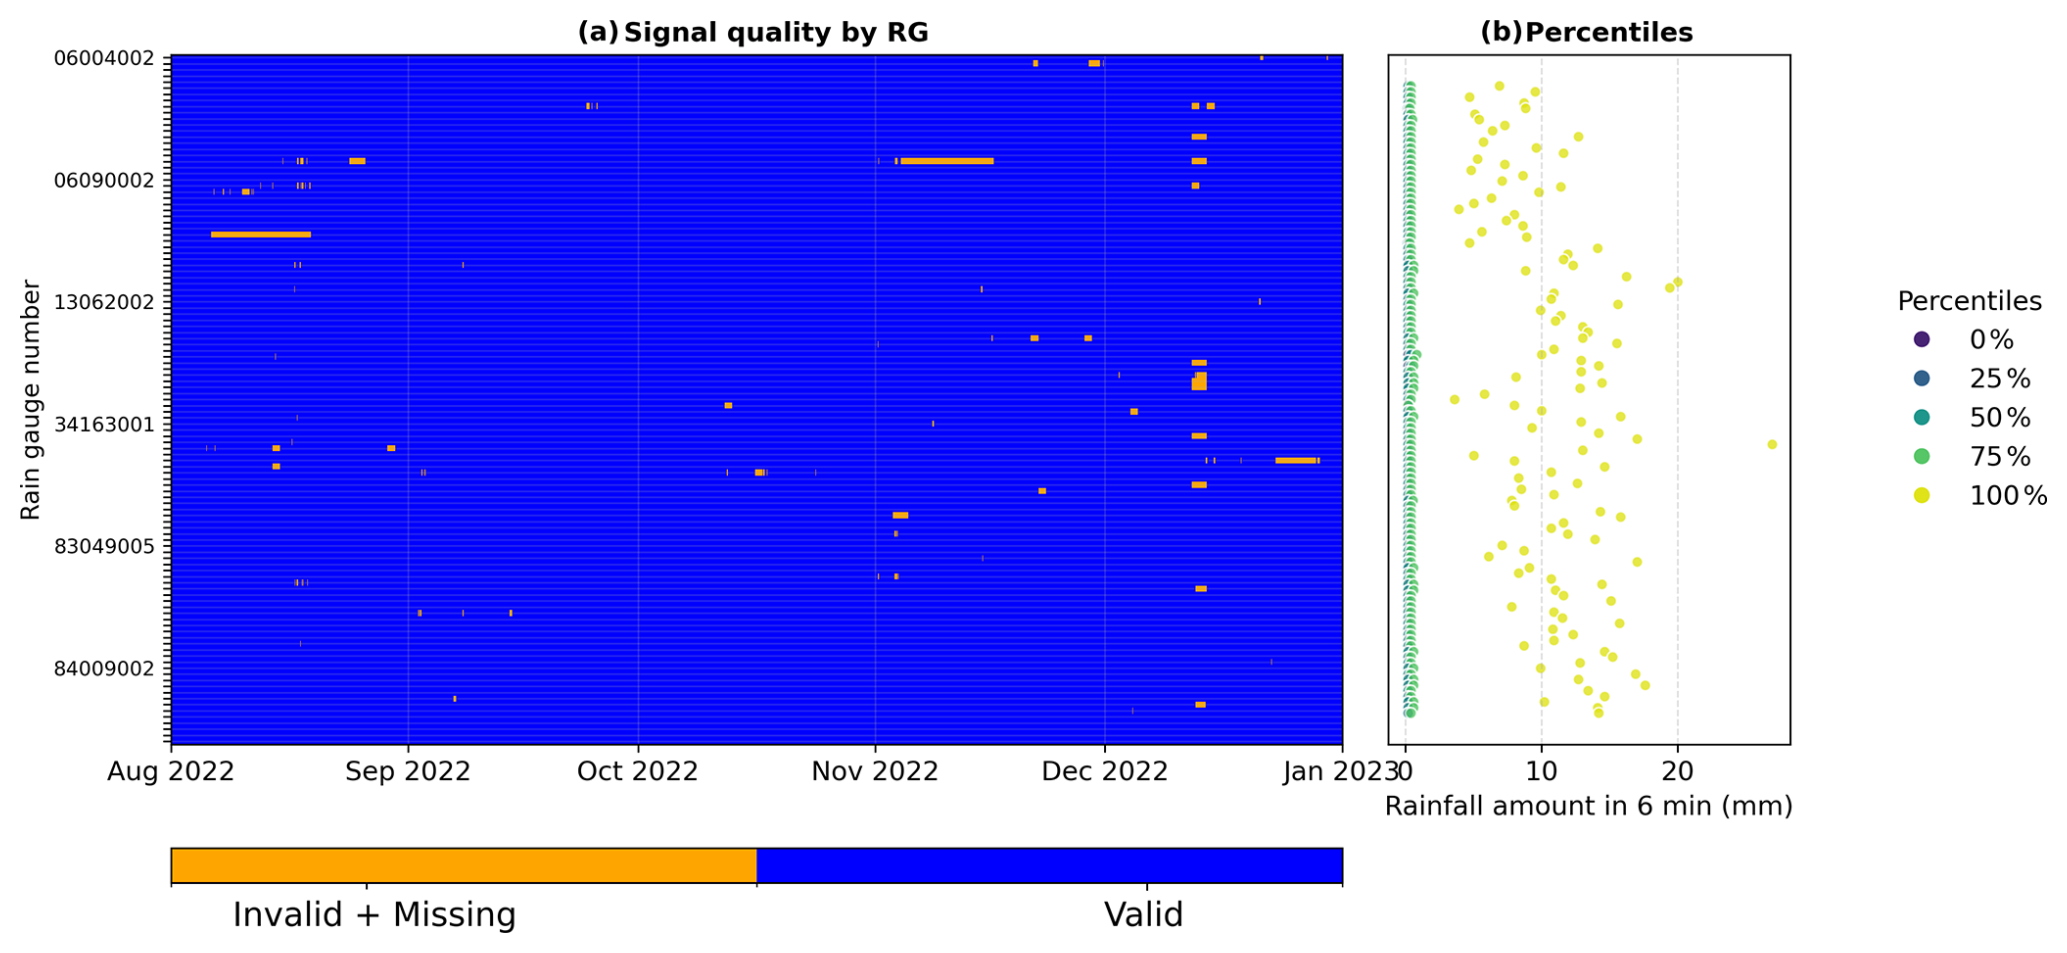
Figure 4Quality assessment of rainfall data collected by the 113 rain gauges during the five-month observation period. (a) Time series of the 6 min rainfall accumulation as a two-dimensional matrix, with colors representing invalid+missing data (orange) and valid data (blue). (b) Distribution of 6 min rainfall accumulation values for each rain gauge in terms of selected quantiles, computed from the set of non-zero measurements. Rain gauges are sorted by increasing sensor identifier from top to bottom.
2.3 Weather radar
We added to OpenSat4Weather the rain gauge-adjusted weather radar product PANTHERE from Météo-France as an additional reference for rainfall estimation. The product is gridded with a spatial resolution of 1 km and a temporal resolution of 5 min. The data are available in near real-time through the Météo-France public API portal (https://portail-api.meteofrance.fr/web/fr/api/DonneesPubliquesPaquetRadar, last access: 19 May 2026). The PANTHERE product is generated from the data collected by ARAMIS, the French operational weather radar network. The network comprises 20 C-band radars, five S-band radars, six X-band radars and two radars deployed at airports in Paris and Nice (Chochon et al., 2022). A description of the methodology to derive the PANTHERE product is provided in Tabary et al. (2011). The radar-derived precipitation fields used in this study contain no missing data during the period covered by the SML observations.
We did not directly include the PANTHERE product in the OpenSat4Weather dataset. Instead, we further processed the data to derive radar-based rainfall estimates along each SML path, as detailed in Sect. 3.2, and these estimates were incorporated in the dataset. It is important to note that, as with most weather radar products, PANTHERE provides maps of surface rainfall intensity derived from radar scans acquired at multiple elevation angles. These measurements sample atmospheric volumes located at altitudes ranging from several hundred meters to several km above ground. To mitigate this limitation, the PANTHERE product has been corrected using ground-based rain gauge observations. Although gauge-based adjustment reduces uncertainties associated with radar measurements aloft, radar products still are only the best available estimate of the true structure of rainfall, as they are affected by multiple error sources (e.g. refraction, beam blockage, attenuation, and Z–R relationship). For example, weather radar data often underestimate rainfall extremes (Schleiss et al., 2020). Therefore, comparing SML rainfall estimates and radar data, such as the ones provided here, should not be expected to yield perfect agreement.
2.4 ERA5
The knowledge of the 0 °C isotherm is essential for identifying the rain height, defined as the upper limit of the portion of the propagation path where precipitation occurs in liquid form. In this study, we use ERA5, a global atmospheric reanalysis dataset available through the Copernicus Climate Data Store (https://cds.climate.copernicus.eu/datasets, last access: 19 May 2026). ERA5 products are generated using the integrated forecast model, developed by the European Centre for Medium-Range Weather Forecasts (ECMWF), which combines model simulations with the assimilation of meteorological observations from multiple sources. The ERA5 single-layer products provide the 0 °C isotherm height at an hourly temporal resolution and a 0.25° spatial resolution (approximately 28 km). This variable represents the altitude a.s.l. at which air temperature reaches 0 °C. The 0 °C isotherm height is crucial for identifying the melting layer, namely, the vertical region of the atmosphere where solid particles melt into raindrops, as discussed in Sect. 3.1.
ERA5 exhibits systematic errors in freezing-level height over complex terrain, primarily due to its limited spatial resolution (Schauwecker et al., 2022). Comparisons with aircraft observations show that ERA5 atmospheric temperatures are generally accurate, with maximum biases of approximately 0.4 °C at upper atmospheric levels over the North Atlantic. Direct comparisons of ERA5-derived 0 °C isotherm heights against aircraft measurements in Chile reported mean absolute errors of approximately 133–245 m (Quijada-Meza et al., 2026; Wolf et al., 2025).
This section describes the processing applied to the raw data of the datasets described in previous Sect. 2 before their integration into the OpenSat4Weather dataset. In particular, the ERA5 temperature data were processed to derive the 0 °C isotherm height, which can be used to derive the contribution of liquid precipitation to SML attenuation, as described in Sect. 3.1. Additionally, radar data were spatially aggregated to provide rainfall estimates comparable to the ones that can be derived from SML observations (Sect. 3.2). Finally, the format and structure of the resulting dataset are briefly described in in Sect. 3.3.
3.1 Rain height
Even though a discussion of the methods for retrieving rainfall intensity from SML raw data is beyond the scope of this paper, nonetheless it is important to understand the role of rain height in SML data processing. The standard conversion formula between rainfall intensity R (in mm h−1) and rain attenuation γ per unit path length is given by ITU-R P.838-3 (2005)
where κ and α are coefficients dependent on SML signal frequency and polarization and on the link elevation angle. When the propagation path intersects a rainy layer with a vertical extent of hR km and an elevation angle θ, R can be estimated as follows:
where A is the RSL attenuation (dB) caused by the rainy layer as detected by the SML. Equation (2) assumes that rain is uniformly distributed along the propagation path up to hR and that no other significant sources of signal attenuation contribute to the observed attenuation. In practice, neither assumption is fully satisfied. Therefore, hR is generally interpreted as an effective rain height rather than the physical altitude up to which liquid particles are present.
The physical rain height can be estimated by weather radar measurements. Radars detect the presence and the height of the melting layer, which appears as a thin vertical region of enhanced reflectivity known as bright band, typically located just below the 0 °C isotherm. The bright band is produced by backscattering from snowflakes melting into raindrops (Thurai et al., 2003). Therefore, the top of the bright band corresponds to the 0 °C isotherm height, while its lower boundary is the physical rain height (Fabry and Zawadzki, 1995). The characteristics of the melting layer depend on the precipitation type. Stratiform precipitation is generally associated with large spatial scales, low rainfall intensities and a well-defined vertical structure composed of a frozen layer, a melting layer and a liquid precipitation layer. In contrast, convective precipitation is characterized by vertical winds (downdrafts and updrafts), which generate high-intensity localized phenomena, and it does not exhibit a clear separation between frozen and liquid phase. As a result, mixed type and mixed-phase precipitation coexist and the bright band disappears (Houze, 1997), which makes rain attenuation difficult to estimate. In addition to radar observations, rain height can be estimated from radiosonde measurements or from NWP model outputs and atmospheric reanalyses, which provide estimates at temporal scales compatible with rainfall variability.
The rain height can also be estimated through models. For instance, ITU-R P.839-4 (2013) provides a statistical formula to retrieve the mean annual rain height a.s.l. from the mean annual 0 °C isotherm height h0:
The output of Eq. (3) represents an effective rain height intended for the statistical prediction of rain attenuation along Earth–satellite propagation paths. It accounts not only for the attenuation produced by liquid precipitation but also for the melting layer contribution. Moreover, this model provides an average of both stratiform and convective precipitation regimes. Capsoni et al. (2009) proposed a more refined statistical approach deriving separate estimates of hR for stratiform and convective precipitation, while explicitly accounting for the contribution of the melting layer. Their method is based on a weighted average of the monthly mean 0 °C isotherm heights. Statistical methods primarily capture long-term features, such as the seasonal variability of the 0 °C isotherm and rain height, rather than the short-term variability associated with individual precipitation events. Therefore, they are not appropriate for retrieving rainfall intensity from raw SML observations available in real time.
If the actual values of the 0 °C isotherm and of the rain height are known, rainfall intensity can be estimated in real time using electromagnetic models. These models typically represent the atmosphere as a two-layer medium consisting of a melting layer overlying a liquid precipitation layer. A straightforward approach consists of introducing an additional attenuation term analogous to that in Eq. (1), which depends on both the rainfall intensity and the thickness of the melting layer, although with coefficients that differ from those of liquid precipitation (Matrosov, 2008; Giannetti et al., 2019). Alternatively, the length of the rainy path can be adjusted to incorporate the melting layer contribution (Xian et al., 2021). Modeling the melting layer during convective precipitation is considerably more challenging, as updrafts can trasport liquid hydrometeors above their typical equilibrium levels and viceversa for downdrafts with solid hydrometeors. As a result, the contribution of the melting layer contribution becomes more difficult to estimate accurately (Giannetti et al., 2017).
Time series of the 0 °C isotherm height for each SML are included in the OpenSat4Weather dataset. These data were derived from the ERA5 reanalysis and are presented in Fig. 5. For each SML, the ERA5 grid cell corresponding to the SML receiver location was selected to approximate the atmospheric profile along the propagation path. Nevertheless, the spatial resolution of ERA5 is insufficient to fully capture the fine-scale topographic and meteorological variability of the study area. Consequently, multiple SML receivers may fall within the same ERA5 grid cell and therefore share identical 0 °C isotherm time series despite differences in receiver elevation. As shown in Fig. 5, the 0 °C isotherm height exhibits significant temporal and spatial variability, primarily driven by seasonal changes and orographic effects. The 0 °C isotherm height progressively decreases from late summer to winter, with peak values exceeding 5000 m above ground in August and minimum values as low as 360 m above ground at winter. This variability is critical for rainfall retrieval from SMLs, as it directly influences the estimation of the effective rain height. The color scale in the figure indicates the elevation of the SML receiver locations. In general, lower receiver elevations are associated with higher isotherm heights a.s.l., reflecting the influence of the regional topography on the atmospheric thermal structure.
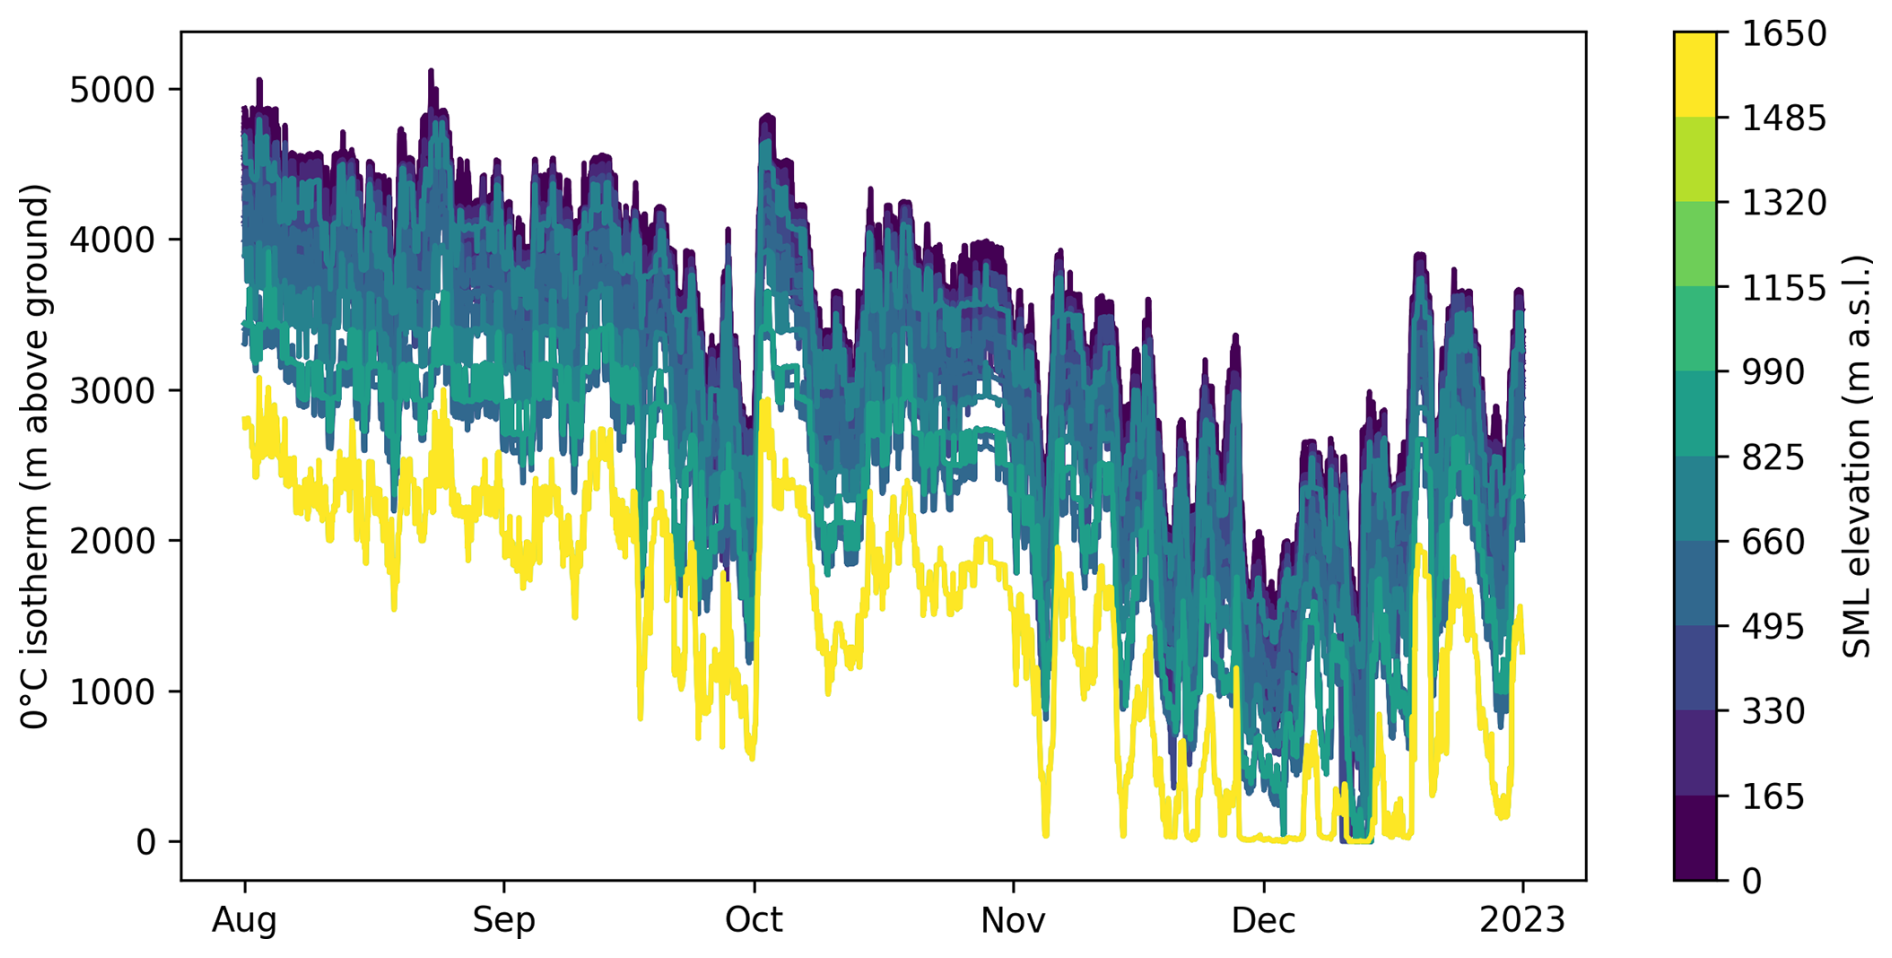
Figure 5Time series of the 0 °C isotherm height from August to December 2022, derived from ERA5 reanalysis data. Each line represents the temporal evolution of the isotherm height at the ERA5 grid point corresponding to the location of an SML receiver in the study area. The line color denotes the elevation of the SML receiver, highlighting the dependence of isotherm variability on receiver altitude as well as on seasonal atmospheric dynamics.
3.2 Radar-based rainfall along SML path
We derived the radar-based rainfall intensity estimate in correspondence of each SML propagation path according to the procedure described below. First, we determined the radar grid cells intersected by the SML path using the grid-intersection method implemented in the poligrain package (https://github.com/OpenSenseAction/poligrain, last access: 19 May 2026). As the SML rainfall estimate depends on the melting layer height, we precomputed the intersections between radar pixels and SML paths for melting layer heights between 0–6000 m above ground in 250 m steps. Each radar grid cell intersected by the SML path was assigned a weight proportional to the length of the path segment within that cell. At each time step, the current height of the melting layer was used to calculate the intersected pixels. Finally, the radar-based rainfall intensity estimate along each SML path was computed as the weighted average of rainfall intensity in the intersected radar cells, using the path-length weights.
The resulting radar-derived rainfall estimate is consistent with the SML measurement geometry, as it represents the path-averaged rainfall between the SML receiver and the point at which the propagation path intersects the melting layer. An example of the radar-based rainfall intensity along an SML path is shown in Sect. 4.
3.3 Data format
A major challenge associated with opportunistic data is the lack of standardized procedures for generating, formatting and storing the data. This issue has recently been addressed by Fencl et al. (2024), who proposed a set of data format conventions for several types of opportunistic data, including SMLs. These recommendations are the outcome of the activities of the COST Action OpenSense (Opportunistic Precipitation Sensing Network), which aims to improve access to opportunistic precipitation observations (https://opensenseaction.eu/, last access: 19 May 2026). Fencl et al. (2024) recommended the use of the NetCDF format for data storage, because of its flexibility and portability. They also defined a set of conventions for variable names and for data and metadata structure, distinguishing between required and optional elements, to ensure consistency and interoperability across datasets. The OpenSat4Weather dataset adopts these recommendations, including all the required SML variables and data specified by Fencl et al. (2024).
The dataset includes the following three NetCDF files:
-
SML_data_2022.nc: stores SML data;
-
radar_along_SML_data_2022.nc: stores radar data;
-
rg_data_2022.nc: stores rain gauge data.
In particular, the SML_data_2022.nc file hosts the following variables:
-
The main variable is rsl, stored in the file with the dimensions sml_id and time;
-
The variable deg0l represents the 0 °C isotherm height at the location of the HD Rain stations;
-
The metadata comprise the following variables:
-
SML ID;
-
time;
-
frequency;
-
coordinates and height a.s.l.;
-
azimuth and elevation angle;
-
name of the satellite targeted by the SML.
-
The radar-derived rainfall estimates along the SML path are stored using the same dimensions, format and naming convention as the SML data. The corresponding SML metadata are not included and radar-derived rainfall is stored in the variable rainfall_amount. The rain gauge dataset contains the variable rainfall_amount together with the corresponding time, coordinates and elevation a.s.l. All timestamps in the three datasets are UTC. For the rain gauge data, each timestamp corresponds to the end of the 6 min accumulation interval. Similarly, the time stamps of radar data are the end time of each 5 min radar volume scan. Since the available radar product is rainfall intensity, the time stamp should be interpreted as a nominal time rather than the exact acquisition time, because rain estimation is based on sweeps at different elevations that generated data before the time stamp.
Figure 6 presents an example time series of RSL collected by SML FRA-00332 (43.556° N, 6.967° E, 9 ) and corresponding meteorological data, during a severe rain event occurred on 15 December 2022. Figure 6a displays the RSL at a 1 min resolution, showing a prolonged rain event from approximately 07:00–23:00 UTC, with the highest rainfall intensity between 16:00–17:00. In correspondence of the rainfall intensity peak, the RSL drops by about 10 dB. Figure 6b illustrates hourly aggregated rainfall intensity profiles from the nearby rain gauge and from the radar data. These profiles generally correlate well with each other and with the RSL. It should be noted that the radar data are obtained by spatially aggregating the PANTHERE radar product along the ground projection of the effective SML propagation path. While all three sensors capture the precipitation peak, the radar exhibits a lower peak intensity than the rain gauge. Moreover, the minimum of the RSL profile occurs slightly later than the rainfall peak as observed by the radar. Figure 6c shows the 0 °C isotherm time series from ERA5 data, which drops by approximately 200 m during the event, influencing the rainy path length.
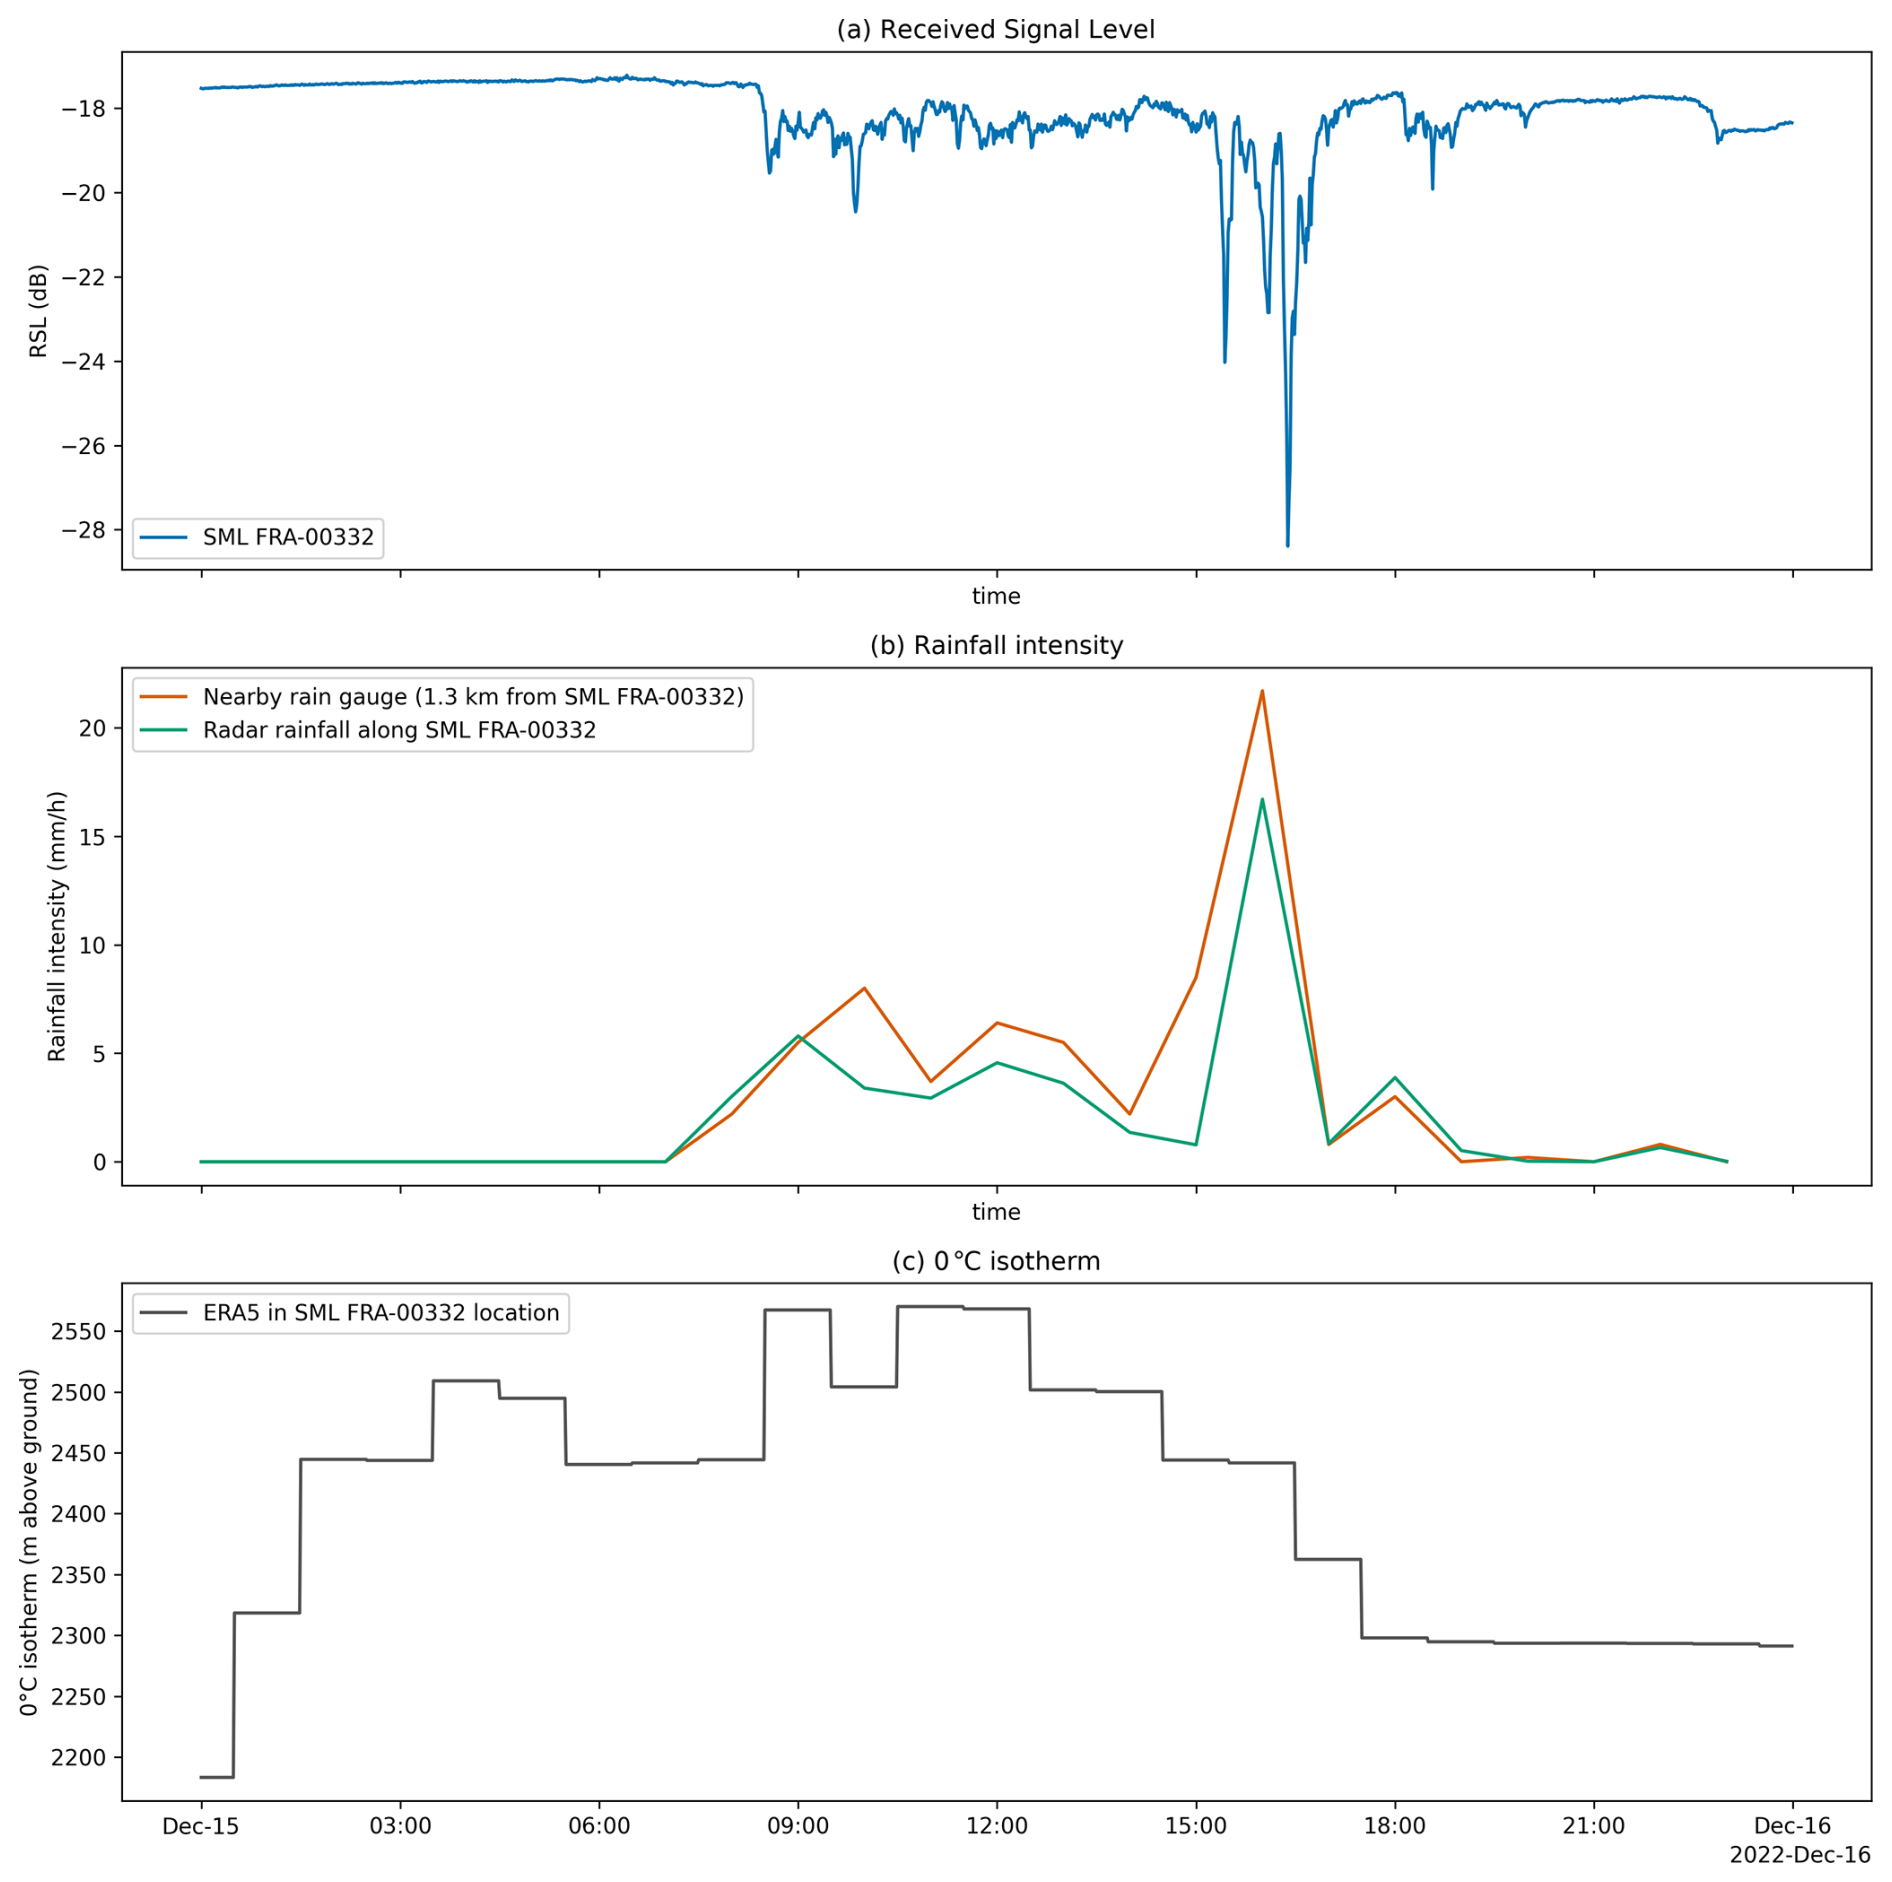
Figure 6Severe rain event occurred on 15 December 2022. (a) 1 min time series of RSL measured by SML FRA-00332 (43.556° N, 6.967° E, 9 ). (b) Corresponding rainfall intensity from rain gauge and radar (hourly average). (c) 0 °C isotherm height from ERA5 reanalyses.
Figure 7 shows the rainfall statistics over the five month observation period, computed from the data collected by the 113 Météo-France rain gauges within the study area. The rain gauges are ordered from left to right according to increasing elevation a.s.l. The original 6 min rainfall accumulations were aggregated to hourly intervals, following Andersson et al. (2022). Four statistics are reported for each station: (a) wet fraction, (b) total rainfall accumulation over the observation period, (c) maximum hourly accumulation, and (d) standard deviation of the hourly accumulation (computed over wet hours). An hourly interval is flagged as wet if the accumulation exceeds 0.1 mm. For 90 % of rain gauges, the wet fraction is comprised between 3.8 % and 7.5 % of time, while the total accumulation ranges from approximately 204–526 mm (5th–95th percentile). Overall, data indicate a weak positive relationship between station elevation and both the percentage of wet hours and the cumulative rainfall.
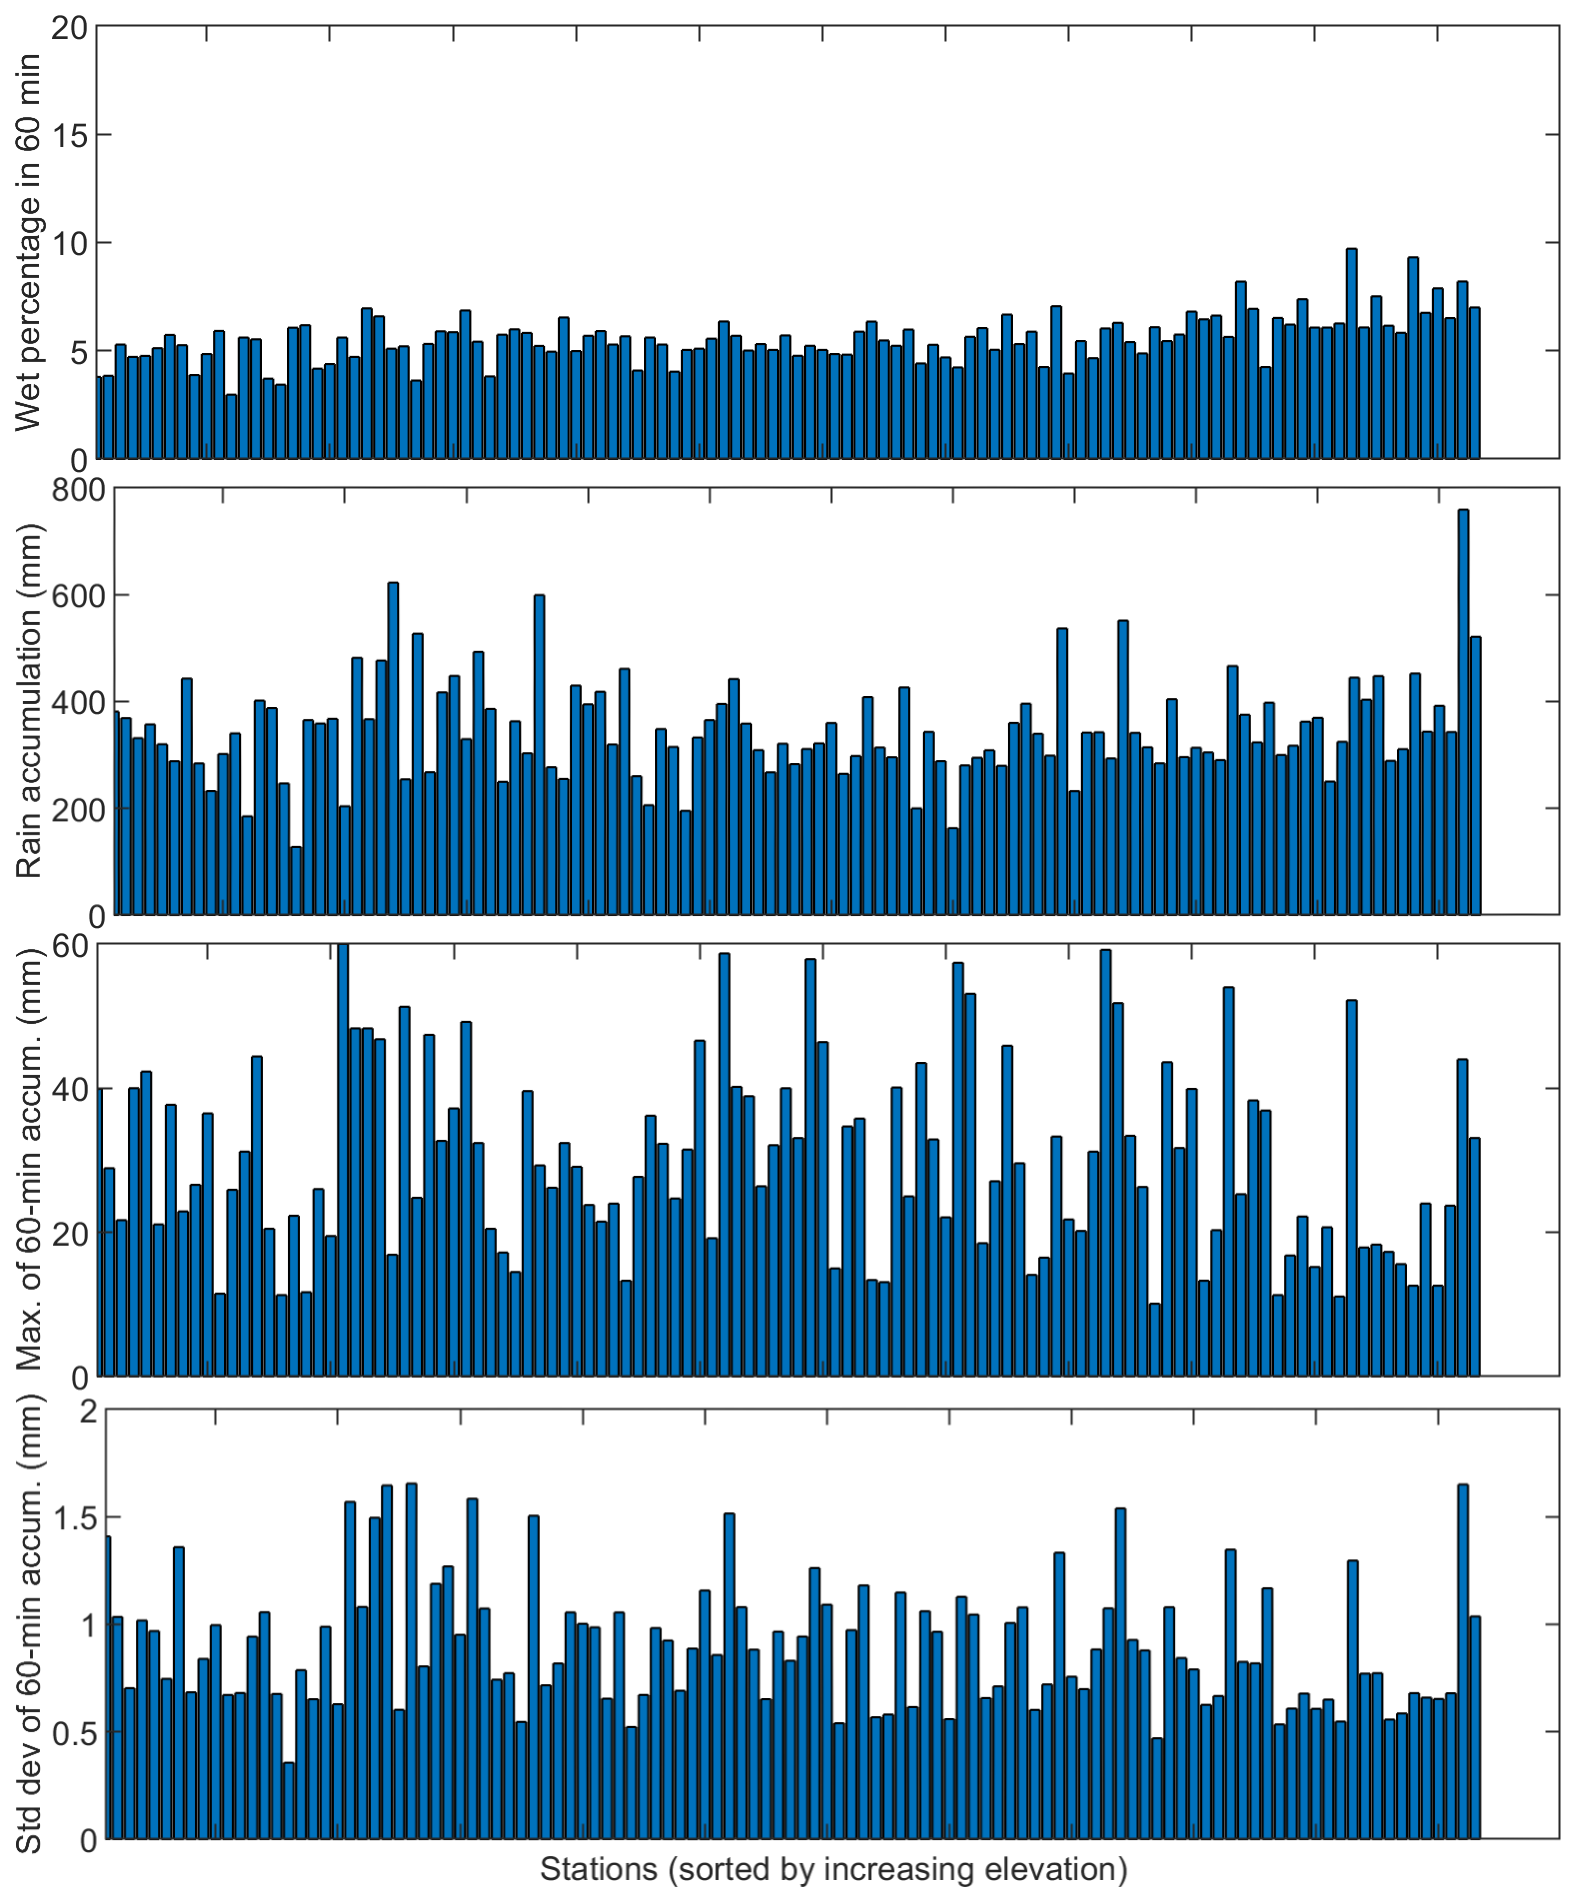
Figure 7Rainfall statistics collected by the 113 rain gauges within the study area during the five-month observation period.
4.1 Descriptive Analysis of SML data
Figure 8 presents descriptive statistics of the RSL measurements for the individual SML stations. In each boxplot, the box extends from the 25th to the 75th percentile (interquartile range), while the vertical lines indicate the 5th and 95th percentiles. The stations are ordered from left to right according to increasing elevation a.s.l. Figure 8a reports the boxplots of the RSL (dBm) over the observation period with the median values highlighted in orange. No clear relationship is observed between RSL and SML elevation. Instead, the median RSL exhibits substantial variability across the network, ranging from −24 to −10 dBm. Although unusually low RSL values may, in some cases, indicate malfunctioning, the dominant factor affecting the median RSL is the length of the coaxial cable connecting the satellite dish to the Rainbox unit. Longer cables introduce greater losses, resulting in lower median RSL values. Consequently, SML data analysis should focus primarily on relative changes in the received signal (e.g. due to rain) rather than on the absolute values, which are strongly influenced by installation-specific characteristics.
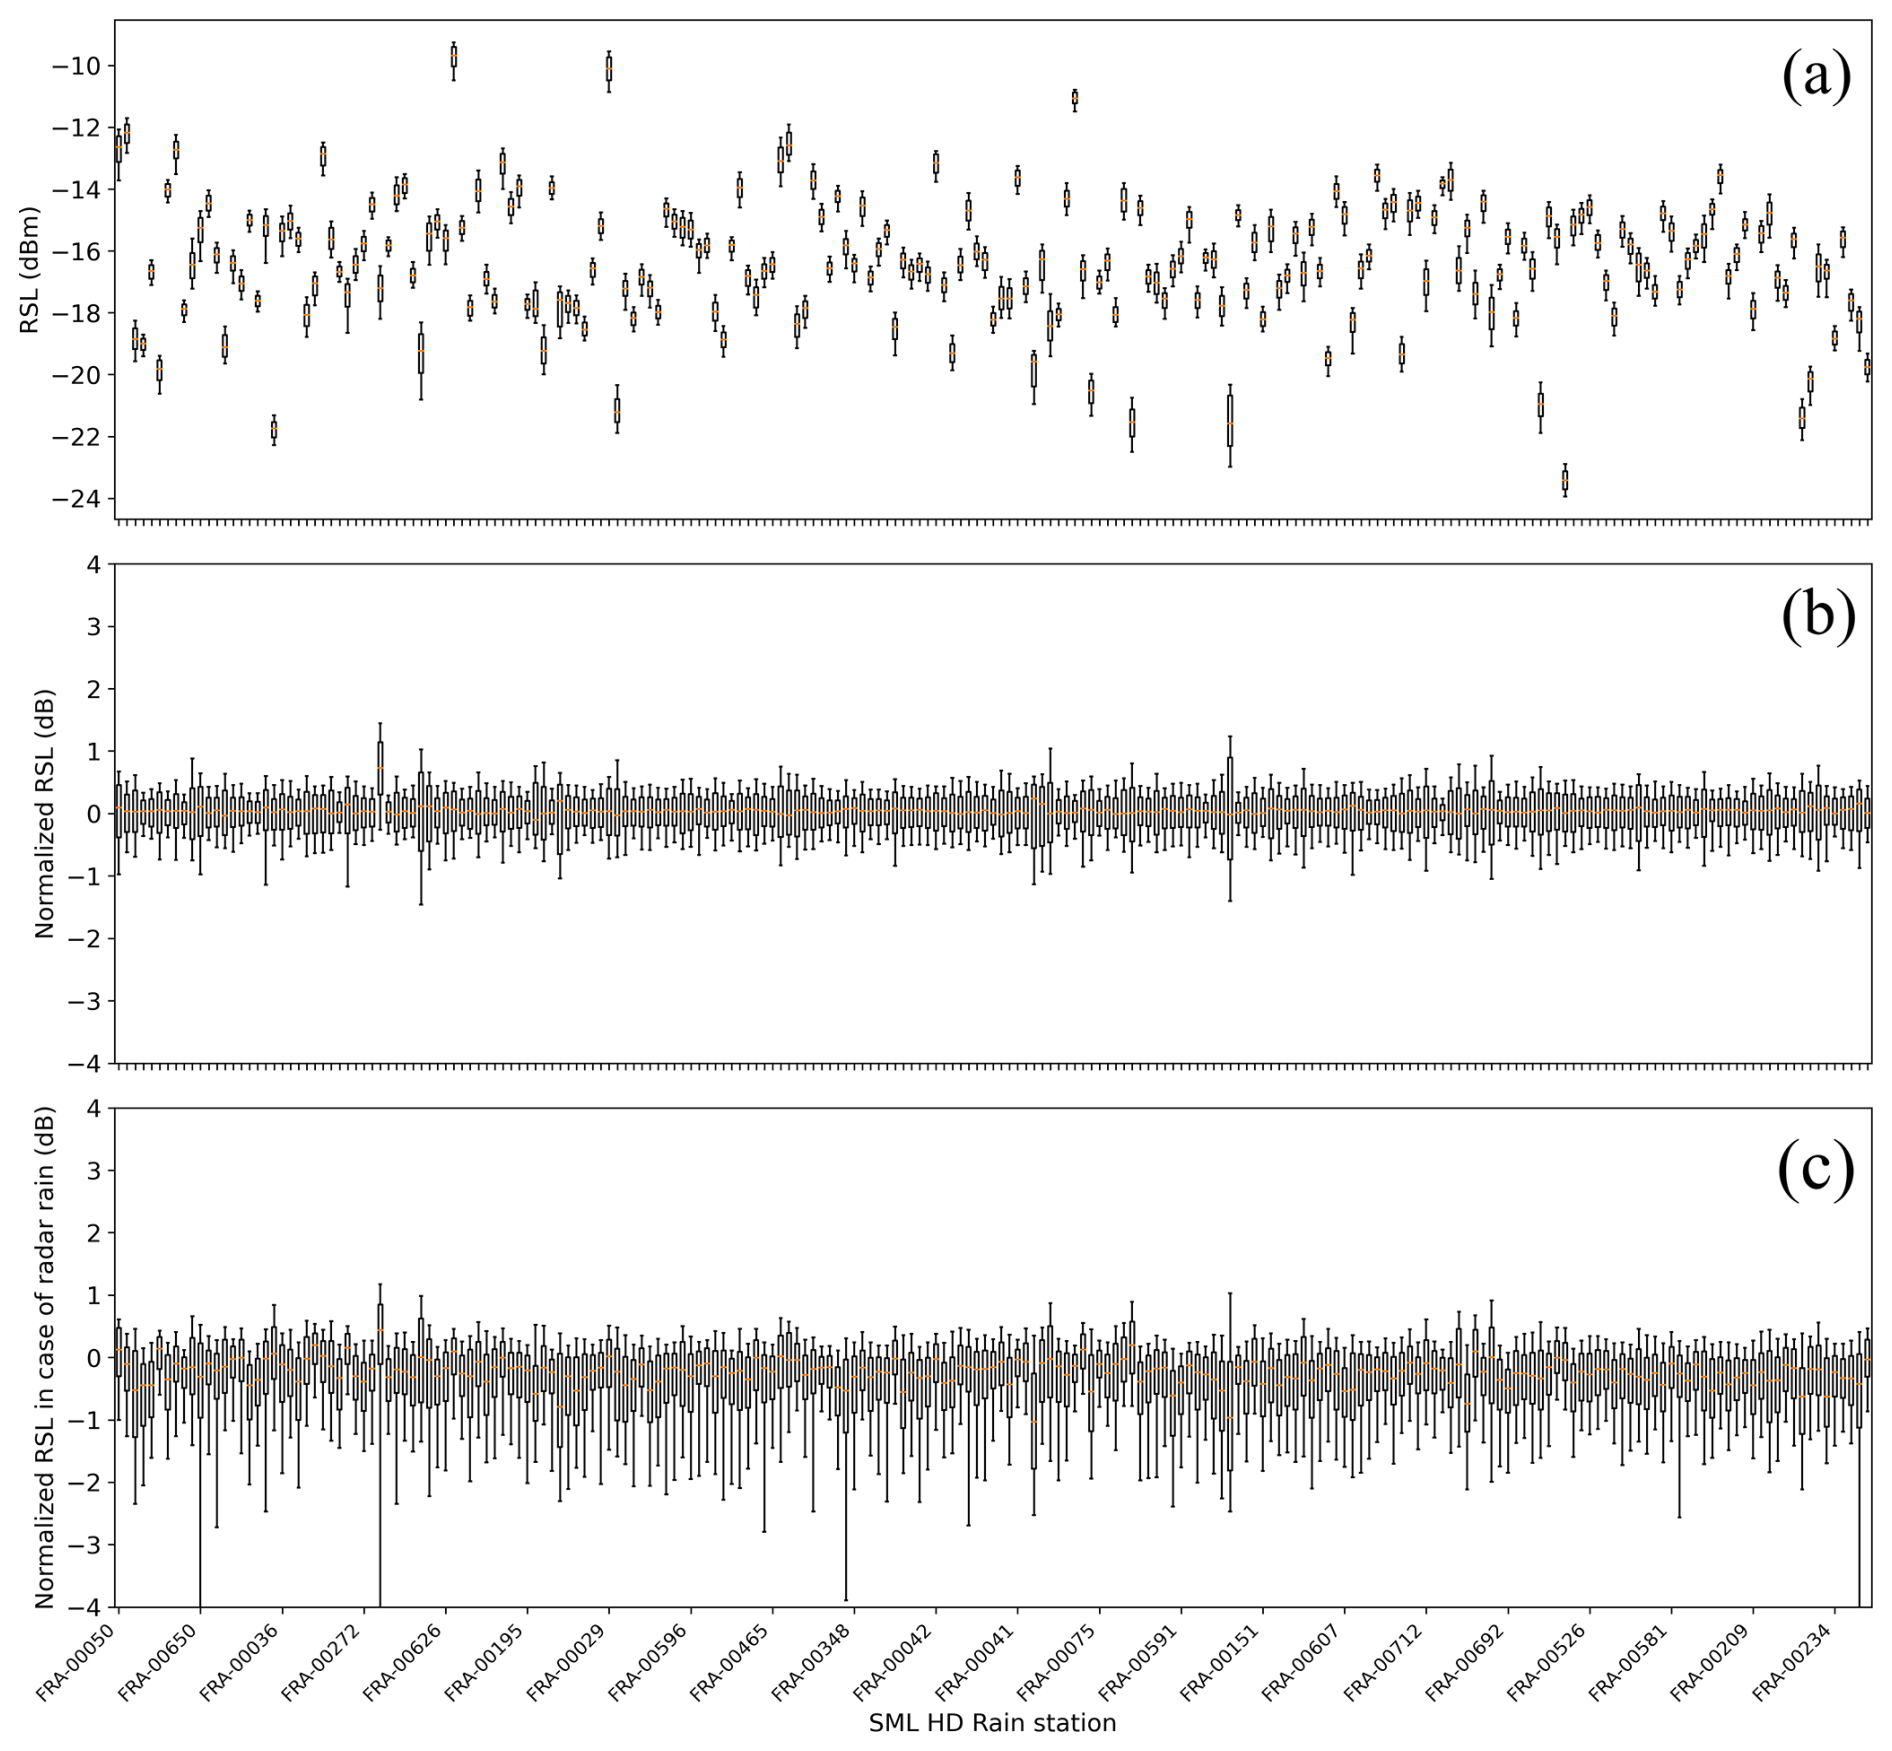
Figure 8Descriptive statistics of SML data over the five-month observation period aggregating RSL data in 5 min temporal intervals. Each box along the x-axis represents an individual SML. The box spans the interquartile range (25th–75th percentiles), and the vertical whiskers denote the 5th and 95th percentiles. The orange horizontal line indicates the median. (a) RSL (dBm). (b) RSL normalized to its mean value for each link (dB). (c) Same as (b), but considering only time steps during which the radar detected rainfall accumulation greater than 0.
Figure 8b shows the normalized RSL, defined as the difference between the 1 min time series and the corresponding mean RSL value over the observation period. For the vast majority of SMLs, the boxplots are centrered around 0 dB and exhibit a dynamic range within 1.5 dB (difference between the 5th and 95th percentiles). This indicates that rainfall, and, particularly moderate-to-heavy precipitation, is only marginally represented within the selected percentile range, as rain attenuation typically exceeds 1 dB during intense precipitation events. Indeed, the radar-derived rainfall estimates along the SML propagation paths indicate that rainfall occurs during only 3.2 %–7.4 % of the 5 min radar time intervals. Consequently, most rainy periods lie near or beyond the tails of the boxplot distribution. Furthermore, a large portion of these rainy periods corresponds to light rainfall, which generally produces attenuation values within 1 dB. For example, only 26 % of the 5 min rainy intervals in the radar dataset are associated with rain intensities above 2 mm h−1. A small number of stations exhibit anomalous boxplots characterized by median values shifted away from 0 dB (indicating a few extreme values that affect the mean value but not the quantiles) or by a large variability, which is an indicator of unstable or malfunctioning links.
The boxplots in Fig. 8c show the normalized RSL, conditioned on the occurrence of rainfall, as identified by the radar-derived rainfall intensity along each SML path. In contrast to Fig. 8b, the effect of rain is clearly visible. Although the median RSL is only slightly reduced (generally between −1 and 0 dB), the lower quantiles (corresponding to 25th and 5th percentiles) drop significantly for nearly all stations. The spread of the distributions also increases, consistent with the spatial variability of rainfall observed by the radar, whose total accumulation ranges from approximately 230–727 mm. Again, no clear altitude effect is observed.
Figure 9 presents time series of indicators aggregated across all SML stations and derived from SML and radar data. The top panel shows the mean of the normalized RSL across all SML stations (green), together with the 95th percentile (blue), and the 5th percentile (orange). For comparison, the mean radar-derived rainfall along SML paths is also shown (black). The distance between the blue and the orange curve measures the difference between the strongest and weakest RSL across all SMLs at each time stamp. The two lower panels in the figure provide views of two selected 10 d periods.
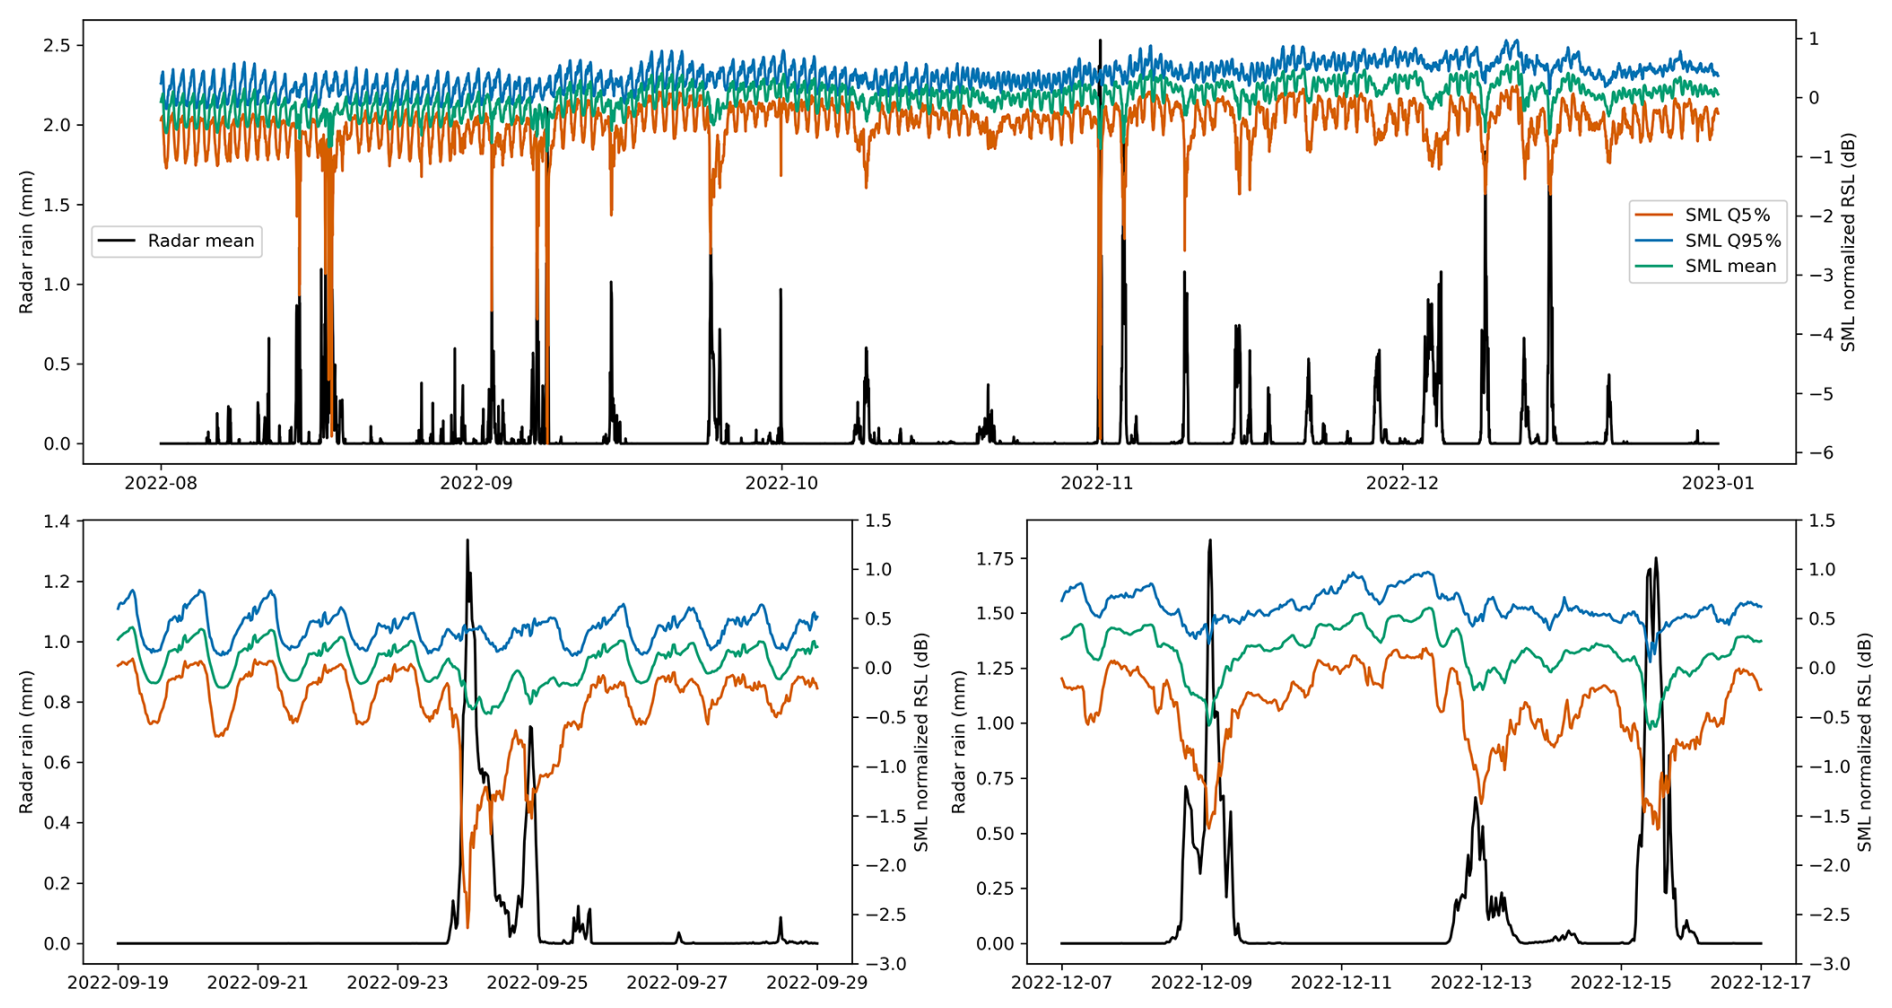
Figure 9Time series of RSL and rainfall aggregated over all the SML stations. Top: total observation period. Bottom: zoom-in on two 10 d periods. The green curve is the normalized RSL averaged over all SML stations at each time stamp, the blue curve is the 95th percentile time series and the orange curve is the 5th percentile time series. Finally, the black curve is the average radar-derived rainfall accumulation along the SML paths.
During dry weather, the normalized RSL exhibits a pronounced diurnal cycle, which will be discussed later. This pattern is particularly evident during the summer months. Rainfall events are also clearly visible, especially in the 5th percentile time series. In the September zoom-in, the 5th percentile drops sharply to approximately −3 dB, while the 95th percentile remains essentially unchanged and the mean slightly decreases. This behavior is consistent with heavy but spatially localized precipitation affecting a subset of SMLs across the French Mediterranean arc. In contrast, during the December period, the 5th percentile is less affected (1.5 dB). However, a slight decrease is observed also in the 95th percentile, indicating the presence of widespread but less intense precipitation.
4.2 SML – rain gauge association
The spatial distribution of rain gauges relative to SML sensors is a key factor for effectively leveraging opportunistic data, as the distance to the nearest rain gauge directly influences the reliability of validation analyses. Figure 10 shows boxplots of the distribution of the distances between each of the 215 HD Rain SML stations and its three nearest rain gauges. The mean distance to the closest rain gauge is 5.87 km, with an interquartile range of 5.16 km (25th percentile: 3.13 km, 75th percentile: 8.29 km). Distances range from a minimum of 0.06 km to a maximum of 19 km. The mean distances to the second and third nearest rain gauges are 10.43 and 13.93 km, respectively, with interquartile ranges of 5.10 and 6.76 km, respectively. Overall, 43 % of SMLs have a rain gauge within 5 km, and 87 % are within 10 km, indicating a relatively homogeneous distribution of both rain gauges and HD Rain stations across the study area.
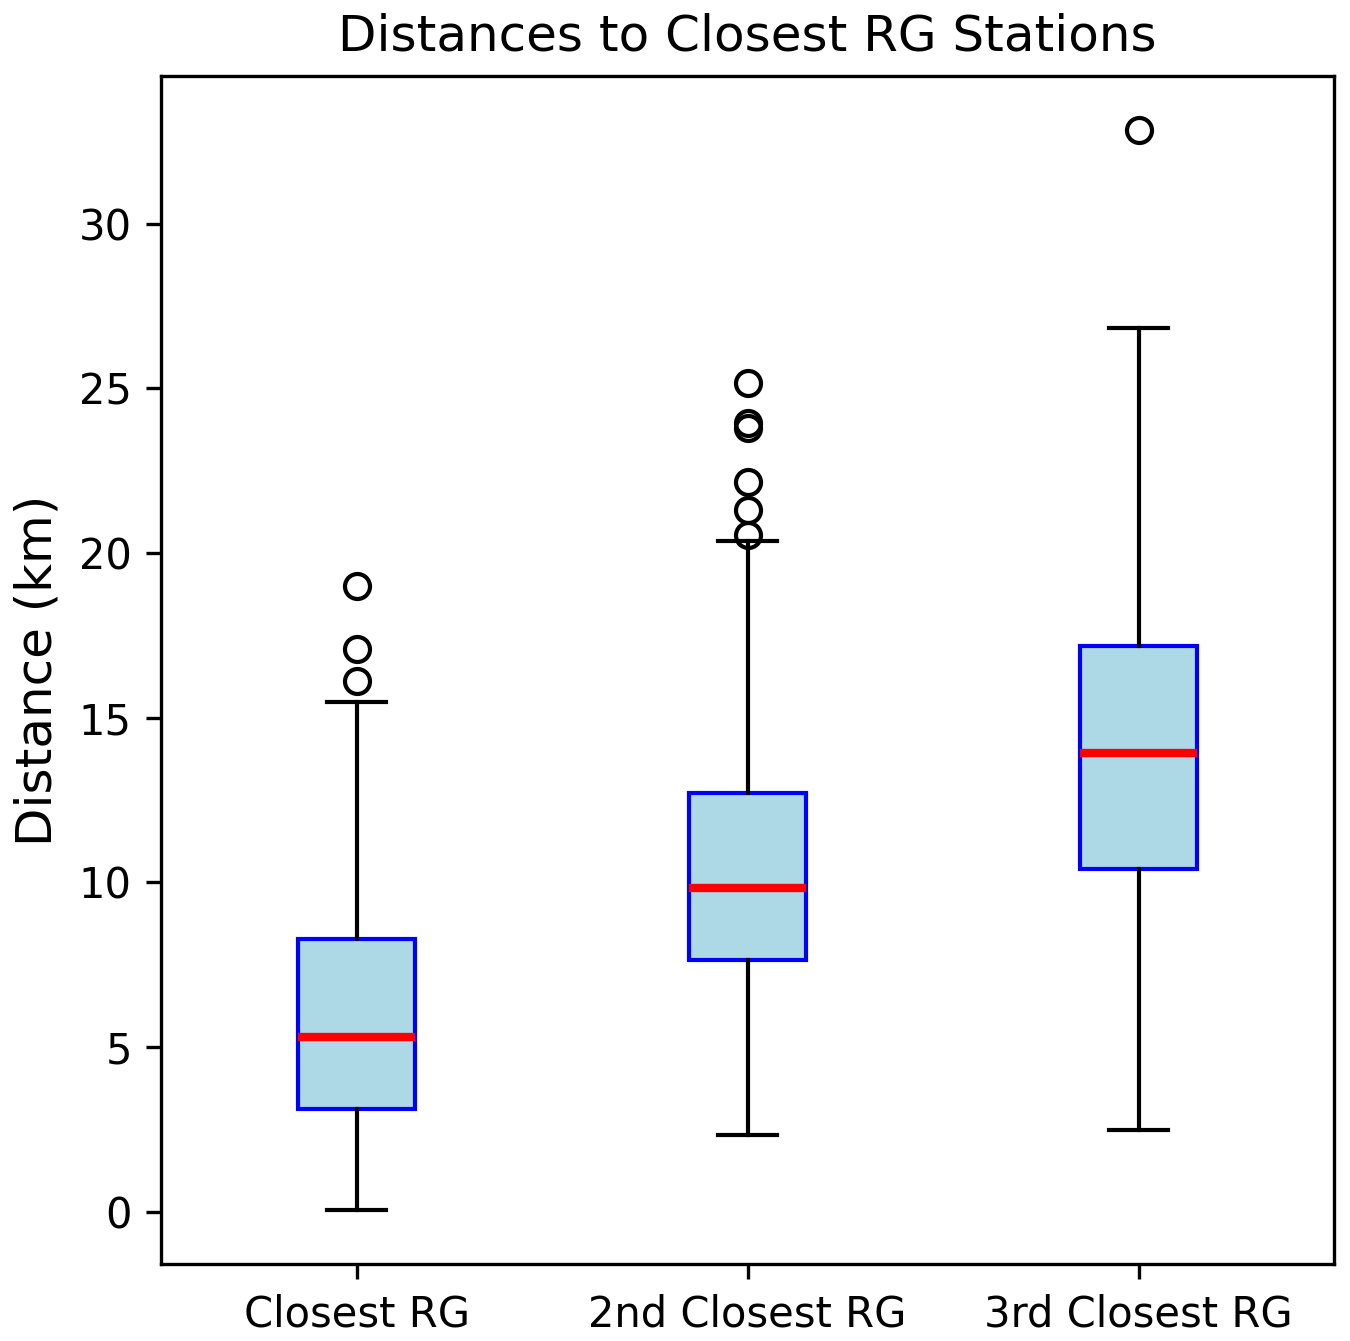
Figure 10Boxplots representing the distribution of the distance between HD Rain SML stations and the three nearest rain gauges.
4.3 Effect of the 0 °C isotherm height
Figure 11 illustrates the evolution of the 0 °C isotherm height from August to December 2022 (bottom panel), together with the RSL of a representative SML (top panel), and nearby rain gauge and radar-based rainfall intensity along the SML path (middle panel). The ERA5-derived 0 °C isotherm height exhibits a large temporal variability, ranging from almost 5000 in August to less than 1000 in December. It usually lies above 2000 from August to mid-October. Consequently, the average SML propagation path of the SML signal below the melting layer is about 6 km. From November onward, the path length decreases to generally less than 3 km.
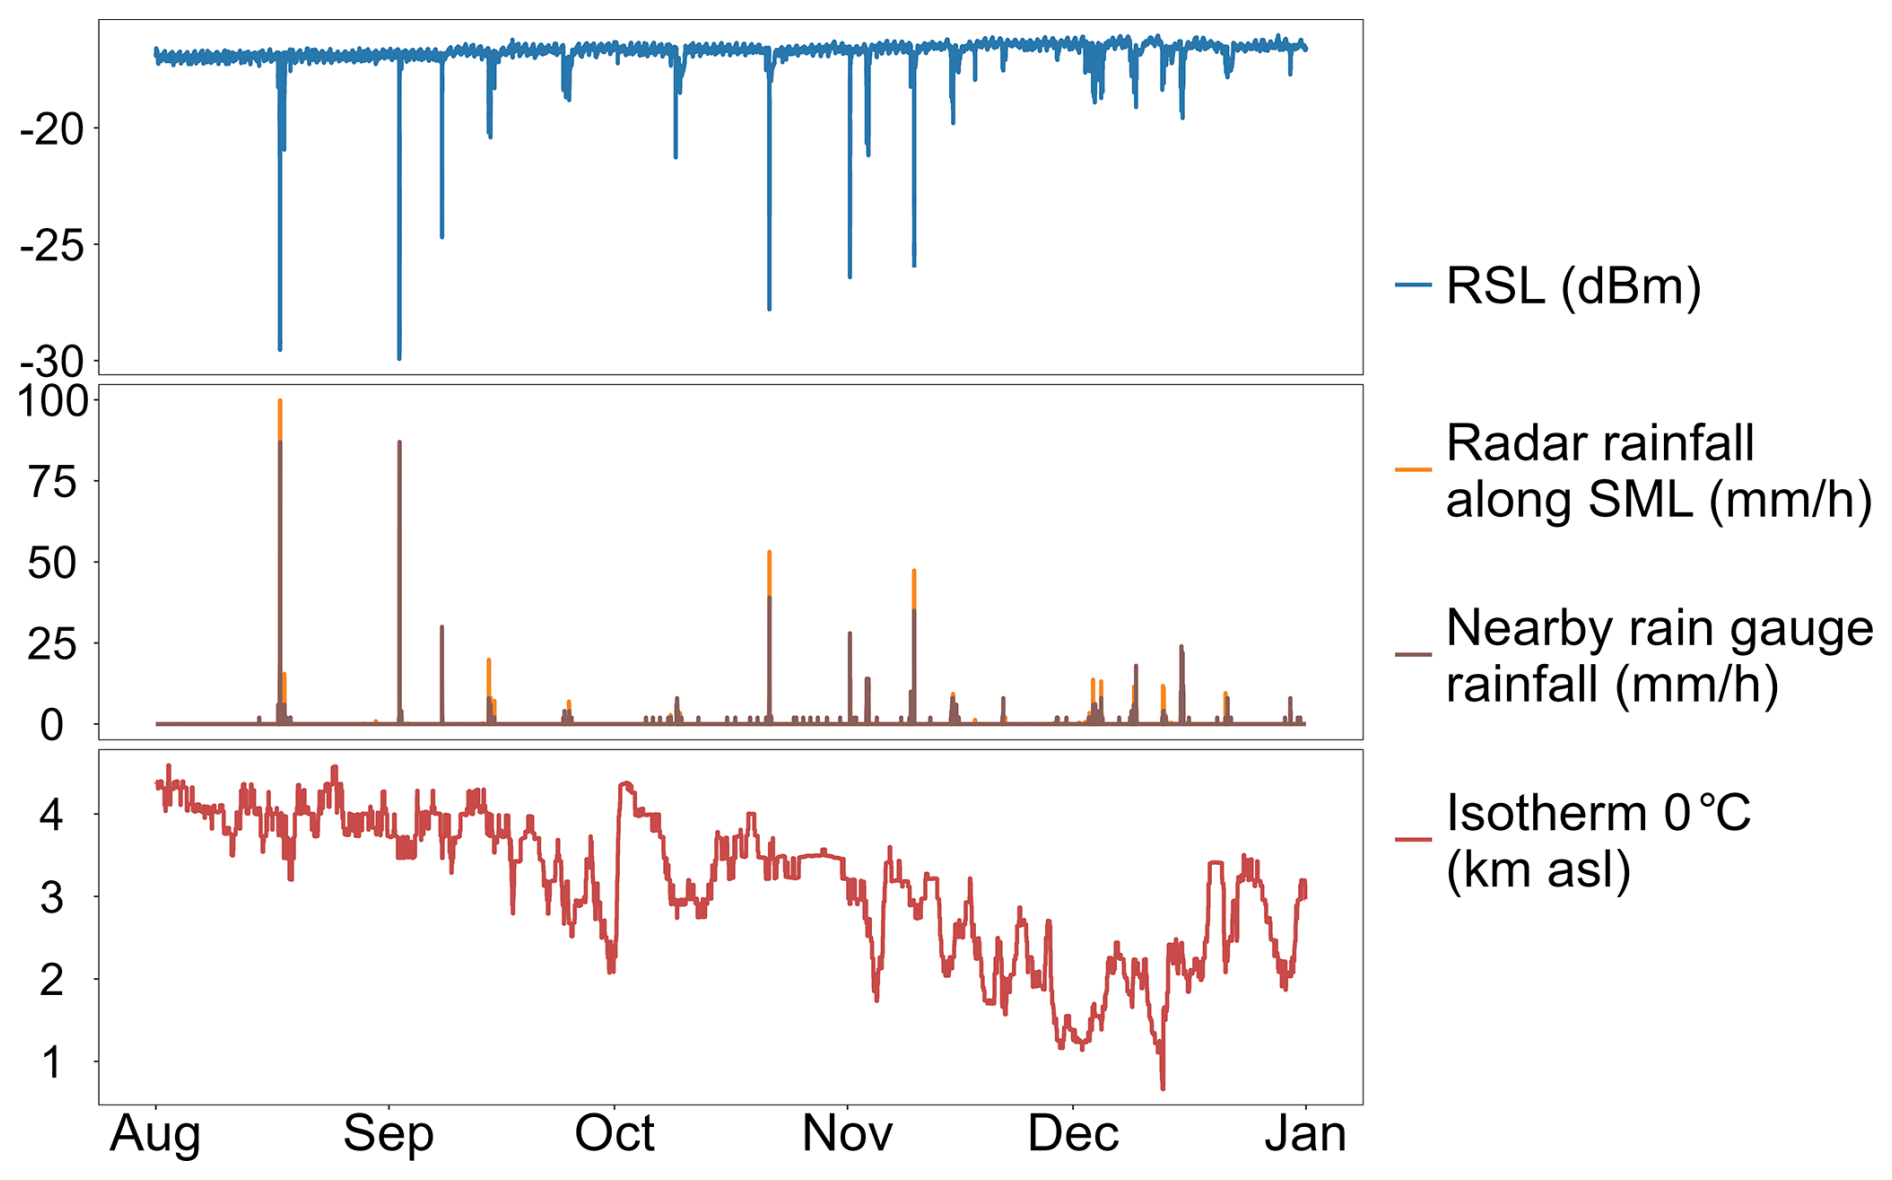
Figure 11RSL collected from the SML station FRA-00410 (top), rainfall intensity from radar data and from the nearby rain gauge (middle), and 0 °C isotherm height a.s.l. from ERA5 reanalyses (bottom).
Large signal attenuation values (up to about 12 dB) are observed during the summer in correspondence of heavy precipitation events (rainfall intensities exceeding 75 mm h−1), while the 0 °C isotherm height remains around 4 A similar situation occurs between late October and early November (rainfall intensity peaks higher than 40 mm h−1, attenuation around 10 dB, and 0 °C isotherm height around 3500 m). As the atmosphere cools later in the observation period, rainfall events become less intense and the 0 °C isotherm height decreases to 1500–2000 m. The observed signal attenuation is substantially reduced, reaching only about 2 dB. These results highlight a clear seasonal pattern, typical of temperate regions. During the warmer months, rainfall events tend to be more intense and the 0 °C isotherm is located at higher altitudes, resulting in stronger signal attenuation, due to both the higher specific attenuation and the longer propagation path through the liquid precipitation layer. Conversely, winter precipitation is generally weaker and predominantly stratiform, which, combined with the lower 0 °C isotherm height, produces substantially lower attenuation.
This seasonal variability has important implications for rainfall retrieval from SML data. During summer, strong attenuation may cause the RSL to decrease to the minimum detectable level of the LNB or result in complete signal loss, thereby limiting the ability to quantify heavy rainfall. Conversely, in winter, the weak attenuation and low variability in the signal can make rainfall detection and estimation more challenging, as identifying the baseline signal level becomes more difficult. However, these seasonal patterns have exceptions. In Mediterranean regions, for example, intense convective events may also occur during the colder months, while stratiform precipitation can occasionally be observed in summer.
Finally, it is important to note that the 0 °C isotherm height exhibits substantial variability, not only on seasonal time scales but also over much shorter periods: fluctuations of 1–2 km can occur over a few days. For instance, Fig. 11 shows that the 0 °C isotherm raises occasionally above 3000 m in late December, while dropping below 2500 m in early October.
As seen previously in Fig. 6, the RSL variation is strongly correlated with rainfall intensity. However, additional effects may have a non-negligible impact on the received signal. Furthermore, hardware limitations and malfunctioning of the ground terminal can produce noticeable RSL patterns. These effects should be accounted for and, whenever possible, canceled, or, at least, identified, to prevent misclassification of such RSL variations as rain events.
For example, temperature significantly affects the RSL. Figure 12 shows distinct signal variations that are inversely correlated with the temperature increase observed on 16 and 17 November, and, to a lesser extent, on 13 and 18 November. These variations are primarily associated with sunny days, which are characterized by significant diurnal temperature fluctuations. A possible explanation is a temperature-dependent variation in the LNB gain. In contrast, the sharp and relatively short signal drops on 14 November, late on 15 November, and during the night between 17–18 November are rain events.
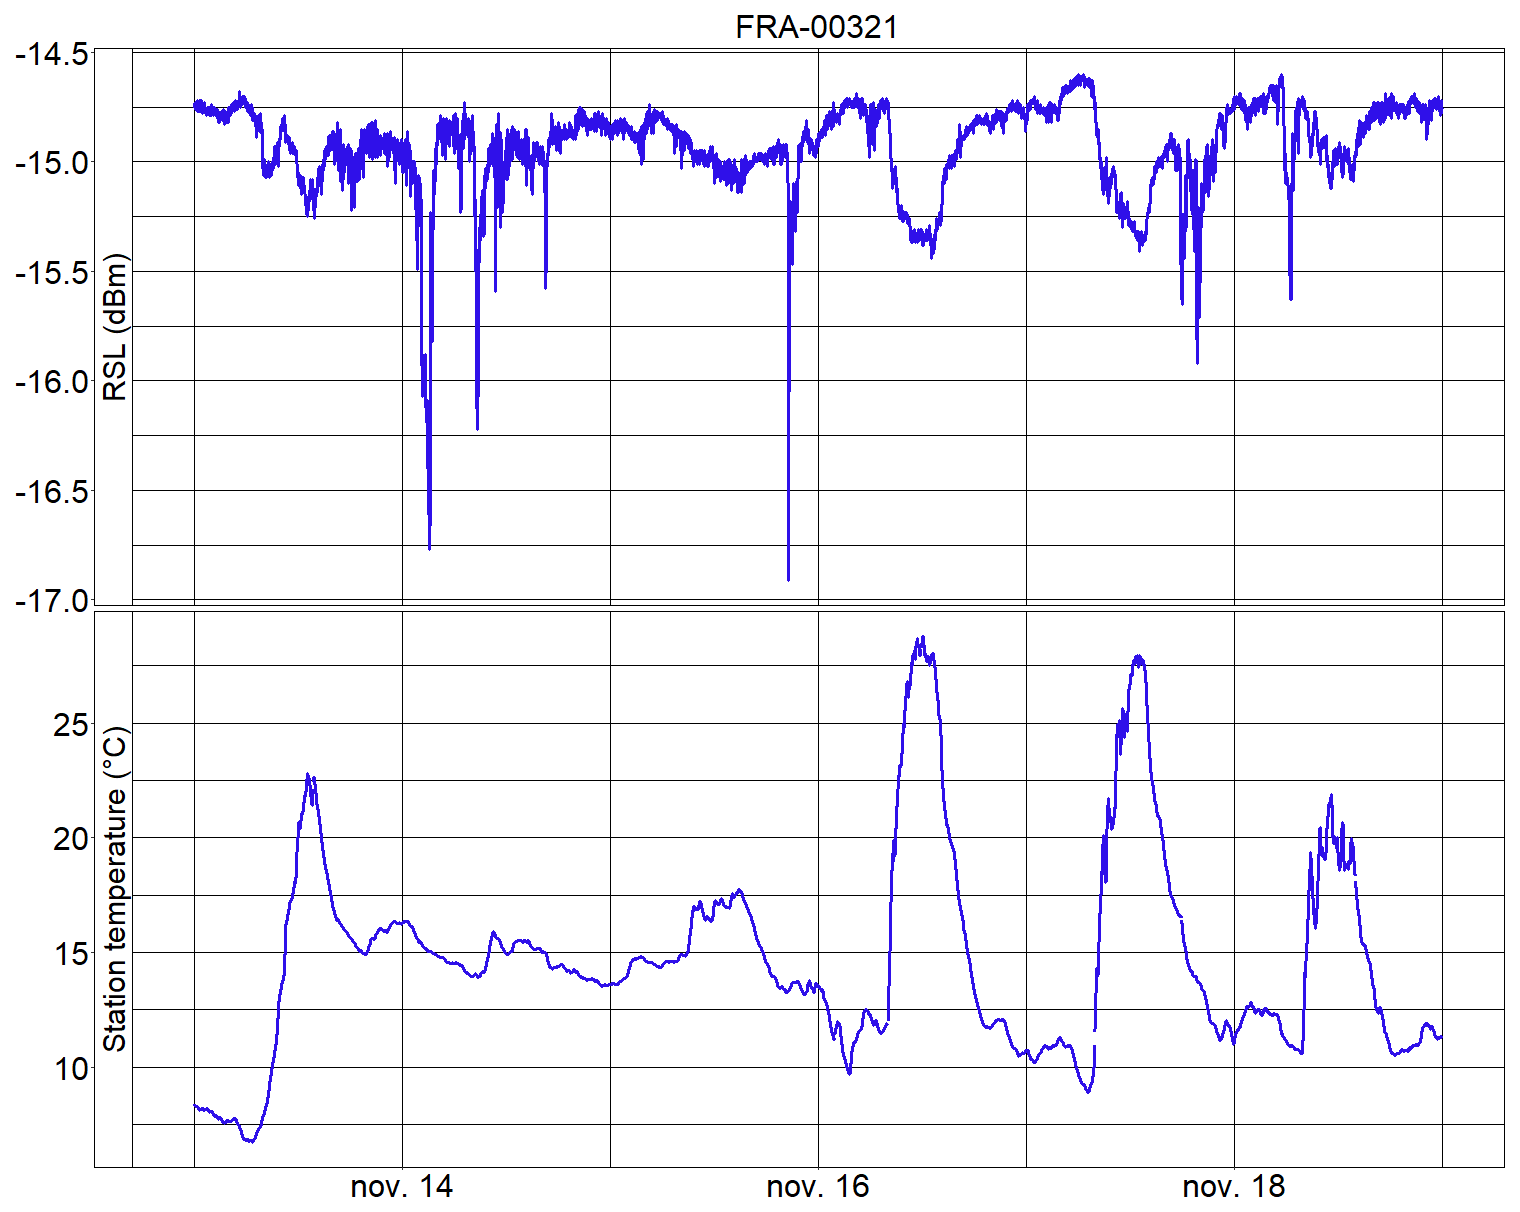
Figure 12Example of RSL pattern and corresponding air temperature measurements. SML station: FRA-00321.
Interactions between raindrops and system characteristics may also influence the quality of the received signal, thereby complicating its interpretation and the conversion into rainfall estimates, as illustrated in the first two examples of Fig. 13. Figure 13a shows the time series relative to a rainy day. The RSL is strongly correlated with the the rainfall intensity profile measured by the radar (and estimated along the SML path). Although precipitation ceases around noon, the RSL increases only gradually to get back to its level before the rain event several hours later. This signal behavior is likely attributable to the progressive drying of the antenna after the event. This phenomenon, known as wet antenna attenuation, has been reported for CMLs by several authors (see e.g. Leijnse et al., 2007b). Figure 13b highlights a short segment of a different RSL time-series. The nearly flat plateau visible between 12:25–12:35 corresponds to the received signal falling below the minimum detectable level of the LNB, during an intense rain episode. For this station, the maximum measurable attenuation is 14 dB. Beyond this threshold, the received signal becomes indistinguishable from noise. It is important to note that this maximum measurable attenuation is not equal to the one in clear-sky conditions, but it is in fact lower, due to the significant increase in noise level during rain. This effect is produced by raindrops, which behave as radiating bodies. A small, yet not negligible, fraction of the emitted energy is radiated in the microwave spectrum and captured by the SML antenna, thereby introducing an additional noise contribution. Typically, for a clear-sky signal-to-noise ratio of about 18 dB, the maximum measurable rain attenuation is around 14 dB, corresponding to an increase in the background noise of about 4 dB (Gelbart et al., 2025). The maximum signal-to-noise ratio in clear-sky depends on the targeted satellite (i.e. the transmitted power level), on the size of the receiving dish (assuming optimal alignment), and, to a lesser extent, on the quality of the dish and on the LNB.
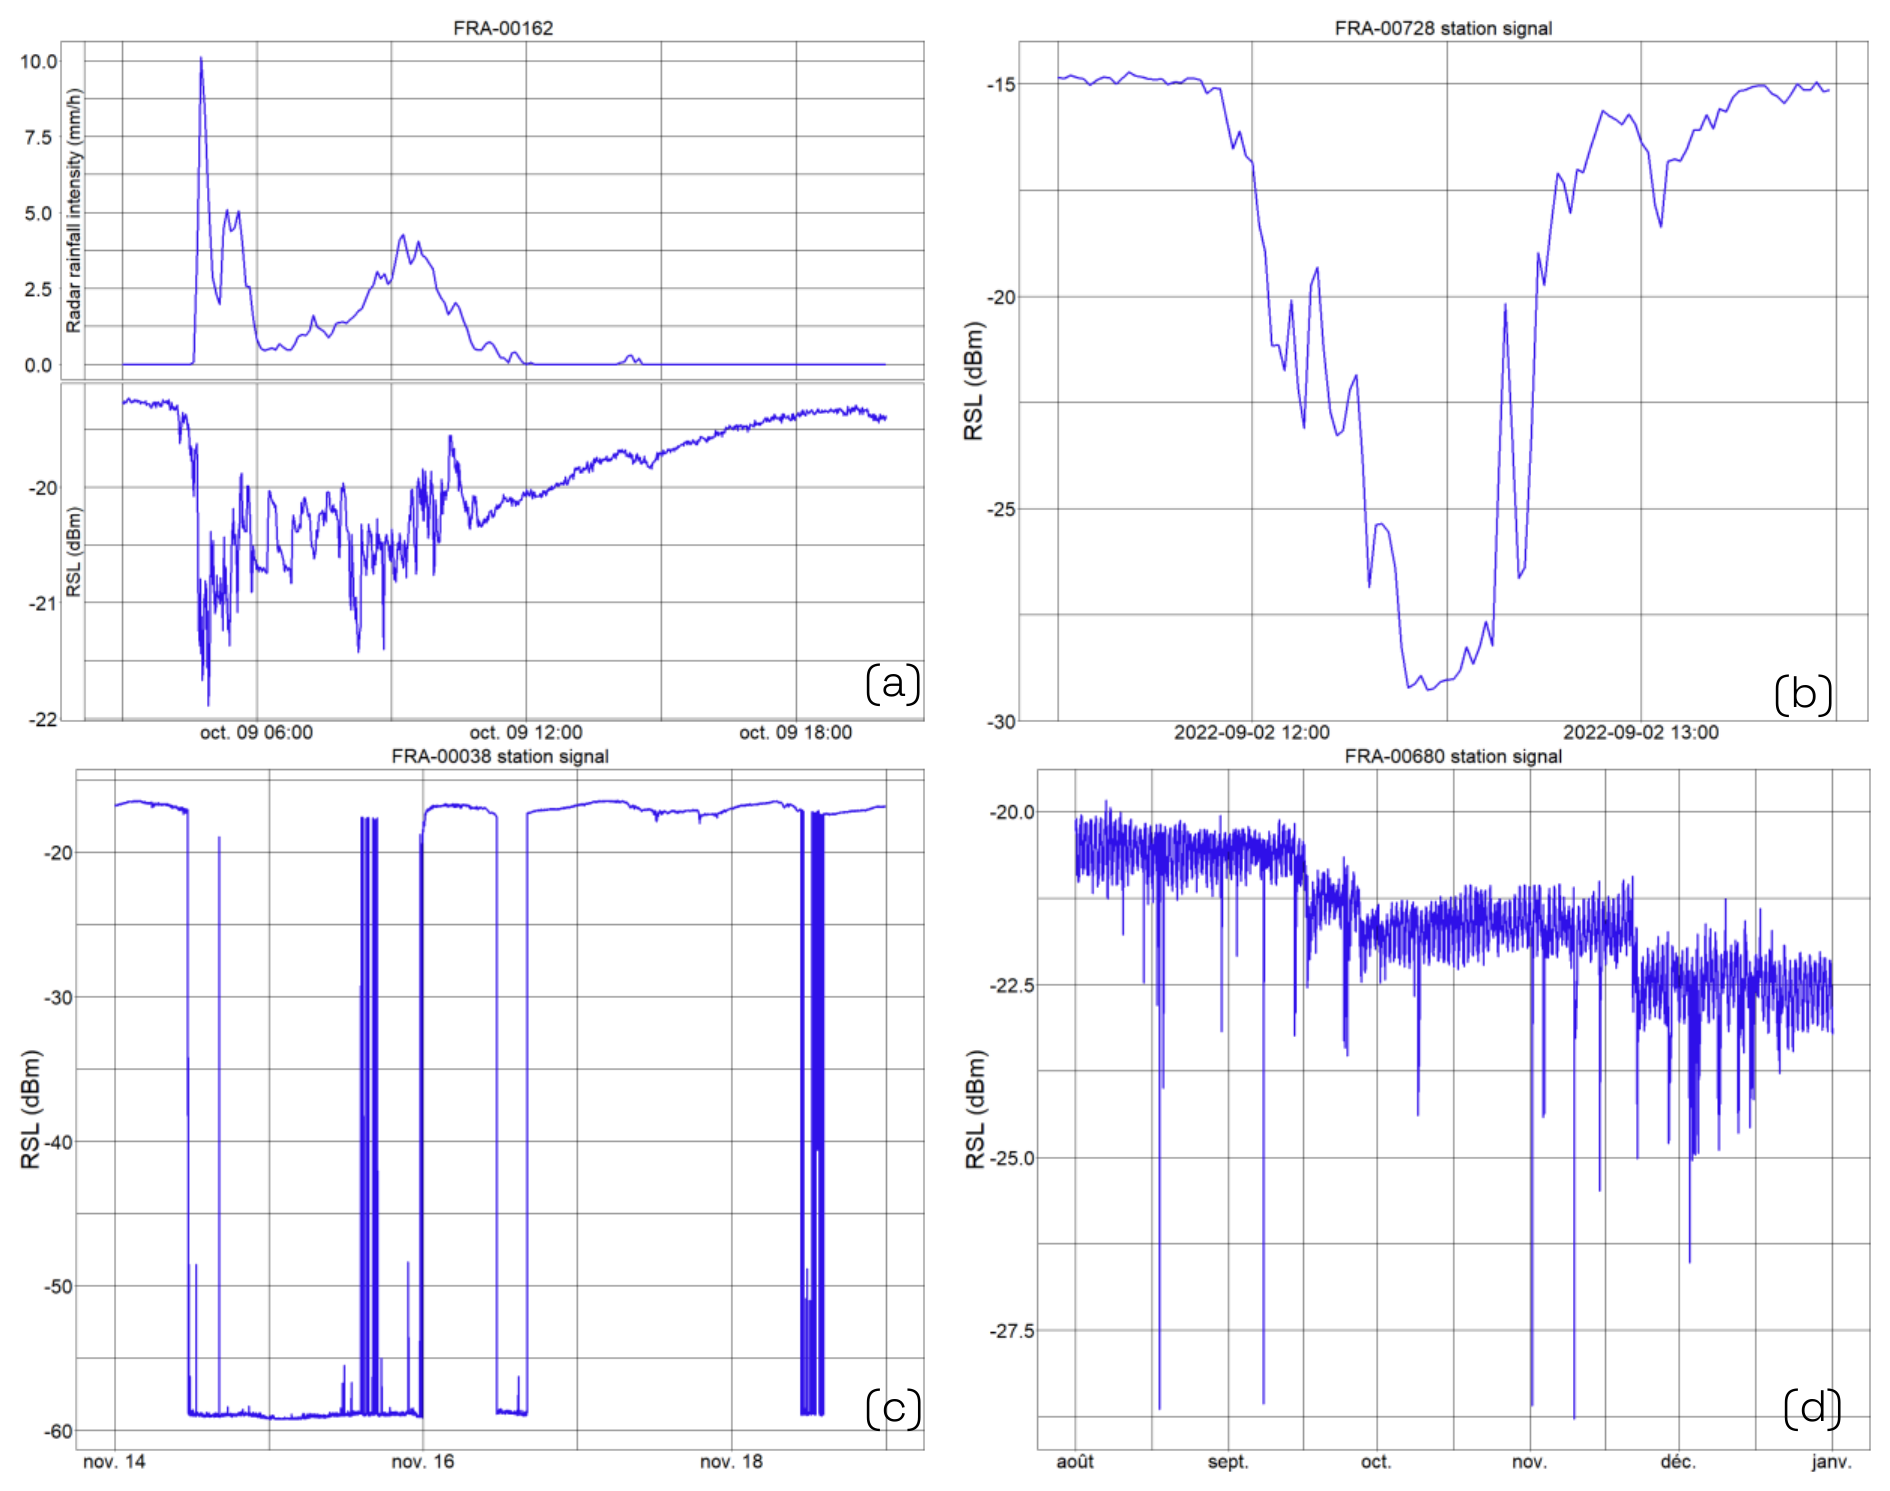
Figure 13Examples of disturbances and anomalous RSL patterns. (a) Antenna drying process after a rainfall event. (b) RSL decreasing to the noise level during an intense rainfall event. (c) LNB cable disconnection. (d) Multiple cases of misalignment of the antenna dish.
The anomalous pattern in Fig. 13c indicates an issue in the cable connecting the antenna to the LNB, resulting in complete signal loss (RSL 60 dBm). Finally, Fig. 13d shows two signal drops occurred in mid-September and in late November, respectively, which are attributed to misalignment of the satellite dish caused by wind or other mechanical factors. These examples clearly demonstrate that the SML signal is not only influenced by rainfall intensity but also by multiple factors, thereby complicating the isolation of the rainfall contribution. Additional disturbances not reported here, such as the sun transit effect, are discussed in extensive surveys (Giannetti and Reggiannini, 2021; Nebuloni et al., 2025a).
While relatively few studies have addressed the processing of SML data, an extensive body of literature is available for CMLs. Since the processing of CML and SML data shares many common methodological aspects, insights and techniques developed for CMLs can be adapted to SMLs. In addition to the references listed in the Introduction (Sect. 1), and based on our experience with SML and CML data, we provide the following recommendations for the processing and analysis of SML observations.
Interpolation of missing data over short time periods (e.g. a few minutes) can help obtaining a more complete dataset while reducing the risk of missing or inaccurately estimating rainfall events. The identification of anomalous links should rely on both the average RSL value and its temporal variability, as discussed in Sect. 2.1. In addition, cross-validation with nearby SMLs is recommended. The application of simple statistical filtering approaches, such as those proposed by Blettner et al. (2025), may also enhance the overall quality of the dataset.
Accurate classification of wet and dry periods is essential for establishing an appropriate baseline for each rainfall event. Several methods have been developed for SMLs (see Nebuloni et al., 2025a for a survey of methods), while additional approaches are available from the CML research community, including those implemented in the widely used Python package pycomlink (Chwala et al., 2025), developed within the COST Action OpenSense. Methods for estimating wet antenna attenuation are also available in pycomlink. However, these techniques were primarily developed for CMLs with two antennas, and should therefore be adapted when using them for SMLs, where only the ground antenna is affected by this disturbance.
Prior to deriving rainfall intensity from attenuation measurements, the portion of the propagation path containing liquid precipitation should be identified, and the contribution of the melting layer to total attenuation should be considered. Determining the 0 °C isotherm height is a key step in this process (see Sect. 4.3). Owing to its substantial temporal variability, we recommend to use dynamic estimates of this quantity rather than climatological averages. Such information can be obtained from atmospheric reanalyses, such as ERA5, NWP models in real-time applications, radiosonde, radar or other remote sensing observations. Rain attenuation can be converted into rainfall rates using the γ–R relationship in Eq. (1). The corresponding parameters are available from ITU recommendations (ITU-R P.838-3, 2005), or can be derived from local disdrometer measurements. To date, no studies have investigated the total attenuation of SML signals caused by heavy rainfall events, comparable to the analysis conducted for CML data by Polz et al. (2023).
Finally, the usage of machine learning methods in several steps of SML data processing appears particularly appropriate, as they are well-suited to capturing the amplitude, duration, and frequency of rain-induced RSL patterns (see e.g. Gianoglio et al., 2024, Gelbart et al., 2025).
The OpenSat4Weather dataset is openly available at https://doi.org/10.5281/zenodo.16530166 under the Creative Commons Attribution 4.0 International Public License (CC BY 4.0) (Nebuloni et al., 2025b). More details on the data structure and files are provided in the data repository. The OpenSat4Weather data covers the period August–December 2022. Additional data from the Météo-France ground weather stations can be downloaded at https://meteo.data.gouv.fr/ (last access: 31 July 2025).
We presented the OpenSat4Weather open access dataset, which provides SML data for the opportunistic sensing of precipitation. The dataset consists of the raw time series of the RSL collected by low cost receivers used for TV-SAT signal reception. SML sensors represent a cost-effective solution for precipitation monitoring, particularly in regions where conventional sensors are sparse or unavailable, due to their multiple advantages: ease of deployment, low power consumption, and the ability to transmit data to a remote server via Wi-Fi or 4G/5G networks.
OpenSat4Weather includes RSL data for 215 SML sensors operating in the Ku-band and deployed across southern France. The dataset consists of 1 min sampled RSL time series covering a five month observation window from August to December 2022. It also provides metadata for each SML, including the ground station coordinates, satellite identifier, and antenna elevation and azimuth angles. All the SMLs operate with horizontal polarization. The RSL should be considered a 1 min average of the signals received over the upper part of the Ku-band, i.e. 11.70–12.75 GHz. In addition, the dataset includes hourly time series of the 0 °C isotherm height along each satellite-to-ground path, which allow to quantify the length of the rainy part of the propagation path. This information, in turn, is required in the conversion process of RSL into rainfall intensity. Finally, OpenSat4Weather provides conventional rainfall data collected by rain gauges and weather radars that can be used for algorithm development, comparison and validation studies. These data can also be used in the RSL processing chain, for example for identifying wet and dry periods of time.
The data are stored in the Netcdf format, which is supported by most of the computing platforms used by scientists and engineers. The dataset is openly available on Zenodo. OpenSat4Weather fulfills the guidelines for FAIR data (namely, Findable, Accessible, Interoperable and Reusable) (Wilkinson et al., 2016).
RN and MG conceived the idea and reached the agreement with data owners to openly share the SML dataset. MG and GC collected rain gauge, weather radar and ERA5 data, and converted these data as well as SML data into the NetCdf format. FM and MT analyzed the SML data. RN analyzed the rain gauge data. MG analyzed the radar data. GC analyzed the ERA5 data. All the authors contributed to write and review the manuscript.
The contact author has declared that none of the authors has any competing interests.
Publisher's note: Copernicus Publications remains neutral with regard to jurisdictional claims made in the text, published maps, institutional affiliations, or any other geographical representation in this paper. The authors bear the ultimate responsibility for providing appropriate place names. Views expressed in the text are those of the authors and do not necessarily reflect the views of the publisher.
This work has been carried out within the framework of the COST Action OpenSense, CA20136, “Opportunistic Precipitation Sensing Network” supported by COST (European Cooperation in Science and Technology). We thank Sereno/HD Rain company for sharing their SML data, the authors of the Zenodo record where the SML data are stored and publicly available, and, finally, Meteo France for providing open access to their meteorological products.
This project has received funding from the European Union's Horizon 2020 research and innovation programme under Grant Agreement CA20136 [Opportunistic precipitation sensing network (OpenSense)].
This paper was edited by Carlos Morales and reviewed by two anonymous referees.
Adirosi, E., Facheris, L., Giannetti, F., Scarfone, S., Bacci, G., Mazza, A., Ortolani, A., and Baldini, L.: Evaluation of rainfall estimation derived from commercial interactive DVB receivers using disdrometer, rain gauge, and weather radar, IEEE T. Geosci. Remote, 59, 8978–8991, https://doi.org/10.1109/TGRS.2020.3041448, 2021. a
Andersson, J. C. M., Olsson, J., van de Beek, R. (C. Z.)., and Hansryd, J.: OpenMRG: Open data from Microwave links, Radar, and Gauges for rainfall quantification in Gothenburg, Sweden, Earth Syst. Sci. Data, 14, 5411–5426, https://doi.org/10.5194/essd-14-5411-2022, 2022. a, b
Angeloni, S., Adirosi, E., Sapienza, F., Giannetti, F., Francini, F., Magherini, L., Valgimigli, A., Vaccaro, A., Melani, S., Antonini, A., and Baldini, L.: Enhanced estimation of rainfall from opportunistic microwave satellite signals, IEEE T. Geosci. Remote, 62, 1–12, https://doi.org/10.1109/TGRS.2023.3349100, 2024. a
Arslan, C. H., Aydin, K., Urbina, J. V., and Dyrud, L.: Satellite-link attenuation measurement technique for estimating rainfall accumulation, IEEE T. Geosci. Remote, 56, 681–693, 2017. a
Barthès, L. and Mallet, C.: Rainfall measurement from the opportunistic use of an Earth–space link in the Ku band, Atmos. Meas. Tech., 6, 2181–2193, https://doi.org/10.5194/amt-6-2181-2013, 2013. a
Blettner, N., Chwala, C., Wiegels, R., Lang, R., and Kunstmann, H.: Evaluating CML rainfall processing methods on a countrywide scale in Zambia, J. Hydrometeorol., 26, 1603–1629, 2025. a
Capsoni, C., Luini, L., Paraboni, A., Riva, C., and Martellucci, A.: A New prediction model of rain attenuation that separately accounts for stratiform and convective rain, IEEE T. Antenn. Propag., 57, 196–204, https://doi.org/10.1109/TAP.2008.2009698, 2009. a
Chochon, R., Martin, N., Lebourg, T., and Vidal, M.: Analysis of Extreme Precipitation During the Mediterranean Event Associated with the Alex Storm in the Alpes-Maritimes: Atmospheric Mechanisms and Resulting Rainfall, 397–418, https://doi.org/10.1007/978-981-19-1600-7_26, 2022. a
Chwala, C., Graf, M., Polz, J., Blettner, N., DanSereb, Øydvin, E., keis f, overeem11, toufikshit, Kaleta, L., and yboose: pycomlink/pycomlink: v0.6.0, Zenodo [code], https://doi.org/10.5281/zenodo.18082259, 2025. a
Colli, M., Stagnaro, M., Caridi, A., Lanza, L. G., Randazzo, A., Pastorino, M., Caviglia, D. D., and Delucchi, A.: A field assessment of a rain estimation system based on satellite-to-Earth microwave links, IEEE T. Geosci. Remote, 57, 2864–2875, https://doi.org/10.1109/TGRS.2018.2878338, 2019. a
Colli, M., Cassola, F., Martina, F., Trovatore, E., Delucchi, A., Maggiolo, S., and Caviglia, D. D.: Rainfall fields monitoring based on satellite microwave down-links and traditional techniques in the city of Genoa, IEEE T. Geosci. Remote, 58, 6266–6280, 2020. a
Covi, E. and Roversi, G.: OpenRainER dataset, Zenodo [code], https://doi.org/10.5281/zenodo.10610886, 2024. a
Crane, R. K.: Electromagnetic Wave Propagation through Rain, Wiley, New York, ISBN 978-0-471-61376-3, 1996. a
Fabry, F. and Zawadzki, I.: Long-term radar observations of the melting layer of precipitation and their interpretation, J. Atmos. Sci., 52, 838–851, https://doi.org/10.1175/1520-0469(1995)052<0838:LTROOT>2.0.CO;2, 1995. a
Fencl, M., Nebuloni, R., Andersson, J. C., Bares, V., Blettner, N., Cazzaniga, G., Chwala, C., Colli, M., de Vos, L., El Hachem, A., Galdies, C., Giannetti, F., Graf, M., Jacoby, D., Habi, H. V., Musil, P., Ostrometzky, J., Roversi, G., Sapienza, F., Seidel, J., Spackova, A., van de Beek, R., Walraven, B., Wilgan, K., and Zheng, X.: Data formats and standards for opportunistic rainfall sensors, Open Research Europe, 3, 169, https://doi.org/10.12688/openreseurope.16068.2, 2024. a, b, c
Gelbart, L., Barthès, L., Mercier-Tigrine, F., Chazottes, A., and Mallet, C.: Enhanced quantitative precipitation estimation through the opportunistic use of Ku TV-SAT links via a dual-channel procedure, Atmos. Meas. Tech., 18, 351–370, https://doi.org/10.5194/amt-18-351-2025, 2025. a, b, c
Giannetti, F. and Reggiannini, R.: Opportunistic rain rate estimation from measurements of satellite downlink attenuation: a survey, Sensors, 21, https://doi.org/10.3390/s21175872, 2021. a
Giannetti, F., Reggiannini, R., Moretti, M., Adirosi, E., Baldini, L., Facheris, L., Antonini, A., Melani, S., Bacci, G., Petrolino, A., and Vaccaro, A.: Real-time rain rate evaluation via satellite downlink signal attenuation measurement, Sensors, 17, 1864, https://doi.org/10.3390/s17081864, 2017. a, b
Giannetti, F., Moretti, M., Reggiannini, R., and Vaccaro, A.: The NEFOCAST system for detection and estimation of rainfall fields by the opportunistic use of broadcast satellite signals, IEEE Aerosp. Electron. Syst. Mag., 34, 16–27, 2019. a, b
Gianoglio, C., Zani, S., Colli, M., and Caviglia, D. D.: Rainfall classification in Genoa: machine learning vs. adaptive statistical models using satellite microwave links, IEEE Access, https://doi.org/10.1109/ACCESS.2024.3458407. 2024. a, b
Houze, R. A.: Stratiform precipitation in regions of convection: a meteorological paradox?, B. Am. Meteorol. Soc., 78, 2179–2196, https://doi.org/10.1175/1520-0477(1997)078<2179:SPIROC>2.0.CO;2, 1997. a
ITU-R P.838-3: Specific attenuation model for rain for use in prediction methods, Tech. rep., https://www.itu.int/dms_pubrec/itu-r/rec/p/R-REC-P.839-4-201309-I!!PDF-E.pdf (last access: 19 May 2026), 2005. a, b, c
ITU-R P.839-4: Rain height model for prediction methods, Tech. rep., https://www.itu.int/dms_pubrec/itu-r/rec/p/R-REC-P.838-3-200503-I!!PDF-E.pdf (last access: 19 May 2026), 2013. a
Jacoby, D., Yu, S., Hu, S., Hine, Z., Johnson, R., Ostrometzky, J., Kadota, I., Messer, H., and Zussman, G.: OpenMesh dataset, Zenodo [code], https://doi.org/10.5281/zenodo.15268340, 2025. a
Leijnse, H., Uijlenhoet, R., and Stricker, J. N. M.: Rainfall measurement using radio links from cellular communication networks, Water Resour. Res., 43, https://doi.org/10.1029/2006WR005631, 2007a. a
Leijnse, H., Uijlenhoet, R., and Stricker, J. N. M.: Hydrometeorological application of a microwave link: 2. Precipitation, Water Resour. Res., 43, 9, https://doi.org/10.1029/2006WR004989, 2007b. a
Matrosov, S. Y.: Assessment of radar signal attenuation caused by the melting hydrometeor layer, IEEE T. Geosci. Remote, 46, 1039–1047, https://doi.org/10.1109/TGRS.2008.915757, 2008. a
Mercier, F., Barthès, L., and Mallet, C.: Estimation of finescale rainfall fields using broadcast TV satellite links and a 4DVAR assimilation method, J. Atmos. Ocean. Tech., 32, 1709–1728, 2015. a
Messer, H., Zinevich, A., and Alpert, P.: Environmental monitoring by wireless communication networks, Science, 312, 713–713, https://doi.org/10.1126/science.1120034, 2006. a
Mimeau, L., Tramblay, Y., Brocca, L., Massari, C., Camici, S., and Finaud-Guyot, P.: Modeling the response of soil moisture to climate variability in the Mediterranean region, Hydrol. Earth Syst. Sci., 25, 653–669, https://doi.org/10.5194/hess-25-653-2021, 2021. a
Météo-France: Fiche climatologique, https://donneespubliques.meteofrance.fr/?fond=produit&id_produit=117&id_rubrique=39, last access: 13 May 2025a. a
Météo-France: 2022 : les bilans climatiques, https://meteofrance.fr/actualite/publications/2022-les-bilans-climatiques, last access: 12 May 2025b. a
Nebuloni, R., Giannetti, F., Sapienza, F., Lottici, V., Adirosi, E., Roversi, G., Covi, E., Gianoglio, C., Colli, M., and Michele, C. D.: A review of technical aspects and challenges in opportunistic rainfall estimation using satellite and terrestrial microwave links: how wireless infrastructure can be used for rainfall monitoring, IEEE Geoscience and Remote Sensing Magazine, 13, 266–296, https://doi.org/10.1109/MGRS.2025.3573645, 2025a. a, b
Nebuloni, R., Graf, M., Cazzaniga, G., Mercier, F., and Turko, M.: The OpenSat4Weather dataset: Ku-band satellite link data for precipitation monitoring, Zenodo [code], https://doi.org/10.5281/zenodo.16530166, 2025b. a, b, c
Overeem, A., Leijnse, H., and Uijlenhoet, R.: Two and a half years of country-wide rainfall maps using radio links from commercial cellular telecommunication networks, Water Resour. Res., 52, 8039–8065, https://doi.org/10.1002/2016WR019412, 2016. a
Polz, J., Graf, M., and Chwala, C.: Missing rainfall extremes in commercial microwave link data due to complete loss of signal, Earth and Space Science, 10, e2022EA002456, https://doi.org/10.1029/2022EA002456, 2023. a
Quijada-Meza, C., Jacques-Coper, M., Garreaud, R. D., and Schauwecker, S.: Temporal variability of the 0 °C isotherm height over the coast of the Biobío region (36.8° S), Chile: characterisation and case studies, Int. J. Climatol., e70229, https://doi.org/10.1002/joc.70229, 2026. a
Schauwecker, S., Palma, G., MacDonell, S., Ayala, Á., and Viale, M.: The snowline and 0 °C isotherm altitudes during precipitation events in the dry subtropical Chilean Andes as seen by citizen science, surface stations, and ERA5 reanalysis data, Front. Earth Sci., 10, 875795, https://doi.org/10.3389/feart.2022.875795, 2022. a
Schleiss, M., Olsson, J., Berg, P., Niemi, T., Kokkonen, T., Thorndahl, S., Nielsen, R., Ellerbæk Nielsen, J., Bozhinova, D., and Pulkkinen, S.: The accuracy of weather radar in heavy rain: a comparative study for Denmark, the Netherlands, Finland and Sweden, Hydrol. Earth Syst. Sci., 24, 3157–3188, https://doi.org/10.5194/hess-24-3157-2020, 2020. a
Tabary, P., Boumahmoud, A.-A., Andrieu, H., Thompson, R. J., Illingworth, A. J., Le Bouar, E., and Testud, J.: Evaluation of two “integrated” polarimetric Quantitative Precipitation Estimation (QPE) algorithms at C-band, J. Hydrol., 405, 248–260, 2011. a
Thurai, M., Iguchi, T., Kozu, T., Eastment, J. D., Wilson, C. L., and Ong, J. T.: Radar observations in Singapore and their implications for the TRMM precipitation radar retrieval algorithms, Radio Sci., 38, https://doi.org/10.1029/2002RS002855, 2003. a
Wilkinson, M. D., Dumontier, M., Aalbersberg, I. J., Appleton, G., Axton, M., Baak, A., Blomberg, N., Boiten, J.-W., da Silva Santos, L. B., Bourne, P. E., Bouwman, J., Brookes, A. J., Clark, T., Crosas, M., Dillo, I., Dumon, O., Edmunds, S., Evelo, C. T., Finkers, R., Gonzalez-Beltran, A., Gray, A. J. G., Groth, P., Goble, C., Grethe, J. S., Heringa, J., 't Hoen, P. A. C., Hooft, R., Kuhn, T., Kok, R., Kok, J., Lusher, S. J., Martone, M. E., Mons, A., Packer, A. L., Persson, B., Rocca-Serra, P., Roos, M., van Schaik, R., Sansone, S.-A., Schultes, E., Sengstag, T., Slater, T., Strawn, G., Swertz, M. A., Thompson, M., van der Lei, J., van Mulligen, E., Velterop, J., Waagmeester, A., Wittenburg, P., Wolstencroft, K., Zhao, J., and Mons, B.: The FAIR guiding principles for scientific data management and stewardship, Scientific Data, 3, https://doi.org/10.1038/sdata.2016.18, 2016. a
Wolf, K., Bellouin, N., Boucher, O., Rohs, S., and Li, Y.: Correction of ERA5 temperature and relative humidity biases by bivariate quantile mapping for contrail formation analysis, Atmos. Chem. Phys., 25, 157–181, https://doi.org/10.5194/acp-25-157-2025, 2025. a
Xian, M., Liu, X., and Gao, T.: An improvement to precipitation inversion model using oblique Earth–space link based on the melting layer attenuation, IEEE T. Geosci. Remote, 59, 6451–6465, https://doi.org/10.1109/TGRS.2020.3027465, 2021. a