the Creative Commons Attribution 4.0 License.
the Creative Commons Attribution 4.0 License.
 | 08 Oct 2026
WAPOSAL: a multi-regional wave dataset from satellite altimetry for significant wave height, period estimation, and wave power density
Sonia Ponce de León
Maria Panfilova

Andrés F. Orejarena-Rondón
Marco Restano
Roberto Sabia
Jérôme Benveniste
Accurate assessment of wave power density (WPD) is essential for marine renewable energy development and for validating numerical wave models, particularly in coastal and nearshore regions where in situ observations are sparse. This study presents a high-resolution, multi-region wave dataset generated within the WAPOSAL (Wave Power & Satellite Altimetry) project, derived from Synthetic Aperture Radar (SAR) altimetry data acquired by the Sentinel-3A/B and CryoSat-2 missions. Significant wave height and normalized radar cross-section were obtained using the SAMOSA+ retracker, and zero-crossing wave period was estimated based on an empirical regression method calibrated with in situ buoy and ERA5 data. Wave power density was then computed along altimeter tracks across eleven regions: Norway & Baltic Sea, UK & North Sea, French façade, Spain Atlantic, Portugal, Mediterranean sea, Madeira, Canary Islands, Azores Archipelago, French Guiana and French Polynesia. The temporal coverage spans 2011–2023, depending on the region and the satellite mission considered. The present paper describes the database and illustrates its use through simple application examples. The dataset in its current format and version can be discovered, shared and cited via the following link: https://doi.org/10.57780/ESA-1AB8CF3 (Ponce de León et al., 2026).
- Article
(8319 KB) - Full-text XML
- BibTeX
- EndNote


Marine renewable energy is a promising option for countries with extensive maritime zones. Interest in this energy source has increased due to the growing demand for low-carbon electricity to mitigate climate change, rising global energy consumption, competition for land resources among agriculture, urban development, and protected areas, and increasing population density. These factors have encouraged the exploration and development of renewable energy resources in the marine environment (O’Connell et al., 2024; Orlov, 2024). Among marine renewable energy options, wave energy is recognized as a promising source due to its high energy density and predictability compared with wind and solar energy (Gu et al., 2025).
There are diverse methodologies for determining wave power density, which focus on obtaining the significant wave height Hs and the energy period Te. Among these is the use of in-situ wave measurements, which is considered highly accurate because buoys record data directly from the sea surface (Dunnett and Wallace, 2009; Kasiulis et al., 2015). However, their low spatial distribution and heterogeneity make it difficult to estimate wave power density at a macro-scale, especially in countries without sustained monitoring networks and in remote ocean areas (Orejarena-Rondón et al., 2026).
Third-generation wave models (e.g., WAM, WAMDI Group, 1988; SWAN, Booij et al., 1999; WAVEWATCH/III, Tolman, 2009), on the other hand, are widely used tools for determining wave power density, solving problems such as spatial resolution and macro-scale coverage (Besio et al., 2016; Görmüş et al., 2024; Vázquez et al., 2025). Nevertheless, they present inconsistencies and gaps in coastal areas, thereby losing important information on the interaction between waves and the seabed, crucial for determining wave energy potential near the coast (Orejarena-Rondón et al., 2026).
In contrast, satellite altimetry has become a cost-effective alternative for determining potential energy density, providing consistent global time series with excellent spatial coverage. Furthermore, thanks to recent advances in technology, measurements in nearshore waters can now be obtained with significantly higher resolution, expanding its possible applications (Orejarena-Rondón et al., 2026; Vignudelli et al., 2019; Dong et al., 2023).
In this context, one of the results of the WAPOSAL (Wave Power & Satellite Altimetry) project was the generation of a high-resolution, validated, multivariable dataset from satellite altimetry, with a special emphasis on estimating the period and calculating wave power density (WPD). The WAPOSAL project webpage is available at https://eo4society.esa.int/projects/waposal/ (last access: 19 September 2026).
The dataset integrates corrected satellite altimetry data using the SAMOSA+ and retracker algorithm (Dinardo et al., 2018), from the Sentinel-3A/B and CryoSat-2 missions, covering various oceanic and coastal regions including: Norway & Baltic Sea, UK & North Sea, French façade, Spain Atlantic, Portugal, Mediterranean Sea, Madeira, Canary Islands, Azores Archipelago, French Guiana and French Polynesia as shown in Fig. 1. The information on significant wave height Hs and normalized radar cross section σ0 was obtained using the retracking procedure, while the zero-crossing wave period Tz was estimated from Hs and σ0 based on the regression method (Gommenginger et al., 2003).
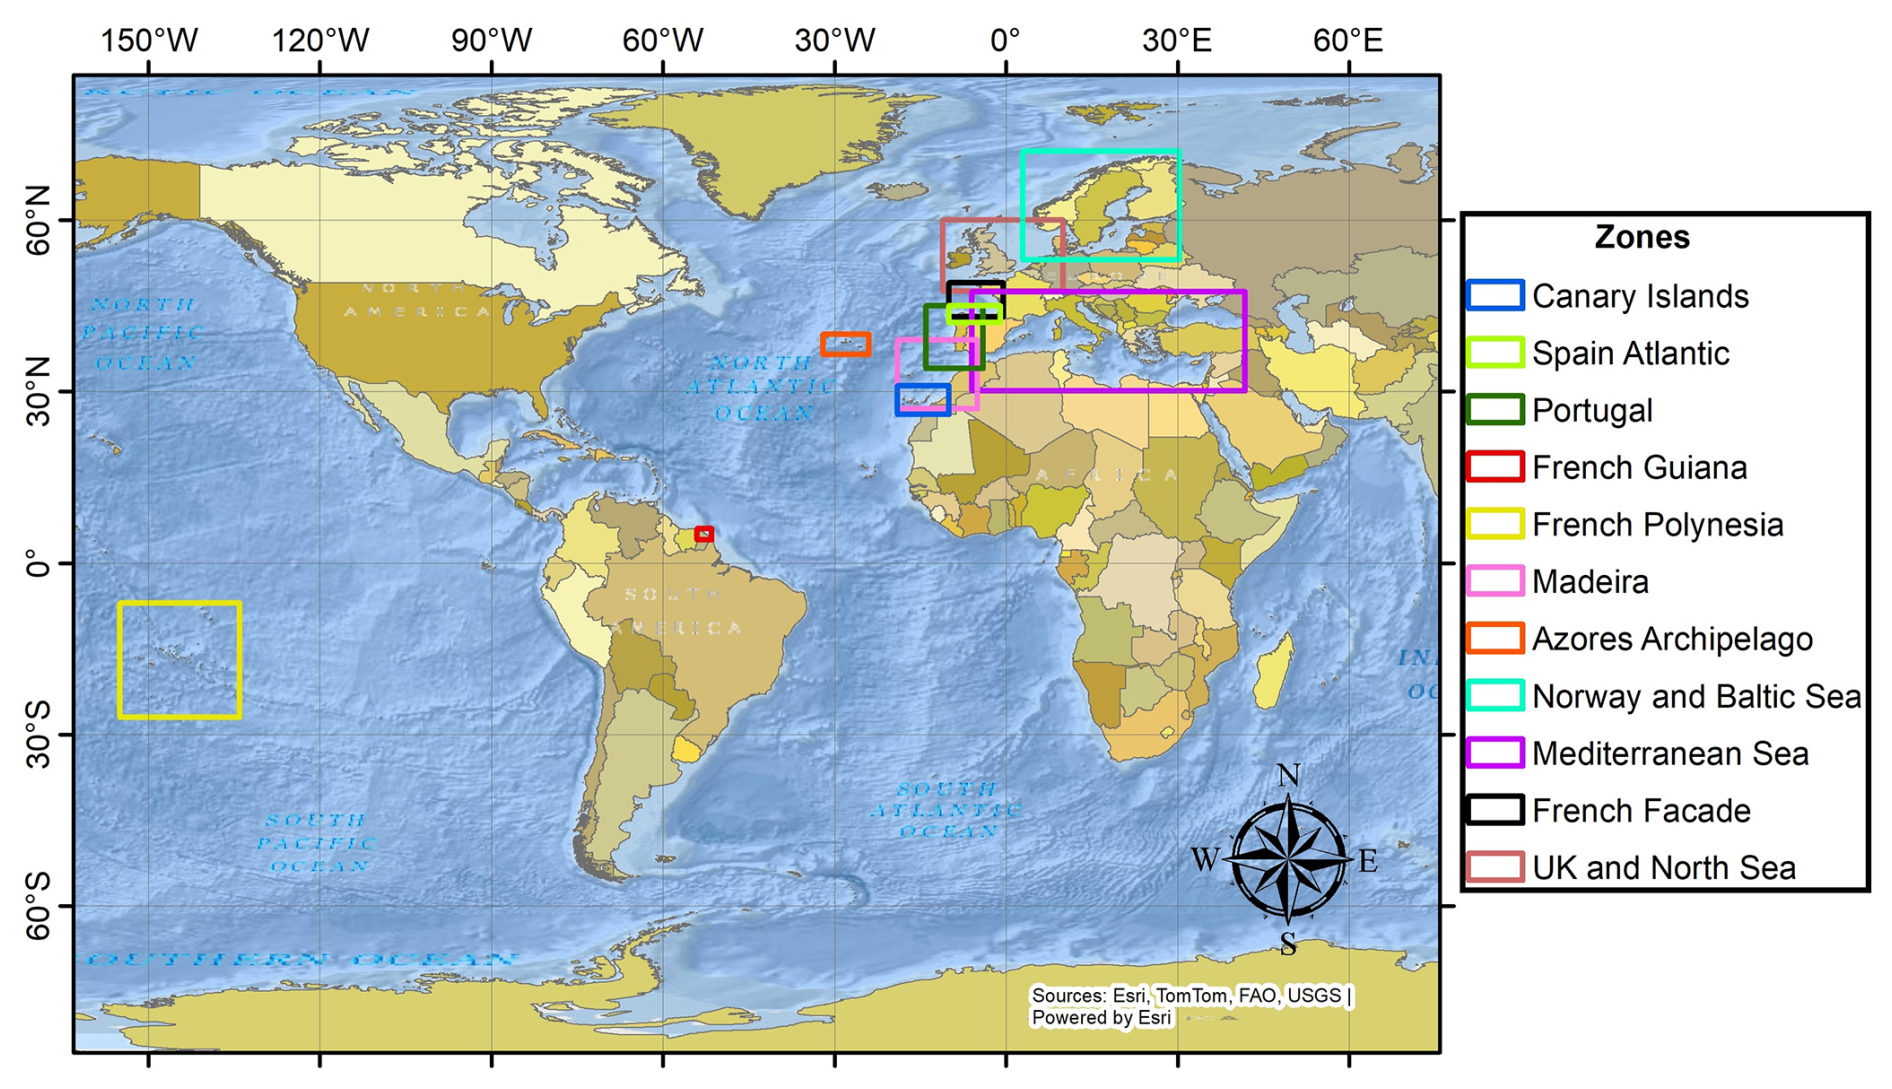
Figure 1WAPOSAL regions: the bounding boxes show the combined spatial extent of the Sentinel-3A/B and CryoSat-2 dataset.
Although the relationship proposed by Gommenginger et al. (2003) was originally calibrated using TOPEX altimeter data and NDBC buoys, a recalibration is required here due to differences in the altimeter processing (use of SAMOSA+ retracker), the proximity to the coast, and the regional wave climate. These factors can influence the altimeter-derived parameter and its relationship with Tz, justifying a site-specific calibration.
The estimated Hs and Tz data were validated against in-situ wave buoy and/or ERA5 data, for each study area. Subsequently, the wave power density was computed along the available tracks for each region, producing a homogeneous database suitable for marine energy applications.
This article describes the method used to determine the wave period, the validation of the Hs and Tz obtained from satellite altimetry, the structure of the final dataset and finally the applications of the wave power density dataset. The resulting database is an open-access, standardized resource that can be utilized by the scientific community, monitoring institutions, and marine energy developers.
2.1 High resolution altimeter data on significant wave height and normalized radar cross section
The radar altimetry data used to generate this Dataset across the 11 study areas (see Fig. 1) are from the European Space Agency (ESA) missions CryoSat-2 and Sentinel-3A/B. The data in high resolution Synthetic Aperture Radar (SAR) mode were considered and reprocessed.
Reprocessing was performed using the ESA-developed cloud service SARvatore (SAR Versatile Altimetric Toolkit for Ocean Research & Exploration), which processes SAR altimetry data. This service incorporates the SAMOSA+ model and retracker algorithm, specifically designed for the altimeter waveform interpretation and parameter estimation under challenging coastal conditions, to optimize data in coastal environments (Dinardo et al., 2018).
From a computational perspective, the reprocessing campaign leveraged EarthConsole®'s P-PRO (Parallel Processing) environment, which dynamically allocates computing resources across a distributed cluster. This parallel architecture significantly reduced overall CPU time by executing multiple processing chains concurrently and by colocating Earth Observation input data with the computing infrastructure. Data transfer overheads were minimized and task execution was accelerated, enabling the efficient handling of large data volumes.
As a result, along-track significant wave height Hs and normalized radar cross-section σ0 were obtained along the altimeter track with a resolution of 300 m. In the retracking procedure, the measured reflected radar waveform is fitted with a theoretical model, and several parameters, including the significant wave height and σ0, are estimated. The “misfit” quantifies the discrepancy between the measured waveform and the fitted model waveform. Therefore, a larger “misfit” indicates a poorer agreement between the observations and the model used in the retracking procedure. The dataset contains the information on the ’misfit’ between the model and measured altimeter waveform, that was later used for quality control.
The altimeter data were reprocessed as part of the OCRE EO (Open Clouds for Research Environments Earth Observations) project to generate high-resolution marine and coastal products. The data are freely available online in the EarthConsole® Virtual Altimetry Laboratory for registered users (https://avl-repo.earthconsole.eu/sarvatore/CENTEC_OCRE, last access: 19 September 2026).
2.2 Wave Period and Wave Power Density Estimate
Within the WAPOSAL project framework, based on the results of the OCRE EO project discussed above, estimates of wave period and wave power density were computed from along-track altimeter data. Information on Hs and σ0 and a “misfit” was used. The samples with a “misfit” greater than 4 counts are eliminated.
We estimated the zero-crossing wave period Tz as follows. In Gommenginger et al. (2003), it was suggested that Tz is linearly related to a variable named X, which is a combination of significant wave height Hs and of the normalized radar cross section σ0, with , and σ0 expressed in natural units (non-dB).
Therefore, following (Gommenginger et al., 2003), using collocated Tz in situ wave buoy data and altimeter Hs and σ0 data, we have re-evaluated for each collocated data set the coefficients (a and b) of the following equation using linear regression
To perform linear regression and validate altimeter measurements, data from 82 wave buoys within the study areas were used. The buoy data from the Copernicus Marine Environment Monitoring Service (IN-SITU OCEAN TAC) database, available at the website of Copernicus Marine Service (https://marineinsitu.eu/dashboard/, last access: 19 September 2026)), were used to validate the Tz and Hs obtained from satellite altimetry data in the UK, the Baltic, Norway, the French Coast, Portugal, Northern Spain, and the Mediterranean Sea. Additionally, within the Mediterranean Sea, in situ buoy data for the Italian coast were obtained from the website of RON database (Italian National Wave Network) available at the website https://dati.isprambiente.it/dataset-2/ron/ (last access: 19 September 2026).
In other regions – such as the Azores, French Guiana, French Polynesia, Madeira, and the Canary Islands – where buoys were not installed, the selected ERA5 grid nodes with available time series for wave parameters were used for validation. The data were downloaded from the website of Copernicus Climate Data Store (https://cds.climate.copernicus.eu, last access: 19 September 2026). The number of selected grid points varied by region (6–12 points), depending on the size and spatial extent of the study area. The grid points were selected to provide representative coverage of the coastal zone. No spatial interpolation was applied; instead, ERA5 data from each selected grid point were used directly. Time series of significant wave height and wave period were extracted from the ERA5 dataset and then processed in the same manner as the wave buoy observations.
Validation studies of ERA5 significant wave height have demonstrated good agreement with buoy measurements (Bessonova et al., 2025; Anusree and Kumar, 2024). However, these studies also indicate that ERA5 tends to underestimate significant wave height during extreme wave conditions. They further show that the accuracy of ERA5 improves with increasing distance from the coast, while variations in water depth have only a minor influence on its performance (Fanti et al., 2023). In addition, Fanti et al. (2023) evaluated ERA5 peak and mean wave periods against buoy observations and found good agreement, supporting the reliability of ERA5 wave period data for wave climate studies.
Altimeter and buoy or ERA5 data were matched in space and time. The matching maximum time interval is fixed as 45 min and the maximum spatial distance as 40 km. Although these thresholds are consistent with those commonly used in previous validation studies (Gommenginger et al., 2003), the resulting statistics may be sensitive to the choice of spatial and temporal windows. Data where the distance to the coast is less than 1 km were excluded. Altimeter data on σ0 and Hs within a 40 km radius of the buoy or ERA5 node location were cleaned of outliers and averaged. Only locations with more than 100 observations were retained for further analysis.
Using the triplets (σ0, Hs, Tz), the regression coefficients a and b were determined for each buoy location.
The regression coefficients a and b were estimated independently for each buoy location using collocated altimeter and in situ observations. This site-specific calibration accounts for regional differences in wave climate, spectral characteristics, and coastal effects, which can influence the relationship between the altimeter-derived parameter X and the mean zero-crossing period Tz. This approach produces mission-specific time series of satellite-derived parameters that are consistently matched to in situ observations at each buoy location. The temporal spacing between collocated pairs depends on buoy position, in situ sampling frequency, and each satellite mission's revisit characteristics.
The estimation of the linear regression coefficients (a,b) is performed separately for each location, motivated by the fact that the relationship between the altimeter-derived parameter X and the mean zero-crossing period Tz is not strictly universal but depends on local sea state characteristics and environmental conditions, including:
-
variations in wave climate (wind-sea vs. swell dominance),
-
differences in spectral shape and bandwidth,
-
bathymetric effects influencing wave transformation in coastal regions,
-
potential regional biases in altimeter measurements, especially in the nearshore zone.
As a result, a single global calibration may introduce systematic biases when applied across heterogeneous environments. Performing the regression at each buoy location allows the empirical relationship to better adapt to local conditions and improves the accuracy of the retrieved Tz.
The collocated altimeter and buoy dataset was randomly partitioned into two equal subsets: a training set and a validation set. The training set was used to estimate the regression coefficients a and b, while the validation set was employed to evaluate model performance in terms of bias, scatter index, and correlation coefficient. This procedure was repeated 1000 times to obtain a stable estimate, and the resulting ensemble was used to compute averaged estimates of both the regression coefficients and the statistical metrics. Since the number of available buoys is limited, we used data from all available wave buoys and ERA5 locations both in the training and validation datasets.
In Fig. 2, scatter plots of Hs and Tz in the validation dataset, which includes all buoy data and Sentinel-3A/B data, are shown.
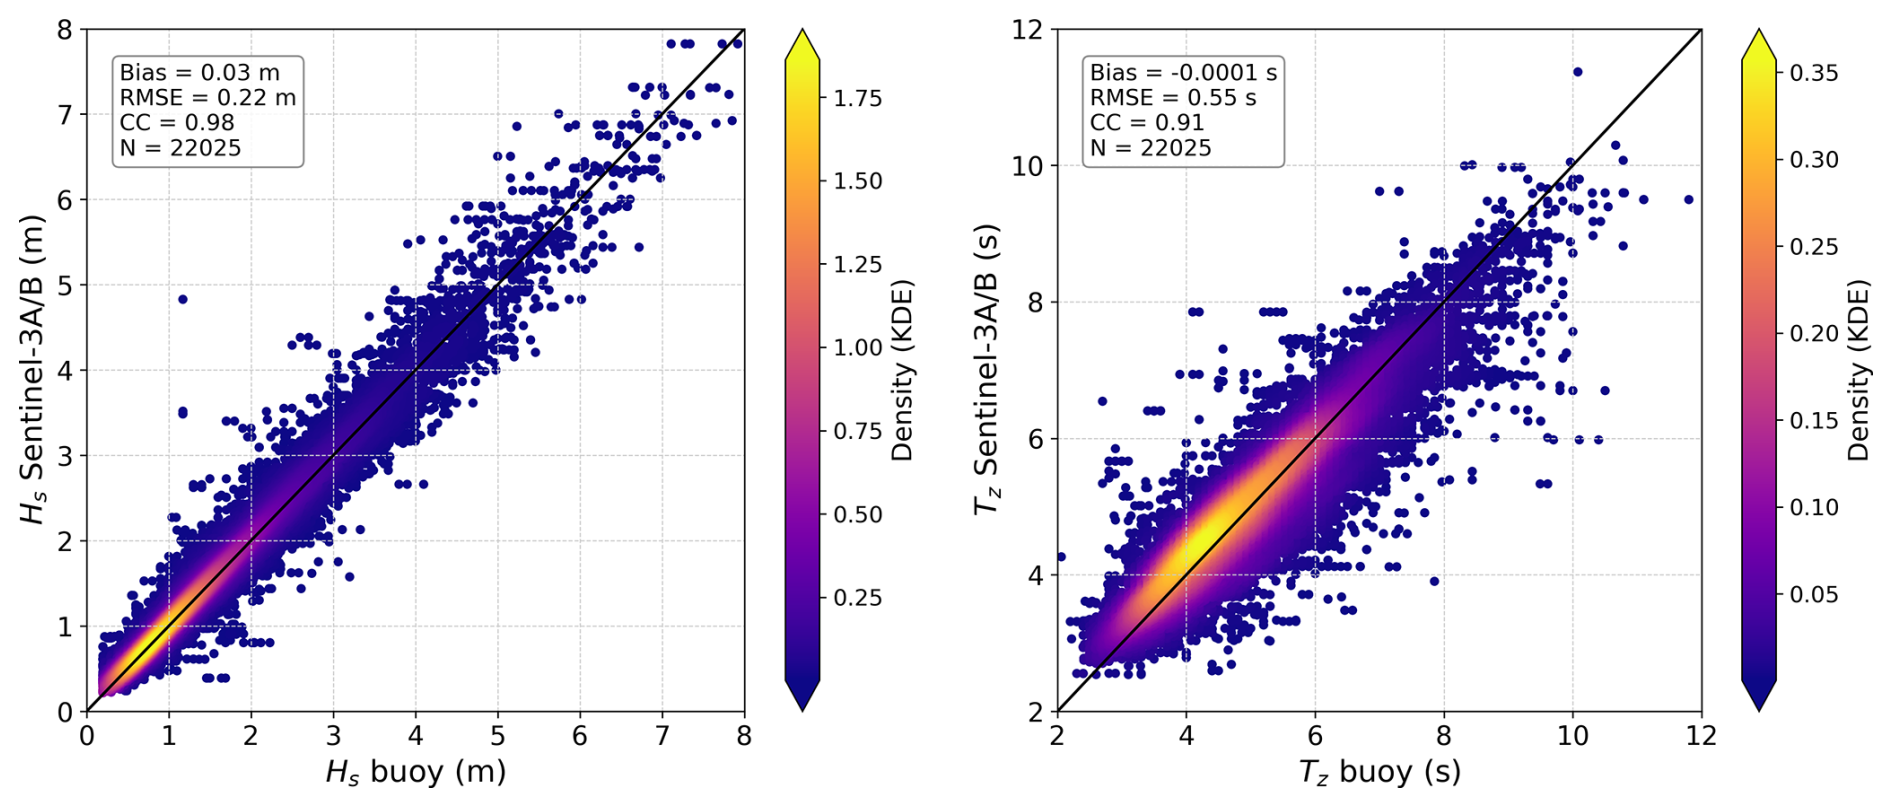
Figure 2Comparison of buoy and Sentinel-3A/B significant wave height (left) and zero-crossing wave period (right).
For Hs, the altimeter's bias relative to buoy measurements is 0.03 m, with a Root Mean Square Error (RMSE) of 0.22 m and a correlation coefficient (CC) of 0.98. For Tz, the altimeter's bias relative to buoy measurements is −0.0001 s, with an RMSE of 0.55 s and a CC of 0.91. For CryoSat-2, similar results are obtained: for Hs, bias = 0.02 m, RMSE = 0.23 m, CC = 0.98; for Tz, bias = −0.0001 s, RMSE = 0.57 s, CC = 0.91.
The strong agreement between buoy and altimeter measurements at the selected locations demonstrates the reliability of the altimeter data across the full coverage area. Therefore, the results of the linear regression are robust. The values of a and b, obtained at locations near buoys, were interpolated to the coordinates of the altimeter antenna footprints, and Tz was calculated along track using Eq. (1). More details about the interpolation procedure are provided in (Ponce de León et al., 2023, 2024a, b).
Wave power density is calculated from measurements of Hs and Tz along the track using the following equation:
where ρ= 1025 kg m−3 is the density of seawater, g= 9.8 m s−2 is the acceleration due to gravity, and Te is the energy wave period.
Equation (2) is derived in a deep water approximation, which is valid only when the water depth exceeds half the wavelength. For longer-period swell waves, the deep-water assumption may not be strictly valid in parts of the shelf, where intermediate-depth conditions can occur. This may lead to a moderate overestimation of wave power density when the deep-water formulation is used.
Moreover, the empirical relationship between Tz and the altimeter-derived parameter X is based on dimensional arguments assuming deep-water wave dispersion (Gommenginger et al., 2003). In this study, we apply the method using coastal-optimized altimetry products derived with the SAMOSA+ retracker, which improves the reliability of wave parameters in the nearshore zone (down to distances of approximately 5 km from the coast). Nevertheless, this represents a limitation of the approach, and future work will address this limitation by implementing finite-depth formulations of wave power density alongside high-resolution bathymetry and numerical wave models, enabling a more accurate assessment near the coastline.
The energy wave period is related to the zero-crossing wave period obtained along track as follows (Cahill and Lewis, 2014):
In this study we utilize constant wave period ratio . However, this ratio depends on the spectral shape (Cahill and Lewis, 2014). In this study, we implicitly assume a unimodal spectrum typical of wind-sea or mixed conditions. Under such assumptions, typically ranges between 1.05 and 1.20, leading to an uncertainty in wave power density on the order of 10 %–15 %, and up to 20 % for more complex spectral conditions (e.g., bimodal sea states). This limitation is inherent to the use of bulk parameters and should be considered when interpreting the results.
2.3 Discussion
2.3.1 Local analysis of the algorithm performance
Two locations were selected in the North Atlantic (wave buoys 6200048 and 6200046) and one in the Mediterranean Sea (wave buoy 6100196). The position of the buoys is shown in the Fig. 3. Table 1 shows the statistical metrics for Tz, Hs, and the wave power density and the regression coefficients for the selected locations.
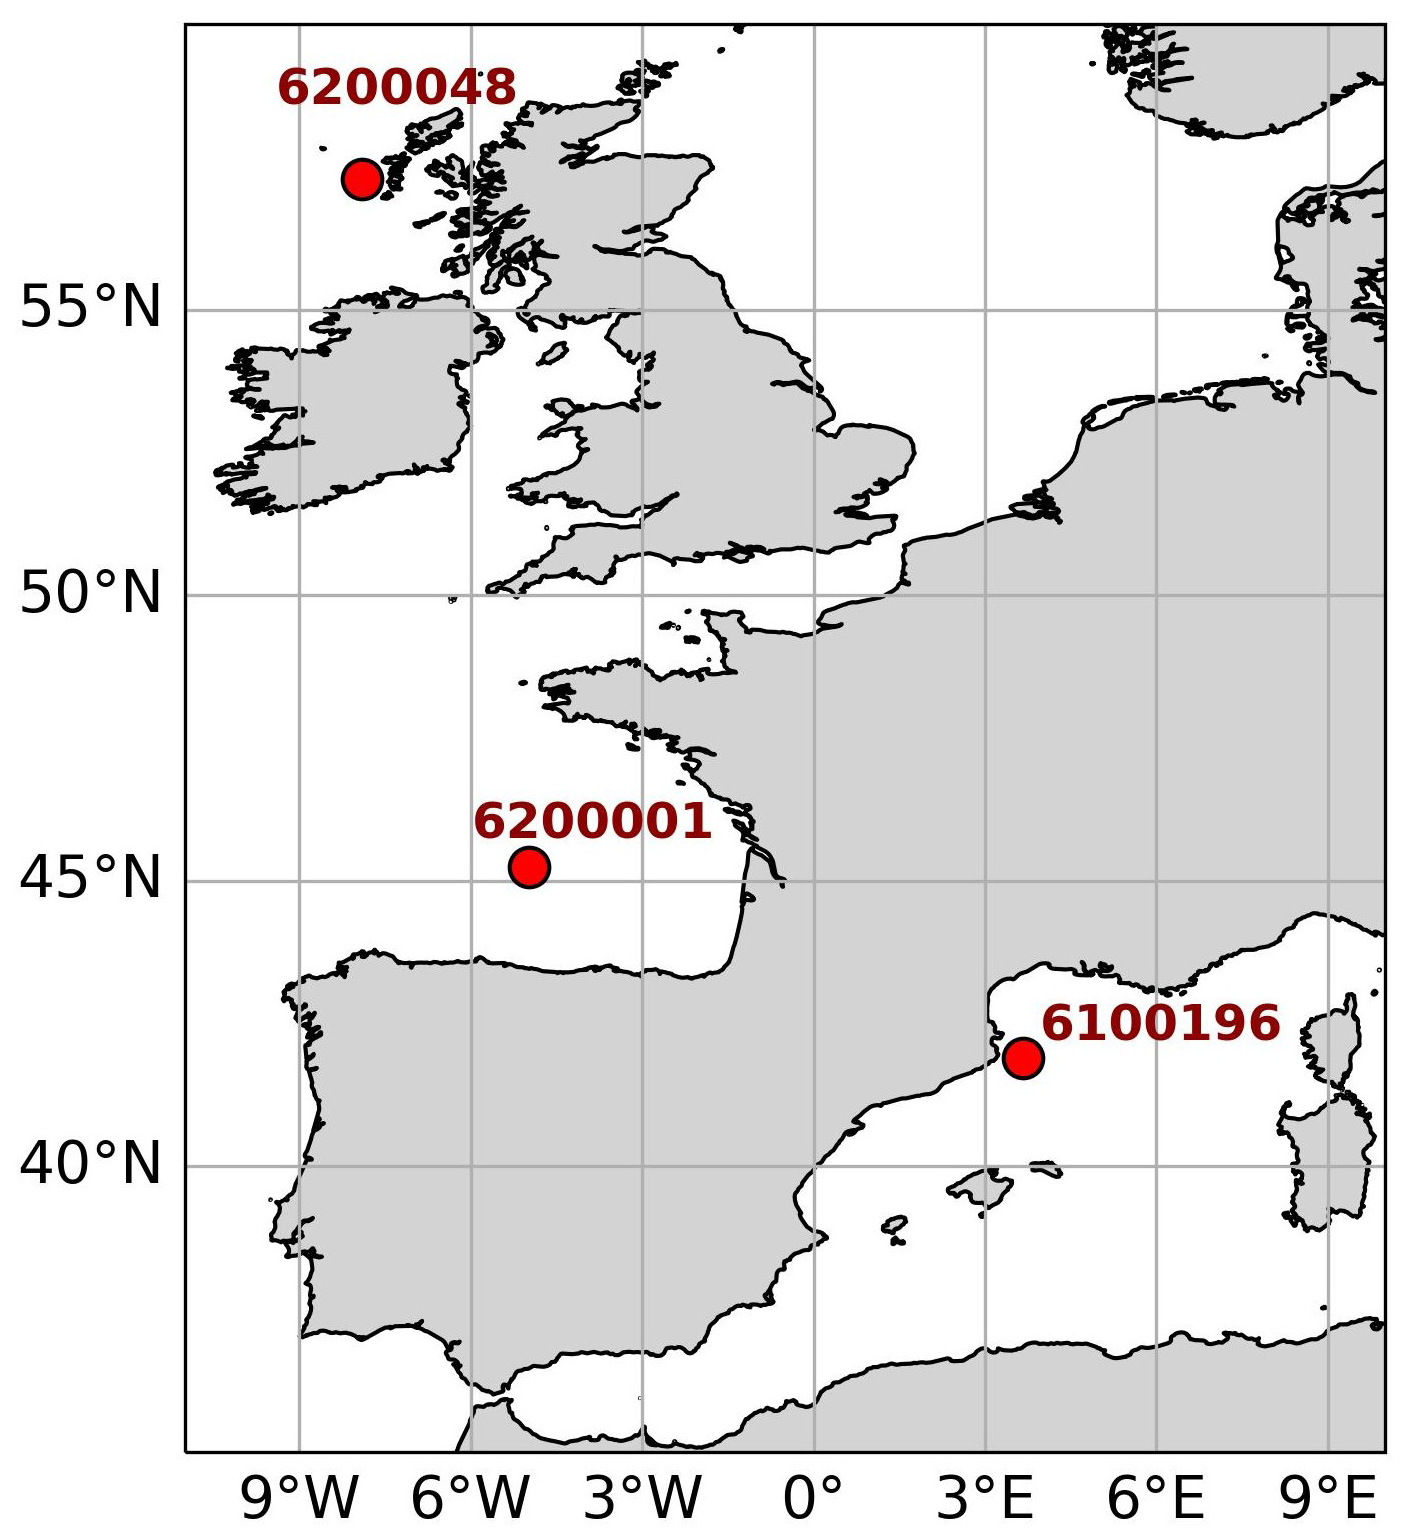
Figure 3Locations of wave buoys with data presented in Table 1.
Table 1Statistics from the collocation for Sentinel-3A/B and wave buoys. CC – correlation coefficient; S.I. – Scatter index.
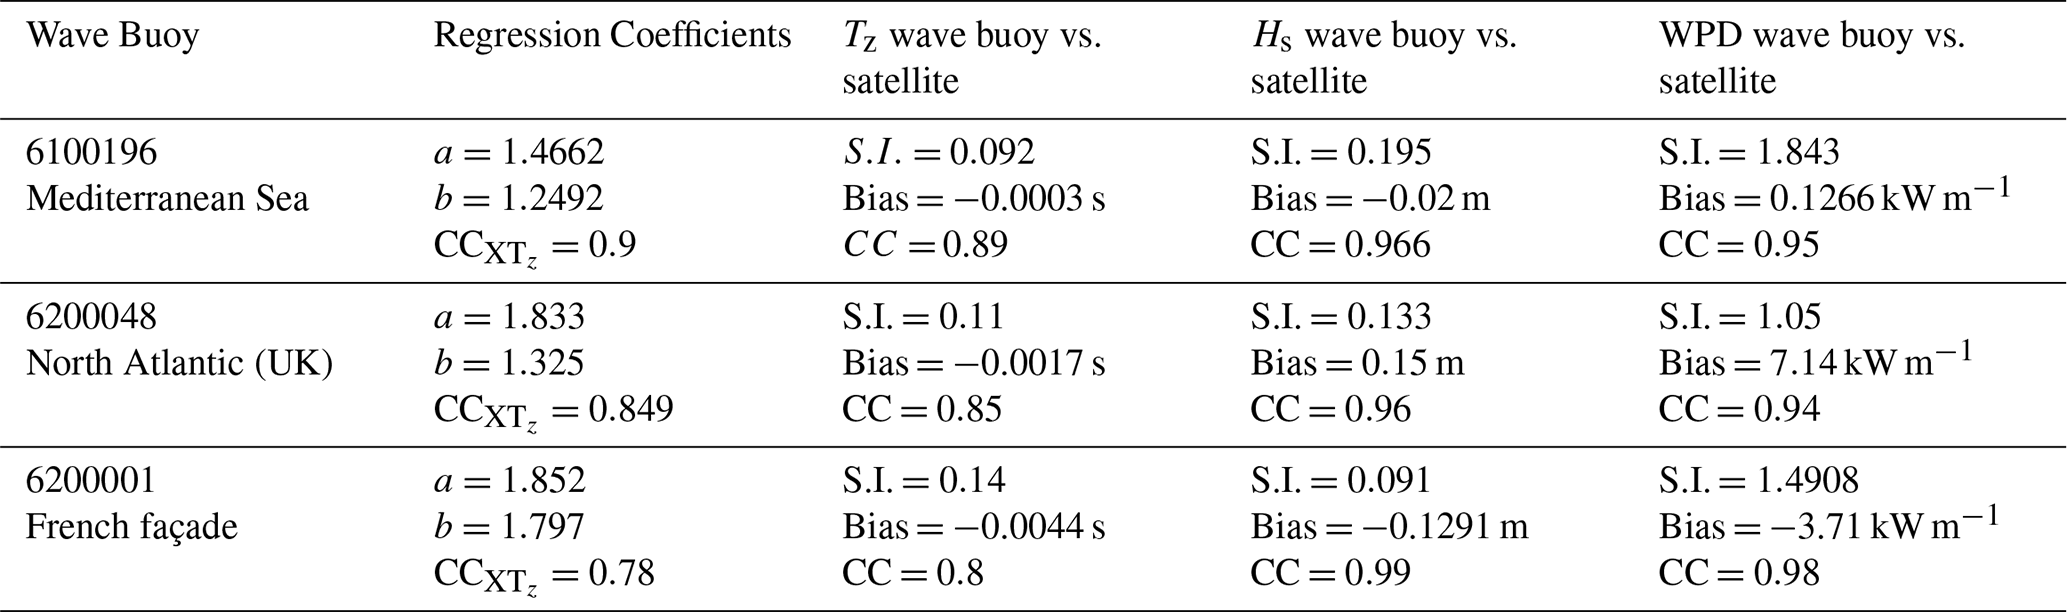
As shown in Table 1, for the North Atlantic locations, the correlation is good for the French façade wave buoy (0.8 for Tz, 0.99 for Hs, and 0.98 for WPD). For the wave buoy selected in the North of the UK (6200048), the correlation (using Sentinel-3A/B) is also high for the Tz (0.85), Hs (0.96), and the wave power density (0.94). For the location shown for the Mediterranean (61000196) in deep waters of the Gulf of Leon, using Sentinel-3A/B, the correlation for Tz is high (0.89), as are those for Hs (0.97) and WPD (0.95).
In Fig. 4 the example showing the comparison between buoy and altimeter wave period is presented for the buoys located in Atlantic and Mediterranean Sea. The root mean square error (RMSE) for Tz for buoy 61000196 located in Mediterranean Sea is 0.4 s, while for the buoy 6200048 located in North Atlantic RMSE is higher and reaches 0.79 s.
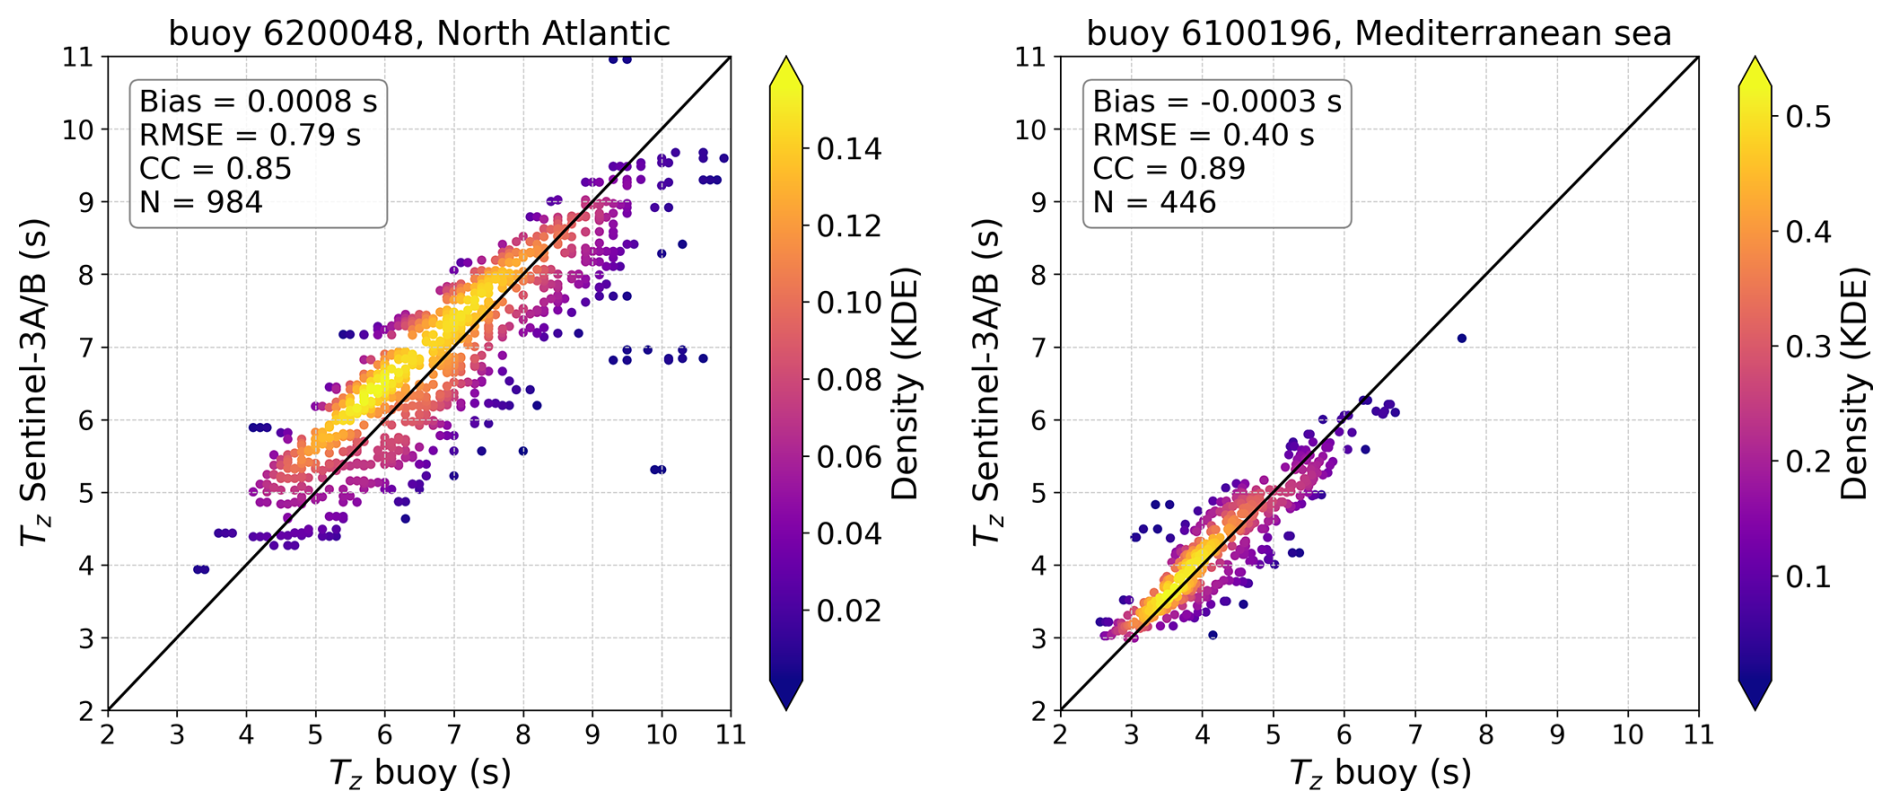
Figure 4Scatter plots of wave period for the wave buoys 6200048 and 6100196, respectively, from Sentinel-3 A/B and the wave buoy at an Atlantic location (left) and a Mediterranean location (right).
A site-by-site analysis shows that the agreement between satellite and buoy measurements varies with the local wave climate. Mediterranean locations, dominated by fetch-limited wind seas, generally show higher skill, particularly for Tz. In contrast, North Atlantic sites, more exposed to long-period swell and bimodal spectra, show slightly reduced performance in Tz, reflecting the empirical formulation's sensitivity to spectral shape. This spatial variability should be considered when using the dataset, especially in swell-dominated environments. This result highlights that the accuracy of satellite-derived wave period is not uniform and depends on sea-state conditions, with better performance in wind-sea-dominated environments than in swell-dominated regimes.
This behavior is consistent with the known limitation that the empirical relationship used to estimate Tz (Gommenginger et al., 2003) depends on the underlying spectral shape. In swell-dominated or multi-peaked conditions, the relationship between the altimeter-derived parameter X and Tz becomes less robust.
2.3.2 Intercomparison of CryoSat-2 and Sentinel-3A/B performance metrics
For both CryoSat-2 and Sentinel-3A/B (with Sentinel-3A and Sentinel-3B processed jointly), we estimated bias, scatter index, and correlation coefficient relative to buoy measurements. The results show good agreement for both missions. The example for buoys around the British Isles is presented. For significant wave height the results are shown in Fig. 5 and for zero-crossing wave period in Fig. 6. Although this is not a direct inter-mission comparison, according to all metrics it suggests that the measurements from the two missions are broadly consistent.
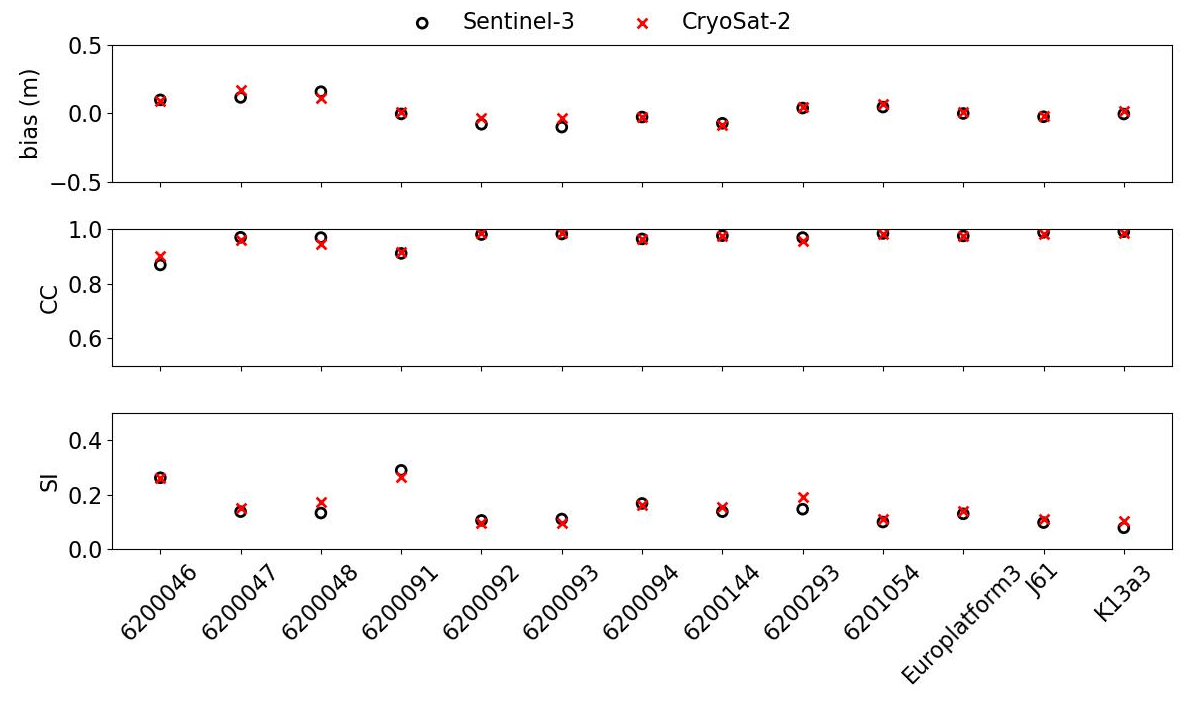
Figure 5Comparison of statistical metrics for Hs. Red crosses – CryoSat-2, circles – Sentinel-3A/B. Region: British Isles.
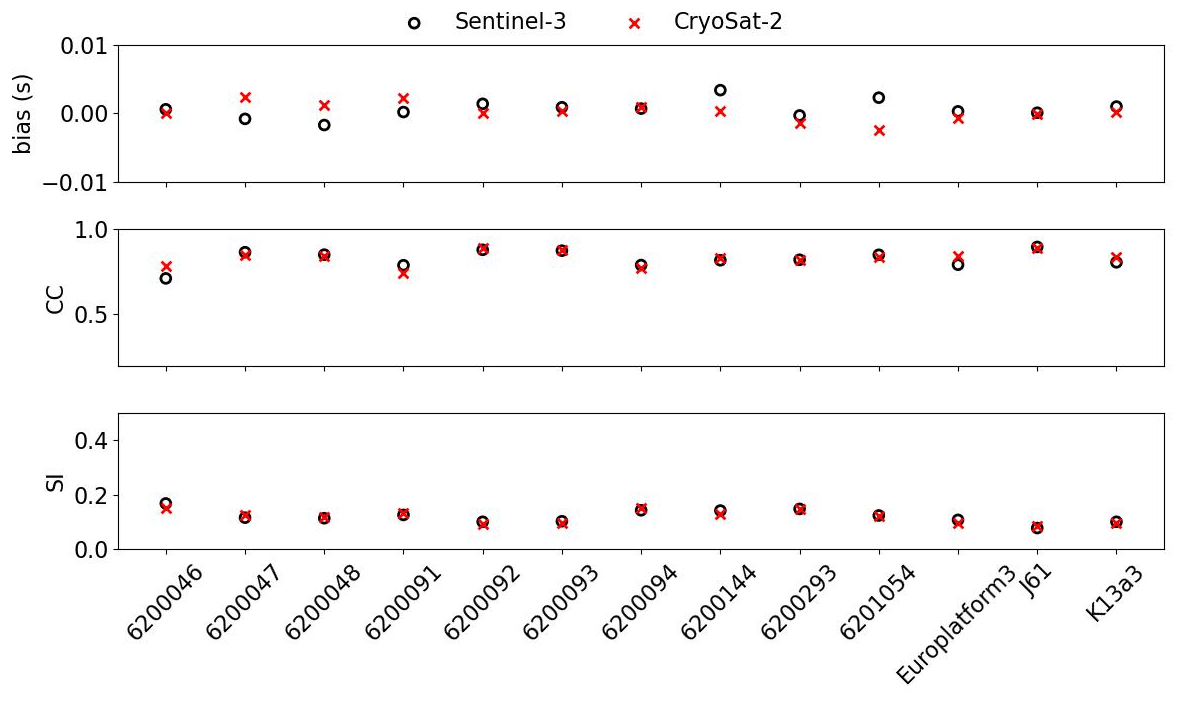
Figure 6Comparison of statistical metrics for Tz. Red crosses – CryoSat-2, circles – Sentinel-3A/B. Region: British Isles.
The dataset generated within the WAPOSAL project, as described above, contains the following variables along the altimeter tracks:
-
Temporal and spatial information. latitude, longitude, and observation time in seconds since 1 January 20:00 UTC for each antenna footprint;
-
The data transferred from the initial dataset used in the work from the ESA Altimetry Virtual Lab on EarthConsole®. significant wave height, normalized radar cross-section, distance to the coast, and a “misfit” between the power waveform model and the power waveform data;
-
The variables obtained within the WAPOSAL project: zero-crossing wave period, wave power density, quality flag. Quality flag identifies outliers as significant wave height or normalized radar cross section values exceeding the 99.87th percentile of their regional distributions.
The information about variables available in the WAPOSAL dataset is summarized in Table 2. CryoSat-2 data are available for 2011–2022 in Baltic & Norway, UK & North Sea, Spain Atlantic, Madeira, Azores Archipelago, French Polynesia, Portugal, Mediterranean Sea and and for 2011–2023 in the French façade only. Sentinel-3A data are available for the period 2016–2022, and Sentinel-3B for 2018–2022, for Baltic & Norway, UK & North Sea, Spain Atlantic, Madeira, Azores Archipelago, French Polynesia, Portugal, Mediterranean Sea, Canary Islands, and French Guiana. For the French façade region, Sentinel-3A and Sentinel-3B data are available for 2016–2023 and 2018–2023, respectively.
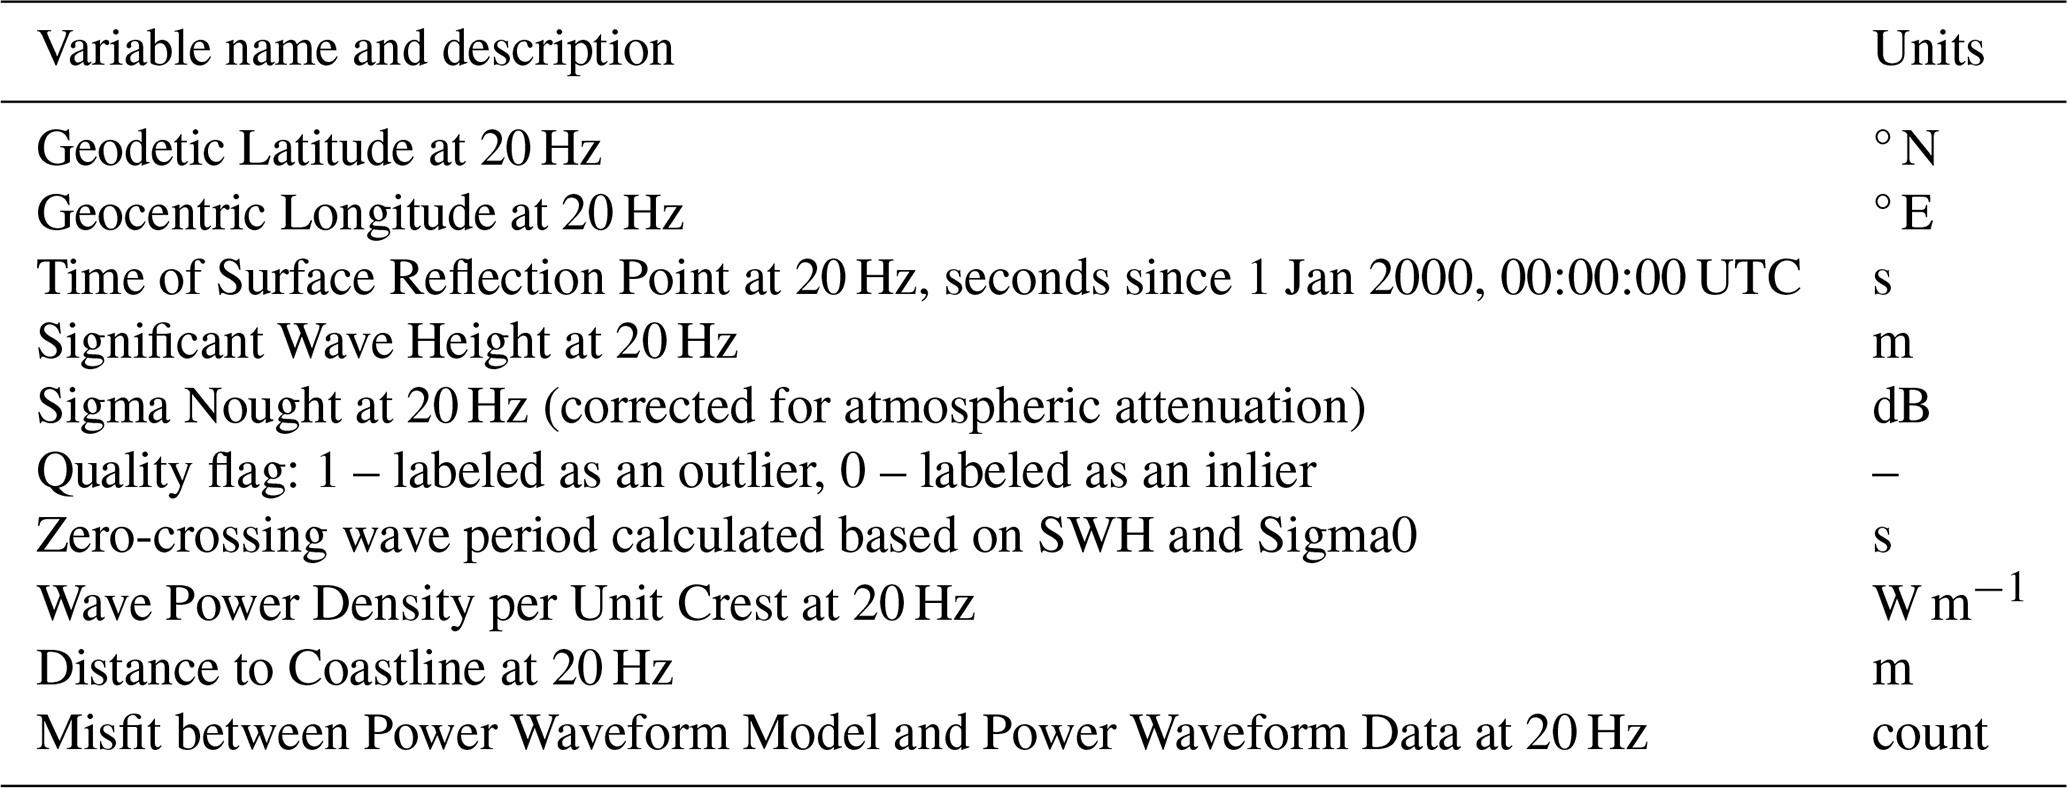
The bounding boxes in Fig. 1 represent the combined spatial extent of the Sentinel-3A/B and CryoSat-2 dataset. The coverage for each individual mission is not identical. For details, please consult the metadata for each region.
The dataset is published by ESA and hosted at the EarthCODE Data Repository platform as the ESA Open Science Catalogue WAPOSAL collection (https://opensciencedata.esa.int/products/waposal-waves/collection, last access: 19 September 2026). The dataset and its specifications can be found in the metadata description on the website.
The dataset is available in the repository in two formats. The first is a .zip file containing netCDF files, each with information for a separate track. It can be accessed via the “Access” option on the collection page. The second format is a set of data cubes containing along-track data for a particular mission – Sentinel-3A, Sentinel-3B, and CryoSat-2 – and a particular region. For example, the file “waposal-uk-cs2.zarr” includes the along-track data for CryoSat-2 for the region around the British Isles, while the files “waposal-uk-s3a.zarr” and “waposal-uk-s3b.zarr” correspond to the Sentinel-3A and Sentinel-3B satellites, respectively. An example of how to access .zarr files is given in the Appendix A.
The .zarr file for a particular region contains data for several tracks, organized as a data cube with dimensions M×N, where M is the number of tracks in the region and N is the length of the longest track. Tracks shorter than N are padded with NaN values.
The metadata contains information on the start and end times of the entire dataset and its spatial extent. The EarthCODE Data Engineering team has performed the data processing and transformation of the original dataset. The entire collection is licensed under https://spdx.org/licenses/CC-BY-SA-4.0.html (last access: 19 September 2026). The dataset in its current format and version can be discovered, shared and cited via the following link: https://doi.org/10.57780/ESA-1AB8CF3 (Ponce de León et al., 2026).
To illustrate applications of the wave power density data, first, the along-track average was calculated from Sentinel-3A/B data; second, the local time series of wave power density was derived from CryoSat-2 data.
4.1 Along-track average wave power density
Each Sentinel-3 satellite has a 27 d repeat cycle, which allows us to estimate the along-track average wave power density. It is assumed that the location of the track is repeated; however, there is a small displacement in satellite movement. Let us call the planned location of the repeated altimeter track the “trajectory”. First, the tracks belonging to the same trajectory are grouped. In each group of tracks, one reference track is selected. The coordinates of the altimeter resolution elements for this track are used as the coordinates for the resulting average wave power density. The data from the other tracks in the group are resampled to the coordinates of the reference track, and the average wave power density is then calculated.
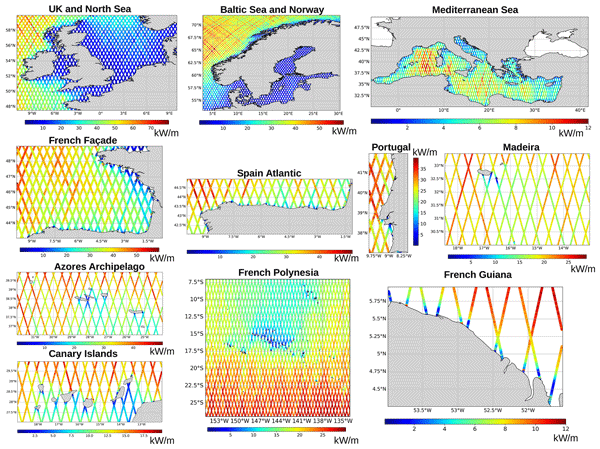
The along-track mean wave power density derived from Sentinel-3A/B data is presented in Fig. 7 for the 11 study regions. While these data can be further processed through interpolation, binning, or smoothing, the original along-track product preserves the intrinsic high spatial resolution of the measurements. This high-resolution information is particularly valuable in coastal zones, where wave conditions exhibit strong spatial variability and may not be adequately captured by gridded products.
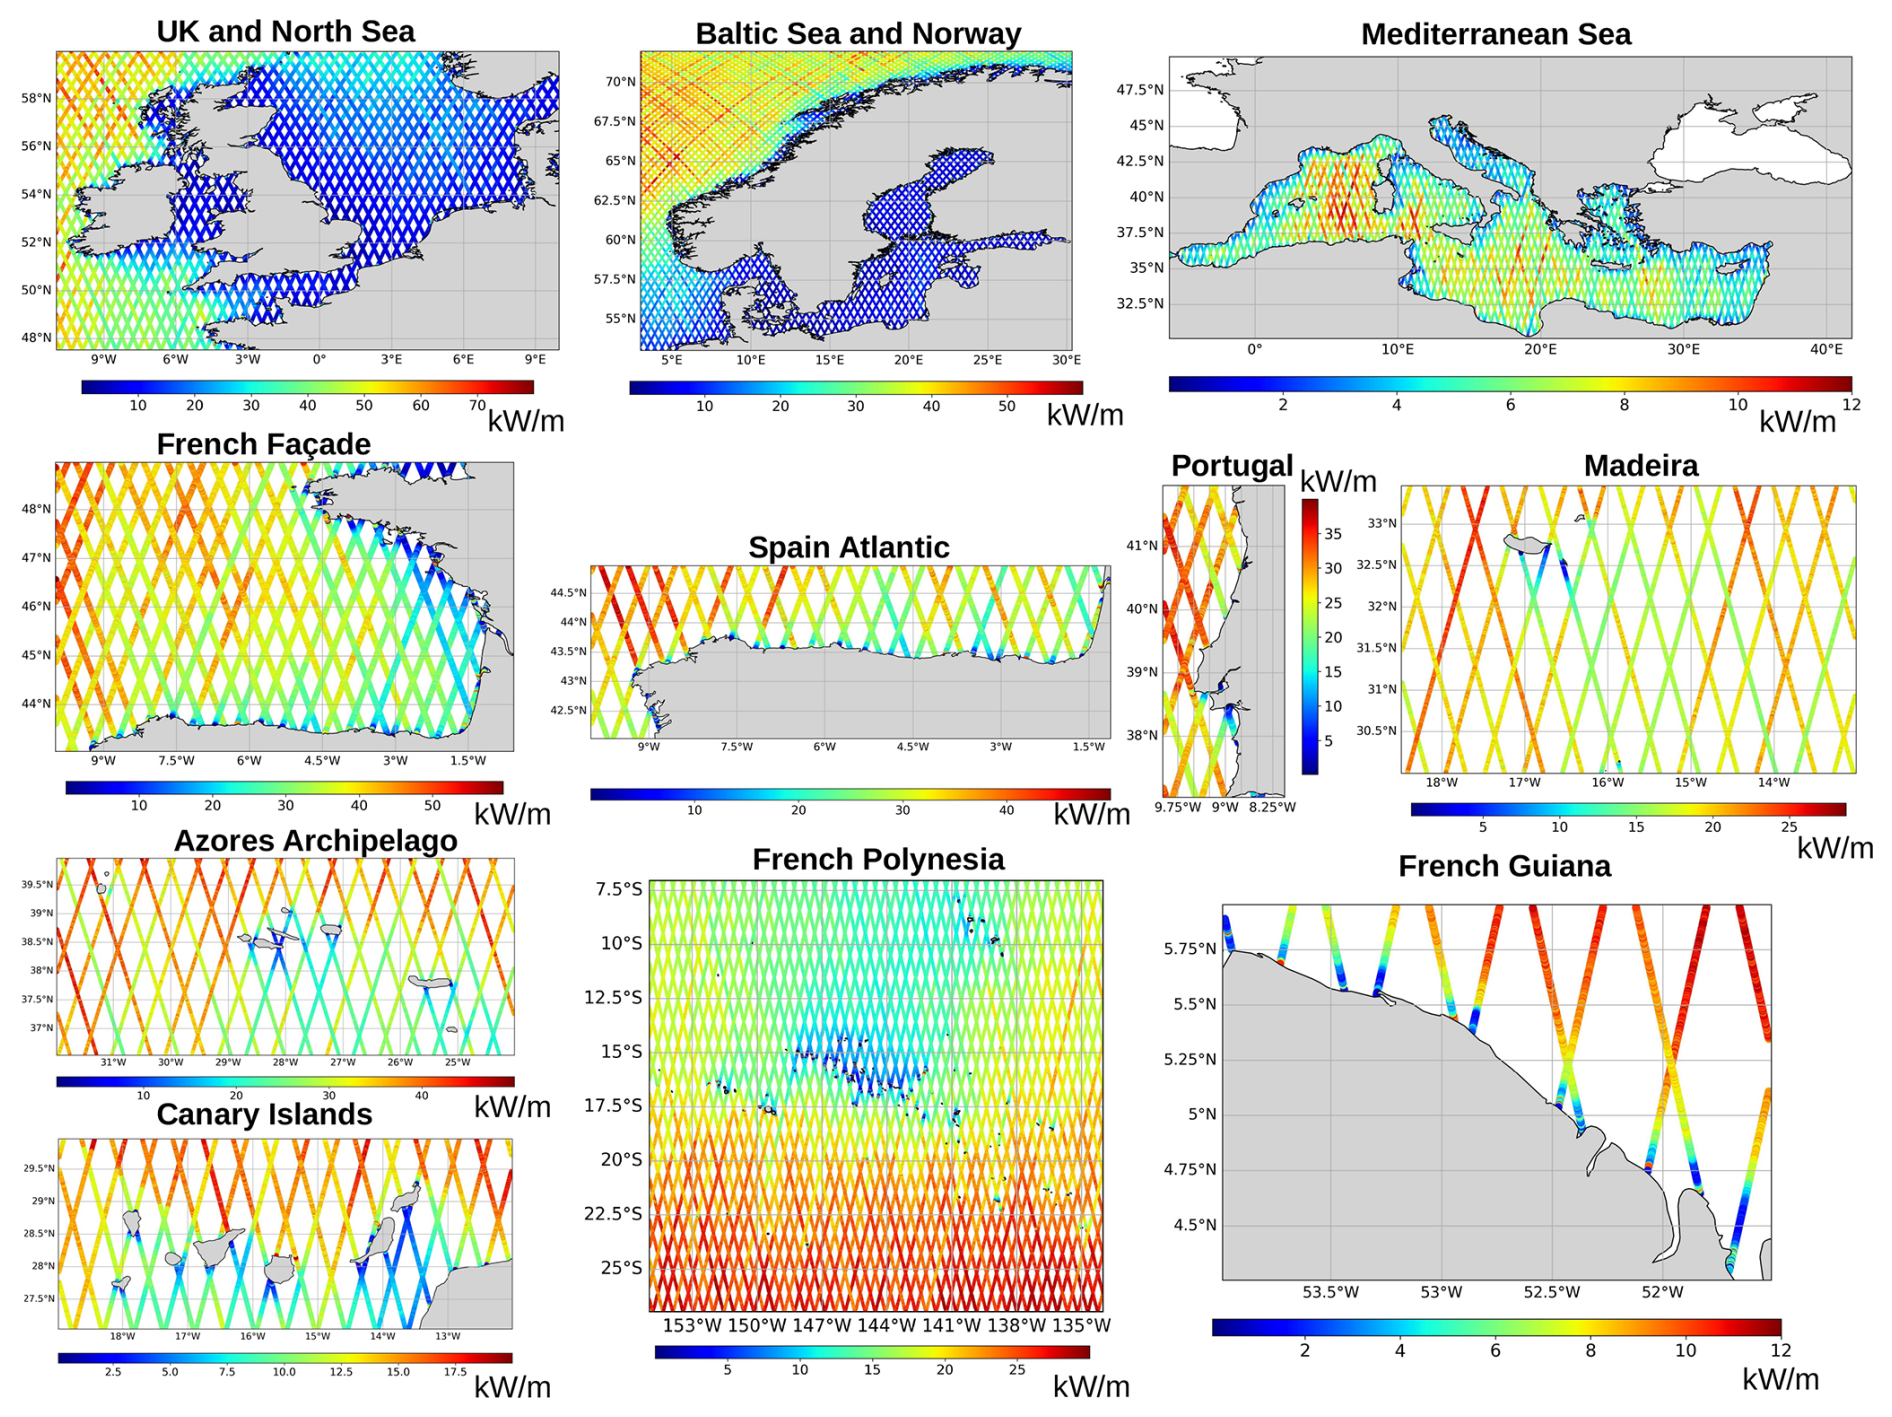
Figure 7Along-track mean wave power density for 11 regions, derived from Sentinel-3A/B altimeter measurements and averaged over the available Sentinel-3A/B record between 2016 and 2023.
4.2 Wave power density time series locally
Based on the obtained dataset, the time series for the selected locations can be studied. Around the selected location, the altimeter data are collected within the circle with the radius of 40 km, cleared of outliers and averaged. As an example, we present the time series for the location situated offshore of São Miguel Island in the Azores archipelago. The time series for this location, derived from 11 years of CryoSat-2 data and 7 years of Sentinel-3A/B data, are shown in Fig. 8. For comparison, the time series for the same location is also presented using ERA5 data. Wave power density derived from CryoSat-2 was compared with ERA5 reanalysis data, yielding a bias of 3.5 kW m−1 and an RMSE of 9.9 kW m−1. For Sentinel-3A/B, the corresponding bias was also 3.5 kW m−1, while the RMSE was slightly lower, at 9.7 kW m−1. These results indicate good agreement between the satellite-derived and ERA5 wave power density estimates.
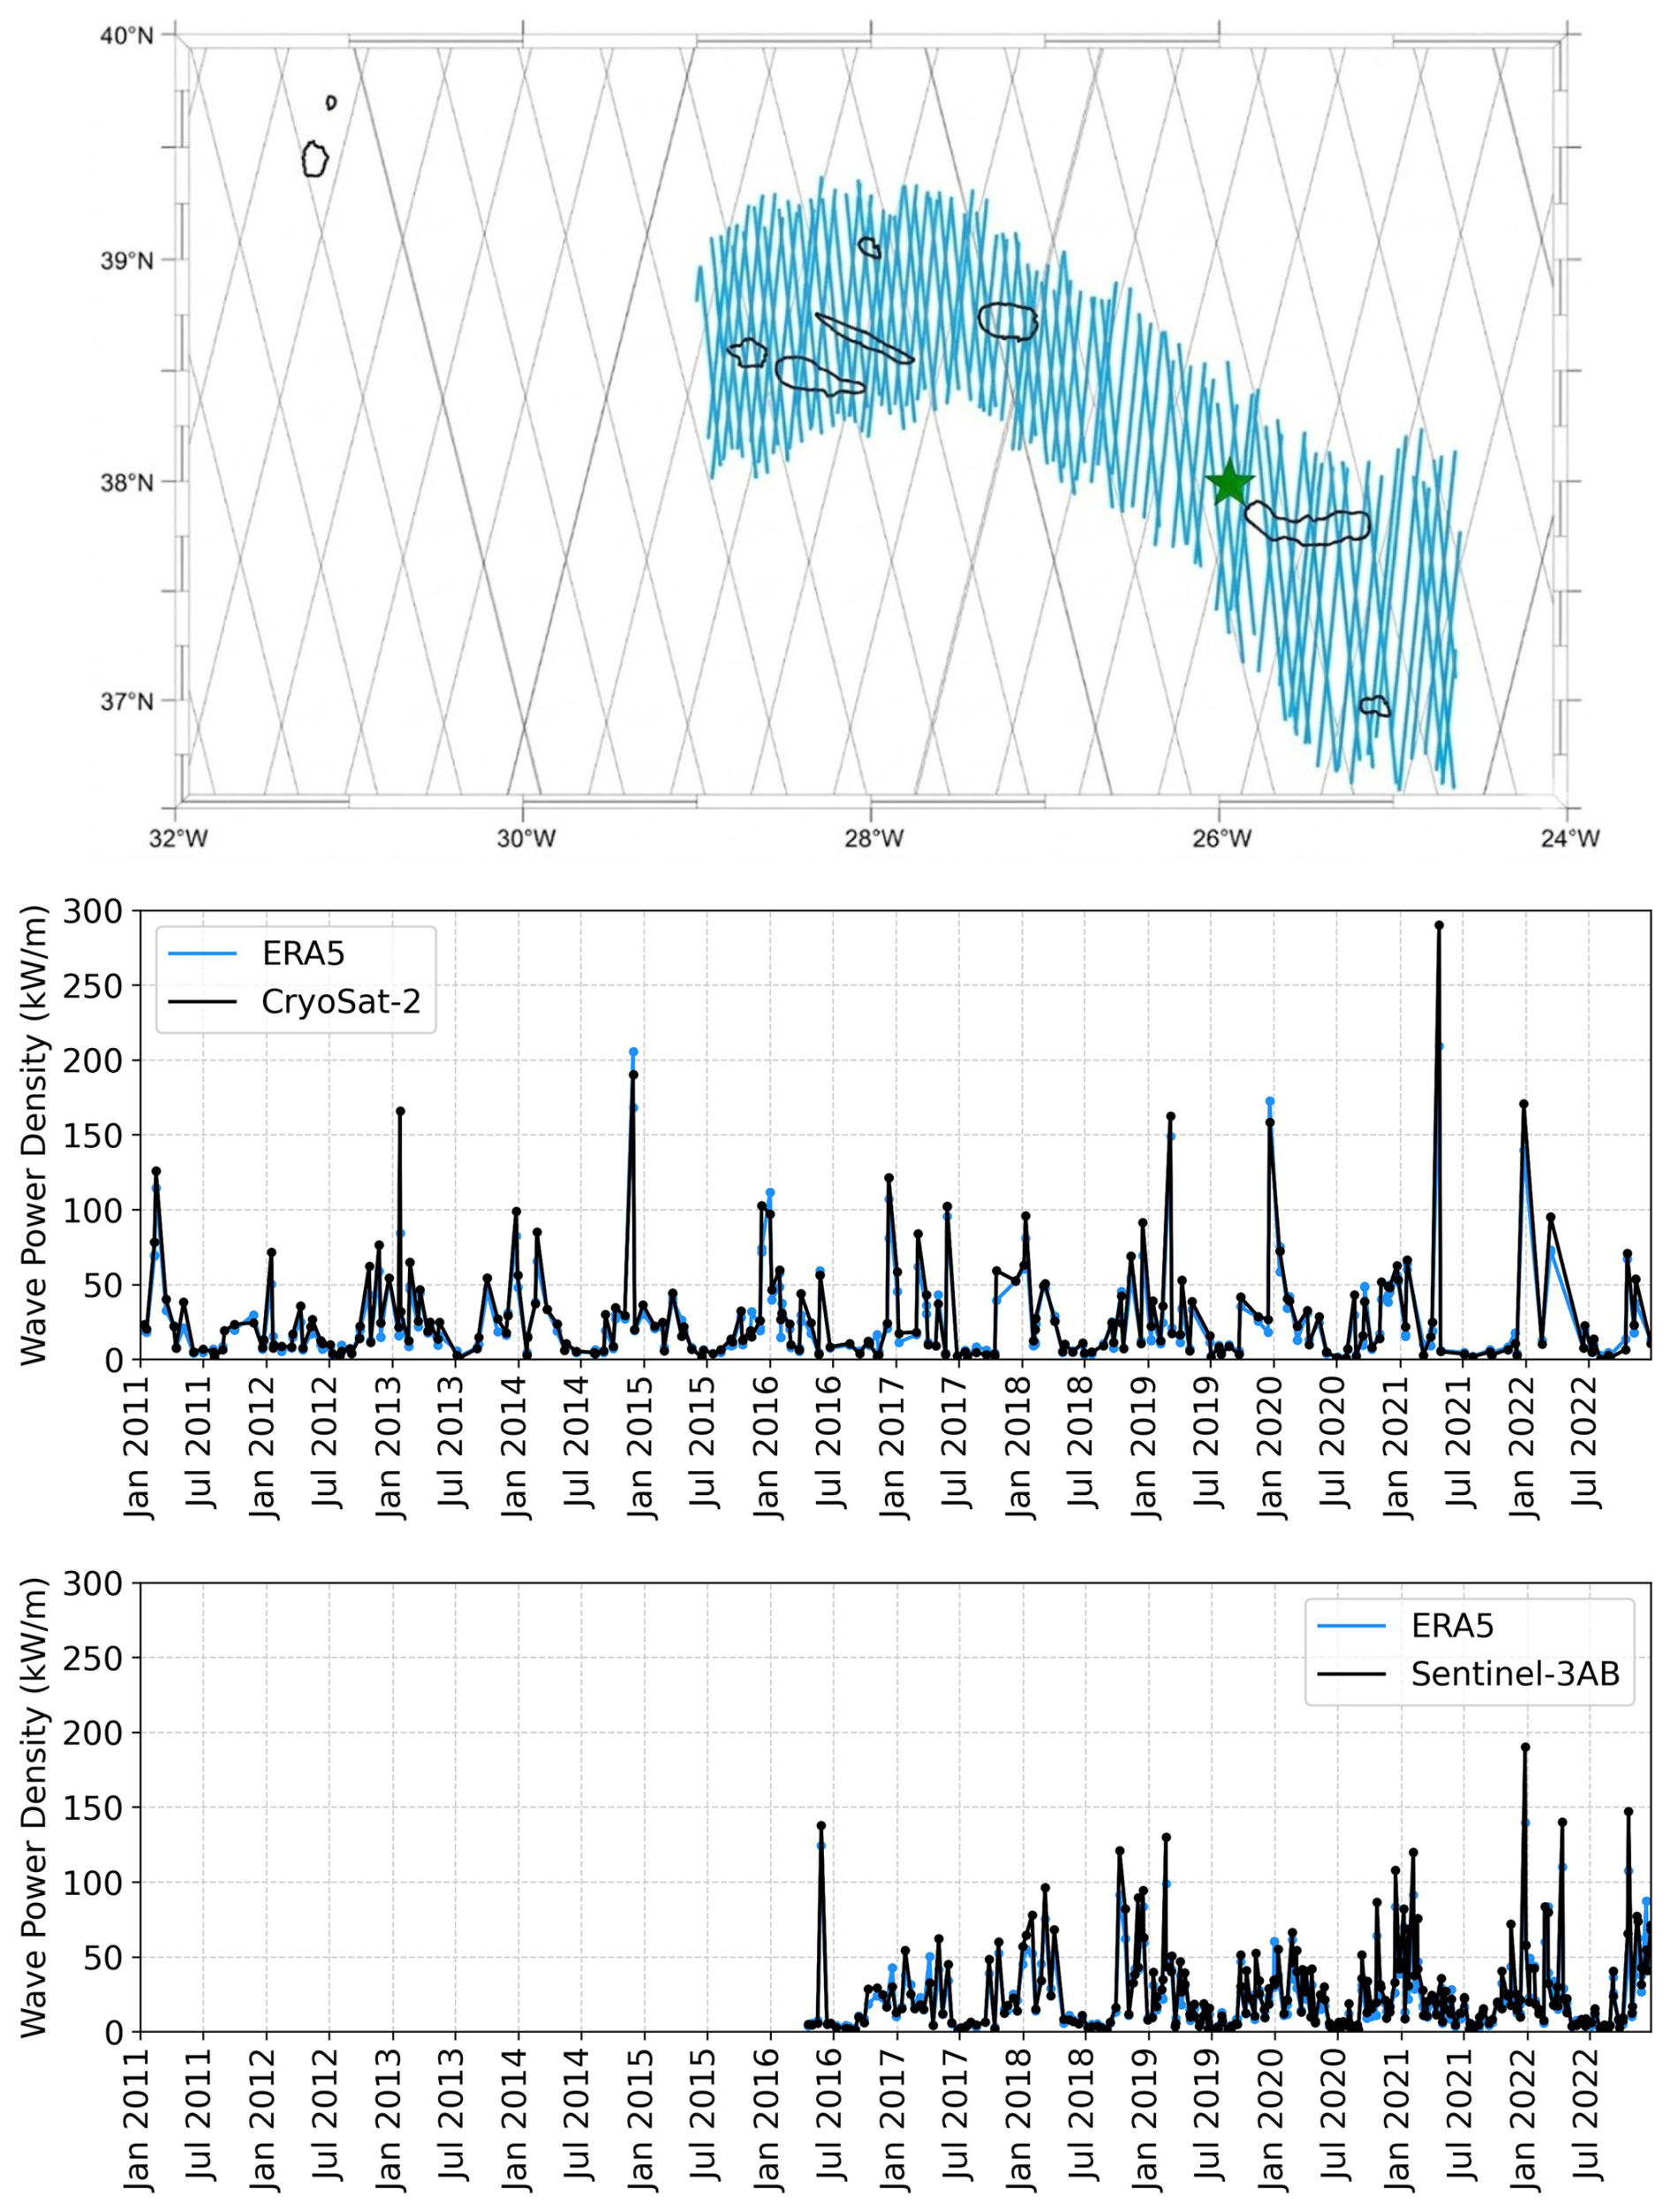
Figure 8CryoSat-2 (blue) and Sentinel-3A/B (black) tracks in the Azores region for 2020 (top). The time series location marked by an asterisk (top); comparison of the wave power density time series from ERA5 and CryoSat-2 (middle) and comparison of the wave power density-derived time series from ERA5 and Sentinel-3A/B (bottom).
Seasonal variability in CryoSat-2 and Sentinel-3A/B is similar; however, due to differences in temporal sampling between the two missions, some intense wave events may be captured by one mission while being missed by the other. For the 2016–2022 period, data from the two missions complement each other and provide a more complete time series.
Both altimeter and ERA5 datasets exhibit pronounced seasonal variability, with elevated WPD values during winter and reduced energy levels during summer months, reflecting the dominant influence of North Atlantic swell and winter storm activity in the region. The satellite-derived WPD closely follows the ERA5 observations.
Other potential uses of the present dataset include seasonal variability analysis for the selected locations, as well as correlation analysis with other geophysical parameters. The present dataset is a valuable source of information for validating numerical wave model results.
The dataset is published by the European Space Agency (ESA) and hosted on the EarthCODE Data Repository platform as the WAPOSAL collection in the ESA Open Science Catalogue, available at https://opensciencedata.esa.int/products/waposal-waves/collection (last access: 29 September 2026). The dataset in its current format and version can be discovered, shared and cited via the following link: https://doi.org/10.57780/ESA-1AB8CF3 (Ponce de León et al., 2026).
This study presents the WAPOSAL wave dataset, a high-resolution, multi-region collection of significant wave height, wave period, and wave power density derived from SAR altimetry observations from the Sentinel-3A/B and CryoSat-2 missions across 11 regions in continental coastal zones and around archipelagos. Significant wave height was derived using the SAMOSA+ retracking algorithm. The zero-crossing wave period was estimated using an empirical method calibrated with in situ buoy and ERA5 reanalysis data.
Comprehensive validation against in situ buoy measurements and ERA5 reanalysis data shows strong agreement for both significant wave height and zero-crossing wave period, supporting the methodology's robustness and the reliability of the derived wave power density estimates. The high along-track spatial resolution (300 m) and extended temporal coverage enable detailed analyses of coastal and nearshore wave energy resources.
The dataset is openly available in standardized formats on the ESA EarthCODE repository, enabling integration across a wide range of applications. By providing a validated, satellite-based wave power dataset, the WAPOSAL collection supports the Earth system science and marine renewable energy communities in sustainable ocean management and energy planning.
Zarr is a cloud-optimized format for multidimensional scientific data, that can eliminate the need for manual download of individual data files. It allows users to use a Zarr reader to a root Zarr store and specify analysis parameters so that only the data for the targeted region or time frame is automatically retrieved in an efficient manner. The URLs to the .zarr files are available by clicking “copy URL”.
As an example, the dataset can be accessed and loaded in Python using the following code:

Listing A1Example of the code snippet for data assess in Python.
Using GDAL command-line tools:

Listing A2Example of the code snippet for data assess using GDAL command-line tools.
SPL: Methodology, Software, Supervision, Resources, Lead of the WAPOSAL project, Writing – review and editing. MP: Data curation, Software, Validation, Visualization, Writing – original draft. AO: Data curation, Software, Validation, Visualization, Writing – original draft. MR: Supervision, Writing – review and editing. RS: Supervision, Writing – review and editing. JB: Supervision, Writing – review and editing.
The contact author has declared that none of the authors has any competing interests.
Publisher's note: Copernicus Publications remains neutral with regard to jurisdictional claims made in the text, published maps, institutional affiliations, or any other geographical representation in this paper. The authors bear the ultimate responsibility for providing appropriate place names. Views expressed in the text are those of the authors and do not necessarily reflect the views of the publisher.
We are indebted to Giancarlo Rivolta and his team at EarthConsole (Progressive Systems Srl, 00044 Frascati – Rome, Italy – https://progressivesystems.it, last access: 19 September 2026) for creating the OCRE EO database and for their assistance in preparing the manuscript. We are also very grateful to Krasen Samardzhev and Ewelina Dobrowolska for organizing the WAPOSAL collection at the EarthCode repository and for their contribution to the data description. The WAPOSAL team is very grateful to ESA. Sonia Ponce de León is currently supported by the European Maritime, Fisheries and Aquaculture Fund (EMFAF) and the “Severo Ochoa Center of Excellence” (CEX2024-001494-S, funded by AEI) and the MITCAT project (CSIC-PIE-202330E10).
This research was funded by the European Space Agency (ESA) Open Call (FUTURE EO-1 SEGMENT OPEN CALL FOR PROPOSAL FOR EO INNOVATION) contract, ESA Co. 4000144113/24/I-DT-bgh, awarded to Dr. Sonia Ponce de León, the PI (https://eo4society.esa.int/projects/waposal/, last access: 19 September 2026).
This paper was edited by Davide Bonaldo and reviewed by Danièle Hauser and two anonymous referees.
Anusree, A. and Kumar, V. S.: Mean wave direction and wave height in the ERA5 reanalysis dataset: Comparison with measured data in the coastal waters of India, Dynam. Atmos. Oceans, 107, 101478, https://doi.org/10.1016/j.dynatmoce.2024.101478, 2024. a
Besio, G., Mentaschi, L., and Mazzino, A.: Wave energy resource assessment in the Mediterranean Sea on the basis of a 35-year hindcast, Energy, 94, 50–63, https://doi.org/10.1016/j.energy.2015.10.044, 2016. a
Bessonova, V., Tapoglou, E., Dorrell, R., Dethlefs, N., and York, K.: Global evaluation of wave data reanalysis: Comparison of the ERA5 dataset to buoy observations, Appl. Ocean Res., 157, 104490, https://doi.org/10.1016/j.apor.2025.104490, 2025. a
Booij, N., Ris, R. C., and Holthuijsen, L. H.: A third-generation wave model for coastal regions: SWAN, J. Geophys. Res.-Oceans, 104, 7649–7666, https://doi.org/10.1029/98JC02622, 1999. a
Cahill, B. and Lewis, T.: Wave period ratios and the calculation of wave power, in: Proceedings of the 2nd Marine Energy Technology Symposium (METS2014), Seattle, WA, USA, 15–18 April 2014, Ocean Renewable Energy Coalition, Gaithersburg, MD, USA, 10 pp., http://hdl.handle.net/10919/49206 (last access: 19 September 2026), 2014. a, b
Dinardo, S., Fenoglio-Marc, L., Buchhaupt, C., Becker, M., Scharroo, R., Fernandes, M. J., and Benveniste, J.: Coastal SAR and PLRM altimetry in German Bight and West Baltic Sea, Adv. Space Res., 62, 1371–1404, https://doi.org/10.1016/j.asr.2017.12.018, 2018. a, b
Dong, C., Huang, G., Cheng, G., Cai, Y., and Chen, C.: Macroscale altimetry-based estimation and analyses of wave power: A foundation of wave energy development over Canada, Renew. Sust. Energ. Rev., 183, 113469, https://doi.org/10.1016/j.rser.2023.113469, 2023. a
Dunnett, D. and Wallace, J. S.: Electricity generation from wave power in Canada, Renew. Energ., 34, 179–195, https://doi.org/10.1016/j.renene.2008.04.034, 2009. a
Fanti, V., Ferreira, Ó., Kümmerer, V., and Loureiro, C.: Improved estimates of extreme wave conditions in coastal areas from calibrated global reanalyses, Communications Earth & Environment, 4, 151, https://doi.org/10.1038/s43247-023-00819-0, 2023. a, b
Gommenginger, C. P., Srokosz, M. A., Challenor, P. G., and Cotton, P. D.: Measuring ocean wave period with satellite altimeters: A simple empirical model, Geophys. Res. Lett., 30, https://doi.org/10.1029/2003GL017743, 2003. a, b, c, d, e, f, g
Görmüş, T., Aydoğan, B., and Ayat, B.: Analysis of hybrid exploitation of wind and wave power in the Mediterranean and the Black Sea, Energ. Convers. Manage., 299, 117820, https://doi.org/10.1016/j.enconman.2023.117820, 2024. a
Gu, H., Chen, Y., and Yang, B.: A spherical triboelectric nanogenerator for omnidirectional wave energy harvesting utilizing gravity, J. Phys. Conf. Ser., 2932, 012038, https://doi.org/10.1088/1742-6596/2932/1/012038, 2025. a
Kasiulis, E., Punys, P., and Kofoed, J. P.: Assessment of theoretical near-shore wave power potential along the Lithuanian coast of the Baltic Sea, Renew. Sust. Energ. Rev., 41, 134–142, https://doi.org/10.1016/j.rser.2014.08.044, 2015. a
O’Connell, R., Kamidelivand, M., Furlong, R., Guerrini, M., Cullinane, M., and Murphy, J.: An advanced geospatial assessment of the levelised cost of energy (LCOE) for wave farms in Irish and western UK waters, Renew. Energ., 221, 119864, https://doi.org/10.1016/j.renene.2023.119864, 2024. a
Orejarena-Rondón, A. F., Panfilova, M., Ponce de León, S., Restano, M., Sabia, R., and Benveniste, J.: High-resolution mapping of wave energy resources in the Mediterranean Sea using satellite altimetry, Energy Reports, 15, 109133, https://doi.org/10.1016/j.egyr.2026.109133, 2026. a, b, c
Orlov, A. V.: Transition to a green economy through the development of renewable energy in the European Union, WSEAS Trans. Environ. Dev., 20, 1072–1084, https://doi.org/10.37394/232015.2024.20.98, 2024. a
Ponce de León, S., Restano, M., and Benveniste, J.: Assessment of wave power density using Sea State Climate Change Initiative database in the French façade, Journal of Marine Science and Engineering, 11, 1970, https://doi.org/10.3390/jmse11101970, 2023. a
Ponce de León, S., Restano, M., and Benveniste, J.: Assessing the wave power density in the Atlantic French façade from high-resolution CryoSat-2 SAR altimetry data, Energy, 302, 131712, https://doi.org/10.1016/j.energy.2024.131712, 2024a. a
Ponce de León, S., Bettencourt, J. H., Ringwood, J. V., and Benveniste, J.: Assessment of combined wind and wave energy in European coastal waters using satellite altimetry, Appl. Ocean Res., 2024, https://doi.org/10.1016/j.apor.2024.104184, 2024b. a
Ponce de León, S., Panfilova, M., and Orejarena-Rondón, A.: High-resolution WAPOSAL wave period and wave power density from Sentinel-3A/B, CryoSat-2, and SAMOSA+ retracker, European Space Agency [data set], https://doi.org/10.57780/ESA-1AB8CF3, 2026. a, b, c
Tolman, H. L.: User manual and system documentation of WAVEWATCH III version 3.14, NOAA/NWS/NCEP/MMAB Technical Note 276, 194 pp., https://polar.ncep.noaa.gov/mmab/papers/tn276/MMAB_276.pdf (last access: 19 September 2026), 2009. a
Vázquez, R., Gutiérrez, C., Ponce de León, S., Nieto-Borge, J. C., Sein, D. V., and Cabos, W.: Climate change impact in offshore energy resources along the Spanish coasts based on a high-resolution regionally coupled model, Renew. Energ., 249, 123202, https://doi.org/10.1016/j.renene.2025.123202, 2025. a
Vicinanza, D., Contestabile, P., and Ferrante, V.: Wave energy potential in the north-west of Sardinia (Italy), Renew. Energ., 50, 506–521, https://doi.org/10.1016/j.renene.2012.07.015, 2013.
Vignudelli, S., Scozzari, A., Abileah, R., Gómez-Enri, J., Benveniste, J., and Cipollini, P.: Water surface elevation in coastal and inland waters using satellite radar altimetry, in: Extreme Hydroclimatic Events and Multivariate Hazards in a Changing Climate, Elsevier, 83–126, https://doi.org/10.1016/B978-0-12-814899-0.00004-3, 2019. a
WAMDI Group: The WAM model – A third-generation ocean wave prediction model, J. Phys. Oceanogr., 18, 1775–1810, https://doi.org/10.1175/1520-0485(1988)018<1775:TWMTGO>2.0.CO;2, 1988. a