the Creative Commons Attribution 4.0 License.
the Creative Commons Attribution 4.0 License.
 | 06 Oct 2026
A global consistent database of plankton and detritus from in situ imaging by the Underwater Vision Profiler 5
Ariadna C. Nocera

Marcel Babin
Tristan Biard
Julie Coustenoble
François Carlotti
Laurent Coppola
Lucas Courchet
Laetitia Drago
Amanda Elineau
Lionel Guidi
Helena Hauss
Laëtitia Jalabert
Lee Karp-Boss
Rainer Kiko
Manon Laget
Fabien Lombard
Andrew McDonnell
Camille Merland
Solène Motreuil
Thelma Panaïotis
Marc Picheral
Andreas Rogge
Anya Waite
Jean-Olivier Irisson
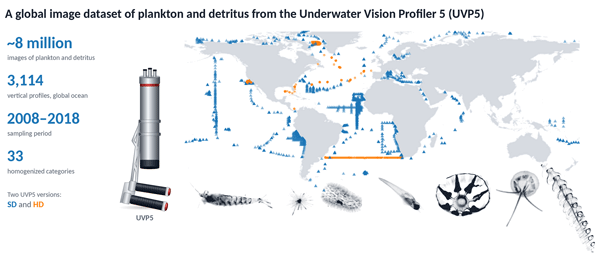
Plankton and detritus are essential components of the Earth's oceans influencing biogeochemical cycles and carbon sequestration. Climate change impacts their composition and fluxes, and marine ecosystems as a whole. To improve our understanding of these changes, standardized observation methods and integrated global datasets are needed to enhance the accuracy of ecological and climate models. Here, we present a global dataset for plankton and detritus obtained by two versions (SD and HD) of the Underwater Vision Profiler 5 (UVP5). This release contains the images classified in 33 homogenized categories, as well as the metadata associated with them, reaching 3114 profiles and ca. 8 million objects acquired between 2008–2018 at global scale. The geographical distribution of the dataset is unbalanced, with the Equatorial region (30° S–30° N) being the most represented, followed by the high latitudes in the northern hemisphere and lastly the high latitudes in the Southern Hemisphere. Detritus is the most abundant category in terms of concentration (90 %) and biovolume (95 %), although its classification in different morphotypes is still not well established. Copepoda was the most abundant planktonic taxon, followed by Trichodesmium colonies. The two versions of UVP5 have different imagers, resulting in a different effective size range to analyze plankton and detritus from the images (HD objects > 600 µm, SD objects > 1 mm) and morphological properties (grey levels, etc.); however, both systems capture comparable qualitative patterns in object morphology and relative abundance across size classes, even though the absolute ranges differ. Therefore, recommendations are provided for the appropriate use of this data when conducting studies. A large number of images of plankton and detritus will be collected in the future by the UVP5, and the public availability of this dataset will help it being utilized as a training set for machine learning and being improved by the scientific community. This will reduce uncertainty by identifying previously unclassified objects and expand the classification categories, ultimately enhancing biodiversity quantification. The dataset that constitutes this first release is available on SEANOE at https://doi.org/10.17882/107583 (Nocera et al., 2025).
- Article
(2342 KB) - Full-text XML
- BibTeX
- EndNote


Plankton and particulate matter play a crucial role in natural biogeochemical cycles and provide essential ecosystem services, including carbon sequestration, nutrient cycling, and primary food source for various marine organisms (Turner, 2015; Boyd et al., 2019; Stemmann and Boss, 2012; Steinberg and Landry, 2017). These components of the marine environment are significantly influenced by climate change, which alters ocean temperature, acidity, oxygenation, and circulation patterns (Doney et al., 2012; Constable et al., 2014). Such changes may, in turn, impact plankton composition by affecting their growth and survival (Hays et al., 2005; Dam and Baumann, 2017; Yebra et al., 2022), which will impact the production and composition of their solid waste, hereafter referred as detritus, with potential consequences for elemental biogeochemical cycles and deep-sea ecosystems (Du Pontavice et al., 2020).
The size range of plankton and detritus spans from pico- to macro-sizes, influencing the methods required for their observation. Collection methods include, for example, water sampling and microscopy for the smallest size classes, net tows and sediment traps for larger particles, while observation and analysis rely on complementary technologies such as optical imaging systems and remote sensing, depending on the targeted size range (Karsenti et al., 2011; Davis et al., 2005; Stemmann et al., 2008; Möller et al., 2012; Siegel et al., 2025). Consequently, obtaining homogeneous global datasets remains difficult notably if different instruments that measure various properties are used (Moriarty and O'Brien, 2013). Many planktonic organisms and detritus are fragile and their abundances decrease with their size, making their collection and analysis challenging (Stemmann et al., 2008; Soviadan et al., 2024; Atherden et al., 2024). Furthermore, plankton exhibits a patchy distribution in the ocean due to physical, chemical, and biological processes (Suthers et al., 2019). These constraints demand increased sampling efforts and the development of standardized methodologies to enhance comparability of global plankton and detritus observations. Addressing these challenges is critical for improving our understanding of oceanic carbon cycling and ecosystem responses to environmental change.
Predicting the future state of plankton biodiversity and/or biomass with habitat or biogeochemical models is difficult and requires data obtained synoptically and regularly. Deep collection by net tows followed by taxonomic identification with microscopes provides accurate biodiversity data, though this sampling method damages fragile organisms and requires dedicated ship time (Calbet, 2024; Soviadan et al., 2024; Giering et al., 2022). In addition, this classical classification is time-consuming and susceptible to human bias, which can hinder effective quality control (Goswami, 2004). Sensors mounted on conventional in situ platforms may provide better spatial resolution and have less impact on the observed target. In situ acoustics with broadband systems allow for broad taxonomic identification but are not adapted for detritus due to their poor scattering. For plankton, quantitative imaging has been identified as the best means to do so (Lombard et al., 2019). In situ imaging methods are better suited to recognize plankton and detritus, but detect them in a smaller volume. Considering the advantages and limitations of each method, we can conclude that in situ imaging is particularly suited for observing plankton and detritus, using their shape to infer taxonomy or morphological attributes (Picheral et al., 2010; Stemmann and Boss, 2012; Lombard et al., 2019). However, there is a compromise between the observed volume and the resolution of the camera that defines a size range and taxonomic resolution for each type of sensor. Recent publications have suggested (Lombard et al., 2019; Kiko et al., 2023) and showcased (Drago et al., 2022; Clements et al., 2023; Laget et al., 2024) that cooperative observation of plankton with imaging systems can allow an upscaling of regional observations by independent observers to global scale.
The Underwater Vision Profiler camera system (UVP, version 5) is an optical imaging instrument designed to automatically detect, size, and count biotic and abiotic particles in the marine environment as it profiles through the water column (Picheral et al., 2010). To date, the 25 units of the UVP5 have been used at 14 462 sites since 2008 providing 94.8 millions of images and ∼1000 new profiles every year. The number of taxa that can be recognized is over 200, whereas robust data is available for the 30 most abundant taxa (Drago et al., 2022; Panaïotis et al., 2023). Semi-supervised classification (automatic prediction followed by human validation) of plankton images (Irisson et al., 2022) was performed at regional scales, because of the time required to analyze all profiles and the lack of dedicated work flow to deal with millions of images. Recently the development of the collaborative platform Ecopart (https://ecopart.obs-vlfr.fr/, last access: 31 January 2025) for UVP metadata and data curation, and EcoTaxa (https://ecotaxa.obs-vlfr.fr/, last access: 31 January 2025) for supervised image classification facilitated data treatment for the users. The data, initially recorded to address regional questions, can then be aggregated in global datasets to investigate global distributions of counts, size and vertical flux of all detected objects (Kiko et al., 2022; Clements et al., 2022, 2023). Furthermore, these platforms allow global studies on macrozooplankton biomass (Drago et al., 2022), and community composition (Panaïotis et al., 2023), as well as on the community proportions of Rhizaria (Biard et al., 2016), their impact on carbon flux attenuation, and silicification (Laget et al., 2024). To date, these studies provided the following data products: global plankton biomass, counts and group specific carbon demand data. In addition, to facilitate data access for modelers, all UVP5 particle size profiles, which were analyzed without image recognition, were released at a 1° spatial resolution (Kiko et al., 2022). A more recent database obtained by combining images from Imaging Flow CytoBot, Zooscan and UVP5 to provide data products on plankton and detritus biomass binned in 1 degree resolution was also released (Dugenne et al., 2024). An attempt was made to classify detritus images based on their morphology (Trudnowska et al., 2022) but given their high number and the lack of consistent shapes, their classification at global scale is still challenging.
Here, we present the global dataset comprising approximately 8 million validated images of plankton and detritus, rigorously verified by expert taxonomists, associated with relevant metadata and their morphological measurements, that was not released in earlier studies. The dataset is of interest for marine ecologists interested in plankton biogeography and biogeochemical modeling and for computer scientists developing Artificial Intelligence methods to classify images. While the current plankton classification has been homogenized for 33 categories, there remains potential for further improvement to increase the list of taxa consistent at a global scale. Classification of detritus was not performed, as existing methodologies developed at regional scale must be improved for a global approach. By providing the raw images for plankton and detritus, we hope to foster the development of new algorithms to sort and analyze them. The manuscript is organized as follows: the Material and Methods section provides details about the UVP5, the inter-calibration and quality control procedures, as well as the dataset structure. The result section presents maps of the dataset distribution, summarizing statistics regarding taxa composition, size spectrum, description of global detritus and plankton distribution. The Discussion section provides recommendations for dataset use and potential future expansions of it.
2.1 Image acquisition with UVP5
2.1.1 UVP5 description
Data from the Underwater Vision Profiler 5 (UVP5), an in-situ imaging system designed to detect, measure, and quantify the distribution of zooplanktonic organisms and marine particles (Picheral et al., 2010), were used. The UVP5 was commercialized in 2010 and produced until 2021. The standard definition (SD) version with a 1.3 MP greyscale camera was produced between 2008 and 2016 (serial numbers 000 to 011) and the high-definition (HD) version with a 4 MP greyscale camera was produced between 2016 and 2021 (serial numbers 200 to 223). The UVP5 (SD and HD) images a volume of about 1 L at a frequency of 5 to 20 Hz and can be deployed down to 6000 m depth. The UVP5 is mostly integrated in the CTD-Rosette and therefore its results (particle and plankton counts) can be related to environmental data obtained with other sensors. All particles larger than appr. 100 µm Equivalent Spherical Diameter (ESD) are sized and counted but their images are not stored because the low number of pixels precludes any recognition of the particles. Recognized objects larger than 30 pixels (UVP5SD) or 80 pixels (UVP5HD) are automatically cropped and the resulting vignettes stored and further analyzed.
2.1.2 Image analysis by zooprocess
Vignettes contain plankton organisms, detritus and artefacts larger than approximately 1 mm ESD for UVP5SD and 600 µm for UVP5HD. Pixel size-to-millimeter conversions for UVP5SD and UVP5HD are derived from objects of 30 and 80 pixels, respectively. For simplicity, we converted the surface area in pixels to its Equivalent Spherical Diameter. In addition, the released dataset contains 42 morphological features characterizing each object (area, major and minor axis, grey level etc.; Picheral and Mériguet, 2026) obtained from the segmentation of raw vignettes. Metadata collection (geographic location, date, etc.) and processing of all 8.46 million images was carried out using the ZooProcess software. For user convenience, the images were inverted to show dark objects on a white background and a scale bar was added to each vignette. Images and metadata were imported into EcoTaxa (Picheral et al., 2017), an application which allows a taxonomic classification of images via supervised learning algorithms, followed by manual validation (Irisson et al., 2022).
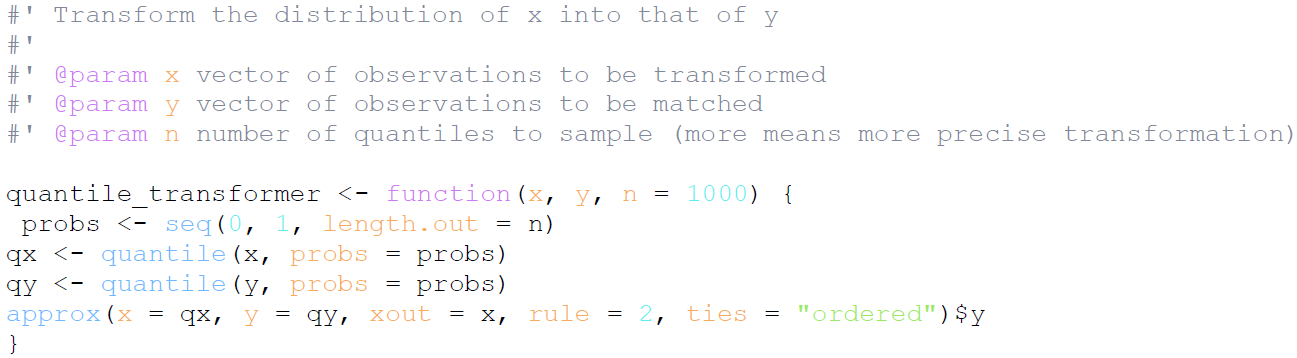
The two versions of the UVP5 have been inter-calibrated based on the size spectrum of all particles measured concurrently in natural conditions (Kiko et al., 2022). Therefore, size is a conservative property between the instruments and plankton community composition can be inter-compared. While all parameters, except for shape-based ones, differ between the SD and HD versions due to the distinct resolution of their imagers, other morphological properties, such as opacity, brightness, etc., may not be conservative, requiring caution in their joint analysis. For the HD version, measurements are taken from images with a dark field, which are then converted to a light field comparable to those in the SD version. Additionally, only images from a continuous descent of the instrument were retained. Beyond the SD/HD distinction, individual UVP5 units were operated with different acquisition settings, so their outputs are not directly comparable. In particular, the distribution of morphological features from unit sn000 differs from that of the other serial numbers. Users should therefore consider a correction before pooling data across units; a quantile-to-quantile transformation (code in Appendix B) should be applied to adjust the distribution profile of sn000 to match the other serial-number settings.
2.1.3 Semi-automatic image identification
Using EcoTaxa (https://ecotaxa.obs-vlfr.fr/, last access: 31 January 2025), we applied semi-automated recognition in two steps following the third strategy path defined in Fig. 2 by Irisson et al. (2022). First, features obtained using Zooprocess software or features re-calculated by a convolutional neural network (CNN) are considered to automatically predict object identities using a Random Forest algorithm. Therefore, various image learning sets were used independently on a project-by-project basis by different users. In this way, plankton organisms can be successfully classified into a few broad categories from the overdominant category of detritus with reasonable success. In a second step, manual validation and further sorting ensured correct classification of all plankton categories and detritus. In general, the sorting was performed by various users and institutions. To reduce the risk of wrong identification, a shared UVP5 taxonomic guide was used by all annotators to homogenize image sorting (EcoTaxaGuide application). In addition, annotations were rigorously quality checked by the authors. The classification of all images was strictly based on the morphological features of the objects in most cases. However, few annotators have used contextual information provided by other means (e.g., bottle or net collections, depth, GPS position) to classify objects with inadequate morphological attributes into taxa. For example, colonies of Trichodesmium (-contextual) can be reliably identified in images when their presence is confirmed by concurrent bottle samples or net tows, even when their morphological features alone are insufficient for unambiguous classification.
2.2 Dataset
The UVP5 dataset (Fig. 2) was compiled from observations across all oceans over a 10-year period (2008–2018) through a collaboration of international partners. It includes 3114 profiles from 62 EcoTaxa projects conducted during research cruises by different institutions (Table A1), each aimed at addressing specific local or basin-scale research questions. It comprises vertical profiles validated to more than 99 % which were retained for subsequent analysis. Currently, the different annotators (in total 71, Table A2) of the 62 EcoTaxa projects chosen have sorted the image datasets in more than 250 categories from species level to phyla or by adding morphological attributes and life stages. Such detailed classification is not possible over the whole dataset with high accuracy because recognition and sorting of organisms can be a source of bias depending on the levels of perception and experience of the people who perform them. Several cognitive biases exist, such as boredom, fatigue or a classification biased towards the most used groups (Culverhouse, 2007; Culverhouse et al., 2014).
In the present dataset, to reduce these errors and ensure classification homogeneity, the images were thereafter grouped into only 33 broader taxonomic groups for living organisms by combining all vignettes within the children categories (Table 1), while in EcoTaxa the original categories are maintained. The broad taxonomy list was established following recent published works using UVP5 data (Drago et al., 2022; Panaïotis et al., 2023; Laget et al., 2024) to ensure a minimum of 50 images per category and ecological patterns at regional or global scales for specific groups or community composition. For example, rhizarians were well studied at local (Biard and Ohman, 2020) and global scales (Biard et al., 2016; Laget et al., 2024) while polychaetes were mostly studied in the tropical Atlantic (Christiansen et al., 2018). Community composition analyzes have been conducted at local scales by Forest et al. (2012) and Barth et al. (2020), and at a global scale by Panaïotis et al. (2023). Global biomass was estimated in Drago et al. (2022). Inter-comparison with plankton net data at global scale (Soviadan et al., 2024) allowed to set confidence in the abundance assessments of many of these groups.
Table 1List of categories that are quantitatively consistent in this work and names of children categories not homogeneous among the projects. Categories also defined by their morphotypes or life stages are in bold. The published dataset contains both the broad and the children categories (when more than 50 vignettes were available for the category). When available publications using the dataset at regional scales are listed. Exponent numbers denote the association with an image example in Fig. 1.
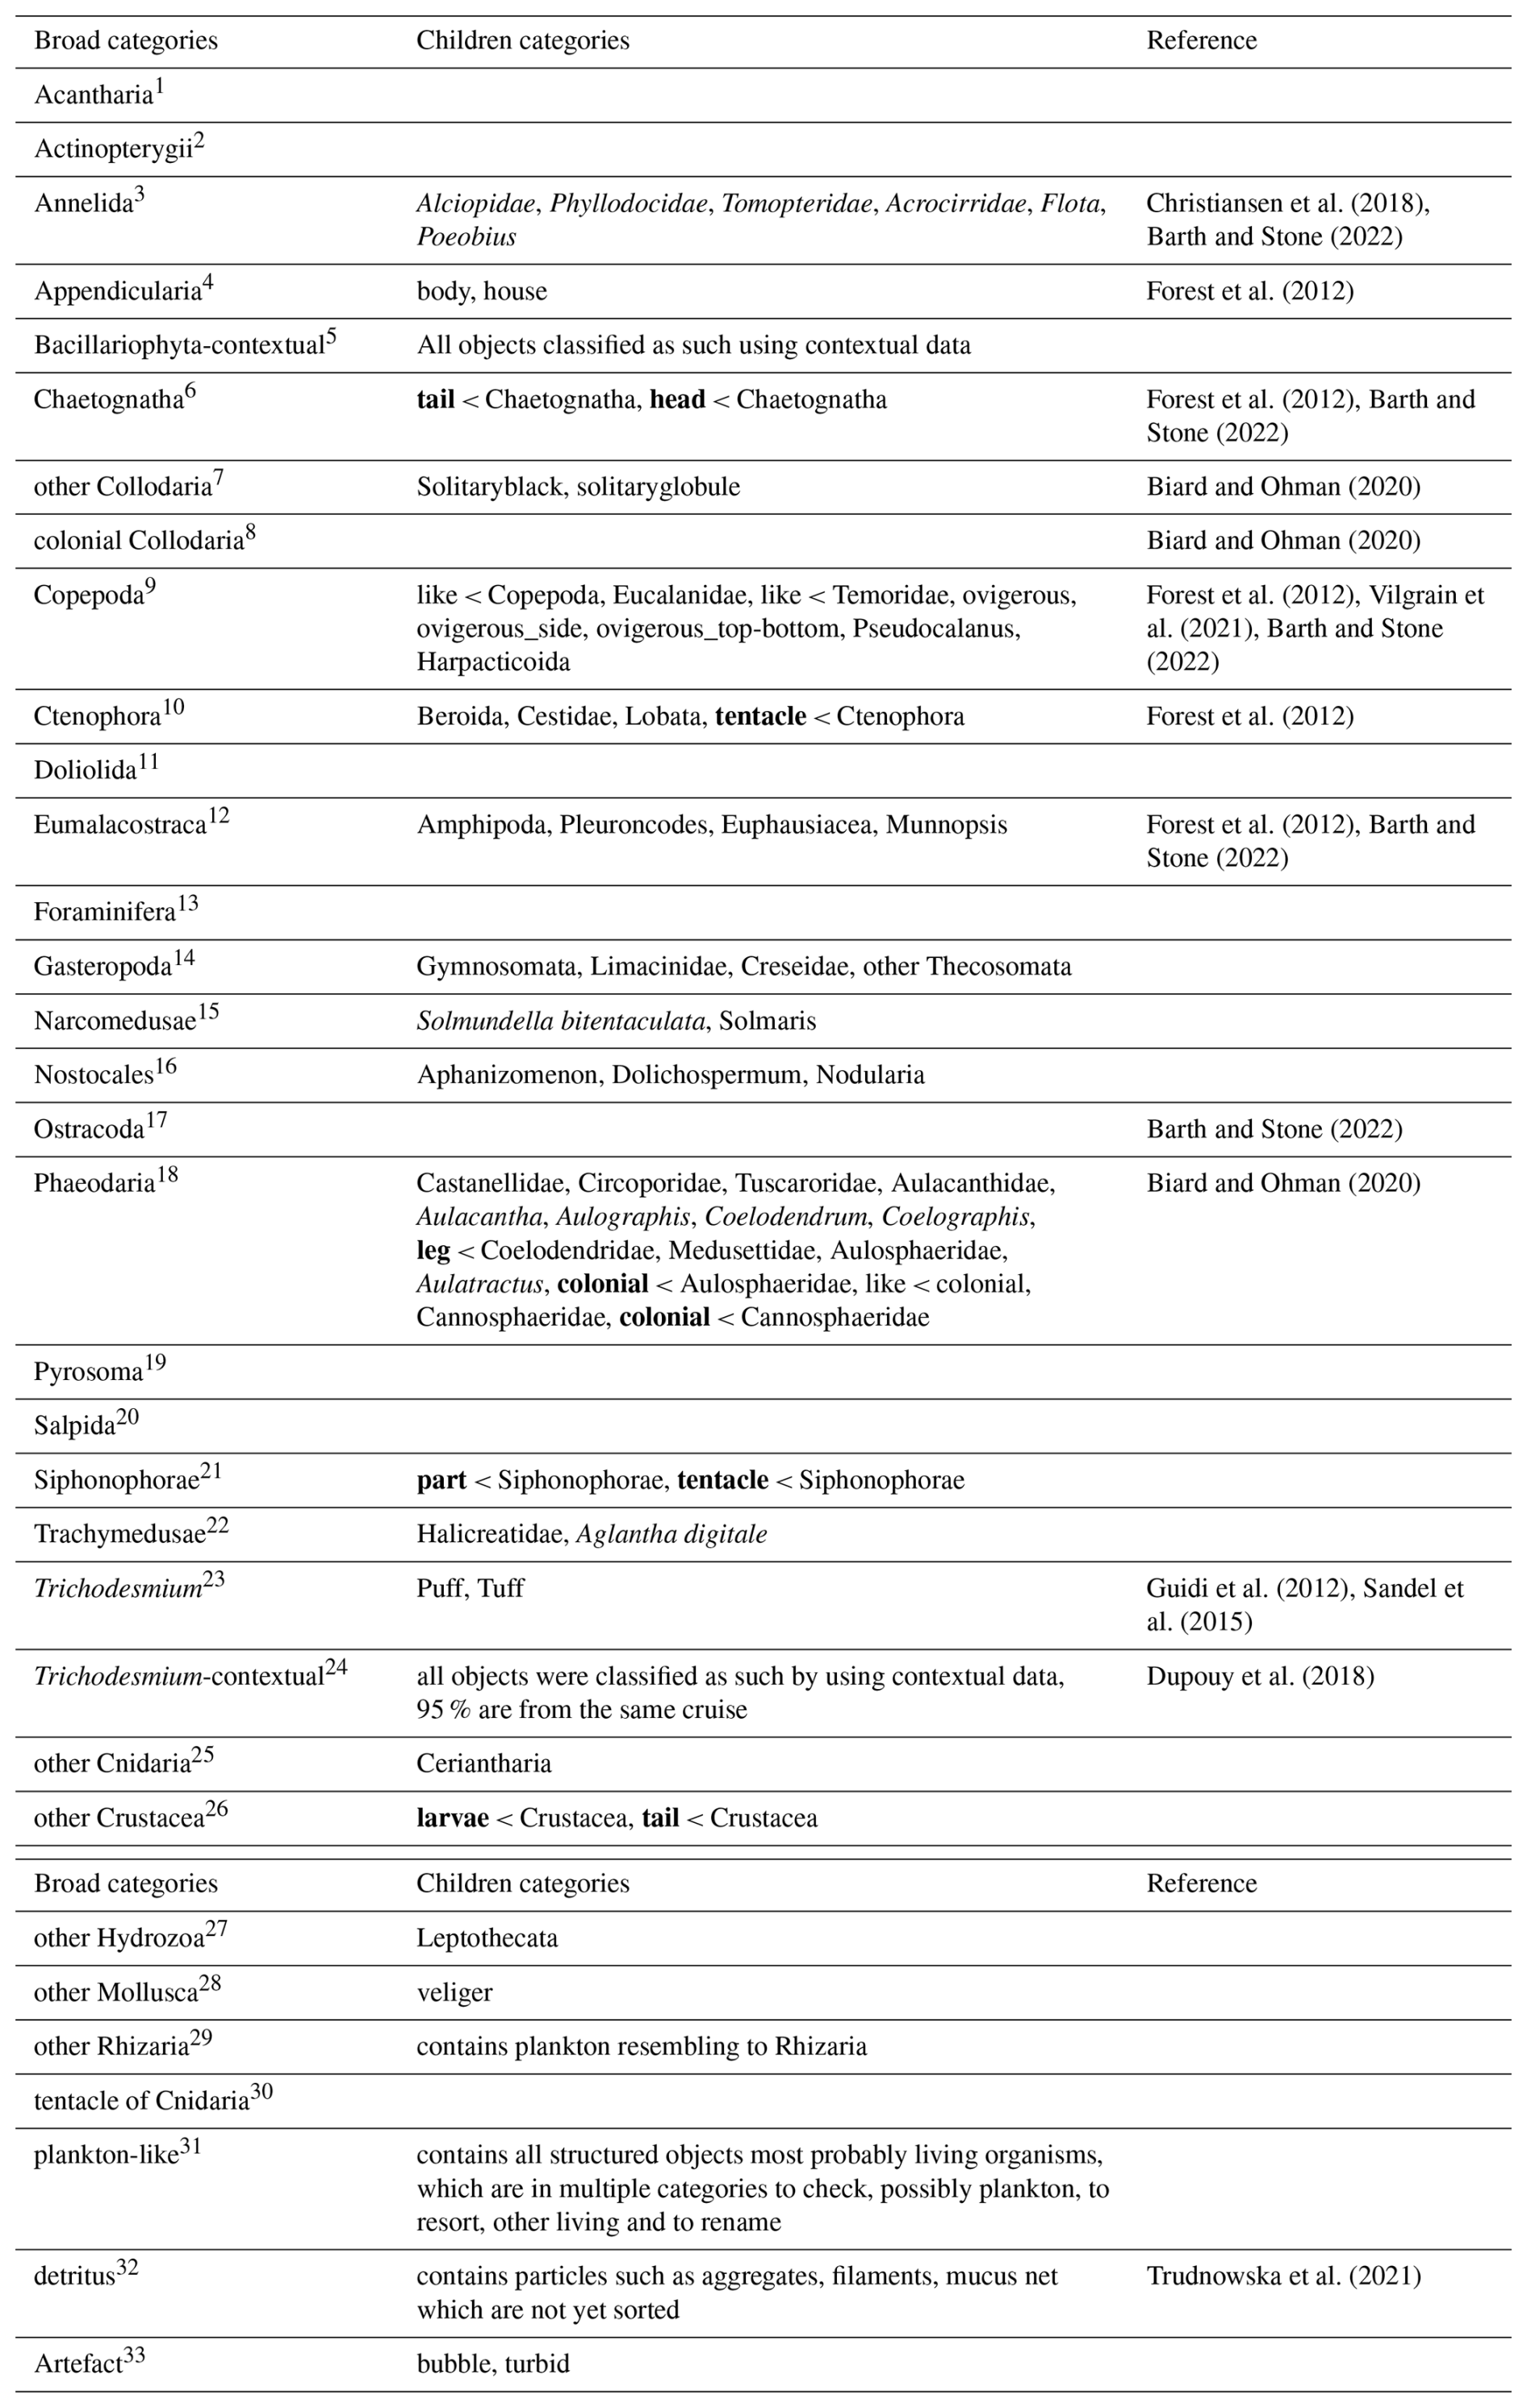
Images of unidentifiable objects exhibiting probable biological characteristics (e.g., symmetry, appendages, or tentacles) were classified into the “plankton-like” category. In this dataset, the term “-like” refers to structured objects that resemble organisms but cannot be taxonomically identified due to limitations such as poor focus, low resolution, incomplete capture, or lack of taxonomic knowledge. For example, copepoda-like contains all vignettes of copepods for which the antenna is not visible while the body shape resembles typical prosome and urosome. When recurring objects that were not yet classified appeared frequently but with uneven spatial distribution, temporary categories were created to accommodate them and labeled as temporary (tmpXXX). When contextual information to identify them was used, “contextual” was added to their names. All images of non-living organisms, including poor-quality images (blurred, low grey level, bubbles, artificial nature, badly segmented images) or particles (aggregates, fibers, pellets) were sorted into several categories without consistency criteria across the consortium. Low-quality images (mostly objects not completely in focus) were set in a category named “artefact” that includes bad focus particles, plankton and real artefact, while particles were grouped into a single detritus category.
To ensure data consistency across projects, a subset of the dataset was reviewed to verify the accuracy of taxonomic sorting within each group. A total of 200 images were extracted from each category, or all available images if fewer than 200 were present. For detritus, 10 % of the total images were selected and independently reviewed by a different trained operator, working independently of the initial classification, after the final dataset was assembled. The error or uncertainty rate was under 8 % for taxa classification. Among the detritus, less than 0.1 % were plankton organisms. The resulting global dataset consisted of 7.05 million detritus images and 734 thousand plankton images from 3114 profiles.
Due to the large number of plots required to display the results for all categories, results are shown for a subset of the original categories. From the 33 initial categories derived from taxonomy (Table 1 and Fig. 1), five broader taxonomic groups were defined for further analysis based on shared feeding strategies and ecological traits (e.g. habitat, life mode, and trophic role). These groups can be highly useful as input for biogeochemical or community ecology models. The groups include Crustacea (Copepoda and Malacostraca), gelatinous filter-feeders (Appendicularia, Salpida), gelatinous carnivores (Chaetognatha, Narcomedusae, Siphonophorae, Ctenophora), Rhizaria (Collodaria, colonial Collodaria, other Rhizaria, Foraminifera, Phaeodaria, Acantharea), and Trichodesmium. From these groups, biovolumes were calculated along with concentrations at different depths and for the analysis of the average grey level.
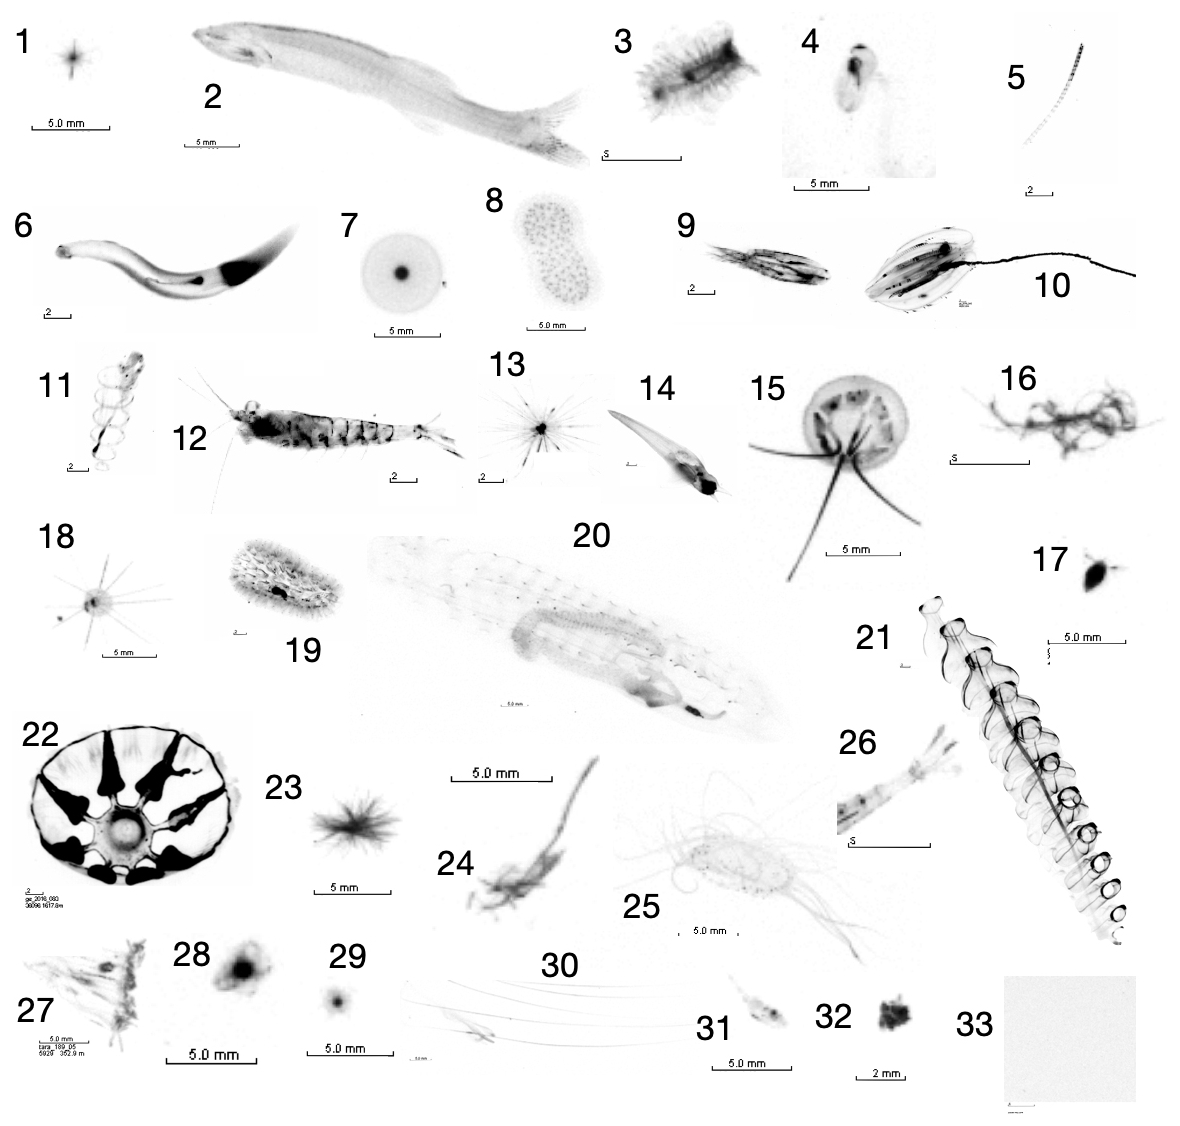
Figure 1Examples of images for each category (Table 1) present in the dataset. All images contain the same scale bar (5 mm) which appears very small for large objects.
2.2.1 Data output format
We provide four tables with numerical data (in .tsv format), as well as all images (with .jpg extension) while their full description is available in the information documents (UVP5_dataset_organization.txt) during the download. Briefly, “objects.tsv” is the data table which contains each object information. The three first columns refer to the unique object ID given by Ecotaxa, original object classification in Ecotaxa and object classification according to Table 1. The following 42 columns contain all the object features obtained from the image. The “samples.tsv” file is the table with the metadata corresponding to all the coordinates (latitude, longitude, date and time) and acquisition details (pixel size and UVP model). The “samples_volume.tsv” is a table that contains the volume of water in which the object was extracted and that is used to calculate concentrations (middle depth bin and volume imaged). Finally, “properties_per_bin.tsv” is a table with concentrations, biovolume, average size (ESD) of the 33 consistent categories per depth bin and per sample. The native size bin of the dataset is 5 m, but to reduce the size of the file and avoid too many zeros, we provide 25 m depth bins in the surface ocean (down to 200 m depth), 50 m depth bins (down to 500 m depth), 100 m bins (down to 1000 m depth) to 250 m below 1000 m. We provide the code in R to recalculate the table with a depth bin of 5 m. The two files “ODV_biovolumes.txt” and “ODV_concentrations.txt” contains the same information as “properties_per_bin.tsv” but in the ODV format.
3.1 Data coverage in time and space
The dataset presented here revealed a heterogeneous global distribution. The UVP5 deployments predominantly occurred in the northern hemisphere (66.3 % of profiles, Fig. 2), especially in tropical and temperate latitudes where seasonal variations are well observed. In contrast, the southern hemisphere had fewer observations (33.7 % of profiles), resulting in a less comprehensive dataset. The region between 30° S–30° N represented the highest proportion of UVP5 profiles (47.25 %). The vertical profiles distribution revealed a predominant concentration of measurements in the upper 1000 m of the water column, representing 40.6 % and 46.8 % for the SD and HD models respectively, with a peak occurring within the upper 500 m. Thus, most deployments targeted shallower depths. The SD version of the UVP5 demonstrated the most extensive coverage, with profiles spanning the entire latitudinal range. Meanwhile, the HD profiles were prevalent in the Northern Hemisphere. The profiles also presented a remarkable annual and interannual variation observed primarily in the northern hemisphere and the under-sampling of the southern hemisphere and the deep sea.
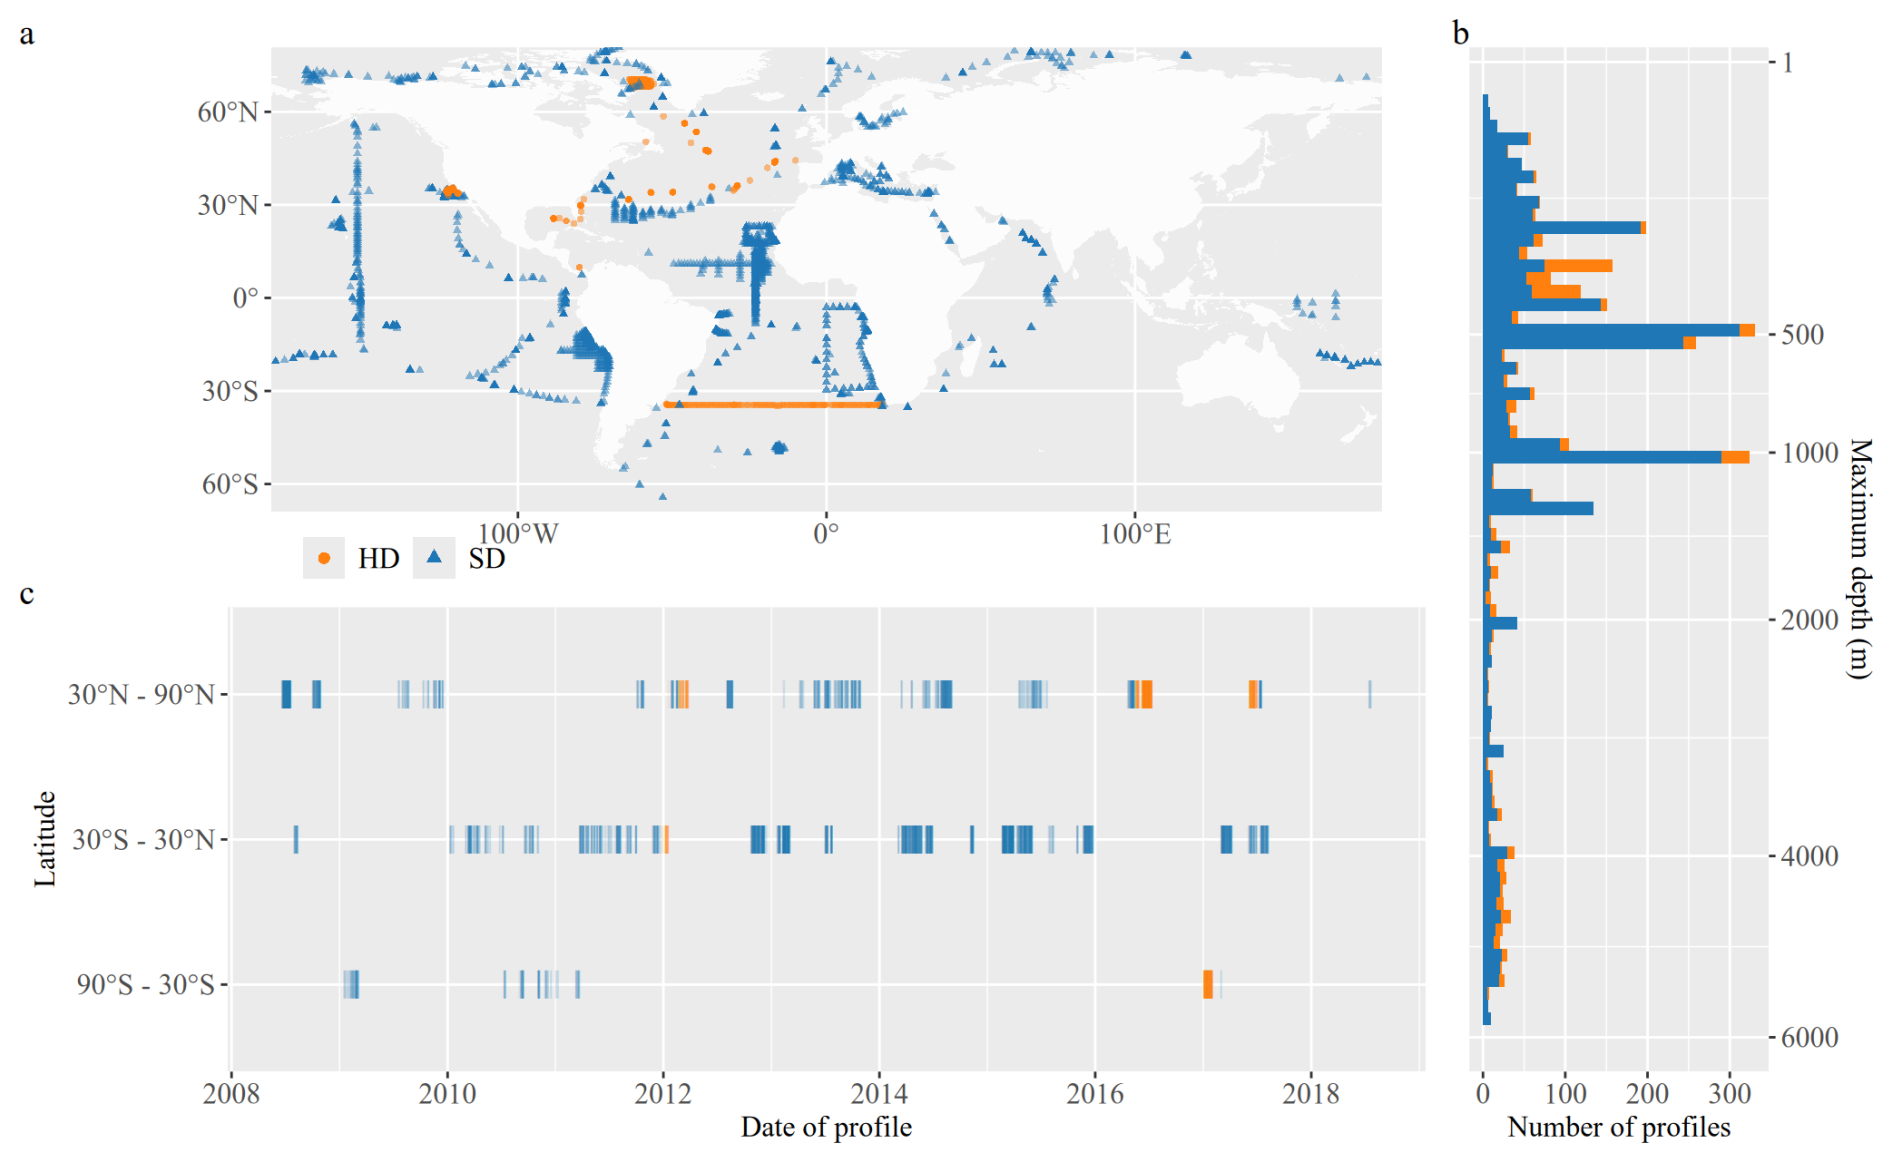
Figure 2(a) Sampling effort for the two versions of UVP5 (SD and HD, blue and orange, respectively) between 2008–2018 in the global ocean. (b) Latitudinal distribution of UVP5 profiles and (c) maximum vertical extent of the profiles.
3.2 Detritus and plankton composition in the whole dataset
Detritus was the most abundant category (90.5 % of total images), indicating a substantial presence of non-living particulate organic material (Fig. 3). Copepoda dominated zooplankton (2.2 %), followed by Trichodesmium (1.3 %), Trichodesmium-contextual (1.1 %), the plankton-like category (1 %), artefacts (0.9 %), Phaeodaria (0.8 %), and Bacillariophyta-contextual (0.6 %). Each of the remaining groups represent <0.16 % of the total number of objects.
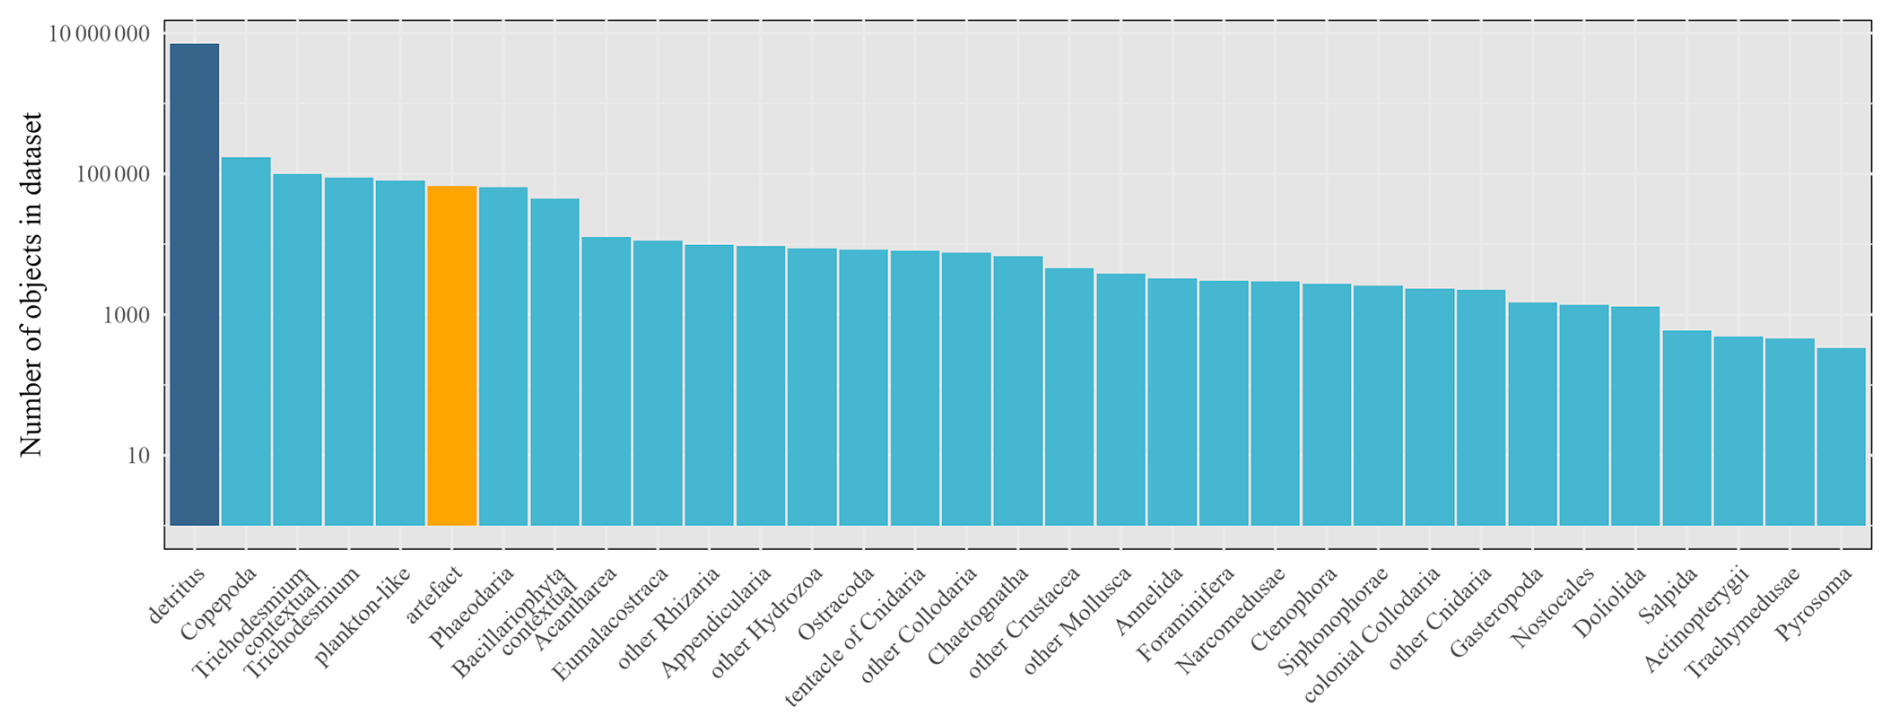
Figure 3Barplot with total number of objects in logarithmic scale available in the dataset per category (detritus and plankton) for the 33 consistent categories ordered by descending counts with specific categories (“detritus” and “artefact”) highlighted in distinct colors.
3.3 Global distribution of plankton and detritus
The spatial patterns of plankton and detritus concentrations in the global ocean vary significantly with depth and location. Across all depth layers, plankton and detritus abundances increased (up to 5 plankton per m3 and 60 detritus per m3 in the 0–100 m depth layer and up 2 plankton per m3 and 20 detritus per m3 in the 500–1000 m depth layer, Fig. 4) in eastern boundary current systems (especially in the Californian and Senegal upwelling systems) or in coastal seas. Minimum values (up to 2 plankton per m3and 20 detritus per m3 in the 0–100 m depth layer and up 1 plankton per m3 and 1 detritus per m3 in the 500–1000 m depth layer) were usually found in the center of large ocean gyres (notably in the South Pacific and the Indian Ocean).
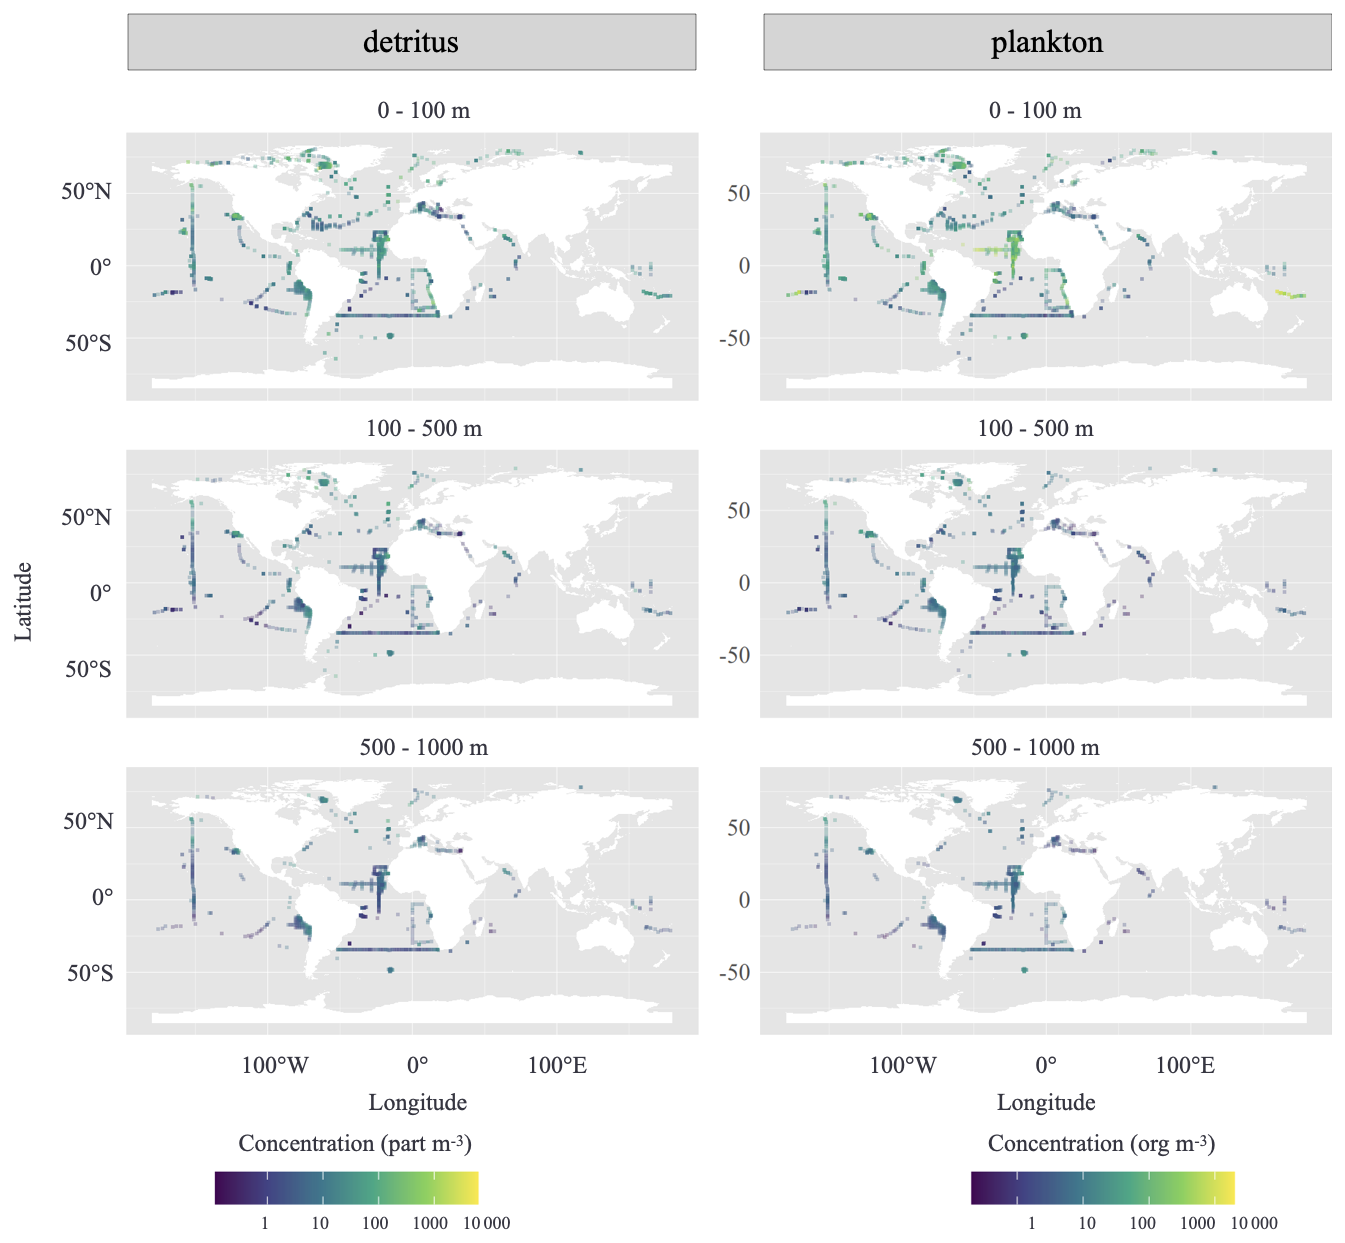
Figure 4Map of the global distribution of detritus and plankton concentration (log particles/organism m−3) in three layers (0–100, 100–500 and 500–1000 m).
3.4 Average size distribution of SD and HD versions
The distribution of detritus followed a dome-like pattern (criteria from Drago et al., 2022), with UVP5 showing a lower detection threshold for particles below 1 mm for UVP5 SD and 600 µm for UVP5 HD (Fig. 5). In contrast, plankton categories exhibited a much flatter normalized biomass/biovolume size spectra (NBSS) distribution. Detritus dominated the smaller size range (<1 mm) while the contribution of plankton increased relative to detritus in the larger size range. Except for Rhizaria, smaller planktonic organisms were more abundant in the upper 100 m in the UVP5HD dataset, emphasizing the detection limits of the two camera versions in the small size range for both plankton and detritus.
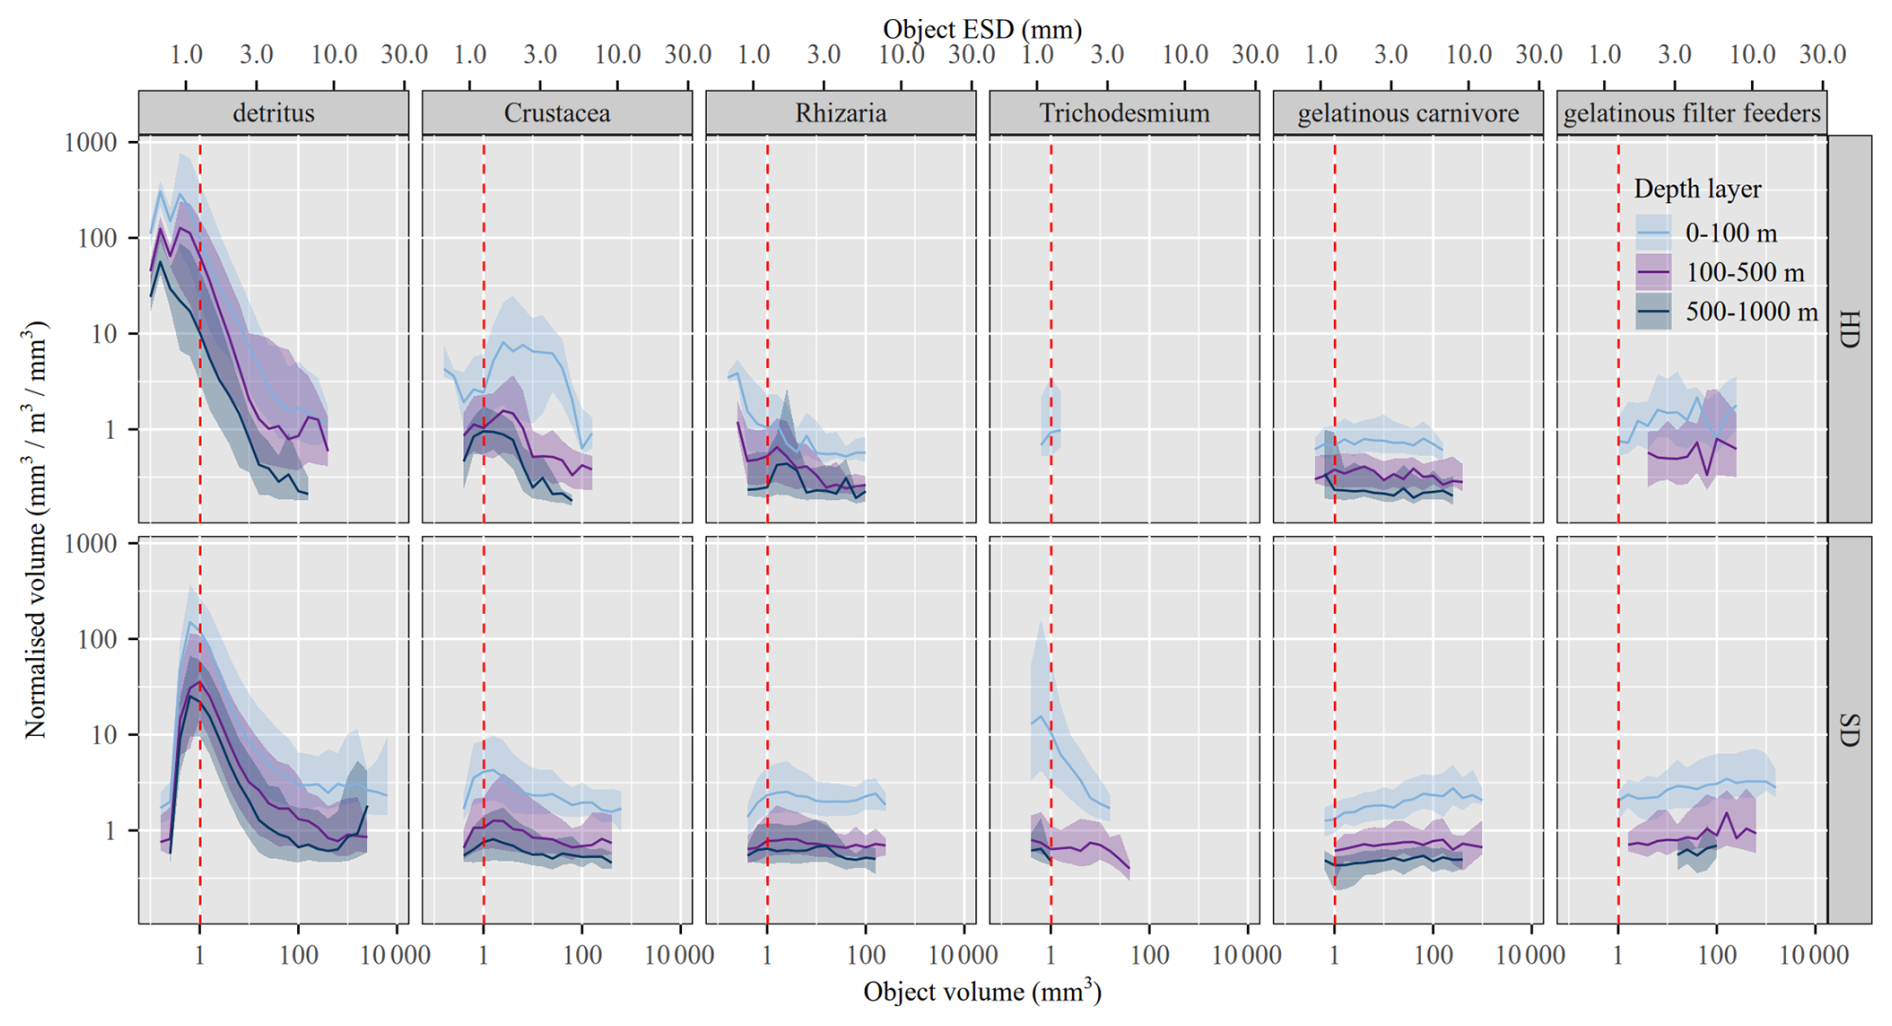
Figure 5Average size distribution of detritus and plankton categories obtained by the SD and HD version of the UVP5 in three depth layers. Red dashed line indicates the threshold value (1.02 mm) below which UVP5 detection of organisms is difficult to quantify properly. Crustacea (Copepoda and Malacostraca), gelatinous filter-feeders (Appendicularia, Salpida), gelatinous carnivores (Chaetognatha, Narcomedusae, Siphonophorae, Ctenophora), Rhizaria (Collodaria, colonial Collodaria, other Rhizaria, Foraminifera, Phaeodaria, Acantharea), and Trichodesmium.
3.5 Plankton to detritus ratio as a function of size
For both UVP5s, the proportion of plankton images on all images (detritus and plankton) increased with size from 0.01 at 500 µm to about 0.8 for objects larger than 3 mm in ESD. The two instruments displayed a similar pattern with a plateau in this ratio starting at about 3 mm. In general, the ratio did not vary with depth and remained at 0.8 for objects larger than 3 mm.
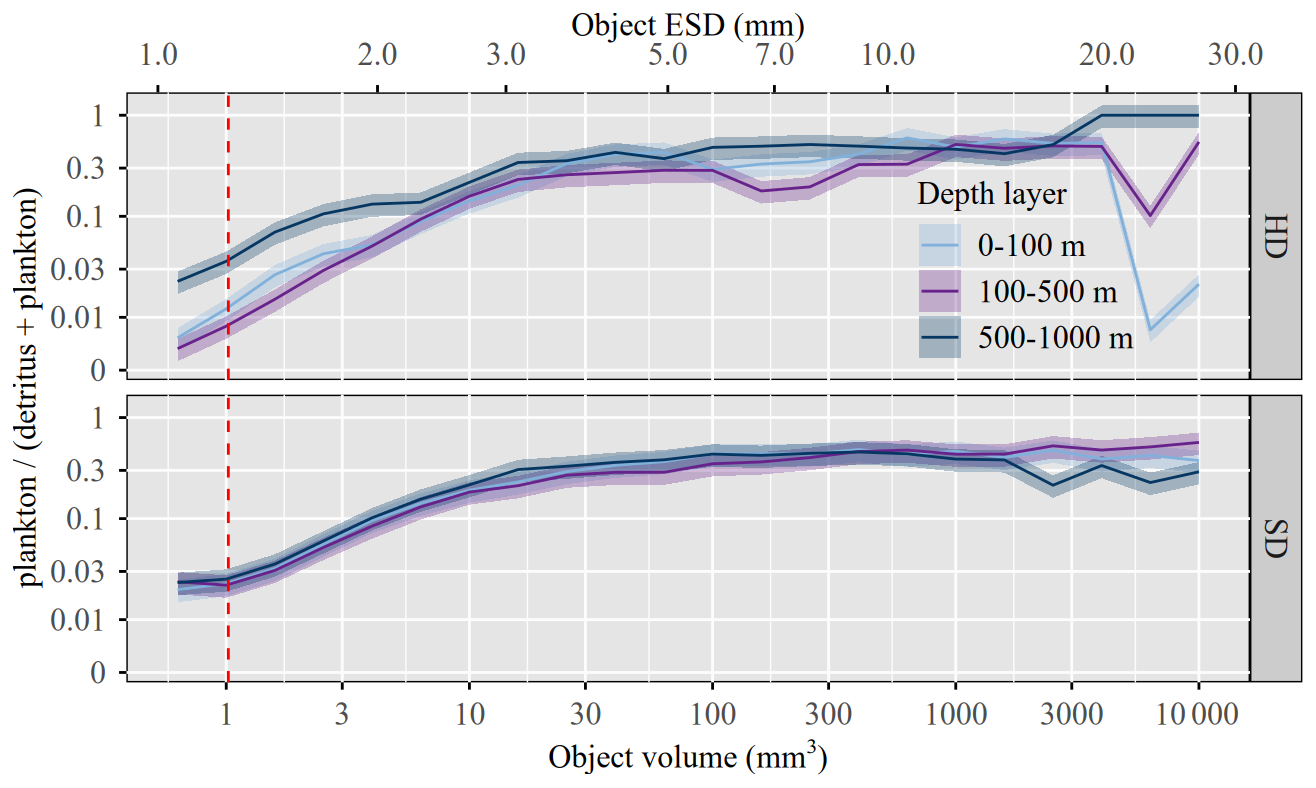
Figure 6Abundance ratio of plankton (without plankton-like) over all images as a function of size for the two different UVP5 versions. Red dashed line indicates the threshold value (1.02 mm) below which a robust detection of organisms is limited.
3.6 Vertical profiles of detritus and plankton concentrations
When analyzed across vertical layers (Fig. 7), detritus showed the highest concentrations in the upper 100 m, with biovolume patterns mirroring concentrations and exceeding those of living plankton by several orders of magnitude. Trichodesmium (excluding Trichodesmium-contextual) was the most abundant group in surface waters, but contributed relatively little to biovolume due to its small size (Fig. 4). Crustacea displayed comparable patterns in concentration and biovolume, with high surface abundance and decreasing values with depth. Gelatinous plankton, including filter feeders (Appendicularia, Salpida) and carnivores (Chaetognatha, Narcomedusae, Siphonophorae, Ctenophora), were characterized by low concentrations but disproportionately high biovolume, particularly in the upper 100 m, with both metrics declining with depth. Rhizaria also peaked in concentration and biovolume in surface waters and decreased gradually down to 1000 m.
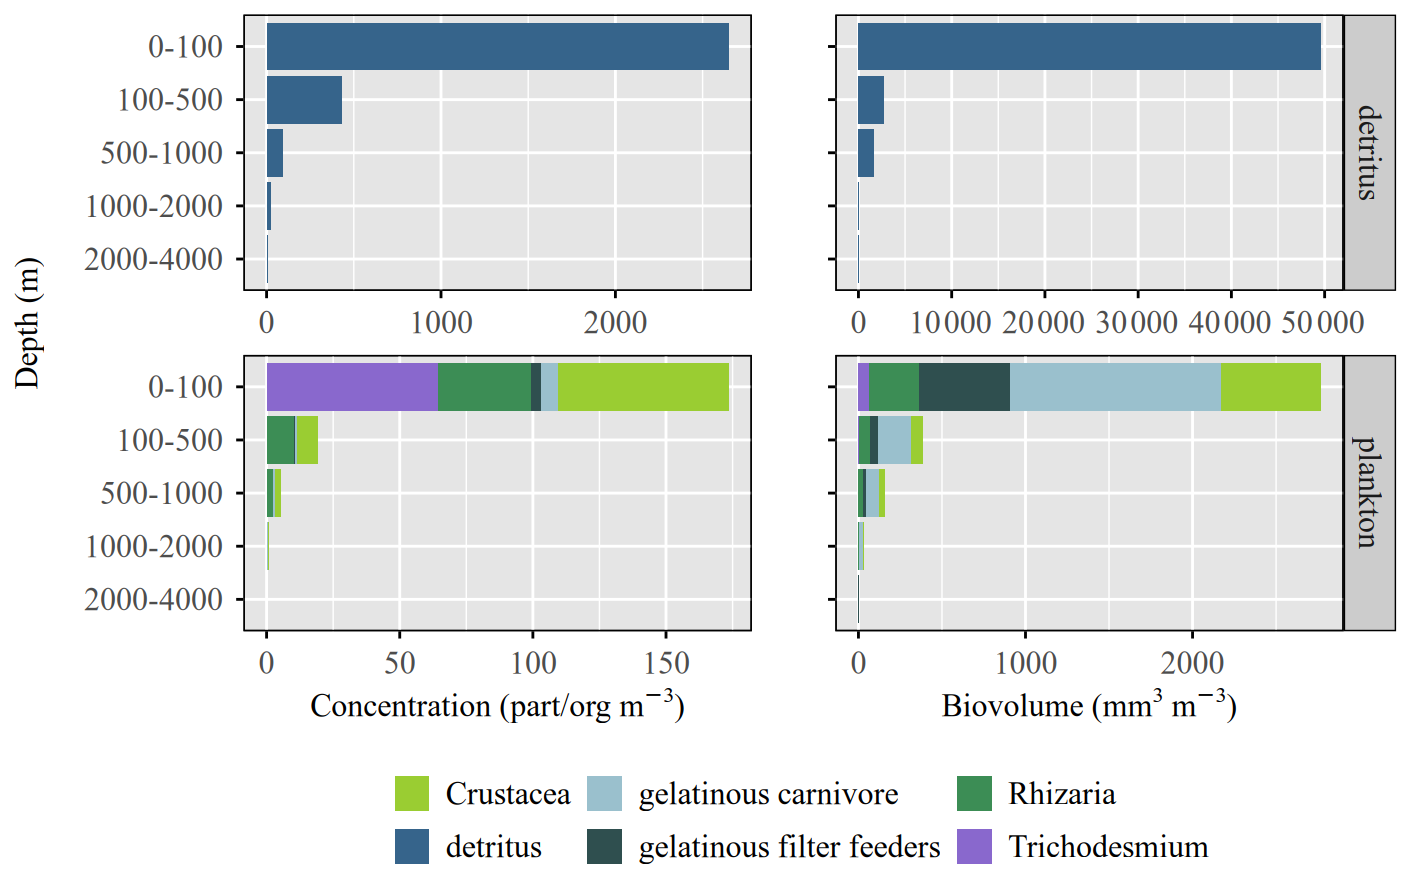
Figure 7Global vertical profiles of concentration and biovolume for detritus and the five plankton groups. part: particles of detritus; org: organisms from different taxa categories. Crustacea (Copepoda and Malacostraca), gelatinous filter-feeders (Appendicularia, Salpida), gelatinous carnivores (Chaetognatha, Narcomedusae, Siphonophorae, Ctenophora), Rhizaria (Collodaria, colonial Collodaria, other Rhizaria, Foraminifera, Phaeodaria, Acantharea), and Trichodesmium.
3.7 Morphological properties
The key morphological properties for detritus and the five plankton categories presented similar patterns between the two UVP5 versions (SD and HD) (Fig. 8). In some cases, the range differed between versions for the groups depending on the property examined. Gelatinous groups were the biggest categories in terms of area measured, while they presented the lowest circularity, compared to the remaining groups. Crustacea was the darkest group, whilst gelatinous were the lightest ones.
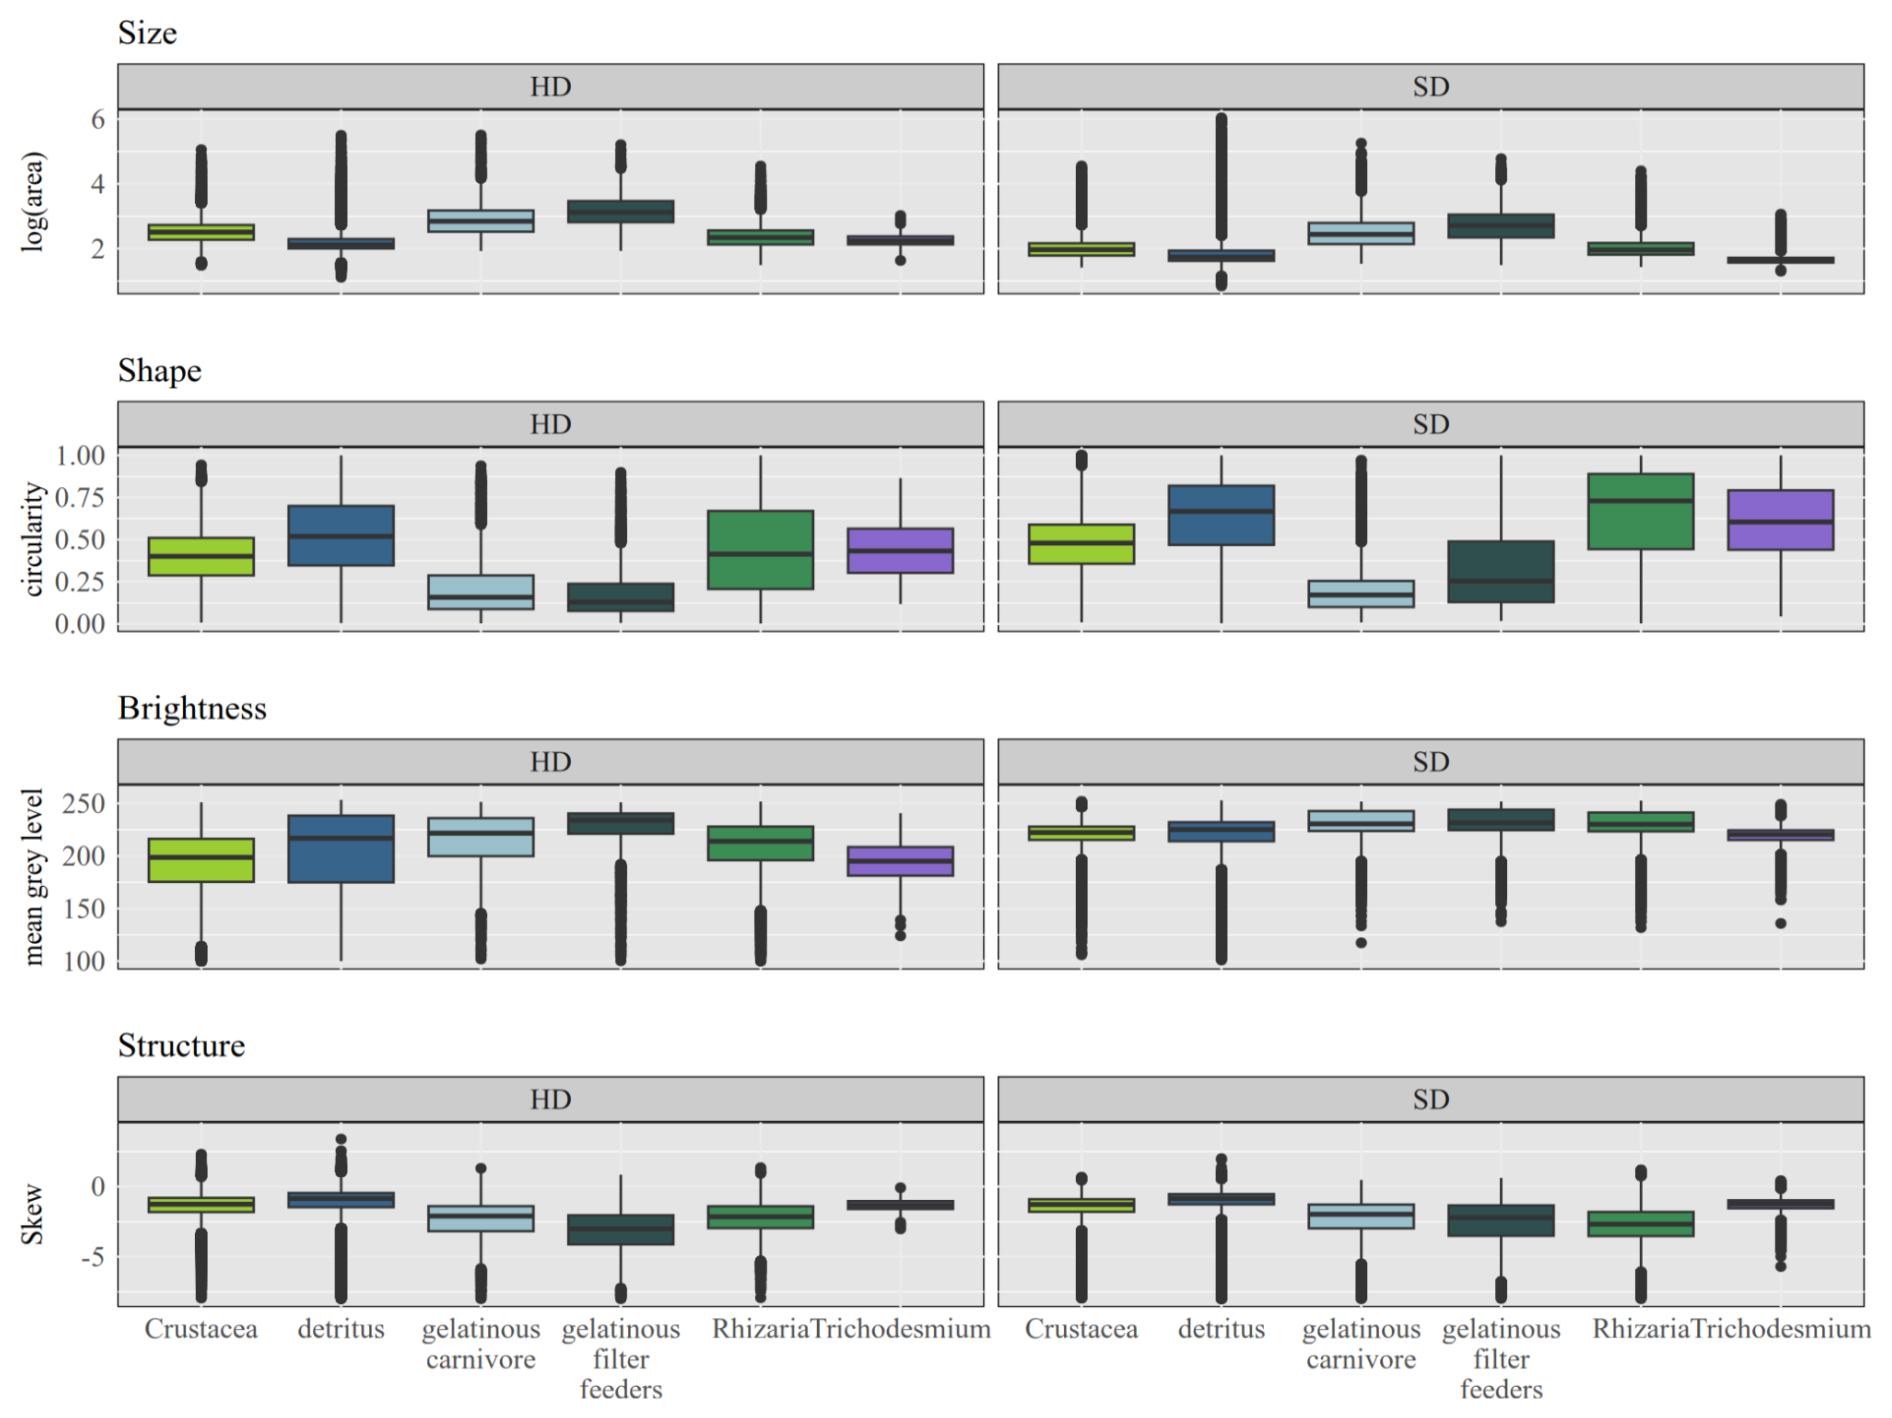
Figure 8Box plots of key exemplary morphological properties (area, circularity, mean grey level, skew) for detritus and the five taxonomic groups (Crustacea, gelatinous carnivore, gelatinous filter feeders, Rhizaria and Trichodesmium) for the two UVP5 versions (HD and SD). Crustacea (Copepoda and Malacostraca), gelatinous filter-feeders (Appendicularia, Salpida), gelatinous carnivores (Chaetognatha, Narcomedusae, Siphonophorae, Ctenophora), Rhizaria (Collodaria, colonial Collodaria, other Rhizaria, Foraminifera, Phaeodaria, Acantharea), and Trichodesmium.
The dataset is available on SEANOE at https://doi.org/10.17882/107583 (Nocera et al., 2025).
The availability and accessibility of both the UVP5 images and their associated metadata present new challenges, encouraging the scientific community to leverage and refine them for future research. With this objective in mind, the dataset presented here serves as a starting point for further exploration of the current database (10 000 profiles not fully validated) and future data incorporated in EcoTaxa (approximately 500 profiles annually on average over the last three years for UVP5 versions only), covering both plankton and detritus. In this context, we discuss the strengths and limitations of the dataset, as well as its potential applications and future directions for the UVP database.
5.1 Consideration related to spatial coverage and instruments performances
The dataset provides decade-long global coverage with standardized methodologies across UVP5 versions, spanning all major ocean basins. However, the southern hemisphere and deep sea remain undersampled, and profiles are mostly concentrated in mid-high latitude of the northern hemisphere (Fig. 2). Well sampled regions correspond to long-term monitoring or time-series programs, such as the California Current, the Western Mediterranean, and the Equatorial region, through initiatives like the CCELTER program (e.g., Biard and Ohman, 2020), ongoing observational efforts of MOOSE (e.g., Llopis Monferrer et al., 2022), and long-term studies in the Equatorial region (e.g., Kiko et al., 2017, Fernández-Carrera et al., 2023). The even distribution across ocean basins is mostly the result of the Tara Ocean Expeditions (2009–2013). Despite broad coverage, small sampled volumes can limit detection of rare taxa, affect image based identification, and cause “zeros” that may reflect detection limits rather than true absence.
At larger size ranges, rare taxa require aggregation counts across thick vertical ocean layers to achieve statistical robustness (Hauss et al., 2016; Panaïotis et al., 2023). At the surface, abundant taxa may permit 10 m binning intervals (Dupouy et al., 2018; Biard and Ohman, 2020), though 20 m bins are typically more appropriate (Picheral et al., 2010). In this study, data were grouped into five depth layers (0–100, 100–500, 500–1000, 1000–2000 and 2000–4000 m) balancing resolution for abundant surface taxa with sufficient counts for rare deeper organisms. While previous publications have adopted fixed depth ranges of 0–200 and 200–500 m (Drago et al., 2022), or a dynamic layer, set as the deepest value among the mixed layer depth and the euphotic depth (median 88 m, Panaïotis et al., 2023), the choice of the vertical layering ultimately depends on the scientific question.
The two UVP5 versions are inter-calibrated based on the size spectra from repeated joint profiles (Picheral et al., 2010; Kiko et al., 2022). Users should also account for unit-specific settings: sn000 (used, for example, during Tara Oceans 2009–2012) shows a different distribution of features and may require a quantile-to-quantile transformation, or exclusion, in cross-unit analyses. Detection efficiency varies with object size (Fig. 5), where HD version captures detritus < 1 mm more effectively than the SD version, while both perform similarly above 1 mm. Size spectra generally show a peak at the detection limit, a steep decline for intermediate sizes, and a flatter distribution for large objects (Stemmann and Boss, 2012).
5.2 Considerations related to classification
Variations in the depth of taxonomic classification among annotators necessitated the merging of certain groups, resulting in a final list of 33 taxa at the lowest common taxonomic denominator (Table 1). To validate classification accuracy, a random subset of images (200 from each taxon and 10 000 for detritus) was independently reviewed by a single operator. Error rates were consistently below 10 % across all groups, with most groups exhibiting error rates under 2.5 %. A source of error in the case of detritus is that many annotators had moved un-focused particles into the category artefact. This category includes images of objects arising from external or procedural factors. Examples of such artifacts include reflections or shadows from a poorly tied rope, presence of seals near the camera, cables, or other non-biological objects inadvertently captured during image acquisition, as well as badly segmented objects in nepheloid layers that modify the background. On the other hand, it may also consist of effects like bubbles caused by the descent through the air/water interface where bubbles are captured on the hardware, as well as artifacts resulting from image blurriness where no actual object or non-recognizable object is present (real artifact). When analyzing the artefact category which contains some subjectivity, considering for example that bad-focused could be very transparent objects, we found that it consists of 85 % of real detritus shaped objects, 5 % of plankton and 10 % of artefact. Sorting them in the EcoTaxa database system would be too time-consuming, so users must decide whether to include or exclude them during the analysis. Here, we merged them with detritus as they would become a minority (less than few percent). However, it is important to note that objects classified as artefacts (not shown in Fig. 7) represent less than 1 % of the total dataset when the concentration is calculated, but contribute to more than 200 % when volume is considered. Their impact is high mostly on large objects because many artefacts are observed in very turbid water where particles are badly segmented. This highlights the significance of their removal.
5.2.1 Plankton-like
We have gathered in plankton-like all objects that are most probably plankton. Inside this category, ∼60 % of the objects in the possibly plankton group may be Rhizaria, but the image definition impairs their recognition. It is important to keep this category apart from the detritus category because they represent a significant fraction of the total plankton count and probably living biomass. Although a significant portion indicates uncertain classification, it is also in this category that most new findings can be performed.
5.2.2 Plankton contextual
The term -contextual in this dataset refers to objects that were classified as a taxonomic category but do not have the morphology of the taxa. Scientists on oceanographic surveys who had other contextual information have created the category Trichodesmium-contextual and Bacillariophyta-contextual for objects that are not formally identified as Trichodesmium puff and tuff or as diatom chains. In this context, the classification is supported by many other optical observations (for example see Dupouy et al., 2018 for Trichodesmium). Due to the risk of mis-interpreting ecological results or impairing the quality of the learning set, it is better to distinguish them from objects whose images are typical of plankton organisms. In the case of the two categories, Trichodesmium and Trichodesmium-contextual, they contain nearly the same number of objects, so including both would double the amount of data for this group. On the other hand, Bacillariophyta-contextual represents the sole category for this genus within the dataset, where its inclusion or not could lead to its complete exclusion.
5.3 Scientific relevance
Overall, this dataset provides a unique and comprehensive tool for the scientific community, enabling researchers to examine the intricate relationships between plankton, detritus, and ecosystem function. The detailed classification of plankton and detritus provides a valuable resource for understanding the complexity between their abundance distribution and the environmental processes happening at global (Drago et al., 2022; Panaïotis et al., 2023; Laget et al., 2024) and local scales (see references in Table 1) within marine systems. By analyzing the abundance, diversity, and distribution of planktonic organisms, researchers can gain insights into food web structures, energy flow, and the interactions between different trophic levels (e.g., D'Alelio et al., 2016; Perhirin et al., 2025). The data allows ecologists the monitoring of plankton communities, which are essential indicators of environmental health and can reflect changes in water quality, nutrient levels, and ecosystem productivity (Muller-Karger et al., 2018). The dataset is equally valuable in biogeochemical studies, so researchers can better predict how changes in plankton community composition and detritus abundance influence nutrient cycling and the overall functioning of marine ecosystems. Additionally, biogeochemical models that integrate this dataset can help refine predictions of carbon sequestration in the ocean, an essential process for regulating atmospheric CO2 levels and mitigating global warming. As plankton and detritus play pivotal roles in the ocean's carbon pump, understanding their distribution in different environmental conditions is crucial for assessing the resilience of marine ecosystems and their ability to mitigate or exacerbate climate change effects (e.g., Le Quéré et al., 2016; Rohr et al., 2023). Through these integrated models, the dataset offers a robust framework for exploring the complex feedback mechanisms between marine biological communities and biogeochemical processes, advancing our ability to predict future changes in marine ecosystems under varying environmental scenarios.
5.4 Moving forward: future development
Future classification should focus its efforts on sorting the detritus category, as a recent study highlights that sinking speed estimated for various particle categories varies with particle morphology (Trudnowska et al., 2022; Soviadan et al., 2025) or that mesoscale activities mix them vertically according to their morphology (Accardo et al., 2025). In addition, they represent a very high proportion in abundance and probably of organic biomass compared to the plankton. Additionally, the specific classification of detritus particles, such as fecal pellets and their associated zooplankton communities, will enhance our understanding of their dynamics, improve the accuracy of carbon flux calculations, and refine their representation in biogeochemical models (Perhirin et al., 2025). Therefore, classifying particles based on their traits could provide valuable new insights into their origin and role in the carbon cycle through the gravitational pump (Boyd et al., 2019). When it comes to zooplankton, recent studies revealed that analyzing their traits, such as body size, morphology, and metabolic rates, which significantly influence their ecological roles and interactions within marine ecosystems, provides a framework for linking organismal characteristics to ecosystem functions, offering deeper insights into zooplankton behavior, community structure, and their contributions to biogeochemical cycles (Titocci et al., 2025).
Transfer learning has shown promising potential in leveraging existing datasets to enhance training for improved recognition tasks. By utilizing the present dataset as a model training for machine learning and artificial intelligence (AI) techniques can be employed to better classify and extract relevant features (Lumini and Nanni, 2019; Irisson et al., 2022). Specifically, AI could play a key role in sorting and categorizing the 7 000 000 detritus images in the dataset, enhancing the processing of the remaining 5598 UVP5 profiles and their corresponding 70 million images. Furthermore, integrating existent profiles with those acquired in the future, such as the anticipated 500 annually for UVP5 and 5000 annually for the new version of the UVP (UVP6LP and HD; Picheral et al., 2022), into the observation system will enhance the robustness of the database, ensuring its adaptability and scalability for future data handling and feature extraction. This observation effort is supported by GOOS (Dexter and Summerhayes, 2010) and already in operation in large-scale observing programs, like the Bio-GO-SHIP (Clayton et al., 2022) or possibly by the BGC-Argo (Claustre et al., 2020) program. Having better embedded classifiers is particularly important for BGC Argo for which the floats and the cameras are not recovered. The new UVP6, which can be attached or associated with different platforms, is now widespread distributed and has allowed the acquisition of innumerable profiles and 87 millions of images in the last 4 years since its commercialization in 2020. These advancements will ultimately contribute to more efficient data analysis and support the continuous improvement of environmental monitoring systems.
Table A1List of the 62 projects included in the present study, with ther corresponding project identification (pprojid), project title indicating UVP model and serial number (ptitle), data owner, project number identification in EcoTaxa (projid), the project name (title) and license registered on EcoTaxa (https://ecotaxa.obs-vlfr.fr/J, last access: 31 January 2025).
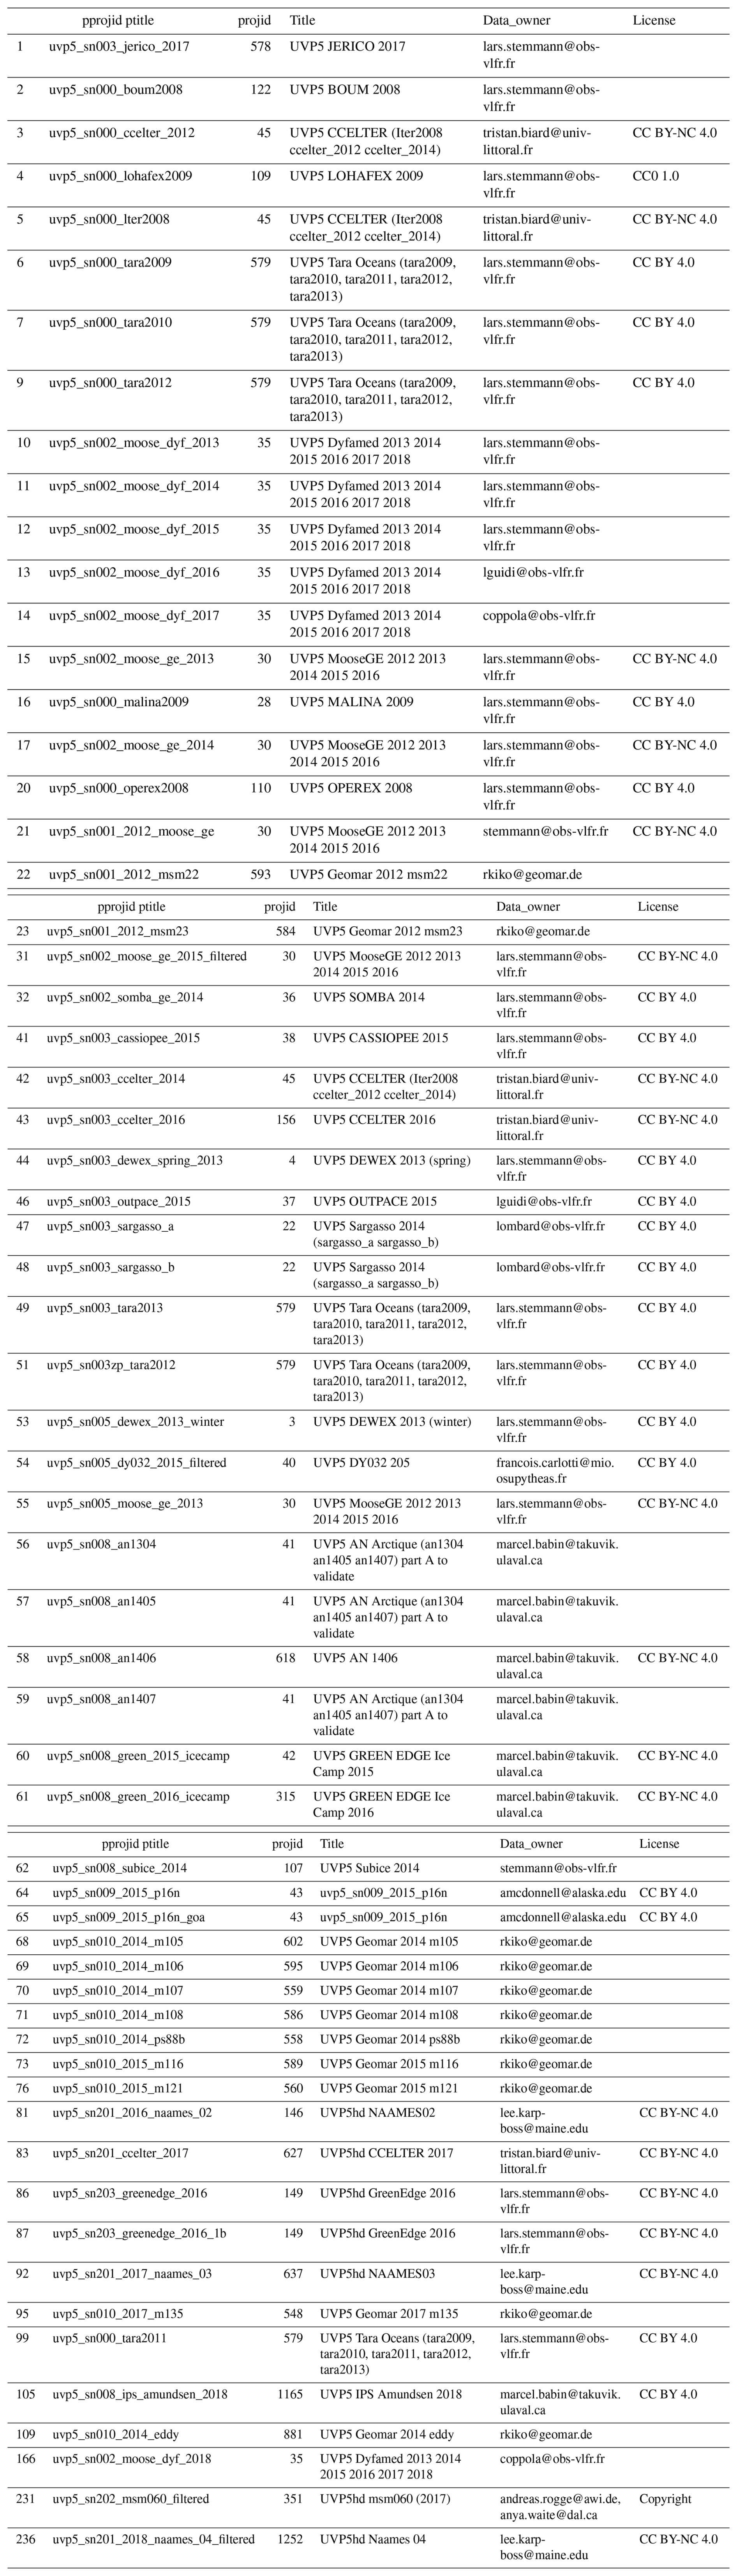
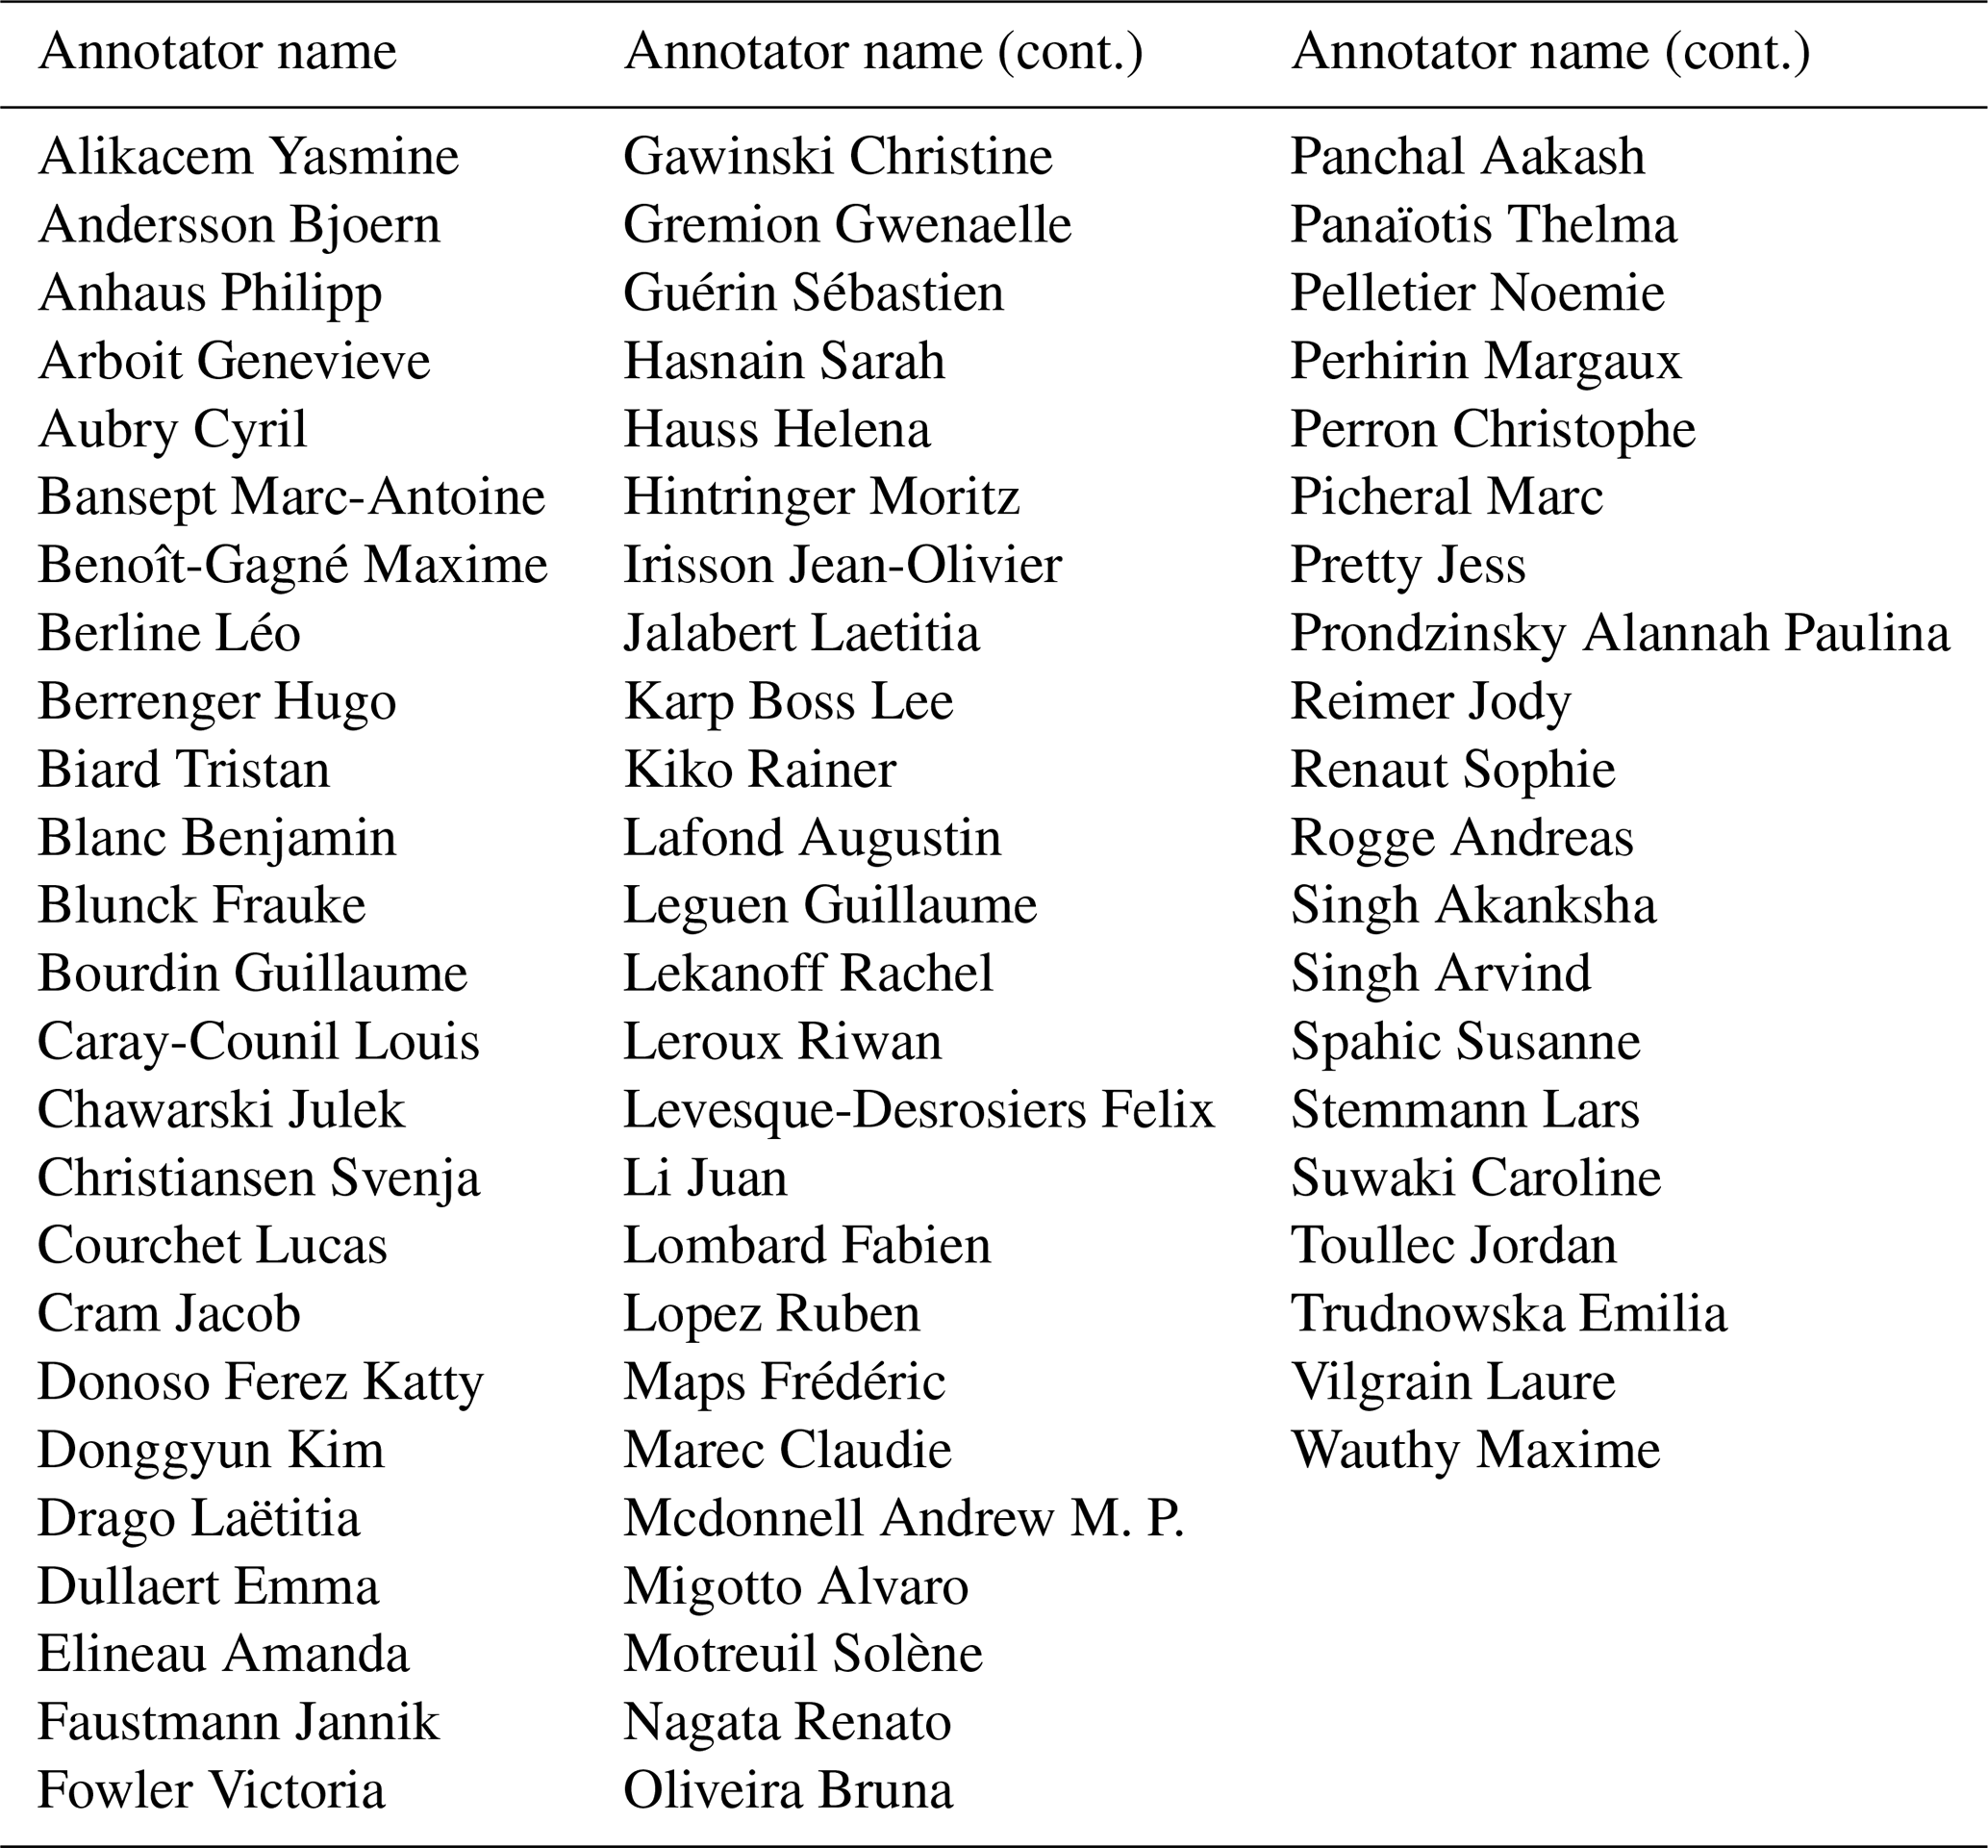
Table A2List of annotators involved in the classification of objects within the current UVP5 dataset.
Quantile-to-quantile transformation function. The R function below is recommended to be used to adjust the distribution of morphological features from UVP5 version with sn000 to match that of the other serial numbers (see Sect. 2.1.2).
ACN, JOI and LS formulated the goals for dataset presentation, quality control and the publication of a global UVP5 dataset and their respective images. LS and MP led the community effort supported by all UVP managers and quality control endeavours, supported by all co-authors. ACN and LS conceived and drafted the article. All authors participated in writing the article.
The contact author has declared that none of the authors has any competing interests.
Publisher's note: Copernicus Publications remains neutral with regard to jurisdictional claims made in the text, published maps, institutional affiliations, or any other geographical representation in this paper. The authors bear the ultimate responsibility for providing appropriate place names. Views expressed in the text are those of the authors and do not necessarily reflect the views of the publisher.
We are grateful for the ship time provided by the respective institutions and programmes and we would like to thank all scientists, officers and crew of the various R/V which took part in UVP5 data collection.
We acknowledge the MOOSE programme (Mediterranean Ocean Observing System for the Environment) coordinated by CNRS - INSU and the Research Infrastructure ILICO (CNRS-IFREMER). Jean-Olivier Irisson acknowledges support by the Belmont Forum (grant no. ANR-18-BELM-0003-01). Rainer Kiko, Lars Stemmann and Laetitia Drago received support from the European Union project TRIATLAS (European Union Horizon 2020 Programme, grant agreement 817578). We also thank the National Science Foundation grant nos. OCE-10-26607, OCE-1637632 and OCE-1614359 which supported the CCE-LTER site.
Rainer Kiko furthermore acknowledges support via a Make Our Planet Great Again grant from the French National Research Agency (ANR) within the Programme d'Investissements d'Avenir (grant no. ANR-19-MOPGA-0012) and funding from the Heisenberg Programme of the German Science Foundation (grant no. KI 1387/5-1). Andreas Rogge was funded by the PACES II (Polar Regions and Coasts in a Changing Earth System) programme of the Helmholtz Association, the INSPIRES programme of the Alfred Wegener Institute Helmholtz Centre for Polar and Marine Research, and the DFG Priority Program SPP 1158 “Antarctic Research with comparative investigations in Arctic ice areas” (project number 562122740). Lars Stemmann was supported by the CNRS/Sorbonne University Chair VISION to initiate the global observation and the Chair PLACARDO at the Institut de France. This project has received funding from the European Union's Horizon 2020 research and innovation programme under grant agreement no. 862923. Ariadna C. Nocera was supported by a postdoctoral fellowship from the National Scientific and Technical Research Council of Argentina. Laetitia Drago received funding from Sorbonne Université through the Ecole doctorale 129 as well as Horizon Europe RIA under grant no. 101081273 (NECCTON project) for her post-doctoral research funding.
This paper was edited by Sabine Schmidt and reviewed by two anonymous referees.
Accardo, A., Laxenaire, R., Baudena, A., Speich, S., Kiko, R., and Stemmann, L.: Intense and localized export of selected marine snow types at eddy edges in the South Atlantic Ocean, Biogeosciences, 22, 1183–1201, https://doi.org/10.5194/bg-22-1183-2025, 2025.
Atherden, F., Slomska, A., and Manno, C.: Sediment trap illustrates taxon-specific seasonal signals in Southern Ocean zooplankton, Mar. Biol., 171, 173, https://doi.org/10.1007/s00227-024-04487-2, 2024.
Barth, A. and Stone, J.: Comparison of an in situ imaging device and net-based method to study mesozooplankton communities in an oligotrophic system, Front. Mar. Sci., 9, 898057, https://doi.org/10.3389/fmars.2022.898057, 2022.
Barth, A., Walter, R. K., Robbins, I., and Pasulka, A.: Seasonal and interannual variability of phytoplankton abundance and community composition on the Central Coast of California, Mar. Ecol. Prog.-Ser., 637, 29–43, https://doi.org/10.3354/meps13245, 2020.
Biard, T. and Ohman, M. D.: Vertical niche definition of test-bearing protists (Rhizaria) into the twilight zone revealed by in situ imaging, Limnol. Oceanogr., 65, 2583–2602, https://doi.org/10.1002/lno.11472, 2020.
Biard, T., Stemmann, L., Picheral, M., Mayot, N., Vandromme, P., Hauss, H., Gorsky, G., Guidi, L., Kiko, R., and Not, F.: In situ imaging reveals the biomass of giant protists in the global ocean, Nature, 532, 504–507, https://doi.org/10.1038/nature17652, 2016.
Boyd, P. W., Claustre, H., Levy, M., Siegel, D. A., and Weber, T.: Multi-faceted particle pumps drive carbon sequestration in the ocean, Nature, 568, 327–335, https://doi.org/10.1038/s41586-019-1098-2, 2019.
Calbet, A.: Sampling plankton, in: The Wonders of Marine Plankton, Springer Nature Switzerland, Cham, 131–136, https://doi.org/10.1007/978-3-031-50766-3, 2024.
Christiansen, S., Hoving, H.-J., Schütte, F., Hauss, H., Karstensen, J., Körtzinger, A., Schröder, S.-M., Stemmann, L., Christiansen, B., Picheral, M., Brandt, P., Robison, B., Koch, R., and Kiko, R.: Particulate matter flux interception in oceanic mesoscale eddies by the polychaete Poeobius sp., Limnol. Oceanogr., 63, 2093–2109, https://doi.org/10.1002/lno.10926, 2018.
Claustre, H., Johnson, K. S., and Takeshita, Y.: Observing the global ocean with biogeochemical-Argo, Annu. Rev. Mar. Sci., 12, 23–48, https://doi.org/10.1146/annurev-marine-010419-010956, 2020.
Clayton, S., Alexander, H., Graff, J. R., Poulton, N. J., Thompson, L. R., Benway, H., Boss, E., and Martiny, A.: Bio-GO-SHIP: the time is right to establish global repeat sections of ocean biology, Front. Mar. Sci., 8, 767443, https://doi.org/10.3389/fmars.2021.767443, 2022.
Clements, D. J., Yang, S., Weber, T., McDonnell, A. M. P., Kiko, R., Stemmann, L., and Bianchi, D.: Constraining the particle size distribution of large marine particles in the global ocean with in situ optical observations and supervised learning, Global Biogeochem. Cy., 36, e2021GB007276, https://doi.org/10.1029/2021GB007276, 2022.
Clements, D. J., Yang, S., Weber, T., McDonnell, A. M. P., Kiko, R., Stemmann, L., and Bianchi, D.: New estimate of organic carbon export from optical measurements reveals the role of particle size distribution and export horizon, Global Biogeochem. Cy., 37, e2022GB007633, https://doi.org/10.1029/2022GB007633, 2023.
Constable, A. J., Melbourne-Thomas, J., Corney, S. P., Arrigo, K. R., Barbraud, C., Barnes, D. K. A., Bindoff, N. L., Boyd, P. W., Brandt, A., Costa, D. P., Davidson, A. T., Ducklow, H. W., Emmerson, L., Fukuchi, M., Gutt, J., Hindell, M. A., Hofmann, E. E., Hosie, G. W., Iida, T., Jacob, S., Johnston, N. M., Kawaguchi, S., Kokubun, N., Koubbi, P., Lea, M.-A., Makhado, A., Massom, R. A., Meiners, K., Meredith, M. P., Murphy, E. J., Nicol, S., Reid, K., Richerson, K., Riddle, M. J., Rintoul, S. R., Smith Jr., W. O., Southwell, C., Stark, J. S., Sumner, M., Swadling, K. M., Takahashi, K. T., Trathan, P. N., Welsford, D. C., Weimerskirch, H., Westwood, K. J., Wienecke, B. C., Wolf-Gladrow, D., Wright, S. W., Xavier, J. C., and Ziegler, P.: Climate change and Southern Ocean ecosystems I: how changes in physical habitats directly affect marine biota, Global Change Biol., 20, 3004–3025, https://doi.org/10.1111/gcb.12623, 2014.
Culverhouse, P. F.: Natural object categorization: man versus machine, in: Automated Taxon Identification in Systematics: Theory, Approaches and Applications, edited by: MacLeod, N., CRC Press, Boca Raton, 25–46, https://doi.org/10.1201/9781420008074, 2007.
Culverhouse, P. F., MacLeod, N., Williams, R., Benfield, M. C., Lopes, R. M., and Picheral, M.: An empirical assessment of the consistency of taxonomic identifications, Mar. Biol. Res., 10, 73–84, https://doi.org/10.1080/17451000.2013.810762, 2014.
D'Alelio, D., Libralato, S., Wyatt, T., and Ribera d'Alcalà, M.: Ecological-network models link diversity, structure and function in the plankton food-web, Sci. Rep., 6, 21806, https://doi.org/10.1038/srep21806, 2016.
Dam, H. G. and Baumann, H.: Climate change, zooplankton and fisheries, in: Climate Change Impacts on Fisheries and Aquaculture: A Global Analysis, Vol. 2, edited by: Phillips, B. F. and Pérez-Ramírez, M., John Wiley & Sons, Chichester, 851–874, https://doi.org/10.1002/9781119154051.ch25, 2017.
Davis, C. S., Thwaites, F. T., Gallager, S. M., and Hu, Q.: A three-axis fast-tow digital Video Plankton Recorder for rapid surveys of plankton taxa and hydrography, Limnol. Oceanogr.-Meth., 3, 59–74, https://doi.org/10.4319/lom.2005.3.59, 2005.
Dexter, P. and Summerhayes, C. P.: Ocean observations – the Global Ocean Observing System (GOOS), in: Troubled Waters: Ocean Science and Governance, edited by: Holland, G. and Pugh, D., Cambridge University Press, Cambridge, 161–178, ISBN 978-0-521-76581-7, 2010.
Doney, S. C., Ruckelshaus, M., Duffy, J. E., Barry, J. P., Chan, F., English, C. A., Galindo, H. M., Grebmeier, J. M., Hollowed, A. B., Knowlton, N., Polovina, J., Rabalais, N. N., Sydeman, W. J., and Talley, L. D.: Climate change impacts on marine ecosystems, Annu. Rev. Mar. Sci., 4, 11–37, https://doi.org/10.1146/annurev-marine-041911-111611, 2012.
Drago, L., Panaïotis, T., Irisson, J.-O., Babin, M., Biard, T., Carlotti, F., Coppola, L., Guidi, L., Hauss, H., Karp-Boss, L., Lombard, F., McDonnell, A. M. P., Picheral, M., Rogge, A., Waite, A. M., Stemmann, L., and Kiko, R.: Global distribution of zooplankton biomass estimated by in situ imaging and machine learning, Front. Mar. Sci., 9, 894372, https://doi.org/10.3389/fmars.2022.894372, 2022.
Dugenne, M., Corrales-Ugalde, M., Luo, J. Y., Kiko, R., O'Brien, T. D., Irisson, J.-O., Lombard, F., Stemmann, L., Stock, C., Anderson, C. R., Babin, M., Bhairy, N., Bonnet, S., Carlotti, F., Cornils, A., Crockford, E. T., Daniel, P., Desnos, C., Drago, L., Elineau, A., Fischer, A., Grandrémy, N., Grondin, P.-L., Guidi, L., Guieu, C., Hauss, H., Hayashi, K., Huggett, J. A., Jalabert, L., Karp-Boss, L., Kenitz, K. M., Kudela, R. M., Lescot, M., Marec, C., McDonnell, A., Mériguet, Z., Niehoff, B., Noyon, M., Panaïotis, T., Peacock, E., Picheral, M., Riquier, E., Roesler, C., Romagnan, J.-B., Sosik, H. M., Spencer, G., Taucher, J., Tilliette, C., and Vilain, M.: First release of the Pelagic Size Structure database: global datasets of marine size spectra obtained from plankton imaging devices, Earth Syst. Sci. Data, 16, 2971–2999, https://doi.org/10.5194/essd-16-2971-2024, 2024.
Du Pontavice, H., Gascuel, D., Reygondeau, G., Maureaud, A., and Cheung, W. W. L.: Climate change undermines the global functioning of marine food webs, Global Change Biol., 26, 1306–1318, https://doi.org/10.1111/gcb.14944, 2020.
Dupouy, C., Frouin, R., Tedetti, M., Maillard, M., Rodier, M., Lombard, F., Guidi, L., Picheral, M., Neveux, J., Duhamel, S., Charrière, B., and Sempéré, R.: Diazotrophic Trichodesmium impact on UV–Vis radiance and pigment composition in the western tropical South Pacific, Biogeosciences, 15, 5249–5269, https://doi.org/10.5194/bg-15-5249-2018, 2018.
Fernández-Carrera, A., Kiko, R., Hauss, H., Hamilton, D. S., Achterberg, E. P., Montoya, J. P., Dengler, M., Brandt, P., and Subramaniam, A.: Nitrogen fixation rates in the Guinea Dome and the equatorial upwelling regions in the Atlantic Ocean, Biogeochemistry, 166, 191–210, https://doi.org/10.1007/s10533-023-01089-w, 2023.
Forest, A., Stemmann, L., Picheral, M., Burdorf, L., Robert, D., Fortier, L., and Babin, M.: Size distribution of particles and zooplankton across the shelf-basin system in southeast Beaufort Sea: combined results from an Underwater Vision Profiler and vertical net tows, Biogeosciences, 9, 1301–1320, https://doi.org/10.5194/bg-9-1301-2012, 2012.
Giering, S. L. C., Culverhouse, P. F., Johns, D. G., McQuatters-Gollop, A., and Pitois, S. G.: Are plankton nets a thing of the past? An assessment of in situ imaging of zooplankton for large-scale ecosystem assessment and policy decision-making, Front. Mar. Sci., 9, 986206, https://doi.org/10.3389/fmars.2022.986206, 2022.
Goswami, S. C.: Zooplankton methodology, collection & identification – a field manual, National Institute of Oceanography, Goa, India, 26 pp., http://drs.nio.org/drs/handle/2264/95 (last access: 31 January 2025), 2004.
Guidi, L., Calil, P. H. R., Duhamel, S., Björkman, K. M., Doney, S. C., Jackson, G. A., Li, B., Church, M. J., Tozzi, S., Kolber, Z. S., Richards, K. J., Fong, A. A., Letelier, R. M., Gorsky, G., Stemmann, L., and Karl, D. M.: Does eddy-eddy interaction control surface phytoplankton distribution and carbon export in the North Pacific Subtropical Gyre?, J. Geophys. Res.-Biogeo., 117, G02024, https://doi.org/10.1029/2012JG001984, 2012.
Hauss, H., Christiansen, S., Schütte, F., Kiko, R., Edvam Lima, M., Rodrigues, E., Karstensen, J., Löscher, C. R., Körtzinger, A., and Fiedler, B.: Dead zone or oasis in the open ocean? Zooplankton distribution and migration in low-oxygen modewater eddies, Biogeosciences, 13, 1977–1989, https://doi.org/10.5194/bg-13-1977-2016, 2016.
Hays, G. C., Richardson, A. J., and Robinson, C.: Climate change and marine plankton, Trends Ecol. Evol., 20, 337–344, https://doi.org/10.1016/j.tree.2005.03.004, 2005.
Irisson, J.-O., Ayata, S.-D., Lindsay, D. J., Karp-Boss, L., and Stemmann, L.: Machine learning for the study of plankton and marine snow from images, Annu. Rev. Mar. Sci., 14, 277–301, https://doi.org/10.1146/annurev-marine-041921-013023, 2022.
Karsenti, E., Acinas, S. G., Bork, P., Bowler, C., de Vargas, C., Raes, J., Sullivan, M., Arendt, D., Benzoni, F., Claverie, J.-M., Follows, M., Gorsky, G., Hingamp, P., Iudicone, D., Jaillon, O., Kandels-Lewis, S., Krzic, U., Not, F., Ogata, H., Pesant, S., Reynaud, E. G., Sardet, C., Sieracki, M. E., Speich, S., Velayoudon, D., Weissenbach, J., Wincker, P., and the Tara Oceans Consortium: A holistic approach to marine eco-systems biology, PLoS Biol., 9, e1001177, https://doi.org/10.1371/journal.pbio.1001177, 2011.
Kiko, R., Biastoch, A., Brandt, P., Cravatte, S., Hauss, H., Hummels, R., Kriest, I., Marin, F., McDonnell, A. M. P., Oschlies, A., Picheral, M., Schwarzkopf, F. U., Thurnherr, A. M., and Stemmann, L.: Biological and physical influences on marine snowfall at the equator, Nat. Geosci., 10, 852–858, https://doi.org/10.1038/ngeo3042, 2017.
Kiko, R., Picheral, M., Antoine, D., Babin, M., Berline, L., Biard, T., Boss, E., Brandt, P., Carlotti, F., Christiansen, S., Coppola, L., de la Cruz, L., Diamond-Riquier, E., Durrieu de Madron, X., Elineau, A., Gorsky, G., Guidi, L., Hauss, H., Irisson, J.-O., Karp-Boss, L., Karstensen, J., Kim, D., Lekanoff, R. M., Lombard, F., Lopes, R. M., Marec, C., McDonnell, A. M. P., Niemeyer, D., Noyon, M., O'Daly, S. H., Ohman, M. D., Pretty, J. L., Rogge, A., Searson, S., Shibata, M., Tanaka, Y., Tanhua, T., Taucher, J., Trudnowska, E., Turner, J. S., Waite, A., and Stemmann, L.: A global marine particle size distribution dataset obtained with the Underwater Vision Profiler 5, Earth Syst. Sci. Data, 14, 4315–4337, https://doi.org/10.5194/essd-14-4315-2022, 2022.
Kiko, R., Lopes, R. M., Soviadan, Y. D., and Stemmann, L.: Towards a distributed and operational pelagic imaging network, Ocean Coast. Res., 71, e23058, https://doi.org/10.1590/2675-2824071.23109rk, 2023.
Laget, M., Drago, L., Panaïotis, T., Kiko, R., Stemmann, L., Rogge, A., Llopis-Monferrer, N., Leynaert, A., Irisson, J.-O., and Biard, T.: Global census of the significance of giant mesopelagic protists to the marine carbon and silicon cycles, Nat. Commun., 15, 3341, https://doi.org/10.1038/s41467-024-47651-4, 2024.
Le Quéré, C., Buitenhuis, E. T., Moriarty, R., Alvain, S., Aumont, O., Bopp, L., Chollet, S., Enright, C., Franklin, D. J., Geider, R. J., Harrison, S. P., Hirst, A. G., Larsen, S., Legendre, L., Platt, T., Prentice, I. C., Rivkin, R. B., Sailley, S., Sathyendranath, S., Stephens, N., Vogt, M., and Vallina, S. M.: Role of zooplankton dynamics for Southern Ocean phytoplankton biomass and global biogeochemical cycles, Biogeosciences, 13, 4111–4133, https://doi.org/10.5194/bg-13-4111-2016, 2016.
Llopis Monferrer, N., Biard, T., Sandin, M. M., Lombard, F., Picheral, M., Elineau, A., Guidi, L., Leynaert, A., Tréguer, P. J., and Not, F.: Siliceous Rhizaria abundances and diversity in the Mediterranean Sea assessed by combined imaging and metabarcoding approaches, Front. Mar. Sci., 9, 895995, https://doi.org/10.3389/fmars.2022.895995, 2022.
Lombard, F., Boss, E., Waite, A. M., Vogt, M., Uitz, J., Stemmann, L., Sosik, H. M., Schulz, J., Romagnan, J.-B., Picheral, M., Pearlman, J., Ohman, M. D., Niehoff, B., Möller, K. O., Miloslavich, P., Lara-Lpez, A., Kudela, R., Lopes, R. M., Kiko, R., Karp-Boss, L., Jaffe, J. S., Iversen, M. H., Irisson, J.-O., Fennel, K., Hauss, H., Guidi, L., Gorsky, G., Giering, S. L. C., Gaube, P., Gallager, S., Dubelaar, G., Cowen, R. K., Carlotti, F., Briseño-Avena, C., Berline, L., Benoit-Bird, K., Bax, N., Batten, S., Ayata, S. D., Artigas, L. F., and Appeltans, W.: Globally consistent quantitative observations of planktonic ecosystems, Front. Mar. Sci., 6, 196, https://doi.org/10.3389/fmars.2019.00196, 2019.
Lumini, A. and Nanni, L.: Deep learning and transfer learning features for plankton classification, Ecol. Inform., 51, 33–43, https://doi.org/10.1016/j.ecoinf.2019.02.007, 2019.
Möller, K. O., St. John, M., Temming, A., Floeter, J., Sell, A. F., Herrmann, J.-P., and Möllmann, C.: Marine snow, zooplankton and thin layers: indications of a trophic link from small-scale sampling with the Video Plankton Recorder, Mar. Ecol. Prog.-Ser., 468, 57–69, https://doi.org/10.3354/meps09984, 2012.
Moriarty, R. and O'Brien, T. D.: Distribution of mesozooplankton biomass in the global ocean, Earth Syst. Sci. Data, 5, 45–55, https://doi.org/10.5194/essd-5-45-2013, 2013.
Muller-Karger, F. E., Miloslavich, P., Bax, N. J., Simmons, S., Costello, M. J., Sousa Pinto, I., Canonico, G., Turner, W., Gill, M., Montes, E., Best, B. D., Pearlman, J., Halpin, P., Dunn, D., Benson, A., Martin, C. S., Weatherdon, L. V., Appeltans, W., Provoost, P., Klein, E., Kelble, C. R., Miller, R. J., Chavez, F. P., Iken, K., Chiba, S., Obura, D., Navarro, L. M., Pereira, H. M., Allain, V., Batten, S., Benedetti-Checchi, L., Duffy, J. E., Kudela, R. M., Rebelo, L.-M., Shin, Y., and Geller, G.: Advancing marine biological observations and data requirements of the complementary essential ocean variables (EOVs) and essential biodiversity variables (EBVs) frameworks, Front. Mar. Sci., 5, 211, https://doi.org/10.3389/fmars.2018.00211, 2018.
Nocera, A. C., Stemmann, L., Babin, M., Biard, T., Coustenoble, J., Carlotti, F., Coppola, L., Courchet, L., Drago, L., Elineau, A., Guidi, L., Hauss, H., Jalabert, L., Karp-Boss, L., Kiko, R., Laget, M., Lombard, F., McDonnell, A., Merland, C., Motreuil, S., Panaïotis, T., Picheral, M., Rogge, A., Waite, A., and Irisson, J.-O.: A global consistent database of plankton and detritus from in situ imaging by the Underwater Vision Profiler 5, SEANOE [data set], https://doi.org/10.17882/107583, 2025.
Panaïotis, T., Babin, M., Biard, T., Carlotti, F., Coppola, L., Guidi, L., Hauss, H., Karp-Boss, L., Kiko, R., Lombard, F., McDonnell, A. M. P., Picheral, M., Rogge, A., Waite, A. M., Stemmann, L., and Irisson, J.-O.: Three major mesoplanktonic communities resolved by in situ imaging in the upper 500 m of the global ocean, Global Ecol. Biogeogr., 32, 1991–2005, https://doi.org/10.1111/geb.13741, 2023.
Perhirin, M., Vilgrain, L., Perrin, G., Lalande, C., Picheral, M., Maps, F., and Ayata, S.-D.: Identifying zooplankton fecal pellets from in situ images, J. Plankton Res., 47, fbae078, https://doi.org/10.1093/plankt/fbae078, 2025.
Picheral, M. and Mériguet, Z.: Description of the metadata and data issued from the Zooprocess and UVPapp applications and imported or exported from the Ecotaxa application, Zenodo [data set], https://doi.org/10.5281/zenodo.18165549, 2026.
Picheral, M., Guidi, L., Stemmann, L., Karl, D. M., Iddaoud, G., and Gorsky, G.: The Underwater Vision Profiler 5: An advanced instrument for high spatial resolution studies of particle size spectra and zooplankton, Limnol. Oceanogr.-Meth., 8, 462–473, https://doi.org/10.4319/lom.2010.8.462, 2010.
Picheral, M., Colin, S., and Irisson, J.-O.: EcoTaxa, a tool for the taxonomic classification of images, https://ecotaxa.obs-vlfr.fr (last access: 28 September 2026), 2017.
Picheral, M., Catalano, C., Brousseau, D., Claustre, H., Coppola, L., Leymarie, E., Coindat, J., Dias, F., Fevre, S., Guidi, L., Irisson, J.-O., Legendre, L., Lombard, F., Mortier, L., Penkerch, C., Rogge, A., Schmechtig, C., Thibault, S., Tixier, T., Waite, A., and Stemmann, L.: The Underwater Vision Profiler 6: an imaging sensor of particle size spectra and plankton, for autonomous and cabled platforms, Limnol. Oceanogr.-Meth., 20, 115–129, https://doi.org/10.1002/lom3.10475, 2022.
Rohr, T., Richardson, A. J., Lenton, A., Chamberlain, M. A., and Shadwick, E. H.: Zooplankton grazing is the largest source of uncertainty for marine carbon cycling in CMIP6 models, Commun. Earth Environ., 4, 212, https://doi.org/10.1038/s43247-023-00871-w, 2023.
Sandel, V., Kiko, R., Brandt, P., Dengler, M., Stemmann, L., Vandromme, P., Sommer, U., and Hauss, H.: Nitrogen fuelling of the pelagic food web of the tropical Atlantic, PLoS ONE, 10, e0131258, https://doi.org/10.1371/journal.pone.0131258, 2015.
Siegel, D. A., Burd, A. B., Estapa, M. L., Fields, E., Johnson, L., Passow, U., Romanelli, E., Brzezinski, M. A., Buesseler, K. O., Clevenger, S. J., and Cetinić, I.: Assessing marine snow dynamics during the demise of the North Atlantic spring bloom using in situ particle imagery, Global Biogeochem. Cy., 39, e2025GB008676, https://doi.org/10.1029/2025GB008676, 2025.
Soviadan, Y. D., Dugenne, M., Drago, L., Biard, T., Trudnowska, E., Lombard, F., Romagnan, J.-B., Jamet, J.-L., Kiko, R., Gorsky, G., and Stemmann, L.: Combining in situ and ex situ plankton image data to reconstruct zooplankton (>1 mm) volume and mass distribution in the global ocean, J. Plankton Res., 46, 461–474, https://doi.org/10.1093/plankt/fbae046, 2024.
Soviadan, Y. D., Beck, M., Habib, J., Baudena, A., Drago, L., Accardo, A., Laxenaire, R., Speich, S., Brandt, P., Kiko, R., and Stemmann, L.: Marine snow morphology drives sinking and attenuation in the ocean interior, Biogeosciences, 22, 3485–3501, https://doi.org/10.5194/bg-22-3485-2025, 2025.
Steinberg, D. K. and Landry, M. R.: Zooplankton and the ocean carbon cycle, Annu. Rev. Mar. Sci., 9, 413–444, https://doi.org/10.1146/annurev-marine-010814-015924, 2017.
Stemmann, L. and Boss, E.: Plankton and particle size and packaging: from determining optical properties to driving the biological pump, Annu. Rev. Mar. Sci., 4, 263–290, https://doi.org/10.1146/annurev-marine-120710-100853, 2012.
Stemmann, L., Youngbluth, M., Robert, K., Hosia, A., Picheral, M., Paterson, H., Ibanez, F., Guidi, L., Lombard, F., and Gorsky, G.: Global zoogeography of fragile macrozooplankton in the upper 100–1000 m inferred from the underwater video profiler, ICES J. Mar. Sci., 65, 433–442, https://doi.org/10.1093/icesjms/fsn010, 2008.
Suthers, I. M., Redden, A. M., Bowling, L., Kobayashi, T., and Rissik, D.: Plankton processes and the environment, in: Plankton: A Guide to Their Ecology and Monitoring for Water Quality, 2nd Edn., edited by: Suthers, I. M., Rissik, D., and Richardson, A. J., CSIRO Publishing, Clayton South, Australia, 21–35, ISBN 486308805, 2019.
Titocci, J., Pata, P. R., Durazzano, T., Ayata, S.-D., Clerc, C., Cornils, A., Duffy, P., Greer, A. T., Halsband, C., Heneghan, R. F., Lacoursière-Roussel, A., Lombard, F., Majaneva, S., Pakhomov, E. A., Reis, C., Rist, S., Rommel, A. C., Silva, T., Stemmann, L., Ugwu, K., Basset, A., Rosati, I., Murphy, K. J., and Hunt, B. P. V.: Pathways for converting zooplankton traits to ecological insights are paved with findable, accessible, interoperable, and reusable (FAIR) data practices, ICES J. Mar. Sci., 82, fsaf017, https://doi.org/10.1093/icesjms/fsaf017, 2025.
Trudnowska, E., Lacour, L., Ardyna, M., Rogge, A., Irisson, J.-O., Waite, A. M., Babin, M., and Stemmann, L.: Marine snow morphology illuminates the evolution of phytoplankton blooms and determines their subsequent vertical export, Nat. Commun., 12, 2816, https://doi.org/10.1038/s41467-021-22994-4, 2021.
Trudnowska, E., Dragańska-Deja, K., Sagan, S., and Błachowiak-Samołyk, K.: Cells of matter and life – towards understanding the structuring of particles and plankton patchiness in the Arctic fjords, Front. Mar. Sci., 9, 909457, https://doi.org/10.3389/fmars.2022.909457, 2022.
Turner, J. T.: Zooplankton fecal pellets, marine snow, phytodetritus and the ocean's biological pump, Prog. Oceanogr., 130, 205–248, https://doi.org/10.1016/j.pocean.2014.08.005, 2015.
Vilgrain, L., Maps, F., Picheral, M., Babin, M., Aubry, C., Irisson, J.-O., and Ayata, S.-D.: Trait-based approach using in situ copepod images reveals contrasting ecological patterns across an Arctic ice melt zone, Limnol. Oceanogr., 66, 1155–1167, https://doi.org/10.1002/lno.11672, 2021.
Yebra, L., Puerto, M., Valcárcel-Pérez, N., Putzeys, S., Gómez-Jakobsen, F., García-Gómez, C., and Mercado, J. M.: Spatio-temporal variability of the zooplankton community in the SW Mediterranean 1992–2020: Linkages with environmental drivers, Prog. Oceanogr., 203, 102782, https://doi.org/10.1016/j.pocean.2022.102782, 2022.