the Creative Commons Attribution 4.0 License.
the Creative Commons Attribution 4.0 License.
 | 08 Sep 2026
Building a dataset of offshore oil and gas extraction platforms from satellite data (2017–2023)
Lulu Si

Shanyu Zhou
Itziar Irakulis-Loitxate
Javier Roger
Luis Guanter
Accurate information on the location and operational status of offshore oil and gas platforms (OOGPs) is important to inform decision-making by various stakeholders and to evaluate the environmental impacts of OOGPs. However, existing OOGP databases are often incomplete or contain outdated data. In this work, we used satellite data and the Google Earth Engine (GEE) platform to construct a new database of OOGPs for six major offshore oil and gas basins in the world between 2017 and 2023. We used synthetic aperture radar (SAR) data from the Sentinel-1 satellite mission to detect OOGP candidates due to its high sensitivity to OOGPs, dense spatio-temporal sampling, and global coverage. Our main processing steps comprise the detection of OOGP candidates using monthly averages of SAR recordings and the removal of noise and false positive objects from annual image composites. With the resulting dataset of OOGPs, we mapped the spatiotemporal distribution of OOGPs in the study regions and analyzed the platform status after the post-processing of the platform targets. Using these methods, we identified a total of 5358 OOGPs distributed in six offshore basins: the Gulf of Mexico (GoM) (1593), Persian Gulf (PG) (1437), North Sea (NS) (440), Caspian Sea (CS) (794), Gulf of Guinea (GoG) (460), and Gulf of Thailand (GoT) (634). An independent validation dataset was used to evaluate the performance of the detection algorithm, which achieved precision of 0.95, recall of 0.89, and F1 score of 0.92. This OOGPs dataset substantially enhances and complements the existing offshore platform database in terms of spatial and temporal coverage. From our analysis of this OOGP dataset, we observed that offshore platform activity has declined in regions like the GoM, consistent with documented trends of aging infrastructure and shifting energy investment, while it has expanded in the PG and CS, consistent with ongoing offshore development. These different regional trends highlight the need for targeted environmental oversight and region-specific mitigation strategies. The dataset of this paper can be accessed through https://doi.org/10.5281/zenodo.18350974 (Si et al., 2026).
- Article
(13766 KB) - Full-text XML
-
Supplement
(26541 KB) - BibTeX
- EndNote


Offshore oil and gas platforms (OOGPs) serve as essential infrastructure for energy extraction and are widely used for drilling, extracting, and processing oil and natural gas, as well as for temporarily storing products before transporting them onshore for refining and sale (Tan et al., 2021). With advancements in offshore exploration technology and the depletion of onshore reserves, the continuous development and utilization of offshore oil and gas resources play an increasingly significant role in the global energy structure and economic development (Charfeddine and Barkat, 2020; Wang et al., 2023). According to the International Energy Agency (IEA) World Energy Outlook for 2024, two-thirds of the overall increase in energy demand in 2023 was met by fossil fuels, with oil and natural gas demand projected to peak by 2030 (IEA, 2024). OOGPs are widely distributed globally, with variations in design scale, complexity, and operational condition depending on platform type. Aging infrastructure nearing the end of its service life often faces challenges related to decommissioning due to structural degradation and escalating operational costs. Aging platforms can be repurposed, recycled, or decommissioned through full removal, partial dismantling, or conversion into artificial reefs or aquaculture facilities. However, both operational and decommissioned OOGPs still pose environmental risks (Ekins et al., 2007; Cantle and Bernstein, 2015; Henrion et al., 2015; Irakulis-Loitxate et al., 2022), for example, when decommissioned OOGPs are transported to land for dismantling and recycling, fossil fuel consumption can generate significant marine pollutants, posing serious threats to the ocean environment (Ronconi et al., 2015). Additionally, the removal of platforms, oil and gas processing equipment, and the dredging of accumulated shell mounds and debris beneath the structures can impact water quality (Bernstein, 2015). Moreover, greenhouse gas (GHG) emissions generated by fossil fuels will directly affect the achievement of the global carbon neutral and global warming targets (Alvarez et al., 2018; Nguyen et al., 2016; IPCC, 2018, 2022). Growing concerns about the environmental and socioeconomic impacts of OOGPs have led to an increased demand for effective monitoring (Lee, 2015; Anifowose et al., 2016; Hunt et al., 2022). Consequently, it is important to detect and monitor OOGPs to better understand their operational status and spatiotemporal patterns.
Despite the critical role of offshore infrastructure, publicly accessible and comprehensive datasets remain limited, especially beyond the Northern Gulf of Mexico (NGoM). This lack of data constrains our capability to assess offshore economies and their environmental impacts. While the Oil and Gas Infrastructure Mapping (OGIM) offers an integrated geospatial perspective, its reliance on industry and regulatory data sources results in persistent gaps and delayed updates (Omara et al., 2023). Monitoring OOGPs is further hindered by their remote locations, harsh oceanic conditions, and high operational costs. Missteps can lead to severe consequences, including oil spills, gas leaks, and human injuries. These challenges underscore the need for advanced methods to determine the location and operational status of OOGPs. Remote sensing has emerged as a promising approach, offering large-scale, long-term, high-resolution, and continuous observational capabilities.
Remote sensing imagery provides rich spectral, textural, and temporal information, making it ideal for monitoring OOGPs. In recent years, a variety of remote sensing data has been used to monitor activities on the sea surface (Spanier and Kuenzer, 2024).
The high reflectance characteristics of the metal-concrete structures, along with the high-temperature exhaust gases of OOGPs in the visible and near-infrared bands, enable their automatic extraction in nighttime imagery.
Often, time-series of optical imagery have also been used for the detection of OOGPs (Liu et al., 2016; Zhu et al., 2021). Also thermal infrared bands enable the automatic detection of OOGP's during nighttime overpasses (Casadio et al., 2012; Elvidge et al., 2016; Zhao et al., 2017). However, recordings by passive optical and thermal sensors are limited by weather conditions (e.g. clouds and precipitation), which hinder consistent monitoring. To overcome these limitations, synthetic aperture radar (SAR) represents a promising alternative for extracting OOGPs. SAR wavebands penetrate clouds and enable the detection of metallic objects due to their high conductivity and resulting backscatter (Peng et al., 2011; Casadio et al., 2012; Wang et al., 2013; Falqueto et al., 2019; Wong et al., 2019). Dual-polarization SAR, such as that provided by Sentinel-1, has an even stronger ability to distinguish the details of a facility's structure more accurately. Nonetheless, existing algorithms based on Sentinel-1 SAR data are prone to false positives, especially in complex oceanic surface conditions, partly limiting large-scale and accurate extraction of OOGPs. While supervised machine learning and deep learning methods have been increasingly applied to offshore platform detection and can achieve high local accuracy when sufficient labelled data are available (Chen et al., 2016; Pei et al., 2018; Zhang et al., 2022, 2025; Ma et al., 2023; Falqueto et al., 2019; Spanier et al., 2026), they require extensive annotated training datasets and may experience reduced transferability across regions not represented in the training data (Spanier et al., 2026). Similarly, optical-based methods (Zhu et al., 2021) and approaches using multi-sensor data (Jackson et al., 2026) face operational limitations associated with cloud cover, data availability, and inconsistent acquisition schedules. These constraints collectively limit the feasibility of constructing temporally consistent, multi-basin OOGP datasets, highlighting the need for a scalable and annotation-free mapping workflow.
In this study, we addressed this gap by constructing a comprehensive and openly available spatiotemporal OOGP dataset covering six major offshore basins from 2017 to 2023. To enable this, we developed a semi-automated mapping workflow that allows scalable and systematic platform mapping without requiring labelled training data or concurrent multi-sensor acquisitions. The key contributions of this study include (1) a semi-automated mapping workflow for large-scale OOGP detection based on Sentinel-1 SAR imagery, and (2) the construction of a comprehensive and openly available spatiotemporal OOGP dataset for analyzing spatial distribution patterns and temporal trends from 2017 to 2023.
2.1 Study area
The selection of Regions of Interest (ROI) was primarily based on their relevance to OOGP activities. This study focused on six offshore regions with known high concentrations of OOGP activity according to the OGIM database: the Gulf of Mexico (GoM), Gulf of Thailand (GoT), Caspian Sea (CS), Gulf of Guinea (GoG), Persian Gulf (PG), and North Sea (NS). These areas are globally significant centers of offshore energy production, representing major hubs of offshore industrial infrastructure.
In five of the six regions (GoM, GoT, GoG, PG, and CS), offshore methane plumes have been detected between 2021–2025 based on data from the United Nations Environment Programme (UNEP)'s Methane Alert and Response System (MARS) (https://methanedata.unep.org/, last access: 4 August 2026) and the Carbon Mapper initiative (https://data.carbonmapper.org/, last access: 4 August 2026) (see Fig. 1). These observations provide contextual evidence of active emission sources associated with offshore oil and gas operations in these regions, highlighting the broader need for accurate and up-to-date OOGP inventories to support emission monitoring and attribution efforts. Although no offshore methane plumes were reported in the NS during this period, it is characterized by a high density of oil and gas platforms, as well as a key site for offshore wind infrastructure (Hoeser et al., 2022).
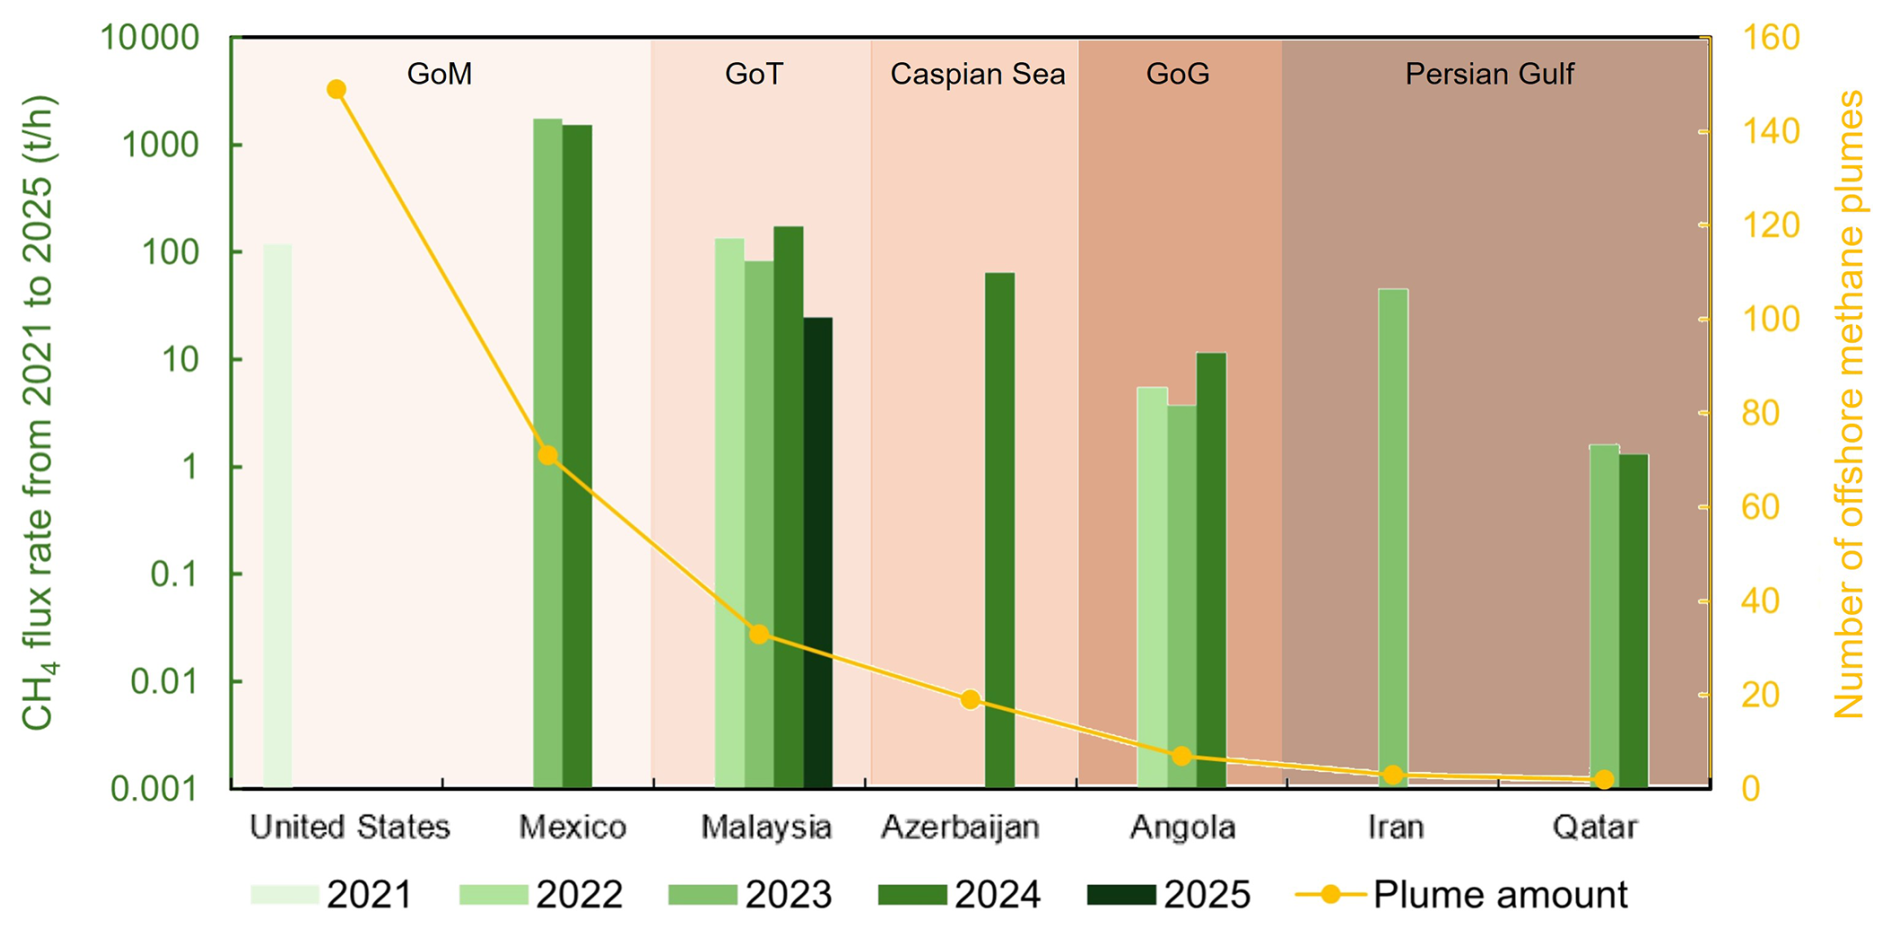
Figure 1Global temporal variation of the total CH4 flux rates from all the emissions and offshore methane plume amount generated by OOGPs in the leading nations from 2021 to 2025.
Together, the inclusion of all six regions ensures comprehensive spatial coverage of major offshore energy hubs and provides a robust foundation for evaluating current methane emissions, offshore infrastructure patterns, and emerging energy transitions.
OOGPs in upstream operations in offshore areas serve as key facilities for the exploration, production, storage, and transportation of oil and gas resources. To better understand the spatial and functional complexity of these installations, it is essential to recognize the diversity of OOGP types deployed in various marine environments. This diversity reflects varying engineering strategies, water depths, and operational requirements across regions. Figure 2 illustrates representative examples of major oil and gas production infrastructure types, highlighting their structural and functional diversity observed in the selected study areas. Understanding the configuration and distribution of these platform types provides an important context for interpreting satellite-detected infrastructure patterns and assessing their environmental footprints. This foundational overview sets the stage for the following sections, which detail the methods used to extract, classify, and analyze OOGPs using satellite data.
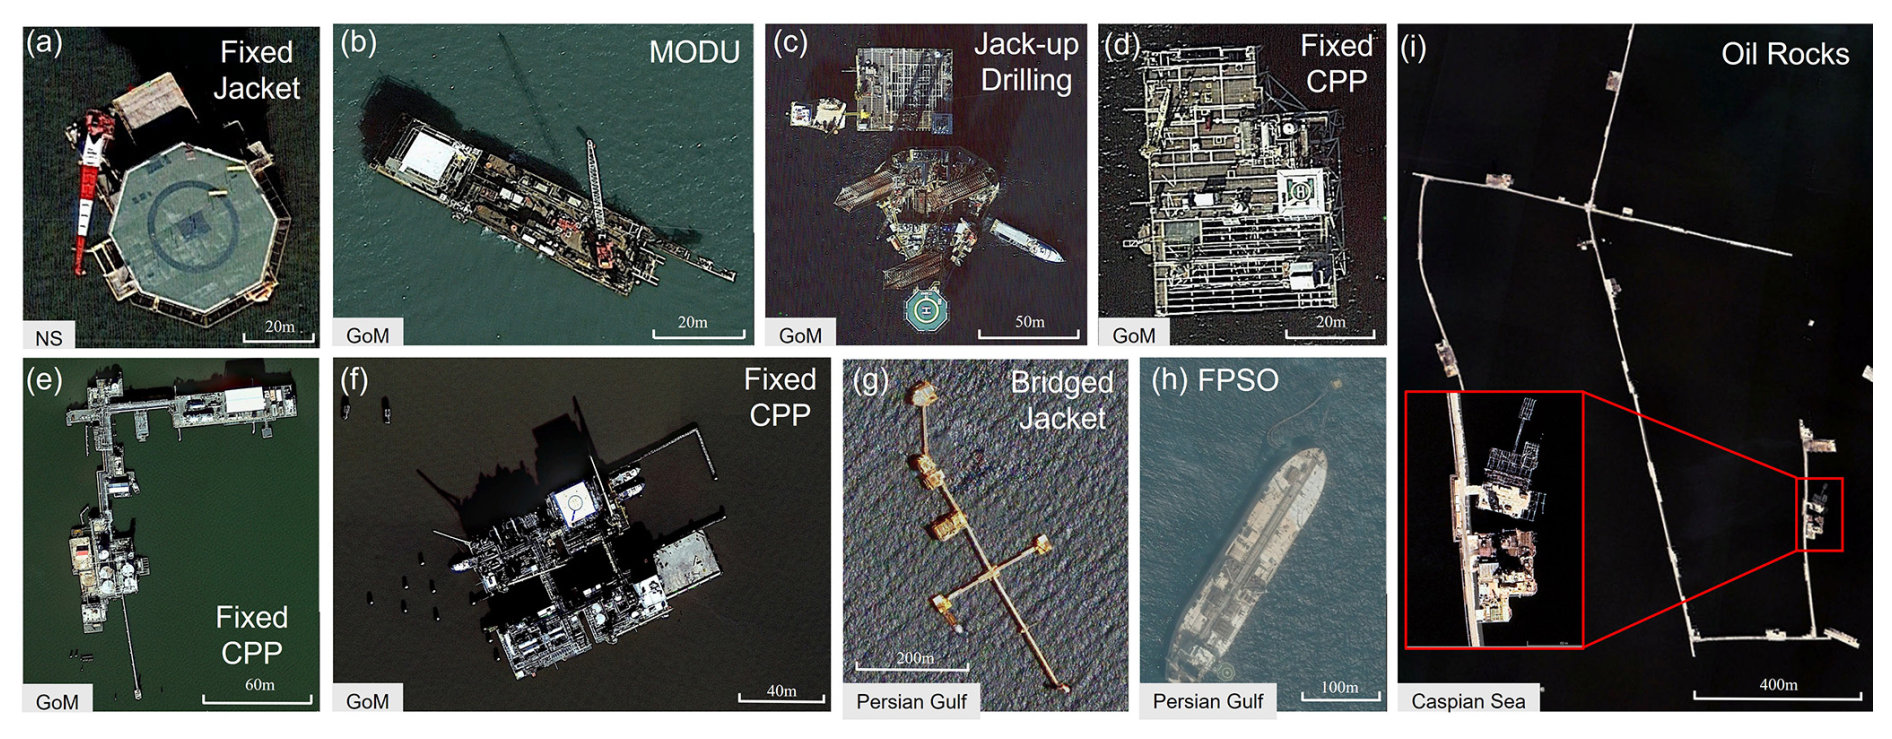
Figure 2High resolution images showing major OOGP types (© Google Earth). (a) Single fixed jacket platform. (b) Moveable Offshore Drilling Unit (MODU) with drilling tower. (c) Jackup Drilling Platforms/Rigs with helideck, hull, leg and spudcan. (d) Central Processing Platform (CPP). (e) Rectangular-shaped bridged fixed production platform with storage tanks and pipelines. (f) Bridged integrated production platform with well, mooring buoys (white points), vent flare boom, distillation/absorption tower, tanks, pipelines, oil and gas separation, helipad and transport vessels. (g) Bridged fixed jacket platform with flaring on South Pars natural gas field. (h) Floating production, storage and offloading (FPSO) vessels on South Pars natural gas field. (i) Oil rocks combined with residential infrastructure and long interconnected metal causeways in the Caspian Sea. (a) Located in the NS. (b–f) Located in GoM, USA. (g–h) Located in the Persian Gulf. (i) Located in the Caspian Sea, Azerbaijan.
2.2 Satellite data
The Sentinel-1 mission, part of the Copernicus Joint Initiative of the European Commission (EC) and the European Space Agency (ESA), provides dual-polarization C-band SAR data operating at 5.405 GHz. Data are delivered as Level 1 Ground Range Detected (GRD) scenes containing calibrated backscatter coefficients (σ0) expressed in decibels (dB), with spatial resolutions of 10, 25, or 40 m depending on the acquisition mode. The available polarization configurations include single-polarization modes as Vertical transmit/Vertical receive (VV) and Horizontal transmit/Horizontal receive (HH), as well as dual-polarization modes like Vertical transmit/Horizontal receive (VV + VH) and Horizontal transmit/Vertical receive (HH + HV). In this study, Sentinel-1 SAR images were collected and processed using the GEE platform through “COPERNICUS/S1_GRD” image collection, which consists of GRD scenes from 2014 onward. GEE applies automated preprocessing workflow that includes thermal noise removal, radiometric calibration, and terrain correction using either the Shuttle Radar Topography Mission (SRTM) 30 m DEM or ASTER GDEM for latitudes above 60°, where SRTM data is unavailable. This ensures the production of consistent, analysis-ready SAR imagery suitable for large-scale time series analysis.
Sentinel-1's C-band SAR operates independently of all-weather, day-and-night capability, making it well suited for continuous observation of offshore environments and detecting changes over time. For OOGPs detection, we used Sentinel-1 imagery in VH polarization from 2017 to 2023. VH-polarized backscatter is particularly sensitive to complex metallic structures with depolarizing properties, such as cranes, pipelines, helipads, and OOGPs, which typically involve vertical and horizontal components. These structures induce cross-polarized signals through multiple scattering, corner reflections, and geometric complexity, making VH band images an effective choice for OOGP detection. Conversely, to exclude Offshore Wind Turbines (OWTs), we utilized imagery acquired in Interferometric Wide (IW) swath mode and VV polarization. OWTs, usually composed of tall, smooth metallic towers with rotating blades, produce strong and stable VV backscatter signals due to their regular geometry. This makes VV polarization effective for masking OWTs during OOGPs mapping.
To support the detection of offshore gas flaring (GF) activities, we incorporated Sentinel-2 imagery as a complementary data source. GF refers to the combustion of excess or unusable gases released during oil and gas extraction, typically through flare stacks at production facilities (Elvidge et al., 2016). These flaring activities are often characterized by high-temperature signatures that can be captured in the shortwave infrared (SWIR) bands of Sentinel-2 imagery (Faruolo et al., 2023). Sentinel-2, launched by the European Space Agency (ESA) under the Copernicus program, provides high-resolution multispectral imagery with frequent global coverage. Its SWIR bands are particularly useful for identifying high temperature anomalies, making it suitable for detecting and validating offshore GF events in high resolution. The imagery used in this study was obtained from the GEE platform (“COPERNICUS/S2_HARMONIZED”), covering the period from 2017 to the present.
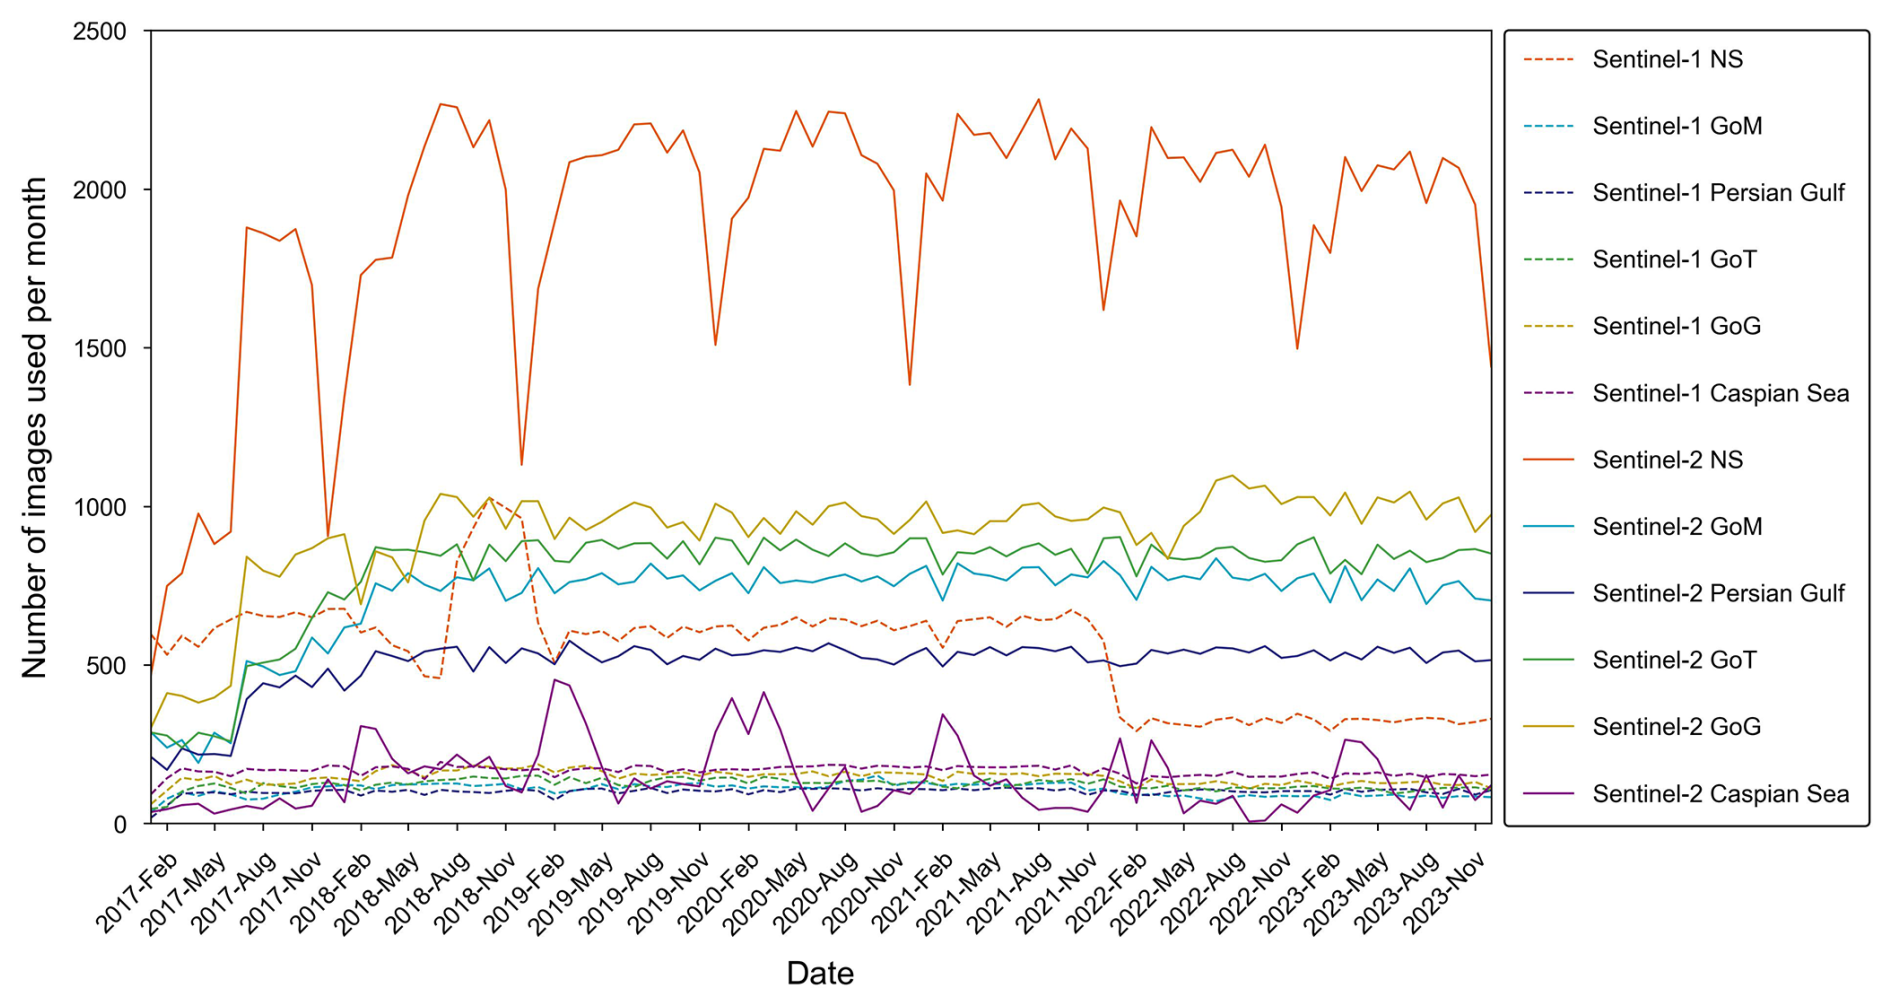
The main geometric and spectral characteristics of each sensor are summarized in Table 1. A total of 99 784 Sentinel-1 images were used for the OOGPs detection algorithm and time series analysis, and 416 070 Sentinel-2 MSI images were employed for locating and monitoring GFs. The number of images analyzed per month is shown in Fig. 3.
Table 1Nominal parameters of optical passive and SAR active sensors whose data were used in this study.

2.3 Auxiliary data
2.3.1 Maritime zoning
To contextualize offshore platform distribution by national jurisdiction, we used the Exclusive Economic Zones (EEZs) database, which defines maritime boundaries established by the 1982 United Nations Convention on the Law of the Sea. Within these boundaries, a sovereign nation has exclusive rights to explore and utilize marine resources. The EEZ data consulted in this study were obtained from the Open Data Platform Marine Regions (https://www.marineregions.org/eezsearch.php, last access: 4 August 2026), which provides EEZ boundaries for all countries. This dataset was used to explain the geographical features of OOGPs within the EEZ of each country.
2.3.2 Validation datasets
To validate the OOGP detection results, we utilized datasets of four primary geospatial platforms as described in Table S1 in the Supplement. A detailed description of each dataset is provided below.
The Bureau of Safety and Environmental Enforcement (BSEE) provides offshore platform information on the federal waters of the NGoM (from the boundary of state waters to 200 nautical miles), including detailed attributes such as structure type, installation and removal dates, operational status, and production flags. The latest BSEE release contains 7303 records describing both existing and removed platforms (https://www.data.bsee.gov/, last access: 4 August 2026). However, BSEE does not cover platforms located within state jurisdictions. To complement this limitation, we also used the NOAA Offshore Oil and Gas Platforms dataset (https://hub.marinecadastre.gov/datasets/noaa::offshore-oil-and-gas-platforms/about, last access: 4 August 2026), which provides point locations of platforms in both state and federal waters. NOAA's product with broader spatial coverage makes it a robust supplementary dataset for validating satellite-derived detections in the NGoM.
For the NS, we used the Offshore Energy Structures in the North Sea (later on, referred to as OESNS) dataset from the University of St Andrews as the primary validation source (Martins et al., 2023). To assist in identifying and removing false positives, we also used vessel traffic management zones from the UK Hydrographic Office (https://datahub.admiralty.co.uk/portal/home/index.html, last access: 4 August 2026), which delineate major shipping corridors.
The global geospatial database named OGIM also provides information on major global oil and gas facilities, including type, location, operational status, operators' name in some countries, and installation dates (Omara et al., 2023). Overall, this dataset was acquired, curated, and integrated from public domain geospatial datasets reported by official government sources, industries, academic research institutions, and other non-governmental entities. It is limited by the open-access availability of geospatial datasets and cannot efficiently obtain spatiotemporal continuity changes in real time.
Among the total records of existing platforms, some structures belonging to the same platform were recorded individually in the first three platform database (Fig. S1 in the Supplement). Thus, we determined the actual counts of existing platforms through the unique identifiers. This process eliminated redundant data and ensured the accuracy of the validation data.
Together, these databases provide reliable references for validating OOGP detections. Moreover, the detection results of this study will supplement the previously mentioned data records.
To further verify platform activity status and cross-reference with our OOGPs detections in this study, we incorporated active fire data distributed by the Fire Information for Resource Management System (FIRMS: https://firms.modaps.eosdis.nasa.gov/, last access: 4 August 2026) (Elvidge et al., 2016) and dense ship regulated areas provided by the UK Hydrographic Office (https://www.admiralty.co.uk/access-data/marine-data, last access: 4 August 2026). Detected hot spots in the FIRMS portal within proximity to known OOGPs locations are interpreted as active GF events. Annual FIRMS hotspot point clouds were spatially aggregated into cluster polygons representing areas of persistent thermal activity, and OOGPs whose centroids fell within these polygons were considered spatially validated as active platforms. This vector-based spatial overlay approach is inherently robust to the resolution discrepancy between FIRMS and the primary satellite datasets, as it operates on vector geometries rather than requiring pixel-level resolution matching. By overlaying these thermal cluster polygons and dense ship lane polygons onto satellite-detected platform locations, the auxiliary datasets ensure the accuracy of platform identification and distinguish operational platforms from other structures or false positives. All detections were further confirmed through multi-source visual interpretation as described in Sect. 4.1.1.
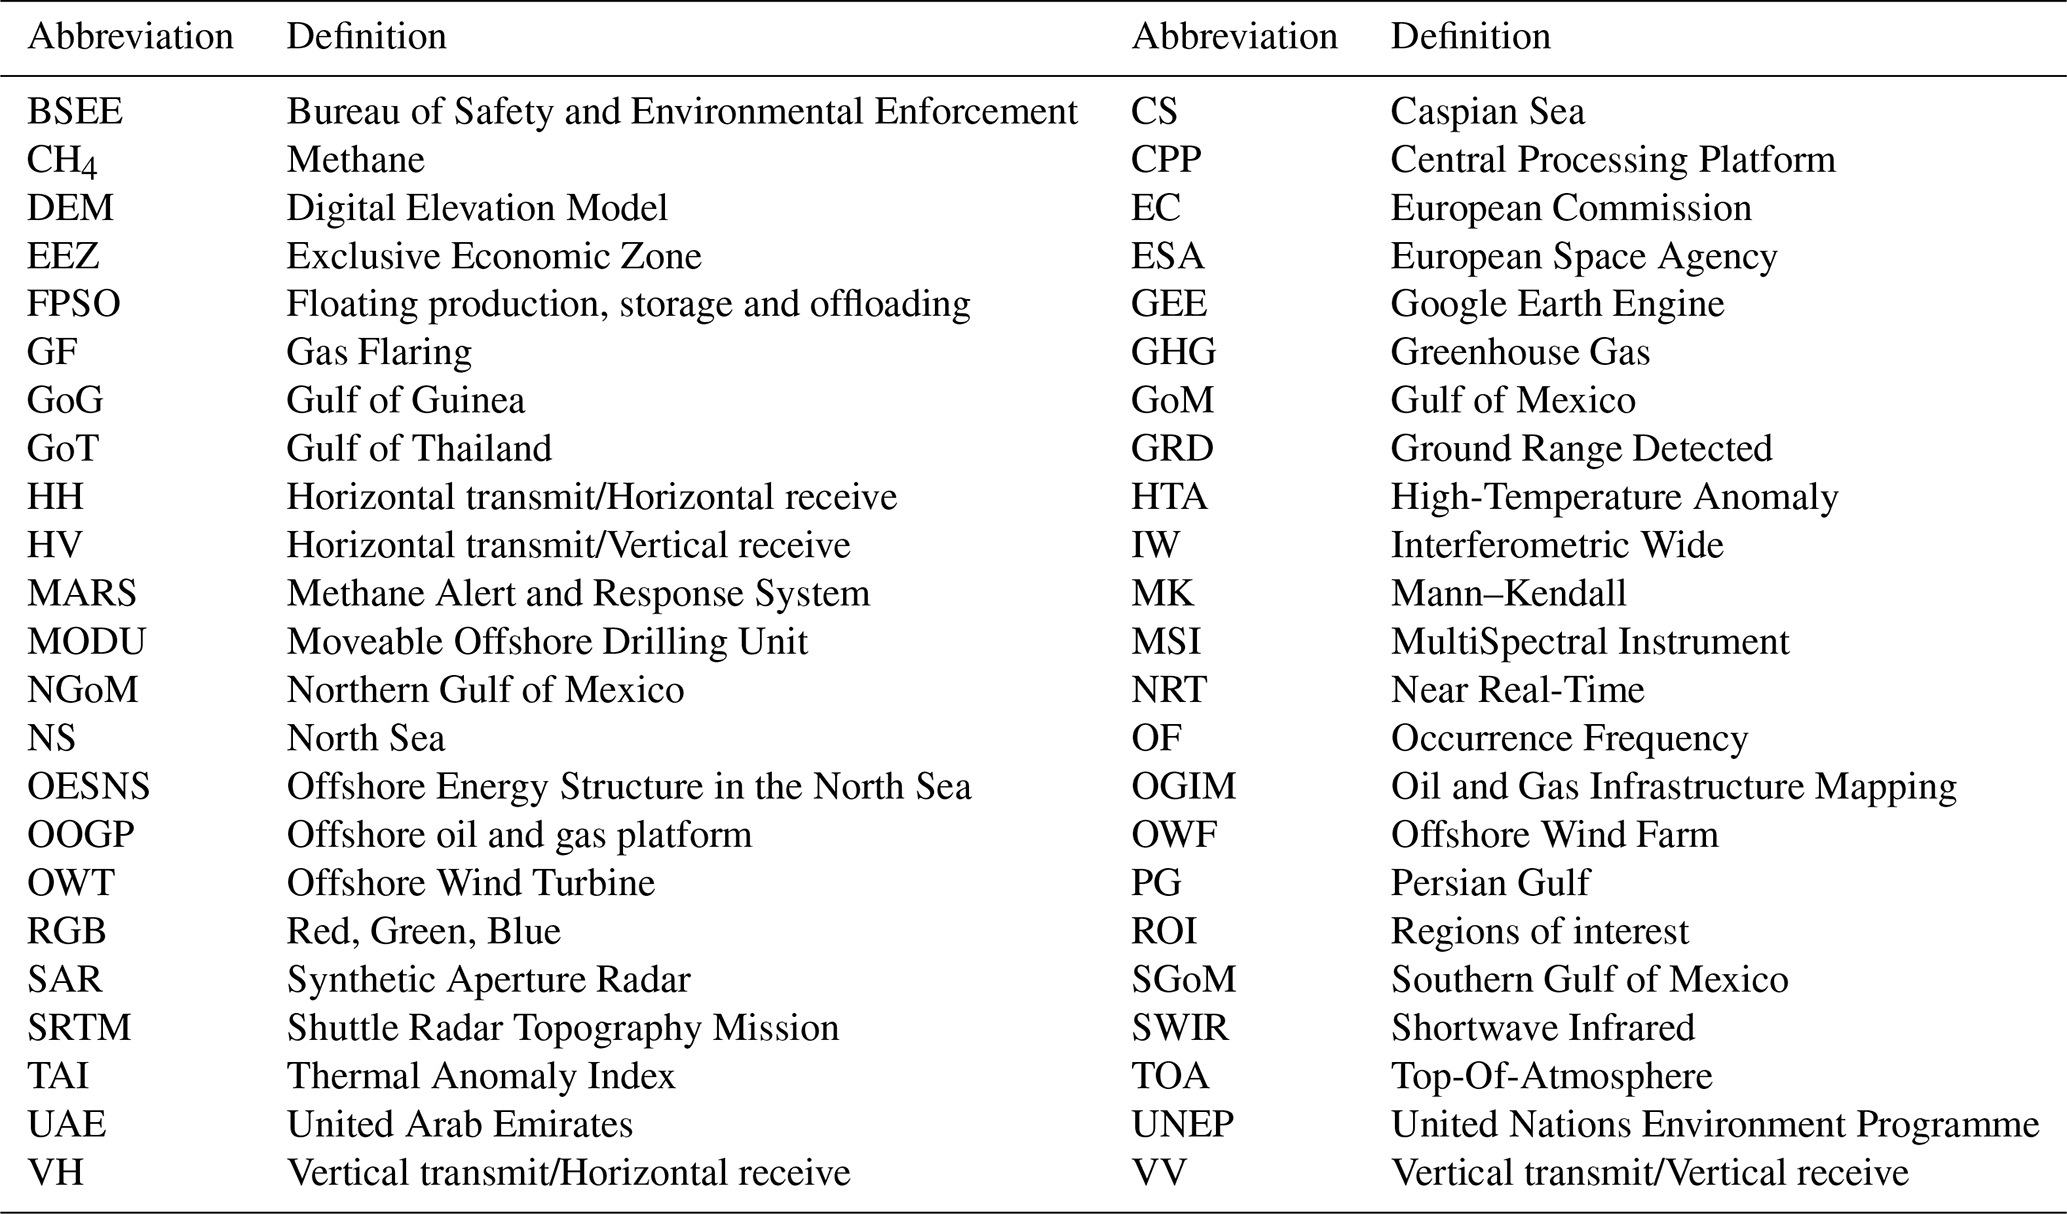
The OOGPs dataset was developed using geospatial analysis with Sentinel-1 SAR and Sentinel-2 time-series imagery on the GEE platform and Python-based workflows. The detailed framework is presented in Fig. 4. It mainly includes: (1) detecting platforms based on monthly averages of Sentinel-1 images; (2) removing noise and false positive objects from long time-series images; and (3) mapping the spatial distribution of platforms and analyzing their respective status after the post-processing of the platform targets.
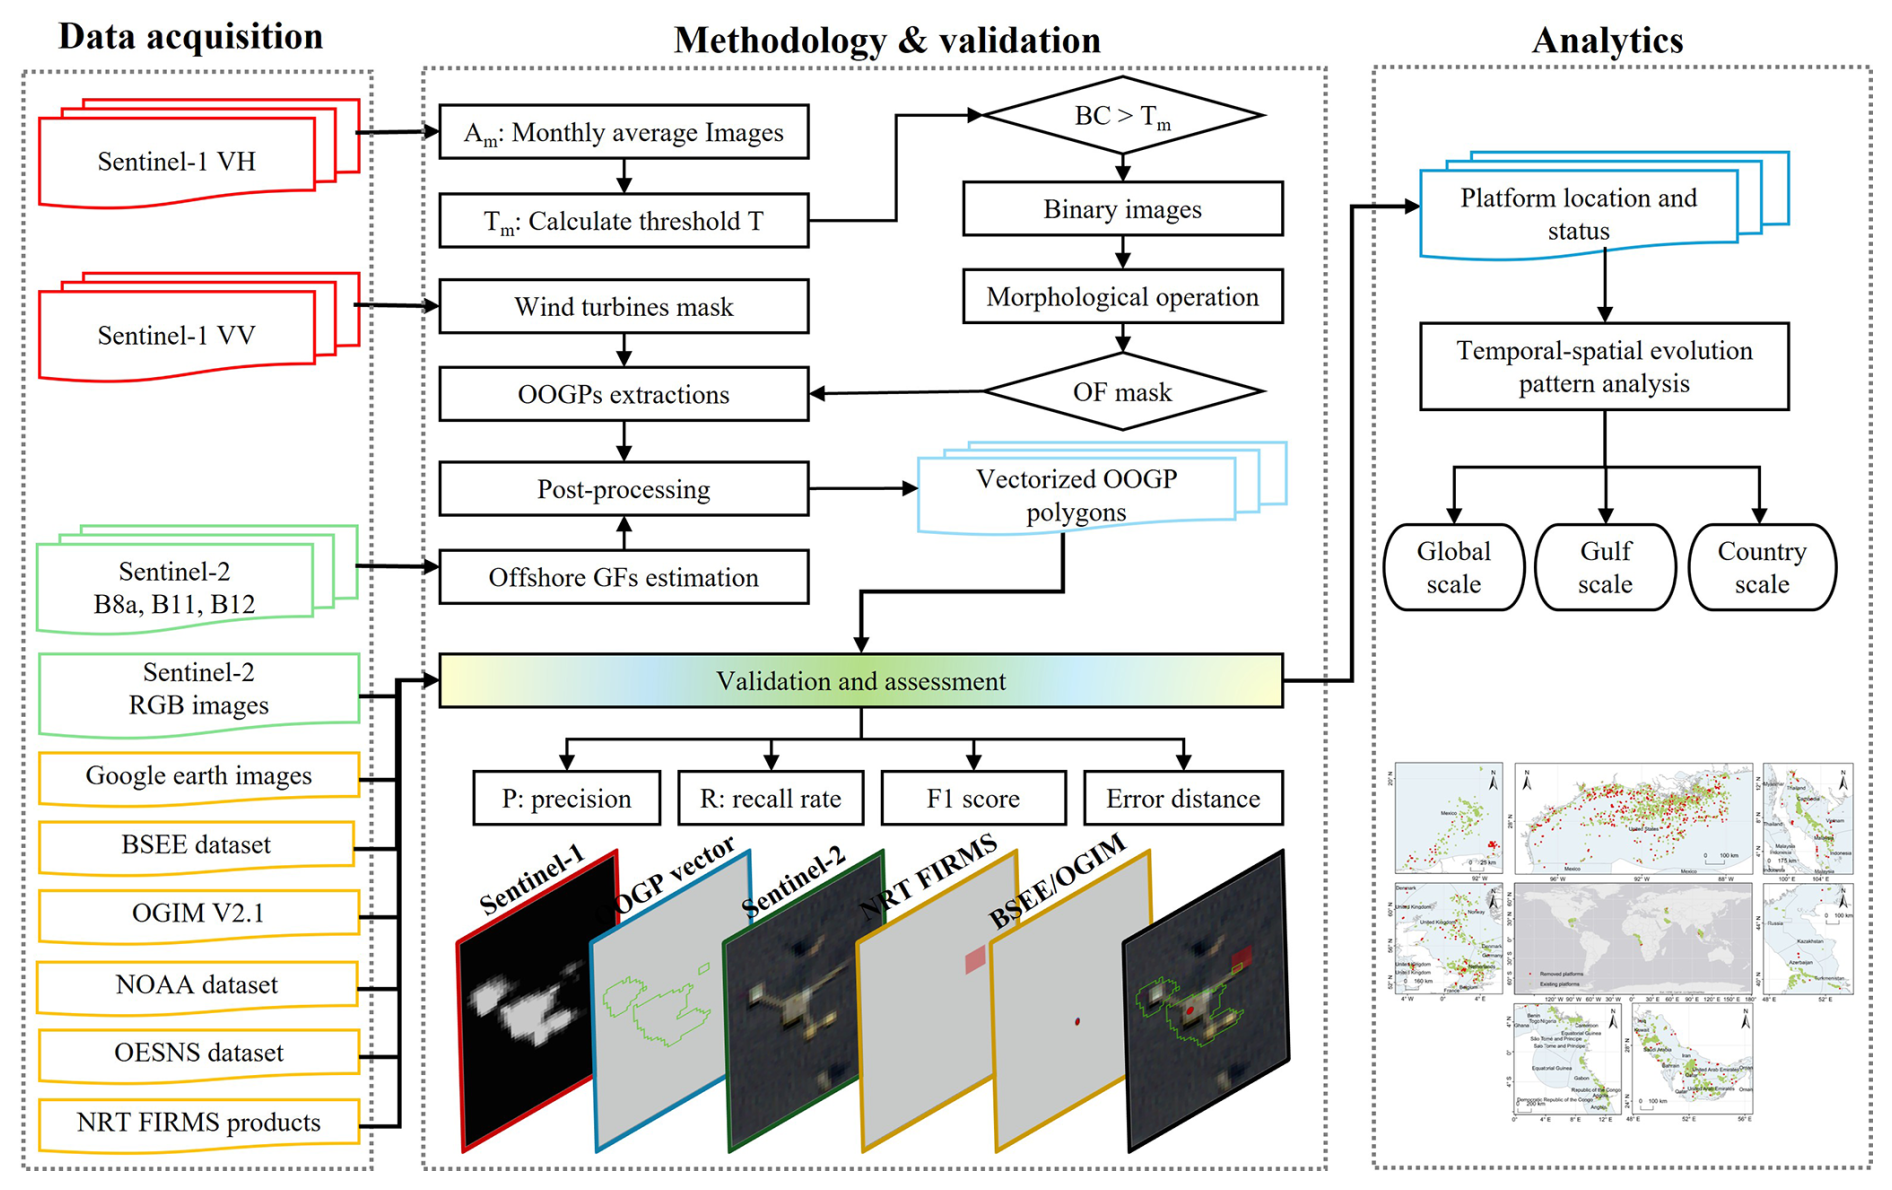
Figure 4Framework of the study used to develop OOGPs data set. OF: Occurrence Frequency, BC: Backscattering Coefficients. See text for acronyms.
3.1 Processing of Sentinel-1 data
In this study, we selected Sentinel-1 imagery from the IW swath mode and VH polarization for the initial inspection of the platforms. As described in Sect. 2.2, this configuration was selected because it is more effective in detecting OOGPs than others. As shown in Fig. 5, we compared the backscatter coefficients of the Sentinel-1 VH polarization band of the subset area of the ROI. The backscattering coefficients in the VH band of Sentinel-1 effectively distinguish OOGPs from open water. As demonstrated by a sensitivity analysis of absolute BCmax thresholds across 12 representative OOGP locations in the GoM (Fig. S2), fixed absolute cutoffs lack regional adaptability due to substantial variability in sea-surface background backscatter across regions and seasons. Therefore, the detection framework adopts the percentile-based adaptive threshold described in Sect. 3.2, which dynamically adjusts to the local backscatter distribution of each region and month. The detection framework is based on the physical differences between fixed OOGPs and mobile objects, such as vessels: OOGPs produce stable and temporally persistent backscatter signals, whereas vessels generate decorrelated and spatially variable signals with low Occurrence Frequency (OF) values. Exploiting these differences, platform detection proceeds in two complementary stages. In the first stage, a percentile-based adaptive threshold was applied to identify candidate targets with high completeness. In the second stage, the OF filtering removed the transient signals. Together, the percentile threshold governs candidate set completeness, while the OF filter governs false positive suppression. The theoretical justification and sensitivity analyses for each stage are detailed in Sects. 3.2 and 3.3.1 respectively.
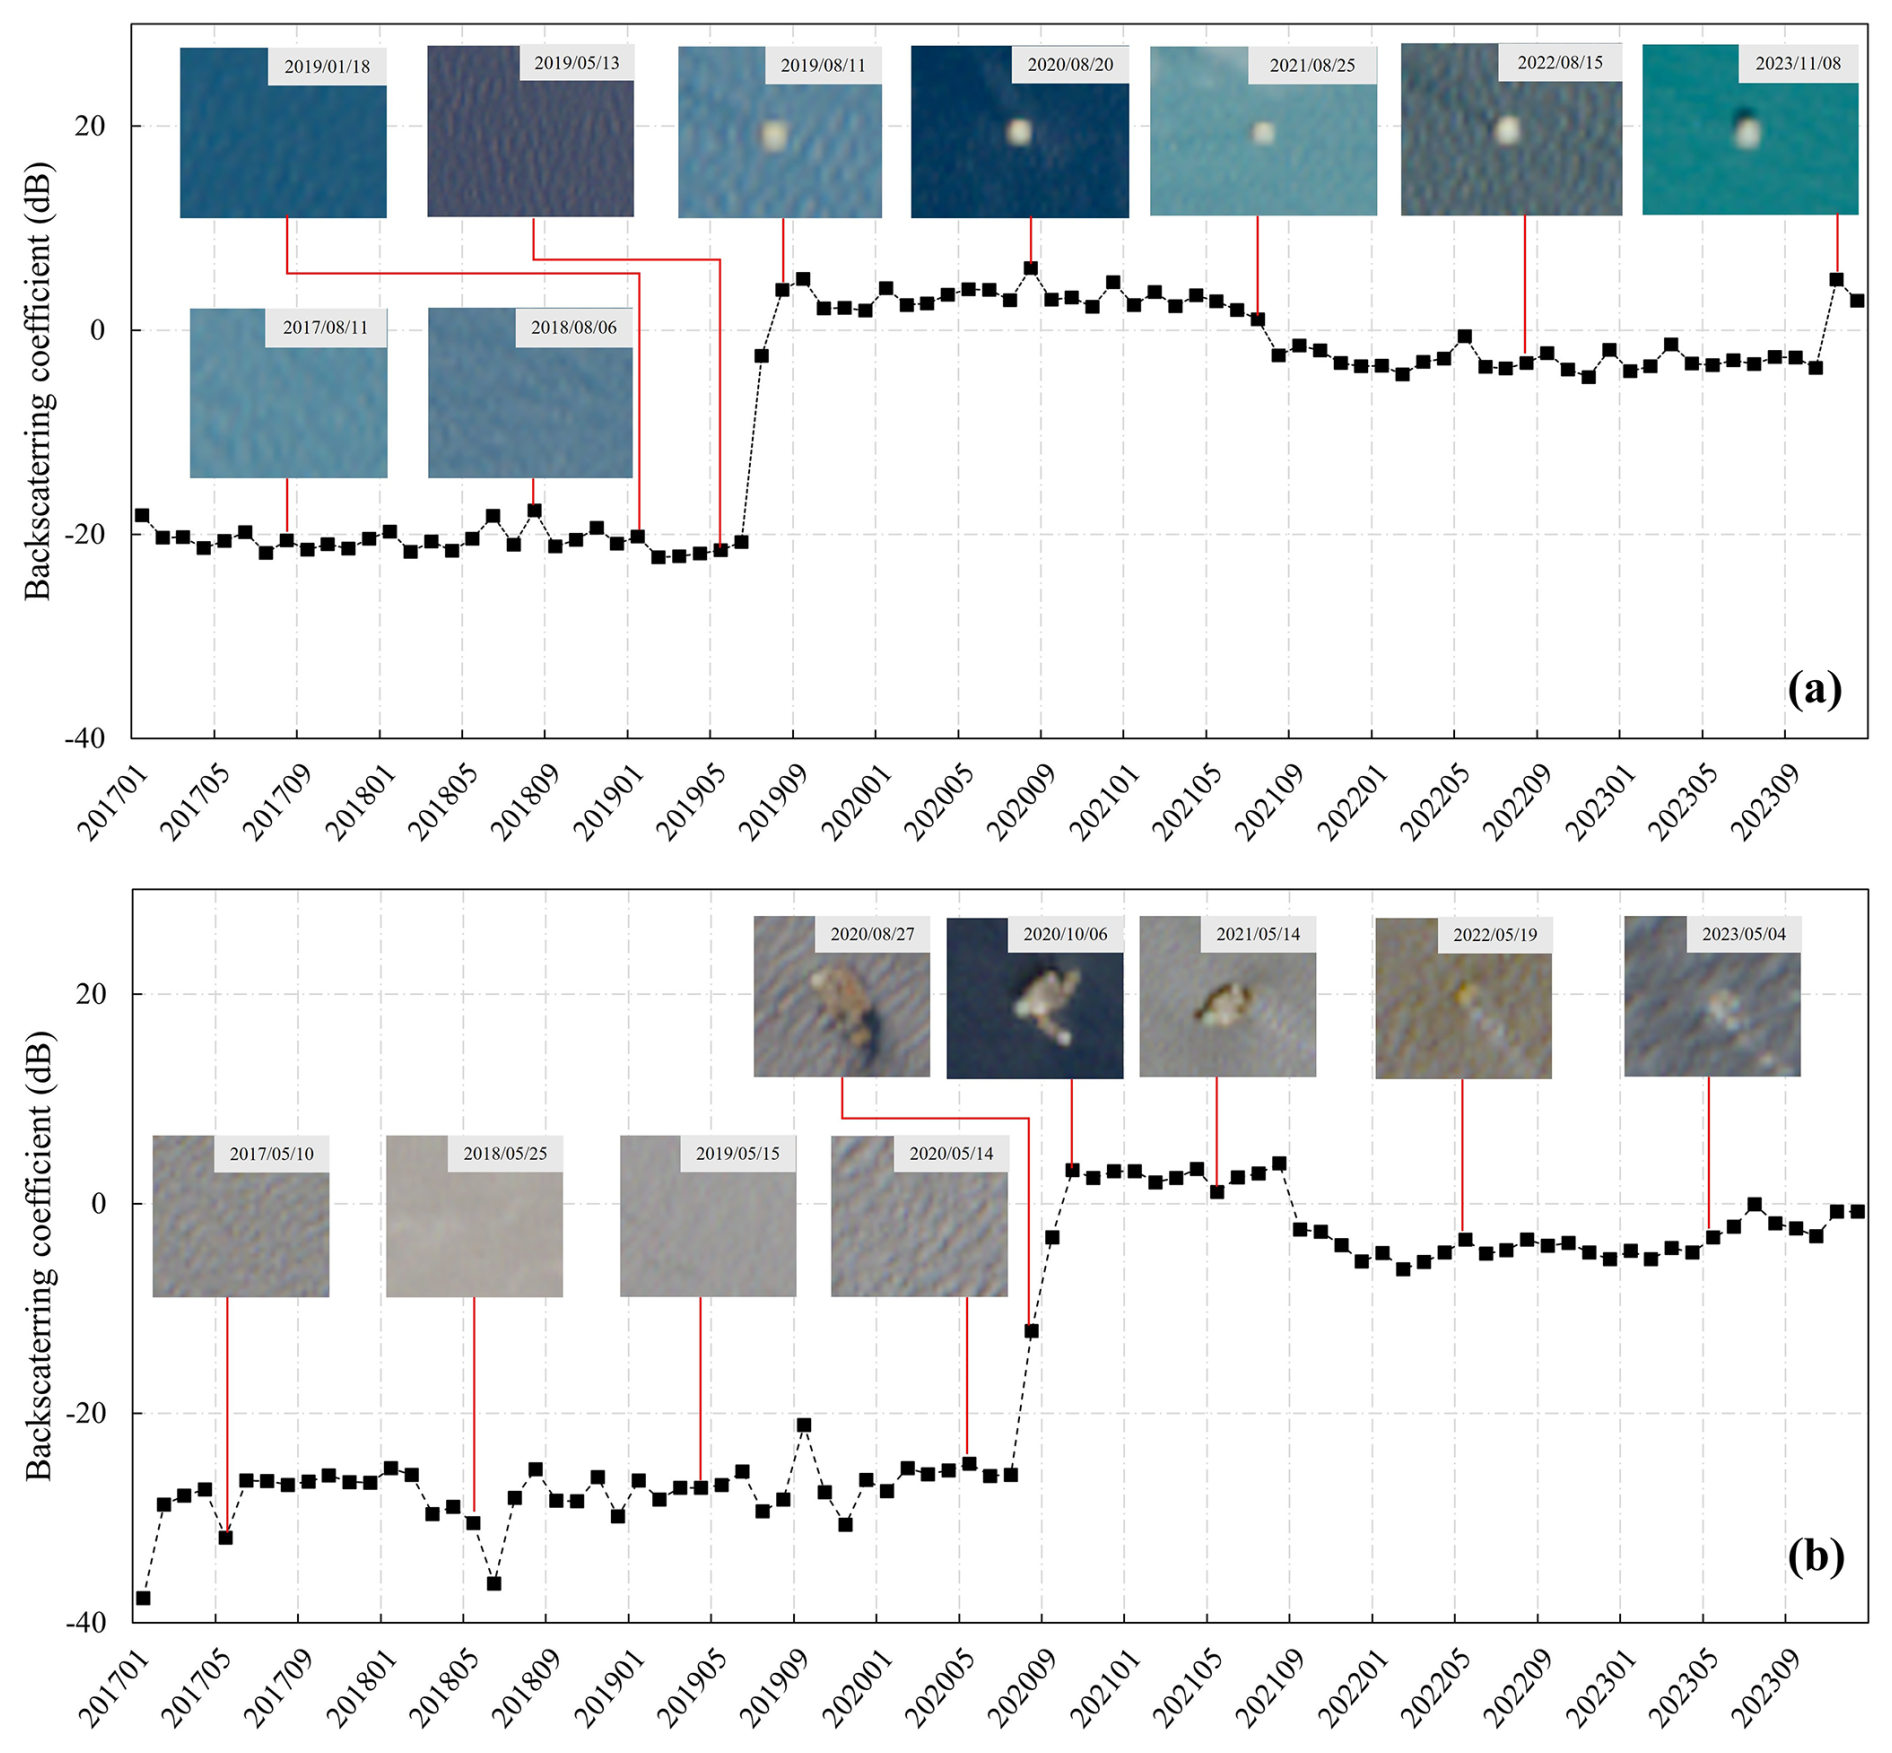
Figure 5Variations of VH backscattering coefficients for example OOGPs from 2017 to 2023 based on Sentinel-2 MSI true color images. (a) Example OOGP in the GoM (92.18° W, 19.07° N). (b) Example OOGP in the Persian Gulf (52.02° E, 26.44° N).
3.2 OOGPs candidates detection
Selecting an appropriate detection threshold for monthly averages of Sentinel-1 VH images is a critical step in initially identifying candidate targets. In regions with existing platforms, radar backscatter coefficients tend to be significantly higher than in surrounding open waters. This difference is reflected in the backscatter intensity curves in Fig. 5, where non-platform areas show a peak at lower values. Considering regional variability in sea surface backscatter, we applied an adaptive threshold strategy. For each month (m), the adaptive threshold (Tm) was set to the 90th percentile of each monthly averages backscatter intensity (Am) within ROIs and used to classify pixels into potential target areas as binary images. Here, the choice of the 90th percentile was ascertained by threshold sensitivity experiments, as shown in Table S2 and Fig. S3, which evaluated detection performance using three percentile levels (85th, 90th, and 95th). Lower thresholds lead to increased sea surface noise, whereas higher thresholds miss small or weakly backscattering platforms. The 90th percentile provides the most balanced trade-off between completeness and the suppression of noise-induced artifacts. Although this inclusive threshold may retain some transient objects, they are subsequently removed through the temporal persistence filtering procedure described in Sect. 3.3.1. This percentile-based thresholding ensures the robust and regionally consistent detection of OOGPs under varying marine conditions. The detailed rules are as follows:
where Bm is the monthly binary image, Am is the monthly average backscatter image computed as the pixel-wise temporal mean of all Sentinel-1 VH acquisitions in month m, Tm is the dynamic threshold of the monthly Sentinel-1 VH image, is the backscatter coefficient image of the ith Sentinel-1 acquisition in month m, n is the number of Sentinel-1 images in month m, and P90 denotes the 90th percentile of the spatial distribution of pixel values in Am.
3.3 OOGPs refinement and post-processing
OOGPs refinement and post-processing were performed systematically by applying following three tasks: (1) Removal of noise and mobile objects. (2) Removal of OWTs. (3) Post-processing of platforms dataset. A detailed explanation of each processing step is given in the following section.
3.3.1 Removal of noise and mobile objects
The binary images produced with the methods described in Sect. 3.2 may be distorted by noise and texture, and some islands or small objects may be present. These false targets often have spatiotemporal discontinuities and are small in size. A morphological operation was applied to the binary images to eliminate interference and improve the accuracy of target detection. This operation employed eight-connected component analysis and an opening operation on the binary image. Specifically, the morphological opening operation refers to erosion processing in a 3×3 window, which replaces each pixel with the minimum value of its neighborhood to remove isolated islands and small noise points. Dilation processing assigns each pixel with the maximum value in its 3×3 neighborhood to restore the original target area boundary and fill holes caused by erosion. After spatial noise reduction through morphological processing, advanced statistical analysis based on the OF of the VH signal was performed to remove floating or temporarily moving objects (e.g. ships and sun glints) using Sentinel-1 monthly averages per year. Platforms, which are stationary infrastructures, maintain stable radar backscatter and thus exhibit high OF values. In contrast, mobile objects such as ships appear only intermittently and therefore display a low OF (Fig. S4). To account for different sea states and shipping intensities, we applied region-specific OF thresholds determined through sensitivity testing and manual inspection: OF>2 in the GoG and GoT; OF>3 in the GoM, inner PG and CS; OF>6 in the open-water NS and nearshore PG; and OF=12 in the heavily trafficked English Channel (NS). Region-specific OF thresholds were determined through a systematic sensitivity analysis by varying each threshold within two steps of the adopted value across all study basins. The primary effect of increasing the OF was the progressive suppression of vessel-induced false positives rather than a reduction in true platform detections. The complete sensitivity analysis is provided in Table S3 and Fig. S5. Based on this processing, false-positive targets caused by sea surface conditions, such as ocean clutter and frequent passing ships, were eliminated, and the resulting vector polygons were used for post-processing.
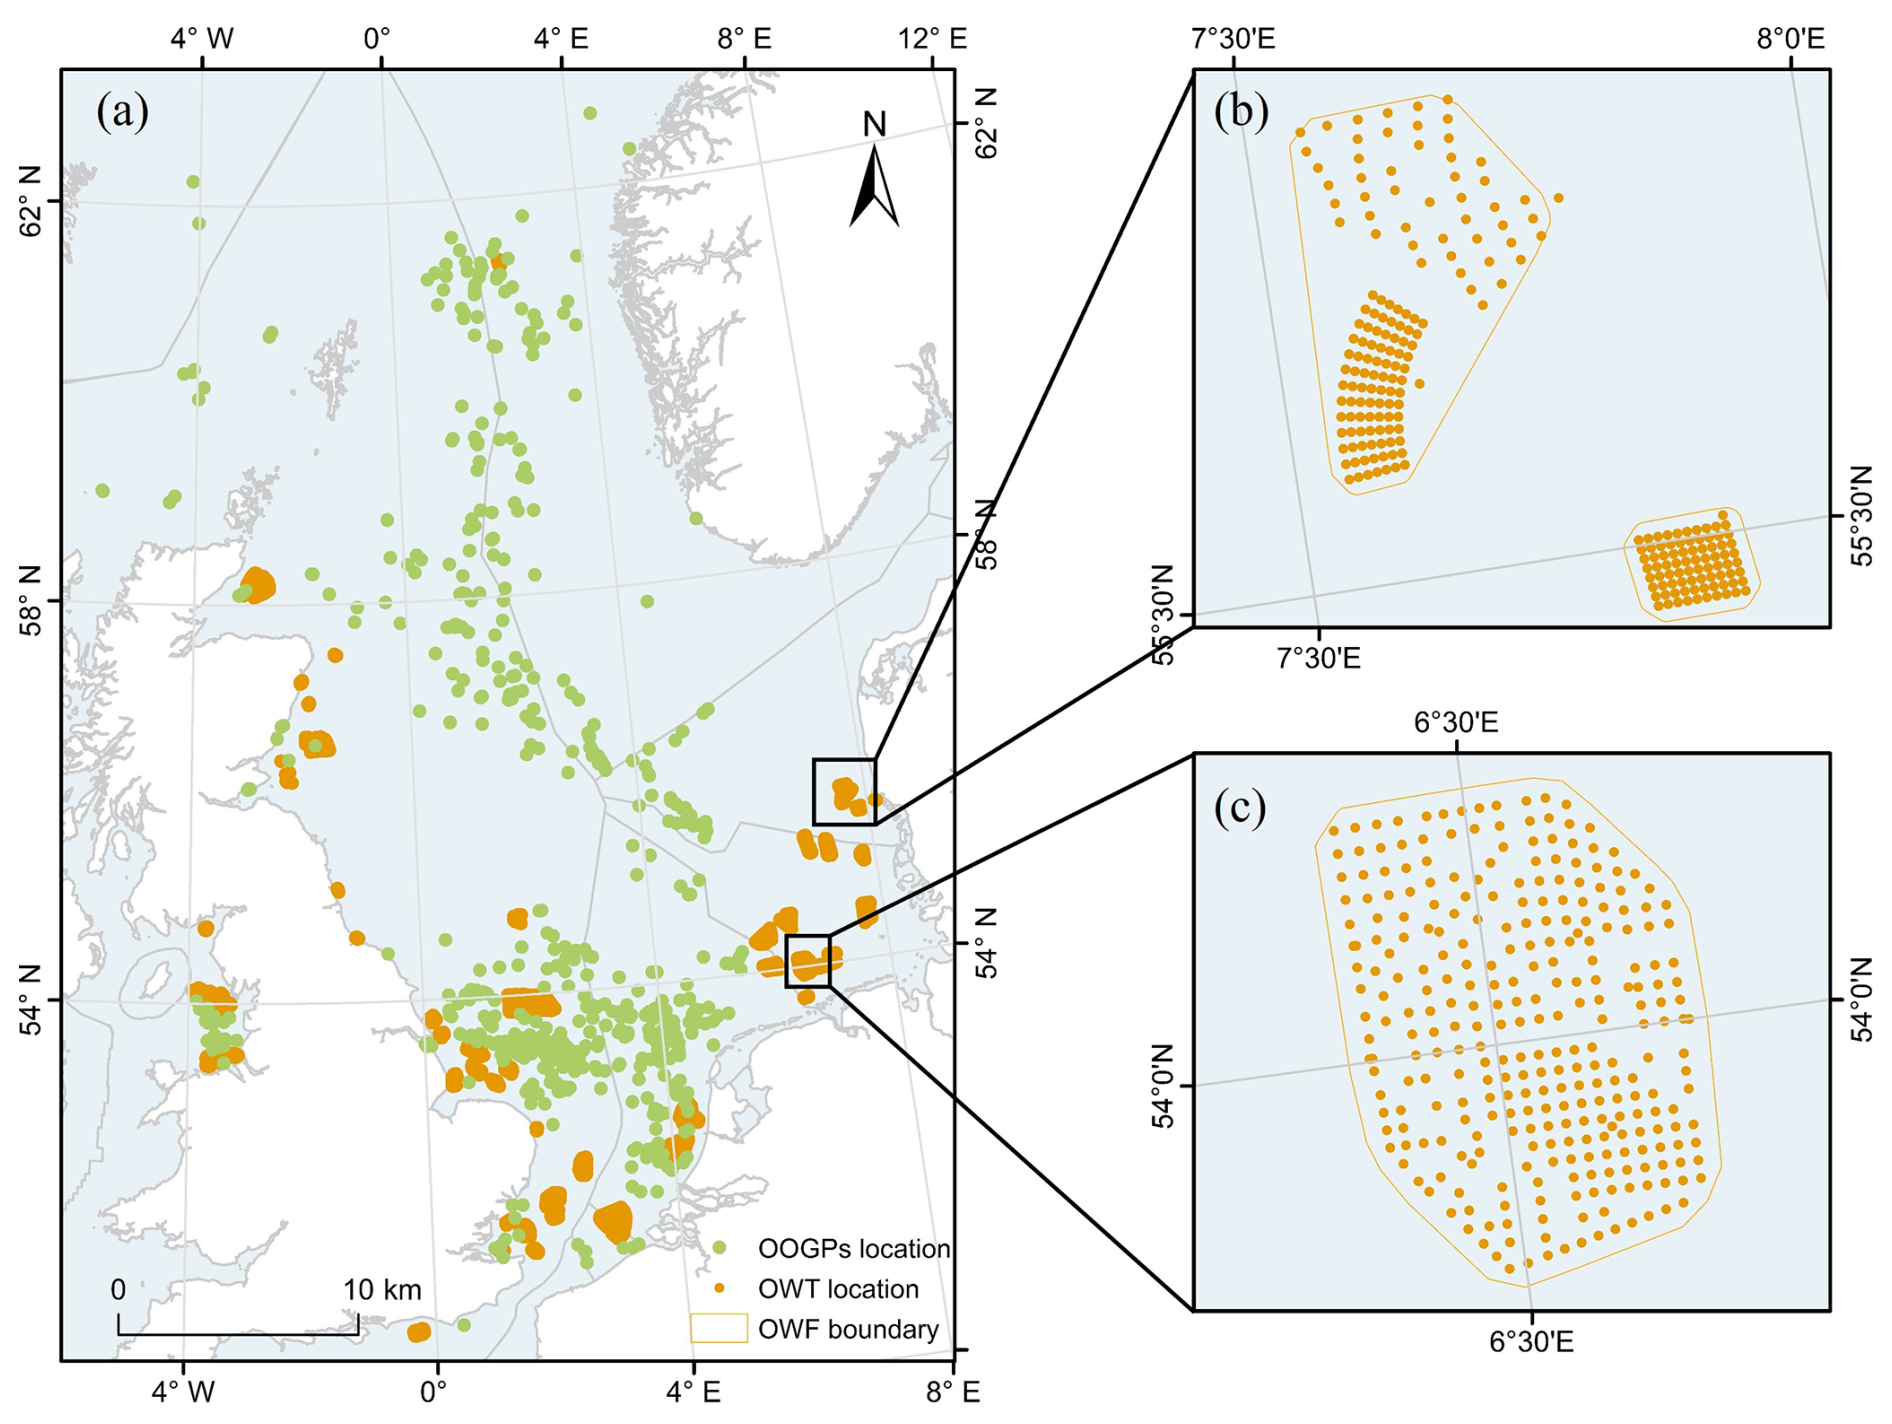
Figure 6Detection results of OWTs in NS. (a) Points of OOGPs detected using Sentinel-1 VH images and OWTs identified from Sentinel-1 VV imagery in NS. (b, c) Selected examples of OWTs within the OWF boundaries in NS. All data were collected between 2017 and 2023.
3.3.2 Removal of offshore wind turbines
Offshore wind farms (OWFs), consisting of OWTs, are widely distributed in the vicinity of oil and gas production facilities in offshore economic zones, mainly in the NS and coastal areas of China. Their local spatiotemporal distribution characteristics are similar to those of OOGPs, making them typical false-positive targets. Owing to the increasing expansion of OWFs at existing and recently developed wind energy production sites, a holistic understanding and detailed insights into their distribution are gaining importance for obtaining accurate OOGP locations. Considering that the VV polarization band is more effective in detecting OWFs, this study used Sentinel-1 imagery in IW swath mode and VV polarization to improve detection accuracy. A percentile-based yearly image reduction method, combined with an auto-adaptive threshold algorithm on the GEE platform, was applied to suppress false positives and better isolate OOGP targets (Fig. S6) (Zhang et al., 2021). We detected 5481 OWTs within 53 OWFs in NS from 2017 to 2023. The OWTs dataset will also be open access and distributed along with our OOGPs dataset as ancillary information. Figure 6 provides an overview of all detected objects and their boundaries throughout the entire time series in the OOGPs dataset, from which our OWTs detection contributes to distinguishing OOGPs from widespread wind energy infrastructures. See procedure details of OWTs detection in the Appendix.
3.3.3 Postprocessing of the platform dataset
To estimate the detailed status of OOGPs, we need to further determine the location, installation date, EEZ, and GF flag for each OOGP. Here, we converted the raster data without false positive targets and noise into a vector polygon layer and calculated the centroid to obtain the location of each platform.
As to the indicator of whether there is approved burning or disposition of produced gas through a single OOGP (Fig. 7), we adopted the Thermal Anomaly Index (TAI) method to detect High-Temperature Anomalies (HTA) from single-phase Sentinel-2 MSI top-of-atmosphere (TOA) reflectance images, and then refined offshore GF site candidates among the time-series detections (Liu et al., 2023).
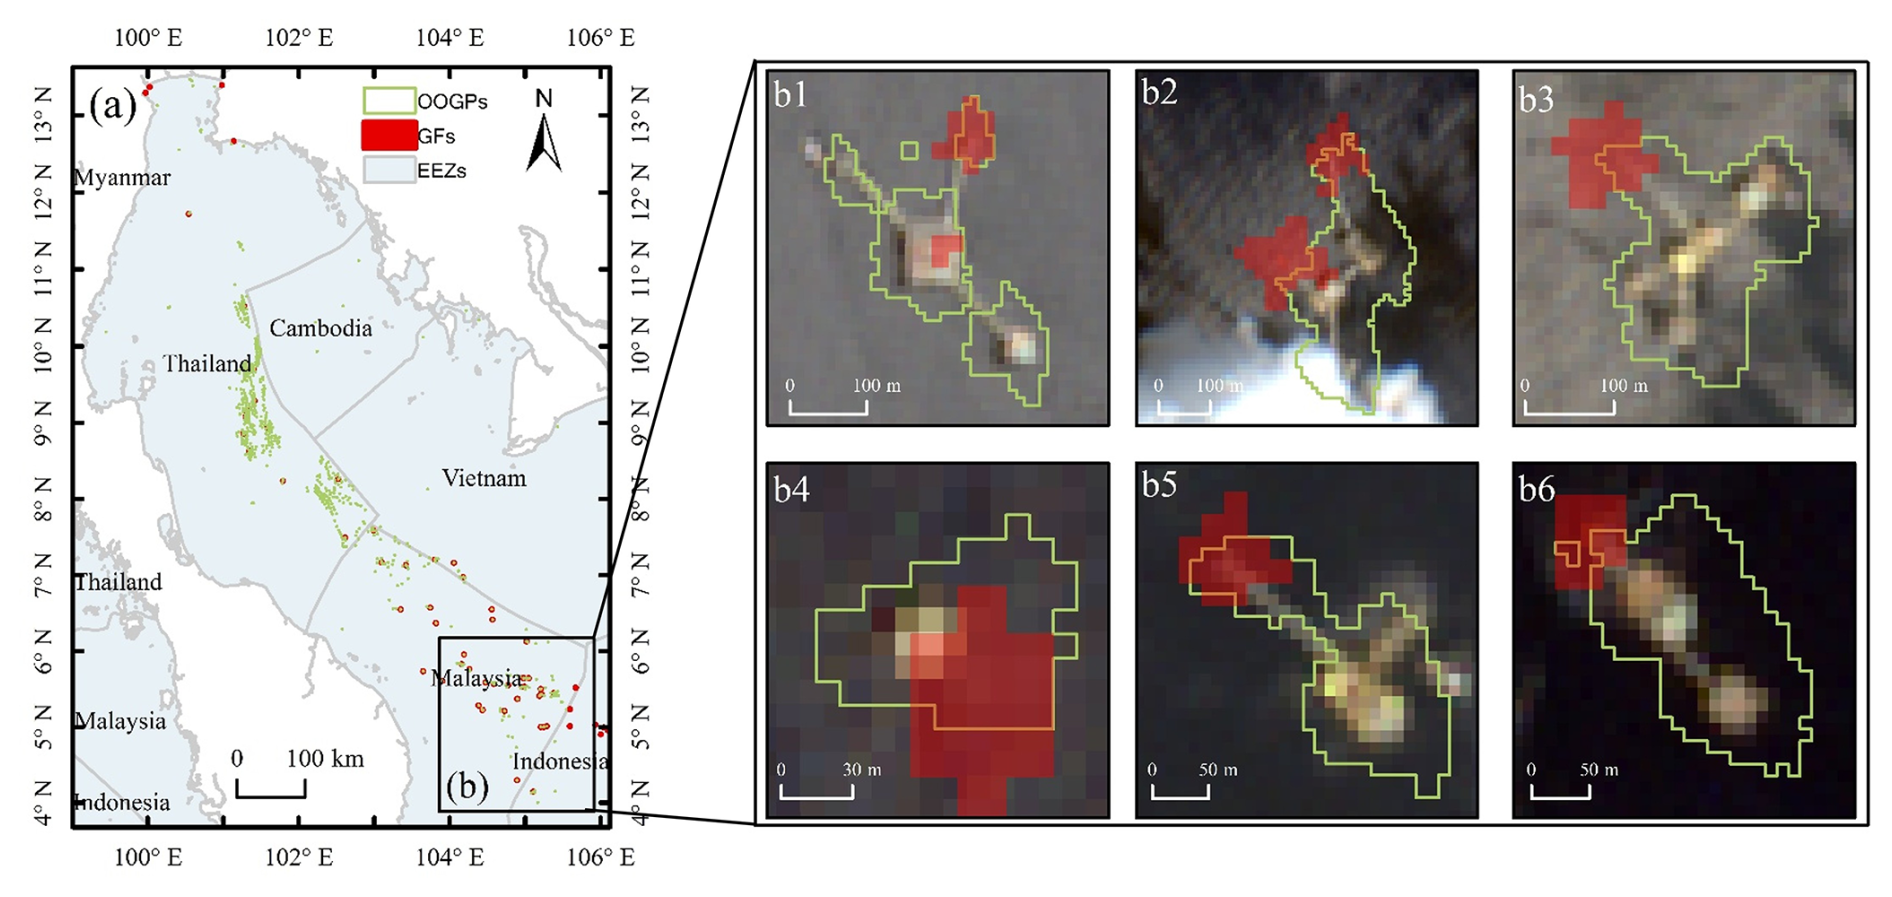
Figure 7Detection of GFs in the GoT. (a) Boundaries of OOGPs detected using Sentinel-1 VH images and GFs identified from Sentinel-2 imagery within different EEZs in the GoT. (b1–b6) Selected examples of GFs produced by OOGPs. Red areas represent gas flaring (GF) signals derived from Sentinel-2 SWIR bands. Green polygons indicate the outlines of offshore oil and gas platforms (OOGPs) detected by Sentinel-1. Sentinel-2 RGB images were used as the basemap. All data are from 2023.
As already shown in Fig. 5, the backscatter coefficient increased substantially after the construction of the platform. To further determine the status and construction time of the platform facilities, we used SAR long time-series data to identify annual drastic change points using the Mann–Kendall (MK) method (Mann, 1945; Kendall, 1949; Hamed, 2008). The MK test is a non-parametric statistical test that determines the trend direction by comparing the relationships between all data points in continuous time series. We created a candidate zone on the platform facility and extracted the monthly maximum backscatter coefficient from this buffer as the input value for the MK test. The operation was performed using GEE and MATLAB.
It is important to note that some platforms have a long lifespan and early installation time, but Sentinel-1 imagery (in operation since 2014) is not sufficient to fully cover the installation time of all platforms, which introduces an incomplete capture of the actual installation date. But despite the partial biases, the MK method and long-term Sentinel-1 data are still reliable choices for detecting the installation date of OOGPs by signal variation. In this study, the statistical values with a significant trend of time series were selected by setting serial values with a P value less than 0.05 of the MK statistic of long time series backscatter coefficient. Two representative sites were chosen for a detailed visual assessment of the OOGP installation dates on a monthly scale. Representative platforms from different study basins were selected for qualitative visual assessment of MK-inferred installation and removal dates using Sentinel-1 SAR and Sentinel-2 RGB imagery acquired before and after the inferred change points (Fig. S7). The visual inspection confirms distinct SAR backscatter changes associated with platform installation and removal events, while the Sentinel-2 imagery further confirms the appearance or disappearance of the corresponding platform structures. The inferred installation and removal dates should be regarded as approximate temporal indicators rather than precise engineering records. The monthly temporal resolution of the Sentinel-1 composites limits the temporal precision of the inferred dates to approximately one month, while limited observations near the boundaries of the observation period may further increase temporal uncertainty. Finally, using auxiliary data, spatial analysis was conducted to compile attribute tables for each platform to obtain complete status information. A description of the attributes is given in Table 2.
Table 2Attributes and descriptions of the OOGP dataset.
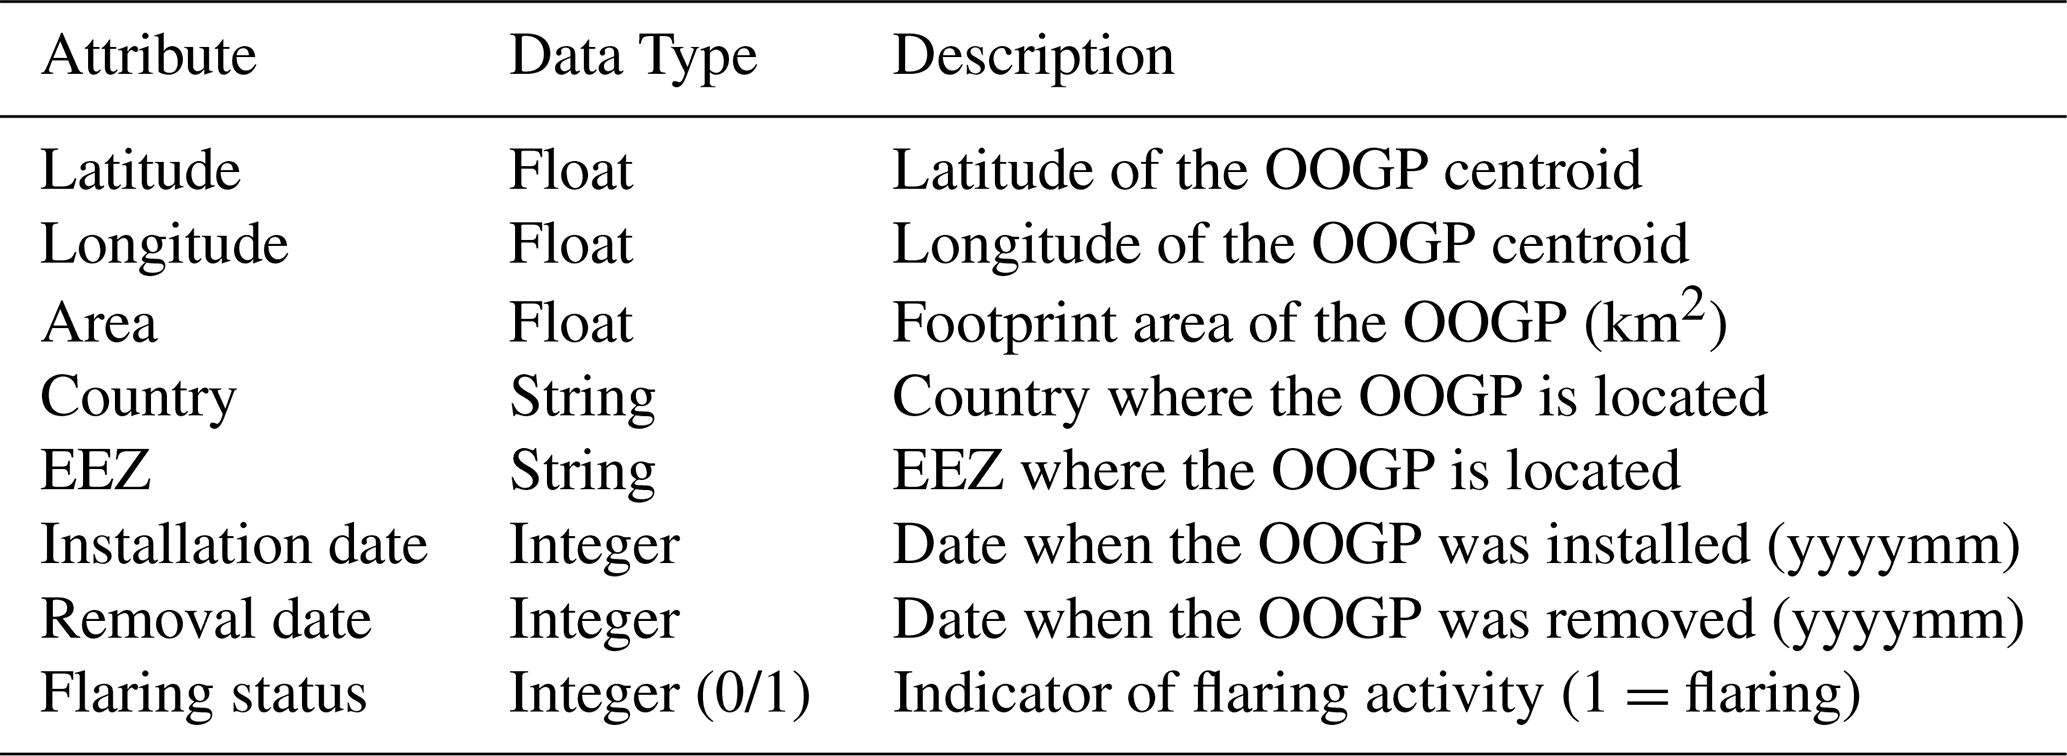
Note: Installation date and Removal date are recorded in yyyymm format, representing the year and month. Null values indicate unavailable or unreported information.
3.4 Validation and uncertainty analysis
OOGPs detection is subject to uncertainty due to a variety of background factors, including sun glint, water turbidity, wind farms, and temporary moving objects. However, there is currently no set of consistent OOGPs to verify the precision and accuracy of this algorithm. To comprehensively assess the performance of our OOGPs dataset, we collected and generated a validation dataset in our study areas to quantify the accuracy metrics. Validation data include: (1) comparisons across multiple source datasets, including the BSEE and OGIM databases; (2) high-resolution imagery and Google satellite images for comprehensive visual interpretation and extensive internal review; and (3) time-series VIIRS fire products.
Because the latest available OGIM data records for 2023 are limited, the OGIM data for 2022 and BSEE data for 2023 were filtered for comparative analysis. Subsequently, we evaluated the performance of the proposed framework in detecting OOGPs from 2017 to 2023 using an independent accuracy assessment approach at the facility and regional levels.
We deployed the spatial analysis tools of the ArcGIS software to match the locations of the detected OOGPs with reference datasets and evaluate their spatial positioning errors. The spatial deviation between the detected platforms and reference data was quantified by calculating the mean, standard deviation, median, maximum, and minimum values of the distance errors between matched points.
In addition, the robustness of the detection method was investigated by calculating the precision P, recall rate R, and F1-score, the harmonic mean of precision and recall that balances the trade-off between the two metrics. These metrics are defined as follows:
where TP is the number of accurately identified OOGPs, FP is the number of falsely identified OOGPs, and FN is the number of OOGPs omitted.
4.1 Assessment of OOGP detection results
4.1.1 Detection accuracy assessment and comprehensive visual interpretation
A total of 5622 sample points covering six offshore regions were selected for validation in 2023, as reference inventories are most complete and up-to-date for this year at the time of the study. The validation was conducted using a combination of authoritative databases and visual interpretation, based on validation datasets composed of NOAA, BSEE, OGIM, OESNS, FIRMS, Sentinel-2 MSI imagery, and Google Earth high-resolution images. Specifically: In the federal waters of NGoM (US), 1349 OOGPs were validated using the NOAA and BSEE database with detailed information on platform location and structure type. In the Southern Gulf of Mexico (SGoM), 195 OOGPs were cross-validated by visual inspection using Sentinel-2 MSI imagery and Google Earth. For the PG, GoT, GoG, NS, and CS, a combined total of 3472 OOGPs were verified through multi-source visual inspection using Sentinel-2 MSI imagery, OGIM and OESNS records, FIRMS data, and high-resolution Google Earth images.
The results of the evaluation are reported in Table 3. Precision scores for identified platforms reached 99 % in the NS, 97 % in the GoM and PG, 92 % in the CS and GoT, and 91 % in the GoG. Part of false positives were primarily associated with coastal structures such as antennas, fishing facilities, and historical landmarks with similar spatial signatures, as illustrated in Fig. 8. Recall scores, representing detection completeness, reached 99 % in the NS, followed by 98 % in the CS. Lower recall was observed in the GoM (84 %), largely due to small-scale wellhead platforms below Sentinel-1's detection threshold. The F1 scores (harmonic mean of precision and recall) indicate the highest performance in the NS (99 %), followed by the CS (95 %).
Table 3Overview of all validation metrics for the OOGPs detection using Sentinel-1 imagery of 2023.
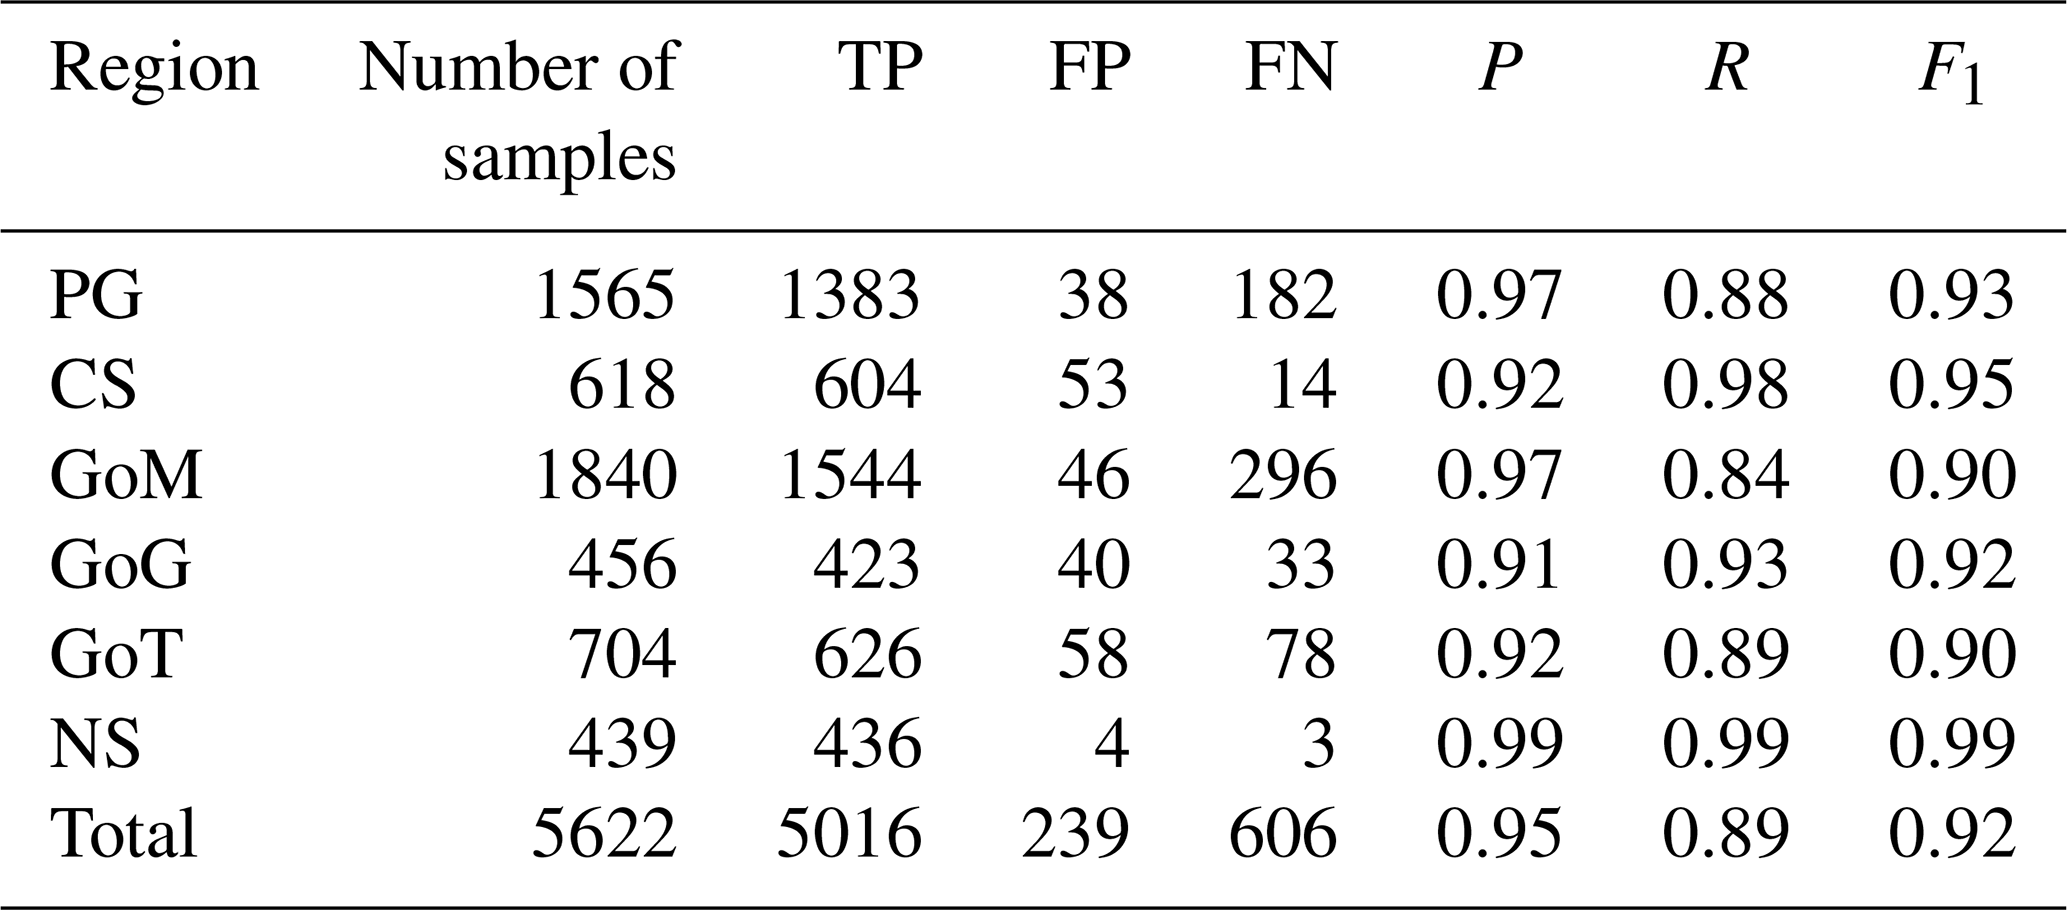
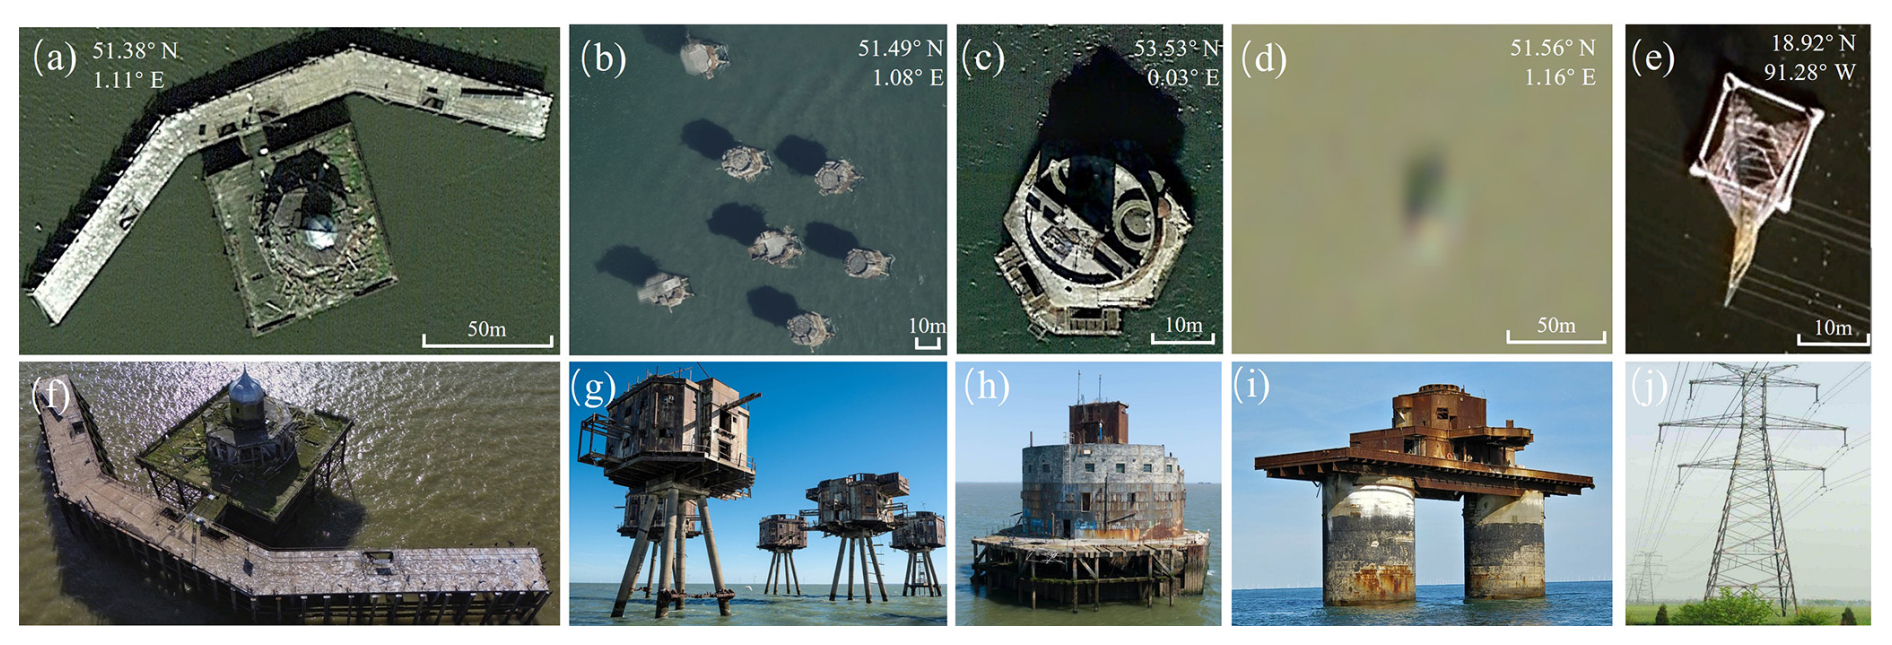
Figure 8Examples of false positive targets in high-resolution imagery (© Google Earth). (a, f) Old pier structure with dome and extended corridors, located in Herne Bay, England. (b, g) A cluster of seven towers known as the Shivering Sands Army Fort, located offshore from Herne Bay, England. (c, h) Hexagonal Haile Sand Fort made of armored concrete, located off the coast of Cleethorpes, England. (d, i) Knock John Fort made of concrete and steel platform decks, situated near Essex, England. (e, j) Coastal electricity pylon near Sabancuy, Mexico.
Overall, the detection framework demonstrates robust accuracy and completeness across diverse offshore regions. Our results offer high accuracy in both spatial precision and temporal consistency, effectively complementing existing data products. While a formal year-by-year validation is not feasible due to the limited availability of temporally resolved reference records for 2017–2022, the detection workflow is applied consistently across all years, and the OF threshold sensitivity analysis (σOF=1.6 %–4.7 %; Table S3) confirms that the mapping performance is stable with respect to parameter uncertainty.
4.1.2 Site-scale accuracy assessment and cross-comparisons
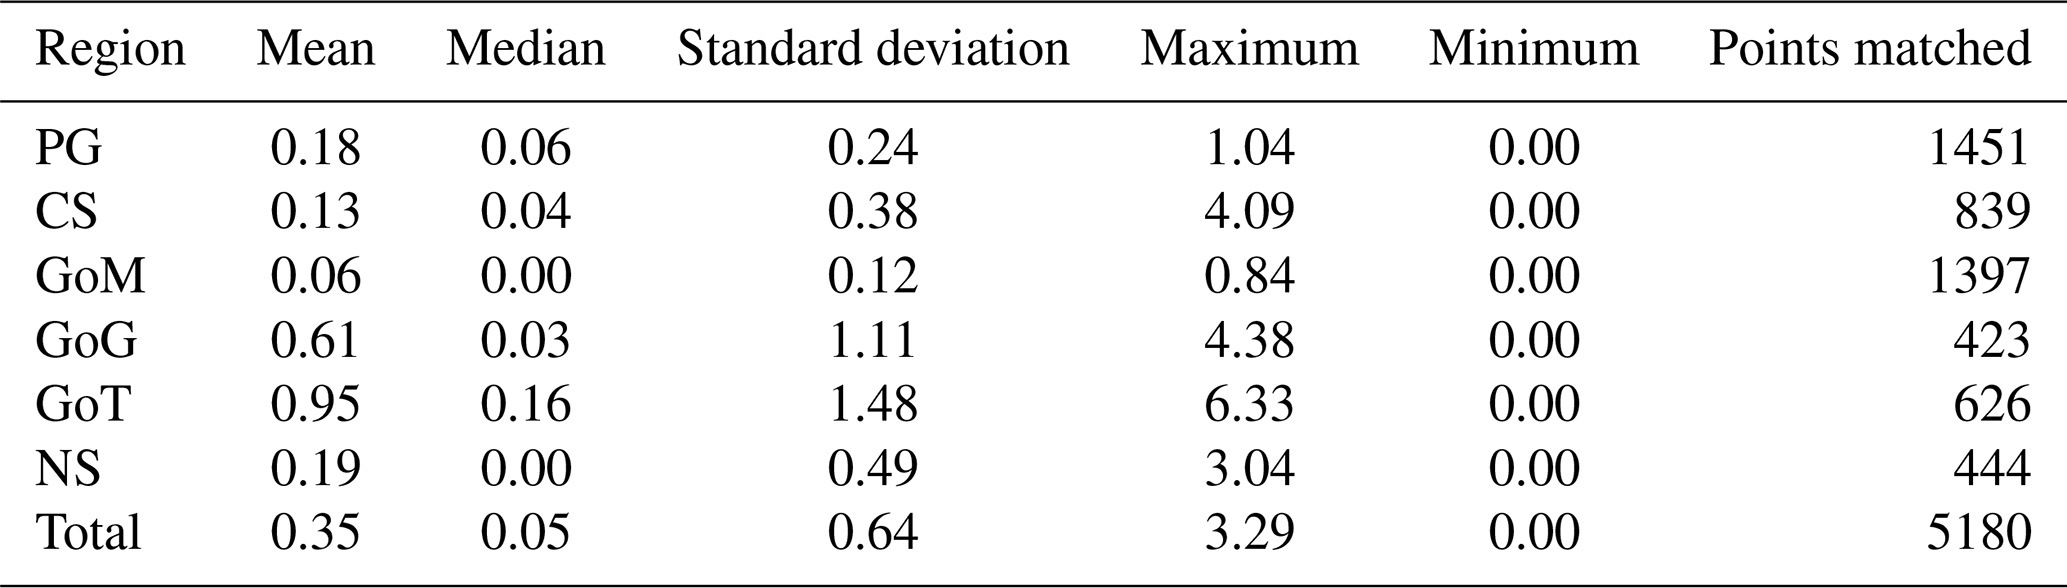
We spatially matched the dataset of OOGPs generated in this work with the BSEE dataset and the OGIM dataset based on the nearest neighbor distance. The distance metric represents the Euclidean offset between the centroid of each SAR-detected OOGP polygon and the corresponding point in the reference dataset, within a 10 m matching radius. The BSEE reference coordinates are derived from operator-reported survey data, and the OGIM coordinates are compiled from official government and industry sources, both registered to the same geographic coordinate system as our detections. Both datasets were used exclusively for validation, ensuring the independence of the comparison. It is important to note that this centroid-to-point distance reflects the spatial offset between the detected polygon centroid and the reference point location, rather than the absolute geolocation accuracy of the satellite-derived product relative to the physical platform location. Table 4 presents the distance error statistics of our OOGPs points and platform points in comparative products. Based on spatial analysis within a nearest neighbor distance of 10 m, 5180 points were matched with the corresponding validation data points. The number of sample points in the PG and GoM was significantly higher than that in other regions, at 1451 and 1397, respectively. Overall, the average regional statistics showed a mean error of 0.35 m, median error of 0.05 m, standard deviation of 0.64 m, maximum error of 3.29 m, and minimum error of 0 m. For large, fixed platforms that dominate the GoM dataset, the strong and spatially concentrated SAR backscatter signal consistently places the detected centroid within a few metres of the operator reported platform centre, which explains the exceptionally low mean error of 0.06 m and median error approximating 0 m observed in this region. The 10 m GRD pixel spacing of Sentinel-1 represents the theoretical lower bound on positional uncertainty, and the achieved centroid agreement reflects the spatial stability of the backscatter signal rather than sub-pixel geolocation precision. Regions with structurally more complex platforms (e.g. GoT, mean error 0.95 m) show larger offsets, consistent with greater uncertainty in centroid placement for such targets. The size of these offshore structures should be considered when validating their locations.
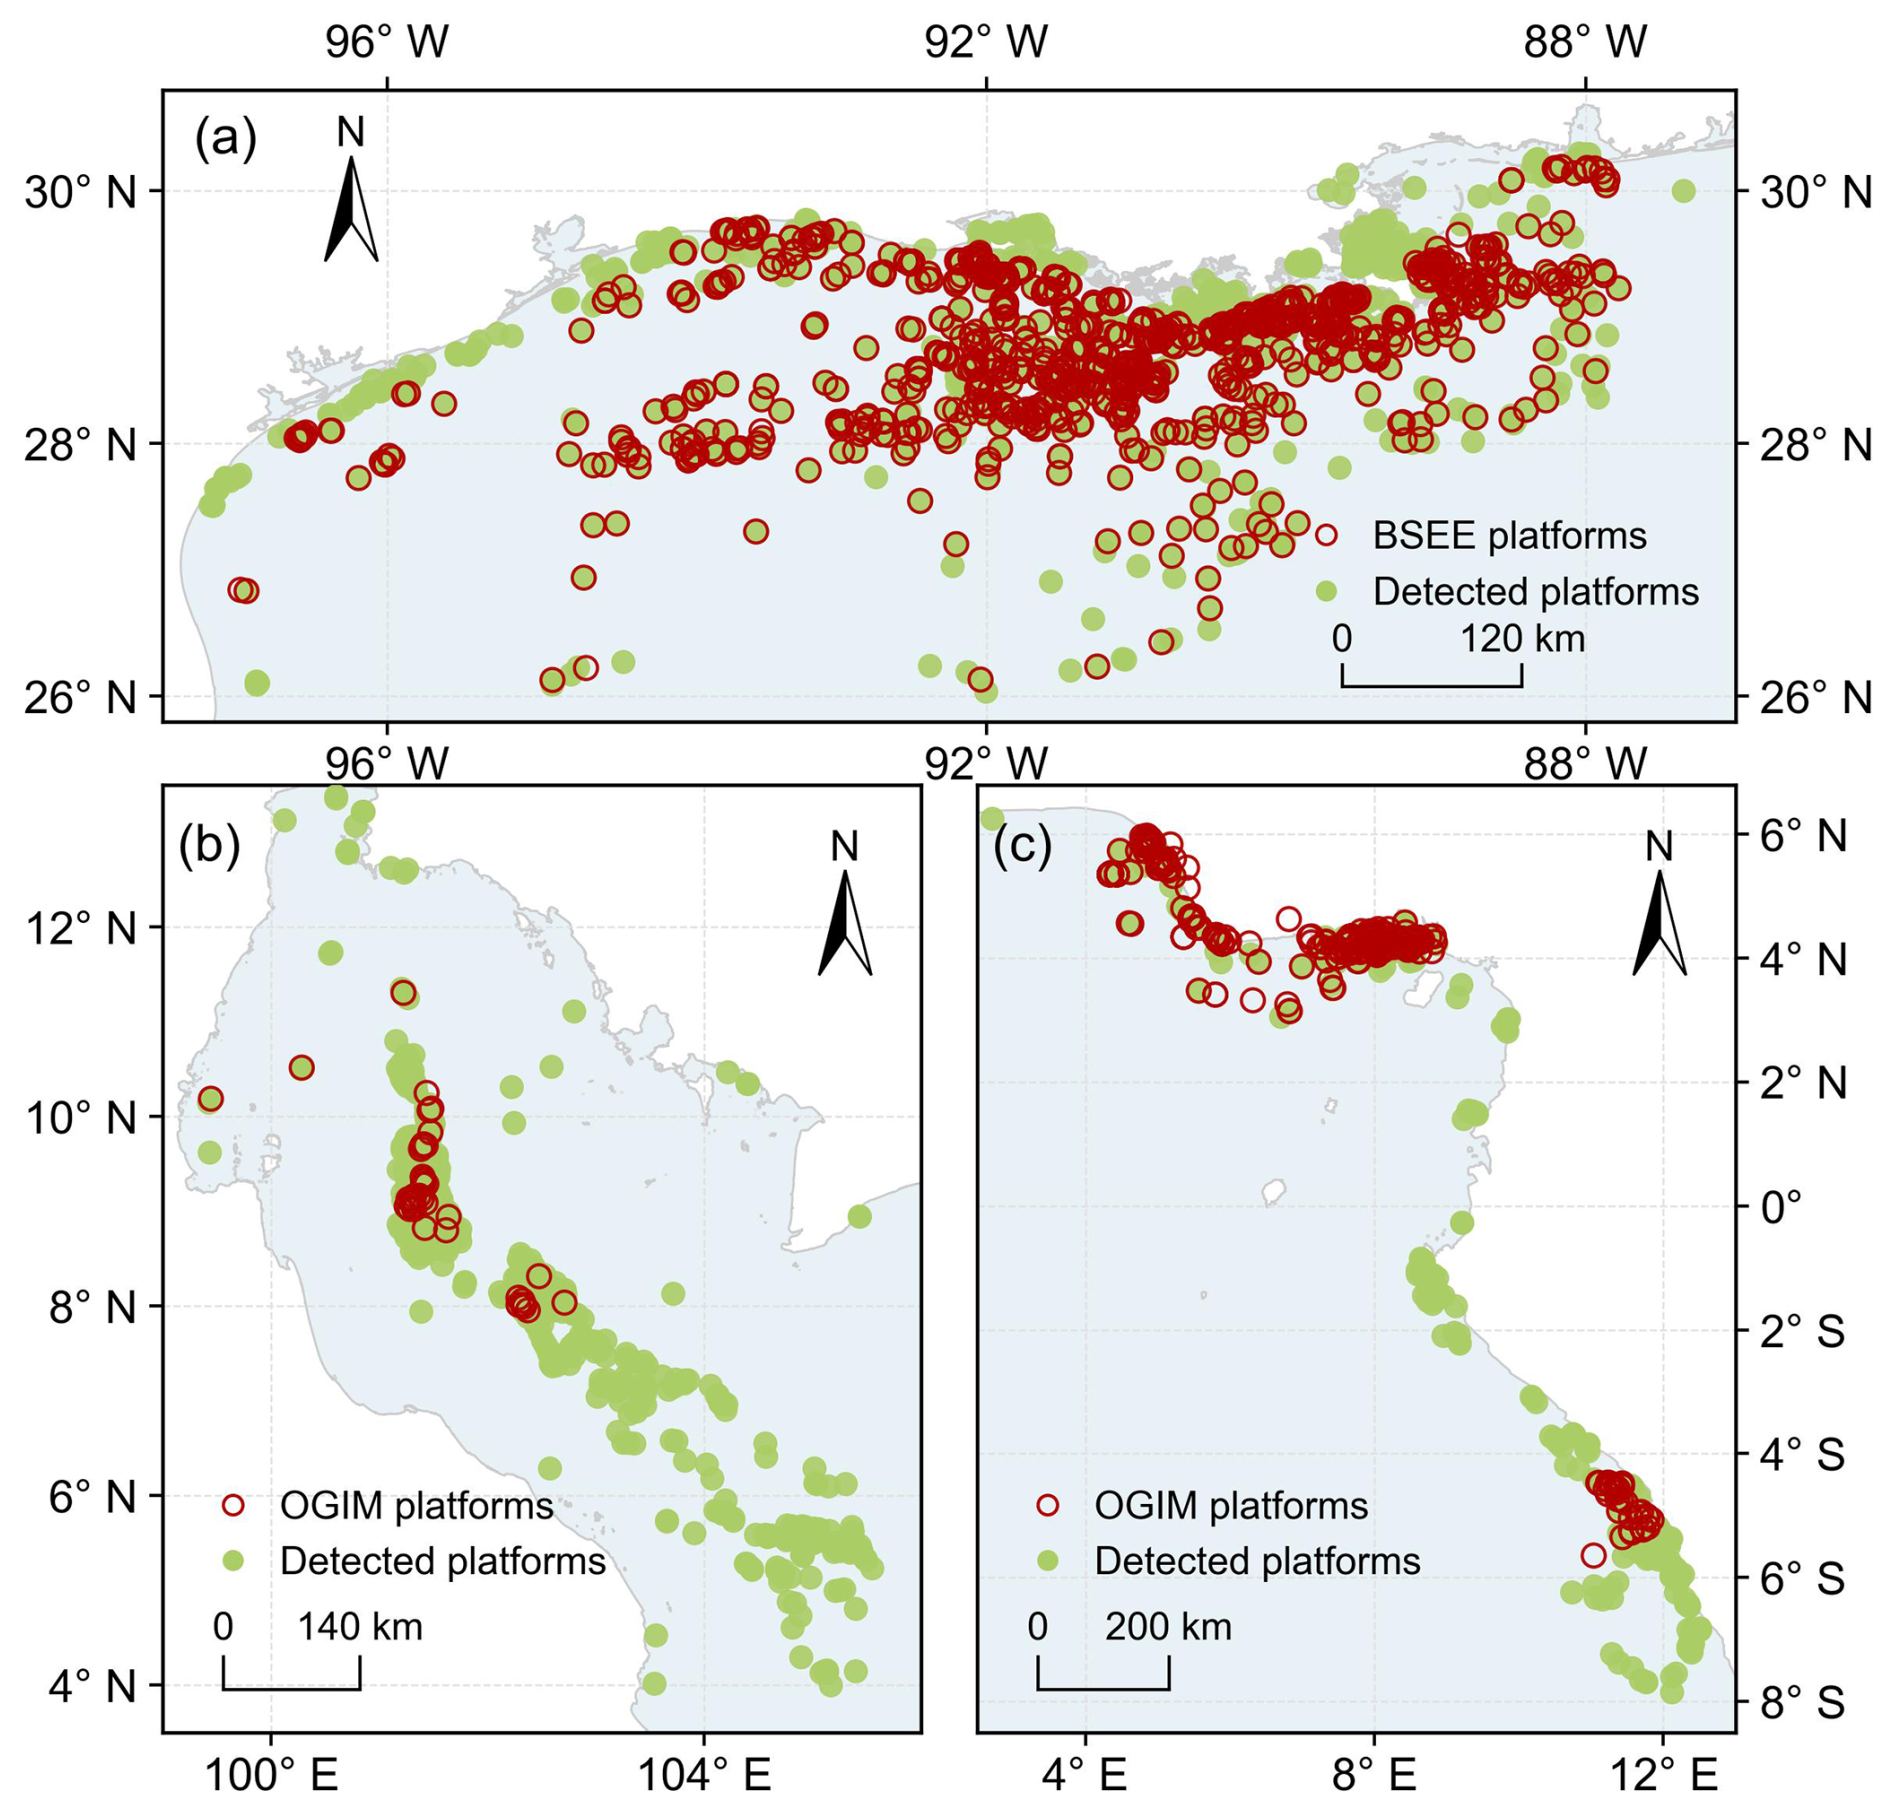
Figure 9Comparison of the OOGPs map and BSEE or OGIM production in 2023. Green points represent OOGPs detected by Sentinel-1. The red circles indicate the referenced production. Panels (a), (b), and (c) indicate comparisons of the NGoM, GoT, and GoG, respectively.
Table 4Transposed error distance statistics (in meters) for the different regions analyzed.
We further visually compared our OOGPs map product with the existing datasets from BSEE and OGIM platform for 2023 at the offshore basin scale (Fig. 9). The unmatched red points in Fig. 9c represent platforms removed before 2023. Since the absence of detailed removal information in the OGIM dataset, such inactive platforms could not be excluded from the records, limiting its temporal accuracy. In contrast, our OOGPs dataset provides an enhanced temporal resolution by focusing on actively present platforms. This enables clearer and more timely detection of platform distribution changes, especially in dynamic production areas where some OGIM platforms may have been removed but not updated in attribution. Spatially, our dataset offers broader and denser platform coverage in marginal seas and nearshore zones that are often underrepresented in existing products. As shown in panels a–c of Fig. 9, the OOGPs map shows more comprehensive distributions in key oil and gas regions such as the NGoM, GoG, and GoT. The validation is described in more detail in Figs. S8 and S9. Overall, the proposed OOGPs dataset holds significant international value by filling critical gaps in existing global offshore infrastructure inventories. Existing datasets, such as BSEE or OGIM, often suffer from low update frequencies, incomplete metadata, and inconsistent reporting standards. Our approach provides a unified, timely, and spatially detailed view of OOGPs using time-series Sentinel-1 SAR imagery based on an adaptive detection framework. Beyond spatial and temporal completeness, the dataset also incorporates key platform attributes such as flaring activity, derived from long-term thermal anomaly detection. This attribute provides insights into operational status and potential environmental impact, which are often lacking in existing inventories.
The enhanced detail and reliability of the OOGPs dataset enables a wide range of applications, including: (1) global environmental monitoring, such as tracking emissions, identifying oil spill risks, and assessing marine ecosystem impacts; (2) maritime domain awareness, including vessel interaction analysis, infrastructure security, and illegal activity surveillance; (3) energy transition tracking, where timely and accurate data on fossil fuel infrastructure is critical for national decarbonization planning and offshore wind site assessments. By offering a more comprehensive inventory across various regions, this dataset contributes to improved global transparency, data interoperability, and decision-making in offshore energy management and remote sensing applications.
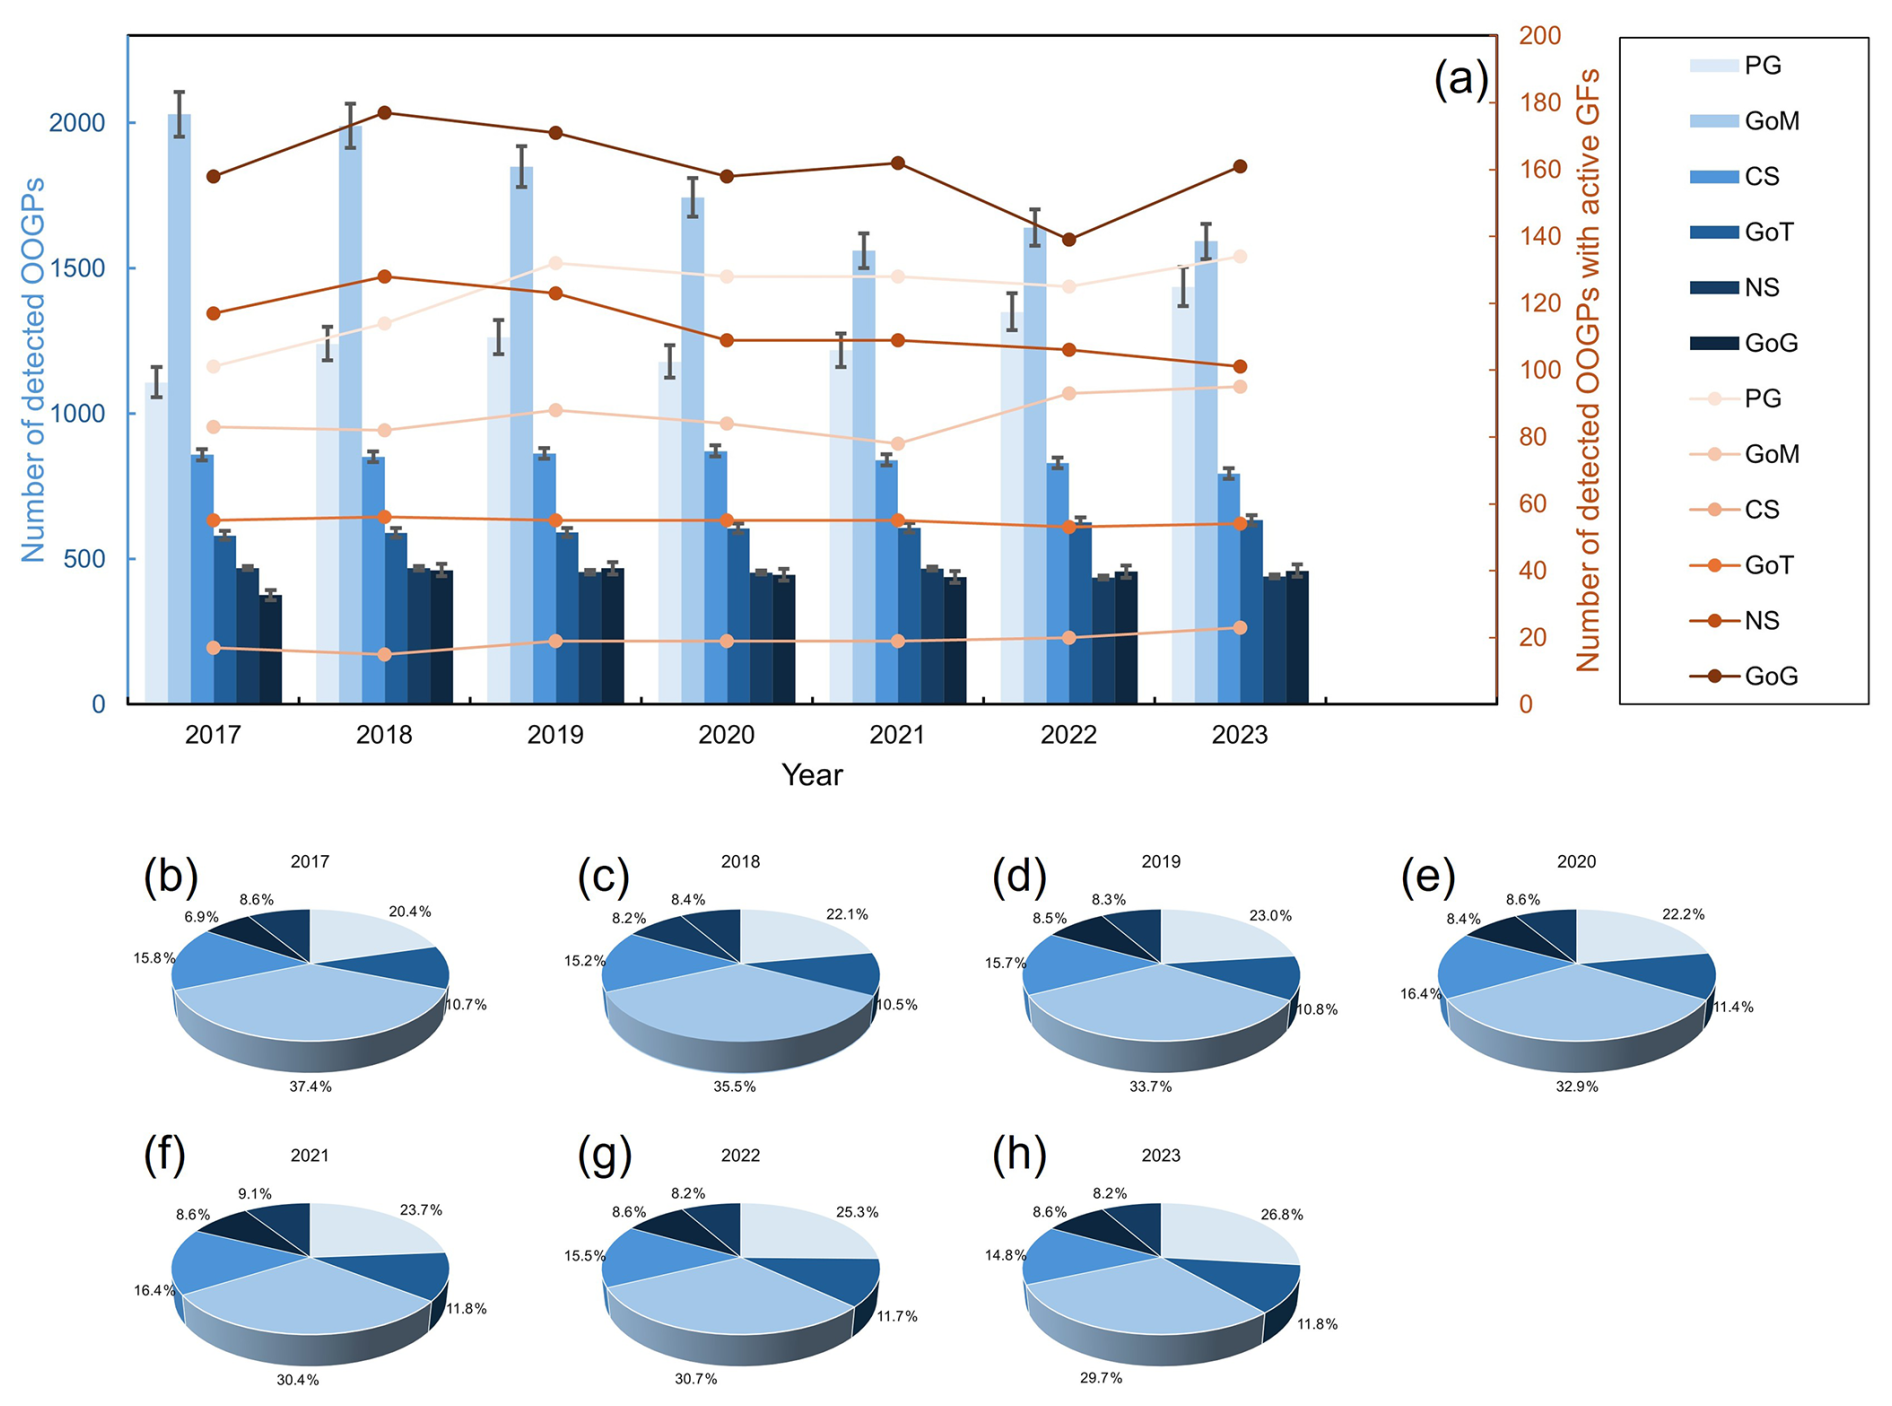
Figure 10(a) Temporal evolution of detected OOGPs and OOGPs with active gas flarings (GFs) in select regions. (b–h) Proportion of each offshore basin based on available data from 2017 to 2023. Error bars represent algorithmic uncertainty estimated from OF threshold sensitivity analysis (σOF=1.6 %–4.7 %; see Table S3).
4.2 Temporal patterns of OOGPs from 2017 to 2023
An open-source OOGPs dataset with detailed spatial and temporal information plays an important role in understanding temporal patterns in offshore oil and gas infrastructure and attributing satellite-observed GHG emissions to upstream fossil fuel operations. In particular, the inclusion of offshore GFs labels enables assessment of the prevalence of unlit flaring, improving the attribution of satellite-detected methane plumes to specific sources.
We acquired approximately 5358 existing OOGPs. Its records include point-based OOGP locations, facility areas, EEZs, and GFs activity labels. Among all records, the GoM accounted for the largest share, nearly 30 % of total entries in 2023, followed by the PG and CS. The GoG holds the smaller share, around 8.6 %, but still displays notable flare activity. This reveals the environmental relevance of even smaller offshore regions due to the lack of investment or availability of gas infrastructure.
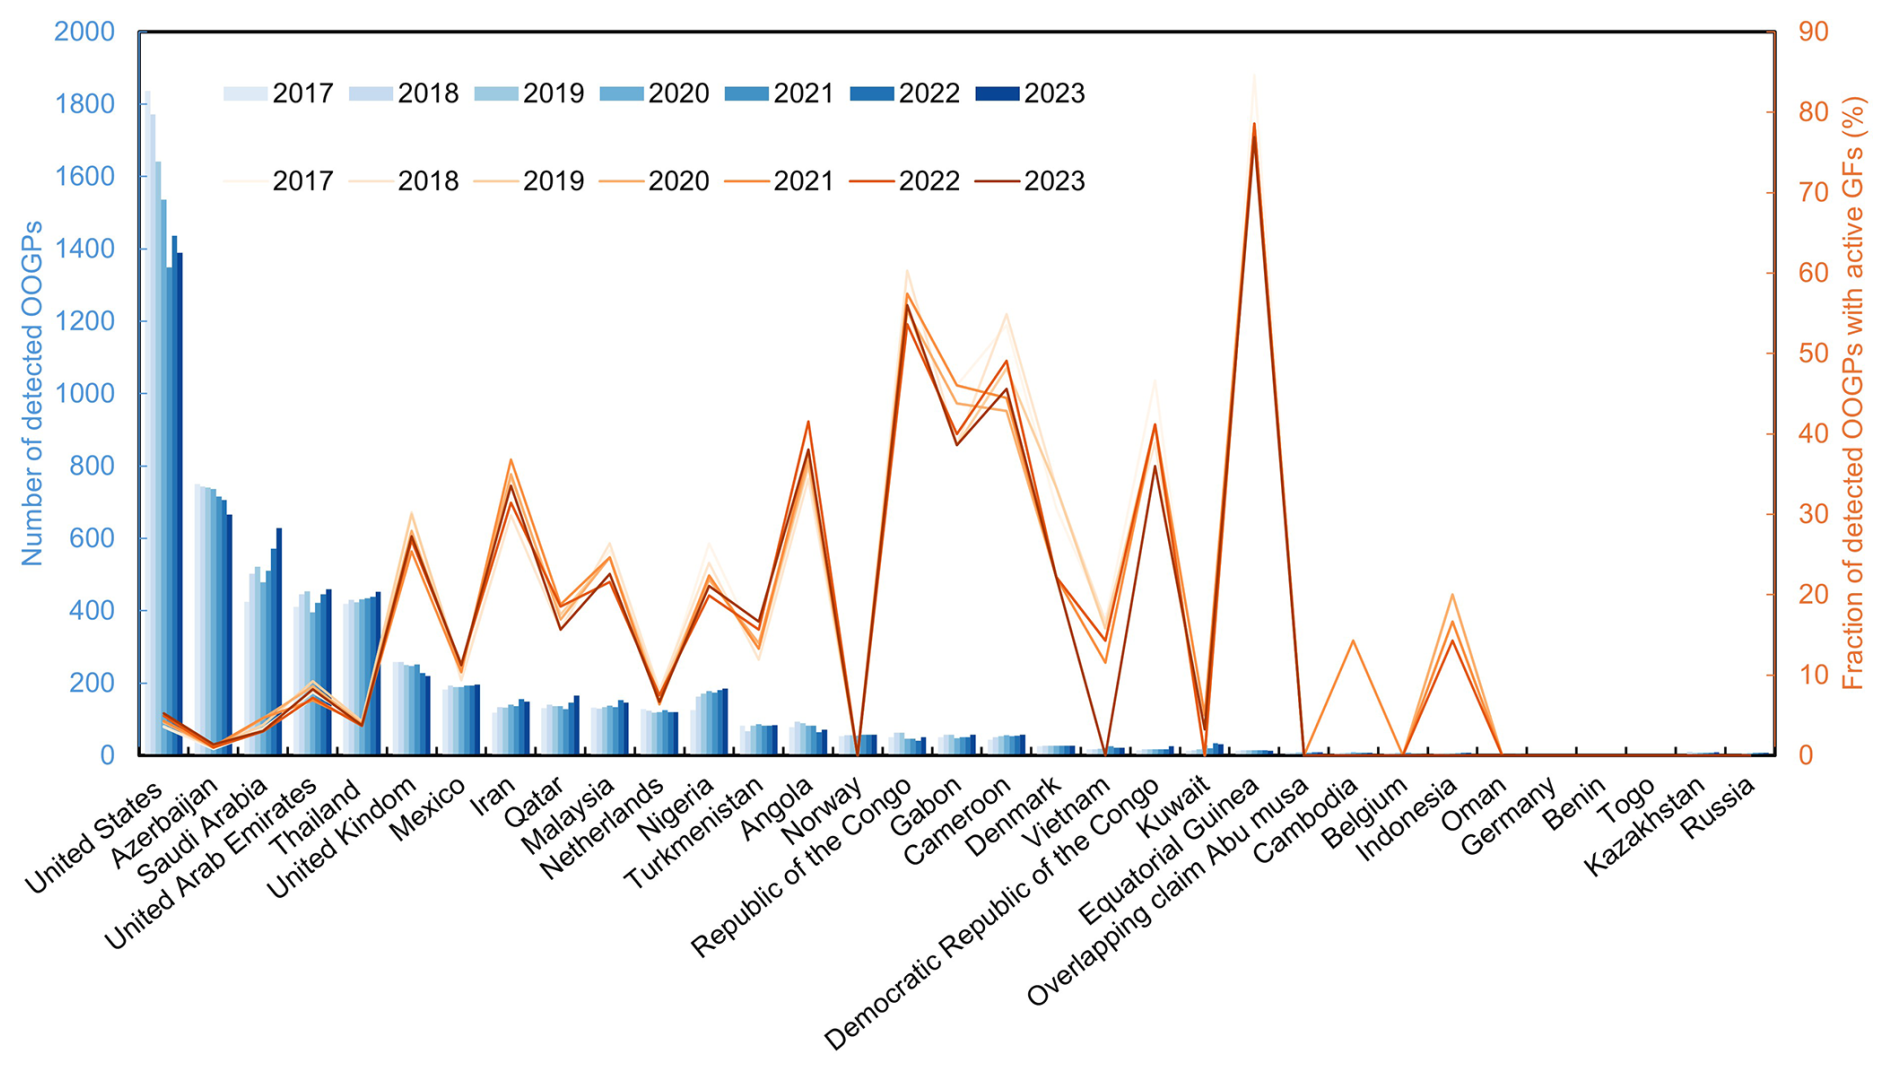
Figure 11National temporal evolution of OOGPs as detected in this study, and the fraction of OOGPs with active gas flarings (GFs) as indicated by Sentinel-2 data from 2017 to 2023.
As illustrated in Fig. 10a, the temporal analysis reveals trends in the six selected regions from 2017 to 2023. The GoM showed a gradual decrease in the number of detected platforms, primarily driven by the decommissioning of aging infrastructure, reduced investment in new exploration, and broader shifts toward cleaner energy policies. Despite this decrease, the number of GoM platforms with GF remained stable or slightly increased, suggesting more intensive production activities at remaining facilities, as well as the persistence of legacy infrastructure that lacks sufficient gas capture or reinjection systems. The mismatch between platform decommissioning and flaring mitigation efforts highlights ongoing infrastructure and policy challenges in managing associated emissions. In contrast, the PG exhibited a gradual increase in both the number of OOGPs and those with GFs, which may reflect the expansion of production capacity, the deployment of new platforms, or operational inefficiencies associated with maintenance. The CS and GoT show smaller but similar trends, with moderate year-to-year fluctuations likely driven by project-level cycles or maintenance schedules. The robustness of these trends against algorithmic parameter uncertainty was assessed through an OF threshold sensitivity analysis, the methodology and results of which are provided in the Supplement (Table S3).
The pie charts in Fig. 10b–h present annual distributions of OOGPs across the six offshore basins between 2017 and 2023. The GoM is consistently ranked as the leading area in terms of OOGPs count, although its dominance gradually declined from 37.4 % in 2017 to 29.7 % in 2023. Meanwhile, the PG's share gradually increased from 20.4 % in 2017 to 26.8 % in 2023, confirming regional growth.
To further examine national dynamics, Fig. 11 provides the annual OOGPs detection counts and associated flare activity for individual countries. The US remains the leader in offshore oil and gas infrastructure among all countries in this study, despite a slight decline year-over-year. In contrast, Saudi Arabia and the United Arab Emirates (UAE) experienced a steady rise in OOGP detections, reflecting large-scale field development and offshore investment (Fig. S10). This makes them the second-largest contributors after the US (Kaiser, 2022; Chen et al., 2024). Other key countries, including Mexico, Iran, Malaysia, Netherlands, and Nigeria, maintain relatively stable detection counts, each with over 100 platforms annually. Notably, Azerbaijan also exhibits a relatively high number of detected OOGPs despite its more limited offshore area. This can be attributed to the unique structural configuration of its offshore facilities, particularly the Oil Rocks (Neft Daşları) complex in the CS (See example in Fig. 2i). Unlike traditional standalone platforms, Oil Rocks consists of a network of numerous small interconnected production units and walkways constructed over shallow waters. These discrete elements are often identified as multiple independent platforms from satellite imagery, leading to a higher overall detection count in Azerbaijan. Similarly, Thailand maintained a dense distribution of small-scale offshore infrastructure in the GoT. These eleven countries collectively account for approximately 90 % of all OOGPs detected in the study areas, reflecting a clear spatial concentration of OOGPs.
In summary, this multi-year dataset offers insights into operational shifts in offshore fossil fuel development. It reveals regional changes including the decline of infrastructure and steady GFs in the GoM; platform expansion and increasing GFs activity in the PG; and flare-associated intensity variations in the GoG. It also highlights national-level strategies, with countries like the US and Saudi Arabia pursuing distinct trajectories in offshore energy development. These insights are critical for supporting methane monitoring, understanding regulatory effectiveness, and informing climate policy on offshore energy systems.
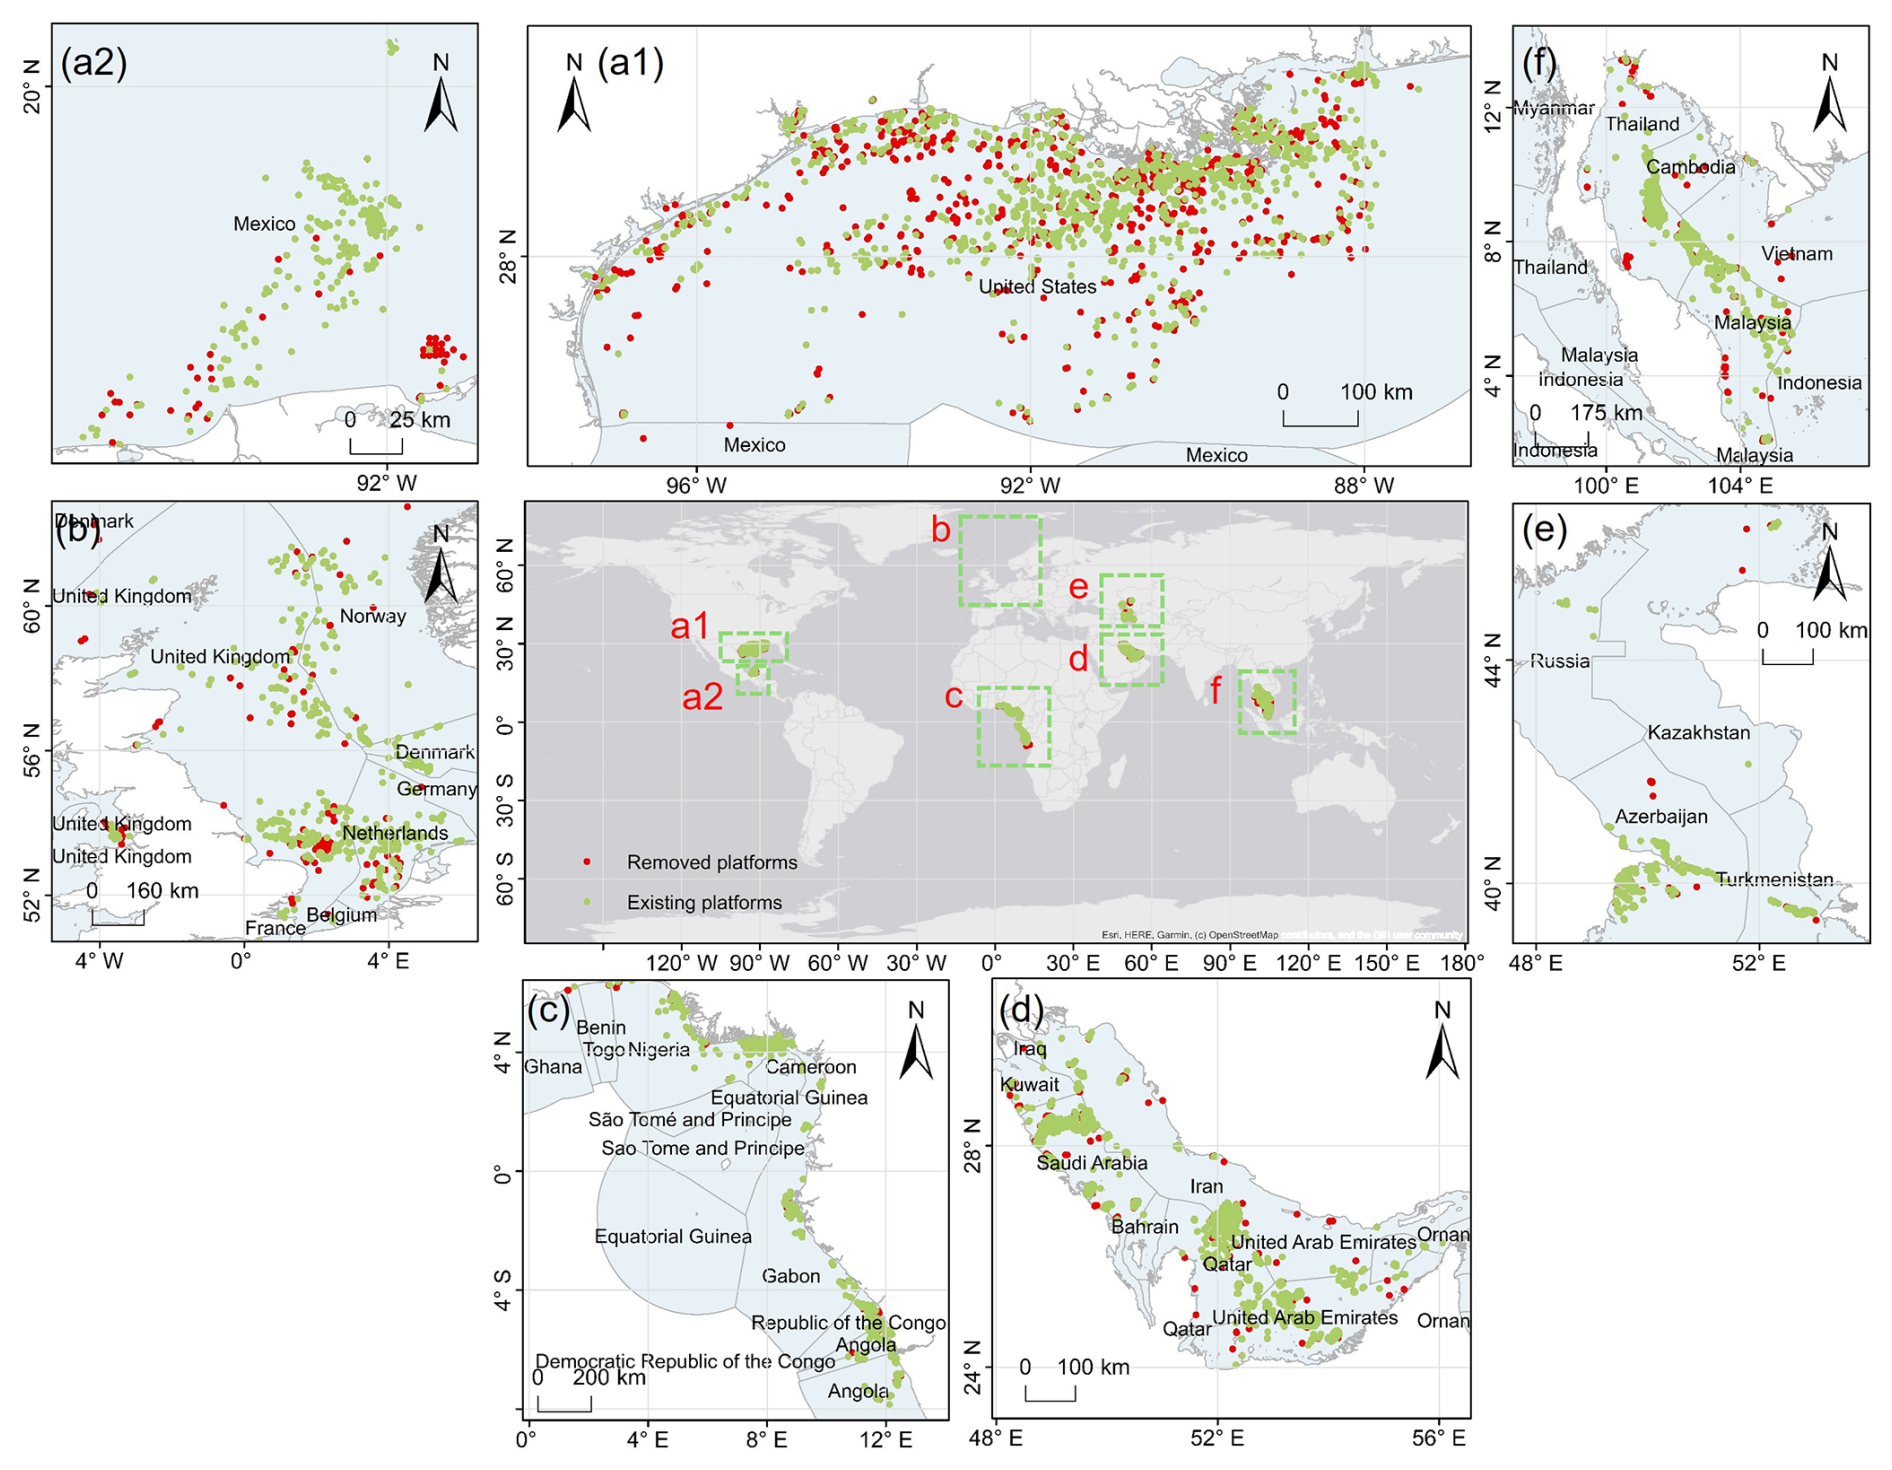
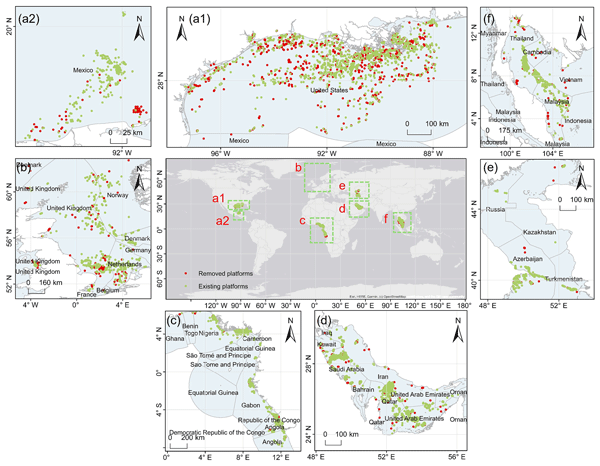
Figure 12Spatial distribution of OOGPs detected in select regions based on available data from 2017 to 2023. Zoom-in insets of the NGoM, SGoM, NS, GoG, Persian Gulf, and GoT. The colors of OOGPs represent their status (green = existing and red = removed).
4.3 Spatial distribution patterns of OOGPs in different EEZs
Figure 12 illustrates the distinct spatial distribution patterns of OOGPs detected in various EEZs of the selected ROIs. The green points represent existing platforms until 2023 and the red points represent platforms removed from 2017 to 2023 in the corresponding EEZ region. OOGPs are highly clustered in major oil-producing regions, with varying densities and removal histories. The US has the most OOGPs in all selected EEZs. The GoM, GoT, and PG EEZs, such as the US, Saudi Arabia, UAE, and Thailand, exhibit the highest density characteristics, with clear spatial linear patterns and small-scale cluster patterns along structural basin belts, whereas the distribution of platforms in the NS is relatively widespread. This indicates that the distribution of oil and gas fields is controlled by regional tectonic and geological conditions, with hydrocarbon resources mainly concentrated in structural highs and fault zones within sedimentary basins. The significant number of platforms removed in the NGoM, NS, and GoT regions can be attributed to the extensive presence of active movable and decommissioned platforms with long-term exploitation. In contrast, platforms in the GoG are more dispersed, with fewer platforms removed along the coast over several years. Because our detection relies on persistent backscattering over time, platforms that undergo rapid, short-distance relocation within the same year may show shifts in their detection location. Such development activities are expected to be identified in future studies.
4.4 Discussion and outlook
This study aimed to improve the automation and timeliness of offshore platform detection, thereby better supplementing existing government reporting data. However, certain limitations and uncertainties remain.
First, the spatial coverage of the current dataset is restricted to six major offshore basins; emerging production regions including Southeast Asian basins are not included and represent a priority for future extension.
Second, detection near the coastline is constrained by blurred shorelines, rocky coasts and intertidal mudflats. To mitigate these effects, a 500 m buffer zone from the coastline was applied, and all objects within this zone were manually checked.
Third, the detection sensitivity of the Sentinel-1 VH backscatter approach is inherently constrained by the 10 m spatial resolution of the GRD product. Platforms smaller than approximately 5 m×20 m are difficult to detect. This effect is compounded in nearshore and high-traffic environments, where elevated sea surface clutter from wind-roughened water and vessel wakes can partially mask the backscatter signatures of small platforms, further reducing detection completeness. These factors may lead to underestimation of platform numbers in regions with high platform density, such as the GoM and the PG.
Fourth, the monthly temporal resolution of the Sentinel-1 composites limits the precision of installation and removal date estimates, and platforms installed or removed near the boundaries of the observation period may not be reliably captured by the MK change point detection.
Fifth, the reference databases used for accuracy assessment, including BSEE, OGIM, and OESNS, differ in data collection methods, regulatory jurisdictions, and update cycles across basins. Post-2017 installation and removal records are sparse in most sources, limiting the scope of temporal validation for the inferred date attributes.
Although recent supervised machine learning, deep learning, and multi-sensor fusion approaches have demonstrated strong performance for offshore platform detection in specific regions, their applicability to long-term basin-scale monitoring remains associated with several practical challenges. Deep learning approaches generally require large annotated training datasets and may experience reduced transferability across regions with different environmental conditions or platform characteristics. Optical and multisensor approaches can be further affected by cloud contamination, inconsistent acquisition schedules, and varying data availability among regions and years.
In comparison, the unsupervised SAR-based framework adopted in this study prioritizes temporal consistency, operational scalability, and reproducibility across geographically diverse offshore basins. Although the method may not always achieve the same level of local optimization as region-specific supervised approaches, its independence from annotated training data and all-weather observational capability make it particularly suitable for constructing long-term, large-scale spatiotemporal OOGP datasets. Future integration of deep learning or multi-sensor information may further improve detection completeness, especially in high-density offshore production regions.
The OOGPs data is available from https://doi.org/10.5281/zenodo.18350974 (Si et al., 2026) in an open-access vector file format. All records were produced and tested using GEE, Python, and ArcGIS 10.8. It provides the spatiotemporal distribution and status of OOGPs in the GoM, NS, GoG, GoT, PG, and CS from 2017 to 2023.
This study produced a vectorized OOGPs dataset that provides OOGPs locations and status in six offshore basins: the GoM, NS, GoG, GoT, PG, and CS. We developed a framework for OOGPs detection based on an adaptive threshold model and morphological operations using time-series Sentinel-1 SAR images and Sentinel-2 MSI images from 2017 to 2023. The effectiveness and robustness of the proposed framework were demonstrated by creating a comprehensive validation dataset and assessing the accuracy of our detected OOGPs against the validation datasets. Our method can effectively remove different types of false positive targets, such as OWTs, ships, and signal noise.
As of 2023, 5358 OOGPs have been identified with 1593, 1437, 440, 794, 460, and 634 in the GoM, PG, NS, CS, GoG, and GoT, respectively. These six basin regions have distinct numbers of OOGPs, with the GoM and PG leading in terms of deployment. Most OOGPs exhibit regular linear or clustered spatial distributions, revealing the geographical concentration and regional variation in offshore energy infrastructure. The attribute information of this updated and completed dataset meets the critical geospatial data needs to support offshore environmental monitoring, facility-scale pollutant gas emission tracking, assessment and mitigation.
The GoM has witnessed a clear trend of decommissioning OOGPs, indicating its long history of exploration and development. However, the installation of OOGPs has exhibited a remarkable exponential growth trend in PG from 2017 to 2023. Despite having the fewest or second-fewest platforms between 2017 and 2023, the GoG exhibited the highest level of GF activities. These variations provide valuable insights into regional development trajectories and environmental risks associated with offshore infrastructure.
The validation and assessment results highlight the effectiveness of our dataset-production framework with high precision. The OOGPs dataset achieved precision of 0.95, recall of 0.89, F1 score of 0.92, and mean error distance of 0.35 m. In addition, compared with the OGIM dataset, our results establish higher coverage detections with detailed location, country, EEZs, area, and GFs status over a long period.
The supplement related to this article is available online at https://doi.org/10.5194/essd-18-6545-2026-supplement.
LG and IIL conceived the study and acquired funding for this research. LS and SZ designed the methodology. LS developed the scripts, compiled the dataset, and prepared the original draft of the manuscript. LS, SZ, and IIL contributed to the visualization and analyses. IIL and JR contributed to validation by providing feedback and suggestions. LG supervised the research. All authors contributed to review and editing of the manuscript.
The contact author has declared that none of the authors has any competing interests.
Publisher's note: Copernicus Publications remains neutral with regard to jurisdictional claims made in the text, published maps, institutional affiliations, or any other geographical representation in this paper. The authors bear the ultimate responsibility for providing appropriate place names. Views expressed in the text are those of the authors and do not necessarily reflect the views of the publisher.
This research was supported by the China Scholarship Council (Grant number: 202306220072) and funded by UNEP's International Methane Emissions Observatory (IMEO). The authors thank the Copernicus Programme of the European Space Agency for the free provision of Sentinel-1 and Sentinel-2 data, and the Google Earth Engine platform for enabling efficient data preprocessing and access. We also express our sincere appreciation to all data providers of BSEE, OGIM, NOAA, OESNS and FIRMS production for their sharing.
This paper was edited by Bo Zheng and reviewed by two anonymous referees.
Alvarez, R. A., Zavala-Araiza, D., Lyon, D. R., Allen, D. T., Barkley, Z. R., Brandt, A. R., Davis, K. J., Herndon, S. C., Jacob, D. J., Karion, A., Kort, E. A., Lamb, B. K., Lauvaux, T., Maasakkers, J. D., Marchese, A. J., Omara, M., Pacala, S. W., Peischl, J., Robinson, A. L., Shepson, P. B., Sweeney, C., Townsend-Small, A., Wofsy, S. C., and Hamburg, S. P.: Assessment of methane emissions from the U.S. oil and gas supply chain, Science, 361, 186–188, https://doi.org/10.1126/science.aar7204, 2018. a
Anifowose, B., Lawler, D. M., van der Horst, D., and Chapman, L.: A systematic quality assessment of Environmental Impact Statements in the oil and gas industry, Sci. Total Environ., 572, 570–585, https://doi.org/10.1016/j.scitotenv.2016.07.083, 2016. a
Bernstein, B. B.: Evaluating alternatives for decommissioning California's offshore oil and gas platforms, Integr. Environ. Assess. Manag., 11, 537–541, https://doi.org/10.1002/ieam.1657, 2015. a
Cantle, P. and Bernstein, B.: Air emissions associated with decommissioning California's offshore oil and gas platforms, Integr. Environ. Assess. Manag., 11, 564–571, https://doi.org/10.1002/ieam.1653, 2015. a
Casadio, S., Arino, O., and Minchella, A.: Use of ATSR and SAR measurements for the monitoring and characterisation of night-time gas flaring from off-shore platforms: the North Sea test case, Remote Sens. Environ., 123, 175–186, https://doi.org/10.1016/j.rse.2012.03.021, 2012. a, b
Charfeddine, L. and Barkat, K.: Short- and long-run asymmetric effect of oil prices and oil and gas revenues on the real GDP and economic diversification in oil-dependent economy, Energy Econ., 86, 104680, https://doi.org/10.1016/j.eneco.2020.104680, 2020. a
Chen, S., Wang, H., Xu, F., and Jin, Y.: Target classification using the deep convolutional networks for SAR images, IEEE T. Geosci. Remote, 54, 4806–4817, https://doi.org/10.1109/TGRS.2016.2551720, 2016. a
Chen, X., Wang, Z., Li, C., Gao, F., and Wei, Q.: Characteristics of global offshore oil and gas development, in: Proceedings of the International Field Exploration and Development Conference (IFEDC) 2023, Springer Series in Geomechanics and Geoengineering, Springer Nature Singapore, Wuhan, China, https://doi.org/10.1007/978-981-97-0475-0_87, 1026–1053, 2024. a
Ekins, P., Vanner, R., and Firebrace, J.: Zero emissions of oil in water from offshore oil and gas installations: economic and environmental implications, J. Clean. Prod., 15, 1302–1315, https://doi.org/10.1016/j.jclepro.2006.07.014, 2007. a
Elvidge, C. D., Zhizhin, M., Baugh, K., Hsu, F.-C., and Ghosh, T.: Methods for global survey of natural gas flaring from visible infrared imaging radiometer suite data, Energies, 9, 14, https://doi.org/10.3390/en9010014, 2016. a, b, c
Falqueto, L. E., Sá, J. A. S., Paes, R. L., and Passaro, A.: Oil rig recognition using convolutional neural network on Sentinel-1 SAR images, IEEE Geosci. Remote S., 16, 1329–1333, https://doi.org/10.1109/LGRS.2019.2894845, 2019. a, b
Faruolo, M., Genzano, N., Marchese, F., and Pergola, N.: Multi-temporal satellite investigation of gas flaring in Iraq and Iran: the DAFI porting on Collection 2 Landsat 8/9 and Sentinel 2A/B, Sensors, 23, 5734, https://doi.org/10.3390/s23125734, 2023. a
Hamed, K. H.: Trend detection in hydrologic data: the Mann–Kendall trend test under the scaling hypothesis, J. Hydrol., 349, 350–363, https://doi.org/10.1016/j.jhydrol.2007.11.009, 2008. a
Henrion, M., Bernstein, B., and Swamy, S.: A multi-attribute decision analysis for decommissioning offshore oil and gas platforms, Integr. Environ. Assess. Manag., 11, 594–609, https://doi.org/10.1002/ieam.1693, 2015. a
Hoeser, T., Feuerstein, S., and Kuenzer, C.: DeepOWT: a global offshore wind turbine data set derived with deep learning from Sentinel-1 data, Earth Syst. Sci. Data, 14, 4251–4270, https://doi.org/10.5194/essd-14-4251-2022, 2022. a
Hunt, J. D., Nascimento, A., Nascimento, N., Vieira, L. W., and Romero, O. J.: Possible pathways for oil and gas companies in a sustainable future: from the perspective of a hydrogen economy, Renew. Sustain. Energy Rev., 160, 112291, https://doi.org/10.1016/j.rser.2022.112291, 2022. a
IEA: World Energy Outlook 2024, https://www.iea.org/reports/world-energy-outlook-2024 (last access: 28 June 2026), 2024. a
IPCC: Summary for policymakers, in: Global warming of 1.5 °C: An IPCC special report on the impacts of global warming of 1.5 °C above pre-industrial levels and related global greenhouse gas emission pathways, in the context of strengthening the global response to the threat of climate change, sustainable development, and efforts to eradicate poverty, World Meteorological Organization, Geneva, Switzerland, https://doi.org/10.1017/9781009157940, 1–32, 2018. a
IPCC: Climate change 2022: Impacts, adaptation and vulnerability. Working Group II contribution to the Sixth Assessment Report of the Intergovernmental Panel on Climate Change, Cambridge University Press, Cambridge, UK and New York, NY, USA, https://doi.org/10.1017/9781009325844, 2022. a
Irakulis-Loitxate, I., Gorroño, J., Zavala-Araiza, D., and Guanter, L.: Satellites detect a methane ultra-emission event from an offshore platform in the Gulf of Mexico, Environ. Sci. Tech. Let., 9, 520–525, https://doi.org/10.1021/acs.estlett.2c00225, 2022. a
Jackson, R. B., Irvin, J. A., Ramachandran, N., Wang, C., Ouyang, Z., Tulloch, P. A., Liu, F. Y., and Ng, A. Y.: MEthane Tracking Emissions Reference (METER): A global database of methane-emitting infrastructure, Earth Syst. Sci. Data Discuss. [preprint], https://doi.org/10.5194/essd-2026-124, in review, 2026. a
Kaiser, M. J.: Offshore oil and gas records circa 2020, Sh. Offshore Struct., 17, 205–241, https://doi.org/10.1080/17445302.2020.1827633, 2022. a
Kendall, M. G.: Rank correlation methods, Econ. J., 59, 575–577, https://doi.org/10.2307/2226580, 1949. a
Lee, J.: The regional economic impact of oil and gas extraction in Texas, Energ. Policy, 87, 60–71, https://doi.org/10.1016/j.enpol.2015.08.032, 2015. a
Liu, Y., Sun, C., Yang, Y., Zhou, M., Zhan, W., and Cheng, W.: Automatic extraction of offshore platforms using time-series Landsat-8 Operational Land Imager data, Remote Sens. Environ., 175, 73–91, https://doi.org/10.1016/j.rse.2015.12.047, 2016. a
Liu, Y., Pu, Y., Hu, X., Dong, Y., Wu, W., Hu, C., Zhang, Y., and Wang, S.: Global declines of offshore gas flaring inadequate to meet the 2030 goal, Nat. Sustain., 6, 1095–1102, https://doi.org/10.1038/s41893-023-01125-5, 2023. a
Ma, R., Wu, W., Wang, Q., Liu, N., and Chang, Y.: Offshore hydrocarbon exploitation target extraction based on time-series night light remote sensing images and machine learning models: a comparison of six machine learning algorithms and their multi-feature importance, Remote Sens.-Basel, 15, 1843, https://doi.org/10.3390/rs15071843, 2023. a
Mann, H. B.: Nonparametric tests against trend, Econometrica, 13, 245–259, https://doi.org/10.2307/1907187, 1945. a
Martins, M. C. I., Carter, M. I., Rouse, S., and Russell, D. J.: Offshore energy structures in the North Sea: past, present and future, Mar. Policy, 152, 105629, https://doi.org/10.1016/j.marpol.2023.105629, 2023. a
Nguyen, T.-V., Tock, L., Breuhaus, P., Maréchal, F., and Elmegaard, B.: CO2-mitigation options for the offshore oil and gas sector, Appl. Energ., 161, 673–694, https://doi.org/10.1016/j.apenergy.2015.09.088, 2016. a
Omara, M., Gautam, R., O'Brien, M. A., Himmelberger, A., Franco, A., Meisenhelder, K., Hauser, G., Lyon, D. R., Chulakadabba, A., Miller, C. C., Franklin, J., Wofsy, S. C., and Hamburg, S. P.: Developing a spatially explicit global oil and gas infrastructure database for characterizing methane emission sources at high resolution, Earth Syst. Sci. Data, 15, 3761–3790, https://doi.org/10.5194/essd-15-3761-2023, 2023. a, b
Pei, J., Huang, Y., Huo, W., Zhang, Y., Yang, J., and Yeo, T.-S.: SAR automatic target recognition based on multiview deep learning framework, IEEE T. Geosci. Remote, 56, 2196–2210, https://doi.org/10.1109/TGRS.2017.2776357, 2018. a
Peng, C., Wang, J., and Li, D.: Oil platform investigation by multi-temporal SAR remote sensing image, in: SAR Image Analysis, Modeling, and Techniques XI, Vol. 8179, SPIE, Prague, Czech Republic, https://doi.org/10.1117/12.897937, 81790V, 2011. a
Ronconi, R. A., Allard, K. A., and Taylor, P. D.: Bird interactions with offshore oil and gas platforms: review of impacts and monitoring techniques, J. Environ. Manage., 147, 34–45, https://doi.org/10.1016/j.jenvman.2014.07.031, 2015. a
Si, L., Zhou, S., Irakulis-Loitxate, I., Roger, J., and Guanter, L.: The Offshore Oil and Gas Platforms (OOGPs) dataset based on satellite data spanning 2017 to 2023, Zenodo [data set], https://doi.org/10.5281/zenodo.18350974, 2026. a, b
Spanier, R. and Kuenzer, C.: Marine infrastructure detection with satellite data: a review, Remote Sens.-Basel, 16, 1675, https://doi.org/10.3390/rs16101675, 2024. a
Spanier, R., Hoeser, T., and Kuenzer, C.: Deep learning-based object detection of offshore platforms on Sentinel-1 imagery and the impact of synthetic training data, Int. J. Remote Sens.-Basel, 47, 2120–2144, https://doi.org/10.1080/01431161.2026.2612908, 2026. a, b
Tan, Y., Li, H. X., Cheng, J. C. P., Wang, J., Jiang, B., Song, Y., and Wang, X.: Cost and environmental impact estimation methodology and potential impact factors in offshore oil and gas platform decommissioning: a review, Environ. Impact Assess. Rev., 87, 106536, https://doi.org/10.1016/j.eiar.2020.106536, 2021. a
Wang, J., Liu, Y., Li, M., Yang, K., and Cheng, L.: Drilling platform detection based on ENVISAT ASAR remote sensing data: a case of southeastern Vietnam offshore area, Geogr. Res., 32, 2143–2152, https://doi.org/10.11821/dlyj201311015, 2013. a
Wang, Z., Li, S., Jin, Z., Li, Z., Liu, Q., and Zhang, K.: Oil and gas pathway to net-zero: review and outlook, Energy Strateg. Rev., 45, 101048, https://doi.org/10.1016/j.esr.2022.101048, 2023. a
Wong, B. A., Thomas, C., and Halpin, P.: Automating offshore infrastructure extractions using synthetic aperture radar & Google Earth Engine, Remote Sens. Environ., 233, 111412, https://doi.org/10.1016/j.rse.2019.111412, 2019. a
Zhang, N., Zhao, H., Jing, P., Gao, Y., Liu, S., Shen, J., Huang, S., Zeng, Q., Liu, Y., and Huang, M.: Deep learning-based intelligent monitoring of petroleum infrastructure using high-resolution remote sensing imagery, Processes, 14, 28, https://doi.org/10.3390/pr14010028, 2025. a
Zhang, T., Tian, B., Sengupta, D., Zhang, L., and Si, Y.: Global offshore wind turbine dataset, Sci. Data, 8, 191, https://doi.org/10.1038/s41597-021-00982-z, 2021. a
Zhang, Z., Yang, J., and Du, Y.: Deep convolutional generative adversarial network with autoencoder for semisupervised SAR image classification, IEEE Geosci. Remote S., 19, 1–5, https://doi.org/10.1109/LGRS.2020.3018186, 2022. a
Zhao, S., Sun, C., Wang, H., and Cheng, W.: Extraction and monitoring of offshore oil and gas platforms based on Landsat imagery, Trop. Geogr., 37, 112–119, https://doi.org/10.13284/j.cnki.rddl.002921, 2017. a
Zhu, H., Jia, G., Zhang, Q., Zhang, S., Lin, X., and Shuai, Y.: Detecting offshore drilling rigs with multitemporal NDWI: a case study in the Caspian Sea, Remote Sens.-Basel, 13, 1576, https://doi.org/10.3390/rs13081576, 2021. a, b