the Creative Commons Attribution 4.0 License.
the Creative Commons Attribution 4.0 License.
 | 03 Sep 2026
ABCFlux v2: Arctic–boreal CO2 and CH4 monthly flux observations and ancillary information across terrestrial and freshwater ecosystems
Anna-Maria Virkkala

Isabel Wargowsky
Judith Vogt
McKenzie A. Kuhn
Simran Madaan
Tiffany Windholz
Kyle A. Arndt
Gerard Rocher-Ros
Mathias Göckede
David Olefeldt
Edward A. G. Schuur
David Bastviken
Richard O'Keefe
Brendan M. Rogers
Jennifer D. Watts
Kelcy Kent
Kristoffer Aalstad
Kelly Aho
Joonatan Ala-Könni
Haley Alcock
Inge Althuizen
Christopher D. Arp
Jun Asanuma
Mika Aurela
Sivakiruthika Balathandayuthabani
Katrin Attermeyer
Alan Barr
Maialen Barret
Ochirbat Batkhishig
Christina Biasi
Mats P. Björkman
Andrew Black
Elena Blanc-Betes
Pascal Bodmer
Julia Boike
Abdullah Bolek
Frédéric Bouchard
Ingeborg Bussmann
Lea Cabrol
Eleonora Canfora
Sean Carey
Karel Castro-Morales
Namyi Chae
Andreas Christen
Torben R. Christensen
Casper T. Christiansen
Housen Chu
Graham Clark
Francois Clayer
Patrick Crill
Christopher Cunada
Scott J. Davidson
Joshua F. Dean
Sigrid Dengel
Matteo Detto
Catherine Dieleman
Florent Domine
Egor Dyukarev
Colin Edgar
Bo Elberling
Craig A. Emmerton
Eugenie Euskirchen
Grant Falvo
Thomas Friborg
Michelle Garneau
Mariasilvia Giamberini
Mikhail V. Glagolev
Miquel A. Gonzalez-Meler
Gustaf Granath
Jón Guðmundsson
Konsta Happonen
Yoshinobu Harazono
Lorna Harris
Josh Hashemi
Nicholas Hasson
Janna Heerah
Liam Heffernan
Manuel Helbig
Warren Helgason
Michal Heliasz
Greg Henry
Geert Hensgens
Tetsuya Hiyama
Beth Holmes
Macall Hock
David Holl
Jutta Holst
Thomas Holst
Gabriel Hould-Gosselin
Elyn Humphreys
Jacqueline Hung
Jussi Huotari
Hiroki Ikawa
Danil V. Ilyasov
Mamoru Ishikawa
Go Iwahana
Hiroki Iwata
Marcin Antoni Jackowicz-Korczynski
Joachim Jansen
Järvi Järveoja
Vincent E. J. Jassey
Rasmus Jensen
Katharina Jentzsch
Robert G. Jespersen
Carl-Fredrik Johannesson
Cheristy P. Jones
Anders Jonsson
Ji Young Jung
Sari Juutinen
Evan Kane
Jan Karlsson
Sergey Karsanaev
Kuno Kasak
Julia Kelly
Kasha Kempton
Marcus Klaus
George W. Kling
Natascha Kljun
Jacqueline Knutson
Hideki Kobayashi
John Kochendorfer
Kukka-Maaria Kohonen
Pasi Kolari
Mika Korkiakoski
Aino Korrensalo
Pirkko Kortelainen
Egle Koster
Kajar Koster
Ayumi Kotani
Praveena Krishnan
Juliya Kurbatova
Lars Kutzbach
Min Jung Kwon
Ethan D. Kyzivat
Jessica Lagroix
Theodore Langhorst
Elena Lapshina
Tuula Larmola
Klaus S. Larsen
Isabelle Laurion
Justin Ledman
Hanna Lee
A. Joshua Leffler
Lance Lesack
Anders Lindroth
David Lipson
Annalea Lohila
Efrén López-Blanco
Vincent L. St. Louis
Erik Lundin
Miska Luoto
Takashi Machimura
Marta Magnani
Avni Malhotra
Marja Maljanen
Ivan Mammarella
Elisa Männistö
Luca Belelli Marchesini
Phil Marsh
Pertti J. Martikainen
Maija E. Marushchak
Mikhail Mastepanov
Alex Mavrovic
Trofim Maximov
Christina Minions
Daniel F. Nadeau
Marco Montemayor
Tomoaki Morishita
Patrick Murphy
Erin Nicholls
Mats B. Nilsson
Anastasia Niyazova
Jenni Nordén
Koffi Dodji Noumonvi
Hannu Nykänen
Walter Oechel
Anne Ojala
Tomohiro Okadera
Sujan Pal
Alexey V. Panov
Tim Papakyriakou
Dario Papale
Sang-Jong Park
Frans-Jan W. Parmentier
Gilberto Pastorello
Mike Peacock
Matthias Peichl
Roman Petrov
Kyra St. Pierre
Norbert Pirk
Jessica Plein
Vilmantas Preskienis
Anatoly Prokushkin
Jukka Pumpanen
Hilary A. Rains
Niklas Rakos
Aleksi Räsänen
Helena Rautakoski
Riikka Rinnan
Janne Rinne
Adrian Rocha
Nigel Roulet
Alexandre Roy
Anna Rutgersson
Aleksandr F. Sabrekov
Torsten Sachs
Erik Sahlée
Alejandro Salazar
Henrique Oliveira Sawakuchi
Christopher Schulze
Roger Seco
Armando Sepulveda-Jauregui
Svetlana Serikova
Abbey Serrone
Hanna M. Silvennoinen
Sofie Sjogersten
June Skeeter
Jo Snöälv
Sebastian Sobek
Oliver Sonnentag
Emily H. Stanley
Maria Strack
Lena Strom
Patrick Sullivan
Ryan Sullivan
Anna Sytiuk
Torbern Tagesson
Pierre Taillardat
Julie Talbot
Suzanne E. Tank
Mario Tenuta
Irina Terenteva
Frederic Thalasso
Antoine Thiboult
Halldor Thorgeirsson
Fenix Garcia Tigreros
Margaret Torn
Amy Townsend-Small
Claire Treat
Alain Tremblay
Carlo Trotta
Eeva-Stiina Tuittila
Merritt Turetsky
Masahito Ueyama
Muhammad Umair
Lona van Delden
Maarten van Hardenbroek
Andrej Varlagin
Ruth K. Varner
Tarmo Virtanen
Elena Veretennikova
Timo Vesala
Carolina Voigt
Jorien E. Vonk
Robert Wagner
Katey Walter Anthony
Qinxue Wang
Masataka Watanabe
Hailey Webb
Jeffrey M. Welker
Andreas Westergaard-Nielsen
Sebastian Westermann
Jeffrey R. White
Christian Wille
Scott N. Williamson
Scott Zolkos
Donatella Zona
Susan M. Natali
Measurements of surface-atmosphere carbon dioxide (CO2) and methane (CH4) fluxes have been relatively sparse across the Arctic tundra and boreal biomes, causing significant uncertainties in carbon budget estimates from the region. While the availability of Arctic-boreal carbon flux data has increased substantially over the past decade, the data have remained spread across different repositories, scientific articles, and unpublished sources, making it difficult to leverage. Here we present a new dataset of monthly Arctic-boreal carbon fluxes (ABCFlux v2) across terrestrial (wetlands and uplands) and freshwater (lakes and rivers) ecosystems compiled from previous syntheses including the Arctic-boreal CO2 flux database (ABCFlux v1), the Boreal-Arctic Wetland and Lake Methane Dataset (BAWLD-CH4), and the Global River Methane Database (GRiMeDB). In addition, we consider data from general-purpose (e.g., Zenodo) and flux network repositories, literature, and site principal investigators. The dataset includes surface-atmosphere CO2 fluxes of gross primary production (GPP), ecosystem respiration (Reco), and net ecosystem exchange (NEE), alongside CH4 fluxes. For aquatic ecosystems, we split CH4 fluxes into diffusive and ebullitive flux pathways, and included potential emissions from transient storage in the water column (“storage fluxes”), alongside CO2 and CH4 concentrations dissolved in the surface water. Fluxes are measured through a variety of methods including chamber and eddy covariance techniques alongside bubble traps, ice-surveys, and concentration-based turbulence-driven modelling in aquatic ecosystems. The monthly flux data are reported together with supporting methodological and environmental metadata. The resulting ABCFlux v2 has 23 847 flux site-months, 8182 concentration site-months, and 199 seasonal observations from 1024 sites, and includes 56 139 reported fluxes (i.e. sum of GPP, Reco, NEE, and CH4 fluxes) from the years 1984 to 2024. The majority of monthly observations occurred after 1999. Wetlands had the highest number of site-month observations (8758), followed by boreal forest (6981), lotic ecosystems (6275), lentic ecosystems (3799) and upland tundra (3308). Measurements of CO2 dominated the dataset across most ecosystem types (25 222) except for lentic ecosystems, where CH4 flux site-months (3098) were more frequent than CO2 flux site-months (2915). Overall, ABCFlux v2 includes 160 % more site-months for terrestrial CO2 flux data compared to ABCFlux v1. Integrating and updating BAWLD-CH4 flux data from growing season averages to monthly fluxes resulted in 5671 site-months of chamber CH4 data compared to 762 site-years. This collaborative initiative, involving contributions from over 260 researchers, provides a comprehensive overview of the current state of the Arctic-boreal carbon flux network and its data, and serves as an important step in reducing uncertainties in Arctic-boreal carbon budgets and in enhancing our understanding of climate feedbacks. The data can be accessed at ORNL DAAC at https://doi.org/10.3334/ORNLDAAC/2448 (Virkkala et al., 2026).
- Article
(3582 KB) - Full-text XML
-
Supplement
(8134 KB) - BibTeX
- EndNote


The Arctic-boreal region has historically been sparsely measured for carbon dioxide (CO2) and methane (CH4) fluxes (Baldocchi et al., 2018; Pallandt et al., 2022). This data sparsity, together with rapid warming, changes in hydrology, permafrost thaw, and other environmental shifts (Biskaborn et al., 2019; O'Neill et al., 2023; Rantanen et al., 2022; Webb et al., 2022), has created significant uncertainties in Arctic-boreal carbon budget estimates (Hugelius et al., 2024; Treat et al., 2024), hindering our capability to understand the fate of its large soil organic carbon stocks (Hugelius et al., 2014; Schuur et al., 2008, 2022). However, over the past decade, the availability of Arctic-boreal carbon flux data has increased substantially (Vogt et al., 2025), giving rise to new flux synthesis datasets (Kuhn et al., 2021; Virkkala et al., 2022) that have been widely used to improve our process-understanding (Kuhn et al., 2021), model intercomparisons (Tao et al., 2021; Treat et al., 2024), site-level trend assessments (See et al., 2024), and Arctic-boreal carbon budgets (Kuhn et al., 2025; Ramage et al., 2024; Virkkala et al., 2025; Vonk et al., 2025; Yuan et al., 2024).
While significant progress has been made in Arctic-boreal carbon flux datasets, most existing syntheses do not include recently published flux data from 2020 onward, a period marked by rapid warming (Minobe et al., 2025) and increased disturbances - such as fires (Euskirchen et al., 2024; Kelly et al., 2024; Korkiakoski et al., 2023), thermokarst (Jorgenson et al., 2025) , and vegetation shifts (Frost et al., 2025). Moreover, global flux repositories often fail to include Arctic-boreal-specific variables, such as permafrost, high-latitude vegetation types, or lake origin (e.g. glacial or thermokarst lake). Additionally, CO2 and CH4 fluxes from freshwater and terrestrial ecosystems have typically been studied and synthesized separately, hindering a holistic understanding of the Arctic-boreal carbon cycle, which can also lead to double counting of carbon fluxes (Casas-Ruiz et al., 2023; Kyzivat and Smith, 2023; Thornton et al., 2016). Finally, data remain scattered across repositories, scientific publications, and unpublished sources, making it difficult to understand how comprehensive and representative the current network of Arctic-boreal flux measurements is.
To address these research gaps, we compiled a dataset of Arctic-boreal CO2 and CH4 fluxes in terrestrial and freshwater ecosystems (ABCFlux v2) from flux repositories, data syntheses, literature, and data contributors, which are presented here. We built upon recent syntheses (Golub et al., 2023; Kuhn et al., 2021; Song et al., 2024; Stanley et al., 2023; Virkkala et al., 2022) and earlier Arctic-boreal terrestrial and freshwater CO2 and CH4 flux datasets (Belshe et al., 2013; McGuire et al., 2012; Natali et al., 2019; Olefeldt et al., 2013; Treat et al., 2018; Wik et al., 2016b), including ABCFlux v1 (Virkkala et al., 2022). The structure of ABCFlux v2 follows v1, which synthesized monthly terrestrial CO2 fluxes. Compared to v1, ABCFlux v2 includes not only updated terrestrial CO2 fluxes, but also terrestrial CH4 fluxes. In addition, we expanded the dataset to freshwater ecosystems, including lentic (lakes, ponds, reservoirs, pools) and lotic (rivers and streams) waterbodies, and synthesized carbon fluxes and surface concentrations of dissolved CO2 and CH4. We also added several new variables to ABCFlux v2 from the BAWLD-CH4 and GRiMeDB database to include variables specific to freshwaters (see Sect. 3 for details) (Kuhn et al., 2021; Stanley et al., 2023).
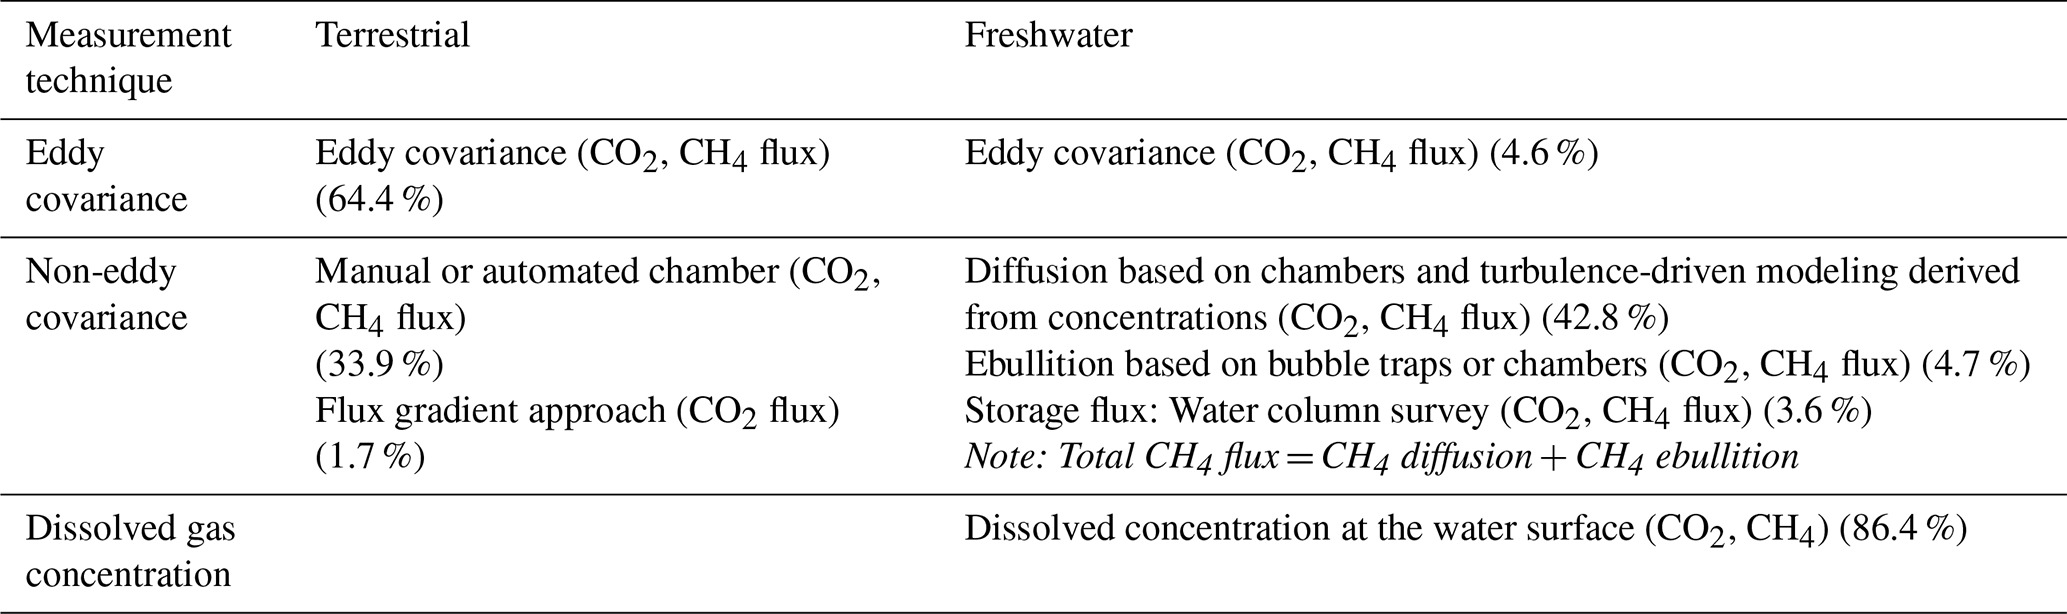
ABCFlux v2 comprises several measurement techniques that provide different measurement frequencies across multiple ecosystem scales. Eddy covariance is a common method for measuring temporal dynamics in terrestrial carbon fluxes on ecosystem scales and quantifying year-round net carbon emissions. In many cases, eddy covariance data are actively shared, processed and curated in global (Pastorello et al., 2020) and regional (Heiskanen et al., 2022; Novick et al., 2018; Ueyama et al., 2025) flux networks. However, not all Arctic-boreal sites are part of these networks, and overall, the Arctic-boreal region has a particularly low coverage of eddy covariance towers (Pallandt et al., 2022), especially for lakes (Eugster et al., 2022; Golub et al., 2023). Furthermore, eddy covariance, which aggregates fluxes over ecosystem scales (hundreds of meters), often cannot resolve issues regarding local-scale spatial heterogeneity in emission and uptake driven by small-scale variation in vegetation, hydrology, soil microclimate (Chen et al., 2012; Virkkala et al., 2024). Moreover, CH4 flux estimates derived from eddy covariance generally do not distinguish between the multiple CH4 emission pathways (diffusion, ebullition, plant-mediated transport; but see Ueyama et al., 2023), which are important to understanding processes controlling the total CH4 fluxes (Bastviken et al., 2004; Kyzivat et al., 2022). Thus, relying solely on eddy covariance towers is insufficient for a comprehensive understanding of Arctic-boreal carbon fluxes and the ability to predict current and future emissions more accurately, emphasizing the value of other kinds of flux measurements including small-scale, ground-based techniques.
Small-scale, ground flux techniques most often consist of static or automated chamber measurements in terrestrial and freshwater ecosystems and concentration-based turbulence-driven modeling approaches in freshwaters (Kuhn et al., 2021; Stanley et al., 2023; Virkkala et al., 2021). Chamber techniques can assess fluxes across small footprints (ca. 0.3 to 1 m2), allowing for detailed assessments of environmental controls on fluxes (Kuhn et al., 2021). Flux gradient approaches, wherein gas samples are taken from the air and throughout the soil or snow profile to estimate net flux, have also been used in some terrestrial sites (Pirk et al., 2016). In freshwaters, diffusive fluxes can also be estimated from measurements of gas concentrations dissolved in the surface water and using turbulence-driven modelling approaches based on gas transfer velocities (Klaus and Vachon, 2020; Vachon and Prairie, 2013). Ebullitive fluxes can be derived from concentration bursts during chamber measurements (Bastviken et al., 2004), but are most commonly assessed using bubble traps, which can be coupled with ice-bubble surveys to reduce spatial uncertainties (Huttunen et al., 2001; Walter Anthony and Anthony, 2013; Wik et al., 2013). For freshwaters, ground-based measurement techniques are also used to capture storage fluxes. Storage fluxes refer to the sudden diffusive efflux triggered by lake turnover in spring and fall, or by gas that accumulates under the frozen layer of a lake and is emitted to the atmosphere when the ice melts in the spring (Jammet et al., 2015).Storage fluxes are measured from the difference between measured waterbody content of dissolved gas before and after the turnover or ice-off (Karlsson et al., 2013). While these micro-scale approaches advance the understanding of local processes and spatial variability in carbon fluxes, they are also accompanied by uncertainties due to potentially limited spatial and temporal representativeness, the disturbance that collars, floating bubble traps, and chambers can cause on the ground or water surface (Welles et al., 2001), oxidation in the water column prior to ice out (Pajala et al., 2023), the wide range of available methods to determine gas transfer velocities (Hall and Ulseth, 2020; Klaus and Vachon, 2020; Raymond et al., 2012), and the temporal representativeness of the manual sampling campaigns (Golub et al., 2023; McGuire et al., 2012; Wik et al., 2016a). Automated chambers and continuous concentration measurements in terrestrial and aquatic ecosystems, provide more temporally representative sampling relative to those from more limited manual sampling campaigns, but do not solve for potential artifacts derived from ground disturbances. Overall, combining all fluxes measured with these different techniques (Table 1) is an important benefit of ABCFlux v2 compared to other efforts focused on a single flux measurement technique or gas species.
Table 1A summary of the measurement techniques, carbon flux and concentration observations, and key ecosystems included in ABCFlux v2. Terrestrial classes include dry and moist tundra, bogs, fens, marshes, tundra wetlands, permafrost bogs, and boreal forest ecosystems. Freshwater classes include lentic and lotic waterbodies. Storage flux refers to the transient accumulative release of gasses during ice-out and water column mixing events. We do not include plant mediated aquatic fluxes of CH4 due to a lack of data available in this region. Percentages represent the percent of site-months from the respective ecosystem (i.e. % of terrestrial site-months or % of freshwater site-months). Percentages for the aquatic ecosystems do not add up to 100 % due to overlaps, for example, where both diffusion fluxes and dissolved concentrations were measured.
In this community-driven effort, we integrated surface-atmosphere CO2 and CH4 fluxes into a single, unified Arctic-boreal-specific dataset. Below, we provide a description of the dataset and a summary of the flux network, and synthesize flux magnitudes across key land cover types, spanning both terrestrial and freshwater ecosystems.
ABCFlux v2 focuses on the Arctic tundra and boreal biomes, as characterized in Dinerstein et al. (2017; Fig. 1). It also includes some hemiboreal sites located within 500 km south of the boreal biome boundary, when data were available through public repositories or provided by data contributors (∼2.5 % of sites). These sites were included because hemiboreal ecosystems share key characteristics with boreal systems and may provide insight into potential trajectories of boreal ecosystems under changing climate (Berner and Goetz, 2022). The dataset compiles in situ measured CO2 and CH4 fluxes aggregated to monthly time periods (unit: g C m−2 per month, i.e. g CO2 C m−2 per month for CO2 fluxes and g CH4 C m−2 per month for CH4 fluxes) from terrestrial and freshwater ecosystems, including boreal forests, wetlands, tundra, lentic and lotic waterbodies. In forested ecosystems, chamber CO2 measurements were excluded as they typically do not represent the whole ecosystem fluxes (i.e. chamber measurements exclude trees). However, for CH4, we accepted measurements of understory CH4 fluxes as the CH4 fluxes from trees are expected to be minimal (see Sect. 8.3 for challenges associated with this assumption). For freshwater ecosystems, we also included monthly average CO2 and CH4 concentrations dissolved in surface waters because this information helps to understand flux dynamics and can also be used to estimate fluxes (e.g. Holgerson and Raymond, 2016). We excluded flux data from experimental manipulation sites, with the exception for control sites within manipulations experiments. We included data from managed forests but excluded croplands, as croplands typically undergo intensive annual management (e.g., tillage, fertilization, and harvesting). In contrast, managed forests are generally managed on decadal timescales, which allows them to retain some functional characteristics of natural ecosystems, particularly in later stages of regrowth.
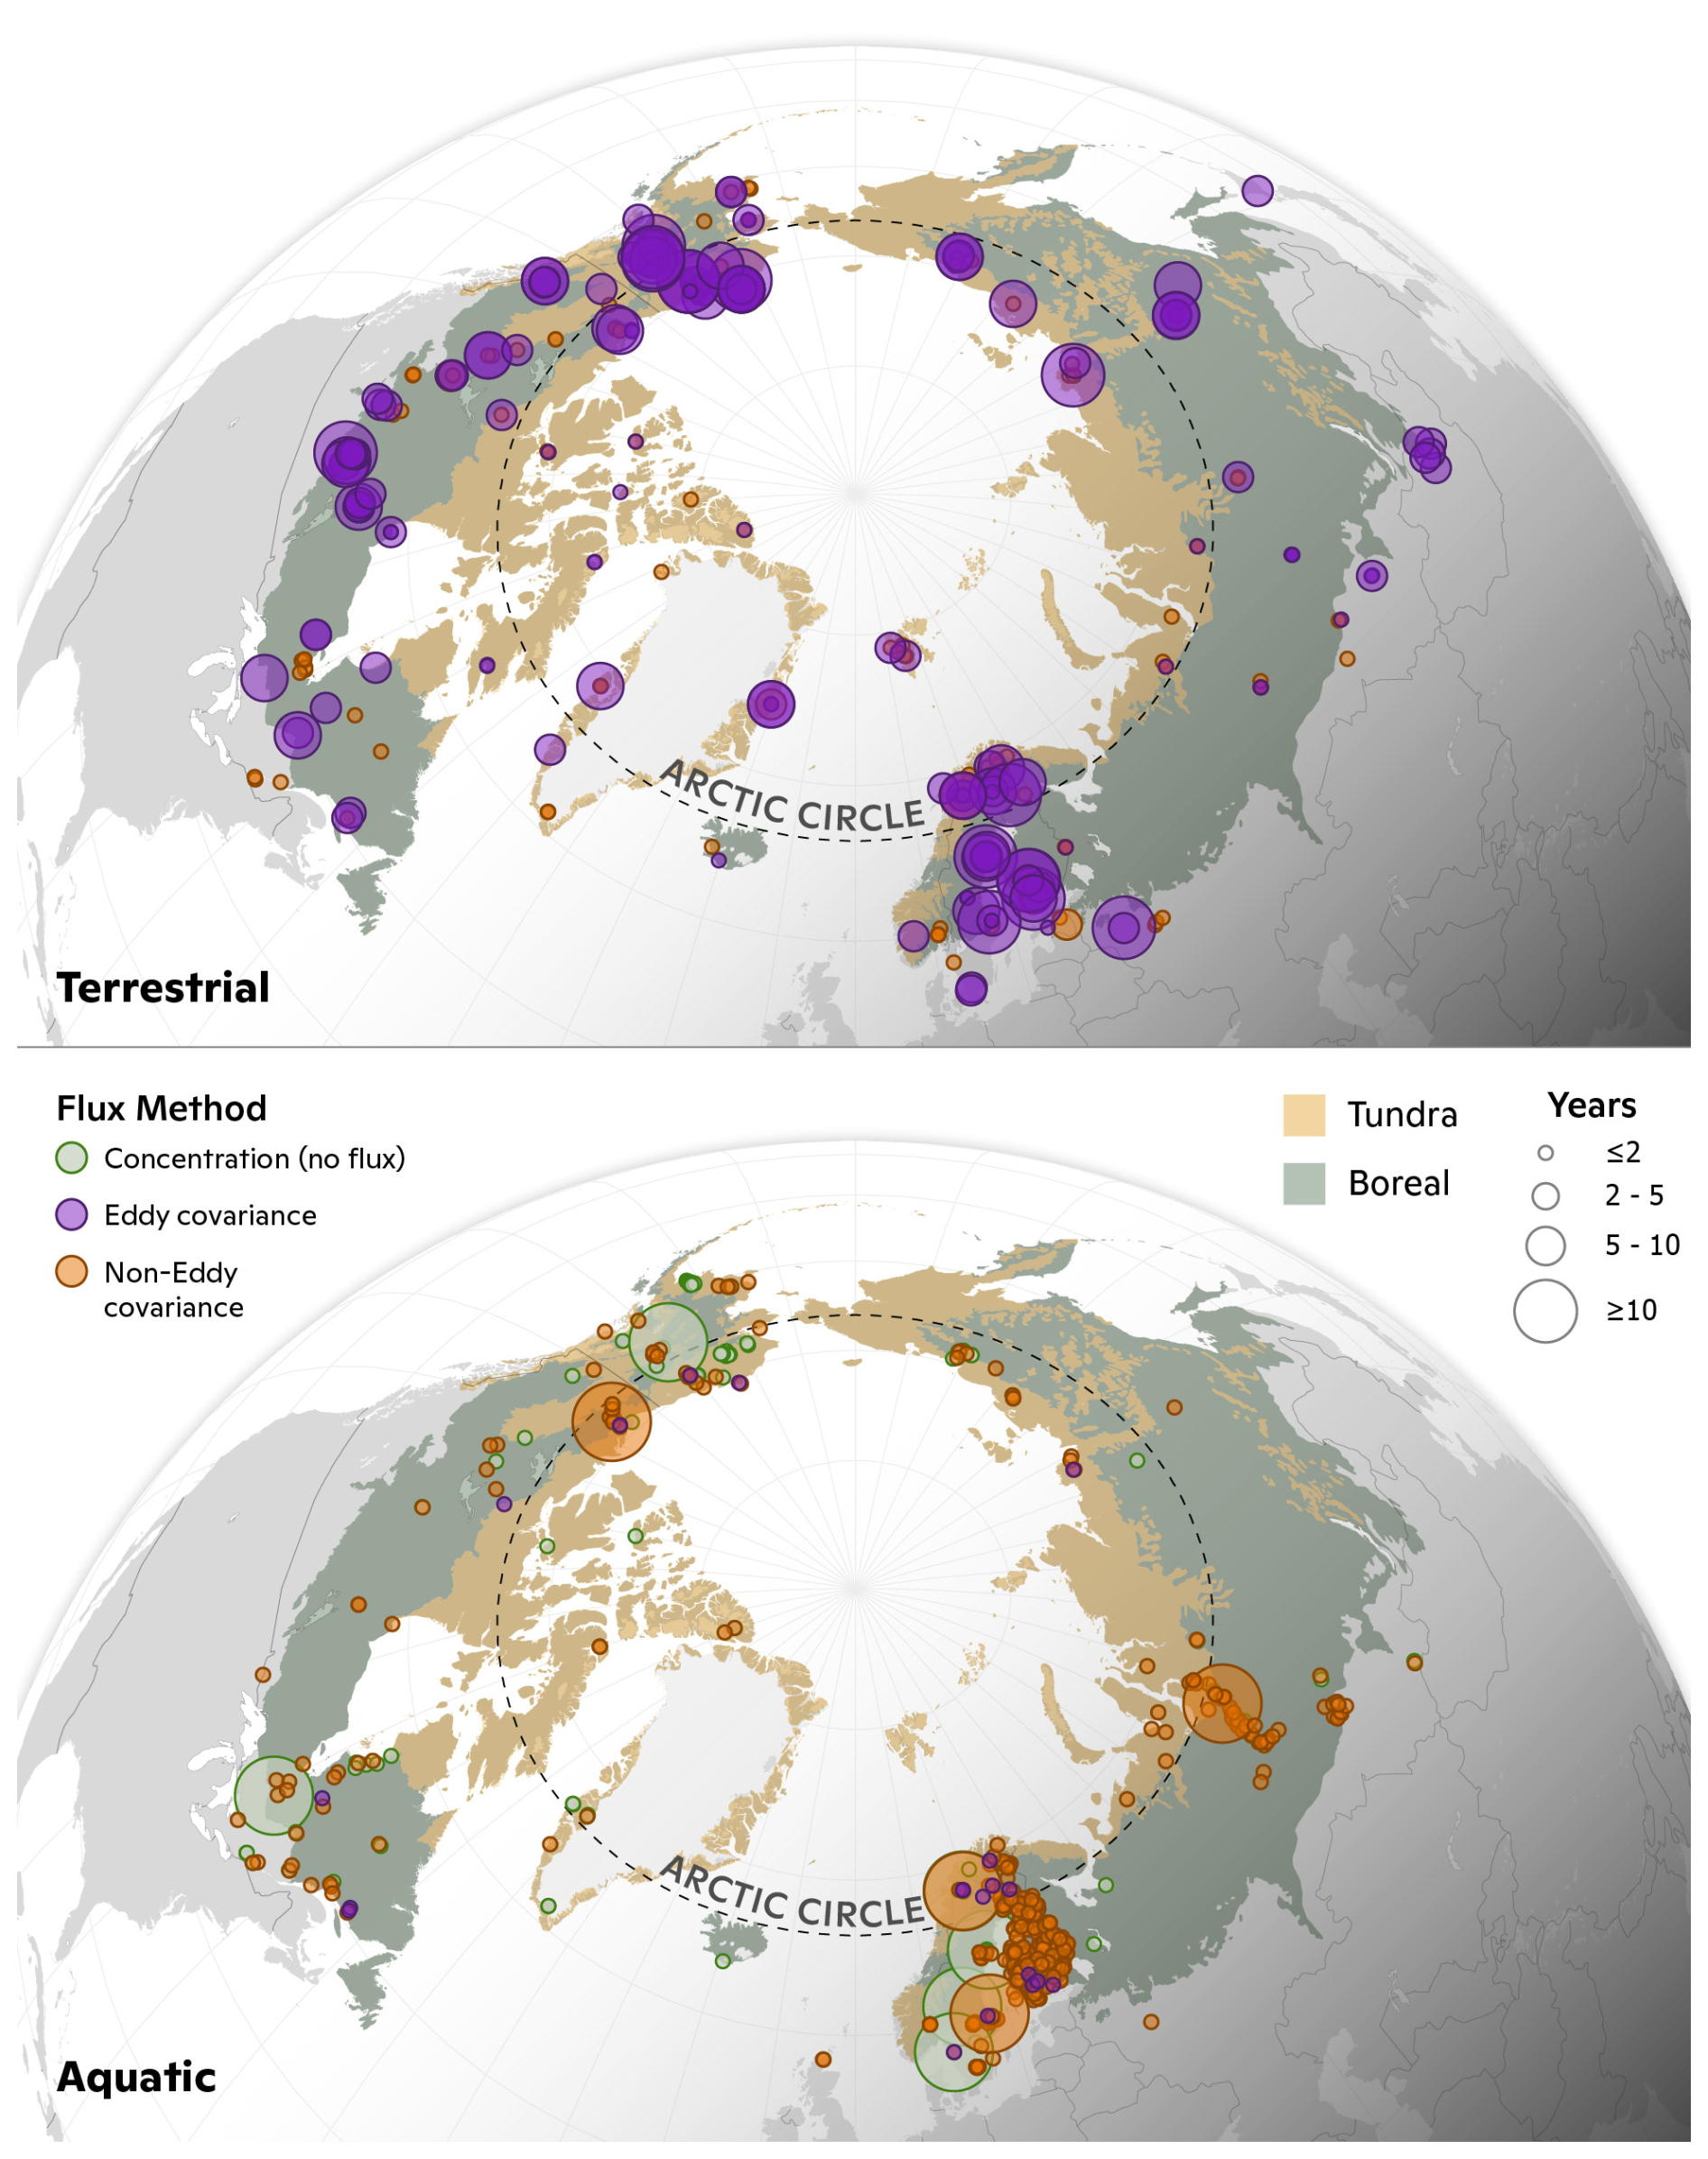
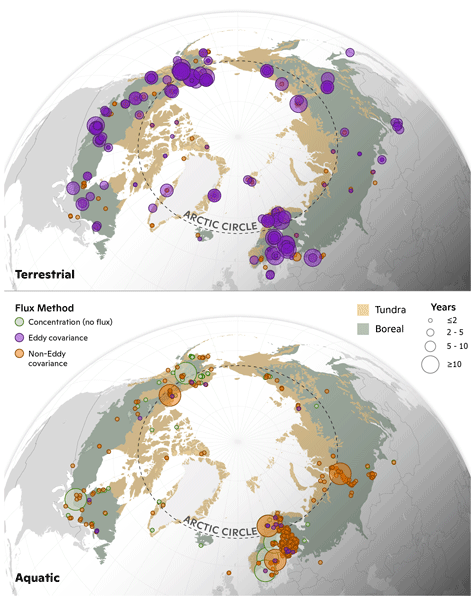
Figure 1Numbers of site-months for terrestrial CO2 and CH4 flux sites, and aquatic CO2 and CH4 flux sites across the Arctic-boreal region. The number of months represented by circles refers to total, not necessarily consecutive months. See Fig. S8 for zoomed-in maps for the densely measured areas.
We used a monthly aggregation interval as it is a common and standard temporal frequency across many site-level, synthesis, and modeling studies, remote sensing products, and process models. However, there were some seasonally-aggregated data from previous syntheses and studies that we were not able to incorporate in a monthly format; these were kept in the dataset in seasonal format alongside the start and end date of the measurement period. Seasonal fluxes make up only <1 % of the dataset. Monthly fluxes were primarily found derived by multiplying daily means (g C m−2 d−1) by the number of days in each month to calculate monthly cumulative fluxes (g C m−2 per month), although methods varied based on available data and temporal resolution (see Sect. 5.1).
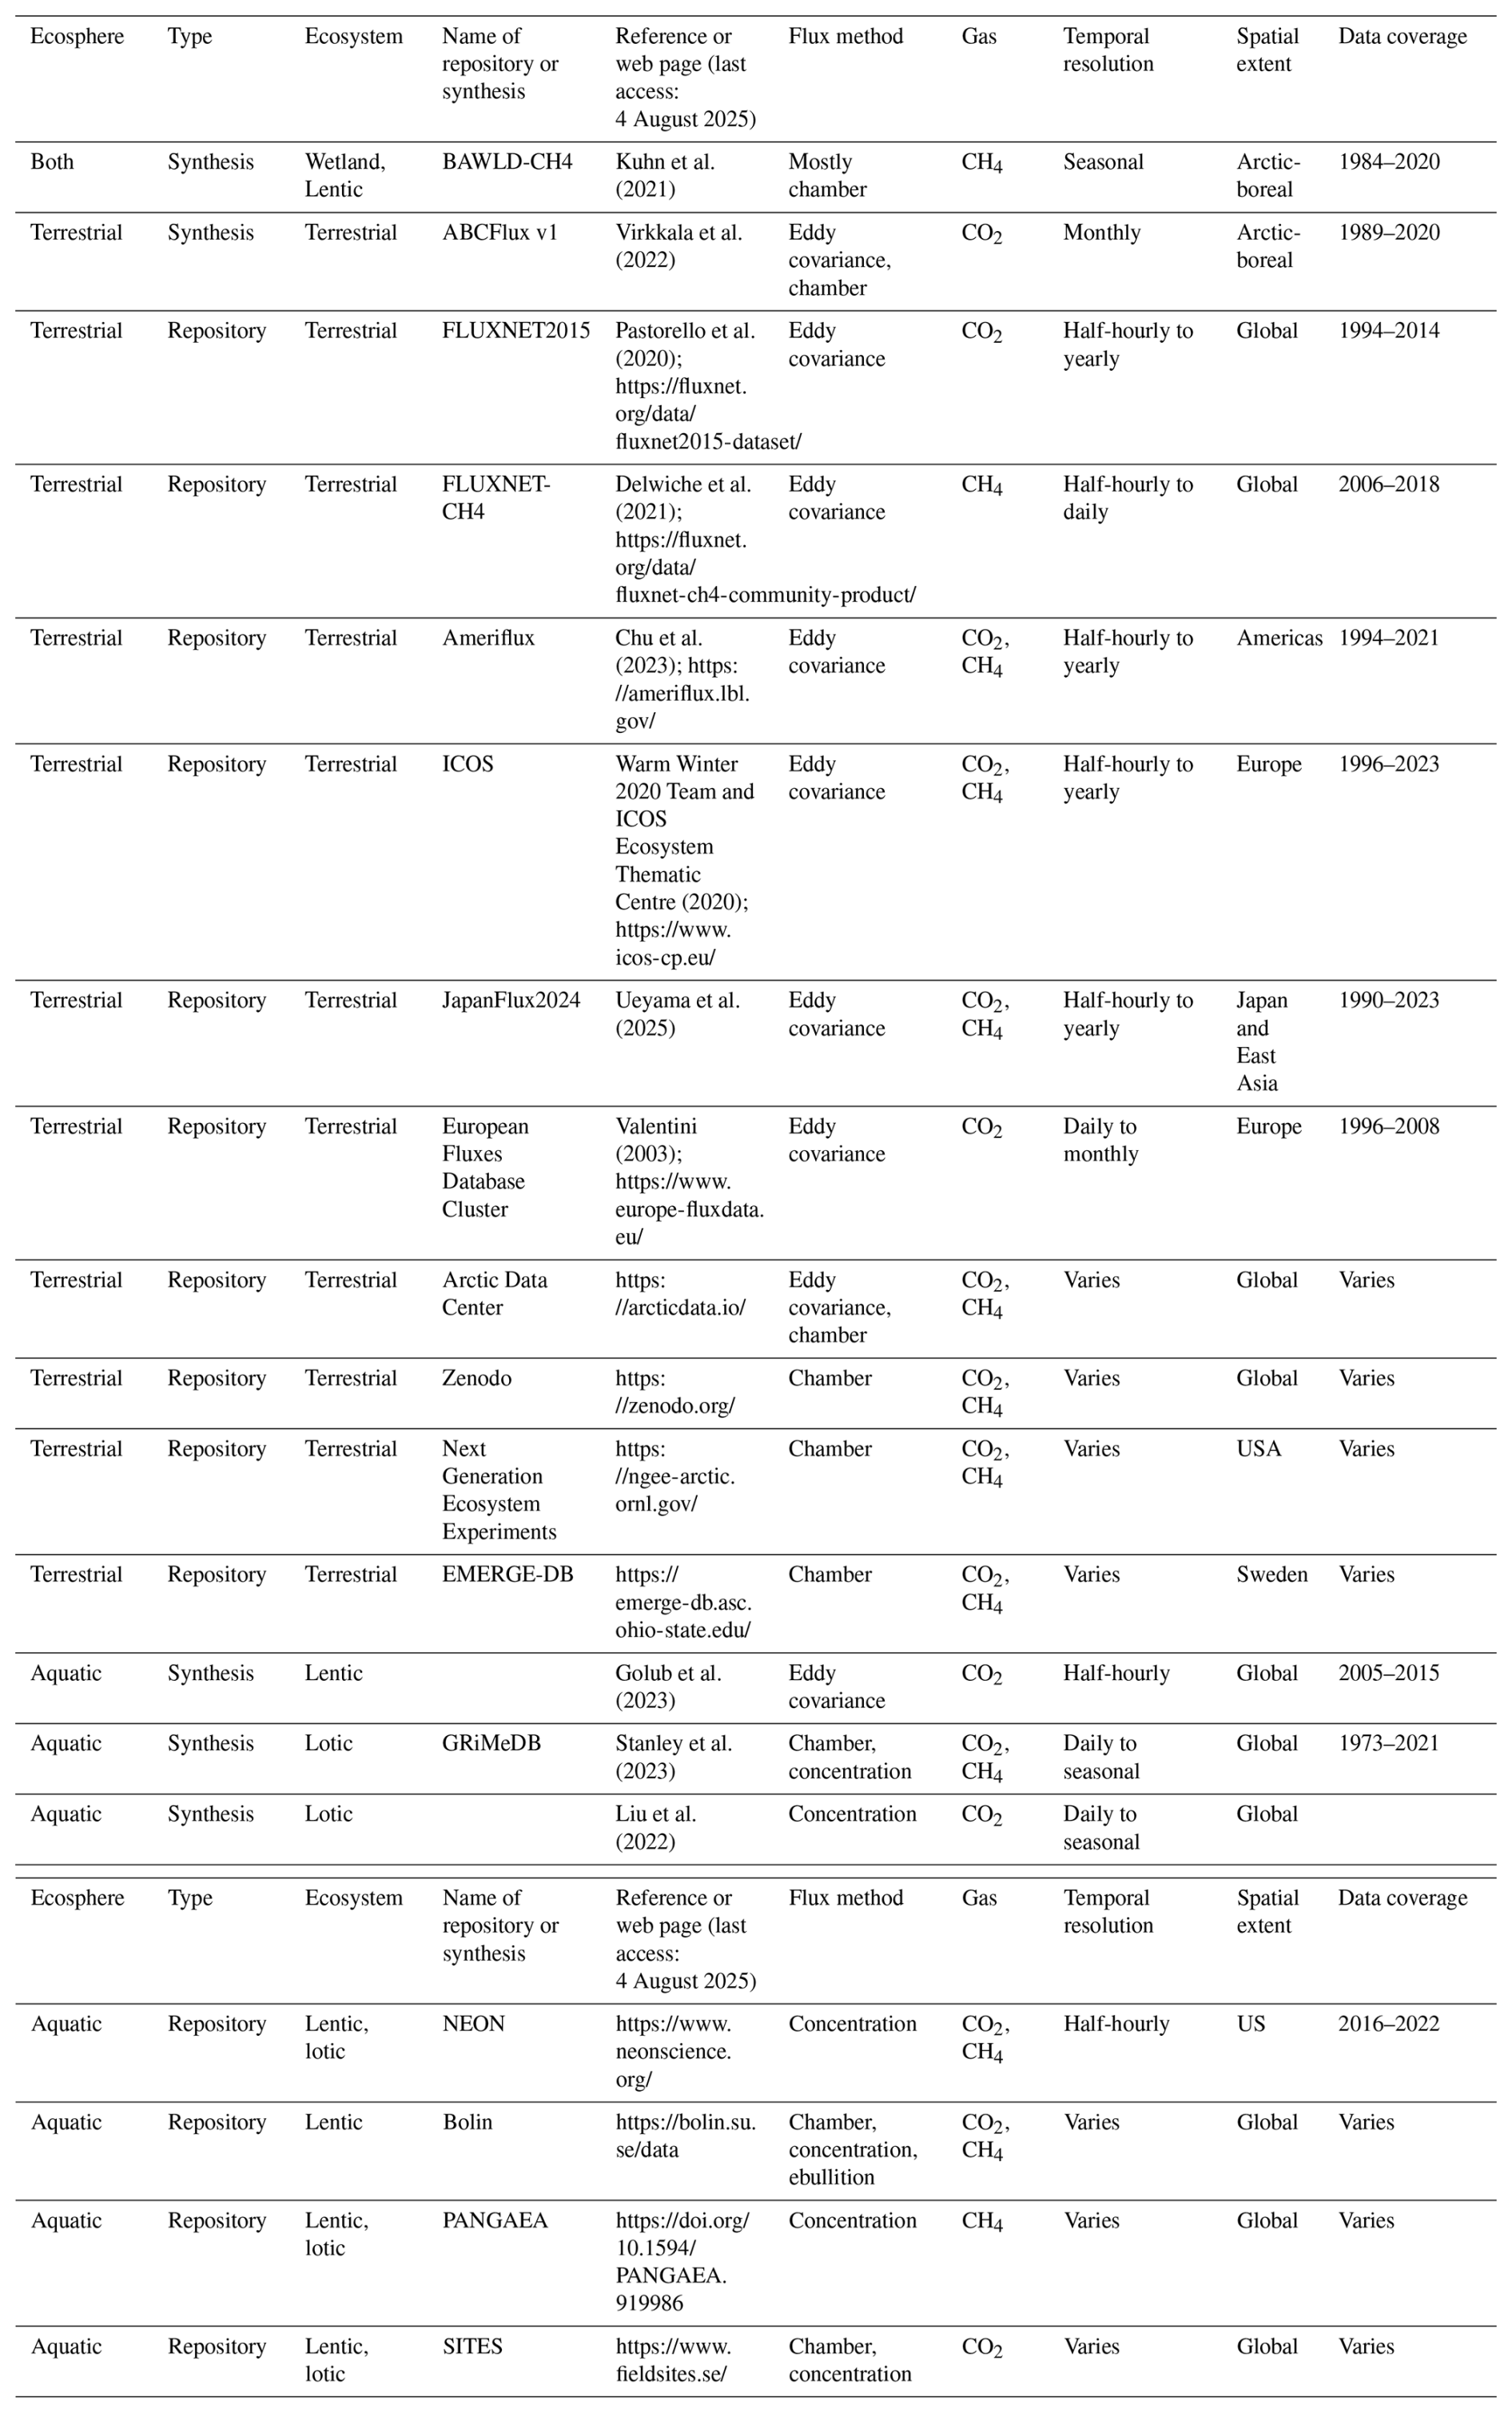
The data compilation steps are detailed in a flow chart (Fig. 2). We compiled and harmonized data from syntheses, global and regional flux repositories and general data repositories (Table 2), publications, and direct submissions from data contributors. In cases where data for the same sites and periods were available from multiple sources, we prioritized user-contributed data over data extracted from repositories, syntheses, and publications. This prioritization was chosen due to the benefits associated with the expertise of data contributors with data processing at their site (e.g., gap-filling), and the inclusion of ancillary data. There are no duplicate observations in the main dataset, i.e. only one flux estimate per flux type is given for each site-month, even though there may be multiple different data sources.
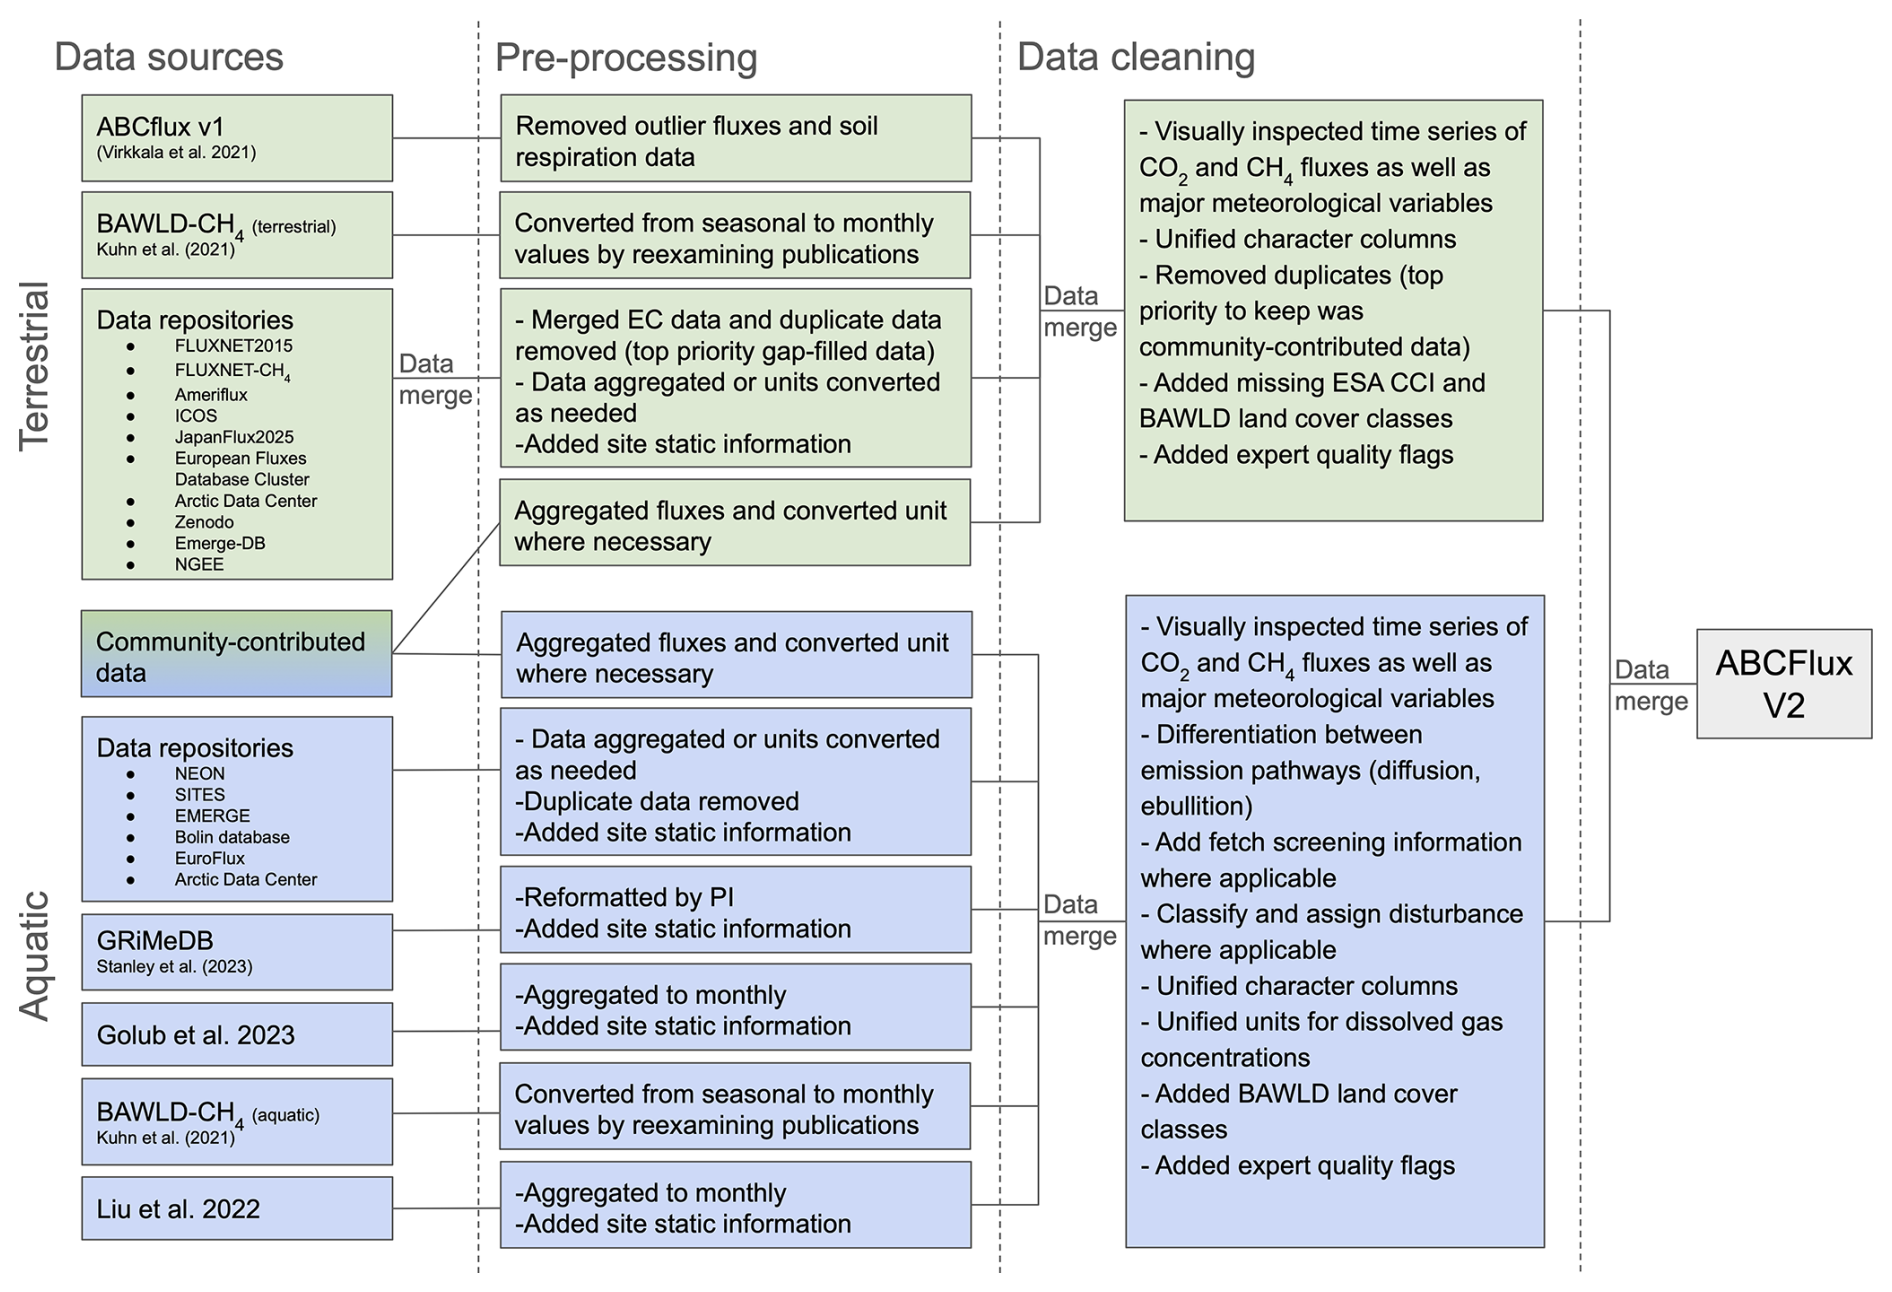
Figure 2Flowchart representing the main data compilation steps to produce ABCFlux v2. Note that repositories are listed based on the direct source of data acquisition; for example, terrestrial NEON fluxes are included via the AmeriFlux repository, whereas aquatic gas concentrations were sourced directly from NEON.
2.1 Recent data syntheses
We incorporated data from various data syntheses into our dataset (Table 2). We integrated terrestrial CO2 flux data included in ABCFluxv1 into our v2 dataset with some modifications to the original dataset. Notably, GPP values in v1 were reported as negative, whereas in v2 they are presented as positive to align with the convention used throughout this synthesis. We removed soil respiration data from forest floors as our focus here was on whole-ecosystem CO2 fluxes. Some monthly chamber fluxes within the v1 dataset were spatial replicates (same coordinates and land cover) and for the purposes of v2, we aggregated these by taking a mean flux. We updated the soil moisture classification for several sites as well as several site names from v1 to be consistent with site names used in v2. Additionally, some data from v1 were replaced by more recent versions of the data found in flux repositories.
The terrestrial and aquatic CH4 chamber flux data from the BAWLD-CH4 dataset (Kuhn et al., 2021) were originally presented as average daily fluxes over the growing season (wetlands and uplands) and open-water season (lentic ecosystems) for each site, with the last year of data collection being 2019 (Table 2). For sites where data at monthly resolution were available in publications, we extracted monthly flux and supporting environmental data. If monthly flux or other ancillary data were not extractable from the literature, we reached out to the lead author for data contribution.
Data in the Global River Methane Database (GRiMeDB, Table 2; Stanley et al., 2023) were aggregated to monthly resolution in ABCFlux v2. Fluxes in the global CO2 lake and reservoir synthesis (Golub et al., 2023) were presented in half-hourly timesteps (Table 2), but were aggregated to monthly resolution. Dissolved gas concentrations in rivers from Liu et al. (2022) were converted to monthly averages. Overall, a significant portion of data (30 %) incorporated in ABCFlux v2 originated from these terrestrial and aquatic data syntheses.
2.2 Data repositories
We obtained a majority of terrestrial eddy covariance data from flux network repositories listed in Table 2. Because aquatic ecosystem eddy covariance data were sparsely available through these flux networks, we relied on user-contributed data and those published in Golub et al. (2023). The repository data were downloaded between August 2023 and January 2024.
The terrestrial data that we downloaded from these repositories came in a variety of formats, though we gave preference to CO2 flux data processed with the ONEFlux pipeline (Pastorello et al., 2020) and CH4 flux data processed as part of the FLUXNET-CH4 community product (Delwiche et al., 2021) when available since these data were gap-filled and quality-checked (i.e., FLUXNET2015, ICOS, and some of the Ameriflux datasets). This decision was made because of the strengths associated with the consistent data processing, quality-control, and recent updates. The ONEFlux pipeline produces datasets aggregated to different time resolutions (half-hourly, daily, monthly, and yearly) along with fluxes processed with various partitioning methods and friction velocity (USTAR) criteria, to remove data under low turbulence conditions (i.e., turbulence filters to correct biases). However, the ONEFlux pipeline does not perform footprint partitioning or fetch screening based on wind direction. Therefore, we assumed that any such filtering (e.g., for wind direction or land cover representativeness) was performed by the data provider of the site prior to ONEFlux processing, or that the reported fluxes represent the entire tower footprint. We used the datasets pre-aggregated to monthly mean fluxes (g C m−2 d−1) and opted for fluxes processed with a constant USTAR threshold and flux partitioning according to Reichstein et al. (2005) when available (for a justification, see Virkkala et al., 2022). To calculate gap-fill percentages for each month, we used the half-hourly datasets produced by the ONEFlux pipeline and the quality flag associated with each flux (QC = 0 measured value).
For terrestrial eddy covariance data not processed with ONEFlux, we prioritized gap-filled data, though where it was not available, we accepted data that were not gap-filled (10 % of all the monthly eddy covariance data). The level of pre-processing (i.e. USTAR filtering, storage correction, etc.) of this non-gap-filled data varied by data source but all data were quality checked prior to monthly aggregation. We justified this approach to increase the amount of data in this data-sparse region, and carefully assessed that the aggregated monthly fluxes were within a realistic range (within minimum and maximum monthly fluxes in similar environments).
We also searched terrestrial and aquatic data through several data repositories not focused solely on fluxes (see Table 2). To identify datasets of interest we used the same search words in the repositories as in the literature search (see Sect. 2.3). If the datasets identified from this search had associated publications, we reviewed the publications and extracted relevant information including that describing the environmental conditions of the study site.
Table 2Global and regional flux syntheses and repositories used in the data compilation of terrestrial and/or aquatic data. Information about the ecosystem, the name, reference or web page, flux method, gas species, temporal resolution, spatial extent and period of data coverage of the respective synthesis or repository are given.
2.3 Literature search
We conducted an exhaustive Web of Science search with search words (“carbon flux” or “carbon dioxide flux” or “methane flux” or “CH4 flux” or “CO2 flux” or “NEE” or “net ecosystem exchange”) and (“arctic” or “tundra” or “boreal”) up to December 2023. For aquatic data, this search was extended up to August 2024. Based on the literature search, we added data from three additional publications for terrestrial ecosystems focusing on chambers and 105 for aquatic ecosystems beyond those already included in BAWLD-CH4, GRiMeDB (Liu et al., 2022; Golub et al., 2023). The total number of new papers identified for terrestrial ecosystems was low because the recent BAWLD-CH4 and ABCFluxv1 datasets already encompass studies up to 2018–2020, and more recent data were sourced from repositories or submitted directly by data contributors.
2.4 Community-contributed data
In order to capture data that are not easily extractable from literature nor found in repositories, we contacted ∼180 researchers that were identified based on earlier reviews and syntheses, and our expert knowledge. This call for data began in April 2023, with final data submissions due in June 2024, though most contributions were given prior to January 2024. Out of the ∼180 researchers contacted, we received 98 terrestrial and 43 aquatic datasets. These user-contributed flux data constitute 42 % of observations in the overall dataset (47 % of terrestrial, 32 % of aquatic, 39 % of CO2, and 51 % of CH4). In addition to flux data, submissions from data contributors were more likely to include detailed site descriptions and data for ancillary variables that were not often available in repositories or papers. Submitted data from 23 new sites were previously unpublished (i.e., not published in scientific papers; 4.1 % of site-months for terrestrial and 2.7 % for aquatic) but had been processed using standard processing protocols or similar tools used at the site before.
3.1 Summary of data columns
The ABCFlux v2 dataset is organized such that each row represents a unique combination of site and month. The data is grouped by site and arranged chronologically. To facilitate ease of use, the dataset is provided as two separate files based on ecosystem type. The aquatic file (including lentic and lotic systems) contains 103 variables while the terrestrial file (including boreal forest, wetlands, and tundra) contains 93 variables. All columns included in ABCFlux v2 are listed in Table 3, together with the percentage of data in each column, which has been subset by applicable data types (e.g. soil temperature applies only to terrestrial data). Across both files, there are a total of 141 columns in ABCFlux v2 including 15 that contain flux data and 12 pertaining to measurement technique details (e.g. flux method details, partition method) and data quality (e.g. gap-fill percentage, number of chamber measurement days).
Table 3Variable names and their description, and the percentage of data present. Percentages were calculated based on the total relevant data for each variable. Subset refers to the data category the respective variable applies to: eddy covariance (EC), and non-eddy covariance (Non-EC) including all other measurement methods (chambers, concentration, etc.). Where the subset remains blank, the variable applies to the whole dataset.

For eddy covariance measurements in terrestrial ecosystems, net ecosystem exchange of CO2 (NEE) can be partitioned into gross primary productivity (GPP) and ecosystem respiration (Reco). In this dataset we include NEE as well as GPP and Reco, when available but we did not perform any data processing or flux partitioning, aside from unit conversions. Throughout this dataset, we report GPP and Reco as positive. NEE and CH4 fluxes are reported with respect to the atmosphere, where positive values are a net source to the atmosphere from the ecosystem, and negative values are a net sink from the atmosphere to the ecosystem. For aquatic ecosystems, only the overall (non-partitioned) CO2 flux is given because of the multiple origins of the CO2 (Battin et al., 2023). The partitioning of GPP from Reco in aquatic systems is usually done with other methods (i.e. as commonly done with oxygen mass balances; Staehr et al., 2010), but are not included in this dataset. For freshwater CH4 fluxes derived with methods other than eddy covariance, we differentiate between diffusive and ebullitive emission pathways and assume the sum of diffusion and ebullition to yield the total CH4 flux. We also compiled CO2 and CH4 storage fluxes (as done for CH4 by Kuhn et al., 2021 and Wik et al., 2016a). Partitioning plant-mediated carbon fluxes from freshwaters is rare and not considered here.
In addition to carbon fluxes and dissolved gas concentrations, we gathered information describing environmental conditions of the site as well as general site characteristics. There are 48 variables pertaining only to aquatic data (e.g. waterbody depth, water temperature) and 38 tailored to terrestrial data (e.g. vegetation information, soil temperature). Fifty three of the columns represent static variables (e.g., biome, land cover), whereas the remaining columns vary monthly (e.g., fluxes, soil temperatures), seasonally (seasonal flux if monthly was not available), or annually (active layer depth). New columns were added to v2 compared to v1 (Virkkala et al., 2022) to represent detailed descriptions of plant functional types (e.g., evergreen and deciduous shrub coverage), deep soil temperatures (<10 cm), and permafrost thaw presence or absence in the top two meters. We also added new columns pertaining to CH4 fluxes that were not included in previous flux synthesis efforts, such as a categorical moisture class (wet-moist-dry) and BAWLD classes (Olefeldt et al., 2021).
To differentiate between terrestrial and freshwater ecosystem classes, we followed the BAWLD classification system (Olefeldt et al., 2021) and specified the classes in column “bawld_class”. BAWLD was specifically designed to separate key classes relevant for CH4 cycling. There are 8 terrestrial classes and 10 freshwater classes listed in the variable descriptions in Table 3, and the classes are more thoroughly discussed in their respective papers and metadata documents (Kuhn et al., 2021; Olefeldt et al., 2021). The column “bawld_class” was designed to differentiate between plot-level (sub-meter) variability in land cover types. Eddy covariance sites that had highly heterogeneous footprint with multiple BAWLD landcover classes were assigned the dominant BAWLD class for the tower footprint and should be interpreted with caution given the different landscape classification scales. When assigning lotic classes, we followed the BAWLD river size distinction (large rivers have a Strahler order > 5, small rivers have a Strahler order ≤ 5). We first used the description provided by data contributors to determine if a small river was organic-poor or organic-rich. If the data contributors did not provide a site description, we deferred to the organic carbon geospatial data by Hugelius et al. (2020). We selected a 20 % organic soil coverage threshold for this split based on a comparison with a small dataset containing site-level classifications of organic-poor and organic-rich soils, combined with our expert knowledge and cross-checked with the gridded percent cover data for rivers from BAWLD. However, since most lotic sites were ultimately classified using geospatial rather than site-level data, these classifications are inherently more uncertain. In some cases where classification was unclear, the site was left as “Unknown”.
In addition to the BAWLD classes, and to acknowledge classes relevant to CO2 fluxes, we used a classification system from the European Space Agency (ESA) Climate Change Initiative (CCI) land cover product (ESA CCI, 2017) which has been used in earlier syntheses (Virkkala et al., 2021). It differentiates between six different boreal forest/vegetation classes instead of the broad Boreal forest class in BAWLD. There are in total 20 terrestrial classes and one general aquatic class in ESA CCI, which are listed in the column descriptions in Table 3 and are more thoroughly discussed in their respective metadata document (ESA CCI, 2017). For the ESA CCI class, we created two columns: “land_cover_plot” for the plot level and “land_cover_eco” for the ecosystem level, to acknowledge the extent and scale of the land cover type associated with each measurement. For example, a dry shrub-dominated plot at a palsa mire received a shrub class at the plot level, while the ecosystem-level class was water-logged, characterizing the mostly wetland-dominated status of the ecosystem. For both the BAWLD and ESA CCI columns, the categories were defined by data contributors or extracted from papers and repositories and then unified by dataset developers through an expert assessment utilizing additional columns (e.g., plant cover and vegetation description for BAWLD and ESA CCI terrestrial classes, and lake size and sediment type for BAWLD aquatic classes). If no information was available, the class was left as “NA”.
3.2 Definition of site
To differentiate between measurement locations, we used two attributes: site_name and site_reference. The column “site_name” (e.g., Stordalen Mire) is considered a more general description of a site whereas “site_reference” (e.g., Stordalen Mire_Palsa Site_Chamber) is a more specific description of a plot/sub-site within a broader site and indicates the method of measurement. The distinction between site_name and site_reference is most evident among chamber studies where measurements may have been made across different types of vegetation or landscape characteristics within a single site (i.e., several site_references corresponding to a single “site_name”). We assigned a unique site_reference to a site, as long as it had a distinct land cover class, coordinates, or unique related environmental data. For eddy covariance tower measurements, the distinction between “site_name” and “site_reference” is less significant. Eddy covariance towers from the major flux repositories (e.g., FLUXNET, Ameriflux, ICOS) often have a FluxID assigned which was reflected in the site_reference of the data (e.g., Stordalen_SE-St1_tower). For user-contributed tower data that did not have a FluxID, site_reference is often the site_name along with a name specified by the data contributor with the addition of “_tower”. In instances where footprint analysis was applied to split tower data in addition to the ecosystem-level fluxes (sites Ranskalankorpi, Iskoras, Stordalen), the “site_reference” column specifies which ecosystem the flux comes from (e.g., Iskoras_NO-Isk_palsa_tower and Iskoras_NO-Isk_pond_tower). ABCFlux v2 comprises 1024 individual site names and 5121 individual site references. In order to not exaggerate the number of sites in this synthesis, we refer to the number of unique “site_name” unless otherwise specified.
Flux data for lentic waterbodies were aggregated to the waterbody level by taking the unweighted average of all observational data (e.g., “Edge” and “Center”) for sites where multiple measurements were conducted. Therefore, spatial within-lake differences were not individually accounted for. However, the column “aquatic_site_sampling_location” provides information about the location within the waterbody where measurements were conducted, and differentiates between the edge and the center of the waterbody, or both if measurements were conducted across the waterbody which can have implications for total flux calculations (Ray et al., 2023). It should be noted that the sampling location within the waterbody remained unknown (no location information was available) for 66 % of the aquatic flux measurements, 22 % were sampled from the center of the waterbody, 7 % from both (center and edge), and 5 % from the edge of the waterbody. If measurements were taken on different days, the number of days is specified in the various “nr_measurement_days” columns. Where measurements were taken within a single campaign along a large lotic waterbody over several kilometers, the river was divided into sections and flux data were aggregated for each section separately. This spatial aggregation was handled on a case-by-case basis and in close collaboration with data contributors. In instances where this spatial aggregation was applied, the “site_name” represents the river name (e.g., Teno) and “site_reference” reflects the river section (e.g., Teno_Karigasniemi_chamber, where Teno river is the name of the river, and Karigasniemi the measurement location).
We screened and cleaned data in ABCFlux v2 using expert judgement, informed by the gap-filled data percentage, quality flags and number of measurements days, if available. Our primary approach was to visually assess the time series of meteorological variables and fluxes for each site as well as the overall magnitudes in flux and supporting environmental data. In general, the quality control of all data was carried out in close cooperation with data providers.
4.1 Terrestrial fluxes
For repository data, we encountered 49 occurrences in eddy covariance site-level time series of CO2 and CH4 fluxes that had “flat lines” over several months of data (see Fig. S1A in the Supplement for an example), i.e., relatively constant flux values that did not vary by more than 3 g C m−2 per month over consecutive months. These “flat lines” often occurred at the beginning and end of time series and usually had a very high gap-fill percentage (a mean gap-fill percentage of 97 %), indicating the value was based on very little measured data and was most often entirely gap-filled. We excluded flux data with “flat lines” if they were made up of three or more consecutive months with high gap-fill percentages (>75 %).
Another issue that was identified during the quality check of the eddy covariance data submitted by data contributors, or extracted from data repositories, pertained to the winter months (December–February). During this period, NEE was occasionally found to be exactly zero with a gap-fill percentage of 100 %. We excluded these zeroes from our dataset, as there should always be some variability due to measurement and data processing uncertainties, even during low-flux conditions. Moreover, previous studies (Kittler et al., 2017b; Natali et al., 2019; Watts et al., 2021) have shown that Arctic-boreal ecosystems can exhibit winter-season fluxes of significance, making the assumption of an exactly zero winter flux unlikely.
For 26 % of CO2 and 70 % of CH4 eddy covariance site-months (including data provided by data contributors and from flux repositories), there was no information about data quality and/or gap-filled data percentage. Consequently, we were not able to solely and systematically rely on these metadata for quality screening. Thus, we calculated the 1st and 99th percentiles for each combination of month, biome, and flux measurement method (EC and non-EC) and used them, together with the visual assessment of time series, to identify data that either strongly deviated from expected seasonal patterns or fell outside these percentile thresholds (Table S2). We removed data if it was both outside of these percentiles and stood out visually (see Fig. S1C and D for examples). Primarily, we excluded months that were entirely gap-filled during winter and showed net CO2 uptake beyond the 99th percentile. The visual inspection of time series also led to the removal of flux data from sites where one year in the dataset showed unrealistic patterns, such as potentially reversed signs (e.g., winter uptake and summer sources). These datasets were often downloaded from general data repositories like the Arctic Data Center and attempts to resolve the issues by contacting data contributors or reviewing relevant publications from the site were unsuccessful. At some sites, flux time series followed a realistic seasonal pattern within the percentile thresholds (see Table S2) despite some of the monthly fluxes being entirely gap-filled (often during a few months of the winter season, or due to, e.g., one year of missing data in a longer time series). Due to the limited amount of data in the Arctic-boreal region, these fluxes were kept in the dataset, and this is noted in the gap-filled data percentage column. In total, we kept 27 sites that included 90 %–100 % gap-filled flux data during the peak winter months (December–February) across all the measured years because the seasonal dynamics and magnitudes matched those from other years of data from the same site or similar ecosystem types (see e.g. Fig. S1B). Though we did remove months where the data repository had winter months that were 100 % gap-filled and data contributors provided only growing season data and advised against including repository data.
We examined terrestrial non eddy covariance (i.e. chamber and snow pack diffusion) using the same approach as eddy covariance, accessing the 1st and 99th percentiles along with the visual inspection of each site time series. These fluxes were not removed, as the limited temporal coverage of these measurement methods made it difficult to interpret seasonal patterns from time series graphs. Additionally, converting these often temporally limited observations into monthly cumulative fluxes can yield values with considerable uncertainty; however, we retained these data given the overall scarcity of measurements in this region and instead rely on the quality flags described in Sect. 5.3 to guide data users.
For the supporting environmental data, we removed data with unchanging values across three or more months as they likely represented a seasonal average and not monthly data. We also removed soil temperature observations that were above 40 °C and below −40 °C as these were the approximate temperature ranges seen in ABCFlux v1 and BAWLD-CH4 and values outside of this range were assumed to be errors. The largest amount of cleaning was done for the water table depth to ensure that the sign of the data was aligned with the variable description for ABCFlux v2 (i.e., positive is below the soil surface, negative is above).
4.2 Freshwater fluxes
The footprints of eddy covariance towers over waterbodies often include surrounding non-aquatic ecosystems. Therefore, a fetch screening is commonly applied by data contributors of sites with mixed footprints (e.g. Lake Villasjön in Sweden; (Jammet et al., 2017) to separate flux contributions from aquatic and adjacent terrestrial ecosystems. The simplest approach to remove non-aquatic flux contributions is to apply a wind-directional fetch screening that excludes half-hourly fluxes from wind directions associated with land surfaces during data processing (also done in Golub et al., 2023). Apart from the wind-directional screening, more sophisticated approaches have been used (e.g. Bayesian modeling; Pirk et al., 2024). In ABCFlux v2, we indicated whether fetch screening was applied and for which wind directions. Regardless of the type of approach used to filter out non-aquatic carbon fluxes for eddy covariance data, the number of data gaps tends to be larger than for terrestrial towers. Because of this, and the fact that most gap-filling approaches are tailored to terrestrial ecosystems, gap-filling for aquatic towers remains challenging. We included both gap-filled and non-gap-filled aquatic tower data and derived monthly cumulative fluxes based on the available data.
Within the process of quality screening, we also unified some variables such as the gas transfer velocity, which can be used to estimate diffusive fluxes based on dissolved gas concentrations and hydraulic properties. Various methods to derive gas transfer velocities can be used, which differ slightly for lentic and lotic ecosystems (Hall and Ulseth, 2020; Klaus and Vachon, 2020; Raymond et al., 2012). The gas transfer velocity can be expressed as a magnitude independent of gas and temperature when normalized to a Schmidt number (Sc) of 600 (k600, i.e. normalized gas transfer velocity) for freshwater at 20 °C. The Schmidt number is defined as the ratio between kinematic viscosity and mass diffusivity but is often empirically determined, and quantifies the temperature-dependent molecular transport properties of each gas (Jähne et al., 1987). Where gas transfer velocities for a specific gas species (kgas) were not normalized to a Schmidt number of 600, we converted them accordingly (k600 = (600/Sc)n ⋅ kgas;; Cole and Caraco, 1998), where n is determined by windspeed (Guérin et al., 2007). Furthermore, dissolved CO2 and CH4 concentrations (or partial pressures) were converted from a range of given units (ppm, ppb, µatm, mol L−1, mmol L−1, nmol L−1, mmol m−3, mg L−1) to µmol L−1 following previous procedures from GRiMeDB (github code: https://github.com/lukeloken/GlobalRiverMethane, last access: 6 January 2025).
Despite extensive efforts in dataset cleaning, users of ABCFlux v2 should remain aware of certain considerations to avoid potential misinterpretation of the data.
5.1 Uncertainties related to gap-filling and flux partitioning
The approach used to gap-fill and estimate monthly cumulative fluxes varied within and across measurement methods. For eddy covariance data, the most common gap-filling technique was Marginal Distribution Sampling (MDS), used in 57 % of site-months, following the ONEFlux pipeline processing approach (Pastorello et al., 2020). However, we also incorporated fluxes that were gap-filled using other methods including neural networks and non-linear regression. For terrestrial and aquatic eddy covariance data, the cumulative monthly flux was most commonly obtained by multiplying the gap-filled monthly mean flux rate given as per day (g C m−2 d−1) by the number of days in the month. In instances where gap-filled data at terrestrial sites were not available, we multiplied the daily mean of the respective month by the days in that particular month, and indicated that no gap-filling was applied in the “gap_fill” column. With these non-gap-filled data, gaps covered 53 % for NEE and 69 % for CH4 flux per month on average. For aquatic eddy covariance sites, half-hourly flux data adopted from Golub et al. (2023) had been gap-filled following Pastorello et al. (2020) and were aggregated to monthly cumulative fluxes for ABCFlux v2, but data contributors also shared non-gap-filled data which we then aggregated to monthly cumulative fluxes and indicated that in the “gap_fill” column. As mentioned above, additional gaps in flux data occur where fetch screening was applied to heterogeneous tower footprints. For aquatic sites, the gap-fill percentage often reflects both general data gaps, such as those caused by sensor issues, maintenance, power outages, or poor turbulence conditions, and the additional exclusion of data due to fetch screening. Consequently, gap-fill percentages between terrestrial and aquatic sites in ABCFlux v2 cannot be directly compared. Gap-fill percentages for aquatic data averaged 68 % for CO2 and 65 % for CH4.
The methods used to partition CO2 fluxes into GPP and Reco at terrestrial eddy covariance sites varied, with the most common approach (66 % of site-months) being that of Lasslop et al. (2010) and Reichstein et al. (2005), which has been widely applied in global synthesis and upscaling studies (e.g., Nelson et al., 2024). In addition to the Reichstein et al. (2005) method, this dataset also includes fluxes based on other partitioning methods such as Lasslop et al. (2010), Reichstein et al. (2005) and Runkle et al. (2013). Potential limitations and differences among partitioning methods in the Arctic-boreal context have been extensively discussed in Virkkala et al. (2022) (under “Uncertainties in eddy covariance flux partitioning”). In particular, nighttime partitioning (Reichstein et al., 2005) can introduce uncertainty in high-latitude regions where low-light nighttime conditions are limited during summer. However, when comparing multiple gap-filling and partitioning methods across sites, we found that the variability in annual GPP and Reco estimates was small (Desai et al., 2008; Keenan et al., 2019), lending confidence to the partitioned GPP and Reco estimates derived from the diverse methods used in this dataset.
Chamber and other non-eddy covariance flux measurements, although generally more temporally sporadic than eddy covariance, were often converted to monthly cumulative fluxes using a similar method as eddy covariance (i.e., measurements averaged and multiplied by days) or, in some cases, gap-filled with light- and temperature-response models; details related to the approach can be found in the “gap_fill” column. Similarly, meteorological data were often collected only during these sporadic measurements, and are thus not based on continuous meteorological measurements within a month. 20 % and 33 % of terrestrial non-eddy covariance NEE and CH4 flux measurements, respectively, 67 % and 50 % of lentic chamber CO2 and CH4 flux measurements, and 14 % and 16 % of lotic chamber CO2 and CH4 flux measurements were derived from one single measurement day (however note that the majority of lotic data do not have this information, 80 % of CO2 and 76 % of CH4 data). Furthermore, these measurements were often conducted during daytime only (69 % of terrestrial chamber measurements, 55 % of lentic, and 90 % of lotic flux measurements). The sporadic nature and lower data coverage of the non-eddy covariance data leads to uncertainty in monthly flux and meteorological data. The bias toward daytime measurements may lead to an overestimation of net CO2 sinks in vegetated ecosystems due to less photosynthesis at night (Lai et al., 2012; Järveoja et al., 2020) and an overestimation of CH4 emissions in lentic ecosystems due to calmer winds and cooler temperatures at night (López-Blanco et al., 2017; Sieczko et al., 2020; Voigt et al., 2023). Similarly, in lotic systems, measurements were typically conducted during the day, even though nighttime emissions may exceed daytime release, potentially leading to an underestimation of monthly CO2 emissions (Attermeyer et al., 2021; Gómez-Gener et al., 2021). However, such biases were not clearly evident in the data, even when comparing monthly fluxes derived using simple averages vs. light- and temperature-response models (Figs. S2 and S3). Site-months based on daytime-only measurements, however, tended to show greater variability, with lower minimum and higher maximum fluxes compared to those including both day- and night-time data. The columns “diurnal_coverage”, “chamber_nr_measurement_days_co2”, “chamber_nr_measurement_days_ch4” and “ebullition_nr_measurement_days” help the data users understand the temporal representativeness of the data.
5.2 Fluxes and periods captured by the dataset
Gas flux and dissolved gas concentration measurements were more abundant during the growing season (May–August) compared to the non-growing season (September–April). The average total number of observations per month was 4058 during growing season months vs. 479 during non-growing season months, and 50 % of terrestrial data and 28 % of aquatic data were collected in the non-growing season despite two thirds of the year being non-growing season. Non-growing season monthly fluxes were often more heavily gap-filled than those during the growing season (54 % in the growing season vs. 68 % in the non-growing season for CO2, 61 % vs. 63 % for CH4), which further contributes to higher uncertainties. This is problematic as the non-growing season, and in particular spring and autumn season CO2 and CH4 emissions in both terrestrial and freshwater ecosystems, are important for the annual carbon balance (Arndt et al., 2023; Lyu et al., 2024). In freshwater ecosystems, the CO2 and CH4 emissions during the spring ice-out period (“storage flux”) are known to contribute significantly to annual fluxes (e.g., 11 % to 59 % in subarctic lakes; Jammet et al., 2015; Juutinen et al., 2009; Karlsson et al., 2013, 2024; Prėskienis et al., 2021), but measurements during the spring period are limited. Assuming a spring ice-out period in May–June for lentic ecosystems and March–April for lotic ecosystems (following Song et al., 2024), 28 % of the lentic site-months and only 6 % of the lotic site-months captured this period. Furthermore, information on the timing of the ice-on and ice-off was rarely given for non-growing season measurements at aquatic sites. Therefore, annual CO2 and CH4 fluxes from aquatic ecosystems may be underestimated due to the lack of data during these influential seasonal periods. However, the extent of this underestimate is uncertain given the unknown role of CH4 oxidation and diel variation in CO2 consumption in the water prior to emissions (Pajala et al., 2023; Rudberg et al., 2021). At the same time, simple averaging of the dominating daytime summer fluxes to spring and autumn seasons may instead generate substantial overestimates for CH4, while simultaneously underestimating CO2 emissions in productive lakes where emissions can occur outside the growing season (Natchimuthu et al., 2016; Rudberg et al., 2021).
A substantial part (23 %) of freshwater carbon fluxes synthesized in ABCFlux v2 were gained from samples taken exclusively in the center of waterbodies, excluding edges. This may be problematic as the spatial variability of carbon fluxes across depth zones in lentic ecosystems can be large and plays a significant role when estimating ecosystem-level emissions, particularly for CH4 fluxes (Kuhn et al., 2023). Studies have shown that CO2 emissions might be overestimated when only considering measurements from the center of lakes (Loken et al., 2019), whereas CH4 emissions might be underestimated in some lakes (Juutinen et al., 2003), but not others (Schmiedeskamp et al., 2021). It is also important to note that the location of eddy covariance towers in freshwater ecosystems can contribute to under- or over-estimating fluxes depending on the location of localized emission hotspots (e.g. thermokarst features). Therefore, both under- and overestimations in aquatic cumulative ecosystem-level fluxes are possible, depending on the gas, sampling location, sampling frequency, and seasonal dynamics involved (Ray et al., 2023).
5.3 Quality flags based on expert assessment
To help data users assess data quality in the flux records, we included additional columns “expert_flag_co2”, ““expert_flag_gpp”, “expert_flag_reco” and “expert_flag_ch4” (Table 4, Fig. S4). These columns may aid in filtering out sites and/or observations that are atypical or highly uncertain and should be used with particular caution when scaling monthly fluxes to estimate budgets across larger domains. In other use cases, these observations may still be useful.
As a broad overview, we flagged CO2 fluxes outside of the 1st and/or 99th percentiles (flag 1), uncertain fluxes due to sporadic non-eddy covariance measurements (flag 2), long periods of eddy covariance data that have been entirely gap-filled (flag 3), and sites that do not represent typical conditions across the Arctic-boreal region due to human induced changes (flag 4, Table 4). All other CO2 fluxes were marked with a zero (i.e. representative, good-quality data).
Table 4Quality flags assigned to the terrestrial and aquatic CO2 and CH4 fluxes based on expert assessment (columns “expert_flag_co2”, “expert_flag_gpp”, “expert_flag_reco” and “expert_flag_ch4”). Note that the data that the respective flags apply to may change between terrestrial and aquatic, as well as lentic and lotic fluxes, and between flux methods. Further detail is given in Sect. 5.3.
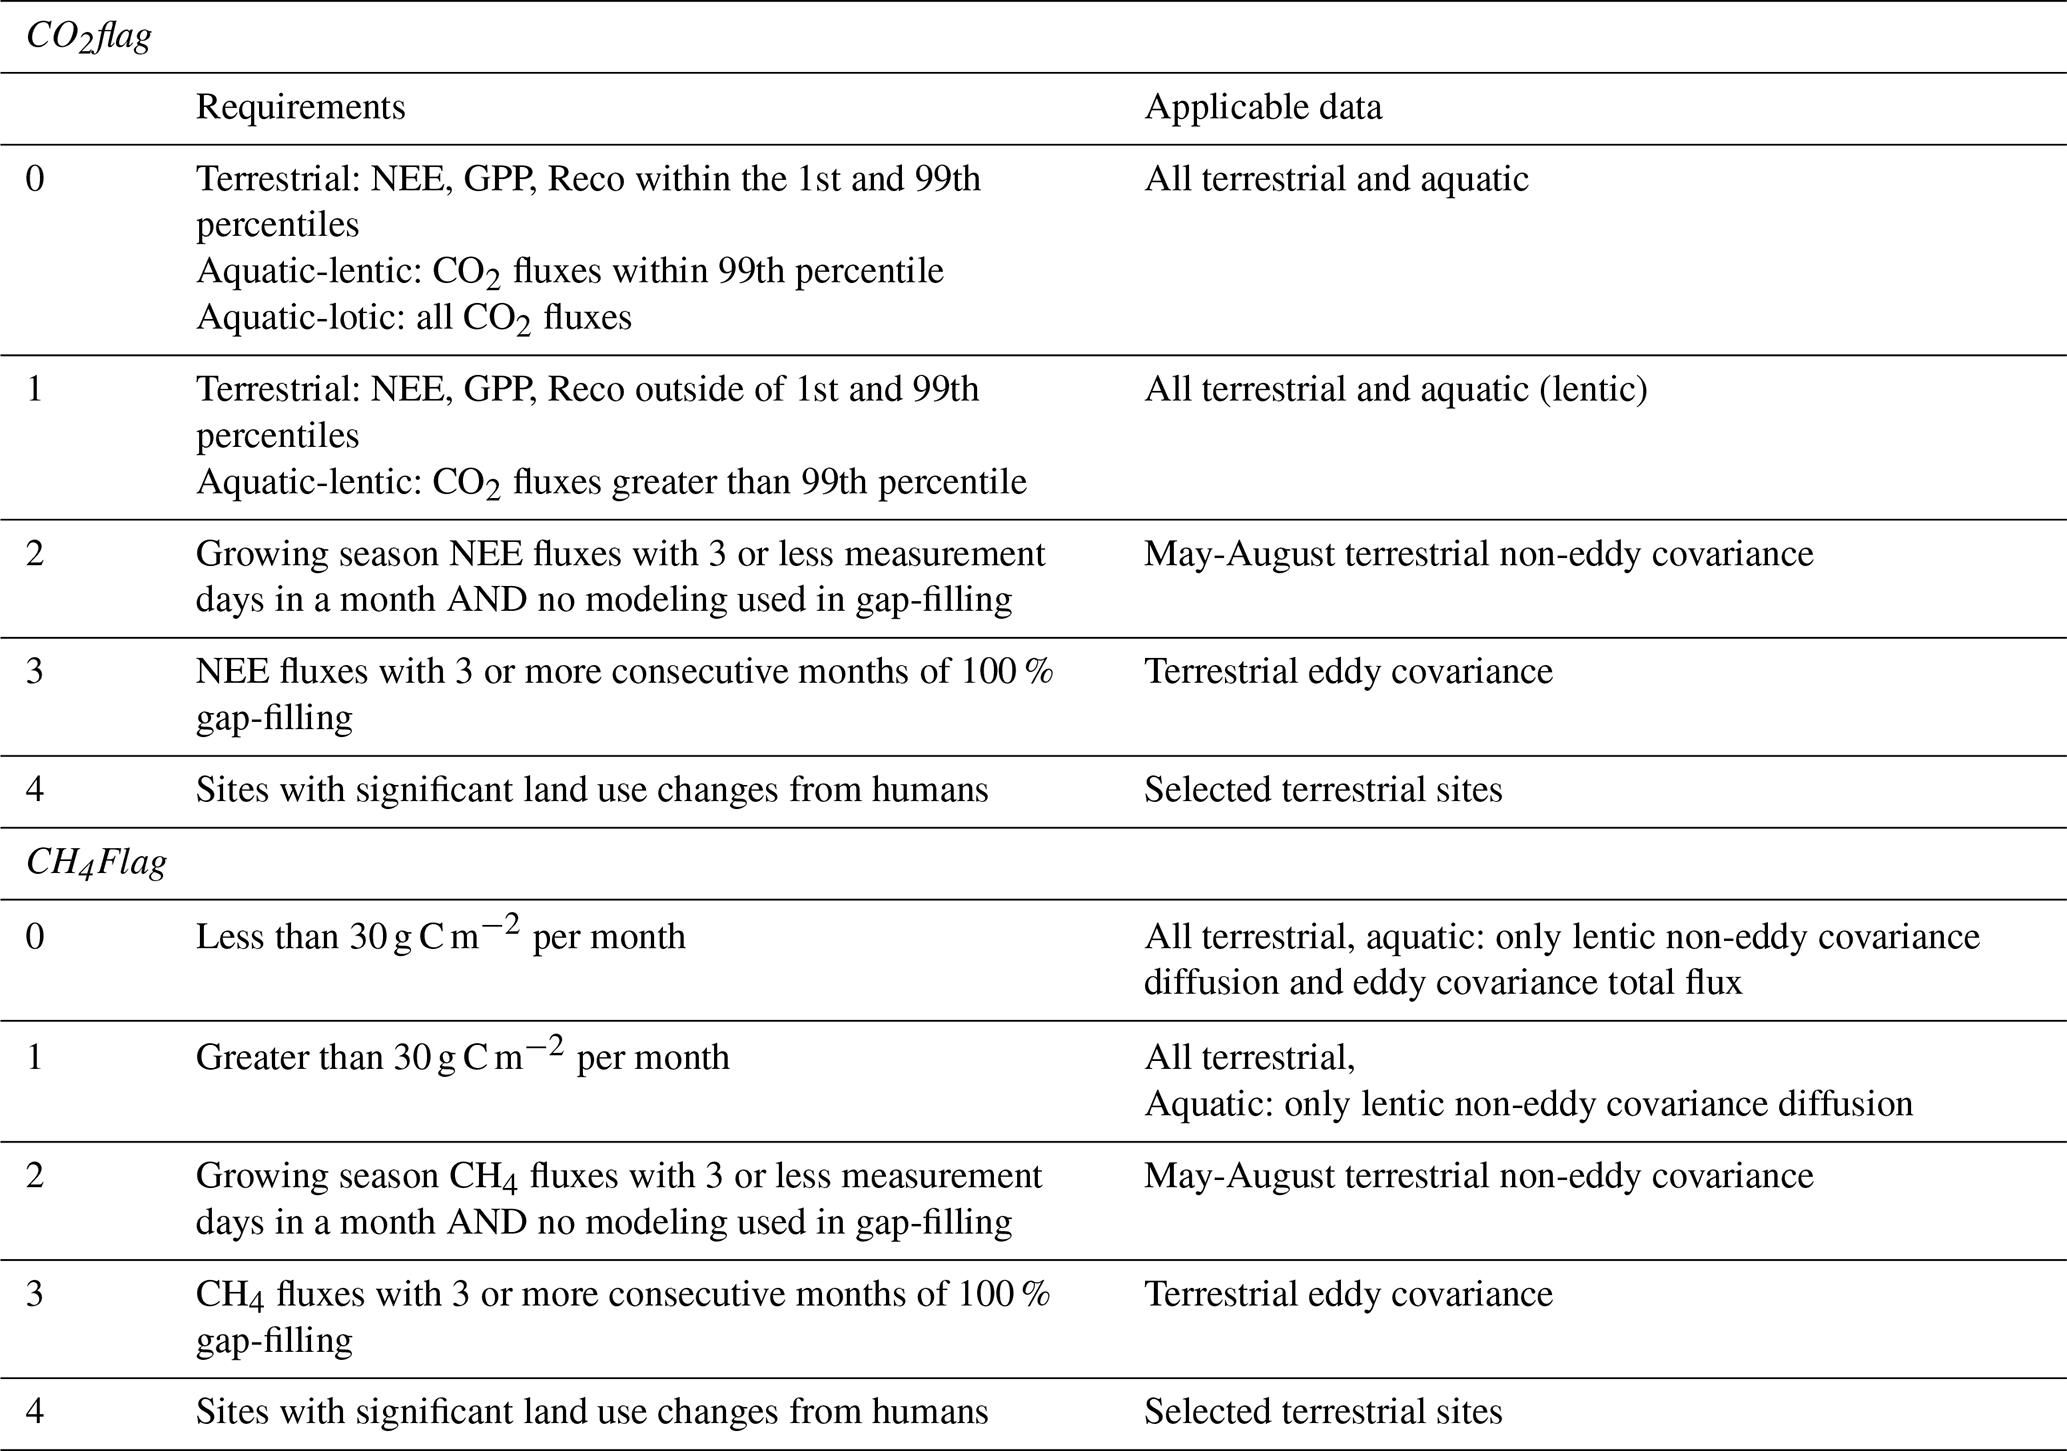
In more detail, we used 1st and 99th percentiles for terrestrial CO2 fluxes calculated separately for each combination of month, biome (tundra, boreal, temperate), and measurement method (EC, chamber, snow diffusion) to flag extremely high or low fluxes with 1. This procedure was applied independently to NEE (expert_flag_co2), GPP (expert_flag_gpp), and Reco (expert_flag_reco). This flag considered, for example, unusually low NEE values during peak winter months (i.e. fluxes from less than −25 g C m−2 per month between December and February), which represent unrealistically high winter net uptake values likely due to issues in eddy covariance data collection and gap-filling (Jentzsch et al., 2021; Kittler et al., 2017a). During the summer months (June–August), flag 1 captured eddy covariance NEE data below −140 g C m−2 per month and chamber NEE data below −425 g C m−2 per month. For chamber data, these large negative NEE values were often based on single daytime measurements alone. Flag 2 marks terrestrial chamber CO2 and CH4 flux growing season (May–August) measurements with fewer than three observation days in a month, where monthly values were calculated using simple averages rather than models incorporating light and temperature. Such limited sampling and simplistic averaging can introduce bias by failing to capture environmental variability, especially during the growing season. The three-day threshold is based on the assumption that approximately one measurement per week is necessary to produce a more reliable cumulative estimate, as suggested by Virkkala et al. (2022). To account for long periods of missing and entirely gap-filled data, we introduced flag 3 which marks eddy covariance data with 3 or more consecutive months of 100 % gap-filling. For flag 4, we flagged eddy covariance sites where there have been significant atypical changes to the landscape from humans such as sites where the organic soils were removed with a bulldozer (Euskirchen et al., 2017; Walter Anthony et al., 2024). While flag 1 was applied separately to NEE, GPP, and Reco, flags 2–4 were applied only to expert_flag_co2, as they pertain to measurement methods and site conditions rather than to the flux variables themselves.
For aquatic CO2, fluxes from lentic ecosystems that exceeded the monthly 99th percentile (between 26.4 g C m−2 per month in January to 320.9 g C m−2 per month in June) were marked with flag 1. We refrained from flagging fluxes from lotic ecosystems since these may be affected, for example, by higher turbulence and larger resulting gas exchange compared to stiller conditions in lentic ecosystems.
For terrestrial CH4 fluxes, we applied flag 1 to fluxes higher than 30 g C m−2 per month as such high values are well beyond the range of previously published estimates (Kuhn et al., 2021). Flags 2–4 were applied to terrestrial CH4 fluxes following the same criteria used for CO2 fluxes.
Similarly to terrestrial data, we flagged diffusive CH4 fluxes for lentic ecosystems that were higher than 30 g C m−2 per month and were excluded from analyses in previous studies (such as BAWLD-CH4) due to exceptionally high gas transfer velocities with flag 1. This flag was not applicable to aquatic eddy covariance sites since total CH4 fluxes did not exceed the chosen threshold. Furthermore, we refrained from flagging high diffusive CH4 fluxes for lotic ecosystems for the same reasons as mentioned above.
Flag 2 was not used for aquatic fluxes since 90 % of the aquatic monthly cumulative CO2 fluxes and 86% of CH4 diffusion fluxes from non-eddy covariance methods were derived from 3 or less measurements per month. Furthermore, none of the aquatic eddy covariance sites showed 3 or more consecutive months of 100 % gap-filled data (flag 3), and none of the aquatic sites experienced significant land use change which could be linked with extremely high fluxes (flag 4).
Throughout the following sections, we describe the spatial and temporal distribution of the dataset. We use the column “site_name” to identify unique sites, and group the flux measurement techniques following the three measurement categories presented in Table 1. The dissolved gas-category includes concentration data alone and is included in the site-month numbers presented Figs. 3–6. The term “site-month” refers to monthly data (fluxes and concentrations) and excludes seasonal fluxes (199 observations in the overall dataset). The key ecosystem categories used in visualizations are described in Sect. S1 in the Supplement; the terrestrial tundra class characterizes non-wetland ecosystems in the tundra biome (i.e., dry and moist tundra).
6.1 Number of site-months, unique flux values and sites
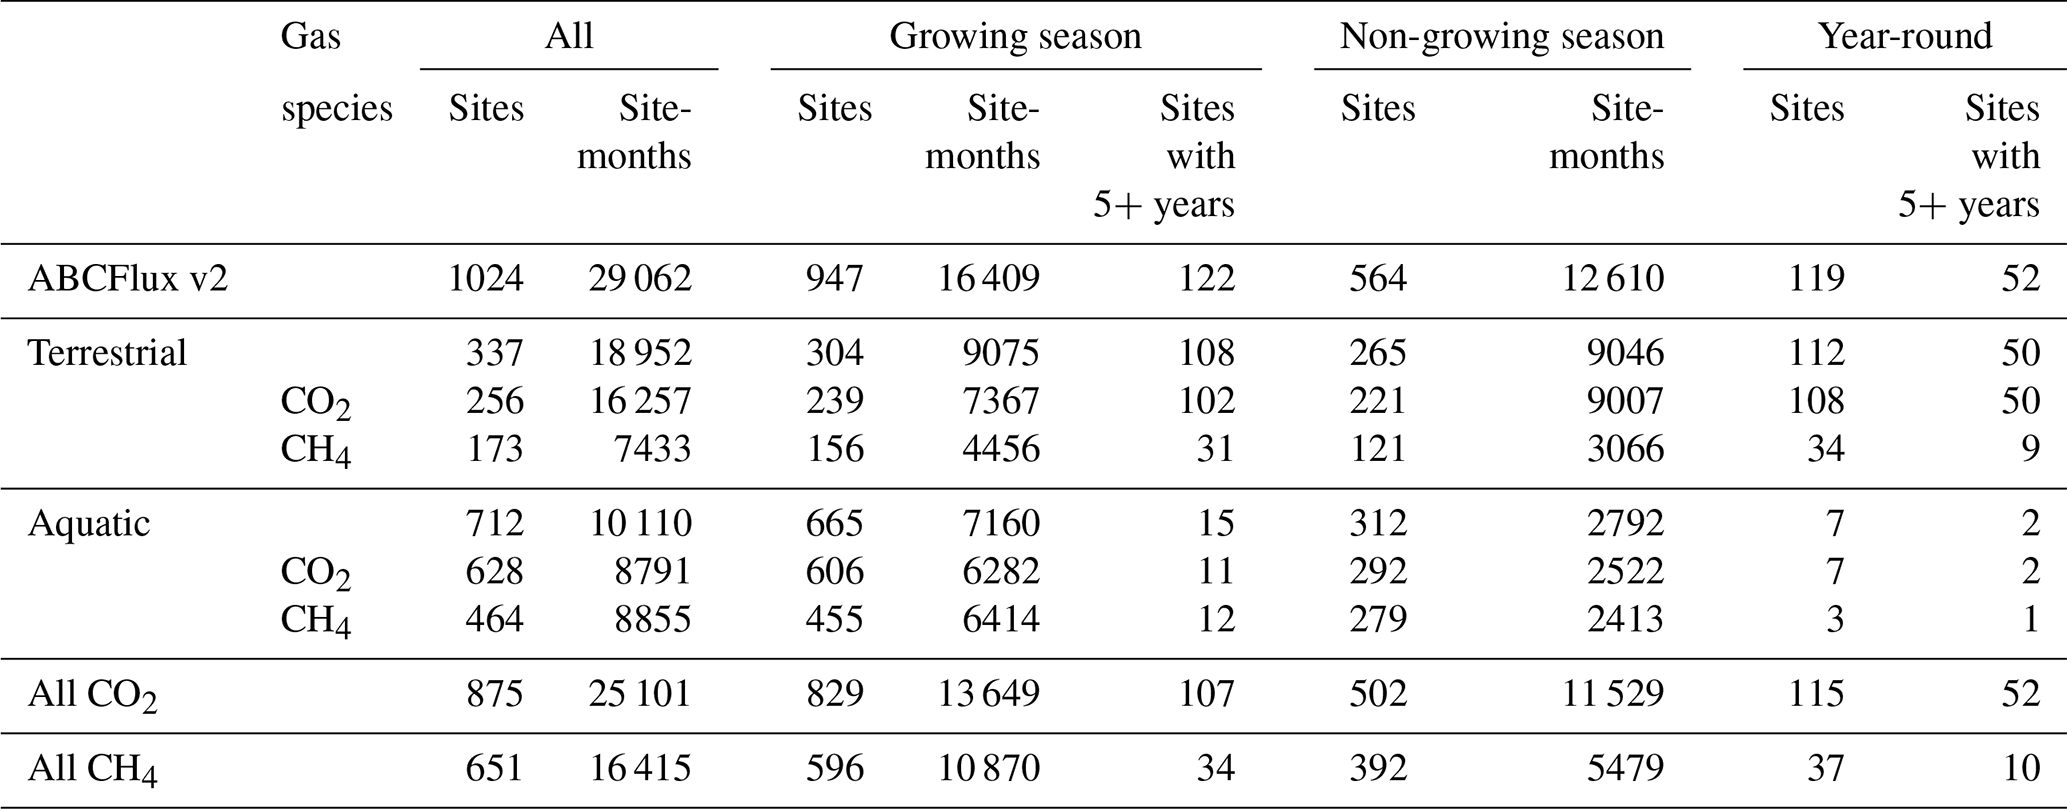
The ABCFlux v2 dataset comprises 29 121 site-months, where each row represents a month with one to several unique gas fluxes (e.g. one site may include both a CH4 and GPP flux for a given month) for a given site. In total, the dataset includes 56,139 unique flux values spanning CO2 and CH4 fluxes and their surface-atmosphere transport pathways. This “unique flux” value reflects the sum of all non-NA flux entries in the “nee”, “gpp”, “reco”, “co2_flux”, “diffusion”, “ebullition”, “total_ch4”, “storage”, and “seasonal” columns (see Table S1). For aquatic concentrations, there are 8801 site-months and 15 668 unique aquatic concentration measurements. Throughout the following sections, we focus on site-months rather than unique flux values. The number of site-months per site varied from 1 month to 330 site-months (1 to 330 site-months at terrestrial sites, 1 to 149 site-months at aquatic sites), with an average of 15 site-months (38 for terrestrial sites, 4 for aquatic sites); note that some sites had some sporadic months that were completely gap-filled in these estimates. We identified six large site clusters in the data (>800 monthly terrestrial and aquatic observations within a 30 km2 radius): Toolik Lake (USA), Abisko-Stordalen (Sweden), Hyytiälä-Siikaneva (Finland), Degerö-Flakaliden (Sweden), Fairbanks (USA), and Utqiaġvik (formerly Barrow; USA), see Fig. S11. The dataset includes a total of 1024 sites, comprising 337 terrestrial and 712 aquatic sites (Table 5). Most sites collected data primarily during the growing season (May–August), while 119 sites operate year-round, the majority of which (108) are eddy covariance sites in terrestrial ecosystems. ABCFlux v2 includes 16 terrestrial year-round CO2 flux sites with >10 years of data, mainly located in the boreal biome (14 sites). The longest time series of CO2 fluxes in ABCFlux v2 in the boreal biome were from Hyytiälä (27 years), Degerö (23 years), Fyodorovskoye (22 years), University of Alaska Fairbanks (21 years), and in the tundra biome sites Eight Mile Lake (14 years), Imnavait Creek Watershed Heath Tundra (14 years), and Imnavait Creek Watershed Tussock Tundra (14 years). There were 33 terrestrial sites with both year-round CO2 and CH4 flux data (at least for some of the years; see Table S3). For CH4, there were 34 terrestrial sites with year-round data with the longest time series at Trail Valley Creek (9 years), Cherskii reference (8 years), Cherskii (8 years), and Scotty Creek Landscape (8 years). For the aquatic dataset, CO2 fluxes were measured year-round at 7 eddy covariance and non-eddy covariance sites (Bernard Lake, Eastmain Reservoir, Iskoras, Kuivajärvi, Romaine-2 reservoir, Vanajavesi, Simpevarp) and at three of them CH4 fluxes were measured year-round (Bernard Lake, Iskoras, Romaine-2 reservoir). ABCFlux v2 also includes automatic chamber measurements from 23 sites. However, these sites have shorter time series and contribute 15 % of monthly CO2 chamber measurements and 6 % of monthly CH4 chamber measurements.
Table 5Number of sites and site-months for the whole dataset separated by terrestrial (CO2 and CH4), aquatic (CO2 and CH4), CO2 only and CH4 for growing season (May–August) and non-growing season (September–April) months. The table also lists the number of year-round sites and year-round sites with 5+ years of data. Note that some sites are both terrestrial and aquatic. A year-round site was defined as having at least some data for all months (no 100 % gap-filled months) for at least one full year in the time series; if no data on gap-filling percentage was provided then we assumed there was some data for all months. The sum of terrestrial and aquatic site counts exceeds the total number of sites because some sites have both terrestrial and aquatic measurements.
6.2 Regional coverage
Terrestrial and aquatic sites are widely distributed across the Arctic-boreal domain (Fig. 1). However, the distribution of sites in ABCFlux v2 varies significantly across regions and key ecosystems in terms of the number of sites, site-months, and the gas species measured (Table 5, Fig. S6). In terms of site-months in the full dataset, Alaska showed the highest coverage (24.3 % of the dataset) with Sweden (20.9 %), Canada (19.2 %), and Finland (17.4 %) following closely behind, and finally Russia (11.2 %), Norway (3 %), and Greenland (2.2 %) (Table S4). Among just the terrestrial data, Alaska, Finland, and Canada account for a majority of the site-months (23.4 %, 20.5 %, and 20.3 % respectively), with Sweden only making up 14.7 % of terrestrial observations. In contrast, measurements from Sweden made up the highest number (32.5 %) of the aquatic site-months followed by Alaska (25.9 %), Canada (17.6 %), and Finland (11.5 %). The majority of aquatic sites came from Finland (31.6 %), and this dominance can be attributed to a few key aquatic studies that were incorporated in our dataset (Juutinen et al., 2009; Kortelainen et al., 2006). The density of sites in these countries is also quite variable in terms of terrestrial and aquatic systems as well as the type of flux (Fig. S5).
6.3 Temporal and seasonal coverage
Data in ABCFlux v2 span the years 1984 to 2024, with the majority of monthly observations occurring after 1999 (92.5 % in total, 95.0 % terrestrial, 87.4 % aquatic, Fig. 3). Years with the largest amount of data are 2014–2019. The distribution of sites with more recent data is less comprehensive (2022 as an example; Fig. S9). This does not imply these sites discontinued data collection, but rather that the data were not made available at the time of this synthesis. Regarding seasonal coverage, eddy covariance data are more evenly distributed across the year compared to chamber and other non-eddy covariance measurement methods (Fig. S6). Terrestrial ecosystems show the highest data availability in July, with 1.5 to 3 times more data than other months, depending on the ecosystem (Fig. 4). In contrast, data coverage in aquatic ecosystems peaks in August, although overall coverage from June to August remains similar. Aquatic data show a sharp decline during spring and autumn, whereas terrestrial ecosystems experience a more gradual decrease outside the summer months. Among terrestrial ecosystems, wetlands exhibit the strongest seasonal bias, with substantially more observations in summer compared to other seasons.
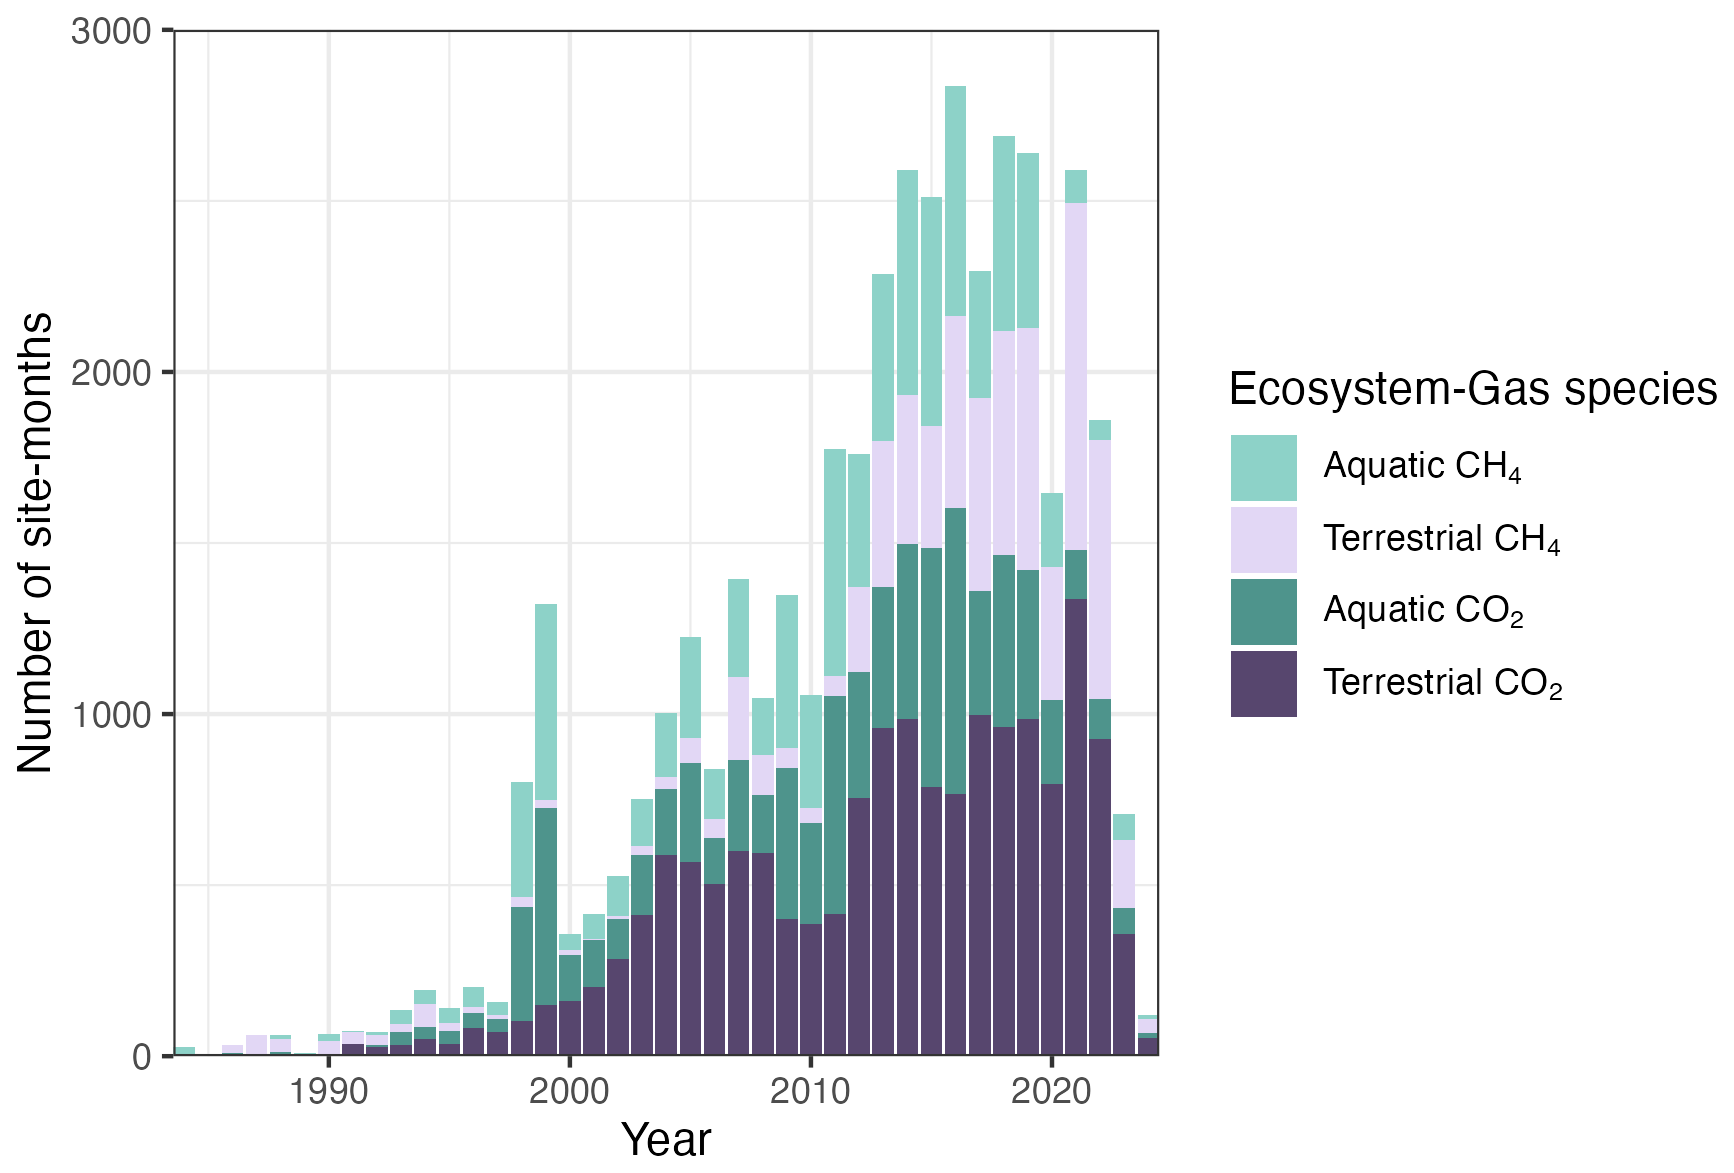
Figure 3The number of CO2 and CH4 flux site-months across years. Numbers of observations are shown as stacked bars for each year. If a site-month measured both CO2 and CH4, it is counted as separate site-months in the figure (1 CO2 site-month and 1 CH4 site-month). The distribution of sites with more recent data is less comprehensive (2022 as an example). This does not imply these sites discontinued data collection, but rather that the data were not made available at the time of this synthesis.
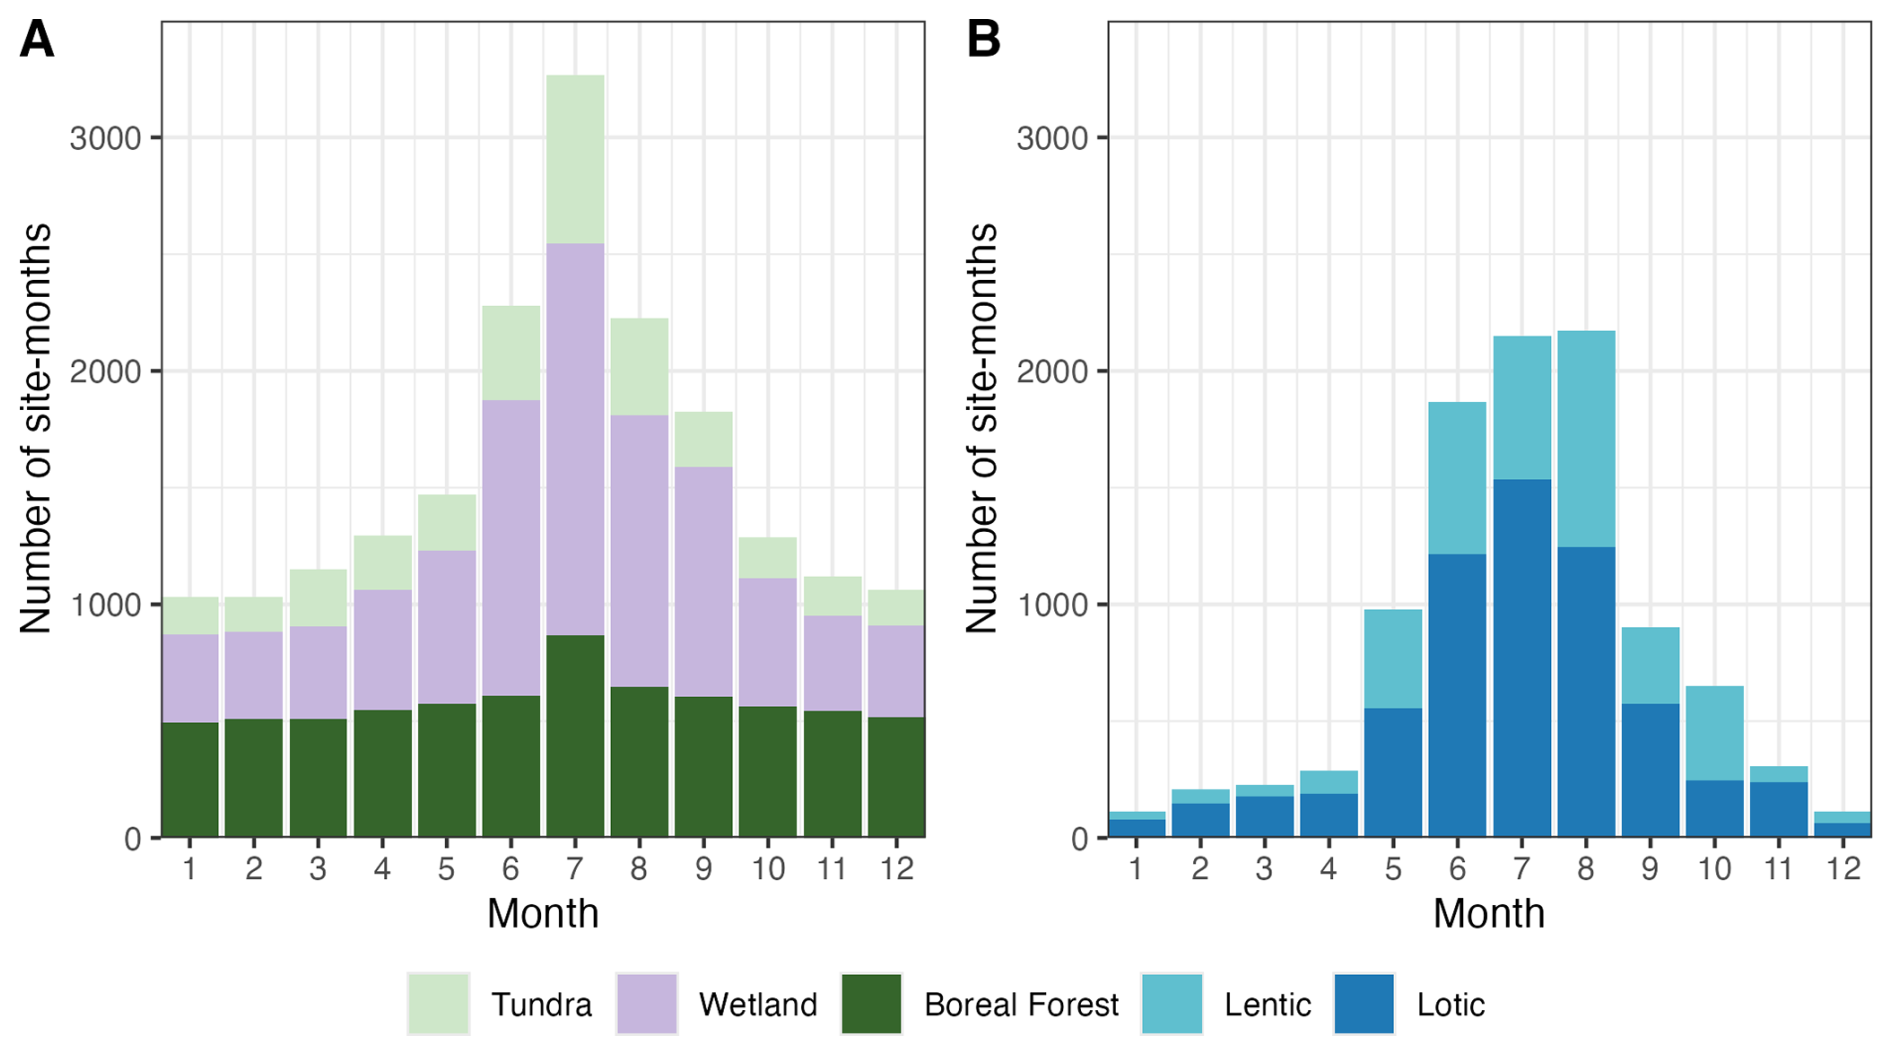
Figure 4The number of CO2 and CH4 monthly observations across months and key ecosystem types (A = terrestrial, B = aquatic). Aquatic concentration site-months are included in the figure. The terrestrial tundra class characterizes non-wetland ecosystems in the tundra biome (i.e., dry and moist tundra).
6.4 Land cover type and disturbance coverage
Wetlands (including bogs, fens, permafrost bogs, tundra wetlands, marshes) had the highest number of flux observations (8758 site-months), driven by the abundance of CO2 flux measurements (Fig. 5). Boreal forests were the second most measured ecosystem type (6981 site-months), while tundra systems were the least studied (3308 site-months). CO2 flux site-months dominated the dataset across most ecosystem types (25 222 site-months), except for lentic ecosystems, where CH4 flux measurements (3098 site-months) were more frequent than CO2 flux measurements (2915 site-months).
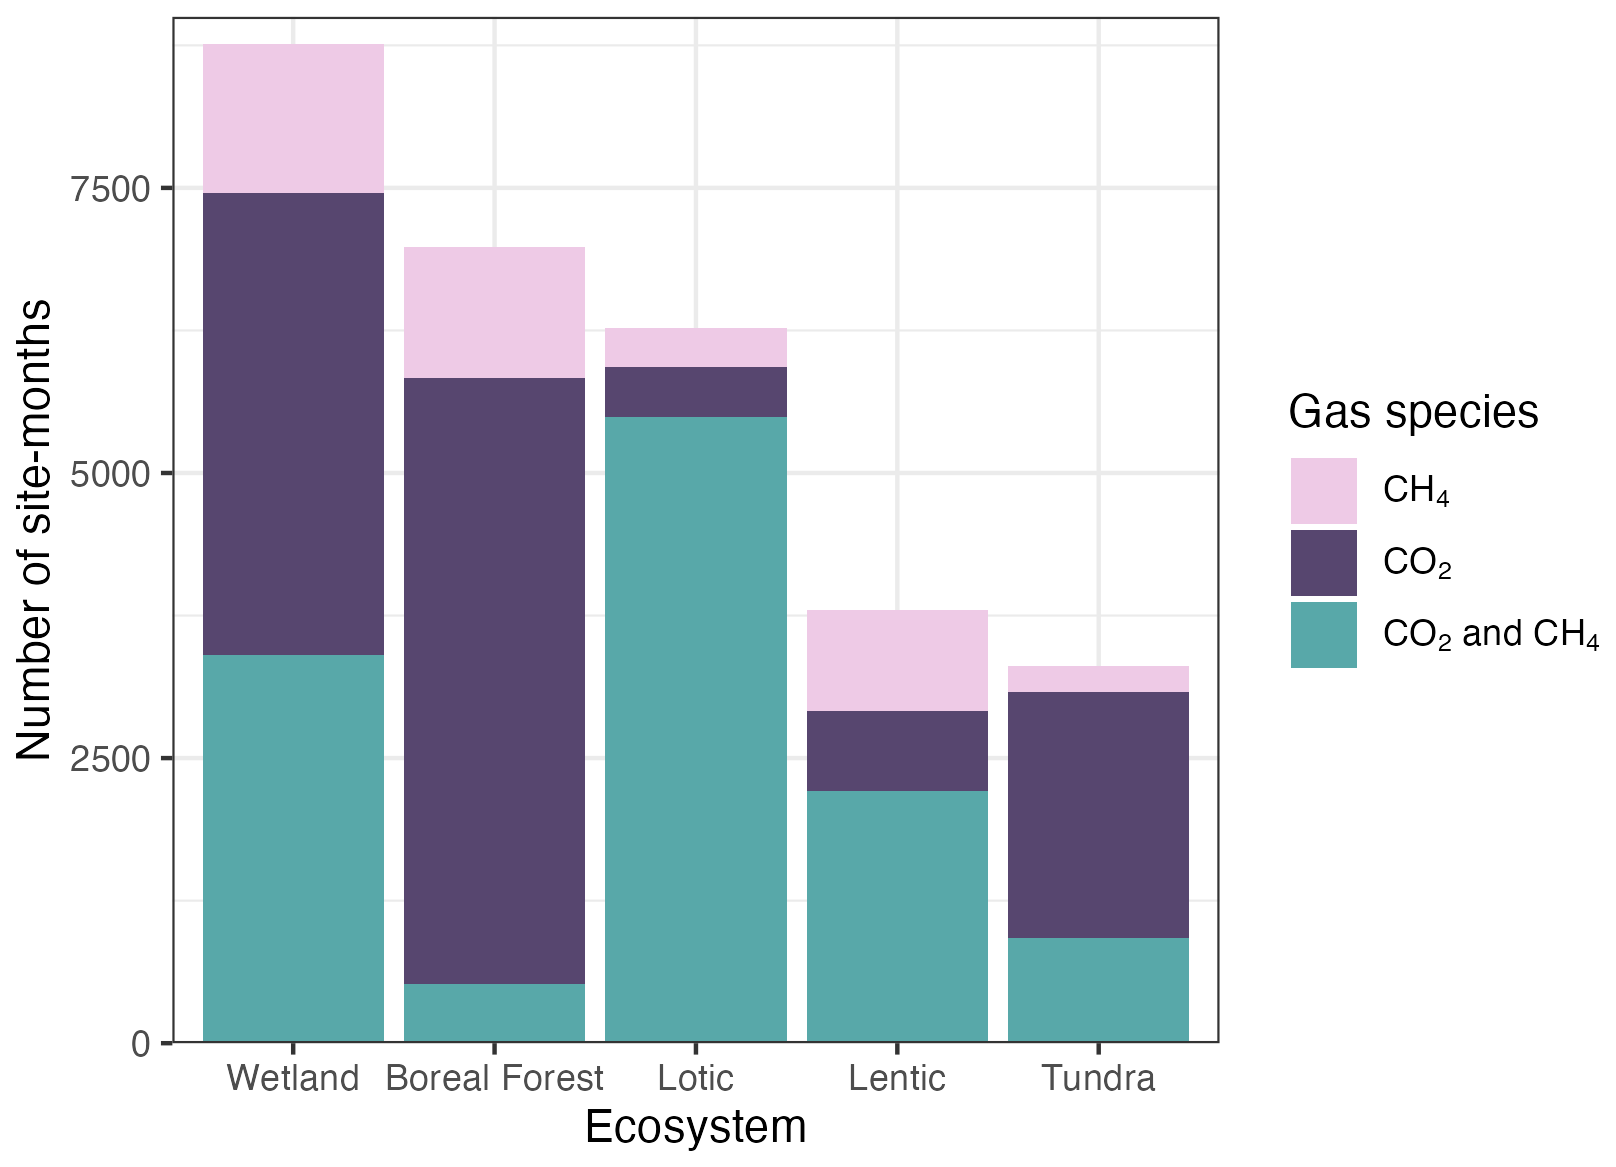
Figure 5The number of CO2 and CH4 flux and concentration site-months per key ecosystem types. Aquatic concentration site-months are included in the figure. The terrestrial tundra class characterizes non-wetland ecosystems in the tundra biome (i.e., dry and moist tundra).
To better understand data coverage and calculate aerial extent across more detailed land and waterbody types, we used a combination of BAWLD and ESA CCI land cover data for terrestrial ecosystems (see Sect. S1 for details) and a simplified version of BAWLD for aquatic ecosystems, focused on waterbody sizes. Overall, flux site-months were somewhat unevenly distributed across key land cover types relative to their areal extent (Fig. 6). Some classes were measured more in comparison to the area they cover (e.g., bogs, fens, permafrost bogs, wet tundra), while others showed more balanced representation (e.g., shrublands, graminoid ecosystems, evergreen needleleaf forests, mixed forests). In contrast, some classes were sparsely measured relative to their large areal extent (e.g., deciduous needleleaf forests, sparse vegetation and barren). For aquatic ecosystems, the most pronounced coverage biases were observed in the large lentic class, which was underrepresented relative to its total surface area, while small lotic ecosystems were disproportionately sampled compared to their small surface area extent. However, since flux data in our dataset are collected at the lake level, each site-month observation is weighted equally, regardless of lake size. This may not accurately reflect larger lakes, where a single observation can represent a much greater area. Similarly, this approach does not account for flux magnitudes or variability, which are variable across ecosystems. For example, lotic and wetland ecosystems often exhibit substantial CH4 flux variability, necessitating more frequent observations for accurate representation compared to, for instance, barren ecosystems.
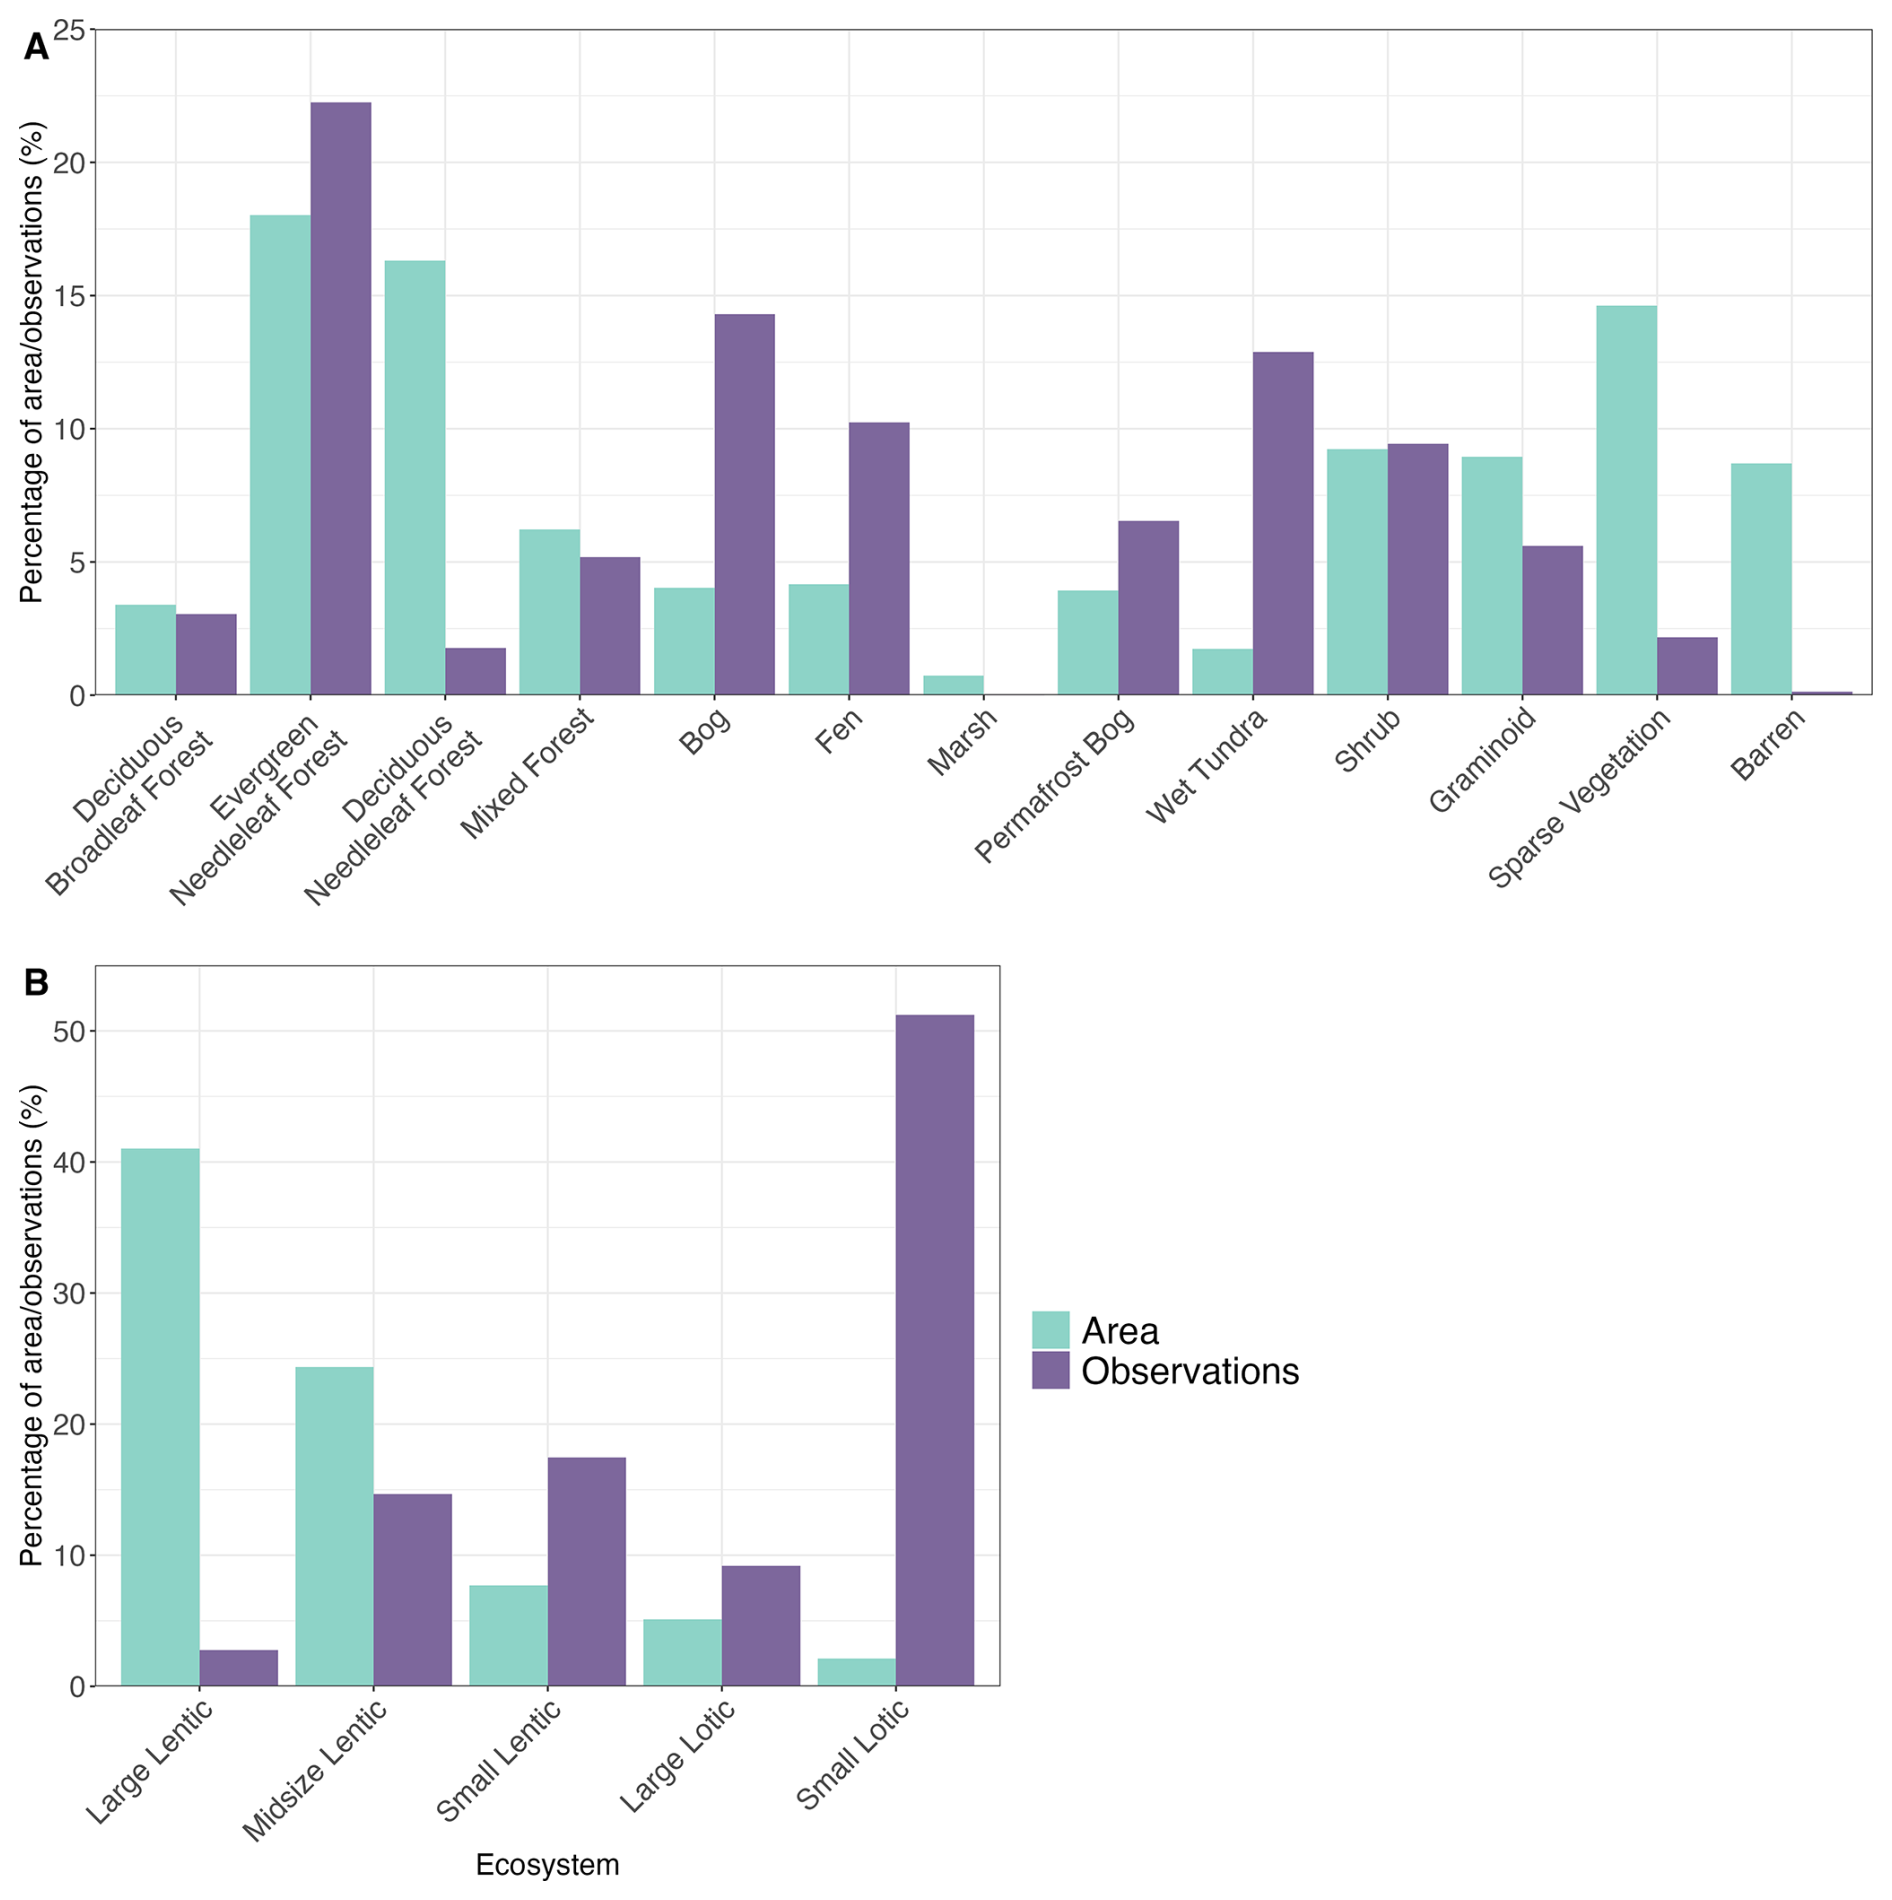
Figure 6The coverage of monthly flux observations and areas of key terrestrial (A) and aquatic (B) ecosystem types from the ESA land cover model. Aquatic concentration site-months are included in the figure. Some observations were left unclassified due to the lack of descriptive data and are not shown in the figure. There are 61 site-months of data from marshes, resulting in their proportion appearing nearly zero in the figure.
There are 272 sites in ABCFlux v2 that reported a disturbance, constituting 11 558 site-months. These disturbances were broadly classified into 21 categories: altered hydrology, animal herbivory, artificial pond, beavers, drainage, drained lake, erosion, extreme weather, fire, forestry, human paths, insect herbivory, land use change, peat mining, reservoir, seismic lines, thaw, tidal effects, wastewater, and other. Among these categories, the most common disturbance noted was “Thaw” (131 sites, 6091 site-months), which can be attributed to the thaw category including various types of permafrost thaw. We further divide the thaw category into 8 categories: active layer thickening with subsidence, active layer thickening without subsidence, active layer thickening with talik formation, ice-wedge degradation, thaw lake/pond expansion, wetland collapse, active layer detachment sliding, and retrogressive thaw slumping. Aside from thaw, fire and forestry were the most frequent disturbances in terms of terrestrial sites (35 and 26 sites respectively). For aquatic sites, thaw was still the most common disturbance (71 sites) followed by wastewater, though the number of sites with this disturbance was much less (9 sites). The years that disturbances occurred varied from hundreds of years ago to more recent (2023) and on-going disturbances.
6.5 Flux site data coverage comparison to earlier synthesis datasets
ABCFlux v2 includes 59 % more sites and 160 % more site-months for terrestrial CO2 flux data compared to ABCFlux v1. ABCFlux v2 has substantially more sites with CO2 data from the non-growing season (September–April; 213 vs. 141 in ABCFlux v1). ABCFlux v2 also has more recent data, with 2020–2024 making up 16 % of the data; though the most recent years 2023–2024 account for 2.1 % of site-months likely due to a delay in publication or processing of data.
While ABCFlux v2 has substantial overlap with the major international eddy covariance data repositories (FLUXNET2015, FLUXNET-CH4, Ameriflux, and ICOS), ABCFlux v2 also incorporates a large number of additional sites and site-months from community-contributed data (i.e., data provided directly by site PIs or researchers), enhancing both the spatial coverage and temporal range of the dataset. FLUXNET-2015 covers 25 % of the terrestrial eddy covariance CO2 site-months included in ABCFlux v2. However, many of these observations were also directly provided by data contributors or removed during data cleaning (see Sect. 3.1 for more details), reducing the net contribution of FLUXNET2015 to 18 % of the terrestrial eddy covariance CO2 site-months. While other repositories such as Ameriflux (17 % of terrestrial CO2 site-months) and ICOS (10 % of site-months) remain important data sources in the Arctic-boreal region, ultimately community-contributed data represent a substantial portion of the dataset (31 % of site-months). This trend is even more pronounced in the terrestrial CH4 eddy covariance data, where FLUXNET-CH4 covers 28 % of site-months in ABCFlux v2 but contributes only 24 % to the final dataset, while community-contributed data account for 60 % of the observations.
Supporting data coverage remained relatively similar between the v1 and v2 datasets. For instance, soil organic carbon stock data were available for 16 % of site-months in v1 compared to 22 % in v2, and soil moisture data for 35 % in v1 vs. 45 % in v2. However, the v2 database shows improved coverage of disturbance information, increasing from 30 % in v1 to 44 % in v2.
BAWLD-CH4 terrestrial CH4 flux data included 555 site-years (daily average over the growing season) of chamber data from 214 sites. Integrating and updating terrestrial CH4 chamber data to monthly format in ABCFlux v2 resulted in 4520 site-months from 126 sites (using BAWLD-CH4 “site” definition for comparison). BAWLD-CH4 aquatic flux data included 396 site-years (daily average over the open-water season) of diffusive fluxes and 168 site-years of ebullitive fluxes from 391 and 151 sites, respectively. Integrating and updating aquatic flux data to monthly format in ABCFlux v2 resulted in 939-site-months from 286 sites for diffusion and 212 site-months from 27 sites for ebullition. The apparent loss of ebullition sites is because many of the original BAWLD-CH4 sites include ebullitive flux data only at the seasonal timeframe and it was not possible to partition fluxes into monthly intervals. Seasonal ebullitive data were included in the “ch4_flux_ebullition_seasonal” column instead.
Of the lotic data, about 85 % of site-months were transferred from the global river methane database (GRiMeDB), with the remaining 15 % of data largely being submitted by data contributors or extracted from recent publications. Nine eddy covariance towers within the Arctic-boreal domain were included in the global analysis of lake and reservoir CO2 fluxes (Golub et al., 2023). In comparison, ABCFlux v2 contains CO2 flux data from 15 eddy covariance towers covering aquatic ecosystems, one of which was deployed on a Finnish river. Otherwise, new tower sites were added from lakes in Canada and Scandinavia.
We also compared the number of sites in ABCFlux v2 with the recent ARctic greenhouse Gas Observation metadata version 1 (ARGO) (Vogt et al., 2025), where metadata across observational platforms in the Arctic-boreal region were collected. Our comparison focused on the number of sites rather than site-months because ARGO does not contain the flux data itself. While we cross-checked ARGO when preparing v2 and it now includes all ABCFlux v2 sites, our dataset contains approximately 40 fewer eddy covariance sites with carbon flux data from terrestrial and aquatic ecosystems. This discrepancy is due to data for those sites not being publicly available. In particular, ABCFlux v2 excludes recently established sites, whose data are not yet fully processed or shared, and older, short-term towers from the early 2000s included in publications for which data could not be accessed. ABCFlux v2 includes recent data since 2022 for only around half of the existing tower sites that are active according to ARGO, in most cases likely due to the delay in making data available. For non-eddy covariance sites, the site counts vary more strongly between ABCFlux v2 and ARGO due to differences in defining a “site”. When comparing unique site names between both datasets, ABCFlux v2 contains roughly three quarters of the sites from the observational platforms Chamber and Dissolved in ARGO. In both datasets, the number of aquatic sites is larger than for terrestrial sites, whereas lentic and lotic sites are split evenly.
Here we show a summary of monthly and annual CO2 and CH4 flux variability to provide a synthesis of flux magnitudes showing the data spread as well as highlight some uncertainties that the data user needs to be aware of. We used columns ”nee” for terrestrial data and “co2_flux” for aquatic data for the CO2 balance estimate, and the “ch4_flux_total” column for the CH4 flux for both ecosystems without differentiation between diffusion and ebullition. Monthly fluxes were summarized using the full dataset (i.e., not using any quality flags) and are reported in the main text for the key ecosystem classes as well as in the Supplementary material for the more detailed ecosystem classes (Tables S5–S10). We additionally summarize monthly concentrations of CH4 and CO2 for lentic and lotic ecosystems.
Total annual estimates were calculated by finding the monthly median fluxes per overarching class type (wetland, tundra, boreal forest, lentic lotic) across the entire dataset, and these were summed to obtain annual fluxes per each class. In this approach, median monthly fluxes from the entire year from terrestrial ecosystems were considered. For freshwater ecosystems, we summed emissions from May–October (6 months), and we assumed ice-emissions accounted for 17 % of the total annual emissions (following Liu et al., 2022; Ramage et al., 2024). We calculated annual emissions using a subset of the data where all data with flags 1–4 were removed based on “expert_co2_flag” and “expert_ch4_flag” columns. The flags considered unrealistically high or low fluxes, uncertain fluxes due to sporadic chamber measurements, eddy covariance data with long periods of entirely gap-filled data, and sites that do not represent typical conditions across the Arctic-boreal region.
The monthly and annual CO2 and CH4 flux estimates from our dataset exhibit magnitudes and variability comparable to previous estimates across key ecosystems (Figs. S12–S14) and are briefly described below.
7.1 Average monthly fluxes and concentrations
Monthly NEE varied widely, ranging from −81.3 to 122.4 g C m−2 per month (2.5th–97.5th percentiles) and from −621.7 to 3850.0 g C m−2 per month (min–max) across the entire dataset (Fig. 7). The most extreme values were often driven by non-eddy covariance measurements with low data coverage per month. When subset by the five main ecosystems, monthly median NEE fluxes varied from −34.1 to 603.4 g C m−2 per month (Table 6). A few lotic sites in the boreal biome remained unfrozen in January and February and showed very high median fluxes (603.4 g C m−2 per month; however it is generally assumed that most lotic, and also lentic, ecosystems are frozen and not actively releasing carbon this time of the year. Monthly median net emissions were highest in lotic ecosystems, followed by lentic ecosystems and October–April months in boreal ecosystems. Strongest net uptake values were found in boreal forests, followed by wetlands and tundra, whereas some aquatic net uptake up to −43.2 g C m−2 per month was observed as well (in total 24 lotic and 219 lentic site-months). Terrestrial ecosystems showed clear seasonal patterns in NEE, with uptake peaking in July (tundra and wetland) or June (boreal forests) and net emissions peaking in October–November (boreal forests and wetland) and September–October (tundra) (Table 6). Seasonal patterns in aquatic NEE were less clear, but net emissions were high throughout most of the year.
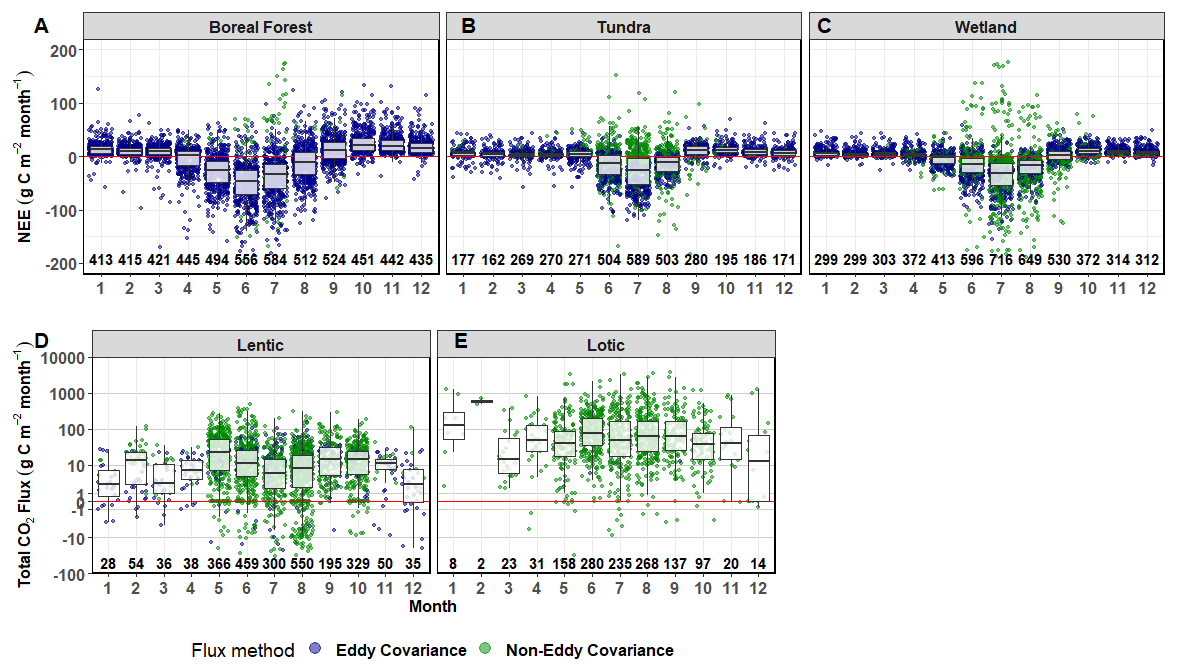
Figure 7Monthly NEE (terrestrial) and total CO2 flux (freshwater) variability across key terrestrial and aquatic classes together with the number of site-months. Note that y axes for the lentic and lotic fluxes follow a pseudo-log scale and represent the CO2 flux. The terrestrial tundra class characterizes non-wetland ecosystems in the tundra biome (i.e., dry and moist tundra).
Table 6Monthly median NEE (terrestrial) or CO2 flux (aquatic) in g C m−2 per month) across key ecosystems, with 25th–75th quantiles in parentheses. The terrestrial tundra class characterizes non-wetland ecosystems in the tundra biome (i.e., dry and moist tundra).
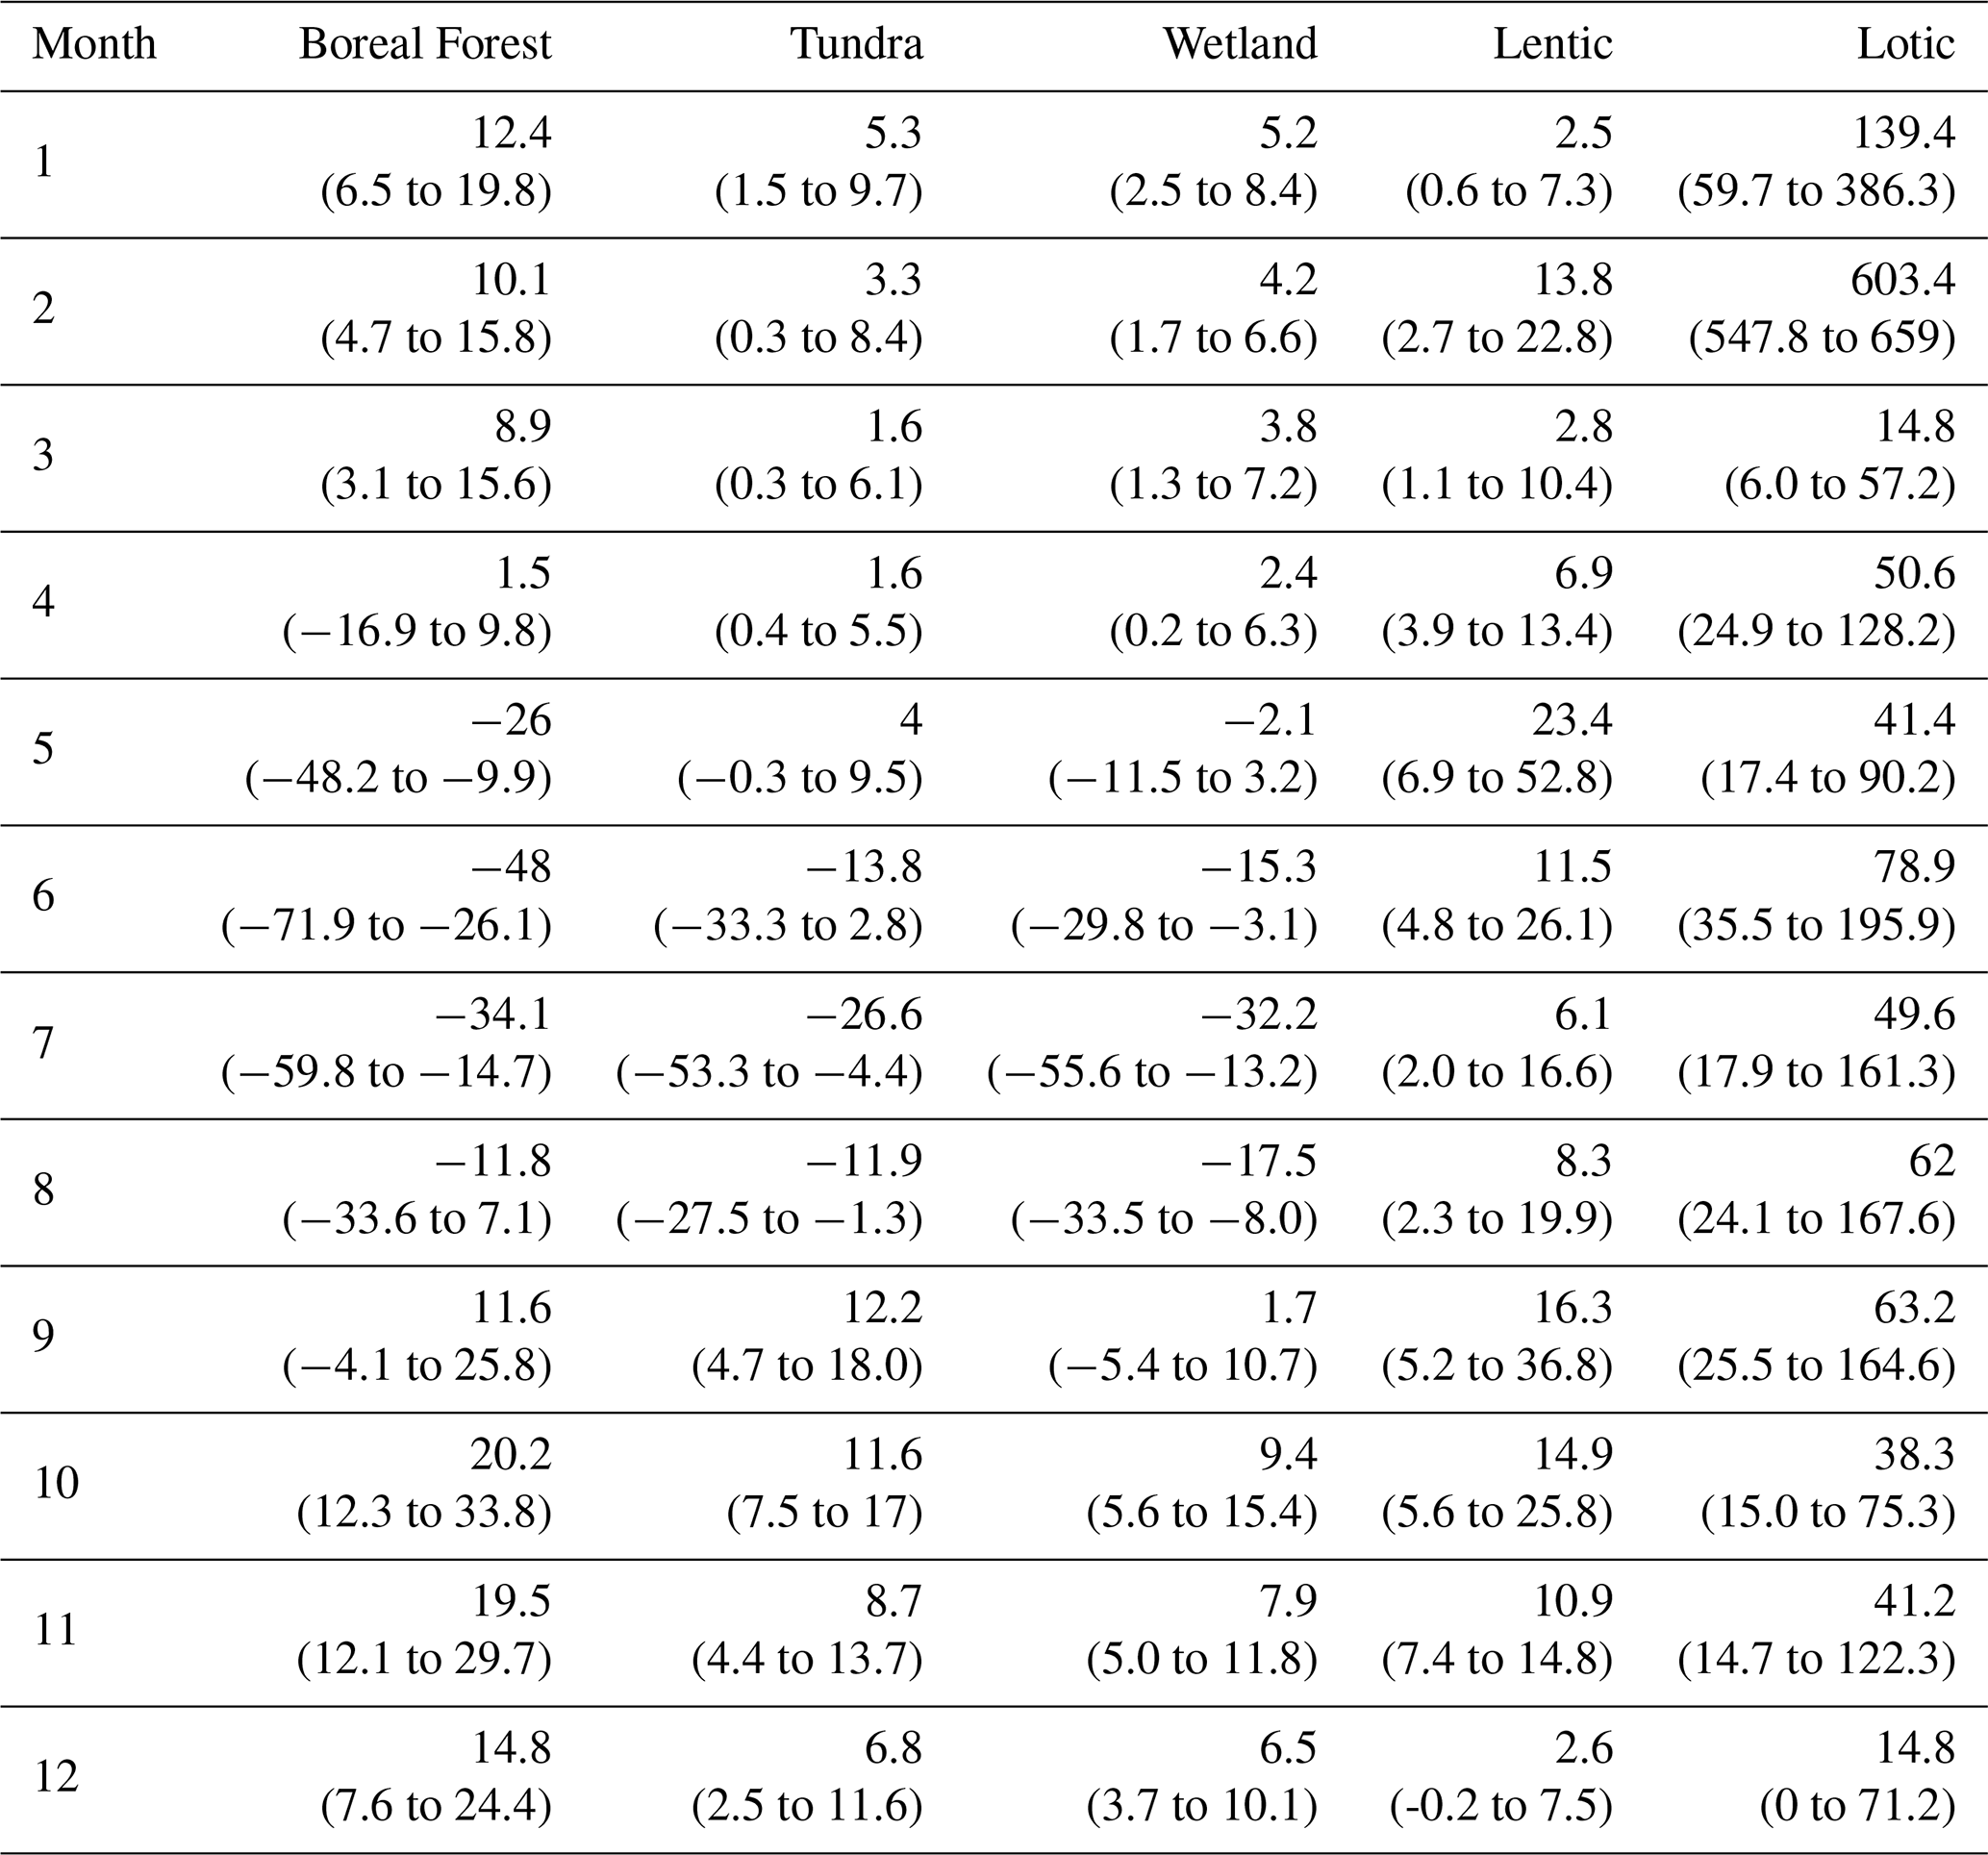
Monthly CH4 flux varied from −104 to 6146 mg C m−2 per month (2.5th–97.5th percentiles) and from −9272 to 145 389 mg C m−2 per month (min–max). The extreme values were primarily associated with aquatic non-eddy covariance measurements, where diffusion and ebullition fluxes were summed to estimate total CH4 flux. Ebullition fluxes in lentic ecosystems accounted on average for 53 % (±33 % standard deviation, 308 site-months) of the total CH4 flux, and for 44 % (±40 %, 16 site-months) in lotic ecosystems. Six monthly total CH4 fluxes exceeded expected ranges due to exceptionally high ebullition fluxes (>30 g C m−2 per month). Monthly median CH4 fluxes across key ecosystem types varied from −10.48 to 3712 mg C m−2 per month (Table 7). Monthly median CH4 emissions were highest in lotic ecosystems, but numbers of site-months were small. Lentic ecosystems and wetlands followed (Fig. 8). Boreal forests were consistent small net CH4 sinks (median) throughout the July–November period, while tundra remained neutral (0.0 g C m−2 per month) or exhibited small net emissions, particularly in spring, autumn, and winter. 14% of tundra (non-wetland) and 15 % of boreal forest site-months represented net CH4 sinks. Emissions from wetlands, lentic and lotic ecosystems showed clear seasonal patterns with emissions peaking in July–August.
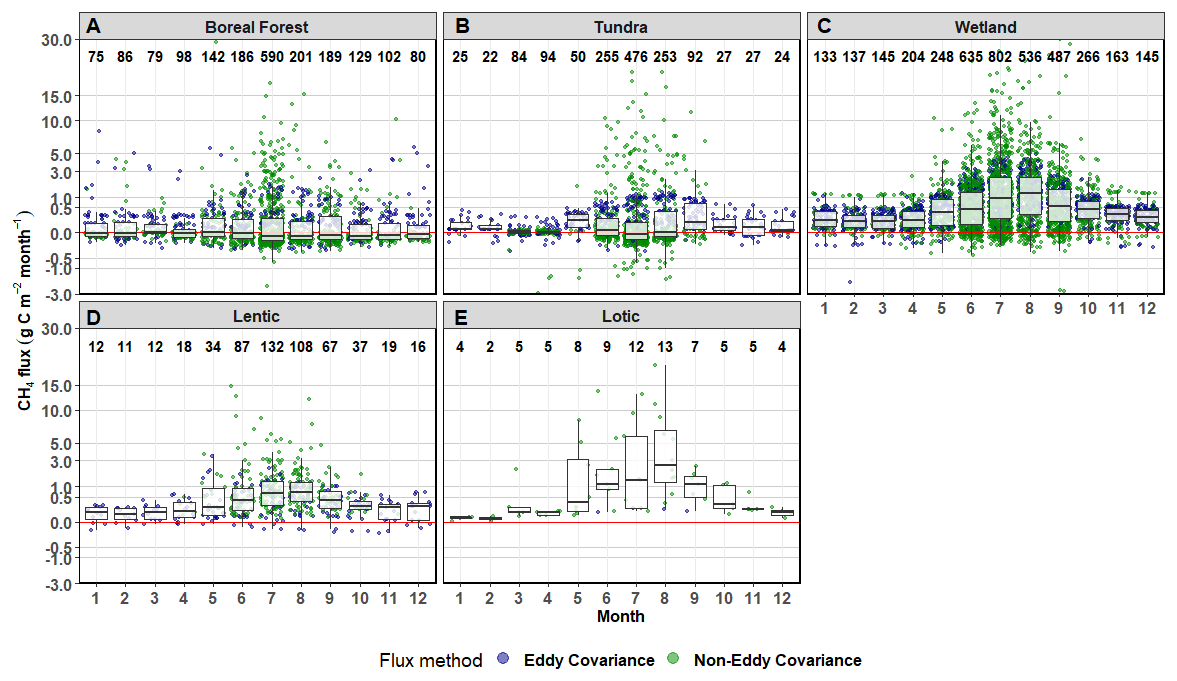
Figure 8Monthly CH4 fluxes across key terrestrial and aquatic classes together with the number of site-months. Note that y axes follow a pseudo-log scale. The tundra classes characterize non-wetland ecosystems in the tundra biome (i.e., dry and moist tundra).
Table 7Monthly median total CH4 flux (mg C m−2 per month) across key ecosystems, with 25th–75th quantiles in parentheses. The terrestrial tundra class characterizes non-wetland ecosystems in the tundra biome (i.e., dry and moist tundra).
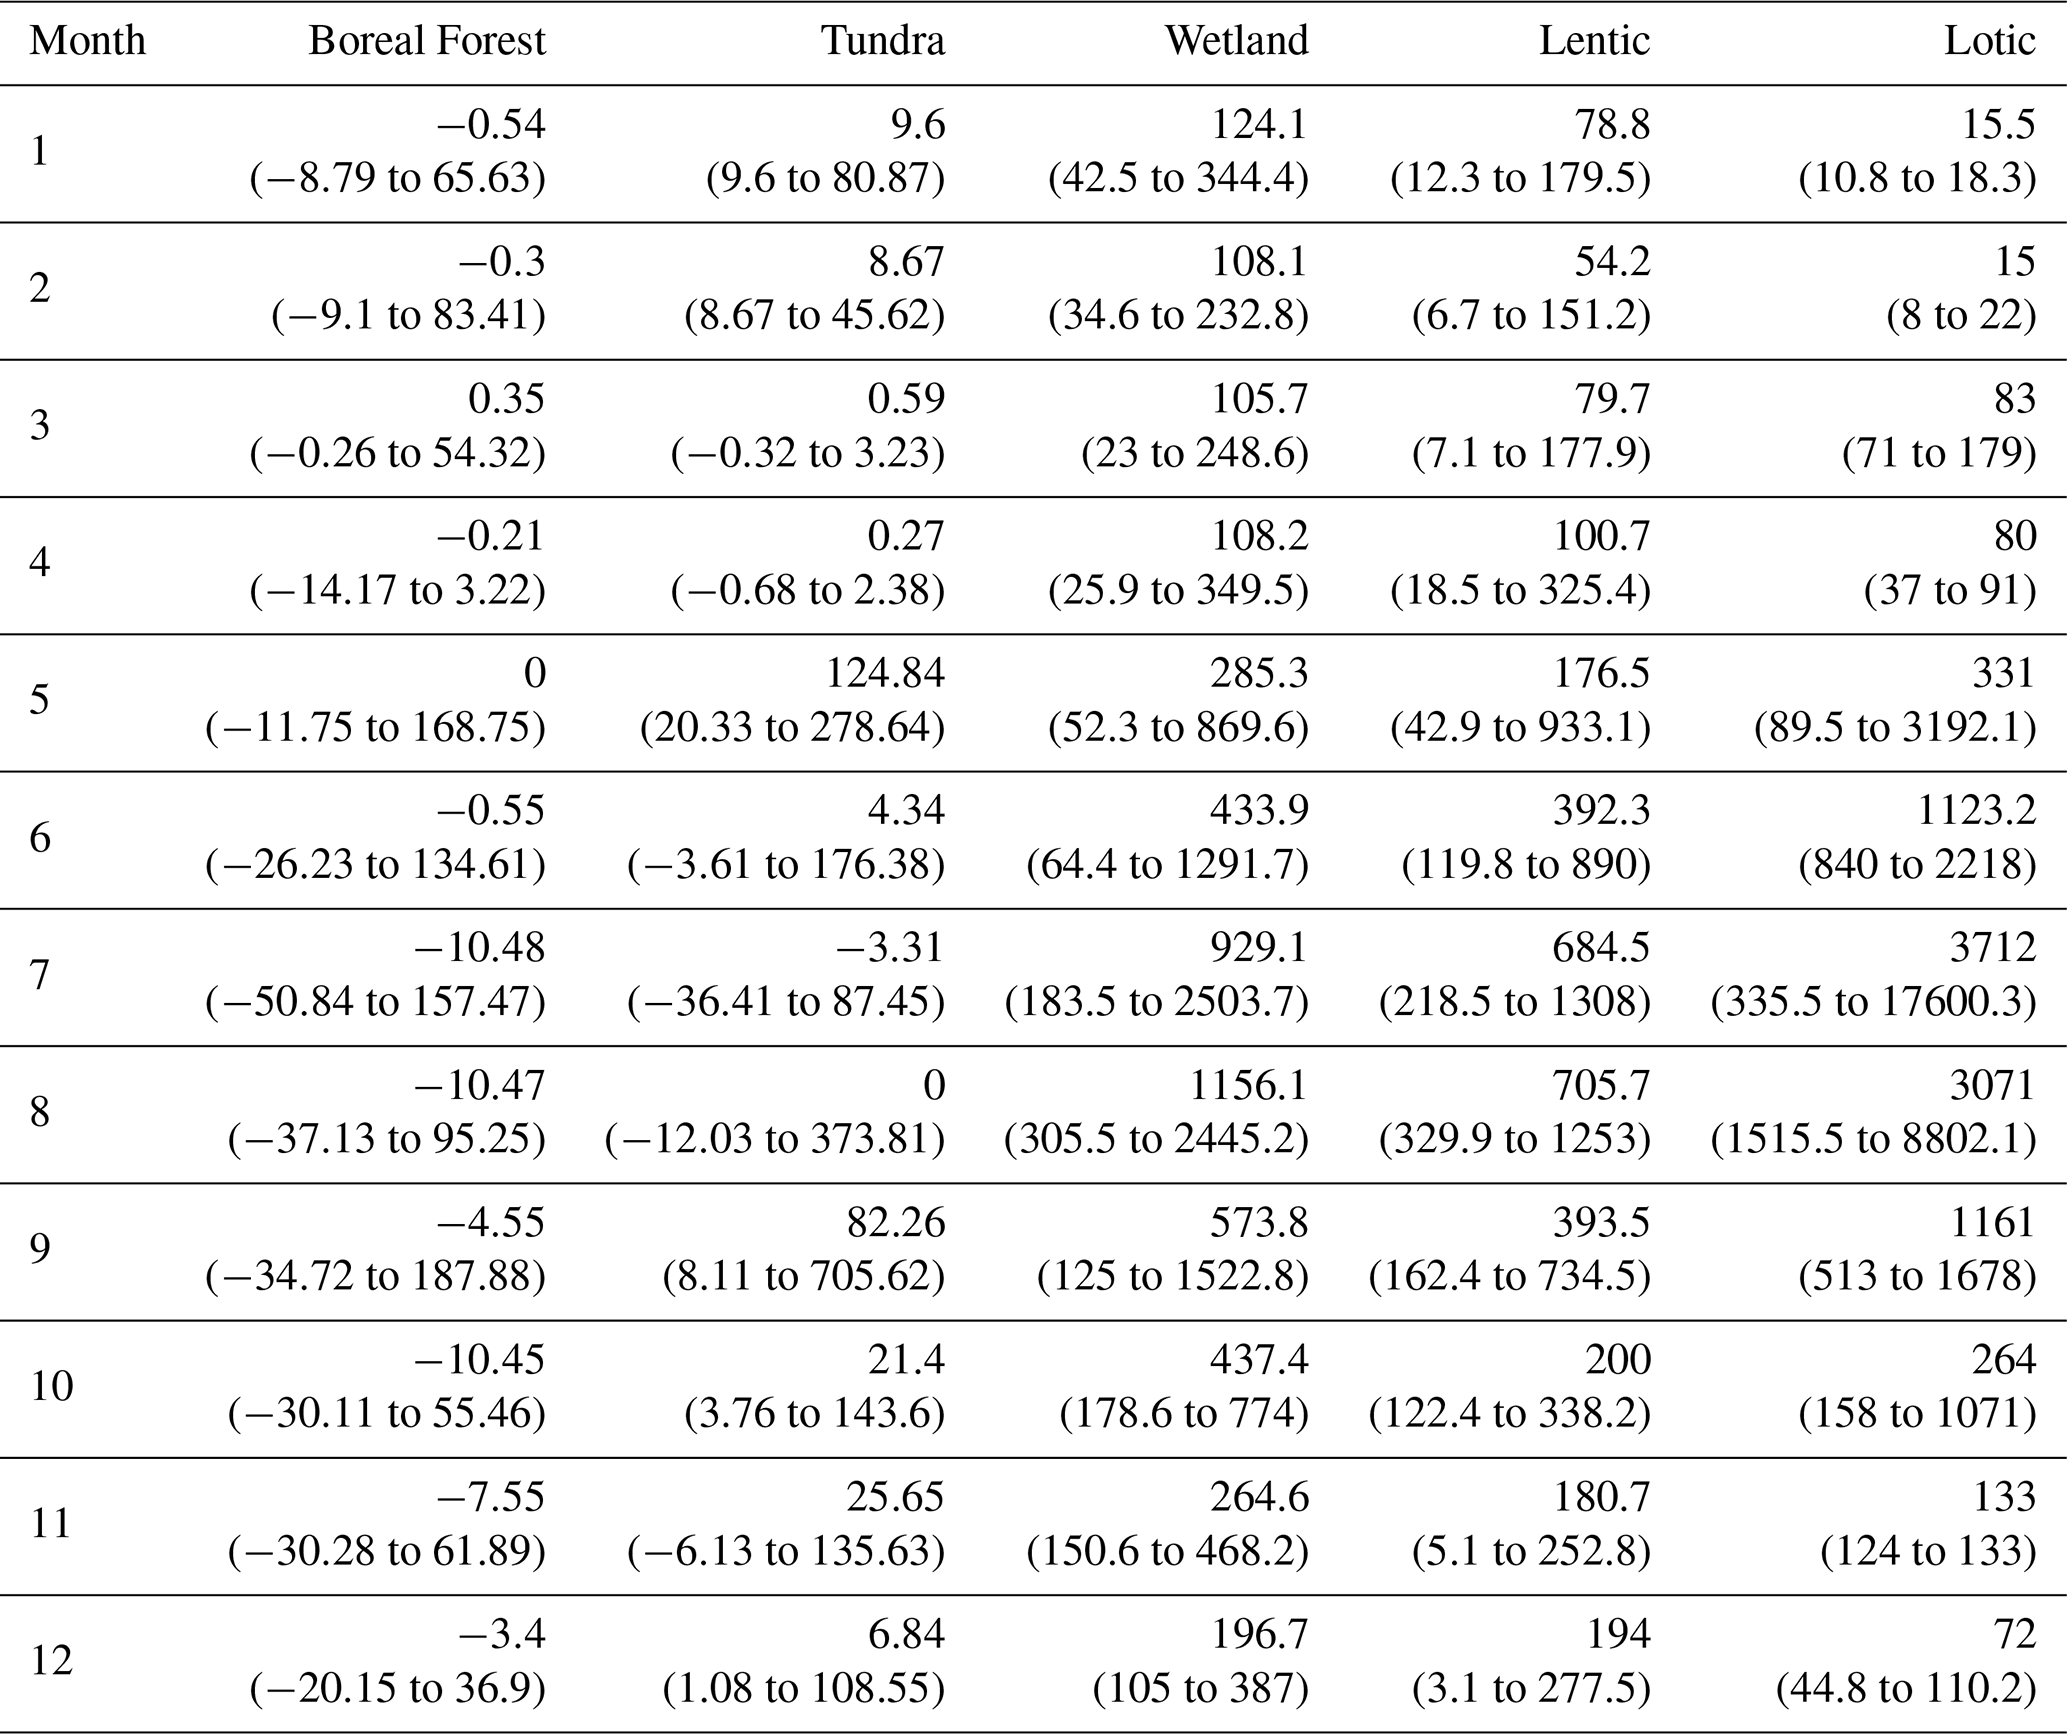
Monthly dissolved CO2 concentrations varied from 12.6 to 5588 µmol L−1 (2.5th–97.5th percentiles) and from 0 to 5480 µmol L−1 (min–max). Monthly median CO2 concentrations were generally highest in lotic ecosystems and followed a seasonal pattern of lower concentrations during the summer months (Fig. 9). Monthly CO2 concentrations for lentic systems were highest in spring, but these months also had the smallest sampling sizes. Monthly dissolved CH4 concentrations varied from 0 to 13.1 µmol L−1 (2.5th–97.5th percentiles) with a maximum concentration of 530 µmol L−1. Lotic ecosystems trended towards CH4 higher concentrations and there were no clear monthly patterns for either freshwater ecosystem.
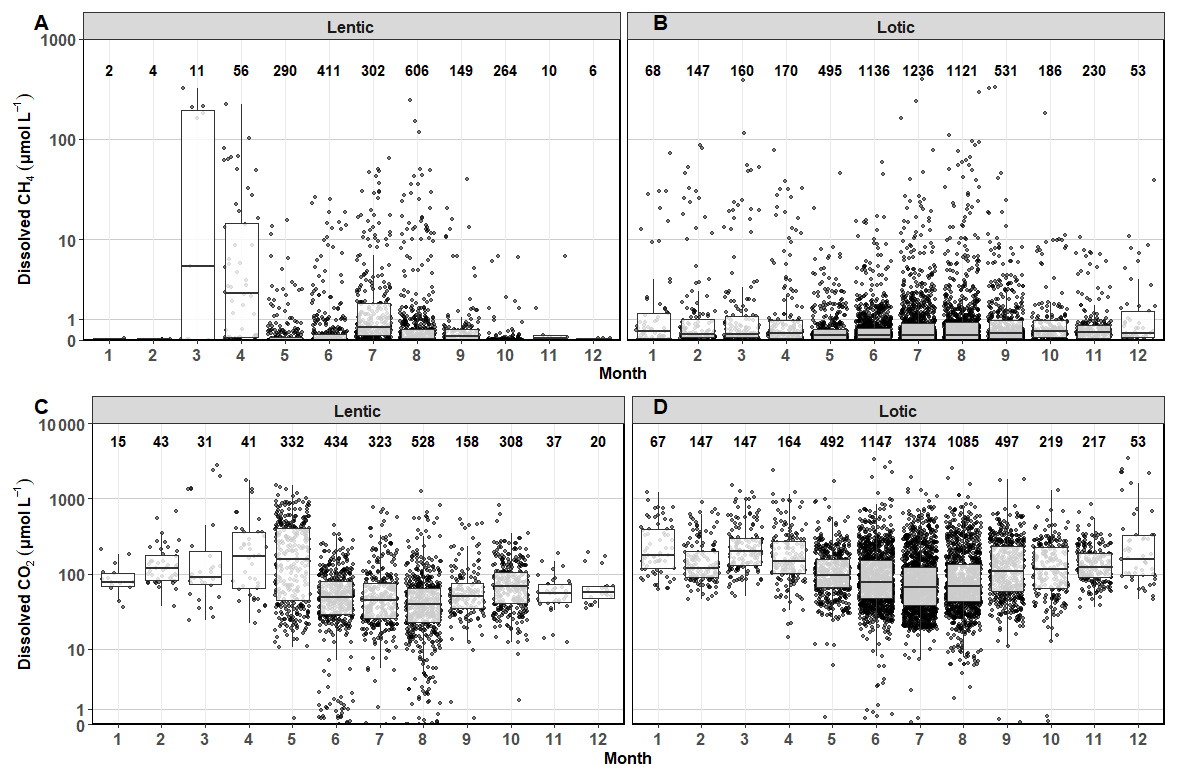
Figure 9Monthly dissolved CH4 and CO2 concentrations across freshwater classes together with the number of site-months. Note that y axes follow a pseudo-log scale.
7.2 Average annual fluxes
Our annual NEE estimates showed a clear sink-to-source transition from net CO2 sinks in wetlands (−34.0 g C m−2 yr−1) forests (−22.2 g C m−2 yr−1), and tundra (−10.7 g C m−2 yr−1) to CO2 sources in lentic (142 g C m−2 yr−1) and especially lotic ecosystems (1180 g C m−2 yr−1). However, the interquartile range for all three terrestrial classes included positive NEE estimates (Table 8). Annual CH4 fluxes demonstrated the largest median net CH4 source for wetlands (5.6 g C m−2 yr−1) followed by lentic waterbodies (3.1 g C m−2 yr−1), lotic waterbodies (2.4 g C m−2 yr−1) and then tundra (0.6 g C m−2 yr−1). Boreal ecosystems were near neutral (0.07 m2 yr−1), with an interquartile range between −0.26 and 1.53 g C m−2 yr−1). It is important to note that these figures are not upscaled estimates and therefore may not accurately reflect the overall sink–source status of the Arctic–boreal region. For example, many freshwater systems exhibit strong CO2 sink during the summer months (Fig. 8) and our approach using the median values for each ecosystem type likely masks this uptake signal and CH4 uptake in upland ecosystems. Furthermore, we provide only a simplified estimate of the contribution of ice-out emissions to total annual estimates for freshwater ecosystems.
Table 8Estimates of annual fluxes (g C m−2 yr−1) for each broadly defined ecosystem. Values represent the median annual emission estimate followed by first and third quartiles.
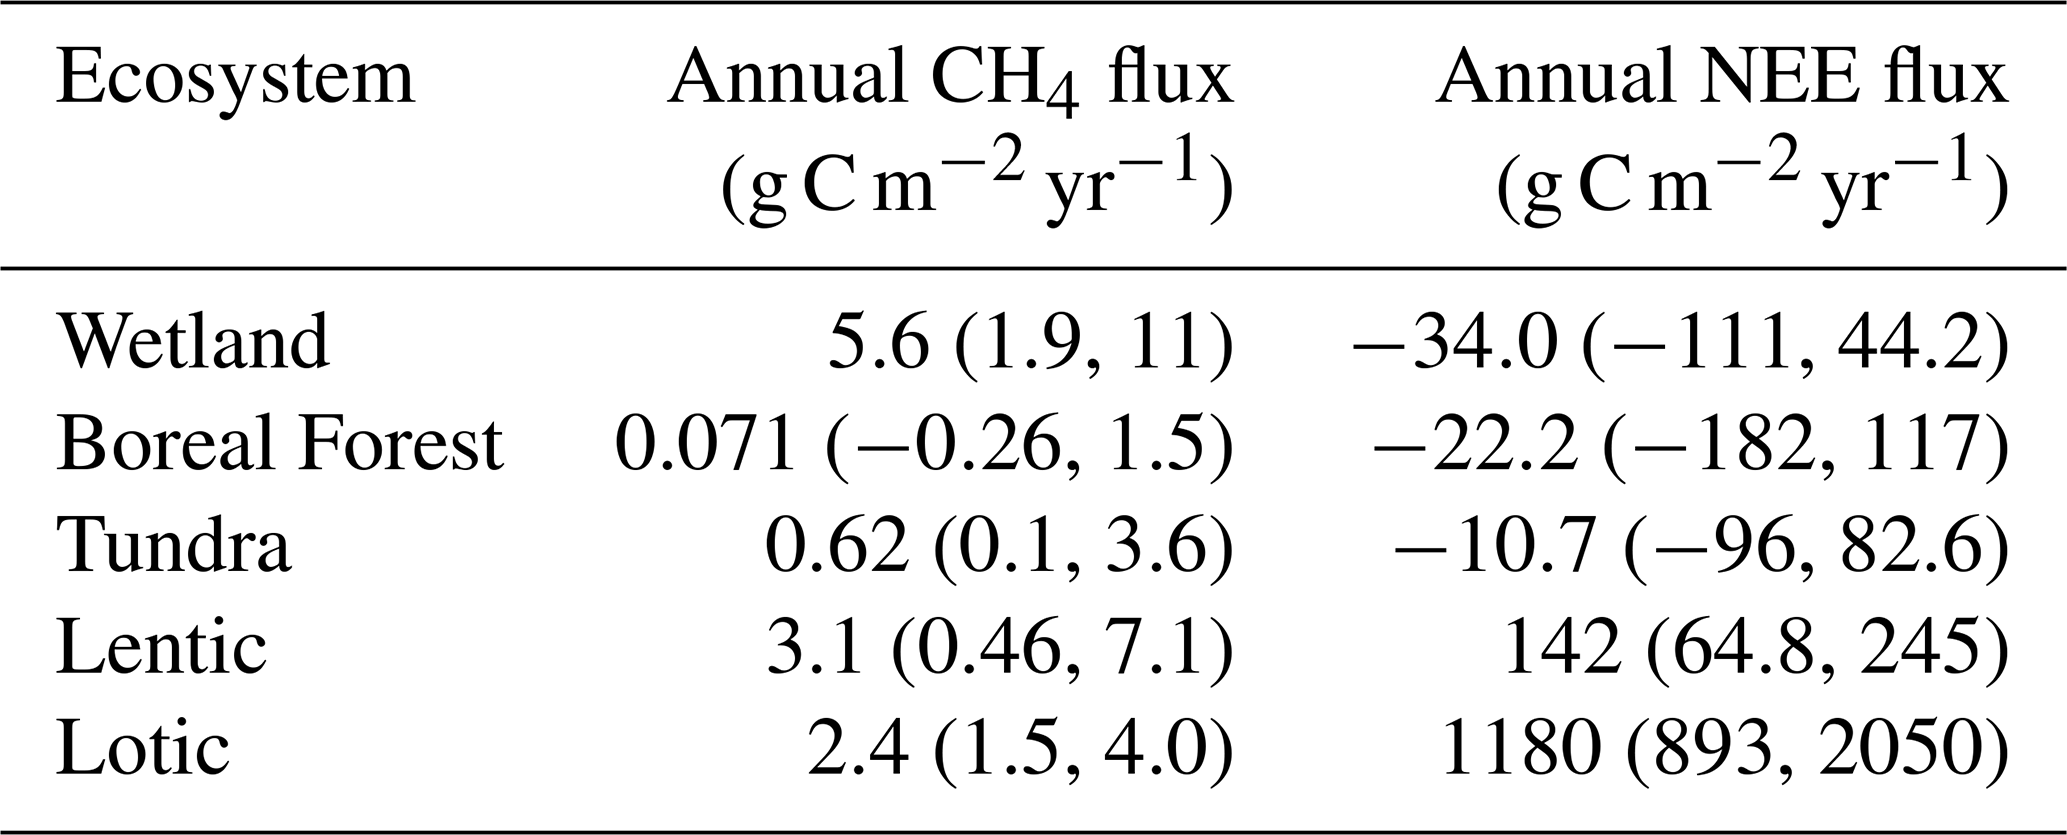
8.1 Future research directions
While a detailed analysis of the underlying mechanisms of flux patterns is beyond the scope of this data description paper, our data compilation offers several new perspectives and research opportunities. For example, ABCFlux v2 opens up for the opportunity to further investigate the detailed characterization of land cover types, waterbody classifications, and disturbance history and with that provides valuable context often overlooked in recent syntheses, which have typically employed coarse classifications (e.g., treating “boreal forest” as a single category, as seen in Virkkala et al., 2021 and Ramage et al., 2024 studies, or aquatic ecosystems split only across permafrost zones as in Song et al., 2024). With ABCFlux v2, it is possible to effectively detect temporal trends, including those in CH4 fluxes. The inclusion of both CO2 and CH4 fluxes also allows for further analysis of their ratios under changing environmental conditions. Moreover, the monthly format provides a clearer understanding of seasonal dynamics, offering an improvement over earlier studies that primarily focused on growing season or annual cumulative fluxes (Kuhn et al., 2021; Ramage et al., 2024; Virkkala et al., 2021). ABCFlux v2 further allows for an improved understanding of some under-studied flux dynamics. While summertime net CO2 uptake was previously found at individual sites (Emmerton et al., 2016; Prėskienis et al., 2021), a broader-scale analysis of the underlying conditions and the extent of CO2 uptake is worth undertaking. This points towards CO2 and CH4 sources playing a more complex role in regional carbon budgets than previously understood (Bogard et al., 2019; Tank et al., 2009). Lotic systems exhibit highly variable yet substantial per m2 emission rates that, according to our synthesis, appear higher than those of any other ecosystem type. However, the degree to which these elevated emissions occur across entire river networks remains uncertain, as does the influence of local (e.g., steep or shallow sections with high gas transfer velocities and emissions vs. flatter or deeper sections with lower emissions; (Natchimuthu et al., 2017) and circumpolar (e.g., climate gradients) drivers of variability. Importantly, the overall contribution of lotic systems to regional carbon budgets is constrained by their limited spatial extent – they occupy only about 0.5 % of the Arctic–boreal domain (Olefeldt et al., 2021). As a result, despite high per m2 fluxes, total emissions from rivers may be smaller than those from more widespread ecosystems such as wetlands, which have lower per m2 emissions but a much greater areal extent (Casas-Ruiz et al., 2023). Nevertheless, ABCFlux v2 offers a valuable opportunity to address these aquatic knowledge gaps.
Our dataset also shows distinctive patterns in the seasonal dynamics of CH4 exchange across different ecosystems. Particularly noteworthy is the contrast between non-wetland tundra and boreal forest systems: tundra areas function as net CH4 sinks in ABCFlux v2 for only a single month, while boreal forest ecosystems maintain CH4 uptake throughout the summer period as well as autumn period (Fig. 8).
8.2 Remaining gaps
ABCFlux v2 demonstrates clear improvements in carbon flux data quantity over time but also shows that some ecosystems (e.g., deciduous needleleaf forests, barren and sparsely vegetated ecosystems, large lentic ecosystems) or periods (non-growing season, and especially the challenging spring ice-off period in aquatic ecosystems) still remain poorly captured. Moreover, the studied sites are heavily clustered in a few regions in Alaska and Fennoscandia, therefore leaving significant spatial gaps in coverage in spite of the relatively high absolute number of locations. In particular, despite Russia's large land mass (close to 60 % of the domain), data from Russia only comprise 10.8 % of the dataset in terms of site-months and 15.3 % of sites in ABCFlux v2 (with similar representativeness among terrestrial and aquatic data), making this region a critical data gap. At local scales, flux data across lentic depth zones and throughout entire lotic networks are critically needed to better estimate spatially representative waterbody fluxes. Furthermore, most freshwater measurements were taken during daytime, leaving nighttime dynamics less constrained. To more reliably estimate the net ecosystem carbon balance, incorporating lateral fluxes into future studies would be a large benefit, especially in landscapes affected by permafrost thaw (Zolkos et al., 2022).
Additionally, some specific flux mechanisms and environmental controls remain undersampled. This is particularly true for ebullition, which only makes up 12 % of aquatic CH4 fluxes in the dataset but can account for up to 90 % of total aquatic CH4 emissions (Walter Anthony et al., 2010; Kuhn et al., 2021). Moreover, plant-mediated CH4 emissions in aquatic systems and CH4 fluxes from terrestrial trees are not explicitly partitioned in the dataset; instead, they are included as part of total fluxes measured primarily by eddy covariance. Improved partitioning of these flux pathways would enhance our understanding of the processes driving CH4 dynamics and help to better constrain landscape-scale carbon budgets (Gauci et al., 2024; Iwata et al., 2018; Juutinen et al., 2009; Kankaala et al., 2005; Kyzivat et al., 2022). Important site-level environmental data such as thaw depth, soil carbon stocks, river width, and comprehensive information on plant and microbial communities are partly or entirely missing, yet would provide valuable insights into the processes governing fluxes. Likewise, more detailed disturbance metrics and a stronger integration of disturbed sites into flux monitoring networks are needed to better capture the impacts of these changes on carbon fluxes and budgets.
Although we excluded chamber measurements for CO2 fluxes taken underneath the canopy of forests, as chambers do not capture the full ecosystem dynamics it is notable that these chamber measurements could be valuable end points and quality assessments when co-located with towers, providing a lower limit on respiration estimates. We did include below canopy chamber CH4 flux measurements under the assumption that CH4 fluxes from trees are negligible. However, recent evidence suggests that trees may play a globally significant role in CH4 uptake, even considering that CH4 uptake by trees decreases with increasing latitude and approaches zero in low mean annual temperatures (Gauci et al., 2024; Sundqvist et al., 2012). Furthermore, some studies suggest that boreal trees emit CH4 from tree stems (Klaus et al., 2024; Machacova et al., 2023; Vainio et al., 2022), suggesting more tree-based flux measurements are needed and should be incorporated into future synthesis efforts. Furthermore, given the low data coverage of 2 % for stable isotope CO2 and CH4 measurements among the aquatic data in ABCFlux v2, the lack of our understanding of emission pathways and sources becomes apparent. Therefore, increasing the number of observations across ecosystems would significantly improve the source attribution of emissions as well as our process understanding.
While long-term, year-round terrestrial CO2 flux sites have become more common, the need remains to expand the network to more aquatic and under-represented terrestrial sites where year-round measurements of both CO2 and CH4 fluxes are collected simultaneously. A larger number of sites measuring these fluxes throughout the year would also inform and improve wintertime process understanding. Long-term CH4 flux monitoring sites remain scarce, hindering our ability to detect temporal trends in CH4 emissions – despite their potentially critical role in a changing climate (Turetsky et al., 2020). Thus, maintaining existing sites and setting up new permanent CH4 flux sites is critical for accurate understanding on the changing carbon cycle in Arctic-boreal regions. The availability of recent, “real-time”, data remains challenging as often post-processing times can delay the release of the data. Improving the turn-around time and associated pipelines from data collection to availability will improve future synthesis and modeling efforts.
An additional notable data gap is the lack of information on nitrous oxide (N2O), another significant GHG that is currently absent from the ABCFlux v2 dataset, which primarily focuses on CO2 and CH4. This omission reflects a broader data gap, despite growing evidence that N2O emissions may become increasingly important for regional and global climate feedbacks as permafrost thaw accelerates (Voigt et al., 2017). As N2O has a global warming potential over 300 times that of CO2 over a 100-year timescale, even relatively small fluxes may significantly contribute to climate feedbacks. Incorporating N2O measurements in future efforts would be critical to achieving a more comprehensive understanding of GHG dynamics in the Arctic-boreal domain.
8.3 The importance of regional networks
While contributing data to global repositories remains highly encouraged, regional syntheses like this provide valuable insights into network status and development needs across the Arctic-boreal domain. In our case, it has helped in establishing a collaborative community that bridges terrestrial and aquatic researchers while integrating CO2 and CH4 flux data in a standardized format, creating a foundation for collectively improving Arctic-boreal carbon cycle understanding. Looking ahead, we strongly advocate for maintaining a community-driven approach in future flux syntheses, similar to earlier ABCFlux initiatives (See et al., 2024; Virkkala et al., 2022, 2025) and those supported by, for example, the Permafrost Carbon Network (Schuur et al., 2015, 2022). Including data contributors as co-authors not only ensures proper recognition of their contributions but also draws on their expertise in data interpretation. Moreover, there is potential for efforts like ABCFlux to gradually evolve into more dynamic, continuously updated resources. While not yet realized, the aspiration to create a database capable of integrating recent flux measurements and associated metadata remains important for enabling iterative updates (e.g. https://fluxnet.org/fluxnet-data-system/, last access: 6 January 2025) and the incorporation of new knowledge (see e.g., NOAA, 2025). Ultimately, such a collaborative and adaptive approach enhances both the technical quality and scientific context of carbon flux syntheses, helping to advance our understanding of high-latitude carbon dynamics in a rapidly changing environment.
ABCFlux v2 data is categorized into two usage tiers depending on the data source, as indicated in the “data_usage” column. Tier 1 data is open and free to use for scientific and educational purposes. In contrast, Tier 2 requires that data users give data producers the opportunity to collaborate and consult with them. However, it is recommended that all researchers reach out and collaborate with the dataset developers and relevant site data producers when using the dataset as a core component of their analysis. This encourages a more informed and context-rich use of the data.
If used, the dataset should be referenced by citing both this paper and the dataset (https://doi.org/10.3334/ORNLDAAC/2448, Virkkala et al., 2026).
The dataset associated with this publication can be found in ORNL DAAC at https://doi.org/10.3334/ORNLDAAC/2448 (Virkkala et al., 2026).
ABCFlux v2 provides the most comprehensive dataset of surface-atmosphere Arctic-boreal ecosystem CO2 and CH4 fluxes to date. It is particularly useful for machine learning or regression modeling for drivers of fluxes, process model tuning, remote sensing-based upscaling, and empirical studies aiming to understand carbon budgets and regional variability in flux magnitudes, as well as changes in fluxes through time.
The supplement related to this article is available online at https://doi.org/10.5194/essd-18-6357-2026-supplement.
The ABCFlux v2 dataset was conceptualized and developed by a team led by AMV, IW, JV, and MAK, supervised by BR, MG, and SN, and further supported by KA, KK, GRR, JW, DO, EAGS, DB, and ROK. IW, JV, MAK, AMV, SM, and TW compiled the data. AMV drafted and coordinated the manuscript in close collaboration with IW, MAK, JV, SN, BR, MG, KA, KK, GRR, JW, DO, EAGS, DB and ROK. Other authors contributed data to the ABCFlux v2 dataset and reviewed the manuscript. Data contributors whose data were extracted from publications are not coauthors in this paper, unless new data were provided.
The contact author has declared that none of the authors has any competing interests.
Publisher's note: Copernicus Publications remains neutral with regard to jurisdictional claims made in the text, published maps, institutional affiliations, or any other geographical representation in this paper. The authors bear the ultimate responsibility for providing appropriate place names. Views expressed in the text are those of the authors and do not necessarily reflect the views of the publisher.
We thank ICOS, Ameriflux, Fluxnet Canada and the Canadian Carbon Program (CCP), FLUXNET, and AsiaFlux networks for openly sharing data for our synthesis. We thank Christina Shintani for her work creating the maps shown in Figs. 1 and S8.
Adrian Rocha was funded by NSF# 2103539. Aino Korrensalo was funded by the Research Council of Finland, grant number 338980. Aki Vähä was funded by the Research Council of Finland (ICOS-FIRI and project no. 322432), ICOS-FI via University of Helsinki funding, and the EU Horizon Europe Framework Programme for Research and Innovation (GreenFeedback grant no. 101056921). Alan Barr acknowledges the support of our boreal flux sites from the Fluxnet Canada Research Network (FCRN), the Canadian Carbon Program (CCP), and the Changing Cold Regions Network (CCRN) research networks funded by the Natural Sciences and Engineering Research Council of Canada (NSERC). Aleksandr F. Sabrekov, Elena Lapshina, and Egor Dyukarev's work was part of the most important innovative project of national importance “Development of a system for ground-based and remote monitoring of carbon pools and greenhouse gas fluxes in the territory of the Russian Federation, ensuring the creation of recording data systems on the fluxes of climate-active substances and the carbon budget in forests and other terrestrial ecological systems” (registration no. 123030300031-6) and the IMCES SB RAS work was supported by the basic state project FWRG-2021-0001 (No. 121031300154-1). Aleksi Räsänen and Tarmo Virtanen was funded by the Research Council of Finland (grant number 308513). Alex Mavrovic and Alexandre Roy would like to warmly thank the Indigenous communities who have welcomed us and shared their territory with us in Iqaluktuuttiaq and Inuvik. AM and AR's dataset was acquired thanks to the contributions of the Natural Sciences and Engineering Research Council of Canada (NSERC), the Fonds de recherche du Quebec – Nature et technologies (FRQNT) and Polar Knowledge Canada (POLAR). Alexey V. Panov was funded by the State Assignment FWES-2024-0023. Amy Townsend-Small was funded by NSF: AON-1107607. Anatoly Prokushkin was funded by the State Assignment FWES-2024-0023. Anders Lindroth acknowledges the European Union, Formas, Swedish Research Council. Andreas Christen acknowledges support by the Canada Foundation for Innovation – IF 2015 (grant no. 33600), NSERC Discovery Grants Program (grant no. RGPIN-2017-03958), NSERC Discovery Grants – Northern Research Supplement (grant no. RGPNS-503529), and NSERC Discovery Grants Program – Accelerator Supplement (grant no. RGPAS-507854). Andreas Westergaard-Nielsen was funded by Villum foundation (project no. 42069) and the Danish Ministry of Climate, Energy and Utilities. Andrew Black and Warren Helgason are grateful for the support of our boreal flux sites from the Fluxnet Canada Research Network (FCRN), the Canadian Carbon Program (CCP), and the Changing Cold Regions Network (CCRN) research networks funded by the Natural Sciences and Engineering Research Council of Canada (NSERC). Anne Ojala acknowledges University of Helsinki for providing access to field stations as well making it possible to use the facilities with the help of highly skilled staff. Armando Sepulveda-Jauregui, Maialen Barret, and Frederic Thalasso acknowledge European project ERANET-LAC “METHANOBASE” ELAC2014-DCC-0092-A. Avni Malhotra was funded by NSERC Discovery grant, NSF REU, NASA Terrestrial Ecology Program (project 80NSSC22K1253). Ayumi Kotani acknowledges JSPS KAKENHI 19H05668, ArCS (JPMXD1300000000), ArCSII (JPMXD1420318865). Bo Elberling acknowledges the Danish National Research Foundation, Center for Permafrost, CENPERM DNRF100 (B.E). The work of Carl-Fredrik Johannesson, Jenni Nordén, Klaus Steenberg Larsen and Hanna Silvennoinen was in relation to the ForBioFunCtioN project, funded by the Research Council of Norway (grant number 303006 to JN). They are grateful to Esben Kirk Hansen and colleagues at Bymiljoetaten of the municipality of Oslo, and Holger Lange, PI at the ICOS-Norway site Hurdal, for granting us research permits and for providing help with practical issues concerning the field data collection. Carlo Trotta was funded by Horizon Europe (Copernicus Climate Change Service Evolution (CERISE)-project, 101082139). Carolina Voigt was funded by Canada Foundation for Innovation project Changing Arctic Network (CANet, grant no. 33661); the Canada Research Chairs Program (CRC-2018-00259 to Oliver Sonnentag); the European Research Council Starting Grant COLDSPOT (no. 101163177 to Carolina Voigt). Catherine Dieleman and Hailey Webb acknowledge the Bonanza Creek Long-Term Ecological Research Site. Cheristy P. Jones work was supported by the Department of Energy (DE-SC0023456), the EMERGE BII (NSF-DBI 2022070), the Swedish Polar Research Secretariat and SITES for the support of the work done at the Abisko Scientific Research Station (SRC 4.3-2021-00164), the FLUXNET Secondment Program, the Greenland Ecosystem Monitoring program for work done at the Kobbefjord Research Station, the University of New Hampshire CEPS First Year PhD Fellowship and the CARPE NRT Fellowship (NSF #2125868). Christina Biasi was supported by the Austrian Science Fund (FWF project PERNO; no. 10.55776/M3335) and the Academy of Finland through multiple projects, including N-PERM (no. 341348), NOCA (no. 314630), and the Yedoma-N project (no. 287469). Christopher D. Arp received funding from NSF: AON-1107607. Claire Treat, Lona van Delden, and Josh Hashemi acknowledge ERC StG FluxWIN 851181. Craig A. Emmerton acknowledges Natural Sciences and Engineering Research Council (NSERC; V.L.S.L. and C.A.E.). Danil V. Ilyasov and Anastasia Niyazova's work was supported by the Russian Science Foundation, project number 25-17-20042. Dario Papale thanks the support of the ITINERIS project (IR0000032) Funded by EU – Next Generation EU PNR. David Bastviken and associated data contributions were funded by the European Research Council (ERC H2020 grant 725546), the Swedish Research Councils VR (grant 2022-03841), and Formas (grant 2018-01794). Donatella Zona was funded by NSF award number 1932900, and 2149988. Edward A. G. Schuur was funded by: National Science Foundation Grant #2309467; Minderoo Foundation. Eeva-Stiina Tuittila acknowledges ACCC Flagship, ICOS-Finland, Research Council of Finland through project and infrastructure funding (grant numbers 337064 and 330840). Efrén López-Blanco, Rasmus Jensen, Torben R. Christensen, and Mikhail Mastepanov's work was supported by the Greenland Ecosystem Monitoring (g-e-m.dk) funded by the Danish Environmental Protection Agency and the Danish Energy Agency. ELB, TRC and MM consider this study a contribution to GreenFeedBack (Greenhouse gas fluxes and earth system feedbacks) funded by the European Union's HORIZON research and innovation program under grant agreement No. 101056921. Miquel A. Gonzalez-Meler and Elena Blanc-Betes acknowledge the Toolik Lake Field Station staff and the CH2MHill Polar Services for logistical support and their research was funded by the DOE, Terrestrial Ecosystem Science Program (DE-SC 0006607) while experimental site establishment and maintenance was funded by NSF Office of Polar Programs (Award numbers 9321730, 9617643, 0856728, 1504141). Elena Veretennikova acknowledges the Russian Academy of science in the framework of basic research – No. 121031300154-1. Eleonora Canfora was funded by Horizon Europe (Open-Earth-Monitor Cyberinfrastructure project, 101059548). Elisa Männistö acknowledges the ACCC Flagship, ICOS-Finland, Research Council of Finland through project and infrastructure funding (grant numbers 337064 and 330840). Emily H. Stanley acknowledges that the assembly of GRiMeDB was supported by the US National Science Foundation (grant no. DEB-2025982, NTL LTER), the Canada Research Chair program, the Swedish Research Council (Vetenskapsradet) (grant nos. 2021-06667 and 2021-04058), and Svenska Forskningsradet Formas (grant no. 2019-01105). Erik Lundin acknowledges the Abisko Scientific Research Station & ICOS SE, funded by the Swedish Research Council (SRC) and the consortium partners since 2010. Erik Sahlée's and Anna Rutgersson's work was sponsored by the Swedish research council FORMAS project number: 2009-1692. Eugenie Euskirchen was funded by NSF Grants DEB LTREB 1354370 and 2011257, DEB-0425328, DEB-0724514, and DEB-0830997 as well as US Geological Survey Climate R&D program. Fenix Garcia Tigreros was funded by NASA ABoVE Project 80NSSC19M0104 and the US Geological Survey Biological Carbon Sequestration Program. Francois Clayer's work was supported by NIVA core funding (Research Council of Norway, contract #342628/L10) Global Change at Northern Latitudes and GreenSense projects, as well as the BIOGOV project (Research Council of Norway, project #323945). Frans-Jan W. Parmentier was supported by the research council of Norway (project nos. 323945 and 352260). Frédéric Bouchard was funded by and acknowledges the Natural Sciences and Engineering Research Council (NSERC), the Polar Continental Shelf Program (PCSP), and the W. Garfield Weston Foundation. Geert Hensgens and Jorien Vonk were supported by the Netherlands Earth Science System Centre (NESSC), which was funded by the Dutch Ministry of Education, Culture and Science (OCW) (grant no. 024.002.001). George W. Kling's work was supported by grants from US NSF AON 1936769, DEB 2224743. Gerard Rocher-Ros was funded by the European Union (ERC, ARIMETH, 1011 61308). Views and opinions expressed are however those of the author(s) only and do not necessarily reflect those of the European Union or the European Research Council. Neither the European Union nor the granting authority can be held responsible for them. Greg Henry acknowledges the Natural Sciences and Engineering Research Council of Canada, Polar Continental Shelf Project, Canada Foundation for Innovation. Hanna Lee acknowledges the Horizon Europe project (IM4CA: 101183460). Hannu Nykanen's work was funded by the European Union contract (ENV4-CT97-0583) – CONGAS project and TUNDRA (ENV4-CT97-0522), and the Arctica projects was funded by the Academy of Finland. Hannu Nykanen acknowledges Kevo Subarctic Research Institute at Utsjoki for logistic support during the field work. Helena Rautakoski was funded by the European Union – NextGenerationEU instrument and from the Research Council of Finland (grant no. 337552, 347794, 324259). Henrique Oliveira Sawakuchi acknowledges that this project has received funding from the European Research Council under the European Union's Horizon 2020 research and innovation program (Grant Agreement No. 725546), the Knut and Alice Wallenberg Foundation (Grant 2016.0083), the Knut and Alice Wallenberg Foundation (Wallenberg Academy Fellowship) to DS, the Swedish Research Council (Grant 2016-04829), and FORMAS (the Swedish Research Council for Sustainable Development (Grant 2018-01794). Henrique Oliveira Sawakuchi thanks Shun Koizumi, Isolde Puts, and Hendricus Verheijen (Umea University) for help measuring oxygen and temperature profiles, and Erik Geibrink (Umea University) for his help setting up the experiment. Hideki Kobayashi was funded by JSPS JP25H00454, ArCS-3. Housen Chu acknowledges that AmeriFlux data were made available through the data portal and processing maintained by the AmeriFlux Management Project, supported by the US Department of Energy Office of Science, Office of Biological and Environmental Research, under contract number DE-AC02-05CH11231. Isabelle Laurion acknowledges the Network of Centres of Excellence program ArcticNet, Fonds quebecois de la recherche sur la nature et les technologies (today: Fonds de recherche du Quebec – Nature et technologies, FRQNT), Natural Sciences and Engineering Research Council of Canada (CRSNG), Natural Resources Canada Polar Continental Shelf Program, International Polar Year, CREATE program EnviroNorth, W. Garfield Weston Foundation, Indian and Northern Affairs Canada (NSTP program of Canadian Gov, today: managed by Polar Knowledge Canada), Center for Northern Studies, Parks Canada. Ivan Mammarella acknowledges financial support from Research Council of Finland (NPERM project no. 341349, ICOS-FIRI), ICOS-FI via University of Helsinki funding, EU-INTERACT, the EU Horizon Europe ± Framework Programme for Research and Innovation (GreenFeedback no. 101056921 and LiweFor no. 101079192). Jacqueline Knutson was supported by NIVA core funding (Research Council of Norway, contract #342628/L10) Global Change at Northern Latitudes and GreenSense projects, as well as the BIOGOV project (Research Council of Norway, project #323945). Järvi Järveoja acknowledges Formas (grant no. 2021-00611). Jeffrey M. Welker was funded by NSF Arctic System Science & Arctic Observing Network proposals 9321730, 9617643, 0856728, 1504141, 1836873 and JMW's UArctic Research Chairship. Ji Young Jung acknowledges RS-2025-24683148 (KOPRI-PN26010). Jo Snöälv acknowledges Stockholm University and Abisko Scientific Research Station (ANS). Joachim Jansen acknowledges The Abisko Scientific Research Station (ANS) and the Swedish Polar Research Secretariat. John Kochendorfer's work was supported by NSF grant 1203583. Jukka Pumpanen was funded by the Research Council of Finland (project number 286685). Julia Kelly's research was funded by the Swedish Research Council FORMAS grant 2018-02700 and the Swedish Research Council FORMAS grant 2019-00836, the Crafoord foundation grant 20190763, Skogssallskapet Stina Werner Fond grant 2021-094, the Royal Physiographic Society of Lund and the Swedish government through the Strategic Research Areas BECC (Biodiversity and Ecosystem Services in a Changing Climate) and MERGE (ModElling the Regional and Global Earth system). Julie Talbot and Daniel F. Nadeau's research was funded by the Natural Sciences and Engineering Research Council of Canada (NSERC) through Grant RDCPJ508080-16 entitled “Observation and modelling of net evaporation from a boreal hydroelectric complex (water footprint)”. Juliya Kurbatova's study was done with the support of the state assignment of IPEE RAS (Theme No. 1022033100172-2-1.6.19). June Skeeter would like to thank the staff at the Aurora Research Institute in Inuvik for providing logistical support (especially Edwin Amos, for the local expertise and invaluable assistance he provided in the field), Rick Ketler for helping to design and install the floating EC system, and the Polar Continental Shelf Program, Natural Resources Canada for additional logistical support. June Skeeter also acknowledges support by the Canada Foundation for Innovation – IF 2015 (grant no. 33600), NSERC Discovery Grants Program (grant no. RGPIN-2017-03958), NSERC Discovery Grants – Northern Research Supplement (grant no. RGPNS-503529), and NSERC Discovery Grants Program – Accelerator Supplement (grant no. RGPAS-507854). Kajar Koster was supported by the Research Council of Finland (Project Nos. 286685, 294600, 307222) and the Kone Foundation. Karel Castro-Morales' project, PROPERAQUA, was funded by the Deutsche Forschungsgemeinschaft (DFG, German Research Foundation) Project No. 396657413. Katey Walter Anthony was supported by NSF NNA 2022577 and a gift from Tito's Handmade Vodka. Katrin Attermeyer and Pascal Bodmer thank the EuroRun team. Kuno Kasak was supported by the Estonian Research Council grant no. PSG714 and by the Estonian Ministry of Education and Research, Center of Excellence for Sustainable Land Use (FutureScapes, TK232). Kyra St. Pierre acknowledges the Danish National Research Foundation, Natural Sciences and Engineering Research Council, Canadian Initiative for Nordic Studies. Lance Lesack was funded by NSERC (Discovery Grant and Northern Research Supplement programs to Lesack), the Polar Continental Shelf Project (helicopter support to Lesack), and from the Northern Scientific Training Program, Polar Knowledge Canada. Logistical, technical, and financial support has been provided by the Aurora Research Institute (Western Arctic Research Centre). Lance Lesack's published data remains the joint intellectual property of his publication co-authors and Simon Fraser University (SFU). SFU's Summit repository is being used to comply with NSERC's open access publication and data policy. Lea Cabrol acknowledges Millennium Science Initiative Program ICN2021_002 (Millenium Institute BASE) from the Chilean National Agency of Research and Innovation, ANID European project ERANET-LAC “METHANOBASE” ELAC2014-DCC-0092-A. Macall Hock was funded by NSF award number 1932900. Maija E. Marushchak was financed by the EU 6th Framework Programme project CARBO-North (no. 036993) and Research Council of Finland project Thaw-N (no. 349503). Manuel Helbig and Janna Heerah acknowledge support through the Natural Sciences and Engineering Research Council of Canada (NSERC) Grant ALLRP 561142-20. Marcin Antoni Jackowicz-Korczynski acknowledges the Greenland Ecosystem Monitoring (GEM) program and the Integrated Carbon Observing System (ICOS) as funded by the Danish Ministry of Climate, Energy and Utilities. Margaret Torn's work on US-NGB and US-NGC was part of The Next-Generation Ecosystem Experiments (NGEE) Arctic project supported by the Office of Biological and Environmental Research in the Department of Energy Office of Science. Mariasilvia Giamberini and Marta Magnani acknowledge Italian National Research Council (CNR), CNR-DSSTA and CNR-ISP for the logistics in the Ny Ålesund research base. Masahito Ueyama acknowledges the Arctic Challenge for Sustainability II (ArCS II; JPMXD1420318865) and ArCS III (JPMXD1720251001). Mats P. Björkman acknowledges the European Union's Horizon 2020 research and innovation program under the Marie Sklodowska-Curie (657627), FORMAS – Swedish Research Council for Sustainable Development (2016-01187 and 2022-00786), the Swedish research council (2021-04011), and the strategic research environment BECC – Biodiversity and Ecosystem services in a Changing Climate. Matthias Peichl, Mats B. Nilsson, Koffi Dodji Noumonvi, and Järvi Järveoja acknowledge funding from the Swedish Research Council (VR, grant no. 2018-03966 and 2019-04676), the Kempe Foundation (grant no. JCK-1712, JCSMK23-0221) and support from the Swedish Infrastructure for Ecosystem Science (SITES) and the Swedish Integrated Carbon Observation System (ICOS-Sweden). Mika Aurela, Mika Korkiakoski, and Annalea Lohila's work was financially supported by the Ministry of Transport and Communications through the Integrated Carbon Observing System (ICOS) research and the ACCC flagship funded by the Academy of Finland (grant no. 337552). Mikhail V. Glagolev's study was conducted under the state assignment of Lomonosov Moscow State University. Namyi Chae was supported by the NRF-RS-2025-24683148. Natascha Kljun's research was funded by the Swedish Research Council FORMAS grant 2018-02700 and the Swedish Research Council FORMAS grant 2019-00836, the Crafoord foundation grant 20190763, Skogssallskapet Stina Werner Fond grant 2021-094, the Royal Physiographic Society of Lund and the Swedish government through the Strategic Research Areas BECC (Biodiversity and Ecosystem Services in a Changing Climate) and MERGE (ModElling the Regional and Global Earth system). Nigel Roulet acknowledges NSERC Discovery. Norbert Pirk was supported by the European Research Council (project #101116083), the Norwegian Research Council (project #323945), the Norwegian Environment Agency, and the strategic research initiative LATICE (#UiO/GEO103920). Oliver Sonnentag acknowledges infrastructure funding from the Canada Foundation for Innovation project Changing Arctic Network (CANet, grant no. 33661, awarded to P.M.), and further financial support through the Canada Research Chair (CRC-2018-00259) and NSERC Discovery Grants programs (DGPIN-2018-05743), ArcticNet, a Network of Centres of Excellence Canada (grant no. P216), the Canada First Research Excellence Fund's Global Water Futures program (Northern Water Futures), and the Polar Continental Shelf Program. Patrick Crill was funded by Vetenskaprådet (Swedish Research Council), Stockholm University, USNSF, USDOE and assisted by Swedish Polar Research. Pierre Taillardat was funded by the Natural Sciences and Engineering Research Council of Canada and Hydro-Quebec to Michelle Garneau (RDCPJ 514218-17). Pirkko Kortelainen acknowledges the Finnish Environment Institute. Praveena Krishnan was supported by an NSF grant 1848694 Qinxue Wang acknowledges monitoring systems were supported by ERTDF (2E-1203), Ministry of the Environment Government of Japan. Riikka Rinnan acknowledges that Abisko Stordalen birch forest data collection was funded by Danish National Research Foundation (grant No. DNRF168), European Research Council (grant No. 771012), and Independent Research Fund Denmark (grant No.. 1026-00127B). Robert Wagner was funded by the NSF Office of Polar Programs (award number 1204263) with additional logistical support funded by the Carbon in Arctic Reservoirs Vulnerability Experiment (CARVE), an Earth Ventures (EV-1) investigation, under contract with the National Aeronautics and Space Administration (NASA) and acknowledges this research was conducted on land owned by the Ukpeagvik Inupiat Corporation (UIC). Roger Seco acknowledges a Ramon y Cajal Grant (RYC2020-029216-I) funded by MICIU/AEI/10.13039/501100011033 and by “ESF Investing in your future”, and project PID2021-122892NA-I00 funded by MICIU/AEI and by “ERDF A way of making Europe”. Sang-Jong Park acknowledges RS-2025-24683148 (KOPRI-PN26010; S.-J.P.). Sari Juutinen was funded by the Research Council of Finland. Scott J. Davidson's work at Barrow-BEO, Barrow-BES, Atqasuk and Ivotuk sites was funded by the Office of Polar Programs of the National Science Foundation (NSF) awarded to Donatella Zona (award number 1204263) and Carbon in Arctic Reservoirs Vulnerability Experiment (CARVE), an Earth Ventures (EV-1) investigation, under contract with the National Aeronautics and Space Administration, and a Royal Society International Exchange awarded to Donatella Zona (2013/R1), and a NERC Arctic Research Programme, CYCLOPS Grant (NE/K00025X/1) to Gareth K. Phoenix. This research was conducted on land owned by the Ukpeagvik Inupiat Corporation (UIC) and the Arctic Slope Regional Corporation (ASRC). For Scott J. Davidson's work at Poplar Fen, IPAD and Carmon Creek sites he would like to acknowledge that this research takes place within the boundaries of Treaty 8, traditional lands of the Dene and Cree, as well as the traditional lands of the Metis of northern Alberta. The University of Waterloo is located on the traditional territory of the Neutral, Anishnaabeg, and Haudenosaunee Peoples. The University of Waterloo is situated on the Haldimand Tract, land promised to Six Nations, which includes six miles on each side of the Grand River. Scott J. Davidson's research is part of the Boreal Ecosystem Recovery and Assessment (BERA) project, and was supported by the Natural Sciences and Engineering Research Council of Canada Alliance Grant (ALLRP 548285 – 19) awarded to Maria Strack in conjunction with Alberta-Pacific Forest Industries Inc., Canadian Natural Resources Ltd., Cenovus Energy, ConocoPhillips Canada Resources Corp., Imperial Oil Resources Ltd., Canadian Forest Service's Northern Forestry Centre, and Alberta Biodiversity Monitoring Institute. Sean Carey thanks Gordon Drewitt for initial data processing, Michael Treberg for instrument maintenance and calibration and Tyler de Jong, David Barrett and Rosy Tutton for field assistance and acknowledges the continued support of the Water Resources Branch, Government of Yukon, for the operation of Wolf Creek Research Basin. Sean Carey was funded by the National Science and Engineering Council of Canada through Discovery Grants and the Global Water Futures Program. Sigrid Dengel acknowledges the work on US-NGB and US-NGC was part of The Next-Generation Ecosystem Experiments (NGEE) Arctic project supported by the Office of Biological and Environmental Research in the Department of Energy Office of Science. Sofie Sjogersten acknowledges the University of Nottingham Faculty of Science Pump-Prime Research Accelerator Fund and is grateful for the fieldwork support from Mattias Dalkvist, Veronica Escubar Ruiz and staff at the Abisko Scientific Research Station. Sujan Pal and Ryan Sullivan acknowledge observations from the Atmospheric Radiation Measurement (ARM) user facility are supported by the US Department of Energy Office of Science user facility managed by the Biological and Environmental Research Program. Work at Argonne National Laboratory was supported by the US Department of Energy, Office of Science, Office of Biological and Environmental Research, under contract DEAC0206CH11357. Suzanne E. Tank acknowledges financial support from the Natural Sciences and Engineering Research Council of Canada to SET, POLAR Knowledge Canada (Taiga Plains and Taiga Shield data) and Polar Continental Shelf Program (Peel Plateau data). Tetsuya Hiyama was funded by the Grants-in-Aid for Scientific Research (Grant Numbers JP19H05668 and JP25H00507) of the Japan Society for the Promotion of Science (JSPS). Tim Papakyriakou was funded by the Natural Sciences and Engineering Research Council of Canada to TNP. Timo Vesala acknowledges University of Helsinki for providing access to field stations as well, making it possible to use the facilities with the help of highly skilled staff. Trofim Maximov and Roman Petrov's work was carried out within the framework of the state assignment of the Ministry of Education and Science of Russia under the project “Study of biogeochemical cycles and adaptive reactions of plants of boreal and arctic ecosystems of the north-east of Russia”, state registration number AAAA-A21-121012190034-2. Tuula Larmola acknowledges the Research Council of Finland. Vincent E. J. Jassey and Anna Sytiuk were supported by the MIXOPEAT project (Grant No. ANR-17-CE01-0007 to VEJJ) and thank the Swedish Polar Research Secretariat and SITES for the support of the work done at the Abisko Scientific Research Station. SITES is supported by the Swedish Research Council's grant 4.3-2021-00164. Vincent L. St. Louis acknowledges Natural Sciences and Engineering Research Council (NSERC; V.L.S.L. and C.A.E.). Walter Oechel was funded by NOAA/EPP Grant # NA16SEC4810008. Ruth Varner was funded National Science Foundation grant EAR-1063037 EF-1241037 and DBI-2022070, National Aeronautics and Space Administration grant NNX17AK10G, Department of Energy grants DE-SC0016440 and DE-SC0023456, and Swedish Research Council Vetenskapsrådet grant 2019-05764.
This research has been supported by the TED (Audacious Project – Permafrost Pathways), the Gordon and Betty Moore Foundation (grant no. 8414), the European Research Council, H2020 European Research Council (grant no. 951288, Q-Arctic), the HORIZON EUROPE Climate, Energy and Mobility (grant no. 101056921, GreenFeedBack), and the Natural Sciences and Engineering Research Council of Canada (grant no. DGECR-2025-00337).
This paper was edited by Bo Zheng and reviewed by two anonymous referees.
Arndt, K. A., Hashemi, J., Natali, S. M., Schiferl, L. D., and Virkkala, A.-M.: Recent Advances and Challenges in Monitoring and Modeling Non-Growing Season Carbon Dioxide Fluxes from the Arctic Boreal Zone, Curr. Clim. Change Rep., 9, 27–40, https://doi.org/10.1007/s40641-023-00190-4, 2023.
Attermeyer, K., Casas-Ruiz, J. P., Fuss, T., Pastor, A., Cauvy-Fraunié, S., Sheath, D., Nydahl, A. C., Doretto, A., Portela, A. P., Doyle, B. C., Simov, N., Gutmann Roberts, C., Niedrist, G. H., Timoner, X., Evtimova, V., Barral-Fraga, L., Bašić, T., Audet, J., Deininger, A., Busst, G., Fenoglio, S., Catalán, N., de Eyto, E., Pilotto, F., Mor, J.-R., Monteiro, J., Fletcher, D., Noss, C., Colls, M., Nagler, M., Liu, L., Romero González-Quijano, C., Romero, F., Pansch, N., Ledesma, J. L. J., Pegg, J., Klaus, M., Freixa, A., Herrero Ortega, S., Mendoza-Lera, C., Bednařík, A., Fonvielle, J. A., Gilbert, P. J., Kenderov, L. A., Rulík, M., and Bodmer, P.: Carbon dioxide fluxes increase from day to night across European streams, Commun. Earth Environ., 2, 1–8, https://doi.org/10.1038/s43247-021-00192-w, 2021.
Baldocchi, D., Chu, H., and Reichstein, M.: Inter-annual variability of net and gross ecosystem carbon fluxes: A review, Agr. Forest Meteorol., 249, 520–533, https://doi.org/10.1016/j.agrformet.2017.05.015, 2018.
Bastviken, D., Cole, J., Pace, M., and Tranvik, L.: Methane emissions from lakes: Dependence of lake characteristics, two regional assessments, and a global estimate: Lake methane emissions, Global Biogeochem. Cy., 18, https://doi.org/10.1029/2004gb002238, 2004.
Battin, T. J., Lauerwald, R., Bernhardt, E. S., Bertuzzo, E., Gener, L. G., Hall Jr., R. O., Hotchkiss, E. R., Maavara, T., Pavelsky, T. M., Ran, L., Raymond, P., Rosentreter, J. A., and Regnier, P.: River ecosystem metabolism and carbon biogeochemistry in a changing world, Nature, 613, 449–459, https://doi.org/10.1038/s41586-022-05500-8, 2023.
Belshe, E. F., Schuur, E. A. G., and Bolker, B. M.: Tundra ecosystems observed to be CO2 sources due to differential amplification of the carbon cycle, Ecol. Lett., 16, 1307–1315, https://doi.org/10.1111/ele.12164, 2013.
Berner, L. T. and Goetz, S. J.: Satellite observations document trends consistent with a boreal forest biome shift, Global Change Biol., 28, 3275–3292, https://doi.org/10.1111/gcb.16121, 2022.
Biskaborn, B. K., Smith, S. L., Noetzli, J., Matthes, H., Vieira, G., Streletskiy, D. A., Schoeneich, P., Romanovsky, V. E., Lewkowicz, A. G., Abramov, A., Allard, M., Boike, J., Cable, W. L., Christiansen, H. H., Delaloye, R., Diekmann, B., Drozdov, D., Etzelmüller, B., Grosse, G., Guglielmin, M., Ingeman-Nielsen, T., Isaksen, K., Ishikawa, M., Johansson, M., Johannsson, H., Joo, A., Kaverin, D., Kholodov, A., Konstantinov, P., Kröger, T., Lambiel, C., Lanckman, J.-P., Luo, D., Malkova, G., Meiklejohn, I., Moskalenko, N., Oliva, M., Phillips, M., Ramos, M., Sannel, A. B. K., Sergeev, D., Seybold, C., Skryabin, P., Vasiliev, A., Wu, Q., Yoshikawa, K., Zheleznyak, M., and Lantuit, H.: Permafrost is warming at a global scale, Nat. Commun., 10, 264, https://doi.org/10.1038/s41467-018-08240-4, 2019.
Bogard, M. J., Kuhn, C. D., Johnston, S. E., Striegl, R. G., Holtgrieve, G. W., Dornblaser, M. M., Spencer, R. G. M., Wickland, K. P., and Butman, D. E.: Negligible cycling of terrestrial carbon in many lakes of the arid circumpolar landscape, Nat. Geosci., 12, 180–185, https://doi.org/10.1038/s41561-019-0299-5, 2019.
Casas-Ruiz, J. P., Bodmer, P., Bona, K. A., Butman, D., Couturier, M., Emilson, E. J. S., Finlay, K., Genet, H., Hayes, D., Karlsson, J., Paré, D., Peng, C., Striegl, R., Webb, J., Wei, X., Ziegler, S. E., and Del Giorgio, P. A.: Integrating terrestrial and aquatic ecosystems to constrain estimates of land-atmosphere carbon exchange, Nat. Commun., 14, 1571, https://doi.org/10.1038/s41467-023-37232-2, 2023.
Chen, B., Coops, N. C., Fu, D., Margolis, H. A., Amiro, B. D., Black, T. A., Arain, M. A., Barr, A. G., Bourque, C. P.-A., Flanagan, L. B., Lafleur, P. M., McCaughey, J. H., and Wofsy, S. C.: Characterizing spatial representativeness of flux tower eddy-covariance measurements across the Canadian Carbon Program Network using remote sensing and footprint analysis, Remote Sens. Environ., 124, 742–755, https://doi.org/10.1016/j.rse.2012.06.007, 2012.
Chu, H., Christianson, D. S., Cheah, Y.-W., Pastorello, G., O'Brien, F., Geden, J., Ngo, S.-T., Hollowgrass, R., Leibowitz, K., Beekwilder, N. F., Sandesh, M., Dengel, S., Chan, S. W., Santos, A., Delwiche, K., Yi, K., Buechner, C., Baldocchi, D., Papale, D., Keenan, T. F., Biraud, S. C., Agarwal, D. A., and Torn, M. S.: AmeriFlux BASE data pipeline to support network growth and data sharing, Sci. Data, 10, 614, https://doi.org/10.1038/s41597-023-02531-2, 2023.
Cole, J. J. and Caraco, N. F.: Atmospheric exchange of carbon dioxide in a low-wind oligotrophic lake measured by the addition of SF6, Limnol. Oceanogr., 43, 647–656, https://doi.org/10.4319/lo.1998.43.4.0647, 1998.
Delwiche, K. B., Knox, S. H., Malhotra, A., Fluet-Chouinard, E., McNicol, G., Feron, S., Ouyang, Z., Papale, D., Trotta, C., Canfora, E., and Others: FLUXNET-CH4: A global, multi-ecosystem dataset and analysis of methane seasonality from freshwater wetlands (Appendix B and Figure 3), 2021.
Desai, A. R., Richardson, A. D., Moffat, A. M., Kattge, J., Hollinger, D. Y., Barr, A., Falge, E., Noormets, A., Papale, D., Reichstein, M., and Stauch, V. J.: Cross-site evaluation of eddy covariance GPP and RE decomposition techniques, Agr. Forest Meteorol., 148, 821–838, https://doi.org/10.1016/j.agrformet.2007.11.012, 2008.
Dinerstein, E., Olson, D., Joshi, A., Vynne, C., Burgess, N. D., Wikramanayake, E., Hahn, N., Palminteri, S., Hedao, P., Noss, R., Hansen, M., Locke, H., Ellis, E. C., Jones, B., Barber, C. V., Hayes, R., Kormos, C., Martin, V., Crist, E., Sechrest, W., Price, L., Baillie, J. E. M., Weeden, D., Suckling, K., and Davis, C.: An Ecoregion-Based Approach to Protecting Half the Terrestrial Realm, BioScience, 67, 534–545, https://doi.org/10.1093/biosci/bix014, 2017.
Emmerton, C. A., St. Louis, V. L., Lehnherr, I., Graydon, J. A., Kirk, J. L., and Rondeau, K. J.: The importance of freshwater systems to the net atmospheric exchange of carbon dioxide and methane with a rapidly changing high Arctic watershed, Biogeosciences, 13, 5849–5863, https://doi.org/10.5194/bg-13-5849-2016, 2016.
ESA CCI: Land Cover CCI Product User Guide Version 2.0, http://maps.elie.ucl.ac.be/CCI/viewer/download/ESACCI-LC-Ph2-PUGv2_2.0.pdf (last access: 16 June 2025), 2017.
Eugster, W., DelSontro, T., Laundre, J. A., Dobkowski, J., Shaver, G. R., and Kling, G. W.: Effects of long-term climate trends on the methane and CO2 exchange processes of Toolik Lake, Alaska, Front. Environ. Sci., 10, 948529, https://doi.org/10.3389/fenvs.2022.948529, 2022.
Euskirchen, E. S., Edgar, C. W., Syndonia Bret-Harte, M., Kade, A., Zimov, N., and Zimov, S.: Interannual and seasonal patterns of carbon dioxide, water, and energy fluxes from ecotonal and thermokarst-impacted ecosystems on carbon-rich permafrost soils in northeastern Siberia, J. Geophys. Res.-Biogeo., 122, 2651–2668, https://doi.org/10.1002/2017jg004070, 2017.
Euskirchen, E. S., Edgar, C. W., Kane, E. S., Waldrop, M. P., Neumann, R. B., Manies, K. L., Douglas, T. A., Dieleman, C., Jones, M. C., and Turetsky, M. R.: Persistent net release of carbon dioxide and methane from an Alaskan lowland boreal peatland complex, Global Change Biol., 30, e17139, https://doi.org/10.1111/gcb.17139, 2024.
Frost, G. V., Bhatt, U. S., Macander, M. J., Berner, L. T., Walker, D. A., Raynolds, M. K., Magnússon, R. Í., Bartsch, A., Bjerke, J. W., Epstein, H. E., Forbes, B. C., Goetz, S. J., Hoy, E. E., Karlsen, S. R., Kumpula, T., Lantz, T. C., Lara, M. J., López-Blanco, E., Montesano, P. M., Neigh, C. S. R., Nitze, I., Orndahl, K. M., Park, T., Phoenix, G. K., Rocha, A. V., Rogers, B. M., Schaepman-Strub, G., Tømmervik, H., Verdonen, M., Veremeeva, A., Virkkala, A.-M., and Waigl, C. F.: The changing face of the Arctic: four decades of greening and implications for tundra ecosystems, Front. Environ. Sci., 13, https://doi.org/10.3389/fenvs.2025.1525574, 2025.
Gauci, V., Pangala, S. R., Shenkin, A., Barba, J., Bastviken, D., Figueiredo, V., Gomez, C., Enrich-Prast, A., Sayer, E., Stauffer, T., Welch, B., Elias, D., McNamara, N., Allen, M., and Malhi, Y.: Global atmospheric methane uptake by upland tree woody surfaces, Nature, 631, 796–800, https://doi.org/10.1038/s41586-024-07592-w, 2024.
Golub, M., Koupaei-Abyazani, N., Vesala, T., Mammarella, I., Ojala, A., Bohrer, G., Weyhenmeyer, G., Blanken, P., Eugster, W., Koebsch, F., Chen, J., Czajkowski, K., Deshmukh, C., Guérin, F., Heiskanen, J., Humphreys, E., Jonsson, A., Karlsson, J., Kling, G., Lee, X., Liu, H., Lohila, A., Lundin, E., Morin, T., Podgrajsek, E., Provenzale, M., Rutgersson, A., Sachs, T., Sahlée, E., Serça, D., Shao, C., Spence, C., Strachan, I., Xiao, W., and Desai, A.: Diel, seasonal, and inter-annual variation in carbon dioxide effluxes from lakes and reservoirs, Environ. Res. Lett., 18, https://doi.org/10.1088/1748-9326/acb834, 2023.
Gómez-Gener, L., Rocher-Ros, G., Battin, T., Cohen, M. J., Dalmagro, H. J., Dinsmore, K. J., Drake, T. W., Duvert, C., Enrich-Prast, A., Horgby, Å., Johnson, M. S., Kirk, L., Machado-Silva, F., Marzolf, N. S., McDowell, M. J., McDowell, W. H., Miettinen, H., Ojala, A. K., Peter, H., Pumpanen, J., Ran, L., Riveros-Iregui, D. A., Santos, I. R., Six, J., Stanley, E. H., Wallin, M. B., White, S. A., and Sponseller, R. A.: Global carbon dioxide efflux from rivers enhanced by high nocturnal emissions, Nat. Geosci., 14, 289–294, https://doi.org/10.1038/s41561-021-00722-3, 2021.
Guérin, F., Abril, G., Serça, D., Delon, C., Richard, S., Delmas, R., Tremblay, A., and Varfalvy, L.: Gas transfer velocities of CO2 and CH4 in a tropical reservoir and its river downstream, J. Mar. Syst., 66, 161–172, https://doi.org/10.1016/j.jmarsys.2006.03.019, 2007.
Hall Jr., R. O. and Ulseth, A. J.: Gas exchange in streams and rivers, WIREs Water, 7, https://doi.org/10.1002/wat2.1391, 2020.
Heiskanen, J., Brümmer, C., Buchmann, N., Calfapietra, C., Chen, H., Gielen, B., Gkritzalis, T., Hammer, S., Hartman, S., Herbst, M., Janssens, I. A., Jordan, A., Juurola, E., Karstens, U., Kasurinen, V., Kruijt, B., Lankreijer, H., Levin, I., Linderson, M.-L., Loustau, D., Merbold, L., Myhre, C. L., Papale, D., Pavelka, M., Pilegaard, K., Ramonet, M., Rebmann, C., Rinne, J., Rivier, L., Saltikoff, E., Sanders, R., Steinbacher, M., Steinhoff, T., Watson, A., Vermeulen, A. T., Vesala, T., Vítková, G., and Kutsch, W.: The Integrated Carbon Observation System in Europe, B. Am. Meteorol. Soc., 103, E855–E872, https://doi.org/10.1175/bams-d-19-0364.1, 2022.
Holgerson, M. A. and Raymond, P. A.: Large contribution to inland water CO2 and CH4 emissions from very small ponds, Nat. Geosci., 9, 222–226, https://doi.org/10.1038/ngeo2654, 2016.
Hugelius, G., Strauss, J., Zubrzycki, S., Harden, J. W., Schuur, E. A. G., Ping, C.-L., Schirrmeister, L., Grosse, G., Michaelson, G. J., Koven, C. D., O'Donnell, J. A., Elberling, B., Mishra, U., Camill, P., Yu, Z., Palmtag, J., and Kuhry, P.: Estimated stocks of circumpolar permafrost carbon with quantified uncertainty ranges and identified data gaps, Biogeosciences, 11, 6573–6593, https://doi.org/10.5194/bg-11-6573-2014, 2014.
Hugelius, G., Loisel, J., Chadburn, S., Jackson, R. B., Jones, M. C., MacDonald, G., Marushchak, M., Olefeldt, D., Packalen, M. S., Siewert, M. B., Treat, C. C., Turetsky, M., Voigt, C., and Yu, Z.: Large stocks of peatland carbon and nitrogen are vulnerable to permafrost thaw, P. Natl. Acad. Sci. USA, 117, 20438–20446, https://doi.org/10.1073/pnas.1916387117, 2020.
Hugelius, G., Ramage, J., Burke, E., Chatterjee, A., Smallman, T. L., Aalto, T., Bastos, A., Biasi, Canadell, J. G., Chandra, N., Chevallier, F., Ciais, P., Chang, J., Feng, L., Jones, M. W., Kleinen, T., Kuhn, M., Lauerwald, R., Liu, J., López-Blanco, E., Luijkx, I. T., Marushchak, M. E., Natali, S. M., Niwa, Y., Olefeldt, D., Palmer, P. I., Patra, P. K., Peters, W., Potter, S., Poulter, B., Rogers, B. M., Riley, W. J., Saunois, M., Schuur, E. A. G., Thompson, R. L., Treat, C., Tsuruta, A., Turetsky, M. R., Virkkala, A.-M., Voigt, C., Watts, J., Zhu, Q., and Zheng, B.: Permafrost region greenhouse gas budgets suggest a weak CO2 sink and CH4 and N2O sources, but magnitudes differ between top-down and bottom-up methods, Global Biogeochem. Cy., 38, https://doi.org/10.1029/2023gb007969, 2024.
Huttunen, J., Lappalainen, K., Saarijarvi, E., Vaisanen, T., and Martikainen, P.: A novel sediment gas sampler and a subsurface gas collector used for measurement of the ebullition of methane and carbon dioxide from a eutrophied lake, Sci. Total Environ., 266, 153–158, https://doi.org/10.1016/s0048-9697(00)00749-x, 2001.
Iwata, H., Hirata, R., Takahashi, Y., Miyabara, Y., Itoh, M., and Iizuka, K.: Partitioning eddy-covariance methane fluxes from a shallow lake into diffusive and ebullitive fluxes, Bound.-Lay. Meteorol., 169, 413–428, https://doi.org/10.1007/s10546-018-0383-1, 2018.
Jähne, B., Münnich, K. O., Bösinger, R., Dutzi, A., Huber, W., and Libner, P.: On the parameters influencing air-water gas exchange, J. Geophys. Res., 92, 1937–1949, https://doi.org/10.1029/jc092ic02p01937, 1987.
Jammet, M., Crill, P., Dengel, S., and Friborg, T.: Large methane emissions from a subarctic lake during spring thaw: Mechanisms and landscape significance: Lake methane emissions upon spring thaw, J. Geophys. Res.-Biogeo., 120, 2289–2305, https://doi.org/10.1002/2015jg003137, 2015.
Jammet, M., Dengel, S., Kettner, E., Parmentier, F.-J. W., Wik, M., Crill, P., and Friborg, T.: Year-round CH4 and CO2 flux dynamics in two contrasting freshwater ecosystems of the subarctic, Biogeosciences, 14, 5189–5216, https://doi.org/10.5194/bg-14-5189-2017, 2017.
Järveoja, J., Nilsson, M., Crill, P., and Peichl, M.: Bimodal diel pattern in peatland ecosystem respiration rebuts uniform temperature response, Nat. Commun., 11, https://doi.org/10.1038/s41467-020-18027-1, 2020.
Jentzsch, K., Schulz, A., Pirk, N., Foken, T., Crewell, S., and Boike, J.: High levels of CO2 exchange during synoptic-scale events introduce large uncertainty into the Arctic carbon budget, Geophys. Res. Lett., 48, https://doi.org/10.1029/2020gl092256, 2021.
Jorgenson, M. T., Douglas, T. A., Shur, Y. L., and Kanevskiy, M. Z.: Mapping the vulnerability of boreal permafrost in central Alaska in relation to thaw rate, ground ice, and thermokarst development, J. Geophys. Res.-Earth, 130, https://doi.org/10.1029/2024jf008030, 2025.
Juutinen, S., Alm, J., and Larmola, T.: Major implication of the littoral zone for methane release from boreal lakes, Global Biogeochem. Cy., 17, https://doi.org/10.1029/2003GB002105, 2003.
Juutinen, S., Rantakari, M., Kortelainen, P., Huttunen, J. T., Larmola, T., Alm, J., Silvola, J., and Martikainen, P. J.: Methane dynamics in different boreal lake types, Biogeosciences, 6, 209–223, https://doi.org/10.5194/bg-6-209-2009, 2009.
Kankaala, P., Käki, T., Mäkelä, S., Ojala, A., Pajunen, H., and Arvola, L.: Methane efflux in relation to plant biomass and sediment characteristics in stands of three common emergent macrophytes in boreal mesoeutrophic lakes, Global Change Biol., 11, 145–153, https://doi.org/10.1111/j.1365-2486.2004.00888.x, 2005.
Karlsson, J., Giesler, R., Persson, J., and Lundin, E.: High emission of carbon dioxide and methane during ice thaw in high latitude lakes: CArbon emission from lakes in spring, Geophys. Res. Lett., 40, 1123–1127, https://doi.org/10.1002/grl.50152, 2013.
Karlsson, J., Verheijen, H. A., Seekell, D. A., Vachon, D., and Klaus, M.: Ice-melt period dominates annual carbon dioxide evasion from clear-water Arctic lakes, Limnol. Oceanogr. Lett., 9, 112–118, https://doi.org/10.1002/lol2.10369, 2024.
Keenan, T. F., Migliavacca, M., Papale, D., Baldocchi, D., Reichstein, M., Torn, M., and Wutzler, T.: Widespread inhibition of daytime ecosystem respiration, Nat. Ecol. Evol., 3, 407–415, https://doi.org/10.1038/s41559-019-0809-2, 2019.
Kelly, J., Kljun, N., Cai, Z., Doerr, S. H., D'Onofrio, C., Holst, T., Lehner, I., Lindroth, A., Thapa, S., Vestin, P., and Santín, C.: Wildfire impacts on the carbon budget of a managed Nordic boreal forest, Agr. Forest Meteorol., 351, 110016, https://doi.org/10.1016/j.agrformet.2024.110016, 2024.
Kittler, F., Eugster, W., Foken, T., Heimann, M., Kolle, O., and Göckede, M.: High-quality eddy-covariance CO2 budgets under cold climate conditions: Arctic Eddy-Covariance CO2 Budgets, J. Geophys. Res.-Biogeo., 122, 2064–2084, https://doi.org/10.1002/2017jg003830, 2017a.
Kittler, F., Heimann, M., Kolle, O., Zimov, N., Zimov, S., and Göckede, M.: Long-Term Drainage Reduces CO2 Uptake and CH4 Emissions in a Siberian Permafrost Ecosystem, Global Biogeochem. Cy., 31, 1704–1717, https://doi.org/10.1002/2017gb005774, 2017b.
Klaus, M. and Vachon, D.: Challenges of predicting gas transfer velocity from wind measurements over global lakes, Aquat. Sci., 82, https://doi.org/10.1007/s00027-020-00729-9, 2020.
Klaus, M., Öquist, M., and Macháčová, K.: Tree stem-atmosphere greenhouse gas fluxes in a boreal riparian forest, Sci. Total Environ., 954, 176243, https://doi.org/10.1016/j.scitotenv.2024.176243, 2024.
Korkiakoski, M., Ojanen, P., Tuovinen, J.-P., Minkkinen, K., Nevalainen, O., Penttilä, T., Aurela, M., Laurila, T., and Lohila, A.: Partial cutting of a boreal nutrient-rich peatland forest causes radically less short-term on-site CO2 emissions than clear-cutting, Agr. Forest Meteorol., 332, 109361, https://doi.org/10.1016/j.agrformet.2023.109361, 2023.
Kortelainen, P., Rantakari, M., Huttunen, J. T., Mattsson, T., Alm, J., Juutinen, S., Larmola, T., Silvola, J., and Martikainen, P. J.: Sediment respiration and lake trophic state are important predictors of large CO2 evasion from small boreal lakes: Large CO2 evasion from small boreal lakes, Global Change Biol., 12, 1554–1567, https://doi.org/10.1111/j.1365-2486.2006.01167.x, 2006.
Kuhn, M., Olefeldt, D., Arndt, K. A., Bastviken, D., Bruhwiler, L., Crill, P., DelSontro, T., Fluet-Chouinard, E., Grosse, G., Hovemyr, M., Hugelius, G., MacIntyre, S., Malhotra, A., McGuire, A. D., Oh, Y., Poulter, B., Treat, C. C., Turetsky, M. R., Varner, R. K., Walter Anthony, K. M., Watts, J. D., and Zhang, Z.: Current and future methane emissions from boreal-Arctic wetlands and lakes, Nat. Clim. Change, 15, 986–991, https://doi.org/10.1038/s41558-025-02413-y, 2025.
Kuhn, M. A., Varner, R. K., Bastviken, D., Crill, P., MacIntyre, S., Turetsky, M., Walter Anthony, K., McGuire, A. D., and Olefeldt, D.: BAWLD-CH4: a comprehensive dataset of methane fluxes from boreal and arctic ecosystems, Earth Syst. Sci. Data, 13, 5151–5189, https://doi.org/10.5194/essd-13-5151-2021, 2021.
Kuhn, M. A., Schmidt, M., Heffernan, L., Stührenberg, J., Knorr, K.-H., Estop-Aragonés, C., Broder, T., Gonzalez Moguel, R., Douglas, P. M. J., and Olefeldt, D.: High ebullitive, millennial-aged greenhouse gas emissions from thermokarst expansion of peatland lakes in boreal western Canada, Limnol. Oceanogr., 68, 498–513, https://doi.org/10.1002/lno.12288, 2023.
Kyzivat, E. D. and Smith, L. C.: A closer look at the effects of lake area, aquatic vegetation, and double-counted wetlands on pan-Arctic lake methane emissions estimates, Geophys. Res. Lett., 50, https://doi.org/10.1029/2023gl104825, 2023.
Kyzivat, E. D., Smith, L. C., Garcia-Tigreros, F., Huang, C., Wang, C., Langhorst, T., Fayne, J. V., Harlan, M. E., Ishitsuka, Y., Feng, D., Dolan, W., Pitcher, L. H., Wickland, K. P., Dornblaser, M. M., Striegl, R. G., Pavelsky, T. M., Butman, D. E., and Gleason, C. J.: The importance of lake emergent aquatic vegetation for estimating arctic-boreal methane emissions, J. Geophys. Res.-Biogeo., 127, https://doi.org/10.1029/2021jg006635, 2022.
Lai, D. Y. F., Roulet, N. T., Humphreys, E. R., Moore, T. R., and Dalva, M.: The effect of atmospheric turbulence and chamber deployment period on autochamber CO2 and CH4 flux measurements in an ombrotrophic peatland, Biogeosciences, 9, 3305003322, https://doi.org/10.5194/bg-9-3305-2012, 2012.
Lasslop, G., Reichstein, M., Papale, D., Richardson, A. D., Arneth, A., Barr, A., Stoy, P., and Wohlfahrt, G.: Separation of net ecosystem exchange into assimilation and respiration using a light response curve approach: critical issues and global evaluation: Separation of NEE into GPP and RECO, Global Change Biol., 16, 187–208, https://doi.org/10.1111/j.1365-2486.2009.02041.x, 2010.
Liu, S., Kuhn, C., Amatulli, G., Aho, K., Butman, D. E., Allen, G. H., Lin, P., Pan, M., Yamazaki, D., Brinkerhoff, C., Gleason, C., Xia, X., and Raymond, P. A.: The importance of hydrology in routing terrestrial carbon to the atmosphere via global streams and rivers, P. Natl. Acad. Sci. USA, 119, e2106322119, https://doi.org/10.1073/pnas.2106322119, 2022.
Loken, L. C., Crawford, J. T., Schramm, P. J., Stadler, P., Desai, A. R., and Stanley, E. H.: Large spatial and temporal variability of carbon dioxide and methane in a eutrophic lake, J. Geophys. Res.-Biogeo., 124, 2248–2266, https://doi.org/10.1029/2019jg005186, 2019.
López-Blanco, E., Lund, M., Williams, M., Tamstorf, M. P., Westergaard-Nielsen, A., Exbrayat, J.-F., Hansen, B. U., and Christensen, T. R.: Exchange of CO2 in Arctic tundra: impacts of meteorological variations and biological disturbance, Biogeosciences, 14, 4467–4483, https://doi.org/10.5194/bg-14-4467-2017, 2017.
Lyu, Z., Sommers, P., Schmidt, S. K., Magnani, M., Cimpoiasu, M., Kuras, O., Zhuang, Q., Oh, Y., De La Fuente, M., Cramm, M., and Bradley, J. A.: Seasonal dynamics of Arctic soils: Capturing year-round processes in measurements and soil biogeochemical models, Earth Sci. Rev., 254, 104820, https://doi.org/10.1016/j.earscirev.2024.104820, 2024.
Machacova, K., Warlo, H., Svobodová, K., Agyei, T., Uchytilová, T., Horáček, P., and Lang, F.: Methane emission from stems of European beech (Fagus sylvatica) offsets as much as half of methane oxidation in soil, New Phytol., 238, 584–597, https://doi.org/10.1111/nph.18726, 2023.
McGuire, A. D., Christensen, T. R., Hayes, D., Heroult, A., Euskirchen, E., Kimball, J. S., Koven, C., Lafleur, P., Miller, P. A., Oechel, W., Peylin, P., Williams, M., and Yi, Y.: An assessment of the carbon balance of Arctic tundra: comparisons among observations, process models, and atmospheric inversions, Biogeosciences, 9, 3185–3204, https://doi.org/10.5194/bg-9-3185-2012, 2012.
Minobe, S., Behrens, E., Findell, K. L., Loeb, N. G., Meyssignac, B., and Sutton, R.: Global and regional drivers for exceptional climate extremes in 2023–2024: beyond the new normal, npj Clim. Atmos. Sci., 8, 138, https://doi.org/10.1038/s41612-025-00996-z, 2025.
Natali, S. M., Watts, J. D., Rogers, B. M., Potter, S., Ludwig, S. M., Selbmann, A.-K., Sullivan, P. F., Abbott, B. W., Arndt, K. A., Birch, L., Björkman, M. P., Bloom, A. A., Celis, G., Christensen, T. R., Christiansen, C. T., Commane, R., Cooper, E. J., Crill, P., Czimczik, C., Davydov, S., Du, J., Egan, J. E., Elberling, B., Euskirchen, E. S., Friborg, T., Genet, H., Göckede, M., Goodrich, J. P., Grogan, P., Helbig, M., Jafarov, E. E., Jastrow, J. D., Kalhori, A. A. M., Kim, Y., Kimball, J. S., Kutzbach, L., Lara, M. J., Larsen, K. S., Lee, B.-Y., Liu, Z., Loranty, M. M., Lund, M., Lupascu, M., Madani, N., Malhotra, A., Matamala, R., McFarland, J., McGuire, A. D., Michelsen, A., Minions, C., Oechel, W. C., Olefeldt, D., Parmentier, F.-J. W., Pirk, N., Poulter, B., Quinton, W., Rezanezhad, F., Risk, D., Sachs, T., Schaefer, K., Schmidt, N. M., Schuur, E. A. G., Semenchuk, P. R., Shaver, G., Sonnentag, O., Starr, G., Treat, C. C., Waldrop, M. P., Wang, Y., Welker, J., Wille, C., Xu, X., Zhang, Z., Zhuang, Q., and Zona, D.: Large loss of CO2 in winter observed across the northern permafrost region, Nat. Clim. Change, 9, 852–857, https://doi.org/10.1038/s41558-019-0592-8, 2019.
Natchimuthu, S., Sundgren, I., Gålfalk, M., Klemedtsson, L., Crill, P., Danielsson, Å., and Bastviken, D.: Spatio-temporal variability of lake CH4 fluxes and its influence on annual whole lake emission estimates, Limnol. Oceanogr., 61, S13–S26, https://doi.org/10.1002/lno.10222, 2016.
Natchimuthu, S., Wallin, M. B., Klemedtsson, L., and Bastviken, D.: Spatio-temporal patterns of stream methane and carbon dioxide emissions in a hemiboreal catchment in Southwest Sweden, Sci. Rep., 7, 39729, https://doi.org/10.1038/srep39729, 2017.
Nelson, J. A., Walther, S., Gans, F., Kraft, B., Weber, U., Novick, K., Buchmann, N., Migliavacca, M., Wohlfahrt, G., Šigut, L., Ibrom, A., Papale, D., Göckede, M., Duveiller, G., Knohl, A., Hörtnagl, L., Scott, R. L., Dušek, J., Zhang, W., Hamdi, Z. M., Reichstein, M., Aranda-Barranco, S., Ardö, J., Op de Beeck, M., Billesbach, D., Bowling, D., Bracho, R., Brümmer, C., Camps-Valls, G., Chen, S., Cleverly, J. R., Desai, A., Dong, G., El-Madany, T. S., Euskirchen, E. S., Feigenwinter, I., Galvagno, M., Gerosa, G. A., Gielen, B., Goded, I., Goslee, S., Gough, C. M., Heinesch, B., Ichii, K., Jackowicz-Korczynski, M. A., Klosterhalfen, A., Knox, S., Kobayashi, H., Kohonen, K.-M., Korkiakoski, M., Mammarella, I., Gharun, M., Marzuoli, R., Matamala, R., Metzger, S., Montagnani, L., Nicolini, G., O'Halloran, T., Ourcival, J.-M., Peichl, M., Pendall, E., Ruiz Reverter, B., Roland, M., Sabbatini, S., Sachs, T., Schmidt, M., Schwalm, C. R., Shekhar, A., Silberstein, R., Silveira, M. L., Spano, D., Tagesson, T., Tramontana, G., Trotta, C., Turco, F., Vesala, T., Vincke, C., Vitale, D., Vivoni, E. R., Wang, Y., Woodgate, W., Yepez, E. A., Zhang, J., Zona, D., and Jung, M.: X-BASE: the first terrestrial carbon and water flux products from an extended data-driven scaling framework, FLUXCOM-X, Biogeosciences, 21, 5079–5115, https://doi.org/10.5194/bg-21-5079-2024, 2024.
NOAA: Arctic Terrestrial Carbon Cycling, https://arctic.noaa.gov/report-card/report-card-2024/arctic-terrestrial-carbon-cycling/ (last access: 6 January 2025), 2025.
Novick, K. A., Biederman, J. A., Desai, A. R., Litvak, M. E., Moore, D. J. P., Scott, R. L., and Torn, M. S.: The AmeriFlux network: A coalition of the willing, Agr. Forest Meteorol., 249, 444–456, https://doi.org/10.1016/j.agrformet.2017.10.009, 2018.
Olefeldt, D., Turetsky, M. R., Crill, P. M., and McGuire, A. D.: Environmental and physical controls on northern terrestrial methane emissions across permafrost zones, Global Change Biol., 19, 589–603, https://doi.org/10.1111/gcb.12071, 2013.
Olefeldt, D., Hovemyr, M., Kuhn, M. A., Bastviken, D., Bohn, T. J., Connolly, J., Crill, P., Euskirchen, E. S., Finkelstein, S. A., Genet, H., Grosse, G., Harris, L. I., Heffernan, L., Helbig, M., Hugelius, G., Hutchins, R., Juutinen, S., Lara, M. J., Malhotra, A., Manies, K., McGuire, A. D., Natali, S. M., O'Donnell, J. A., Parmentier, F.-J. W., Räsänen, A., Schädel, C., Sonnentag, O., Strack, M., Tank, S. E., Treat, C., Varner, R. K., Virtanen, T., Warren, R. K., and Watts, J. D.: The Boreal–Arctic Wetland and Lake Dataset (BAWLD), Earth Syst. Sci. Data, 13, 5127–5149, https://doi.org/10.5194/essd-13-5127-2021, 2021.
O'Neill, H. B., Smith, S. L., Burn, C. R., Duchesne, C., and Zhang, Y.: Widespread permafrost degradation and thaw subsidence in northwest Canada, J. Geophys. Res.-Earth, 128, https://doi.org/10.1029/2023jf007262, 2023.
Pajala, G., Sawakuchi, H. O., Rudberg, D., Schenk, J., Sieczko, A., Gålfalk, M., Seekell, D., Sundgren, I., Thanh Duc, N., Karlsson, J., and Bastviken, D.: The effects of water column dissolved oxygen concentrations on lake methane emissions – results from a whole-lake oxygenation experiment, J. Geophys. Res.-Biogeo., 128, https://doi.org/10.1029/2022jg007185, 2023.
Pallandt, M. M., Kumar, J., Mauritz, M., Schuur, E. A. G., Virkkala, A.-M., Celis, G., Hoffman, F. M., and Göckede, M.: Representativeness assessment of the pan-Arctic eddy covariance site network and optimized future enhancements, Biogeosciences, 19, 559–583, https://doi.org/10.5194/bg-19-559-2022, 2022.
Pastorello, G., Trotta, C., Canfora, E., Chu, H., Christianson, D., Cheah, Y.-W., Poindexter, C., Chen, J., Elbashandy, A., Humphrey, M., Isaac, P., Polidori, D., Reichstein, M., Ribeca, A., van Ingen, C., Vuichard, N., Zhang, L., Amiro, B., Ammann, C., Arain, M. A., Ardö, J., Arkebauer, T., Arndt, S. K., Arriga, N., Aubinet, M., Aurela, M., Baldocchi, D., Barr, A., Beamesderfer, E., Marchesini, L. B., Bergeron, O., Beringer, J., Bernhofer, C., Berveiller, D., Billesbach, D., Black, T. A., Blanken, P. D., Bohrer, G., Boike, J., Bolstad, P. V., Bonal, D., Bonnefond, J.-M., Bowling, D. R., Bracho, R., Brodeur, J., Brümmer, C., Buchmann, N., Burban, B., Burns, S. P., Buysse, P., Cale, P., Cavagna, M., Cellier, P., Chen, S., Chini, I., Christensen, T. R., Cleverly, J., Collalti, A., Consalvo, C., Cook, B. D., Cook, D., Coursolle, C., Cremonese, E., Curtis, P. S., D’Andrea, E., da Rocha, H., Dai, X., Davis, K. J., Cinti, B. D., Grandcourt, A. de, Ligne, A. D., De Oliveira, R. C., Delpierre, N., Desai, A. R., Di Bella, C. M., Tommasi, P. di, Dolman, H., Domingo, F., Dong, G., Dore, S., Duce, P., Dufrêne, E., Dunn, A., Dušek, J., Eamus, D., Eichelmann, U., ElKhidir, H. A. M., Eugster, W., Ewenz, C. M., Ewers, B., Famulari, D., Fares, S., Feigenwinter, I., Feitz, A., Fensholt, R., Filippa, G., Fischer, M., Frank, J., Galvagno, M., Gharun, M., Gianelle, D., Gielen, B., Gioli, B., Gitelson, A., Goded, I., Goeckede, M., Goldstein, A. H., Gough, C. M., Goulden, M. L., Graf, A., Griebel, A., Gruening, C., Grünwald, T., Hammerle, A., Han, S., Han, X., Hansen, B. U., Hanson, C., Hatakka, J., He, Y., Hehn, M., Heinesch, B., Hinko-Najera, N., Hörtnagl, L., Hutley, L., Ibrom, A., Ikawa, H., Jackowicz-Korczynski, M., Janouš, D., Jans, W., Jassal, R., Jiang, S., Kato, T., Khomik, M., Klatt, J., Knohl, A., Knox, S., Kobayashi, H., Koerber, G., Kolle, O., Kosugi, Y., Kotani, A., Kowalski, A., Kruijt, B., Kurbatova, J., Kutsch, W. L., Kwon, H., Launiainen, S., Laurila, T., Law, B., Leuning, R., Li, Y., Liddell, M., Limousin, J.-M., Lion, M., Liska, A. J., Lohila, A., López-Ballesteros, A., López-Blanco, E., Loubet, B., Loustau, D., Lucas-Moffat, A., Lüers, J., Ma, S., Macfarlane, C., Magliulo, V., Maier, R., Mammarella, I., Manca, G., Marcolla, B., Margolis, H. A., Marras, S., Massman, W., Mastepanov, M., Matamala, R., Matthes, J. H., Mazzenga, F., McCaughey, H., McHugh, I., McMillan, A. M. S., Merbold, L., Meyer, W., Meyers, T., Miller, S. D., Minerbi, S., Moderow, U., Monson, R. K., Montagnani, L., Moore, C. E., Moors, E., Moreaux, V., Moureaux, C., Munger, J. W., Nakai, T., Neirynck, J., Nesic, Z., Nicolini, G., Noormets, A., Northwood, M., Nosetto, M., Nouvellon, Y., Novick, K., Oechel, W., Olesen, J. E., Ourcival, J.-M., Papuga, S. A., Parmentier, F.-J., Paul-Limoges, E., Pavelka, M., Peichl, M., Pendall, E., Phillips, R. P., Pilegaard, K., Pirk, N., Posse, G., Powell, T., Prasse, H., Prober, S. M., Rambal, S., Rannik, Ü., Raz-Yaseef, N., Rebmann, C., Reed, D., Resco de Dios, V., Restrepo-Coupe, N., Reverter, B. R., Roland, M., Sabbatini, S., Sachs, T., Saleska, S. R., Sánchez-Cañete, E. P., Sanchez-Mejia, Z. M., Schmid, H. P., Schmidt, M., Schneider, K., Schrader, F., Schroder, I., Scott, R. L., Sedlák, P., Serrano-Ortíz, P., Shao, C., Shi, P., Shironya, I., Siebicke, L., Šigut, L., Silberstein, R., Sirca, C., Spano, D., Steinbrecher, R., Stevens, R. M., Sturtevant, C., Suyker, A., Tagesson, T., Takanashi, S., Tang, Y., Tapper, N., Thom, J., Tomassucci, M., Tuovinen, J.-P., Urbanski, S., Valentini, R., van der Molen, M., van Gorsel, E., van Huissteden, K., Varlagin, A., Verfaillie, J., Vesala, T., Vincke, C., Vitale, D., Vygodskaya, N., Walker, J. P., Walter-Shea, E., Wang, H., Weber, R., Westermann, S., Wille, C., Wofsy, S., Wohlfahrt, G., Wolf, S., Woodgate, W., Li, Y., Zampedri, R., Zhang, J., Zhou, G., Zona, D., Agarwal, D., Biraud, S., Torn, M., and Papale, D.: The FLUXNET2015 dataset and the ONEFlux processing pipeline for eddy covariance data, Sci. Data, 7, 225, https://doi.org/10.1038/s41597-020-0534-3, 2020.
Pirk, N., Tamstorf, M. P., Lund, M., Mastepanov, M., Pedersen, S. H., Mylius, M. R., Parmentier, F.-J. W., Christiansen, H. H., and Christensen, T. R.: Snowpack fluxes of methane and carbon dioxide from high Arctic tundra, J. Geophys. Res.-Biogeo., 121, 2886–2900, https://doi.org/10.1002/2016jg003486, 2016.
Pirk, N., Aalstad, K., Mannerfelt, E. S., Clayer, F., de Wit, H., Christiansen, C. T., Althuizen, I., Lee, H., and Westermann, S.: Disaggregating the carbon exchange of degrading permafrost peatlands using Bayesian deep learning, Geophys. Res. Lett., 51, https://doi.org/10.1029/2024gl109283, 2024.
Prėskienis, V., Laurion, I., Bouchard, F., Douglas, P. M. J., Billett, M. F., Fortier, D., and Xu, X.: Seasonal patterns in greenhouse gas emissions from lakes and ponds in a High Arctic polygonal landscape, Limnol. Oceanogr., 66, https://doi.org/10.1002/lno.11660, 2021.
Ramage, J., Kuhn, M., Virkkala, A.-M., Voigt, C., Marushchak, M. E., Bastos, A., Biasi, C., Canadell, J. G., Ciais, P., López-Blanco, E., Natali, S. M., Olefeldt, D., Potter, S., Poulter, B., Rogers, B. M., Schuur, E. A. G., Treat, C., Turetsky, M. R., Watts, J., and Hugelius, G.: The net GHG balance and budget of the permafrost region (2000–2020) from ecosystem flux upscaling, Global Biogeochem. Cy., 38, e2023GB007953, https://doi.org/10.1029/2023gb007953, 2024.
Rantanen, M., Karpechko, A. Y., Lipponen, A., Nordling, K., Hyvärinen, O., Ruosteenoja, K., Vihma, T., and Laaksonen, A.: The Arctic has warmed nearly four times faster than the globe since 1979, Commun. Earth Environ., 3, 1–10, https://doi.org/10.1038/s43247-022-00498-3, 2022.
Ray, N. E., Holgerson, M. A., Andersen, M. R., Bikše, J., Bortolotti, L. E., Futter, M., Kokorīte, I., Law, A., McDonald, C., Mesman, J. P., Peacock, M., Richardson, D. C., Arsenault, J., Bansal, S., Cawley, K., Kuhn, M., Shahabinia, A. R., and Smufer, F.: Spatial and temporal variability in summertime dissolved carbon dioxide and methane in temperate ponds and shallow lakes, Limnol. Oceanogr., 68, 1530–1545, https://doi.org/10.1002/lno.12362, 2023.
Raymond, P. A., Zappa, C. J., Butman, D., Bott, T. L., Potter, J., Mulholland, P., Laursen, A. E., McDowell, W. H., and Newbold, D.: Scaling the gas transfer velocity and hydraulic geometry in streams and small rivers: Gas transfer velocity and hydraulic geometry, Limnol. Oceanogr., 2, 41–53, https://doi.org/10.1215/21573689-1597669, 2012.
Reichstein, M., Falge, E., Baldocchi, D., Papale, D., Aubinet, M., Berbigier, P., Bernhofer, C., Buchmann, N., Gilmanov, T., Granier, A., Grunwald, T., Havrankova, K., Ilvesniemi, H., Janous, D., Knohl, A., Laurila, T., Lohila, A., Loustau, D., Matteucci, G., Meyers, T., Miglietta, F., Ourcival, J.-M., Pumpanen, J., Rambal, S., Rotenberg, E., Sanz, M., Tenhunen, J., Seufert, G., Vaccari, F., Vesala, T., Yakir, D., and Valentini, R.: On the separation of net ecosystem exchange into assimilation and ecosystem respiration: review and improved algorithm, Global Change Biol., 11, 1424–1439, https://doi.org/10.1111/j.1365-2486.2005.001002.x, 2005.
Rudberg, D., Duc, N. T., Schenk, J., Sieczko, A. K., Pajala, G., Sawakuchi, H. O., Verheijen, H. A., Melack, J. M., MacIntyre, S., Karlsson, J., and Bastviken, D.: Diel variability of CO2 emissions from northern lakes, J. Geophys. Res.-Biogeo., 126, https://doi.org/10.1029/2021jg006246, 2021.
Runkle, B. R. K., Sachs, T., Wille, C., Pfeiffer, E.-M., and Kutzbach, L.: Bulk partitioning the growing season net ecosystem exchange of CO2 in Siberian tundra reveals the seasonality of its carbon sequestration strength, Biogeosciences, 10, 1337–1349, https://doi.org/10.5194/bg-10-1337-2013, 2013.
Schmiedeskamp, M., Praetzel, L. S. E., Bastviken, D., and Knorr, K.-H.: Whole-lake methane emissions from two temperate shallow lakes with fluctuating water levels: Relevance of spatiotemporal patterns, Limnol. Oceanogr., 66, 2455–2469, https://doi.org/10.1002/lno.11764, 2021.
Schuur, E. A. G., Bockheim, J., Canadell, J. G., Euskirchen, E., Field, C. B., Goryachkin, S. V., Hagemann, S., Kuhry, P., Lafleur, P. M., Lee, H., Mazhitova, G., Nelson, F. E., Rinke, A., Romanovsky, V. E., Shiklomanov, N., Tarnocai, C., Venevsky, S., Vogel, J. G., and Zimov, S. A.: Vulnerability of permafrost carbon to climate change: Implications for the global carbon cycle, Bioscience, 58, 701–714, https://doi.org/10.1641/b580807, 2008.
Schuur, E. A. G., McGuire, A. D., Schädel, C., Grosse, G., Harden, J. W., Hayes, D. J., Hugelius, G., Koven, C. D., Kuhry, P., Lawrence, D. M., Natali, S. M., Olefeldt, D., Romanovsky, V. E., Schaefer, K., Turetsky, M. R., Treat, C. C., and Vonk, J. E.: Climate change and the permafrost carbon feedback, Nature, 520, 171–179, https://doi.org/10.1038/nature14338, 2015.
Schuur, E. A. G., Abbott, B. W., Commane, R., Ernakovich, J., Euskirchen, E., Hugelius, G., Grosse, G., Jones, M., Koven, C., Leshyk, V., Lawrence, D., Loranty, M. M., Mauritz, M., Olefeldt, D., Natali, S., Rodenhizer, H., Salmon, V., Schädel, C., Strauss, J., Treat, C., and Turetsky, M.: Permafrost and Climate Change: Carbon Cycle Feedbacks From the Warming Arctic, Annu. Rev. Environ. Resour., 47, 343–371, https://doi.org/10.1146/annurev-environ-012220-011847, 2022.
See, C. R., Virkkala, A.-M., Natali, S. M., Rogers, B. M., Mauritz, M., Biasi, C., Bokhorst, S., Boike, J., Bret-Harte, M. S., Celis, G., Chae, N., Christensen, T. R., Murner (Connon), S. J., Dengel, S., Dolman, H., Edgar, C. W., Elberling, B., Emmerton, C. A., Euskirchen, E. S., Göckede, M., Grelle, A., Heffernan, L., Helbig, M., Holl, D., Humphreys, E., Iwata, H., Järveoja, J., Kobayashi, H., Kochendorfer, J., Kolari, P., Kotani, A., Kutzbach, L., Kwon, M. J., Lathrop, E. R., López-Blanco, E., Mammarella, I., Marushchak, M. E., Mastepanov, M., Matsuura, Y., Merbold, L., Meyer, G., Minions, C., Nilsson, M. B., Nojeim, J., Oberbauer, S. F., Olefeldt, D., Park, S.-J., Parmentier, F.-J. W., Peichl, M., Peter, D., Petrov, R., Poyatos, R., Prokushkin, A. S., Quinton, W., Rodenhizer, H., Sachs, T., Savage, K., Schulze, C., Sjögersten, S., Sonnentag, O., St. Louis, V. L., Torn, M. S., Tuittila, E.-S., Ueyama, M., Varlagin, A., Voigt, C., Watts, J. D., Zona, D., Zyryanov, V. I., and Schuur, E. A. G.: Decadal increases in carbon uptake offset by respiratory losses across northern permafrost ecosystems, Nat. Clim. Change, 14, 853–862, https://doi.org/10.1038/s41558-024-02057-4, 2024.
Sieczko, A. K., Duc, N. T., Schenk, J., Pajala, G., Rudberg, D., Sawakuchi, H. O., and Bastviken, D.: Diel variability of methane emissions from lakes, P. Natl. Acad. Sci. USA, 117, 21488–21494, https://doi.org/10.1073/pnas.2006024117, 2020.
Song, C., Liu, S., Wang, G., Zhang, L., Rosentreter, J. A., Zhao, G., Sun, X., Yao, Y., Mu, C., Sun, S., Hu, Z., Lin, S., Sun, J., Li, Y., Wang, Y., Li, Y., Raymond, P. A., and Karlsson, J.: Inland water greenhouse gas emissions offset the terrestrial carbon sink in the northern cryosphere, Sci. Adv., 10, eadp0024, https://doi.org/10.1126/sciadv.adp0024, 2024.
Staehr, P. A., Bade, D., Van de Bogert, M. C., Koch, G. R., Williamson, C., Hanson, P., Cole, J. J., and Kratz, T.: Lake metabolism and the diel oxygen technique: State of the science: Guideline for lake metabolism studies, Limnol. Oceanogr. Meth., 8, 628–644, https://doi.org/10.4319/lom.2010.8.0628, 2010.
Stanley, E. H., Loken, L. C., Casson, N. J., Oliver, S. K., Sponseller, R. A., Wallin, M. B., Zhang, L., and Rocher-Ros, G.: GRiMeDB: the Global River Methane Database of concentrations and fluxes, Earth Syst. Sci. Data, 15, 2879–2926, https://doi.org/10.5194/essd-15-2879-2023, 2023.
Sundqvist, E., Crill, P., Mölder, M., Vestin, P., and Lindroth, A.: Atmospheric methane removal by boreal plants: Methane removal by boreal plants, Geophys. Res. Lett., 39, https://doi.org/10.1029/2012gl053592, 2012.
Tank, S. E., Lesack, L. F. W., and Hesslein, R. H.: Northern delta lakes as summertime CO2 absorbers within the arctic landscape, Ecosystems, 12, 144–157, https://doi.org/10.1007/s10021-008-9213-5, 2009.
Tao, J., Zhu, Q., Riley, W. J., and Neumann, R. B.: Warm-season net CO2 uptake outweighs cold-season emissions over Alaskan North Slope tundra under current and RCP8.5 climate, Environ. Res. Lett., 16, 055012, https://doi.org/10.1088/1748-9326/abf6f5, 2021.
Thornton, B. F., Wik, M., and Crill, P. M.: Double-counting challenges the accuracy of high-latitude methane inventories: Double-counting Arctic methane, Geophys. Res. Lett., 43, 12569–12577, https://doi.org/10.1002/2016gl071772, 2016.
Treat, C. C., Anthony Bloom, A., and Marushchak, M. E.: Nongrowing season methane emissions – a significant component of annual emissions across northern ecosystems, Global Change Biol., 24, 3331–3343, https://doi.org/10.1111/gcb.14137, 2018.
Treat, C. C., Virkkala, A.-M., Burke, E., Bruhwiler, L., Chatterjee, A., Fisher, J. B., Hashemi, J., Parmentier, F.-J. W., Rogers, B. M., Westermann, S., Watts, J. D., Blanc-Betes, E., Fuchs, M., Kruse, S., Malhotra, A., Miner, K., Strauss, J., Armstrong, A., Epstein, H. E., Gay, B., Goeckede, M., Kalhori, A., Kou, D., Miller, C. E., Natali, S. M., Oh, Y., Shakil, S., Sonnentag, O., Varner, R. K., Zolkos, S., Schuur, E. A. G., and Hugelius, G.: Permafrost carbon: Progress on understanding stocks and fluxes across northern terrestrial ecosystems, J. Geophys. Res.-Biogeo., 129, https://doi.org/10.1029/2023jg007638, 2024.
Turetsky, M. R., Abbott, B. W., Jones, M. C., Anthony, K. W., Olefeldt, D., Schuur, E. A. G., Grosse, G., Kuhry, P., Hugelius, G., Koven, C., Lawrence, D. M., Gibson, C., Sannel, A. B. K., and David McGuire, A.: Carbon release through abrupt permafrost thaw, Nat. Geosci., 13, 138–143, https://doi.org/10.1038/s41561-019-0526-0, 2020.
Ueyama, M., Knox, S. H., Delwiche, K. B., Bansal, S., Riley, W. J., Baldocchi, D., Hirano, T., McNicol, G., Schafer, K., Windham-Myers, L., Poulter, B., Jackson, R. B., Chang, K.-Y., Chen, J., Chu, H., Desai, A. R., Gogo, S., Iwata, H., Kang, M., Mammarella, I., Peichl, M., Sonnentag, O., Tuittila, E.-S., Ryu, Y., Euskirchen, E. S., Göckede, M., Jacotot, A., Nilsson, M. B., and Sachs, T.: Modeled production, oxidation, and transport processes of wetland methane emissions in temperate, boreal, and Arctic regions, Global Change Biol., 29, 2313–2334, https://doi.org/10.1111/gcb.16594, 2023.
Ueyama, M., Takao, Y., Yazawa, H., Tanaka, M., Yabuki, H., Kumagai, T., Iwata, H., Awal, Md. A., Du, M., Harazono, Y., Hata, Y., Hirano, T., Hiura, T., Ide, R., Ishida, S., Ishikawa, M., Kitamura, K., Kominami, Y., Komiya, S., Kotani, A., Inoue, Y., Machimura, T., Matsumoto, K., Matsuura, Y., Mizoguchi, Y., Murayama, S., Nagano, H., Nakai, T., Nakaji, T., Nakaya, K., Ohkubo, S., Ohta, T., Ono, K., Saitoh, T. M., Sakabe, A., Shimizu, T., Shimoda, S., Sugita, M., Takagi, K., Takahashi, Y., Takamura, N., Takanashi, S., Takimoto, T., Yasuda, Y., Wang, Q., Asanuma, J., Hasegawa, H., Hiyama, T., Iijima, Y., Ishidoya, S., Itoh, M., Kato, T., Kondo, H., Kosugi, Y., Kume, T., Maeda, T., Matsuura, S., Maximov, T., Miyama, T., Moriwaki, R., Muraoka, H., Petrov, R., Suzuki, J., Taniguchi, S., and Ichii, K.: The JapanFlux2024 dataset for eddy covariance observations covering Japan and East Asia from 1990 to 2023, Earth Syst. Sci. Data, 17, 3807–3833, https://doi.org/10.5194/essd-17-3807-2025, 2025.
Vachon, D. and Prairie, Y. T.: The ecosystem size and shape dependence of gas transfer velocity versus wind speed relationships in lakes, Can. J. Fish. Aquat. Sci., 70, 1757–1764, https://doi.org/10.1139/cjfas-2013-0241, 2013.
Vainio, E., Haikarainen, I. P., Machacova, K., Putkinen, A., Santalahti, M., Koskinen, M., Fritze, H., Tuomivirta, T., and Pihlatie, M.: Soil-tree-atmosphere CH4 flux dynamics of boreal birch and spruce trees during spring leaf-out, Plant Soil, 478, 391–407, https://doi.org/10.1007/s11104-022-05447-9, 2022.
Valentini, R.: EUROFLUX: An Integrated Network for Studying the Long-Term Responses of Biospheric Exchanges of Carbon, Water, and Energy of European Forests, in: Fluxes of Carbon, Water and Energy of European Forests, edited by: Valentini, R., Springer, Berlin, Heidelberg, 1–8, https://doi.org/10.1007/978-3-662-05171-9_1, 2003.
Virkkala, A.-M., Aalto, J., Rogers, B. M., Tagesson, T., Treat, C. C., Natali, S. M., Watts, J. D., Potter, S., Lehtonen, A., Mauritz, M., Schuur, E. A. G., Kochendorfer, J., Zona, D., Oechel, W., Kobayashi, H., Humphreys, E., Goeckede, M., Iwata, H., Lafleur, P. M., Euskirchen, E. S., Bokhorst, S., Marushchak, M., Martikainen, P. J., Elberling, B., Voigt, C., Biasi, C., Sonnentag, O., Parmentier, F.-J. W., Ueyama, M., Celis, G., St Louis, V. L., Emmerton, C. A., Peichl, M., Chi, J., Järveoja, J., Nilsson, M. B., Oberbauer, S. F., Torn, M. S., Park, S.-J., Dolman, H., Mammarella, I., Chae, N., Poyatos, R., López-Blanco, E., Christensen, T. R., Kwon, M. J., Sachs, T., Holl, D., and Luoto, M.: Statistical upscaling of ecosystem CO2 fluxes across the terrestrial tundra and boreal domain: Regional patterns and uncertainties, Global Change Biol., 27, 4040–4059, https://doi.org/10.1111/gcb.15659, 2021.
Virkkala, A.-M., Natali, S. M., Rogers, B. M., Watts, J. D., Savage, K., Connon, S. J., Mauritz, M., Schuur, E. A. G., Peter, D., Minions, C., Nojeim, J., Commane, R., Emmerton, C. A., Goeckede, M., Helbig, M., Holl, D., Iwata, H., Kobayashi, H., Kolari, P., López-Blanco, E., Marushchak, M. E., Mastepanov, M., Merbold, L., Parmentier, F.-J. W., Peichl, M., Sachs, T., Sonnentag, O., Ueyama, M., Voigt, C., Aurela, M., Boike, J., Celis, G., Chae, N., Christensen, T. R., Bret-Harte, M. S., Dengel, S., Dolman, H., Edgar, C. W., Elberling, B., Euskirchen, E., Grelle, A., Hatakka, J., Humphreys, E., Järveoja, J., Kotani, A., Kutzbach, L., Laurila, T., Lohila, A., Mammarella, I., Matsuura, Y., Meyer, G., Nilsson, M. B., Oberbauer, S. F., Park, S.-J., Petrov, R., Prokushkin, A. S., Schulze, C., St. Louis, V. L., Tuittila, E.-S., Tuovinen, J.-P., Quinton, W., Varlagin, A., Zona, D., and Zyryanov, V. I.: The ABCflux database: Arctic–boreal CO2 flux observations and ancillary information aggregated to monthly time steps across terrestrial ecosystems, Earth Syst. Sci. Data, 14, 179–208, https://doi.org/10.5194/essd-14-179-2022, 2022.
Virkkala, A.-M., Niittynen, P., Kemppinen, J., Marushchak, M. E., Voigt, C., Hensgens, G., Kerttula, J., Happonen, K., Tyystjärvi, V., Biasi, C., Hultman, J., Rinne, J., and Luoto, M.: High-resolution spatial patterns and drivers of terrestrial ecosystem carbon dioxide, methane, and nitrous oxide fluxes in the tundra, Biogeosciences, 21, 335–355, https://doi.org/10.5194/bg-21-335-2024, 2024.
Virkkala, A.-M., Rogers, B. M., Watts, J. D., Arndt, K. A., Potter, S., Wargowsky, I., Schuur, E. A. G., See, C. R., Mauritz, M., Boike, J., Bret-Harte, M. S., Burke, E. J., Burrell, A., Chae, N., Chatterjee, A., Chevallier, F., Christensen, T. R., Commane, R., Dolman, H., Edgar, C. W., Elberling, B., Emmerton, C. A., Euskirchen, E. S., Feng, L., Göckede, M., Grelle, A., Helbig, M., Holl, D., Järveoja, J., Karsanaev, S. V., Kobayashi, H., Kutzbach, L., Liu, J., Luijkx, I. T., López-Blanco, E., Lunneberg, K., Mammarella, I., Marushchak, M. E., Mastepanov, M., Matsuura, Y., Maximov, T. C., Merbold, L., Meyer, G., Nilsson, M. B., Niwa, Y., Oechel, W., Palmer, P. I., Park, S.-J., Parmentier, F.-J. W., Peichl, M., Peters, W., Petrov, R., Quinton, W., Rödenbeck, C., Sachs, T., Schulze, C., Sonnentag, O., St. Louis, V. L., Tuittila, E.-S., Ueyama, M., Varlagin, A., Zona, D., and Natali, S. M.: Wildfires offset the increasing but spatially heterogeneous Arctic–boreal CO2 uptake, Nat. Clim. Change, 1–8, https://doi.org/10.1038/s41558-024-02234-5, 2025.
Virkkala, A.-M., Wargowsky, I., Vogt, J., Kuhn, M. A., Madaan, S., O'Keefe, R., Windholz, T., Arndt, K. A., Rogers, B. M., Watts, J. D., Kent, K., Göckede, M., Olefeldt, D., Rocher-Ros, G., Schuur, E. A. G., Bastviken, D., Aalstad, K., Aho, K., Ala-Könni, J., Alcock, H., Althuizen, I., Arp, C. D., Asanuma, J., Attermeyer, K., Aurela, M., Balathandayuthabani, S., Barr, A., Barret, M., Batkhishig, O., Biasi, C., Björkman, M. P., Black, A., Blanc-Betes, E., Bodmer, P., Boike, J., Bolek, A., Bouchard, F., Bussmann, I., Cabrol, L., Canfora, E., Carey, S., Castro-Morales, K., Chae, N., Christen, A., Christensen, T. R., Christiansen, C. T., Chu, H., Clark, G., Clayer, F., Crill, P., Cunada, C., Davidson, S. J., Dean, J. F., Dengel, S., Detto, M., Dieleman, C., Domine, F., Dyukarev, E., Edgar, C., Elberling, B., Emmerton, C. A., Euskirchen, E., Falvo, G., Friborg, T., Garneau, M., Giamberini, M., Glagolev, M. V., Gonzalez-Meler, M. A., Granath, G., Guðmundsson, J., Happonen, K., Harazono, Y., Harris, L., Hashemi, J., Hasson, N., Heerah, J., Heffernan, L., Helbig, M., Helgason, W., Heliasz, M., Henry, G., Hensgens, G., Hiyama, T., Hock, M., Holl, D., Holmes, B., Holst, J., Holst, T., Hould-Gosselin, G., Humphreys, E., Hung, J., Huotari, J., Ikawa, H., Ilyasov, D. V., Ishikawa, M., Iwahana, G., Iwata, H., Jackowicz-Korczynski, M. A., Jansen, J., Järveoja, J., Jassey, V. E. J., Jensen, R., Jentzsch, K., Jespersen, R. G., Johannesson, C.-F., Jones, C. P., Jonsson, A., Jung, J. Y., Juutinen, S., Kane, E., Karlsson, J., Karsanaev, S., Kasak, K., Kelly, J., Kempton, K., Klaus, M., Kling, G. W., Kljun, N., Knutson, J., Kobayashi, H., Kochendorfer, J., Kohonen, K.-M., Kolari, P., Korkiakoski, M., Korrensalo, A., Kortelainen, P., Koster, E., Koster, K., Kotani, A., Krishnan, P., Kurbatova, J., Kutzbach, L., Kwon, M. J., Kyzivat, E. D., Lagroix, J., Langhorst, T., Lapshina, E., Larmola, T., Larsen, K. S., Laurion, I., Ledman, J., Lee, H., Leffler, A. J., Lesack, L., Lindroth, A., Lipson, D., Lohila, A., López-Blanco, E., St. Louis, V. L., Lundin, E., Luoto, M., Machimura, T., Magnani, M., Malhotra, A., Maljanen, M., Mammarella, I., Männistö, E., Belelli Marchesini, L., Marsh, P., Martkainen, P. J., Marushchak, M. E., Mastepanov, M., Mavrovic, A., Maximov, T., Minions, C., Montemayor, M., Morishita, T., Murphy, P., Nadeau, D. F., Nicholls, E., Nilsson, M. B., Niyazova, A., Nordén, J., Noumonvi, K. D., Nykanen, H., Oechel, W., Ojala, A., Okadera, T., Pal, S., Panov, A. V., Papakyriakou, T., Papale, D., Park, S.-J., Parmentier, F.-J. W., Pastorello, G., Peacock, M., Peichl, M., Petrov, R., St. Pierre, K., Pirk, N., Plein, J., Prėskienis, V., Prokushkin, A., Pumpanen, J., Rains, H. A., Rakos, N., Räsänen, A., Rautakoski, H., Rinnan, R., Rinne, J., Rocha, A., Roulet, N., Roy, A., Rutgersson, A., Sabrekov, A. F., Sachs, T., Sahlée, E., Salazar, A., Oliveira Sawakuchi, H., Schulze, C., Seco, R., Sepulveda-Jauregui, A., Serikova, S., Serrone, A., Silvennoinen, H. M., Sjogersten, S., Skeeter, J., Snöälv, J., Sobek, S., Sonnentag, O., Stanley, E. H., Strack, M., Strom, L., Sullivan, P., Sullivan, R., Sytiuk, A., Tagesson, T., Taillardat, P., Talbot, J., Tank, S. E., Tenuta, M., Terenteva, I., Thalasso, F., Thiboult, A., Thorgeirsson, H., Garcia Tigreros, F., Torn, M., Townsend-Small, A., Treat, C., Tremblay, A., Trotta, C., Tuittila, E.-S., Turetsky, M., Ueyama, M., Umair, M., Vähä, A., van Delden, L., van Hardenbroek, M., Varlagin, A., Varner, R. K., Veretennikova, E., Vesala, T., Virtanen, T., Voigt, C., Vonk, J. E., Wagner, R., Walter Anthony, K., Wang, Q., Watanabe, M., Webb, H., Welker, J. M., Westergaard-Nielsen, A., Westermann, S., White, J. R., Wille, C., Williamson, S. N., Zolkos, S., Zona, D., and Natali, S. M.: ABCFlux v2: Arctic-Boreal CO2 and CH4 In-situ Flux and Environmental Data (Version 1), ORNL Distributed Active Archive Center [data set], https://doi.org/10.3334/ORNLDAAC/2448, 2026.
Vogt, J., Pallandt, M. M. T. A., Basso, L. S., Bolek, A., Ivanova, K., Schlutow, M., Celis, G., Kuhn, M., Mauritz, M., Schuur, E. A. G., Arndt, K., Virkkala, A.-M., Wargowsky, I., and Göckede, M.: ARGO: ARctic greenhouse Gas Observation metadata version 1, Earth Syst. Sci. Data, 17, 2553–2573, https://doi.org/10.5194/essd-17-2553-2025, 2025.
Voigt, C., Marushchak, M. E., Lamprecht, R. E., Jackowicz-Korczyński, M., Lindgren, A., Mastepanov, M., Granlund, L., Christensen, T. R., Tahvanainen, T., Martikainen, P. J., and Biasi, C.: Increased nitrous oxide emissions from Arctic peatlands after permafrost thaw, P. Natl. Acad. Sci. USA, 114, 6238–6243, https://doi.org/10.1073/pnas.1702902114, 2017.
Voigt, C., Virkkala, A.-M., Hould Gosselin, G., Bennett, K. A., Black, T. A., Detto, M., Chevrier-Dion, C., Guggenberger, G., Hashmi, W., Kohl, L., Kou, D., Marquis, C., Marsh, P., Marushchak, M. E., Nesic, Z., Nykänen, H., Saarela, T., Sauheitl, L., Walker, B., Weiss, N., Wilcox, E. J., and Sonnentag, O.: Arctic soil methane sink increases with drier conditions and higher ecosystem respiration, Nat. Clim. Change, 1–10, https://doi.org/10.1038/s41558-023-01785-3, 2023.
Vonk, J. E., Fritz, M., Speetjens, N. J., Babin, M., Bartsch, A., Basso, L. S., Bröder, L., Göckede, M., Gustafsson, Ö., Hugelius, G., Irrgang, A. M., Juhls, B., Kuhn, M. A., Lantuit, H., Manizza, M., Martens, J., O'Regan, M., Suslova, A., Tank, S. E., Terhaar, J., and Zolkos, S.: The land–ocean Arctic carbon cycle, Nat. Rev. Earth Environ., 6, 86–105, https://doi.org/10.1038/s43017-024-00627-w, 2025.
Walter Anthony, K. M., Vas, D. A., Brosius, L., Chapin III, F. S., Zimov, S. A., and Zhuang, Q.: Estimating methane emissions from northern lakes using ice-bubble surveys, Limnol. Oceanogr. Meth., 8, 592–609, 2010.
Walter Anthony, K. M. and Anthony, P.: Constraining spatial variability of methane ebullition seeps in thermokarst lakes using point process models: Thermokarst lake methane ebullition, J. Geophys. Res.-Biogeo., 118, 1015–1034, https://doi.org/10.1002/jgrg.20087, 2013.
Walter Anthony, K. M., Anthony, P., Hasson, N., Edgar, C., Sivan, O., Eliani-Russak, E., Bergman, O., Minsley, B. J., James, S. R., Pastick, N. J., Kholodov, A., Zimov, S., Euskirchen, E., Bret-Harte, M. S., Grosse, G., Langer, M., and Nitzbon, J.: Upland Yedoma taliks are an unpredicted source of atmospheric methane, Nat. Commun., 15, 6056, https://doi.org/10.1038/s41467-024-50346-5, 2024.
Warm Winter 2020 Team and ICOS Ecosystem Thematic Centre: Warm Winter 2020 ecosystem eddy covariance flux product for 73 stations in FLUXNET-Archive format – release 2022-1, https://doi.org/10.18160/2G60-ZHAK, 2020.
Watts, J. D., Natali, S. M., Minions, C., Risk, D., Arndt, K., Zona, D., Euskirchen, E. S., Rocha, A. V., Sonnentag, O., Helbig, M., Kalhori, A., Oechel, W., Ikawa, H., Ueyama, M., Suzuki, R., Kobayashi, H., Celis, G., Schuur, E. A. G., Humphreys, E., Kim, Y., Lee, B.-Y., Goetz, S., Madani, N., Schiferl, L. D., Commane, R., Kimball, J. S., Liu, Z., Torn, M. S., Potter, S., Wang, J. A., Jorgenson, M. T., Xiao, J., Li, X., and Edgar, C.: Soil respiration strongly offsets carbon uptake in Alaska and Northwest Canada, Environ. Res. Lett., 16, 084051, https://doi.org/10.1088/1748-9326/ac1222, 2021.
Webb, E. E., Liljedahl, A. K., Cordeiro, J. A., Loranty, M. M., Witharana, C., and Lichstein, J. W.: Permafrost thaw drives surface water decline across lake-rich regions of the Arctic, Nat. Clim. Change, 12, 841–846, https://doi.org/10.1038/s41558-022-01455-w, 2022.
Webb, H., Fuchs, M., Abbott, B. W., Douglas, T. A., Elder, C. D., Ernakovich, J. G., Euskirchen, E. S., Göckede, M., Grosse, G., Hugelius, G., Jones, M. C., Koven, C., Kropp, H., Lathrop, E., Li, W., Loranty, M. M., Natali, S. M., Olefeldt, D., Schädel, C., Schuur, E. A. G., Sonnentag, O., Strauss, J., Virkkala, A.-M., and Turetsky, M. R.: A review of abrupt permafrost thaw: Definitions, usage, and a proposed conceptual framework, Curr. Clim. Change Rep., 11, 7, https://doi.org/10.1007/s40641-025-00204-3, 2025.
Welles, J. M., Demetriades-Shah, T. H., and McDermitt, D. K.: Considerations for measuring ground CO2 effluxes with chambers, Chem. Geol., 177, 3–13, https://doi.org/10.1016/s0009-2541(00)00388-0, 2001.
Wik, M., Crill, P. M., Varner, R. K., and Bastviken, D.: Multiyear measurements of ebullitive methane flux from three subarctic lakes: Methane ebullition from subarctic lakes, J. Geophys. Res.-Biogeo., 118, 1307–1321, https://doi.org/10.1002/jgrg.20103, 2013.
Wik, M., Thornton, B. F., Bastviken, D., Uhlbäck, J., and Crill, P. M.: Biased sampling of methane release from northern lakes: A problem for extrapolation, Geophys. Res. Lett., 43, 1256–1262, https://doi.org/10.1002/2015gl066501, 2016a.
Wik, M., Varner, R. K., Anthony, K. W., MacIntyre, S., and Bastviken, D.: Climate-sensitive northern lakes and ponds are critical components of methane release, Nat. Geosci., 9, 99–105, https://doi.org/10.1038/ngeo2578, 2016b.
Yuan, K., Li, F., McNicol, G., Chen, M., Hoyt, A., Knox, S., Riley, W. J., Jackson, R., and Zhu, Q.: Boreal-Arctic wetland methane emissions modulated by warming and vegetation activity, Nat. Clim. Change, 14, 282–288, https://doi.org/10.1038/s41558-024-01933-3, 2024.
Zolkos, S., Tank, S. E., Kokelj, S. V., Striegl, R. G., Shakil, S., Voigt, C., Sonnentag, O., Quinton, W. L., Schuur, E. A. G., Zona, D., Lafleur, P. M., Sullivan, R. C., Ueyama, M., Billesbach, D., Cook, D., Humphreys, E. R., and Marsh, P.: Permafrost landscape history shapes fluvial chemistry, ecosystem carbon balance, and potential trajectories of future change, Global Biogeochem. Cy., 36, https://doi.org/10.1029/2022gb007403, 2022.
- Abstract
- Introduction
- Data compilation and search
- Data columns
- Data quality and screening
- Data usage notes
- Spatial and temporal distribution of the dataset
- Flux synthesis
- Discussion
- Data use guidelines
- Data availability
- Conclusions
- Author contributions
- Competing interests
- Disclaimer
- Acknowledgements
- Financial support
- Review statement
- References
- Supplement
- Abstract
- Introduction
- Data compilation and search
- Data columns
- Data quality and screening
- Data usage notes
- Spatial and temporal distribution of the dataset
- Flux synthesis
- Discussion
- Data use guidelines
- Data availability
- Conclusions
- Author contributions
- Competing interests
- Disclaimer
- Acknowledgements
- Financial support
- Review statement
- References
- Supplement