the Creative Commons Attribution 4.0 License.
the Creative Commons Attribution 4.0 License.
 | 24 Aug 2026
Decadal surge of water-surface solar in China's Yangtze Delta: A high-fidelity SAR-optical fusion inventory (2015–2024)
Yue Yan
Xin Jiang
Sihuan Wei
Yubin Jin
Xinyu Zou
Junwei Liu
Yaotong Cai
Jianhuai Ye
Zhilin Guo
Zhenzhong Zeng
China hosts approximately 97 % of the world's water-surface photovoltaics (WPV), with nearly two-thirds of its national capacity concentrated in the Yangtze River Delta (YRD), a densely populated economic powerhouse facing intense land–energy trade-offs. Despite this dominance, no high-resolution, decade-long inventory has been available to track this rapid expansion. WPV detection using optical remote sensing (RS) imagery is severely limited by persistent cloud cover, water surface reflections, and spectral confusion, compromising long-term consistency across aquatic environments. Here, we developed a multi-sensor fusion framework integrating all-weather Sentinel-1 Synthetic Aperture Radar (SAR) observations and annual composite Sentinel-2 optical imagery. Input features include six Sentinel-2 bands, spectral indices (NDVI, MNDWI, NDBI, NDPI, and SAVI), texture metrics, and dual-polarization SAR backscatter. We trained a random forest classifier on 55 849 verified samples to generate annual WPV maps for 2015–2024. Subsequently, we applied post-processing procedures, including noise removal, patch merging, and area thresholding, and further verified installation years and removed misclassified areas through manual inspection of Google Earth time-series imagery. The resulting 10 m-resolution WPV atlas for the YRD maps 401 validated projects with a cumulative area of 145.4 km2 by 2024. It outperforms existing global PV inventories with an overall accuracy of 97.3 % and a Cohen's kappa coefficient of 0.94. The results reveal rapid expansion from 17.4 km2 in 2015 to 145.4 km2 in 2024, with 87 % of WPV area deployed on natural lakes, a marked shift in dominance from Jiangsu to Anhui, and clear spatial clustering near grid infrastructure and stable water bodies. This high-fidelity inventory provides a robust foundation for monitoring WPV evolution, assessing environmental impacts, and informing sustainable energy planning in the world's leading floating solar region. The dataset is available at https://doi.org/10.5281/zenodo.17484488 (Yan et al., 2025).
- Article
(18275 KB) - Full-text XML
- BibTeX
- EndNote


The global shift from carbon-intensive energy systems to low-carbon renewables is accelerating in response to growing electricity demand and the urgent need to mitigate climate change. Solar photovoltaics (PV) dominates this growth, owing to its continued cost declines, and accounted for nearly 80 % of new capacity additions in 2024 (IEA, 2025; Bogdanov et al., 2021). However, the substantial land footprint required by conventional PV systems increasingly conflicts with agriculture and other critical land uses (Capellán-Pérez et al., 2017; van de Ven et al., 2021; Wei et al., 2025). Water-surface photovoltaics (WPV) have emerged as a promising alternative. Deployed on natural lakes, reservoirs, and other water bodies, WPV systems alleviate land-use competition while offering additional benefits, such as reduced water evaporation loss (Forester et al., 2025; Pouran et al., 2022; Jin et al., 2023). China hosts approximately 97 % of global WPV, with nearly two-thirds of its national capacity concentrated in the water-abundant, energy-intensive Yangtze River Delta (YRD) region (Chen et al., 2024). For the YRD and similar regions, understanding the spatial dynamics and scalability of WPV is crucial for optimizing renewable energy strategies that balance energy security, land stewardship, and ecosystem sustainability.
In recent years, the integration of remote sensing and machine learning has become prevalent for extracting photovoltaic installations at regional or global scales (Zhang et al., 2023; Ortiz et al., 2022; Zhang et al., 2022). Among these, classification algorithms such as random forest (RF) have demonstrated strong performance and robustness (Belgiu and Drăguţ, 2016). These techniques typically leverage spectral, geometric, and textural features from satellite imagery to enable efficient, large-scale PV detection (Zhang et al., 2021; Chen et al., 2022). Building on these advances, several global photovoltaic inventories have been developed to provide large-scale datasets of PV installations. For example, A Global Inventory of Photovoltaic Installations maps commercial-, industrial-, and utility-scale PV facilities worldwide using multi-source satellite imagery, including Sentinel-2 (10 m) and high-resolution SPOT-6/7 imagery, and was produced using deep learning, followed by manual verification of installations identified primarily from 2016 to 2018 (Kruitwagen et al., 2021). Similarly, Global Renewables Watch integrates quarterly PlanetScope imagery at 4.7 m spatial resolution with deep learning–based semantic segmentation to map global solar and wind infrastructure from 2017 Q4 to 2024 Q2, enabling regular updates and temporal tracking of infrastructure development (Robinson et al., 2025). Compared with these products, our study specifically focuses on WPV mapping and combines SAR and optical observations to better distinguish floating PV from surrounding water backgrounds, while also providing annual, temporally consistent WPV inventories for 2015–2024.
Despite these advances, several challenges persist, particularly for complex aquatic environments and long-term monitoring. Optical imagery, which forms the foundation of most existing methods, is highly sensitive to weather conditions such as clouds, fog, and overcast skies, and cannot acquire data at night. Over water bodies, its performance is further constrained by specular reflections and shadows. Furthermore, although per-image accuracies can exceed 96 % (Kruitwagen et al., 2021; Xia et al., 2022, 2023), small errors accumulate substantially in long-term time-series mapping. For instance, mapping with 96 % annual accuracy over a decade yields only about 67 % consistency across the full period (0.9610≈0.67). This compounded uncertainty can substantially reduce temporal consistency in long-term mapping, complicating spatiotemporal assessments and increasing the likelihood of confusion between photovoltaic installations and water surfaces. As a result, ensuring both temporal consistency and high fidelity in long-term water-based PV mapping remains a key methodological challenge.
To directly address these limitations, this study proposes a robust and multidimensional feature-fusion framework for WPV extraction in the YRD region. Our approach utilizes annual composite Sentinel-2 imagery (2015–2024) and incorporates Sentinel-1 SAR observations to enable all-weather detection and capture strong backscatter signatures of WPV metallic structures. This combination substantially improves mapping accuracy and reduces misclassifications. To ensure comprehensive spatial coverage, we first identified candidate WPV zones through multi-year temporal compositing and water-mask filtering, thereby constraining detection to likely water-based locations and suppressing non-water interference. Subsequently, all detected WPV regions underwent systematic manual inspection and refinement using high-resolution Google Earth imagery. This step enabled the precise removal of false positives and the reliable determination of installation years. The resulting decade-long WPV dataset achieves high accuracy and temporal consistency, representing a highly reliable long-term inventory of WPV development to date and providing a robust foundation for understanding spatiotemporal growth dynamics and policy-relevant deployment patterns.
2.1 Study area
China leads the world in WPV system development, accounting for approximately 96.82 % of the global installed WPV surface area in 2019, as shown in Fig. 1a. Within China, the YRD region represents a significant WPV hub, accounting for nearly two-thirds of the national total. Specifically, Jiangsu (30.21 %), Anhui (19.75 %), and Zhejiang (9.97 %) provinces contain the largest installed WPV areas (Xia et al., 2022, 2023).
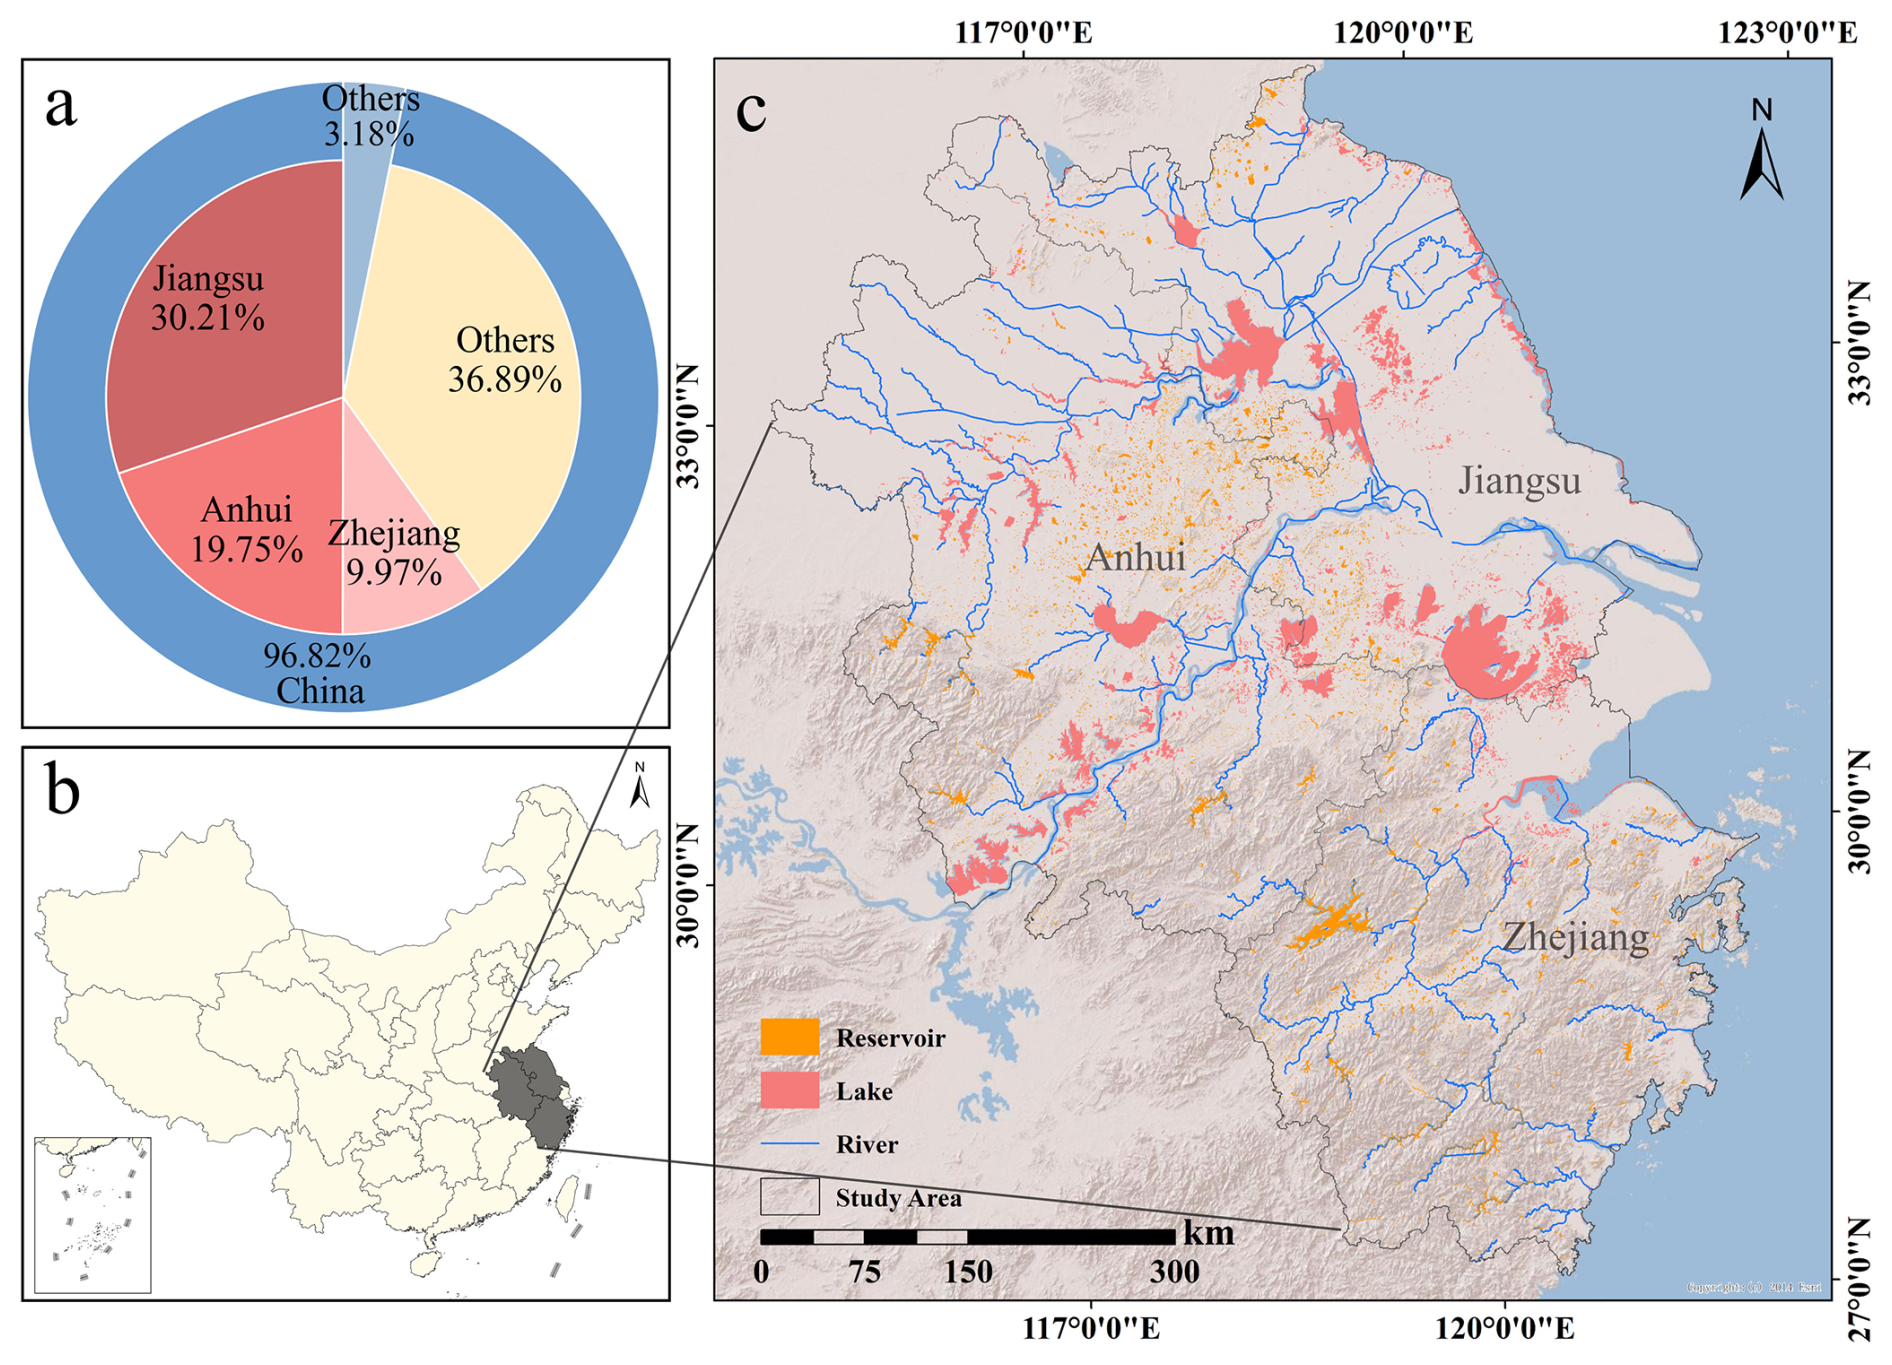
Figure 1WPV distribution and overview of the study area. (a) Proportion of WPV area in the study area relative to China, with contributions from Jiangsu, Anhui, and Zhejiang provinces; (b) location of the study area within China; (c) spatial distribution of reservoirs, lakes, and rivers in the study area (source: Esri 2014 | Powered by Esri).
Located in eastern China along the lower reaches of the Yangtze River (Fig. 1b), the YRD is characterized by abundant water resources, including a dense network of rivers, lakes, and reservoirs (Fig. 1c). These natural conditions are highly favorable for large-scale WPV deployment. Moreover, as one of China's most economically developed and industrially concentrated areas, the YRD experiences substantial electricity demand (Xu et al., 2023). The rapid growth of WPV in this region not only helps alleviate regional energy pressures but also plays a vital role in energy restructuring and the transition toward low-carbon development. Considering its current deployment scale, water resource conditions, and future development potential, this study focuses on the YRD as its primary research area.
2.2 Datasets
2.2.1 Satellite datasets
This study primarily utilized Sentinel-1 Synthetic Aperture Radar (SAR) and Sentinel-2 Multispectral Instrument (MSI) imagery, both of which are accessible via the Google Earth Engine (GEE) platform. The selected temporal coverage, from 2015 to 2024, aligns with the rapid development timeline of WPV installations in China.
Sentinel-1, equipped with a C-band SAR sensor, provides all-weather and day-and-night imaging capabilities, making it suitable for long-term dynamic monitoring because it is less affected by cloud cover and illumination conditions. We utilized the Sentinel-1 Ground Range Detected product from GEE, which features a 10 m spatial resolution and a 6–12 d revisit interval. To comprehensively capture radar backscatter characteristics of water bodies and WPV structures, VV (vertical transmit/vertical receive) and VH (vertical transmit/horizontal receive) polarization channels were selected.
Sentinel-2 provides high-resolution, multispectral optical and near-infrared imagery, well-suited for identifying and classifying WPV regions. We utilized atmospherically corrected Level-2A surface reflectance products from the Sentinel-2 MSI sensor, which provide 13 spectral bands. Six key bands sensitive to water bodies and artificial structures were selected: Bands 2–4 (visible) and Band 8 (near-infrared, NIR) at 10 m resolution, and Bands 11–12 (SWIR) at 20 m resolution. To reduce cloud interference, a cloud-masking algorithm was applied, and annual median composites were generated from all available images (Gorelick et al., 2017). These composites improve radiometric consistency and provide a stable spatial baseline for dynamic WPV detection and temporal analysis.
2.2.2 Water body datasets
A water mask of the Yangtze River Delta (YRD) was constructed to delineate potential water areas within the study region. To construct the water mask for WPV mapping, we integrated four waterbody-related datasets: HydroLAKES, GRanD, GOODD, and GeoDAR (Lehner et al., 2011; Messager et al., 2016; Mulligan et al., 2020; Wang et al., 2022a). HydroLAKES provided lake boundaries and associated attributes, while GRanD supplied reservoir polygons and reservoir-related information. GOODD and GeoDAR, which contain georeferenced dam records, were used as complementary datasets to support reservoir identification where reservoir boundaries or attribute information was incomplete or uncertain. These datasets were harmonized into a unified maximum historical water extent layer for the study area. This integrated layer was used as a consistent spatial mask to constrain the analysis to long-term potential water bodies, rather than as a year-specific annual water mask.
In this study, reservoirs were defined as water bodies formed by dams or other engineered hydraulic infrastructure and subject to artificial water-level regulation. In contrast, lakes were defined as inland water bodies without reservoir functions, including natural lakes and other non-reservoir surface water bodies. This distinction is relevant for WPV analysis because reservoirs generally exhibit more regulated water levels and are associated with different ownership and management regimes than lakes. By integrating these four datasets, an integrated water layer for the study area was generated. This layer provides a consistent spatial reference and supports the identification of water-surface photovoltaics using Sentinel-1 SAR and Sentinel-2 optical imagery.
2.2.3 Training and validation samples
The training and validation samples used in this study were derived from the WPV inventory (Xia et al., 2022), which mapped the distribution of WPV installations in China for 2021. Because the original dataset contained several misclassified regions, a manual verification process was conducted to ensure the reliability of the labels. Each WPV polygon was visually checked using high-resolution satellite imagery, and misidentified areas were removed. WPV sample points were generated proportionally to the area of each WPV polygon to ensure adequate representation of large installations. Examples from three representative WPV regions are shown in Fig. 2a–c, demonstrating typical distribution patterns across different water bodies. Non-WPV samples were randomly selected from water surfaces without WPV coverage to provide balanced class representation.
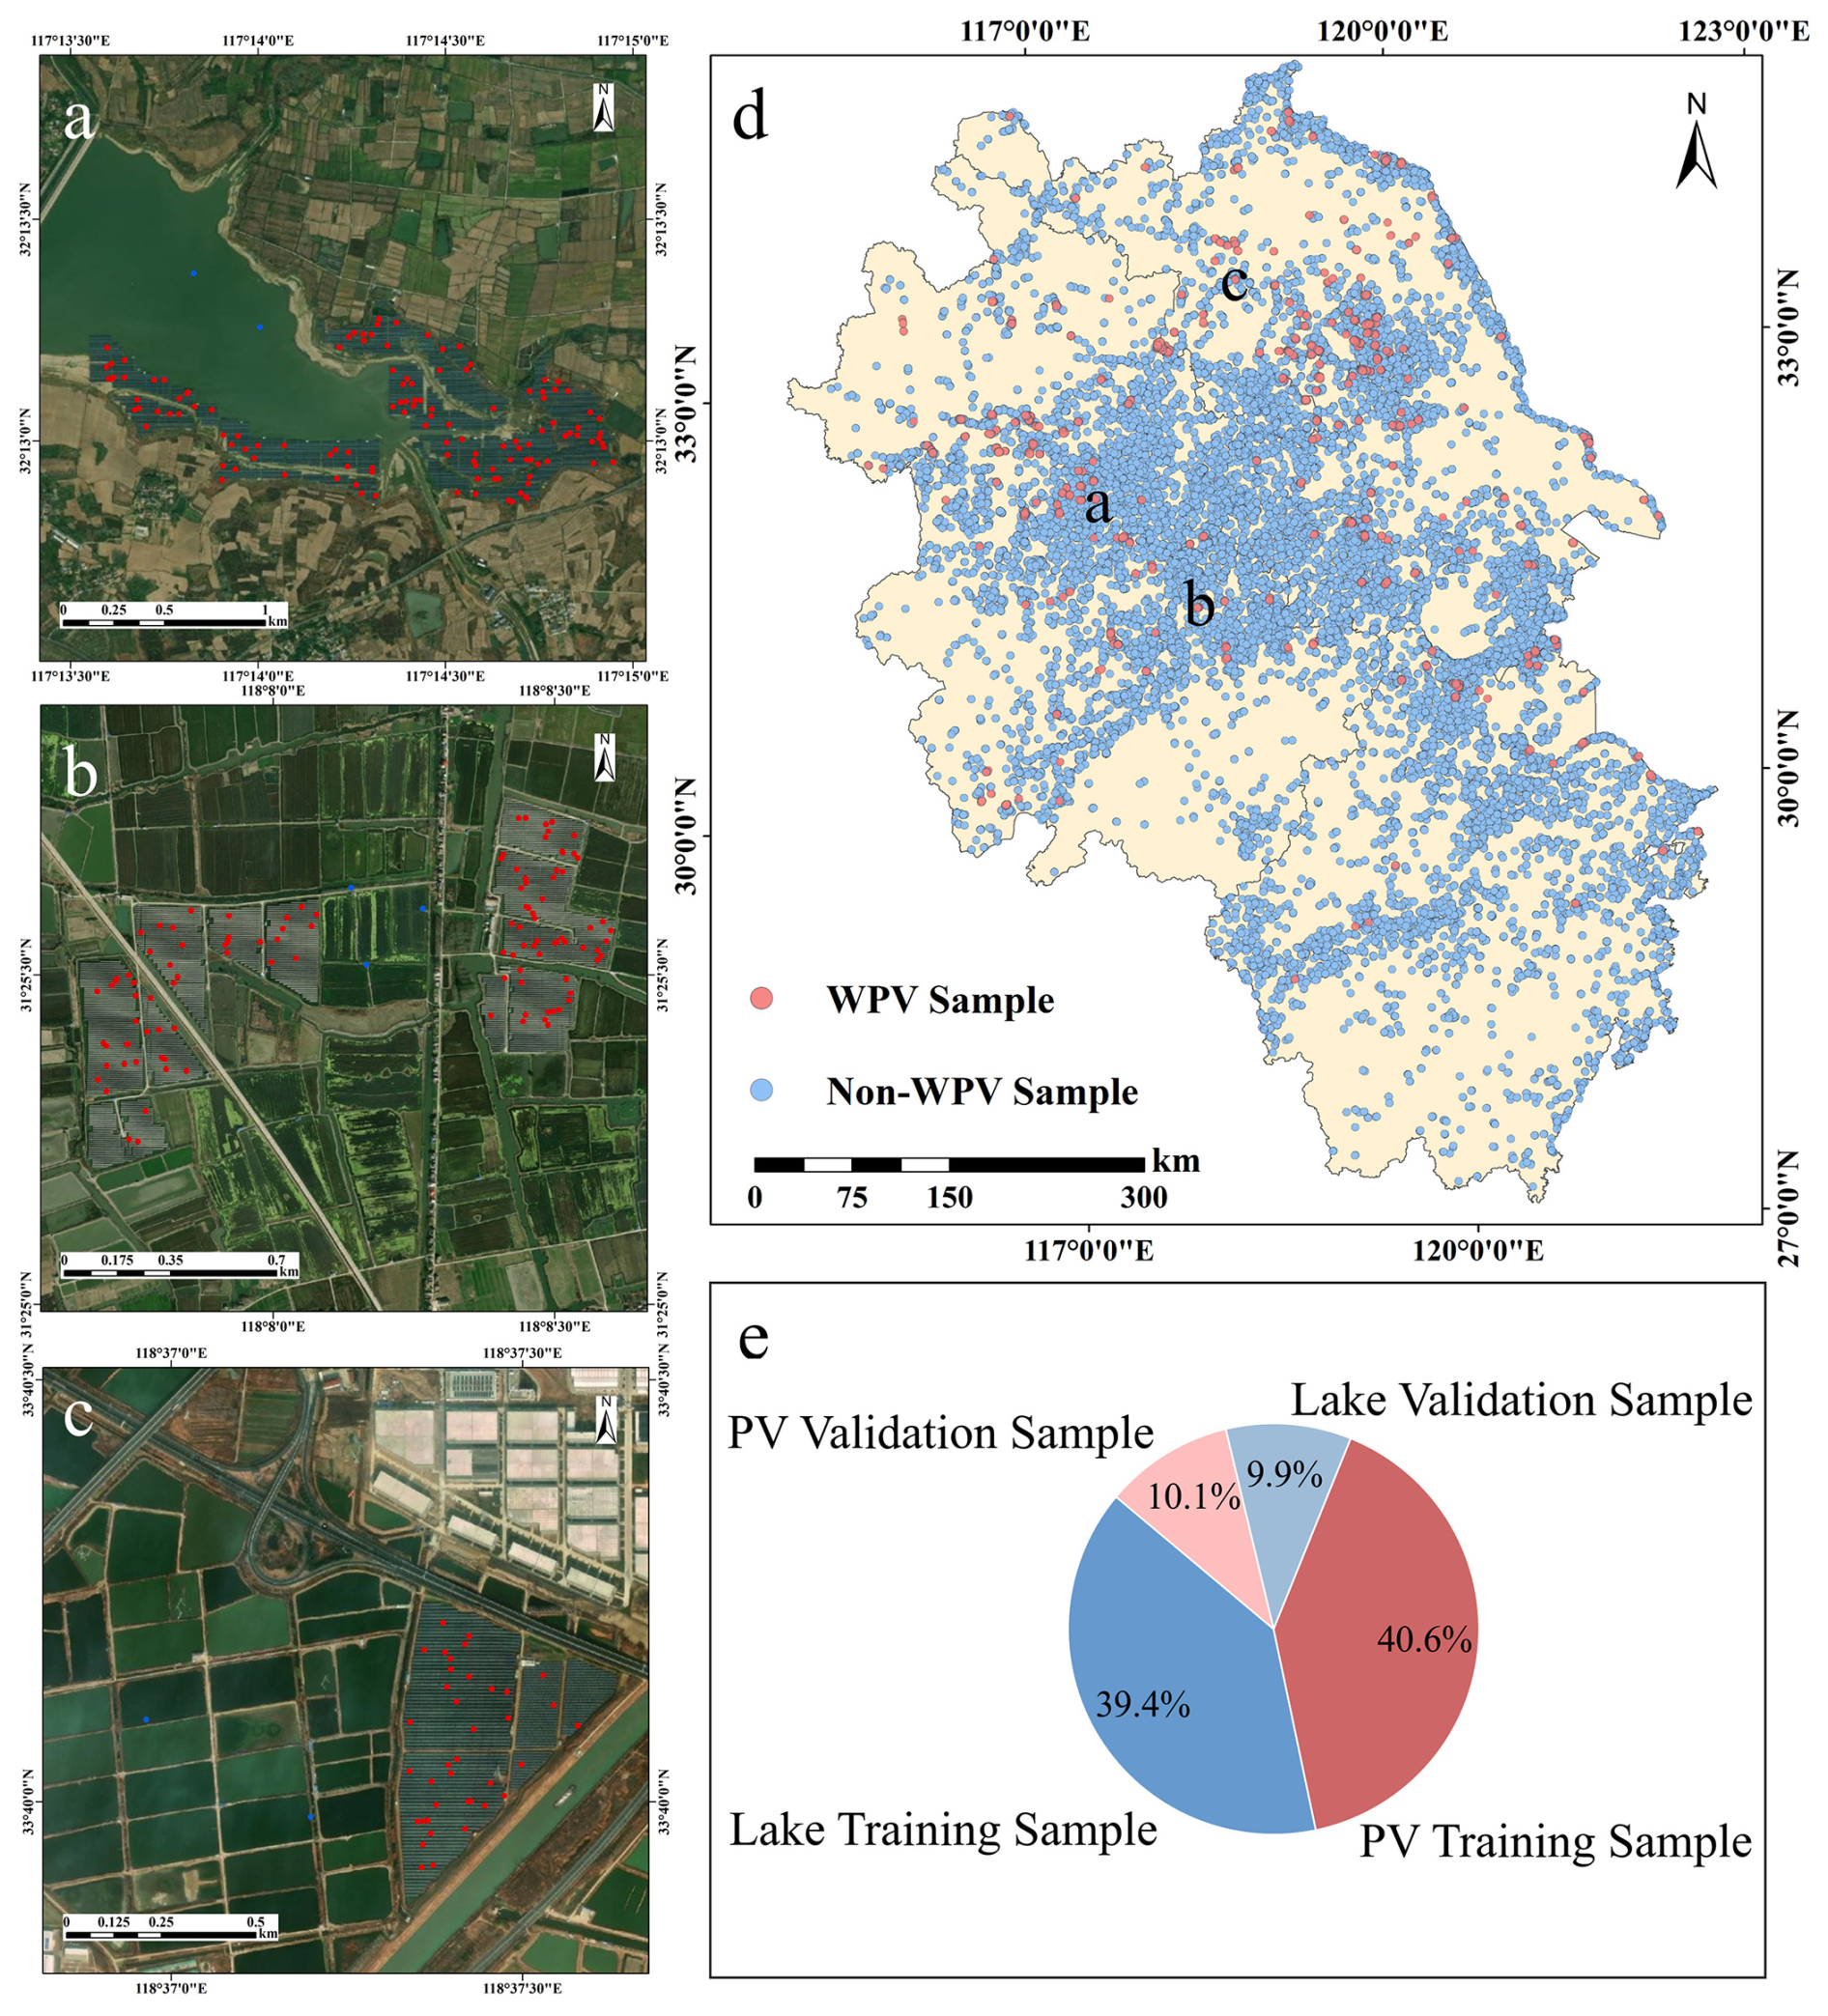
Figure 2Distribution and examples of samples. (a–c) Examples of representative sample regions, where red points indicate WPV samples and blue points indicate non-WPV samples; (d) spatial distribution of WPV and non-WPV samples across the study area; (e) proportions of different sample categories (source: Google Earth Pro, © 2025 Airbus, © 2025 Airbus/CNES, © 2025 Maxar Technologies).
The spatial distribution of all sample points is illustrated in Fig. 2d, where red points represent WPV samples and blue points represent non-WPV samples. In total, the dataset consists of 55 849 labeled points (80 % for training and 20 % for validation), including 28 332 WPV and 27 517 non-WPV samples (Fig. 2e). These manually verified samples provided the basis for subsequent annual classifications from 2015 to 2024.
2.3 WPV extraction workflow
2.3.1 WPV feature engineering
To reduce interference from temporary shoreline fluctuations and to focus the analysis on long-term potential water areas, we filtered Sentinel-2 MSI imagery using a unified maximum historical water extent mask, rather than deriving an independent water mask for each year. Six spectral bands (Bands 2–4 (visible), Band 8 (NIR), and Bands 11–12 (SWIR)) were selected as input features due to their sensitivity to water bodies and artificial structures. To minimize the influence of cloud cover and provide consistent annual surface conditions, annual median composites were generated from all available images within each year. To enhance the distinction between water bodies and WPV installations, we integrated a comprehensive set of additional features:
Spectral indices: Normalized Difference Vegetation Index (NDVI), Modified Normalized Difference Water Index (MNDWI), Normalized Difference Built-up Index (NDBI), Normalized Difference Photovoltaic Index (NDPI), and Soil-Adjusted Vegetation Index (SAVI), based on Eqs. (1)–(5). These indices have been shown to be effective for photovoltaic detection (Feng et al., 2024). Specifically, NDVI and SAVI helped reduce confusion between WPV and vegetated surfaces such as emergent or floating vegetation near shorelines, MNDWI improved the separation of panel-covered water from open water, and NDBI/NDPI enhanced the discrimination of artificial panel surfaces that might otherwise resemble dark water in optical imagery.
Although some spectral indices are derived from the original optical bands and are therefore correlated with them, Random Forest is generally less sensitive to multicollinearity among predictors in classification tasks. As a result, the inclusion of both original bands and derived indices is unlikely to substantially affect model performance, although it may influence the interpretation of variable importance.
Texture features: Calculated from the B8 (NIR) band using the Gray Level Co-occurrence Matrix (Haralick et al., 1973). These features capture the characteristic spatial patterns of WPV arrays, which typically exhibit clear, regular boundaries that contrast with natural water bodies.
SAR-based backscatter data: We incorporated annual mean values from Sentinel-1 SAR VV and VH polarization bands to provide complementary SAR backscatter information, which is particularly valuable for WPV identification over water surfaces.
2.3.2 Annual WPV classification
Classification was performed using a random forest classifier implemented with the smileRandomForest algorithm in Google Earth Engine (GEE). The algorithm was selected because of its robustness, computational efficiency, and previous successful applications in photovoltaic mapping (Feng et al., 2024; Zhang et al., 2023). The classifier was trained using labeled samples from WPV installations and non-WPV water surfaces (Fig. 3a). We used 80 trees and selected 7 variables at each split. The remaining hyperparameters were kept at the default settings of the GEE implementation, including minimum leaf population (1), bag fraction (0.5), maximum nodes (null), and random seed (0). After model training, the classifier was applied to annual imagery to classify each year from 2015 to 2024, producing a decade-long time series of WPV distribution maps.
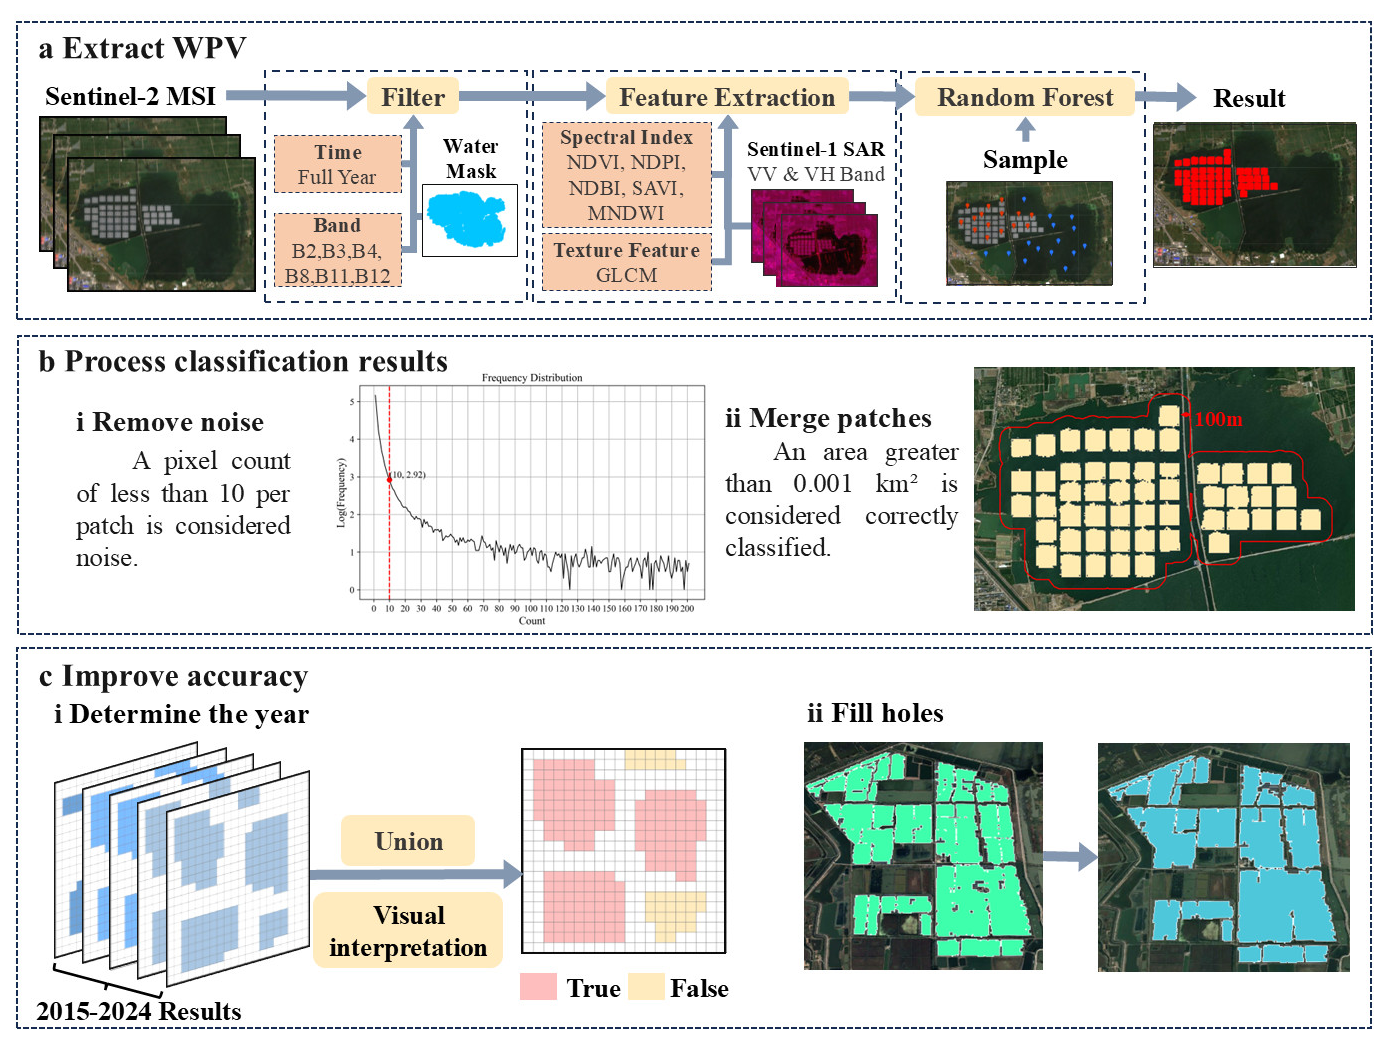
Figure 3Workflow for extracting WPV from satellite imagery. (a) WPV extraction workflow based on Sentinel-2 MSI and Sentinel-1 SAR data, including water masking, feature extraction (spectral indices, texture features, and SAR bands), and classification using a random forest model; (b) post-processing of classification results, including (i) removing noise patches smaller than 10 pixels, (ii) merging patches within 200 m of each other, and (iii) retaining patches with an area greater than 0.001 km2; (c) accuracy improvement procedures, including (i) determining installation years using annual temporal integration and visual interpretation, and (ii) filling small gaps within classified patches. The final dataset covers the period from 2015 to 2024 (source: Google Earth Pro, © 2025 Airbus, © 2025 Airbus/CNES, © 2025 Maxar Technologies).
2.3.3 Automated post-processing
Following the initial classification, we applied a systematic post-processing methodology to refine the results, remove non-WPV areas, and consolidate adjacent patches. This process, which is consistent with previous work (Hirayama et al., 2019), aimed to improve spatial consistency and reduce the workload for subsequent visual interpretation (Fig. 3b). Given that WPV installations typically occupy relatively large areas, we first performed noise removal by identifying and eliminating classified objects with fewer than 10 pixels. Additionally, WPV arrays located in proximity within the same water body are often part of the same project and installed concurrently. To accurately represent this, adjacent patches separated by less than 200 m were merged into single units. Finally, recognizing that larger WPV patches generally correlate with higher classification accuracy, only those with an area greater than 0.001 km2 were retained in the final results, improving the reliability of the final WPV inventory.
2.4 Accuracy assessment and manual refinement
2.4.1 Classification model assessment
To support the classification workflow, a stratified random sample comprising 20 % of the total dataset (5667 WPV points and 5507 non-WPV points) was held out for independent accuracy assessment. Classification performance was evaluated using four standard metrics: User Accuracy (UA), Producer Accuracy (PA), Overall Accuracy (OA), and the Cohen's Kappa coefficient.
2.4.2 Manual refinement and final dataset creation
To achieve high accuracy and completeness in our WPV extraction, we integrated the annual classified WPV maps (2015–2024) with external WPV datasets (Xia et al., 2022), creating a comprehensive set of potential WPV regions. Each potential region was then interpreted and corrected using high-resolution imagery available in Google Earth (Fig. 3c) to accurately identify and remove misclassified non-WPV areas, thereby improving the reliability of the final dataset. Specifically, each potential WPV region was checked for (1) its location within mapped water bodies, (2) the presence of regular and repetitive photovoltaic array patterns, and (3) separation from non-WPV objects such as shoreline buildings, roads, embankments, or floating vegetation. Since WPV installations are typically long-lasting, their installation year was determined by identifying the earliest year in which each installation became visible in high-resolution Google Earth imagery sequences. Given the generally persistent nature of WPV installations during the study period, previously confirmed WPV areas were retained in subsequent years unless clear evidence of removal was observed, while newly detected regions were added. Through this temporal consistency rule, the annual WPV dataset was constructed following a cumulative, non-decreasing pattern, reducing spurious year-to-year disappearance caused by classification noise, short-term hydrological variations, or image-quality differences, thereby enhancing the reliability of decadal trend estimation. Finally, internal gaps within the identified WPV patches were filled to ensure spatial completeness, facilitating more precise calculations of area and surface coverage.
3.1 Accuracy assessment and comparison of WPV extraction results
To evaluate the performance of our WPV extraction results, we conducted a multi-level validation and comparison process. This section presents a systematic assessment of classification performance from three complementary perspectives. First, the initial classification outputs were visually inspected and refined to examine the influence of the post-processing procedure. Then, single-year and multi-year merged datasets were compared to evaluate the temporal stability of WPV detection results. Finally, our dataset was compared with existing global PV products, including a global inventory of photovoltaic solar energy generating units as of the end of 2018 (Kruitwagen et al., 2021) and Global Renewables Watch in 2024 (Robinson et al., 2025), to assess spatial coverage and consistency. Both qualitative and quantitative analyses were performed, including confusion-matrix-based accuracy assessment and detailed visual interpretation across representative regions. Together, these evaluations provide a thorough verification of the accuracy, continuity, and advantages of our WPV dataset.
3.1.1 Evaluation of initial and refined WPV extraction results
To visually examine the impact of the post-processing workflow, we compared the initial and refined WPV classification results (Fig. 4). The initial classification results (Fig. 4b, e, h) contained residual noise and misclassification, including small isolated patches and fragmented boundaries along water edges. These inaccuracies were likely associated with spectral confusion between WPV installations and nearby structures or floating vegetation. After systematic post-processing and manual correction (Fig. 4c, f, i), the final results exhibited cleaner boundaries and more coherent WPV patches. The red outlines clearly delineate WPV areas, indicating improved spatial consistency and fewer apparent false positives. This refinement process improved the consistency of the extracted WPV maps, providing a foundation for subsequent accuracy validation and spatial analysis.
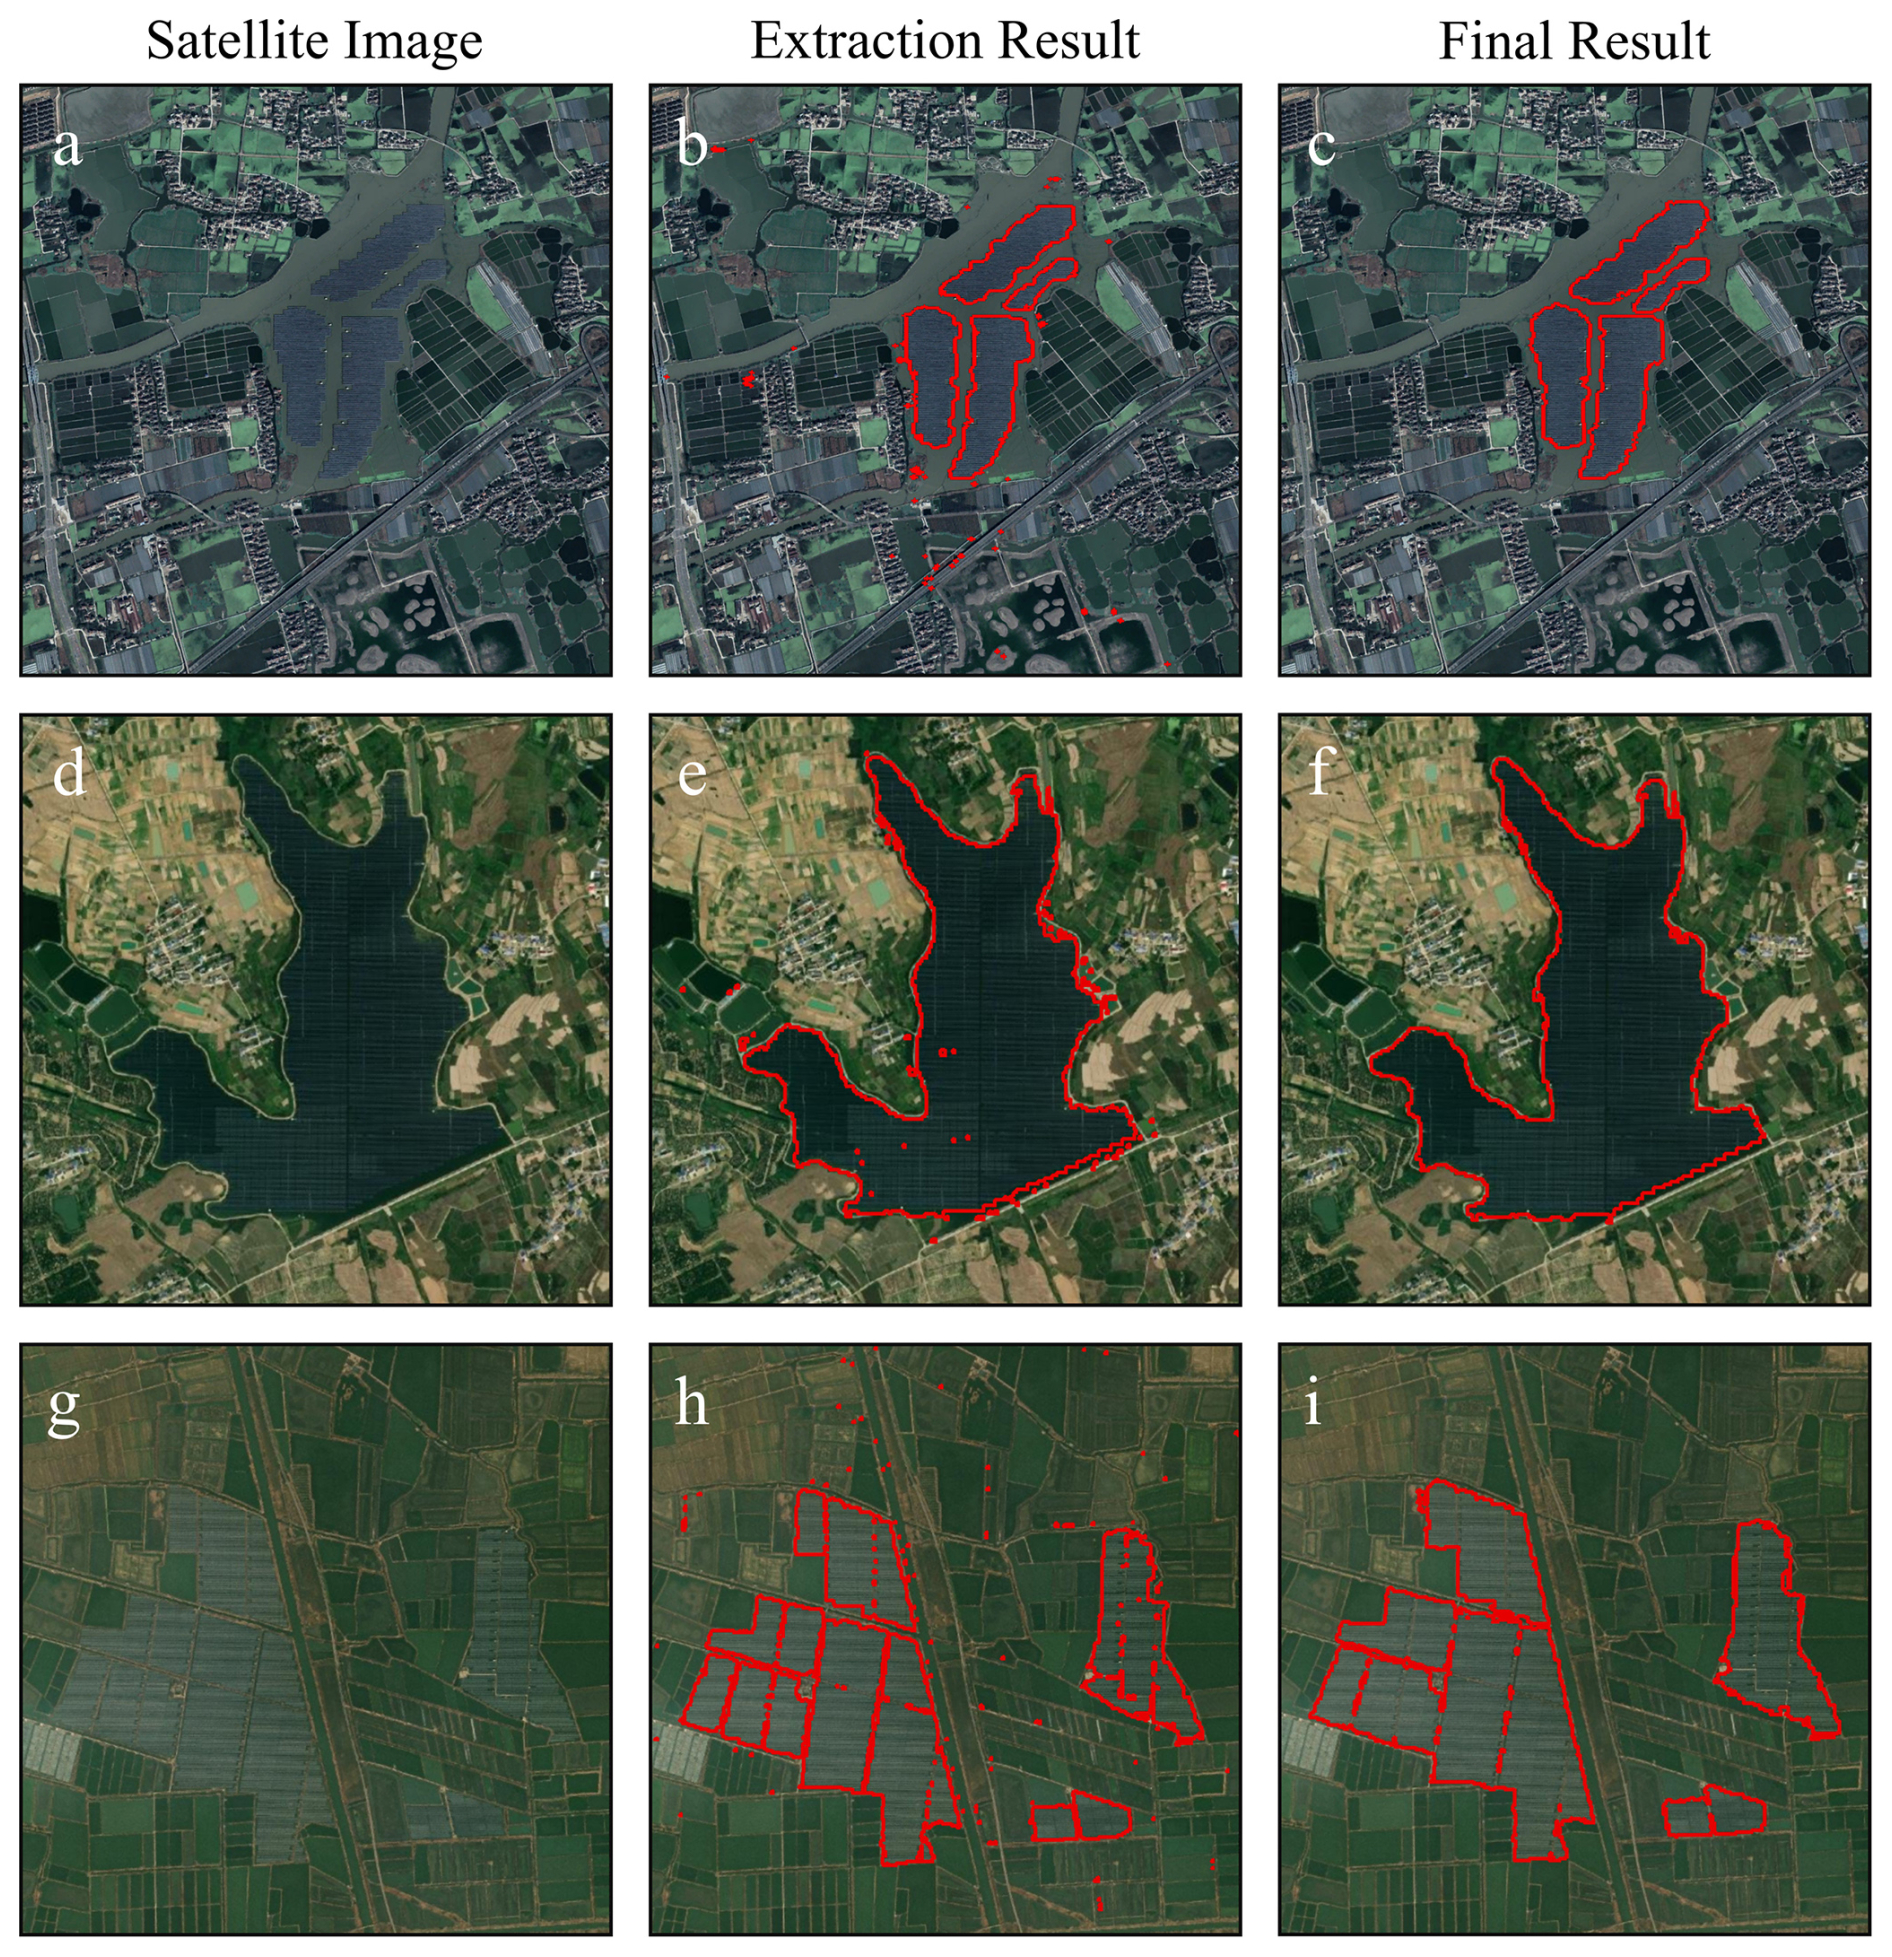
Figure 4Examples of WPV extraction results. Panels (a)–(c), (d)–(f), and (g)–(i) show three representative areas. (a, d, g) Satellite images; (b, e, h) initial WPV extraction results; (c, f, i) final results after manual correction. Red outlines indicate WPV boundaries. The three areas are located at (a–c) 30°51′40.54′′ N, 120°44′30.47′′ E; (d–f) 32°06′03.69′′ N, 117°33′00.10′′ E; and (g–i) 32°58′06.10′′ N, 119°37′09.47′′ E (source: Google Earth Pro, © 2025 Airbus, © 2025 Airbus/CNES, © 2025 Maxar Technologies).
3.1.2 Comparison of single-year and multi-year merged results
We compared WPV extraction results obtained from single-year imagery with those derived from merged multi-year datasets (Figs. 5, 6), providing an assessment of the influence of temporal data integration. The results indicate that single-year classifications on both lakes and reservoirs frequently showed incomplete coverage (Figs. 5a–b, d–e, g–h and 6a–b, d–e, g–h), with fragmented or missing WPV patches likely associated with cloud contamination or partial image coverage. By contrast, the merged 2015–2024 dataset (Figs. 5c, f, i and 6c, f, i) provided a more consistent delineation of WPV boundaries, as highlighted by the orange outlines. These improvements were particularly notable in turbid or seasonally fluctuating water bodies, where single-year imagery alone may fail to capture stable WPV features. Overall, the multi-year merging strategy improved both classification completeness and spatial continuity, providing a basis for temporal analyses of WPV expansion.
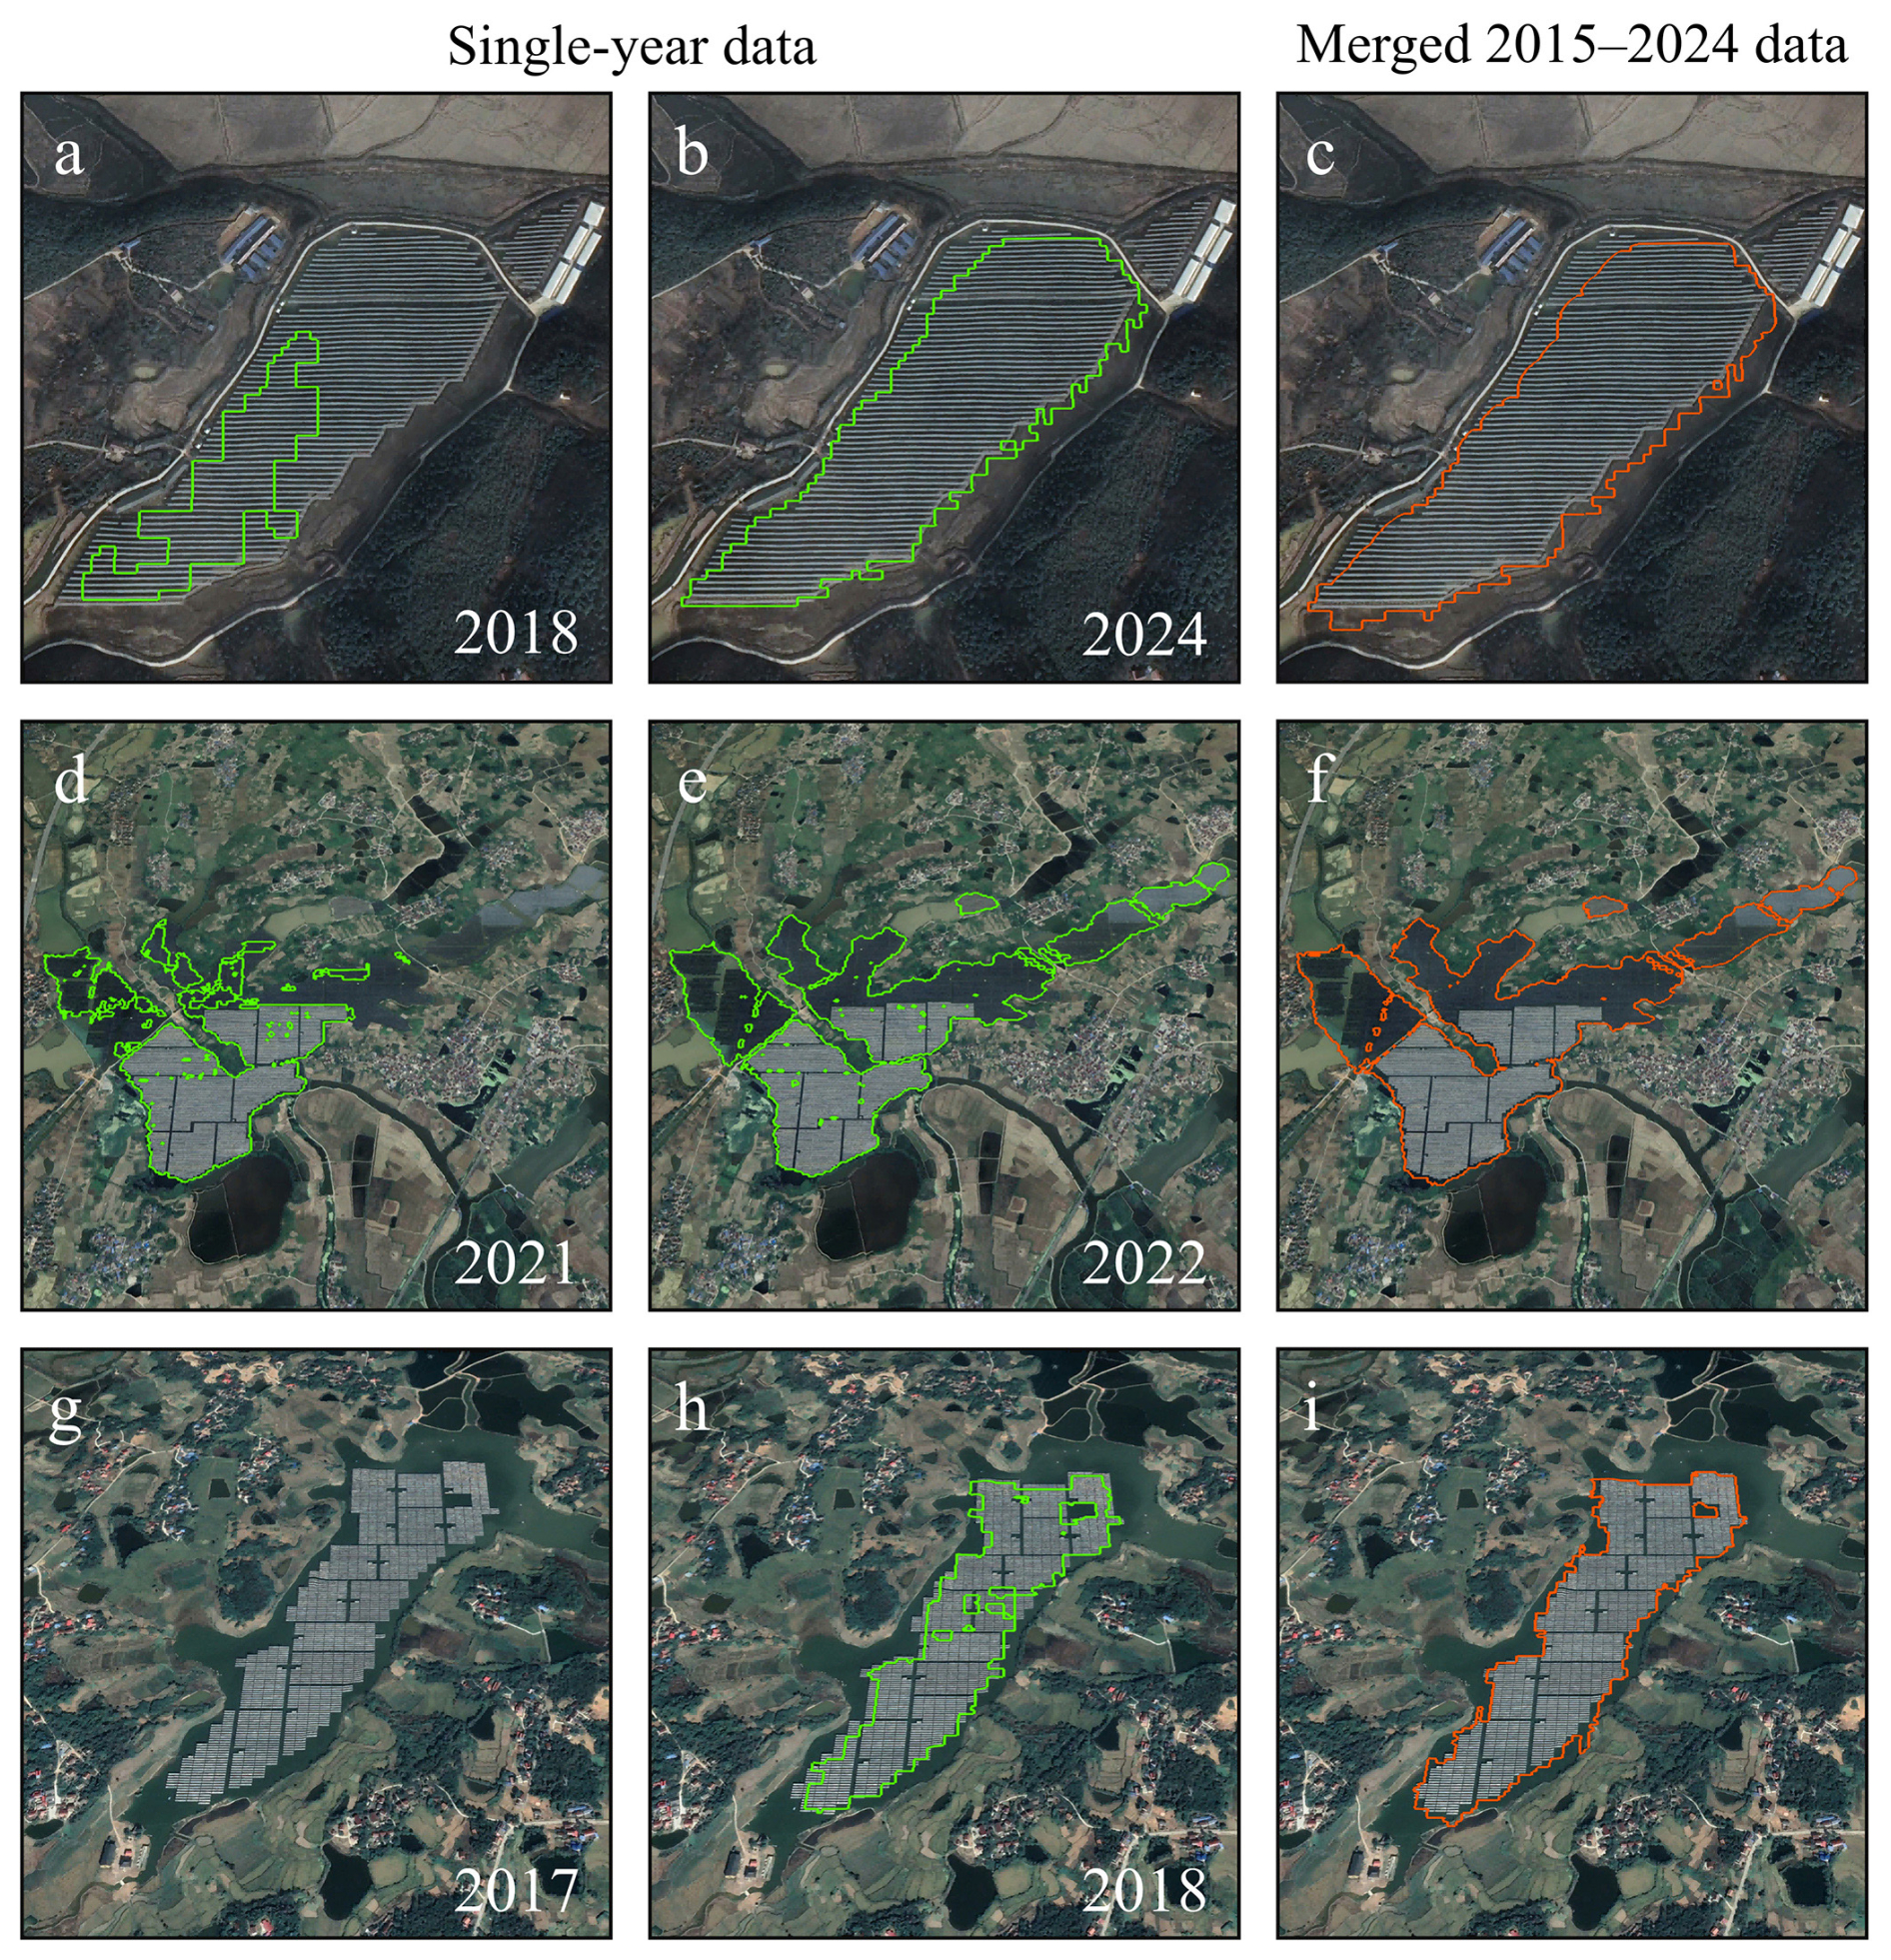
Figure 5Comparison between single-year and merged multi-year data for WPV extraction on lakes. Panels (a)–(c), (d)–(f), and (g)–(i) represent three representative areas. (a, d, g) WPV extraction results from single-year images, outlined in green; (b, e, h) corresponding single-year extraction results from different years; (c, f, i) WPV extraction results based on the merged 2015–2024 dataset, outlined in orange. The three areas are located at (a–c) 30°22′19.59′′ N, 116°21′50.00′′ E; (d–f) 30°36′26.69′′ N, 117°17′45.92′′ E; and (g–i) 30°44′55.34′′ N, 116°57′05.93′′ E (source: Google Earth Pro, © 2025 Airbus, © 2025 Airbus/CNES, © 2025 Maxar Technologies).
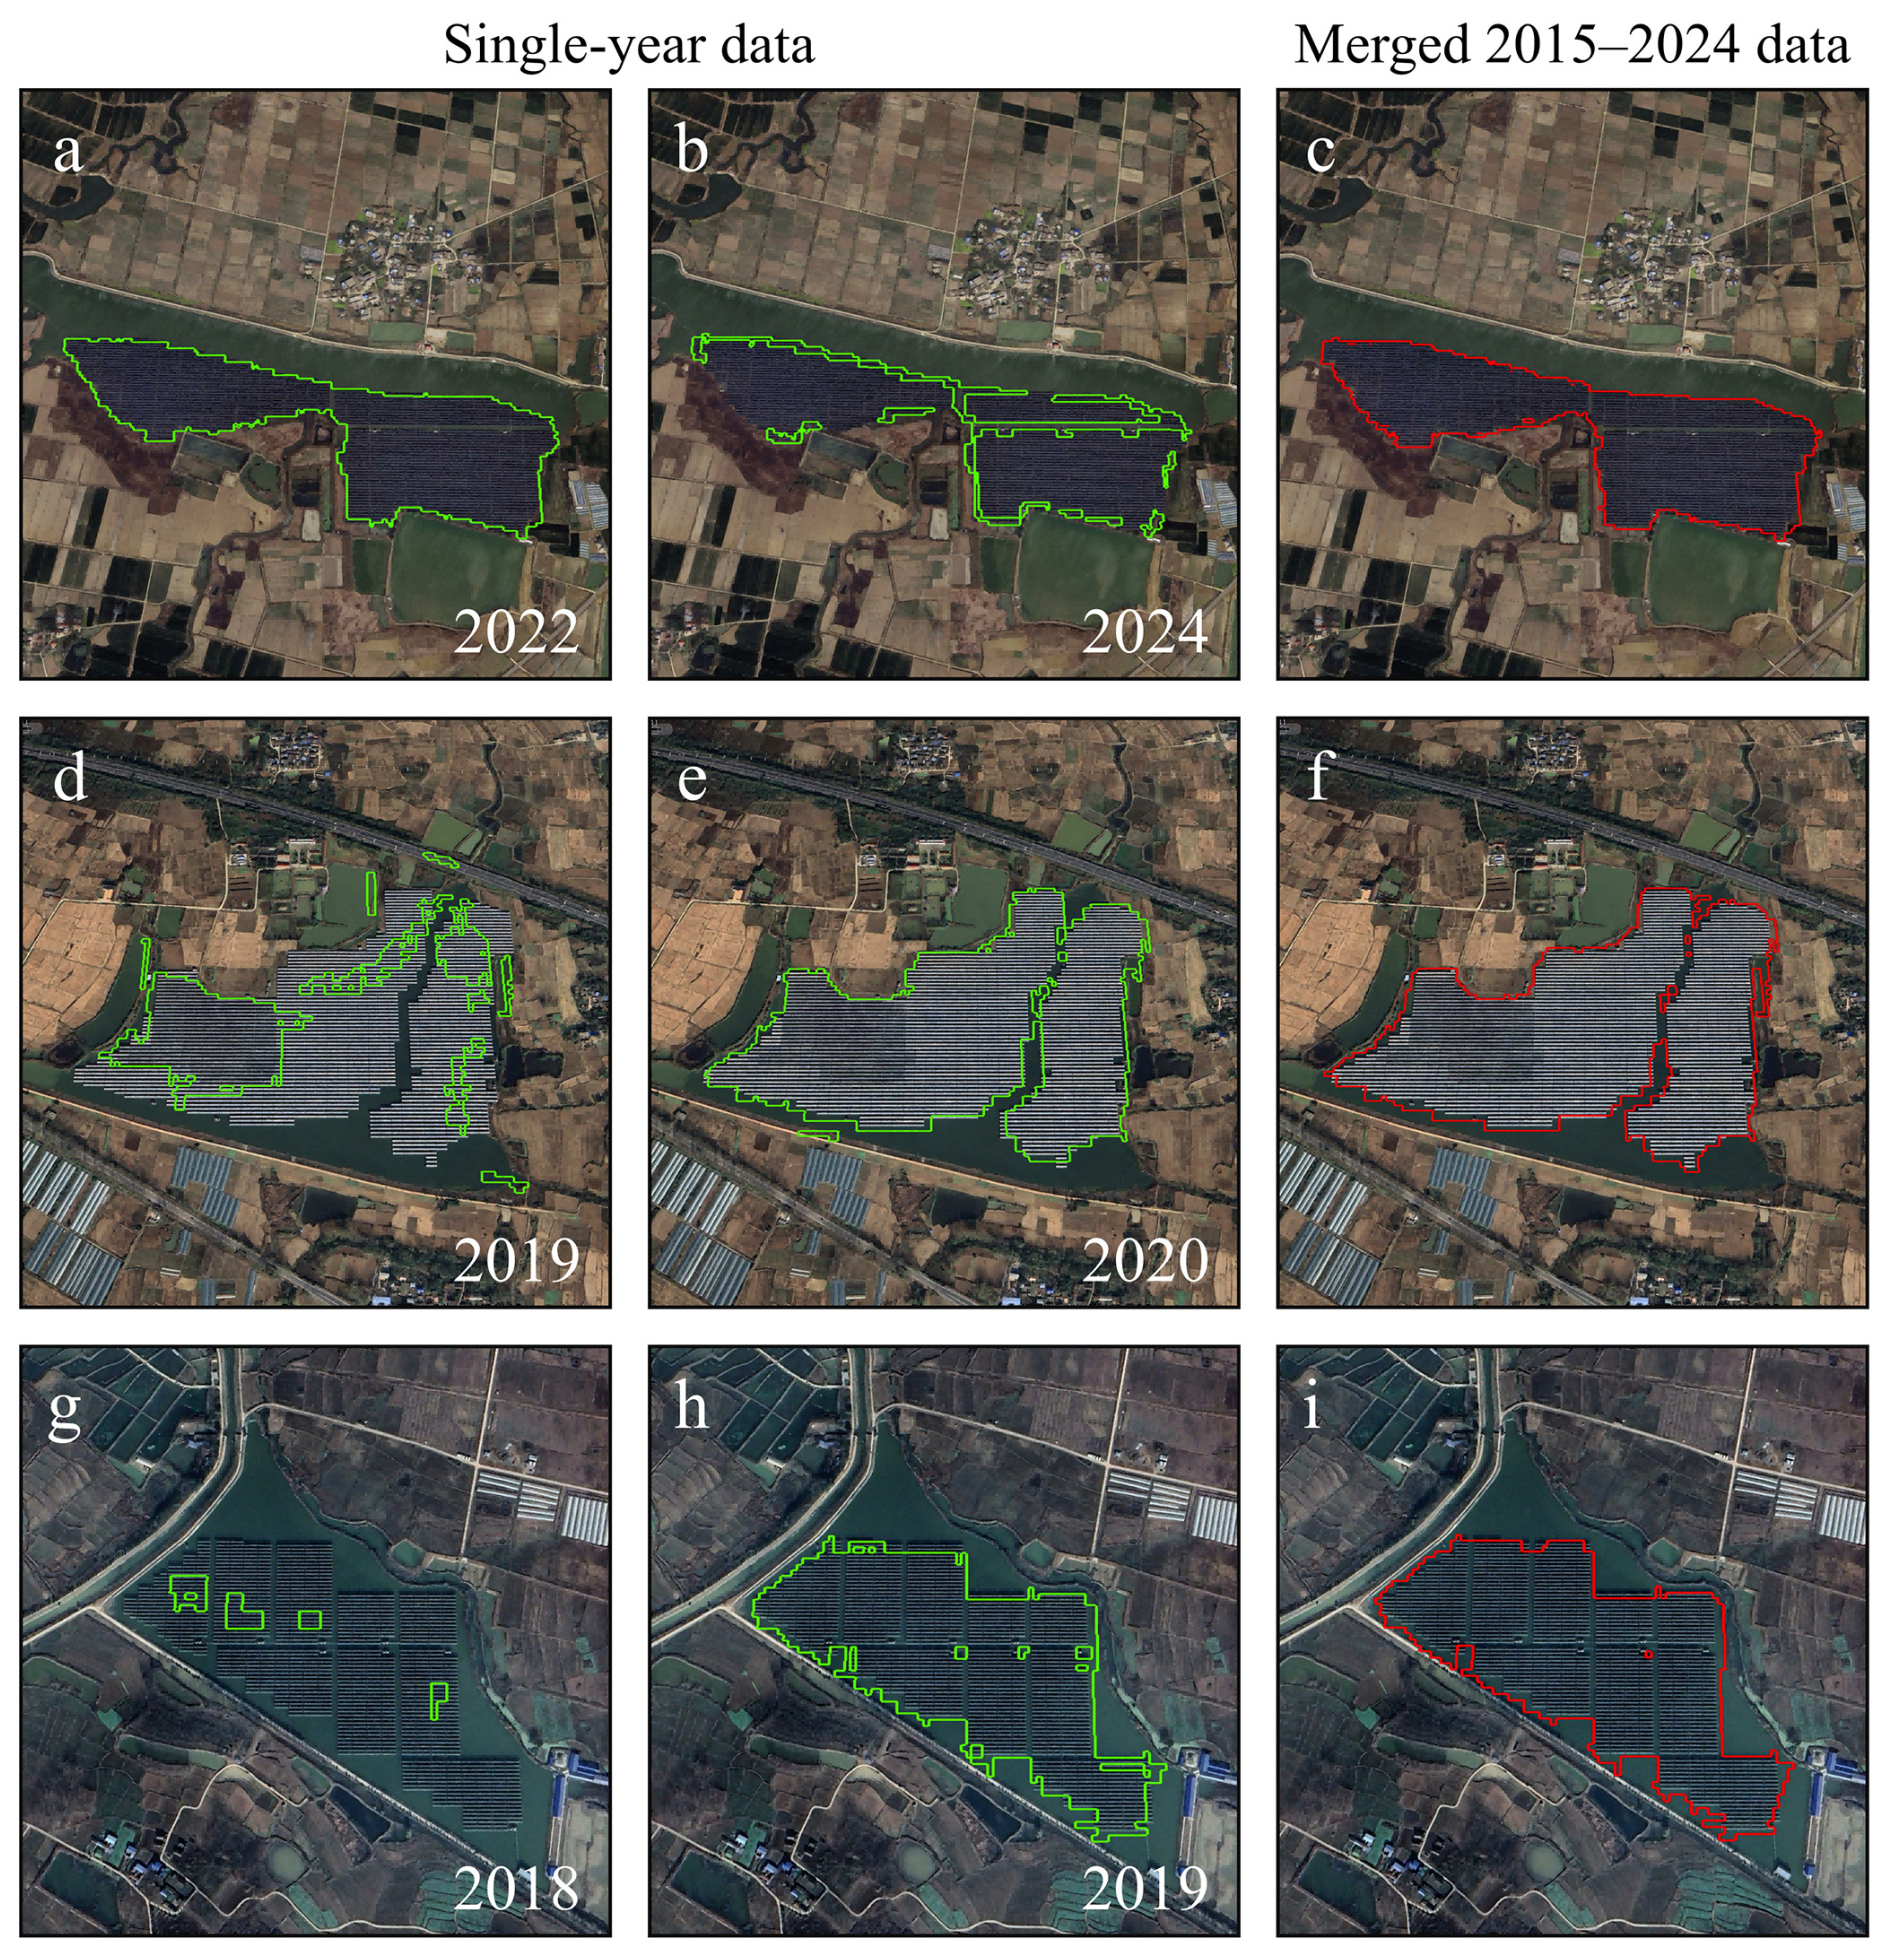
Figure 6Comparison between single-year and merged multi-year data for WPV extraction on reservoirs. Panels (a)–(c), (d)–(f), and (g)–(i) represent three representative areas. (a, d, g) WPV extraction results from single-year images, outlined in green; (b, e, h) corresponding single-year extraction results from different years; (c, f, i) WPV extraction results based on the merged 2015–2024 dataset, outlined in red. The three areas are located at (a–c) 32°43′54.10′′ N, 117°41′35.43′′ E; (d–f) 32°33′04.04′′ N, 116°55′38.40′′ E; and (g–i) 32°11′46.56′′ N, 117°02′51.31′′ E (source: Google Earth Pro, © 2025 Airbus, © 2025 Airbus/CNES, © 2025 Maxar Technologies).
3.1.3 Comparison with existing global PV datasets
We compared our WPV dataset with a global inventory of photovoltaic solar energy-generating units and Global Renewables Watch in terms of quantitative accuracy and spatial consistency. Six representative locations were selected to assess the performance of our dataset relative to these global datasets (Figs. 7, 8). Visual inspection indicates that the existing global datasets showed differences in WPV identification performance, including cases of misclassification or omission, particularly in small-scale or spatially complex inland water bodies. Figure 7 highlights instances of incomplete or erroneous WPV identification, whereas Fig. 8 shows multiple WPV regions that were not identified in the global datasets but were detected in our dataset.
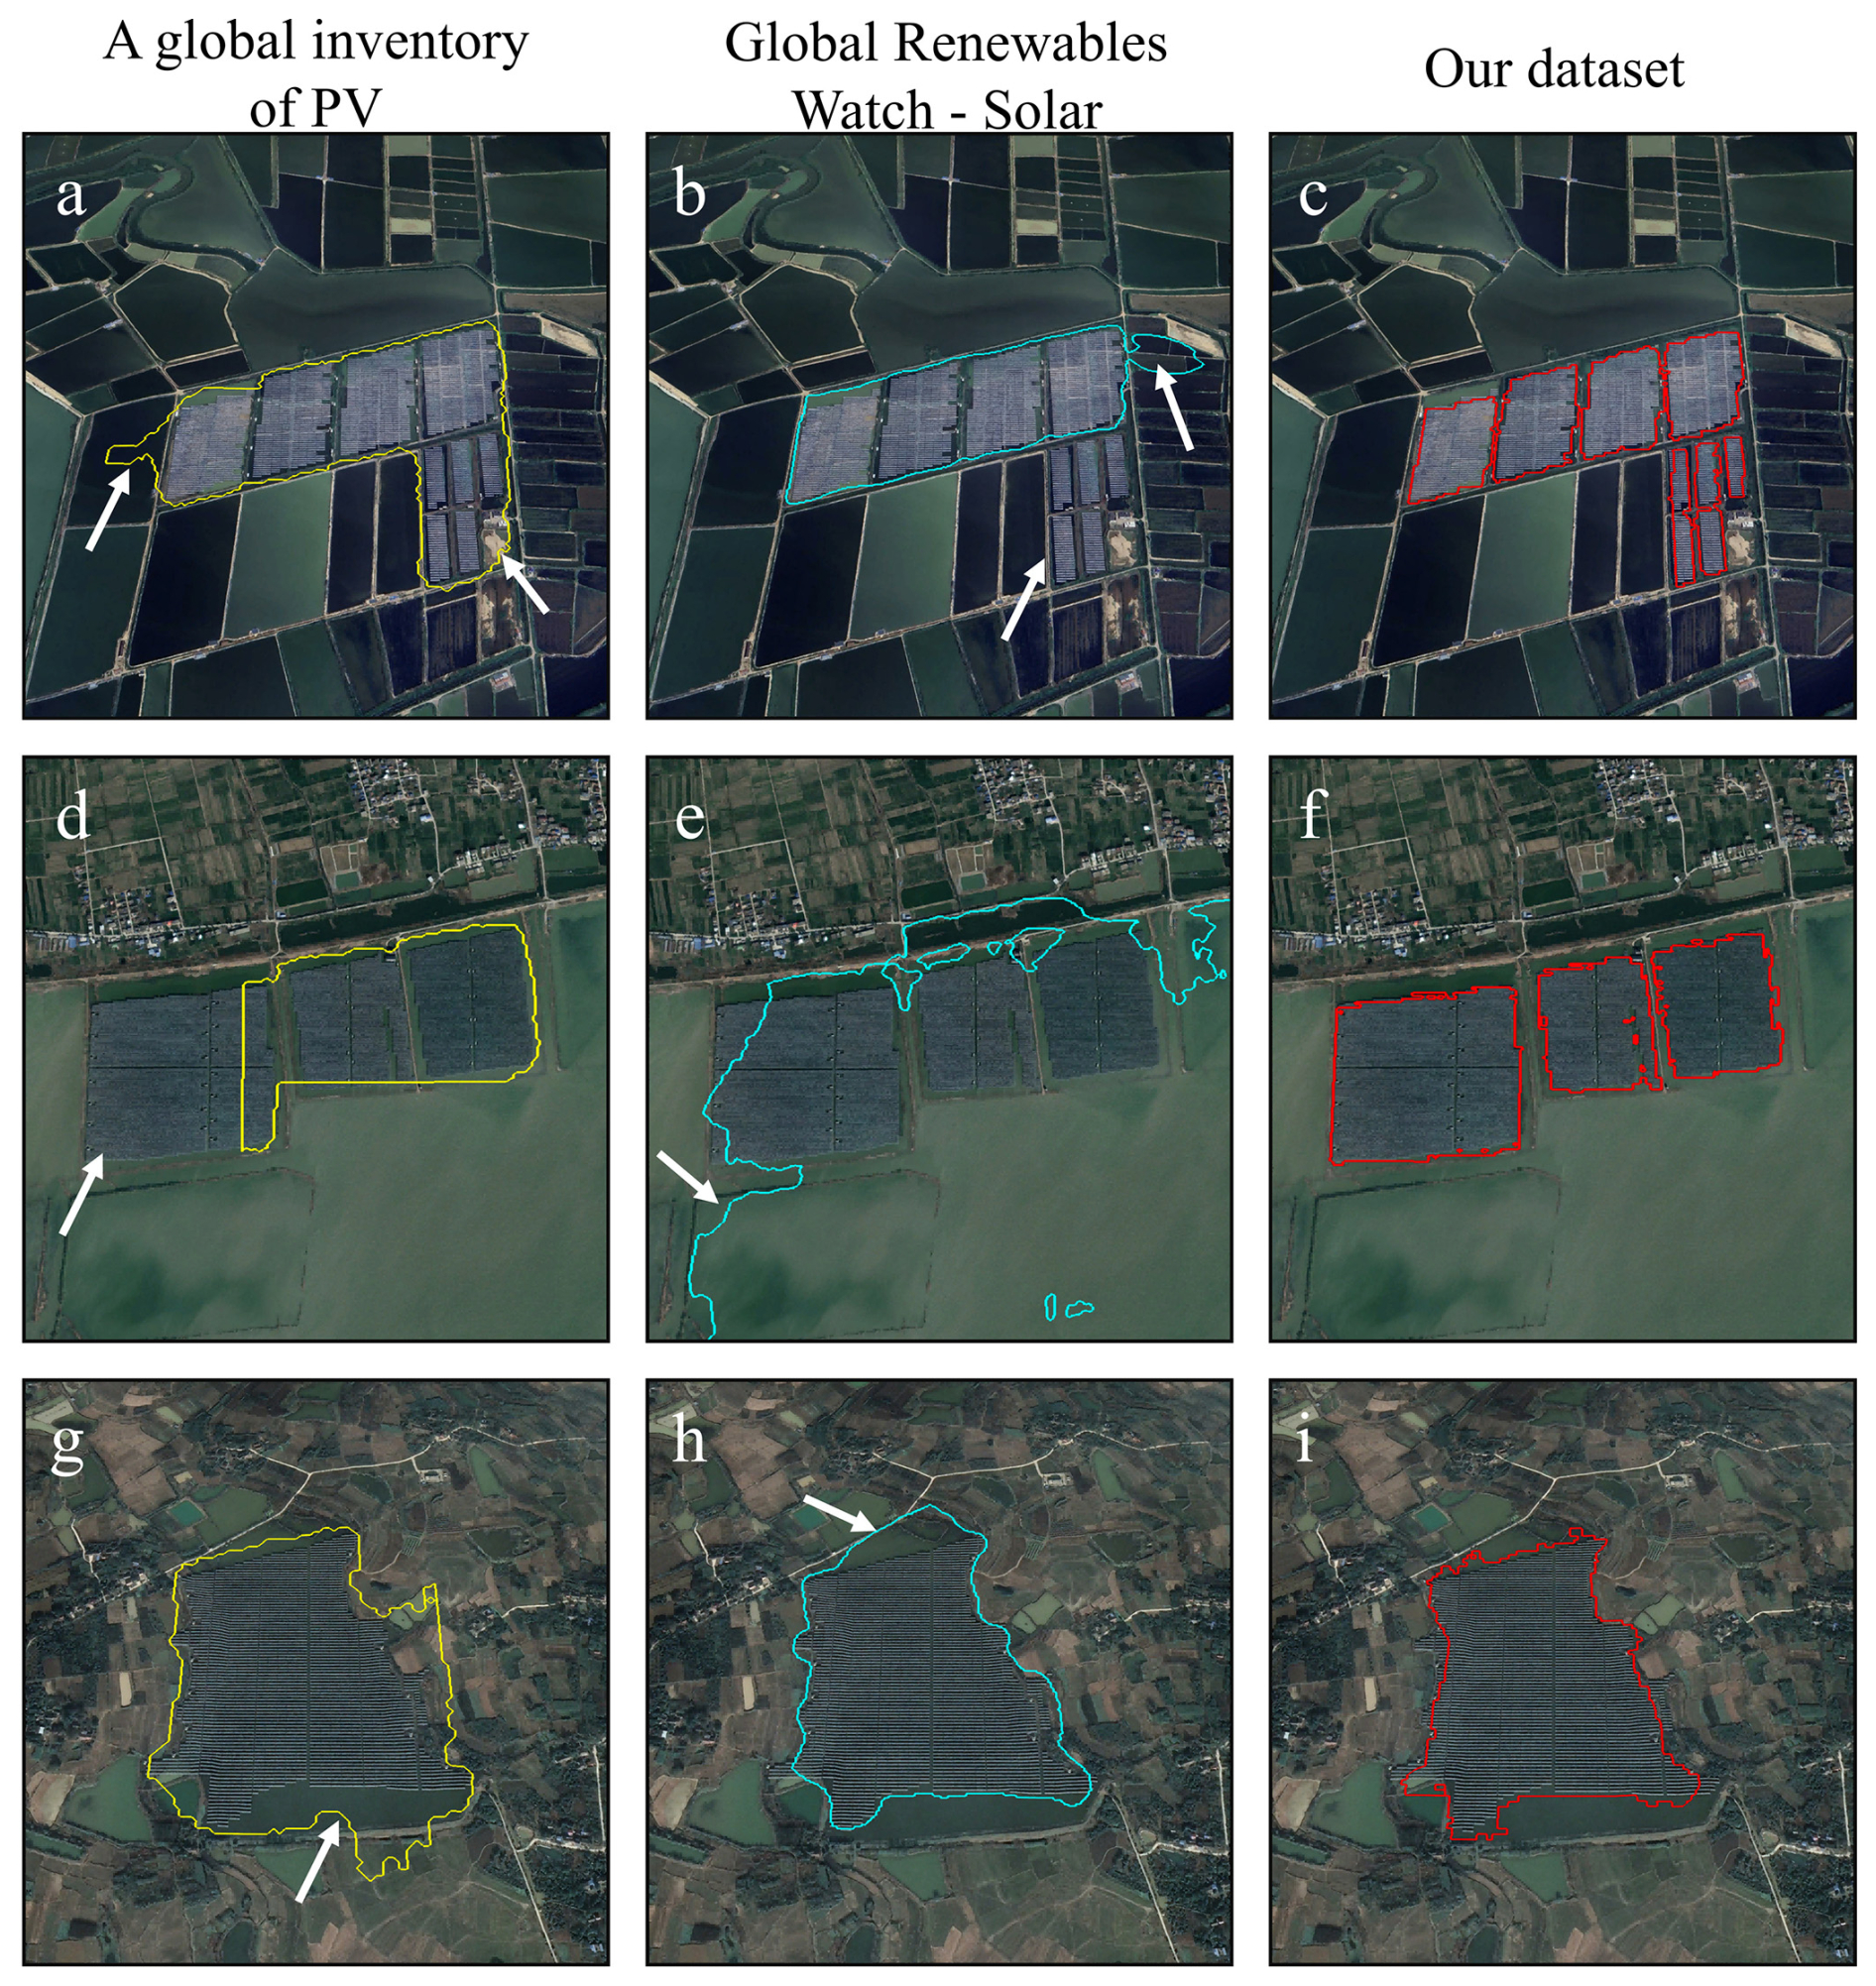
Figure 7Comparison of WPV extraction results with two global PV datasets (Kruitwagen et al., 2021; Robinson et al., 2025): examples of incomplete and incorrect identification. Panels (a)–(c), (d)–(f), and (g)–(i) represent three representative areas. (a, d, g) A Global Inventory of Photovoltaic Installations (Kruitwagen et al., 2021), outlined in yellow; (b, e, h) Global Renewables Watch (Robinson et al., 2025), outlined in blue; (c, f, i) Our WPV extraction results, outlined in red. The three areas are located at (a–c) 31°07′51.26′′ N, 119°02′42.41′′ E; (d–f) 32°36′34.53′′ N, 116°34′24.75′′ E; and (g–i) 31°35′19.28′′ N, 117°06′36.42′′ E (source: Google Earth Pro, © 2025 Airbus, © 2025 Airbus/CNES, © 2025 Maxar Technologies).
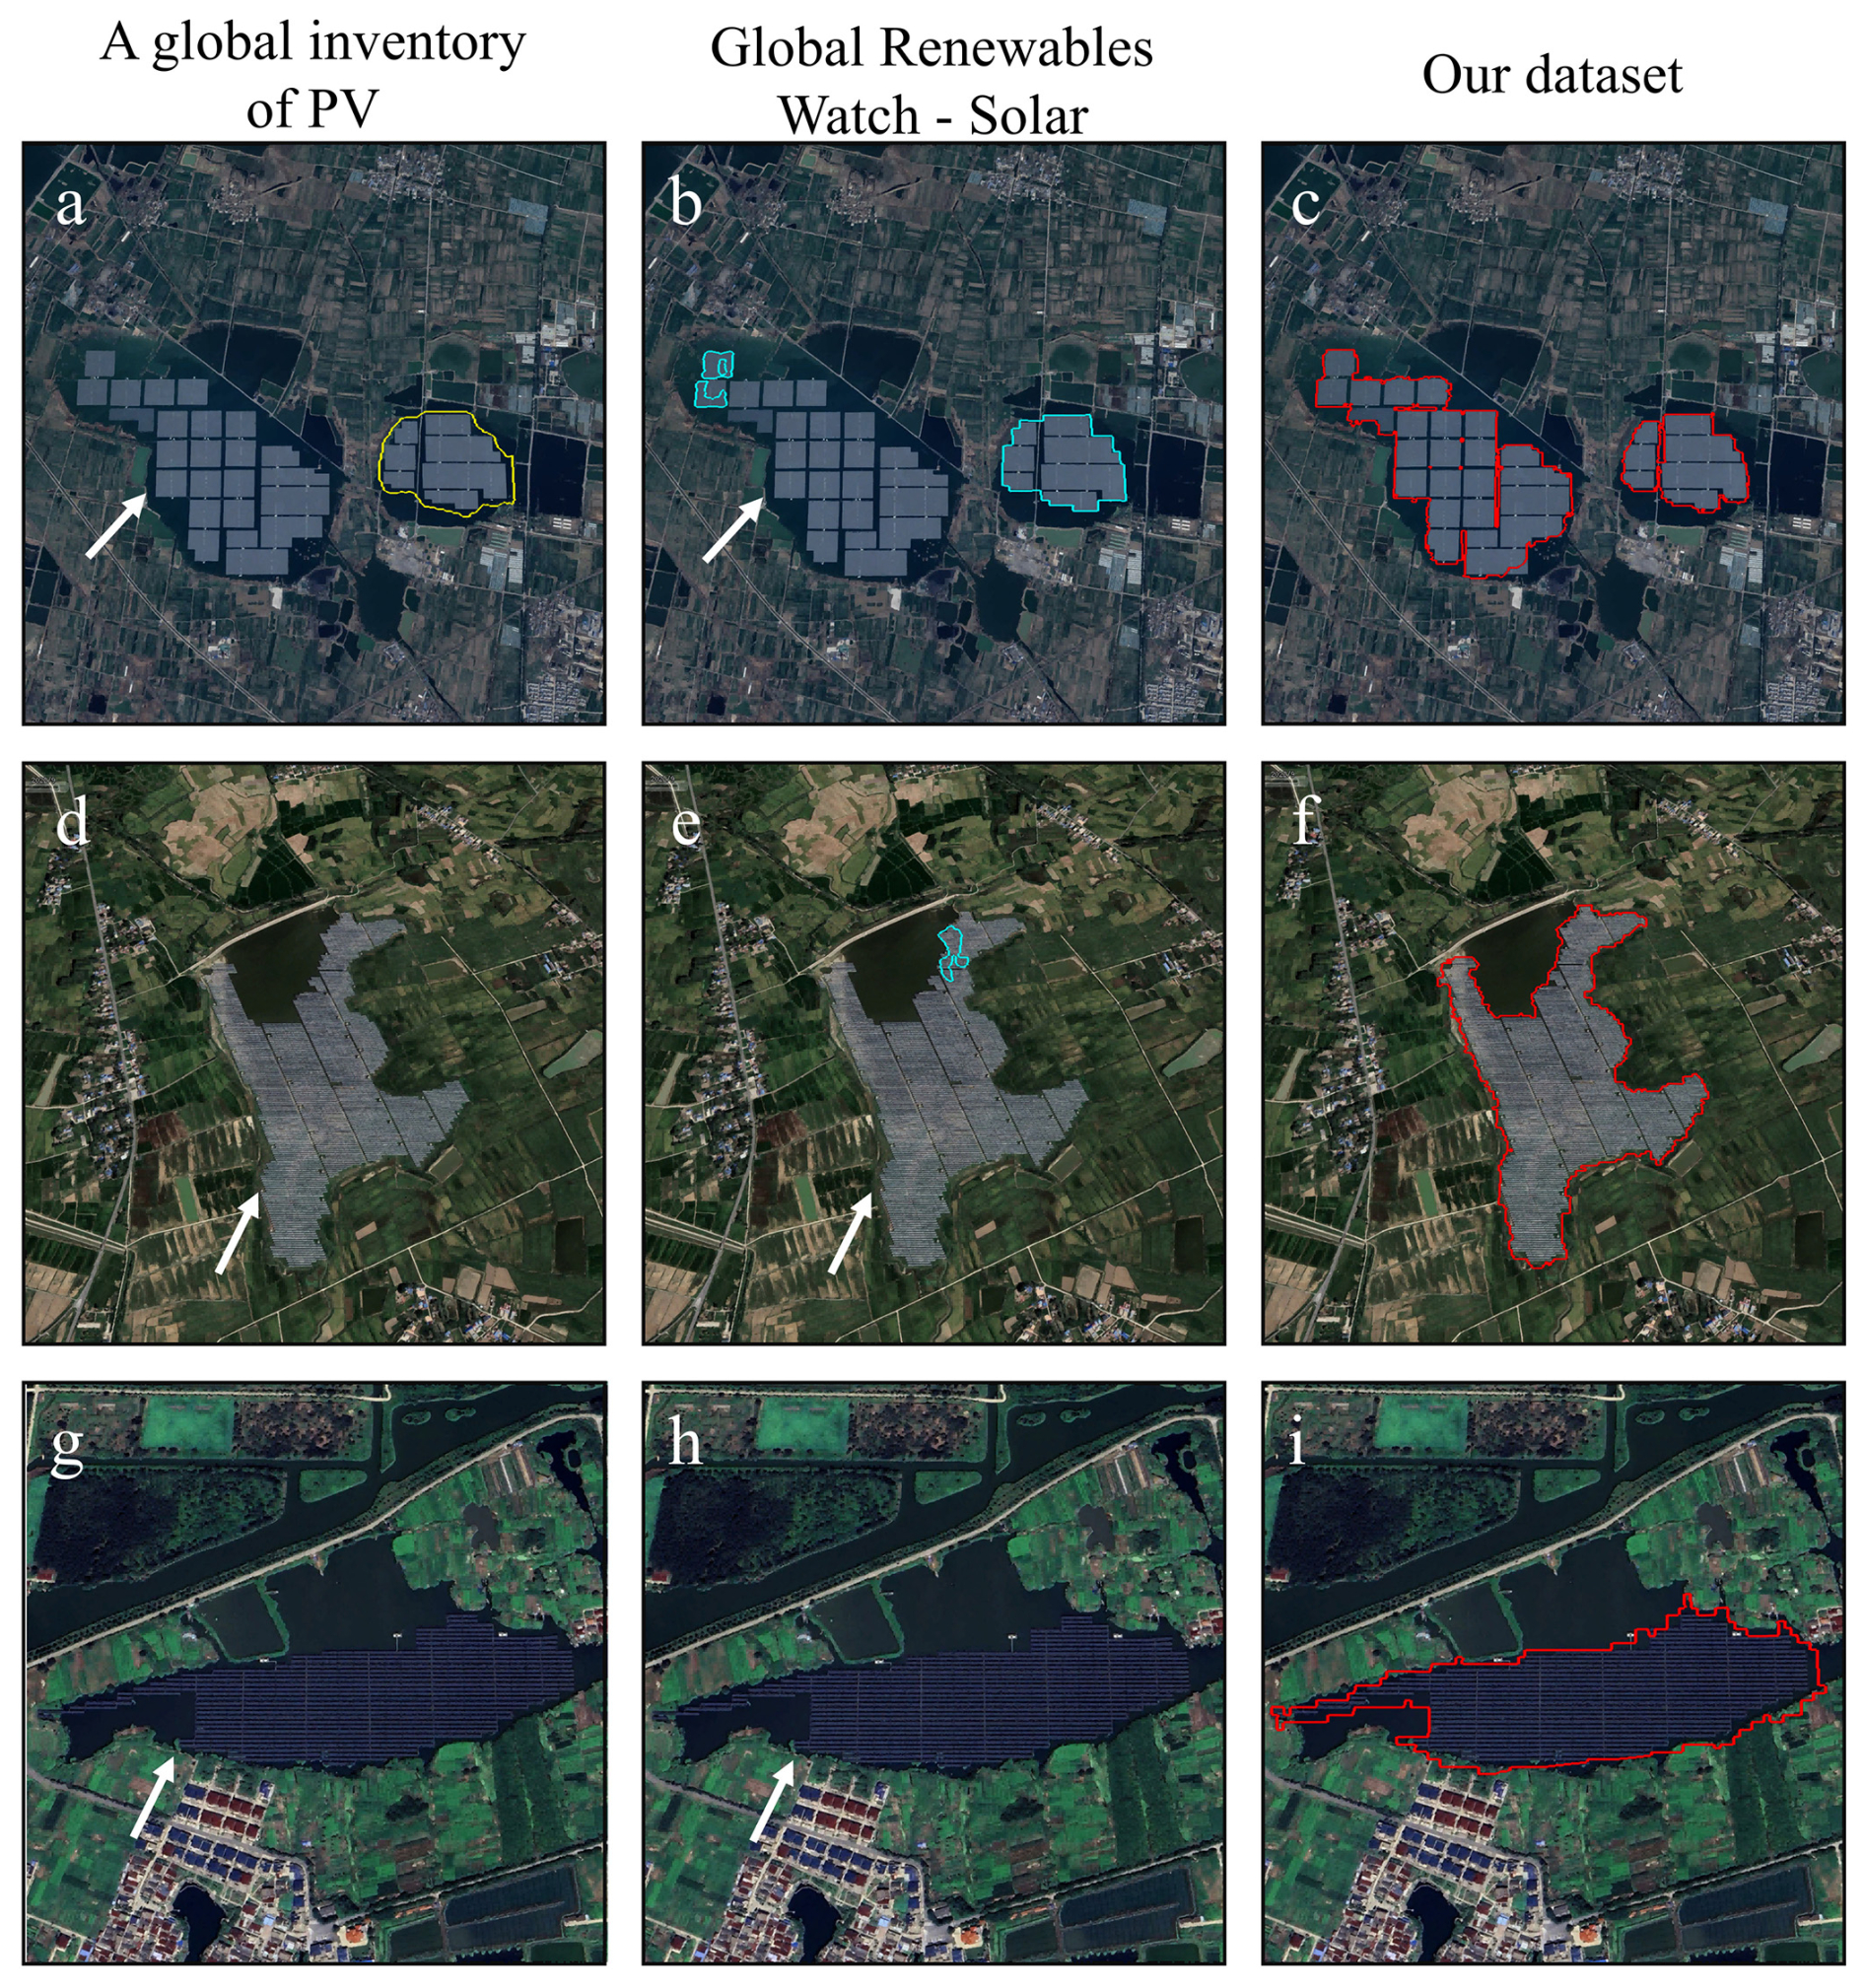
Figure 8Comparison of WPV extraction results with two global PV datasets (Kruitwagen et al., 2021; Robinson et al., 2025): examples of undetected WPV installations. Panels (a)–(c), (d)–(f), and (g)–(i) represent three representative areas. (a, d, g) A Global Inventory of Photovoltaic Installations (Kruitwagen et al., 2021), outlined in yellow; (b, e, h) Global Renewables Watch (Robinson et al., 2025), outlined in blue; (c, f, i) Our WPV extraction results, outlined in red. The three representative lake areas are located at (a–c) 32°49′16.10′′ N, 116°49′57.69′′ E; (d–f) 32°20′36.04′′ N, 117°21′11.29′′ E; and (g–i) 32°34′46.60′′ N, 119°58′03.91′′ E (source: Google Earth Pro, © 2025 Airbus, © 2025 Airbus/CNES, © 2025 Maxar Technologies).
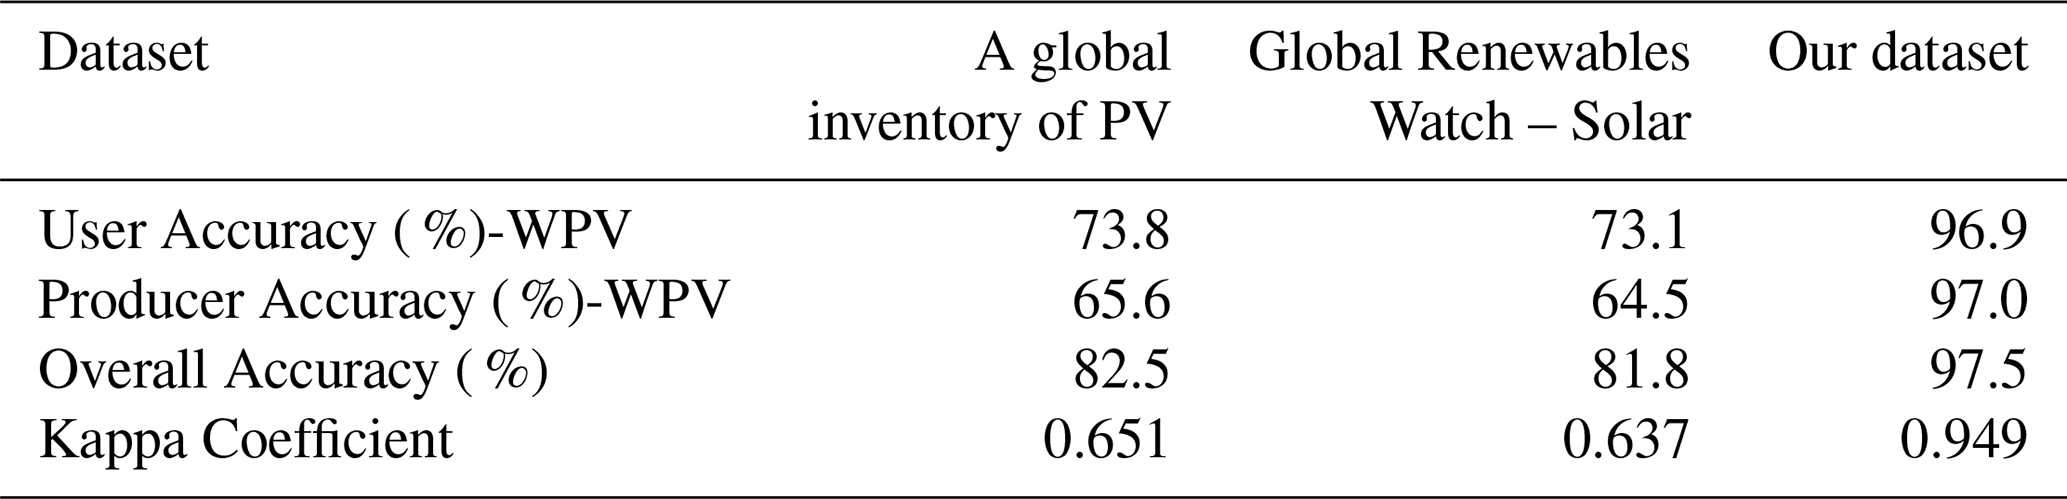
Quantitative accuracy assessment (Table 1) showed higher accuracy values for our dataset than for the two global datasets. Specifically, our WPV dataset achieved an OA and Kappa coefficient exceeding 0.9, while the corresponding metrics for the two global datasets were generally lower (OA: 0.825 and 0.818, Kappa: 0.651 and 0.637, respectively). These results indicate that our dataset provides higher classification accuracy and spatial completeness than the evaluated global datasets, suggesting that integrating multi-temporal imagery with regionally representative samples for training can improve WPV extraction performance.
Table 1Validation of the accuracy of the classification results and comparison with other datasets.
3.2 WPV spatiotemporal distribution and growth trends
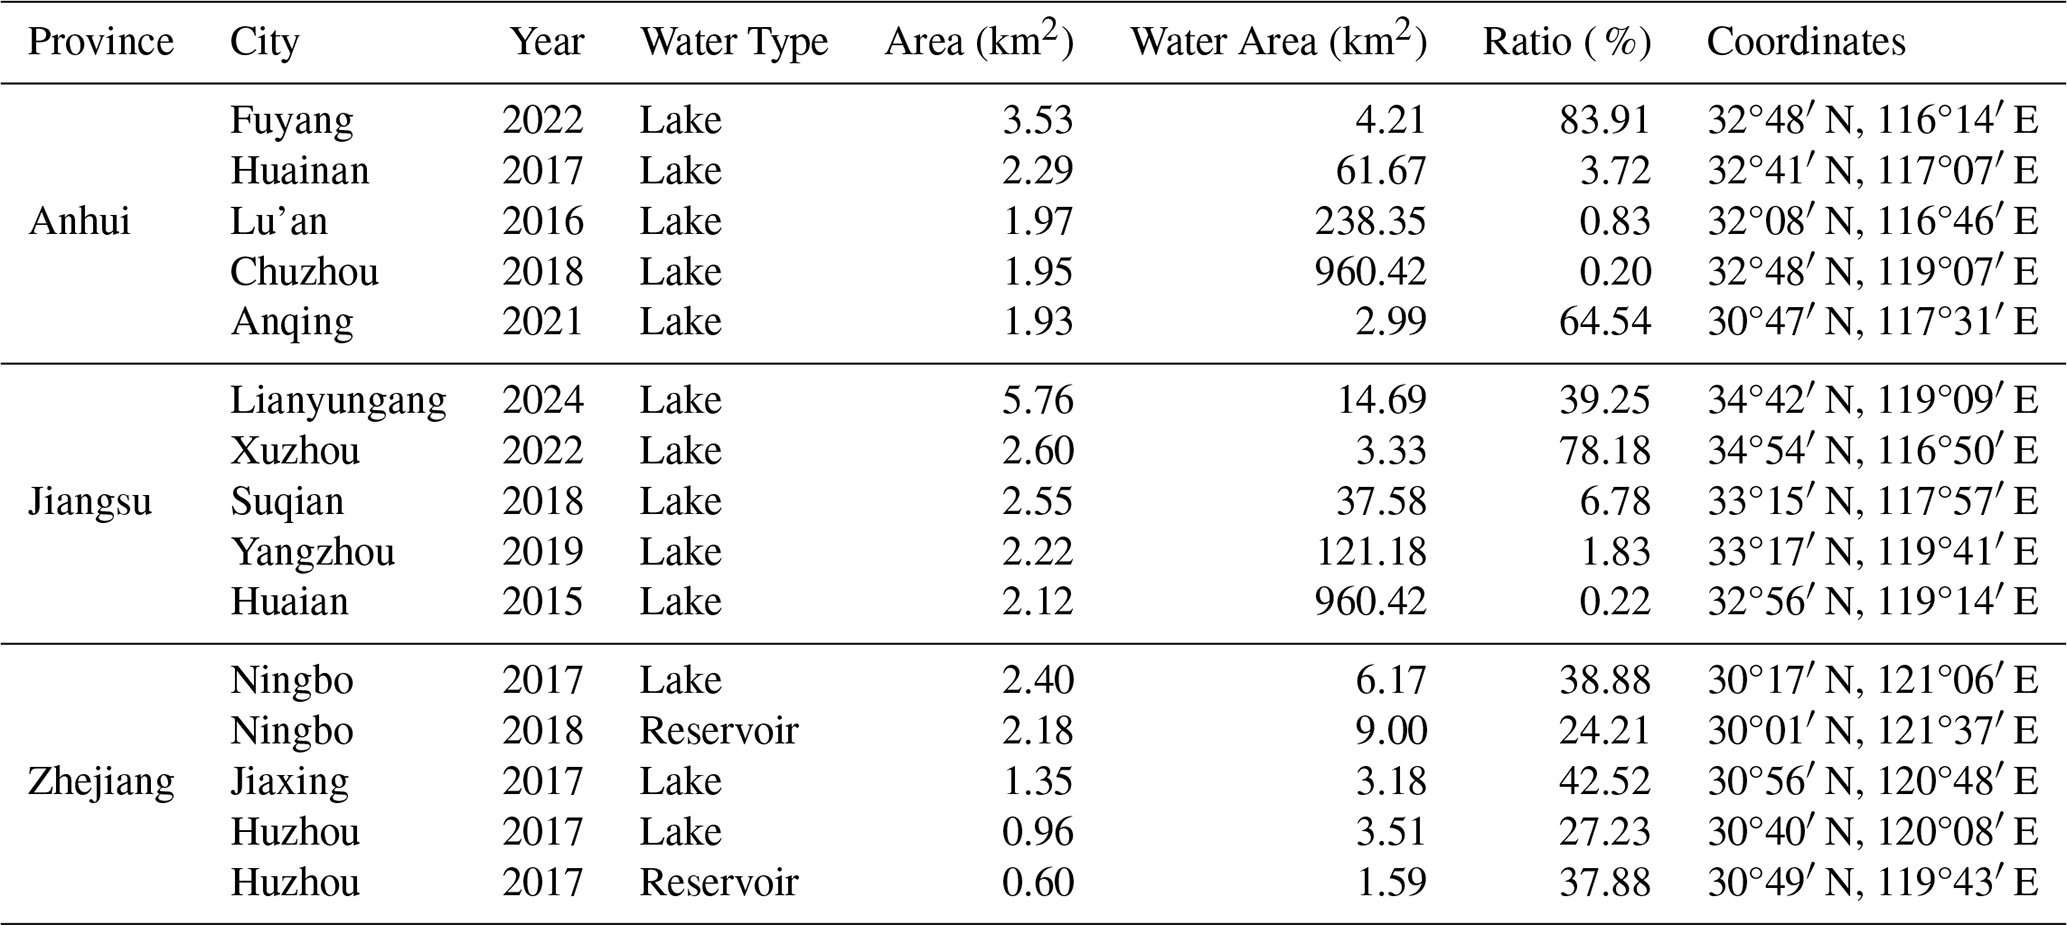
WPV projects in the study area show clear spatiotemporal patterns and growth trends. Spatially, current WPV projects are primarily concentrated in Anhui and Jiangsu provinces, where hydrological and land-use conditions are favorable for large-scale deployment (Fig. 9a). By 2024, a total of 401 WPV projects have been identified in the YRD, covering a cumulative area of 145.4 km2. Among these, Anhui Province hosts the largest share (68.7 km2), accounting for 47 % of the total WPV area, followed by Jiangsu (64.8 km2) and Zhejiang (12 km2). The inset bar chart further illustrates the proportion of WPV area relative to the total water area in each province in 2024, showing that Anhui had the highest deployment intensity (1.01 %), followed by Jiangsu (0.67 %) and Zhejiang (0.48 %). Based on the five largest WPV projects in each province (Table 2), Jiangsu generally exhibits a larger overall project scale, with most large WPV installations located on lakes.
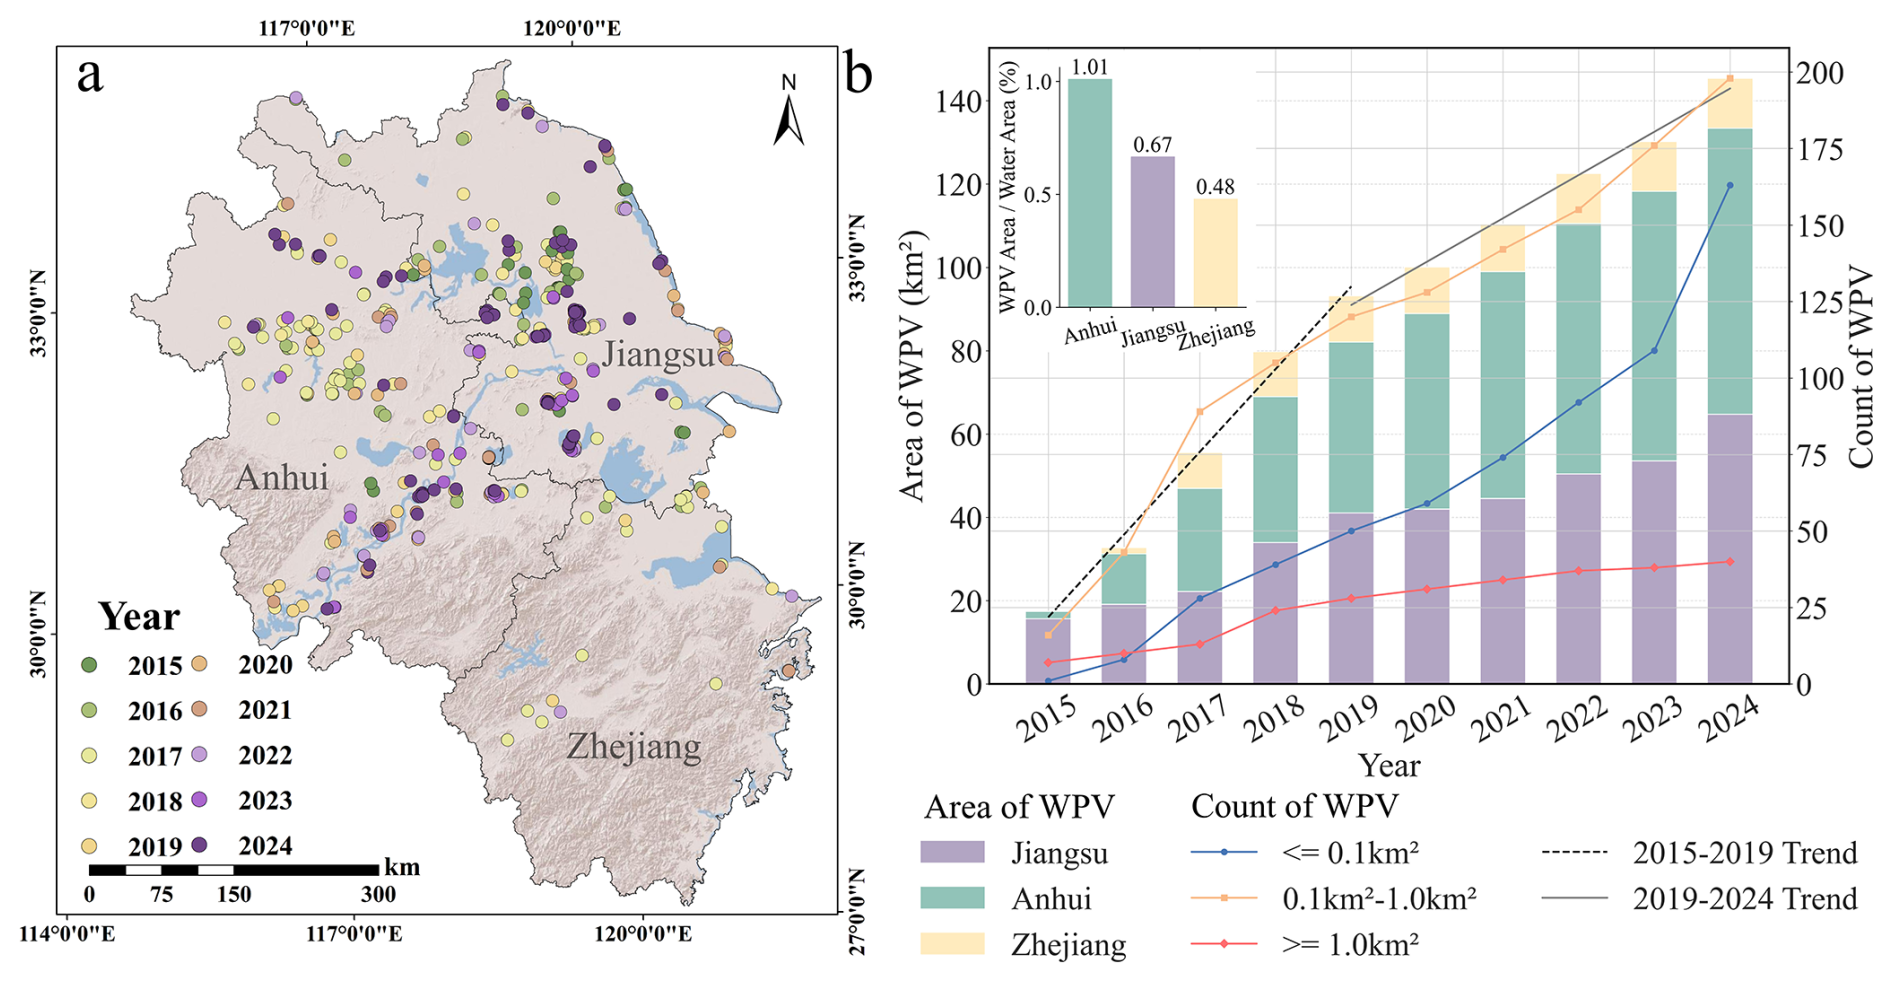
Figure 9Spatiotemporal evolution of WPV installations from 2015 to 2024. (a) Spatial distribution of WPV installations from 2015 to 2024 in Jiangsu, Anhui, and Zhejiang provinces, colored by installation year; (b) temporal evolution of WPV area and number of installations during 2015–2024. Stacked bars represent WPV area contributions from each province, and lines indicate the number of WPV installations classified by size (≤0.1 km2, 0.1–1.0 km2, and ≥1.0 km2). Dashed and solid lines represent fitted trends for 2015–2019 and 2019–2024, respectively. The inset bar chart (upper left) shows the proportion of WPV area relative to the water area within each province in 2024 (source: Esri 2014 | Powered by Esri).
From a temporal perspective, WPV installations have expanded markedly between 2015 and 2024, with the total area increasing by 128 km2 (Fig. 9b). This expansion was concentrated primarily during the early phase (2015–2019), during which approximately 59.2 % of the total increase occurred, followed by a relative slowdown during 2019–2024. At the provincial level, Anhui experienced the greatest increase in WPV area over the decade, adding 66.9 km2, followed by Jiangsu (49.1 km2), while Zhejiang's growth remained modest, with a total addition of only 12 km2. Notably, the spatial evolution trajectories of WPV deployment show different patterns among the three provinces. In Jiangsu, WPV development began in the northern region and gradually expanded southward and toward the coastal areas during the early years. In contrast, early WPV projects in Anhui were also concentrated in the north, but from 2022 onward, installations rapidly expanded along the Yangtze River corridor, forming a more continuous, belt-shaped distribution. Zhejiang Province, by comparison, saw only limited WPV deployment, characterized by a short burst of growth between 2017 and 2020, with most projects clustered in its northern and western regions.
In addition to the overall spatial and temporal patterns in the YRD, WPV projects of different sizes exhibit distinct trends in quantity and growth, providing additional insights into the structural characteristics of PV development in the region (Fig. 9b). Large-scale projects (>1.0 km2) are relatively few, with most expansion occurring between 2015 and 2018 before stabilizing. Conversely, medium-scale (0.1–1.0 km2) and small-scale (<0.1 km2) projects far outnumber large ones and have grown rapidly overall. Overall, the spatial pattern shifted from localized concentrations toward broader regional deployment, and from predominantly large-scale projects to a more diversified mix of small-scale and medium-scale systems.
3.3 WPV deployment on lakes and reservoirs
Different types of water bodies show distinct patterns of WPV deployment, with implications for assessing spatial distribution and potential capacity (Bai et al., 2024; Château et al., 2019). Within the study area, WPV installations are predominantly located on lakes, with only a minor proportion situated on reservoirs (Fig. 10a). Lakes contained the vast majority of total WPV area, reaching 126.8 km2 by 2024, or 87.2 % of the cumulative WPV area. In contrast, reservoirs account for 12.8 % (18.6 km2) of total WPV deployment. However, the distribution across water body types differs considerably among provinces. Jiangsu shows the largest difference, with approximately 98.1 % of its WPV systems deployed on lakes and only 1.9 % on reservoirs. Anhui and Zhejiang demonstrate higher shares of reservoir-based WPV, at 28.9 % and 20.2 %, respectively. The temporal evolution of WPV deployment also reveals distinct trajectories for lakes and reservoirs (Fig. 10b). Lake-based WPV installations expanded steadily between 2015 and 2024, with a total increase of 109.4 km2. In contrast, the development of reservoir-based WPV proceeded more slowly. Its expansion was limited between 2015 and 2019 (14.9 km2), and coinciding with the introduction of policy restrictions in 2019, reservoir-based WPV expansion slowed, with the total area remaining below 20 km2. These trends indicate the increasing dominance of lakes in WPV deployment, while reservoir-based deployment showed slower growth during the study period, potentially associated with operational constraints and regulatory changes (General Office of the Ministry of Water Resources of the People's Republic of China, 2020).
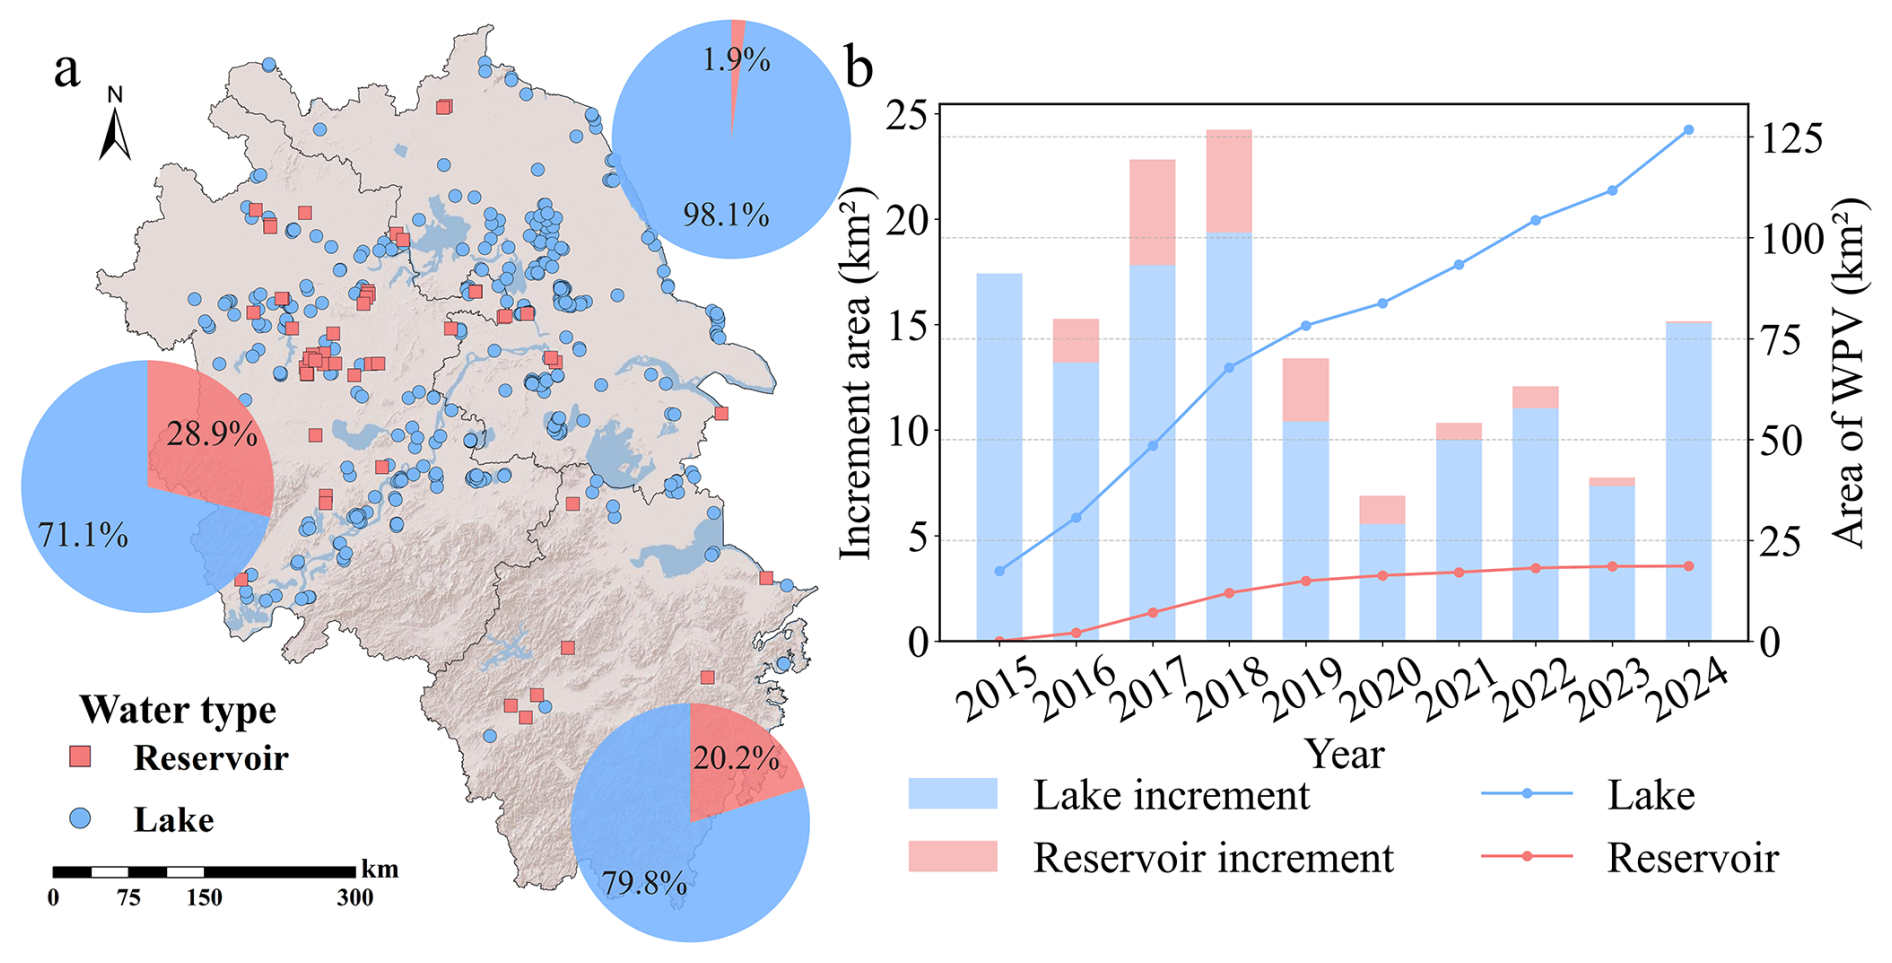
Figure 10Spatial and temporal characteristics of WPV systems across different water-body types in the Yangtze River Delta. (a) Spatial distribution of WPV systems on lakes (blue circles) and reservoirs (red squares), with pie charts showing the proportion of WPV area by water-body type in Jiangsu (top right), Zhejiang (bottom right), and Anhui (left); (b) annual WPV area increments on lakes and reservoirs from 2015 to 2024. Bars represent annual increments, and lines represent cumulative WPV area for each water-body type (source: Esri 2014 | Powered by Esri).
WPV deployment intensity varies among water bodies of different sizes and characteristics, with surface coverage providing an important metric for assessing the spatial extent of WPV occupation (Exley et al., 2021). By integrating WPV distribution data with surface water datasets, WPV coverage was calculated for 385 water bodies across the study area (Fig. 11a, b). Coverage rates varied substantially among different size classes. In smaller water bodies (0–4 km2), WPV coverage exhibited high variability, ranging from 0 % to 100 %. However, as water body size increased, WPV coverage declined sharply, falling below 50 % in medium-sized water bodies and below 10 % in large ones (>100 km2). Most reservoirs covered by WPV installations are relatively small (<4 km2), and their overall WPV coverage is slightly lower than that of lakes of comparable size.
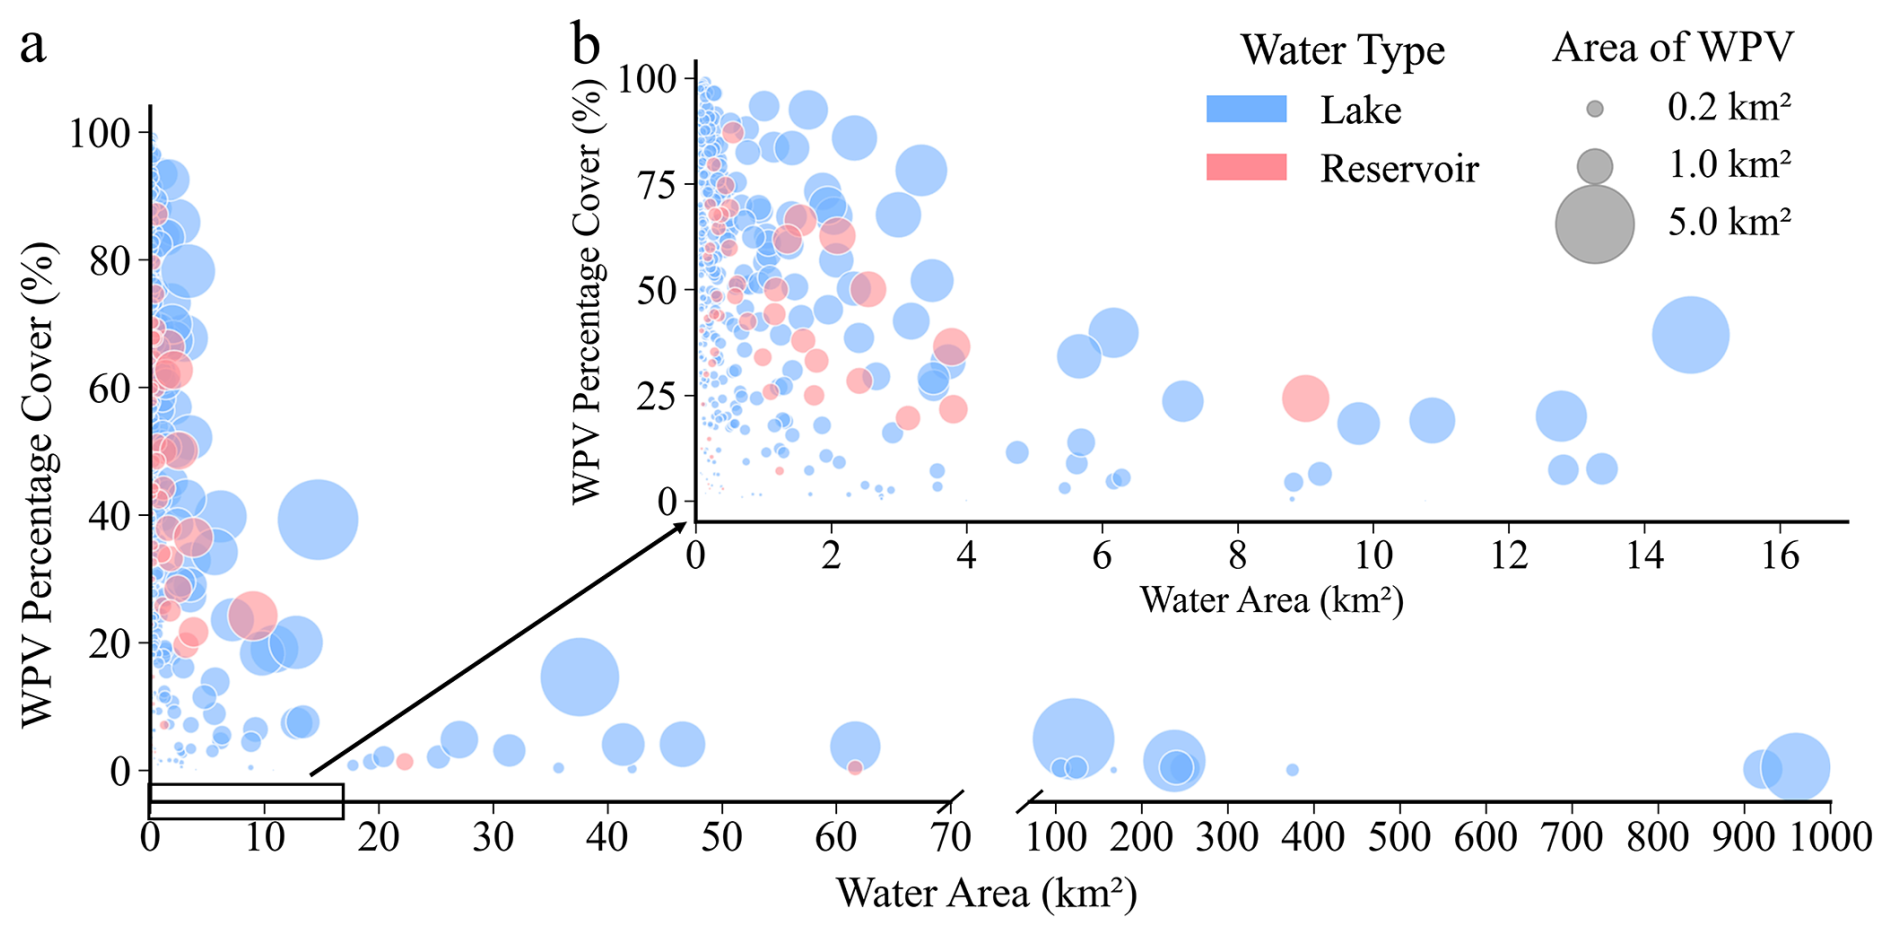
Figure 11Relationship between water body area and WPV percentage cover across lakes and reservoirs. (a) Distribution of WPV percentage cover (%) against water body area (km2), with circle size representing WPV area; (b) enlarged view of the 0–10 km2 water body area range to highlight clustering patterns. Blue and red colors represent lakes and reservoirs, respectively, and circle size denotes WPV area.
3.4 WPV spatial clustering and potential influencing factors
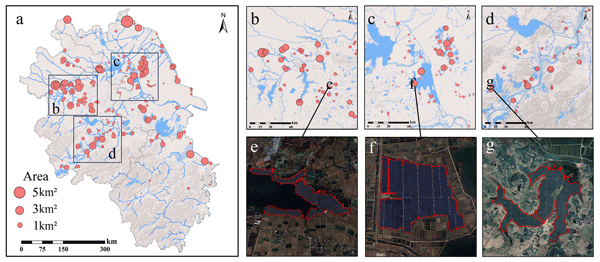
At the regional scale (Fig. 12a), WPV projects exhibit a clear pattern of localized clustering across the study area. These projects are primarily distributed along major rivers and lakes, with project sizes varying considerably, from less than 0.1 km2 to over 3 km2. Notably, several large, high-density clusters are observed in parts of Jiangsu and Anhui provinces (Fig. 12b–d).
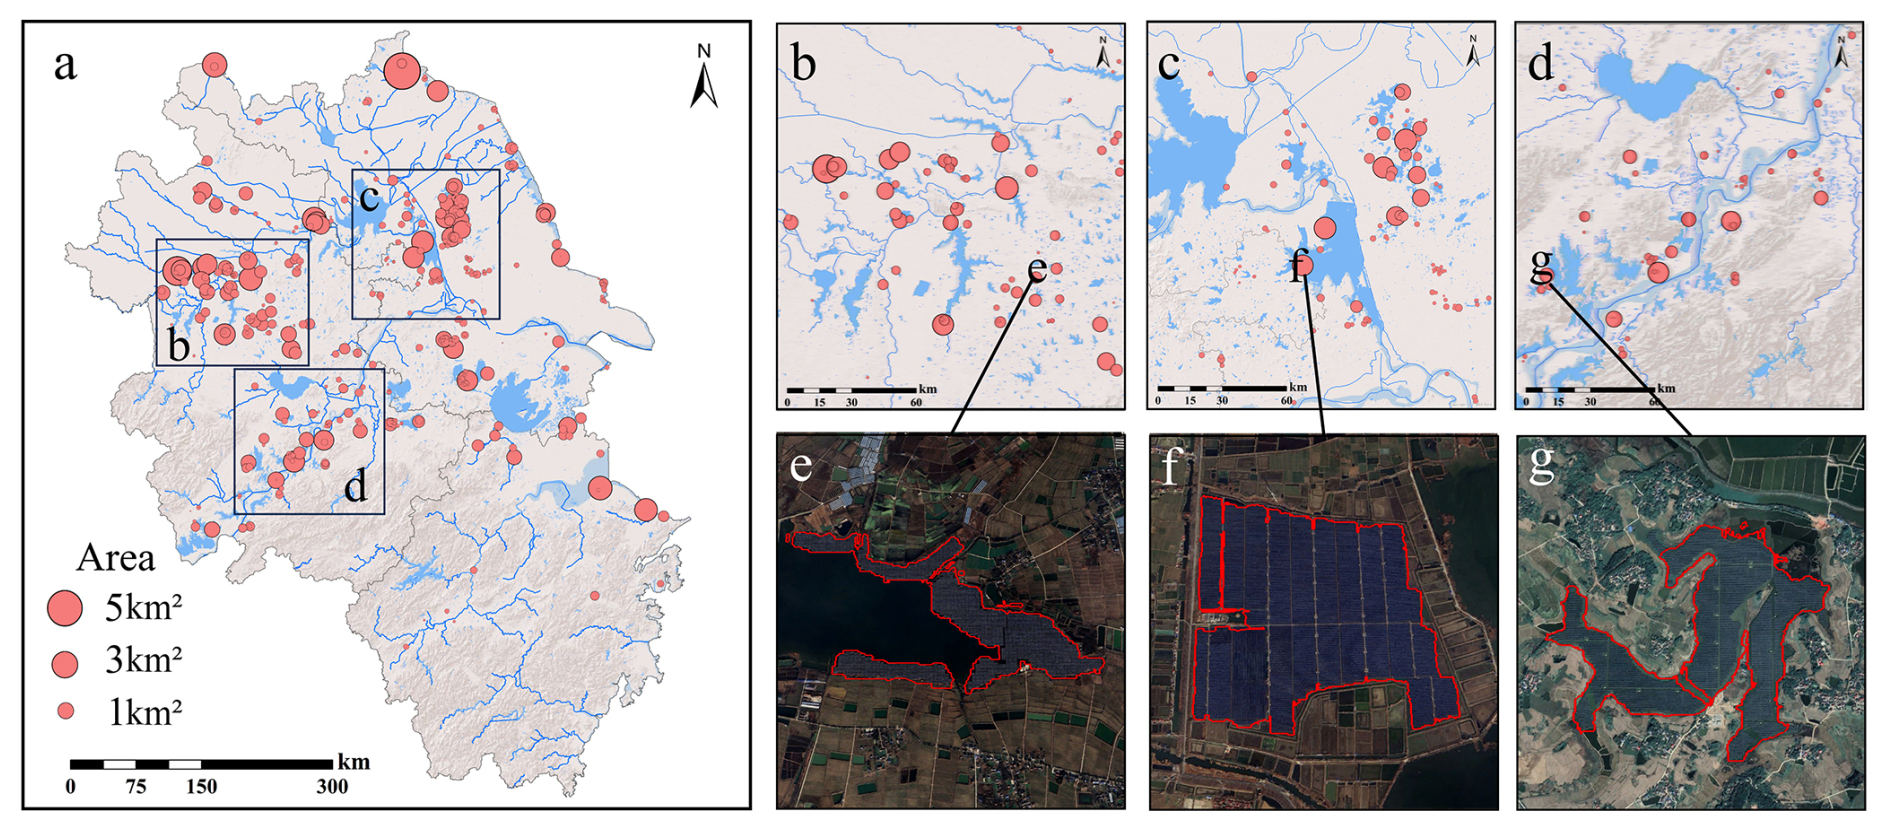
Figure 12Spatial clustering and local layouts of WPV installations. (a) Distribution of WPV systems across Jiangsu, Anhui, and Zhejiang provinces. Circle size represents the area of each WPV system; (b–d) enlarged views of typical clustered regions highlighted in (a); (e–g) high-resolution images showing detailed layouts of selected WPV systems corresponding to locations indicated in (b)–(d), with WPV boundaries outlined in red (source: Google Earth Pro, © 2025 Airbus, © 2025 Airbus/CNES, © 2025 Maxar Technologies, Esri 2014 | Powered by Esri).
This spatial aggregation is associated with a combination of natural and socio-economic factors. Natural conditions may influence WPV suitability, with large water bodies characterized by relatively stable water levels and suitable water conditions often preferred for deployment (Woolway et al., 2024). For example, Sanlihe Reservoir (Fig. 12e), Gaoyou Lake (Fig. 12f), and Xizi Lake (Fig. 12g) possess extensive and relatively stable water surfaces, coinciding with large WPV installations. Grid accessibility is another factor potentially associated with the spatial distribution of WPV systems (Essak and Ghosh, 2022). Around Gaoyou Lake and Xizi Lake, WPV installations are located close to settlements and existing grid infrastructure, which may facilitate grid connection and electricity transmission. The co-occurrence of suitable water surfaces and accessible infrastructure may therefore help explain the concentration of large WPV projects in these areas.
4.1 Major findings and contributions
This study constructs a high-resolution, decade-long (2015–2024) WPV dataset for the YRD region, providing an improved basis for remote sensing-based WPV mapping. We address several limitations in existing time-series mapping approaches, including the vulnerability of optical imagery to cloud contamination and water-surface reflections, as well as the accumulation of temporal uncertainty in long-term mapping (e.g., annual accuracy of ∼0.96 may translate into only ∼0.67 temporal consistency over ten years). By integrating Sentinel-1 SAR observations with multi-temporal Sentinel-2 imagery, our framework combines complementary optical and radar information to enhance WPV discrimination and temporal consistency. In addition, post-processing and manual verification using high-resolution Google Earth imagery enabled the generation of a quality-controlled long-term WPV inventory.
Using this dataset, we performed a systematic decadal assessment of WPV spatial patterns and growth trajectories in the YRD. We found that total WPV area increased from 17.4 km2 in 2015 to 145.4 km2 in 2024, accompanied by a shift in development dominance from Jiangsu to Anhui. The analysis further revealed contrasting growth trajectories among large-, medium-, and small-scale WPV projects, indicating a transition from localized deployment toward broader regional expansion.
4.2 Implications and potential applications
The high-resolution, decade-long WPV dataset developed in this study has both practical and scientific relevance. By quantifying WPV coverage, spatial distribution, and waterbody-specific deployment characteristics, the dataset provides a spatial basis for WPV planning, site selection, and comparative analyses across water body types and coverage levels. High-coverage configurations, including those associated with “fishing-solar complementarity” systems, may represent intensive deployment modes with greater potential for local hydrological or ecological interactions (Pringle et al., 2017). Such settings may be associated with greater modification of light availability, air–water exchange, evaporation, and aquatic habitat conditions. From an energy-planning perspective, they also represent an intensive deployment mode, although future expansion should account for environmental carrying capacity and site-specific management constraints (Bai et al., 2024; Château et al., 2019).
Beyond inventory mapping, the dataset is also relevant to broader Earth system science applications. As a spatially explicit record of water-surface solar deployment, it can support analyses of energy–water–environment interactions by linking renewable-energy expansion with water body functions, hydrological conditions, and ecological constraints. In this sense, the dataset may serve as a useful spatial input for regional sustainability assessments and integrated analyses of low-carbon transitions, infrastructure planning, and trade-offs among energy generation, water use, and ecosystem management.
The dataset may also support investigation of the potential environmental implications of WPV deployment. Its high-resolution delineation of WPV-covered and uncovered areas within the same water body facilitates spatially explicit comparisons between shaded and unshaded zones, as well as before-and-after analyses based on installation timing. When combined with other observations, these maps may support assessment of possible water-surface temperature differences associated with partial shading using thermal infrared products, as well as potential changes in water optical properties and algal dynamics using water-color or water-quality indicators such as chlorophyll-a, turbidity, or algal bloom proxies (Chen et al., 2025; Chu and He, 2023). These applications may be particularly relevant for identifying ecological concerns associated with high-coverage installations in small water bodies and for informing more environmentally informed deployment strategies (Sahu et al., 2016; Armstrong et al., 2020; Nobre et al., 2023; Ma and Liu, 2022). In addition, the dataset can facilitate field validation by enabling targeted selection of representative WPV sites for in situ investigation. It should be noted, however, that the SAR–optical fusion framework is primarily designed to detect WPV extent, boundaries, and deployment timing. Although these attributes are relevant for environmental exposure assessment, the framework does not directly quantify thermal or biogeochemical responses, which require dedicated thermal infrared, water-quality remote sensing, or field observations.
4.3 Limitations and future research
Despite constructing a high-resolution WPV inventory, this study has several limitations. First, uncertainties in the underlying water body datasets remain a challenge; small water bodies (e.g., ponds) may be omitted, while imprecise boundaries and spectral confusion with nearby buildings or bare soil may lead to omissions and misclassifications at water edges (Valerio et al., 2024; Wang et al., 2022b). Second, the diversity in WPV installation methods and structural designs may introduce variations in spectral and textural characteristics, posing challenges for consistent extraction (Shi et al., 2023). The current framework is most suitable for stationary installations and anchored, medium- to large-scale floating PV systems, which represent the dominant commercial deployment type in the study region. However, uncertainty may increase for small, loosely arranged, or highly mobile floating platforms, especially where local displacement alters patch boundaries or weakens texture regularity. Finally, the area threshold applied during post-processing to eliminate noise likely leads to an underestimation of the total WPV area, particularly by excluding small-scale systems on rural ponds or aquaculture facilities (Iqra et al., 2024).
In light of these limitations, future research can focus on three key directions. Methodologically, integrating deep learning methods (e.g., U-Net, DeepLabV3+) holds promise for enhancing accuracy, particularly in delineating complex boundaries and detecting morphologically diverse or small-scale targets (Chen et al., 2018; Ronneberger et al., 2015). Spatially, expanding the study to national or global scales would reveal large-scale deployment trends driven by policy and market dynamics, offering valuable guidance for macro-level energy planning. Thematically, future work should place greater emphasis on evaluating the ecological impacts of WPV systems by integrating remote-sensing retrievals with in situ monitoring data, thereby promoting a coordinated approach to renewable energy development and ecosystem conservation.
The Yangtze River Delta Water-Surface Photovoltaics Dataset (2015–2024) is available at https://doi.org/10.5281/zenodo.17484488 (Yan et al., 2025).
This study developed a high-resolution spatiotemporal inventory of water-surface photovoltaic (WPV) systems in China's Yangtze River Delta from 2015 to 2024. By integrating multi-temporal Sentinel-1 SAR and Sentinel-2 optical imagery with random forest classification, followed by systematic post-processing and manual verification, we generated a decade-long WPV dataset that mitigates limitations of optical observations and provides improved temporal consistency for long-term monitoring. Our results reveal rapid WPV expansion from 17.4 km2 in 2015 to 145.4 km2 in 2024, accompanied by a shift in deployment dominance toward Anhui Province. Small- and medium-scale installations constitute the majority of WPV projects, which are predominantly located on lakes and exhibit strong spatial clustering associated with water-body characteristics and grid accessibility. This dataset provides a spatial basis for assessing WPV development potential, supporting renewable energy planning, and investigating potential environmental implications. The proposed framework can be extended to broader WPV monitoring efforts and future studies integrating remote sensing observations with ecological assessments.
Yue Yan: Conceptualization, Data curation, Investigation, Methodology, Software, Visualization, Writing – original draft, Writing – review & editing. Xin Jiang: Conceptualization, Methodology, Validation, Writing – review & editing. Sihuan Wei: Data curation, Investigation, Validation. Yubin Jin: Data curation, Investigation, Validation. Xinyu Zou: Formal analysis, Visualization, Writing – review & editing. Junwei Liu: Investigation, Methodology, Validation. Yaotong Cai: Data curation, Software, Validation. Jianhuai Ye: Data curation, Investigation. Zhilin Guo: Data curation, Investigation. Zhenzhong Zeng: Conceptualization, Methodology, Supervision, Funding acquisition, Project administration, Writing – review & editing.
The contact author has declared that none of the authors has any competing interests.
Publisher's note: Copernicus Publications remains neutral with regard to jurisdictional claims made in the text, published maps, institutional affiliations, or any other geographical representation in this paper. The authors bear the ultimate responsibility for providing appropriate place names. Views expressed in the text are those of the authors and do not necessarily reflect the views of the publisher.
The authors thank the editor and anonymous reviewers for their constructive comments and suggestions. This work also acknowledges support from the State Key Laboratory of Climate Resilience for Coastal Cities and Otto Poon Research Institute for Climate-Resilient Infrastructure at the Hong Kong Polytechnic University. We acknowledge the Center for Computational Science and Engineering at the Southern University of Science and Technology for providing computing resources.
This study was supported by the Fundamental and Interdisciplinary Disciplines Breakthrough Plan of the Ministry of Education of China (grant no. JYB2025XDXM909), the National Natural Science Foundation of China–United Nations Environment Programme (NSFC–UNEP, grant no. 42361144001), the National Natural Science Foundation of China (grant no. 42071022), Shenzhen Science and Technology Project for Sustainable Development in Special Innovation (grant no. KCXFZ20230731093403008), Guangdong Basic and Applied Basic Research Foundation (grant no. 2022A1515240070), the Shenzhen Key Laboratory of Precision Measurement and Early Warning Technology for Urban Environmental Health Risks (grant no. ZDSYS20220606100604008), and SUSTech High Level of Special Funds (grant nos. G03034K001 and G030290001).
This paper was edited by Chunlüe Zhou and reviewed by Giuseppe Marco Tina and two anonymous referees.
Armstrong, A., Page, T., Thackeray, S. J., Hernandez, R. R., and Jones, I. D.: Integrating environmental understanding into freshwater floatovoltaic deployment using an effects hierarchy and decision trees, Environ. Res. Lett., 15, 114055, https://doi.org/10.1088/1748-9326/abbf7b, 2020.
Bai, B., Xiong, S., Ma, X., and Liao, X.: Assessment of floating solar photovoltaic potential in China, Renew. Energy, 220, 119572, https://doi.org/10.1016/j.renene.2023.119572, 2024.
Belgiu, M. and Drăguţ, L.: Random forest in remote sensing: A review of applications and future directions, ISPRS J. Photogramm. Remote Sens., 114, 24–31, https://doi.org/10.1016/j.isprsjprs.2016.01.011, 2016.
Bogdanov, D., Ram, M., Aghahosseini, A., Gulagi, A., Oyewo, A. S., Child, M., Caldera, U., Sadovskaia, K., Farfan, J., De Souza Noel Simas Barbosa, L., Fasihi, M., Khalili, S., Traber, T., and Breyer, C.: Low-cost renewable electricity as the key driver of the global energy transition towards sustainability, Energy, 227, 120467, https://doi.org/10.1016/j.energy.2021.120467, 2021.
Capellán-Pérez, I., De Castro, C., and Arto, I.: Assessing vulnerabilities and limits in the transition to renewable energies: Land requirements under 100 % solar energy scenarios, Renew. Sustain. Energy Rev., 77, 760–782, https://doi.org/10.1016/j.rser.2017.03.137, 2017.
Château, P.-A., Wunderlich, R. F., Wang, T.-W., Lai, H.-T., Chen, C.-C., and Chang, F.-J.: Mathematical modeling suggests high potential for the deployment of floating photovoltaic on fish ponds, Sci. Total Environ., 687, 654–666, https://doi.org/10.1016/j.scitotenv.2019.05.420, 2019.
Chen, D., Peng, Q., Lu, J., Huang, P., Liu, Y., and Peng, F.: Assessing effect of water photovoltaics on nearby water surface temperature using remote sensing techniques, Adv. Space Res., 75, 138–147, https://doi.org/10.1016/j.asr.2024.08.040, 2025.
Chen, L.-C., Zhu, Y., Papandreou, G., Schroff, F., and Adam, H.: Encoder–decoder with atrous separable convolution for semantic image segmentation, in: Computer Vision – ECCV 2018, edited by: Ferrari, V., Hebert, M., Sminchisescu, C., and Weiss, Y., Lecture Notes in Computer Science, vol. 11211, Springer, Cham, Switzerland, 833–851, https://doi.org/10.1007/978-3-030-01234-2_49, 2018.
Chen, Y., Zhou, J., Ge, Y., and Dong, J.: Uncovering the rapid expansion of photovoltaic power plants in China from 2010 to 2022 using satellite data and deep learning, Remote Sens. Environ., 305, 114100, https://doi.org/10.1016/j.rse.2024.114100, 2024.
Chen, Z., Kang, Y., Sun, Z., Wu, F., and Zhang, Q.: Extraction of photovoltaic plants using machine learning methods: A case study of the pilot energy city of Golmud, China, Remote Sens., 14, 2697, https://doi.org/10.3390/rs14112697, 2022.
Chu, H.-J. and He, Y.-C.: Remote sensing water quality inversion using sparse representation: Chlorophyll-a retrieval from Sentinel-2 MSI data, Remote Sens. Appl. Soc. Environ., 31, 101006, https://doi.org/10.1016/j.rsase.2023.101006, 2023.
Essak, L. and Ghosh, A.: Floating photovoltaics: A review, Clean Technol., 4, 752–769, https://doi.org/10.3390/cleantechnol4030046, 2022.
Exley, G., Armstrong, A., Page, T., and Jones, I. D.: Floating photovoltaics could mitigate climate change impacts on water body temperature and stratification, Sol. Energy, 219, 24–33, https://doi.org/10.1016/j.solener.2021.01.076, 2021.
Feng, Q., Niu, B., Ren, Y., Su, S., Wang, J., Shi, H., Yang, J., and Han, M.: A 10-m national-scale map of ground-mounted photovoltaic power stations in China of 2020, Sci. Data, 11, 198, https://doi.org/10.1038/s41597-024-02994-x, 2024.
Forester, E., Levin, M. O., Thorne, J. H., Armstrong, A., Pasquale, G., Di Blasi, M. L. V., Scott, T. A., and Hernandez, R. R.: Siting considerations for floating solar photovoltaic energy: A systematic review, Renew. Sustain. Energy Rev., 211, 115360, https://doi.org/10.1016/j.rser.2025.115360, 2025.
General Office of the Ministry of Water Resources of the People's Republic of China: Notice on further strengthening the management of construction projects within river and lake management scope, Ban He Hu [2020] No. 177, Ministry of Water Resources of the People's Republic of China, Beijing, China, http://www.mwr.gov.cn/zwgk/gknr/202510/t20251001_2079778.html (last access: 1 April 2026), 2020.
Gorelick, N., Hancher, M., Dixon, M., Ilyushchenko, S., Thau, D., and Moore, R.: Google Earth Engine: Planetary-scale geospatial analysis for everyone, Remote Sens. Environ., 202, 18–27, https://doi.org/10.1016/j.rse.2017.06.031, 2017.
Haralick, R. M., Shanmugam, K., and Dinstein, I.: Textural features for image classification, IEEE Trans. Syst. Man Cybern., SMC-3, 610–621, https://doi.org/10.1109/TSMC.1973.4309314, 1973.
Hirayama, H., Sharma, R. C., Tomita, M., and Hara, K.: Evaluating multiple classifier system for the reduction of salt-and-pepper noise in the classification of very-high-resolution satellite images, Int. J. Remote Sens., 40, 2542–2557, https://doi.org/10.1080/01431161.2018.1528400, 2019.
International Energy Agency (IEA): Global Energy Review 2025, IEA, Paris, France, https://www.iea.org/reports/global-energy-review-2025 (last access: 1 April 2026), 2025.
Iqra, K. J. G. and Javed, M.: Small object detection in diverse application landscapes: A survey, Multimed. Tools Appl., 83, 88645–88680, https://doi.org/10.1007/s11042-024-18866-w, 2024.
Jin, Y., Hu, S., Ziegler, A. D., Gibson, L., Campbell, J. E., Xu, R., Chen, D., Zhu, K., Zheng, Y., Ye, B., Ye, F., and Zeng, Z.: Energy production and water savings from floating solar photovoltaics on global reservoirs, Nat. Sustain., 6, 865–874, https://doi.org/10.1038/s41893-023-01089-6, 2023.
Kruitwagen, L., Story, K. T., Friedrich, J., Byers, L., Skillman, S., and Hepburn, C.: A global inventory of photovoltaic solar energy generating units, Nature, 598, 604–610, https://doi.org/10.1038/s41586-021-03957-7, 2021.
Lehner, B., Liermann, C. R., Revenga, C., Vörösmarty, C., Fekete, B., Crouzet, P., Döll, P., Endejan, M., Frenken, K., Magome, J., Nilsson, C., Robertson, J. C., Rödel, R., Sindorf, N., and Wisser, D.: High-resolution mapping of the world's reservoirs and dams for sustainable river-flow management, Front. Ecol. Environ., 9, 494–502, https://doi.org/10.1890/100125, 2011.
Ma, C. and Liu, Z.: Water-surface photovoltaics: Performance, utilization, and interactions with water eco-environment, Renew. Sustain. Energy Rev., 167, 112823, https://doi.org/10.1016/j.rser.2022.112823, 2022.
Messager, M. L., Lehner, B., Grill, G., Nedeva, I., and Schmitt, O.: Estimating the volume and age of water stored in global lakes using a geo-statistical approach, Nat. Commun., 7, 13603, https://doi.org/10.1038/ncomms13603, 2016.
Mulligan, M., van Soesbergen, A., and Sáenz, L.: GOODD, a global dataset of more than 38,000 georeferenced dams, Sci. Data, 7, 31, https://doi.org/10.1038/s41597-020-0362-5, 2020.
Nobre, R., Boulêtreau, S., Colas, F., Azemar, F., Tudesque, L., Parthuisot, N., Favriou, P., and Cucherousset, J.: Potential ecological impacts of floating photovoltaics on lake biodiversity and ecosystem functioning, Renew. Sustain. Energy Rev., 188, 113852, https://doi.org/10.1016/j.rser.2023.113852, 2023.
Ortiz, A., Negandhi, D., Mysorekar, S. R., Nagaraju, S. K., Kiesecker, J., Robinson, C., Bhatia, P., Khurana, A., Wang, J., Oviedo, F., and Ferres, J. L.: An artificial intelligence dataset for solar energy locations in India, Sci. Data, 9, 497, https://doi.org/10.1038/s41597-022-01499-9, 2022.
Pouran, H. M., Padilha Campos Lopes, M., Nogueira, T., Alves Castelo Branco, D., and Sheng, Y.: Environmental and technical impacts of floating photovoltaic plants as an emerging clean energy technology, iScience, 25, 105253, https://doi.org/10.1016/j.isci.2022.105253, 2022.
Pringle, A. M., Handler, R. M., and Pearce, J. M.: Aquavoltaics: Synergies for dual use of water area for solar photovoltaic electricity generation and aquaculture, Renew. Sustain. Energy Rev., 80, 572–584, https://doi.org/10.1016/j.rser.2017.05.191, 2017.
Robinson, C., Ortiz, A., Kim, A., Dodhia, R., Zolli, A., Nagaraju, S. K., Oakleaf, J., Kiesecker, J., and Lavista Ferres, J. M.: Global Renewables Watch: A temporal dataset of solar and wind energy derived from satellite imagery, arXiv [preprint], https://doi.org/10.48550/arXiv.2503.14860, 2025.
Ronneberger, O., Fischer, P., and Brox, T.: U-Net: Convolutional networks for biomedical image segmentation, in: Medical Image Computing and Computer-Assisted Intervention – MICCAI 2015, edited by: Navab, N., Hornegger, J., Wells, W. M., and Frangi, A. F., Lecture Notes in Computer Science, vol. 9351, Springer, Cham, Switzerland, 234–241, https://doi.org/10.1007/978-3-319-24574-4_28, 2015.
Sahu, A., Yadav, N., and Sudhakar, K.: Floating photovoltaic power plant: A review, Renew. Sustain. Energy Rev., 66, 815–824, https://doi.org/10.1016/j.rser.2016.08.051, 2016.
Shi, W., Yan, C., Ren, Z., Yuan, Z., Liu, Y., Zheng, S., Li, X., and Han, X.: Review on the development of marine floating photovoltaic systems, Ocean Eng., 286, 115560, https://doi.org/10.1016/j.oceaneng.2023.115560, 2023.
Valerio, F., Godinho, S., Ferraz, G., Pita, R., Gameiro, J., Silva, B., Marques, A. T., and Silva, J. P.: Multi-temporal remote sensing of inland surface waters: A fusion of Sentinel-1 & Sentinel-2 data applied to small seasonal ponds in semiarid environments, Int. J. Appl. Earth Obs. Geoinf., 135, 104283, https://doi.org/10.1016/j.jag.2024.104283, 2024.
van de Ven, D.-J., Capellán-Pérez, I., Arto, I., Cazcarro, I., De Castro, C., Patel, P., and Gonzalez-Eguino, M.: The potential land requirements and related land use change emissions of solar energy, Sci. Rep., 11, 2907, https://doi.org/10.1038/s41598-021-82042-5, 2021.
Wang, J., Walter, B. A., Yao, F., Song, C., Ding, M., Maroof, A. S., Zhu, J., Fan, C., McAlister, J. M., Sikder, S., Sheng, Y., Allen, G. H., Crétaux, J.-F., and Wada, Y.: GeoDAR: georeferenced global dams and reservoirs dataset for bridging attributes and geolocations, Earth Syst. Sci. Data, 14, 1869–1899, https://doi.org/10.5194/essd-14-1869-2022, 2022a.
Wang, L., Bie, W., Li, H., Liao, T., Ding, X., Wu, G., and Fei, T.: Small water body detection and water quality variations with changing human activity intensity in Wuhan, Remote Sens., 14, 200, https://doi.org/10.3390/rs14010200, 2022b.
Wei, S., Chen, Y., and Zeng, Z.: An unexpectedly large proportion of photovoltaic facilities installed on cropland, The Innovation Energy, 2, 100070, https://doi.org/10.59717/j.xinn-energy.2024.100070, 2025.
Woolway, R. I., Zhao, G., Rocha, S. M. G., Thackeray, S. J., and Armstrong, A.: Decarbonization potential of floating solar photovoltaics on lakes worldwide, Nat. Water, 2, 566–576, https://doi.org/10.1038/s44221-024-00251-4, 2024.
Xia, Z., Li, Y., Guo, X., and Chen, R.: High-resolution mapping of water photovoltaic development in China through satellite imagery, Int. J. Appl. Earth Obs. Geoinf., 107, 102707, https://doi.org/10.1016/j.jag.2022.102707, 2022.
Xia, Z., Li, Y., Guo, S., Chen, R., Zhang, W., Zhang, P., and Du, P.: Mapping global water-surface photovoltaics with satellite images, Renew. Sustain. Energy Rev., 187, 113760, https://doi.org/10.1016/j.rser.2023.113760, 2023.
Xu, C., Xie, D., Gu, C., Zhao, P., Wang, X., and Wang, Y.: Sustainable development pathways for energies in Yangtze River Delta urban agglomeration, Sci. Rep., 13, 18135, https://doi.org/10.1038/s41598-023-44727-x, 2023.
Yan, Y., Jiang, X., Wei, S., Jin, Y., Zou, X., Liu, J., Cai, Y., Ye, J., Guo, Z., and Zeng, Z.: Yangtze River Delta Water-Surface Photovoltaics Dataset (2015–2024), Zenodo [data set], https://doi.org/10.5281/zenodo.17484488, 2025.
Zhang, H., Tian, P., Zhong, J., Liu, Y., and Li, J.: Mapping photovoltaic panels in coastal China using Sentinel-1 and Sentinel-2 images and Google Earth Engine, Remote Sens., 15, 3712, https://doi.org/10.3390/rs15153712, 2023.
Zhang, X., Zeraatpisheh, M., Rahman, M. M., Wang, S., and Xu, M.: Texture is important in improving the accuracy of mapping photovoltaic power plants: A case study of Ningxia Autonomous Region, China, Remote Sens., 13, 3909, https://doi.org/10.3390/rs13193909, 2021.
Zhang, X., Xu, M., Wang, S., Huang, Y., and Xie, Z.: Mapping photovoltaic power plants in China using Landsat, random forest, and Google Earth Engine, Earth Syst. Sci. Data, 14, 3743–3755, https://doi.org/10.5194/essd-14-3743-2022, 2022.