the Creative Commons Attribution 4.0 License.
the Creative Commons Attribution 4.0 License.
 | 20 Aug 2026

A multi-decadal global Landsat-derived dataset of forest fire patches from 1984–2022
Jiaying He
Xin Zou
Weihan Zhang
Quan Duan
Ronggao Liu
Yang Liu
Jinwei Dong
Chaoyang Wu
Chao Wu
Forest fires are a major ecological disturbance affecting carbon cycling, ecosystem structure, and landscape dynamics worldwide. Understanding long-term changes in forest fire patterns requires consistent information on the distribution, extent, and structure of fire patches across broad spatial and temporal scales. The Landsat archive provides nearly four decades of global observations at 30 m resolution, yet generating a consistent global record of forest fire patches remains challenging because of cloud contamination, heterogeneous observation availability, and the computational demands associated with processing multi-decadal imagery. Here we present an initial release of a global 30 m dataset characterizing forest fire patches (GlobMap FFP) from 1984–2022 based on the full Landsat archive (https://doi.org/10.5281/zenodo.17638167, Liu, 2025). To achieve a consistent representation of fire-related spectral signals under heterogeneous observation conditions, we generated multi-temporal Landsat composites using a minimum Brown Vegetation Index compositing approach implemented on the Google Earth Engine platform. Burned pixels were subsequently identified using artificial neural network modeling, and spatially connected pixels with the same burned years were grouped into fire patches through spatiotemporal clustering. The final raster-based product preserves fine-scale spatial heterogeneity while providing patch-level attributes. Across global forests, the dataset delineated 11.97 million fire patches and mapped an average annual burned area of 7.3 Mha yr−1 over 1984–2022. Agreement metrics calculated against a separately generated Landsat-derived reference dataset showed omission errors ranging from 12.2 %–36.8 % and commission errors ranging from 6.4 %–23.2 % across forest types. Performance varied among forest biomes, with lower agreement observed in tropical evergreen broadleaf forests. Intercomparison with existing burned area products revealed generally consistent large-scale spatial patterns, while discrepancies in burned area estimates and patch delineation reflect variations in observation systems, mapping methodologies, and temporal aggregation strategies. Rather than representing a complete global burned area inventory, GlobMap FFP provides a long-term, spatially explicit characterization of forest fire patch structure from Landsat. This dataset facilitates ecological research, particularly at regional scales, by characterizing fire patch structure and spatial organization over time.
- Article
(11304 KB) - Full-text XML
- BibTeX
- EndNote


Forest fires are among the most influential disturbances shaping global ecosystems, affecting carbon balance, surface energy budget, and ecosystem functioning. Compared with frequent, lower-intensity burns typical of savannas, grasslands, or cropland systems, forest fires often occur less frequently but may exhibit higher intensity and severity, resulting in prolonged ecological recovery and persistent ecosystem impacts. Because forests store a disproportionate share of terrestrial carbon, such severe fires can substantially alter carbon dynamics, vegetation structure, and ecosystem resilience (Zheng et al., 2021; Pugh et al., 2019). In extreme cases, forest fires may even trigger irreversible transitions from closed-canopy forests to shrub- or grass-dominated states (Van Wees et al., 2021; Beck et al., 2011; Brando et al., 2019). Consequently, understanding not only the extent but also the spatial organization of forest fires is essential for assessing their ecological impacts and long-term consequences.
Fire patches represent key spatial units through which forest fires affect landscapes. Beyond their contribution to total burned area, many ecological consequences of fire are governed by the spatial characteristics of individual fire patches, including their size, shape, connectivity, and spatial organization (Turner et al., 1997; Turner, 2010; Cova et al., 2023; Buonanduci et al., 2024). Fire patch structure influences post-fire regeneration, habitat fragmentation, biodiversity refugia, and the redistribution of carbon and nutrients across landscapes (Meddens et al., 2016; Sommers and Flannigan, 2022; Minor et al., 2017; Godoy et al., 2025). In recent decades, climate warming has altered forest fire regimes in many regions through increases in fire frequency, burned area, fire severity and post-fire recovery time, potentially reshaping the spatial organization of fire patches and reinforcing positive climate-fire feedbacks (Scholten et al., 2022; Balch et al., 2022; Lv et al., 2025; Iglesias et al., 2022). Characterizing the occurrence and spatial organization of forest fire patches is therefore critical for understanding long-term changes in forest fire regimes.
Satellite-based fire products have greatly advanced the monitoring of global fire activity. In particular, products derived from the Moderate Resolution Imaging Spectroradiometer (MODIS) have enabled assessments of large-scale fire trends and fire regime dynamics over the past two decades (Andela et al., 2019; Artés et al., 2019; Balch et al., 2020). Yet, their relatively coarse spatial resolution limits the characterization of fine-scale fire patch structure, small fire occurrence, and within-fire heterogeneity. The four-decade Landsat archive provides a unique opportunity to address these limitations through globally consistent observations at 30 m spatial resolution. Compared with coarse-resolution products, Landsat imagery enables improved delineation of fire perimeters, detection of small and fragmented fire scars, and characterization of landscape-scale fire patch organization relevant to ecological and biogeographical studies (Meddens et al., 2016; Ramo et al., 2021; Chuvieco et al., 2019). Nevertheless, generating globally consistent Landsat-derived fire patch datasets remains challenging because of persistent cloud contamination, irregular observation frequency, and the immense computational demands associated with the multi-decadal archive. Consequently, most Landsat-based products remain regional in scope, such as the Burned Area Essential Climate Variable (BAECV) for the conterminous US (CONUS) (Hawbaker et al., 2020a) and the Landscape Fire Scars Database (LFSD) for Chile (Miranda et al., 2022a). Additionally, the Global Annual Burned Area Map (GABAM) (Long et al., 2019) has demonstrated the potential of Landsat for global burned area mapping. However, achieving consistent long-term fire characterization under heterogeneous observation conditions remains challenging.
Several methodological challenges further complicate global fire patch characterization from Landsat imagery. Unlike MODIS, Landsat observations are acquired at substantially lower temporal frequency and are more susceptible to observation gaps caused by cloud contamination and data availability, limiting the ability to capture short-lived fire signals (Roteta et al., 2019; Hislop et al., 2018). Time-series methods, such as Vegetation Change Tracker (VCT) and LandTrendr, have been widely applied to detect forest disturbances based on abrupt temporal changes from multi-year Landsat data stacks (Huang et al., 2010; Kennedy et al., 2010). Machine learning-based approaches based on annual composites have also been used to develop burned area products such as GABAM (Long et al., 2019). While effective, these approaches remain computationally intensive at global scales and are sensitive to the availability and quality of cloud-free observations. Multi-temporal image compositing has therefore emerged as a practical strategy for generating spatially consistent disturbance representations while reducing data volume and improving computational feasibility (Francini et al., 2023; Qiu et al., 2023). Nevertheless, compositing approaches involve critical trade-offs among disturbance sensitivity, contamination robustness, temporal representativeness, and computational efficiency (Miettinen and Liew, 2008; Otón et al., 2019; Hermosilla et al., 2019; Senf and Seidl, 2021b). For example, the best available pixel (BAP) method produces high-quality mosaics but with increased computational cost (White et al., 2014), whereas minimum NIR method is effective for burned area detection but is sensitive to cloud shadows and atmospheric contamination (Miettinen and Liew, 2008; Chuvieco et al., 2005). Developing globally scalable approaches that balance these trade-offs remains a major challenge for long-term Landsat-based fire monitoring. No existing framework simultaneously optimizes disturbance sensitivity, temporal precision, contamination robustness, and computational efficiency at the global scale.
In this study, we present GlobMap Forest Fire Patches (GlobMap FFP), an initial release of a global 30 m dataset characterizing forest fire patches from 1984–2022 using the full Landsat archive (Liu, 2025). Rather than attempting to reconstruct all individual fire ignition events or maximize burned area completeness relative to existing burned area inventory, this product was designed to provide a spatially explicit and temporally consistent representation of forest fire patches under heterogeneous Landsat observation conditions over nearly four decades. We first generated multi-temporal Landsat composites on the Google Earth Engine (GEE) platform to condense fire-related spectral signals and improve observation consistency across space and time. Burned area was subsequently identified using artificial neural network (ANN) models trained across major forest types, and spatially connected burned pixels were grouped into fire patches using a spatiotemporal clustering algorithm. The final product is distributed in raster format, with each fire patch assigned a unique identifier together with associated attributes including burned year and quality assurance (QA) information. This raster-based representation preserves fine-scale spatial heterogeneity while supporting analyses of fire patch morphology, spatial organization, and long-term forest fire dynamics. Finally, we evaluated the dataset through comparison with separately generated burned area samples and through intercomparison with existing burned area products.
2.1 Landsat imagery
Landsat satellites provide the longest running of high-resolution, multispectral observations of Earth's surface at the global scale. Their optical sensors acquire imagery across visible, infrared, and thermal wavelengths, with a swath width of 185 km and a 16 d revisit cycle. However, the optical nature of Landsat, combined with persistent cloud contamination, irregular observation frequency, sensor differences among missions, and relatively sparse temporal sampling, imposes substantial constraints on globally consistent, long-term fire characterization. For this study, we used Level-2 surface reflectance data from all available Landsat imagery archived on the GEE platform from 1984–2022. We considered data from Landsat 5 Thematic Mapper (TM; 1984–2013), Landsat 7 Enhanced Thematic Mapper Plus (ETM+; 1999–2021), and Landsat 8 Operational Land Imager (OLI; 2013–2022), which share broadly comparable band configurations. Surface reflectance data from Landsat 5 TM and Landsat 7 ETM+ were processed using the Landsat Ecosystem Disturbance Adaptive Processing System (LEDAPS) algorithm, while data from Landsat 8 and 9 OLI were generated using the Land Surface Reflectance Code (LaSRC). We focused on the green, red, near infrared (NIR), and shortwave infrared (SWIR) bands and their derived vegetation indices for fire signal characterization.
2.2 Auxiliary datasets
We generated a global forest mask for identifying forest fires using MODIS-based tree cover and land cover products. Tree cover was derived from the 250 m global annual tree cover product (GLOBMAP FTC; https://doi.org/10.5281/zenodo.10589730, Liu and Liu, 2024), which improves global tree cover estimates by leveraging highly discriminative spectral features and extensive near-global training samples (Liu et al., 2024). We first constructed a maximum tree cover layer by selecting the highest tree cover value for each pixel during 2000–2021. We then defined forests as areas with the derived maximum tree cover greater than 25 %. This operational threshold is commonly used in global forest mapping studies to distinguish forest from non-forest land cover types on satellite data (Myroniuk et al., 2020; Hansen et al., 2013; Harris et al., 2012). While it improves global consistency in forest delineation, it may exclude some sparsely wooded systems, particularly in dry forest-savanna transition regions such as parts of western North America. We further excluded tropical savannas and shrublands using the MODIS land cover product MCD12Q1 under the International Geosphere-Biosphere Programme (IGBP) classification scheme (Sulla-Menashe et al., 2019). This product was chosen because it provides relatively consistent global differentiation between tropical savannas, shrublands, and forested areas. The resulting forest mask (shown in Fig. 5d) was applied to all burned area detections to retain only fire patches occurring within forested areas.
Additionally, we used the MODIS burned area product MCD64A1 (Giglio et al., 2018) over 2001–2022 as a reference to generate Landsat-based training samples for ANN modeling. Although MCD64A1 has known limitations in forests (Boschetti et al., 2019), it provides a temporally and spatially consistent source for identifying candidate burned pixels across the globe, a difficult task to achieve from Landsat alone given its lower temporal frequency. This product provides monthly burned area information at 500 m resolution based on changes from both surface reflectance and thermal anomalies. We also incorporated the 30 m Global Forest Change (Hansen et al., 2013) and Global Forest Losses due to Fire (Tyukavina et al., 2022) products (https://glad.umd.edu/dataset, last access: 17 August 2026) to reduce potential confusion between fire-related and non-fire disturbances such as logging.
2.3 Intercomparison datasets
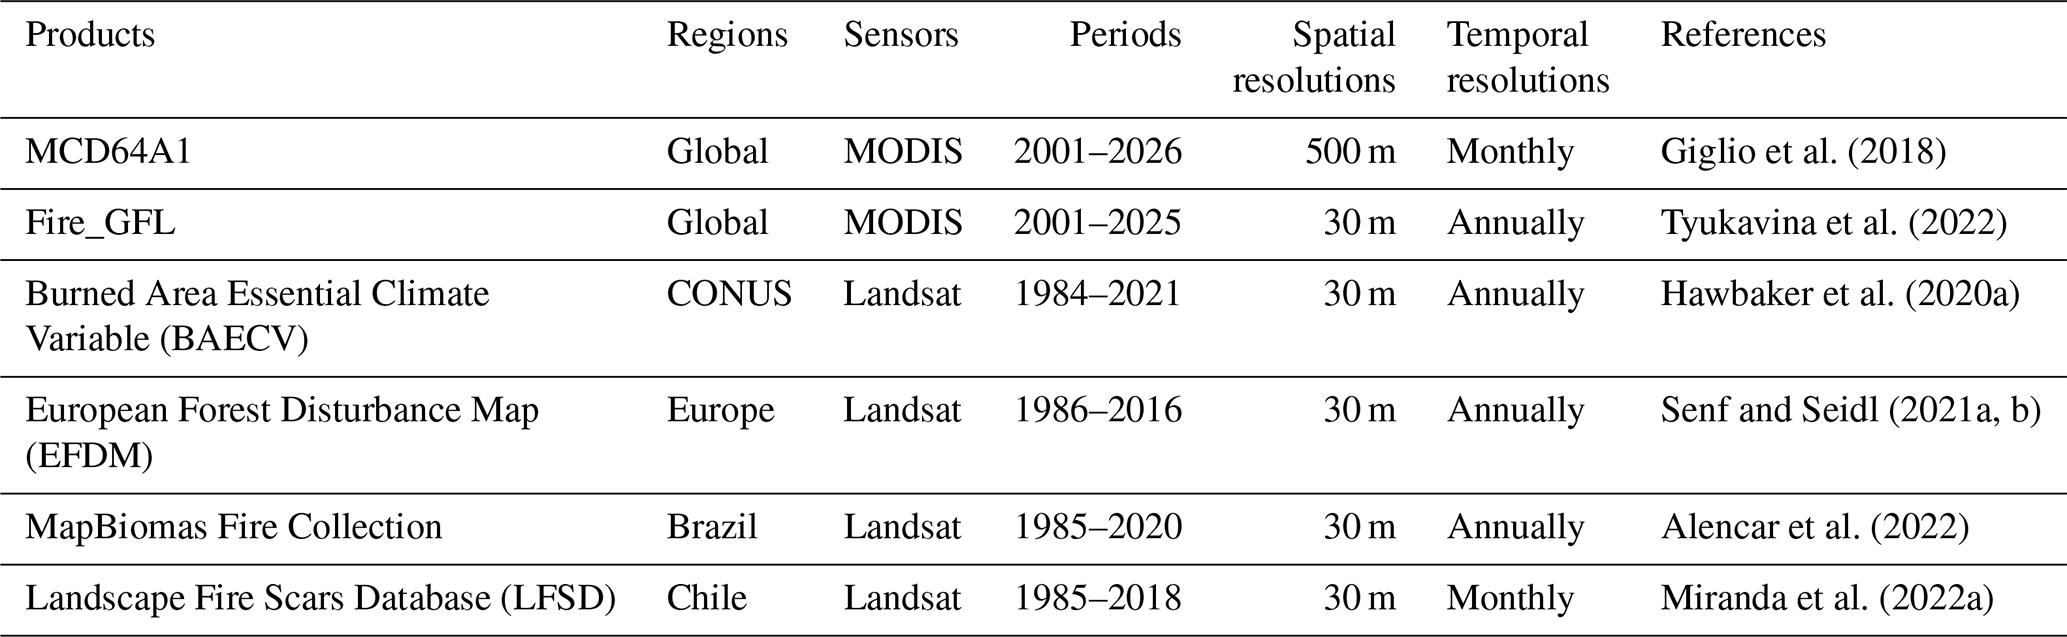
Existing fire datasets with comparable characteristics were employed for intercomparison to assess the similarities and differences in fire patch distribution, spatial organization, and burned area estimates among products (Table 1). We considered four Landsat-based burned area products for regional comparison: the BAECV (https://doi.org/10.5066/P9QKHKTQ, Hawbaker et al., 2020b) for the CONUS, the European Forest Disturbance Maps (EFDM; https://doi.org/10.5281/zenodo.3924381, Senf and Seidl, 2020) for Europe, the LFSD (https://doi.org/10.1594/PANGAEA.941127, Miranda et al., 2022b) for Chile, and the MapBiomas Fire Collection (https://brasil.mapbiomas.org/en/mapbiomas-fogo/, last access: 17 August 2026) for Brazil. The BAECV product, developed by the US Geological Survey, maps annual burned area across the CONUS from 1984 onward using dense Landsat time-series (Hawbaker et al., 2020a). In Europe, the EFDM provides 30 m annual maps of forest disturbance patches and distinguishes fire-driven and storm-driven records during 1986–2021 (Senf and Seidl, 2021a, b). The LFSD provides size, perimeter, and severity of individual fires in Chile from 1985–2018 (Miranda et al., 2022a). The MapBiomas Fire Collection characterizes long-term fire dynamics in Brazil since 1985 (Alencar et al., 2022). Globally, we used the MODIS-based burned area product MCD64A1 (Giglio et al., 2018) and the Landsat-based Global Forest Loss due to Fire (Fire_GFL; https://glad.umd.edu/dataset/Fire_GFL/, last access: 17 August 2026) data (Tyukavina et al., 2022) for intercomparison. This widely used MODIS product provides monthly 500 m burned area maps from 2000 onward, derived using a hybrid algorithm that integrates thermal anomalies, surface reflectance, and contextual information to detect burn scars. The Fire_GFL dataset provides a global 30 m map of annual forest loss due to fire from 2001–2025. It was developed to quantify fire-related forest loss consistently across global forests and supports unbiased area estimation and analysis of long-term trends using high-resolution satellite observations.
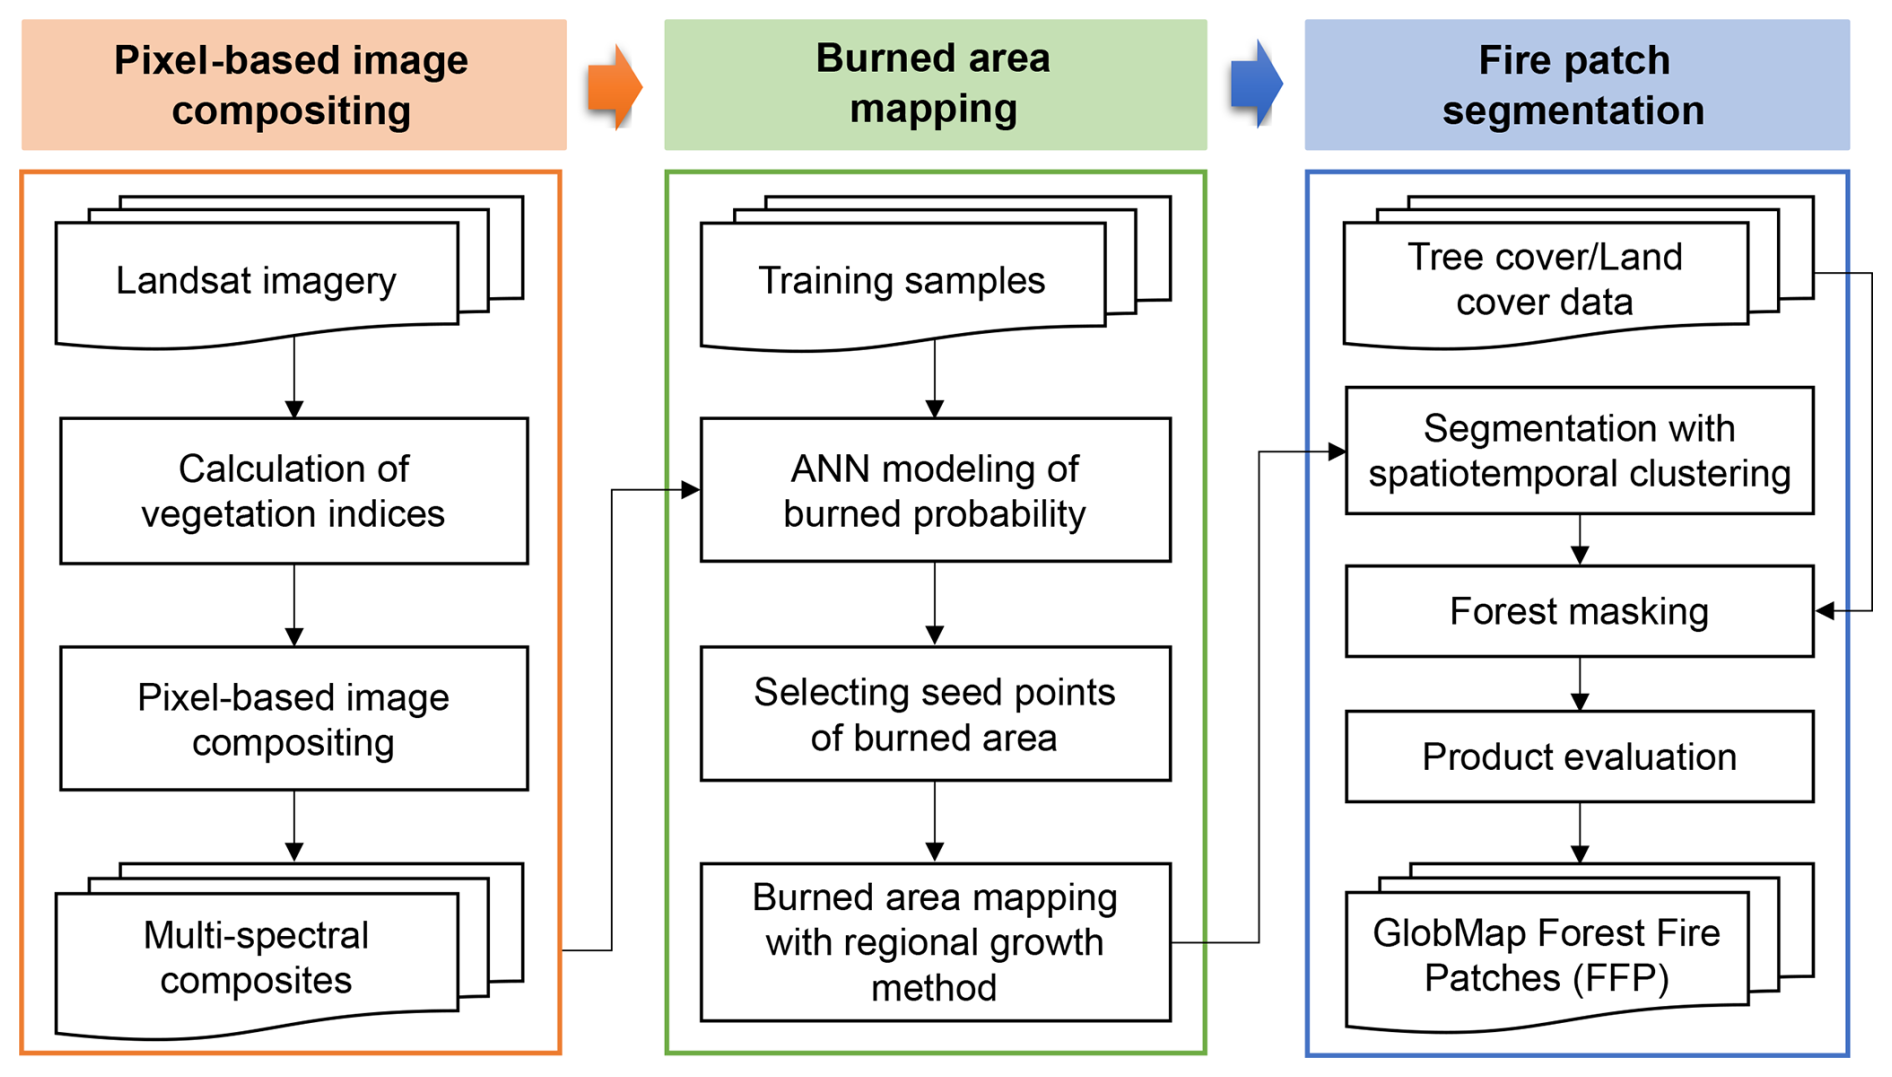
GlobMap FFP was designed to provide a long-term, spatially explicit characterization of forest fire patches derived from the global Landsat archive. This product prioritizes spatial consistency, global scalability, and preservation of fine-scale fire patch morphology under heterogeneous Landsat observation conditions. Several methodological choices reflect practical trade-offs associated with the characteristics of the Landsat archive. Persistent cloud contamination, irregular observation frequency, sensor differences, and the relatively long revisit interval of Landsat complicate globally consistent fire detection over multi-decadal periods. Consequently, we adopted multi-temporal image compositing, annual-scale temporal aggregation, and raster-based patch representation to support disturbance-signal consistency and computational feasibility at the global scale.
The development of the GlobMap FFP product involved three main steps (Fig. 1). First, we applied a pixel-based image compositing algorithm to generate multi-year Landsat composites at approximately five-year intervals. Second, we mapped burned area pixels using spectral information from the composites with ANN regression modeling. Third, we applied a spatiotemporal clustering algorithm to segment the mapped burned area pixels from the previous step into distinct fire scars, and encoded each as an individual fire patch. The image compositing step was conducted on the GEE platform, while the subsequent burned area mapping and fire patch segmentation processes were performed offline on a local computing server. Finally, the product was evaluated through performance assessment and intercomparison against existing burned area datasets.
3.1 Product development
3.1.1 Pixel-based image compositing
To improve spatial consistency under heterogeneous Landsat observation conditions, we generated multi-year composites by aggregating Landsat observations within predefined temporal intervals and retaining the most pronounced spectral signals associated with burned vegetation. Because clear-sky Landsat observations were substantially less available before 2000, the pre-2000 period was divided into two longer compositing intervals (1984–1990 and 1991–2000). After 2000, composites were generated at approximately five-year intervals (2001–2005, 2006–2010, 2011–2015, 2016–2020, and 2021–2022). The interval was selected as a compromise between observation availability and temporal specificity. Shorter intervals substantially reduced observation availability in many cloud-prone regions and in the early Landsat archive, whereas longer intervals increased the likelihood of merging distinct fire events. All available Landsat sensors operating within each interval were used.
Here, we employed the minimum Brown Vegetation Index (BVI) compositing approach (Liu, 2017) to generate multi-year imagery. Previous compositing approaches commonly relied on minimum NBR, NDVI, or NIR values (Chuvieco et al., 2005; Miettinen and Liew, 2008; Barbosa et al., 1998; Alencar et al., 2022). However, NIR-based burn signals often recover rapidly after fire, which can reduce their persistence in long-term composites, particularly in regions with sparse observations or rapid vegetation regrowth (Mckenna et al., 2018; Pérez-Cabello et al., 2021). By contrast, the green-SWIR2 contrast captured by BVI tends to preserve burn-darkening signals for longer periods and is less sensitive to cloud, shadow, and aerosol contamination during minimum-value compositing (Liu, 2017). BVI is calculated as:
where ρGreen and ρSWIR2 represent surface reflectance in the green and SWIR at 2.1 µm (SWIR2) wavelengths, respectively. BVI exploits the contrasting spectral responses of burned surface in the green and SWIR2 bands. Following fire disturbance, SWIR2 reflectance typically increases because of vegetation moisture reduction and charcoal deposition, whereas green reflectance decreases with vegetation damage (Chuvieco et al., 2019; Liu, 2017), producing characteristically low BVI values over burned area.
For each pixel, we first identified ten candidate observations with the lowest BVI values using Landsat time series within each compositing interval. Among these candidates, the observation with the lowest surface reflectance in the NIR band was selected to generate the compositing layer. The acquisition year of the selected observation was recorded as the burned year. The final compositing layer retained all Landsat surface reflectance bands together with the burned year layer for subsequent burned area mapping and fire patch segmentation (Fig. 2). By condensing observations within each compositing interval into a single representative record, the approach reduced data volume and limited repeated representation of persistent burn scars across consecutive years.
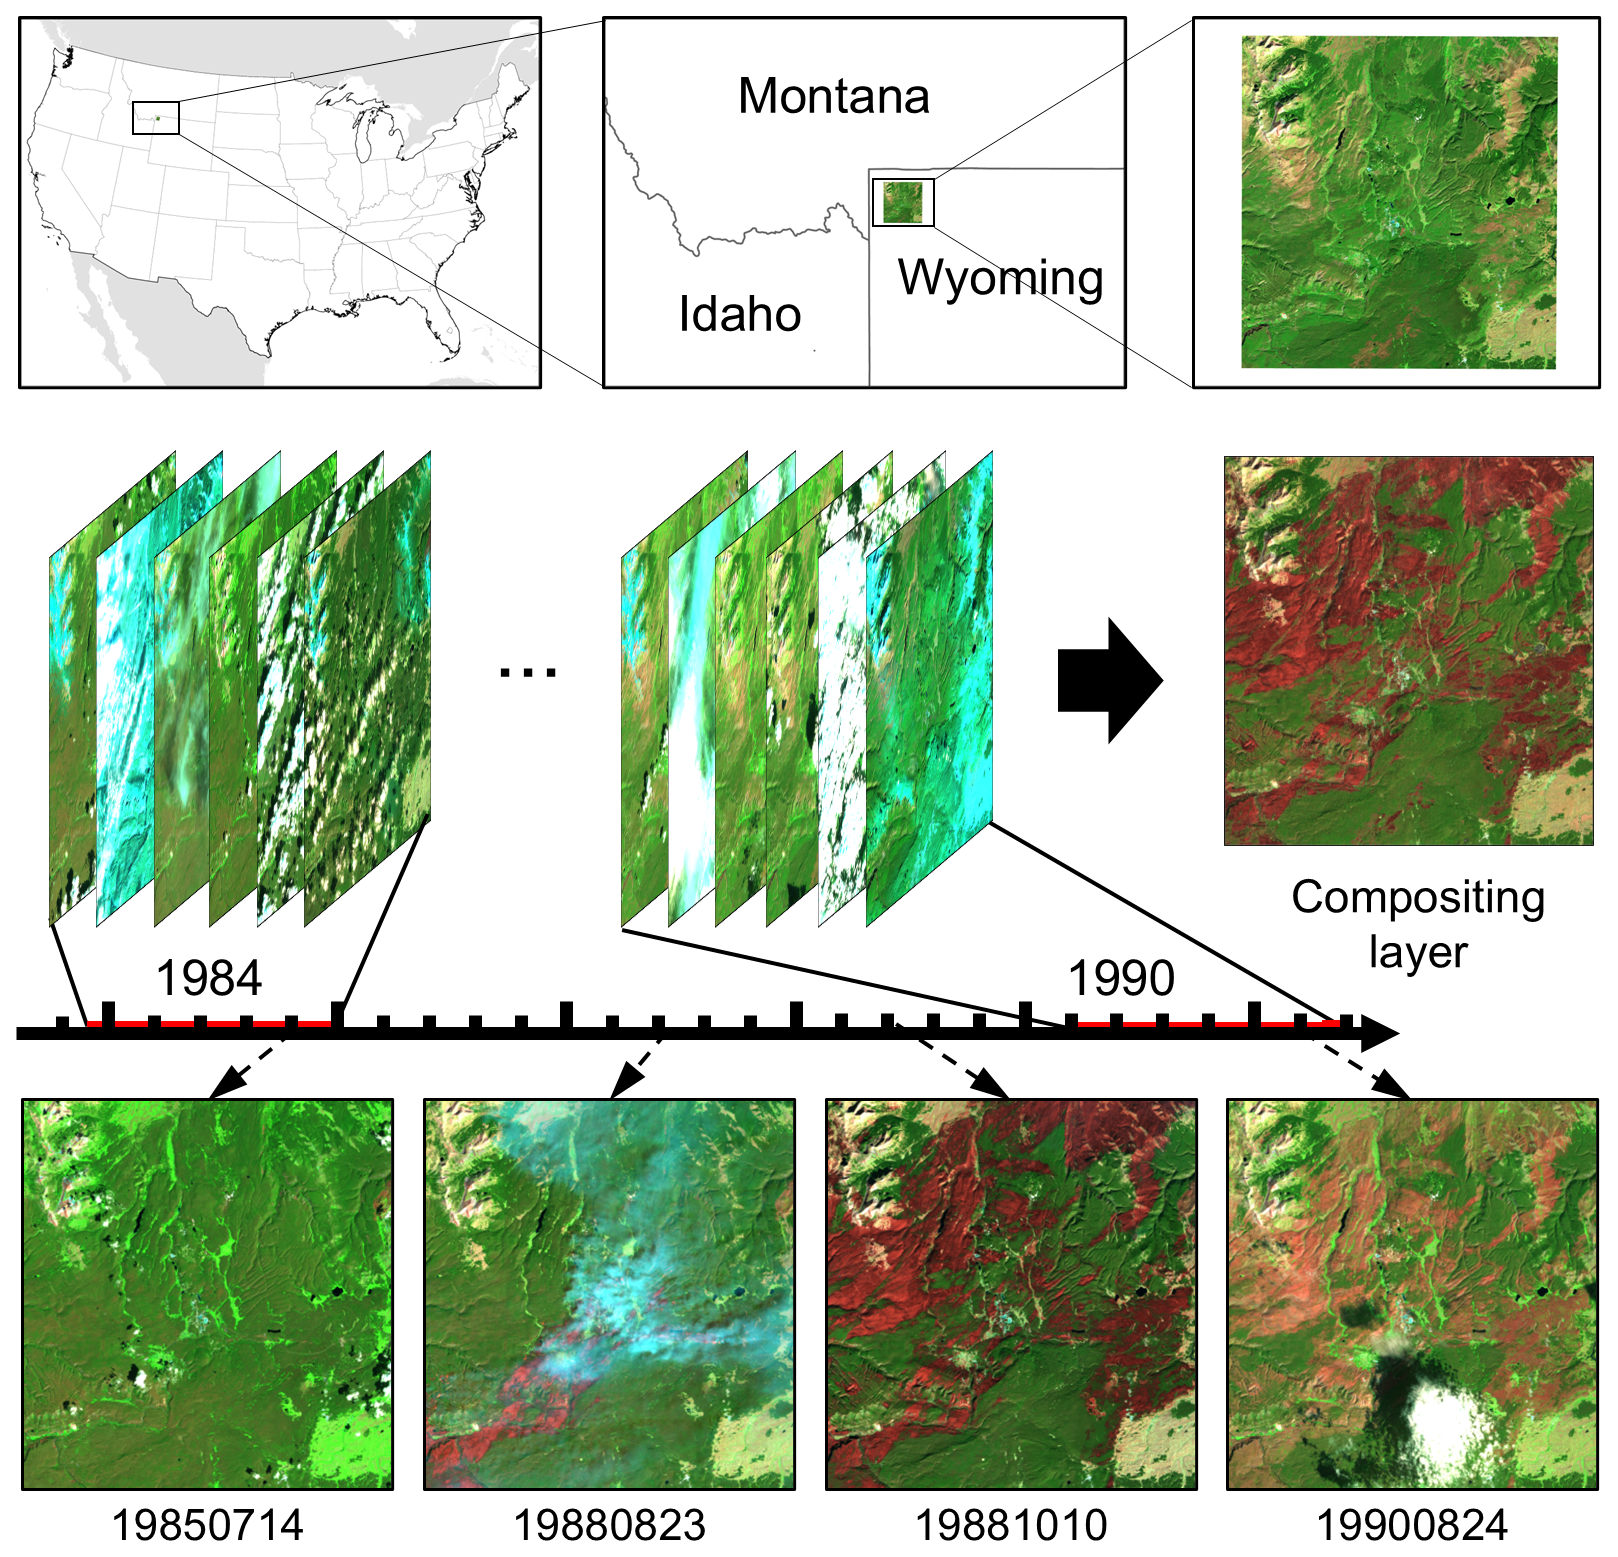
Figure 2Illustration of the multi-year compositing procedure for deriving the compositing layer with condensed burned signals, shown here using Landsat imagery from 1984–1990 in Yellowstone National Park as an example.
3.1.2 Burned area mapping
Training samples of burned and unburned pixels were derived from Landsat imagery using MCD64A1 burned area and MCD12Q1 land cover products to guide sample selection rather than providing direct training labels. We first divided the globe into 2°×2° grid cells and overlaid each grid with Landsat Thiessen Scene Area (TSA) units. For each grid, we selected Landsat tiles with forest cover exceeding 80 % and the largest burned area, yielding a total of 800 tiles for sample extraction. Burned pixels within each tile were independently delineated from Landsat imagery using a maximum curvature segmentation method (Duan et al., 2024), which identifies burned surfaces based on SWIR2 and NIR reflectance changes. All segmentation outputs were visually inspected before sample extraction. Burned samples were then randomly drawn from these detected burned pixels, while unburned samples were taken from nearby unaffected forest pixels. Because Landsat composites may include non-fire disturbances (e.g., logging), we also collected samples of non-fire forest loss and treated them as unburned to help the model distinguish fire from other disturbance types. Specifically, we separated fire-related forest loss identified in the Global Forest Loss due to Fire dataset (Tyukavina et al., 2022) from all forest loss in the 30 m Global Forest Change product (Hansen et al., 2013), and used the remaining loss as non-fire disturbance. The resulting sample set was designed to capture the spectral variability of burned, unburned, and non-fire disturbance conditions across major forest biomes.
We then developed an ANN model to estimate the burned probability of each pixel. Input variables included Landsat surface reflectance bands together with NBR, NDVI, and normalized different water index (NDWI) derived from the multi-year composites. The network consisted of five hidden layers using the ReLU activation function and a sigmoid output layer (Nair and Hinton, 2010), yielding burned probabilities ranging from 0–1. Samples were randomly divided into training (70 %) and testing (30 %) subsets. To generate the final burned area map, we identified seed points with burn probabilities higher than 80 %. A regional growing algorithm was then applied to expand the seed points into neighboring pixels and delineate the full extent of the burned area. Pixels with burn probabilities greater than 40 % and located within an 8-connected neighborhood were further aggregated into the final burned area. The resulting burned area map served as the input for subsequent fire patch segmentation and reconstruction.
3.1.3 Fire patch segmentation
Burned area pixels detected within the same burned year and separated by a distance of less than 20 Landsat pixels (600 m) were grouped as a single fire patch and assigned a unique fire identifier. The objective of this procedure was to generate spatially coherent fire patches suitable for fire regime analyses at a global scale rather than to reconstruct individual ignition events. This distance threshold was selected to bridge small unburned gaps commonly caused by heterogeneous fire spread, cloud contamination, or omission errors in burned area detection while avoiding excessive merging of spatially independent fires. Temporal segmentation was based on annual burned year assignments rather than sub-annual fire chronology, because the heterogeneous availability of cloud- and snow-free Landsat observations limits reliable global-scale reconstruction of fire timing (Feng and Wang, 2024; Flores-Anderson et al., 2023). As a consequence, multiple fires occurring within the same year and in close spatial proximity may be represented as a single fire patch, potentially overestimating patch sizes and reducing the number of identified fire patches.
For each fire patch, we derived a QA level to assess the confidence by comparing spectral signals with those of surrounding forest reference pixels. The reference pixels were extracted from the 10-pixel outer border of each fire patch with a pre-burning land cover type of forests. We constructed a secondary ANN model to estimate a confidence score using training samples generated in Sect. 3.1.2. Surface reflectance from the Red, NIR, SWIR2 bands, as well as the differences between SWIR2 and NIR bands and between SWIR2 and Red bands, were used as input features. Based on the predicted confidence score, we categorized all fire patches into four QA levels: level 1 (75 %–100 %), level 2 (50 %–75 %), level 3 (25 %–50 %), and level 4 (0 %–25 %). Here level 1 indicates the highest confidence in detecting a fire patch, while level 4 indicates the lowest.
To ensure that the final dataset represented forest fire patches, several post-processing filters were applied. First, non-forest fire patches were removed using a forest mask derived from GLOBMAP fractional tree cover and MCD12Q1 land cover products. Second, potential logging disturbances were excluded based on geometric characteristics, because harvest units typically exhibit more regular shapes and smoother boundaries than fire scars. Specifically, fractal dimension and perimeter-area ratio were calculated for each patch. Finally, fire patches smaller than 20 Landsat pixels (1.8 ha) were excluded to reduce detection uncertainties.
3.2 Product evaluation
3.2.1 Performance assessment
To evaluate the performance of GlobMap FFP, we constructed a Landsat-derived reference dataset using the TSA units selected to achieve broad geographic coverage following the spatial distribution of the burned area reference database (BARD) (Franquesa et al., 2020). The assessment was designed to quantify agreement between GlobMap FFP and a separately generated reference dataset derived from the same Landsat archive, rather than to provide a fully independent validation. In total, we sampled 74 Landsat TSA units across major forest biomes (Fig. 3). Then Landsat scenes with cloud cover below 40 % in these units were sampled, spanning the full study period and encompassing observations from the Landsat 5, 7, and 8 archives, resulting in a total of 945 Landsat scenes. The cloud cover threshold was introduced to improve the interpretability and consistency of the reference data, but may reduce the representation of highly cloud-prone regions in the evaluation dataset.
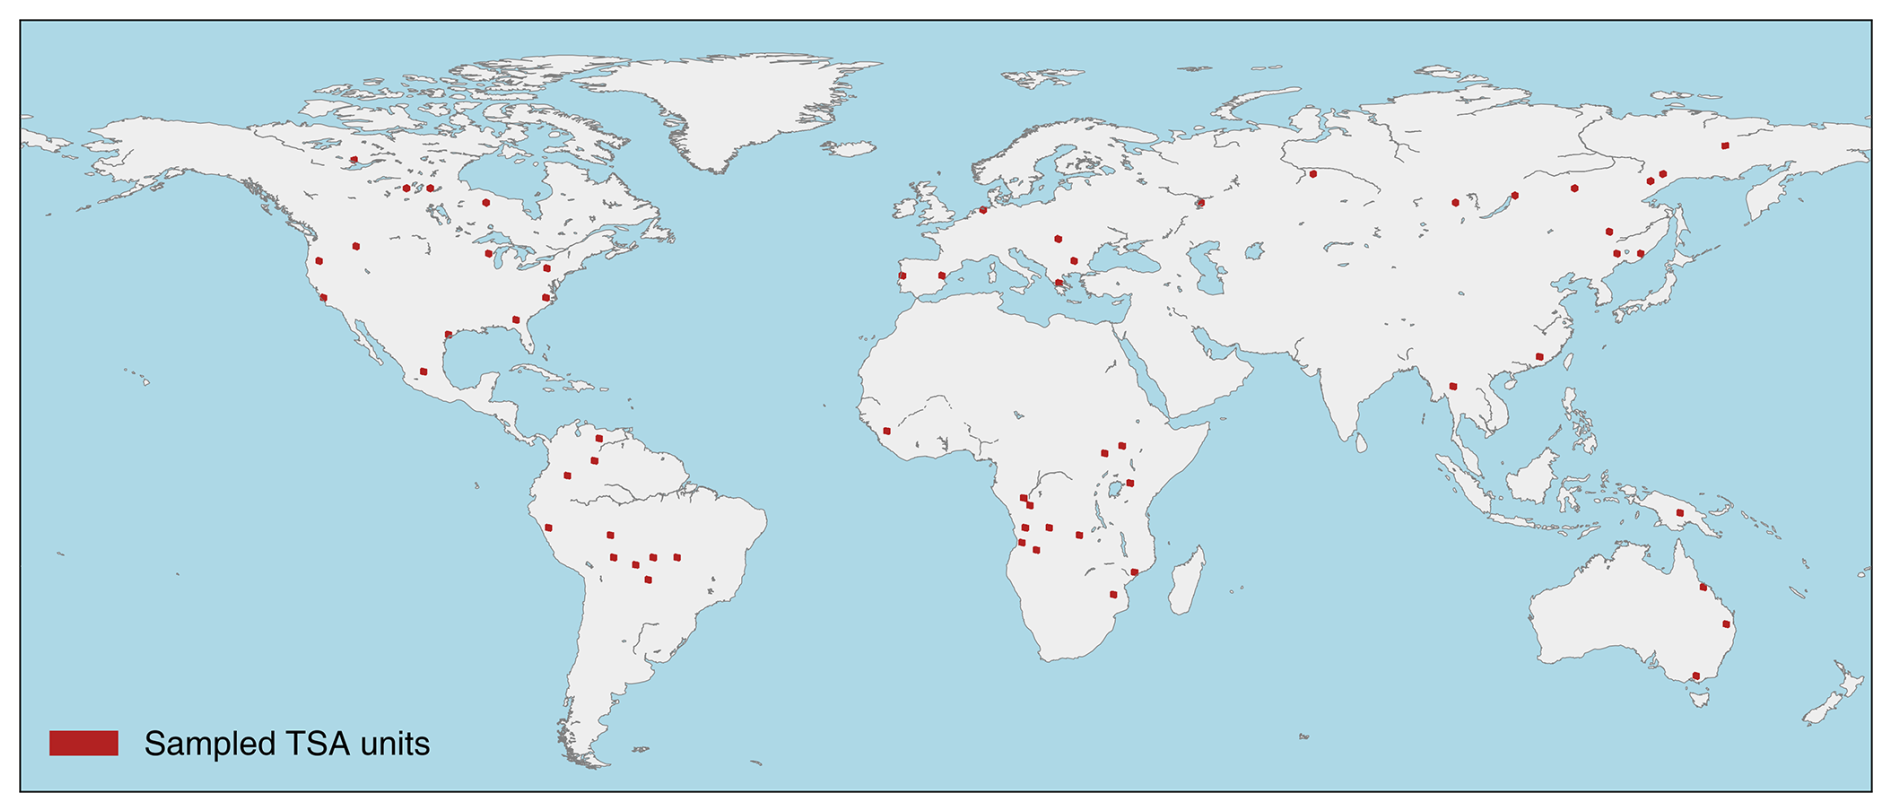
Figure 3Spatial coverage of sampled Landsat Thiessen Scene Area (TSA) units.
Burned area was delineated using the same maximum-curvature segmentation algorithm (Duan et al., 2024). The resulting scene-level detections were then composited to generate reference burned area maps for each TSA unit. Agreement between GlobMap FFP and the reference dataset was quantified using confusion matrices. We calculated commission error (CE), omission error (OE), Dice coefficient (DC), and relative bias (relB) for five forest types defined based on MODIS land cover data (Padilla et al., 2015). Because both datasets were derived from Landsat imagery and relied on related burned area detection procedures, these metrics should be interpreted as measures of internal consistency rather than fully independent estimates of product accuracy.
3.2.2 Product intercomparison
Product intercomparison was conducted to assess consistency in burned area representation and fire patch characterization between GlobMap FFP and existing burned area datasets. At the global scale, GlobMap FFP was compared with the MODIS-based MCD64A1 and the Landsat-based Fire_GFL across the fourteen Global Fire Emission Dataset (GFED) regions. At the regional scale, GlobMap FFP was compared with four long-term Landsat-based regional products (BAECV, LFSD, EFDM, and MapBiomas) in the CONUS, Chile, Europe, and Brazil (Table 1). For each regional comparison, three pairwise comparisons were performed: (1) GlobMap FFP versus MCD64A1; (2) regional Landsat-based products versus MCD64A1; (3) GlobMap FFP versus regional Landsat-based products. Forest burned area was extracted from all products using the same fire patch segmentation method described in Sect. 3.1.3 to ensure comparability. Because regional burned area products and GFED regions were developed using different spatial frameworks, their geographic extents are not always identical. Comparisons involving regional products and GFED regions were conducted within broadly comparable domains rather than exactly matching boundaries.
We performed three complementary analyses for intercomparison. First, annual forest burned area was compared among products using linear regression and Pearson's r correlation to evaluate temporal consistency in burned area dynamics. Second, spatial agreement was assessed by matching annual fire patches between products and classifying burned pixels into five overlap categories (Fig. 4): (1) No overlap – unique to Product 1, (2) Overlap – detected only by Product 1, (3) Overlap – detected by both products, (4) Overlap – detected only by Product 2, and (5) No overlap – unique to Product 2. Groups 1 and 5 represent unmatched fire patches unique to each product. Groups 2 and 4 indicate partial spatial agreement (shared patches but divergent extents), and Group 3 reflects full agreement in fire extent. We summarized the relative contribution of each group separately for smaller (<200 ha) and larger (>200 ha) fire patches. The relative contribution was calculated as the proportion of burned area assigned to each group relative to the total burned area across all five groups, as follows:
where Contributioni represents the relative contribution of Group i, and BAi represents the burned area of Group i ().
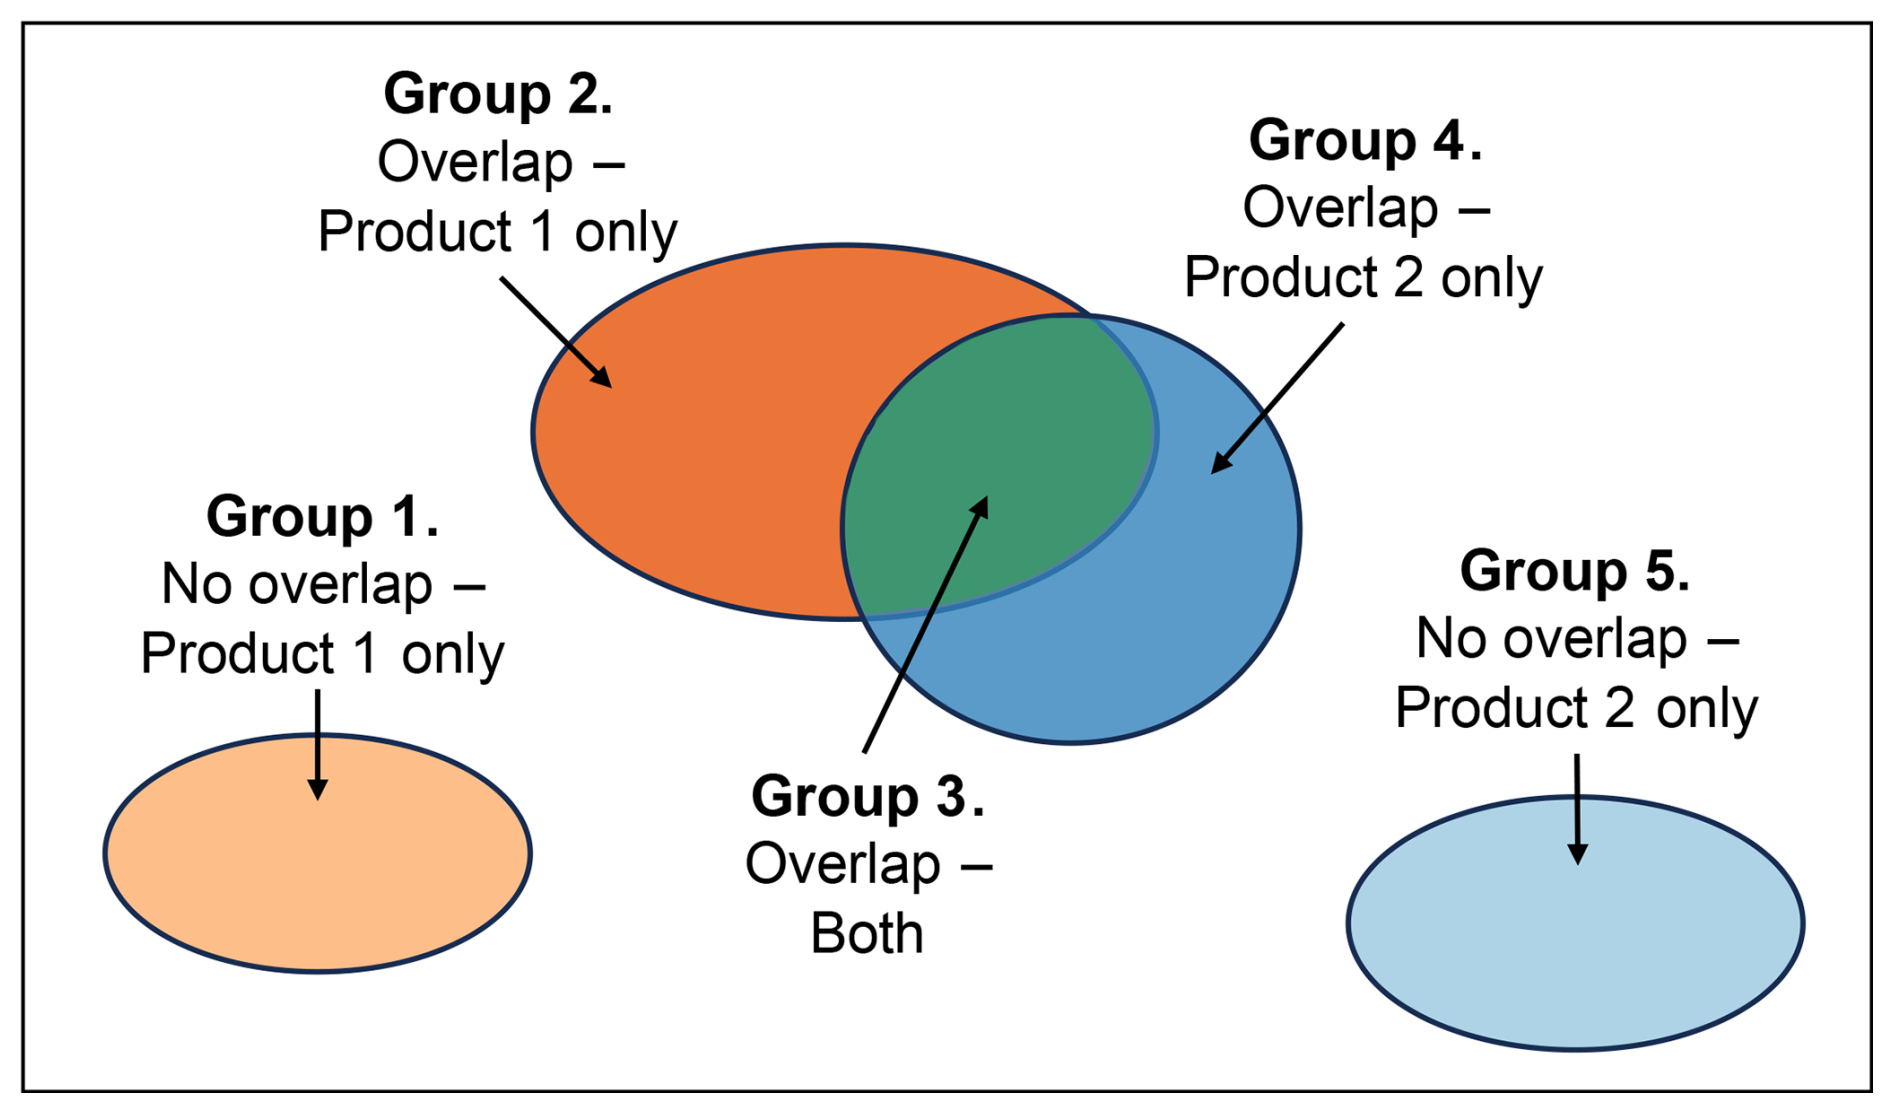
Figure 4Conceptual framework of the spatial agreement analysis based on one-to-one matching of individual fire patches between two products. After matching corresponding fire patches, burned pixels were classified into five spatial groups. Groups 1 and 5 represent product-specific fire patches uniquely detected by one product. Groups 2 and 4 reflect within-patch extent differences, where corresponding fire patches are identified by both products by portions of the burned extent are detected by only one product. Group 3 represents shared burned extent detected by both products.
Third, temporal agreement was evaluated by randomly sampling 30 % of the spatially overlapping burned pixels identified by both products and calculating the proportion of pixels with consistent burned-year assignments within a ±3 year difference (Senf and Seidl, 2021b). Temporal agreement was also summarized separately for smaller and larger fire patches. This analysis was applied to products designed to characterize the timing of burned signals, excluding Fire_GFL because its temporal attributes correspond to fire-induced forest loss rather than burned area occurrence. Comparatively, annual burned area and spatial agreement analyses were conducted for all comparison datasets.
4.1 Characteristics of the GlobMap FFP dataset
Between 1984 and 2022, GlobMap FFP identified a total of 11.97 million individual fire patches across global forests based on the newly developed dataset from this study. We summarized the spatial patterns of burned area, fire patch occurrences, and mean fire patch size derived from the mapped fire patches. Burned area exhibited substantial spatial heterogeneity across global forests (Fig. 5a), with major concentrations in the boreal forests of North America and Eurasia, as well as in the tropical forests of South America and South Asia. Boreal forests in North America and Eurasia accounted for approximately 60.0 % of the total burned area represented in the dataset over the study period. Nevertheless, these burned area concentrations were associated with contrasting fire patch characteristics. Boreal forests typically experienced less frequent but more extensive fire patches, whereas tropical forests were characterized by smaller but more frequent burnings (Fig. 5b and c).
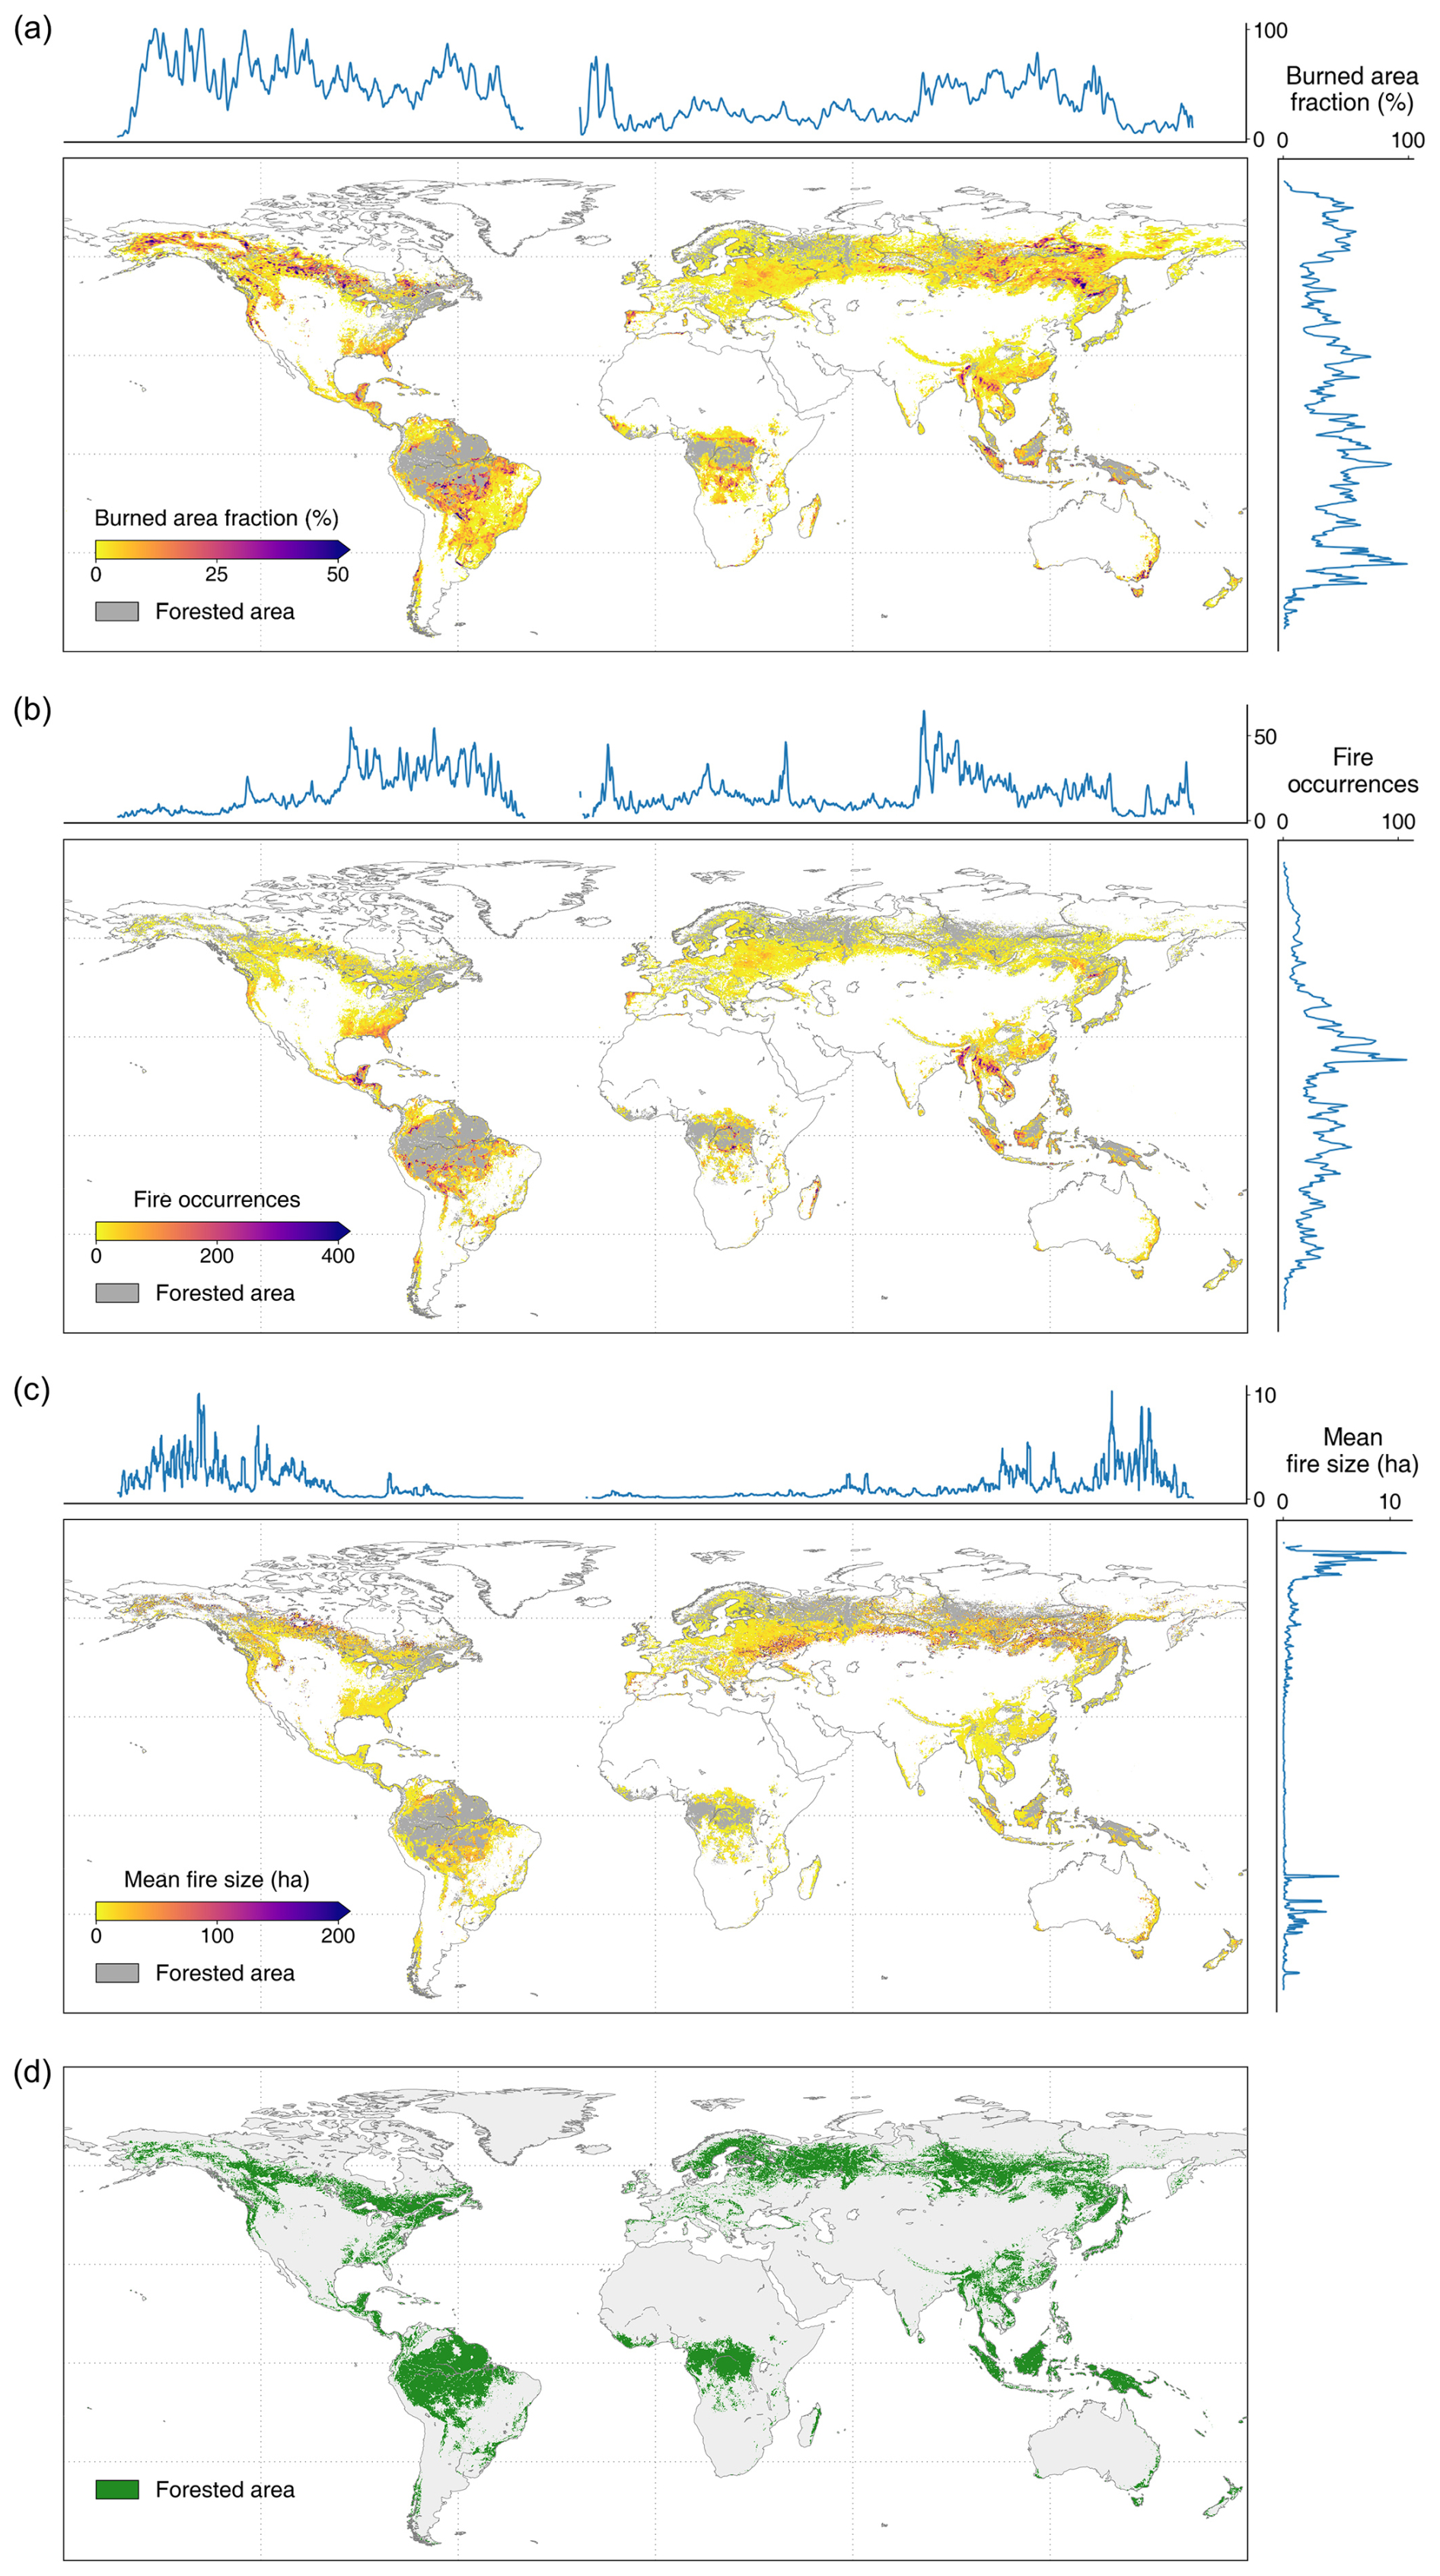
Figure 5Spatial distributions of total global forest fires over 1984–2022 based on the dataset developed in this study. (a) Burned area fraction (%), (b) fire occurrences, (c) mean fire size (ha). (d) shows the identified forested area. The variables were aggregated at a 0.1 resolution for data visualization.
Fire patch occurrences showed pronounced latitudinal gradients across global forests (Fig. 5b). High fire patch occurrences were particularly evident in tropical forests of South America, Africa, and South Asia, where anthropogenic burning is widespread (Archibald et al., 2013). For example, forests in southeastern United States experienced higher fire patch occurrences than boreal forests in North America, which is consistent with the regional differences in fire ignition sources (Veraverbeke et al., 2017). Mean fire patch size showed an opposite spatial pattern (Fig. 5c). Large fire patches were concentrated in boreal and temperate forests at high northern latitudes, whereas tropical and lower-latitude forests were generally characterized by smaller fire patches. This spatial contrast is broadly consistent with previously reported global patterns of fire size from MODIS observations (Hantson et al., 2015). These results highlight substantial geographic variation in the occurrence and size characteristics of fire patches represented in GlobMap FFP.
4.2 Product performance across forest biomes
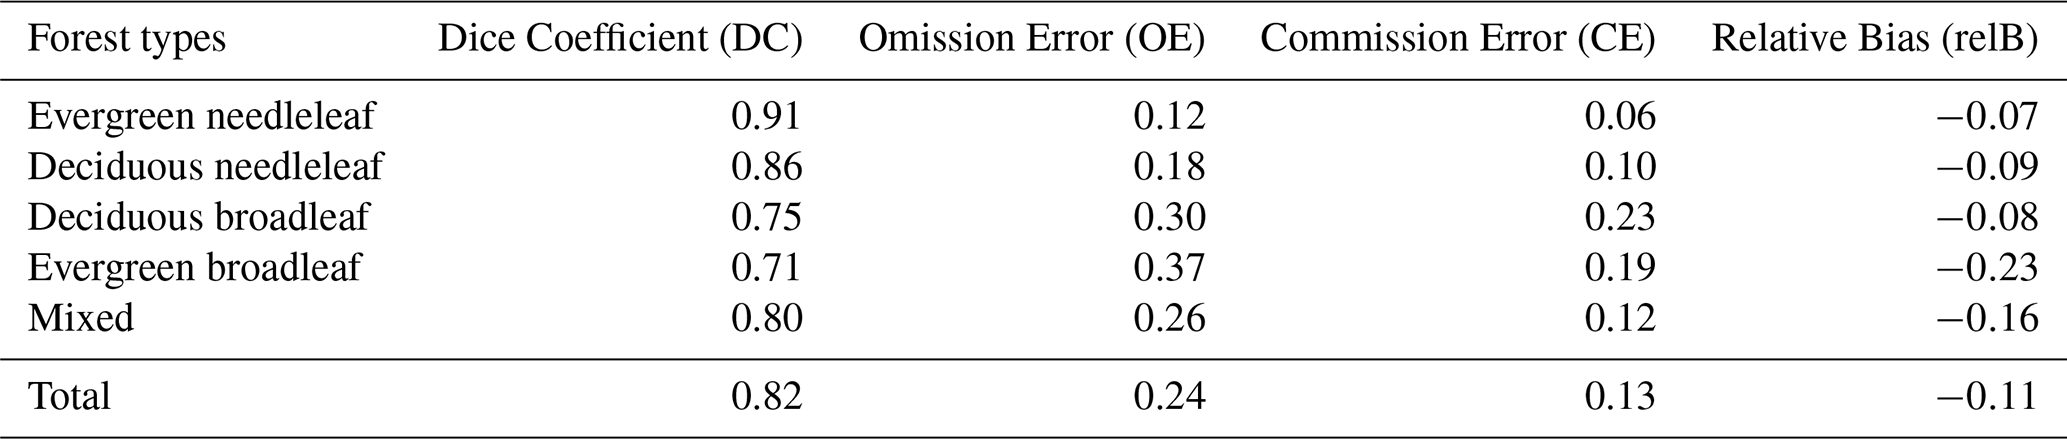
We evaluated product performance using a Landsat-derived reference dataset constructed from independently selected sample locations (Sect. 3.2.1). Product agreement varied among forest types. Across global forests, GlobMap FFP showed a Dice Coefficient of 0.82, with a commission error (CE) rate of 23.8 % and an omission error (OE) rate of 13.2 % (Table 2). The omission error rates ranged from 12.2 %–36.8 %, with the lowest value in evergreen needleleaf forests and the highest in mixed forests. The commission error rates ranged from 6.4 %–23.2 %, with the lowest value in evergreen needleleaf forests and the highest in deciduous broadleaf forests. The boreal and temperate forests showed stronger agreement with the reference dataset, while the agreement in tropical broadleaf and mixed forests was much lower. The omission and commission statistics suggest that major burned scars identifiable from Landsat observations were generally captured within the evaluated samples.
Table 2Summary of performance assessment results across various forest types.
Yet, it is worth noting that the reported omission and commission errors characterize agreement between GlobMap FFP and the Landsat-based reference samples within evaluated locations where burned scars remained detectable in the available observations. These metrics quantify classification agreement conditional on burn detectability rather than the completeness of burned area reconstruction at regional or global scales. Fires that were not observable because of limited observation availability, persistent cloud cover, rapid post-fire vegetation recovery, or compositing effects are not represented in these statistics. Therefore, relatively low omission and commission errors within the evaluated samples do not necessarily imply complete recovery of burned area when estimates are aggregated across regions and decades.
4.3 Consistency with existing fire products
4.3.1 Annual burned area comparison
Comparisons between GlobMap FFP and existing Landsat-based regional products generally showed similar temporal variability in annual forest burned area at the regional scale, although differences in burned area magnitude were observed among products. GlobMap FFP exhibited strong linear relationships (p<0.01, R2>0.5, r>0.75) with the four regional products, except in Europe (Fig. 6). It estimated higher annual burned area than LFSD in Chile, but lower values than BAECV in CONUS and MapBiomas in Brazil. Over the past four decades, the mean annual burned area in Chilean forests detected by GlobMap FFP was about 2.43 times that of LFSD. In CONUS, BAECV reported a mean annual burned area of 0.52 Mha yr−1, 1.69 times that of GlobMap FFP (0.31 Mha yr−1) (Table 3). Similarly, in Brazil, MapBiomas estimated annual forest burned area about 1.58 times that of GlobMap FFP. GlobMap FFP also showed moderate consistency with MCD64A1 in CONUS, Chile, and Brazil (p<0.1). Nevertheless, all three products exhibited weak agreement in European forests. For example, a negative correlation () was found between GlobMap FFP and EFDM. This discrepancy likely reflects differences in mapping strategies, as EFDM first identifies all forest disturbances and then attributes causes using a machine learning-based attribution model (Senf and Seidl, 2021a, b).
Table 3Annual forest burned area in four regions from Landsat-based and MCD64A1 products.
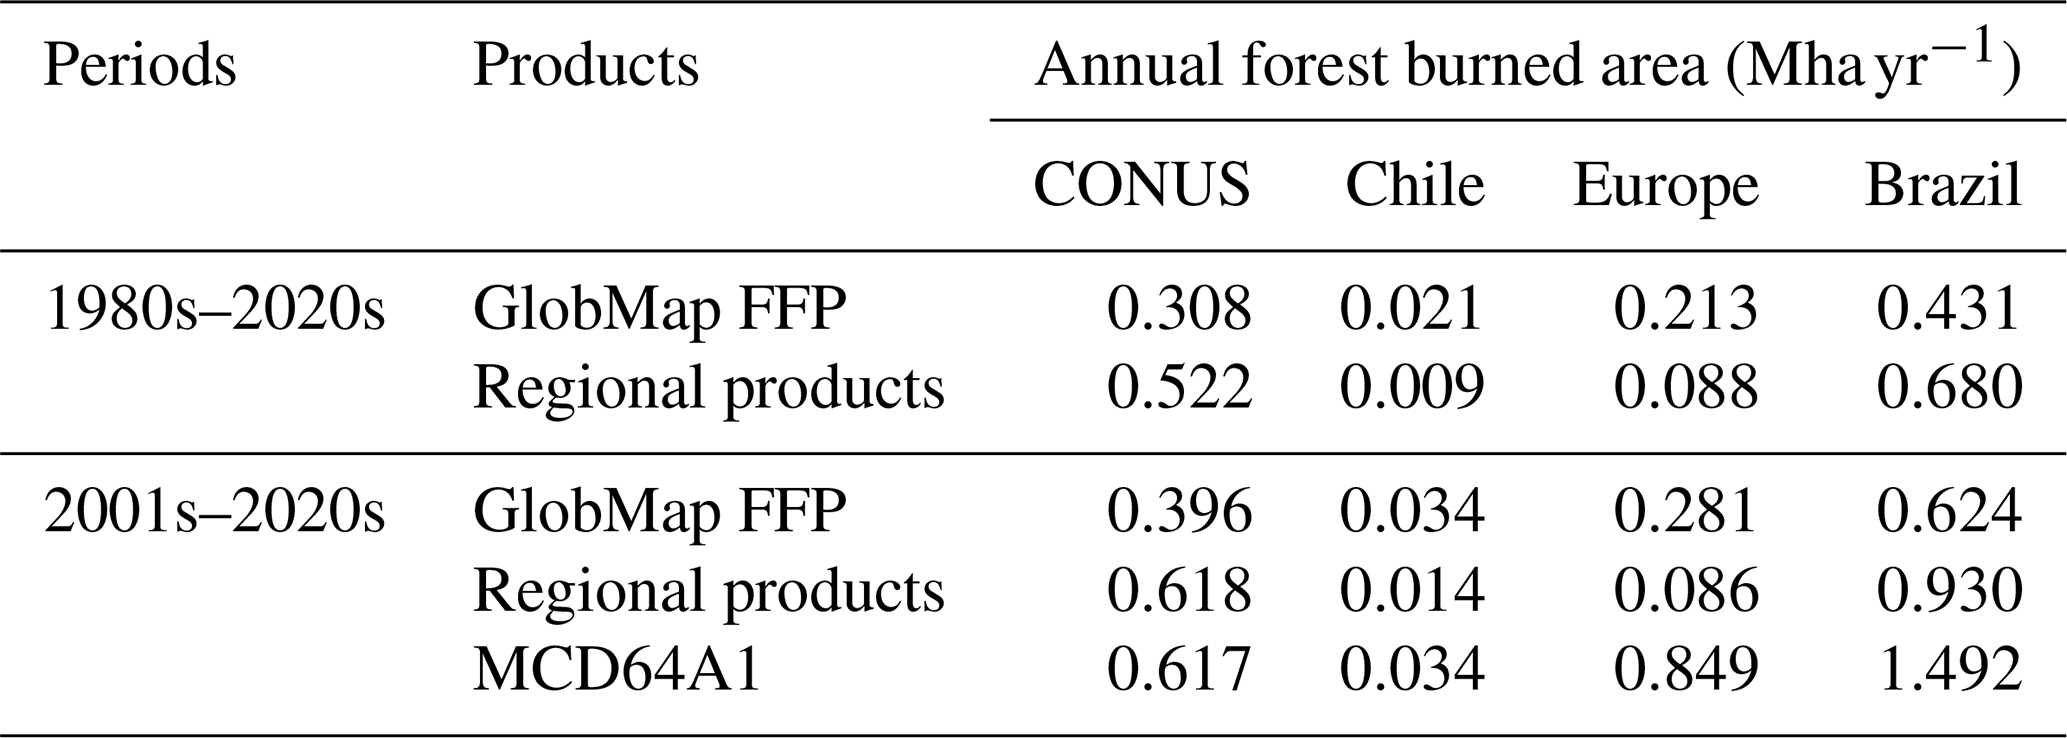
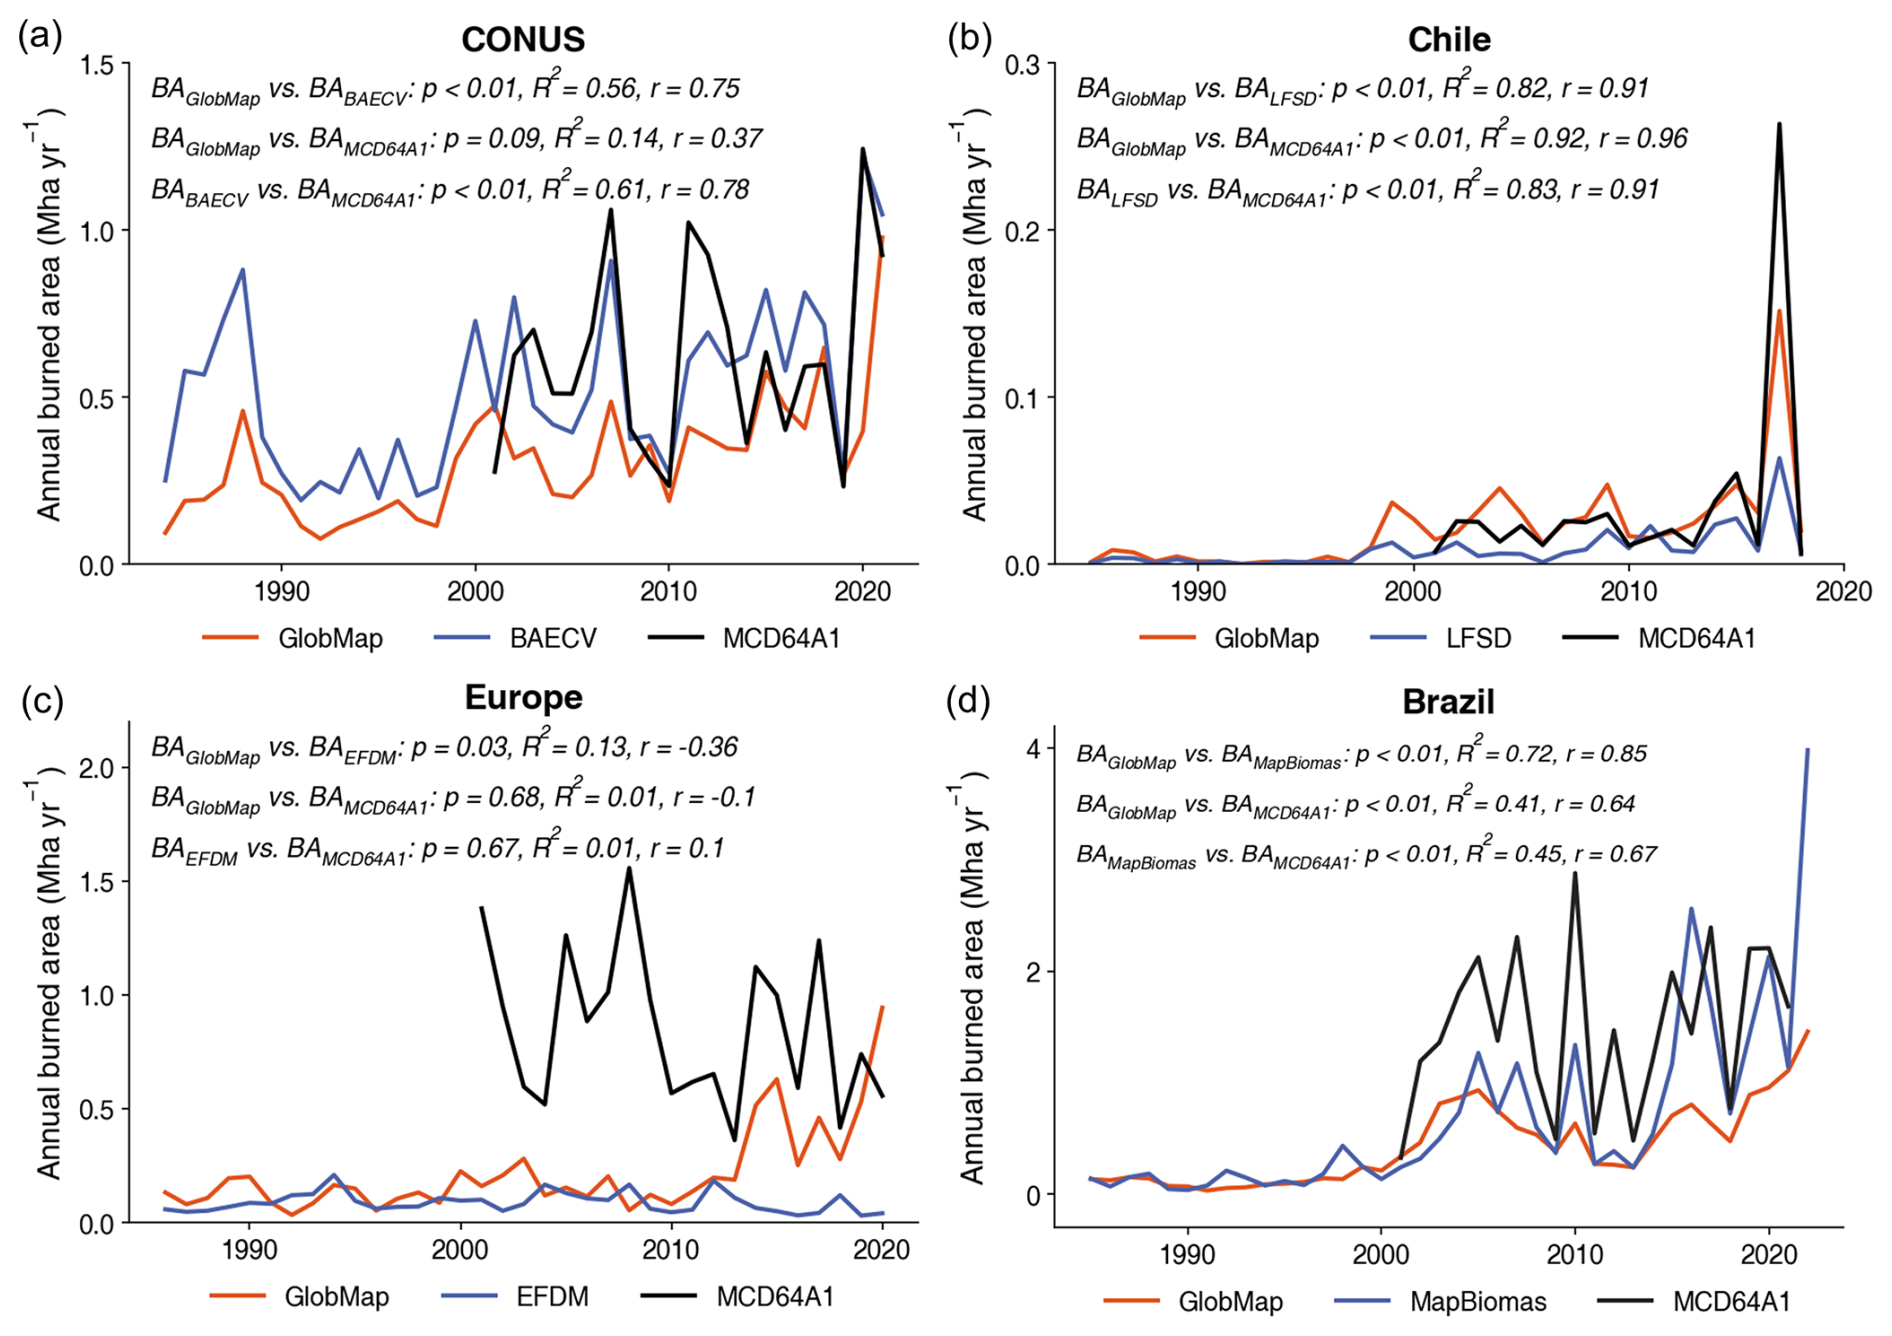
Figure 6Comparison of annual forest burned area estimates between Landsat-based products (GlobMap FFP and four regional datasets) and MCD64A1 across four regions over the past decades. (a) CONUS: GlobMap FFP, BAECV, and MCD64A1 (1984–2021). (b) Chile: GlobMap FFP, LFSD, and MCD64A1 (1985–2018). (c) Europe: GlobMap FFP, EFDM, and MCD64A1 (1986–2020). (d) Brazil: GlobMap FFP, MapBiomas, and MCD64A1 (1985–2022). GlobMap FFP is represented in orange, the four regional products (BAECV, LFSD, EFDM, and MapBiomas) in purple, and MCD64A1 in black. Each subplot includes linear regression statistics and Pearson's correlation coefficients between annual burned area estimates from each product pair.
Global comparison between GlobMap FFP and MCD64A1 revealed marked regional differences in mapped forest burned area, with generally stronger agreement observed in boreal and temperate forests than in tropical forests. From 2001–2021, GlobMap FFP estimated 7.3 Mha yr−1 of forest burned area globally, compared with 19.59 Mha yr−1 from MCD64A1, with the largest differences occurring in tropical regions (Fig. 7). In boreal and temperate domains, including BONA, TENA, EURO, EQAS, and BOAS, the two products showed broadly comparable interannual variability and significant correlations in annual burned area (p<0.1). In contrast, MCD64A1 consistently reported higher burned area across tropical forests, such as NHSA, NHAF, SHAF, and SEAS. These results indicate that differences between GlobMap FFP and MCD64A1 are strongly region dependent, with larger discrepancies occurring in ecosystems characterized by rapid vegetation recovery and frequent cloud contamination. The daily revisit frequency of MODIS increases the likelihood of capturing short-lived or rapidly recovering burns, while cloud-free Landsat observations are often limited in tropical forests (Roteta et al., 2019). The multi-year compositing approach used in GlobMap FFP may further merge repeated fire events occurring at the same location within a compositing interval, resulting in potential underestimation of burned area. Thus, GlobMap FFP should be interpreted as a spatially explicit representation of forest fire patches under heterogeneous observation conditions rather than a complete estimate of forest burned area. Comparison with MCD64A1 does not imply that MCD64A1 provides a true burned area reference, as it contains regional uncertainties and omission errors (Boschetti et al., 2019).
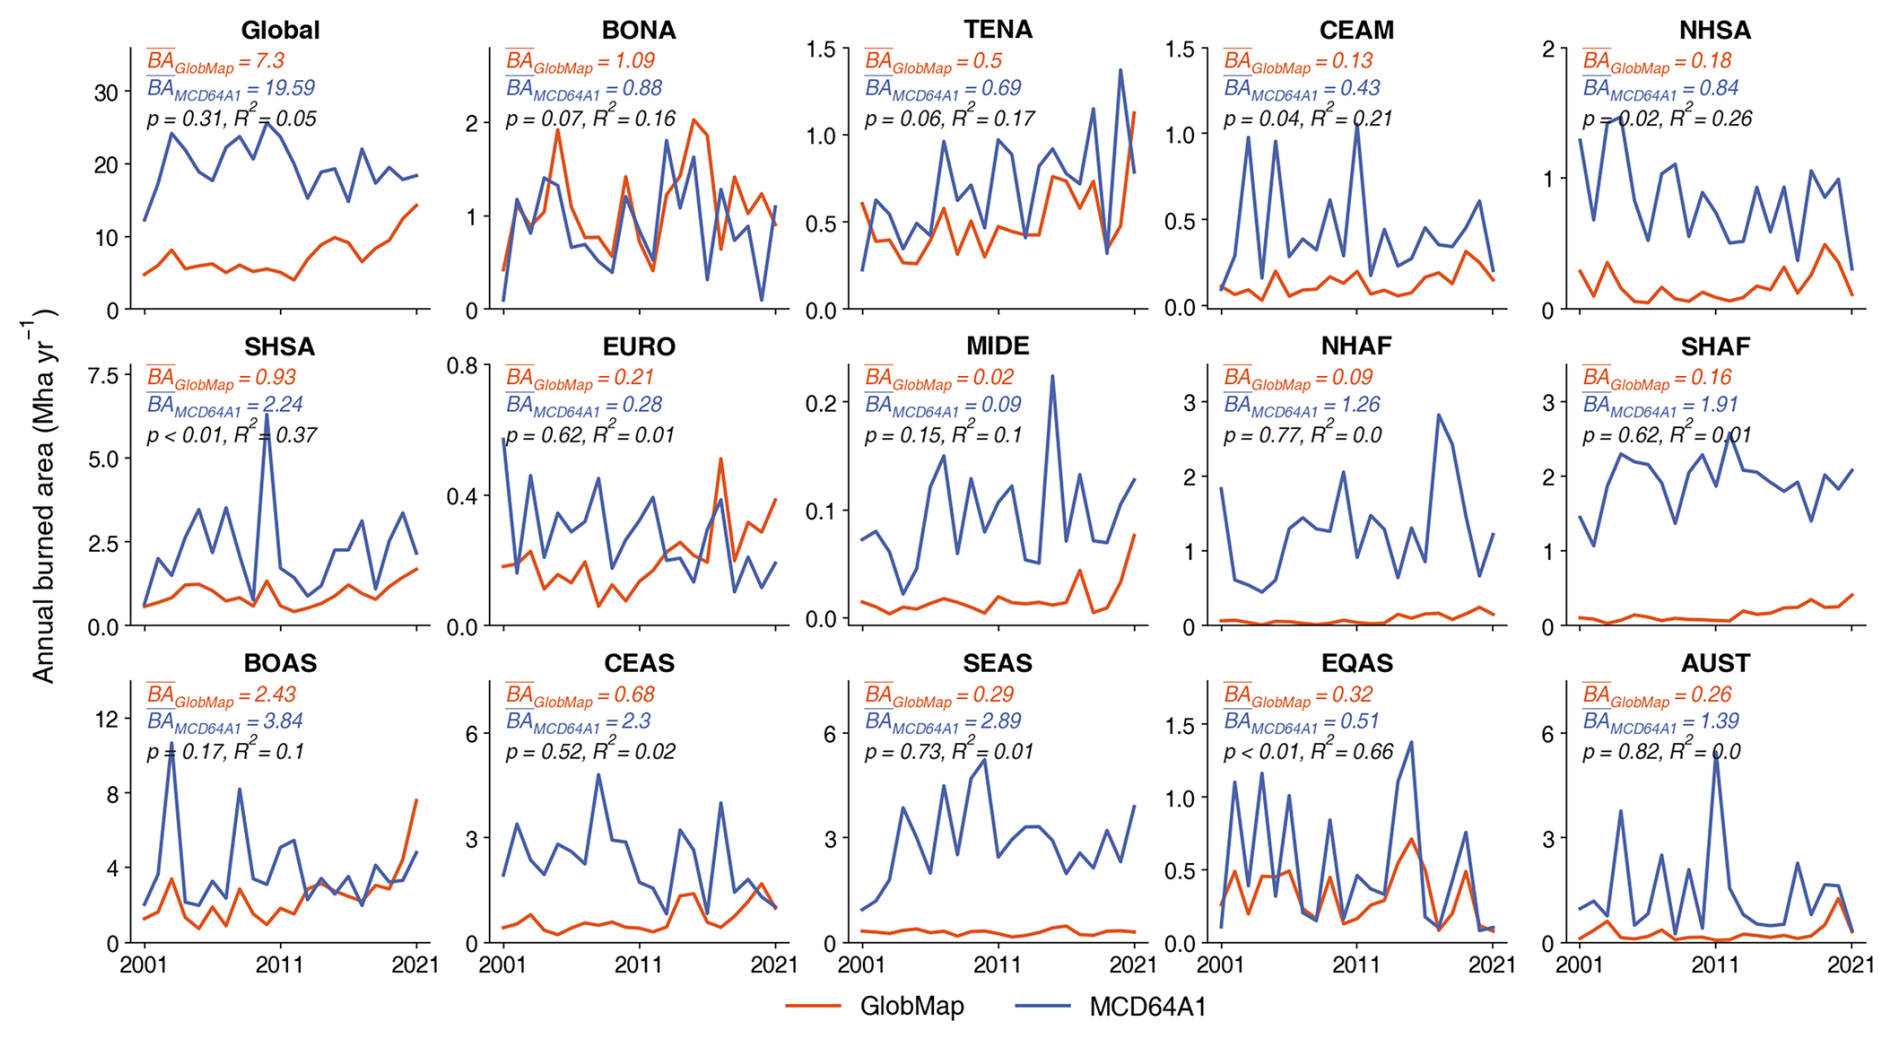
Figure 7Comparison of annual forest burned area estimates between GlobMap FFP and MCD64A1 from 2001–2021. Burned area was summarized for global forests and the fourteen GFED regions. Annual burned area estimates from GlobMap FFP and MCD64A1 are shown in orange and purple, respectively, with the corresponding multi-year mean values indicated in each subplot. Linear regression relationships between the two products are also denoted.
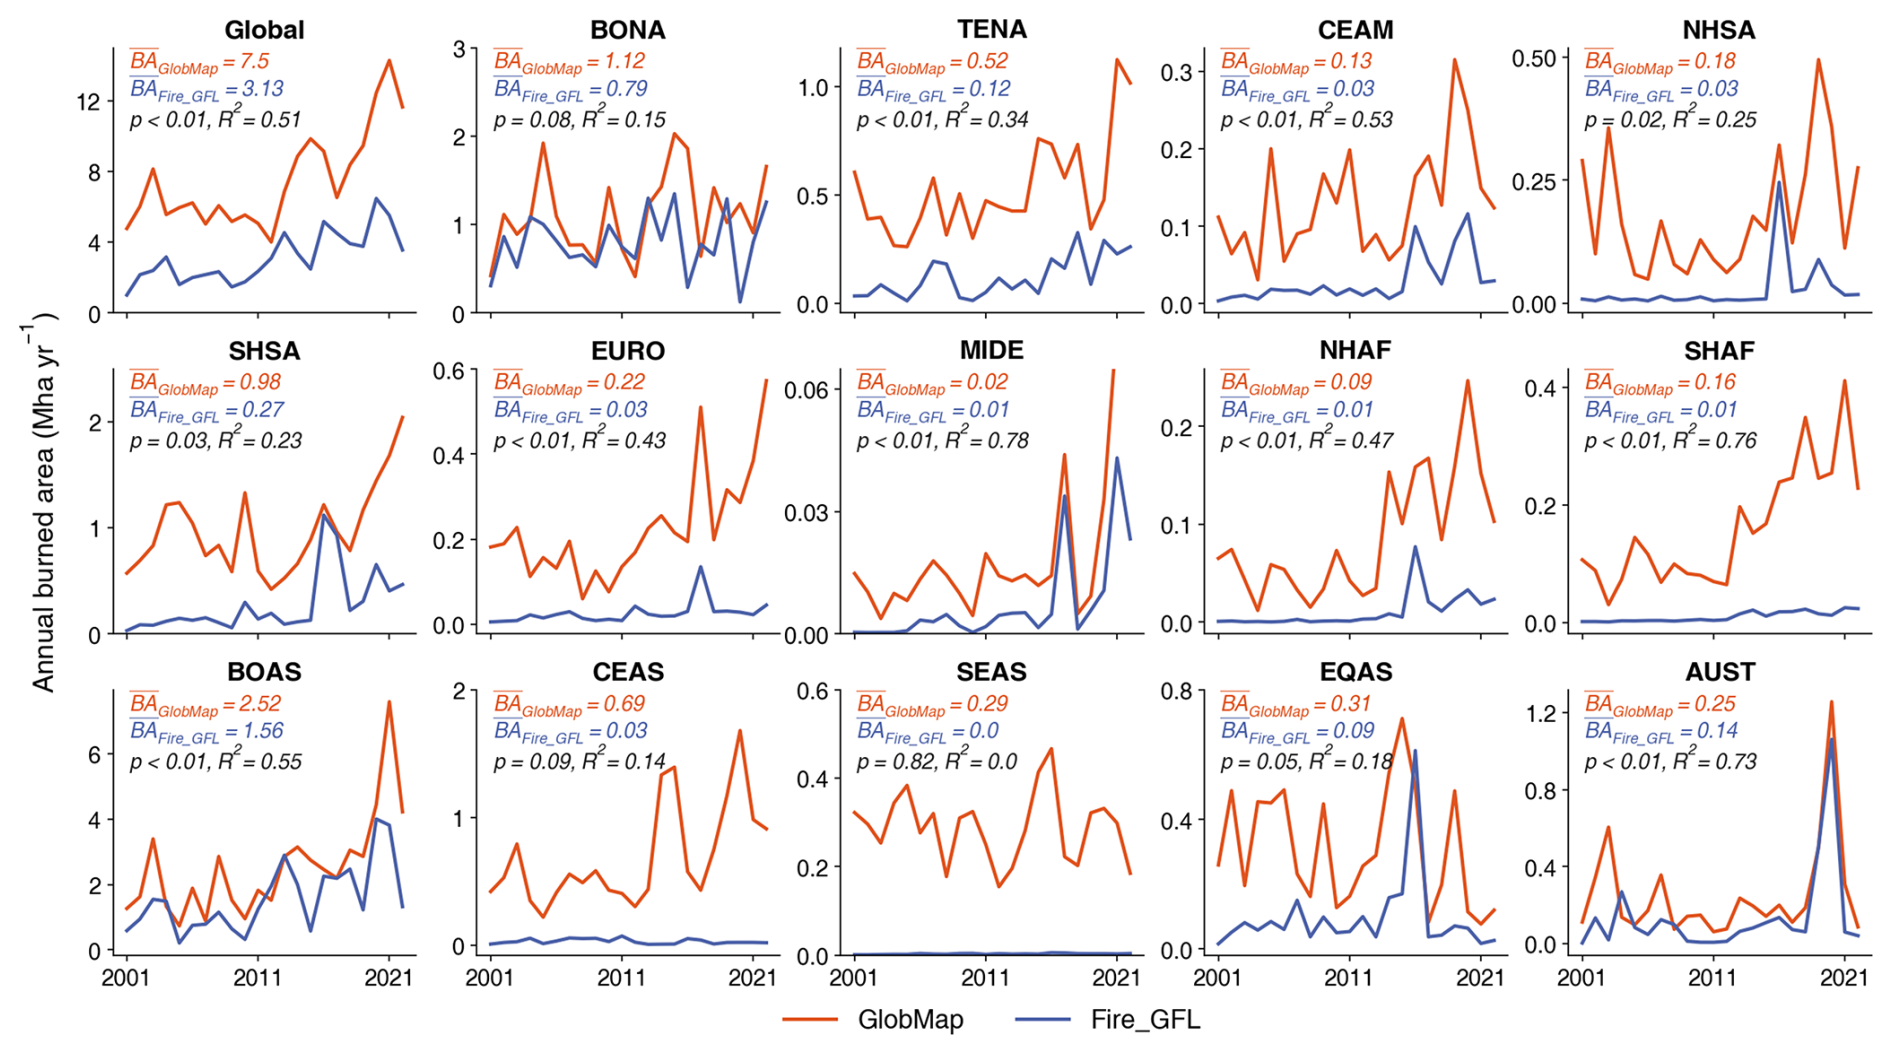
Figure 8Comparison of annual forest burned area estimates between GlobMap FFP and Fire_GFL from 2001–2022. Burned area was summarized for global forests and the fourteen GFED regions. Annual burned area estimates from GlobMap FFP and Fire_GFL are shown in orange and purple, respectively, with the corresponding multi-year mean values indicated in each subplot. Linear regression relationships between the two products are also denoted.
Between GlobMap FFP and Fire_GFL, GlobMap FFP generally identified larger burned areas than Fire_GFL across most GFED regions globally (Fig. 8). The two products showed more comparable estimates in boreal regions (BONA and BOAS) and Australia (AUST), where fire events are more frequently associated with substantial forest structural loss. The differences between the two products primarily reflect their distinct objectives in representing fire-related forest disturbances. Fire_GFL was designed to characterize forest loss caused by fire and therefore focuses mainly on stand-replacing events that result in detectable canopy loss (Tyukavina et al., 2022). Comparatively, GlobMap FFP captures a broader range of fire disturbances, including low- to moderate-severity fires that may not be represented in Fire_GFL.
4.3.2 Spatial agreement of fire patches
Spatial agreement analyses evaluated differences in fire patch extent and delineation among GlobMap FFP and existing burned area products. At the regional scale, GlobMap FFP and other Landsat-based products showed generally high spatial consistency (Fig. 9a and Table 4a). The proportion of burned area with full or partial spatial agreement exceeded 86 % in Chile (93.2 %), Brazil (95.0 %), and Europe (86.7 %), with full agreement accounting for over 65 % of burned area in Chile and Brazil, indicating broadly similar representations of fire patches. Across all regions, differences were primarily associated with Group 4 pixels, suggesting larger mapped extents within matched fire patches delineated by BAECV. Despite this overall consistency, GlobMap FFP identified a larger proportion of uniquely detected burned area (Group 1) than regional Landsat products (Group 5). For example, in Europe and Chile, approximately 50.2 % and 47.2 % of burned area were mapped only by GlobMap FFP, respectively. These results suggest that variations in fire patch delineation and small fire detection contribute substantially to discrepancies among Landsat-based products.
Table 4Relative contributions of five spatial agreement groups in regional comparisons. (a) Comparisons between GlobMap FFP and existing regional Landsat-based products. (b) Comparisons between GlobMap FFP and MCD64A1. (c) Comparisons between existing Landsat-based products and MCD64A1.
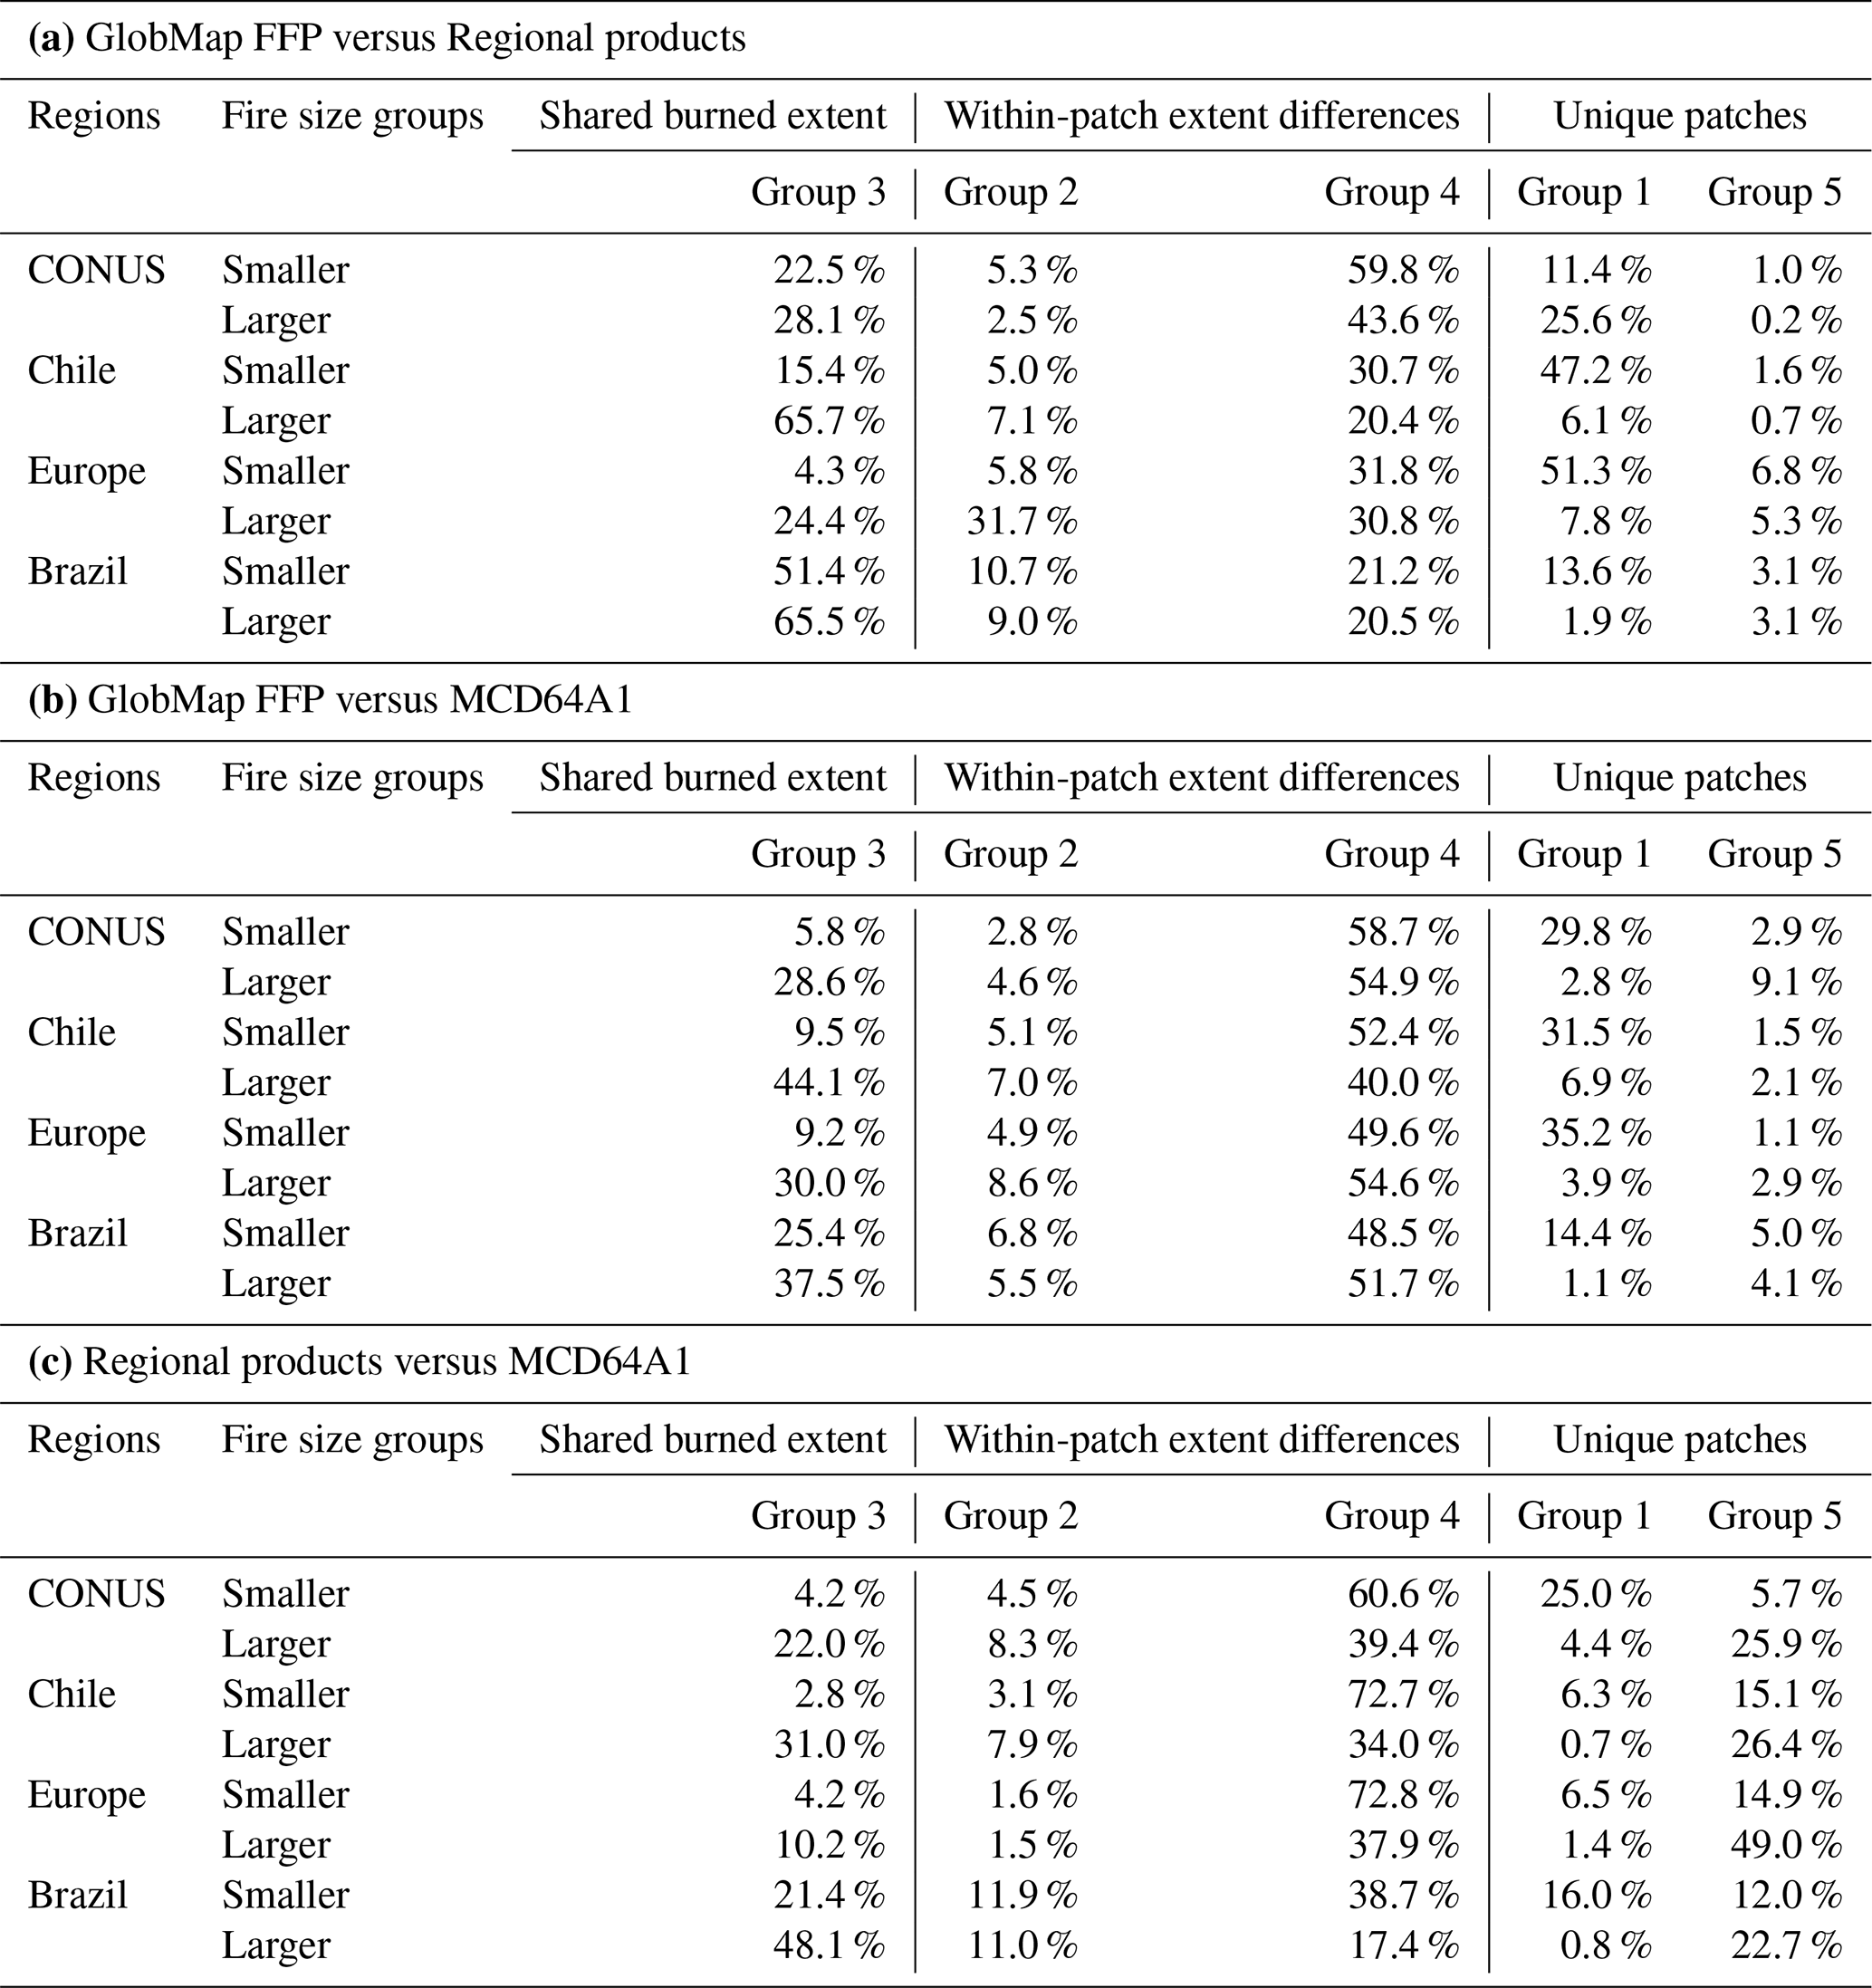
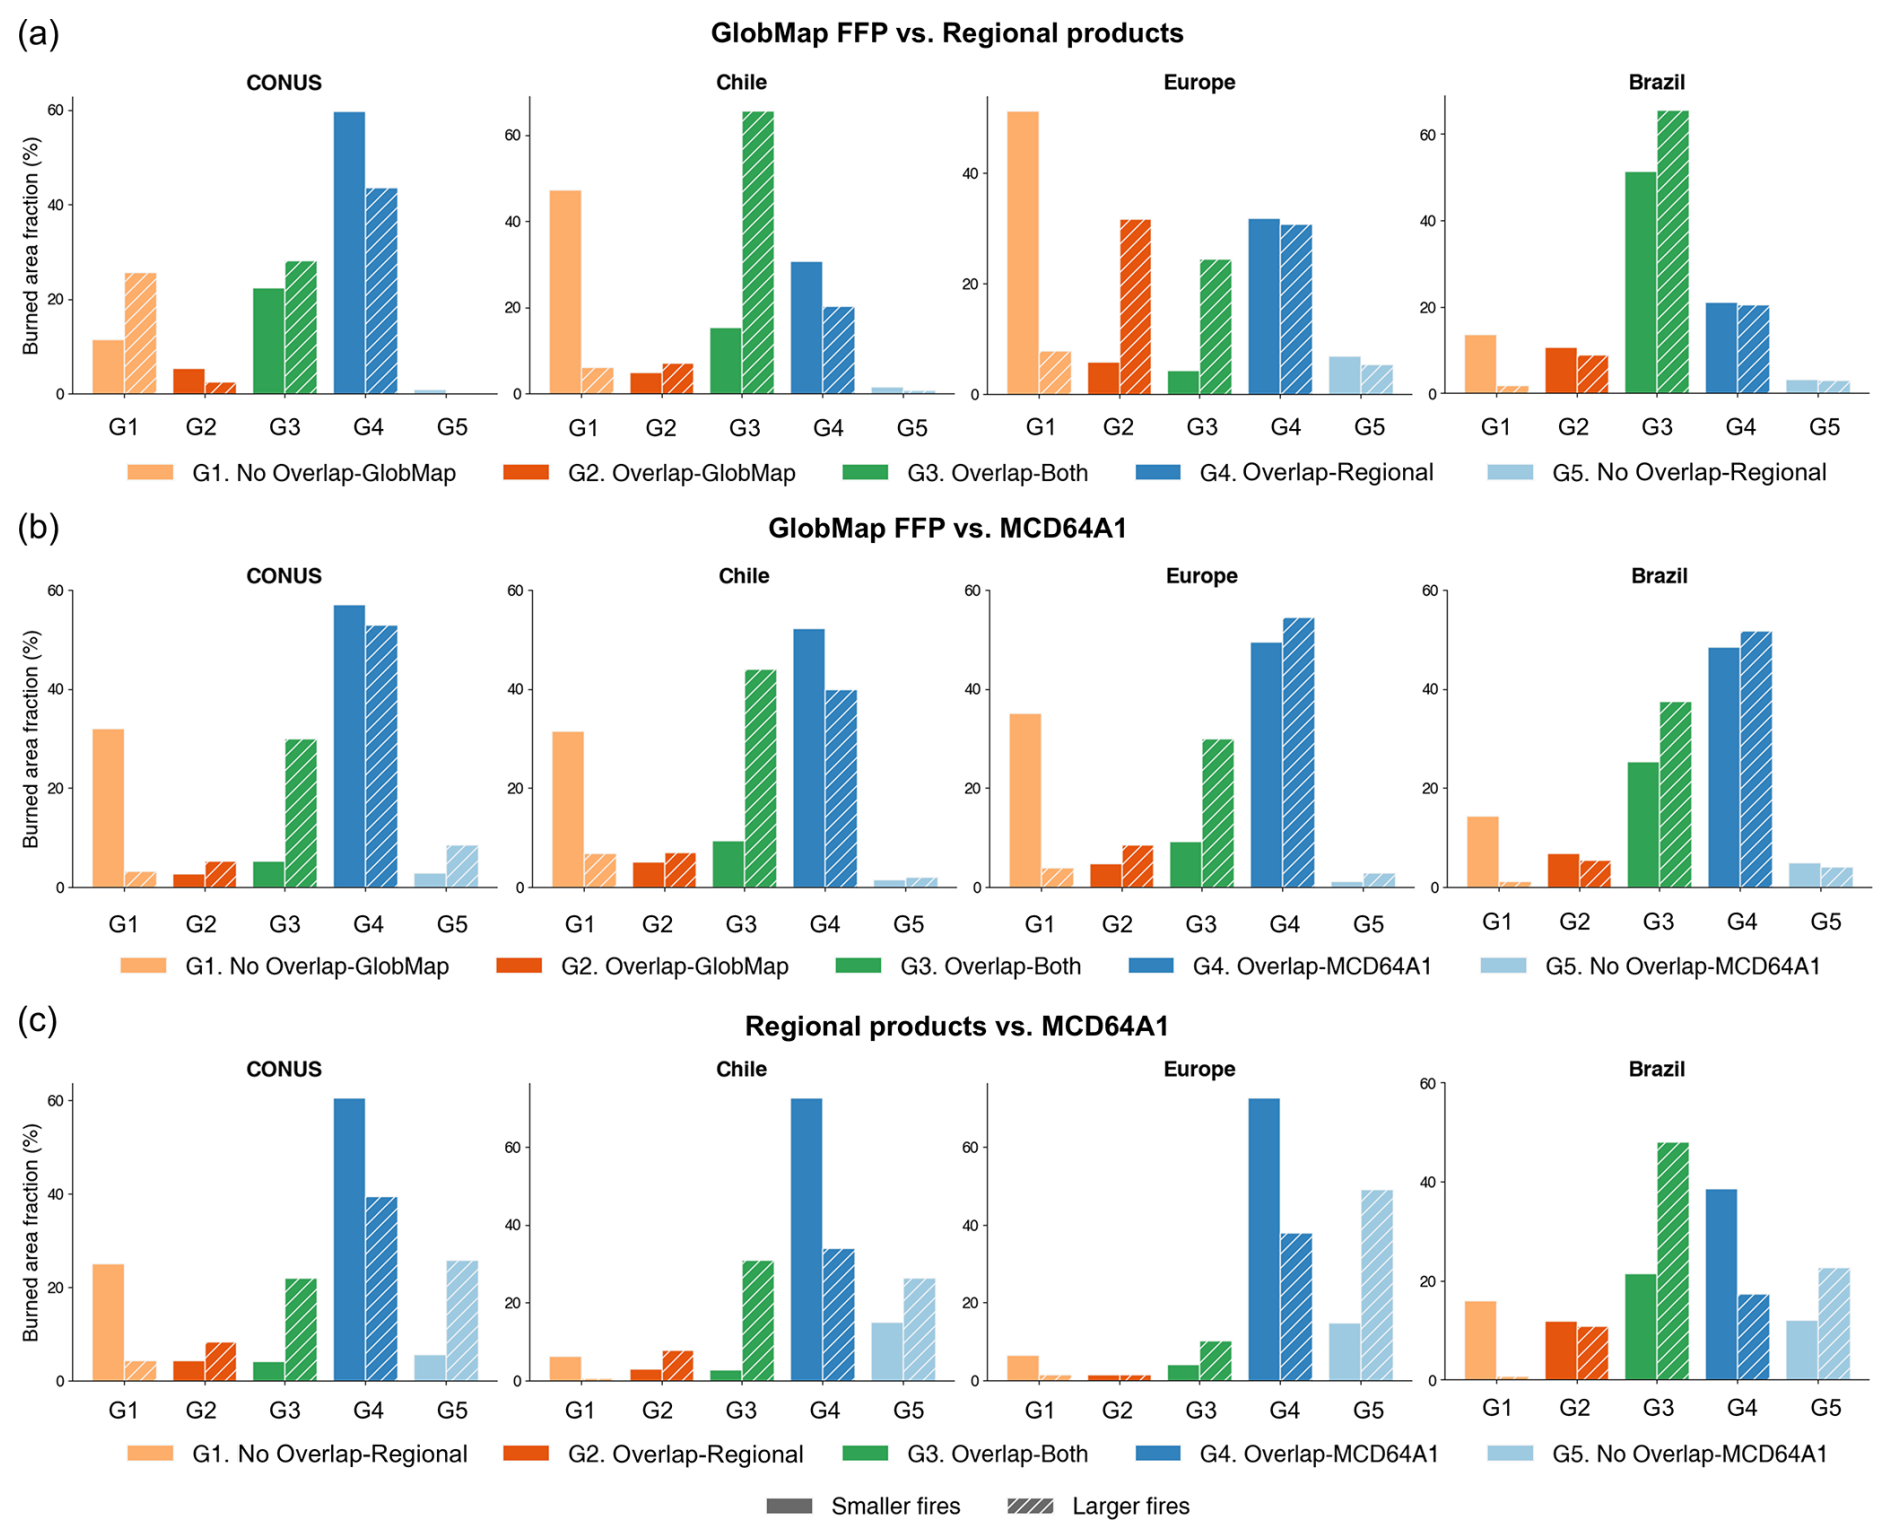
Figure 9Spatial agreement between Landsat-based products (GlobMap FFP and existing regional products) and MCD64A1 across four regions. (a) Comparison between GlobMap FFP and regional Landsat-based products since the 1980s: BAECV in CONUS, LFSD in Chile, EFDM in Europe, and MapBiomas in Brazil. (b) Comparison between GlobMap FFP and MCD64A1 since 2001 in the same four regions. (c) Comparison between regional Landsat-based products and MCD64A1 sicne 2001. Light orange, dark orange, green, dark blue, and light blue colors represent Groups 1–5 (Fig. 4). Bars with solid fills represent smaller fire patches, while those with diagonal patterns represent larger ones.
Comparisons between Landsat-based products with MCD64A1 in the four regions revealed a different spatial agreement pattern. Disagreement was dominated by Group 4 pixels, representing fire patches detected by both products but with larger mapped extents in MCD64A1 (Fig. 9b). This category accounted for more than 43 % of burned area for both larger and smaller fire patches, indicates that differences between Landsat- and MODIS-based products were primarily associated with burned extent delineation rather than complete disagreement in fire occurrence. For smaller fires, GlobMap FFP identified a larger proportion of uniquely detected burned area compared with MCD64A1 (Group 1; Fig. 9b), highlighting the advantage of Landsat's finer spatial resolution in representing small and fragmented fire patches that may be difficult to capture with MODIS observations. When compared to GlobMap FFP, other Landsat-based regional products tended to omit a greater portion of burned area uniquely detected by MCD64A1 (Group 5) (Fig. 9c).
At the global scale, comparisons between GlobMap FFP and MCD64A1 also exhibited differences in spatial agreement patterns among fire size classes and regions (Fig. 10). For larger fires, disagreement was dominated by Group 4 and Group 5 pixels, indicating that MODIS frequently mapped larger burned extents within matched fire patches and detected additional fires particularly in tropical forests (e.g., NHSA, NHAF, and SHAF). These differences likely reflect differences in observation frequency and spatial resolution between the two products, which influence the detection of transient fire signals and the delineation of fire patch extent. For smaller fires, GlobMap FFP consistently identified a greater proportion of uniquely mapped burned area, particularly in temperate and boreal regions (Group 1), especially in temporal and boreal regions.
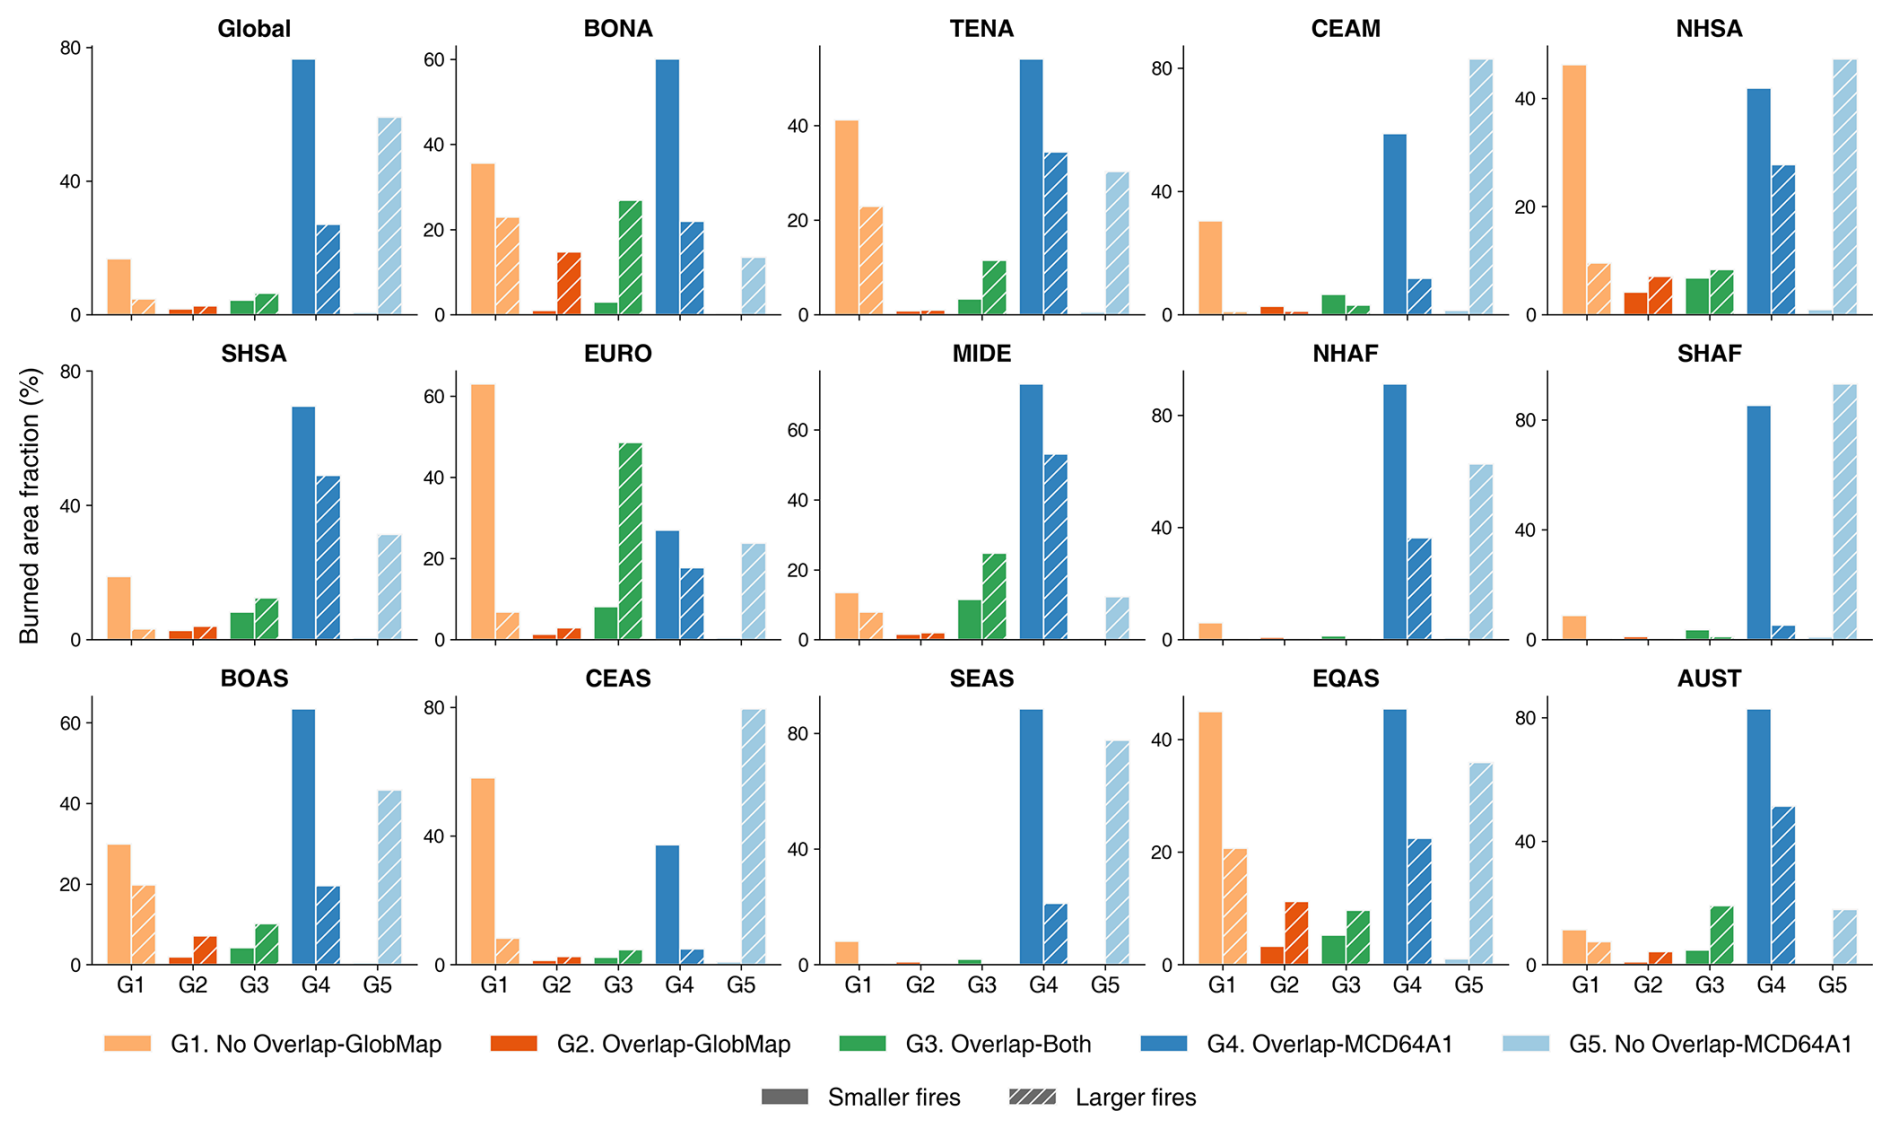
Figure 10Spatial agreement between GlobMap FFP and MCD64A1 from 2001–2021 across global forests and GFED regions. Light orange, dark orange, green, dark blue, and light blue colors represent spatial agreement Groups 1–5, respectively (Fig. 4). Bars with solid fills represent smaller fire patches, while those with diagonal patterns represent larger ones.
Comparison with Fire_GFL revealed that similar annual burned area estimates can correspond to different spatial representations of fire patches (Fig. 11). Substantial spatial differences remained in regions where GlobMap FFP and Fire_GFL showed comparable annual burned area. Fire_GFL showed additional burned extent within matched fire patches (Group 4), whereas GlobMap FFP identified additional fire patches (Group 1) and larger burned extents within shared patches (Group 2). In regions where GlobMap FFP estimated higher burned area than Fire_GFL, the differences were primarily associated with uniquely detected fire patches (Group 1) and additional burned extents within shared patches (Group 2). These results indicate that the two Landsat-based products differ not only in mapped burned area magnitude but also in the spatial representation of fire disturbances.
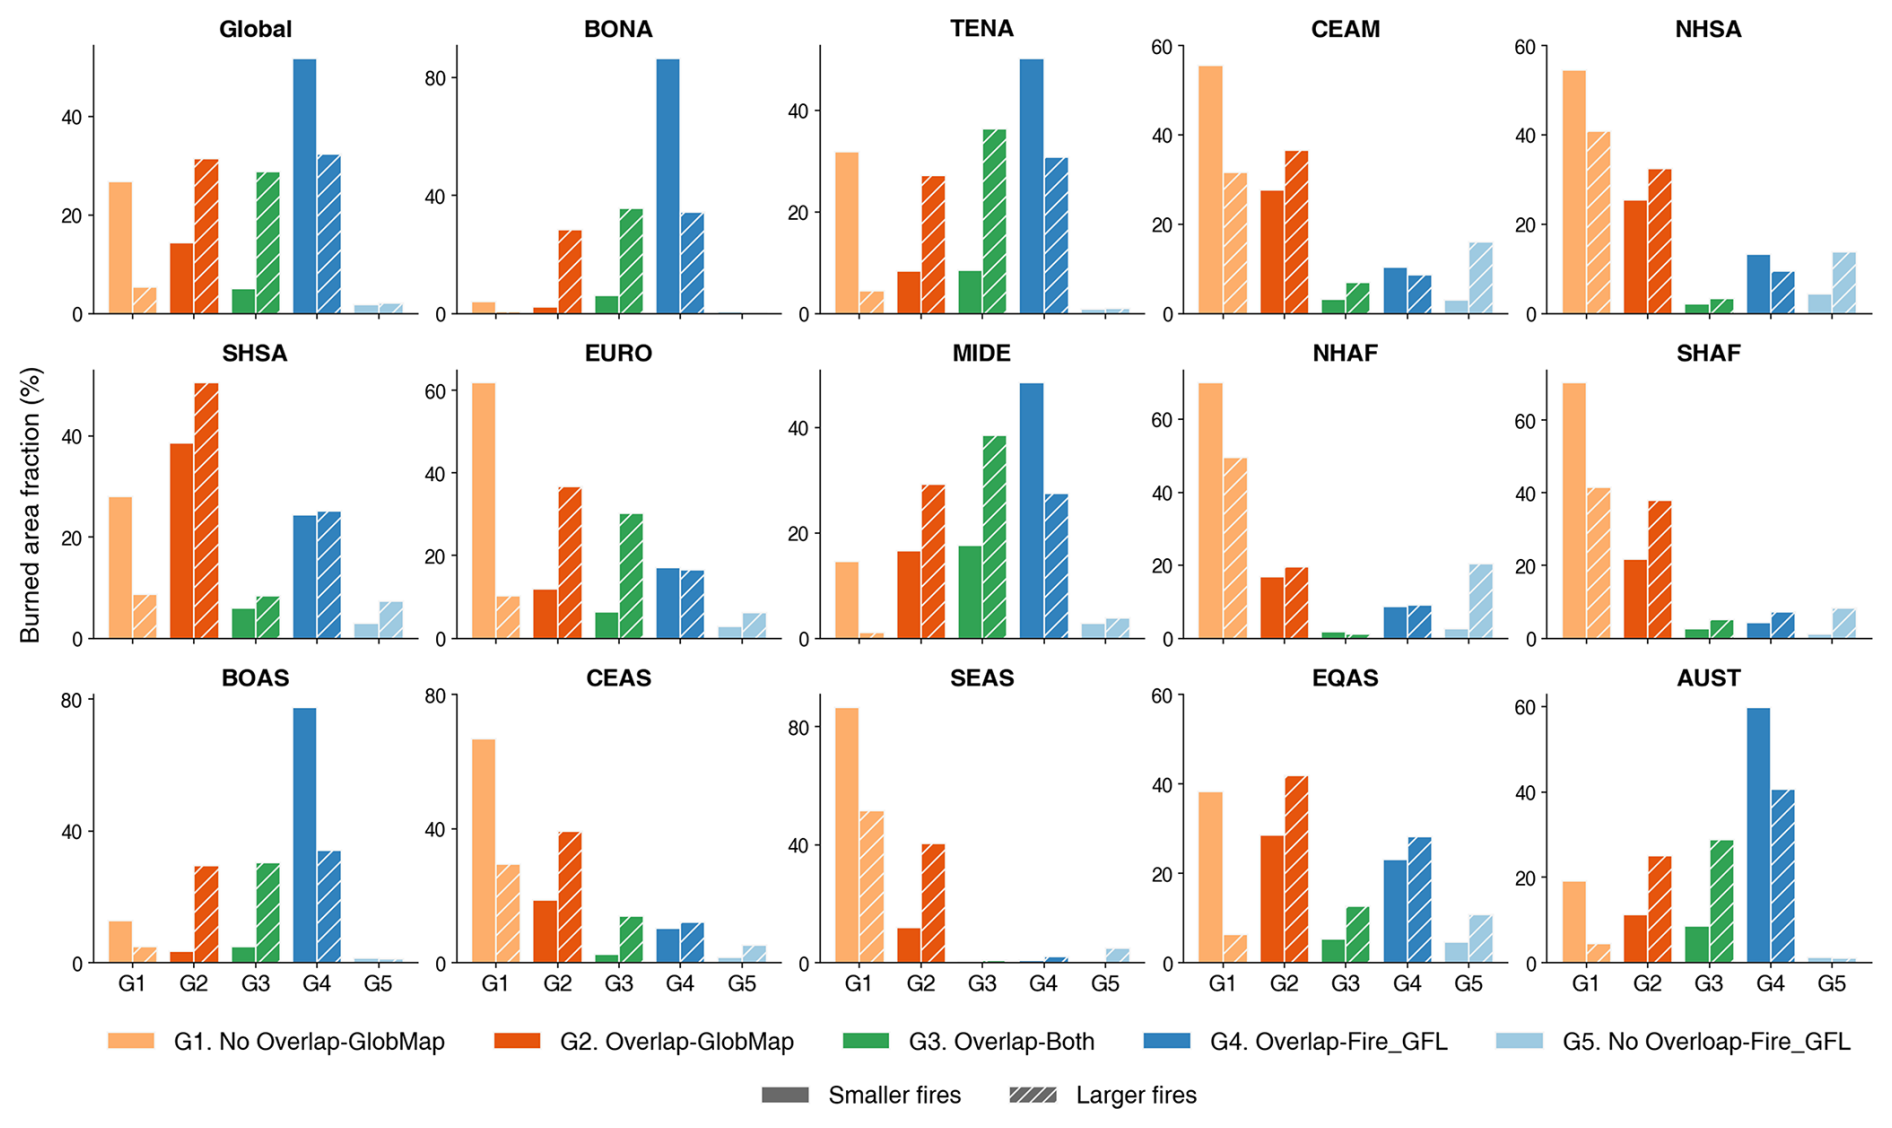
Figure 11Spatial agreement between GlobMap FFP and Fire_GFL from 2001–2022 across global forests and GFED regions. Light orange, dark orange, green, dark blue, and light blue colors represent spatial agreement Groups 1–5, respectively (Fig. 4). Bars with solid fills represent smaller fire patches, while those with diagonal patterns represent larger ones.
4.3.3 Temporal consistency of assigned burned year
Temporal consistency of the assigned burned year varied among regions and was generally higher for large fires and in boreal forests. Regionally, comparisons with MCD64A1 indicated that a substantial proportion of burned pixels identified by GlobMap FFP were assigned to years within 3 years of those reported by the MODIS product (Fig. 12a–d). The proportion of temporally consistent detections was generally higher than that of the regional Landsat-based products despite regional differences (Fig. 12e–h). For example, in Chile, GlobMap FFP assigned 99.2 % of larger fire samples and 60.0 % of smaller fire samples within 3 years of MCD64A1, compared with96.4 % and 59.5 %, respectively, for LFSD (Fig. 12b and f). Comparatively, temporal consistency was lower in Europe, where EFDM showed closer correspondence with MCD64A1 than GlobMap FFP (Fig. 12c and g).
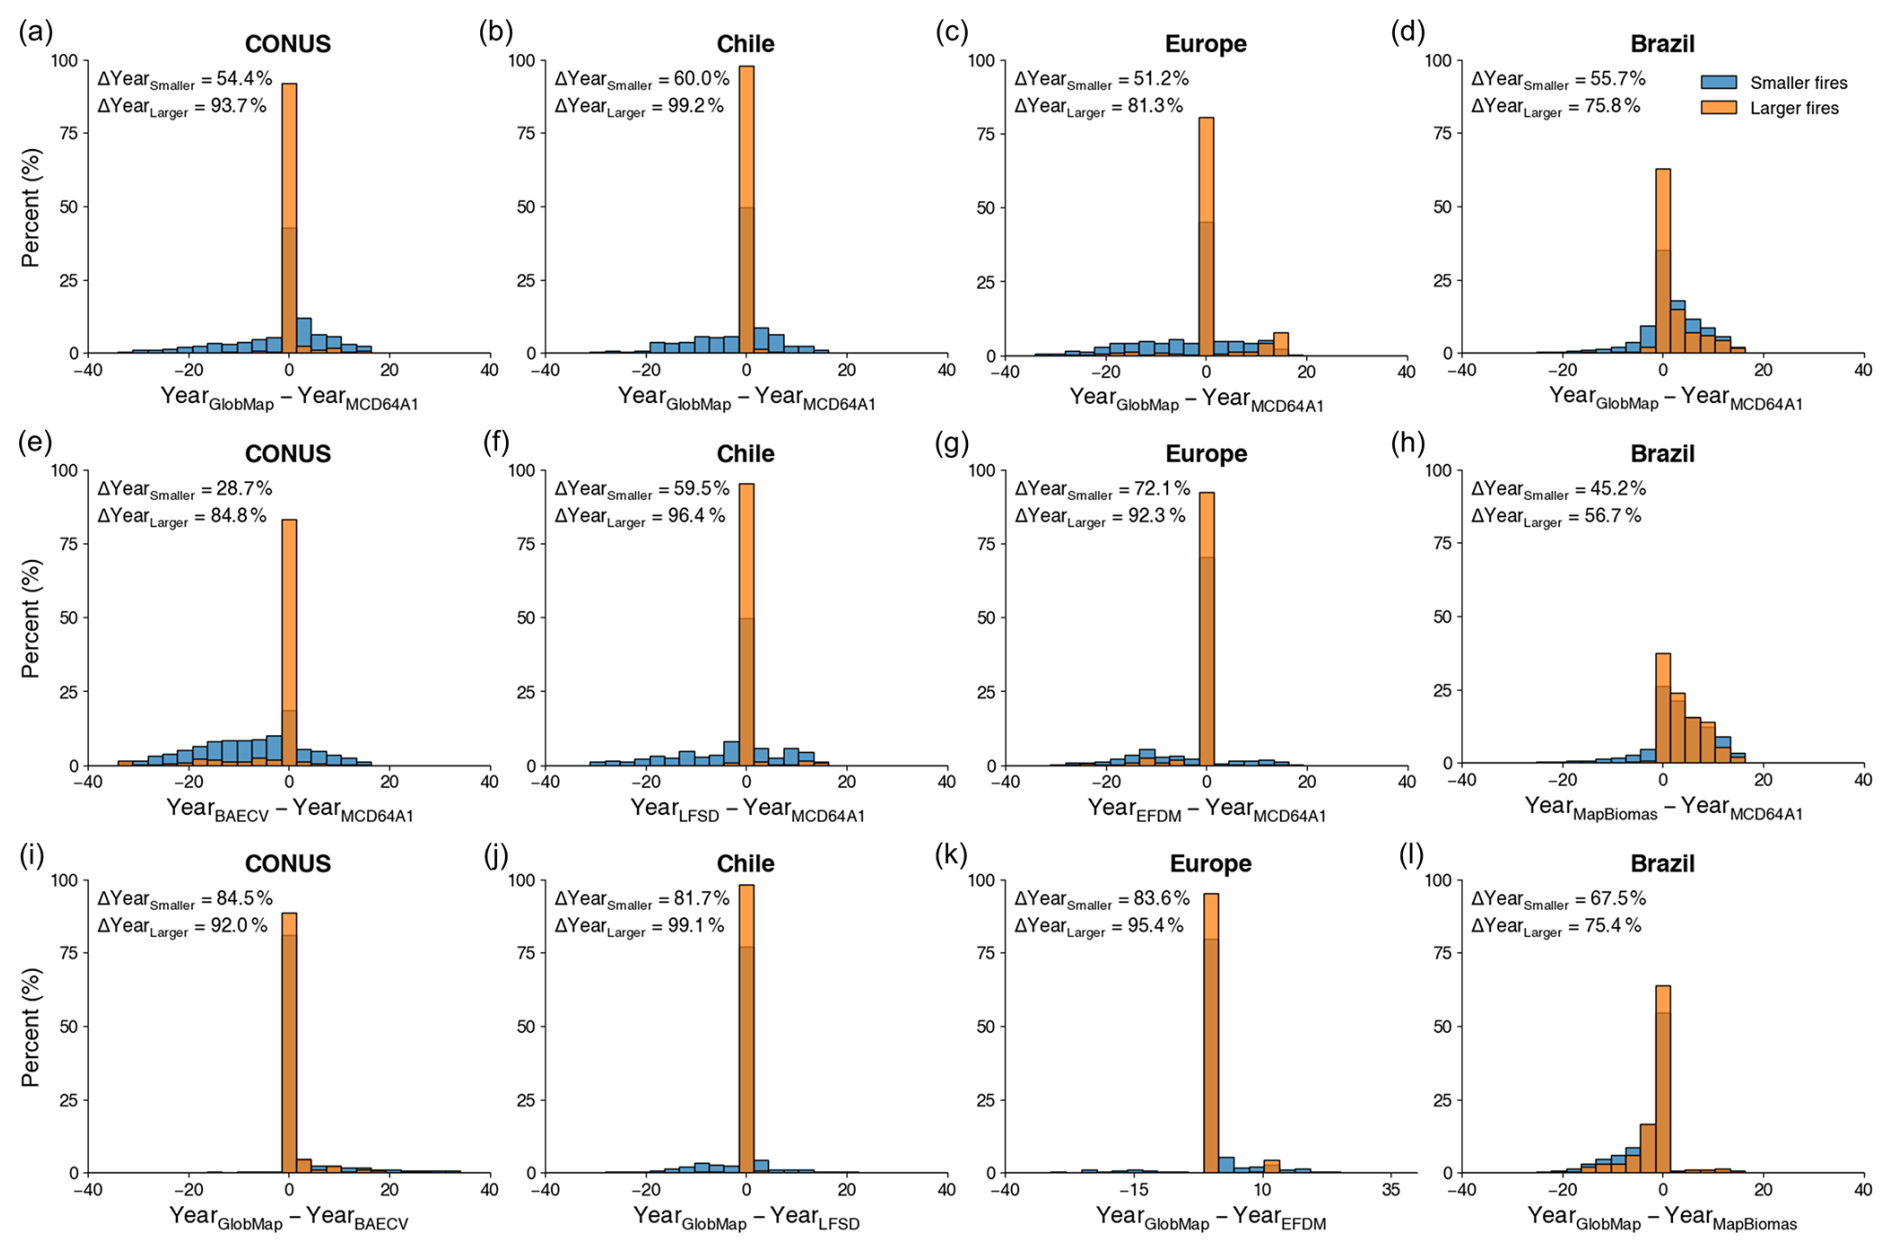
Figure 12Histograms of burned year differences between Landsat-based products and MCD64A1. (a–d) Comparisons between GlobMap FFP and MCD64A1 after 2001 in CONUS (a), Chile (b), Europe (c), and Brazil (d). (e–h) Comparisons between existing regional products and MCD64A1 in the same regions after 2001: BAECV in CONUS (e), LFSD in Chile (f), EFDM in Europe (g), and MapBiomas in Brazil (h). (i–l) Long-term comparisons between GlobMap FFP and the regional products since the 1980s: CONUS (i), Chile (j), Europe (k), and Brazil (l). For each subplot, the percentages of samples with burned year differences within ±3 years are displayed in the upper left corner, separately for smaller (<200 ha, orange bars) and larger (200 ha, blue bars) fire size groups.
Comparisons with the regional Landsat-based products further demonstrate broad consistency of burned year assignment over the Landsat era. The proportion of fire samples assigned within ±3 years exceeded 92 % for larger fires and 81 % for small fires in most regions, except for Brazil (Fig. 12i–l). In Chile, temporal consistency reached 99.5 % for larger fires and 81.4 % for smaller fires when compared with LFSD (Fig. 12j). Corresponding values in Europe were 95.4 % and 83.6 % relative to EFDM (Fig. 12k). Lower consistency was observed in Brazil, where both GlobMap FFP and MapBiomas showed reduced agreement with MCD64A1 (Fig. 12d and h), reflecting the greater challenges of assigning burned year in cloud-prone tropical forests with limited clear-sky Landsat observations.
Globally, temporal consistency between GlobMap FFP and MCD64A1 showed substantial regional variability. Boreal and temperate forests generally exhibited higher consistency than tropical forests. More than 85 % of sampled burned pixels were assigned within 3 years in Boreal North America (BONA; 98.2 %), Australia and New Zealand (AUST; 87.6 %), Europe (EURO; 85.9 %), Temperate North America (TENA; 85.8 %), and Boreal Asia (BOAS; 85.0 %; Fig. 13a). In contrast, lower consistency was observed across several tropical regions, where persistent cloud cover and rapid vegetation recovery may limit the ability of Landsat observations to capture the accurate timing of individual fires. Across all GFED regions, larger fires (>200 ha) exhibited higher temporal consistency than smaller fires (Fig. 13b). For example, more than 90 % of larger fire samples were assigned within 3 years in BONA (99.7 %), AUST (97.2 %), TENA (95.7 %), EURO (94.1 %), and BOAS (91.2 %), whereas agreement for smaller fires was generally lower. This pattern likely reflects the greater persistence and spatial extent of larger burned scars, which increase their detectability within composited Landsat observations.
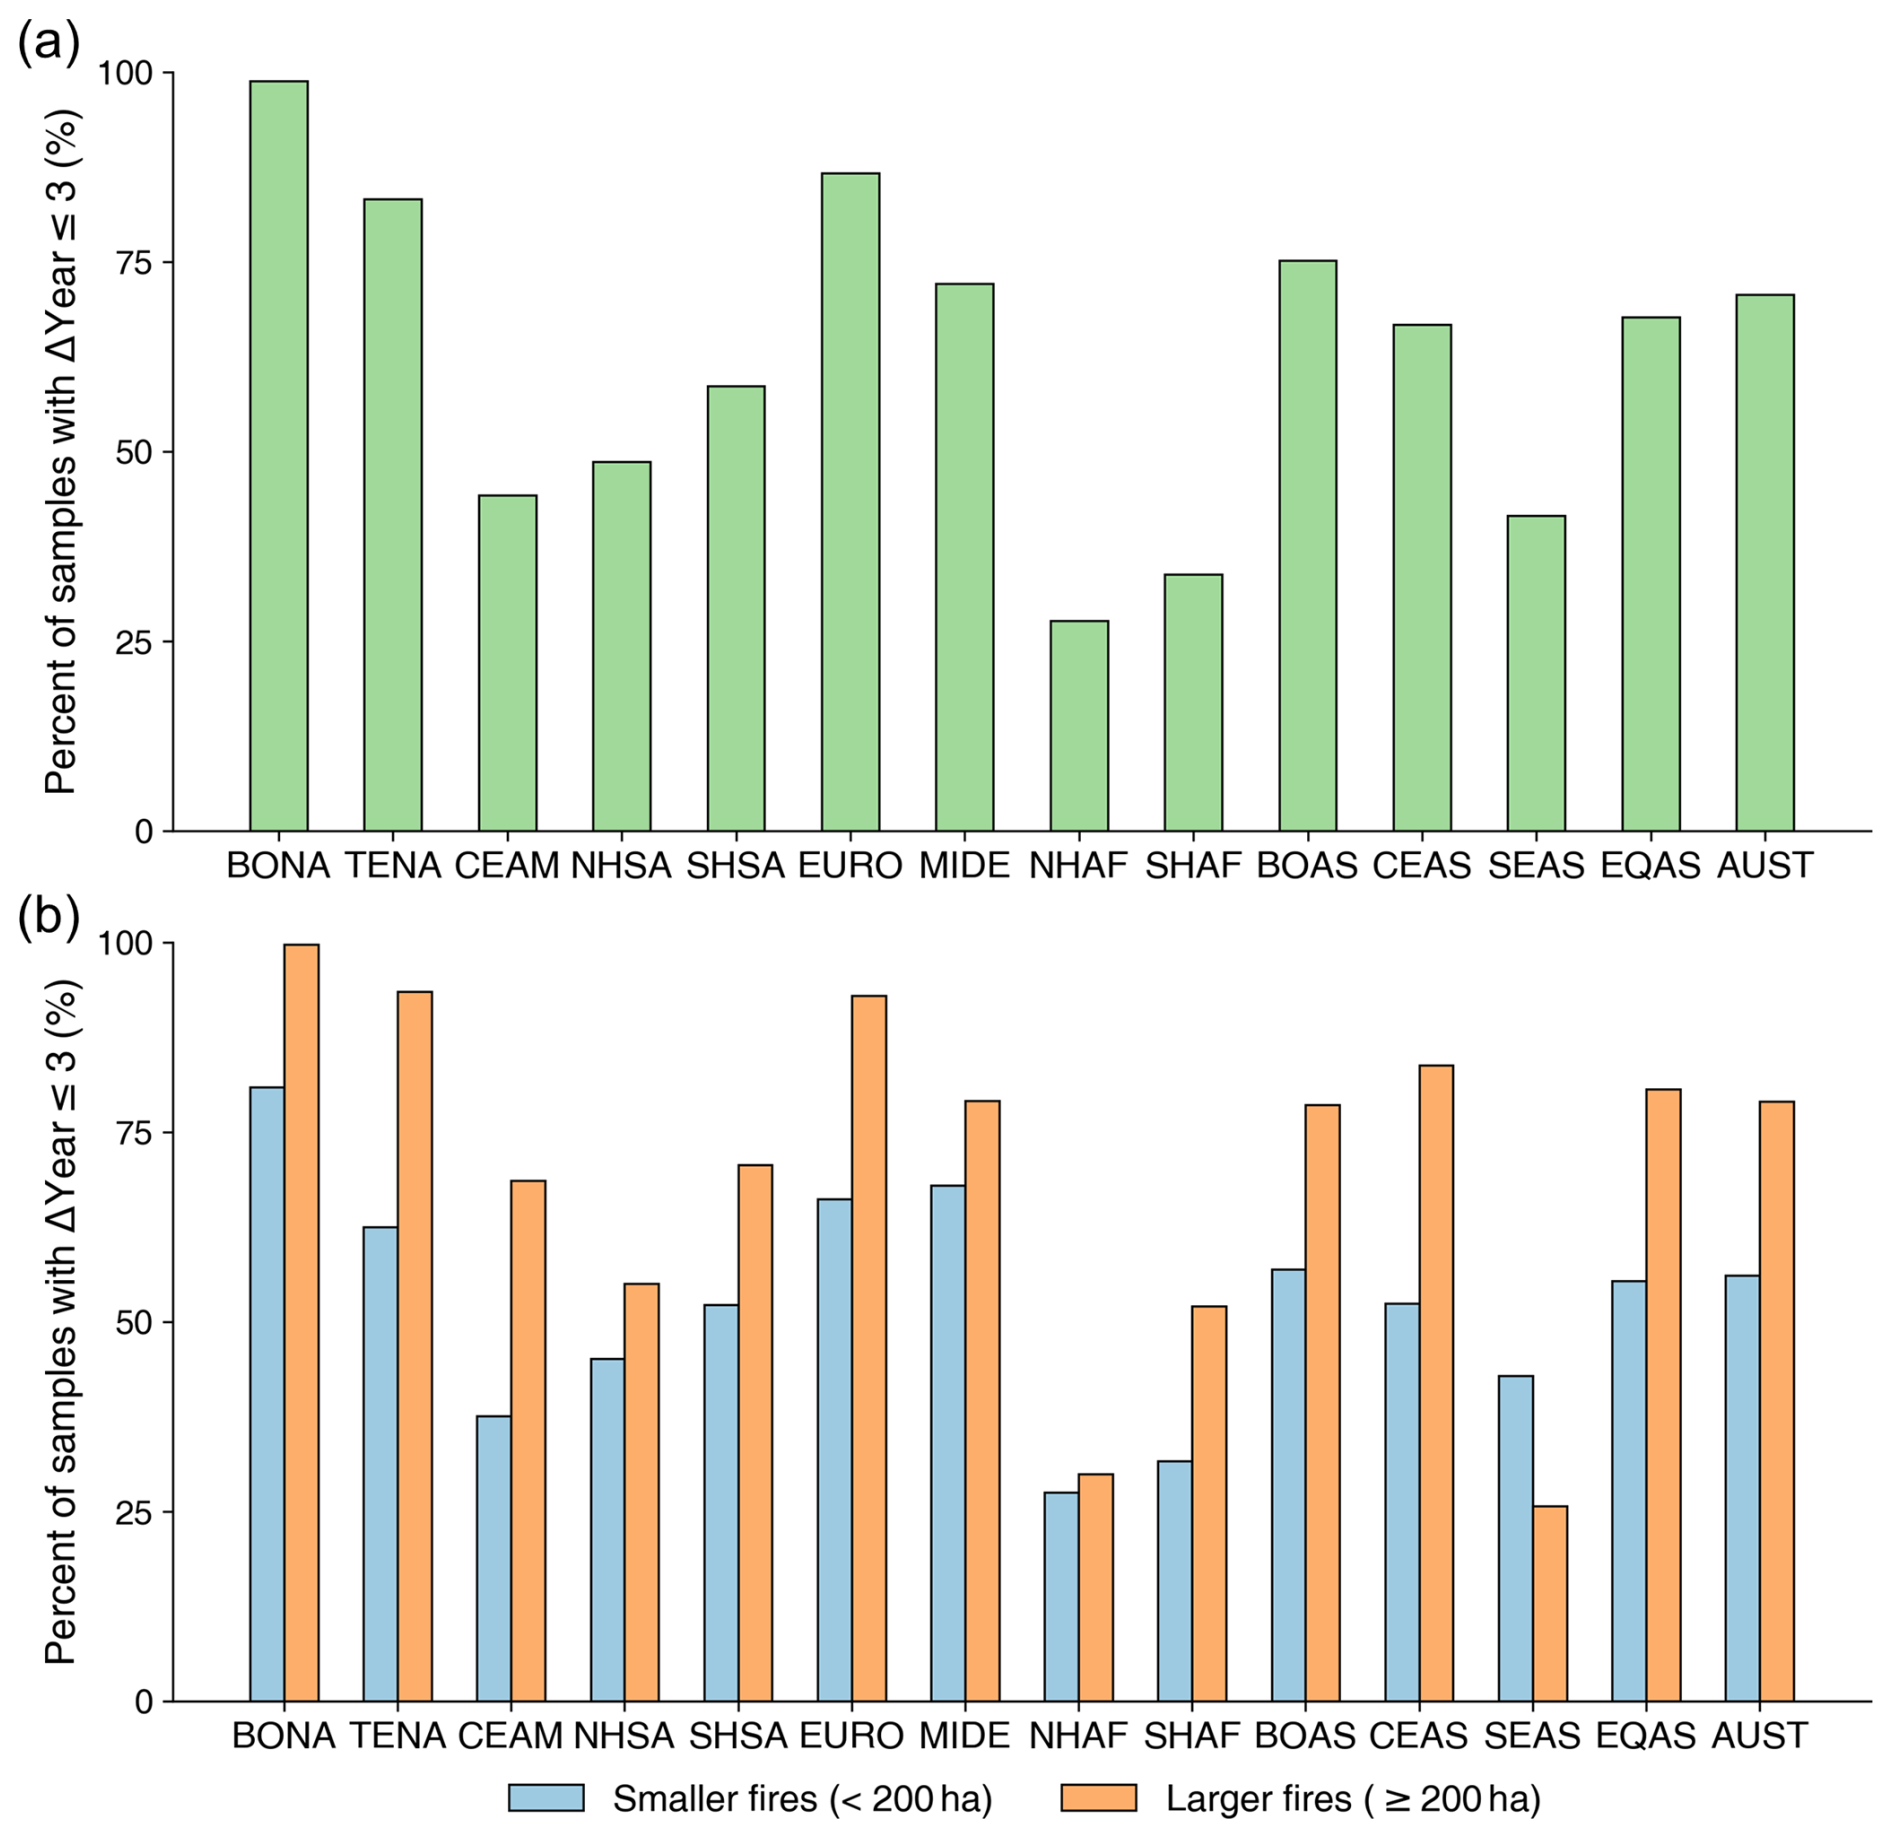
Figure 13Fractions of fire patches with burned year differences within ±3 years between the GlobMap FFP and MCD64A1, summarized by GFED regions. (a) Overall agreement across all fire patches. (b) Fractions summarized by smaller (<200 ha, orange bars) and larger fires (≥200 ha, blue bars) separately.
Because burned year in GlobMap FFP was assigned from multi-temporal composited imagery rather than reconstructed from complete fire chronologies, these comparisons should be interpreted as an assessment of temporal consistency instead of exact fire patch timing. The results nevertheless suggest that the assigned burned year provides a useful approximation of fire occurrence timing for long-term analyses of fire patch distribution and dynamics, particularly in boreal and temperate forest regions.
This study presents a new 30 m global dataset of forest fire patches spanning 1984–2022 based on the Landsat archive, offering a long-term characterization of fire patch patterns across global forests. Unlike traditional burned area products that primarily quantify burned extent, GlobMap FFP focuses on the characterization of individual fire patches and their spatial organization cross global forests. By combining the long temporal record and 30 m spatial resolution of Landsat observations, the dataset provides a new opportunity to investigate fire patch structure and its long-term patterns across regional to global scales. Because the availability of cloud- and snow-free Landsat observations varies substantially across regions and time periods, GlobMap FFP prioritizes consistent reconstruction of fire patches rather than detailed within-season fire chronology to achieve global consistency. The adopted multi-year compositing strategy therefore represents a trade-off between global consistency, temporal precision, burned scar completeness, and computational efficiency. Although this design inevitably sacrifices some temporal precision, it enables a globally consistent reconstruction of long-term fire patch patterns from the heterogeneous Landsat archive.
A key advantage of GlobMap FFP lies in its explicit representation of fire patch geometry and spatial organization (Fig. 14). Many ecological consequences of fire are governed not only by the amount of area burned but also by the spatial characteristics of individual fire patches, including their size, shape, connectivity, and internal heterogeneity. Compared with coarse-resolution burned area products, Landsat-based fire products or management inventories can provide improved representations of fire boundaries and severity patterns, features that are often obscured in MODIS-scale products (Miranda et al., 2022a; Hawbaker et al., 2020a). For example, the Monitoring Trends in Burn Severity (MTBS) dataset provides Landsat-derived fire perimeters and severity classifications across the United States, from which fire patches can be extracted by excluding unburned and low-severity areas. Such information is increasingly recognized as critical for understanding post-fire regeneration, biodiversity persistence, habitat fragmentation, and ecosystem resilience under changing fire conditions (Meddens et al., 2016). Yet, existing fire inventories are generally limited to specific regions and periods. GlobMap FFP complements such products by providing a globally consistent reconstruction of forest fire patches over nearly four decades.
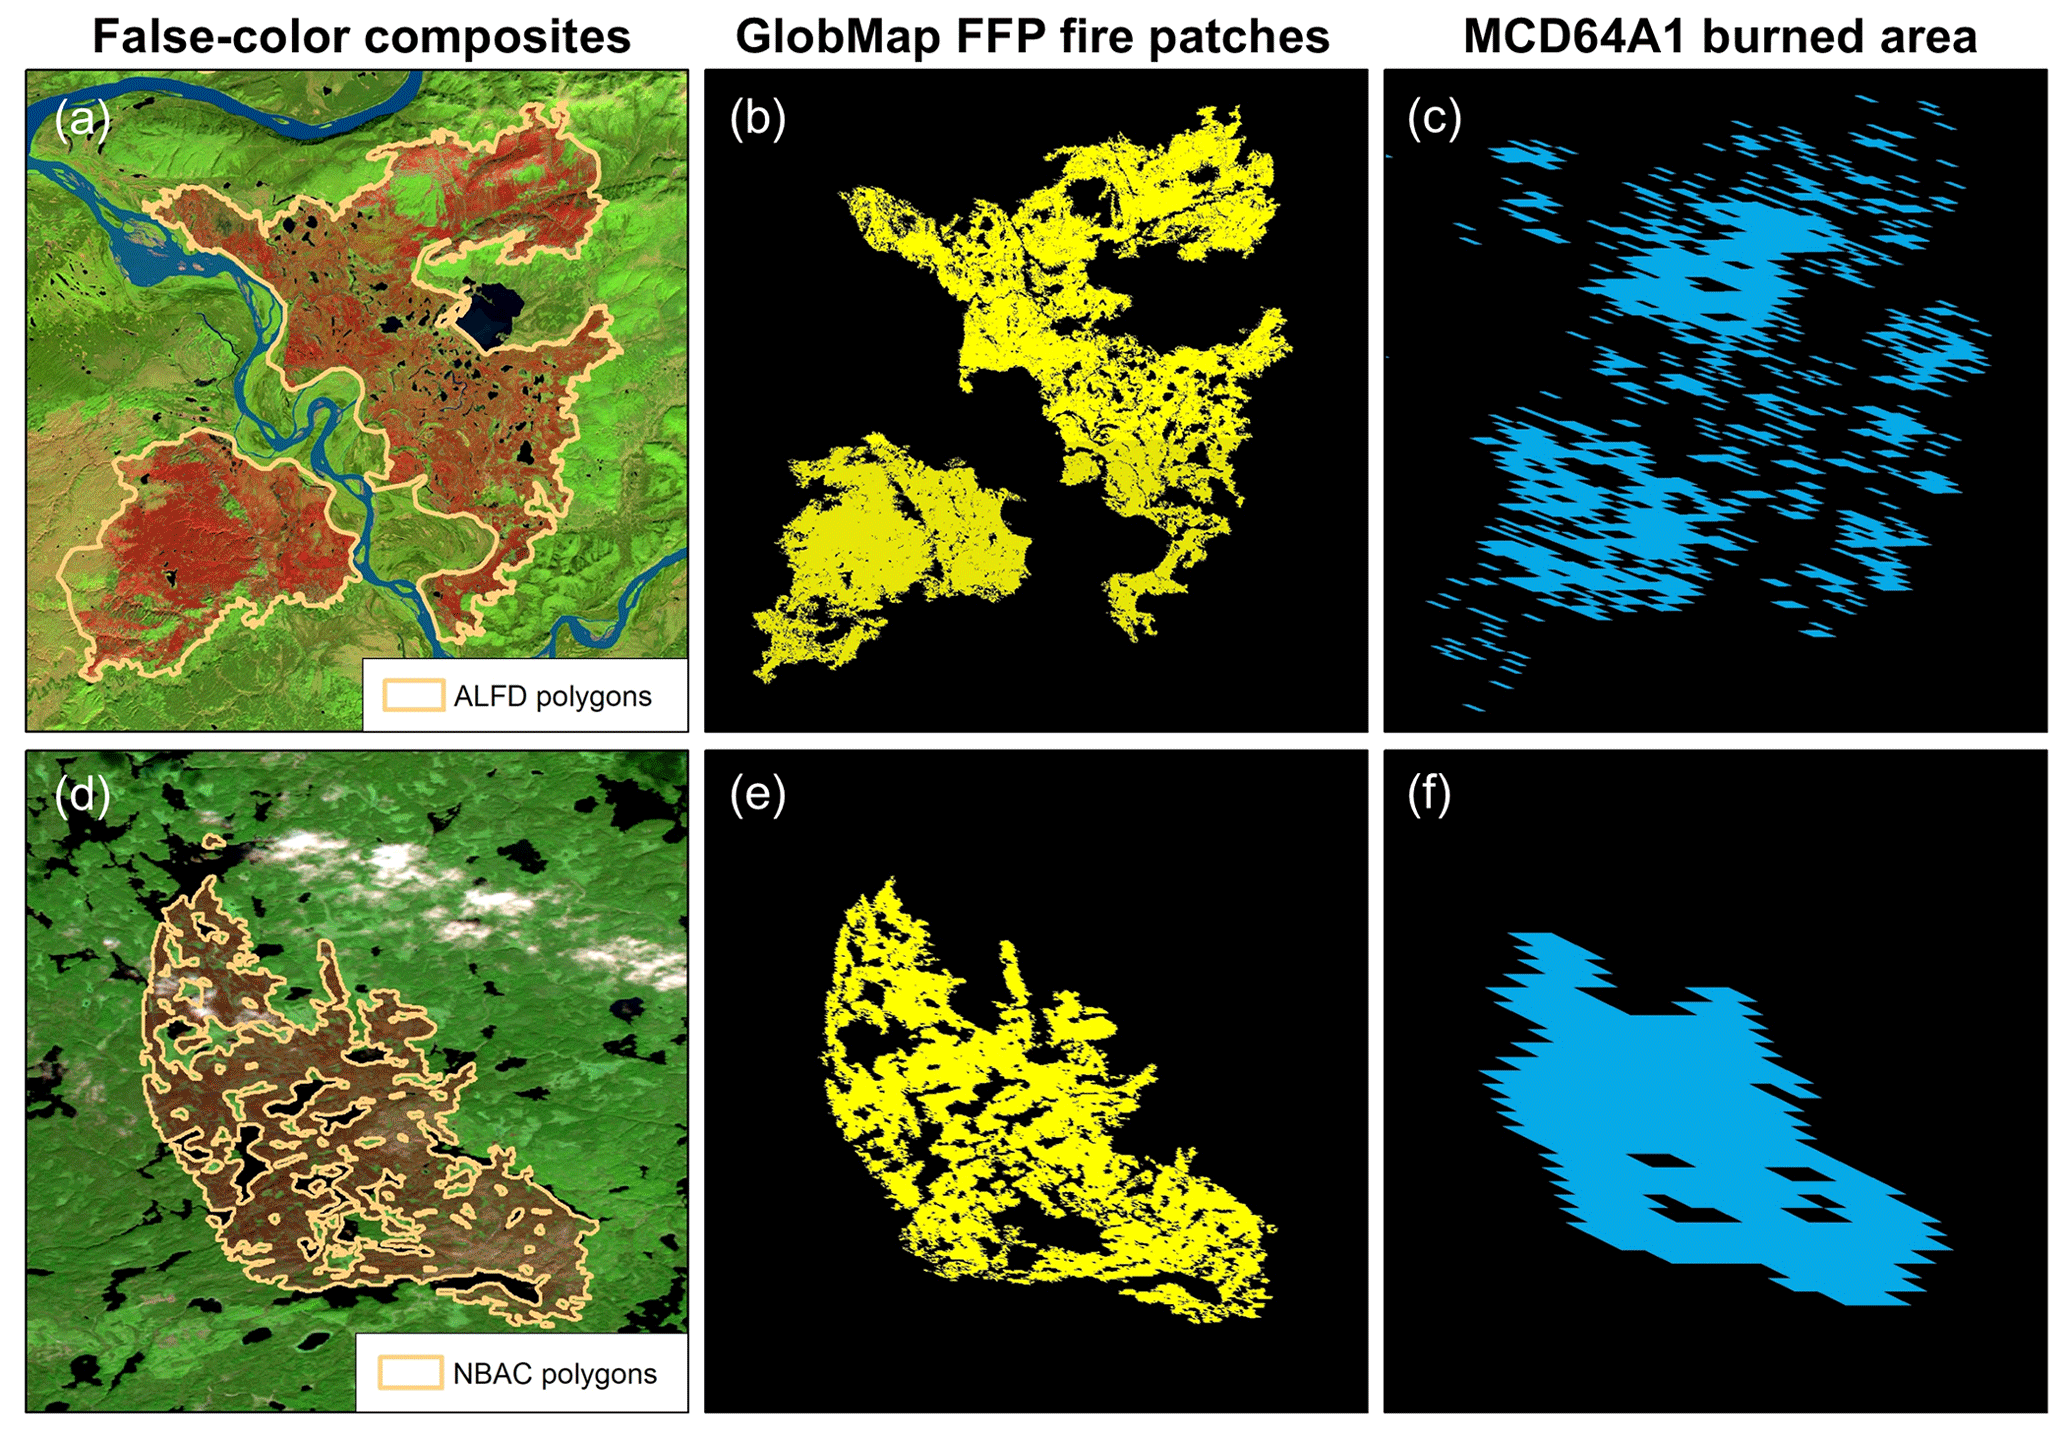
Figure 14Examples of GlobMap FFP fire patch delineation and comparisons with Landsat false-color composites (SWIR2-NIR-Red), regional fire perimeter data, and MCD64A1 burned area at two forest sites. Alaska, US: (a) Landsat false-color composite acquired on 1 September 2015, overlaid with fire perimeters from the Alaska Large Fire Database (ALFD); (b) GlobMap FFP fire patches; (c) MCD64A1 burned area. Eastern Canada: (d) Landsat false-color composite acquired on 26 October 2019, overlaid with fire perimeters from the National Burned Area Composite (NBAC); (e) GlobMap FFP fire patches; (f) MCD64A1 burned area.
Because each detected fire patch is assigned a unique identifier and retains its original spatial geometry at 30 m resolution, the dataset enables analyses that are difficult to perform using conventional burned area products. Potential applications include characterizing patch-level properties, such as size distributions, perimeter-area relationships, and fractal geometry, as well as landscape-scale patterns such as fragmentation, clustering, and spatial organization across diverse forest biomes. These analyses can provide new insights into how fire-affected landscapes are organized and how their spatial patterns change over time. Furthermore, the high spatial resolution of GlobMap FFP enables integration with emerging forest structure and biomass datasets derived from Landsat, GEDI, and ICESat-2 observations, supporting investigations of fire-vegetation interaction and post-fire ecosystem recovery.
Several factors contribute to differences between GlobMap FFP and existing burned area products, particularly MCD64A1. Spatial discrepancies partly reflect differences in sensor resolution. The coarser MODIS pixels tend to produce larger and more spatially continuous burned perimeters, whereas Landsat observations better preserve small fires, patch boundaries, and within-fire heterogeneity (Robinson, 1991). Temporal discrepancies are mostly evident in tropical forests, where persistent cloud cover and rapid vegetation regrowth can cause burned signals to disappear before the next cloud-free Landsat observation. Therefore, this product may miss some short-lived fire effects that are more readily captured by near-daily MODIS observations, particularly in ecosystems characterized by rapid vegetation recovery or frequent low-severity burning.
Additional differences arise from the methodological choices adopted to achieve globally consistent fire patch reconstruction. The multi-year compositing strategy reduces the influence of cloud contamination, data gaps, and uneven observation availability while maintaining computational feasibility. Yet, because only a single representative observation is retained for each pixel within a compositing interval, repeated burning occurring at the same location during the same interval is not explicitly reconstructed. Fire recurrence may therefore be underrepresented in frequently burned regions, and analyses involving recurrence should be interpreted with caution. Similarly, annual aggregation may merge temporally adjacent fires into a single fire patch, potentially resulting in larger mapped patches and reduced fire occurrence counts. Consequently, GlobMap FFP should be interpreted as a spatially explicit fire patch dataset rather than a complete inventory of all forest burned area, particularly in frequently burned tropical forests. Future work should evaluate how alternative compositing strategies influence fire patch reconstruction across contrasting fire environments and compare the performance of BVI-based and NBR-based approaches under varying observation conditions.
Mapping global forest fire patches from Landsat imagery is subject to several limitations despite its advantages for long-term fire patch characterization. First, the irregular availability of cloud- and snow-free Landsat observations constrains the temporal precision and completeness of fire patch reconstruction, particularly in moist tropical forests where short-lived fires may disappear before the next clear-sky acquisition. Frequent cloud cover in these regions reduces the effective temporal sampling frequency and limits the ability to identify burning dates accurately. Fast-recovering surface fires may also be missed if post-fire spectral signals disappear before the next cloud-free overpass (Hislop et al., 2018). Second, incomplete spatial coverage prior to the 2000s may contribute to regional underestimation of burned area. In parts of western and central Africa and boreal Eurasia, Landsat acquisitions prior to the 2000s were sparse because of historical limitations in data storage, ground-station reception, and data archiving (Feng and Wang, 2024). Yet, this may be less pronounced in boreal forests, where post-fire recovery following stand-replacing fires is often sufficiently slow for burned scars to remain detectable for multiple years. Third, the evaluation presented here should be interpreted as an assessment of internal consistency rather than a fully independent accuracy validation. Because the reference dataset was derived from the same Landsat archive and relied on a similar burned area identification workflow, shared sources of uncertainty may exist. Future versions should incorporate independently interpreted reference samples or cross-sensor validation datasets. Integrating Landsat observations with higher-frequency optical sensors such as Sentinel-2 and all-weather synthetic aperture radar observations may further improve the temporal completeness and reliability of global fire patch mapping.
GlobMap FFP Dataset (version 1.0) is publicly available on Zenodo at https://doi.org/10.5281/zenodo.17638167 (Liu, 2025). The dataset is organized into seven “.zip” packages corresponding to compositing periods and is provided in 5°×5° Sinusoidal grid tiles (666 tiles in global forests). Each 30 m tile (18 533×18 533 pixels) includes three raster-format GeoTIFF files: (1) fire patch ID, (2) burned year, and (3) QA level. Files follow the naming convention: “ScarID_ScarTM3DV03_GEEScarTMSinv02_Clean.A3000001.h[HH]v[VV].[FILE_TYPE].[PERIOD].tif”, where [HH] and [VV] denote the horizontal and vertical tile indices. [FILE_TYPE] corresponds to one of the three file types: “ScarID”, “ScarYear”, and “QualityFlag”, representing fire patch ID, burned year, and QA level, respectively. The actual year of fire is obtained by adding 1980 to “ScarYear”. Only QA levels 1 and 2 are included in the distributed dataset. The dataset is distributed in raster format to preserve pixel-level spatial heterogeneity; future versions may explore polygon-based representations for improved usability.
In summary, this study developed a new dataset that characterizes global forest fire patches at 30 m spatial resolution over the past four decades. The pixel-based multi-temporal image compositing strategy adopted in this study provides an efficient framework for large-scale fire patch reconstruction on cloud computing platforms such as the GEE. Comparisons with existing global and regional products suggest that GlobMap FFP captures broad patterns of forest fire patch distribution and spatial organization, particularly in boreal and temperate forests, while greater uncertainty remains in tropical regions because of cloud contamination, rapid vegetation recovery, and limited observation availability. This dataset is most suitable for analyses of fire patch structure, landscape-scale spatial organization, and long-term changes in forest fire patterns, rather than serving as a complete inventory for estimating total burned area.
RL designed the algorithm, developed the software, generated the product, and evaluated the product performance. JH conducted the product intercomparison and drafted the original manuscript. XZ and WZ conducted the image compositing workflow. QD supported the performance assessment. All authors reviewed the final paper.
The contact author has declared that none of the authors has any competing interests.
Publisher's note: Copernicus Publications remains neutral with regard to jurisdictional claims made in the text, published maps, institutional affiliations, or any other geographical representation in this paper. The authors bear the ultimate responsibility for providing appropriate place names. Views expressed in the text are those of the authors and do not necessarily reflect the views of the publisher.
This research has been supported by the National Natural Science Foundation of China, International Cooperation and Exchange Programme (grant-no.: 42161144001).
This paper was edited by Jia Yang and reviewed by two anonymous referees.
Alencar, A. A. C., Arruda, V. L. S., Silva, W. V. d., Conciani, D. E., Costa, D. P., Crusco, N., Duverger, S. G., Ferreira, N. C., Franca-Rocha, W., Hasenack, H., Martenexen, L. F. M., Piontekowski, V. J., Ribeiro, N. V., Rosa, E. R., Rosa, M. R., dos Santos, S. M. B., Shimbo, J. Z., and Vélez-Martin, E.: Long-Term Landsat-Based Monthly Burned Area Dataset for the Brazilian Biomes Using Deep Learning, Remote Sens.-Basel, 14, 2510, https://doi.org/10.3390/rs14112510 2022.
Andela, N., Morton, D. C., Giglio, L., Paugam, R., Chen, Y., Hantson, S., van der Werf, G. R., and Randerson, J. T.: The Global Fire Atlas of individual fire size, duration, speed and direction, Earth Syst. Sci. Data, 11, 529–552, https://doi.org/10.5194/essd-11-529-2019, 2019.
Archibald, S., Lehmann, C. E. R., Gómez-Dans, J. L., and Bradstock, R. A.: Defining pyromes and global syndromes of fire regimes, P. Natl. Acad. Sci. USA, 110, 6442–6447, 2013.
Artés, T., Oom, D., de Rigo, D., Durrant, T. H., Maianti, P., Libertà, G., and San-Miguel-Ayanz, J.: A global wildfire dataset for the analysis of fire regimes and fire behaviour, Scientific Data, 6, 296, https://doi.org/10.1038/s41597-019-0312-2, 2019.
Balch, J. K., St. Denis, L. A., Mahood, A. L., Mietkiewicz, N. P., Williams, T. M., McGlinchy, J., and Cook, M. C.: FIRED (Fire Events Delineation): An Open, Flexible Algorithm and Database of US Fire Events Derived from the MODIS Burned Area Product (2001–2019), Remote Sens.-Basel, 12, 3498, 2020.
Balch, J. K., Abatzoglou, J. T., Joseph, M. B., Koontz, M. J., Mahood, A. L., McGlinchy, J., Cattau, M. E., and Williams, A. P.: Warming weakens the night-time barrier to global fire, Nature, 602, 442–448, https://doi.org/10.1038/s41586-021-04325-1, 2022.
Barbosa, P. M., Pereira, J. M. C., and Grégoire, J.-M.: Compositing Criteria for Burned Area Assessment Using Multitemporal Low Resolution Satellite Data, Remote Sens. Environ., 65, 38–49, https://doi.org/10.1016/S0034-4257(98)00016-9, 1998.
Beck, P. S. A., Goetz, S. J., Mack, M. C., Alexander, H. D., Jin, Y., Randerson, J. T., and Loranty, M. M.: The impacts and implications of an intensifying fire regime on Alaskan boreal forest composition and albedo, Glob. Change Biol., 17, 2853–2866, https://doi.org/10.1111/j.1365-2486.2011.02412.x, 2011.
Boschetti, L., Roy, D. P., Giglio, L., Huang, H., Zubkova, M., and Humber, M. L.: Global validation of the collection 6 MODIS burned area product, Remote Sens. Environ., 235, 111490, https://doi.org/10.1016/j.rse.2019.111490, 2019.
Brando, P. M., Silvério, D., Maracahipes-Santos, L., Oliveira-Santos, C., Levick, S. R., Coe, M. T., Migliavacca, M., Balch, J. K., Macedo, M. N., Nepstad, D. C., Maracahipes, L., Davidson, E., Asner, G., Kolle, O., and Trumbore, S.: Prolonged tropical forest degradation due to compounding disturbances: Implications for CO2 and H2O fluxes, Glob. Change Biol., 25, 2855–2868, https://doi.org/10.1111/gcb.14659, 2019.
Buonanduci, M. S., Donato, D. C., Halofsky, J. S., Kennedy, M. C., and Harvey, B. J.: Few large or many small fires: Using spatial scaling of severe fire to quantify effects of fire-size distribution shifts, Ecosphere, 15, e4875, https://doi.org/10.1002/ecs2.4875, 2024.
Chuvieco, E., Ventura, G., Martín, M. P., and Gómez, I.: Assessment of multitemporal compositing techniques of MODIS and AVHRR images for burned land mapping, Remote Sens. Environ., 94, 450–462, https://doi.org/10.1016/j.rse.2004.11.006, 2005.
Chuvieco, E., Mouillot, F., van der Werf, G. R., San Miguel, J., Tanasse, M., Koutsias, N., García, M., Yebra, M., Padilla, M., Gitas, I., Heil, A., Hawbaker, T. J., and Giglio, L.: Historical background and current developments for mapping burned area from satellite Earth observation, Remote Sens. Environ., 225, 45–64, https://doi.org/10.1016/j.rse.2019.02.013, 2019.
Cova, G., Kane, V. R., Prichard, S., North, M., and Cansler, C. A.: The outsized role of California's largest wildfires in changing forest burn patterns and coarsening ecosystem scale, Forest Ecol. Manag., 528, 120620, https://doi.org/10.1016/j.foreco.2022.120620, 2023.
Duan, Q., Liu, R., Chen, J., Wei, X., Liu, Y., and Zou, X.: Burned area detection from a single satellite image using an adaptive thresholds algorithm, Int. J. Digit. Earth, 17, 2376275, https://doi.org/10.1080/17538947.2024.2376275, 2024.
Feng, L. and Wang, X.: Quantifying Cloud-Free Observations from Landsat Missions: Implications for Water Environment Analysis, J. Remote Sens., 4, 0110, https://doi.org/10.34133/remotesensing.0110, 2024.
Flores-Anderson, A. I., Cardille, J., Azad, K., Cherrington, E., Zhang, Y., and Wilson, S.: Spatial and Temporal Availability of Cloud-free Optical Observations in the Tropics to Monitor Deforestation, Scientific Data, 10, 550, https://doi.org/10.1038/s41597-023-02439-x, 2023.
Francini, S., Hermosilla, T., Coops, N. C., Wulder, M. A., White, J. C., and Chirici, G.: An assessment approach for pixel-based image composites, ISPRS J. Photogramm., 202, 1–12, https://doi.org/10.1016/j.isprsjprs.2023.06.002, 2023.
Franquesa, M., Vanderhoof, M. K., Stavrakoudis, D., Gitas, I. Z., Roteta, E., Padilla, M., and Chuvieco, E.: Development of a standard database of reference sites for validating global burned area products, Earth Syst. Sci. Data, 12, 3229–3246, https://doi.org/10.5194/essd-12-3229-2020, 2020.
Giglio, L., Boschetti, L., Roy, D. P., Humber, M. L., and Justice, C. O.: The Collection 6 MODIS burned area mapping algorithm and product, Remote Sens. Environ., 217, 72–85, https://doi.org/10.1016/j.rse.2018.08.005, 2018.
Godoy, E., Adorno, B. F. C. B., da Silva, B. D., Corrêa, W., Barbosa, V. M., Piratelli, A. J., Ribeiro, M. C., and Hasui, É.: Fire refugia under threat: How increasing pyrodiversity reduces species richness in unburned forests, Forest Ecol. Manag., 585, 122673, https://doi.org/10.1016/j.foreco.2025.122673, 2025.
Hansen, M. C., Potapov, P. V., Moore, R., Hancher, M., Turubanova, S. A., Tyukavina, A., Thau, D., Stehman, S. V., Goetz, S. J., Loveland, T. R., Kommareddy, A., Egorov, A., Chini, L., Justice, C. O., and Townshend, J. R. G.: High-Resolution Global Maps of 21st-Century Forest Cover Change, Science, 342, 850–854, https://doi.org/10.1126/science.1244693, 2013.
Hantson, S., Pueyo, S., and Chuvieco, E.: Global fire size distribution is driven by human impact and climate, Global Ecol. Biogeogr., 24, 77–86, https://doi.org/10.1111/geb.12246, 2015.
Harris, N. L., Brown, S., Hagen, S. C., Saatchi, S. S., Petrova, S., Salas, W., Hansen, M. C., Potapov, P. V., and Lotsch, A.: Baseline Map of Carbon Emissions from Deforestation in Tropical Regions, Science, 336, 1573–1576, https://doi.org/10.1126/science.1217962, 2012.
Hawbaker, T. J., Vanderhoof, M. K., Schmidt, G. L., Beal, Y. J., Picotte, J. J., Takacs, J. D., Falgout, J. T., and Dwyer, J. L.: The Landsat Burned Area algorithm and products for the conterminous United States, Remote Sens. Environ., 244, 111801, https://doi.org/10.1016/j.rse.2020.111801, 2020a.
Hawbaker, T. J., Vanderhoof, M. K., Schmidt, G. L., Beal, Y., Picotte, J. J., Takacs, J. D., Falgout, J. T., and Dwyer, J. L.: The Landsat Burned Area products for the conterminous United States (ver. 3.0, March 2022), U.S. Geological Survey data release, https://doi.org/10.5066/P9QKHKTQ, 2020b.
Hermosilla, T., Wulder, M. A., White, J. C., and Coops, N. C.: Prevalence of multiple forest disturbances and impact on vegetation regrowth from interannual Landsat time series (1985–2015), Remote Sens. Environ., 233, 111403, https://doi.org/10.1016/j.rse.2019.111403, 2019.
Hislop, S., Jones, S., Soto-Berelov, M., Skidmore, A., Haywood, A., and Nguyen, T. H.: Using Landsat Spectral Indices in Time-Series to Assess Wildfire Disturbance and Recovery, Remote Sens.-Basel, 10, 460, https://doi.org/10.3390/rs10030460, 2018.
Huang, C., Goward, S. N., Masek, J. G., Thomas, N., Zhu, Z., and Vogelmann, J. E.: An automated approach for reconstructing recent forest disturbance history using dense Landsat time series stacks, Remote Sens. Environ., 114, 183–198, https://doi.org/10.1016/j.rse.2009.08.017, 2010.
Iglesias, V., Balch, J. K., and Travis, W. R.: U. S. fires became larger, more frequent, and more widespread in the 2000s, Science Advances, 8, eabc0020, https://doi.org/10.1126/sciadv.abc0020, 2022.
Kennedy, R. E., Yang, Z., and Cohen, W. B.: Detecting trends in forest disturbance and recovery using yearly Landsat time series: 1. LandTrendr – Temporal segmentation algorithms, Remote Sens. Environ., 114, 2897–2910, https://doi.org/10.1016/j.rse.2010.07.008, 2010.
Liu, R.: Compositing the Minimum NDVI for MODIS Data, IEEE T. Geosci. Remote, 55, 1396–1406, https://doi.org/10.1109/TGRS.2016.2623746, 2017.
Liu, R.: A Global 30 m Landsat-based Dataset of Forest Fire Patches (GlobMap FFP v1.0) from 1984–2022, Zenodo [data set], https://doi.org/10.5281/zenodo.17638167, 2025.
Liu, R. and Liu, Y.: GLOBMAP FTC: a global annual fractional tree cover dataset since 2000 (Version Version 1.0), Zenodo [data set], https://doi.org/10.5281/zenodo.10589730, 2024.
Liu, Y., Liu, R., Chen, J., Wei, X., Qi, L., and Zhao, L.: A global annual fractional tree cover dataset during 2000–2021 generated from realigned MODIS seasonal data, Scientific Data, 11, 832, https://doi.org/10.1038/s41597-024-03671-9, 2024.
Long, T., Zhang, Z., He, G., Jiao, W., Tang, C., Wu, B., Zhang, X., Wang, G., and Yin, R.: 30 m Resolution Global Annual Burned Area Mapping Based on Landsat Images and Google Earth Engine, Remote Sens.-Basel, 11, 489, https://doi.org/10.3390/rs11050489, 2019.
Lv, Q., Chen, Z., Wu, C., Peñuelas, J., Fan, L., Su, Y., Yang, Z., Li, M., Gao, B., Hu, J., Zhang, C., Fu, Y., and Wang, Q.: Increasing severity of large-scale fires prolongs recovery time of forests globally since 2001, Nature Ecology and Evolution, 9, 980–992, https://doi.org/10.1038/s41559-025-02683-x, 2025.
McKenna, P., Phinn, S., and Erskine, P. D.: Fire Severity and Vegetation Recovery on Mine Site Rehabilitation Using WorldView-3 Imagery, Fire, 1, 22, https://doi.org/10.3390/fire1020022, 2018.
Meddens, A. J. H., Kolden, C. A., and Lutz, J. A.: Detecting unburned areas within wildfire perimeters using Landsat and ancillary data across the northwestern United States, Remote Sens. Environ., 186, 275–285, https://doi.org/10.1016/j.rse.2016.08.023, 2016.
Miettinen, J. and Liew, S. C.: Comparison of multitemporal compositing methods for burnt area detection in Southeast Asian conditions, Int. J. Remote Sens., 29, 1075–1092, https://doi.org/10.1080/01431160701281031, 2008.
Minor, J., Falk, D. A., and Barron-Gafford, G. A.: Fire Severity and Regeneration Strategy Influence Shrub Patch Size and Structure Following Disturbance, Forests, 8, 221, https://doi.org/10.3390/f8070221, 2017.
Miranda, A., Mentler, R., Moletto-Lobos, Í., Alfaro, G., Aliaga, L., Balbontín, D., Barraza, M., Baumbach, S., Calderón, P., Cárdenas, F., Castillo, I., Contreras, G., de la Barra, F., Galleguillos, M., González, M. E., Hormazábal, C., Lara, A., Mancilla, I., Muñoz, F., Oyarce, C., Pantoja, F., Ramírez, R., and Urrutia, V.: The Landscape Fire Scars Database: mapping historical burned area and fire severity in Chile, Earth Syst. Sci. Data, 14, 3599–3613, https://doi.org/10.5194/essd-14-3599-2022, 2022a.
Miranda, A., Mentler, R., Moletto Lobos, I., Alfaro, G., Aliaga, L., Balbontín, D., Barraza, M., Baumbach, S., Calderón, P., Cardenas, F., Castillo, I., Gonzalo, C., de la Barra, F., Galleguillos, M., Gonzalez, M., Hormazabal, C., Lara, A., Mancilla, I., Muñoz, F., Oyarce, C., Pantoja, F., Ramirez, R., and Urrutia, V.: Fire Scars: remotely sensed historical burned area and fire severity in Chile between 1984–2018, PANGAEA [data set], https://doi.org/10.1594/PANGAEA.941127, 2022b.
Myroniuk, V., Kutia, M., J. Sarkissian, A., Bilous, A., and Liu, S.: Regional-Scale Forest Mapping over Fragmented Landscapes Using Global Forest Products and Landsat Time Series Classification, Remote Sens.-Basel, 12, 187, https://doi.org/10.3390/rs12010187 2020.
Nair, V. and Hinton, G. E.: Rectified linear units improve restricted boltzmann machines, Proceedings of the 27th International Conference on International Conference on Machine Learning, Haifa, Israel, https://dl.acm.org/doi/10.5555/3104322.3104425 (last access: 17 August 2026), 2010.
Otón, G., Ramo, R., Lizundia-Loiola, J., and Chuvieco, E.: Global Detection of Long-Term (1982–2017) Burned Area with AVHRR-LTDR Data, Remote Sens., 11, 2079, https://doi.org/10.3390/rs11182079, 2019.
Padilla, M., Stehman, S. V., Ramo, R., Corti, D., Hantson, S., Oliva, P., Alonso-Canas, I., Bradley, A. V., Tansey, K., Mota, B., Pereira, J. M., and Chuvieco, E.: Comparing the accuracies of remote sensing global burned area products using stratified random sampling and estimation, Remote Sens. Environ., 160, 114–121, https://doi.org/10.1016/j.rse.2015.01.005, 2015.
Pérez-Cabello, F., Montorio, R., and Alves, D. B.: Remote sensing techniques to assess post-fire vegetation recovery, Current Opinion in Environmental Science and Health, 21, 100251, https://doi.org/10.1016/j.coesh.2021.100251, 2021.
Pugh, T. A. M., Arneth, A., Kautz, M., Poulter, B., and Smith, B.: Important role of forest disturbances in the global biomass turnover and carbon sinks, Nat. Geosci., 12, 730–735, https://doi.org/10.1038/s41561-019-0427-2, 2019.
Qiu, S., Zhu, Z., Olofsson, P., Woodcock, C. E., and Jin, S.: Evaluation of Landsat image compositing algorithms, Remote Sens. Environ., 285, 113375, https://doi.org/10.1016/j.rse.2022.113375, 2023.
Ramo, R., Roteta, E., Bistinas, I., van Wees, D., Bastarrika, A., Chuvieco, E., and van der Werf, G. R.: African burned area and fire carbon emissions are strongly impacted by small fires undetected by coarse resolution satellite data, P. Natl. Acad. Sci. USA, 118, 1–7, https://doi.org/10.1073/pnas.2011160118, 2021.
Robinson, J. M.: Fire from space: Global fire evaluation using infrared remote sensing, Int. J. Remote Sens., 12, 3–24, https://doi.org/10.1080/01431169108929628, 1991.
Roteta, E., Bastarrika, A., Padilla, M., Storm, T., and Chuvieco, E.: Development of a Sentinel-2 burned area algorithm: Generation of a small fire database for sub-Saharan Africa, Remote Sens. Environ., 222, 1–17, https://doi.org/10.1016/j.rse.2018.12.011, 2019.
Scholten, R. C., Coumou, D., Luo, F., and Veraverbeke, S.: Early snowmelt and polar jet dynamics co-influence recent extreme Siberian fire seasons, Science, 378, 1005–1009, https://doi.org/10.1126/science.abn4419, 2022.
Senf, C. and Seidl, R.: European forest disturbance maps (Version 1.0.0), Zenodo [data set], https://doi.org/10.5281/zenodo.3924381, 2020.
Senf, C. and Seidl, R.: Storm and fire disturbances in Europe: Distribution and trends, Glob. Change Biol., 27, 3605–3619, https://doi.org/10.1111/gcb.15679, 2021a.
Senf, C. and Seidl, R.: Mapping the forest disturbance regimes of Europe, Nature Sustainability, 4, 63–70, https://doi.org/10.1038/s41893-020-00609-y, 2021b.
Sommers, M. and Flannigan, M. D.: Green islands in a sea of fire: the role of fire refugia in the forests of Alberta, Environ. Rev., 30, 402–417, https://doi.org/10.1139/er-2021-0115, 2022.
Sulla-Menashe, D., Gray, J. M., Abercrombie, S. P., and Friedl, M. A.: Hierarchical mapping of annual global land cover 2001 to present: The MODIS Collection 6 Land Cover product, Remote Sens. Environ., 222, 183–194, https://doi.org/10.1016/j.rse.2018.12.013, 2019.
Turner, M. G.: Disturbance and landscape dynamics in a changing world, Ecology, 91, 2833–2849, https://doi.org/10.1890/10-0097.1, 2010.
Turner, M. G., Romme, W. H., Gardner, R. H., and Hargrove, W. W.: Effects of fire size and pattern on early succession in Yellowstone National Park, Ecol. Monogr., 67, 411–433, https://doi.org/10.1890/0012-9615(1997)067[0411:EOFSAP]2.0.CO;2, 1997.
Tyukavina, A., Potapov, P., Hansen, M. C., Pickens, A. H., Stehman, S. V., Turubanova, S., Parker, D., Zalles, V., Lima, A., Kommareddy, I., Song, X.-P., Wang, L., and Harris, N.: Global Trends of Forest Loss Due to Fire From 2001–2019, Frontiers in Remote Sensing, 3, https://doi.org/10.3389/frsen.2022.825190, 2022.
van Wees, D., van der Werf, G. R., Randerson, J. T., Andela, N., Chen, Y., and Morton, D. C.: The role of fire in global forest loss dynamics, Glob. Change Biol., 27, 2377–2391, https://doi.org/10.1111/gcb.15591, 2021.
Veraverbeke, S., Rogers, B. M., Goulden, M. L., Jandt, R. R., Miller, C. E., Wiggins, E. B., and Randerson, J. T.: Lightning as a major driver of recent large fire years in North American boreal forests, Nat. Clim. Change, 7, 529–534, https://doi.org/10.1038/nclimate3329, 2017.
White, J. C., Wulder, M. A., Hobart, G. W., Luther, J. E., Hermosilla, T., Griffiths, P., Coops, N. C., Hall, R. J., Hostert, P., Dyk, A., and Guindon, L.: Pixel-Based Image Compositing for Large-Area Dense Time Series Applications and Science, Can. J. Remote Sens., 40, 192–212, https://doi.org/10.1080/07038992.2014.945827, 2014.
Zheng, B., Ciais, P., Chevallier, F., Chuvieco, E., Chen, Y., and Yang, H.: Increasing forest fire emissions despite the decline in global burned area, Science Advances, 7, eabh2646, https://doi.org/10.1126/sciadv.abh2646, 2021.