the Creative Commons Attribution 4.0 License.
the Creative Commons Attribution 4.0 License.
 | 13 Aug 2026
An airborne in-situ dataset of cloud microphysical properties in supercooled large droplet icing conditions
Johannes Lucke
Tina Jurkat-Witschas
Christiane Voigt
Simon Kirschler
Aurélien Bourdon
Detailed and comprehensive data sets on microphysical cloud properties in icing conditions are rare. In April 2023, fifteen research flights were performed with the SAFIRE ATR 42 research aircraft during the SENS4ICE-EU airborne measurement campaign over France and adjacent marine regions to measure clouds containing supercooled large droplets (SLD) at altitudes between 2 and 6 km and temperatures of 0 to −18 °C. Ten cloud probes were deployed on the aircraft, comprising four imaging probes, two light-scattering probes, and three hotwire probes, in order to characterise natural SLD conditions and serve as reference instruments for novel aircraft icing detection sensors. This work presents a comprehensive cloud dataset derived from the in-situ instruments used during the campaign, which is accessible on the HALO (High Altitude and Long Range Research Aircraft) database (https://doi.org/10.17616/R39Q0T, Menekay et al., 2026). The dataset includes measurements of liquid and ice water content, combined particle size distributions, cloud microphysical properties, and meteorological parameters relevant to icing environments. In addition to documenting the dataset structure and processing methods, the paper provides an overview of flight strategies, instrument configurations, and statistical characteristics of the observed cloud properties, including their dependence on temperature and altitude. The dataset is suitable for studies of atmospheric icing conditions, mid-level clouds, sensor development, and model evaluation. It represents a rare collection of in-situ observations of SLD characteristics in icing environments and supports the evaluation of numerical weather prediction models under icing conditions to improve weather forecasts in hazardous conditions.
- Article
(1357 KB) - Full-text XML
- BibTeX
- EndNote


Airborne in-situ measurements of cloud properties are crucial for advancing our understanding of atmospheric processes related to clouds. These observations provide valuable data for a wide range of applications, including input for climate and numerical weather prediction models, and validation of satellite retrievals. In particular, measurements of supercooled clouds are of high relevance for characterising aircraft icing environments. However, previous airborne measurement campaigns focusing on supercooled liquid droplets are limited to confined geographical regions, seasons, or to specific scientific objectives (DiVito et al., 2019; Moser et al., 2023; Sorooshian et al., 2025). A more comprehensive understanding of cloud evolution and radiative effects requires combining observations from multiple campaigns to capture influences such as seasonal variability, geographical differences, and interannual variability. Achieving this goal relies on the availability of well-documented datasets that adhere to established data management principles (Wilkinson et al., 2016).
This article describes the measurement data of the SENS4ICE-EU flight campaign in a way that enables other researchers to understand and reuse the measurement strategy, the derived data products, and the processing steps applied, thereby facilitating comparison with other in-situ cloud datasets. The data evaluation and related uncertainties are discussed in detail, and a general overview of the measurement conditions encountered during the flights is also given.
This work begins with an introduction to the SENS4ICE project and the corresponding European flight campaign. It then outlines the measurement strategy and provides an overview of the flight activities, the general experimental setup, and the instrumentation used in this study. The applied data evaluation procedures and the structure of the resulting dataset are subsequently described, together with the associated uncertainties. Finally, selected results are presented to provide an overview of the cloud microphysical properties encountered during the campaign.
The EU-project SENSors and certifiable hybrid architectures for safer aviation in ICing Environment (SENS4ICE) (Schwarz, 2021, 2023a) aimed to develop sensor technologies that allow to detect and differentiate the icing environments specified in Appendix C (Office of the Federal Register, National Archives and Records Administration, 2014) and Appendix O (Office of the Federal Register, National Archives and Records Administration, 2016) of the European and American certification specifications for large aircraft (CS-25 and 14 CFR Part 25, both are referred to from now on as Part 25). Appendix C specifies the regulations for flights in icing conditions with median volume diameters (MVD) smaller than 50 µm. Appendix O regulates the flight in icing conditions that include SLDs, which are defined as droplets with a diameter larger than 100 µm. Appendix O was added to Part 25 in the mid-2010s and was the consequence of several fatal accidents that occurred in icing conditions where SLDs were likely present (Marwitz et al., 1997; National Transportation Safety Board, 1996, 1998). The SENS4ICE project was initiated as a consequence of the addition of Appendix O to Part 25. It pursued a two-fold approach of detecting and assessing the severity of icing conditions. On the one hand, several companies and research institutes developed and tested sensors for the direct detection of icing and SLD conditions (Pohl, 2022; Roberts et al., 2023; Gonzalez and Frövel, 2022; Schwarz, 2023b). Simultaneously, DLR and partners implemented an indirect approach to detect ice accretion based on flight parameters such as lift and drag (Deiler and Sachs, 2023). Both techniques were combined to test a hybrid ice detection system in flight (Deiler, 2024).
For the testing of the developed sensors and indirect ice detection methodology, two flight campaigns were performed, one in the Midwestern United States, coordinated by Embraer (Schwarz, 2023a; Lucke et al., 2024) and a second campaign based out of Toulouse, France, with the French ATR 42 environmental research aircraft of the French facility for airborne research (SAFIRE). The second flight campaign is referred to as the European flight campaign and is the subject of this study.
The aircraft used in the European flight campaign was an ATR 42-320, operated by SAFIRE. The scientific instrumentation aboard the aircraft belonged partly to SAFIRE and partly to DLR (Jurkat-Witschas et al., 2023). As part of the SENS4ICE project and prior to the airborne measurements, DLR cloud instruments were used to characterise droplet spectra and total water content in wind tunnels recently enhanced for Appendix O conditions (Lucke et al., 2022a). SAFIRE evaluates and publishes its data from the SENS4ICE campaign on the SAFIRE+ Aeris portal (Bourdon and Schwarz, 2023). These data include flight parameters such as position and airspeed, as well as radiation and humidity measurements, along with the measurements from the cloud probes owned by SAFIRE, which are later described in detail. The evaluation of all DLR instruments is based on the aircraft parameters, like velocity and position, provided by SAFIRE. A list of the aircraft parameters used in the following evaluation, apart from the latitude, longitude, and altitude, is shown in Table 1.
Table 1Aircraft parameters provided by SAFIRE used in the evaluation.

3.1 Measurement strategy
The selection of the campaign location and time was based on extensive climatological analyses of potential icing occurrences in Europe, with a particular focus on SLD formation as discussed in Jurkat-Witschas et al. (2023). In addition to the frequency of potential icing conditions, their severity was also a crucial factor for the aircraft's operational safety requirements. A minimum flight altitude of 8000 ft (2.4 km) above ground level was necessary for icing encounters, along with a warm air layer below the measurement altitude to facilitate deicing. Southern France was chosen as the primary region of interest, as active frontal systems in this area promote moist air masses and atmospheric lifting, creating favourable conditions for icing events. The influx of cleaner marine air with low CCN concentrations from the ocean further increases the likelihood of SLD formation. Conducting the campaign in spring ensured the presence of a warm air layer beneath the clouds, allowing for effective aircraft deicing.
The flights were conducted as either CER (Contrôle Essais Réception/Temporary Reserved Area) flights or flights on airways. CER flights took place in specifically designated areas reserved for the research aircraft, managed by a dedicated air traffic controller. This setup provided significant flexibility to adjust the flight plan in real-time. However, CER zones were limited to regions near Toulouse and along the Atlantic coast near Bordeaux. Airways flights were conducted when suitable weather conditions were not forecast for the CER areas. Unlike CER flights, Airways flights followed predefined routes with little to no flexibility for changes in flight path or altitude.
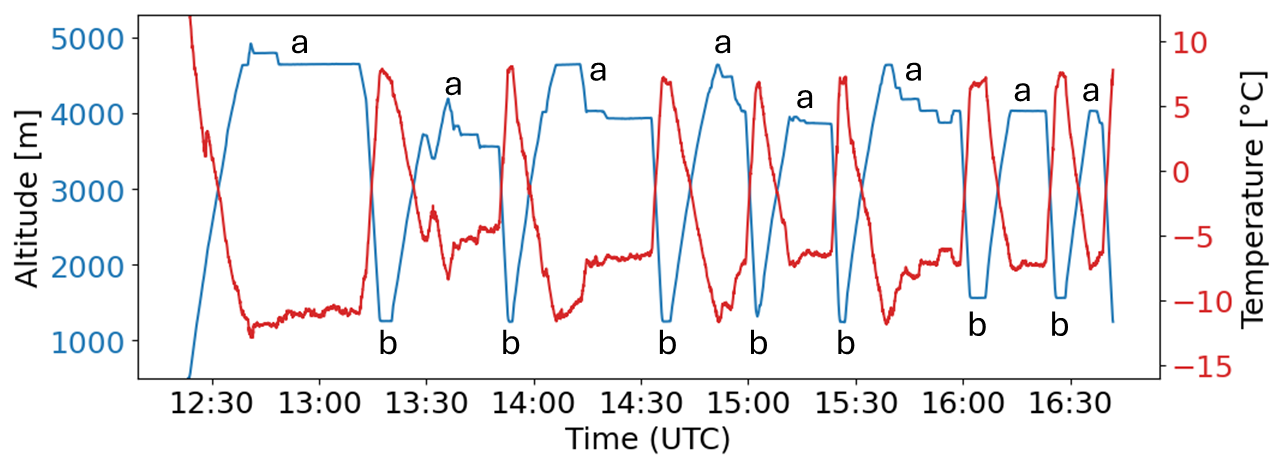
Figure 1Altitude and temperature profile of the CER flight on 24 April 2023 (OF9), illustrating a typical flight strategy used during the campaign. Periods of stable altitude at temperatures below 0 °C indicate cloud measurement phases (a), while segments characterised by descends accompanied by temperature increases (b) correspond to aircraft deicing cycles.
To test both indirect ice detection and accretion-based sensors, the flight included icing segments that promoted ice accretion on the aircraft, followed by warm air segments returning the aircraft to an “ice-free” configuration. The measurement strategy, therefore, involved alternating cycles of ice accretion and deicing by descending to warmer temperatures during the flight. Figure 1 illustrates an example of a flight pattern used during the campaign. Section (a) highlights cloud encounters under icing conditions, while section (b) represents the deicing phases.
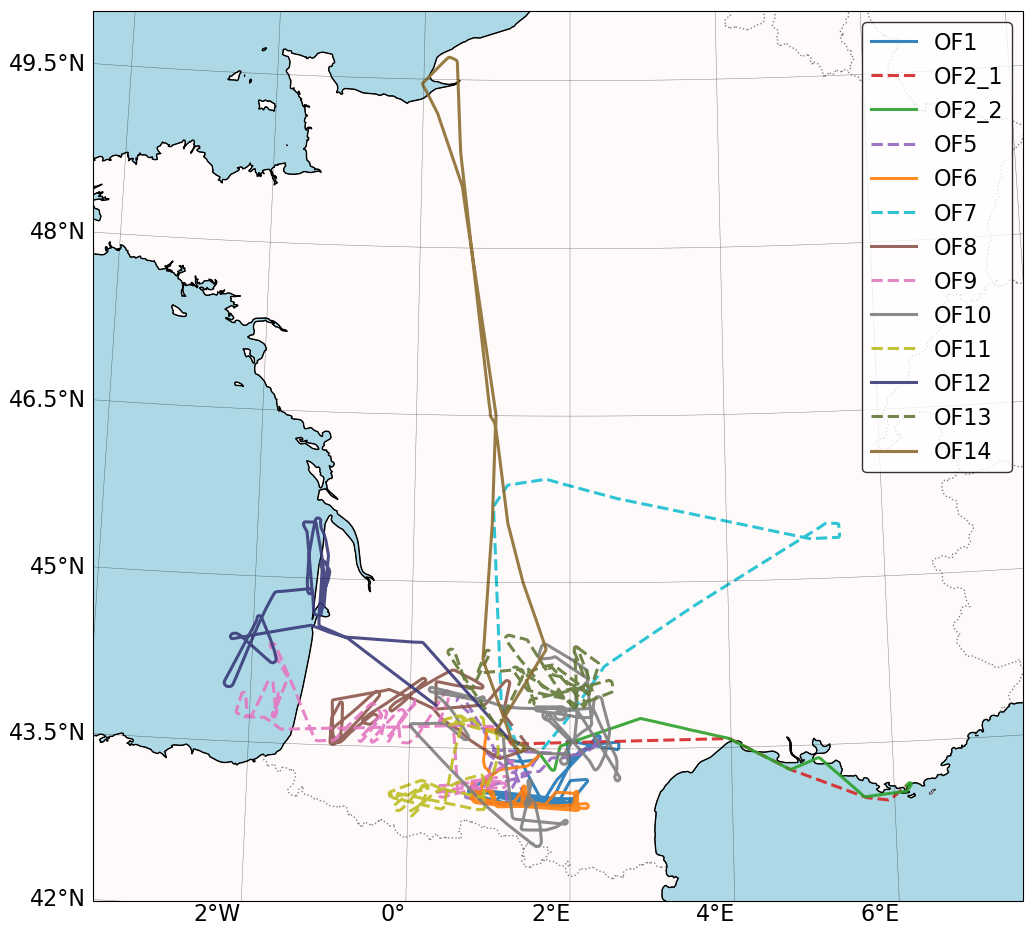
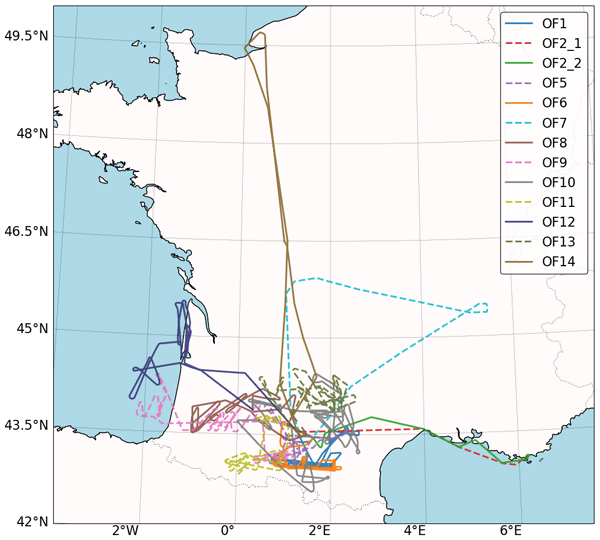
Figure 2Flight tracks from the SENS4ICE-EU campaign in France. Flight numbers are shown in the legend. Ocean areas are shaded in light blue and land areas in light grey.
3.2 Overview of flight activities
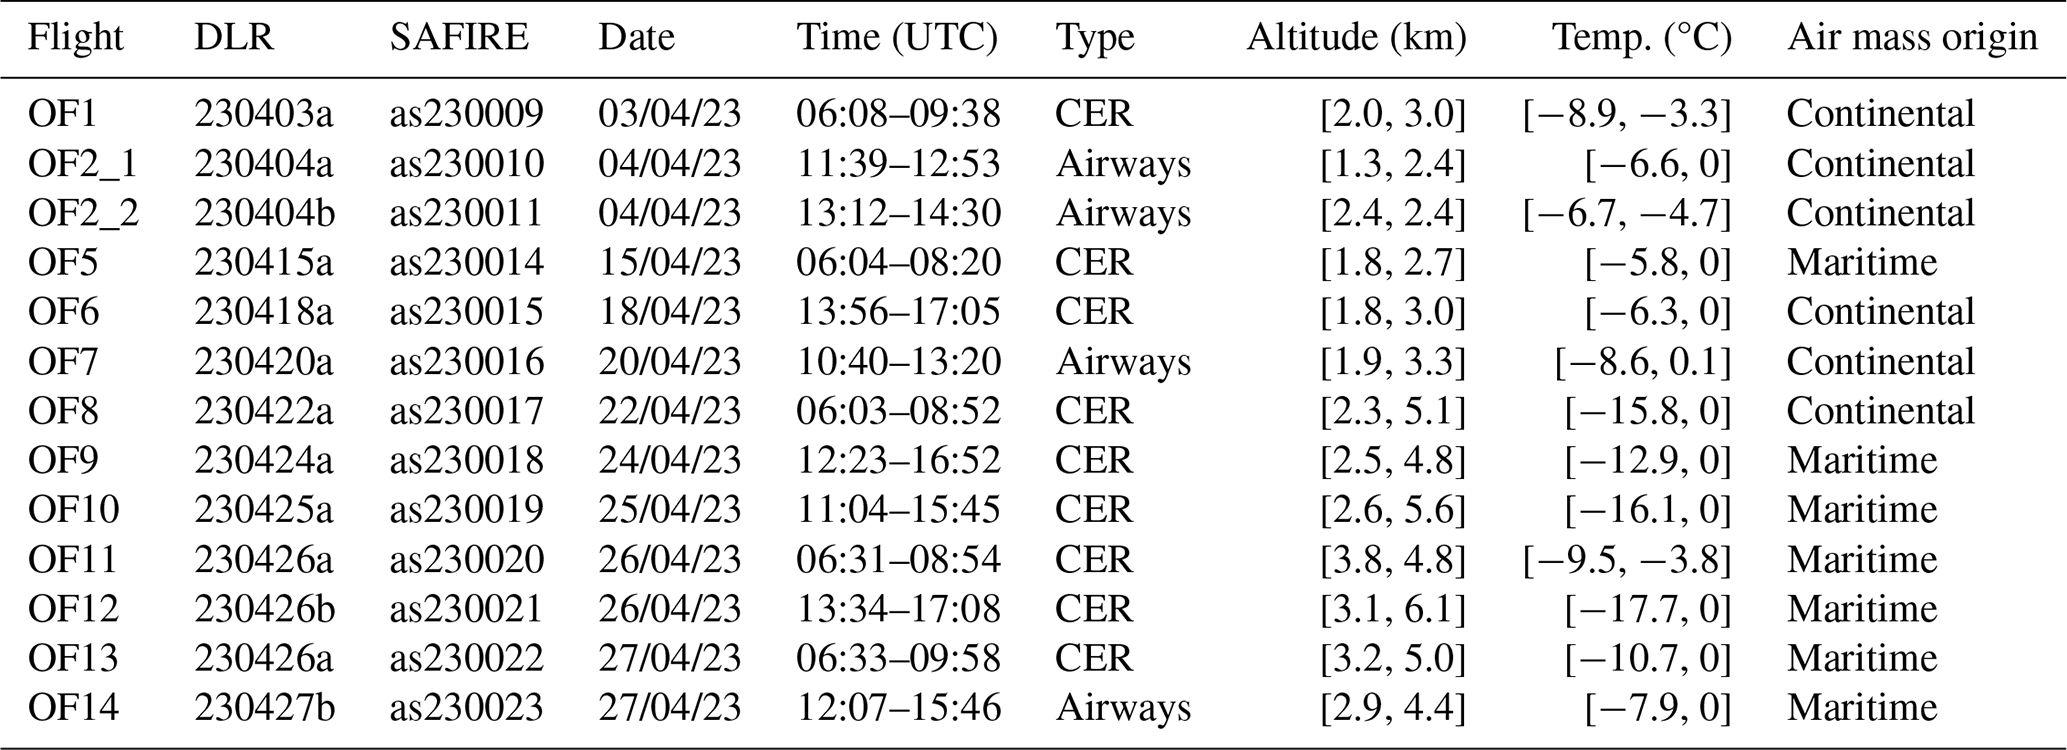
Fifteen scientific flights were conducted and tracks of the evaluated flights are shown in Fig. 2. Additionally, one electromagnetic interference testing flight and two other test flights were carried out but were not evaluated as there was not adequate scientific data collected. Aircraft and instrument issues were encountered during observational flights (OFs) 3 and 4, which were removed from the dataset. Moreover, data from the Nevzorov probe on flights from OF1 to OF8 was unreliable and is therefore not used. For these flights, water content measurements that are used for the assessment of icing conditions are obtained from the LWC-300 and Robust instruments. Table 2 provides an overview of the evaluated flights from the campaign. Determination of the air mass origin is described in Lucke et al. (2025).
Table 2Overview of the flights conducted during the SENS4ICE-EU campaign, including flight names used by DLR and SAFIRE conventions, dates and time periods (UTC), flight type, altitude and temperature ranges during cloud measurements, and the dominant air mass origin.
A comprehensive understanding of cloud conditions relies on precise measurement instruments and the data they provide. This section focuses on the instruments used to generate the presented dataset, as well as the instrument settings applied. Table 3 presents an overview of the instrument configuration, whereas Fig. 3 presents the position of each instrument onboard the ATR-42. The horizontal and vertical wind components were obtained from the retrieved three-dimensional wind vector. The wind retrieval is based on pressure measurements from the nose-mounted five-hole radome, together with aircraft attitude and navigation data (Bony et al., 2022).
The primary instruments used for particle size, concentration, and water content measurements include the Cloud Droplet Probe (CDP), the Greyscale Cloud Imaging Probe (CIP-GS), and the Precipitation Imaging Probe (PIP). Together, these instruments cover a wide and complementary cloud particle size range. In addition, measurements from the Nevzorov probe, the LWC-300 sensor, and the Robust hotwire Probe are included to provide reliable estimates of cloud water content. Data from the High-Speed Imager (HSI), the Backscatter Cloud Probe with Polarisation Detection (BCPD), and other probes are used as complementary observations to support the interpretation of the in-situ cloud measurements.
Table 3Scientific instrumentation aboard the SAFIRE ATR 42 aircraft during the SENS4ICE-EU campaign.
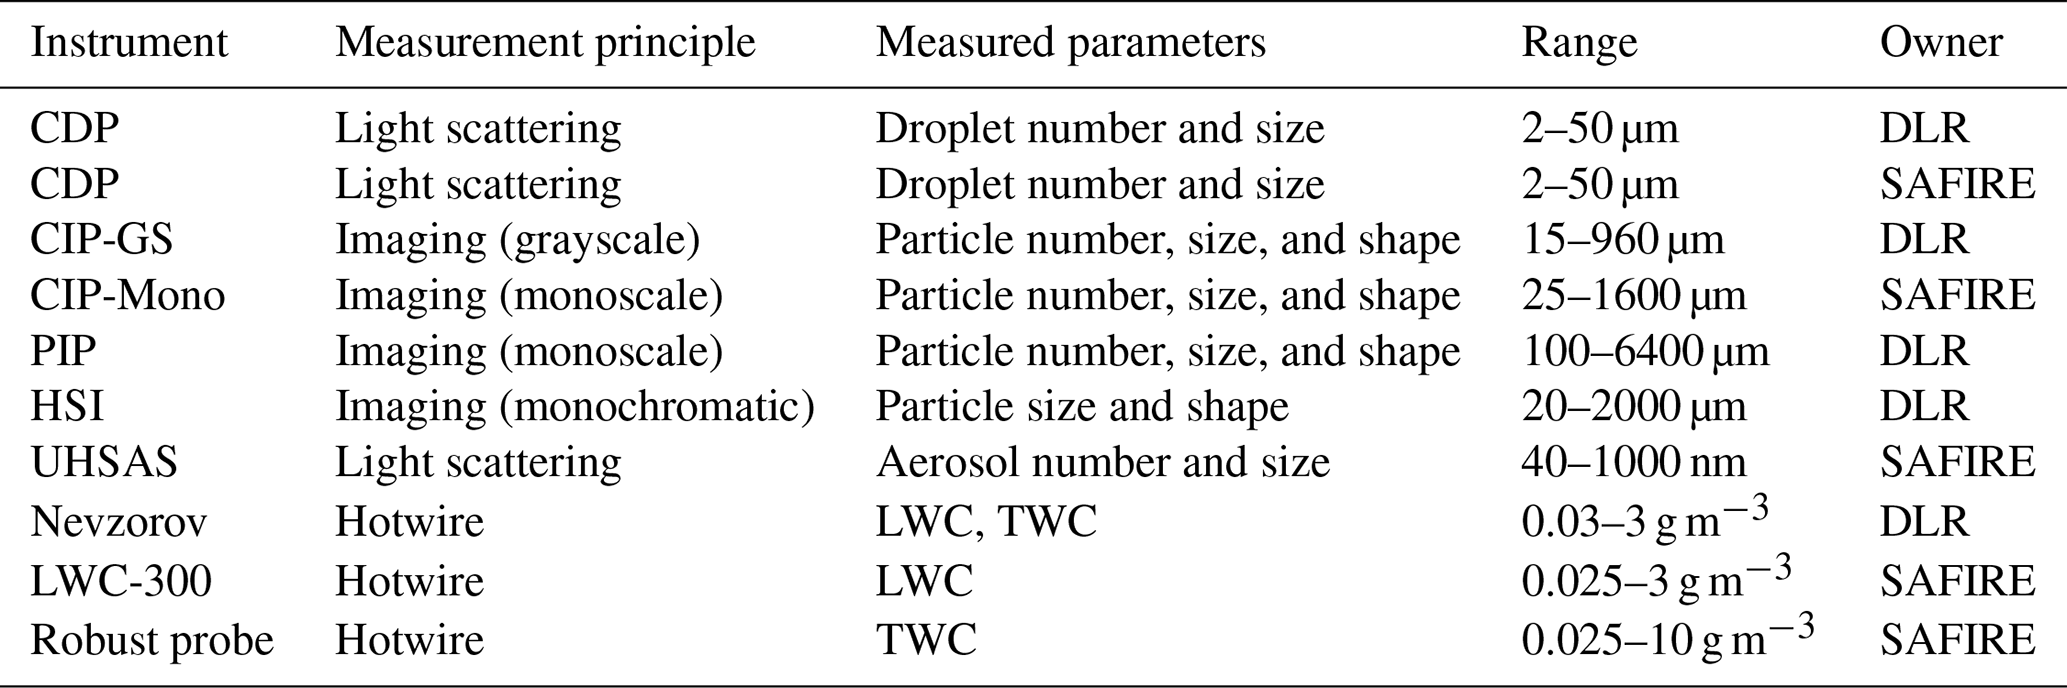
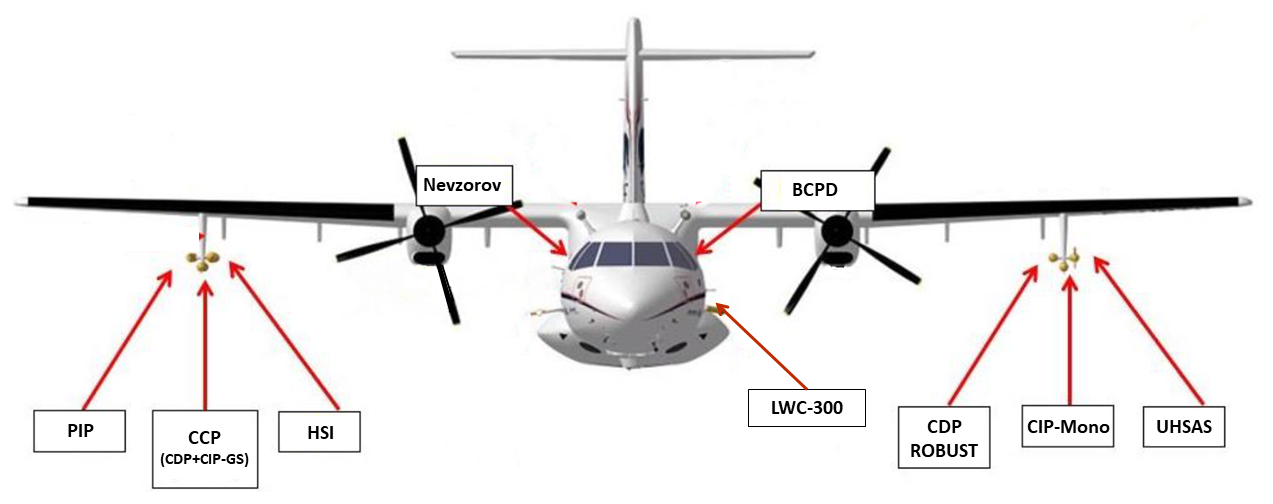
Figure 3Location of cloud instruments on the ATR 42. In total, the aircraft carried 6 underwing cloud probes and 2 fuselage-mounted instruments.
4.1 Cloud Droplet Probe
Two Cloud Droplet Probes (CDP) were installed on the SAFIRE ATR 42 aircraft, integrated into a Cloud Combination Probe (CCP) under the right wing, and the other was incorporated into the same canister as the CDP Robust probe under the left wing. The calibration and binning have been done according to the procedure described in Kleine (2019).
The CDP is an open-path forward scattering probe for measuring individual droplets with diameters between 2 and 50 µm (Lance et al., 2010; Lance, 2012; Faber et al., 2018). It uses a laser operating at a wavelength of 658 nm. Light scattered in the forward direction by each droplet is collected within an angular range of 4 and 12°. The droplet size is determined based on the Mie theory, which establishes a relationship between the scattered light intensity and particle diameter (Mie, 1908).
For ice particles, the forward-scattered intensity also depends on ice crystal shape and orientation. While the CDP can detect ice crystals, it is generally not suitable for deriving ice crystal sizes (Jang et al., 2022). Due to lower instrument sensitivity for ice crystals and their rapid growth in mixed-phase clouds driven by the Bergeron-Findeisen process (Pruppacher and Klett, 2010), particles detected within the CDP size range are assumed to be liquid. The true airspeed measured by the SAFIRE aircraft instrumentation was used to correct the CDP number concentration measurements.
4.2 Optical Array Probes
The SAFIRE ATR 42 carried two Cloud Imaging Probes (CIP), one of which forms the second component of the CCP, the second one owned as a standalone instrument. The CIP is an optical array probe (OAP) (Knollenberg, 1970) that measures particle size and shape for particles (Baumgardner et al., 2017). It has been described in various publications, e.g. Braga et al. (2017); O'Shea et al. (2019); De La Torre Castro et al. (2023); Lucke (2024). The DLR-operated probe is a grayscale CIP (CIP-GS) with a resolution of 15 µm, and the SAFIRE-operated probe is a monoscale CIP (CIP-mono), with a resolution of 25 µm. The CIP-GS differentiates between four different degrees of shadowing (unshadowed, more than 25 % shadowed, more than 50 % shadowed, and more than 75 % shadowed). Thus, every pixel is represented by a 2-bit value. The CIP-mono, on the other hand, only differentiates between unshadowed (i.e. less than 50 % shadowed) and shadowed pixels, thus each pixel can be represented by one bit. Both probes contain Korolev tips in order to reduce the effects of ice shattering (Korolev et al., 2013) and have a 658 nm laser. The imaging threshold set in CIP-GS is 50 %, meaning at least one 50 % pixel should exist in the image to be recorded. Additionally, the probe air speed (PAS) (Weigel et al., 2016) value is set to 120 m s−1 to avoid wrong recording due to icing or malfunctioning of the pitot tube. This value was deliberately set higher than the actual PAS to ensure that particles could always be imaged with a sufficiently high sampling rate and thus resolution, regardless of the flight conditions. Otherwise, the probe may have missed important features of the particles if the sampling rate was lower than the flight speed.
For larger particle size ranges, the Precipitation Imaging Probe (PIP) was aboard the aircraft. The PIP measures sizes between 100 and 6400 µm with a resolution of 100 µm. Thus, it allows for measuring larger ice crystals, snowflakes and raindrops compared to the CIP. The wider arm separation of the probe also allows for sampling of higher volumes The PIP used in the SENS4ICE-EU campaign is a monoscale probe and has been used during several previous flight campaigns (Weigel et al., 2016; Mech et al., 2022; Moser et al., 2023; Voigt et al., 2017; Jurkat-Witschas et al., 2025). The PIP also contains Korolev tips like the CIP and has a 658 nm laser.
4.3 High-Speed Imaging (HSI) Probe
The High-Speed Imaging probe developed by Artium Technologies Inc. was deployed during the campaign to address key limitations of OAPs, particularly issues related to DOF and out-of-focus particles (Esposito et al., 2019). The probe captures high-resolution 2D shadow images of cloud particles, enabling the retrieval of size distribution, thermodynamic phase (through shape analysis), number concentration, and LWC. In contrast to the single-beam configuration of OAPs, the HSI operates using a multi-beam illumination principle with six lasers at 860 nm, each equipped with a beam expander and collimator, converging at a common focal point that defines the sample volume. The overlapping shadows of particles at this focal point are captured by a CMOS sensor, producing 1624×1240 pixel monochromatic images with 256 grayscale levels and a pixel resolution of 3 µm. From the recorded images, particles are selected based on predefined filter settings and identified as “blobs”, meaning they are isolated as images composed exclusively of the pixels assigned to the respective particle.
The probe was set at a frame rate of 100 Hz to prevent memory buffer overflow during high-concentration cloud encounters. Instrument operation and data evaluation were performed using the manufacturer-provided AIMS (Artium Integrated Management System) software. An adaptive threshold was selected as the image processor type, and the camera mode was used for image acquisition instead of the trigger mode, such that the camera operated continuously at the selected frame rate. This operating mode is recommended by the probe manufacturer to avoid data loss.
4.4 Hotwire Probes
During the campaign, three hot-wire probes were deployed: the Nevzorov probe, the LWC-300 probe, and the Robust probe. The LWC-300 (Droplet Measurement Technologies, 2018) is equipped with a cylindrical collector that measures liquid water content (LWC), as ice crystals are assumed to rebound from the sensor surface after impact and therefore do not significantly contribute to the measurement. In contrast, the Robust probe (Science Engineering Associates, Inc., 2026) uses a single concave collector and measures total water content (TWC).
The Nevzorov probe was equipped with an SN500 sensor head consisting of one LWC sensor, two TWC sensor cones (TWC1: 8 mm and TWC2: 12 mm), and one reference sensor to measure the dry-air term (Lucke et al., 2022b). The LWC sensor has a cylindrical geometry designed to efficiently collect droplets, while the TWC sensors feature concave cones optimised for the collection of both droplets and ice particles. The reference sensor is shielded from particle impacts and therefore measures only convective heat losses. The probe determines cloud water content from the electrical power required to compensate for heat losses caused by evaporation on the collector sensor. A detailed description of the measurement principle is given in Korolev et al. (1998b).
Lucke et al. (2022b) showed that the 12 mm TWC cone exhibits higher droplet collection efficiency for large droplets than the 8 mm cone and is therefore used as the primary sensor. For smaller droplets, the collection efficiency of the TWC sensors is corrected using information from the particle size distribution. A comparison of the Nevzorov probe specifications with the other hot-wire sensors onboard the aircraft is provided in Table 4, while an intercomparison of the measurements from the hot-wire probes is presented in Lucke et al. (2025).

5.1 Data evaluation of hotwire instruments
The three hotwire instruments (LWC-300, Robust probe and Nevzorov probe) were evaluated with a similar procedure. The procedure was established in Lucke (2024), and is summarised here with a focus on aspects relevant for data interpretation and uncertainties.
5.1.1 Removal of convective heat losses
Hotwire instruments determine total power consumption (Pt) needed to maintain a constant sensor temperature. Outside clouds, power is mainly lost to convective cooling by dry air (Pd). Inside clouds, additional power (Pw) is required to heat and evaporate impinging droplets or ice. Thus, to derive the cloud water content (LWC and TWC), Pd must be subtracted from Pt (King et al., 1978).
The magnitude of Pd depends on flight parameters like airspeed, temperature, and pressure (Korolev et al., 1998b). For estimation, the flight data were first separated into in-cloud and out-of-cloud segments based on the variability of the measured power signal, using thresholds adapted to the sampling frequency of each instrument (Lucke, 2024). These segments are grouped into bins by flight conditions (4 m s−1 airspeed, 3 °C temperature, 20 hPa pressure), averaged, and interpolated across three dimensions. The uncertainty of Pd is evaluated through the standard deviation within each bin. Errors in Pd significantly affect LWC and TWC estimates, especially for sensors like the LWC-300 or the Robust probe that have lower ratios. A 2 % error in Pd can lead to a 7 % error in LWC for the LWC-300, and 2 %–2.5 % for TWC cones (Lucke et al., 2022a). To address unexplained jumps in Pd, particularly in the Robust probe, a local adjustment method is applied to correct for transient disturbances, such as airflow blockage from ice formation, based on rolling standard deviations and interpolation. A similar technique improves LWC-300 data, despite no ice buildup being expected.
5.1.2 Collision and capture efficiencies
In addition to uncertainties due to convective heat losses, hotwire measurements are influenced by the efficiency with which particles collide with and are retained by the sensor. Collision efficiency depends on particle size, sensor geometry, airspeed, and air properties and primarily affects small droplets (Langmuir and Blodgett, 1946; Korolev et al., 1998b; Strapp et al., 2003; Lucke et al., 2022a; Lucke, 2024; Esposito et al., 2023). Capture efficiency describes the fraction of liquid or ice mass retained by the sensor after impact and becomes relevant for large droplets, particularly under SLD conditions (Schwarzenboeck et al., 2009). Due to remaining uncertainties in published values (Strapp et al., 2003; Lucke et al., 2022a), no corrections for collision or capture efficiency were applied. The published hotwire measurements therefore represent uncorrected values, allowing informed users to apply suitable efficiency corrections if required.
5.2 Data evaluation of imaging probes
The CIP and PIP collect both 1D raw datasets and 2D shadow images of cloud particles. For a detailed evaluation of cloud microphysical properties, 2D images are primarily used. However, this image data requires correction to ensure accurate measurements. In-house code written in Python is used for processing the data (De La Torre Castro, 2024; Lucke, 2024). The cloud data evaluation procedure is described in Lucke et al. (2025) and is also presented here.
5.2.1 Processing of the image data
A correct representation of the image size is based on the trigger for recording of array frames, which is based on the preset particle air speed. If this deviates from the real speed of air in the sampling volume, the images will be displayed either squeezed or elongated. As explained in the previous section, the particle air speed (PAS) was fixed at 120 m s−1 throughout the campaign. To account for deviations from actual flight conditions and ensure accurate sampling volumes for particle concentration measurements, the true airspeed (TAS) data from the SAFIRE database were used. A correction factor was calculated as the ratio of instantaneous TAS to the fixed PAS value. This factor was then used to narrow particle images when TAS was lower than PAS, therefore preserving the accuracy of size estimations.
Once the images were corrected for PAS effects, further processing was required to filter out artefacts and non-physical particles (noise). Several filters were applied to the particle-by-particle data. Particles that were partially out of the image frame were excluded by checking whether 50 % grayscale border pixels were present, as size and phase estimation are only possible with fully imaged particles (Knollenberg, 1970). Stuck bits, which produce long linear artefacts, were filtered by detecting particles with a high aspect ratio at a single grayscale level, typically 25 % or 50 %. Particles with very low grayscale pixel counts, defined as less than 5 % at 25 % level or less than 10 % at 50 % level, were removed to eliminate noise. Extremely small particles, with a width or height of 1 to 2 pixels, were discarded because their physical properties cannot be reliably inferred. Particles with these sizes are instead measured by the CDP. Particles lacking characteristic cloud features, such as those composed entirely of 50 % grayscale pixels or having extreme aspect ratios, were also excluded. Coincident droplets in image frames are detected, separated, and merged back to the dataset. A dead-time correction (Gurganus and Lawson, 2018) was also tested, but it had only a negligible influence on the derived particle concentrations and was therefore not applied.
After the particles had been filtered and non-relevant data removed, the remaining shadow images were processed using the in-house 2D particle image analysis software described in Kirschler (2023). This software provides an extended set of image-derived particle parameters such as the size of the Poisson's spot, the aspect ratio at each grayscale level, and the sphericity of the particle shape. The additional parameters support a more detailed discrimination between droplets, ice particles, and image artefacts, which is particularly important for the reliable identification of SLDs in the present study. For spherical particles below 500 µm, the Korolev correction (Korolev et al., 1998a) was applied to improve the sizing of droplets affected by diffraction and DOF effects. For the sizing of ice crystals, the maximum diameter enclosing the particle shadow is used. This is consistent with the diameter that is required for the parametrization of the effective diameter (ED) and ice mass according to Baker and Lawson (2006). The maximum diameter is also used in the determination of the DOF. However, this approach may lead to a slight overestimation of the DOF, since particles are not necessarily aligned with their longest axis parallel to the laser beam.
5.2.2 Selection of particle rejection mode for CIP
A crucial aspect of interpreting CIP data accurately is the appropriate selection of the depth of field (DOF), which defines the volume from which particles are properly sized. The DOF affects both the precision of the measurements and the number of particles analysed. If the DOF is too large, out-of-focus particles are included, potentially leading to errors in phase discrimination, especially for droplets where sharp edges are needed for the identification. Conversely, a very small DOF may exclude valid particles, reducing statistical robustness. The DOF is calculated based on the coefficient c from the equation in Korolev et al. (1991). Building on this, Lilie et al. (2023) proposed three particle rejection modes corresponding to different c values: Mode 1 accepts particles with at least one pixel at 50 % shadow level (c=8.18), Mode 2 requires at least one pixel at 75 % level (c=3.68), and Mode 3 uses a ratio of , with a tighter DOF (c=0.9). Thus, Mode 1 has the widest DOF and includes more particles (including out-of-focus particles), while Mode 3 is the most restrictive, ensuring particles are well imaged.
Comparative analysis of the CIP modes and the Nevzorov probe’s water content measurements revealed that Modes 1, 2, and 3 yield nearly identical results for particles larger than approximately 100 µm. However, Mode 1 aligns better with the CDP at smaller droplet sizes as shown in Fig. 4. Based on this, a hybrid approach was adopted: Mode 1 is used for particles smaller than 90 µm, while Mode 3 is applied to larger particles. The 90 µm cutoff aligns with the instrument’s 15 µm resolution and reflects the point at which size discrimination and phase identification become more critical. Particles are assumed to be liquid below 90 µm, this threshold should be considered when compared to modelled dataset. For larger particles, Mode 3 ensures the particles are in focus and therefore suitable for detailed phase classification. This approach balances the need for high-quality measurements with statistical significance across the particle size spectrum.
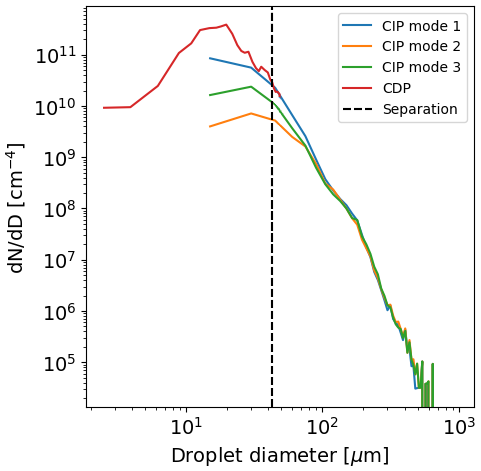
Figure 4Normalised size distribution derived from three CIP modes and CDP from a cloud encounter. The separation line is located at 43 µm, where the threshold between CDP and CIP is defined.
5.3 Combined size distributions
A combined size distribution from the CDP, CIP, and PIP is required for a comprehensive evaluation of particle size distribution between 2 and 6400 µm. Given the overlapping measurement ranges of the probes, thresholds are required to merge the individual size distributions. The threshold between the CDP and CIP was set to 43 µm. This value was chosen because, considering the 15 µm resolution of the CIP, only particles with a minimum size of three pixels, corresponding to 45 µm, were used in the evaluation. This avoids using the lowest two CIP size bins, which have low image resolution and larger uncertainties due to the small DOF. The threshold between the CIP and PIP was set to 600 µm. This value avoids using PIP particle images with less than six pixel widths, while also limiting the use of CIP images for particles larger than 600 µm, for which the requirement of fully imaged particles reduces sampling statistics because the particle size exceeds more than half of the CIP array width. Therefore, the selected thresholds are based on the optical resolution, image quality, depth-of-field uncertainty, and sampling statistics of the individual probes.
After the probe-specific corrections, logarithmic interpolation between bin centres was applied to the combined size distribution to obtain a 1 µm size resolution, following Cober and Isaac (2012). From the resulting distributions, cumulative volume distributions were calculated to derive the cloud microphysical properties. For liquid droplets, the effective diameter is calculated as the ratio of the third to the second moment of the size distribution. This quantity is physically meaningful because droplets are assumed to be spherical, making the third moment proportional to particle volume and therefore mass. The liquid water content is obtained by integrating droplet mass over the probe sample volume using the measured number concentration and particle size information. The median volume diameter is defined as the diameter at which 50 % of the cumulative volume is reached, while the maximum droplet diameter is represented by the 99th percentile of the cumulative volume distribution (VD99) to reduce the influence of outliers.
Ice-phase microphysical properties are derived from the non-spherical particle size distributions measured by the OAPs for particles larger than 90 µm. The effective diameter is defined as the maximum diameter as explained previously. Ice water content is determined by summing particle mass derived from least squares fit with respect to the projected area, which is an area-to-mass parametrization described in Baker and Lawson (2006).
Together with the 1 Hz data, the combined data of the water content and size is averaged in sequential 15 s intervals, corresponding to a horizontal length scale of 1.8 ± 0.15 km assuming an average aircraft speed of 120 m s−1. Time averaging ensures statistically robust size distributions. 15 s of averaging time is chosen because it represents a short averaging scale compared to the cloud extension and provides sufficient measurement data for statistical significance (Cober et al., 2003). Computed values represent the running average in the s intervals to provide continuous values of the parameters.
5.4 Discussion on the uncertainties
Uncertainties in particle number concentration and sizing primarily arise from counting statistics, probe sampling characteristics, and particle imaging limitations. For the CDP, scattering intensity generally increases with droplet diameter. However, the relationship is not strictly monotonic due to Mie ambiguities and exhibits oscillations, which lead to increased sizing uncertainties for droplets smaller than 20 µm (Lance et al., 2010). A comprehensive analysis of these uncertainties is provided by Faber et al. (2018). Additionally, Baumgardner et al. (2017) estimate uncertainties between 10 % and 30 % for counting and between 10 % and 50 % for sizing, with relative uncertainties generally decreasing toward larger particle sizes.
For OAPs, including the CIP and PIP, uncertainty estimates depend on particle size, phase, concentration, particle shape, image quality, and the applied processing method. Baumgardner et al. (2017) estimate uncertainty ranges between 10 % and 100 % for both particle counting and sizing, reflecting the complexity of OAP error estimation. The uncertainties reported here are therefore interpreted as representative relative uncertainties for the processed dataset, rather than as absolute errors or size-resolved uncertainty estimates. The applied corrections and the use of the particle rejection mode in the CIP processing are expected to reduce uncertainties in both sizing and concentration measurements. For droplets, sizing uncertainties are reduced by the Korolev correction, whereas larger uncertainties remain for ice particles due to their irregular shapes. Additional sizing uncertainties arise from DOF effects, pixel-resolution discretisation, and assumptions related to particle shape (Baumgardner et al., 2017; Vaillant de Guélis et al., 2019). The relative sizing uncertainty generally decreases with increasing particle size and increases for smaller particles. Combining measurements from the CDP, CIP, and PIP further reduces the influence of uncertain size ranges by excluding those with the highest uncertainty from the merged particle size distribution.
5.5 Assessment of icing environments
To identify icing conditions during the flights, the recorded in situ measurements were analysed to detect cloud encounters corresponding to Appendix O icing environments containing SLD. The classification is based on a set of criteria involving ambient temperature, liquid water content, ice crystal concentration, droplet size characteristics, and the relative contribution of large droplets to the total water content. A detailed description and justification of the applied criteria are provided by Lucke et al. (2025). In brief, the filters ensure that the detected encounters occur at sub-freezing temperatures, contain sufficient liquid water, are not dominated by ice crystals, and include a significant fraction of SLD. All parameters except the static ambient temperature (SAT) were evaluated using 15 s averages, and each encounter was required to persist for at least 5 s to avoid rapidly varying cloud conditions. Encounters that do not meet the Appendix O criteria but exhibit liquid water content exceeding 0.025 g m−3 at temperatures below 0 °C are classified as Appendix C icing conditions.
Figure 5 summarises the flight time spent in different cloud environments for each flight, including freezing drizzle, small-droplet icing, and mixed-phase conditions. Freezing drizzle corresponds to the Appendix O icing encounters identified using the criteria mentioned above, as freezing rain was not observed during the campaign. Small-droplet icing refers to encounters at sub-freezing temperatures where droplet sizes are characterised by VD99 values below 100 µm. Mixed-phase conditions are identified when liquid water is present together with elevated ice crystal concentrations exceeding 1 L−1.
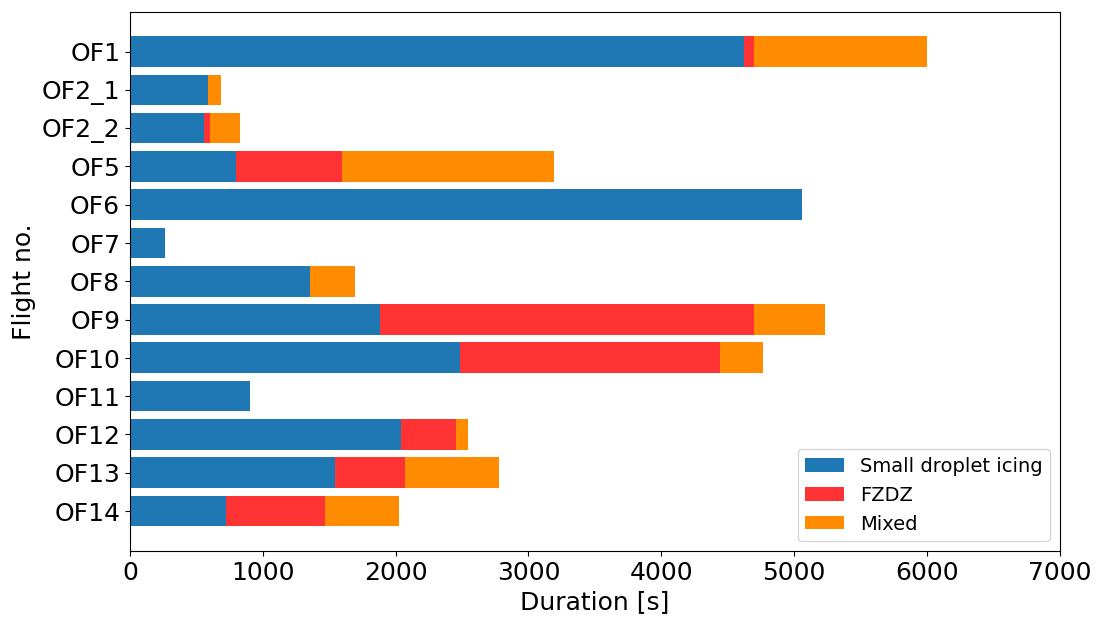
Figure 5Duration of measurements (in s) in small droplet icing, freezing drizzle (FZDZ), and mixed-phase conditions in each flight of the campaign. Small droplet icing conditions were encountered during all flights and were sampled at the highest frequency. The figure is adapted from Lucke et al. (2024).
For each flight of the SENS4ICE-EU campaign, the data are archived in the HALO Database (HALO-DB) (Menekay et al., 2026) as a set of associated datasets linked to the corresponding flight entry. These associated datasets comprise a merged cloud dataset, particle size distribution (PSD) datasets, and particle-by-particle image property data from the HSI instrument.
The primary product for each flight is the merged cloud dataset, provided in NASA Ames format and additionally in NetCDF3 format. These datasets are identified by the filename SENS4ICE EU Cloud Dataset [flight number] [HALO-DB name]. They contain 1 Hz in-situ measurements of cloud microphysical properties, including cloud particle number concentrations, liquid and ice water content estimates, particle size metrics (MVD and ED), and icing indicator flags. Each data record is time-stamped and accompanied by aircraft and atmospheric data such as static air temperature, true airspeed, altitude, geographic position (latitude and longitude), and three-dimensional wind components. A detailed overview of the variables included in the cloud dataset, grouped by instrument and data product, is provided in Table 5.
Table 5Structure of the dataset and parameters. Time-averaged parameters are not shown in this table to save space.
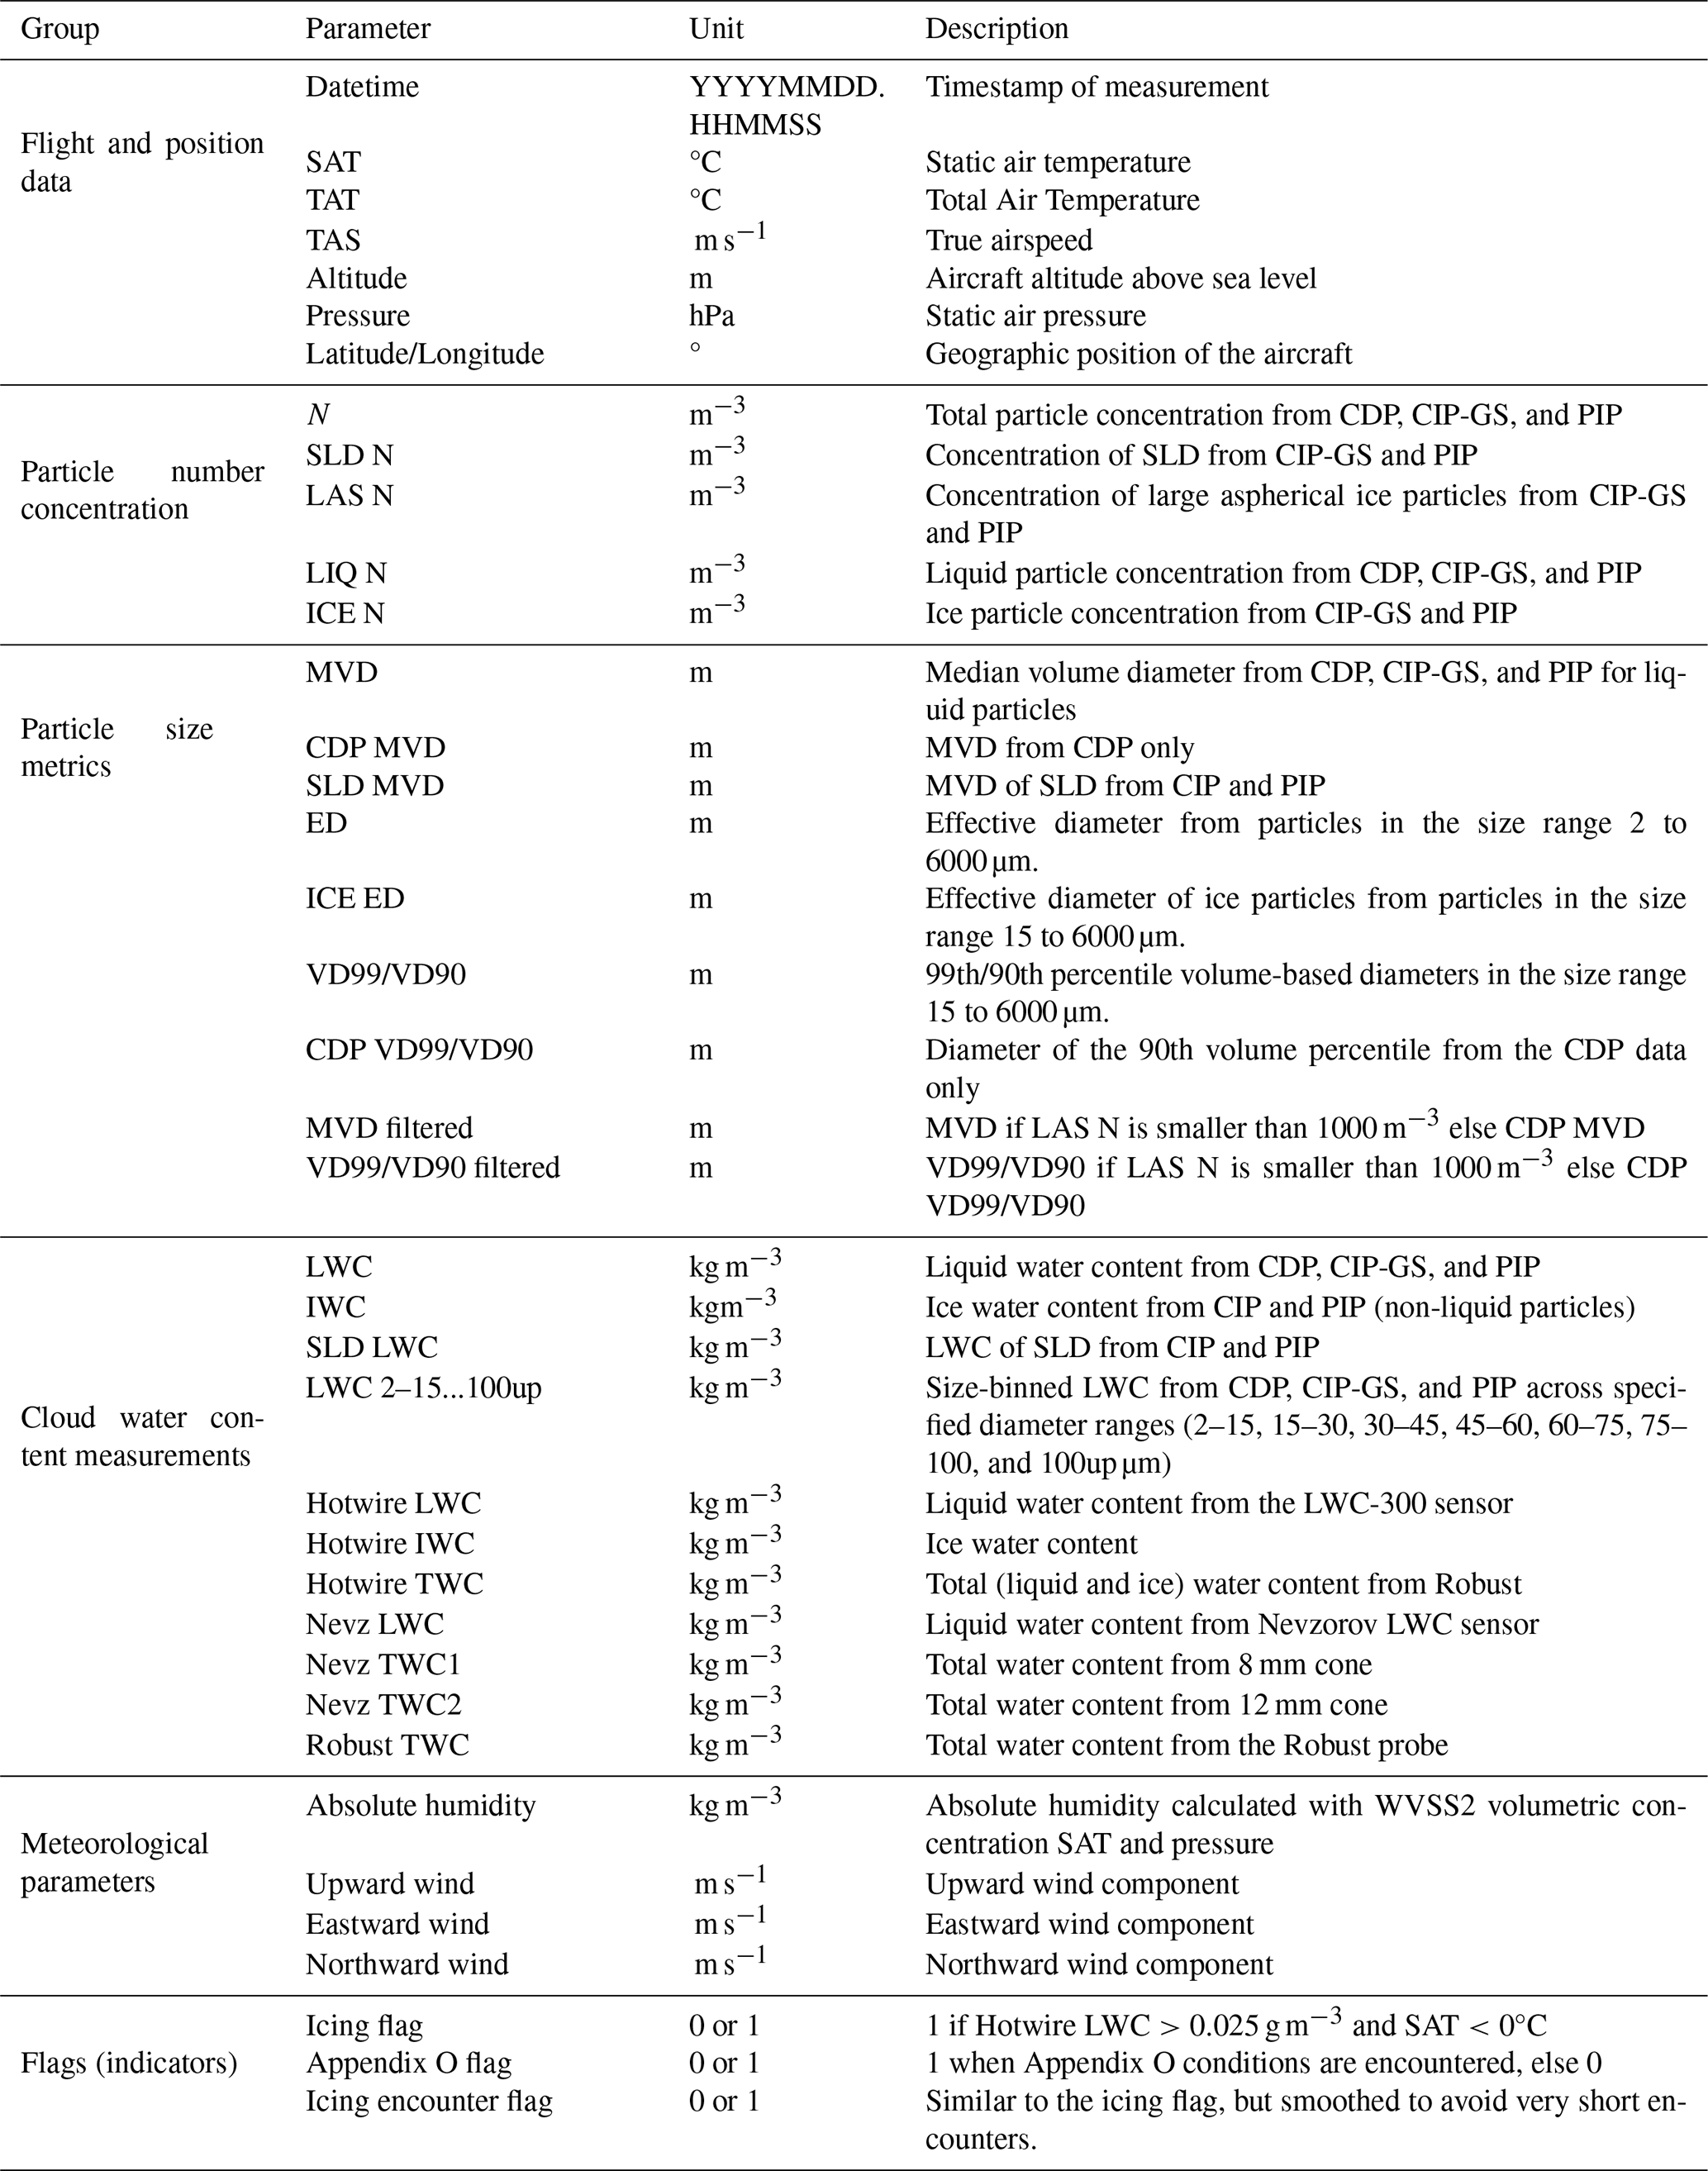
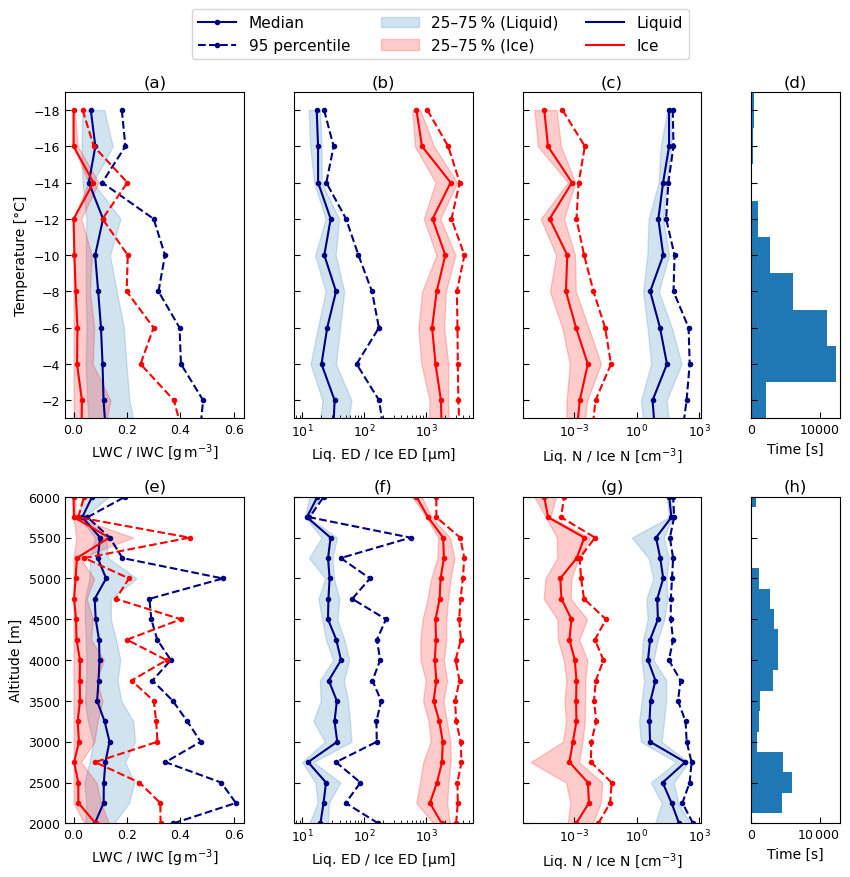
Figure 6Distribution of (a, e) LWC in blue and IWC in red, (b, f) ED, and (c, g) N observations, sorted into 2 °C temperature and 250 m altitude bins. The histogram in (d), (h) shows the total frequency of observations per temperature bin for each group. Thicker solid lines represent the median values per temperature bin, while dashed lines indicate the 95th percentile. Shaded areas highlight the interquartile range, covering the 25th and 75th percentiles of the measurements.
Cloud Particle size distribution data are provided as two separate associated datasets in NASA Ames format. The dataset SENS4ICE-EU PSD all [flight number] [HALO-DB name] contains total particle size distributions, including both liquid and ice particles, expressed as number concentration per unit size (ddD) across 118 size bins covering particle diameters from 2 to 6400 µm at a temporal resolution of 1 Hz. The dataset SENS4ICE-EU PSD liquid [flight number] [HALO-DB name] provides the particle size distribution of only spherical particles, thus mainly liquid.
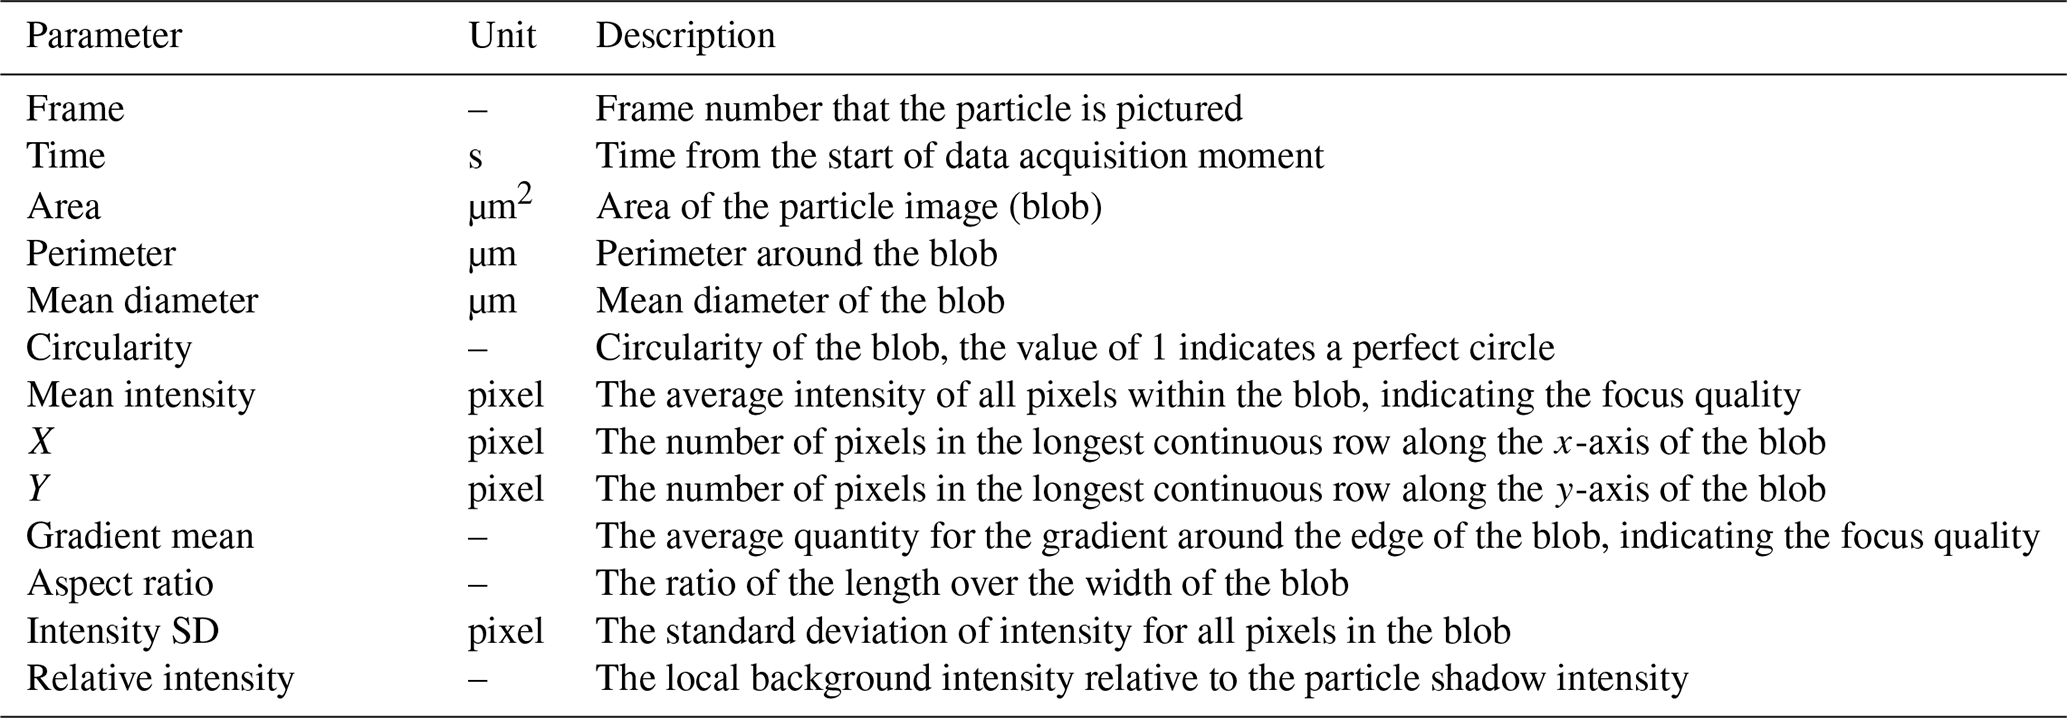
Particle-by-particle measurements from the High-Speed Imager are provided as a separate associated dataset, SENS4ICE-EU HSI [datetime of the start of recording] Valid Blobs Table]. This dataset contains all valid (in-focus) particles and includes properties such as detection time, projected area, perimeter, aspect ratio, focus quality, and particle size metrics. Only particles meeting the applied quality criteria (IntensityMean ≤ 150, GradientMean ≥ 200, and MeanDiameter ≥ 10 µm) are included. A complete list of variables provided in the HSI dataset is given in Table 6.
Table 6Structure of the dataset and parameters in the HSI files.
Figures 6–8 provide an overview of the cloud microphysical properties observed during the SENS4ICE-EU campaign and illustrate key characteristics of the dataset. Figure 6 presents the temperature and altitude dependent distributions of cloud microphysical parameters derived from all cloud encounters during the campaign. Blue profiles represent liquid-phase properties, while red profiles indicate ice-phase measurements. Panels (a)–(c) show liquid and ice water content (LWC and IWC), effective diameter (ED), and number concentration (N) as functions of temperature, while panels (e–g) present the same parameters as functions of altitude. The corresponding histograms in panels (d) and (h) indicate the sampling duration within the respective temperature and altitude bins. The results show that most observations were obtained within the temperature range from approximately −2 to −12 °C, indicating that statistical distributions are most robust within this interval.
Figure 6 shows cumulative mass distributions calculated from the mean particle size distributions for different cloud thermodynamic regimes encountered during the campaign, including supercooled large droplets, supercooled small droplets (SSD), mixed-phase, and liquid-only encounters. The corresponding MVD of the mean distributions are 45.63 µm for SLD, 23.39 µm for SSD, 36.77 µm for mixed-phase, and 33.96 µm for all liquid-only encounters, illustrating the larger characteristic droplet sizes associated with SLD conditions.
Figure 8 illustrates joint distributions between selected cloud microphysical parameters derived from all cloud encounters. Panel (a) shows the relationship between effective diameter (ED) and droplet number concentration (N), while panel (b) presents liquid water content (LWC) as a function of median volume diameter (MVD). The color shading represents the number of observations within logarithmically spaced bins, highlighting the typical ranges and variability of these parameters in the dataset.
Air motions are also relevant for understanding the microphysical variability and the occurrence of SLD conditions. Figure 9 provides dynamical context for the observed cloud microphysical variability by showing the distribution of vertical wind speed derived from the five-hole radome measurements. The distribution is centred close to 0 m s−1, with a median of 0.25 m s−1, indicating that most cloud encounters occurred in weak vertical motion. However, the positive tail shows that some cloud regions were associated with enhanced upward motion, which can promote condensational growth and support the maintenance of supercooled liquid water. The Appendix O subset follows a similar distribution, suggesting that SLD conditions were not limited to the strongest updrafts but occurred over a range of dynamical conditions.
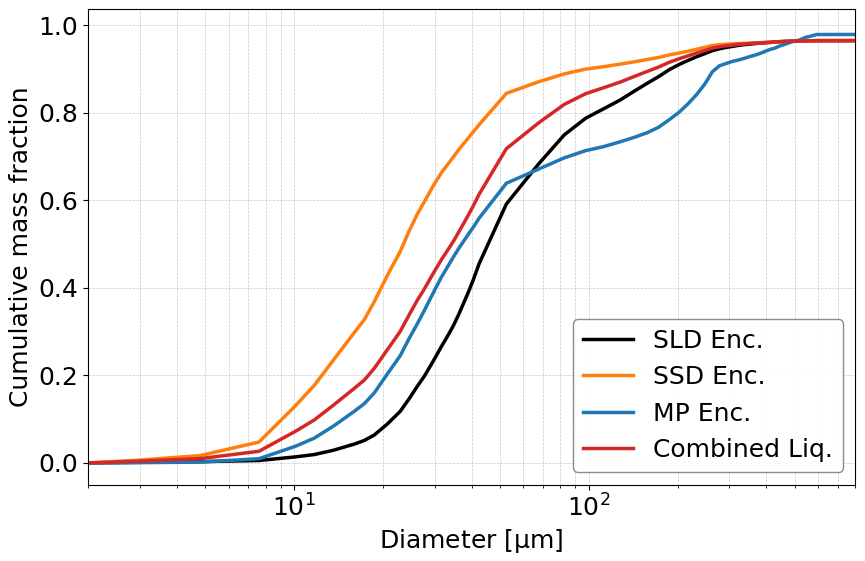
Figure 7Cumulative mass distributions for the mean of supercooled large droplets (SLD), supercooled small droplets (SSD), mixed-phase encounters, and liquid (supercooled) encounters.
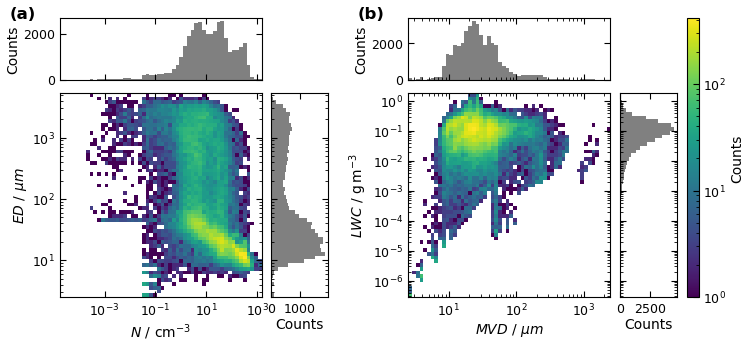
Figure 8Joint distributions of ED versus N (a) and LWC vs MVD (b) from the cloud encounters during the campaign, color coded by their occurrence.
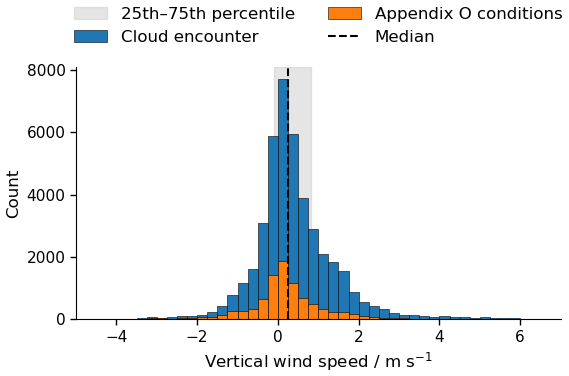
Figure 9Distribution of vertical wind speed derived from the five-hole radome measurements during cloud encounters. Blue bars show the cloud-encounter dataset, while orange bars indicate the subset fulfilling Appendix O icing conditions.
The datasets for this study are available at the HALO database (Menekay et al., 2026, https://halo-db.pa.op.dlr.de/mission/146, last access: 3 August 2026) under the following DOI: https://doi.org/10.17616/R39Q0T (Mission: SENS4ICE-EU, mission no. 146; Menekay et al., 2026). The cloud datasets are provided in both NASA Ames and NetCDF formats, with corresponding dataset IDs #11170–#11182 and #11274–#11286, respectively. The remaining datasets are provided in NASA Ames format: HSI datasets #11183–#11195, cloud PSDs #11196–#11208, and droplet PSDs #11210–#11221 and #11288. The cloud probe image dataset is available from the corresponding author upon request. Supporting aircraft and meteorological measurements from SAFIRE are available through the SAFIRE+/AERIS data centre (Bourdon and Schwarz, 2023). These include data from the CDP (https://doi.org/10.25326/477, Schwarz, 2023c), UHSAS (https://doi.org/10.25326/476, Schwarz, 2023d), CIP (https://doi.org/10.25326/481), ice accretion measurements (https://doi.org/10.25326/473, Schwarz, 2023e), LWC measurements (https://doi.org/10.25326/474, Schwarz, 2023f), radiation measurements (https://doi.org/10.25326/475, Schwarz, 2023g), thermodynamic and dynamic core parameters (https://doi.org/10.25326/478, Schwarz, 2023h), and aircraft navigation and platform characteristics at 10 and 1 Hz (https://doi.org/10.25326/479, Schwarz, 2023i; https://doi.org/10.25326/480, Schwarz, 2023j).
This paper presents a cloud microphysical dataset derived from in-situ measurements collected by in-situ cloud probes during the SENS4ICE-EU flight campaign conducted in April 2023, based in Toulouse. The instruments were primarily operated as reference sensors for the validation of aircraft icing conditions and the development of new icing detection technologies. Beyond this primary objective, the observations provide a valuable resource for a broad range of scientific applications, including weather and climate research, atmospheric cloud modelling, and improved understanding of the occurrence and characteristics of in-flight icing conditions. The dataset mainly provides properties of mid-level icing clouds of both continental and marine origin above Europe at altitudes between 2 and 6 km and temperatures between 0 and −18 °C. The resulting dataset is intended to support future investigations of aircraft icing environments and cloud microphysical processes, as well as the evaluation and improvement of numerical weather prediction and climate models, particularly with respect to the representation and prediction of SLD icing conditions.
TJW conceived the project, led and organised the flight campaign, coordinated the scientific activities, and supervised the data analysis and interpretation. JL prepared the cloud microphysics instrumentation for the campaign, calibrated the instruments, developed the data evaluation protocols, evaluated the hotwire probe data, and generated the combined size distributions. DM contributed to data collection during the campaign, evaluated the imaging probe data, and prepared the dataset for public release. SK supported the data evaluation procedures and assisted with data collection. CV supervised the project and provided scientific guidance and feedback on the manuscript. AB contributed to the organisation of the flight campaign, provided the aircraft platform and SAFIRE data. All authors contributed to the manuscript.
The contact author has declared that none of the authors has any competing interests.
Publisher's note: Copernicus Publications remains neutral with regard to jurisdictional claims made in the text, published maps, institutional affiliations, or any other geographical representation in this paper. The authors bear the ultimate responsibility for providing appropriate place names. Views expressed in the text are those of the authors and do not necessarily reflect the views of the publisher.
The authors would like to express their gratitude to the SAFIRE team for their efforts in making this campaign possible, and to Météo-France for their valuable contributions to flight planning through weather forecasting support. The authors thank Carsten Schwarz for his role as campaign Principal Investigator, Bern Bernstein for his support as a consultant, and Christoph Kiemle for conducting the internal review. Airborne data was obtained using the aircraft managed by SAFIRE, the French facility for airborne research, an infrastructure of the French National Center for Scientific Research (CNRS), Météo-France and the French National Center for Space Studies (CNES). Distributed data are processed by SAFIRE.
The SENS4ICE project has been funded by the European Union's Horizon 2020 Programme for Research and Innovation under grant agreement number 824253 (SENS4ICE). Furthermore, research performed as part of this work has received funding from the German Research Foundation (DFG, Deutsche Forschungsgemeinschaft) under the Priority Program SPP 1294 HALO Vol1504/101 no. 522359172.
The article processing charges for this open-access publication were covered by the German Aerospace Center (DLR).
This paper was edited by Montserrat Costa Surós and reviewed by two anonymous referees.
Baker, B. and Lawson, R. P.: Improvement in Determination of Ice Water Content from Two-Dimensional Particle Imagery. Part I: Image-to-Mass Relationships, J. Appl. Meteorol. Clim., 45, 1282–1290, https://doi.org/10.1175/jam2398.1, 2006. a, b
Baumgardner, D., Abel, S. J., Axisa, D., Cotton, R., Crosier, J., Field, P., Gurganus, C., Heymsfield, A., Korolev, A., Krämer, M., Lawson, P., McFarquhar, G., Ulanowski, Z., and Um, J.: Cloud Ice Properties: In Situ Measurement Challenges, Meteorol. Monogr., 58, 9.1–9.23, https://doi.org/10.1175/amsmonographs-d-16-0011.1, 2017. a, b, c, d
Bony, S., Lothon, M., Delanoë, J., Coutris, P., Etienne, J.-C., Aemisegger, F., Albright, A. L., André, T., Bellec, H., Baron, A., Bourdinot, J.-F., Brilouet, P.-E., Bourdon, A., Canonici, J.-C., Caudoux, C., Chazette, P., Cluzeau, M., Cornet, C., Desbios, J.-P., Duchanoy, D., Flamant, C., Fildier, B., Gourbeyre, C., Guiraud, L., Jiang, T., Lainard, C., Le Gac, C., Lendroit, C., Lernould, J., Perrin, T., Pouvesle, F., Richard, P., Rochetin, N., Salaün, K., Schwarzenboeck, A., Seurat, G., Stevens, B., Totems, J., Touzé-Peiffer, L., Vergez, G., Vial, J., Villiger, L., and Vogel, R.: EUREC4A observations from the SAFIRE ATR42 aircraft, Earth Syst. Sci. Data, 14, 2021–2064, https://doi.org/10.5194/essd-14-2021-2022, 2022. a
Bourdon, A. and Schwarz, C.: SAFIRE+, the data portal of the French airborne research, https://safireplus.aeris-data.fr/fr/acces-donnees/?tab=1&id=SENS4ICE-2023 (last access: 12 March 2026), 2023. a, b
Braga, R. C., Rosenfeld, D., Weigel, R., Jurkat, T., Andreae, M. O., Wendisch, M., Pöhlker, M. L., Klimach, T., Pöschl, U., Pöhlker, C., Voigt, C., Mahnke, C., Borrmann, S., Albrecht, R. I., Molleker, S., Vila, D. A., Machado, L. A. T., and Artaxo, P.: Comparing parameterized versus measured microphysical properties of tropical convective cloud bases during the ACRIDICON–CHUVA campaign, Atmos. Chem. Phys., 17, 7365–7386, https://doi.org/10.5194/acp-17-7365-2017, 2017. a
Cober, S., Isaac, G., Shah, A., and Jeck, R.: Defining Characteristic Cloud Drop Spectra From In-situ Measurements, in: 41st aerospace sciences meeting and exhibit, p. 561, https://doi.org/10.2514/6.2003-561, 2003. a
Cober, S. G. and Isaac, G. A.: Characterization of Aircraft Icing Environments with Supercooled Large Drops for Application to Commercial Aircraft Certification, J. Appl. Meteorol. Clim., 51, 265–284, https://doi.org/10.1175/jamc-d-11-022.1, 2012. a
Deiler, C.: Performance-based ice detection-first results from sens4ice European flight test campaign, in: AIAA SciTech 2024 Forum, p. 2817, https://doi.org/10.2514/6.2024-2817, 2024. a
Deiler, C. and Sachs, F.: Design and Testing of an Indirect Ice Detection Methodology, in: SAE Technical Paper Series, SAE International, https://doi.org/10.4271/2023-01-1493, 2023. a
De La Torre Castro, E.: Microphysical properties and interplay of natural cirrus, contrail cirrus and aerosol at different latitudes, Ph.D. thesis, Delft University of Technology, https://doi.org/10.4233/uuid:1daa70eb-e8ac-4ee7-ad53-3bd87c2de258, 2024. a
De La Torre Castro, E., Jurkat-Witschas, T., Afchine, A., Grewe, V., Hahn, V., Kirschler, S., Krämer, M., Lucke, J., Spelten, N., Wernli, H., Zöger, M., and Voigt, C.: Differences in microphysical properties of cirrus at high and mid-latitudes, Atmos. Chem. Phys., 23, 13167–13189, https://doi.org/10.5194/acp-23-13167-2023, 2023. a
DiVito, S., Bernstein, B. C., Riley, J. T., Bond, T., Sims, D. L., Landolt, S. D., Haggerty, J. A., Wolde, M., and Korolev, A.: ICICLE: Winter 2018-19 In-Cloud Icing and Large-Drop Experiment, in: American Meteorological Society Meeting Abstracts, 99, 3–8, https://ams.confex.com/ams/2019Annual/webprogram/Paper351924.html (last access: 4 August 2026), 2019. a
Droplet Measurement Technologies: LWC-300/301 Liquid Water Content Sensor Operator’s Manual, dOC-0361, Revision C, https://www.dropletmeasurement.com/wp-content/uploads/2020/02/DOC-0361-Rev-C-LWC-300-301-Operator-Manual.pdf (last access: 4 August 2026), 2018. a
Esposito, B. M., Bachalo, W. D., Leroy, D., Schwarzenboeck, A., Jurkat, T., Voigt, C., and Bansmer, S.: Wind tunnel measurements of simulated glaciated cloud conditions to evaluate newly developed 2d imaging probes, Tech. rep., SAE Technical Paper, https://doi.org/10.4271/2019-01-1981, 2019. a
Esposito, B. M., Orchard, D., Lucke, J., Nichman, L., Bliankinshtein, N., Lilie, L., Catalano, P., D'Aniello, F., and Strapp, J. W.: Comparability of Hot-Wire Estimates of Liquid Water Content in SLD Conditions, in: SAE Technical Paper Series, SAE International, https://doi.org/10.4271/2023-01-1423, 2023. a
Faber, S., French, J. R., and Jackson, R.: Laboratory and in-flight evaluation of measurement uncertainties from a commercial Cloud Droplet Probe (CDP), Atmos. Meas. Tech., 11, 3645–3659, https://doi.org/10.5194/amt-11-3645-2018, 2018. a, b
Gonzalez, M. and Frövel, M.: Fiber Bragg Grating Sensors ice detection: Methodologies and performance, Sensors Actuat. A, 346, 113778, https://doi.org/10.1016/j.sna.2022.113778, 2022. a
Gurganus, C. and Lawson, P.: Laboratory and Flight Tests of 2D Imaging Probes: Toward a Better Understanding of Instrument Performance and the Impact on Archived Data, J. Atmos. Ocean. Tech., 35, 1533–1553, https://doi.org/10.1175/jtech-d-17-0202.1, 2018. a
Jang, S., Kim, J., McFarquhar, G. M., Park, S., Lee, S. S., Jung, C. H., Park, S. S., Cha, J. W., Lee, K., and Um, J.: Theoretical calculations of directional scattering intensities of small nonspherical ice crystals: Implications for forward scattering probes, Remote Sens., 14, 2795, https://doi.org/10.3390/rs14122795, 2022. a
Jurkat-Witschas, T., Lucke, J., Schwarz, C., Deiler, C., Sachs, F., Kirschler, S., Menekay, D., Voigt, C., Bernstein, B., Jaron, O., Kalinka, F., Zollo, A., Lilie, L., Mayer, J., Page, C., Vié, B., Bourdon, A., Lima, R. P., and Vieira, L.: Overview of Cloud Microphysical Measurements during the SENS4ICE Airborne Test Campaigns: Contrasting Icing Frequencies from Climatological Data to First Results from Airborne Observations, in: SAE Technical Paper Series, SAE International, https://doi.org/10.4271/2023-01-1491, 2023. a, b
Jurkat-Witschas, T., Voigt, C., Groß, S., Kaufmann, S., Sauer, D., De la Torre Castro, E., Krämer, M., Schäfler, A., Afchine, A., Attinger, R., Bartolome Garcia, I., Beer, C. G., Bugliaro, L., Clemen, H.-C., Dekoutsidis, G., Ehrlich, A., Grawe, S., Hahn, V., Hendricks, J., Järvinen, E., Klimach, T., Krüger, K., Krüger, O., Lucke, J., Luebke, A. E., Marsing, A., Mayer, B., Mayer, J., Mertes, S., Moser, M., Müller, H., Nenakhov, V., Pöhlker, M., Pöschl, U., Pörtge, V., Rautenhaus, M., Righi, M., Röttenbacher, J., Rubin-Zuzic, M., Schaefer, J., Schnaiter, M., Schneider, J., Schumann, U., Spelten, N., Stratmann, F., Tomsche, L., Wagner, S., Wang, Z., Weber, A., Wendisch, M., Wernli, H., Wetzel, B., Wirth, M., Zahn, A., Ziereis, H., and Zöger, M.: CIRRUS-HL: Picturing High-and Midlatitude Summer Cirrus and Contrail Cirrus above Europe with Airborne Measurements aboard the Research Aircraft HALO, B. Am. Meteorol. Soc., 106, E2300–E2327, 2025. a
King, W. D., Parkin, D. A., and Handsworth, R. J.: A Hot-Wire Liquid Water Device Having Fully Calculable Response Characteristics, J. Appl. Meteor. Climatol., 17, 1809–1813, https://doi.org/10.1175/1520-0450(1978)017<1809:AHWLWD>2.0.CO;2, 1978. a
Kirschler, S.: Effekte von Aerosol und Dynamik auf die Eigenschaften ozeanischer Wolken im Nordwestatlantik, Ph.D. thesis, Johannes Gutenberg-Universität in Mainz, https://doi.org/10.25358/openscience-9749, 2023. a
Kleine, J.: Flugzeuggetragene Messungen von Eis- und Rußpartikeln in Kondensstreifen bei Verwendung konventioneller und synthetischer Treibstoffe, Ph.D. thesis, Johannes Gutenberg-Universität Mainz, https://doi.org/10.25358/openscience-3574, 2019. a
Knollenberg, R. G.: The optical array: An alternative to scattering or extinction for airborne particle size determination, J. Appl. Meteorol., 86–103, https://doi.org/10.1175/1520-0450(1970)009<0086:TOAAAT>2.0.CO;2, 1970. a, b
Korolev, A., Emery, E., and Creelman, K.: Modification and tests of particle probe tips to mitigate effects of ice shattering, J. Atmos. Ocean. Tech., 30, 690–708, 2013. a
Korolev, A. V., Kuznetsov, S. V., Makarov, Y. E., and Novikov, V. S.: Evaluation of Measurements of Particle Size and Sample Area from Optical Array Probes, J. Atmos. Ocean. Tech., 8, 514–522, https://doi.org/10.1175/1520-0426(1991)008<0514:eomops>2.0.co;2, 1991. a
Korolev, A. V., Strapp, J. W., and Isaac, G. A.: Evaluation of the Accuracy of PMS Optical Array Probes, J. Atmos. Ocean. Tech., 15, 708–720, https://doi.org/10.1175/1520-0426(1998)015<0708:EOTAOP>2.0.CO;2, 1998a. a
Korolev, A. V., Strapp, J. W., Isaac, G. A., and Nevzorov, A. N.: The Nevzorov Airborne Hot-Wire LWC–TWC Probe: Principle of Operation and Performance Characteristics, J. Atmos. Ocean. Tech., 15, 1495–1510, https://doi.org/10.1175/1520-0426(1998)015<1495:tnahwl>2.0.co;2, 1998b. a, b, c
Lance, S.: Coincidence Errors in a Cloud Droplet Probe (CDP) and a Cloud and Aerosol Spectrometer (CAS), and the Improved Performance of a Modified CDP, J. Atmos. Ocean. Tech., 29, 1532–1541, https://doi.org/10.1175/jtech-d-11-00208.1, 2012. a
Lance, S., Brock, C. A., Rogers, D., and Gordon, J. A.: Water droplet calibration of the Cloud Droplet Probe (CDP) and in-flight performance in liquid, ice and mixed-phase clouds during ARCPAC, Atmos. Meas. Tech., 3, 1683–1706, https://doi.org/10.5194/amt-3-1683-2010, 2010. a, b
Langmuir, I. and Blodgett, K.: A mathematical investigation of water droplet trajectories, Army Air Forces Headquarters, Air Technical Service Command, https://doi.org/10.1016/B978-0-08-009362-8.50021-1, 1946. a
Lilie, L., Bouley, D., Sivo, C., Esposito, B., Bansemer, A., Heller, R., and Strapp, J. W.: A New 1D2D Optical Array Particle Imaging Probe for Airborne and Ground Simulation Cloud Measurements, Tech. rep., SAE Technical Paper, https://doi.org/10.4271/2023-01-1415, 2023. a
Lucke, J.: Detection and differentiation of supercooled large drop icing conditions, Ph.D. thesis, Delft University of Technology, https://doi.org/10.4233/uuid:ba16a451-2d55-4e96-b188-a7f6cf748f31, 2024. a, b, c, d, e
Lucke, J., Jurkat-Witschas, T., Heller, R., Hahn, V., Hamman, M., Breitfuss, W., Bora, V. R., Moser, M., and Voigt, C.: Icing wind tunnel measurements of supercooled large droplets using the 12 mm total water content cone of the Nevzorov probe, Atmos. Meas. Tech., 15, 7375–7394, https://doi.org/10.5194/amt-15-7375-2022, 2022. a, b, c, d
Lucke, J., Jurkat-Witschas, T., Heller, R., Hahn, V., Hamman, M., Breitfuss, W., Bora, V. R., Moser, M., and Voigt, C.: Icing Wind Tunnel Measurements of Supercooled Large Droplets Using the 12 mm Total Water Content Cone of the Nevzorov Probe: Measurement Data, Zenodo [data set], https://doi.org/10.5281/zenodo.6817112, 2022b. a, b
Lucke, J., Zollo, A. L., Bernstein, B., and Jurkat-Witschas, T.: SENS4ICE deliverable D4.3: Final report on airborne demonstration and atmospheric characterization, Tech. rep., https://doi.org/10.5281/zenodo.11520416, 2024. a, b
Lucke, J., Jurkat-Witschas, T., Menekay, D., Voigt, C., Bernstein, B. C., Jaron, O., Bourdon, A., and Garcia, G. S.: Microphysical properties of supercooled large droplet conditions in North America and Europe, Journal of Air Transportation, 1–20, https://doi.org/10.2514/1.D0469, 2025. a, b, c, d
Marwitz, J., Politovich, M., Bernstein, B., Ralph, F., Neiman, P., Ashenden, R., and Bresch, J.: Meteorological Conditions Associated with the ATR72 Aircraft Accident near Roselawn, Indiana, on 31 October 1994, B. Am. Meteorol. Soc., 78, 41–52, https://doi.org/10.1175/1520-0477(1997)078<0041:mcawta>2.0.co;2, 1997. a
Mech, M., Ehrlich, A., Herber, A., Lüpkes, C., Wendisch, M., Becker, S., Boose, Y., Chechin, D., Crewell, S., Dupuy, R., Gourbeyre, C., Hartmann, J., Jäkel, E., Jourdan, O., Kliesch, L.-L., Klingebiel, M., Kulla, B. S., Mioche, G., Moser, M., Risse, N., Ruiz-Donoso, E., Schäfer, M., Stapf, J., and Voigt, C.: MOSAiC-ACA and AFLUX – Arctic airborne campaigns characterizing the exit area of MOSAiC, Sci. Data, 9, https://doi.org/10.1038/s41597-022-01900-7, 2022. a
Menekay, D., Jurkat-Witschas, T., Lucke, J., and Voigt, C.: Mission: SENS4ICE-EU, HALO database [data set], https://doi.org/10.17616/R39Q0T, 2026. a, b, c, d
Mie, G.: Beiträge zur Optik trüber Medien, speziell kolloidaler Metallösungen, Ann. Phys., 330, 377–445, 1908. a
Moser, M., Voigt, C., Jurkat-Witschas, T., Hahn, V., Mioche, G., Jourdan, O., Dupuy, R., Gourbeyre, C., Schwarzenboeck, A., Lucke, J., Boose, Y., Mech, M., Borrmann, S., Ehrlich, A., Herber, A., Lüpkes, C., and Wendisch, M.: Microphysical and thermodynamic phase analyses of Arctic low-level clouds measured above the sea ice and the open ocean in spring and summer, Atmos. Chem. Phys., 23, 7257–7280, https://doi.org/10.5194/acp-23-7257-2023, 2023. a, b
National Transportation Safety Board: In-Flight Icing Encounter and Loss of Control Simmons Airlines, d.b.a. American Eagle Flight 4184 Avions de Transport Regional (ATR) Model 72-212, N401AM Roselawn, Indiana October 31, 1994, Tech. Rep. NTSB/AAR-96/01, National Transportation Safety Board, https://www.ntsb.gov/investigations/AccidentReports/Reports/AAR9601.pdf (last access: 4 August 2026), 1996. a
National Transportation Safety Board: In-Flight Icing Encounter and Uncontrolled Collision with Terrain, Comair Flight 3272, Embraer EMB120RT, N265CA, Monroe, Michigan, January 9, 1997, Tech. Rep. NTSB/AAR-98/04, https://www.ntsb.gov/investigations/AccidentReports/Reports/AAR9804.pdf (last access: 4 August 2026), 1998. a
Office of the Federal Register, National Archives and Records Administration: 14 CFR Appendix C to Part 25, https://www.ecfr.gov/pdfs/df8e9886-1ceb-46a8-938a-16a146334e04.pdf (last access: 12 March 2025), 2014. a
Office of the Federal Register, National Archives and Records Administration: 14 CFR Appendix O to Part 25 – Supercooled Large Drop Icing Conditions, https://www.govinfo.gov/app/details/CFR-2016-title14-vol1/CFR-2016-title14-vol1-part25-appO (last access: 3 August 2026), 2016. a
O'Shea, S. J., Crosier, J., Dorsey, J., Schledewitz, W., Crawford, I., Borrmann, S., Cotton, R., and Bansemer, A.: Revisiting particle sizing using greyscale optical array probes: evaluation using laboratory experiments and synthetic data, Atmos. Meas. Tech., 12, 3067–3079, https://doi.org/10.5194/amt-12-3067-2019, 2019. a
Pohl, M.: A lamb wave-based icing sensor for aircraft ice detection, in: Proceedings–Int. Workshop on Atmospheric Icing of Structures, 2022. a
Pruppacher, H. and Klett, J.: Microphysics of Clouds and Precipitation, Springer Netherlands, https://doi.org/10.1007/978-0-306-48100-0, 2010. a
Roberts, I., Gent, R., Hatch, C., and Moser, R.: Development of the Atmospheric Icing Patch (AIP) under the SENS4ICE Programme, in: SAE Technical Paper Series, ICE, SAE International, ISSN 2688-3627, https://doi.org/10.4271/2023-01-1488, 2023. a
Schwarz, C.: SENS4ICE EU Project Preliminary Results, in: SAE Technical Paper Series, SAE International, https://doi.org/10.4271/2023-01-1496, 2023a. a, b
Schwarz, C. W.: SENS4ICE EU Project Icing Detection Technologies Evaluation, DLRK 2023, https://doi.org/10.25967/610055, 2023b. a
Schwarz, C.: SENS4ICE-2023_SAFIRE-ATR42_SAFIRE_CDP CDP data, Aeris [data set], https://doi.org/10.25326/477, 2023c. a
Schwarz, C.: SENS4ICE-2023_SAFIRE-ATR42_SAFIRE_UHSAS Aerosol UHSAS, Aeris [data set], https://doi.org/10.25326/476, 2023d. a
Schwarz, C.: SENS4ICE-2023_SAFIRE-ATR42_SAFIRE_CIP CIP data, Aeris [data set], https://doi.org/10.25326/481, 2023e. a
Schwarz, C.: SENS4ICE-2023_SAFIRE-ATR42_SAFIRE_LWC Liquid Water Content at 1Hz, Aeris [data set], https://doi.org/10.25326/474, 2023f. a
Schwarz, C.: SENS4ICE-2023_SAFIRE-ATR42_SAFIRE_RADIATION Radiation data, Aeris [data set], https://doi.org/10.25326/475, 2023g. a
Schwarz, C.: SENS4ICE-2023_SAFIRE-ATR42_SAFIRE_CORE_TDYN Thermodynamic and dynamic Core Data including, pressure, temperature, humidity, TAS, wind, noseboom sideslip and AOA post-processed at 1HZ, Aeris [data set], https://doi.org/10.25326/478, 2023h. a
Schwarz, C.: SENS4ICE-2023_SAFIRE-ATR42_SAFIRE_CORE_NAV Navigation and platform characteristics, Aeris [data set], https://doi.org/10.25326/479, 2023i. a
Schwarz, C.: SENS4ICE-2023_SAFIRE-ATR42_SAFIRE_CORE_NAV Navigation and platform characteristics, Aeris [data set], https://doi.org/10.25326/480, 2023j. a
Schwarz, C. W.: The SENS4ICE EU project – SENSors and certifiable hybrid architectures for safer aviation in ICing Environment – A project midterm overview, in: 6th International Conference Prospects of Civil Avionics Development, https://elib.dlr.de/144361/ (last access: 3 August 2026), 2021. a
Schwarzenboeck, A., Mioche, G., Armetta, A., Herber, A., and Gayet, J.-F.: Response of the Nevzorov hot wire probe in clouds dominated by droplet conditions in the drizzle size range, Atmos. Meas. Tech., 2, 779–788, https://doi.org/10.5194/amt-2-779-2009, 2009. a
Science Engineering Associates, Inc.: WCM-3000 Robust Water Content System, https://www.scieng.com/products/robust.htm (last access: 17 May 2026), 2026. a
Sorooshian, A., Siu, L. W., Butler, K., Brunke, M. A., Cairns, B., Chellappan, S., Chen, J., Choi, Y., Crosbie, E. C., Cutler, L., DiGangi, J. P., Diskin, G. S., Ferrare, R. A., Hair, J. W., Hostetler, C. A., Kirschler, S., Kleb, M. M., Li, X.-Y., Liu, H., McComiskey, A., Namdari, S., Painemal, D., Schlosser, J. S., Shingler, T., Shook, M. A., Silva, S., Sinclair, K., Jr., W. L. S., Soloff, C., Stamnes, S., Tang, S., Thornhill, K. L., Tornow, F., Tselioudis, G., Diedenhoven, B. V., Voigt, C., Vömel, H., Wang, H., Winstead, E. L., Xu, Y., Zeng, X., Zhang, B., Ziemba, L., and Zuidema, P.: The NASA ACTIVATE mission, B. Am. Meteorol. Soc., 106, E1517–E1538, 2025. a
Strapp, J. W., Oldenburg, J., Ide, R., Lilie, L., Bacic, S., Vukovic, Z., Oleskiw, M., Miller, D., Emery, E., and Leone, G.: Wind Tunnel Measurements of the Response of Hot-Wire Liquid Water Content Instruments to Large Droplets, J. Atmos. Ocean. Tech., 20, 791–806, https://doi.org/10.1175/1520-0426(2003)020<0791:WTMOTR>2.0.CO;2, 2003. a, b
Vaillant de Guélis, T., Schwarzenböck, A., Shcherbakov, V., Gourbeyre, C., Laurent, B., Dupuy, R., Coutris, P., and Duroure, C.: Study of the diffraction pattern of cloud particles and the respective responses of optical array probes, Atmos. Meas. Tech., 12, 2513–2529, https://doi.org/10.5194/amt-12-2513-2019, 2019. a
Voigt, C., Schumann, U., Minikin, A., Abdelmonem, A., Afchine, A., Borrmann, S., Boettcher, M., Buchholz, B., Bugliaro, L., Costa, A., Curtius, J., Dollner, M., Dörnbrack, A., Dreiling, V., Ebert, V., Ehrlich, A., Fix, A., Forster, L., Frank, F., Fütterer, D., Giez, A., Graf, K., Grooß, J.-U., Groß, S., Heimerl, K., Heinold, B., Hüneke, T., Järvinen, E., Jurkat, T., Kaufmann, S., Kenntner, M., Klingebiel, M., Klimach, T., Kohl, R., Krämer, M., Krisna, T. C., Luebke, A., Mayer, B., Mertes, S., Molleker, S., Petzold, A., Pfeilsticker, K., Port, M., Rapp, M., Reutter, P., Rolf, C., Rose, D., Sauer, D., Schäfler, A., Schlage, R., Schnaiter, M., Schneider, J., Spelten, N., Spichtinger, P., Stock, P., Walser, A., Weigel, R., Weinzierl, B., Wendisch, M., Werner, F., Wernli, H., Wirth, M., Zahn, A., Ziereis, H., and Zöger, M.: ML-CIRRUS: The Airborne Experiment on Natural Cirrus and Contrail Cirrus with the High-Altitude Long-Range Research Aircraft HALO, B. Am. Meteorol. Soc., 98, 271–288, https://doi.org/10.1175/BAMS-D-15-00213.1, 2017. a
Weigel, R., Spichtinger, P., Mahnke, C., Klingebiel, M., Afchine, A., Petzold, A., Krämer, M., Costa, A., Molleker, S., Reutter, P., Szakáll, M., Port, M., Grulich, L., Jurkat, T., Minikin, A., and Borrmann, S.: Thermodynamic correction of particle concentrations measured by underwing probes on fast-flying aircraft, Atmos. Meas. Tech., 9, 5135–5162, https://doi.org/10.5194/amt-9-5135-2016, 2016. a, b
Wilkinson, M. D., Dumontier, M., Aalbersberg, I. J., Appleton, G., Axton, M., Baak, A., Blomberg, N., Boiten, J.-W., da Silva Santos, L. B., Bourne, P. E., Bouwman, J., Brookes, A. J., Clark, T., Crosas, M., Dillo, I., Dumon, O., Edmunds, S., Evelo, C. T., Finkers, R., Gonzalez-Beltran, A., Gray, A. J., Groth, P., Goble, C., Grethe, J. S., Heringa, J., ’t Hoen, P. A., Hooft, R., Kuhn, T., Kok, R., Kok, J., Lusher, S. J., Martone, M. E., Mons, A., Packer, A. L., Persson, B., Rocca-Serra, P., Roos, M., van Schaik, R., Sansone, S.-A., Schultes, E., Sengstag, T., Slater, T., Strawn, G., Swertz, M. A., Thompson, M., van der Lei, J., van Mulligen, E., Velterop, J., Waagmeester, A., Wittenburg, P., Wolstencroft, K., Zhao, J., and Mons, B.: The FAIR Guiding Principles for scientific data management and stewardship, Sci. Data, 3, https://doi.org/10.1038/sdata.2016.18, 2016. a