the Creative Commons Attribution 4.0 License.
the Creative Commons Attribution 4.0 License.
 | 07 Aug 2026
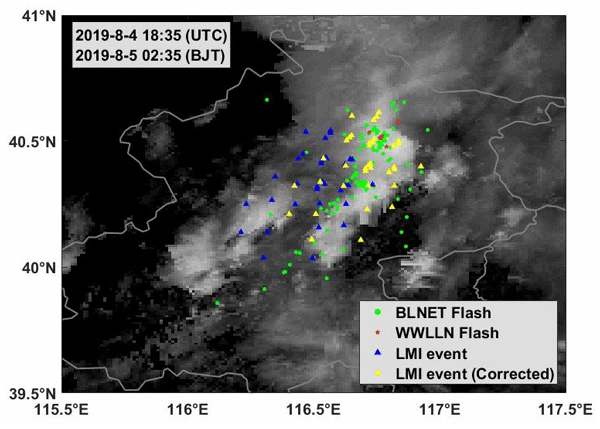
Corrected event dataset of FengYun-4A Lightning Mapping Imager (FY-4A LMI), 2019–2023
Yuansheng Zhang
Xiushu Qie
Rubin Jiang
Dongjie Cao
Jing Yang
Dongfang Wang
Mingyuan Liu
Dongxia Liu
Zhuling Sun
Hongbo Zhang
Shanfeng Yuan
The Lightning Mapping Imager (LMI) aboard FengYun-4A (FY-4A) has accumulated substantial observational data. To address remaining systematic geolocation deviations, we propose a correction method using World Wide Lightning Location Network (WWLLN) as a reference. The LMI field of view is divided into 400 subregions (20×20 grid). Within each subregion, sensitivity experiments match LMI events with ground-based lightning to quantify systematic deviations, followed by a weighted curve-fitting approach to derive subregional correction curves. The fitted curves are applied to the original Level-2 products to construct a refined correction dataset. Based on over nine million matched LMI-WWLLN pairs (2019–2023), after correction the proportion of events with deviation ≤ 15 km increases from 36.0 % to 51.7 %, and ≤20 km increases from 58.2 % to 74.8 %. The coordinate deviations converge substantially, indicating improved geolocation performance. Across most of the LMI field of view, the coarse-estimate average error is within approximately 15 km (about 1.5 pixels), with the actual accuracy being better, excluding those undetermined regions with sparse lightning (e.g., Xinjiang, Mongolia) where robust fitting is not feasible. Independent validation using the high-precision Beijing Broadband Lightning Network (BLNET) for a severe convective case on 4 August 2019 shows that for 70 % of the events, longitude deviations are within ±0.069° (mean 0.016°) and latitude deviations are within ±0.046° (mean −0.016°), with the comprehensive geolocation error within approximately one pixel, achieving accuracy levels comparable to those obtained using regional high-precision lightning network post-processing corrections. The corrected dataset is publicly available at https://doi.org/10.11888/Atmos.tpdc.303312 (Zhang et al., 2026b).
- Article
(14934 KB) - Full-text XML
- BibTeX
- EndNote


Lightning is a hazardous atmospheric discharge phenomenon associated with severe convective weather and represents a major contributor to casualties from meteorological disasters (Qie et al., 2021; Qie et al., 2023). As a long-distance discharge phenomenon in nature, lightning serves as the largest natural source of nitrogen oxides (NOx) in the troposphere, which not only regulates the atmospheric oxidation capacity in the upper troposphere but also profoundly shapes chemical cycling processes within the troposphere (Brune et al., 2021). Lightning also triggers wildfires, which in turn influence the evolutionary trajectories of species and ecosystems. Accurate lightning detection is therefore of paramount importance for weather monitoring and disaster mitigation. With advances in space-based lightning imaging technology, large-scale lightning observation systems have developed rapidly over the past decade. So far, three series of lightning imagers based on geostationary satellites have been operating in space, providing a probable global distribution of lightning activity. The Geostationary Lightning Mapper (GLM) onboard the Geostationary Operational Environmental Satellite (GOES) R-series – GOES-16, 17, 18 and 19 – was launched in 2017, 2018, 2023 and 2024, respectively (Goodman et al., 2013; Loto Aniu et al., 2023; Peterson et al., 2022a; Rudlosky et al., 2019). This establishes a multi-satellite collaborative observation system. In parallel, China's next-generation geostationary meteorological satellite, Fengyun-4A (FY-4A), carrying the Lightning Mapping Imager (LMI), was launched on 11 December 2016. During boreal summer, FY-4A primarily monitored lightning activity over China and surrounding regions in the Northern Hemisphere, whereas in boreal winter it focused on the eastern Indian Ocean and western Australia in the Southern Hemisphere (Cao, 2016; Yang et al., 2017). After several years of continuous operation, FY-4A was decommissioned in early 2024. Subsequently, on 27 December 2025, the next generation geostationary satellite FY-4C was successfully launched, carrying an upgraded version of the LMI. In addition, the Lightning Imager (LI) onboard the Meteosat Third Generation (MTG) satellite was launched on 13 December 2022, providing coverage of Europe, Africa and the surrounding seas (Holmlund et al., 2021). This further expanded the global capability for continuous geostationary lightning observations.
For the Geostationary Lightning Mapper (GLM), Carr et al. (2020) addressed geolocation errors by using coastline identification and registration as a spatial reference. They further incorporated data from distributed temperature sensors into compensation algorithms to mitigate deviations caused by thermal deformation. Consequently, the GLM achieved a lightning location accuracy of approximately 4 km at the nadir. Building on this work, a series of comprehensive evaluations of GLM lightning detection performance, including the characteristics of lightning optical sources, detection range and height, detection thresholds, and clustering algorithms, have been conducted (Peterson et al., 2022a, b, c; Peterson and Mach, 2022). In addition, GLM implemented a cloud-top-height (CTH) parallax correction model to mitigate parallax-related geolocation deviations (Buechler et al., 2018). Overall, GLM has demonstrated stable performance with relatively high lightning geolocation accuracy. However, as the CTH parameter was derived through comparisons between satellite observations and ground-based lightning location networks, the correction accuracy was influenced by the latitude of lightning occurrences to a certain extent.
As an experimental payload, the LMI onboard FY-4A has been the subject of extensive validation efforts. Hui et al. (2020a, b) examined the preliminary observational data and radiative characteristics of LMI by comparing lightning optical signals detected by LMI with those from other lightning observation systems, such as the Lightning Imaging Sensor (LIS) and the World Wide Lightning Location Network (WWLLN). The consistency among these datasets provided initial evidence of the reliability of LMI observations. Nevertheless, Cao et al. (2021) compared LMI and LIS lightning observations from 2018 to 2020 and found that the nighttime detection efficiency of LMI was significantly higher than its daytime counterpart, indicating that the majority of LMI lightning detections occur at night. Chen et al. (2021) compared LMI observations with ground based high-precision data from the Beijing Broadband Lightning Network (BLNET) and found that LMI preferentially detected lightning in shallow clouds, whereas lightning within deep convective clouds was more difficult to capture, indicating that the LMI detection efficiency is thunderstorm-dependent and is unevenly distributed both spatially and physically. To address these limitations, a series of studies focusing on data error correction have been conducted. Drawing on the navigation registration strategy used for GLM, Cheng et al. (2021) and Wang et al. (2021) proposed a double-edge algorithm that employs coastlines as reference features for image registration during daytime, while nighttime geolocation deviations were estimated from thermal plate measurements to infer payload displacement induced by launch acceleration. This approach partially reduced thermal deformation related geolocation deviations in LMI, achieving a positioning accuracy of approximately one pixel during daytime and within three pixels at night. Zhang et al. (2023) proposed an ellipsoidal cloud-top height correction model that utilizes post-processed CTH data, effectively mitigating parallax-induced geolocation deviations in LMI lightning observations and further improving detection accuracy. Building on this work, Zhang et al. (2026a) demonstrated the feasibility of using regional ground-based lightning location data, following CTH parallax correction, to correct thermal deformation induced geolocation deviations of satellite payloads. This approach further enhanced the lightning geolocation accuracy of LMI.
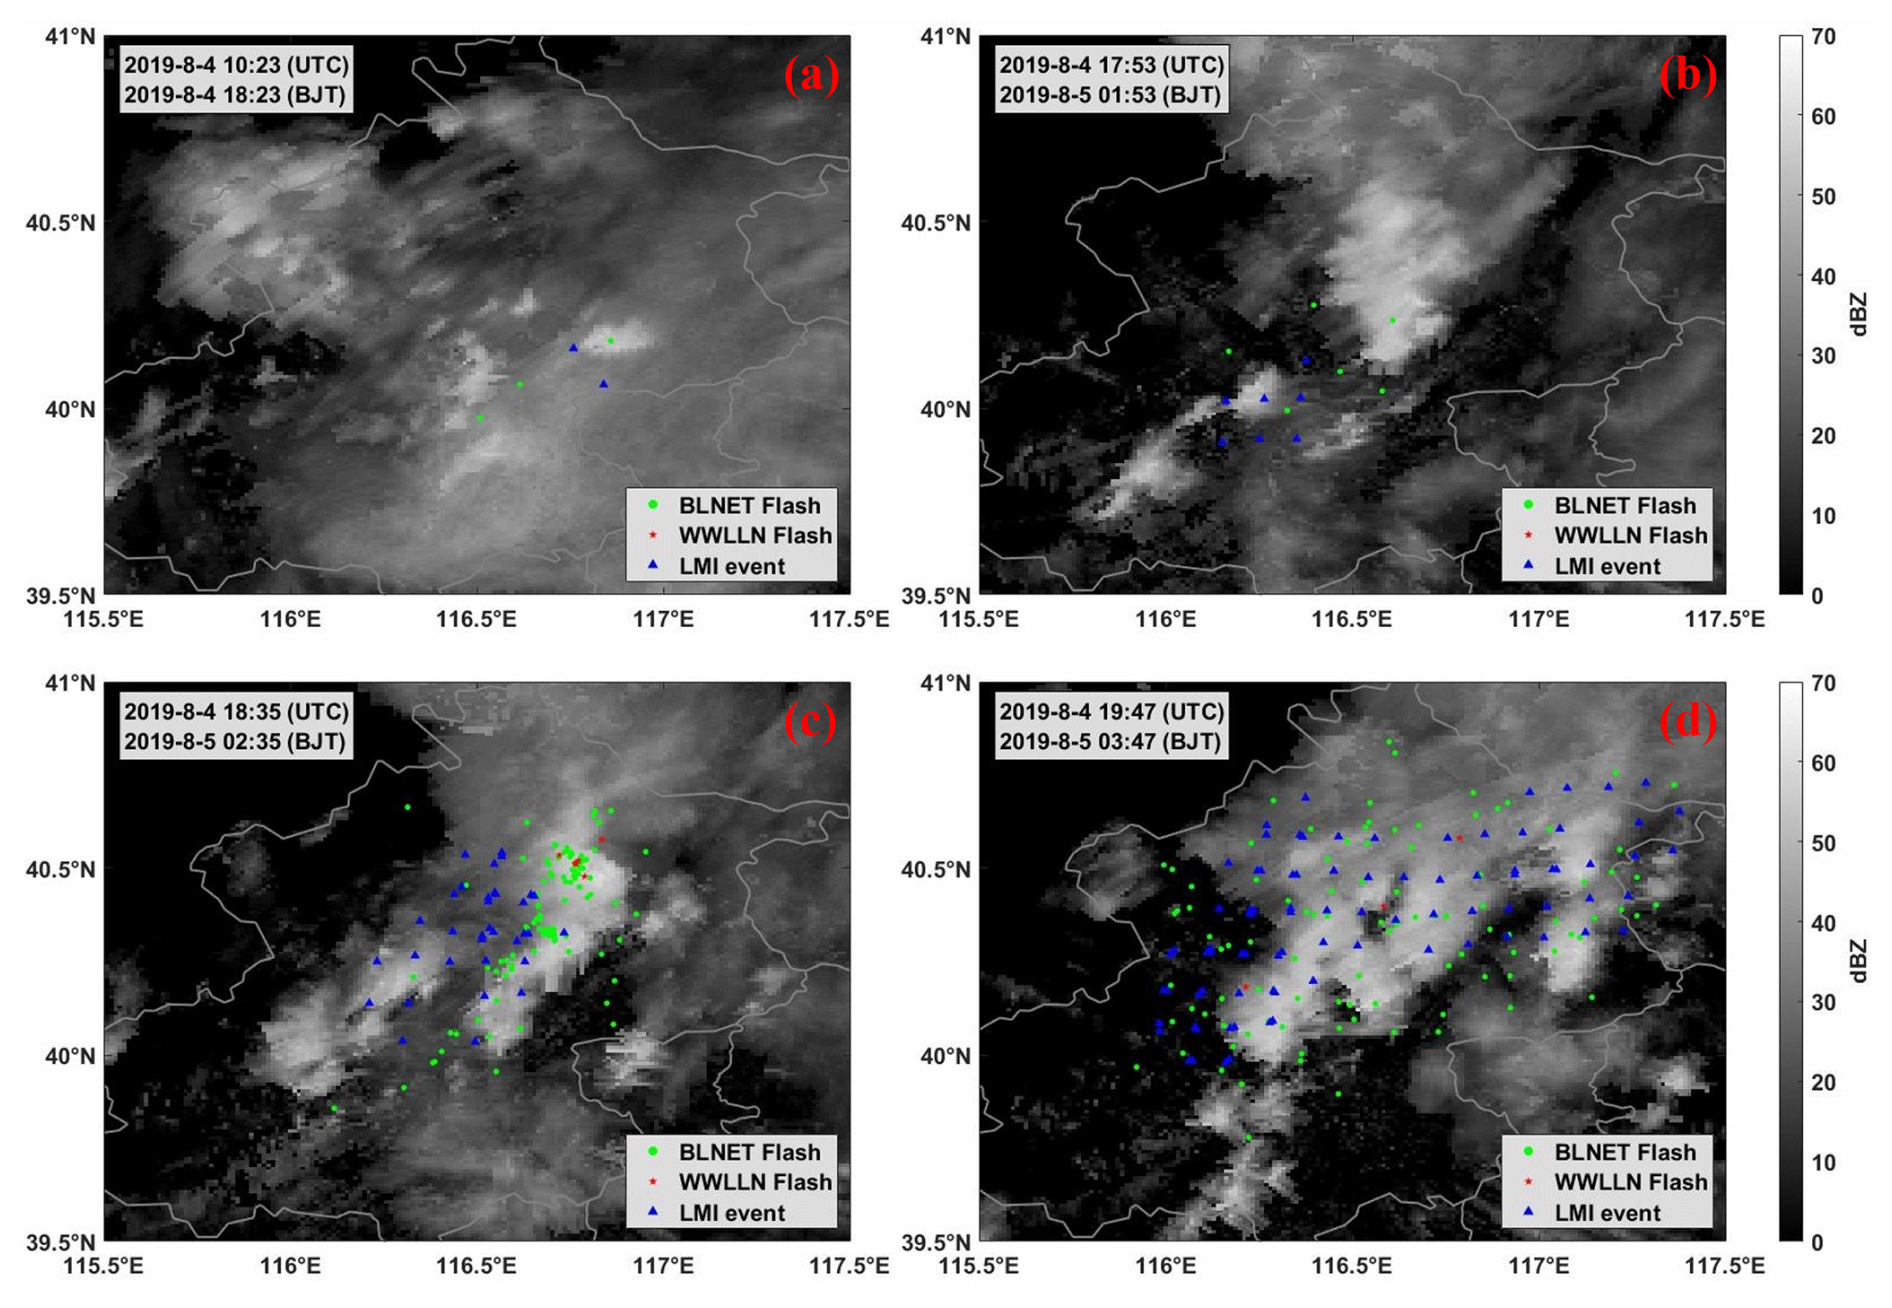
Figure 1LMI event deviation at different stages of a severe convective event over Beijing on 4 August 2019.
Although substantial efforts have been devoted to the correction and validation of lightning observations from the LMI, resulting in notable progress, several limitations persist in existing correction approaches. First, most previous studies have focused on localized regions or specific time periods. Although the proposed correction strategies perform well under these conditions, they have not been systematically evaluated across the full observational domain, limiting confidence in their applicability. Second, several issues remain unresolved, including systematic geolocation deviations arising from the use of different post-processing strategies across subregions, deviations induced by satellite platform jitter, and the identification and removal of interference signals such as intense solar flares. In practice, the physics-based corrections applied to FY-4A LMI are still imperfect. Specifically:
-
The CTH parallax correction depends on the accuracy of CTH retrievals from FY-4A satellite data, which suffers from spatiotemporal uncertainties. Spatially, comparison between satellite CTH products and radar observations shows a vertical error of about 1 km, leading to a parallax correction error on the order of kilometers. Temporally, the satellite CTH product has a resolution of 15 min, which is too coarse for rapidly developing convective cells; time interpolation introduces additional errors. Even with satellite CTH, the residual error after parallax correction should not exceed 10 km. However, our matching results show that only 58.2 % of LMI lightning locations have a residual error within 20 km, and these residuals exhibit clear periodic variations with time and geographic location, suggesting that they are caused by thermal deformation or other periodic errors. This leads to the second point.
-
According to our experimental results (as shown in Fig. 1), the uncorrected LMI Level-2 products still exhibit large residual errors, indicating that the corrections applied in the operational algorithm are incomplete. As illustrated by the severe convective system case over Beijing on 4 August 2019, the locations of LMI events show a systematic southwestward deviation relative to the lightning strokes detected by BLNET and WWLLN. These deviations are not a fixed overall offset but rather systematic biases with diurnal variation and spatial heterogeneity (e.g., thermal deformation signatures), indicating that the physical corrections in the operational algorithm are incomplete. However, the physical corrections applied in the operational algorithm are not fully documented in the published literature. It is difficult and could lead to redundant corrections to pinpoint exactly which correction step(s) the residuals originate from. Therefore, the only feasible approach is to match LMI events with ground-based lightning location network data, statistically derive the spatiotemporal characteristics of these residuals, and thereby improve the accuracy of LMI products. This is precisely the main methodology of the present study: an empirical spline-fitting correction based on WWLLN data.
-
Additionally, random or semi-random errors such as satellite platform jitter, attitude control inaccuracies, and inter-detector response inconsistencies cannot be fully resolved by existing physical models. These errors are not yet systematically addressed in the literature. They contribute to the observed scatter in lightning locations and cannot be eliminated by deterministic physical corrections.
Currently, the correction efforts are largely independent and fragmented, lacking effective integration and coordination. Consequently, a comprehensive, consistently formatted, and fully corrected lightning dataset has yet to be established, which substantially constrains the broader application of lightning observations in meteorological forecasting, hazard monitoring, and climate analysis. In view of this, the present study builds upon previous work by synthesizing and integrating existing correction methodologies and explicitly addressing the multiple sources of geolocation deviation that persist in current LMI lightning products. We perform a systematic, full-field-of-view (FOW) correction of LMI lightning observations and construct a complete, coherent, and reliable corrected lightning dataset. This dataset provides a robust foundation for accurate lightning monitoring and advances research in lightning meteorology and climatology, while also offering higher-quality observational constraints for data-driven applications such as artificial intelligence-based analysis and the validation and evaluation of numerical weather and climate models.
The LMI onboard FY-4A was the first spaceborne lightning detector capable of observing both cloud-to-ground and intra-cloud lightning in China. Correcting LMI observations across the full field of view requires ground-based lightning location data with broad spatial coverage and long-term temporal continuity. As demonstrated by Zhang et al. (2026a), WWLLN data provide an appropriate reference for this purpose. Unlike regional networks, WWLLN's very-low-frequency (VLF) detection capability extends far into ocean areas. Therefore, where sufficient matched LMI-WWLLN events are available, the correction can be applied over both land areas and for a certain distance into the ocean. However, because most of LMI's Southern Hemisphere field of view is covered by ocean, where even WWLLN has limited coverage. This study focuses primarily on the Northern Hemisphere rather than the Indian Ocean region in the Southern Hemisphere.
2.1 FY-4A LMI event
The LMI onboard FY-4A employed a CCD focal plane array, operated at a wavelength of 777.4 nm, and sampled at a frame rate of 2 ms (Cao, 2016; Yang et al., 2017). The LMI field of view covered China and its adjacent seas (dark-blue region in Fig. 2), with a nadir spatial resolution of 7.8 km. LMI used a real-time event processor (RTEP) to dynamically estimate the mean background optical radiance, which was subsequently used as a threshold for background discrimination. Pixels within each frame whose radiance exceeded this threshold were extracted and defined as event data. Event: A single pixel in a single frame (2 ms) whose radiance exceeds the background threshold. Group: A cluster of spatially adjacent (<16.5 km) events within the same frame. The location of the group is the centroid of the polygon formed by all qualifying events. Flash: a cluster of groups within a certain temporal window (<330 ms). The location of the flash is the centroid of the polygon formed by all qualifying groups. In this study, we employed the fundamental LMI event-level products provided by the National Satellite Meteorological Center of the China Meteorological Administration and applied a CTH parallax correction as a preprocessing step, following the model proposed by Zhang et al. (2023).
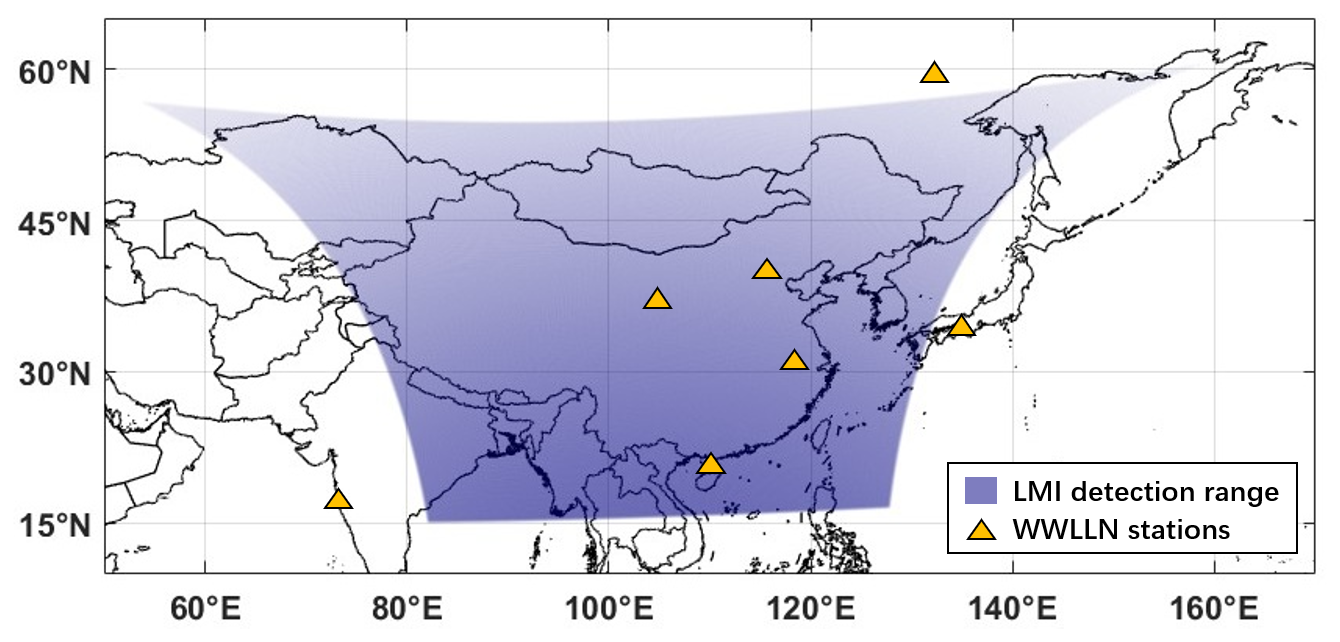
Figure 2LMI observational domain in the Northern Hemisphere and the distribution of WWLLN stations.
2.2 WWLLN flash
The ground-based lightning observations from the WWLLN is used as a reference to investigate whether systematic geolocation deviations associated with thermal deformation are present. This provides a basis for assessing the potential of WWLLN data to correct thermal deformation, which induced geolocation deviations in LMI observations across the full field of view. WWLLN detects global lightning activity in near real time by capturing electromagnetic radiation in the VLF band (3–30 kHz) and using GPS timing to determine the precise arrival times of lightning pulses at individual stations. The network comprises more than 70 stations worldwide, five of which are located within or near the LMI observational domain in East Asia (orange triangles in Fig. 2). WWLLN primarily detects high-peak-current lightning events, including both intra-cloud (IC) and cloud-to-ground (CG) discharges, with detection efficiency increasing for stronger return strokes (Abarca et al., 2010; Rodger et al., 2006). Fan et al. (2018) compared WWLLN with data from the Cloud-to-Ground Lightning Location System (CGLLS) developed by the State Grid Corporation of China and found that, during 2013–2015, approximately 72 % of WWLLN detected lightning events over the central and southern Tibetan Plateau were IC discharges. The mean location accuracy of WWLLN is around 10 km. It should be noted that this 10 km uncertainty does not mean that each individual WWLLN stroke is displaced by 10 km from the true lightning location; rather, WWLLN tends to locate high-current lightning events within a region, and as shown in Fig. 2, its locations generally fall within the areas of strongest radar reflectivity. This characteristic implies that WWLLN should not be treated as an absolute truth, but rather as a reference for the spatial distribution of lightning-dense areas. Our empirical correction aims to reduce the relative systematic offset between LMI and the ground-based reference, not to correct detection efficiency. In this study, the WWLLN dataset spans the boreal summer of 2019. The WWLLN data used here are provided at the flash level. A flash is defined as a cluster of lightning discharges occurring within 0.5 s and separated by no more than 30 km.
Unlike high-quality regional lightning location networks such as CGLLS and Advanced Time-of-arrival and Direction lightning location network (ADTD), which have extremely high detection efficiency (>90 %) and location accuracy (better than 500 m) but are limited to the Chinese mainland (Wu et al., 2024), the goal of this study is to perform a full-field-of-view correction of FY-4A LMI observations over the entire Northern Hemisphere, including China, Mongolia, Kazakhstan, Southeast Asian countries, and considerable ocean areas. This requires a reference dataset with global or near-global coverage. Therefore, despite its known limitations in detection efficiency and accuracy, WWLLN remains the most practical reference for our correction.
2.3 BLNET flash
To better validate the reliability of the correction method proposed in this study, we conducted an additional comparative experiment in the Beijing area using the high-precision Beijing Broadband Lightning Network (BLNET). As shown in Fig. 3, the BLNET comprises 16 stations. The BLNET comprises 16 stations strategically distributed throughout the Beijing area. Each station is equipped with fast and slow electric field change measurement instruments (commonly referred to as fast and slow antennas), as well as very-high-frequency (VHF) radiometers designed for detecting lightning radiation (Wang et al., 2016, 2020). This comprehensive instrumentation enables multi-frequency lightning observation. The inherent horizontal positioning deviation of the network is less than 200 m, and even at a distance of 100 km from the network, the deviation remains below 3 km. Within the BLNET framework, detected radiation events originating from nearby sources with spatial separation up to 15 km and temporal separation within 400 ms are classified as components of a single lightning discharge event (BLNET flash). This classification methodology is supported by previous studies. In this study, the clustered location of each BLNET flash is defined as the position of the strongest event within the specified spatiotemporal thresholds. The BLNET dataset used in this experiment covers the summer of 2019.
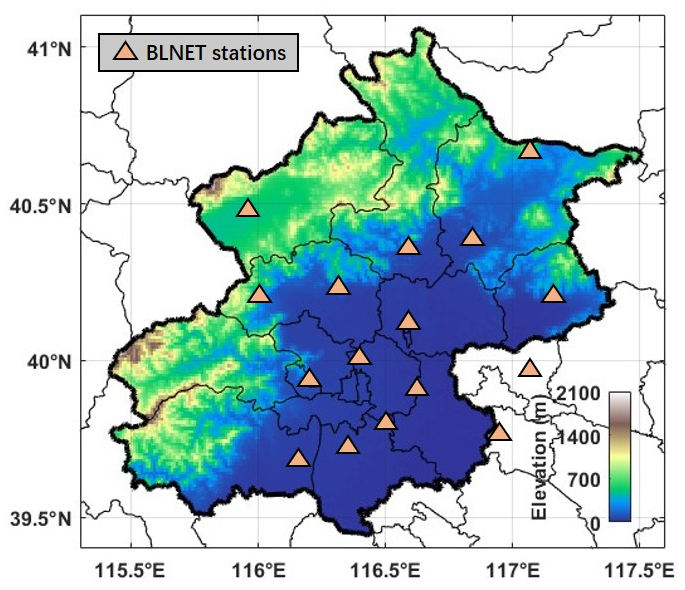
Figure 3Topographic Map of the Beijing Area and Distribution of BLNET Stations in 2019.
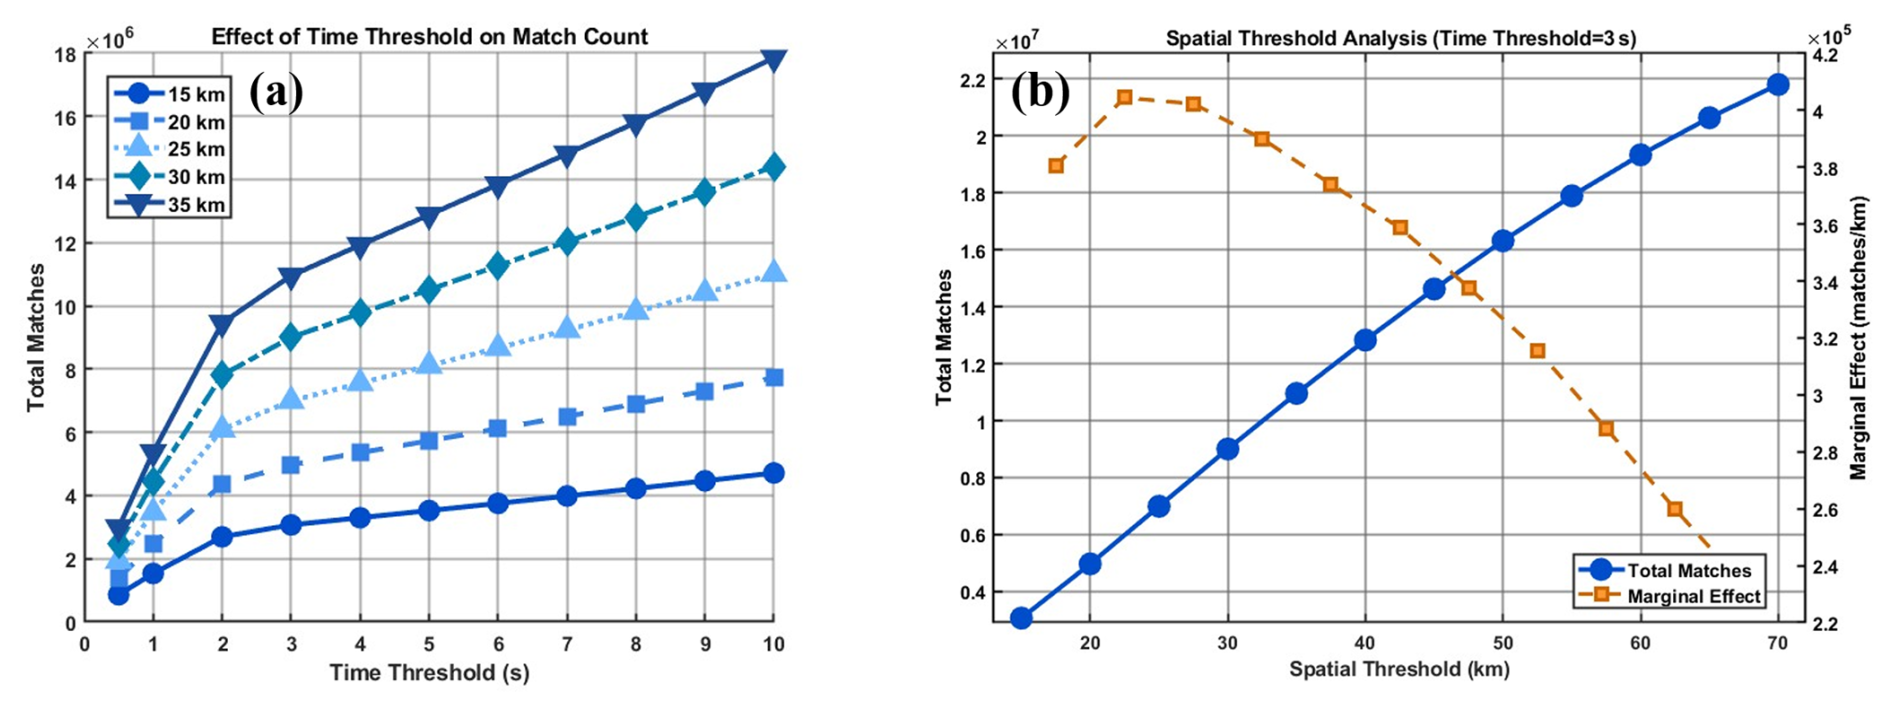
Figure 4Sensitivity experiments on spatiotemporal matching thresholds for matching LMI events with WWLLN flashes. (a) Statistics of the number of matched events under different spatiotemporal threshold settings; (b) marginal effect analysis under a fixed temporal threshold of 3 s.
3.1 Matching between spaceborne and ground-based lightning observations
Before quantifying the geolocation deviations of LMI lightning observations, it is necessary to match spaceborne lightning detections with ground-based lightning events. Currently, the selection of spatiotemporal matching thresholds between different lightning detection systems mainly relies on sensitivity analysis combined with the marginal effect principle (Jie, 2018; Thompson et al., 2014) .To determine appropriate matching thresholds, we conducted a series of sensitivity experiments, as shown in Fig. 4. A single lightning discharge typically lasts less than 1 s, but LMI and ground-based lightning detection systems observe the same discharge with different temporal sampling and signal propagation delays. As illustrated in Fig. 4a, regardless of the spatial window applied, the rate of increase in the number of matched lightning events becomes stable once the temporal threshold exceeds 3 s. This indicates that a 3 s window captures the vast majority of true coincidences without introducing excessive false matches, a concept known as the marginal effect in multi-sensor lightning matching. We therefore adopt 3 s as a robust temporal matching threshold. Under this condition, the spatial matching window was further refined through, a marginal effect analysis, as shown in Fig. 4b. The results indicate that spatial thresholds of 25 and 30 km yield optimal marginal effects. Considering that WWLLN has an intrinsic location uncertainty of about 10 km and that LMI pixel size ranges from ∼7.8 km at nadir to >20 km near the edge of the field of view, a spatial threshold of 30 km represents a reasonable compromise between statistical robustness and physical plausibility. To ensure a sufficiently large number of matched lightning events, a 30 km spatial threshold was ultimately adopted for the matching procedure.
As the number of detected lightning events is finite, performing geolocation deviation analysis at the level of individual detection units is impractical. Instead, detection units within a certain spatial extent must be treated collectively and analysed as an ensemble. This requires a regionalized analysis of the LMI observational domain. In the operational processing chain of the LMI, the full field of view is partitioned into a 4×4 grid, within which detection parameters (e.g., background threshold, clustering criteria) are independently calibrated (Hui et al., 2020a, b). Accordingly, each of these 16 operational subregions exhibits homogeneous detection efficiency and noise characteristics. To prevent the mixture of data originating from distinct operational subregions within a single analysis subregion, which would introduce performance inconsistencies arising from heterogeneous detection parameters and algorithmic behaviors, it is required that all lightning events within any given analysis subregion belong to the same operational subregion. Hence, the number of analysis subregions along each dimension must be a multiple of 4, such as 8×8, 20×20, or 40×40. Several multiples within the range of 16×16, 20×20, and 24×24 were tested to determine the optimal subdivision. The 16×16 subdivision yielded subregions that were excessively coarse (each covering approximately 2° in latitude and longitude), thereby smoothing out the systematic deviation patterns targeted for resolution. The 24×24 subdivision resulted in subregions that were too small, leading to insufficient sample sizes in numerous subregions, particularly in marginal or lightning-sparse areas. The 20×20 subdivision achieves an optimal balance, providing adequate spatial resolution while maintaining robust sample sizes (median > 500 events per day in active regions). Supporting evidence is provided by Zhang et al. (2023), who applied CTH parallax correction to the Beijing region using an approximately 2°×2° grid. Their results demonstrate that, under identical conditions, the longitude and latitude correction values for all lightning events within such a grid are highly consistent, essentially following a linear trend. This finding indicates that within a grid of approximately 2° in size, the deviation characteristics are relatively homogeneous.
Considering both the availability of lightning observations and computational efficiency, we divide the LMI field of view into 400 subregions arranged in a 20×20 grid for subsequent analysis.
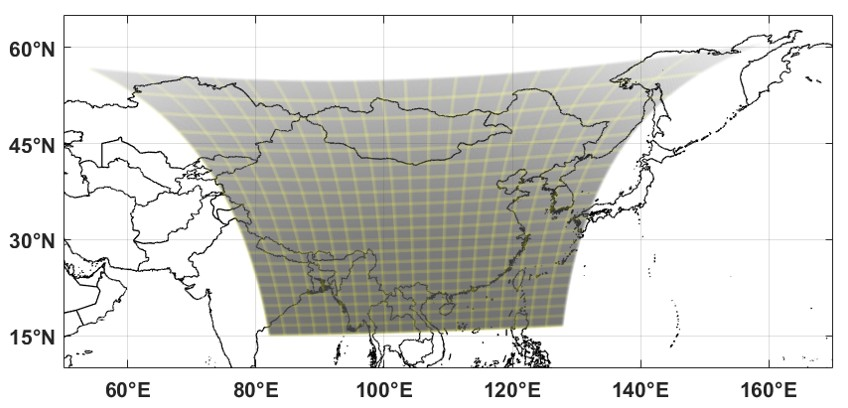
Figure 5Subdivision of the LMI observational domain in the Northern Hemisphere.
3.2 Curve-fitting-based correction method
As noted in the Introduction, the operational lightning products have already undergone multiple layers of correction, some of which are redundant, while others fail to address certain sources of bias. Consequently, the experiments presented here seek to address the geolocation deviation problem directly from a numerical perspective, using the final operational LMI products as the starting point. Building on the subdivision of the LMI observational domain into 400 subregions described, we aggregate the lightning location deviation values within each subregion along a 24 h time axis, using 10 min intervals, as shown in Fig. 5. For each interval the mean and standard deviation of the deviation vectors are calculated. These time series are then corrected using a curve-fitting approach, a methodology that has been validated in several previous studies on satellite payload geolocation bias correction (Wang et al., 2021; Zhang et al., 2021, 2026a). In recent thermal deformation correction experiments, Zhang et al. (2026a) employed a composite model consisting of multiple superimposed Gaussian functions, which proved effective for correcting thermal deformation over the eastern portion of the LMI field of view. However, when extending this approach to full domain correction, the systematic offsets associated with the lefthand CCD array of the LMI result in longitudinal and latitudinal deviation components. They deviate substantially from the ideal bivariate normal distribution. This necessitates the adoption of a more flexible fitting strategy that aligns more closely with the empirical structure of the deviation data, thereby ensures correction quality.
Accordingly, we adopt a spline based fitting approach. Spline fitting is inherently robust to sporadic strong outliers occurring at individual time intervals and, while maintaining overall smoothness, can adaptively preserve the genuine diurnal variation of the deviation signal. This avoids overfitting induced by high frequency noise and provides a stable representation of the underlying systematic bias. The fitted function f(t) is obtained by minimizing the following functional:
where represents the weighted data fidelity term, Here, k denotes the kth 10 min interval, and ν denotes the set of valid data points (excluding NaNs and outliers). tk is the time corresponding to the kth interval (in hours), μk is the mean observed location deviation within that interval, and f(tk) is the value of the fitted function evaluated at tk, The difference μk−f(tk) corresponds to the fitting residual, and denotes the weight assigned to the kth data point. The term is the smoothness constraint, where f′′(t) is the second derivative of the fitted function with respect to time, representing its curvature, and λ is the smoothing parameter that controls the trade-off between fidelity to the data and overall smoothness of the fitted curve.
In the spline fitting, the smoothing parameter λ ranges from 0 to 1, where 0 produces a completely smooth curve and 1 forces the curve to pass through all data points (no smoothing). To evaluate the stability of the fitting and the sensitivity to λ, 95 % confidence intervals were estimated for each subregion using bootstrap resampling (500 replicates). The results indicate that the fitted curves exhibit little sensitivity to λ variations within the range of 0.4–0.6, while λ=0.5 provides the optimal balance between preserving the diurnal trend and suppressing high-frequency noise. Therefore, a fixed λ=0.5 was uniformly applied to all 400 subregions, with confidence bands typically within ±0.02° (approximately ±2 km) in most regions, confirming the robustness of the chosen parameter.
Because the number of LMI observations varies across time intervals and the data quality is not uniform, different intervals should contribute unequally to the fitting process. Intervals characterized by a larger sample size and lower dispersion are expected to be more reliable and therefore should be assigned higher weights. Accordingly, the weight is defined as a function that jointly accounts for the number of samples and the variability within each time interval, such that time bins with more observations and smaller spread exert a stronger influence on the fitted curve:
where Nk denotes the number of samples within the kth time interval, σk is the corresponding standard deviation, and is a small constant introduced to avoid division by zero. The final weight is obtained by normalizing the raw weight (scaling it to the range of 0.1–1.0), and then applying additional constraints, including downweighting time intervals that were manually flagged as outliers.
In practice, certain time intervals may contain only a very small number of lightning detections. In such cases, the estimated standard deviation can be artificially small, which would otherwise lead to an unrealistically large weight. To address this issue, additional constraints are imposed to downweight intervals characterized by extremely small standard deviations. Furthermore, all timeseries data from the 400 subregions were manually inspected, and time intervals containing extreme outliers were explicitly identified and excluded from the analysis.
During the fitting procedure, we also found that some data points, while not classified as extreme outliers, still deviated substantially from the overall diurnal trend and could noticeably distort the fitted curve. To further suppress the influence of such points, an additional smoothing step was applied. Specifically, the spline fitting results were subsequently processed using a three-point moving average, which further stabilizes the correction curve while preserving the dominant temporal structure:
where denotes the final smoothed curve used for correction, while represents the spline fitted value obtained from Eq. (1). The terms tk−1, tk, tk+1 correspond to three consecutive 10 min time intervals. To ensure continuity of the diurnal cycle, the curve is constructed using a cyclic replication approach, in which the end of the 24 h period is smoothly connected to the beginning of the next day, thereby preserving temporal continuity across the 24 h boundary.
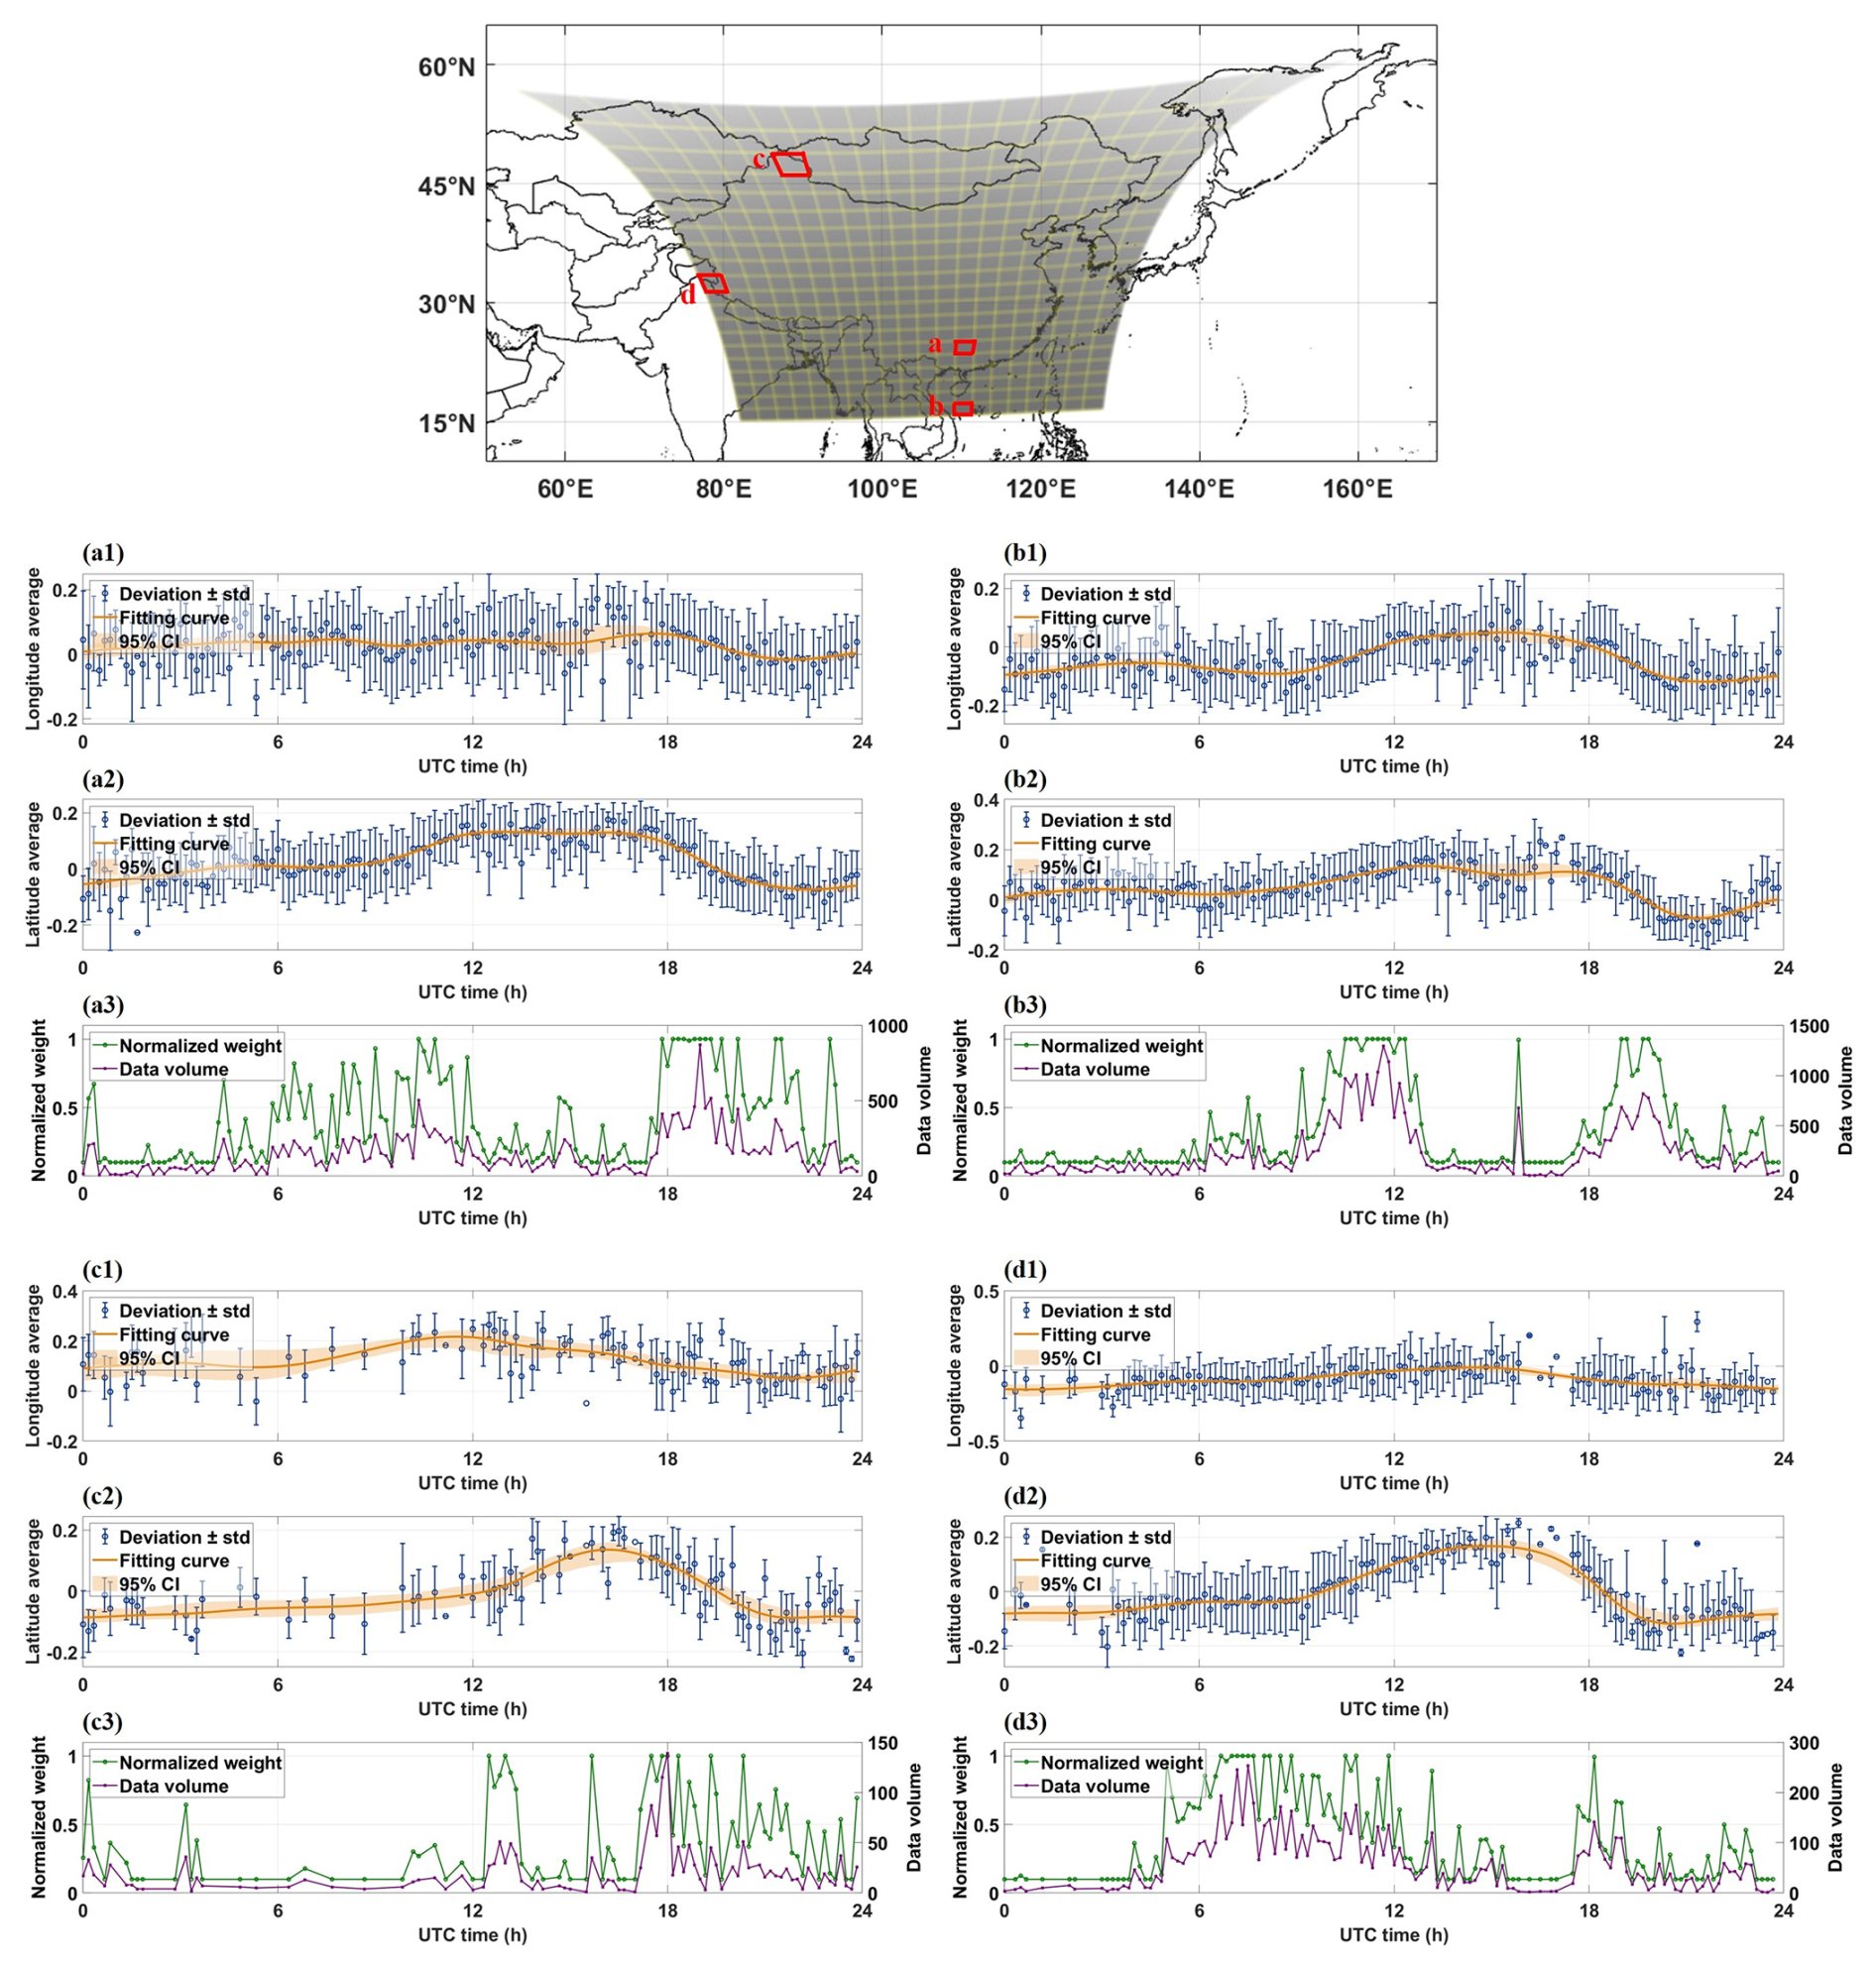
Figure 6Fitted longitude and latitude deviation curves and corresponding weight distributions for selected LMI event subregions. (a1–a3) Longitude deviation curve fitting, latitude deviation curve fitting, and weight distribution for subregion “15, 12”; (b1–b3) corresponding statistics for subregion “20, 13”; (c1–c3) corresponding statistics for subregion “3, 6”; (d1–d3) corresponding statistics for subregion “10, 1”.
Following the methodology outlined in Sect. 3, we compute the mean and standard deviation of the geolocation deviations for all observations within each corresponding time step. Figure 6 presents several representative subregions, illustrating the longitudinal and latitudinal deviations together with the associated weight calculations. Overall, in contrast to previous studies (Cao et al., 2021; Chen et al., 2021; Zhang et al., 2023), we do not observe a pronounced imbalance characterized by substantially more nighttime than daytime detections across the full domain. Instead, the data volume exhibits a more irregular temporal distribution, with lightning counts in a given subregion and time interval often being strongly influenced by episodic extreme weather events, such as typhoons (Zhang et al., 2015). Figure 6a shows the fitted deviation curves for a subregion in the eastern part of the LMI field of view. In the latitudinal component, a pronounced deviation emerges from approximately 10:00 UTC and weakens around 20:00 UTC, a pattern consistent with the thermal deformation correction results reported by Wang et al. (2021) and Zhang et al. (2026a). This characteristic clearly indicates a thermally induced deformation driven by the diurnal cycle of solar radiation. In contrast, the longitudinal deviations are less distinct. This is attributable to the superposition of thermally induced deformation and meridional distortion arising from the projection of the LMI CCD array onto the Earth's ellipsoidal surface. Although these effects do not fully coincide, a discernible displacement can still be identified near 20:00 UTC. In Fig. 6b, we examine the southernmost subregion of the LMI observational domain. This region lies closest to the satellite nadir and experiences minimal projection induced distortion; consequently, its spatiotemporal deviation characteristics provide a particularly clear representation of systematic and periodic error sources. Here, a similar thermally driven periodic deviation is evident. Figure 6c shows a subregion near Xinjiang and Inner Mongolia, where lightning occurrence is extremely sparse. As a result, the available data volume is very limited, with many time intervals entirely missing, substantially increasing the difficulty of curve fitting and leading to a higher probability of extreme outliers. Nevertheless, certain deviation characteristics remain discernible. In particular, the longitudinal deviations exhibit a clear systematic offset, despite the small sample size. This is attributed to a westward displacement of the left half of the LMI detector array caused by acceleration during rocket launch, an effect that is further amplified by the proximity of this subregion to the northwestern edge of the LMI field of view. Figure 6d presents a subregion located near the boundary of the observational domain. Its longitudinal and latitudinal deviation patterns are broadly similar to those shown in Fig. 6a. However, extended periods of missing data are evident. Such prolonged data gaps can induce substantial biases in the fitted curves. To mitigate this issue, we adjust the weighting scheme and apply additional smoothing during the fitting process, allowing the curves to exhibit a predictive characteristic over data sparse intervals and ensuring smooth temporal transitions. To quantify the uncertainty of the fitted correction functions, this study applies a bootstrap resampling method (500 iterations) to estimate the 95 % confidence intervals for the longitude and latitude deviation curves of each subregion. The time axis covers 24 h with a 10 min interval, yielding 144 time points. In each iteration, valid 10 min bins (with sufficient lightning events and not flagged as outliers) are resampled with replacement, preserving the original weights of each bin (determined by event count and standard deviation; see Eq. 2). The same spline fitting procedure is then applied to the resampled data. The 2.5th and 97.5th percentiles of the fitted values at each time point are taken as the 95 % confidence interval. The mean uncertainty for a subregion is defined as the average half-width of the confidence band over the 24 h period; subregions with sparse data or failed fitting are not evaluated and are flagged in the dataset. In the results, the 95 % confidence intervals are shown as orange shaded bands around the fitted curves (Fig. 6). Except for time periods with very few or no lightning events, where reliability is lower, the shaded bands closely follow the fitted curves for most periods, with errors within ±0.02°, indicating good reliability of the diurnal correction.
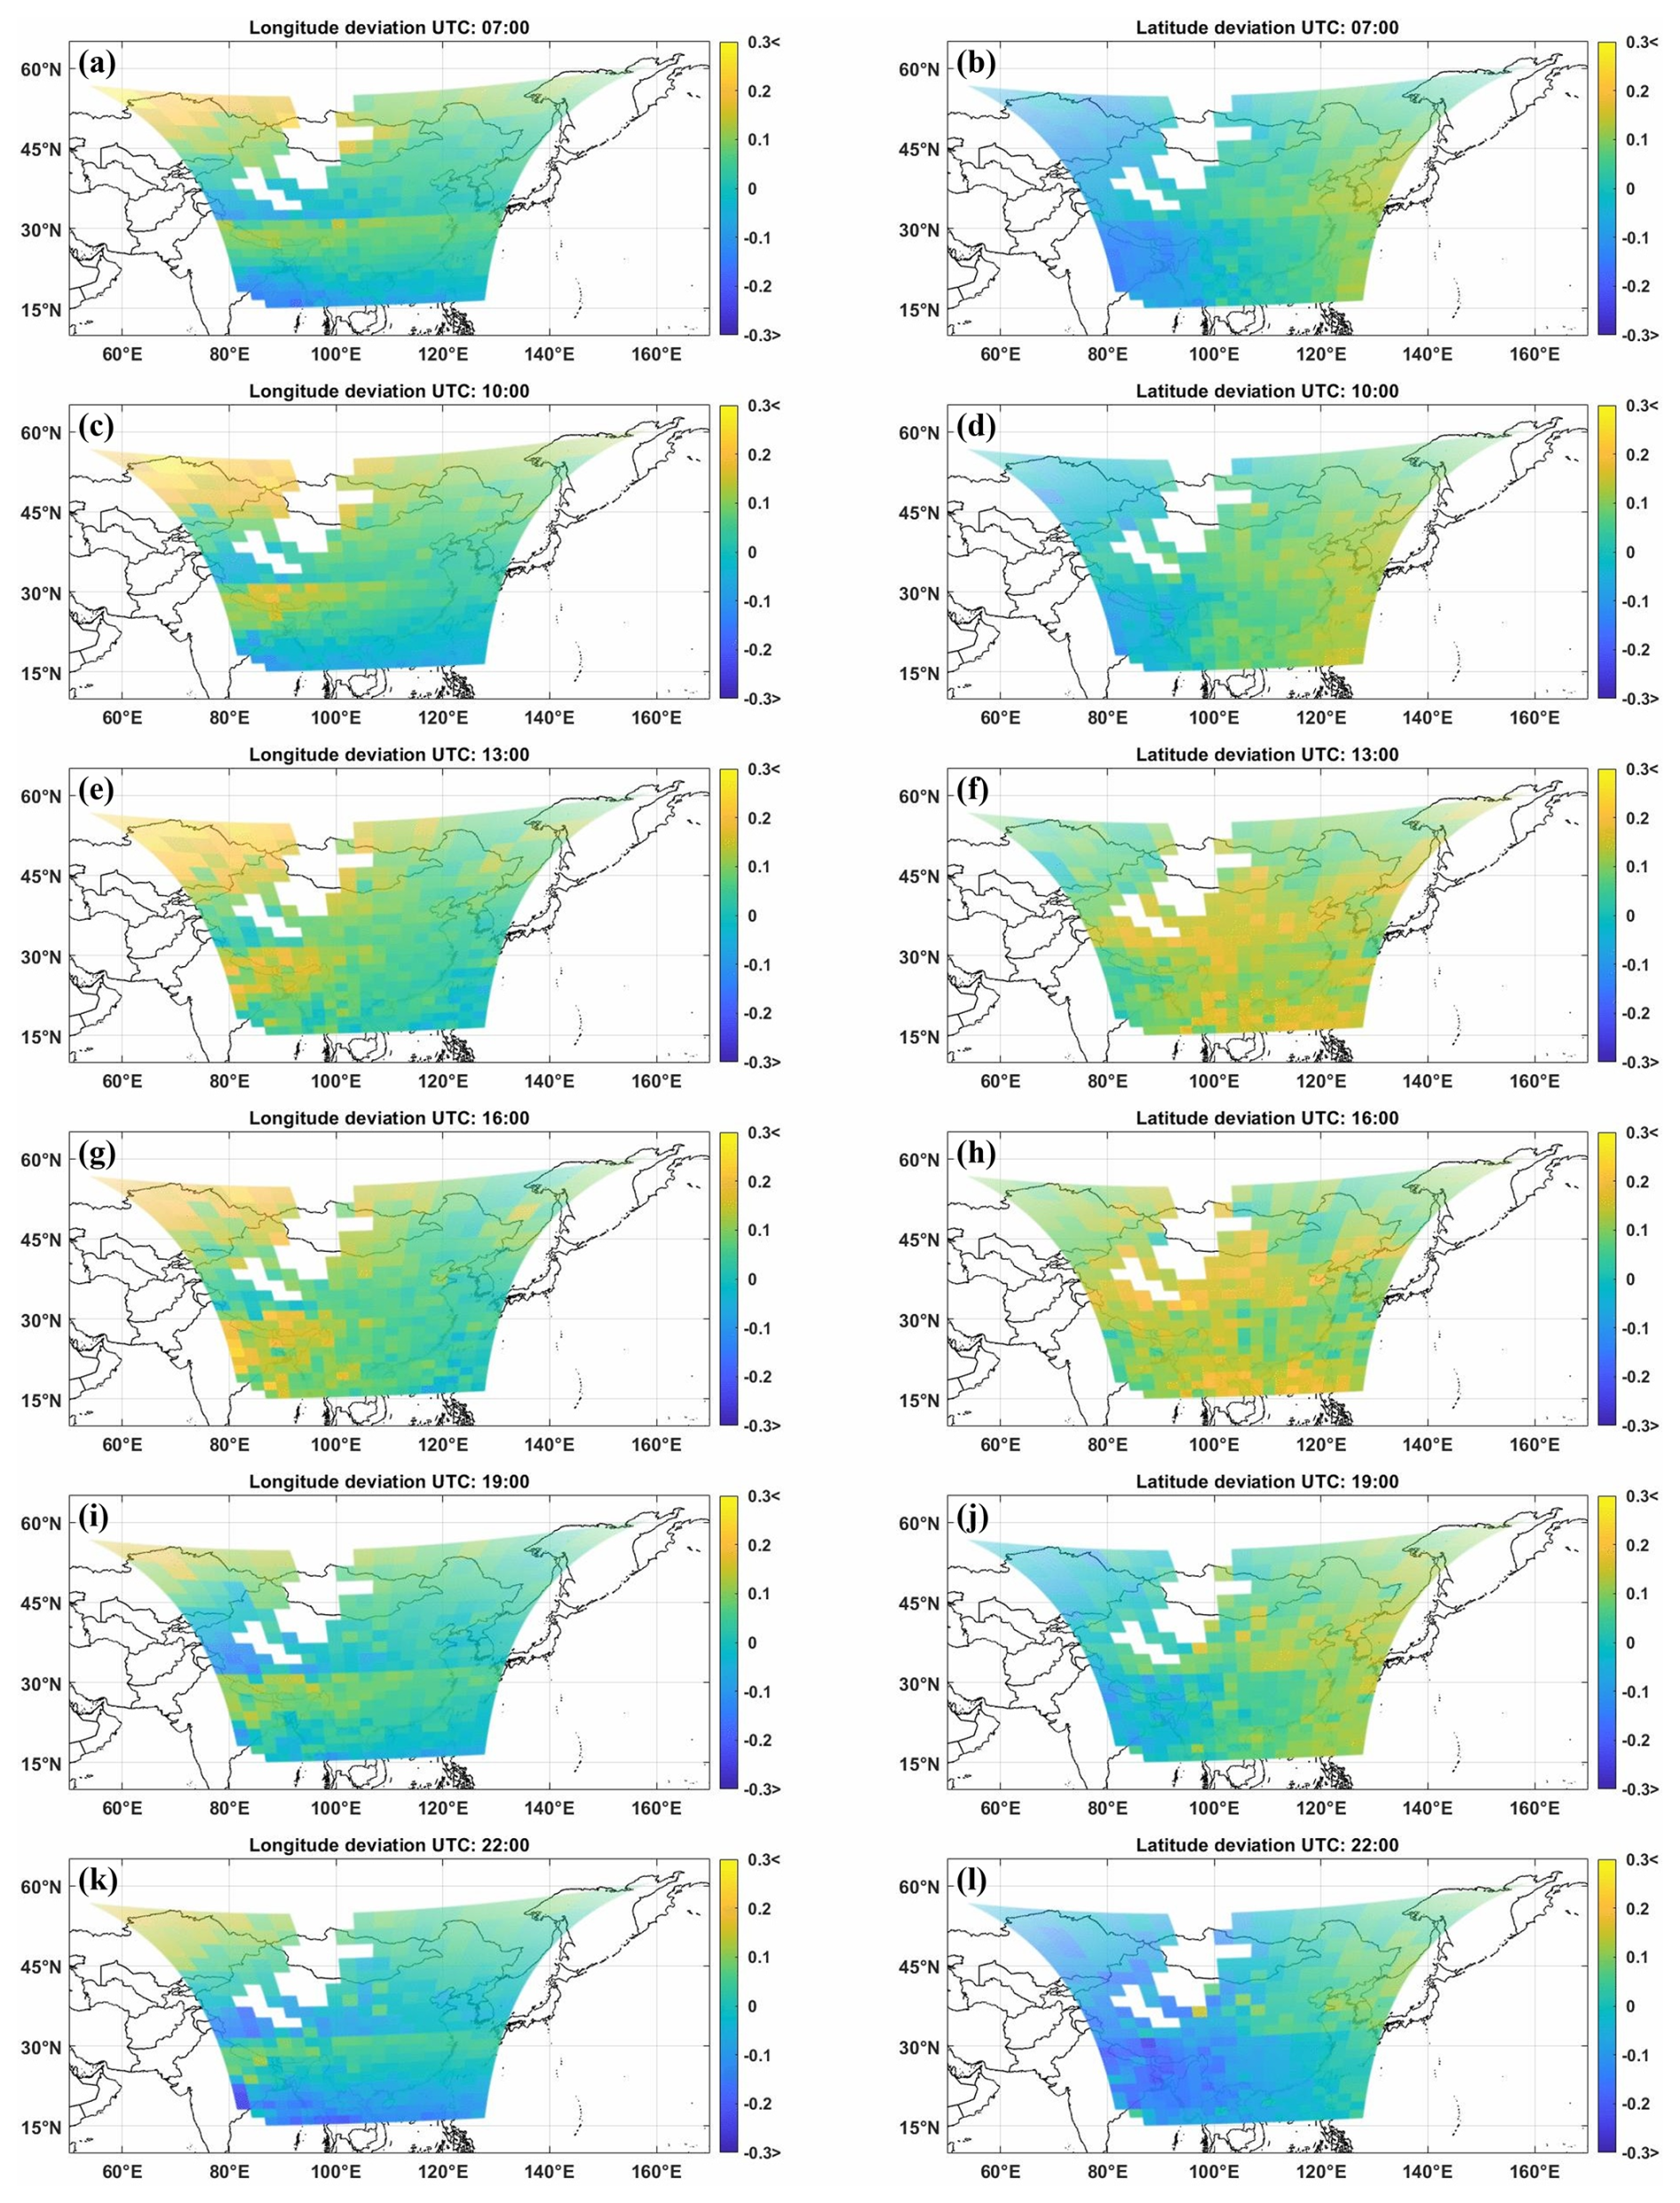
Figure 7Spatiotemporal distribution of lightning geolocation deviations for LMI events over the Northern Hemisphere observational domain. The left column (a, c, e, g, i k) shows the longitudinal deviations, and the right column (b, d. f, h, j, l) shows the latitudinal deviations. Panels (a, b) correspond to 07:00 UTC; (c, d) 10:00 UTC; (e, f) 13:00 UTC; (g, h) 16:00 UTC; (i, j) 19:00 UTC; and (k, l) 22:00 UTC. The statistics are compiled from LMI observations collected during the boreal warm season (March–September) from 2019 to 2023.
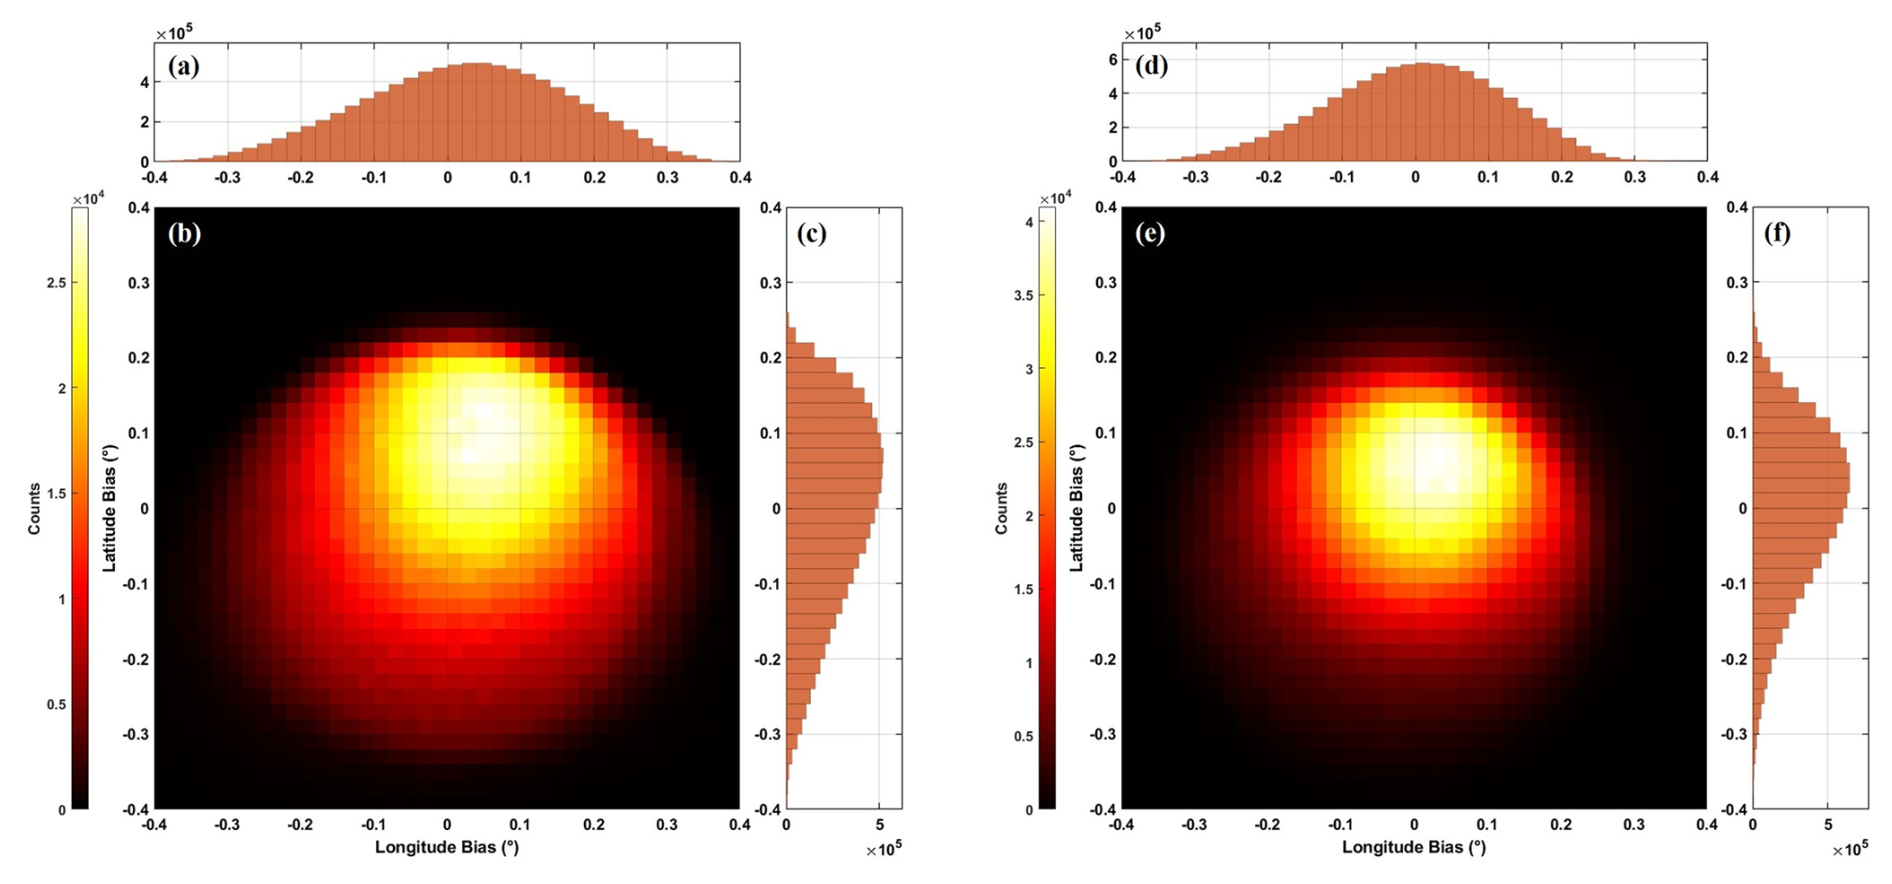
Figure 8Distributions of coordinate differences between LMI events and WWLLN flashes before and after correction. (b) the density distribution of LMI event coordinate differences prior to correction, with panels (a) and (c) presenting the corresponding projections of the longitudinal and latitudinal deviations, respectively; (e) the density distribution after correction, while panels (d) and (f) display the corresponding longitudinal and latitudinal deviation projections. The statistics are based on data collected during the boreal warm season (March–September) from 2019 to 2023.
By aggregating the fitted results from all subregions across the full LMI field of view, we obtain the spatiotemporal distribution of lightning geolocation deviations over the entire observational domain (Fig. 7). It should be noted that the color scale in Fig. 7 is capped at ±0.3°; values exceeding this range (mainly occurring in a few northwestern subregions due to large observation angles and the launch-induced meridional deviation of the left-half CCD array) are displayed as “0.3<” or “” to avoid stretching the color scale and obscuring the spatiotemporal variations in the rest of the domain. From the latitude deviation patterns, a pronounced thermal deformation signal emerges, initiating around 10:00 UTC and expanding from the southeast toward the entire domain. This signal intensifies until approximately 16:00 UTC, after which it gradually weakens, stabilizing near 22:00 UTC before entering the Zhang et al. (2026a) and other previous studies. In contrast, the longitude deviations exhibit a different characteristic. A marked systematic offset is evident on the western half of the LMI CCD array, attributable to intrinsic displacement of the detector plane. This offset exerts a stronger influence in the zonal (longitude) direction than in the meridional (latitude) direction, thereby partially masking the canonical eastward intensification and subsequent westward attenuation associated with thermal deformation. Nevertheless, a clear temporal modulation of the longitude deviation remains discernible. Another noteworthy feature is the presence of distinct “boundaries” within the LMI observational domain, which arise from the regionalized processing strategy adopted in the operational LMI algorithm. Specifically, the algorithm partitions the field of view into a 4×4 grid comprising 16 regions, within which lightning characteristics are processed independently (Hui et al., 2020a, b). This regionalized treatment introduces discontinuities and anomalous geolocation characteristic near the boundaries, giving rise to the systematic, boundary like deviation patterns observed around 30° N in Fig. 7, as well as the extended temporal gaps in lightning detections evident for certain edge subregions (for example, Fig. 7d). These artifacts underscore the influence of algorithmic partitioning on the spatial coherence of LMI lightning products and motivate further investigation, which we address in subsequent sections.
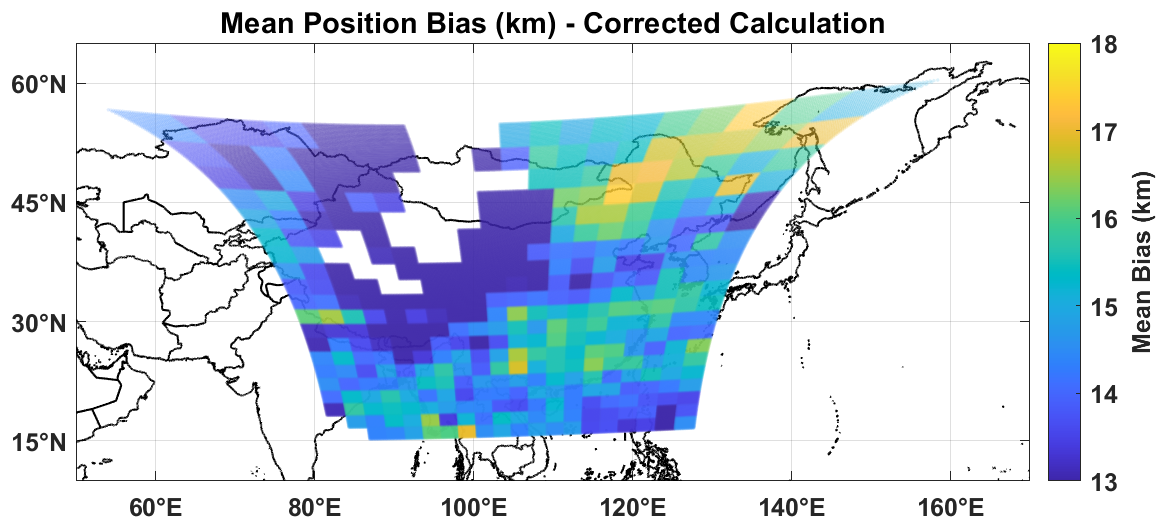
Figure 9Spatial distribution of lightning geolocation accuracy over the LMI Northern Hemisphere observational domain.
Figure 8 presents the distributions of coordinate deviations between LMI events and WWLLN flashes before and after correction, with WWLLN flashes serving as the reference. As shown in Fig. 8b, after applying only the CTH parallax correction as preprocessing, most LMI lightning detections still exhibit a pronounced northward bias along with a moderate eastward bias. Quantitative statistics based on over nine million matched LMI-WWLLN pairs indicate that prior to the proposed correction, only 58.2 % of LMI events have a geolocation deviation within 20 km. Following the proposed correction (Fig. 8e), the coordinate difference distribution converges substantially. The proportion of events with a deviation ≤ 15 km increases from 36.0 % to 51.7 %, and that with a deviation ≤ 20 km increases from 58.2 % to 74.8 %. In terms of the zonal and meridional components, after correction, 90.3 % of longitude differences and 90.5 % of latitude differences are within 20 km of the WWLLN reference, compared with 82.9 % and 83.5 % before correction. Most data points become more tightly clustered around zero and approximately follow a Gaussian distribution, with longitude deviations mainly confined to (−0.1, −0.15°) and latitude deviations to (−0.05, −0.15°). The overall dispersion is markedly reduced, indicating a substantial improvement in geolocation accuracy.
It should be noted that relatively broad spatiotemporal matching thresholds were adopted in this study to associate LMI events with lightning-dense regions represented by ground-based observations, rather than to enforce a strict one-to-one correspondence between individual discharges. Consequently, some mismatches and noise are inevitable, resulting in a small fraction of data points with comparatively large deviations. The intrinsic location uncertainty of WWLLN also contributes to the residual spread. Therefore, we focus primarily on the high-density regions of the distribution plots, which better reflect the characteristics of actual lightning events. With a sufficiently large sample size, the effects of mismatches and random noise are effectively mitigated in a statistical sense, enabling robust correction of the systematic geolocation biases.
Subsequently, the fitted curve values are applied as correction terms to the lightning observations, and a corrected LMI event dataset is generated. Using this dataset, we evaluate the geolocation accuracy across the LMI observational domain (Fig. 9). The results show that, over most southern regions, the lightning geolocation accuracy is maintained at approximately 15 km (about 1.5 pixels), representing a relatively ideal level of performance. It should be noted, however, that this statistical assessment is based on relatively broad matching thresholds (3 s, 30 km), which inevitably introduce mismatches from non-corresponding convective cells. The background noise introduced by this broad-window matching largely amplifies the estimated average deviation; consequently, the actual corrected geolocation accuracy is expected to be better than 15 km. This will be further demonstrated and discussed in the specific convective case study presented in the following section. Additionally, parts of Xinjiang and Mongolia, as well as regions near India along the southwestern edge of the observational domain, experience sparse lightning activity. This leads to data gaps that preclude a robust accuracy assessment.
Therefore, in these data-sparse regions, we do not apply the empirical correction due to insufficient matched LMI-WWLLN events for reliable curve fitting. Instead, we retain the original physics-based corrections. A smoother fitted curve in low-sample regions does not indicate higher geolocation accuracy; it merely reflects lower random noise. In such regions, the small number of lightning events results in a low probability of mismatches, which artificially reduces the standard deviation of the deviations and makes the fitted curve appear smoother. However, this apparent smoothness should not be misinterpreted as superior correction quality. True reliability and robustness of the fitted correction still depend primarily on having a sufficiently large sample size. Therefore, the empirical correction is applied only where sufficient matched events are available, and the results in low-lightning regions are not considered reliable.
In contrast, regions with high lightning activity are often associated with widespread, organized severe convective systems (e.g., mesoscale convective systems), where lightning is distributed over hundreds of kilometers and different convective cells may overlap in space and time. Under our relatively broad matching thresholds (3 s, 30 km), such widespread activity inevitably introduces mismatches from non-corresponding convective cells, leading to larger standard deviations in the deviation estimates and less smooth fitted curves. Nevertheless, the larger sample size in these active regions ensures that the fitted correction is statistically more robust and representative, despite the increased apparent scatter. A distinct degradation in geolocation accuracy is observed in the northeastern portion of the observational domain. This is primarily due to the intrinsically coarse spatial resolution of the detector elements in this region, where a single pixel can exceed 20 km in ground coverage, thereby degrading the overall data quality. Overall, after correction, the geolocation accuracy of LMI lightning observations is spatially stable across most of the observational domain.
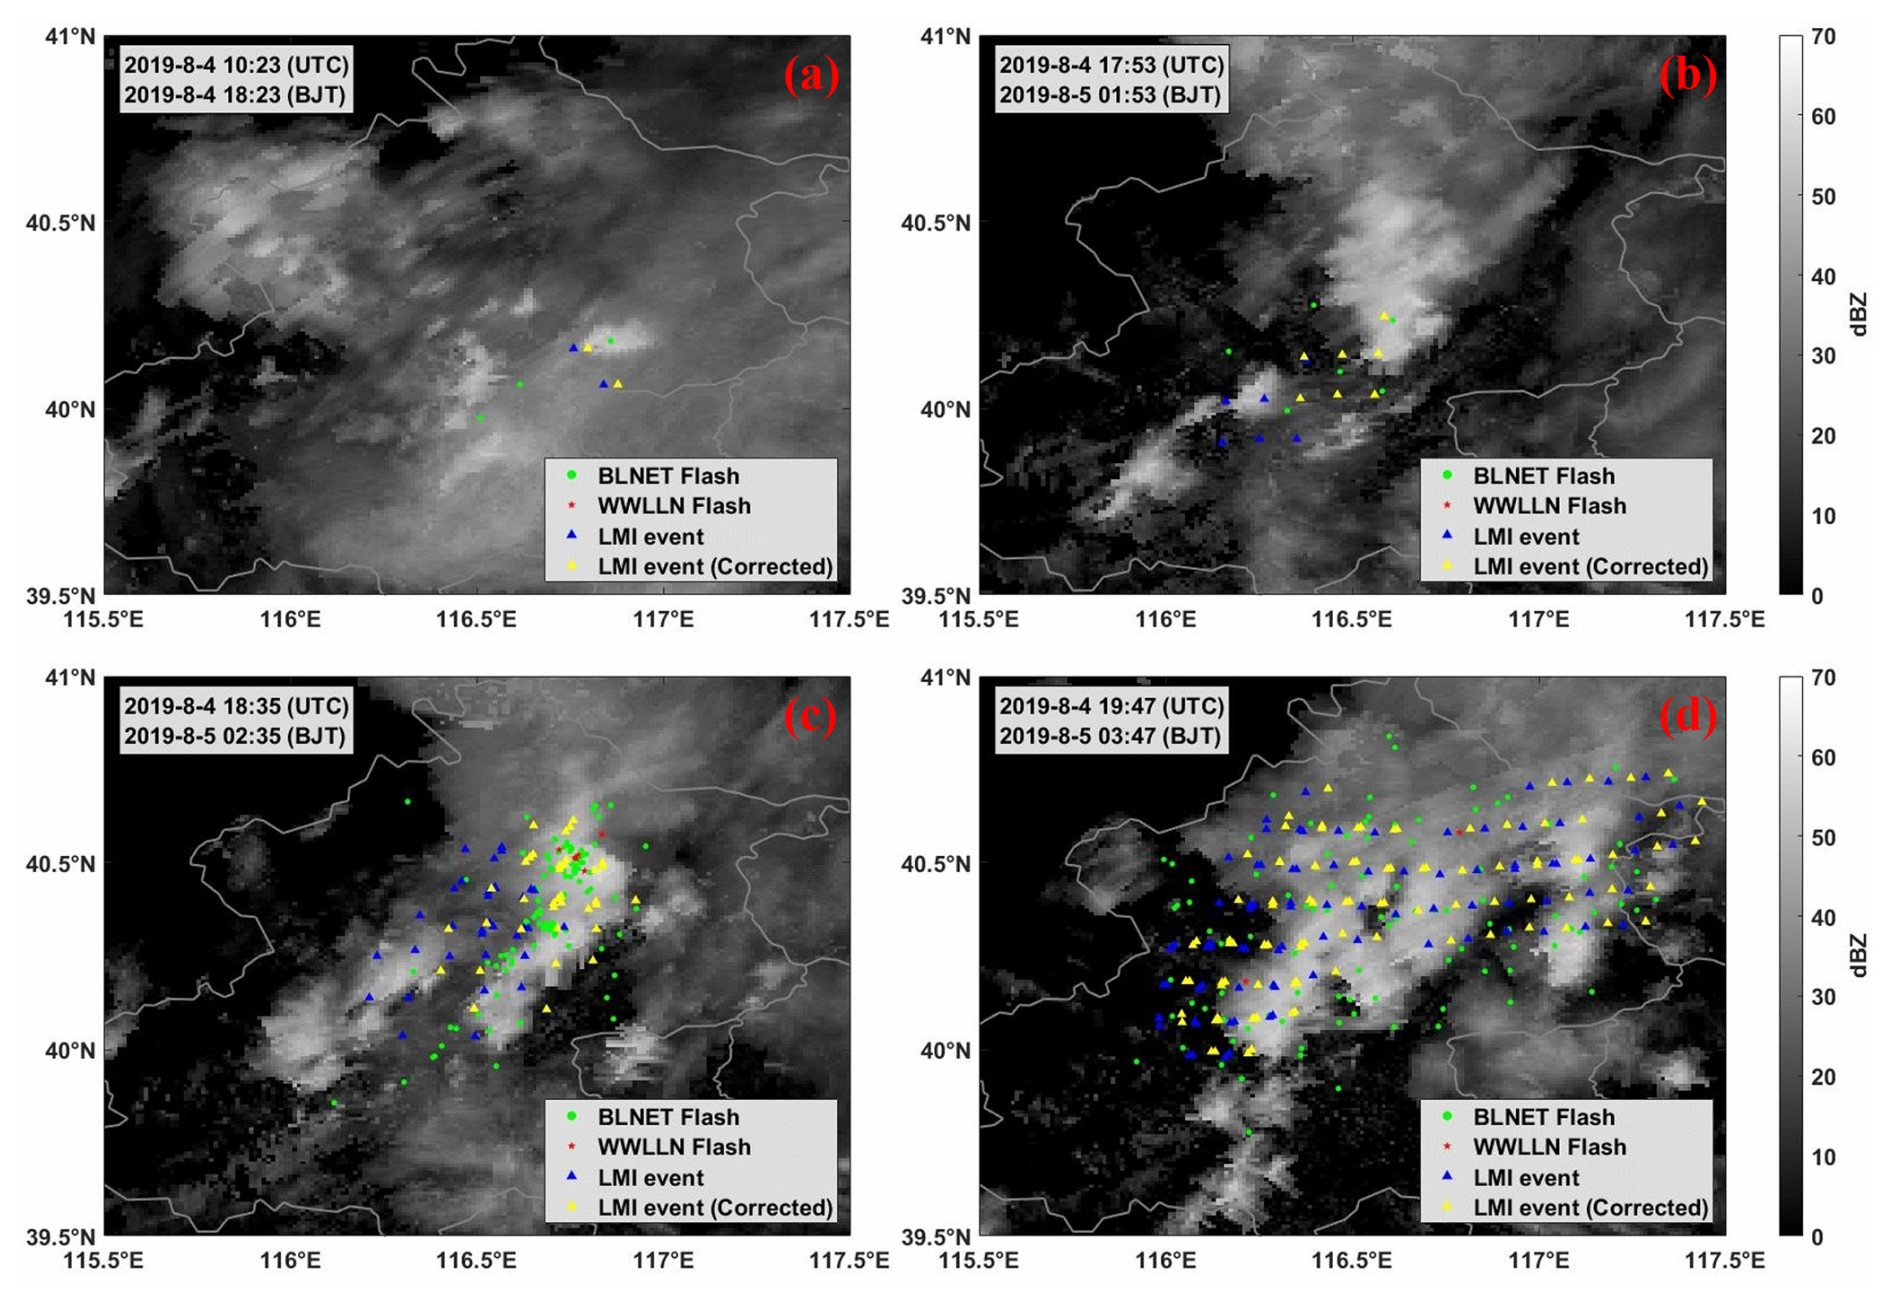
Figure 10Comparison of LMI correction results before and after with BLNET and WWLLN flash. The red dots represent the matched WWLLN flash data, the green dots indicate the matched BLNET flash data, the yellow dots show the LMI events data after correction, and the blue dots show the LMI events data before correction. The background indicates radar composite reflectivity.
For the severe convective case over Beijing on 4 August 2019, which was previously used to illustrate the systematic southwestward deviations (see Introduction), Fig. 10 compares the LMI event locations before and after correction with BLNET flashes, WWLLN flashes, and radar composite reflectivity. The time window 18:00–20:00 UTC is examined because the thermal deformation effect was most significant during this period, consistent with the diurnal variation noted earlier. As shown in Fig. 10, before correction, LMI events exhibited a systematic southwestward deviation relative to BLNET flashes, WWLLN flashes, and the high-radar-reflectivity cores; after correction, the LMI events align more closely with the ground-based lightning location results and generally cover the high-radar-reflectivity areas. After correction, the LMI events align more closely with the areas of strongest radar reflectivity and show better agreement with both BLNET and WWLLN flash locations, indicating a notable improvement in correction performance. It should be noted that due to differences in detection principles, the detection efficiencies of LMI and WWLLN are relatively low. Consequently, the number of LMI events and WWLLN flashes displayed in the figure is significantly lower than that of BLNET flashes, which has a much higher detection efficiency.
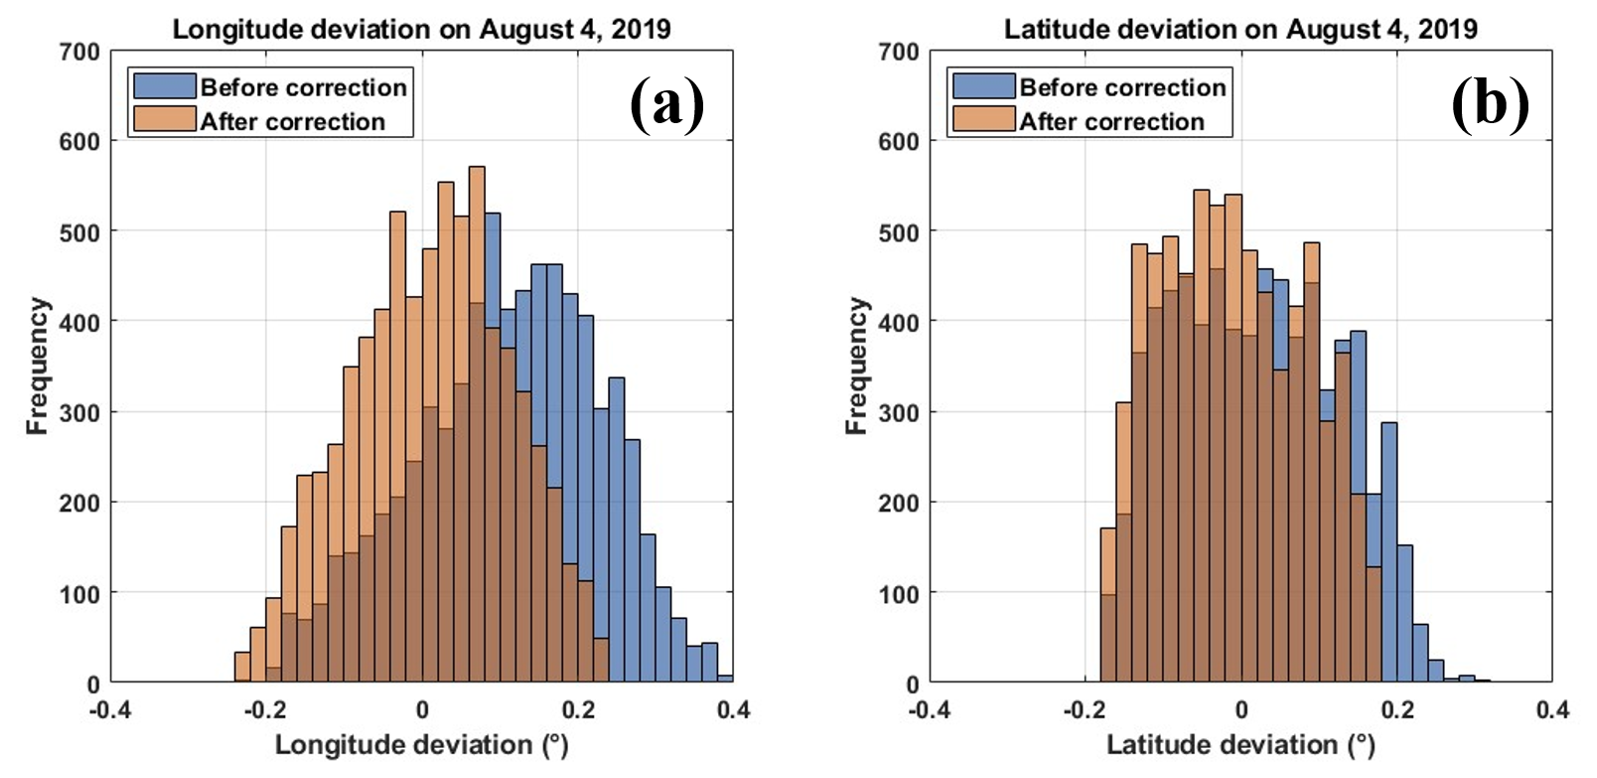
Figure 11Distributions of coordinate differences between LMI events and BLNET flashes before and after correction.
In addition to the visual comparison, we also conducted a quantitative evaluation of the LMI geolocation deviation for this severe convective system using BLNET as an independent reference. Figure 11 shows the distributions of coordinate deviations between LMI events (before and after correction) and the matched BLNET flashes. However, it is worth noting that the relatively broad thresholds (3 s, 30 km) inevitably introduce mismatches from non-corresponding convective cells. As shown in Fig. 10c, the BLNET flashes within the matching window cover almost the entire high-reflectivity convective region, which dilutes the statistical improvement and masks the true correction effect. To better quantify the actual correction performance, we conducted a sensitivity experiment specifically for the BLNET validation thresholds (see Appendix B). Under the stricter thresholds (2 s, 20 km), which effectively removed much of the background noise, the statistical results from the coordinate differences between LMI events and BLNET flashes (Fig. 11a and b) show that the distributions of both zonal and meridional deviations become more convergent after correction and exhibit a Gaussian-like distribution centered at zero. Specifically, 70 % of the longitude deviations are within ±0.069° with a mean of 0.016°, and 70 % of the latitude deviations are within ±0.046° with a mean of −0.016°. These accuracy levels are comparable to those achieved by post-processing corrections using regional high-precision lightning location networks (Zhang et al., 2026a), confirming the effectiveness of the proposed method.
Overall, the spatial alignment between the corrected LMI events and the BLNET flashes, as well as with radar reflectivity cores, is visibly improved in the spatial plots, confirming the overall effectiveness of the correction. This demonstrates that the WWLLN-based empirical spline-fitting method, when combined with existing physical corrections, effectively reduces systematic geolocation biases in LMI observations, as further validated by independent BLNET and radar data.
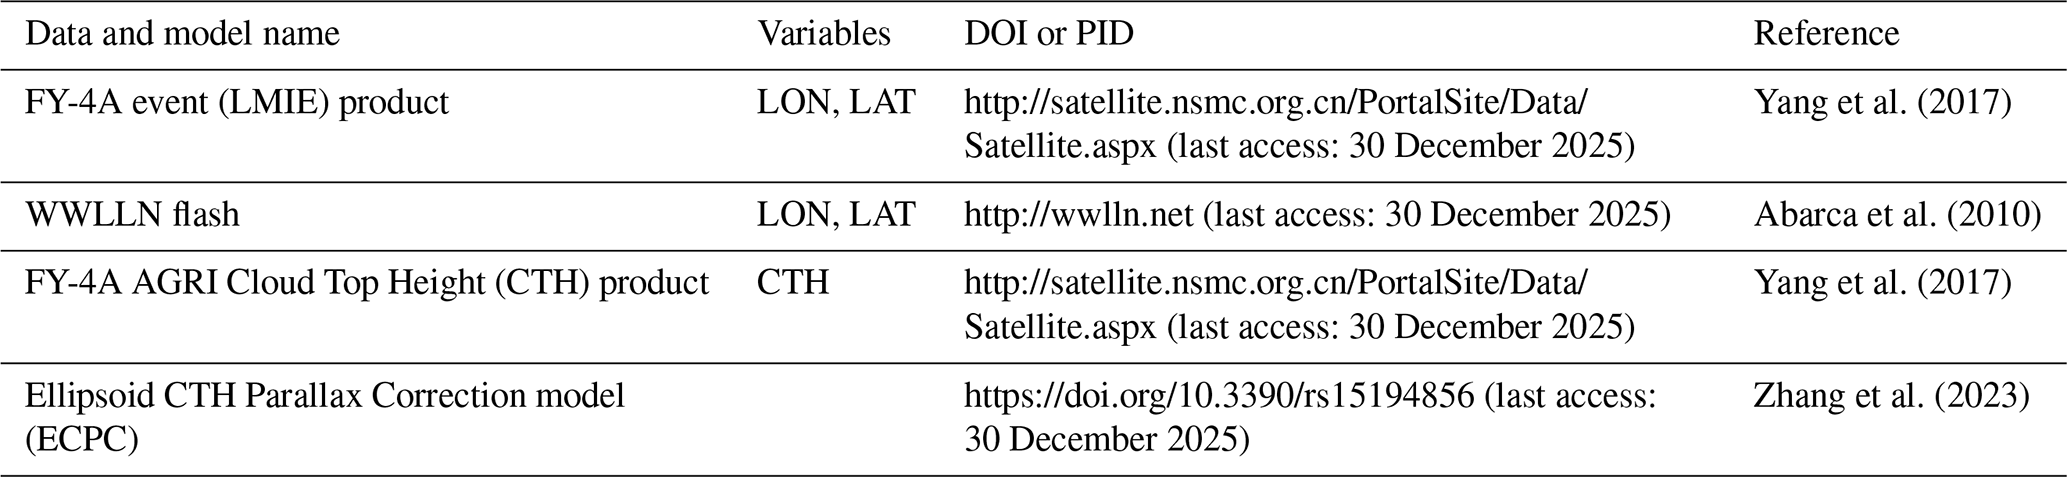
The corrected FY-4A LMI event dataset produced in this study is publicly available at https://doi.org/10.11888/Atmos.tpdc.303312 (Zhang et al., 2026b). The corrected lightning dataset generated in this study is stored in both tabular (.csv) and NetCDF (.nc) formats, with one file produced per day. The CSV format offers flexibility for users who prefer tabular data, while the NetCDF format provides standardized metadata and is suitable for large-scale processing. The dataset covers corrected LMI event data from March to September for the period 2019–2023. Detailed descriptions of the table attributes are provided in Table A1. Information on the acquisition of all other datasets used in this study is summarized in Table A2. The BLNET and radar data used for independent validation in this study are not open access and can be obtained by contacting the corresponding author.
Spaceborne lightning observations are inevitably affected by solar radiation, satellite platform jitter, and systematic offsets of the detector array, which together introduce periodic and random geolocation deviations. To address these issues for the FY-4A LMI, this study develops an empirical correction framework based on a robust spline-fitting model using WWLLN as a reference for lightning-dense regions. The method quantifies the spatiotemporal patterns of residual deviations and applies fitted correction curves to the original Level-2 products, resulting in a publicly available corrected dataset https://doi.org/10.11888/Atmos.tpdc.303312 (Zhang et al., 2026b). Independent validation using the high-precision BLNET over Beijing confirms the effectiveness of the correction.
The coarse-estimate mean geolocation error of the corrected dataset is within 15 km (about 1.5 pixels) across most of the LMI field of view, with the actual accuracy being better. Independent validation using BLNET over Beijing shows that for 70 % of the events, longitude deviations are within 0.069° and latitude deviations are within ±0.046°, corresponding to a comprehensive geolocation error within approximately one pixel, approaching the accuracy level of the GOES-R GLM. This residual error has different implications depending on the application. For storm-scale studies, such as lightning data assimilation, convective initiation, lightning jump, and storm tracking, the kilometer-scale error is comparable to the typical size of a convective core (∼10–20 km) and is acceptable for convective-scale numerical models (typical grid spacings of 3–15 km), as demonstrated by the improved spatial alignment with radar reflectivity cores in the Beijing case study. For climatological studies, such as gridded lightning climatology at 0.25° or coarser, trend analysis, or regional lightning frequency mapping, the residual error is negligible, as random components tend to cancel out over long-term averaging. For applications requiring higher precision, for example lightning-induced NOx estimation with point-by-point alignment or validation of high-resolution satellite products, users should be aware that the kilometer-scale residual remains.
The corrected dataset opens new avenues for advancing lightning research and its applications. It can serve as a benchmark for training artificial intelligence models in lightning nowcasting, for example using deep learning to predict convective initiation or lightning jumps, and for identifying lightning-structure relationships from satellite data. The dataset also provides an independent observational constraint for evaluating numerical weather and climate models, particularly the performance of convective parameterizations and lightning parameterization schemes in models such as WRF and GRAPES. Furthermore, it enables long-term climatological analyses of lightning activity over the Northern Hemisphere with improved spatial consistency. Looking forward, the methodology can be extended to FY-4C LMI data, though adjustments will be needed for its different orbital position (133° E) and predominantly oceanic view. Future work will also explore multi-source data fusion, for example combining WWLLN with satellite-borne lightning imagers such as LIS, to further enhance geolocation accuracy, especially over oceans.
Table A1Detailed descriptions of the FY-4A LMI Event Corrected Dataset.
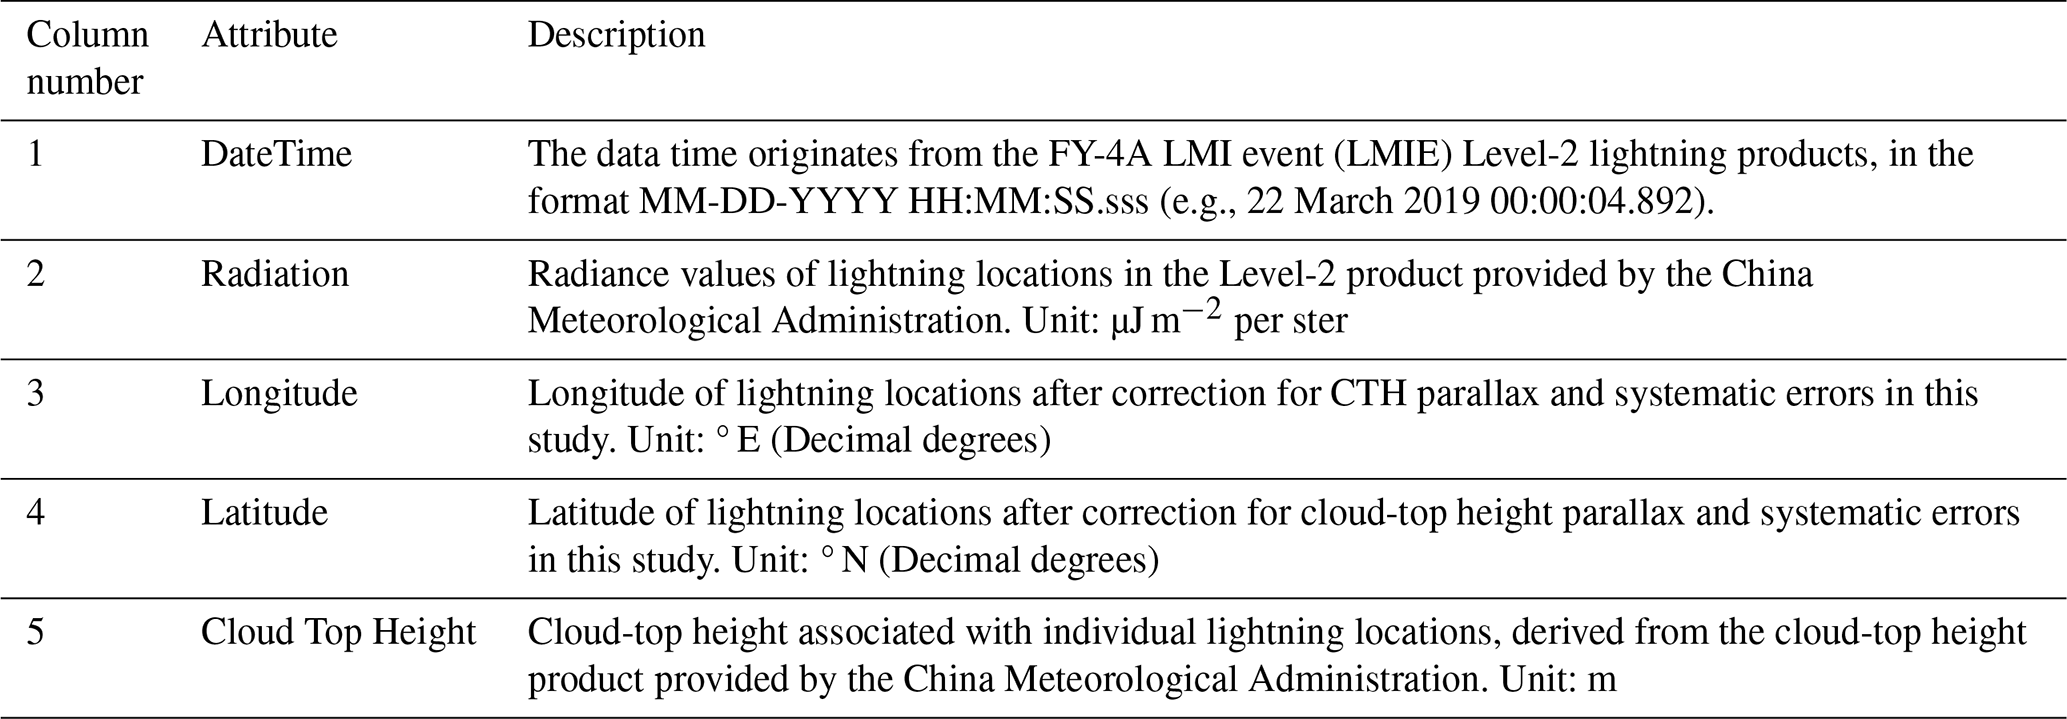
Table A2Overview of where to find the data and model used in the current work.
To determine the optimal spatiotemporal matching thresholds for evaluating the correction performance using BLNET as an independent reference, we conducted a sensitivity experiment based on the severe convective case over Beijing on 4 August 2019. Figure B1a shows the variation in the number of matched events under different temporal windows (0.5 to 4 s) and spatial windows (15 to 40 km). The results indicate that, regardless of the spatial window, the growth rate of matched events stabilizes when the temporal window reaches approximately 2 s, suggesting that 2 s is an appropriate temporal threshold for capturing true coincidences while suppressing false matches. Figure B1b further presents the change in matched events with increasing spatial threshold under the fixed 2 s temporal window. The marginal gain in matched events is largest between 20 and 30 km, while beyond 30 km the increase flattens and further enlarging the window would introduce excessive background noise. Unlike the WWLLN matching strategy, which favoured a relatively larger threshold within the marginal gain interval to accumulate sufficient data for robust curve fitting, the BLNET validation focuses on minimizing the dilution of the magnitude of improvement before and after correction by noise when calculating coordinate differences. Therefore, we select the lower end of the interval, i.e., 20 km, as the optimal spatial threshold. Accordingly, in the BLNET-based validation for correction performance evaluation, we adopt 2 s and 20 km as the spatiotemporal matching thresholds.
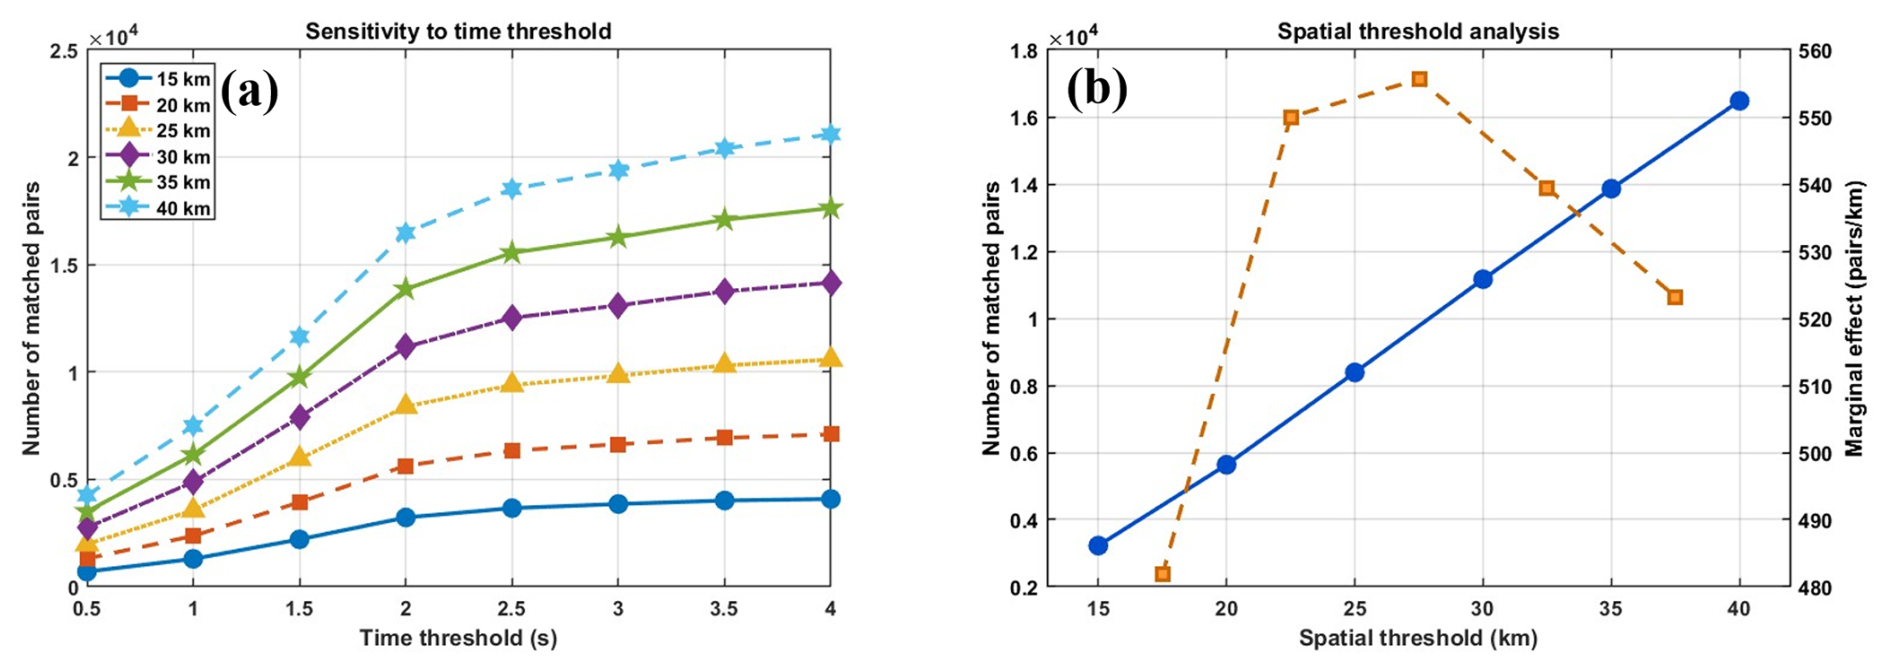
Figure B1Sensitivity experiments on spatiotemporal matching thresholds for matching LMI events with BLNET flashes. (a) Statistics of the number of matched events under different spatiotemporal threshold settings; (b) marginal effect analysis under a fixed temporal threshold of 2 s.
YZ: data curation, investigation, validation, visualisation, writing (original draft), writing (review and editing), conceptualisation, formal analysis, methodology, soft ware. XQ: investigation, validation, methodology, writing (original draft), writing (review and editing), conceptualisation, formal analysis, funding acquisition, resources. RJ: data curation, formal analysis, methodology, writing (original draft), writing (review and editing). DC: data curation, methodology, writing (review and editing), resources. JY: data curation, methodology, writing (review and editing), resources. DW: data curation, methodology, writing (original draft), writing (review and editing). ML: writing (review and editing). DL: data curation, writing (review and editing). ZS: writing (review and editing). HZ: writing (review and editing). SY: methodology, writing (review and editing).
The contact author has declared that none of the authors has any competing interests.
Publisher's note: Copernicus Publications remains neutral with regard to jurisdictional claims made in the text, published maps, institutional affiliations, or any other geographical representation in this paper. The authors bear the ultimate responsibility for providing appropriate place names. Views expressed in the text are those of the authors and do not necessarily reflect the views of the publisher.
The authors thank the National Satellite Meteorological Center for providing the FY-4A LMI data “http://satellite.nsmc.org.cn/PortalSite/Data/Satellite.aspx (last access: 30 December 2025)”, and the WWLLN “http://wwlln.net (last access: 30 December 2025)”, a collaboration among over 40 universities and institutions, for providing the WWLLN data used in this paper.
This research was funded by the National Natural Science Foundation of China (grant nos. 42230609 and 42027803) and the Strategic Priority Research Program of the Chinese Academy of Sciences (grant no. XDB0760300).
This paper was edited by Bastiaan van Diedenhoven and reviewed by Rupraj Biswasharma and one anonymous referee.
Abarca, S. F., Corbosiero, K. L., and Galarneau, T. J.: An evaluation of the worldwide lightning location network (wwlln) using the national lightning detection network (nldn) as ground truth, J. Geophys. Res.-Atmos., 115, 2009JD013411, https://doi.org/10.1029/2009JD013411, 2010.
Brune, W. H., Mcfarland, P. J., Bruning, E., Waugh, S., Macgorman, D., Miller, D. O., Jenkins, J. M., Ren, X., Mao, J., and Peischl, J.: Extreme oxidant amounts produced by lightning in storm clouds, Science, 372, 711–715, https://doi.org/10.1126/science.abg0492, 2021.
Buechler, D., Varghese, T., Armstrong, P., Bremer, J., Lamb, R., Fulbright, J., Goodman, S., Butler, J. J., Xiong, X. J., and Gu, X.: On-orbit validation of the geolocation accuracy of goes-16 geostationary lightning mapper (glm) flashes using ground-based laser beacons, in: Earth Observing Systems XXIII, SPIE, 2018/1/1, 107640J, 2018.
Cao, D.: The development of product algorithm of the fengyun-4 geostationary lightning mapping imager, Adv. Meteorol. Sci. Techol., 6, 94–98, 2016.
Cao, D., Lu, F., Zhang, X., and Yang, J.: Lightning activity observed by the fengyun-4a lightning mapping imager, Remote Sens., 13, 3013, https://doi.org/10.3390/rs13153013, 2021.
Carr, J. L., Tillier, C. E., and Shu, Y.: Validation of image navigation and registration for the geostationary lightning mapper, J. Appl. Remote Sens., 3, 1, https://doi.org/10.1117/1.JRS.14.032403, 2020.
Chen, Z., Qie, X., Sun, J., Xiao, X., Zhang, Y., Cao, D., and Yang, J.: Evaluation of fengyun-4a lightning mapping imager (lmi) performance during multiple convective episodes over beijing, Remote Sens., 13, 1746, https://doi.org/10.3390/rs13091746, 2021.
Cheng, K., Tong, X., Liu, S., Yan, X., and Li, H.: An on-orbit geometric calibration approach based on double tubes edge-binding feng yun-4a lightning mapping imager, J. Geomat. Sci. Technol., 38, 477–484, 2021.
Fan, P., Zheng, D., Zhang, Y., Gu, S., Zhang, W., Yao, W., Yan, B., and Xu, Y.: A performance evaluation of the world wide lightning location network (wwlln) over the tibetan plateau, J. Atmos. Ocean. Tech., 35, 927–939, https://doi.org/10.1175/JTECH-D-17-0144.1, 2018.
Goodman, S. J., Blakeslee, R. J., Koshak, W. J., Mach, D., Bailey, J., Buechler, D., Carey, L., Schultz, C., Bateman, M., Mccaul, E., and Stano, G.: The goes-r geostationary lightning mapper (glm), Atmos. Res., 125–126, 34–49, https://doi.org/10.1016/j.atmosres.2013.01.006, 2013.
Holmlund, K., Grandell, J., Schmetz, J., Stuhlmann, R., Bojkov, B., Munro, R., Lekouara, M., Coppens, D., Viticchie, B., August, T., Theodore, B., Watts, P., Dobber, M., Fowler, G., Bojinski, S., Schmid, A., Salonen, K., Tjemkes, S., Aminou, D., and Blythe, P.: Meteosat third generation (mtg): continuation and innovation of observations from geostationary orbit, B. Am. Meteorol. Soc., 5, https://doi.org/10.1175/BAMS-D-19-0304.1, 2021.
Hui, W., Huang, F., and Liu, R.: Characteristics of lightning signals over the tibetan plateau and the capability of fy-4a lmi lightning detection in the plateau, Int. J. Remote Sens., 41, 4605–4625, https://doi.org/10.1080/01431161.2020.1723176, 2020a.
Hui, W., Zhang, W., Lyu, W., and Li, P.: Preliminary observations from the china fengyun-4a lightning mapping imager and its optical radiation characteristics, Remote Sens., 12, 2622, https://doi.org/10.3390/rs12162622, 2020b.
Jie, Z.: Comparison of the satellite-based lightning imaging sensor (lis) against the ground-based national lightning monitoring network, Prog. Geophys., 2, 541–546, 2018.
Loto Aniu, P. T. M., Davis, A., Jarvis, A., Grotenhuis, M., Rich, F. J., Califf, S., Inceoglu, F., Pacini, A., and Singer, H. J.: Initial on-orbit results from the goes-18 spacecraft science magnetometer, Space Sci. Rev., 219, 84, https://doi.org/10.1007/s11214-023-01032-3, 2023.
Peterson, M. and Mach, D.: The illumination of thunderclouds by lightning: 4. Volumetric thunderstorm imagery, Earth Space Sci., 9, https://doi.org/10.1029/2021EA001945, 2022.
Peterson, M., Light, T. E. L., and Mach, D.: The illumination of thunderclouds by lightning: 1. The extent and altitude of optical lightning sources, J. Geophys. Res.-Atmos., 127, https://doi.org/10.1029/2021JD035579, 2022a.
Peterson, M., Light, T. E. L., and Mach, D.: The illumination of thunderclouds by lightning: 2. The effect of glm instrument threshold on detection and clustering, Earth Space Sci., 9, https://doi.org/10.1029/2021EA001943, 2022b.
Peterson, M., Light, T. E. L., and Mach, D.: The illumination of thunderclouds by lightning: 3. Retrieving optical source altitude, Earth Space Sci., 9, https://doi.org/10.1029/2021EA001944, 2022c.
Qie, X., Yuan, S., Chen, Z., Wang, D., Liu, D., Sun, M., Sun, Z., Srivastava, A., Zhang, H., Lu, J., Xiao, H., Bi, Y., Feng, L., Tian, Y., Xu, Y., Jiang, R., Liu, M., Xiao, X., Duan, S., Su, D., Sun, C., Xu, W., Zhang, Y., Lu, G., Zhang, D., Yon, Y., and Yu, Y.: Understanding the dynamical-microphysical-electrical processes associated with severe thunderstorms over the beijing metropolitan region, Sci. China Earth Sci., 4, 10–26, https://doi.org/10.1007/s11430-020-9656-8, 2021.
Qie, X., Zhang, Y., Zhang, D., Yin, Y., Yu, Y., Lu, G., and Jiang, R. (Eds:): Principles and forecast of thunderbolt weather system, Science Press, Beijing, ISBN 9787030737281, 2023.
Rodger, C. J., Werner, S., Brundell, J. B., Lay, E. H., Thomson, N. R., Holzworth, R. H., and Dowden, R. L.: Detection efficiency of the VLF World-Wide Lightning Location Network (WWLLN): initial case study, Ann. Geophys., 24, 3197–3214, https://doi.org/10.5194/angeo-24-3197-2006, 2006.
Rudlosky, S. D., Goodman, S. J., Virts, K. S., and Bruning, E. C.: Initial geostationary lightning mapper observations, Geophys. Res. Lett., 46, 1097–1104, https://doi.org/10.1029/2018GL081052, 2019.
Thompson, K., Bateman, M., and Carey, L.: A comparison of two ground-based lightning detection networks against the satellite-based lightning imaging sensor (lis), J. Atmos. Ocean. Tech., 10, 2191–2205, https://doi.org/10.1175/JTECH-D-13-00186.1, 2014.
Wang, D., Sun, Z., Yuan, S., Lu, J., Qie, X., Liu, M., Xu, Y., Lu, G., and Tian, Y.: Beijing broadband lightning network and the spatiotemporal evolution of lightning flashes during a thunderstorm, Chinese J. Atmos. Sci., 44, 851–864, https://doi.org/10.3878/j.issn.1006-9895.1910.19161, 2020.
Wang, J., Tong, X., Yang, L., Shang, J., Liu, C., Bao, S., Zhang, Z., and Yang, J.: Image navigation for fy-4a lightning mapping imager, IEEE J. Select. Top. Appl. Earth Obs. Remote Sens., 14, 11450–11465, https://doi.org/10.1109/JSTARS.2021.3124955, 2021.
Wang, Y., Qie, X., Wang, D., Liu, M., Su, D., Wang, Z., Liu, D., Wu, Z., Sun, Z., and Tian, Y.: Beijing lightning network (blnet) and the observation on preliminary breakdown processes, Atmos. Res., 171, 121–132, https://doi.org/10.1016/j.atmosres.2015.12.012, 2016.
Wu, A., Cai, L., Guo, J., and Ding, M.: Comparative study on lightning data between the fengyun-4a satellite and the national lightning monitoring network in guizhou, china, J. Atmos. Sol.-Terr. Phy., 256, 106194, https://doi.org/10.1016/j.jastp.2024.106194, 2024.
Yang, J., Zhang, Z., Wei, C., Lu, F., and Guo, Q.: Introducing the new generation of chinese geostationary weather satellites, fengyun-4, B. Am. Meteorol. Soc., 98, 1637–1658, https://doi.org/10.1175/BAMS-D-16-0065.1, 2017.
Zhang, H., Zhao, X., Mei, Q., Wang, Y., Song, S., and Yu, F.: On-orbit thermal deformation prediction for a high-resolution satellite camera, Appl. Therm. Eng., 195, 117152, https://doi.org/10.1016/j.applthermaleng.2021.117152, 2021.
Zhang, W., Zhang, Y., Zheng, D., Wang, F., and Xu, L.: Relationship between lightning activity and tropical cyclone intensity over the northwest pacific, J. Geophys. Res.-Atmos., 120, 4072–4089, https://doi.org/10.1002/2014JD022334, 2015.
Zhang, Y., Cao, D., Yang, J., Lu, F., Wang, D., Liu, R., Zhang, H., Liu, D., Chen, Z., Lyu, H., Cai, W., Bao, S., and Qie, X.: A parallax shift effect correction based on cloud top height for fy-4a lightning mapping imager (lmi), Remote Sens., 15, 4856, https://doi.org/10.3390/rs15194856, 2023.
Zhang, Y., Qie, X., Cao, D., Yuan, S., Wang, D., Zhang, H., Liu, D., Sun, Z., Liu, M., Zhu, K., Jiang, R., and Yang, J.: Thermal deformation correction for the fy-4a lmi, Remote Sens., 18, 163, https://doi.org/10.3390/rs18010163, 2026a.
Zhang, Y., Qie, X., Jiang, R., Cao, D., Yang, J., Wang, D., Liu, M., Liu, D., Sun, Z., Zhang, H., and Yuan, S.: Corrected event dataset of FY-4A LMI in Northern Hemisphere (2019–2023, March–September), National Tibetan Plateau/Third Pole Environment Data Center [data set], https://doi.org/10.11888/Atmos.tpdc.303312, 2026b.
- Abstract
- Introduction
- Data
- Methods
- Results and discussion
- Data availability
- Conclusion
- Appendix A: Additional material
- Appendix B: Sensitivity experiment on matching thresholds for correction performance evaluation
- Author contributions
- Competing interests
- Disclaimer
- Acknowledgements
- Financial support
- Review statement
- References
- Abstract
- Introduction
- Data
- Methods
- Results and discussion
- Data availability
- Conclusion
- Appendix A: Additional material
- Appendix B: Sensitivity experiment on matching thresholds for correction performance evaluation
- Author contributions
- Competing interests
- Disclaimer
- Acknowledgements
- Financial support
- Review statement
- References