the Creative Commons Attribution 4.0 License.
the Creative Commons Attribution 4.0 License.
 | 31 Jul 2026
Extended global terrestrial evapotranspiration and gross primary production dataset from 1982 to near present
Zhenwu Xu
Dongdong Kong
Xuanze Zhang
The Penman–Monteith–Leuning (PML) model is a widely recognized diagnostic framework for estimating coupled terrestrial evapotranspiration (ET) and gross primary production (GPP). To address the critical need for high-fidelity, long-term, and near-present eco-hydrological records, we developed the PML-V2.2 dataset, spanning from 1982 to 2025. Driven by observation-constrained Multi-Source Weighted-Ensemble Precipitation (MSWEP) and Multi-Source Weather (MSWX) meteorological variables, the dataset comprises three complementary products: (1) PML-V2.2a, an 8 d 500 m MODIS/VIIRS satellite-based product (2000–2024 and 2012–2025) optimized for near-present monitoring (updated annually); (2) PML-V2.2b, a half-month 0.1° AVHRR-based product (1982–2020) anchoring long-term climate attribution; and (3) PML-V2.2c, a consolidated half-month 0.1° record integrating the above products for seamless 44-year continuity (1982–2025). Our methodological framework features an expanded bottom-up calibration using 208 flux sites (∼ 1400 site-years) across various plant functional types (PFTs) and a refined parameterization that explicitly distinguishes between irrigated and rainfed croplands. This distinction effectively mitigated systematic biases in agricultural regions, reducing ET and GPP estimation errors by 8.7 % and 16.2 %, respectively. Performance evaluation reveals high accuracy across PFTs (cross-validation Nash-Sutcliffe Efficiency, NSE > 0.60, absolute bias < 5 %), while top-down water-balance validation across 56 large river basins during 1982–2016 and 152 basins during 2003–2020 confirms high reliability (NSE: 0.89–0.91) as compared with other products. The MODIS- and VIIRS-based PML-V2.2a datasets are internally consistent, and exhibit high agreement with PML-V2.2b during their overlapping period (NSE = 0.90 and 0.79 for annual ET and GPP anomalies), ensuring a seamless transition across satellite epochs. Based on the consolidated PML-V2.2c dataset, global terrestrial ET and GPP during 1982–2025 are estimated at 65.8 × 10³ km3 yr−1 (with 58.2 % from transpiration) and 143.4 PgC yr−1, respectively. Long-term analysis reveals significant (p < 0.05) increasing trends in GPP (0.343 PgC yr−2) and ET (0.019 × 10³ km3 yr−2) during 1982–2025, where vegetation greening impact on ET is partially offset by physiological water saving under rising atmospheric CO2, consequently enhancing water use efficiency. By bridging the gap between satellite epochs, PML-V2.2 provides an internally consistent long-term global dataset for hydrology, ecology, and other Earth science studies. The dataset is freely accessible, with the 500 m resolution PML-V2.2a product hosted on Google Earth Engine, and all 0.1° PML-V2.2a/b/c versions archived at the National Tibetan Plateau Data Center under https://doi.org/10.11888/Terre.tpdc.303314 (Xu et al., 2026).
- Article
(17813 KB) - Full-text XML
- BibTeX
- EndNote


Terrestrial evapotranspiration (ET), the primary pathway for water transfer from the land surface to the atmosphere, plays a pivotal role in regulating Earth's hydrological cycle and energy balance (Oki, 2006; Zhang et al., 2026). As a fundamental driver of surface-atmosphere interactions, ET dictates the partitioning of net radiation into latent and sensible heat fluxes, thereby modulating surface temperatures, boundary layer dynamics, and global atmospheric circulation. Beyond its physical impact, ET serves as a critical bridge between the water and carbon cycles via transpiration, which is coupled with gross primary productivity (GPP) through stomatal regulation. This mechanism inherently governs ecosystem water use efficiency (WUE) (Zhang et al., 2022; Li et al., 2023b; Yuan et al., 2025b). Furthermore, ET acts as a major moisture source for terrestrial precipitation (P) through moisture recycling processes – a feedback increasingly critical in a greening Earth (Hoek van Dijke et al., 2022; Cui et al., 2022; Yang et al., 2023; Yao et al., 2026). Given these multifaceted roles, the development of accurate, long-term, and spatially consistent ET and GPP datasets is imperative for addressing the escalating challenges in climate, hydrological, and ecological sciences amidst global warming, precipitation shifts, and vegetation changes (Zhang et al., 2016a; Zhao et al., 2022b; Xu et al., 2022; Zhang et al., 2023).
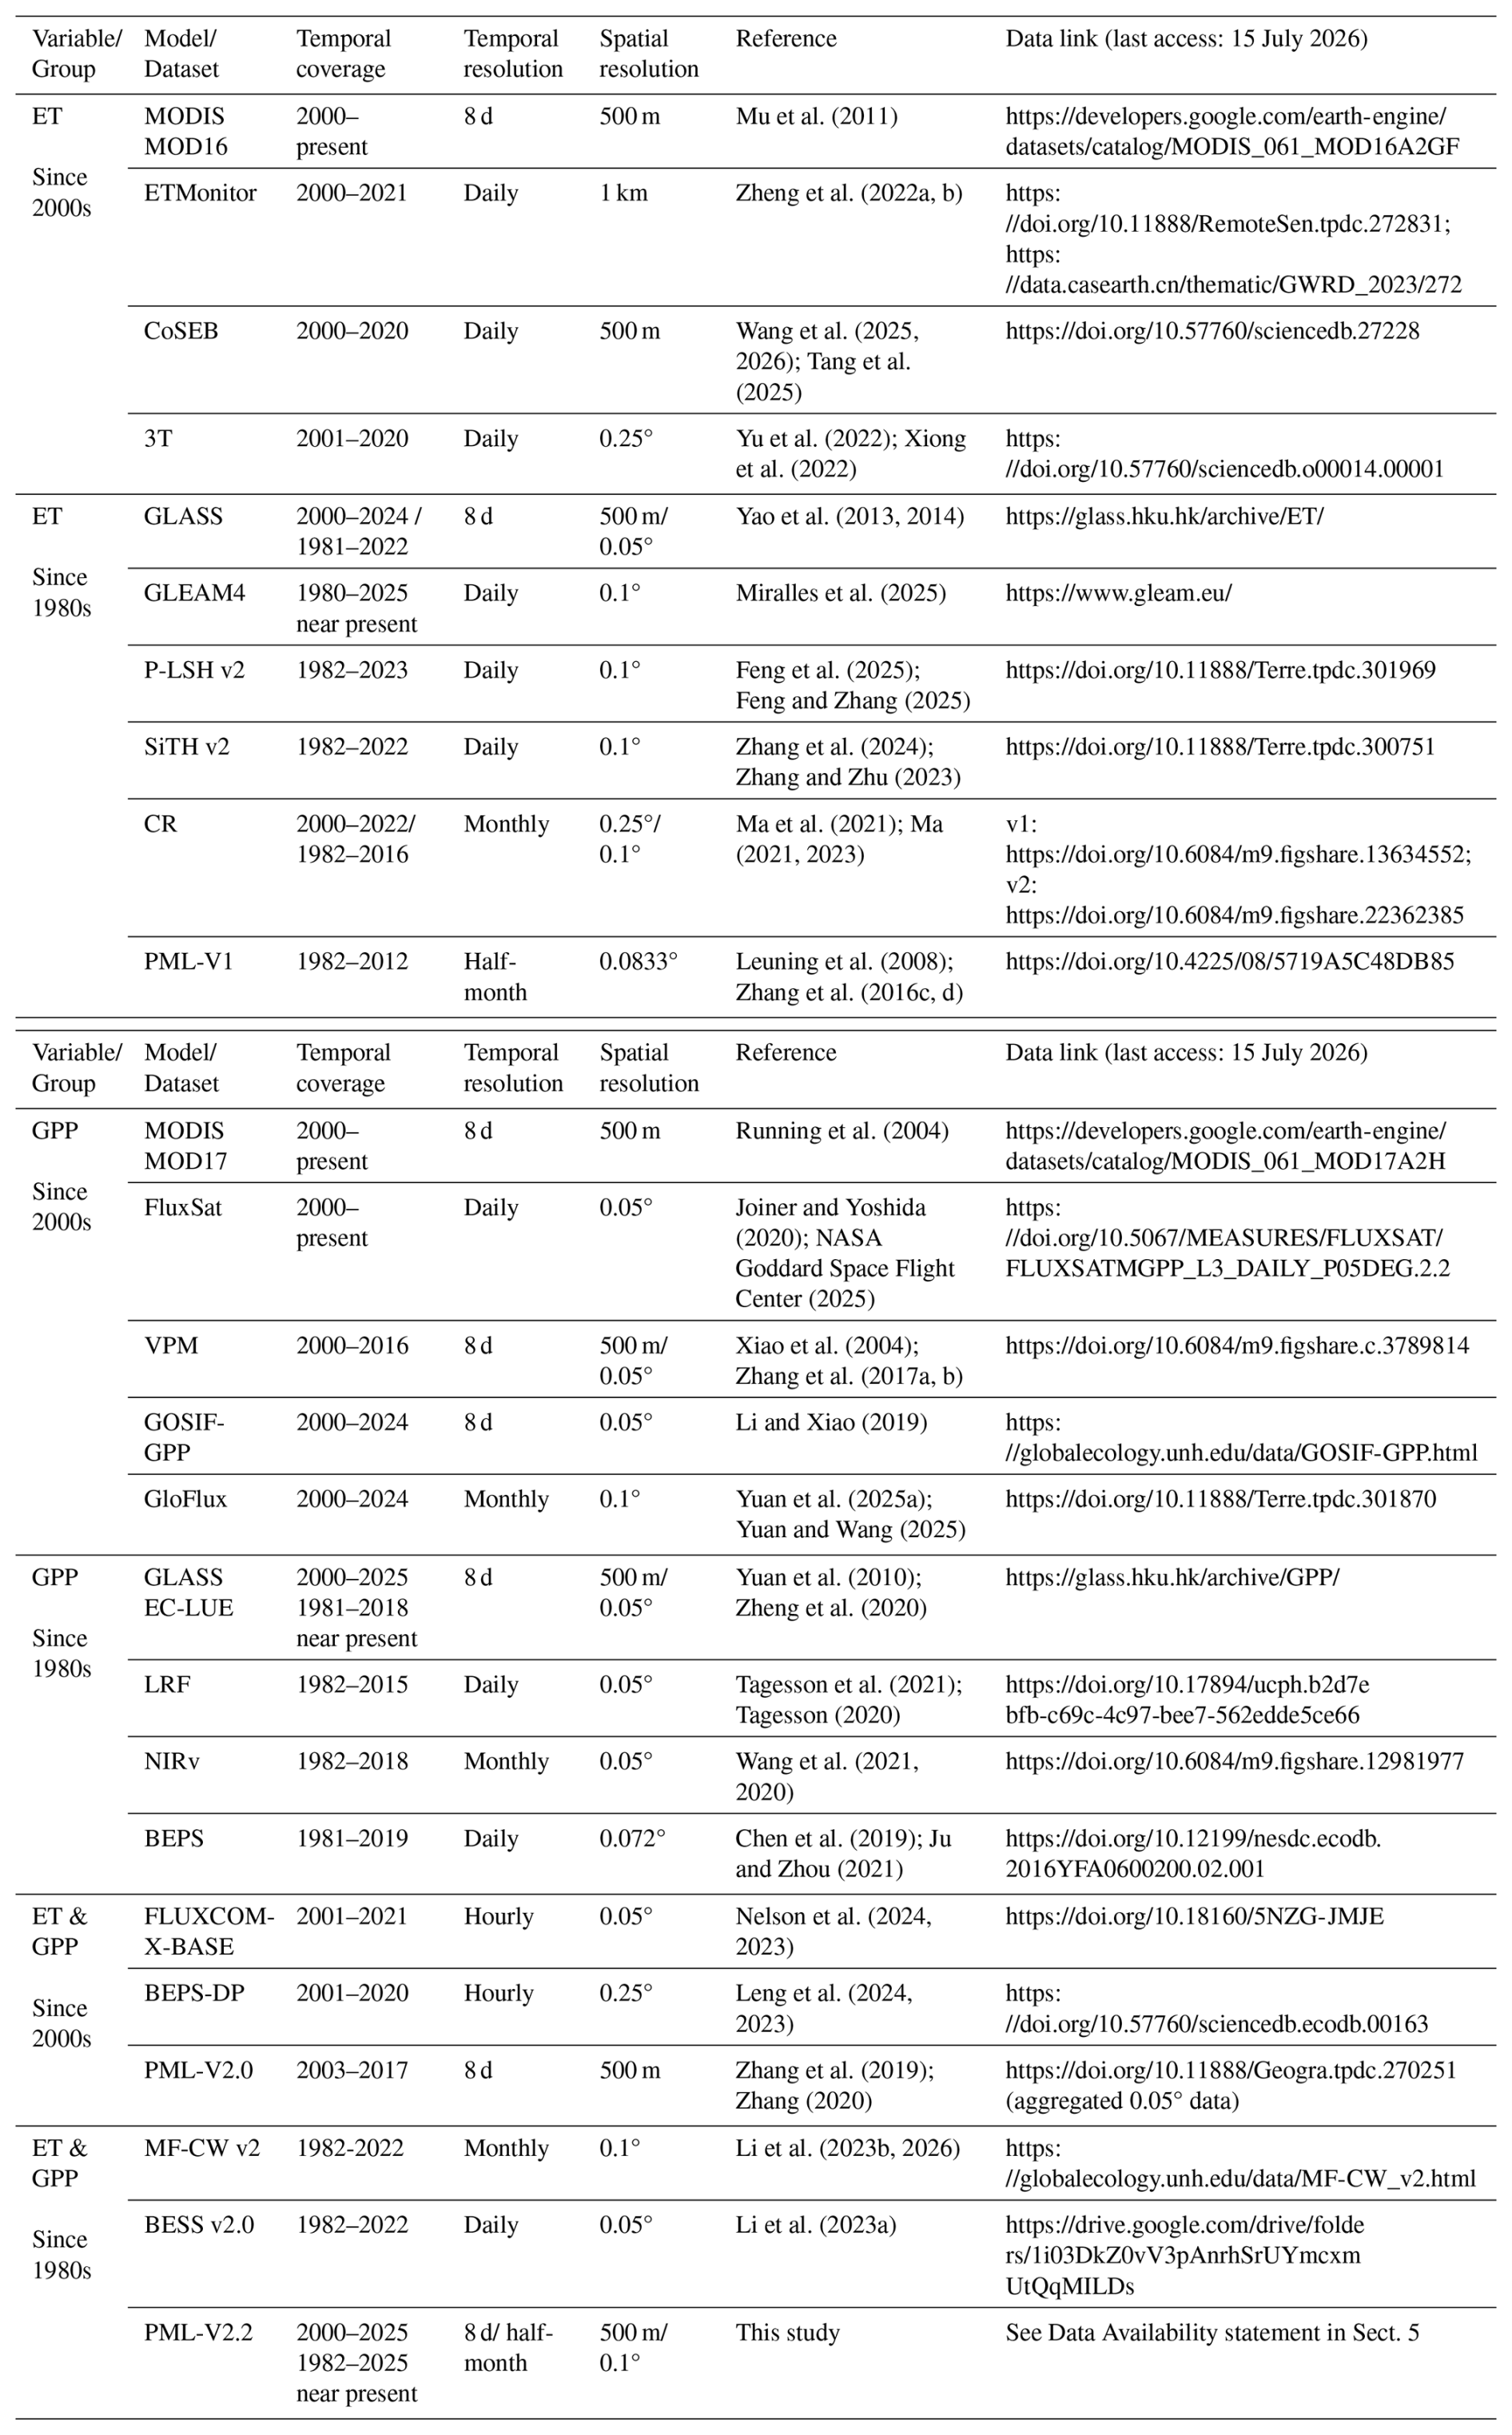
The increasing availability of satellite observations and the maturation of land surface modeling have fostered a diverse ecosystem of remote-sensing-based diagnostic ET and GPP products. Table 1 synthesizes current models, focusing on datasets with a spatial resolution of 0.25° or finer to ensure the spatial fidelity required for detailed regional and global assessments. Unlike prognostic land surface models (LSMs), these diagnostic frameworks directly assimilate satellite-derived vegetation dynamics (e.g., leaf area index, LAI) to circumvent the systematic biases often inherent in complex plant functional type (PFT) simulations. Broadly, these datasets can be categorized into three primary clusters based on their target variables (see Table 1 for references): (1) stand-alone ET algorithms rooted in Penman-Monteith (e.g., MOD16) or energy/water-balance principles (e.g., 3T, SiTH); (2) GPP-specific products driven largely by Light Use Efficiency (LUE) logic (e.g., MOD17, GLASS EC-LUE) or emerging proxies like SIF and NIRv (e.g., GOSIF); and (3) integrated frameworks that simultaneously estimate both fluxes to ensure physiological consistency (e.g., BEPS, BESS). Notably, within these categories, Machine Learning (ML) has emerged as a transformative force. This includes pure data-driven approaches that upscale flux observations directly (e.g., FLUXCOM-X-BASE, GloFlux) and hybrid strategies that embed ML into process-based schemes to refine specific parameters like stress factors (e.g., GLEAM4, CoSEB).
Table 1Summary of major remote sensing-based diagnostic ET and GPP models and datasets.
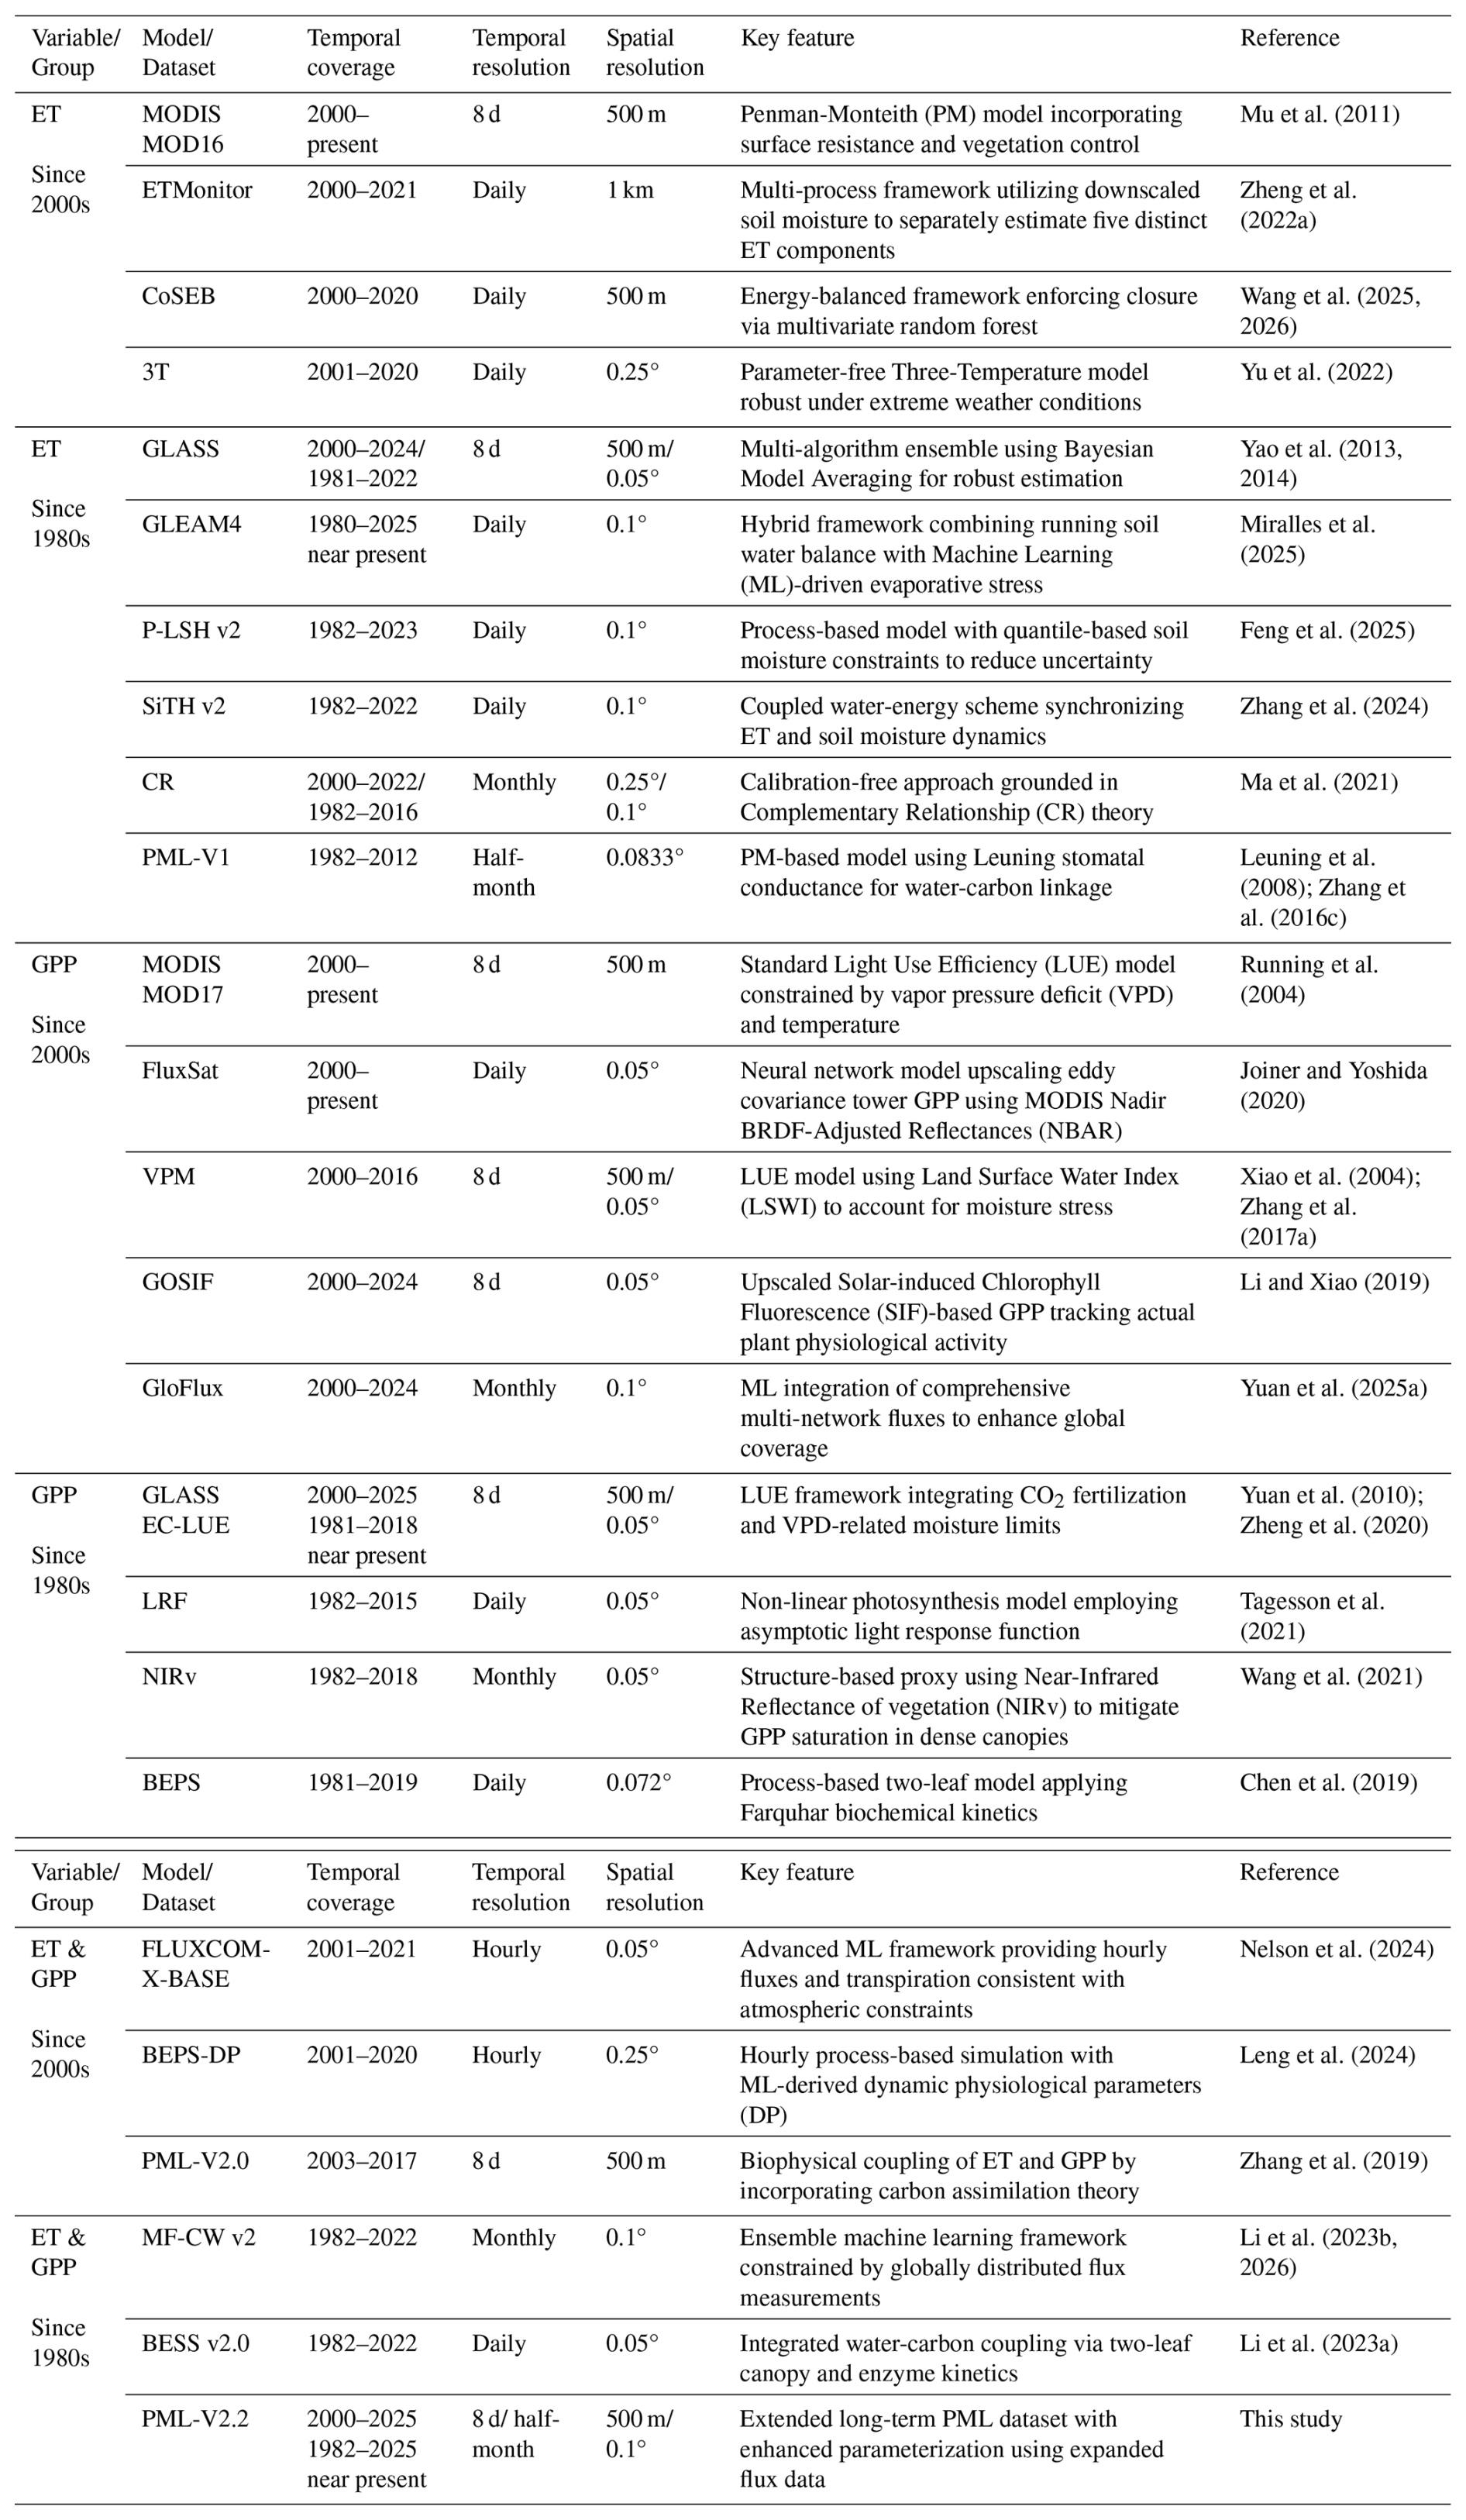
Note: Datasets with a spatial resolution coarser than 0.25° are excluded from this summary. The literature search and data availability check were concluded on 15 July 2026. Access links for all products are provided in Table A1 in the Appendix. Time series of majority of datasets are shown in Fig. 13. In this study, “present” refers to data with a production delay of several days to one month (e.g., MODIS). Due to the latency in meteorological and remote sensing forcing data, “near present” refers to datasets updated annually through 2025.
Despite this methodological diversity, the current data landscape is characterized by a persistent trade-off between temporal span and biophysical consistency. This dichotomy is largely dictated by the evolution of satellite sensors: while higher-resolution diagnostic records are predominantly tethered to the post-2000 era of the Moderate Resolution Imaging Spectroradiometer (MODIS), and its continuity mission, the Visible Infrared Imaging Radiometer Suite (VIIRS), establishing pre-2000 baselines necessitates reliance on the Advanced Very High Resolution Radiometer (AVHRR). However, bridging these distinct epochs is difficult, and many long-term datasets covering earlier decades estimate ET and GPP in isolation. This challenge is further compounded by instabilities in meteorological driving data (e.g., solar radiation, vapor pressure deficit) derived from disparate reanalysis products, which collectively increase the uncertainty in detecting authentic climate-driven shifts (Kim et al., 2021; Xie et al., 2025). Beyond these consistency issues, a critical gap remains in data latency. As shown in Table 1, most biophysically consistent records suffer from significant production lags, precluding the inclusion of the near-present period (e.g., update annually to 2025). Consequently, few datasets are simultaneously long-term, consistent, and up-to-date, which hinders timely assessments of long-term changes and recent anomalies.
The Penman–Monteith–Leuning (PML) model was initially conceived as a high-precision ET diagnostic framework (PML-V1) based on the Penman-Monteith equation coupled with Leuning's canopy conductance theory (Leuning et al., 2008; Zhang et al., 2008), which successfully established a long-term global ET record covering 1982–2012 (Zhang et al., 2016c). Another theoretical advance occurred with the development of the PML-V2 model, a coupled water and carbon flux model that estimates canopy conductance through the GPP process, thereby providing a more physically consistent and high-accuracy estimation of both ET and GPP (Zhang et al., 2019; Gan et al., 2018). Implemented on the Google Earth Engine (GEE) platform (Gorelick et al., 2017), this second generation leveraged 95 FLUXNET2015 sites of flux observations and MODIS data for parameterization to achieve a spatial resolution of 500 m at an 8 d interval, initially providing global coverage for 2003–2017 (Zhang et al., 2019), while an optimized regional daily version for China was subsequently released covering 2000–2020, integrating 26 local flux sites and local climate forcing (He et al., 2022). Consequently, despite its high accuracy, the original PML-V2 framework lacks a consistent methodology to bridge the gap between AVHRR and MODIS observations, leaving a critical void in our understanding of long-term ecosystem responses and recent climate-driven anomalies.
To provide an integrated, high-fidelity record that resolves the trade-offs between spatial resolution and temporal span, we introduce the PML-V2.2 dataset. Built upon a robust diagnostic framework, PML-V2.2 extends the coupled record to nearly 44 years (1982–2025, near present and updated annually). The dataset is strategically released as three complementary products: the “a” version provides 500 m near-present capability based on MODIS and VIIRS; the “b” version utilizes AVHRR to anchor historical estimates essential for climate attribution; and the “c” version systematically integrates their strengths into a continuous, globally consistent record. This design ensures that PML-V2.2 serves as a timely resource, supporting both high-resolution operational monitoring and robust long-term trend analysis in terrestrial hydro-climatic studies. Our new PML-V2.2 datasets have the following features:
-
Consistent forcing data: All simulations (1982–2025) share the same forcing data from bias-corrected MSWEP V2.8 and MSWX-Past datasets (Beck et al., 2019, 2022) to ensure internally consistent modelling results.
-
Expanded calibration: A significantly larger number of flux-tower sites for model calibration (208 versus 95 used in Zhang et al., 2019).
-
Refined cropland estimates: More accurate ET estimates for croplands that are separated into irrigated and non-irrigated.
-
Optimized parameterization: The new two-parameter function for vapor pressure deficit is employed, reducing the number of parameters by one compared to the previous version (Zhang et al., 2019; He et al., 2022).
A detailed description of these new features is provided in Sects. 2 and 3.
2.1 Penman-Monteith-Leuning model
The PML-V2 model partitions terrestrial ET into three constitutive components: vegetation transpiration (Ec), soil evaporation (Es), and canopy interception (Ei) (Zhang et al., 2019). Within a Penman-Monteith (PM) framework, the model utilizes LAI for canopy-soil energy partitioning. Crucially, Ec is estimated through a GPP-coupled canopy conductance (Gc) scheme to ensure biophysical consistency (Gan et al., 2018). Es is estimated by determining the soil moisture stress by accumulated precipitation and soil equilibrium evaporation (Zhang et al., 2010), while Ei is quantified via the Gash rainfall interception model (van Dijk and Bruijnzeel, 2001).
where , in which γ is the psychrometric constant (kPa °C−1) and is the slope of the curve relating saturation water vapor pressure to temperature (kPa °C−1). Ac and As are the available energy (net absorbed radiation minus soil heat flux, MJ m−2 d−1) separated by LAI for Ec and Es. ρ is the density of air (g m−3). cp is the specific heat of air at constant pressure (J g−1 °C−1). Da is the water vapor pressure deficit of the air (kPa). Ga is the aerodynamic conductance (m s−1). Gc is the canopy conductance (m s−1). f is a dimensionless variable that determines the water availability for soil evaporation. P is the daily precipitation (mm d−1). Pwet is the reference threshold rainfall amount if the canopy is wet (mm d−1). fER is the ratio of average evaporation rate over average precipitation intensity storms (unitless), fv is the fractional area covered by intercepting leaves (unitless).
The defining feature of PML-V2 is its coupled water-carbon mechanism. Unlike traditional PM-based models, it derives canopy conductance (Gc) directly from the photosynthesis process, constrained by vapor pressure deficit (Da). Furthermore, it incorporates the impact of atmospheric CO2 concentration (Ca) on carbon assimilation and Gc, providing a more physically robust simulation of ET and GPP under changing environmental conditions.
where Ac,g is the gross assimilation rate without Da constraint. f(Da) is the Da constraint function adopted from Wang et al. (2014) and Running et al. (2015).
In this model, the carbon assimilation and water exchange are subject to a unified constraint from Da. Therefore, the same function f(Da) can be used for deriving Gc:
where m is a dimensionless stomatal conductance coefficient. Note that 1.6 is the ratio of stomatal conductance to water vapor relative to that to carbon flux (Medlyn et al., 2011; Yebra et al., 2013; Gan et al., 2018).
More details on the PML modelling can be found on the supplement of Zhang et al. (2019). Compared with that, the D0 parameter and the stress function of the original Ball-Berry-Leuning equation are replaced with the two-parameter function. One parameter can be reduced after this update.
2.2 Bottom-up parameterization and validation
The ten parameters of the PML-V2.2 model were optimized and validated using a comprehensive bottom-up framework based on the latest global eddy covariance (EC) flux observations, yielding the optimal parameter sets presented in Table 2. Crucially, versions a and b share this exact parameterization scheme, and any product discrepancies arise solely from their respective forcing datasets. The parameter optimization was performed exclusively at an 8 d temporal scale, which was chosen because the MODIS vegetation and albedo data employed in our framework provide an optimal balance between data quality and spatiotemporal resolution. The optimization process utilized these MODIS products alongside the highest-quality site-level meteorological observations, predominantly covering the period from 2000 to 2022.
Table 2Optimized PML-V2.2 model parameters for the harmonized IGBP and CCI PFTs.
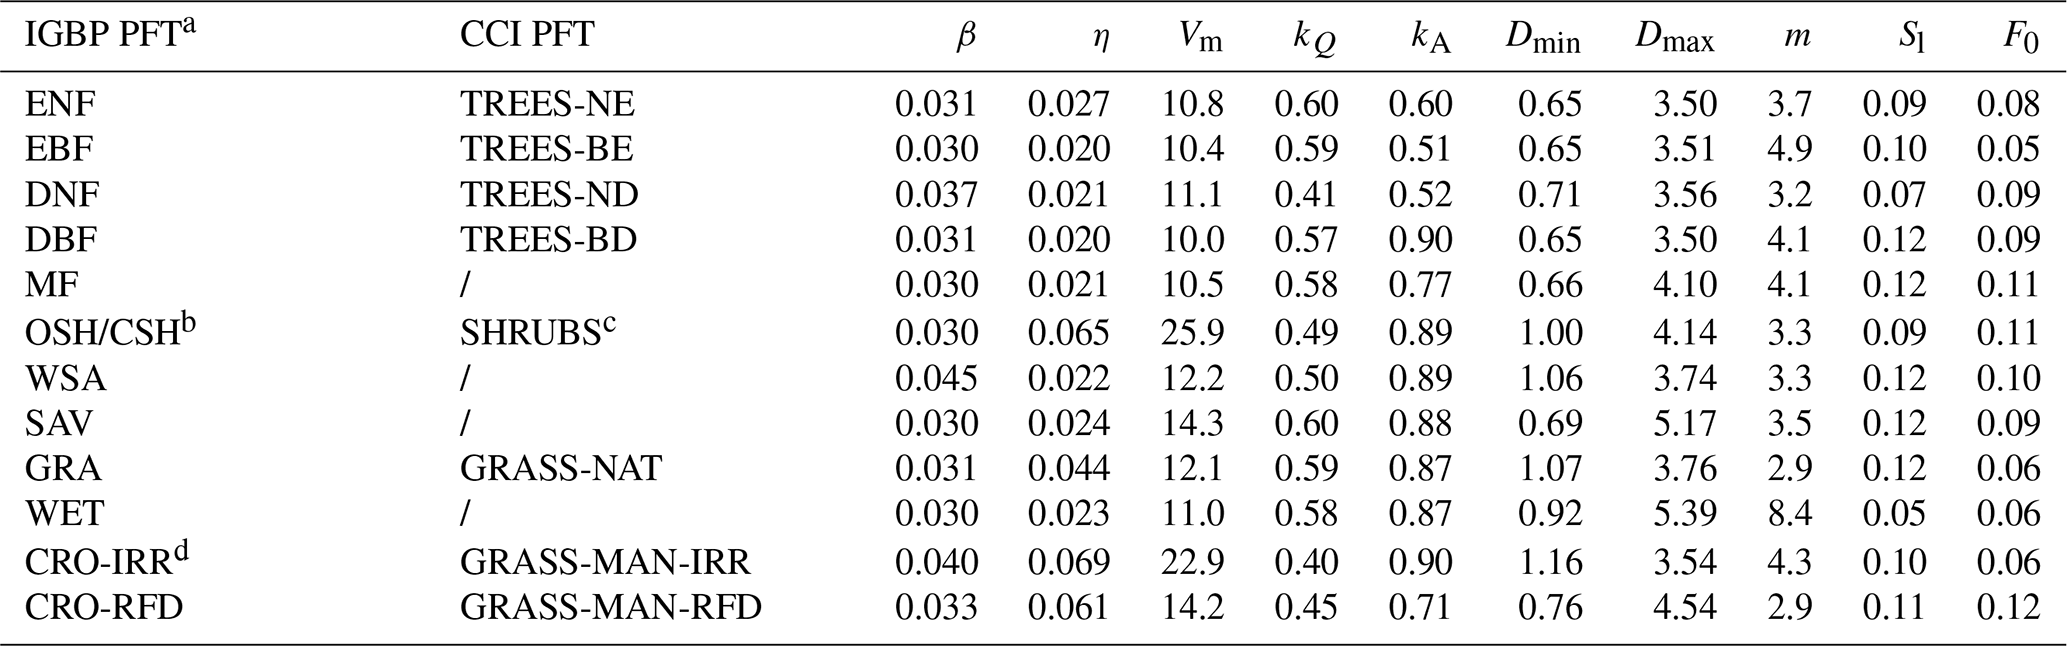
a IGBP PFT are reported by data suppliers of the flux network. b Due to limited number of shrub sites for robust model calibration, the open shrublands and closed shrublands are combined. c ESA CCI PFT has four types of SHRUBS (NE, BE, ND, BD), which are also combined. d Croplands are split as rainfed (RFD) and irrigated (IRR) types based on the IGRIP30 dataset. The corresponding human-managed grass (GRASS-MAN) class is also split. Note that β is initial slope of the light response curve to assimilation rate (i.e. quantum efficiency), η is initial slope of the CO2 response curve to assimilation rate (i.e. carboxylation efficiency), Vm is maximum catalytic capacity of Rubisco per unit leaf area at 25 °C. kQ is extinction coefficient of PAR. kA is extinction coefficient of available energy. Dminand Dmax are thresholds below which there is no vapor pressure constraint and highest constraint, respectively. m is stomatal conductance coefficient. Sl is specific canopy rainfall storage capacity per unit leaf area. F0 is specific ratio of average evaporation rate over average rainfall intensity during storms per unit canopy cover.
Flux measurements were compiled from six major international monitoring networks including FLUXNET2015 (Pastorello et al., 2020), the Australian and New Zealand flux tower network (OzFlux) (Beringer et al., 2016; Isaac et al., 2017; Beringer et al., 2022), AmeriFlux (Novick et al., 2018; Chu et al., 2023), the Integrated Carbon Observation System (ICOS) (Heiskanen et al., 2022; Warm Winter 2020 Team et al., 2022; ICOS RI et al., 2025), JapanFlux (Ueyama et al., 2025), ChinaFlux (Yu et al., 2006, 2024), and other independent data providers (Liu et al., 2018, 2013b; Ma et al., 2020; Zhou et al., 2023). For sites with missing data, gap-filling and flux partitioning were performed using the REddyProc R package (Wutzler et al., 2018). This processing pipeline aligns with the FLUXNET2015 data protocol (Pastorello et al., 2020), incorporating friction velocity (u*) threshold filtering, Marginal Distribution Sampling (MDS) for gap-filling, and standardized carbon flux partitioning. GPP was calculated as the average of estimates derived from both daytime and nighttime partitioning methods (Reichstein et al., 2005; Lasslop et al., 2010). To ensure temporal continuity, missing meteorological forcing data were supplemented using Multi-Source Weighted-Ensemble Precipitation (MSWEP) V2.8 and Multi-Source Weather (MSWX) Past version (Beck et al., 2019, 2022), which integrate multi-source in-situ observations, satellite-based estimates and rescaled European Centre for Medium-Range Weather Forecasts (ECMWF) Reanalysis V5 (ERA5) data. Following a protocol consistent with FLUXNET's use of ERA5-Interim, these seamless daily fields were subsequently used to drive the PML model. Finally, all observations were aggregated into an 8 d timescale, with a Quality Control (QC) flag assigned to represent the proportion of measured and high-quality gap-filled data. To maintain high data standards, only records with QC > 0.9 were retained for further calibration. Notably, rainy days were not filtered out, as precipitation noise is naturally smoothed at the 8 d scale. Moreover, removing them would severely disrupt data continuity, particularly in humid regions.
To ensure data reliability, a stringent quality control procedure was also applied to the selected sites, following Zhang et al. (2019). Only sites meeting the following criteria were retained: (i) an energy balance closure ratio exceeding 0.75, (ii) a spatially homogeneous flux footprint within a 500 m radius, and (iii) a continuous observational record longer than one year. After filtering, the final dataset comprised 208 sites (∼ 1400 site-years for ET), representing a substantial expansion compared to the 95 sites used in the earlier version 2.0 (Zhang et al., 2019).
Plant functional type (PFT) classifications were harmonized between the International Geosphere–Biosphere Programme (IGBP) and European Space Agency Climate Change Initiative (ESA CCI) schemes, which are intended to be used for the versions “a” and “b”, respectively. While IGBP classifications are directly provided by the flux networks as high-accuracy references, the ESA CCI classes were mapped from IGBP categories through a one-to-one correspondence at the selected sites. For the IGBP scheme, model parameters were calibrated for 12 vegetated PFTs using site-level observations (Fig. 1a). During this harmonization process, the four forest classes (ENF, EBF, DNF, and DBF) and other key types, including grasslands (GRA) and croplands (CRO), were mapped to their corresponding ESA CCI classes (e.g., GRASS-NAT and GRASS-MAN) to ensure a perfect match (Fig. 1b). To ensure robust cross-validation, the nine open and closed shrublands (CSH/OSH) were merged into a single shrubland (SH/SHRUBS) class. Furthermore, the 30 m 2015 Landsat-derived Global Rainfed and Irrigated-cropland Product (LGRIP30) (Teluguntla et al., 2023) was used to further split CRO and GRASS-MAN into rainfed (RFD) and irrigated (IRR) types. Finally, all vegetated PFTs were parameterized with EC data, while the four non-vegetated classes (water, ice, barren land, and urban areas) were assigned static values.
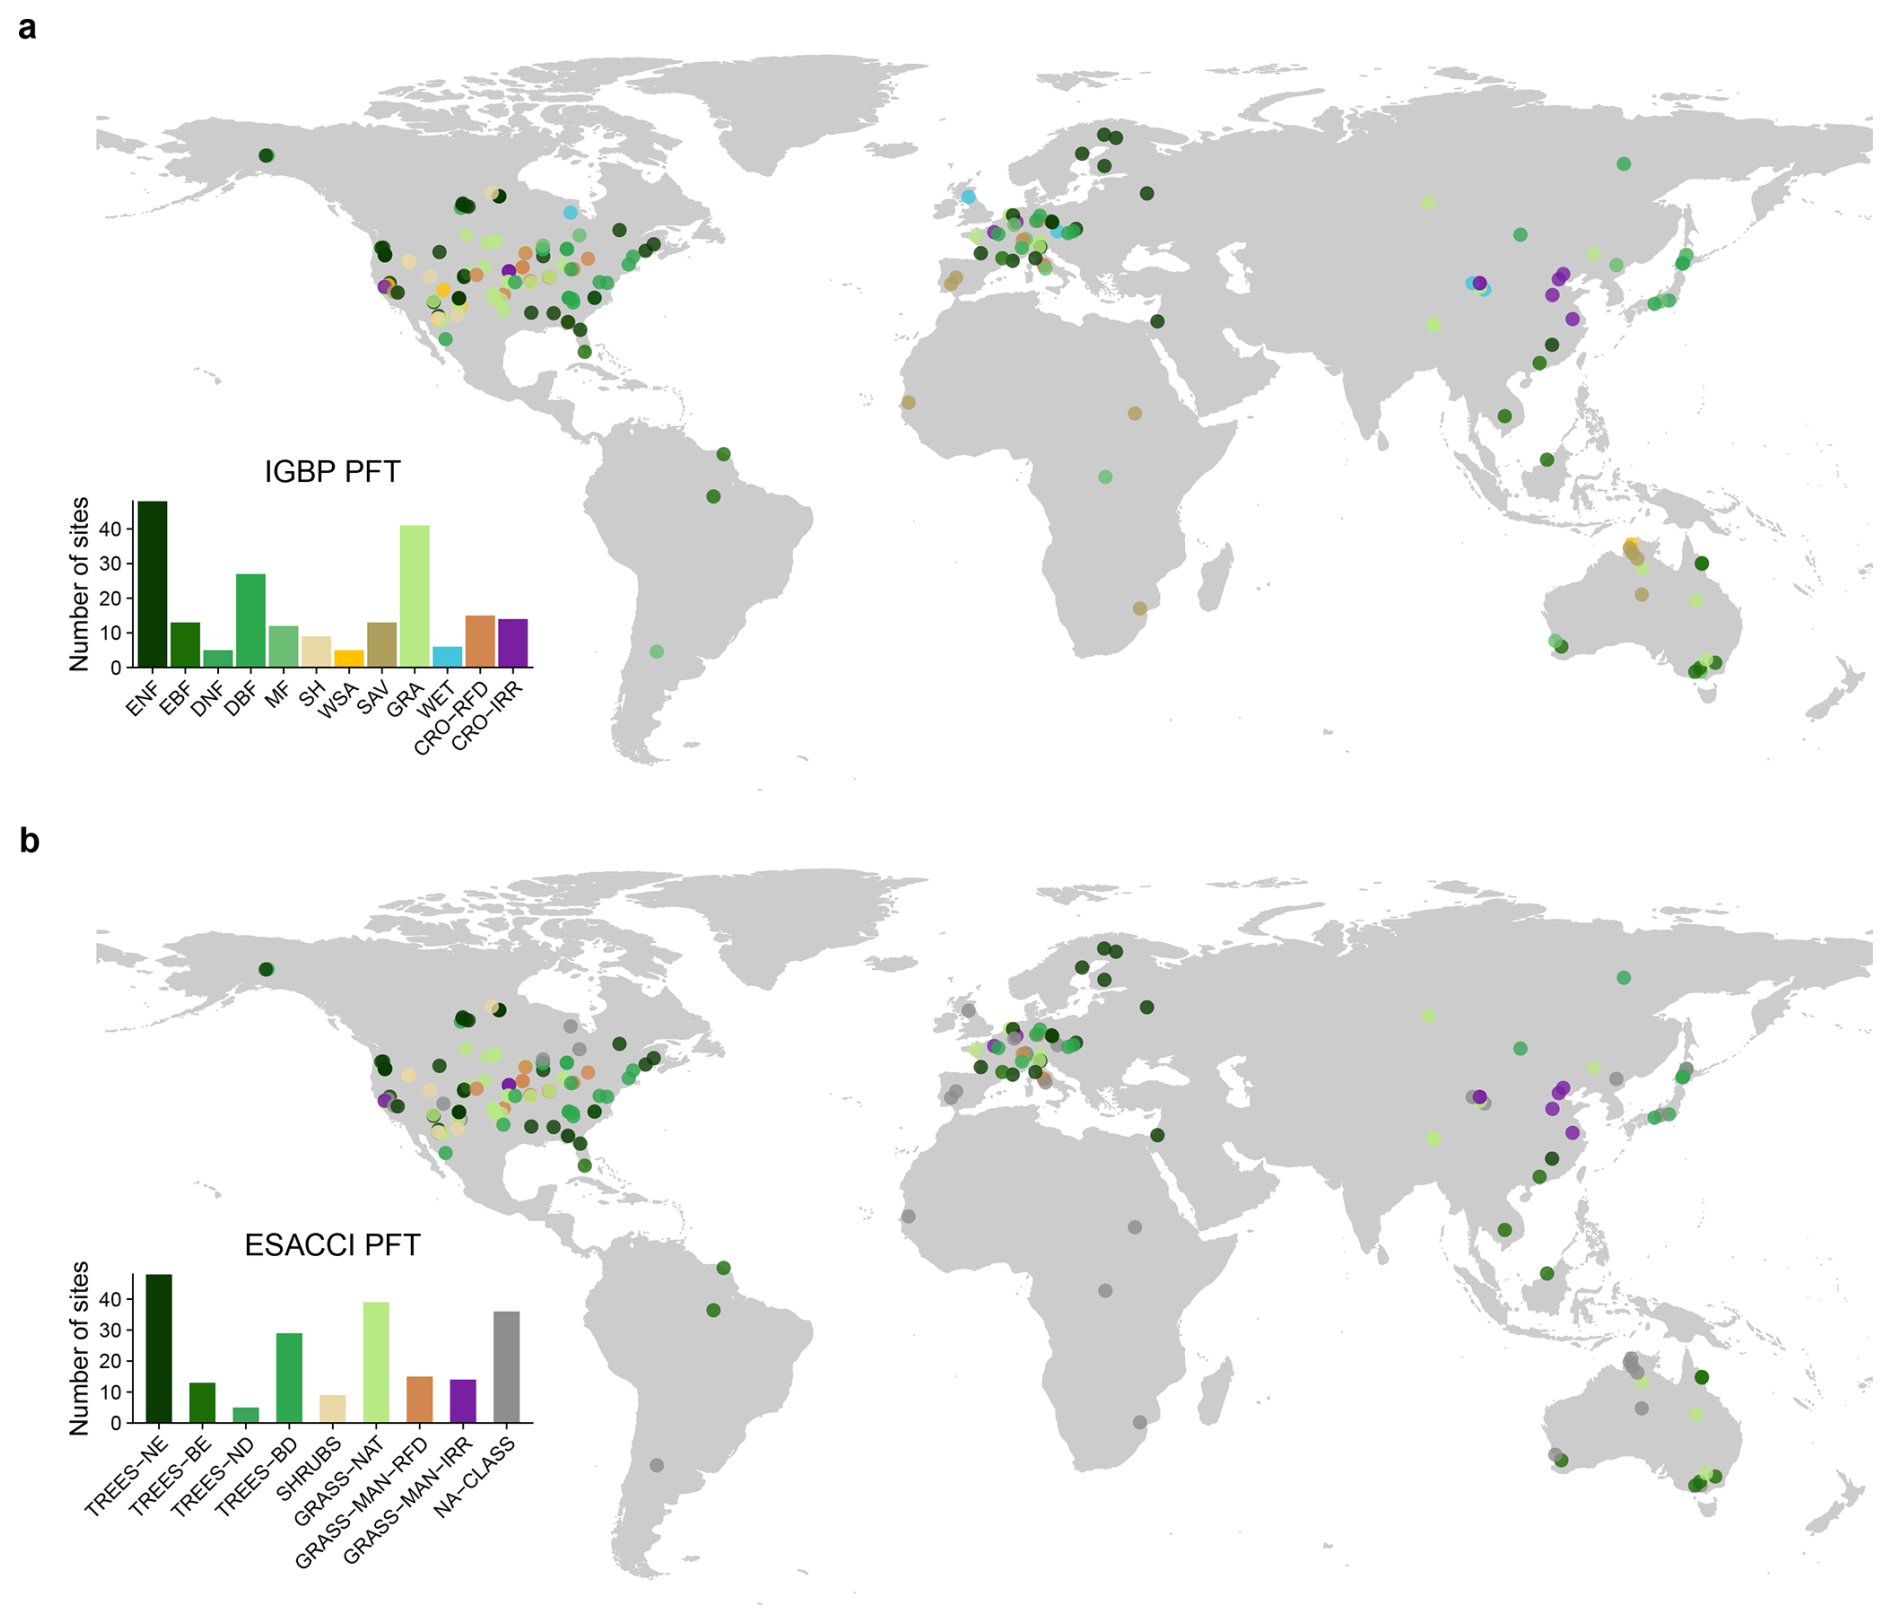
Figure 1Global distribution of eddy covariance flux towers for model calibration and validation.
Consequently, we retained a subset of 172 sites (82.7 % of the 208 IGBP sites) that exhibited perfect one-to-one alignment between IGBP and CCI classification, enabling both schemes to share identical parameter sets (Table 2). This rigorous selection was necessary because initial investigations revealed that some ESA CCI labels did not align with the strict physical definitions of the classes. Specifically, the 36 sites where mixed forests (MF) were labeled as specific forest types, or where woody savannas (WSA), savannas (SAV), and wetlands (WET) were labeled as grasslands, were excluded to ensure classification integrity. During modelling, the CCI classification uses fractions of other PFTs to represent these IGBP PFTs.
Model calibration was conducted independently for each PFT, and cross-validation was performed using a leave-one-out strategy within each PFT (Zhang et al., 2019; He et al., 2022). This means that for each PFT, the parameters were optimized using all sites except one, and the calibrated model was then used to predict the omitted site. This process was iterated so that each site, in turn, was left out for prediction, ensuring that all sites within a PFT were ultimately predicted. Compared to version 2.0, PML-V2.2 employs an enhanced multi-objective error metric (F) (Viney et al., 2009; Zhang et al., 2016b), which places a heightened emphasis on bias control to improve simulation accuracy:
where NSE is the Nash–Sutcliffe efficiency of the 8 d ET or GPP. Bias is the model bias. yobs,i and ysim,i are the observed and simulated values at time step i. is the mean of all observations. This objective function jointly optimizes the NSE and Bias for both ET and GPP. By simultaneously constraining temporal dynamics (via NSE) and long-term water and carbon balance (via Bias), this formulation improves the robustness and transferability of model parameters for global-scale applications.
To provide greater transparency and evaluate parameter behavior across different PFTs, a variance-based global sensitivity analysis was conducted using the Sobol method. We calculated the Sobol sensitivity indices for all calibrated parameters to quantify their relative contributions to the variance of simulated ET, GPP, and their underlying components. As illustrated in Fig. A1 in the Appendix, the parameters β, η, and Vm strongly influence photosynthesis and GPP. Parameter m, which regulates the stomatal conductance process, dominates Ec and WUE, making it the most influential parameter for total ET. Additionally, soil evaporation (Es) is primarily driven by kA, which controls canopy-soil energy partitioning, while interception evaporation (Ei) depends on the canopy interception capacity (Sl) and evaporation rate (F0). This sensitivity analysis enhances the physical interpretability of the PML model and further justifies our PFT-specific parameterization strategy.
2.3 Model versions and consolidation
To meet diverse research needs ranging from high-resolution monitoring to long-term climate attribution, this study develops three primary versions of the PML-V2 model. PML-V2.2a and PML-V2.2b serve as the foundational products for the MODIS/VIIRS and AVHRR satellite eras, respectively. These versions provide the basis for the final consolidated dataset, PML-V2.2c, which bridges the AVHRR, MODIS, and VIIRS records to offer a seamless global dataset from 1982 to the near-present. While the core physics of the PML-V2.2 model remain consistent across all versions, these datasets are distinguished by their specific satellite sensors, spatial resolutions, and Plant Functional Type (PFT) inputs to ensure maximum utility across different spatiotemporal scales (Fig. 2).
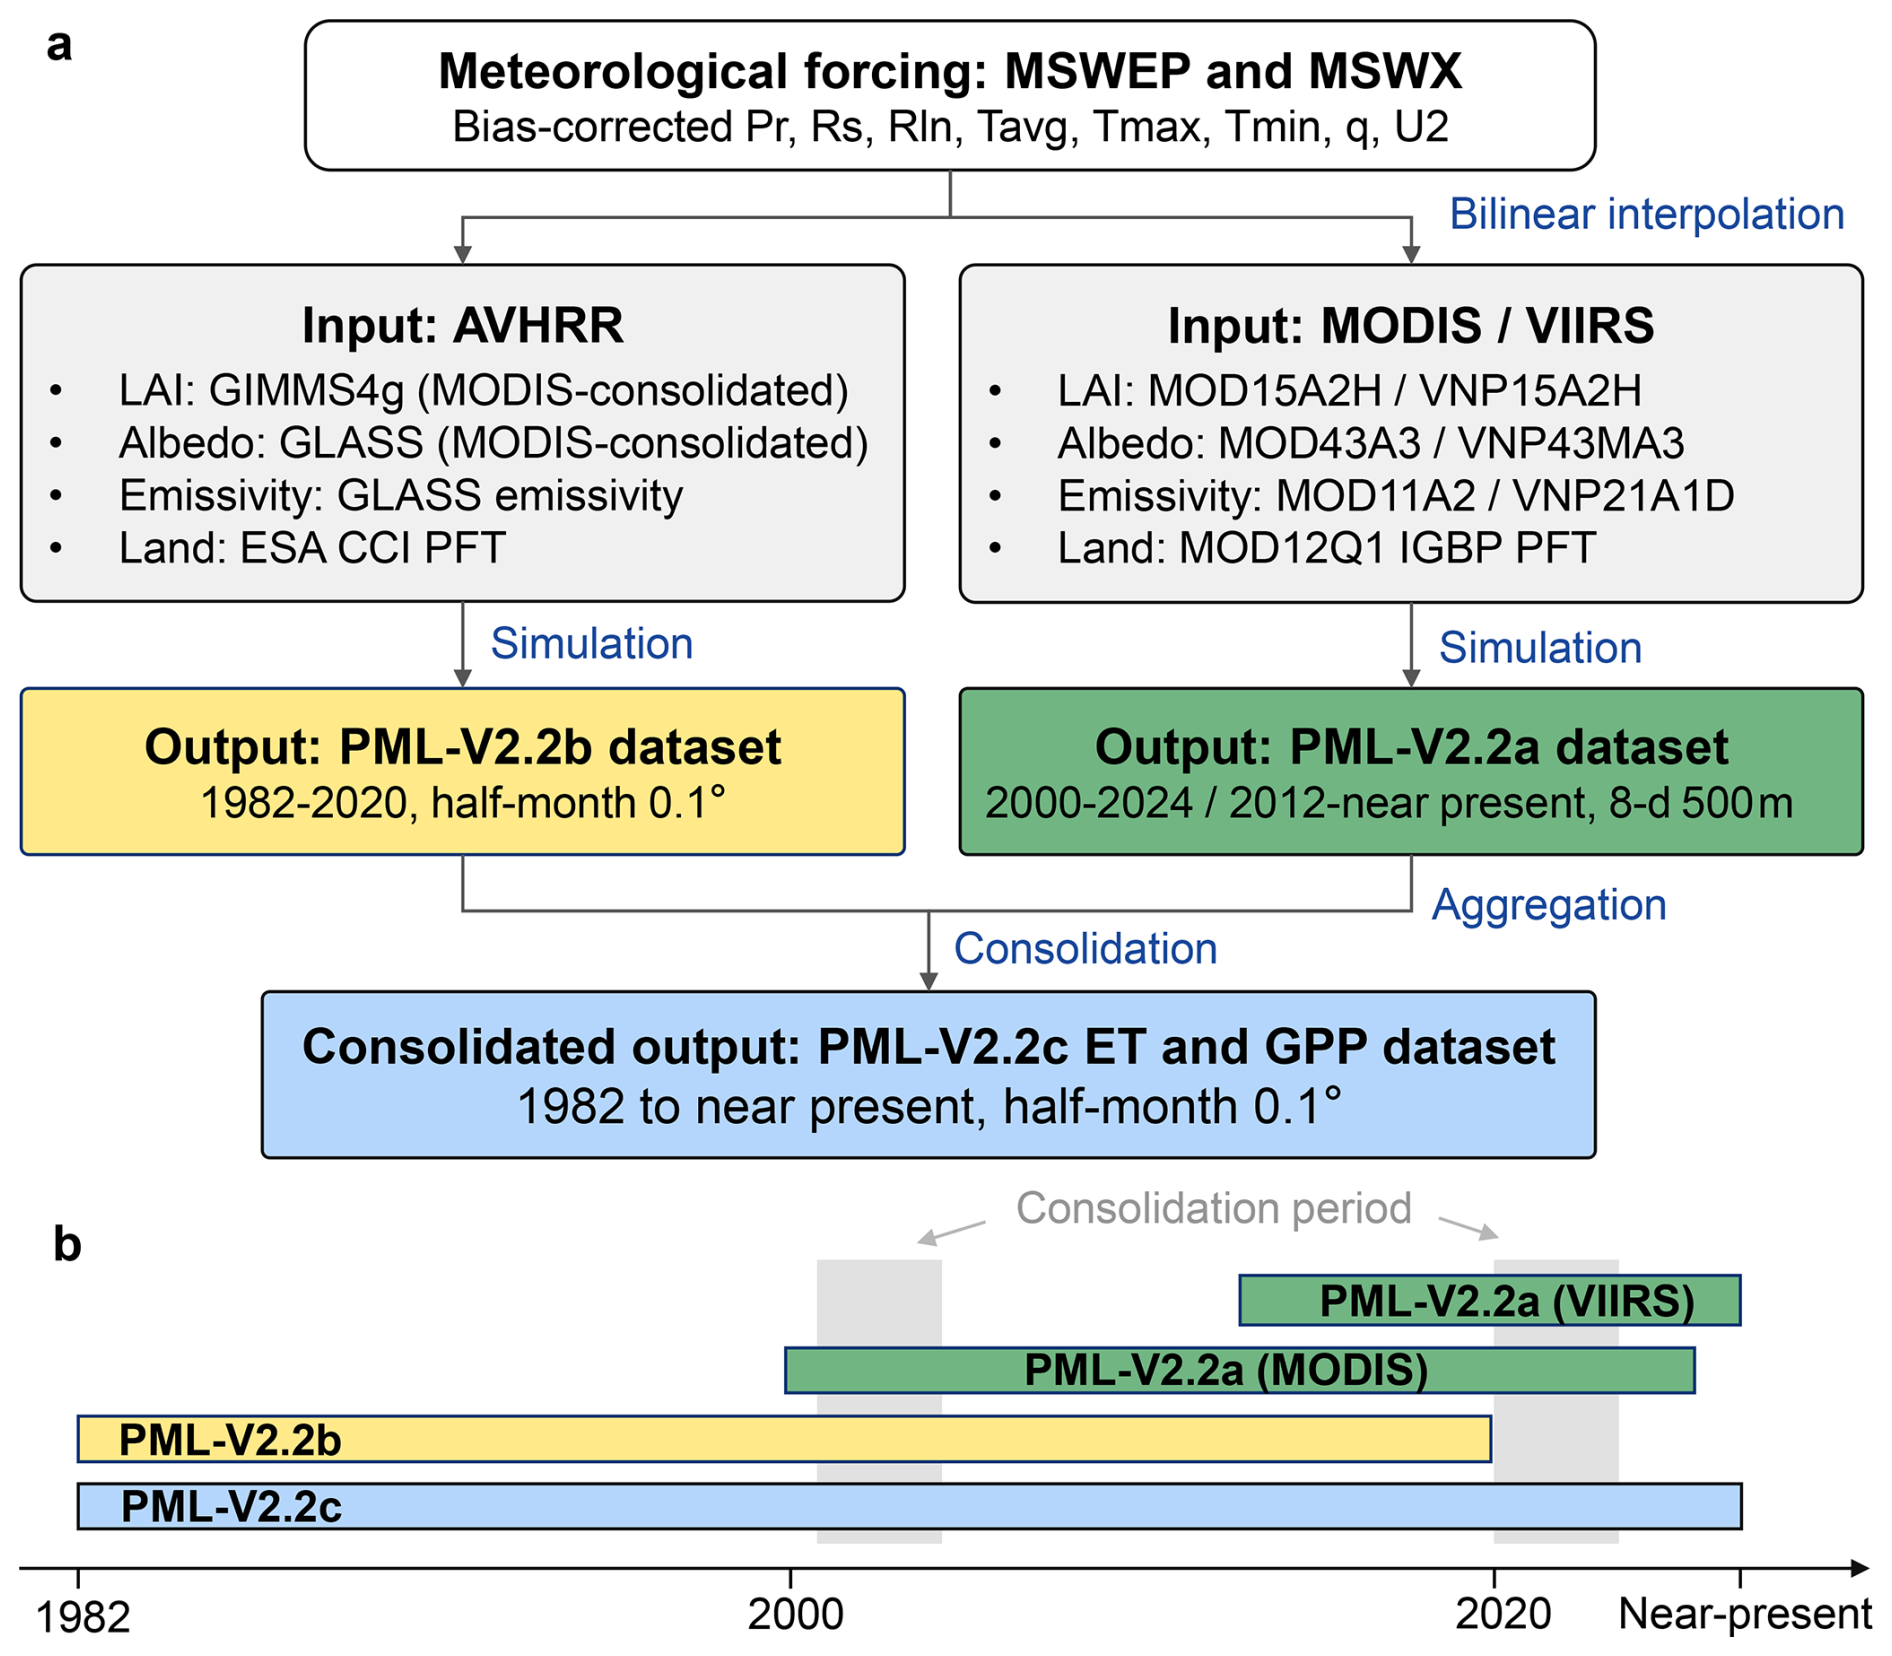
Figure 2Methodological framework and temporal coverage of the PML-V2.2 dataset.
A critical enhancement in this framework is the adoption of MSWEP V2.8 and MSWX-Past as meteorological forcing (Beck et al., 2019, 2022), replacing the Global Land Data Assimilation System (GLDAS) V2.1 used in previous versions (Beaudoing and Rodell, 2020). The primary driver for this transition was the temporal limitation of GLDAS V2.1, which is restricted to the post-2000 era. In contrast, MSWEP and MSWX offer a seamless, high-accuracy record from 1982 to 2025, enabling the consistent detection of decadal eco-hydrological trends. Beyond temporal coverage, these datasets utilize a unique multi-source fusion strategy that optimally combines gauge, satellite, and reanalysis data. Unlike purely model-based products, this integration significantly reduces biases in precipitation and meteorological variables, providing a climatic baseline with superior accuracy. Furthermore, the native 0.1° resolution of MSWEP/MSWX minimizes the footprint mismatch caused by the coarser 0.25° GLDAS, ensuring better spatial alignment with satellite-derived inputs. For implementation, all forcing variables (e.g., precipitation, radiation, temperature, vapor pressure, wind speed) were spatially aligned using bilinear interpolation (Fig. 2). Additionally, the global monthly atmospheric CO2 concentration (Ca) data were sourced from Mauna Loa Observatory administered by the National Oceanic and Atmospheric Administration (NOAA). These monthly concentrations were applied as static values for the 8 d and half-monthly simulation steps within each corresponding month. With these consistent climate forcing and parameter sets, the three datasets are produced as follows.
PML-V2.2a serves as the primary moderate-resolution (500 m, 8 d) version of the framework from 2000 to the present. While it is predominantly driven by MODIS Collection 6.1 inputs (including MOD15A2H LAI, MOD43A3 albedo, MOD11A2 emissivity, and MOD12Q1 IGBP PFT data) (Myneni et al., 2021; Schaaf and Wang, 2021; Wan et al., 2021; Friedl and Sulla-Menashe, 2022), we also incorporated subsidiary inputs from the corresponding VIIRS V002 products (including VNP15A2H LAI, VNP43MA3 albedo, VNP21A1D emissivity) (Myneni, 2023; Schaaf et al., 2025; Hulley and Hook, 2025). Integrating VIIRS ensures the future continuity of the dataset as the aging MODIS sensors are gradually decommissioned. While it maintains consistency with the physical structure of earlier versions, PML-V2.2a incorporates the latest model parameters calibrated against an expanded dataset of 208 flux tower sites. A key technical advancement is the integration of the weighted Whittaker LAI smoothing algorithm V0.1.6 (Kong et al., 2019). This upgraded version enhances outlier detection and specifically avoids the common pitfall of over-smoothing. Consequently, it accurately preserves the signals of bimodal seasonality in double-cropping croplands and mitigates the chronic underestimation of LAI in tropical regions caused by frequent cloud cover and rainfall (He et al., 2022). During the stable overlapping period of 2013–2022, the MODIS and VIIRS LAI and albedo exhibited highly consistent relative changes (NSE = ∼ 0.80, Figs. A2 and A3), which provides robust support for the consolidation of these two datasets. However, it is important to note that severe sensor degradation and orbital drift have been observed in the post-2022 MODIS records (Twedt et al., 2023; Wu et al., 2025). These uncompensated radiometric anomalies are known to propagate systematic, non-physical biases into downstream products such as cloud droplet number concentration (Liu et al., 2026). Specifically, these uncompensated shifts caused artificial declines in LAI retrievals particularly over tropical regions (Fig. A2d), even though their current impact on albedo retrievals seems marginal. Consequently, the MODIS-based version a ceases updates after the year 2024. Future extensions will rely solely on VIIRS until the MODIS Bidirectional Reflectance Distribution Function (BRDF) calibration issues are officially resolved. These sensor transitions and algorithmic refinements contribute to a theoretically higher accuracy and better representation of vegetation heterogeneity.
PML-V2.2b is the AVHRR-based version designed for historical eco-hydrological analysis, providing half-month 0.1° outputs from 1982 to 2020. This version utilizes the GIMMS LAI4g dataset (Cao et al., 2023; Zhu et al., 2013) as its primary vegetation input. Unlike its predecessors, GIMMS LAI4g employs a deep-learning-based consolidation strategy that effectively eliminates satellite orbital drift and sensor degradation, ensuring consistency across the pre- and post-2000 eras. For model parameterization, these vegetation dynamics are paired with GLASS albedo and emissivity products (Liu et al., 2013a; Cheng et al., 2016; Liang et al., 2021) and ESA CCI PFT data (Harper et al., 2023). To match the model grid, the high-resolution land cover data were aggregated to 0.1° resolution by calculating the fractional coverage of five major PFTs within each grid. Although restricted by the coarser spatial resolution of AVHRR compared to MODIS, PML-V2.2b provides the necessary decadal continuity for studying terrestrial water and carbon cycles over the past 39 years. By employing the same climate forcing, model and parameter sets as version a, it ensures that the foundational diagnostic mechanisms remain consistent across different satellite epochs.
PML-V2.2c is the final consolidated dataset (half-month 0.1°) generated through a rigorous, pixel-scale bi-directional consolidation that bridges three satellite eras: AVHRR, MODIS, and VIIRS, providing a continuous record from 1982 to the present (Fig. 2). This consolidation was performed in two successive stages. First, to bridge the pre- and post-2000 eras, we treated the MODIS-based estimates (version a) as the primary benchmark and harmonized the historical AVHRR-based estimates (version b) using the 2001–2003 overlapping period. Second, to extend the dataset reliably into the post-MODIS era, a similar bidirectional consolidation was applied to link the MODIS and VIIRS records, utilizing their highly stable 2020–2022 overlapping window. As detailed in the description of version a, this specific period was carefully selected to avoid the post-2022 MODIS sensor drift, which renders subsequent years unsuitable for benchmark calibration. For most pixels, the primary variables from the subsidiary sensors (AVHRR or VIIRS) were scaled to match the mean values of the benchmark sensor to ensure statistical alignment. In extreme scenarios, such as desert or ice-covered regions or instances where the benchmark detected vegetation (> 0) but the subsidiary sensor remained at zero (precluding standard scaling), a reverse scaling or masking to zero was applied to maintain absolute consistency. This harmonization effectively eliminates systematic jumps caused by sensor transitions and PFT classification differences, ensuring that the 44-year record preserves both accurate mean states and genuine long-term trends.
2.4 Top-down water balance validation
We use top-down water balance ET (ETWB) estimates to independently validate our new PML ET estimates. At the annual scale, water balance ET is estimated by solving the basin-scale water balance equation using precipitation (P), streamflow (Q), and changes in terrestrial water storage ():
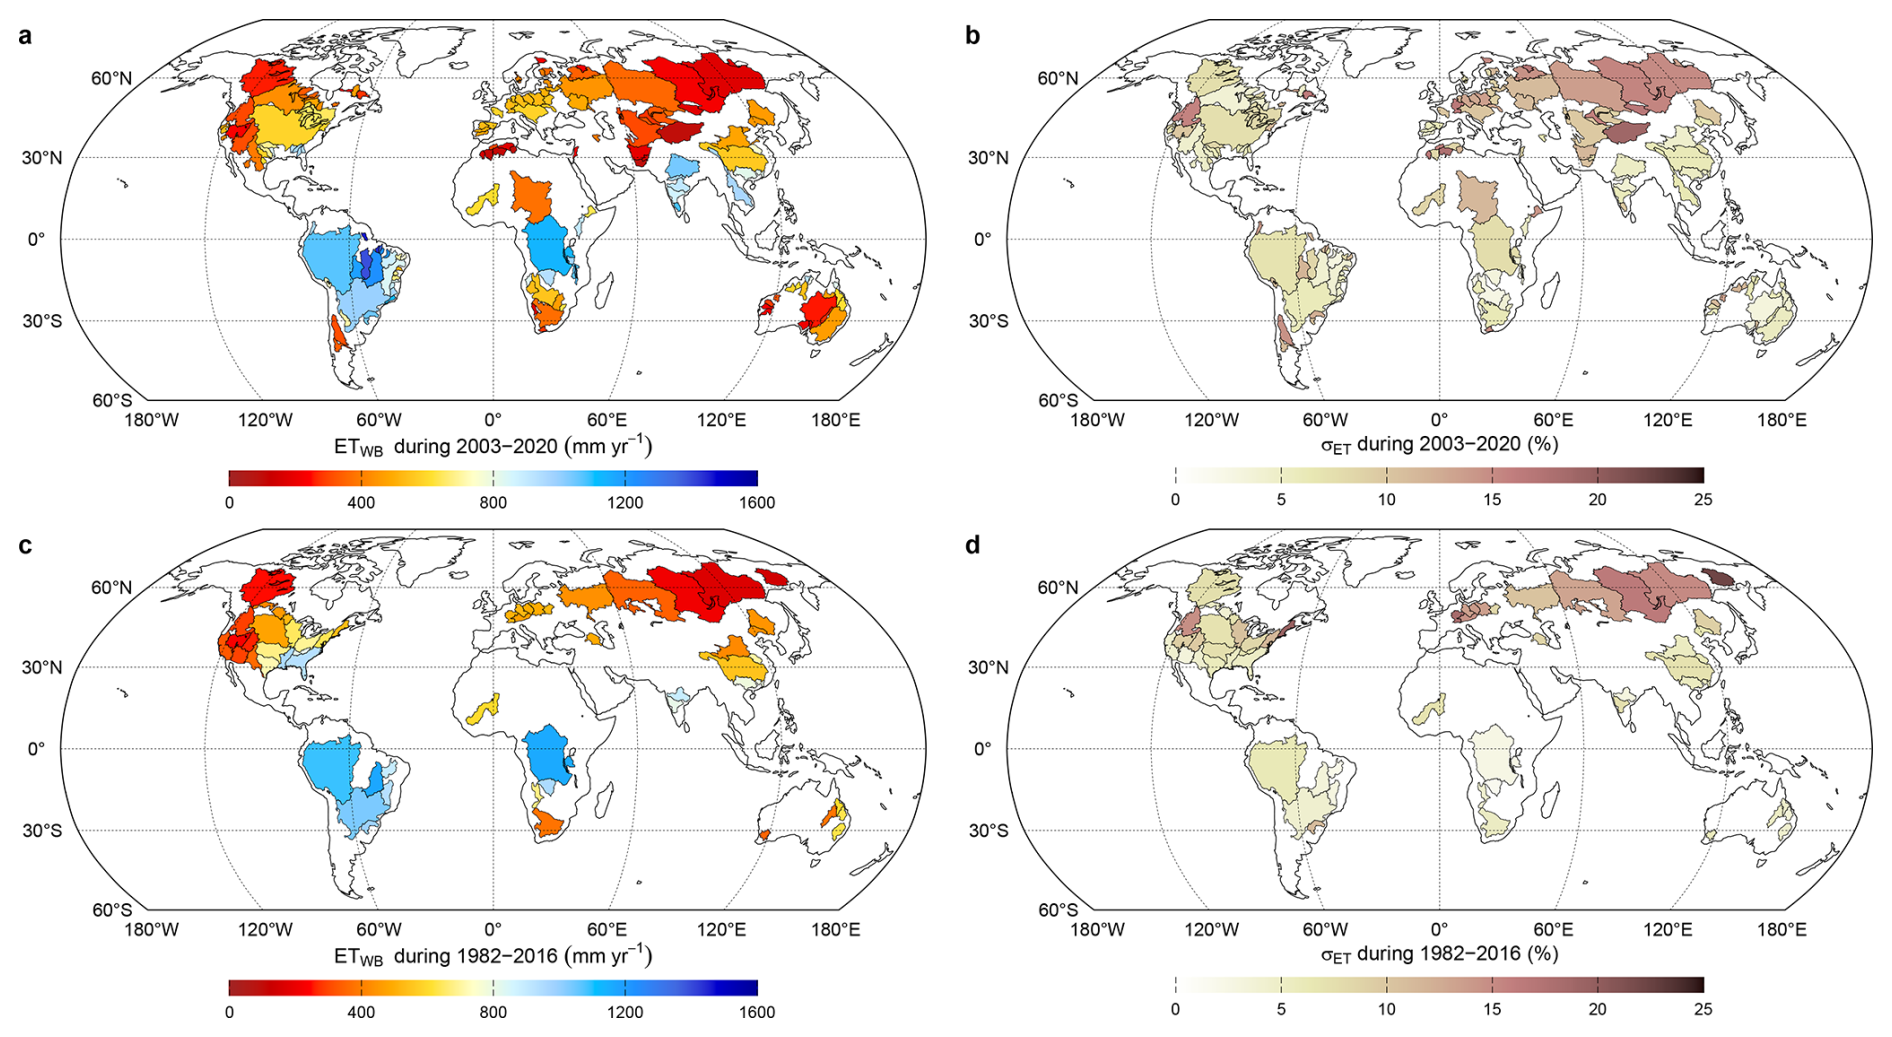
To account for inherent uncertainties in individual components of the water balance, the validation integrates multiple observation-based data sources. Similar to Ma et al. (2024), precipitation is obtained from several widely used products, including the MSWEP V2.8 (Beck et al., 2019), the Global Precipitation Climatology Project (GPCP) V3.3 (Huffman, 2024), the Global Precipitation Climatology Centre dataset (GPCC) version 2022 (Schneider et al., 2022), and the Climatic Research Unit Time Series (CRU-TS) V4.09 (Harris et al., 2020). Streamflow data are compiled from in situ observations provided by the Global Runoff Data Centre (GRDC), the United States Geological Survey (USGS), the Australian Bureau of Meteorology (BOM), and the Ministry of Water Resources (MWR) of China. Terrestrial water storage anomalies (TWSA) are obtained from the Gravity Recovery and Climate Experiment and its Follow-On mission (GRACE/FO), including solutions from the Jet Propulsion Laboratory (JPL) (Save et al., 2016; Save, 2022), the Center for Space Research (CSR) (Watkins et al., 2015; Wiese et al., 2016, 2018), and the Goddard Space Flight Center (GSFC) (Loomis et al., 2019) during 2003–2020. The 11 gap months during 2017–2018 and other isolated gaps are filled by two independent methods, including a climate adjustment scheme using singular spectrum analysis (climSSA) (Zhang et al., 2025) and a transformer-based deep learning approach (Wang and Zhang, 2024). Following Ma et al. (2024), we use the GRACE reconstruction dataset (GRACE-REC) to extend TWSA records during 1982–2002 (Humphrey and Gudmundsson, 2019). is computed as a mean of the differences between consecutive Januarys and Decembers at an annual scale.
By combining these independent data sources, the analysis explicitly accounts for observational uncertainties, which can vary substantially across regions. Basin-scale water-balance ET estimates (ETWB) are obtained using an arithmetic mean method, which allows for the estimation of a consensus ET signal while minimizing the influence of individual data-source errors. The associated uncertainty (σ) is quantified as the standard deviation across all feasible combinations of P, Q, and datasets.
where σ are computed as standard deviation among different data sources and processing methods. Following Ma et al. (2024), a relative uncertainty of 5 % is assumed for Q.
As shown in Fig. 3, this validation framework is applied across multiple spatial and temporal scales. Specifically, it includes an analysis of 56 large river basins (Ma et al., 2024), covering approximately 29 % of the global land surface for the period 1982–2016, and an expanded assessment of 152 large basins, representing about 42 % of global land area, for the period 2003–2020 (streamflow data extended from Zhang et al., 2023).
2.5 Statistical analysis
The predictive accuracy of the model is evaluated using a suite of performance metrics, including NSE, Bias, the Pearson correlation coefficient (R), and Root Mean Square Error (RMSE). These metrics are selected to provide a balanced assessment, as they compensate for each other's specific limitations. While R measures the strength of the linear relationship and NSE evaluates the overall fit relative to the observed mean, both can be sensitive to extreme outliers or peak values. To address this, RMSE is used to quantify the absolute error in the same units as the data, and Bias is employed to detect any systematic over- or under-estimation (volume error). Collectively, this multi-metric approach ensures that the model is validated for its ability to capture both the timing and the magnitude of the observed data.
To interpret long-term changes, the non-parametric Mann-Kendall (MK) test and Sen's Slope estimator are applied to quantify the significance and magnitude of trends. These methods are robust against outliers and non-normal distributions, ensuring that the results represent long-term trends rather than impact of anomalies.
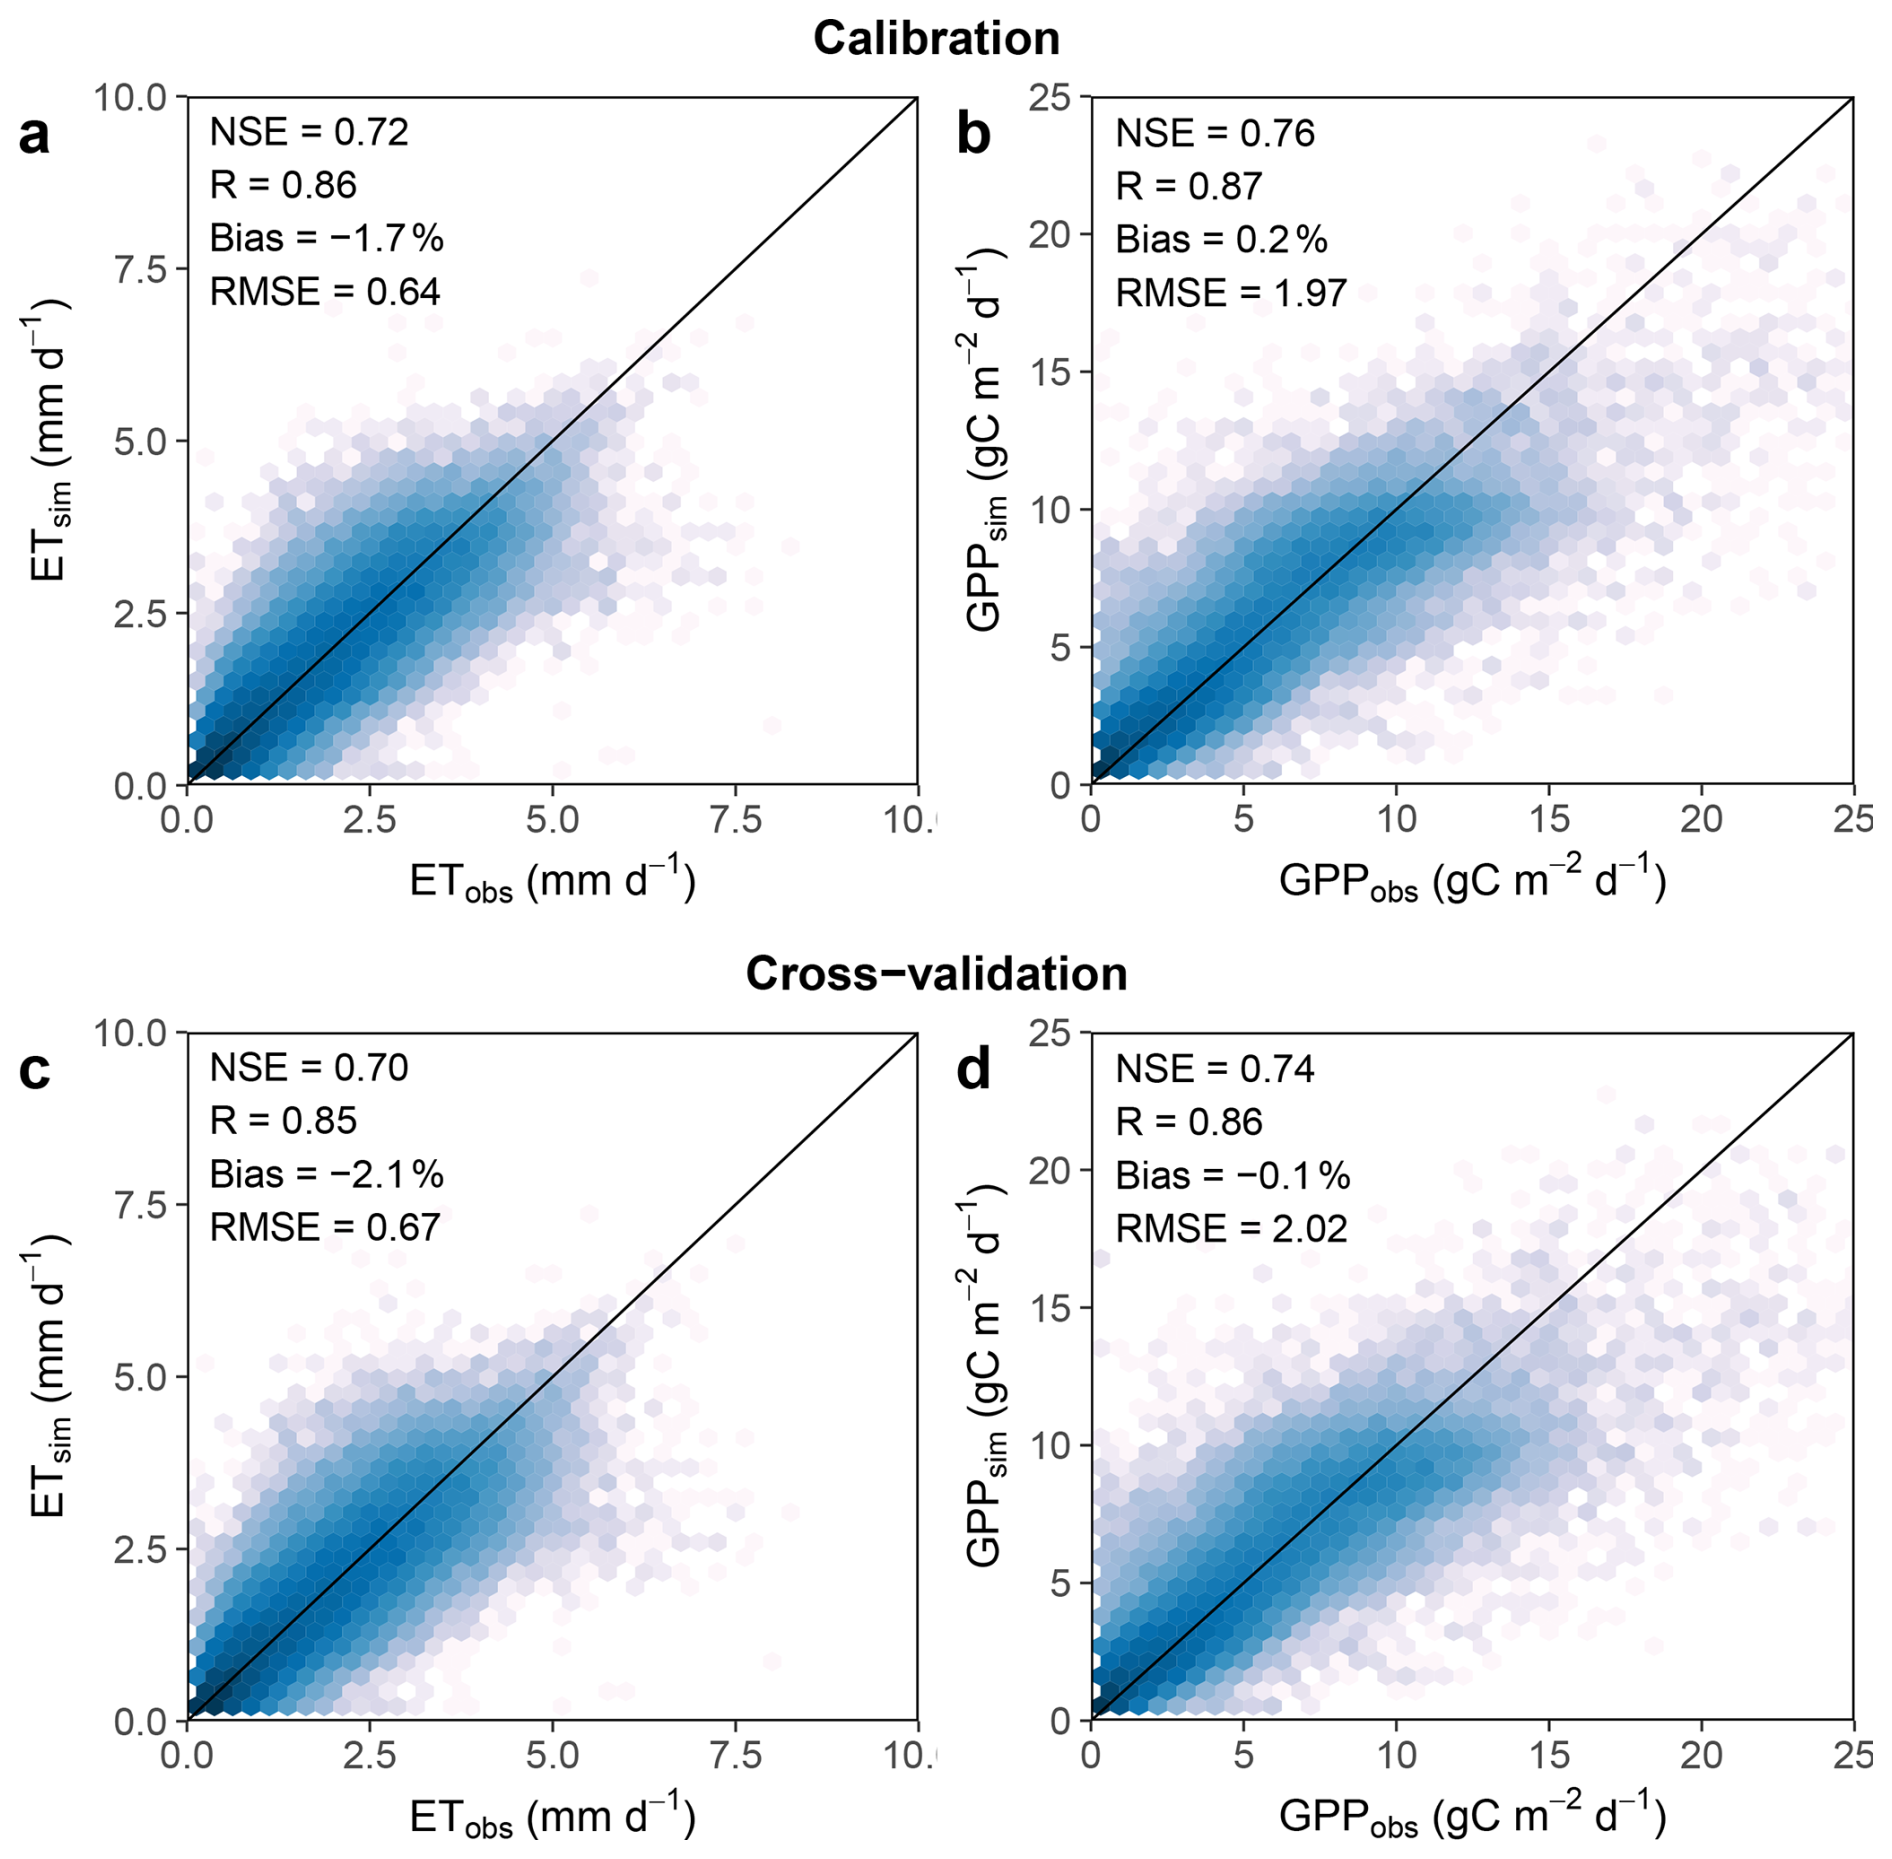
Figure 4Model calibration and cross-validation result under IGBP classification of the total 208 sites.

Figure 5Calibration and cross-validation result over different PFTs under IGBP classification. Note that 8 of the 12 IGBP PFTs have the same parameters but with different names under CCI classification (Table 2).
3.1 Model calibration and validation
The PML model demonstrates high proficiency in estimating 8 d ET and GPP across the 208 eddy covariance sites (Fig. 4). Overall, the model performs robustly in capturing flux variability, indicated by ET statistical metrics: NSE = 0.72, R = 0.86, RMSE = 0.64 mm d−1, Bias = −1.7 %, and GPP statistical metrics: NSE = 0.76, R = 0.87, RMSE = 1.97 g C m−2 d−1, Bias = 0.2 %. The corresponding Kling-Gupta Efficiency (KGE) values for ET and GPP are 0.86 and 0.82. Similarly, it has robust model performance in cross-validation for both ET and GPP, with only slight degradation in overall NSE and other metrics. The validation of WUE (GPP per unit of ET consumption) at the site scale demonstrates good model performance across both multi-year and annual scales, with cross-validation NSE values of 0.52 and 0.35, respectively, and absolute biases consistently maintained within 5 % (Fig. A4). The clustering of points along the 1 : 1 line across both calibration and validation phases demonstrates the model's robustness in capturing flux variability across diverse site conditions.
Building upon these global site-level assessments, the model's performance remains highly stable when analyzed across different PFTs (Fig. 5). For ET performance, accuracy is consistent across most biomes, with PFT-specific NSE values typically ranging from 0.45 to 0.78 and R values between 0.74 and 0.92. PFTs such as grasslands (GRA), deciduous broadleaf forest (DBF), and wetlands (WET) exhibit the highest precision in water flux estimation, with RMSE generally staying between 0.5 and 0.95 mm d−1. Bias remains within ± 5 % for the majority of categories.
Regarding GPP performance, the model achieves even higher metrics across the PFT spectrum, with NSE reaching up to 0.88 and R values exceeding 0.90 for categories such as WET and deciduous needleleaf forest (DNF). While agricultural types – specifically irrigated (CRO-IRR) and rainfed (CRO-RFD) croplands – display higher absolute errors (RMSE) compared to natural vegetation, their biases remain tightly clustered around zero. This indicates that the model effectively captures the magnitude of carbon productivity with minimal systematic error across different vegetation structures.
Overall, the model demonstrates high robustness and regionalization capability, with high consistency between calibration and cross-validation metrics across biomes. This robustness is particularly evident in GPP estimates, which show greater stability than ET during validation. Despite this reliability, some PFT-specific sensitivities persist: EBF remains challenging to simulate due to low seasonal variability limiting the signal-to-noise ratio, while DNF shows a sharper cross-validation drop in ET NSE likely due to the limited representation (only four sites). Nonetheless, the high consistency across most PFTs confirms the model's reliability for capturing complex eco-hydrological processes under varying conditions.
3.2 Improved parameterization of croplands
The implementation of a split parameterization scheme for rainfed (CRO-RFD) and irrigated (CRO-IRR) croplands led to significant performance improvements (Fig. 6). For rainfed systems, the model showed a notable increase in the NSE by 0.07 and a reduction in RMSE by 0.07 mm d−1, effectively mitigating systematic biases with a decrease in ET Bias of 10.0 %. While the irrigated ET precision metrics remained relatively stable, the Bias shifted by 7.4 % toward the zero-baseline, suggesting a more accurate representation of water availability and management in irrigated agricultural lands compared to the traditional mixed approach.
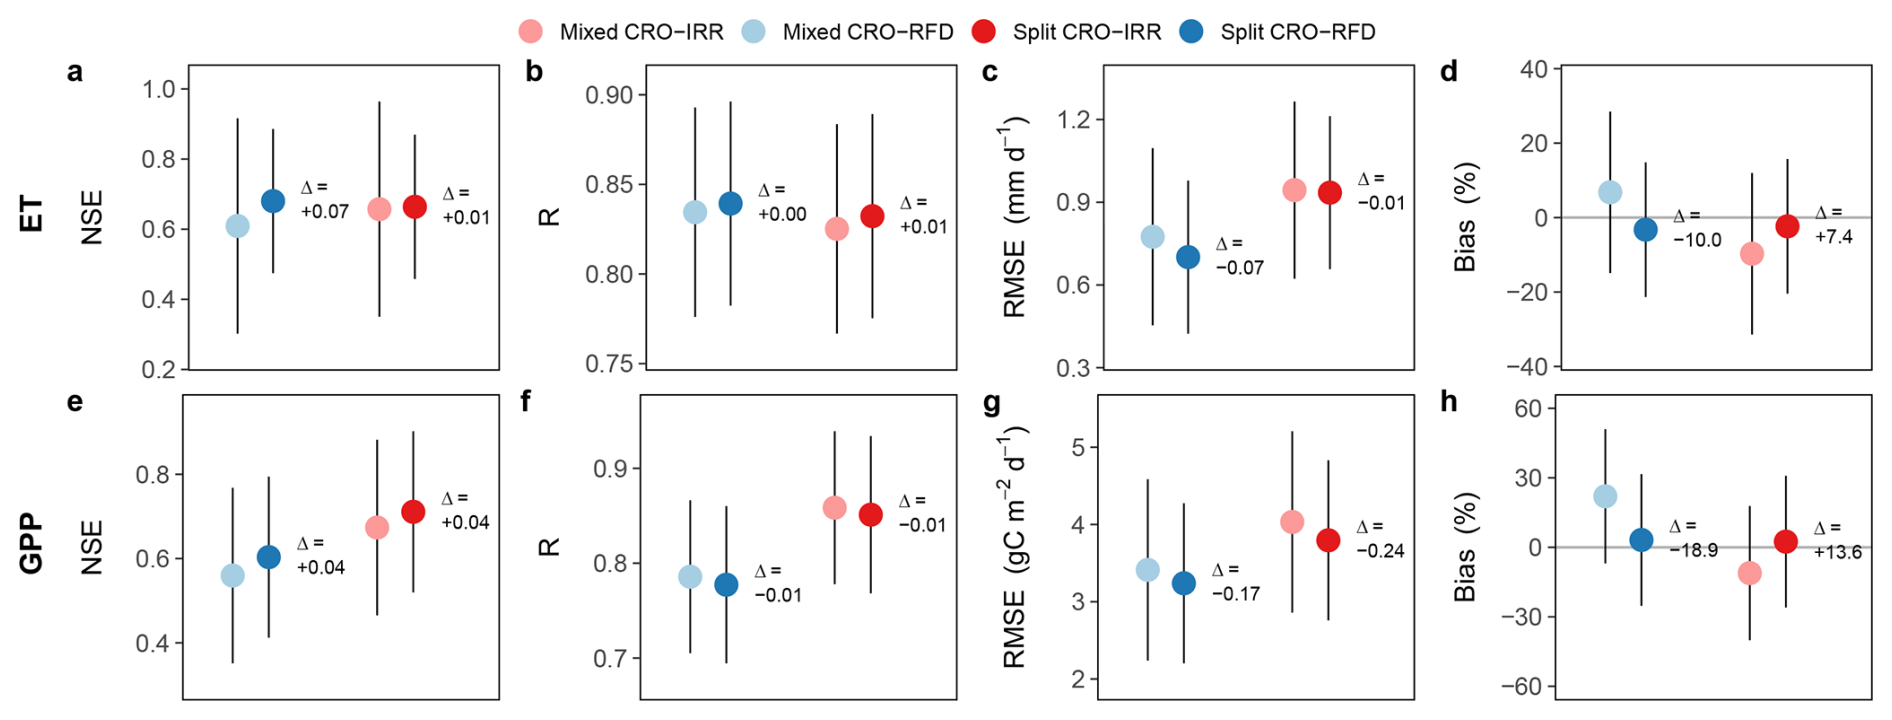
Figure 6Improvement in cross-validation by split parameterization across rainfed and irrigated croplands compared with mixed parameterization. The evaluation was conducted across 29 flux sites, including 14 irrigated and 15 rainfed sites.
Substantial enhancements were also observed in GPP simulations, where the split scheme addressed systematic errors more effectively than the mixed model. GPP RMSE decreased by 0.17 and 0.24 g C m−2 d−1 for RFD and IRR, respectively, while Bias was substantially reduced by 18.9 % and 13.6 %. Overall, this parameterization scheme reduced the magnitude of systematic errors across all agricultural lands by averages of 8.7 % for ET and 16.2 % for GPP. This suggests that the conceptual simplification of treating irrigated and rainfed crops as distinct entities enables a more physically consistent representation of agricultural cycles. By separately capturing high-productivity irrigated regimes and moisture-limited rainfed growth, this approach effectively achieves a better closure of both water and carbon balances.
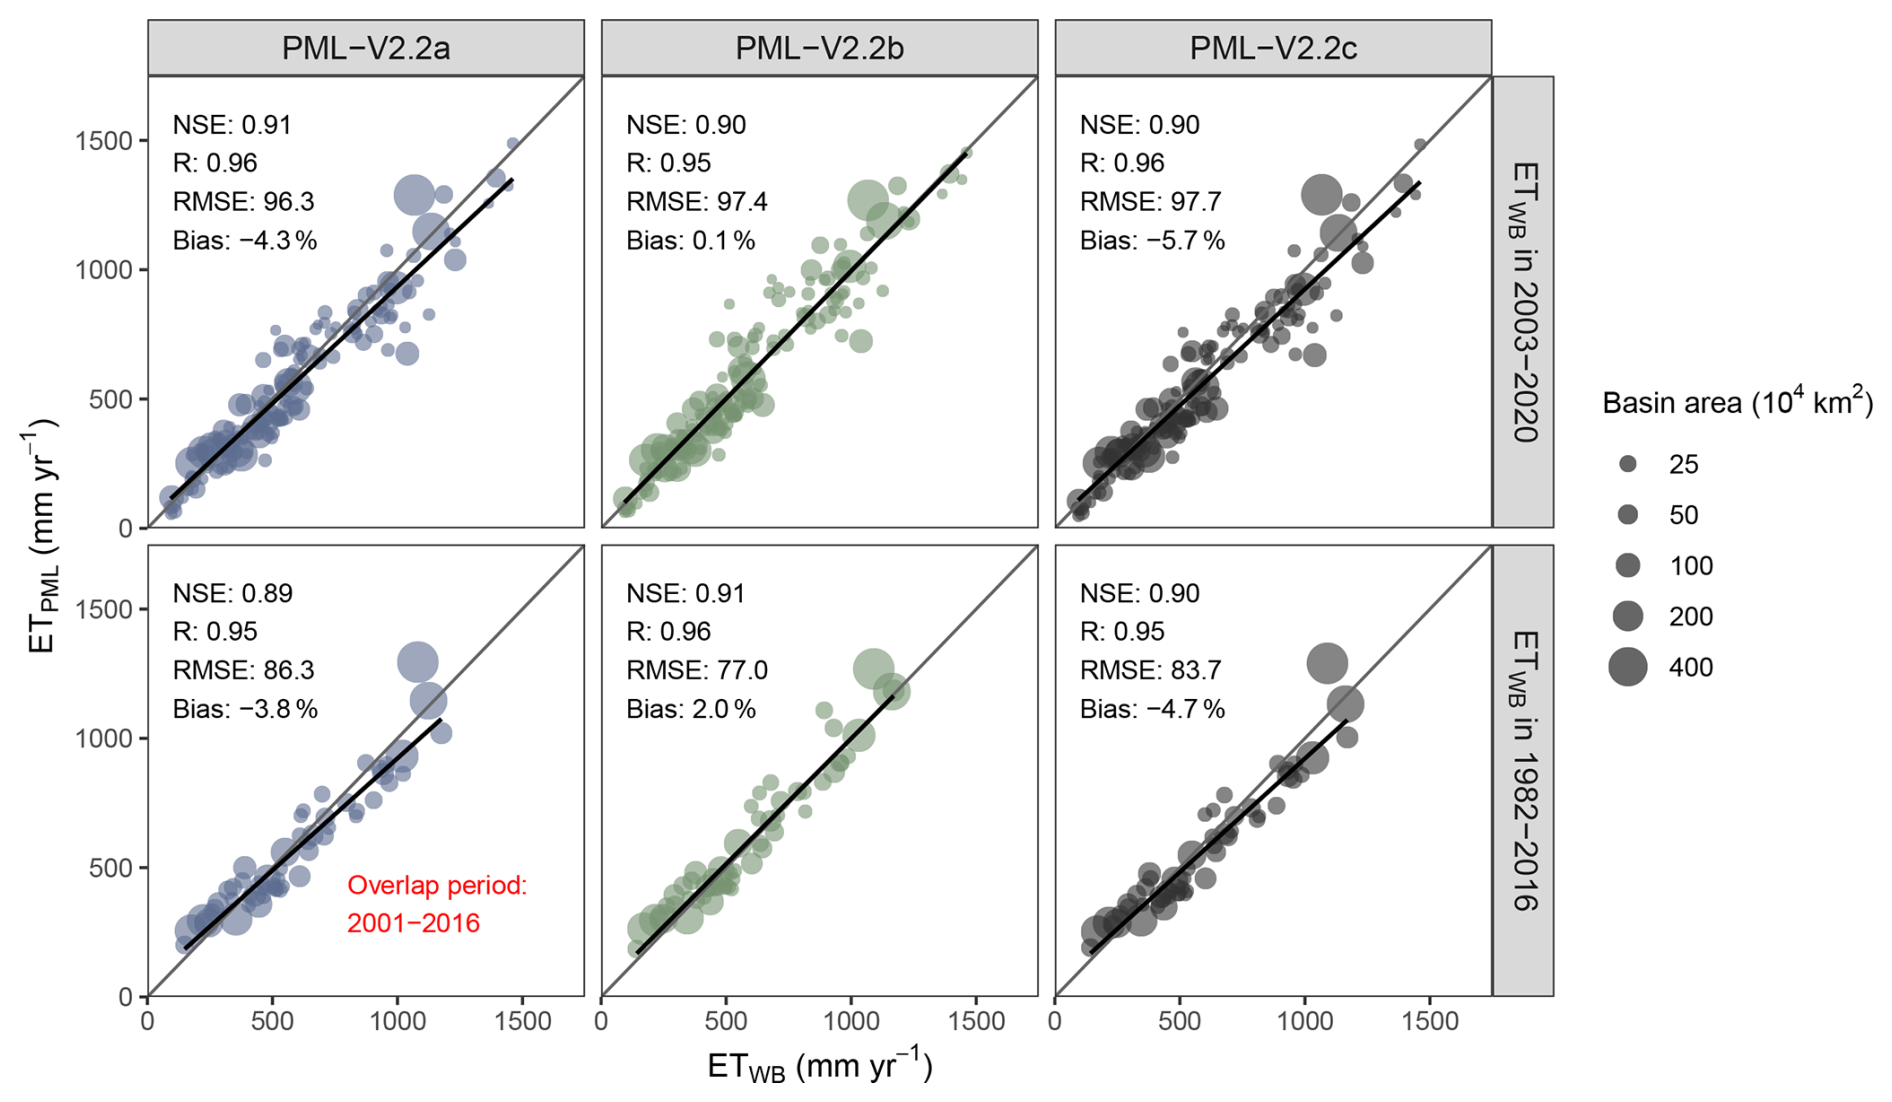
Figure 7Comparison of simulated ET from three versions of PML-V2.2 datasets with water-balance-derived ET (ETWB) averaged for two basin datasets over different historical periods (1982–2016 and 2003–2020). Note that ETWBdata are shown in Fig. 3. The four evaluation metrics here are computed without area weights, while an additional figure considering area weights is shown in Fig. A5.
3.3 Basin-scale water balance validation
Basin-scale validation against water-balance-derived ET (ETWB) confirms the robust performance of all three PML-V2.2 products across different historical periods (Fig. 7). Across both the 2003–2020 (152 basins) and 1982–2016 (56 basins) evaluation windows, the products consistently yield high accuracy with NSE values of 0.89–0.91 and R ≥ 0.95. Subtle discrepancies exist between versions a and b, primarily driven by differences in LAI, albedo, and PFT inputs. While the point-wise statistics indicate a slight underestimation for most products, the primary biases for all versions remain well within ± 6 %. Notably, supplementary analysis (Fig. A5) reveals a marginal bias when results are aggregated by basin area, highlighting the relative effects inherent in basin-scale water balance validation. While ETWB estimates are not entirely bias-free (Fig. 3), the validation results remain within a reasonable and acceptable range, particularly given the robust NSE values across basins.
3.4 Consistency of consolidation
To evaluate the consistency and reliability of the data integration process, we first assessed the transition between the recent satellite epochs. Supported by highly consistent relative changes in LAI and Albedo between 2020–2022 and 2013–2015 (NSE = 0.80 and 0.79, Figs. A2 and A3), the corresponding shifts in ET and GPP based on MODIS and VIIRS exhibit high spatial agreement (NSE = 0.99 and 0.94, Fig. A6). Consequently, the primary challenge for long-term consistency lies in bridging the AVHRR-based product (PML-V2.2b) with the MODIS-based version (PML-V2.2a).
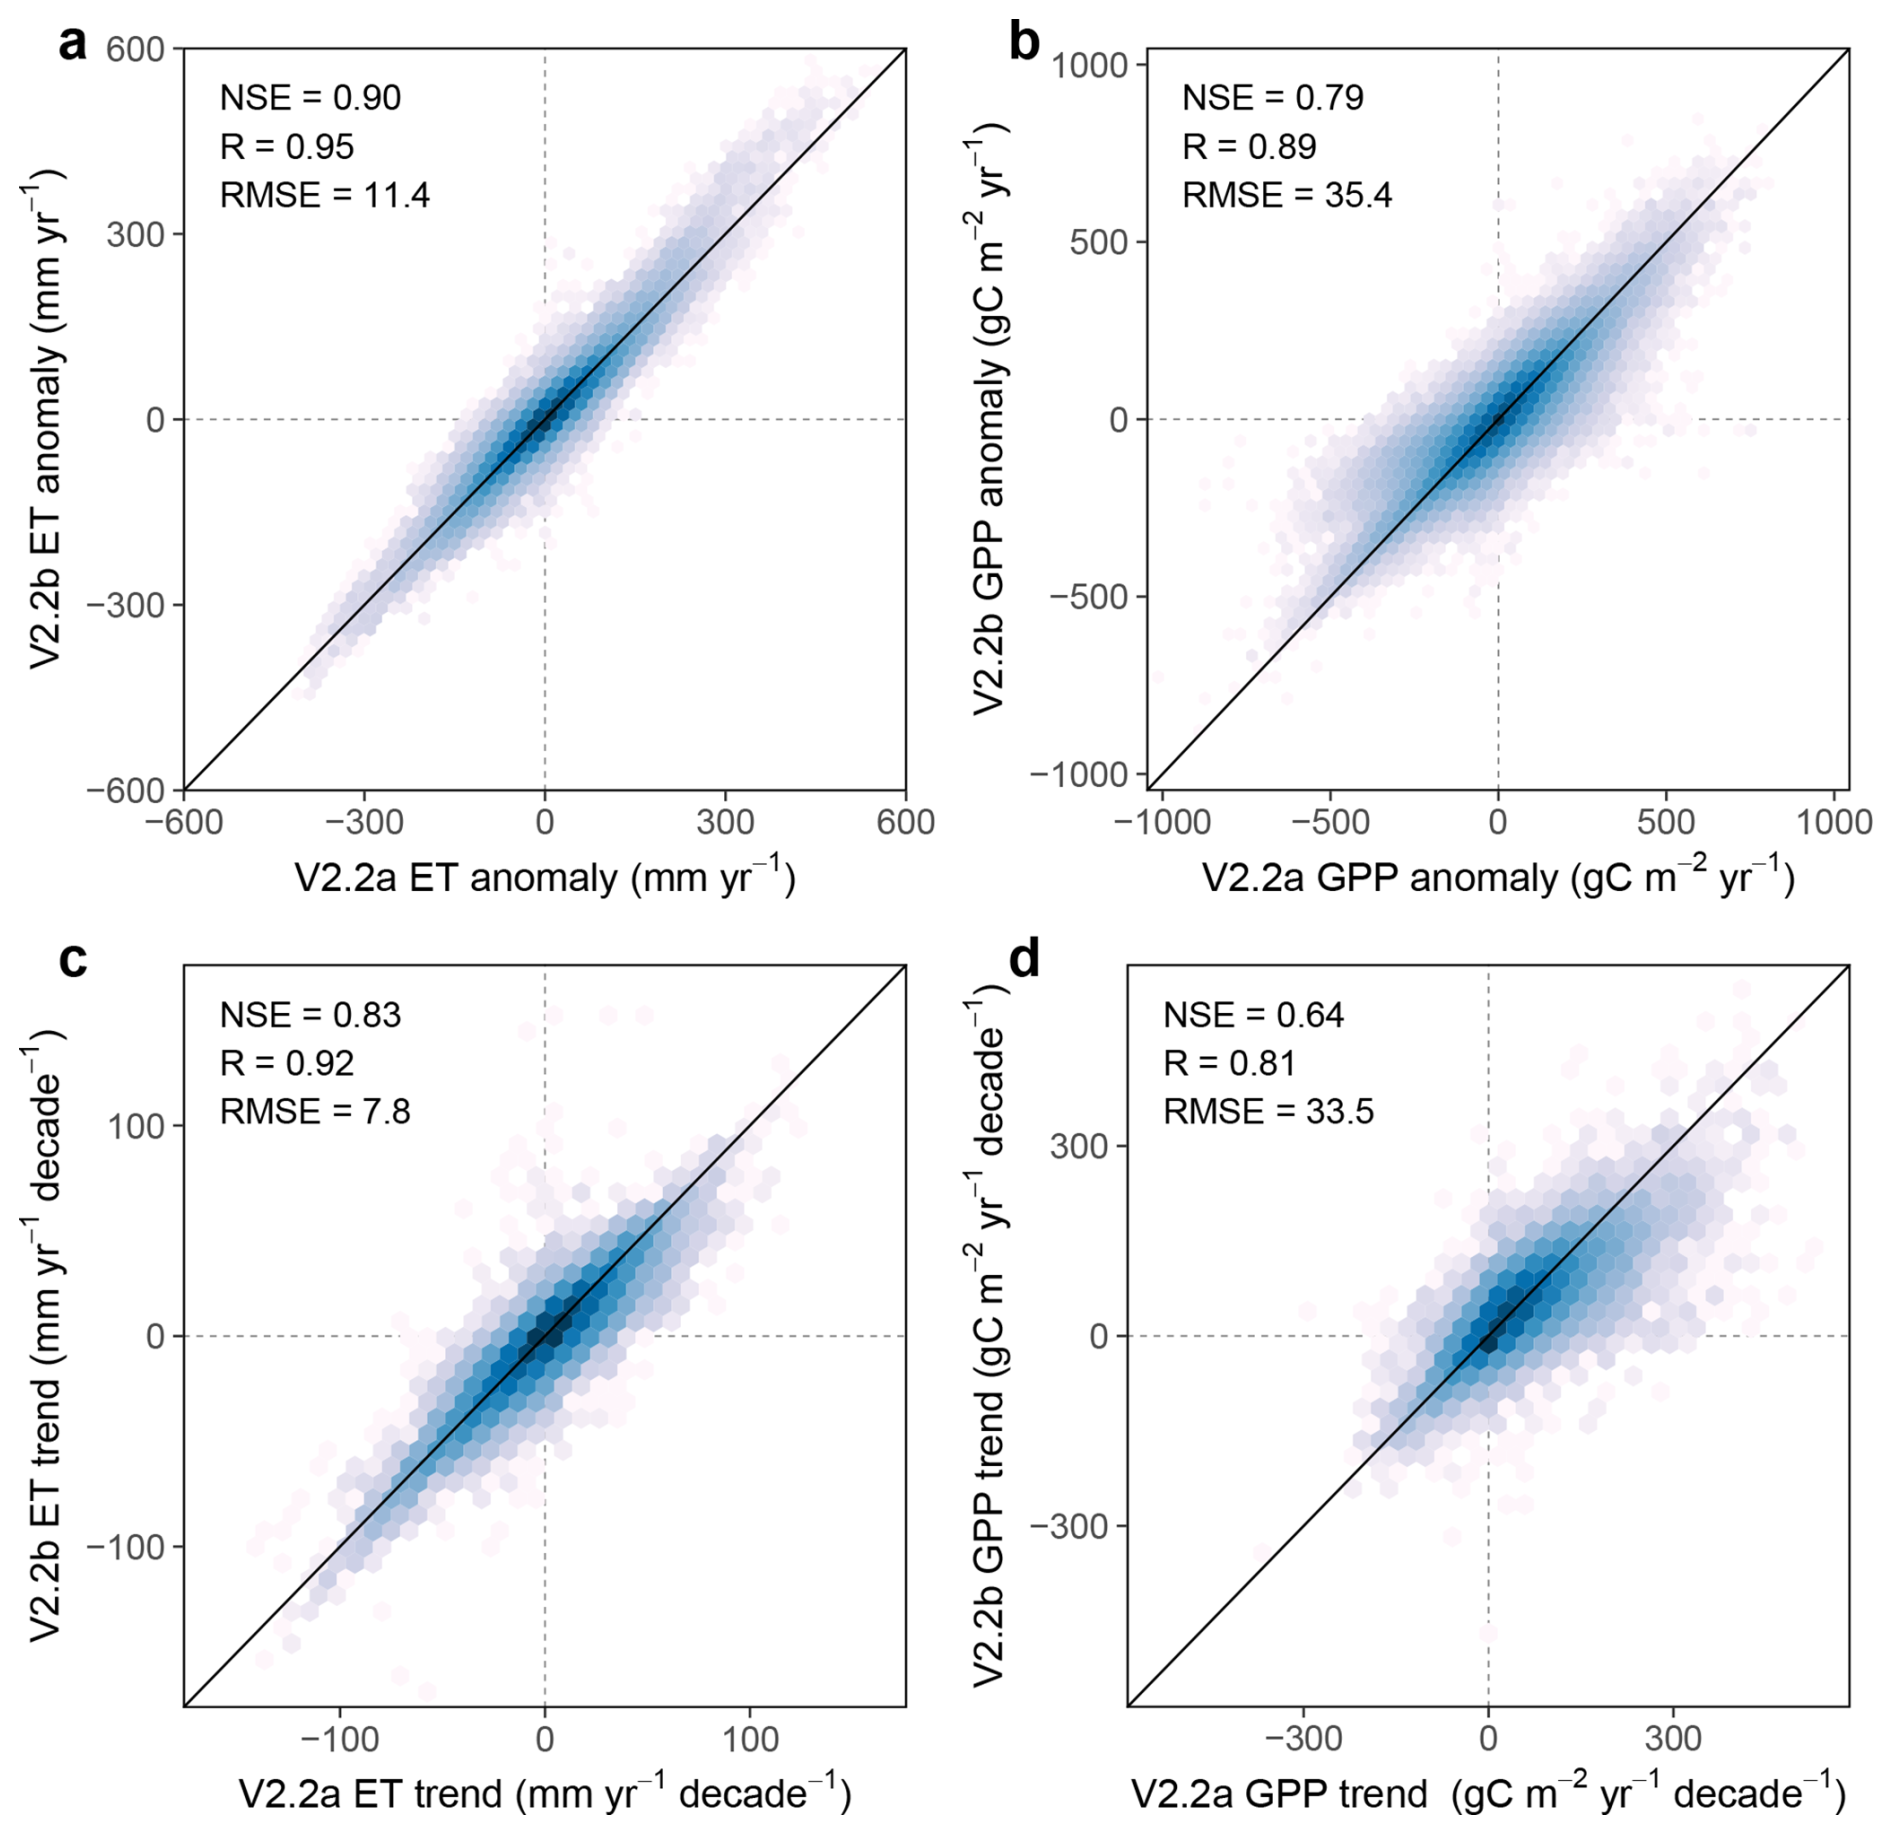
Figure 8Consistency of interannual variability and decadal trends between AVHRR-based PML-V2.2b and MODIS-based PML-V2.2a during the overlapping period of 2001–2020. Panels (a) and (b) compare the annual anomalies for ET and GPP, respectively, indicating the agreement in interannual variability. Panels (c) and (d) compare the decadal trends (see Fig. A7 for the corresponding spatial trend maps). The metrics are calculated based on aggregated grids at a 0.5° resolution to demonstrate the robustness of the consolidation process.
To address this, their decadal trends and annual anomalies were compared for the overlapping period 2001–2020 (Fig. 8). The annual anomalies exhibit excellent agreement, with high consistency for ET (NSE = 0.90) and GPP (NSE = 0.79), indicating that the reconstructed dataset robustly captures interannual hydro-climatic fluctuations. The decadal trends of both ET and GPP also show a high degree of consistency across the global land surface. For ET, the two versions exhibit a strong correlation (R = 0.92) and a high NSE = 0.83 (slightly lower than NSE = 0.90 for ET anomalies due to inherent uncertainty in trend estimation). Similarly, GPP trends demonstrate significant agreement with an R value of 0.81 and an NSE of 0.64. These statistical results are further corroborated by the spatially coherent global patterns shown in Fig. A7. While slight regional variations exist due to remote-sensing forcing data inputs, the comparison of their mean climatology highlights that the PML-V2.2b product yields higher ET and GPP estimates across most non-tropical rainforest regions, primarily driven by the inherently higher LAI values in these areas (Fig. A8). Nevertheless, the overall alignment along the 1 : 1 line confirms that the consolidation process preserves the core long-term hydro-climatic signals of the original datasets.
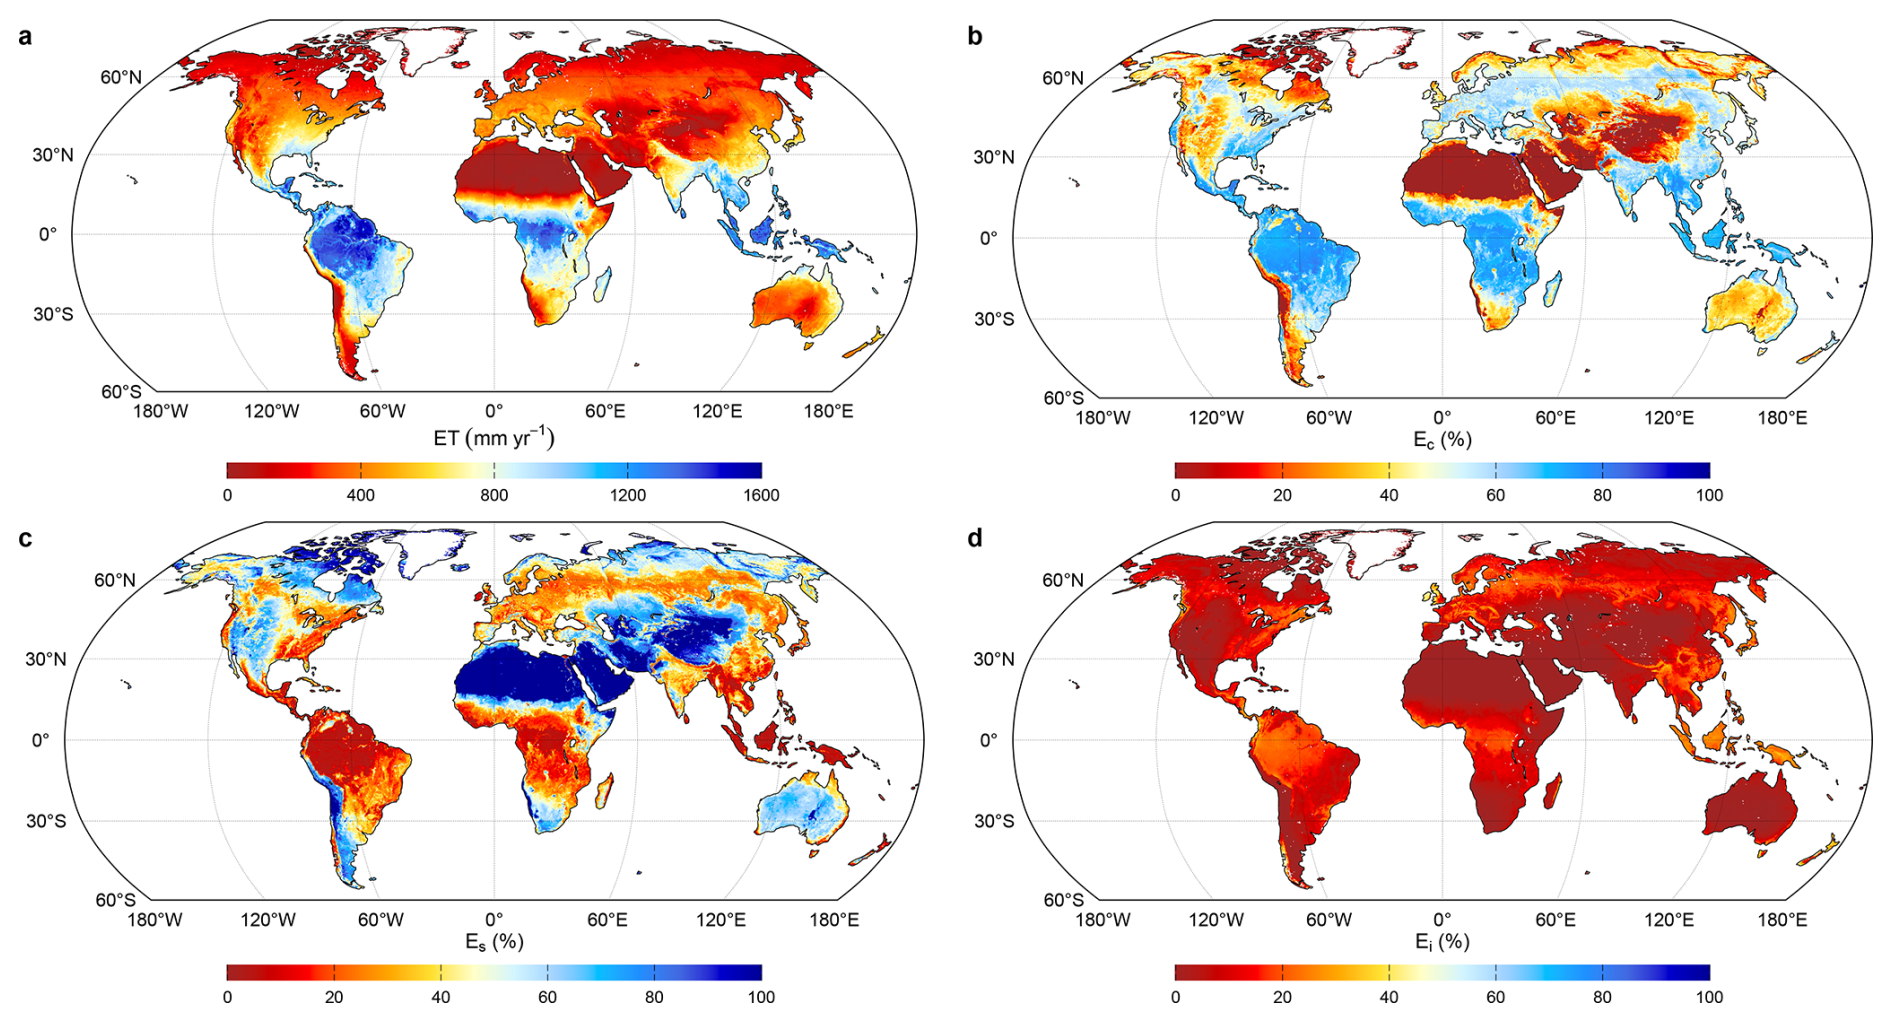
Figure 9Global patterns of terrestrial evapotranspiration (ET) and its components of the PML-V2.2c dataset during 1982–2025.

Figure 10Global patterns of terrestrial gross primary production (GPP) and water use efficiency (WUE) of the PML-V2.2c dataset during 1982–2025. WUE is computed by GPP/ET.
3.5 Global patterns and trends during 1982–2025
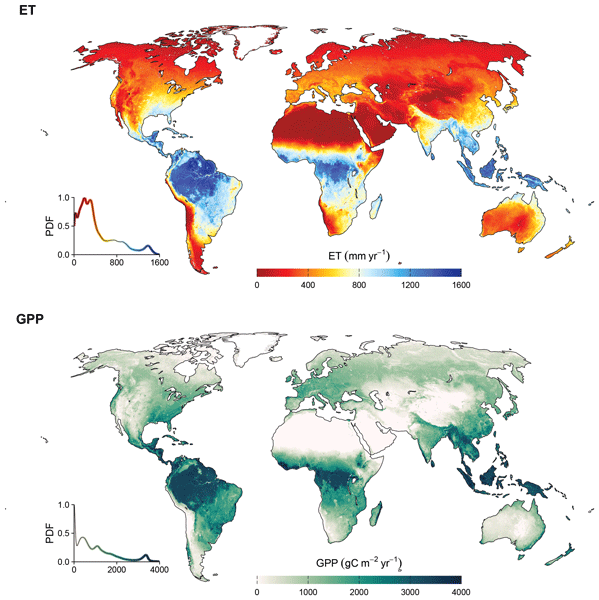
The global spatial distribution of long-term mean ET during 1982–2025 exhibits strong latitudinal gradients, reflecting the fundamental role of energy and water availability (Fig. 9). The highest ET fluxes, exceeding 1000 mm yr−1, are concentrated in tropical rainforests across the Amazon Basin, Congo Basin, and Southeast Asia. In these humid regions, vegetation transpiration and interception loss are the primary contributors to the total water flux. Conversely, ET values remain minimal in arid and semi-arid regions such as the Sahara and Central Australia, where water limitation severely constrains surface evaporation. The PML-V2.2 product effectively captures these hydro-climatic constraints, showing that transpiration dominates the global ET budget over most vegetated land surfaces. Overall, the PML-V2.2c product estimates global ET of 65.8 × 10³ km3 yr−1 during 1982–2025. This corresponds to a mean flux of 509 mm yr−1 averaged over a land area of 1.292 × 10⁸ km2 (excluding inland water bodies, permanent snow and glaciers). The partitioning reveals that 58.2 %, 30.2 %, and 11.6 % of this flux are contributed by transpiration, soil evaporation, and interception evaporation, respectively.
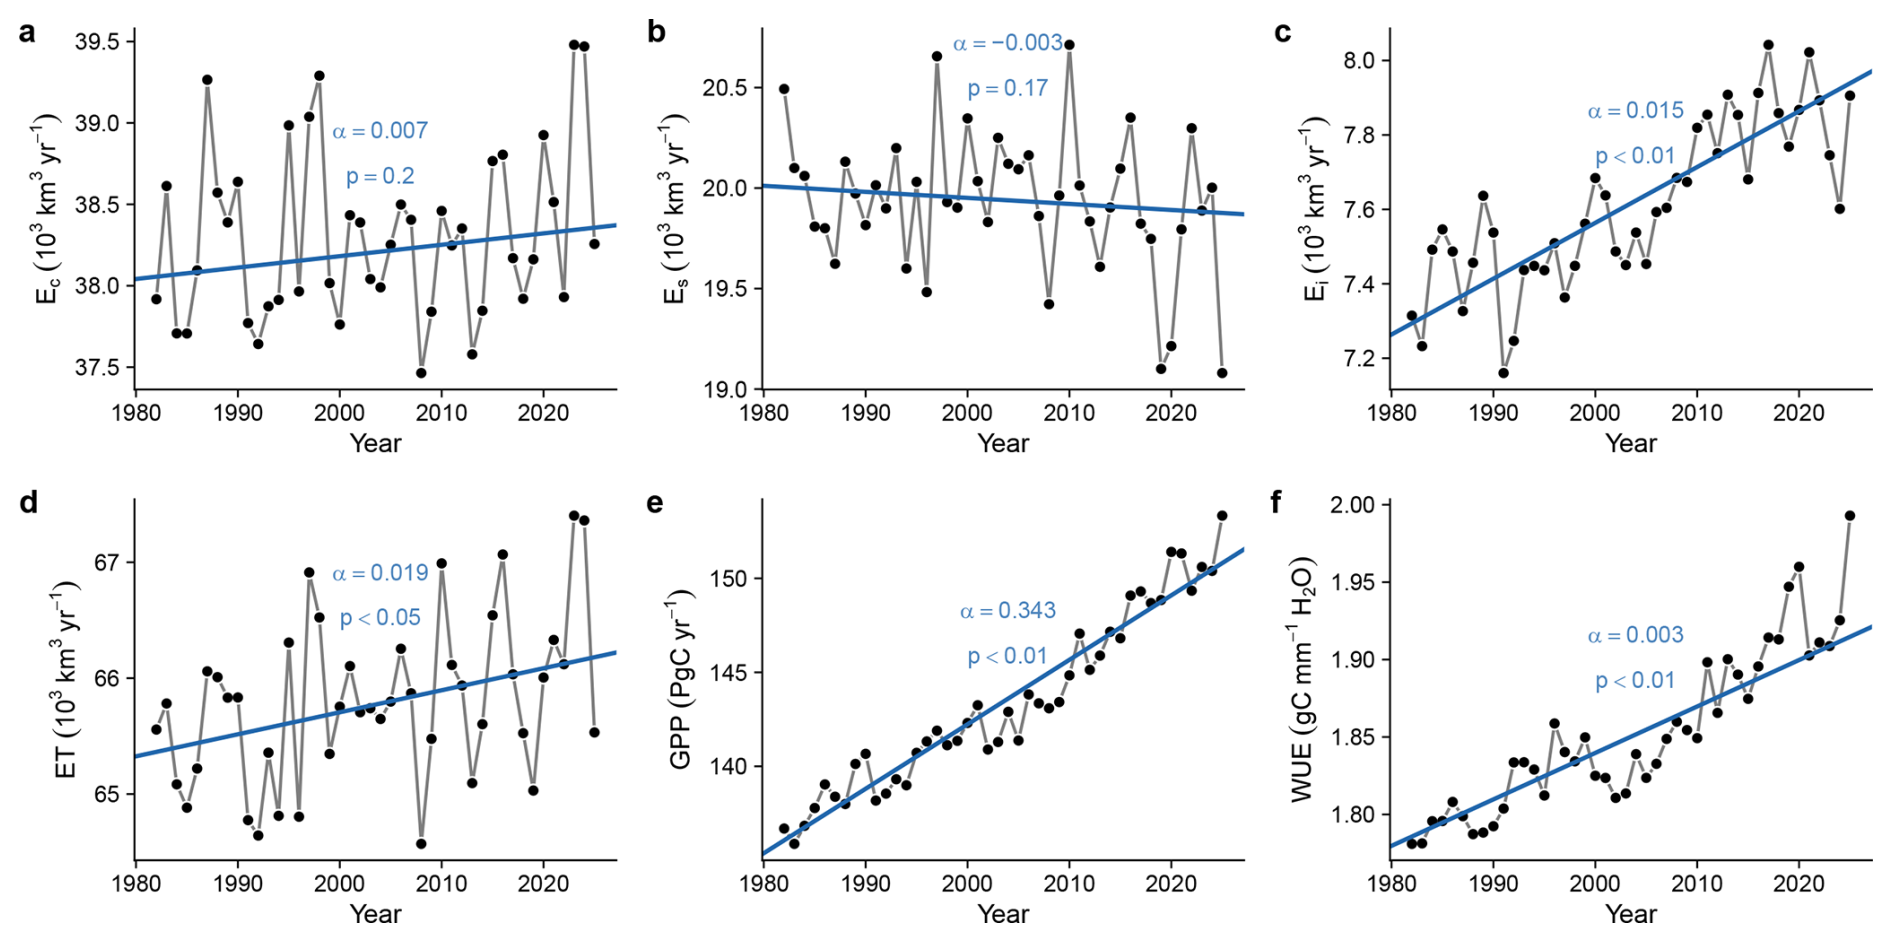
Figure 11Interannual variations and long-term trends of global water and carbon fluxes of the PML-V2.2c dataset during 1982–2025. All global calculations exclude water bodies to focus on terrestrial surfaces. The blue solid lines indicate the linear trends, where α denotes the Sen's Slope estimates (103 km3 yr−2, PgC yr−2, or gC mm−1 H2O yr−1 for different variables) and the p-value represents the significance level determined by the MK test.
Terrestrial productivity and its coupling with water consumption are characterized by the spatial distributions of GPP and WUE (Fig. 10). The global total GPP in the PML-V2.2c dataset is approximately 143.4 PgC yr−1, peaking in tropical biomes (above 2500 gC m−2 yr−1), where photosynthesis is maximized by abundant sunlight and moisture. However, the WUE pattern reveals a different ecological strategy: the highest WUE values are found in temperate forests and certain semi-arid shrublands, indicating high carbon assimilation per unit of water lost. These spatial patterns highlight the regional differences in how ecosystems balance their carbon-water trade-offs, with the PML-V2.2 dataset providing a consistent representation of these global productivity gradients.
The long-term dynamics from 1982 to 2025 reveal an intensifying global water and carbon cycle, characterized by widespread increasing trends (Fig. 11 and Fig. A9). Global GPP has shown a robust and significant increase (α = 0.343 PgC yr−2, p < 0.01), particularly in greening hotspots like China, India, and Europe. Parallel to carbon gains, global ET also exhibits a significant upward trend (α = 0.019 × 10³ km3 yr−2, p < 0.05), primarily driven by the increasing transpiration and interception. While most regions show positive trajectories, notable regional heterogeneity exists, with declining ET trends in parts of the western U.S., South America and Southern Africa. Overall, the global-scale consistent rise in GPP, ET, and WUE (Fig. A9) underscores the significant impact of CO2 fertilization and climate change on terrestrial ecosystem functions over the past 44 years.
The transition to the PML-V2.2 series represents a significant advancement in model stability and accuracy. By implementing a refined optimization framework and updated PFT schemes, the absolute bias remains within 5 % across diverse biomes, marking a substantial improvement over previous versions where ET bias could reach 10 % and GPP bias could be exceeding 25 % during cross-validation (Fig. 5 in Zhang et al., 2019). A critical improvement is observed in cropland simulations. While remote sensing-based LAI partially captures the reduced water limitation in agricultural areas, our results suggest that differences in stomatal conductance are another factor in determining accuracy. By incorporating two basic irrigation types into the parameterization, the model better reflects the enhanced productivity of managed lands. Despite these gains, substantial potential remains for further refinement. Future iterations should focus on moving beyond static PFT-based parameters toward a scheme that integrates dynamic vegetation attributes, such as leaf traits and hydraulic properties, directly into the parameterization framework to better capture physiological responses to environmental change (Yan et al., 2025).
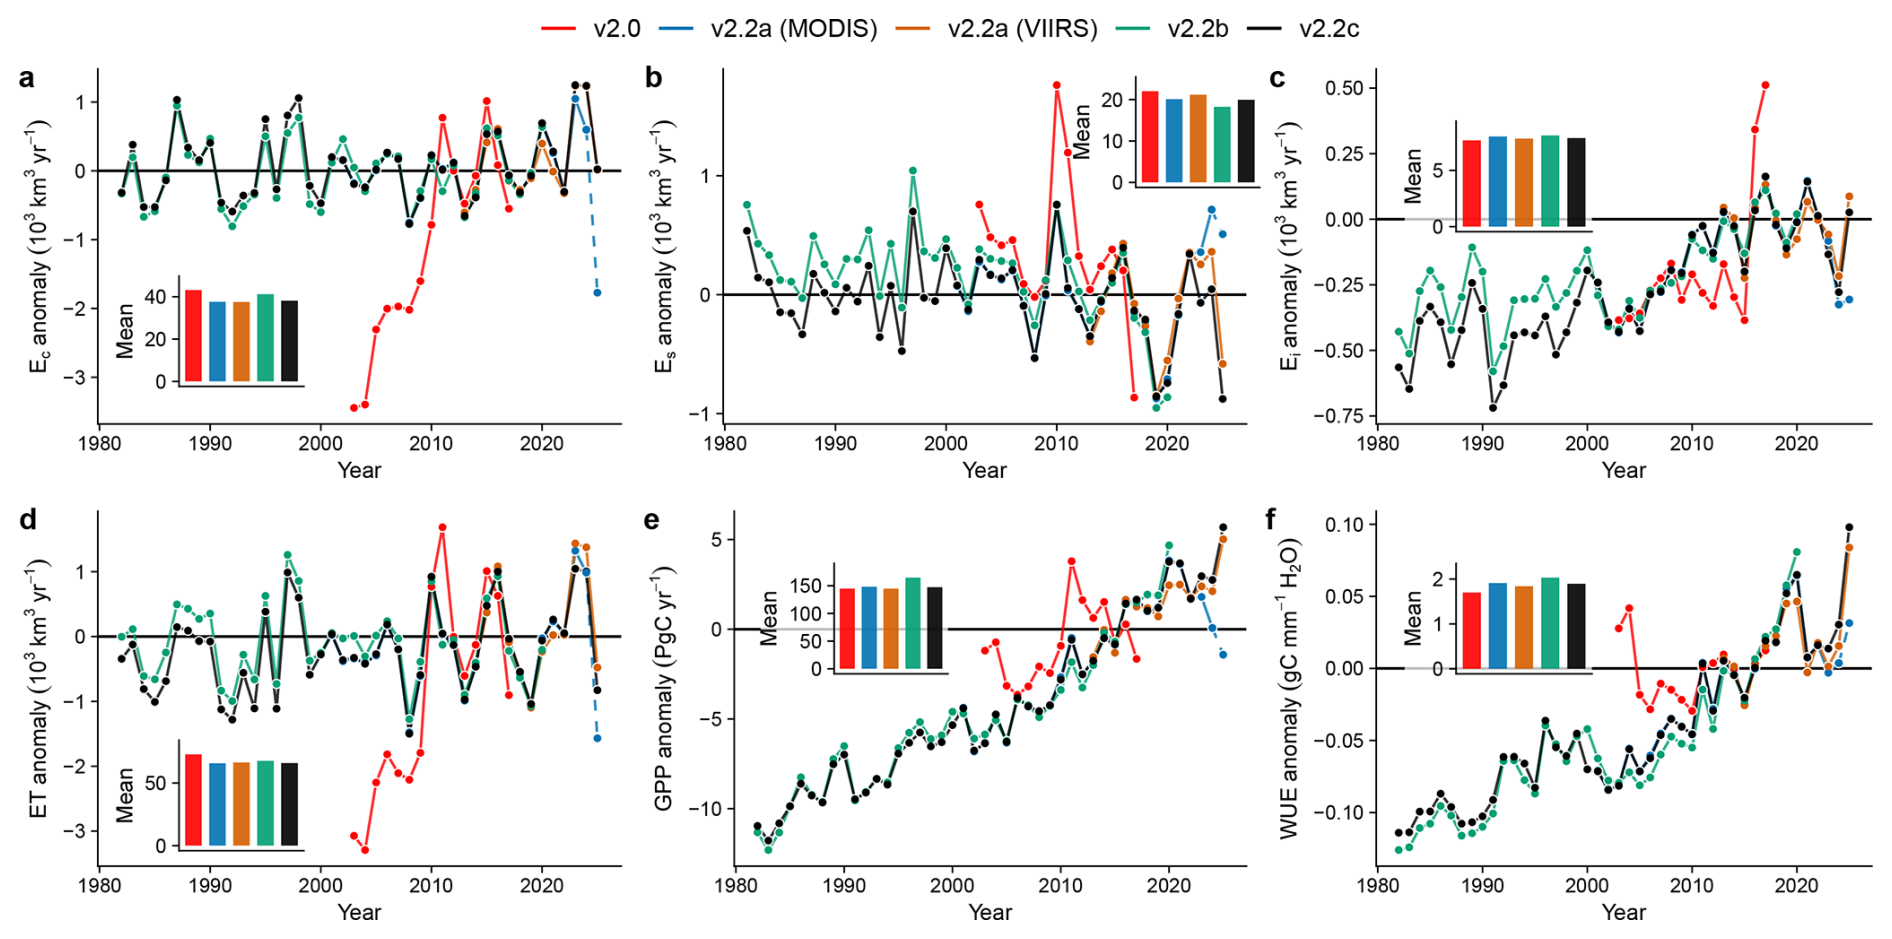
Figure 12Consistency in interannual variations and long-term trends in global water and carbon fluxes across different PML-V2 versions. Note that the higher variability in the initial PML-V2.0 is likely attributable to unstable climate forcing from GLDAS V2.1. The 2025 MODIS-based PML-V2.2a estimates (dashed line) are shown to illustrate satellite-drift induced biases but will not be available in the public data repository.
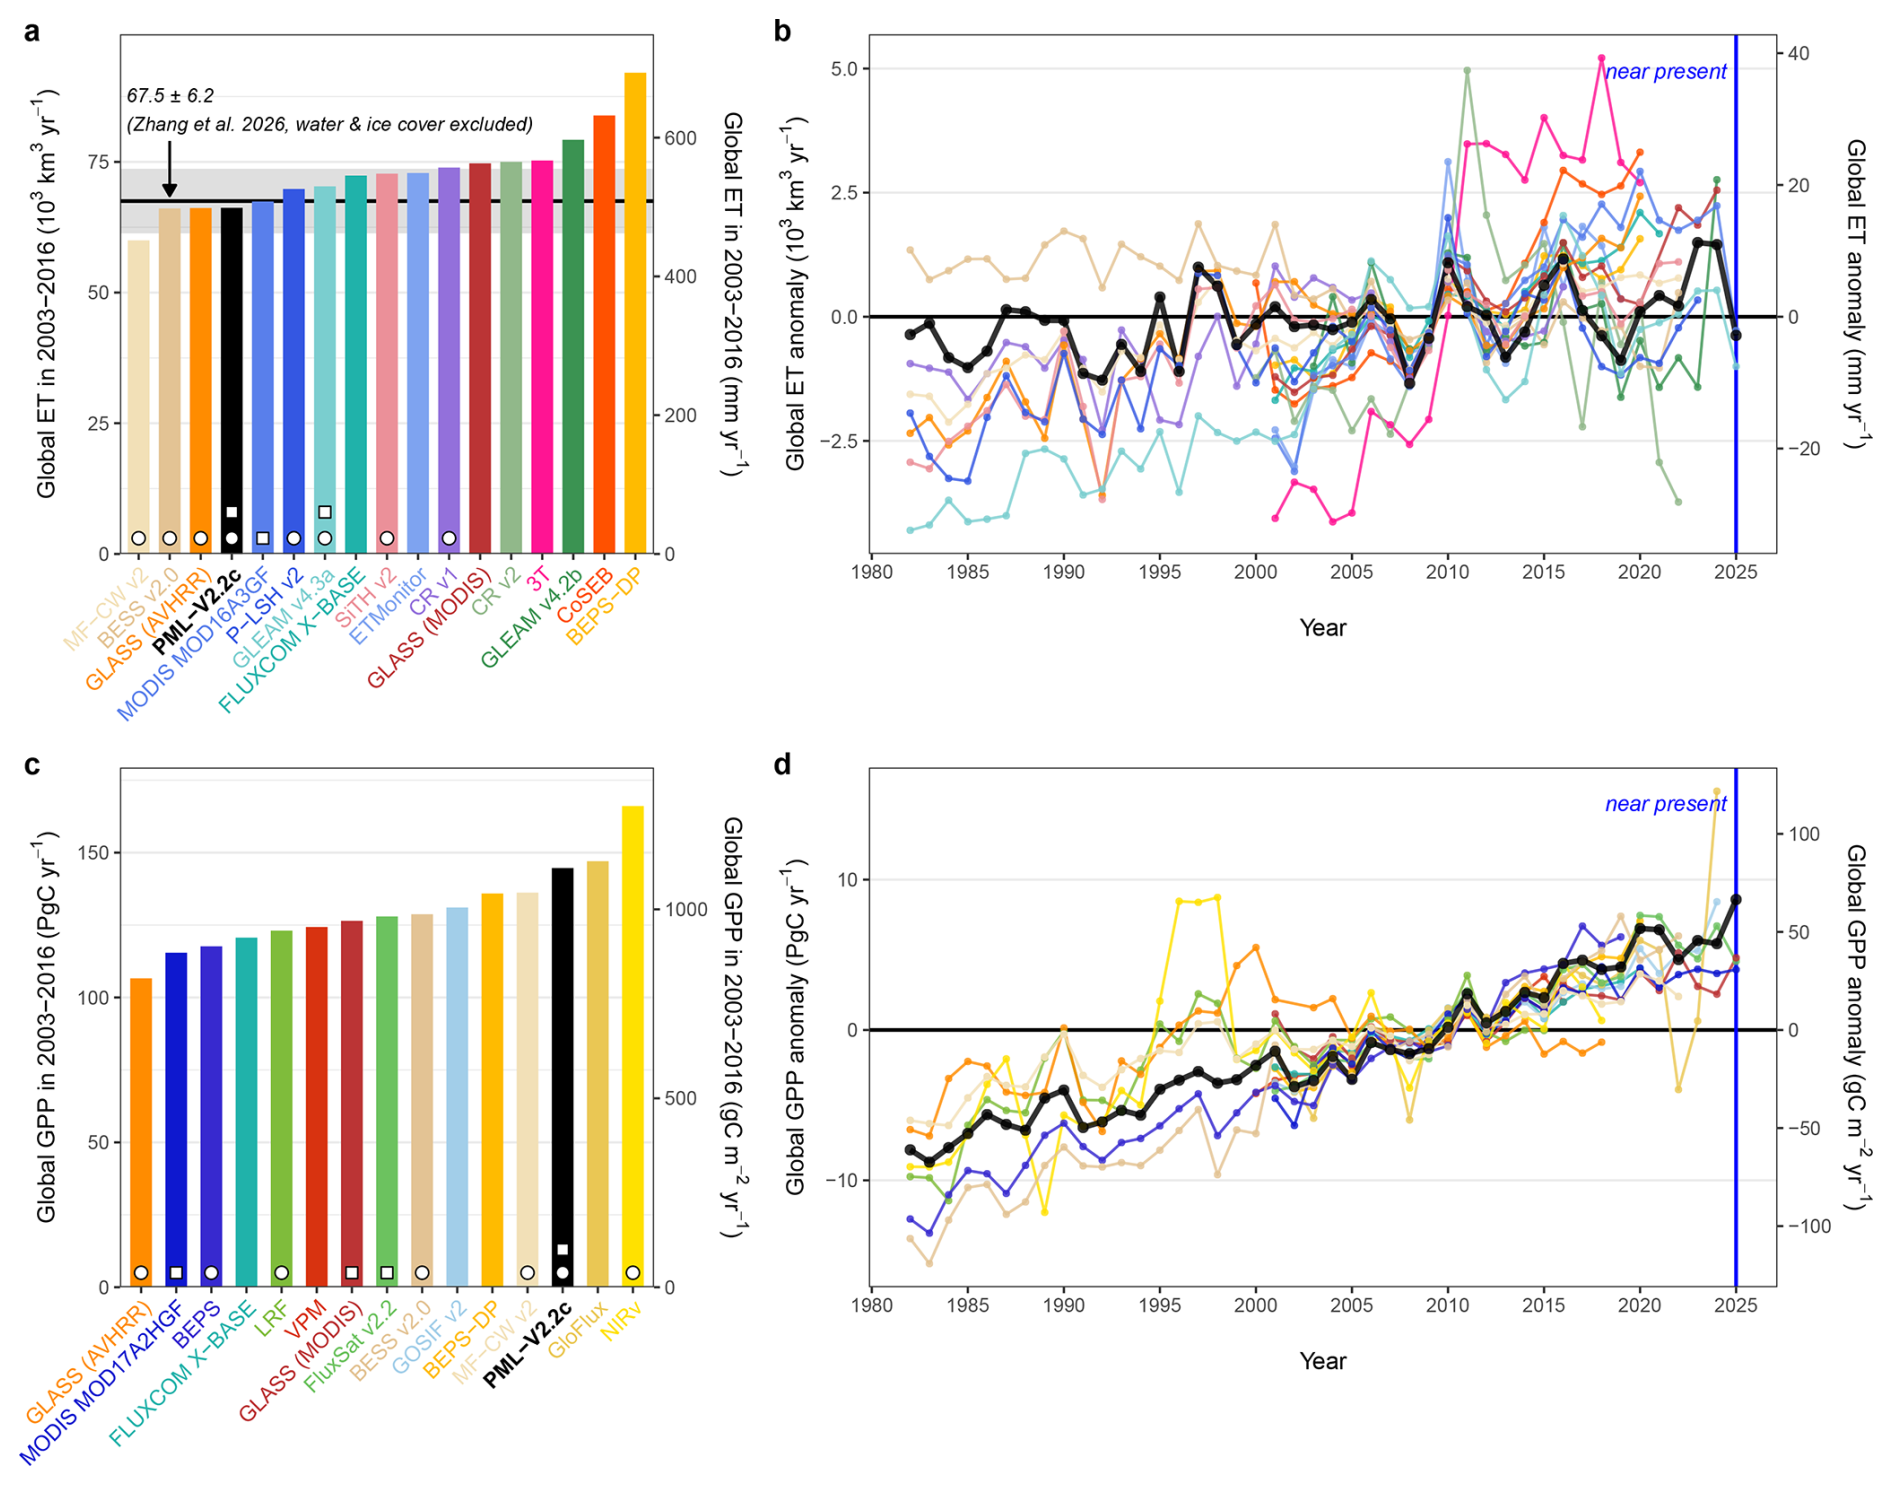
Figure 13Comparison of global mean and interannual variability in ET and GPP from mainstream diagnostic products listed in Table 1. The mean values are calculated for the period 2003–2016, during which data records are available for most products. White circles at the base of the bars denote products starting from 1982 or earlier, while white squares indicate datasets updated to the near-present of 2025.
The temporal consistency of the PML-V2.2 product from 1982 to 2025 (Fig. 12) demonstrates its robustness for long-term climate studies. This stability is primarily attributed to the use of unified meteorological forcing and parameter sets across different satellite eras. During the overlapping period, the historical AVHRR-based PML-V2.2b yields moderately higher global magnitudes (approximately +2.6 % for ET and +3.1 % for transpiration fraction) compared to the MODIS/VIIRS-based versions. This difference is driven by residual uncertainties in the consolidated historical inputs (specifically GIMMS LAI4g and GLASS albedo) (Cao et al., 2023), resulting in inherently higher LAI and GPP values across non-tropical regions (Fig. A8). Furthermore, the global and regional interannual trends show remarkable coherence (Figs. 12 and A7). To maintain this physical consistency for long-term trend analysis, we deliberately applied the unified parameter set across all epochs (Fig. 2), avoiding the scale-mismatch issues associated with separately calibrating the 0.1° AVHRR model against site-level flux towers with footprint ranging from several to hundreds of meters.
By fully integrating VIIRS to replace the aging MODIS, this framework successfully ensures high-resolution monitoring continuity into the near present and future eras (Yan et al., 2021; Endsley et al., 2025). This sensor transition is critical, as the severely degraded MODIS LAI in 2025 introduced an artificial, sharp decline in both ET and GPP estimates, as clearly captured by the v2.2a (MODIS) anomaly stream in 2025 (dashed blue line in Fig. 12), justifying our decision to discontinue the MODIS-based updates (Figs. A2 and A3). Under the current consolidation structure, PML-V2 can be continuously updated to provide a reliable, long-term record for critical assessments, such as the State of Global Water Resources Report compiled by World Meteorological Organization (2025), where high-fidelity, multi-decadal data are required to monitor global hydro-climatic shifts.
Differences in global means between the current and earlier PML versions are likely driven by the shift from GLDAS 2.1 to MSWEP/MSWX climate forcing (Kim et al., 2021; Xie et al., 2025), alongside updated parameterization, updated LAI data and smoothing algorithms. In version 2.0, the model predicted an aggressive increase in ET and GPP during 2003–2010 but followed by sharp declines. Our analysis reveals that these spurious trends may result from the high volatility in the solar radiation terms of the GLDAS forcing used in that version (Fig. 12). Comparatively, the new global mean GPP and WUE exhibit a continuing upward trend, a more physically plausible result in a greening world. Overall, while both versions have similar range of global patterns and total fluxes, the new version is recommended for users as it covers a longer period and offers higher quality as validated from eddy flux observations and water balance.
Our global ET estimate of 65.8 × 10³ km3 yr−1 during 1982–2025 is slightly lower than recent estimates by Zhang et al. (2026). In their updated assessment of global water cycle variables, they report a mean annual land ET of 69.0 ± 6.2×10³ km3 yr−1 for 1981–2014, excluding Greenland and Antarctica. Our estimate also excludes these regions, but additionally omits evaporation from surface inland water bodies, which is approximately 1.5 ± 0.15 × 10³ km3 yr−1 (Zhao et al., 2022a). When this water body evaporation is included, our adjusted global ET becomes very similar to or 2.5 % less than the mean value reported by Zhang et al. (2026) (Fig. 13). Our updated parameter sets differ from the PML-V2.0 version (Zhang et al., 2019) due to three key refinements: (i) an expanded calibration using 208 global flux sites from the original 95 sites for improved robustness; (ii) a new distinction between irrigated and rainfed croplands that reduced their internal ET biases by 8.7 %; and (iii) the removal of a parameter to enhance model parsimony without losing accuracy. Compared to 17 mainstream diagnostic products during basin-scale water balance validation (Figs. A10 and A11), the PML-V2.2 products consistently demonstrate top-tier performance, ranking as the best or second-best among all products evaluated. Specifically, PML-V2.2 achieves the highest NSE (0.89–0.91) and the lowest RMSE (77.0 to 96.3 mm yr−1).
Our global GPP estimate of 143.4 PgC yr−1 during 1982–2025 is in closer alignment with the evolving consensus in the carbon cycle community. Traditional optical remote sensing-driven products, specifically LUE-based upscaling (∼ 115 PgC yr−1), machine learning-based upscaling (∼ 124 PgC yr−1), and process models (∼ 131 PgC yr−1), tend to converge within a lower range. Our result is significantly higher but aligns more closely with contemporary estimates derived from novel proxies and ensemble assessments, such as the soil respiration constraints (∼ 149 ± 25 PgC yr−1), the 18O signature of atmospheric CO2 (150–175 PgC yr−1), and the latest carbonyl sulfide (OCS)-based results by Lai et al. (2024) (157 ± 8.5 PgC yr−1). This position is clearly illustrated in our multi-product intercomparison (Fig. 13c), where PML-V2.2c yields a higher magnitude than 11 of the 15 mainstream diagnostic GPP datasets. Although global GPP magnitude remains highly debated (Tian et al., 2026; Lai et al., 2026), this higher estimate reflects a physically constrained output rather than an unguided inflation. Notably, among the very few diagnostic products that simultaneously provide both water and carbon fluxes, PML-V2.2c is the only one that delivers internally consistent ET and GPP records continuously extending to the near-present of 2025 (Fig. 13).
The long-term trends of PML-V2.2c offer a nuanced view of the global water cycle, showing a more conservative ET growth of approximately 1.25 % during 1982–2025. In terms of linear trends, our estimate of 0.24 mm yr−2 during 1982–2011 is significantly more moderate compared to the ensemble mean of six diagnostic products (0.66 ± 0.38 mm yr−2) (Yang et al., 2023). Similarly, when benchmarked against a broader ensemble of 11 ET products (1982–2016) with a median trend of 0.28 mm yr−2 (Ma et al., 2021), our estimate of 0.18 mm yr−2 for the same period remains on the lower end of the spectrum. This global trajectory results from the offsetting dynamics of internal components. This multi-product divergence is evident in Fig. 13. While global ET anomalies exhibit highly scattered trajectories due to their heavy reliance on varying meteorological or radiation forcings, global GPP anomalies display a remarkably coherent upward trend across nearly all datasets, especially during the MODIS era. This high GPP consistency is fundamentally driven by unified satellite-derived greenness inputs (e.g., LAI or NDVI) that carry a robust global greening signal. From PML-V2.2c estimates, the marginal increase in transpiration is likely driven by the interplay between vegetation greening and physiological water saving from rising atmospheric CO2 (Zhang et al., 2021; Wei et al., 2024; Lesk et al., 2025; Wei et al., 2025). Simultaneously, interception evaporation shows a significant upward trend following LAI increases, while soil evaporation has slightly decreased due to the reduced available energy at the soil surface caused by canopy shading. The magnitude of global GPP remains consistent with other independent data sources (Yang et al., 2022; Lai et al., 2024; Wang et al., 2024), reflecting a strong increase in WUE due to vegetation greening (Fig. 12). While uncertainties remain, the internal consistency of the PML-V2 framework makes these results a valuable tool for multi-model assessments and climate attribution research, providing a stable benchmark for understanding how the terrestrial biosphere regulates water and carbon fluxes.
The original PML-V2.2a dataset at 8 d 500 m resolution is freely accessible via Google Earth Engine at https://developers.google.com/earth-engine/datasets/publisher/pml_evapotranspiration (last access: 15 July 2026). The aggregated 0.1° versions of PML-V2.2a (MODIS, 2000–2024; VIIRS, 2012–2025), along with the PML-V2.2b (1982–2020) and PML-V2.2c (1982–2025) datasets, are available at the National Tibetan Plateau Data Center (TPDC) under https://doi.org/10.11888/Terre.tpdc.303314 (Xu et al., 2026).
The active PML-V2.2a and V2.2c datasets will be updated annually with a six-month processing latency. Users are encouraged to select the dataset version that best balances spatiotemporal resolution and temporal length based on their needs. To support open science, the PML-V2.2 model code (R and C language), calibration data for 208 flux sites, and figure data for global patterns and trends are available at Zenodo under https://doi.org/10.5281/zenodo.18385275 (Xu, 2026).
The development of PML-V2.2 establishes an internally consistent, 44-year record (from 1982 to the near present of 2025) of the global terrestrial water and carbon cycles. The high statistical and spatial agreement between the MODIS/VIIRS-based (V2.2a) and AVHRR-based (V2.2b) products validates the multi-tier architecture, ensuring that the consolidated PML-V2.2c dataset provides a reliable multi-decadal benchmark for climate attribution. By leveraging an expanded calibration of 208 flux sites and distinguishing between irrigated and rainfed systems, the dataset achieves high fidelity, yielding global mean ET and GPP estimates of 65.8 × 10³ km3 yr−1 (with 58.2 % from transpiration) and 143.4 PgC yr−1, respectively. The successful top-down water-balance validation (NSE = 0.89–0.91) across 152 large basins during 2003–2020 and 56 basins during 1982–2016 further confirms that this framework provides a physically plausible representation of global eco-hydrological states.
Beyond data production, this long-term record offers critical insights into the intensifying global water-carbon cycle. Specifically, global GPP has significantly increased at a rate of 0.343 PgC yr−2 during 1982–2025 (p<0.01), while global ET exhibits a significant but more constrained rise of 0.019 × 10³ km3 yr−2 (p<0.05). These diverging trends highlight a major eco-hydrological tradeoff, where the increased transpiration driven by vegetation greening is largely offset by the physiological water-saving effect from rising atmospheric CO2.
With the successful integration of VIIRS securing data continuity beyond the aging MODIS, the consolidation strategies employed in PML-V2.2 provide a robust template for mitigating sensor degradation. Building on this stable multidecadal foundation, future refinements will focus on integrating dynamic vegetation traits and improved water stress mechanisms, while leveraging next-generation remote sensing data to deliver these physiological updates at higher spatial resolutions. As an evolving, near-present, and high-accuracy record, PML-V2.2 is positioned to support critical international assessments, such as the WMO State of Global Water Resources reports, providing the foundational data continuity required for climate adaptation, trend attribution, and global water management.
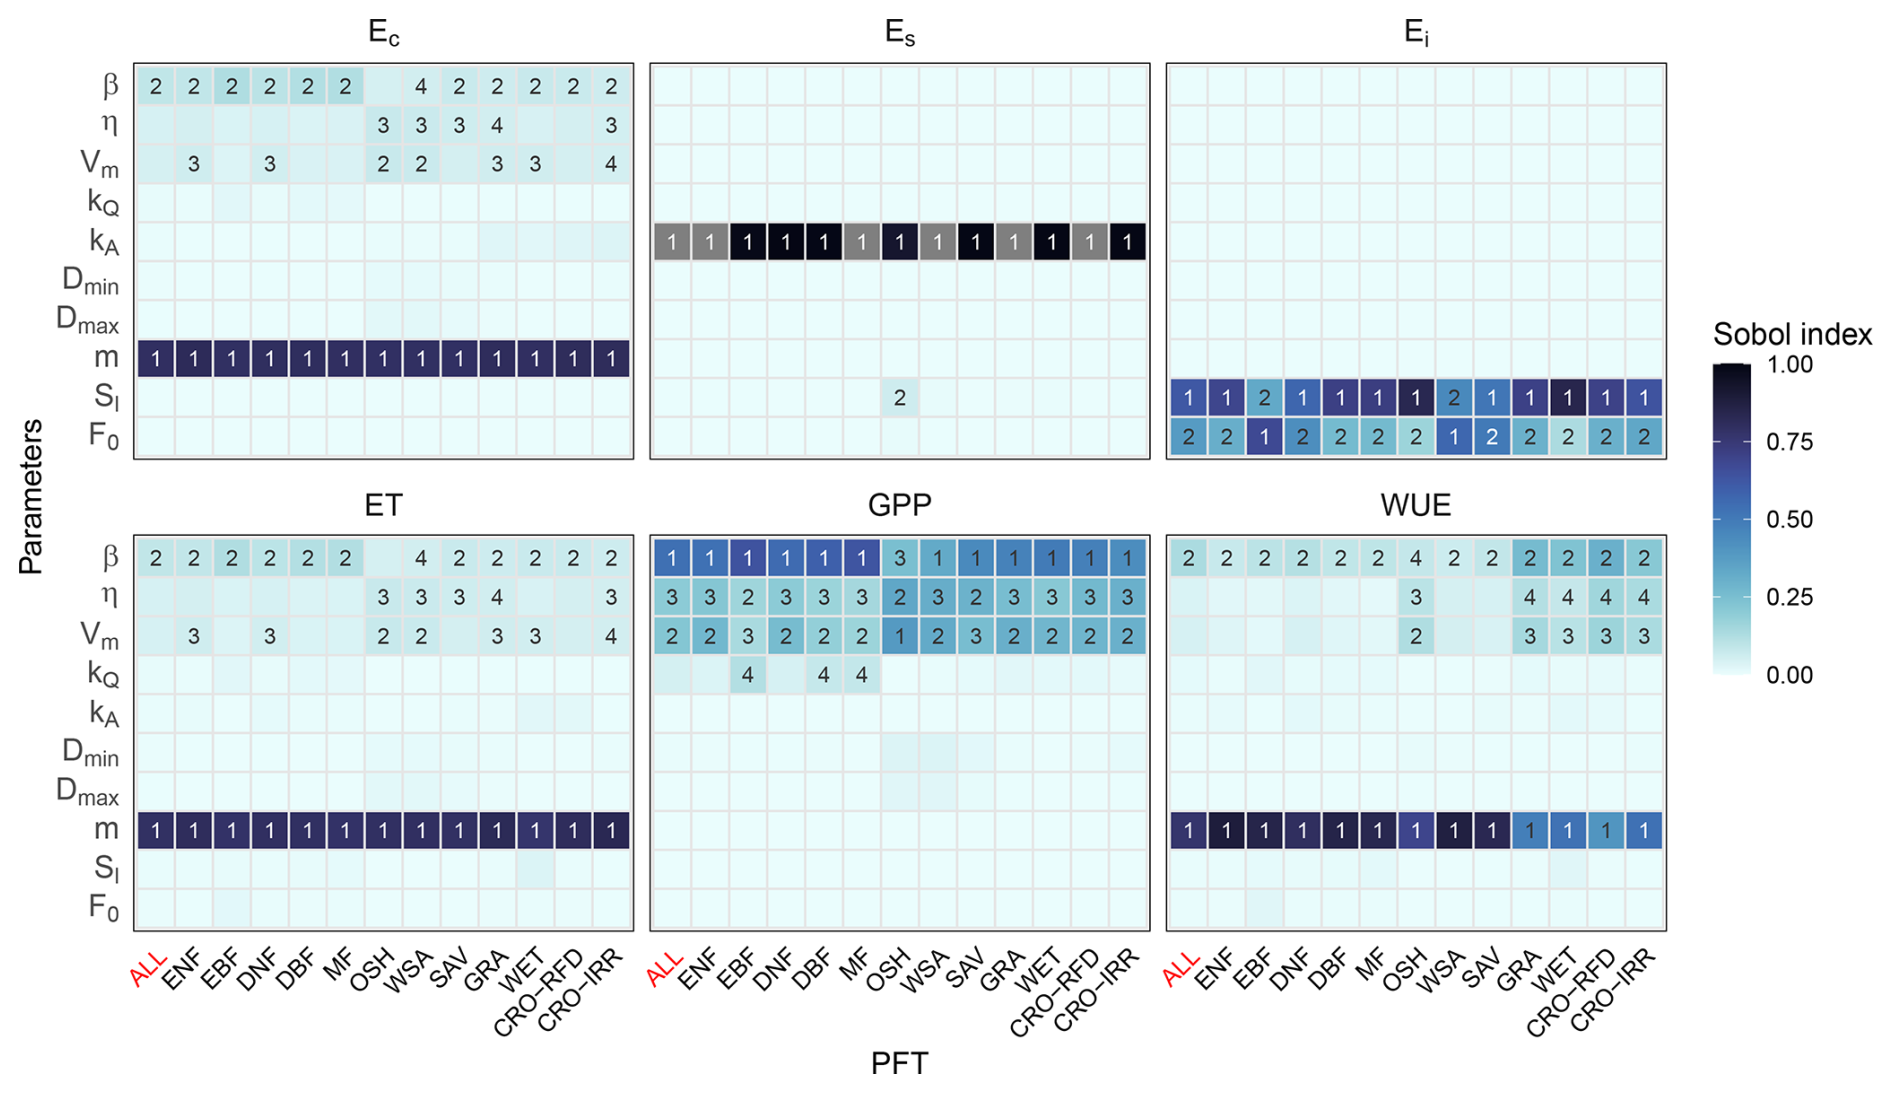
Figure A1Global sensitivity analysis of PML-V2 model parameters across different Plant Functional Types (PFTs) and all sites combined (ALL) using the Sobol index. For each specific PFT and the ALL category, 5000 parameter sets were generated using Latin Hypercube Sampling (LHS). To maintain visual clarity and emphasize the dominant drivers, numerical ranks (where 1 represents the most sensitive parameter) are displayed only for parameters with a Sobol index greater than 0.05. Meaning of all parameters can be found in Table 2.
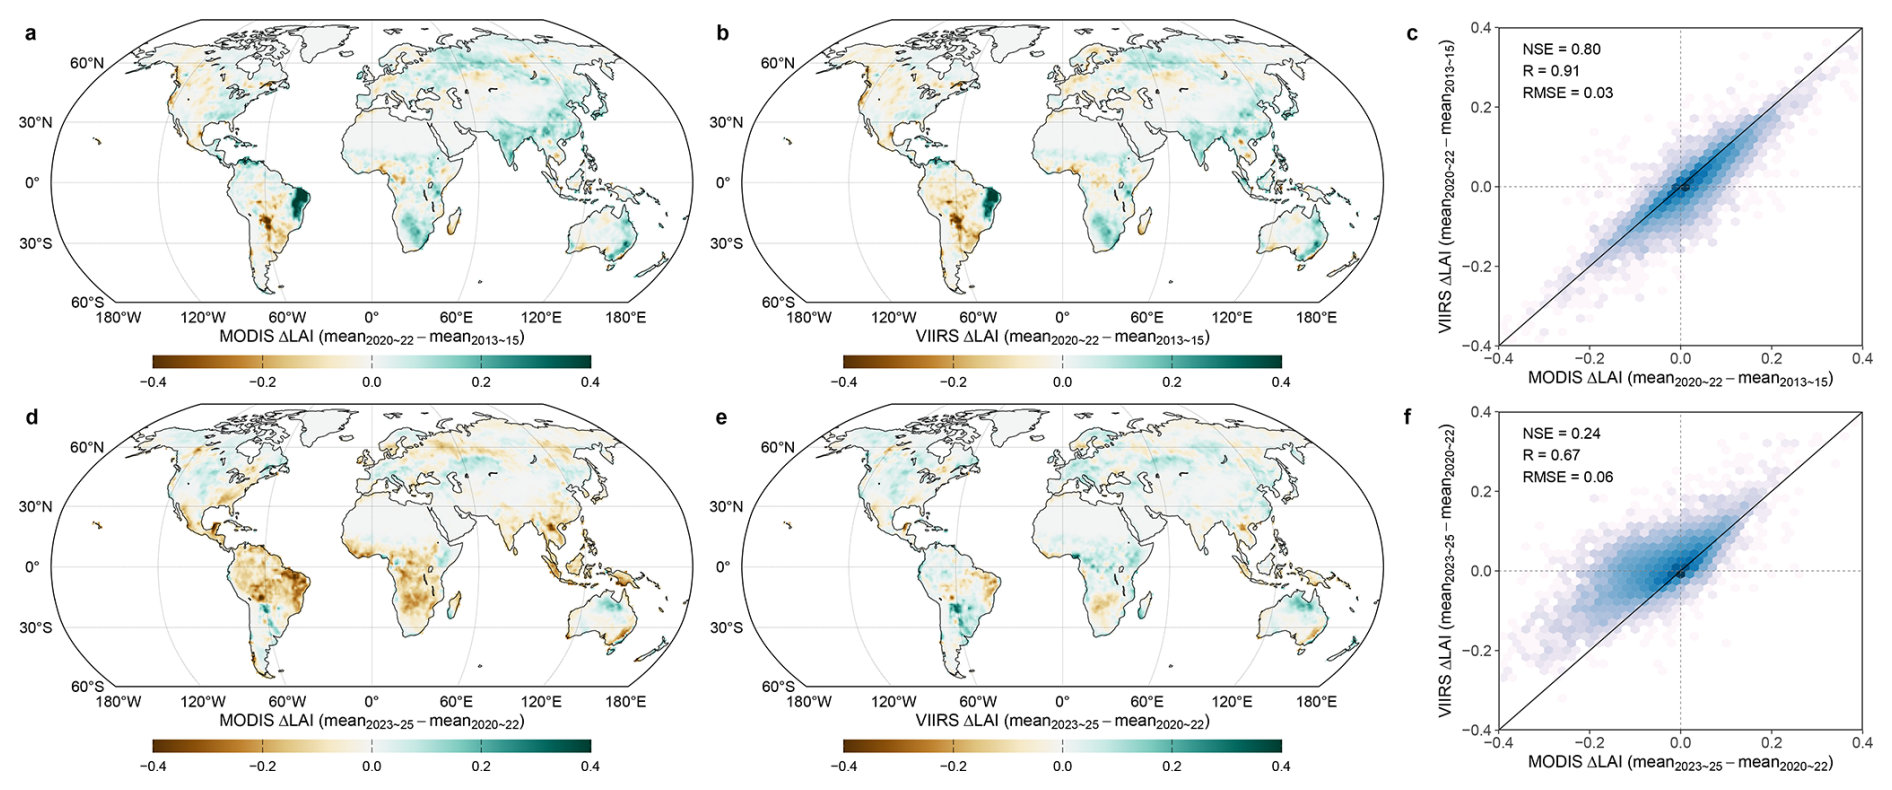
Figure A2Divergence between MODIS and VIIRS LAI records highlighting post-2022 MODIS sensor degradation. Changes are computed between means of 2020–2022 and 2013–2015, as large uncertainties exist in trend estimates over short periods.

Figure A3Consistency between MODIS and VIIRS albedo records even after post-2022 MODIS sensor degradation.
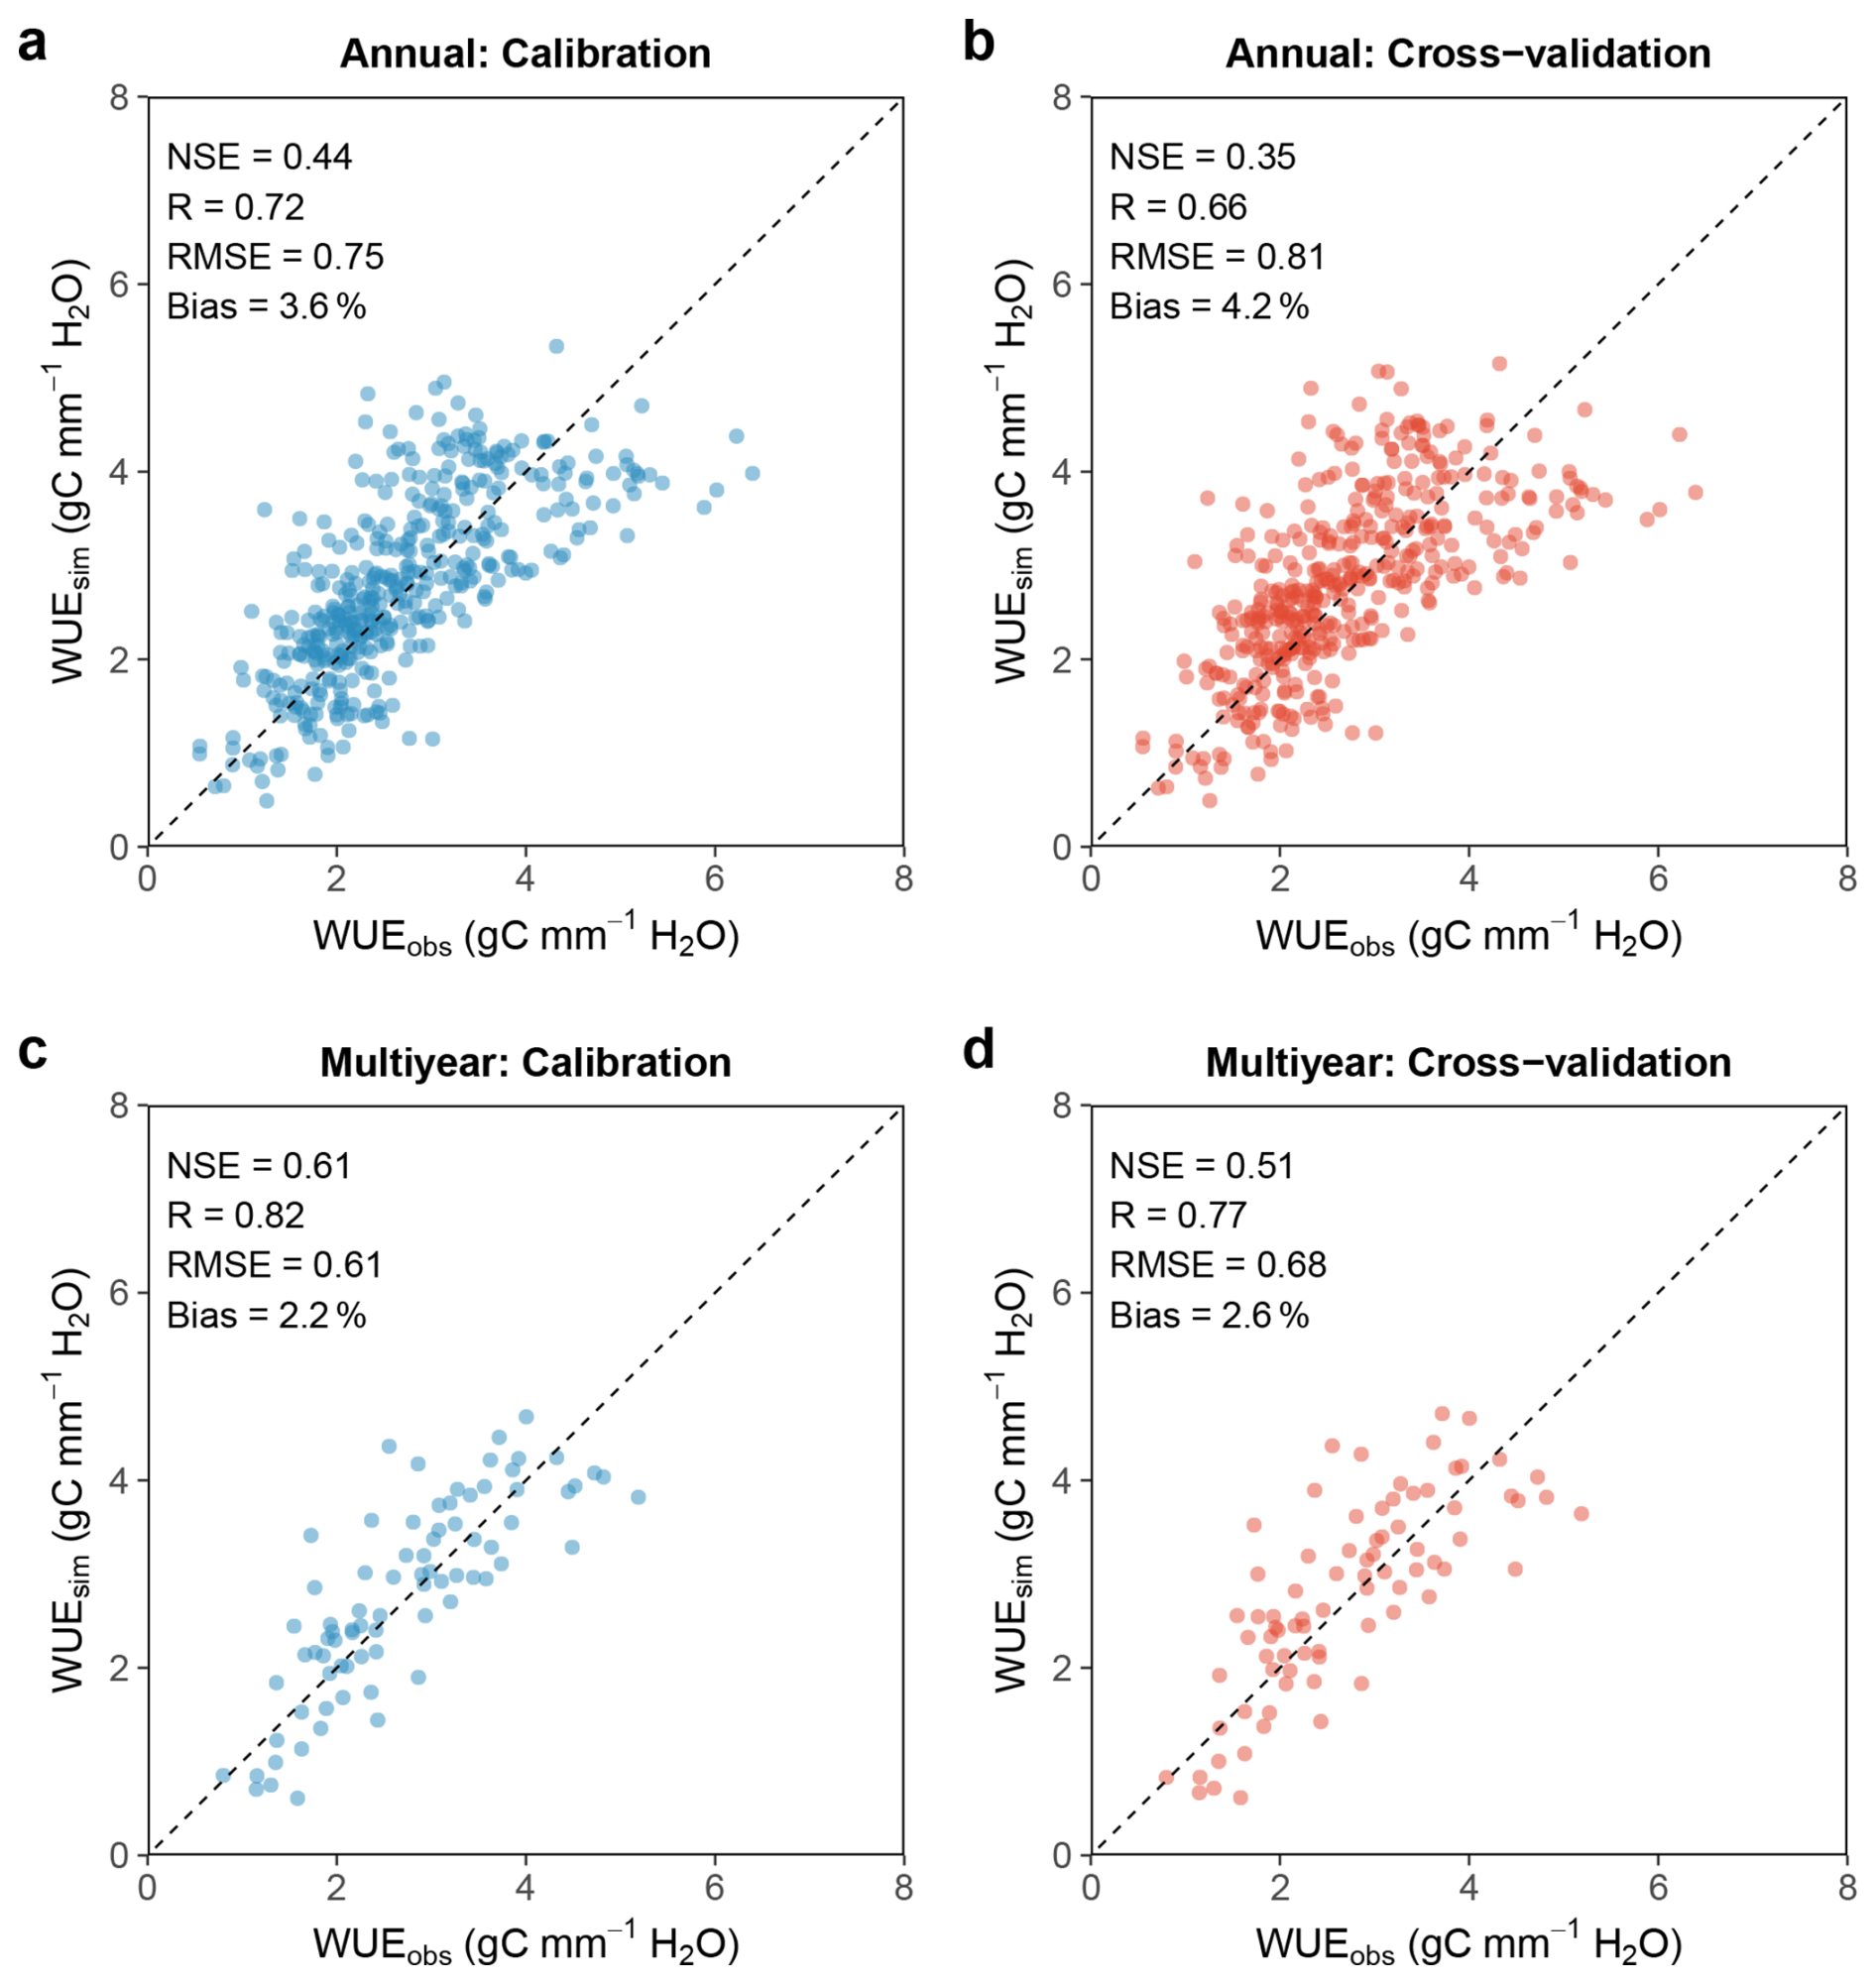
Figure A4Calibration and cross-validation of WUE at annual scale. Annual WUE is derived from ET and GPP averages with >80 % 8 d availability, while multi-year WUE necessitates at least five years of valid data.
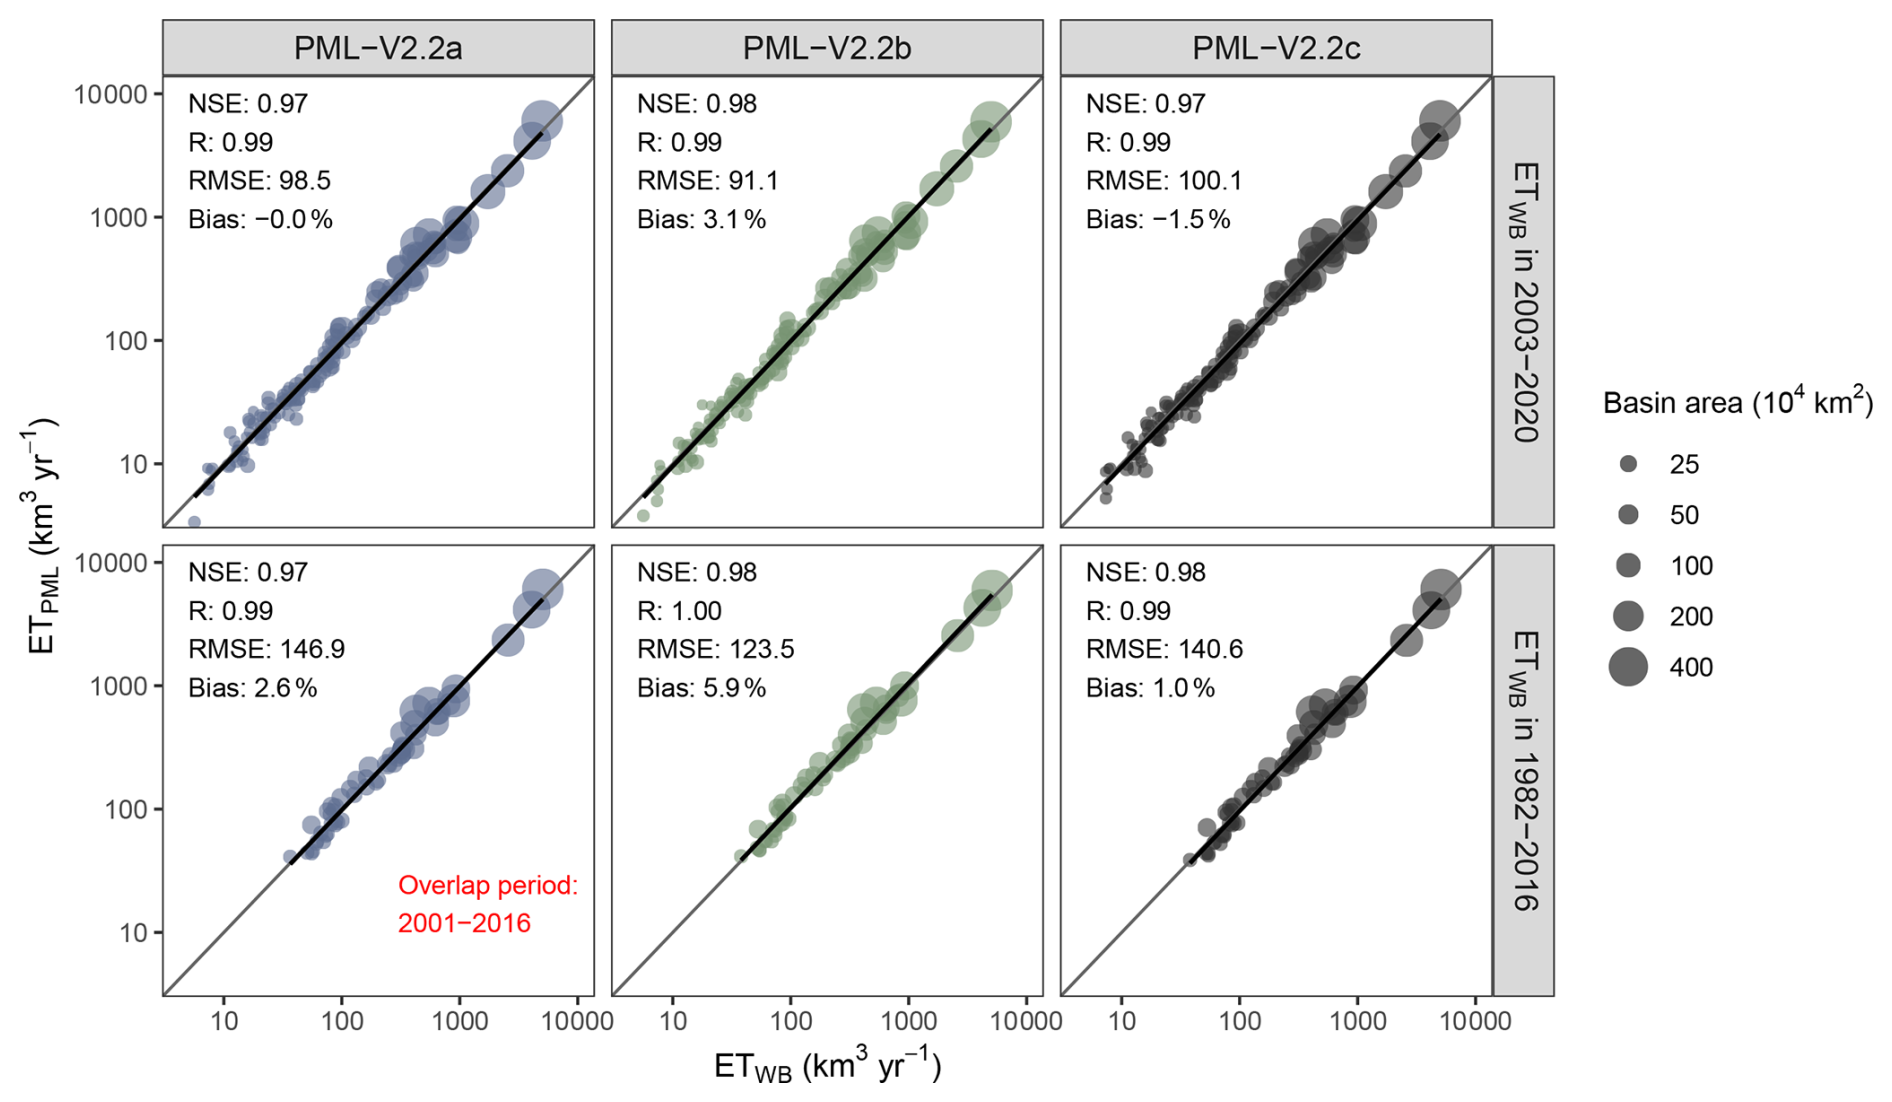
Figure A5Comparison of simulated ET with water-balance-derived ET averaged for two basin datasets over different historical periods (1982–2016 and 2003–2020). Note that compared with Fig. 7, ET considers basin area coverage and is expressed as km3 yr−1.
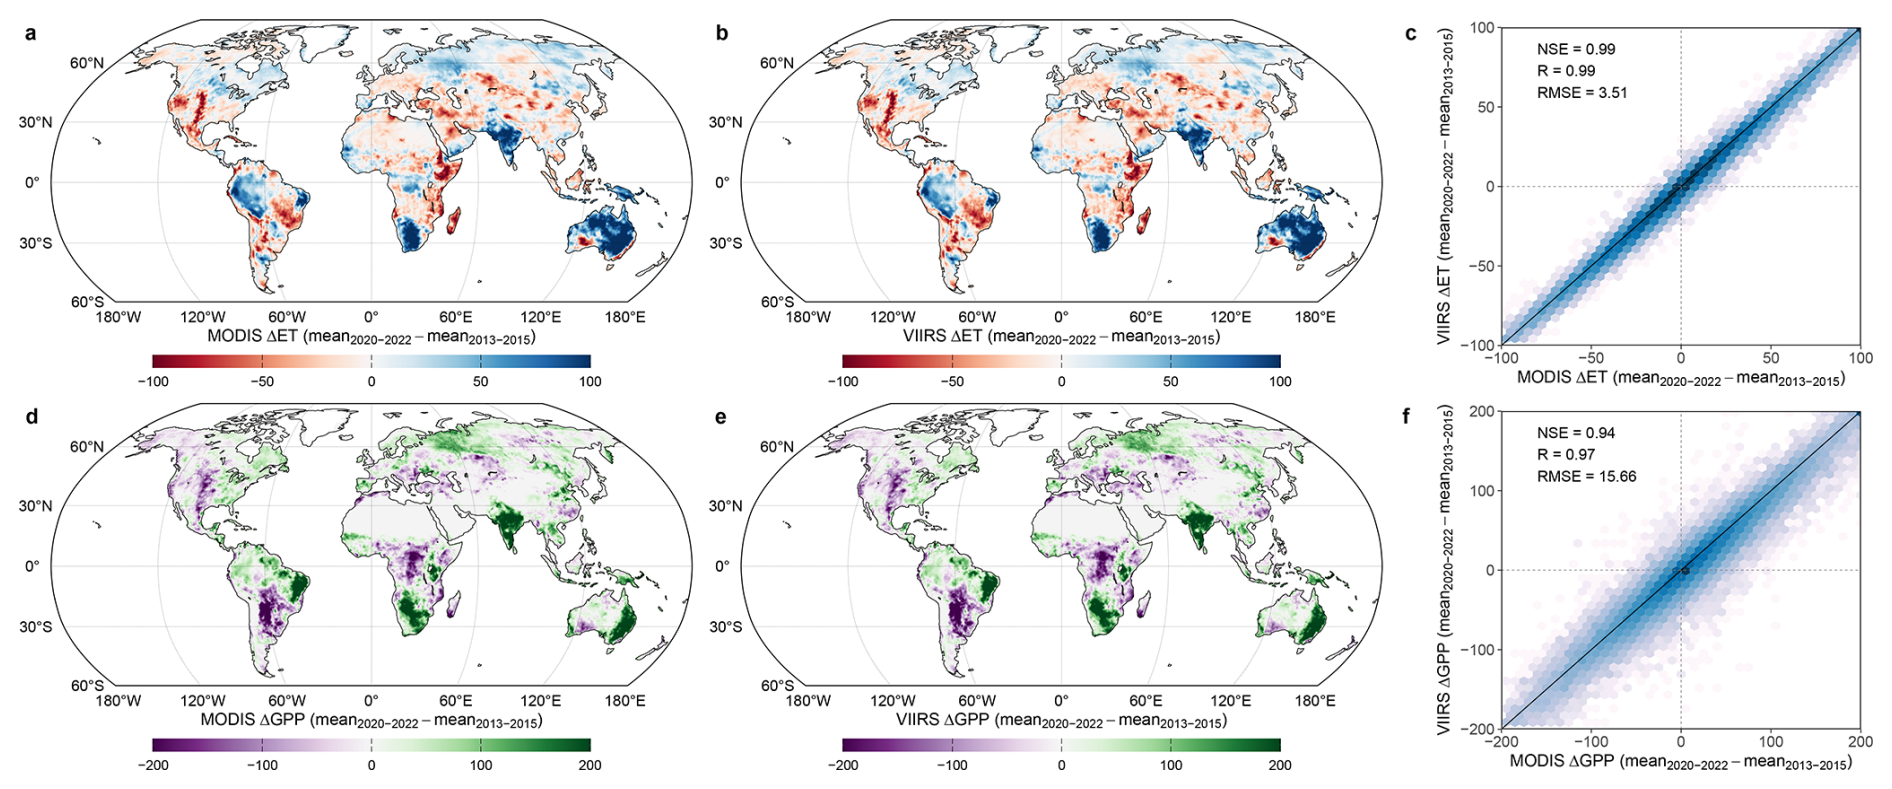
Figure A6Spatial consistency of ET and GPP changes between MODIS and VIIRS-based PML-V2.2a datasets. Changes are computed between means of 2020–2022 and 2013–2015, as large uncertainties exist in trend estimates over short periods.
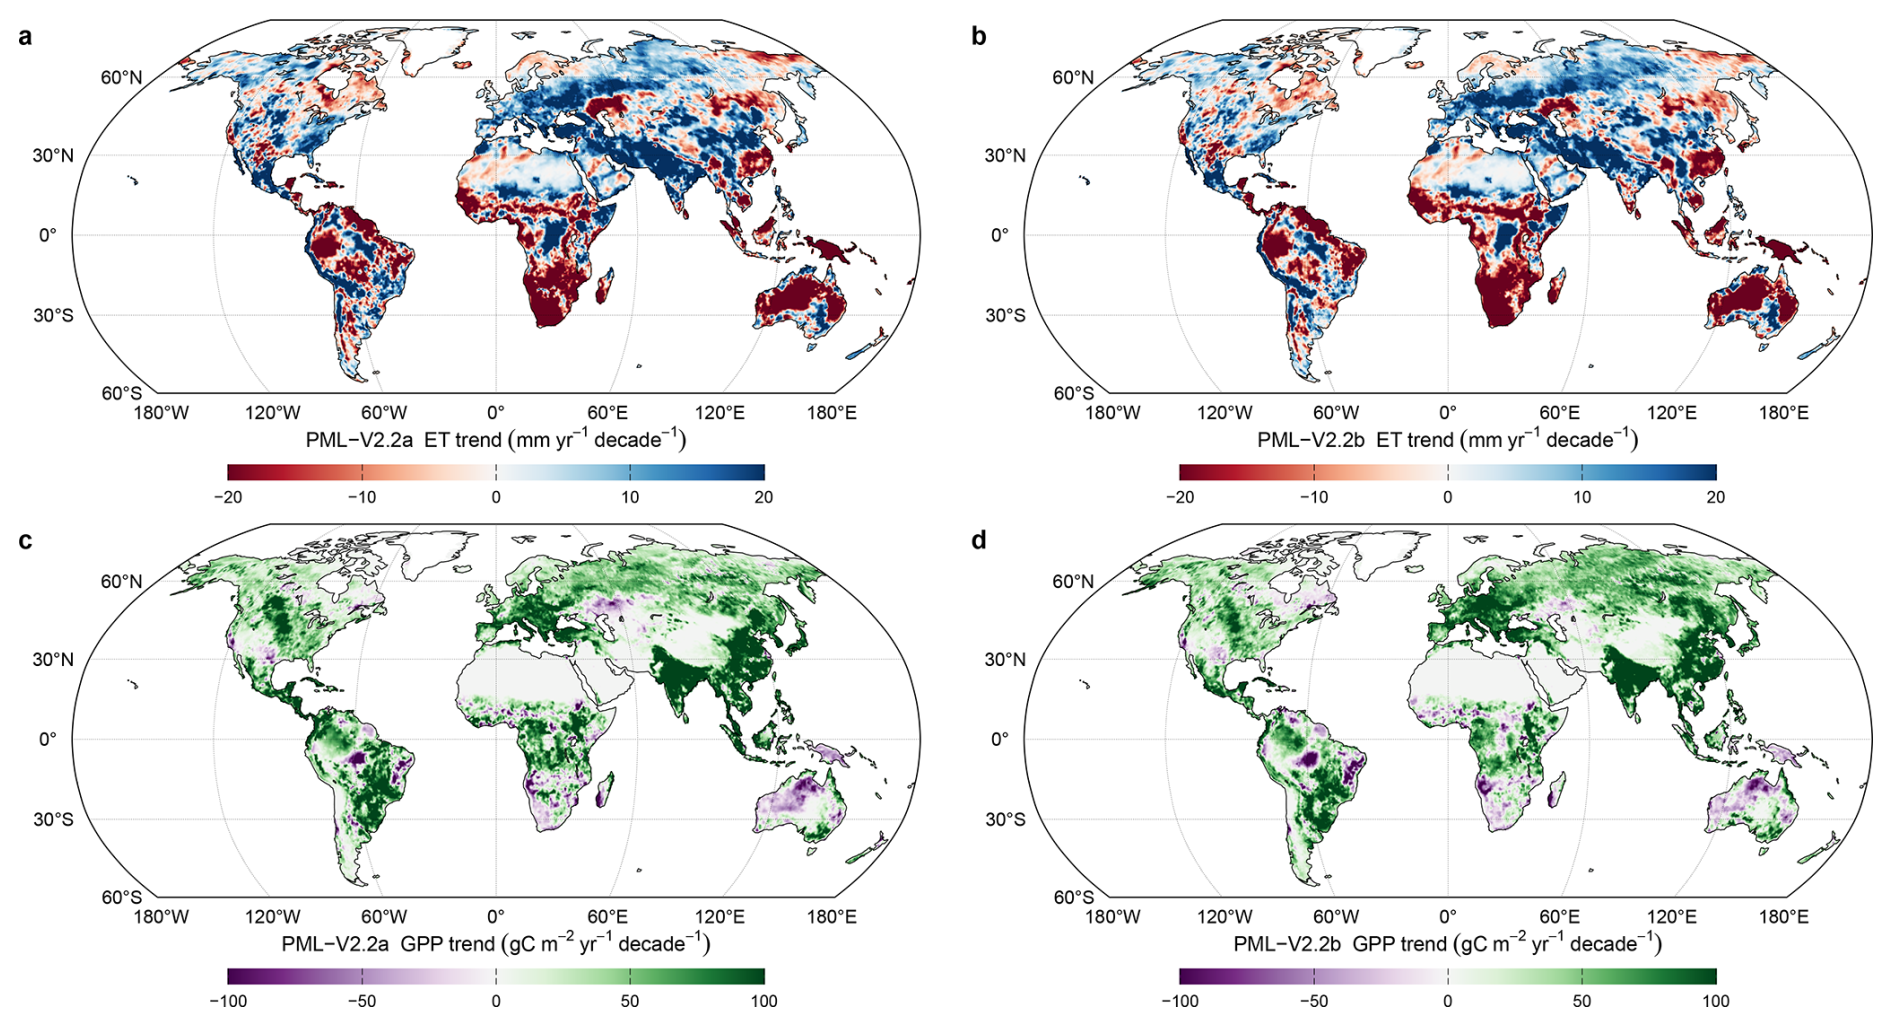
Figure A7Spatial consistency of ET and GPP trends between the baseline MODIS-based PML-V2.2a and the consolidated AVHRR-based PML-V2.2b during the overlapping period (2001–2020). Panels (a) and (b) show the spatial distribution of ET trends from V2.2a and V2.2b, respectively. Panels (c) and (d) show the comparison for GPP trends. The highly similar spatial patterns verify that PML-V2.2b successfully captures the climate-driven trends observed in the MODIS-based PML-V2.2a. Scatter plots of trends at grid scale are provided in Fig. 8.
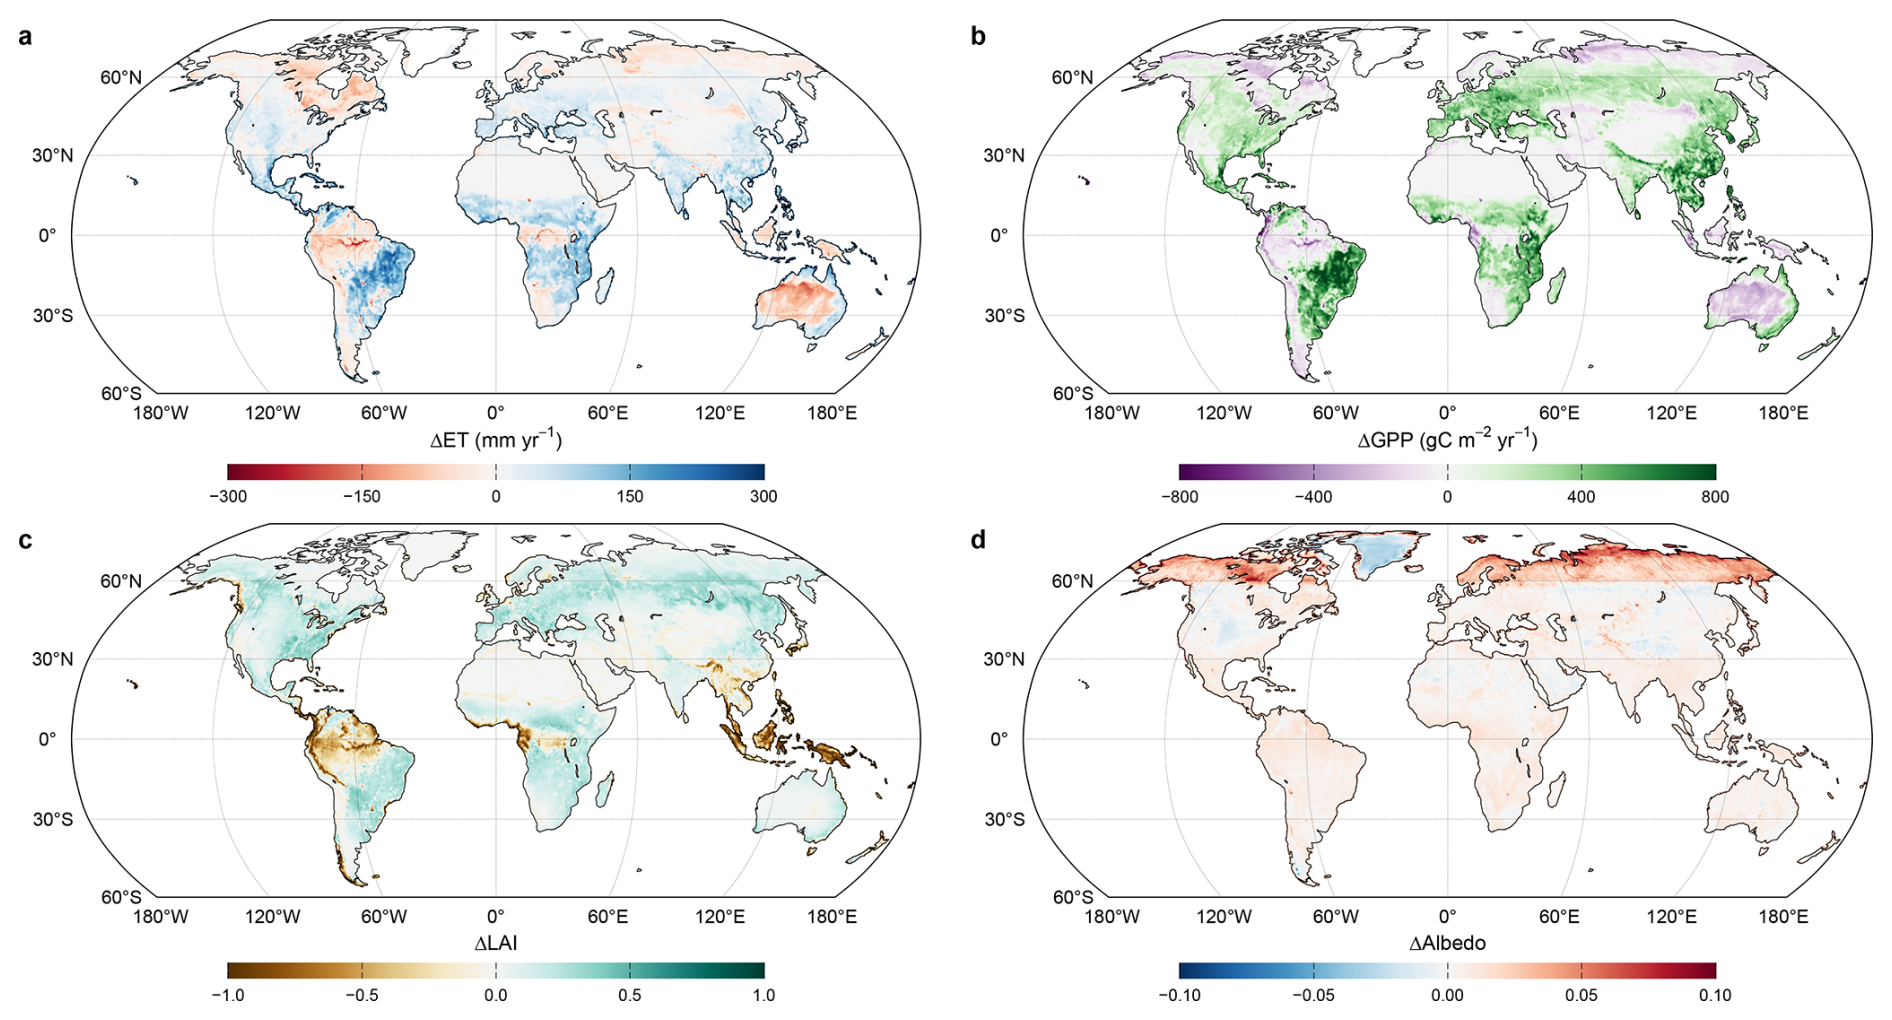
Figure A8Differences between the PML-V2.2a and V2.2b products are mainly attributed to the discrepancies in LAI between MODIS and AVHRR (GIMMS LAI4g, though consolidated with MODIS). Across most non-tropical rainforest regions, the GIMMS LAI4g dataset exhibits higher LAI values, consequently leading to higher ET and GPP estimates. Despite these differences in mean magnitudes, their long-term trends remain highly consistent (see Fig. A7).
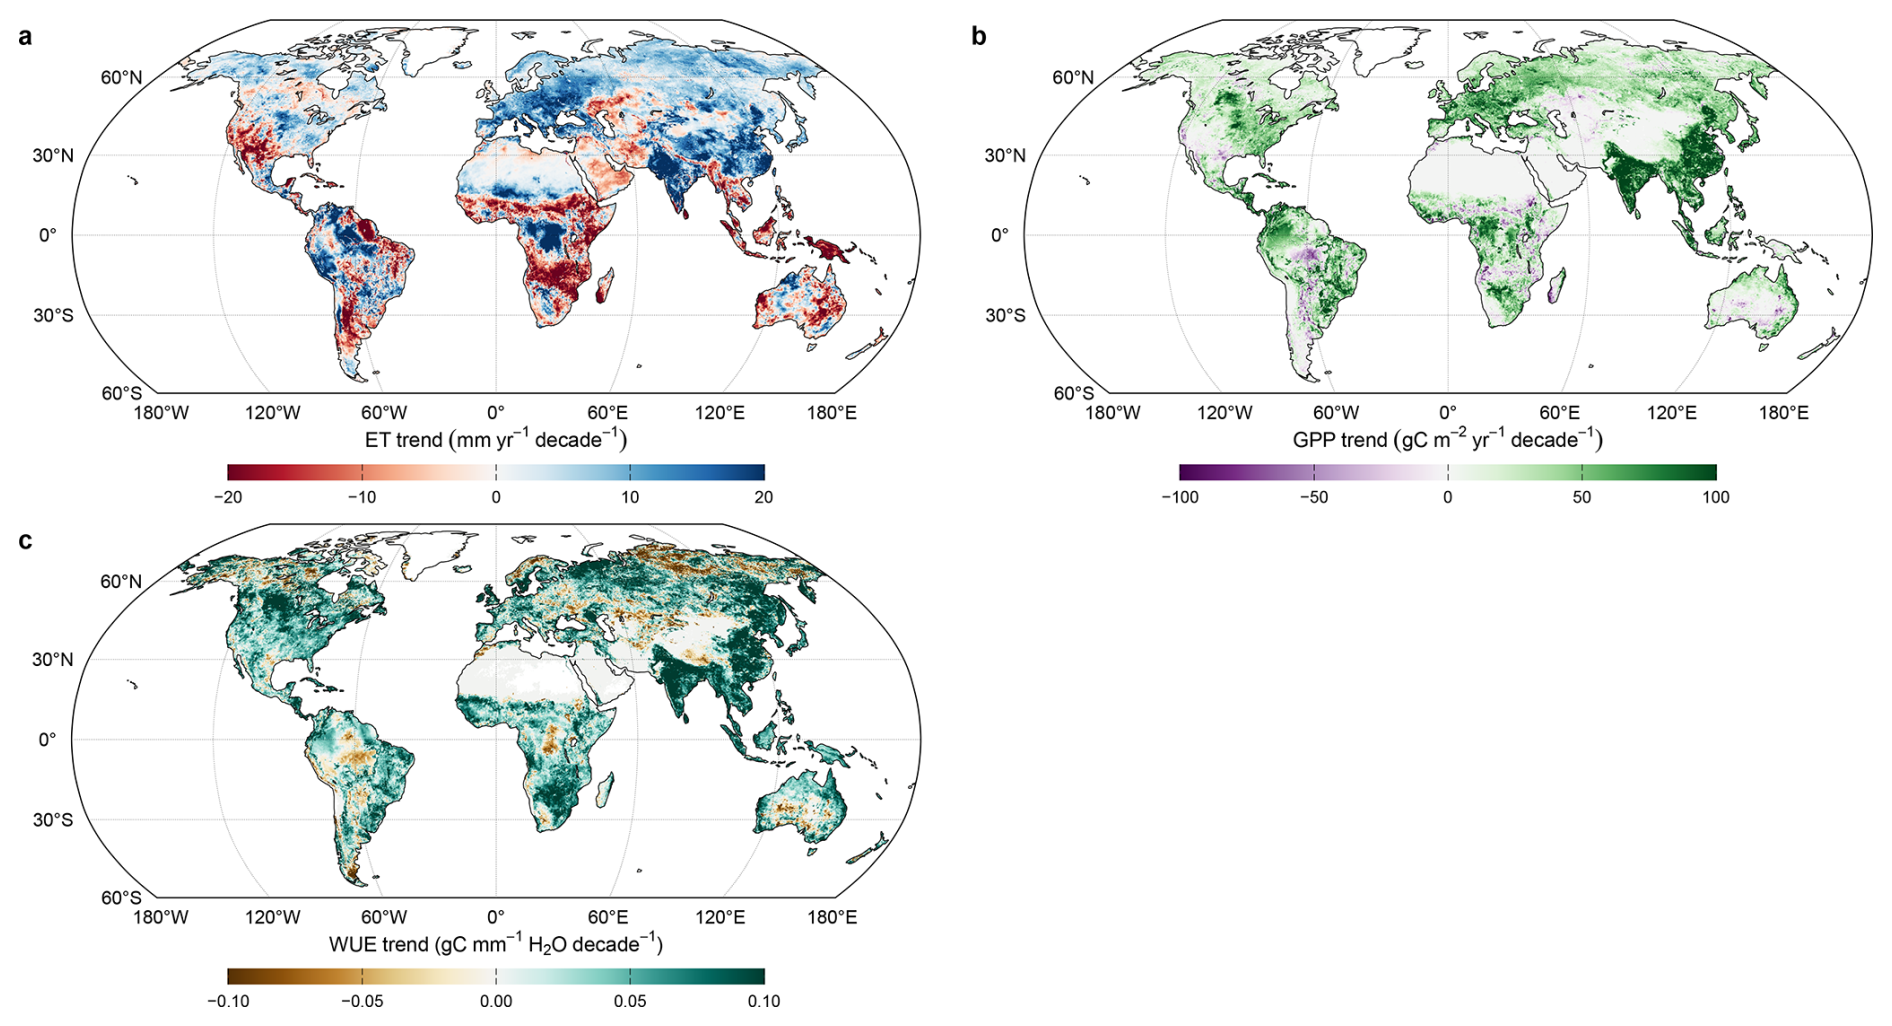
Figure A9Global trends in ET, GPP, and WUE during 1982–2025 from the consolidated PML-V2.2c dataset.
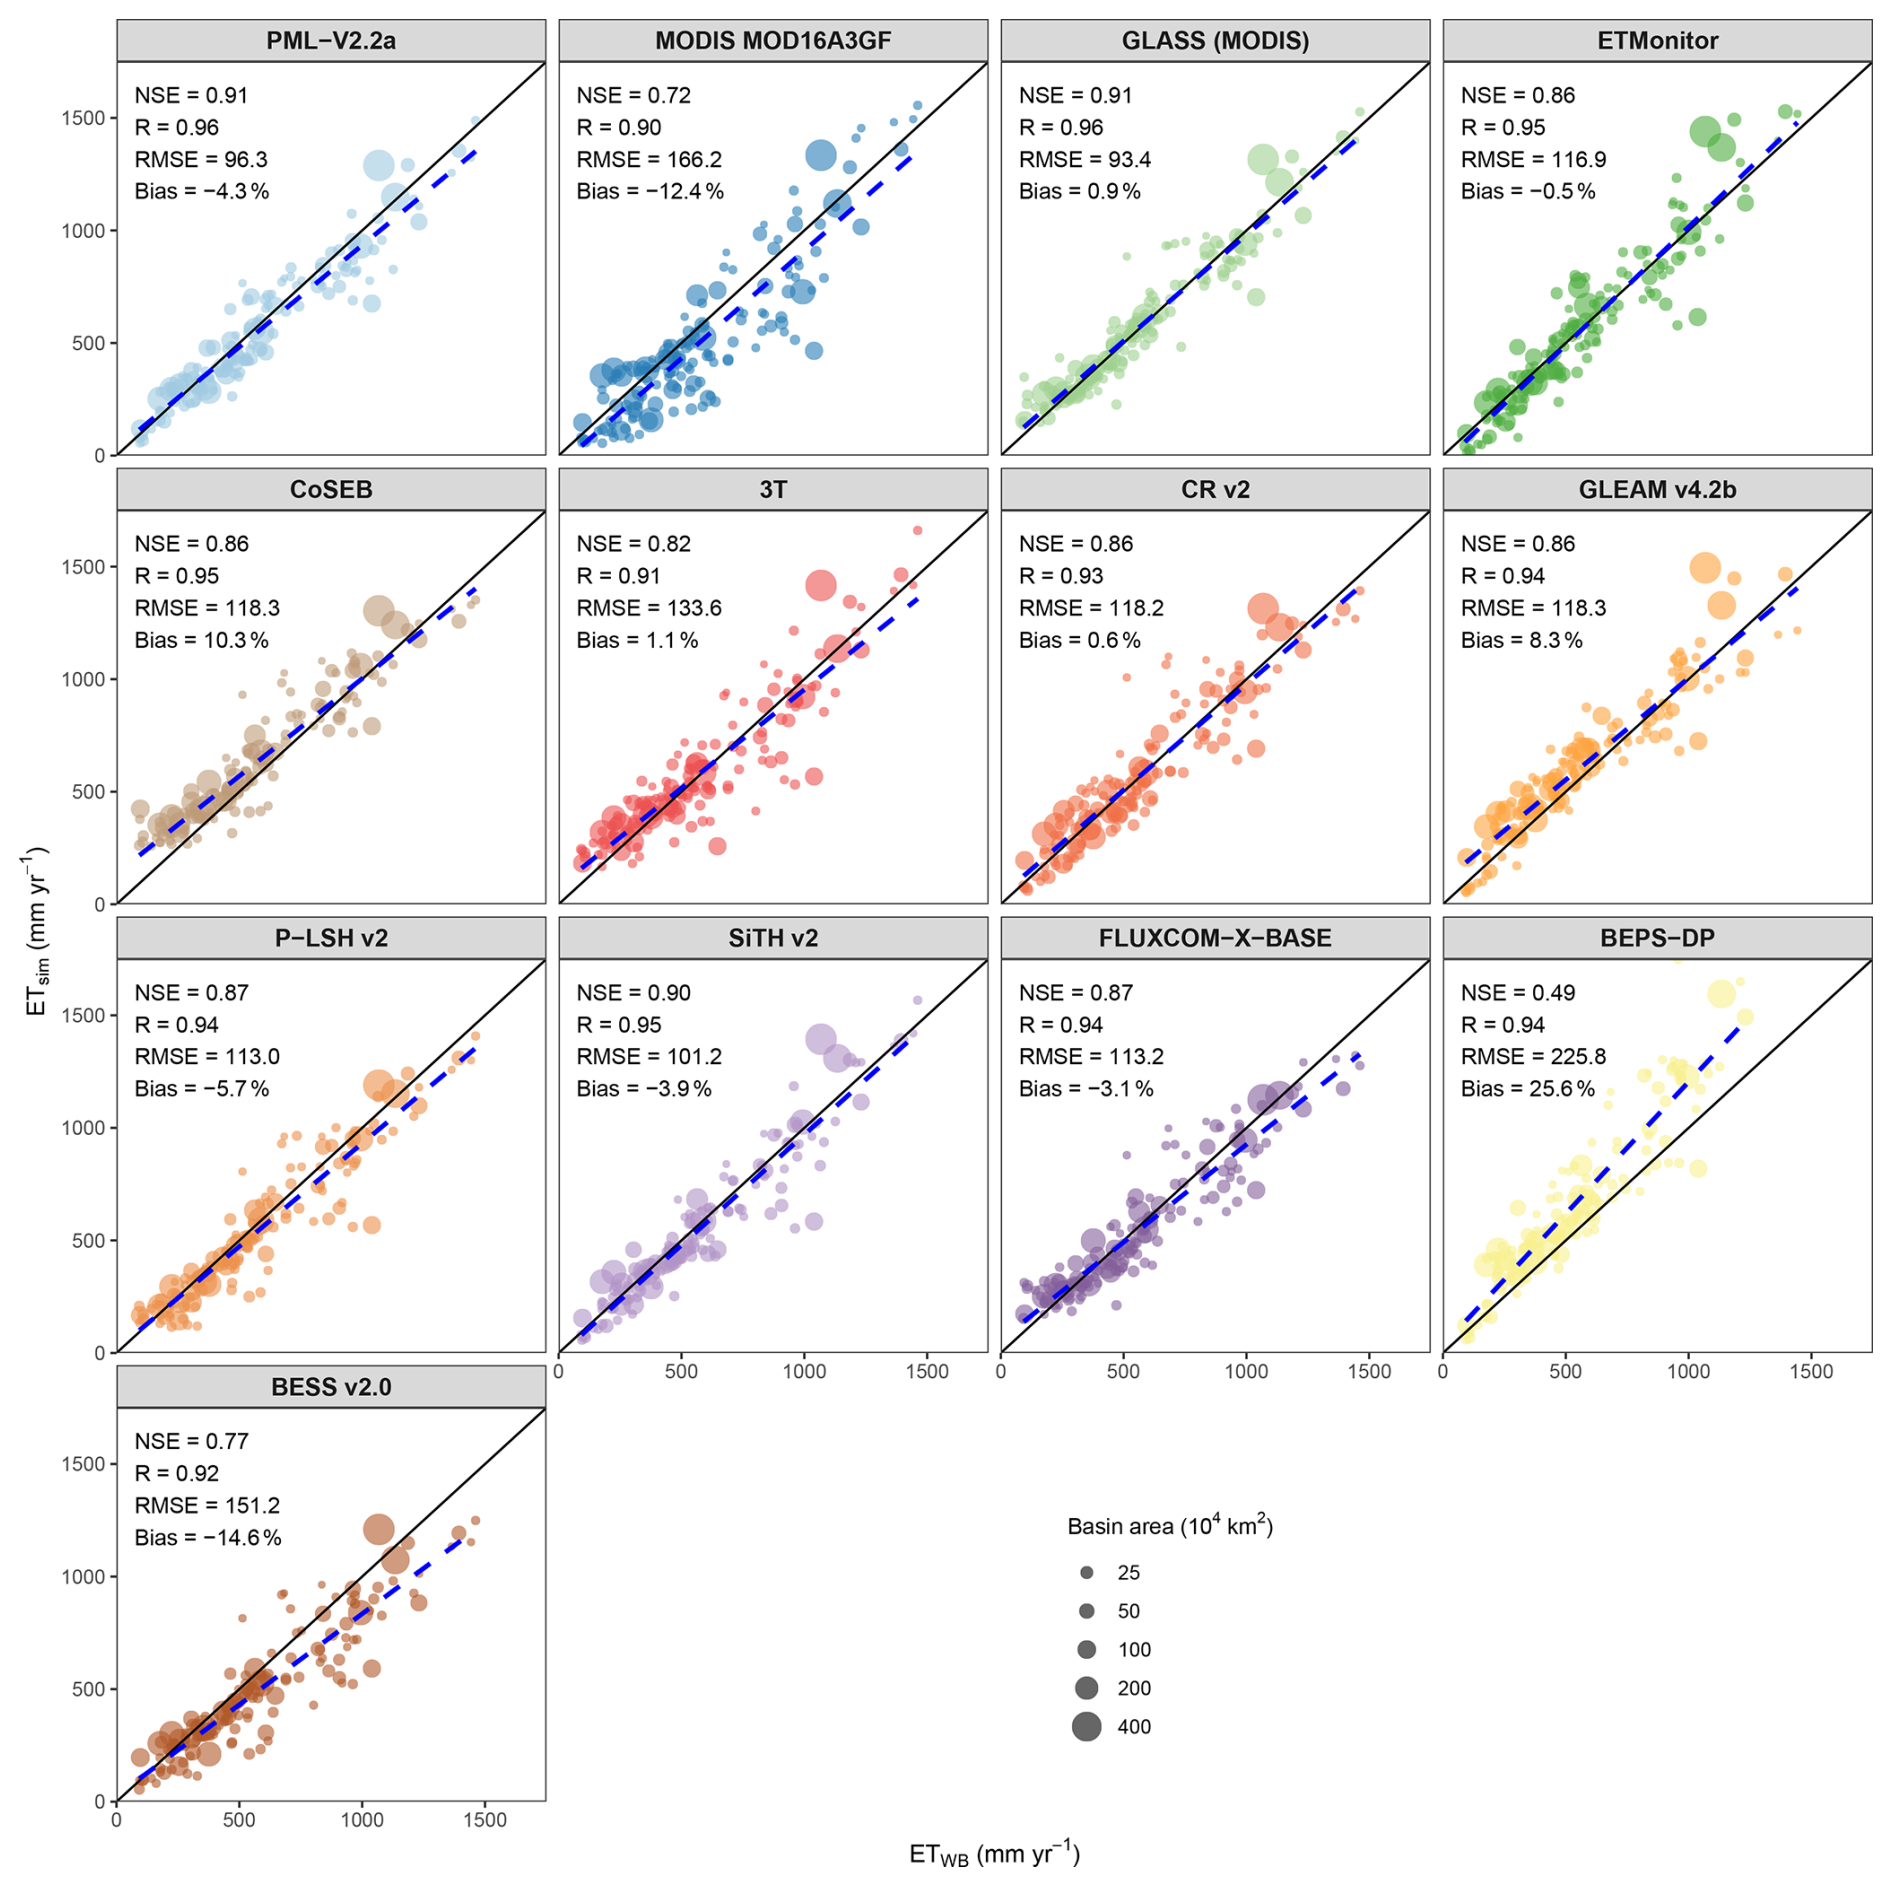
Figure A10Comparison of simulated ET with water-balance-derived ET averaged for 152 large basins over 2003–2020. To ensure a fair comparison, minor spatial gaps over barren land and water bodies in some products were gap-filled using PML data.
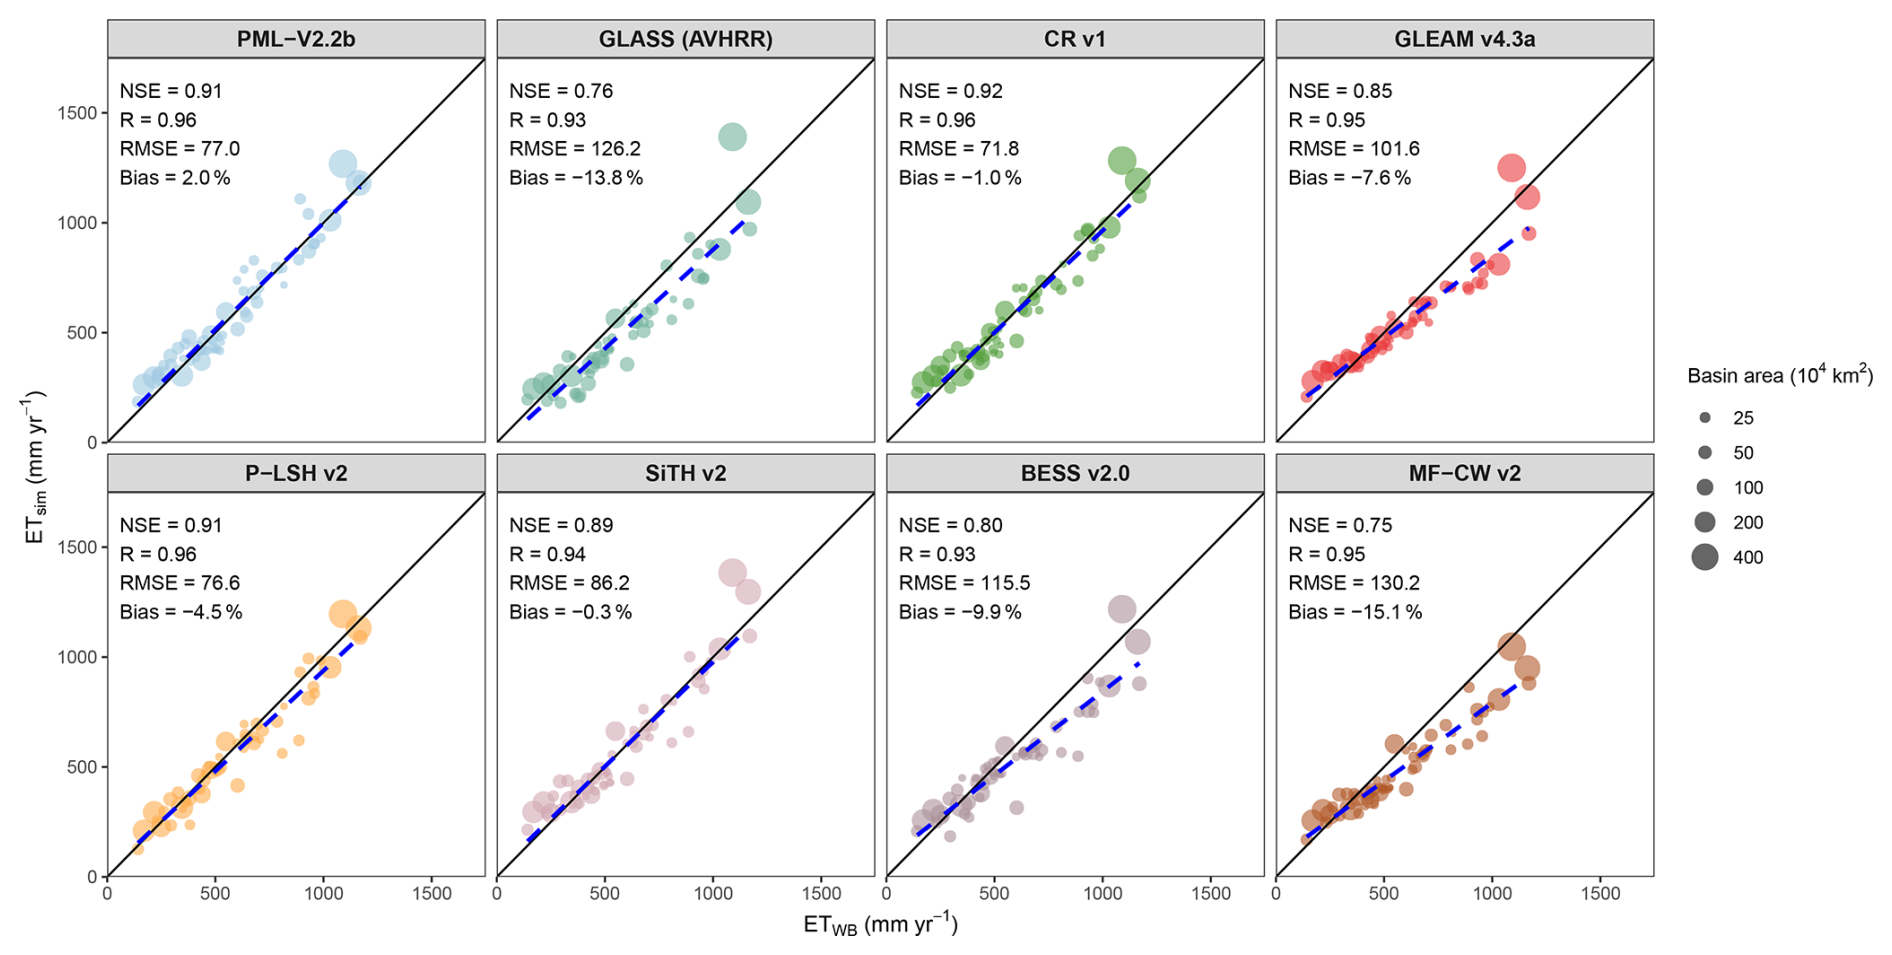
Figure A11Comparison of simulated ET with water-balance-derived ET averaged for 56 large basins over 1982–2016. To ensure a fair comparison, minor spatial gaps over barren land and water bodies in some products were gap-filled using PML data.
Y.Z. conceived this study. Z.X. led material preparation, model simulation, and data analysis. Z.X. and Y.Z. wrote the first version of the paper. D.K. provided ongoing data and programming support for model simulations. N.M. compiled long-term streamflow data and contributed to the water balance analysis. X.Z. provided expert guidance based on previous AVHRR data versions. All authors contributed to the discussion, interpretation of the results, and writing of the paper.
The contact author has declared that none of the authors has any competing interests.
Publisher's note: Copernicus Publications remains neutral with regard to jurisdictional claims made in the text, published maps, institutional affiliations, or any other geographical representation in this paper. The authors bear the ultimate responsibility for providing appropriate place names. Views expressed in the text are those of the authors and do not necessarily reflect the views of the publisher.
We gratefully acknowledge the individuals involved in infrastructure maintenance, field collection, and data processing. We specifically thank the following data providers: FLUXNET2015, AmeriFlux, OzFlux, JapanFlux, and ChinaFlux for eddy flux observations; the MSWEP and MSWX teams for climate forcing datasets; the CRU, GPCC, GPCP, and MSWEP teams for precipitation datasets; the JPL, CSR, and GSFC GRACE/FO teams and the GRACE-REC team for TWSA datasets; the GRDC, USGS, BOM, and MWR for streamflow datasets; and the respective space agencies and science teams (e.g., NASA, NOAA, ESA) for providing the MODIS, VIIRS, AVHRR, and ESA CCI satellite datasets. We also acknowledge the Google Earth Engine platform for providing the cloud computing infrastructure essential for large-scale data processing and interactive visualization, and the TPDC for providing essential data storage support. In particular, we thank Simon Ilyushchenko from Google for his valuable assistance with the data catalog update process. Furthermore, we are grateful to Congcong Li, Xian Wang, Shaoyang He, Xiaojie Li, Yuxuan Xie, Wenjie Hou, Jiangmeng Li, Yifei Sun, and Lingxiao Huang for their assistance with data preparation, collection, model simulations and evaluations.
Y.Z. acknowledges financial support from the National Natural Science Foundation of China (Grant No. 42330506 and 42361144709) and the Talent Program of the Ministry of Science and Technology of China. Z.X. acknowledges financial support from the Postdoctoral Fellowship Program (Grant No. GZC20250236) and General Program (Grant No. 2025M770359) of the China Postdoctoral Science Foundation.
This paper was edited by Di Tian and reviewed by Oscar Manuel Baez Villanueva and one anonymous referee.
Beaudoing, H. and Rodell, M.: GLDAS Noah Land Surface Model L4 3 hourly 0.25 × 0.25 degree V2.1. Goddard Earth Sciences Data and Information Services Center (GES DISC), Greenbelt, Maryland, USA, https://doi.org/10.5067/E7TYRXPJKWOQ, 2020.
Beck, H. E., Wood, E. F., Pan, M., Fisher, C. K., Miralles, D. G., Dijk, A. I. J. M. van, McVicar, T. R., and Adler, R. F.: MSWEP V2 global 3-hourly 0.1° precipitation: methodology and quantitative assessment, B. Am. Meteorol. Soc., 100, 473–500, https://doi.org/10.1175/BAMS-D-17-0138.1, 2019.
Beck, H. E., Dijk, A. I. J. M. van, Larraondo, P. R., McVicar, T. R., Pan, M., Dutra, E., and Miralles, D. G.: MSWX: Global 3-Hourly 0.1° Bias-Corrected Meteorological Data Including Near-Real-Time Updates and Forecast Ensembles, B. Am. Meteorol. Soc., 103, E710–E732, https://doi.org/10.1175/BAMS-D-21-0145.1, 2022.
Beringer, J., Hutley, L. B., McHugh, I., Arndt, S. K., Campbell, D., Cleugh, H. A., Cleverly, J., Resco de Dios, V., Eamus, D., Evans, B., Ewenz, C., Grace, P., Griebel, A., Haverd, V., Hinko-Najera, N., Huete, A., Isaac, P., Kanniah, K., Leuning, R., Liddell, M. J., Macfarlane, C., Meyer, W., Moore, C., Pendall, E., Phillips, A., Phillips, R. L., Prober, S. M., Restrepo-Coupe, N., Rutledge, S., Schroder, I., Silberstein, R., Southall, P., Yee, M. S., Tapper, N. J., van Gorsel, E., Vote, C., Walker, J., and Wardlaw, T.: An introduction to the Australian and New Zealand flux tower network – OzFlux, Biogeosciences, 13, 5895–5916, https://doi.org/10.5194/bg-13-5895-2016, 2016.
Beringer, J., Moore, C. E., Cleverly, J., Campbell, D. I., Cleugh, H., De Kauwe, M. G., Kirschbaum, M. U. F., Griebel, A., Grover, S., Huete, A., Hutley, L. B., Laubach, J., Van Niel, T., Arndt, S. K., Bennett, A. C., Cernusak, L. A., Eamus, D., Ewenz, C. M., Goodrich, J. P., Jiang, M., Hinko-Najera, N., Isaac, P., Hobeichi, S., Knauer, J., Koerber, G. R., Liddell, M., Ma, X., Macfarlane, C., McHugh, I. D., Medlyn, B. E., Meyer, W. S., Norton, A. J., Owens, J., Pitman, A., Pendall, E., Prober, S. M., Ray, R. L., Restrepo-Coupe, N., Rifai, S. W., Rowlings, D., Schipper, L., Silberstein, R. P., Teckentrup, L., Thompson, S. E., Ukkola, A. M., Wall, A., Wang, Y. P., Wardlaw, T. J., and Woodgate, W.: Bridge to the future: Important lessons from 20 years of ecosystem observations made by the OzFlux network, Glob. Change Biol., 28, 3489–3514, https://doi.org/10.1111/gcb.16141, 2022.
Cao, S., Li, M., Zhu, Z., Wang, Z., Zha, J., Zhao, W., Duanmu, Z., Chen, J., Zheng, Y., Chen, Y., Myneni, R. B., and Piao, S.: Spatiotemporally consistent global dataset of the GIMMS leaf area index (GIMMS LAI4g) from 1982 to 2020, Earth Syst. Sci. Data, 15, 4877–4899, https://doi.org/10.5194/essd-15-4877-2023, 2023.
Chen, J. M., Ju, W., Ciais, P., Viovy, N., Liu, R., Liu, Y., and Lu, X.: Vegetation structural change since 1981 significantly enhanced the terrestrial carbon sink, Nat. Commun., 10, 4259, https://doi.org/10.1038/s41467-019-12257-8, 2019.
Cheng, J., Liang, S., Verhoef, W., Shi, L., and Liu, Q.: Estimating the hemispherical broadband longwave emissivity of global vegetated surfaces using a radiative transfer model, IEEE T. Geosci. Remote Sens., 54, 905–917, https://doi.org/10.1109/TGRS.2015.2469535, 2016.
Chu, H., Christianson, D. S., Cheah, Y.-W., Pastorello, G., O'Brien, F., Geden, J., Ngo, S.-T., Hollowgrass, R., Leibowitz, K., Beekwilder, N. F., Sandesh, M., Dengel, S., Chan, S. W., Santos, A., Delwiche, K., Yi, K., Buechner, C., Baldocchi, D., Papale, D., Keenan, T. F., Biraud, S. C., Agarwal, D. A., and Torn, M. S.: AmeriFlux BASE data pipeline to support network growth and data sharing, Sci. Data, 10, 614, https://doi.org/10.1038/s41597-023-02531-2, 2023.
Cui, J., Lian, X., Huntingford, C., Gimeno, L., Wang, T., Ding, J., He, M., Xu, H., Chen, A., Gentine, P., and Piao, S.: Global water availability boosted by vegetation-driven changes in atmospheric moisture transport, Nat. Geosci., https://doi.org/10.1038/s41561-022-01061-7, 2022.
Endsley, K. A., Zhao, M., Kimball, J. S., Albrethsen, T., and Devadiga, S.: Improved global estimates of terrestrial evapotranspiration using the MODIS and VIIRS sensors, J. Hydrometeorol., 26, 817–833, https://doi.org/10.1175/JHM-D-24-0145.1, 2025.
Feng, J. and Zhang, K.: P-LSHv2: a multi-decadal global daily land surface actual evapotranspiration dataset enhanced with explicit soil moisture constraints in remote sensing retrieval, National Tibetan Plateau/Third Pole Environment Data Center [data set], https://doi.org/10.11888/Terre.tpdc.301969, 2025.
Feng, J., Zhang, K., Chao, L., Zhan, H., and Li, Y.: P-LSHv2: a multi-decadal global daily evapotranspiration dataset enhanced with explicit soil moisture constraints, Earth Syst. Sci. Data, 17, 5039–5064, https://doi.org/10.5194/essd-17-5039-2025, 2025.
Friedl, M. and Sulla-Menashe, D.: MODIS/Terra+Aqua Land Cover Type Yearly L3 Global 500m SIN Grid V061, NASA Land Processes Distributed Active Archive Center [data set], https://doi.org/10.5067/MODIS/MCD12Q1.061, 2022.
Gan, R., Zhang, Y., Shi, H., Yang, Y., Eamus, D., Cheng, L., Chiew, F. H. S., and Yu, Q.: Use of satellite leaf area index estimating evapotranspiration and gross assimilation for Australian ecosystems, Ecohydrology, 11, e1974, https://doi.org/10.1002/eco.1974, 2018.
Gorelick, N., Hancher, M., Dixon, M., Ilyushchenko, S., Thau, D., and Moore, R.: Google Earth Engine: Planetary-scale geospatial analysis for everyone, Remote Sens. Environ., 202, 18–27, https://doi.org/10.1016/j.rse.2017.06.031, 2017.
Harper, K. L., Lamarche, C., Hartley, A., Peylin, P., Ottlé, C., Bastrikov, V., San Martín, R., Bohnenstengel, S. I., Kirches, G., Boettcher, M., Shevchuk, R., Brockmann, C., and Defourny, P.: A 29-year time series of annual 300 m resolution plant-functional-type maps for climate models, Earth Syst. Sci. Data, 15, 1465–1499, https://doi.org/10.5194/essd-15-1465-2023, 2023.
Harris, I., Osborn, T. J., Jones, P., and Lister, D.: Version 4 of the CRU TS monthly high-resolution gridded multivariate climate dataset, Sci. Data, 7, 109, https://doi.org/10.1038/s41597-020-0453-3, 2020.
He, S., Zhang, Y., Ma, N., Tian, J., Kong, D., and Liu, C.: A daily and 500 m coupled evapotranspiration and gross primary production product across China during 2000–2020, Earth Syst. Sci. Data, 14, 5463–5488, https://doi.org/10.5194/essd-14-5463-2022, 2022.
Heiskanen, J., Brümmer, C., Buchmann, N., Calfapietra, C., Chen, H., Gielen, B., Gkritzalis, T., Hammer, S., Hartman, S., Herbst, M., Janssens, I. A., Jordan, A., Juurola, E., Karstens, U., Kasurinen, V., Kruijt, B., Lankreijer, H., Levin, I., Linderson, M.-L., Loustau, D., Merbold, L., Myhre, C. L., Papale, D., Pavelka, M., Pilegaard, K., Ramonet, M., Rebmann, C., Rinne, J., Rivier, L., Saltikoff, E., Sanders, R., Steinbacher, M., Steinhoff, T., Watson, A., Vermeulen, A. T., Vesala, T., Vítková, G., and Kutsch, W.: The integrated carbon observation system in Europe, B. Am. Meteorol. Soc., https://doi.org/10.1175/BAMS-D-19-0364.1, 2022.
Hoek van Dijke, A. J., Herold, M., Mallick, K., Benedict, I., Machwitz, M., Schlerf, M., Pranindita, A., Theeuwen, J. J. E., Bastin, J.-F., and Teuling, A. J.: Shifts in regional water availability due to global tree restoration, Nat. Geosci., 15, 363–368, https://doi.org/10.1038/s41561-022-00935-0, 2022.
Huffman, G. J.: GPCP precipitation level 3 monthly 0.5-degree V3.3, NASA Goddard Earth Sciences Data and Information Services Center [data set], https://doi.org/10.5067/MEASURES/GPCP/DATA306, 2024.
Hulley, G. and Hook, S.: VIIRS/NPP land surface temperature/emissivity daily L3 global 1 km SIN grid day V002, NASA earthdata, NASA Goddard Earth Sciences Data and Information Services Center [data set], 2025.
Humphrey, V. and Gudmundsson, L.: GRACE-REC: a reconstruction of climate-driven water storage changes over the last century, Earth Syst. Sci. Data, 11, 1153–1170, https://doi.org/10.5194/essd-11-1153-2019, 2019.
ICOS RI, Aalto, J., Aalto, P., et al.: Ecosystem final quality (L2) product in ETC-archive format – release 2025-1, ICOS ERIC – Carbon Portal [data set], https://doi.org/10.18160/S6HM-CP8Q, 5 May 2025.
Isaac, P., Cleverly, J., McHugh, I., van Gorsel, E., Ewenz, C., and Beringer, J.: OzFlux data: network integration from collection to curation, Biogeosciences, 14, 2903–2928, https://doi.org/10.5194/bg-14-2903-2017, 2017.
Joiner, J. and Yoshida, Y.: Satellite-based reflectances capture large fraction of variability in global gross primary production (GPP) at weekly time scales, Agr. Forest Meteorol., 291, 108092, https://doi.org/10.1016/j.agrformet.2020.108092, 2020.
Ju, W. and Zhou, Y.: The dataset of simulated daily gross primary productivity over the globe during 1981–2019, NSTI [data set], https://doi.org/10.12199/nesdc.ecodb.2016YFA0600200.02.001, 2021.
Kim, S., Anabalón, A., and Sharma, A.: An assessment of concurrency in evapotranspiration trends across multiple global datasets, J. Hydrometeorol., https://doi.org/10.1175/JHM-D-20-0059.1, 2021.
Kong, D., Zhang, Y., Gu, X., and Wang, D.: A robust method for reconstructing global MODIS EVI time series on the Google Earth Engine, ISPRS J. Photogramm., 155, 13–24, https://doi.org/10.1016/j.isprsjprs.2019.06.014, 2019.
Lai, J., Kooijmans, L. M. J., Sun, W., Lombardozzi, D., Campbell, J. E., Gu, L., Luo, Y., Kuai, L., and Sun, Y.: Terrestrial photosynthesis inferred from plant carbonyl sulfide uptake, Nature, 634, 855–861, https://doi.org/10.1038/s41586-024-08050-3, 2024.
Lai, J., Kooijmans, L. M. J., Sun, W., Lombardozzi, D., Campbell, J. E., Gu, L., Luo, Y., Kuai, L., and Sun, Y.: Reply to: the size of tropical vegetation gross primary production, Nature, 654, E5–E7, https://doi.org/10.1038/s41586-026-10561-0, 2026.
Lasslop, G., Reichstein, M., Papale, D., Richardson, A. D., Arneth, A., Barr, A., Stoy, P., and Wohlfahrt, G.: Separation of net ecosystem exchange into assimilation and respiration using a light response curve approach: critical issues and global evaluation, Glob. Change Biol., 16, 187–208, https://doi.org/10.1111/j.1365-2486.2009.02041.x, 2010.
Leng, J., Chen, J. M., Li, W., Luo, X., Xu, M., Liu, J., Wang, R., Rogers, C., Li, B., and Yan, Y.: Global Datasets of Hourly Carbon and Water Fluxes Simulated Using a Satellite-based Process Model with Dynamic Parameterizations, V1, Science Data Bank [data set], https://doi.org/10.57760/sciencedb.ecodb.00163, 2023.
Leng, J., Chen, J. M., Li, W., Luo, X., Xu, M., Liu, J., Wang, R., Rogers, C., Li, B., and Yan, Y.: Global datasets of hourly carbon and water fluxes simulated using a satellite-based process model with dynamic parameterizations, Earth Syst. Sci. Data, 16, 1283–1300, https://doi.org/10.5194/essd-16-1283-2024, 2024.
Lesk, C. S., Winter, J. M., and Mankin, J. S.: Projected runoff declines from plant physiological effects on precipitation, Nat. Water, 3, 167–177, https://doi.org/10.1038/s44221-024-00361-z, 2025.
Leuning, R., Zhang, Y. Q., Rajaud, A., Cleugh, H., and Tu, K.: A simple surface conductance model to estimate regional evaporation using MODIS leaf area index and the Penman-Monteith equation, Water Resour. Res., 44, https://doi.org/10.1029/2007wr006562, 2008.
Li, B., Ryu, Y., Jiang, C., Dechant, B., Liu, J., Yan, Y., and Li, X.: BESSv2.0: a satellite-based and coupled-process model for quantifying long-term global land–atmosphere fluxes, Remote Sens. Environ., 295, 113696, https://doi.org/10.1016/j.rse.2023.113696, 2023a.
Li, F., Xiao, J., Chen, J., Ballantyne, A., Jin, K., Li, B., Abraha, M., and John, R.: Global water use efficiency saturation due to increased vapor pressure deficit, Science, 381, 672–677, https://doi.org/10.1126/science.adf5041, 2023b.
Li, F., Xiao, J., Chen, J., Ballantyne, A., Peñuelas, J., Green, J. K., Tian, S., Zhang, Y., Poulter, B., Sitch, S., Jin, J., Hu, X., and Bao, G.: Dryland dominance in the slowdown of global vegetation carbon uptake, Nat. Geosci., 1–7, https://doi.org/10.1038/s41561-026-01957-8, 2026.
Li, X. and Xiao, J.: Mapping photosynthesis solely from solar-induced chlorophyll fluorescence: a global, fine-resolution dataset of gross primary production derived from OCO-2, Remote Sens., 11, 2563, https://doi.org/10.3390/rs11212563, 2019.
Liang, S., Cheng, J., Jia, K., Jiang, B., Liu, Q., Xiao, Z., Yao, Y., Yuan, W., Zhang, X., Zhao, X., and Zhou, J.: The global land surface satellite (GLASS) product suite, B. Am. Meteorol. Soc., https://doi.org/10.1175/BAMS-D-18-0341.1, 2021.
Liu, J., Zhu, Y., Rosenfeld, D., Cao, Y., Wang, Y., and Wang, M.: Apparent global increase in cloud droplet number concentration after 2022 attributed to MODIS orbital drift, Geophys. Res. Lett., 53, e2025GL120318, https://doi.org/10.1029/2025GL120318, 2026.
Liu, N. F., Liu, Q., Wang, L. Z., Liang, S. L., Wen, J. G., Qu, Y., and Liu, S. H.: A statistics-based temporal filter algorithm to map spatiotemporally continuous shortwave albedo from MODIS data, Hydrol. Earth Syst. Sci., 17, 2121–2129, https://doi.org/10.5194/hess-17-2121-2013, 2013a.
Liu, S., Li, X., Xu, Z., Che, T., Xiao, Q., Ma, M., Liu, Q., Jin, R., Guo, J., Wang, L., Wang, W., Qi, Y., Li, H., Xu, T., Ran, Y., Hu, X., Shi, S., Zhu, Z., Tan, J., Zhang, Y., and Ren, Z.: The heihe integrated observatory network: a basin-scale land surface processes observatory in China, Vadose Zone J., 17, 180072, https://doi.org/10.2136/vzj2018.04.0072, 2018.
Liu, S. M., Xu, Z. W., Zhu, Z. L., Jia, Z. Z., and Zhu, M. J.: Measurements of evapotranspiration from eddy-covariance systems and large aperture scintillometers in the hai river basin, china, J. Hydrol., 487, 24–38, https://doi.org/10.1016/j.jhydrol.2013.02.025, 2013b.
Loomis, B. D., Luthcke, S. B., and Sabaka, T. J.: Regularization and error characterization of GRACE mascons, J. Geod., 93, 1381–1398, https://doi.org/10.1007/s00190-019-01252-y, 2019.
Ma, N.: Global Land ET by CR method Version 1.0, figshare [data set], https://doi.org/10.6084/m9.figshare.13634552, 2021.
Ma, N.: Global Land ET by CR method Version 2.0, figshare [data set], https://doi.org/10.6084/m9.figshare.22362385, 2023.
Ma, N., Szilagyi, J., and Zhang, Y.: Calibration-free complementary relationship estimates terrestrial evapotranspiration globally, Water Resour. Res., 57, e2021WR029691, https://doi.org/10.1029/2021WR029691, 2021.
Ma, N., Zhang, Y., and Szilagyi, J.: Water-balance-based evapotranspiration for 56 large river basins: a benchmarking dataset for global terrestrial evapotranspiration modeling, J. Hydrol., 630, 130607, https://doi.org/10.1016/j.jhydrol.2024.130607, 2024.
Ma, Y., Hu, Z., Xie, Z., Ma, W., Wang, B., Chen, X., Li, M., Zhong, L., Sun, F., Gu, L., Han, C., Zhang, L., Liu, X., Ding, Z., Sun, G., Wang, S., Wang, Y., and Wang, Z.: A long-term (2005–2016) dataset of hourly integrated land–atmosphere interaction observations on the Tibetan Plateau, Earth Syst. Sci. Data, 12, 2937–2957, https://doi.org/10.5194/essd-12-2937-2020, 2020.
Medlyn, B. E., Duursma, R. A., Eamus, D., Ellsworth, D. S., Prentice, I. C., Barton, C. V. M., Crous, K. Y., De Angelis, P., Freeman, M., and Wingate, L.: Reconciling the optimal and empirical approaches to modelling stomatal conductance, Global Change Biol., 17, 2134–2144, https://doi.org/10.1111/j.1365-2486.2010.02375.x, 2011.
Miralles, D. G., Bonte, O., Koppa, A., Baez-Villanueva, O. M., Tronquo, E., Zhong, F., Beck, H. E., Hulsman, P., Dorigo, W., Verhoest, N. E. C., and Haghdoost, S.: GLEAM4: global land evaporation and soil moisture dataset at 0.1° resolution from 1980 to near present, Sci. Data, 12, 416, https://doi.org/10.1038/s41597-025-04610-y, 2025.
Mu, Q., Zhao, M., and Running, S. W.: Improvements to a MODIS global terrestrial evapotranspiration algorithm, Remote Sens. Environ., 115, 1781–1800, https://doi.org/10.1016/j.rse.2011.02.019, 2011.
Myneni, R.: VIIRS/NPP leaf area index/FPAR 8-day L4 global 500m SIN grid V002, NASA earthdata, NASA Land Processes Distributed Active Archive Center [data set], https://doi.org/10.5067/VIIRS/VNP15A2H.002, 2023.
Myneni, R., Knyazikhin, Y., and Park, T.: MODIS/terra leaf area index/FPAR 8-day L4 global 500m SIN grid V061, NASA Land Processes Distributed Active Archive Center [data set], https://doi.org/10.5067/MODIS/MOD15A2H.061, 2021.
NASA Goddard Space Flight Center: Daily FluxSat GPP of biomass over Land, Based on MODIS Terra and Aqua adjusted reflectance Collection 6.1, on a Global 0.05 by 0.05 Degree Grid, Level 3, NASA Goddard Earth Sciences Data and Information Services Center [data set], https://doi.org/10.5067/MEASURES/FLUXSAT/FLUXSATMGPP_L3_DAILY_P05DEG.2.2, 2025.
Nelson, J. A., Walther, S., Jung, M., Gans, F., Kraft, B., Weber, U., Hamdi, Z., Duveiller, G., and Zhang, W.: FLUXCOM-X-BASE, ICOS ERIC – Carbon Portal [data set], https://doi.org/10.18160/5NZG-JMJE, 2023.
Nelson, J. A., Walther, S., Gans, F., et al.: X-BASE: the first terrestrial carbon and water flux products from an extended data-driven scaling framework, FLUXCOM-X, Biogeosciences, 21, 5079–5115, https://doi.org/10.5194/bg-21-5079-2024, 2024.
Novick, K. A., Biederman, J. A., Desai, A. R., Litvak, M. E., Moore, D. J. P., Scott, R. L., and Torn, M. S.: The AmeriFlux network: a coalition of the willing, Agr. Forest Meteorol., 249, 444–456, https://doi.org/10.1016/j.agrformet.2017.10.009, 2018.
Oki, T.: Global Hydrological Cycles and World Water Resources, Science, 313, 1068–1072, https://doi.org/10.1126/science.1128845, 2006.
Pastorello, G., Trotta, C., Canfora, E., et al.: The FLUXNET2015 dataset and the ONEFlux processing pipeline for eddy covariance data, Sci. Data, 7, 225, https://doi.org/10.1038/s41597-020-0534-3, 2020.
Reichstein, M., Falge, E., Baldocchi, D., Papale, D., Aubinet, M., Berbigier, P., Bernhofer, C., Buchmann, N., Gilmanov, T., Granier, A., Grünwald, T., Havránková, K., Ilvesniemi, H., Janous, D., Knohl, A., Laurila, T., Lohila, A., Loustau, D., Matteucci, G., Meyers, T., Miglietta, F., Ourcival, J.-M., Pumpanen, J., Rambal, S., Rotenberg, E., Sanz, M., Tenhunen, J., Seufert, G., Vaccari, F., Vesala, T., Yakir, D., and Valentini, R.: On the separation of net ecosystem exchange into assimilation and ecosystem respiration: review and improved algorithm, Glob. Change Biol., 11, 1424–1439, https://doi.org/10.1111/j.1365-2486.2005.001002.x, 2005.
Running, S., Mu, Q., and Zhao, M.: MOD17A2H MODIS/terra gross primary productivity 8-day L4 global 500m SIN grid V006, NASA Land Processes Distributed Active Archive Center [data set], https://doi.org/10.5067/MODIS/MOD17A2H.006, 2015.
Running, S. W., Nemani, R. R., Heinsch, F. A., Zhao, M., Reeves, M., and Hashimoto, H.: A continuous satellite-derived measure of global terrestrial primary production, Bioscience, 54, 547–560, https://doi.org/10.1641/0006-3568(2004)054[0547:ACSMOG]2.0.CO;2, 2004.
Save, H.: CSR GRACE and GRACE-FO RL06 mascon solutions v02, GRACE mission [data set], https://doi.org/10.15781/cgq9-nh24, 2022.
Save, H., Bettadpur, S., and Tapley, B. D.: High‐resolution CSR GRACE RL05 mascons, J. Geophys. Res.-Sol. Ea., 121, 7547–7569, https://doi.org/10.1002/2016JB013007, 2016.
Schaaf, C. and Wang, Z.: MODIS/Terra+Aqua BRDF/Albedo Daily L3 Global – 500m V061, NASA Land Processes Distributed Active Archive Center [data set], https://doi.org/10.5067/MODIS/MCD43A3.061, 2021.
Schaaf, C., Wang, Z., Erb, A., and Paynter, I.: VIIRS/NPP BRDF/albedo daily L3 global 1km SIN grid V002, NASA Land Processes Distributed Active Archive Center [data set], https://doi.org/10.5067/VIIRS/VNP43MA3.001, 2025.
Schneider, U., Hänsel, S., Finger, P., Rustemeier, E., and Ziese, M.: GPCC full data monthly version 2022 at 0.5°: monthly land-surface precipitation from rain-gauges built on GTS-based and historic data: globally gridded monthly totals (2022), Global Precipitation Climatology Centre (GPCC) at Deutscher Wetterdienst [data set], https://doi.org/10.5676/DWD_GPCC/FD_M_V2022_050, 2022.
Tagesson, T.: Light Response Function Modelled Gross Primary Production, Electronic Research Data Archive – University of Copenhagen [data set], https://doi.org/10.17894/ucph.b2d7ebfb-c69c-4c97-bee7-562edde5ce66, 2020.
Tagesson, T., Tian, F., Schurgers, G., Horion, S., Scholes, R., Ahlström, A., Ardö, J., Moreno, A., Madani, N., Olin, S., and Fensholt, R.: A physiology-based earth observation model indicates stagnation in the global gross primary production during recent decades, Glob. Change Biol., 27, 836–854, https://doi.org/10.1111/gcb.15424, 2021.
Tang, R., Wang, J., Liu, M., and Li, Z.-L.: Energy-conservation datasets of global land surface radiation and heat fluxes from 2000–2020 generated by CoSEB, V2, Science Data Bank [data set], https://doi.org/10.57760/sciencedb.27228, 2025.
Teluguntla, P., Thenkabail, P., Oliphant, A., Gumma, M., Aneece, I., Foley, D., and McCormick, R.: Landsat-derived global rainfed and irrigated-cropland product 30 m V001, NASA EOSDIS Land Processes Distributed Active Archive Center, https://doi.org/10.5067/COMMUNITY/LGRIP/LGRIP30.001, 2023.
Tian, J., Huang, X., Chen, H., Chen, J. M., Ciais, P., Krol, M., Liang, S., Piao, S., Wu, J., Xiao, J., Chen, X., and Yuan, W.: The size of tropical vegetation gross primary production, Nature, 654, E1–E4, https://doi.org/10.1038/s41586-026-10562-z, 2026.
Twedt, K., Xiong, X., Geng, X., Wilson, T., and Mu, Q.: Impact of satellite orbit drift on MODIS Earth scene observations used in calibration of the reflective solar bands, in: Earth Observing Systems XXVIII, Earth Observing Systems XXVIII, SPIE, 158, https://doi.org/10.1117/12.2676873, 2023.
Ueyama, M., Takao, Y., Yazawa, H., Tanaka, M., Yabuki, H., Kumagai, T., Iwata, H., Awal, Md. A., Du, M., Harazono, Y., Hata, Y., Hirano, T., Hiura, T., Ide, R., Ishida, S., Ishikawa, M., Kitamura, K., Kominami, Y., Komiya, S., Kotani, A., Inoue, Y., Machimura, T., Matsumoto, K., Matsuura, Y., Mizoguchi, Y., Murayama, S., Nagano, H., Nakai, T., Nakaji, T., Nakaya, K., Ohkubo, S., Ohta, T., Ono, K., Saitoh, T. M., Sakabe, A., Shimizu, T., Shimoda, S., Sugita, M., Takagi, K., Takahashi, Y., Takamura, N., Takanashi, S., Takimoto, T., Yasuda, Y., Wang, Q., Asanuma, J., Hasegawa, H., Hiyama, T., Iijima, Y., Ishidoya, S., Itoh, M., Kato, T., Kondo, H., Kosugi, Y., Kume, T., Maeda, T., Matsuura, S., Maximov, T., Miyama, T., Moriwaki, R., Muraoka, H., Petrov, R., Suzuki, J., Taniguchi, S., and Ichii, K.: The JapanFlux2024 dataset for eddy covariance observations covering Japan and East Asia from 1990 to 2023, Earth Syst. Sci. Data, 17, 3807–3833, https://doi.org/10.5194/essd-17-3807-2025, 2025.
van Dijk, A. I. J. M. and Bruijnzeel, L. A.: Modelling rainfall interception by vegetation of variable density using an adapted analytical model. Part 2. Model validation for a tropical upland mixed cropping system, J. Hydrol., 247, 239–262, https://doi.org/10.1016/S0022-1694(01)00393-6, 2001.
Viney, N., Perraud, J., Vaze, J., Chiew, F., Post, D., and Yang, A.: The usefulness of bias constraints in model calibration for regionalisation to ungauged catchments, 18th World IMACS Congress and MODSIM09 International Congress on Modelling and Simulation, Modelling and Simulation Society of Australia and New Zealand Inc. (MSSANZ), 13–17, https://www.mssanz.org.au/modsim09/I7/viney_I7a.pdf (last access: 29 July 2026), 2009.
Wan, Z., Hook, S., and Hulley, G.: MODIS/terra land surface temperature/emissivity 8-day L3 global 1km SIN grid V061, NASA Land Processes Distributed Active Archive Center [data set], https://doi.org/10.5067/MODIS/MOD11A2.061, 2021.
Wang, F., Chen, J. M., Gonsamo, A., Zhou, B., Cao, F., and Yi, Q.: A two-leaf rectangular hyperbolic model for estimating GPP across vegetation types and climate conditions, J. Geophys. Res.-Biogeo., 119, 1385–1398, https://doi.org/10.1002/2013JG002596, 2014.
Wang, J., Tang, R., Liu, M., Jiang, Y., Huang, L., and Li, Z.-L.: Coordinated estimates of 4-day 500 m global land surface energy balance components, Remote Sens. Environ., 326, 114795, https://doi.org/10.1016/j.rse.2025.114795, 2025.
Wang, J., Tang, R., Liu, M., and Li, Z.-L.: Energy-conservation datasets of global land surface radiation and heat fluxes from 2000–2020 generated by CoSEB, Earth Syst. Sci. Data, 18, 443–463, https://doi.org/10.5194/essd-18-443-2026, 2026.
Wang, L. and Zhang, Y.: Filling GRACE data gap using an innovative transformer-based deep learning approach, Remote Sens. Environ., 315, 114465, https://doi.org/10.1016/j.rse.2024.114465, 2024.
Wang, S., Zhang, Y., and Ju, W.: Long-term (1982–2018) global gross primary production dataset based on NIRv, figshare [data set], https://doi.org/10.6084/m9.figshare.12981977, 2020.
Wang, S., Zhang, Y., Ju, W., Qiu, B., and Zhang, Z.: Tracking the seasonal and inter-annual variations of global gross primary production during last four decades using satellite near-infrared reflectance data, Sci. Total Environ., 755, 142569, https://doi.org/10.1016/j.scitotenv.2020.142569, 2021.
Wang, Z., Peñuelas, J., Tagesson, T., Smith, W. K., Wu, M., He, W., Sitch, S., and Wang, S.: Evolution of global terrestrial gross primary productivity trend, Ecosyst. Health Sustainability, https://doi.org/10.34133/ehs.0278, 2024.
Warm Winter 2020 Team, ICOS Ecosystem Thematic Centre, ICOS Ecosystem Thematic Centre, and Trotta, C.: Warm winter 2020 ecosystem eddy covariance flux product for 73 stations in FLUXNET-archive format – release 2022-1, ICOS Carbon Portal [data set], https://doi.org/10.18160/2G60-ZHAK, 1 February 2022.
Watkins, M. M., Wiese, D. N., Yuan, D.-N., Boening, C., and Landerer, F. W.: Improved methods for observing Earth's time variable mass distribution with GRACE using spherical cap mascons, J. Geophys. Res.-Sol. Ea., 120, 2648–2671, https://doi.org/10.1002/2014jb011547, 2015.
Wei, H., Zhang, Y., Huang, Q., Chiew, F. H. S., Luan, J., Xia, J., and Liu, C.: Direct vegetation response to recent CO2 rise shows limited effect on global streamflow, Nat. Commun., 15, 9423, https://doi.org/10.1038/s41467-024-53879-x, 2024.
Wei, H., Zhang, Y., Huang, Q., Liu, C., and Wagener, T.: Functional relationships reveal large differences in streamflow response to eCO2-vegetation in global water models, Geophys. Res. Lett., 52, e2024GL113685, https://doi.org/10.1029/2024GL113685, 2025.
Wiese, D. N., Landerer, F. W., and Watkins, M. M.: Quantifying and reducing leakage errors in the JPL RL05M GRACE mascon solution, Water Resour. Res., 52, 7490–7502, https://doi.org/10.1002/2016wr019344, 2016.
Wiese, D. N., Yuan, D. N., Boening, C., Landerer, F. W., and Watkins, M. M.: JPL GRACE mascon ocean, ice, and hydrology equivalent water height release 06 Coastal Resolution Improvement (CRI) filtered version 1.0, https://doi.org/10.5067/TEMSC-3MJC6, 2018.
World Meteorological Organization (WMO): State of global water resources 2024, https://doi.org/10.59327/WMO/WATER/2024, 2025.
Wu, A., Xiong, X., Twedt, K., and Geng, X.: Tracking MODIS RVS for the reflective solar bands in drifting orbits using SNO with VIIRS, in: Earth Observing Missions and Sensors: Development, Implementation, and Characterization VI, Earth Observing Missions and Sensors: Development, Implementation, and Characterization VI, 74, SPIE, https://doi.org/10.1117/12.3040232, 2025.
Wutzler, T., Lucas-Moffat, A., Migliavacca, M., Knauer, J., Sickel, K., Šigut, L., Menzer, O., and Reichstein, M.: Basic and extensible post-processing of eddy covariance flux data with REddyProc, Biogeosciences, 15, 5015–5030, https://doi.org/10.5194/bg-15-5015-2018, 2018.
Xiao, X., Zhang, Q., Braswell, B., Urbanski, S., Boles, S., Wofsy, S., Moore, B., and Ojima, D.: Modeling gross primary production of temperate deciduous broadleaf forest using satellite images and climate data, Remote Sens. Environ., 91, 256–270, https://doi.org/10.1016/j.rse.2004.03.010, 2004.
Xie, Y., Kong, D., Zhang, Y., Zhong, Y., Ma, N., Gong, R., Ci, H., Xiao, M., and Gu, X.: Evaluation of the performance of multiple reanalysis forcing data in potential evapotranspiration estimation and its implication for actual evapotranspiration modeling, J. Hydrol., 660, 133472, https://doi.org/10.1016/j.jhydrol.2025.133472, 2025.
Xiong, Y., Yu, L., Qiu, G. Y., Yan, C., Zhao, W., Zou, Z., Ding, J., and Qin, L.: A global terrestrial evapotranspiration product based on three-temperature model from 2001 to 2020, V2, Science Data Bank [data set], https://doi.org/10.57760/sciencedb.o00014.00001, 2022.
Xu, Z.: Data for Manuscript entitled “Extended global terrestrial evapotranspiration and gross primary production dataset from 1982 to near present”, Zenodo [data set], https://doi.org/10.5281/zenodo.18385275, 2026.
Xu, Z., Zhang, Y., Zhang, X., Ma, N., Tian, J., Kong, D., and Post, D.: Bushfire-induced water balance changes detected by a modified paired catchment method, Water Resour. Res., 58, e2021WR031013, https://doi.org/10.1029/2021wr031013, 2022.
Xu, Z., Zhang, Y., and Kong, D.: PML-V2.2: Global terrestrial evapotranspiration and gross primary production dataset from 1982 to near present, National Tibetan Plateau/Third Pole Environment Data Center [data set], https://doi.org/10.11888/Terre.tpdc.303314, 2026.
Yan, K., Pu, J., Park, T., Xu, B., Zeng, Y., Yan, G., Weiss, M., Knyazikhin, Y., and Myneni, R. B.: Performance stability of the MODIS and VIIRS LAI algorithms inferred from analysis of long time series of products, Remote Sens. Environ., 260, 112438, https://doi.org/10.1016/j.rse.2021.112438, 2021.
Yan, Y., Li, B., Dechant, B., Xu, M., Luo, X., Qu, S., Miao, G., Leng, J., Shang, R., Shu, L., Jiang, C., Wang, H., Jeong, S., Ryu, Y., and Chen, J. M.: Plant traits shape global spatiotemporal variations in photosynthetic efficiency, Nat. Plants, 11, 924–934, https://doi.org/10.1038/s41477-025-01958-2, 2025.
Yang, R., Wang, J., Zeng, N., Sitch, S., Tang, W., McGrath, M. J., Cai, Q., Liu, D., Lombardozzi, D., Tian, H., Jain, A. K., and Han, P.: Divergent historical GPP trends among state-of-the-art multi-model simulations and satellite-based products, Earth Syst. Dynam., 13, 833–849, https://doi.org/10.5194/esd-13-833-2022, 2022.
Yang, Y., Roderick, M. L., Guo, H., Miralles, D. G., Zhang, L., Fatichi, S., Luo, X., Zhang, Y., McVicar, T. R., Tu, Z., Keenan, T. F., Fisher, J. B., Gan, R., Zhang, X., Piao, S., Zhang, B., and Yang, D.: Evapotranspiration on a greening Earth, Nat. Rev. Earth Environ., 4, 626–641, https://doi.org/10.1038/s43017-023-00464-3, 2023.
Yao, Y., Liang, S., Cheng, J., Liu, S., Fisher, J. B., Zhang, X., Jia, K., Zhao, X., Qin, Q., Zhao, B., Han, S., Zhou, G., Zhou, G., Li, Y., and Zhao, S.: MODIS-driven estimation of terrestrial latent heat flux in China based on a modified Priestley–Taylor algorithm, Agr. Forest Meteorol., 171–172, 187–202, https://doi.org/10.1016/j.agrformet.2012.11.016, 2013.
Yao, Y., Liang, S., Li, X., Hong, Y., Fisher, J. B., Zhang, N., Chen, J., Cheng, J., Zhao, S., Zhang, X., Jiang, B., Sun, L., Jia, K., Wang, K., Chen, Y., Mu, Q., and Feng, F.: Bayesian multimodel estimation of global terrestrial latent heat flux from eddy covariance, meteorological, and satellite observations, J. Geophys. Res.-Atmos., 119, 4521–4545, https://doi.org/10.1002/2013JD020864, 2014.
Yao, Y., Chen, J., Fisher, J. B., Shao, C., and Liu, Y.: A review of satellite-derived terrestrial evapotranspiration: theories, methods and products, Ecol. Process., 15, 25, https://doi.org/10.1186/s13717-026-00688-3, 2026.
Yebra, M., Van Dijk, A., Leuning, R., Huete, A., and Guerschman, J. P.: Evaluation of optical remote sensing to estimate actual evapotranspiration and canopy conductance, Remote Sens. Environ., 129, 250–261, https://doi.org/10.1016/j.rse.2012.11.004, 2013.
Yu, G.-R., Wen, X.-F., Sun, X.-M., Tanner, B. D., Lee, X., and Chen, J.-Y.: Overview of ChinaFLUX and evaluation of its eddy covariance measurement, Agr. Forest Meteorol., 137, 125–137, https://doi.org/10.1016/j.agrformet.2006.02.011, 2006.
Yu, G.-R., Chen, Z., and Wang, Y.-P.: Carbon, water and energy fluxes of terrestrial ecosystems in China, Agr. Forest Meteorol., 346, 109890, https://doi.org/10.1016/j.agrformet.2024.109890, 2024.
Yu, L., Qiu, G. Y., Yan, C., Zhao, W., Zou, Z., Ding, J., Qin, L., and Xiong, Y.: A global terrestrial evapotranspiration product based on the three-temperature model with fewer input parameters and no calibration requirement, Earth Syst. Sci. Data, 14, 3673–3693, https://doi.org/10.5194/essd-14-3673-2022, 2022.
Yuan, Q. and Wang, X.: Global carbon flux dataset (2000–2024), National Tibetan Plateau/Third Pole Environment Data Center [data set], https://doi.org/10.11888/Terre.tpdc.301870, 2025.
Yuan, Q., Wang, X., Che, T., and Li, J.: Global carbon flux dataset generated by fusing remote sensing and multiple flux networks observation, Sci. Data, 12, 1359, https://doi.org/10.1038/s41597-025-05672-8, 2025a.
Yuan, W., Liu, S., Yu, G., Bonnefond, J.-M., Chen, J., Davis, K., Desai, A. R., Goldstein, A. H., Gianelle, D., Rossi, F., Suyker, A. E., and Verma, S. B.: Global estimates of evapotranspiration and gross primary production based on MODIS and global meteorology data, Remote Sens. Environ., 114, 1416–1431, https://doi.org/10.1016/j.rse.2010.01.022, 2010.
Yuan, W., Tian, J., Wang, M., Wang, S., Xu, W., Wang, Y., Fu, Z., Girardin, M. P., Green, J. K., Zhou, S., Shang, J., He, B., Huang, M., Liu, M., Lu, H., Piao, S., Qing, Y., Xue, M., Song, C., Su, Y., Sadok, W., Zhang, Y., and Chen, X.: Impacts of rising atmospheric dryness on terrestrial ecosystem carbon cycle, Nat. Rev. Earth Environ., 6, 712–727, https://doi.org/10.1038/s43017-025-00726-2, 2025b.
Zhang, K. and Zhu, G.: A global dataset of terrestrial evapotranspiration (multi-component) and soil moisture (multi-layer) from 1982 to 2022, National Tibetan Plateau/Third Pole Environment Data Center [data set], https://doi.org/10.11888/Terre.tpdc.300751, 2023.
Zhang, K., Kimball, J. S., and Running, S. W.: A review of remote sensing based actual evapotranspiration estimation, Wires Water, 3, 834–853, https://doi.org/10.1002/wat2.1168, 2016a.
Zhang, K., Chen, H., Ma, N., Shang, S., Wang, Y., Xu, Q., and Zhu, G.: A global dataset of terrestrial evapotranspiration and soil moisture dynamics from 1982 to 2020, Sci. Data, 11, 445, https://doi.org/10.1038/s41597-024-03271-7, 2024.
Zhang, X., Zhang, Y., Ma, N., Kong, D., Tian, J., Shao, X., and Tang, Q.: Greening-induced increase in evapotranspiration over Eurasia offset by CO2-induced vegetational stomatal closure, Environ. Res. Lett., 16, 124008, https://doi.org/10.1088/1748-9326/ac3532, 2021.
Zhang, X., Zhang, Y., Tian, J., Ma, N., and Wang, Y.-P.: CO2 fertilization is spatially distinct from stomatal conductance reduction in controlling ecosystem water-use efficiency increase, Environ. Res. Lett., 17, 054048, https://doi.org/10.1088/1748-9326/ac6c9c, 2022.
Zhang, X., Ren, C., Wang, Z., Li, X., and Zhang, Y.: Gap-filling GRACE and GRACE-FO data with a climate adjustment scheme using singular spectrum analysis, J. Hydrol., 653, 132782, https://doi.org/10.1016/j.jhydrol.2025.132782, 2025.
Zhang, Y.: PML_V2 global evapotranspiration and gross primary production (2002.07–2019.08), National Tibetan Plateau/Third Pole Environment Data Center [data set], https://doi.org/10.11888/Geogra.tpdc.270251, 2020.
Zhang, Y., Chiew, F. H. S., Zhang, L., Leuning, R., and Cleugh, H. A.: Estimating catchment evaporation and runoff using MODIS leaf area index and the Penman-Monteith equation, Water Resour. Res., 44, https://doi.org/10.1029/2007wr006563, 2008.
Zhang, Y., Leuning, R., Hutley, L. B., Beringer, J., McHugh, I., and Walker, J. P.: Using long-term water balances to parameterize surface conductances and calculate evaporation at 0.05° spatial resolution, Water Resour. Res., 46, https://doi.org/10.1029/2009wr008716, 2010.
Zhang, Y., Zheng, H., Chiew, F. H. S., Arancibia, J. P., and Zhou, X.: Evaluating regional and global hydrological models against streamflow and evapotranspiration measurements, J. Hydrometeorol., https://doi.org/10.1175/JHM-D-15-0107.1, 2016b.
Zhang, Y., Peña-Arancibia, J. L., McVicar, T. R., Chiew, F. H. S., Vaze, J., Liu, C., Lu, X., Zheng, H., Wang, Y., Liu, Y. Y., Miralles, D. G., and Pan, M.: Multi-decadal trends in global terrestrial evapotranspiration and its components, Sci. Rep., 6, 19124, https://doi.org/10.1038/srep19124, 2016c.
Zhang, Y., Pena Arancibia, J., McVicar, T., Chiew, F., Vaze, J., Zheng, H., and Wang, Y. P.: Monthly global observation-driven Penman-Monteith-Leuning (PML) evapotranspiration and components, v2, CSIRO Data Collection [data set], https://doi.org/10.4225/08/5719A5C48DB85, 2016d.
Zhang, Y., Xiao, X., Wu, X., Zhou, S., Zhang, G., Qin, Y., and Dong, J.: A global moderate resolution dataset of gross primary production of vegetation for 2000–2016, Sci. Data, 4, 170165, https://doi.org/10.1038/sdata.2017.165, 2017a.
Zhang, Y., Xiao, X., Wu, X., Zhou, S., Zhang, G., Qin, Y., and Dong, J.: A global moderate resolution dataset of gross primary production of vegetation for 2000–2016, figshare [collection], https://doi.org/10.6084/m9.figshare.c.3789814, 2017b.
Zhang, Y., Kong, D., Gan, R., Chiew, F. H. S., McVicar, T. R., Zhang, Q., and Yang, Y.: Coupled estimation of 500 m and 8-day resolution global evapotranspiration and gross primary production in 2002–2017, Remote Sens. Environ., 222, 165–182, https://doi.org/10.1016/j.rse.2018.12.031, 2019.
Zhang, Y., Li, C., Chiew, F. H. S., Post, D. A., Zhang, X., Ma, N., Tian, J., Kong, D., Leung, L. R., Yu, Q., Shi, J., and Liu, C.: Southern Hemisphere dominates recent decline in global water availability, Science, 382, 579–584, https://doi.org/10.1126/science.adh0716, 2023.
Zhang, Y., Blöschl, G., Wei, H., Kong, D., Ma, N., Wagener, T., Tian, J., Xia, J., Li, C., Wang, L., Chiew, F. H. S., Leung, L. R., Liu, X., Zheng, H., Zhang, X., and Liu, C.: Overestimation of past and future increases in global river flow by Earth system models, Nat. Geosci., 0–10, https://doi.org/10.1038/s41561-025-01897-9, 2026.
Zhao, G., Li, Y., Zhou, L., and Gao, H.: Evaporative water loss of 1.42 million global lakes, Nat. Commun., 13, 3686, https://doi.org/10.1038/s41467-022-31125-6, 2022a.
Zhao, M., A, G., Liu, Y., and Konings, A. G.: Evapotranspiration frequently increases during droughts, Nat. Clim. Change, https://doi.org/10.1038/s41558-022-01505-3, 2022b.
Zheng, C., Jia, L., and Hu, G.: Global land surface evapotranspiration monitoring by ETMonitor model driven by multi-source satellite earth observations, J. Hydrol., 613, 128444, https://doi.org/10.1016/j.jhydrol.2022.128444, 2022a.
Zheng, C., Jia, L., and Hu, G.: ETMonitor Global Actual Evapotranspiration Dataset with 1-km Resolution, National Tibetan Plateau/Third Pole Environment Data Center [data set], https://doi.org/10.11888/RemoteSen.tpdc.272831, 2022b.
Zheng, Y., Shen, R., Wang, Y., Li, X., Liu, S., Liang, S., Chen, J. M., Ju, W., Zhang, L., and Yuan, W.: Improved estimate of global gross primary production for reproducing its long-term variation, 1982–2017, Earth Syst. Sci. Data, 12, 2725–2746, https://doi.org/10.5194/essd-12-2725-2020, 2020.
Zhou, Y., Zhang, Y., Zhu, T., and Ju, W.: A dataset of carbon and water fluxes in the cropland ecosystem at Jurong Station (2015–2020), China Sci. Data, 8, https://doi.org/10.11922/11-6035.csd.2023.0072.zh, 2023.
Zhu, Z., Bi, J., Pan, Y., Ganguly, S., Anav, A., Xu, L., Samanta, A., Piao, S., Nemani, R. R., and Myneni, R. B.: Global data sets of vegetation leaf area index (LAI)3g and fraction of photosynthetically active radiation (FPAR)3g derived from global inventory modeling and mapping studies (GIMMS) normalized difference vegetation index (NDVI3g) for the period 1981 to 2011, Remote Sens., 5, 927–948, https://doi.org/10.3390/rs5020927, 2013.