the Creative Commons Attribution 4.0 License.
the Creative Commons Attribution 4.0 License.
 | 29 Jul 2026
Mapping paddy rice distribution and cropping intensity in South and Southeast Asia (1995–2024) at 30 m resolution
Zizhang Zhao
Geli Zhang

Jinwei Dong
Jilin Yang
Chang Fan
Ruoqi Liu
Xiangming Xiao
South and Southeast Asia is a major global hub for paddy rice cultivation, with the highest rice cropping intensity worldwide owing to its favorable hydrothermal conditions. The region has also experienced considerable spatiotemporal changes driven by climate change and anthropogenic activities. However, the absence of spatially explicit long-term datasets on paddy rice distribution and cropping intensity hinders effective agricultural and environmental management. This gap is particularly critical in the 21st century, as changes in climate, water resources, and food trade patterns increasingly reshape regional rice production systems. Using all available Landsat and Sentinel-2 archives, we refined a phenology-based algorithm to generate 30 m multi-year composite rice distribution and cropping-intensity products across South and Southeast Asia for four nominal reference years: 1995, 2005, 2015, and 2024. The algorithm addresses the challenge of detecting rice cropping intensity from long-term satellite time series and comprises three core steps: (1) identifying pixel-level rice phenological peaks using an enhanced peak detection method, thereby defining potential transplanting windows and minimizing monsoon-induced cloud and precipitation interference; (2) detecting paddy flooding signals and delineating rice cultivation areas based on phenological rules derived from the relationship between the Land Surface Water Index (LSWI) and Enhanced Vegetation Index (EVI); and (3) determining rice cropping intensity according to the number of valid crop peaks and associated flooding signals detected within the corresponding composite-period time series. The resulting maps were validated using 23 396 samples derived from a field photo library, visual interpretation of Sentinel-1/2 satellite imagery, and a sample migration algorithm. Across the four periods, the maps achieved overall accuracies ranging from 83.74 % to 87.60 %. In addition, the resulting products were compared with existing regional and period-specific rice datasets (e.g., NESEA-Rice10 and Open-SEA-Rice-10) for further evaluation. The comparisons demonstrated that the refined approach achieved higher accuracy and robustness in mapping both rice distribution and cropping intensity. When compared with official FAO statistics for South and mainland Southeast Asian countries, the derived maps yielded R2 values exceeding 0.9. These products hold great potential for applications such as methane emission estimation, water resource management, and crop yield monitoring, thereby supporting sustainable agricultural practices and policy development in the region.
The dataset and source code are available at https://doi.org/10.5281/zenodo.21349862 (Zhao et al., 2026).
- Article
(13135 KB) - Full-text XML
-
Supplement
(9733 KB) - BibTeX
- EndNote


Rice is a staple food crop across South and Southeast Asia, underpinning food security in a region characterized by rapid population growth and escalating food demand (Xiao et al., 2006). This demographic pressure has inevitably driven the expansion of rice paddies and the intensification of cultivation practices (Godfray et al., 2010; Foley et al., 2005). However, the expansion of agricultural land, including rice paddies, exacerbates environmental challenges, such as freshwater depletion, deforestation, and increased methane emissions, all of which threaten ecosystem functions (Mehta et al., 2024; Wang et al., 2023; Zeng et al., 2018; Chen et al., 2024). Balancing food security with the preservation of ecosystem services is thus a critical component of achieving the United Nations' 2030 Sustainable Development Goals (SDGs) (Persaud and Dagher, 2021). Understanding the spatial extent and cropping intensity patterns of rice agriculture is essential to provide robust data support for sustainable development policies (Potapov et al., 2022; Zabel et al., 2019; Cheng et al., 2026).
Satellite remote sensing has emerged as a powerful tool for accurately mapping rice agriculture over large spatial scales (Dong and Xiao, 2016; Zhang et al., 2017). Moderate Resolution Imaging Spectroradiometer (MODIS) data, with its 500 m spatial resolution, has been effectively utilized to map rice distributions in monsoon Asia, including South and Southeast Asia (Zhang et al., 2020). However, the coarse resolution of MODIS limits its ability to capture fragmented rice paddies and introduces errors due to mixed-pixel effects, particularly in detecting multi-cropping systems (Han et al., 2021). Higher-resolution satellite data, such as Landsat (30 m) and Sentinel-1/2 (10–20 m) observations, enable more precise identification of rice paddies (Zhao et al., 2024). Current research employs phenology-based algorithms or machine learning approaches to leverage these higher-resolution datasets for rice mapping.
Phenology-based rice mapping methods primarily exploit the relationship between the Land Surface Water Index (LSWI) and the Enhanced Vegetation Index (EVI) derived from optical imagery to detect the unique flooding signals of rice paddies (Dong et al., 2015; Xiao et al., 2005). These methods have achieved high accuracy in regions such as Northeast China, Japan, and South Korea (Dong et al., 2016; Carrasco et al., 2022; Han et al., 2022). Recent studies have extended phenology-based approaches to Synthetic Aperture Radar (SAR) data, improving rice mapping in cloud-prone and rainy regions (Xu et al., 2023; Song et al., 2025). Due to their simplicity, computational efficiency, and robustness, phenology-based methods are particularly well-suited for large-scale applications and can be readily implemented on cloud-computing platforms, making them the most widely adopted approach for regional and continental-scale rice mapping studies (Zhao et al., 2025).
Machine learning-based rice classification methods have also gained prominence, as they leverage extensive training samples to achieve high accuracy in mapping paddy rice distribution (Dong and Xiao, 2016). For instance, several studies have achieved high-precision rice mapping in regions with complex cropping patterns, such as the crop rotation systems in Northeast China and the multi-season rice planting patterns in the Jianghan Plain, by integrating rice-specific phenological features with machine learning classifiers, such as One-Class Support Vector Machines (OC-SVM) and Random Forest (He et al., 2021; Ni et al., 2021). More recently, deep learning techniques, particularly convolutional neural networks like U-Net and eXplainable Mamba UNet, have been employed to process time series of Sentinel-1 SAR data, demonstrating remarkable robustness in capturing spatial patterns, even in cloud-prone regions where optical imagery is limited (Ge et al., 2025; Thorp and Drajat, 2021; Lin et al., 2022).
Despite these advances, existing approaches have not yet provided a long-term, large-scale solution that jointly captures paddy rice distribution and cropping intensity in South and Southeast Asia. Traditional phenology-based rice mapping methods rely on prior expert knowledge to determine phenological stages, but interpreting phenological periods from several decades ago introduces considerable uncertainty. Machine learning methods, on the other hand, have shown potential for global-scale classification, yet the acquisition of large, high-quality historical training datasets remains time-consuming and resource-intensive (Zhao et al., 2025; Zhan et al., 2021). Even though a fully automated, sample-free rice-mapping framework has been developed, its dependence on SAR-derived rice features limits its applicability to periods prior to the operational lifetime of Sentinel-1 (Gao et al., 2023).
This study addresses this gap by employing a refined phenology-based method that eliminates the need for extensive training samples while accurately identifying cropping intensity and phenological windows. Through optical imagery fusion and false peak elimination techniques, we aim to precisely identify rice cropping systems and their spatial distributions, thereby quantifying changes over the past three decades. This approach provides critical data for balancing rice production expansion and intensification with sustainable development goals, offering robust support for informed policy-making in South and mainland Southeast Asia.
2.1 Study area
The study area encompasses South and mainland Southeast Asia, including Vietnam, Thailand, Cambodia, Myanmar, Laos, Bangladesh, India, and Pakistan (Fig. 1). These eight countries are predominantly characterized by a tropical monsoon climate, with the exception of Balochistan Province in Pakistan, and feature distinct wet and dry seasons. Rice is the dominant crop in this region, which exhibits the highest rice cropping intensity worldwide. The region also includes diverse rice production systems, such as the rice-winter wheat rotation system in northern India, flood-associated single-season rice cultivation in Bangladesh, and typical multi-season rice systems in the Mekong River Basin. In 2024, the total rice harvested area in this region accounted for approximately 47 % of the global rice harvested area, making it the world's most important rice production base.
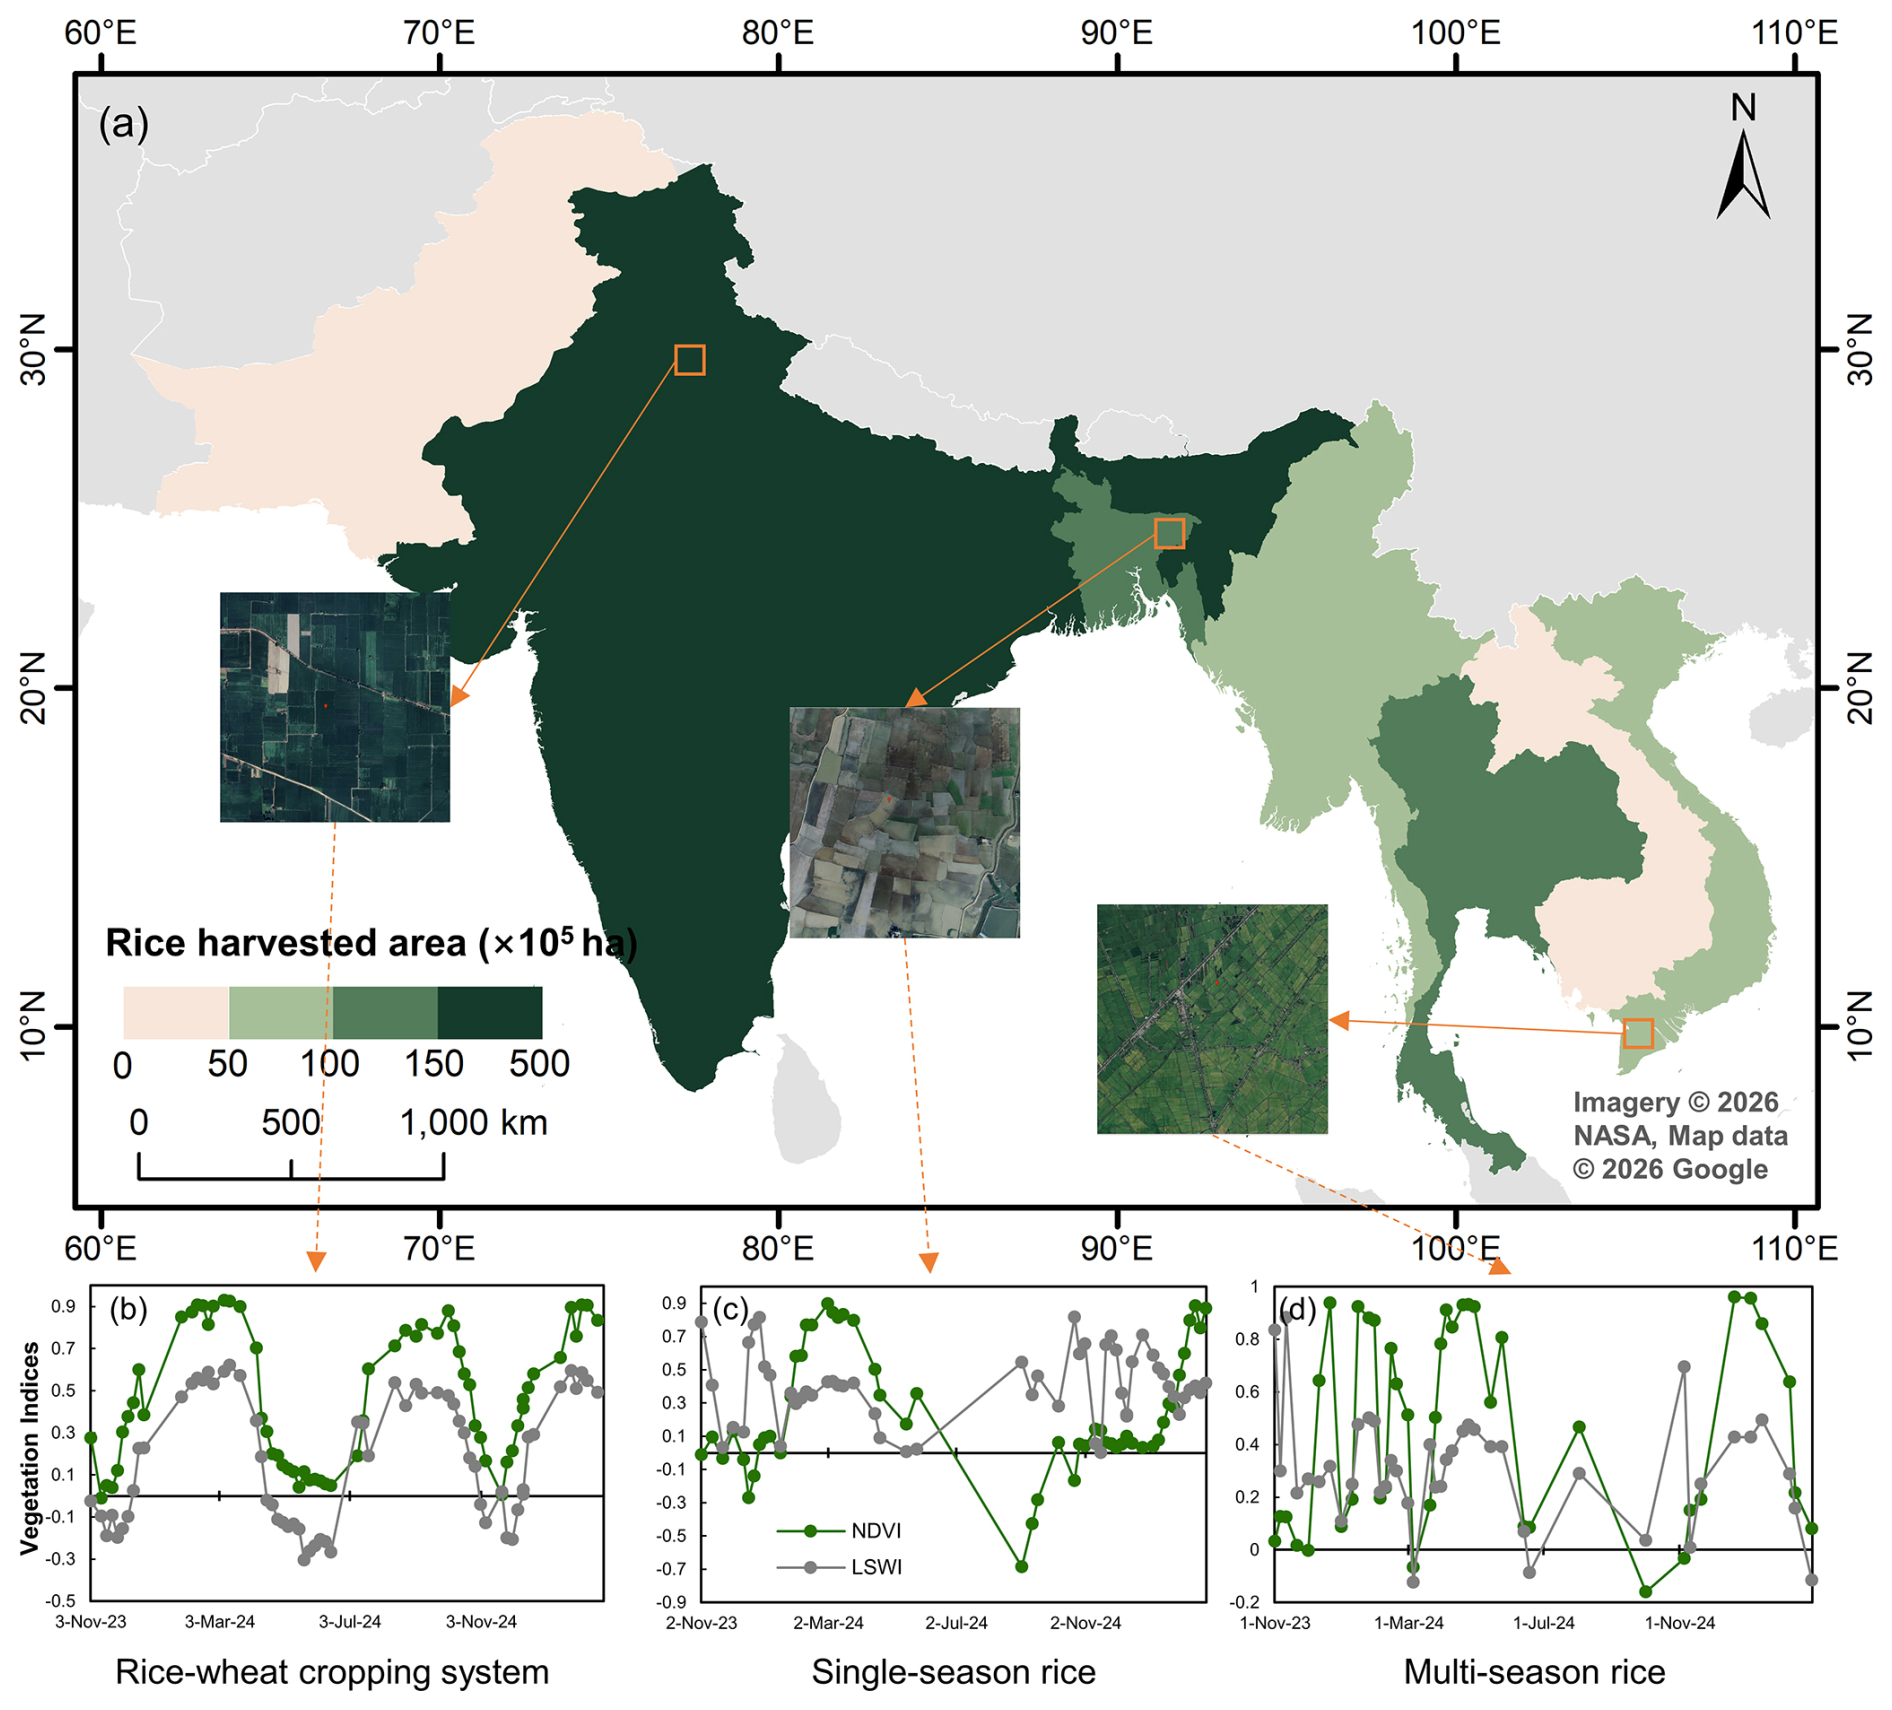
Figure 1(a) Spatial distribution of rice harvested area in South and mainland Southeast Asia (×105 ha). Insets show example rice fields at the locations marked by orange squares. (b–d) Representative NDVI (green) and LSWI (gray) time series for (b) rice-wheat cropping system, (c) single-season rice, and (d) multi-season rice. The locations of the example pixels are indicated by arrows on the map. The administrative boundaries used in this map are derived from Natural Earth (public domain). They are used solely to delineate the spatial extent of the study areas for this rice mapping research and do not imply any official endorsement or acceptance of national borders. Rice harvested area data were obtained from the Food and Agriculture Organization (FAO). The high-resolution satellite imagery insets were obtained from Google Earth; Imagery © 2026 NASA, Map data © 2026 Google.
2.2 Data and preprocessing
2.2.1 Satellite imagery
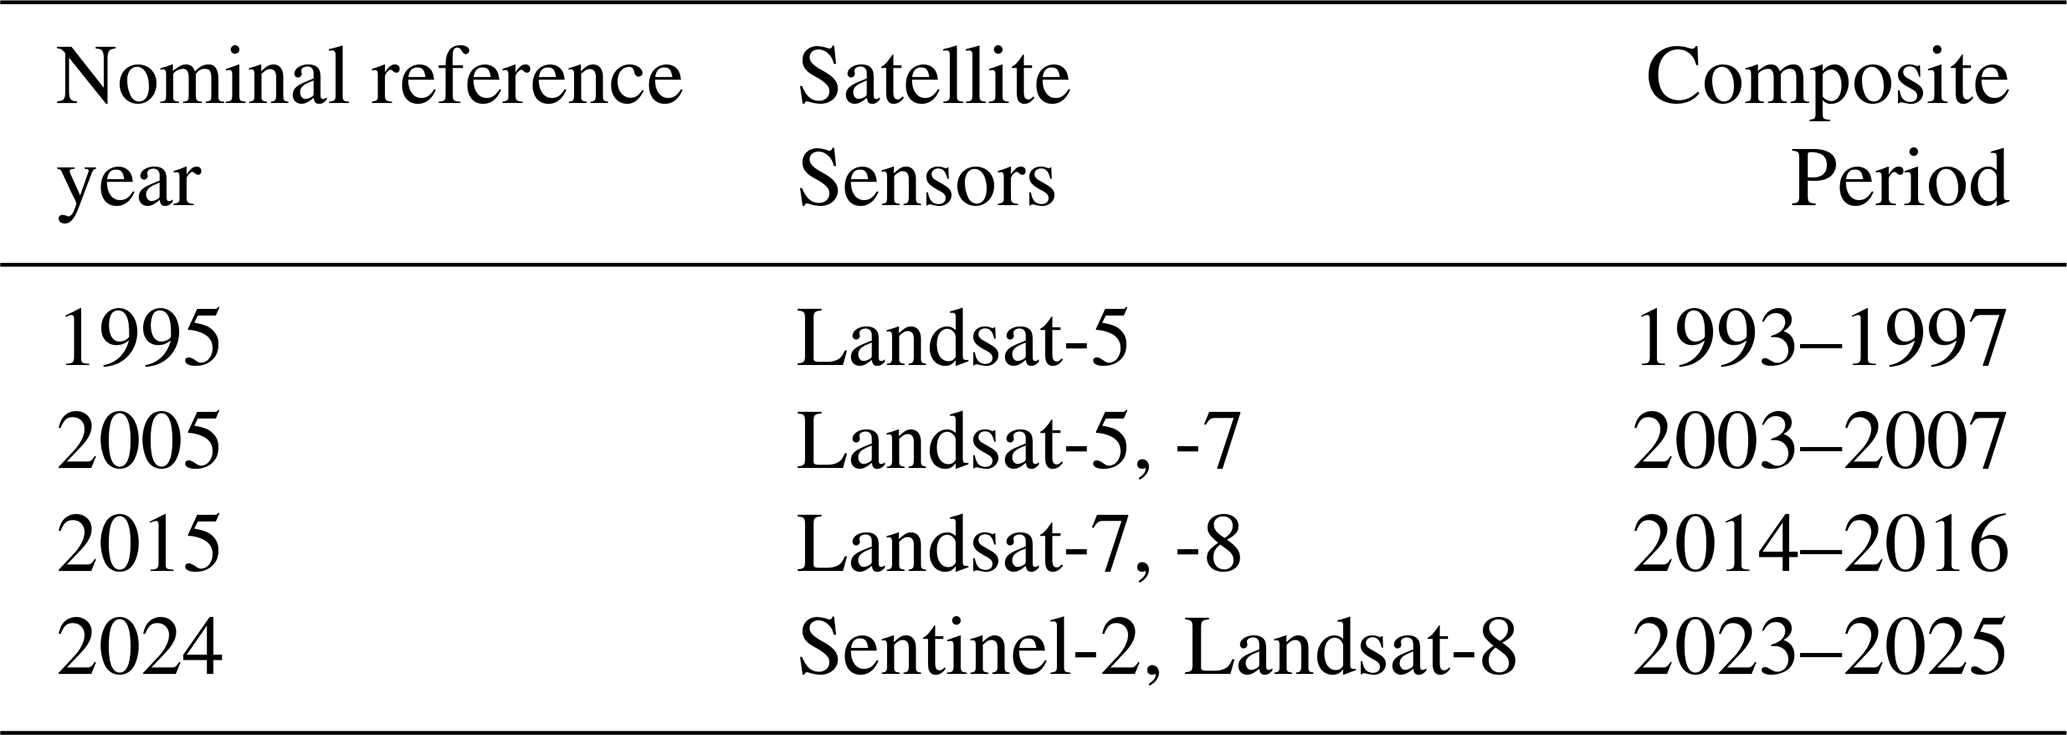
To develop long-term rice mapping products for South and mainland Southeast Asia, we acquired all available Sentinel-2 (S2_HARMONIZED) and Landsat T1_L2 imagery data from the Google Earth Engine (GEE) platform for specific time periods (Table 1). Invalid observations, including clouds, cloud shadows, and snow cover, were filtered out using the Sentinel-2 QA60 and Landsat QA_PIXEL bands. Because imagery from a single year was insufficient to reliably support rice information extraction across South and mainland Southeast Asia, we applied a multi-year median compositing approach for the periods 1993–1997, 2003–2007, 2014–2016, and 2023–2025 to mitigate data gaps (see Table 1). Specifically, each year was segmented into half-monthly intervals (e.g., 1–15 January and 16–31 January, with some intervals spanning 14 or 16 d due to monthly variations), and all valid observations within the selected time periods for each interval were used to generate a single median composite image. Additionally, linear regression was employed to harmonize the spectral bands of Landsat and Sentinel-2 data (Yang et al., 2023), resulting in the generation of half-monthly time-series curves.
Table 1Satellite sensors and multi-year composite periods used for the nominal reference-year rice products in South and mainland Southeast Asia.
Based on the generated half-monthly time-series curves, we further calculated relevant vegetation indices to identify the spatial distribution and cropping intensity of paddy rice, including NDVI, LSWI, and EVI (Eqs. 1–3).
2.2.2 Cropland mask
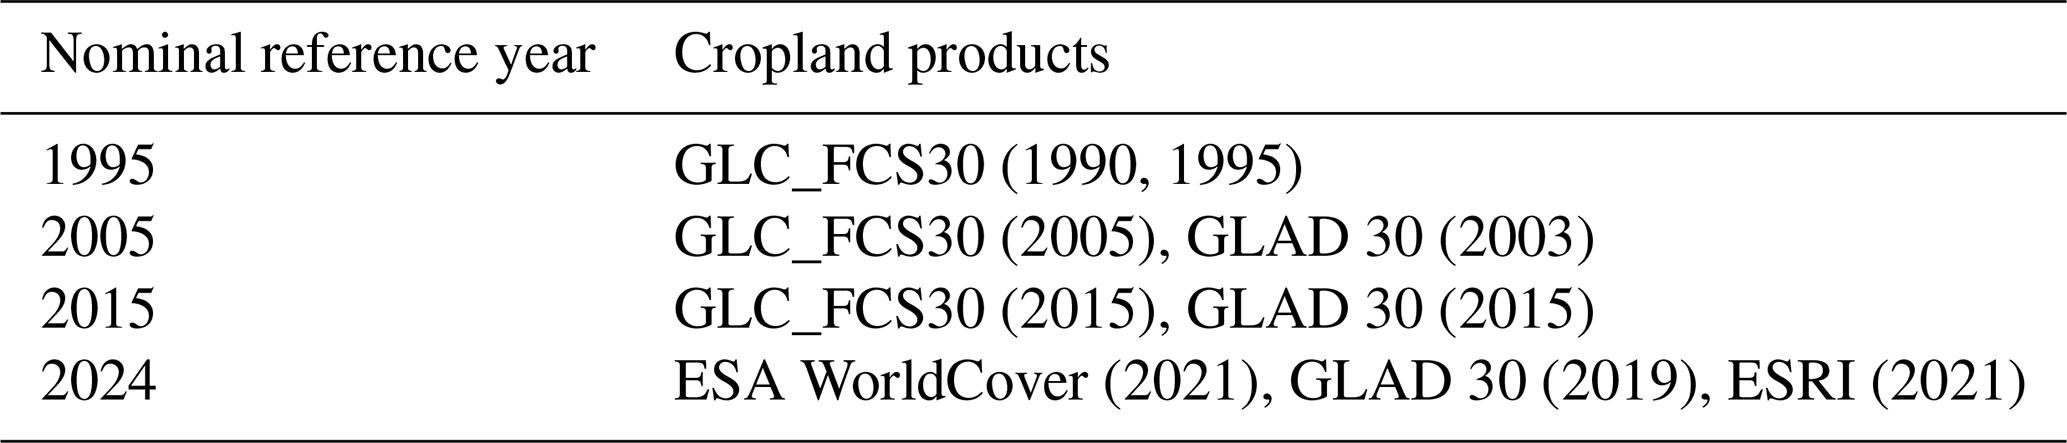
To investigate changes in rice cropping patterns in South and mainland Southeast Asia, a region that has undergone significant land-use transformations, including cropland expansion and forest loss over recent decades, we selected high-quality land cover and cropland products aligned with the target mapping years. Four global products were chosen to mitigate uncertainties in rice mapping arising from cropland expansion. The specific cropland products selected for each nominal reference year are detailed in Table 2: GLC_FCS30 (Zhang et al., 2021), GLAD 30 (Potapov et al., 2022), ESA WorldCover 2021 (Zanaga et al., 2022), and ESRI 2021 (Karra et al., 2021).
Table 2Cropland products used to generate the cropland mask in South and mainland Southeast Asia.
2.3 Methodology
2.3.1 Identification of valid crop peak dates
To accurately identify multiple rice cropping cycles, we first determined the peak date of each valid crop cycle (i.e., the number of times a plot is cropped within a year). The specific steps are as follows (Fig. 2):
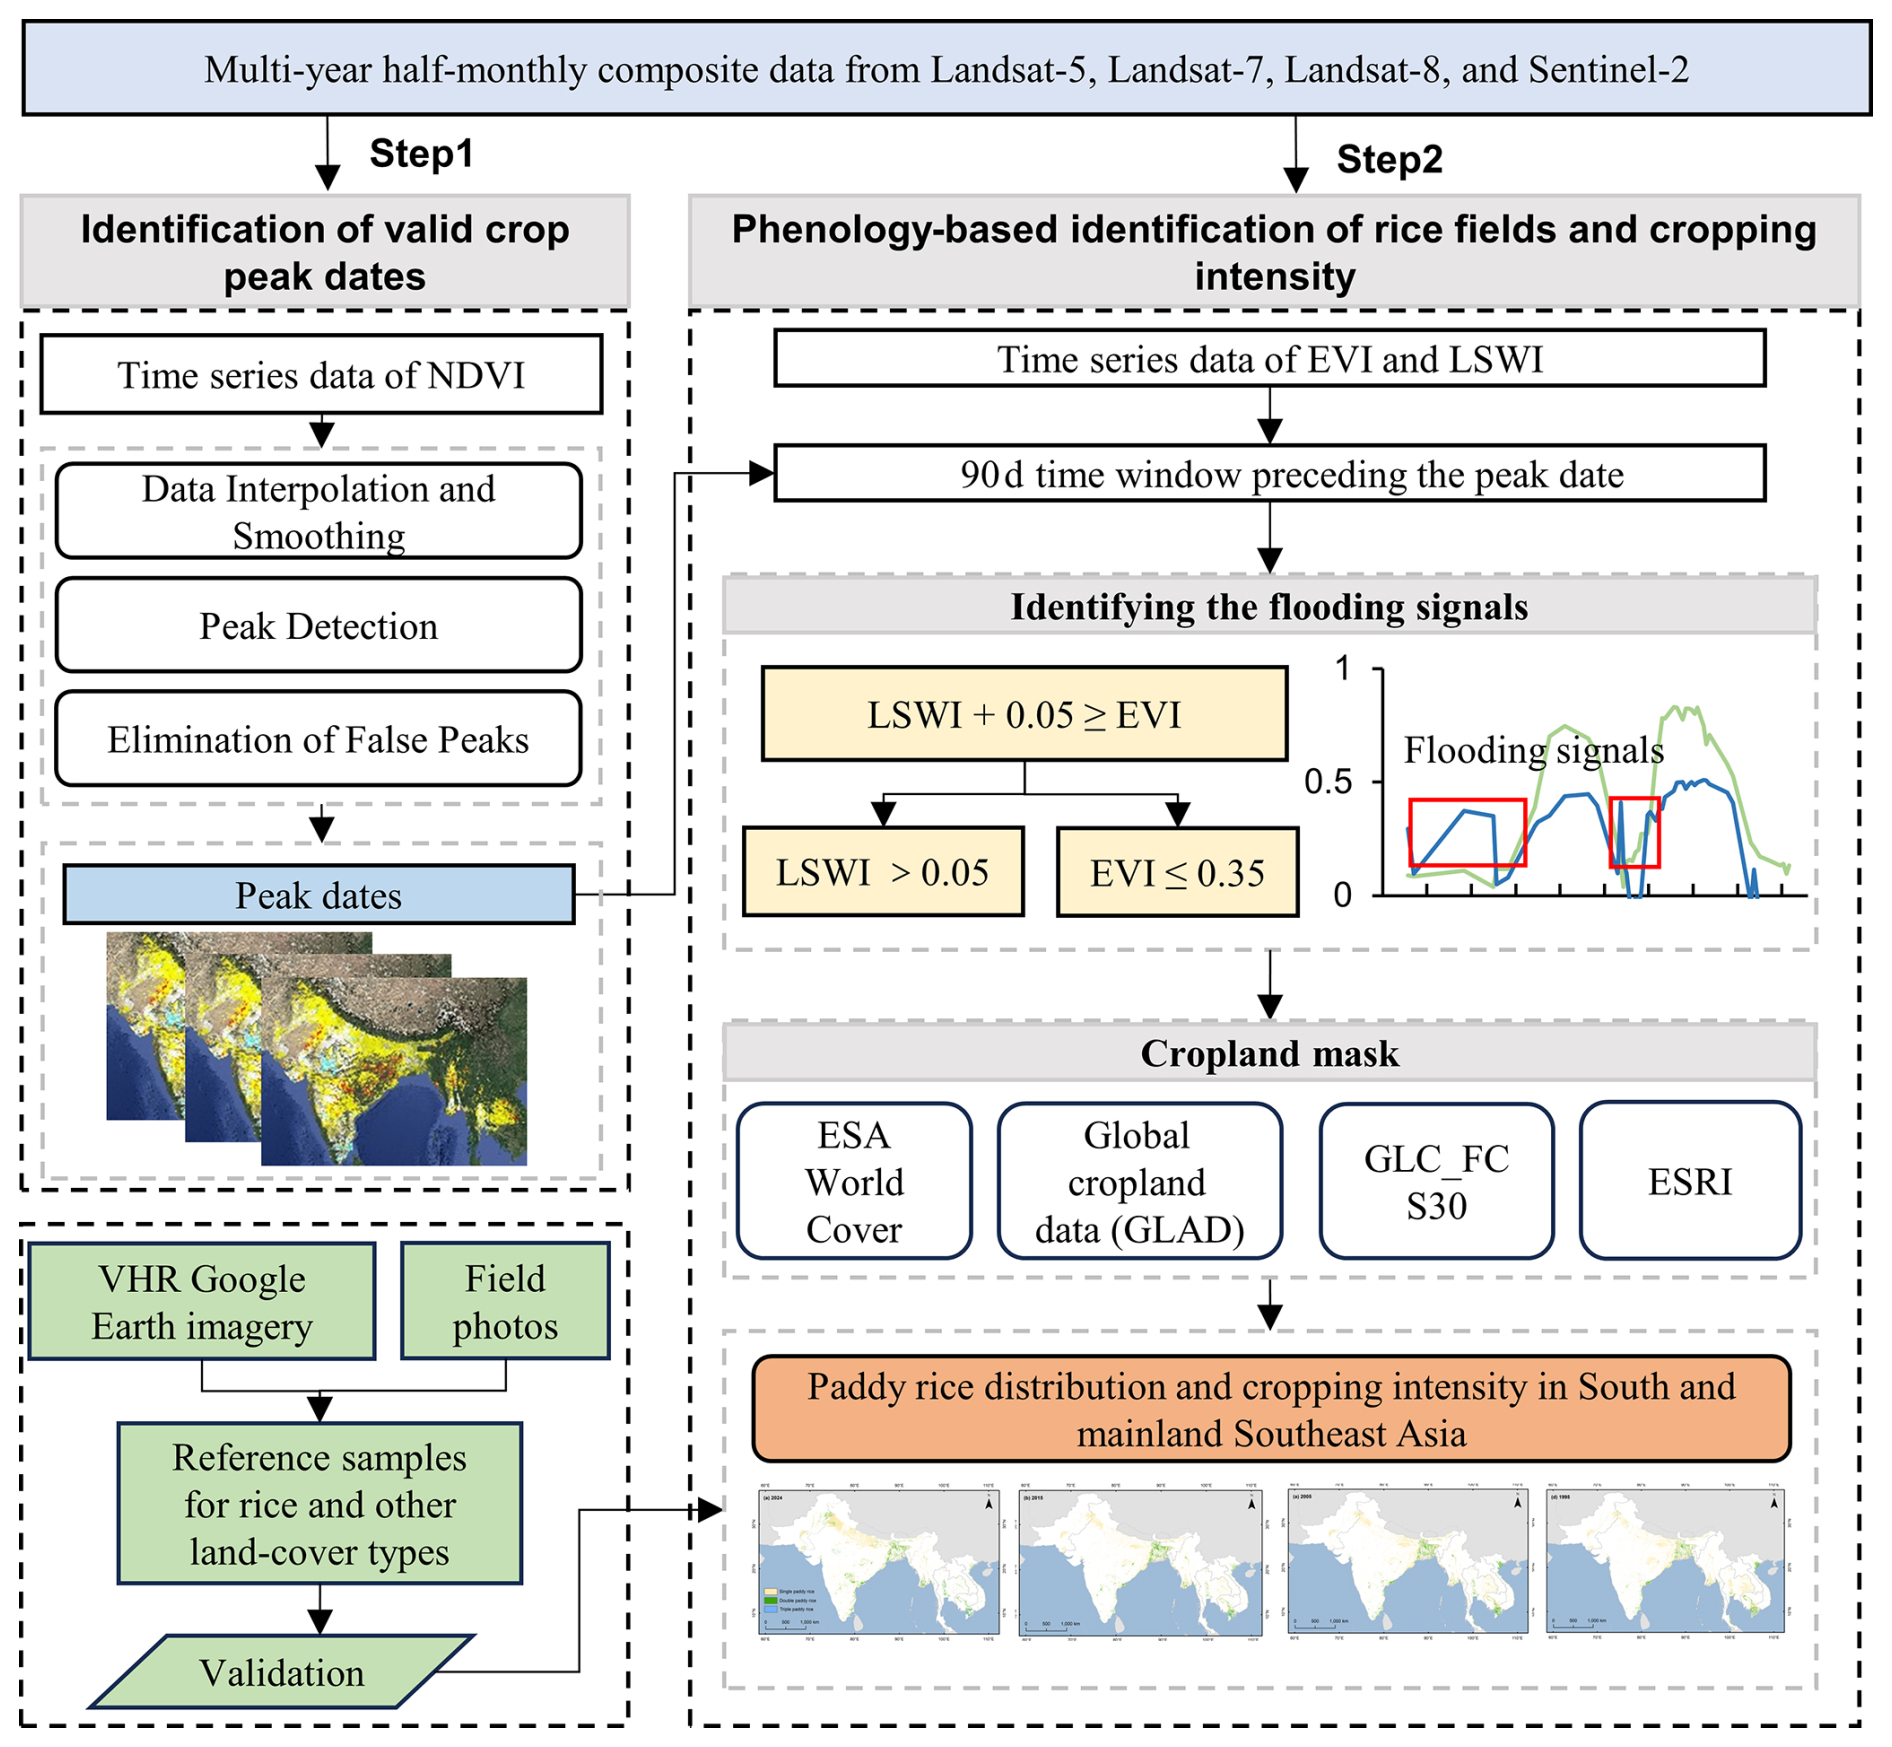
Figure 2Flowchart of the mapping process for long-term rice spatial distribution and cropping intensity in South and mainland Southeast Asia.
Data Interpolation and Smoothing. First, using the half-monthly composite imagery and derived vegetation indices, NDVI outliers were removed based on the mean and three standard deviations. Linear interpolation was then applied to fill gaps in the time series of LSWI and NDVI. Subsequently, the NDVI time series was smoothed using the Whittaker smoothing algorithm with a smoothing parameter λ=300 (see the Supplement for details on the selection of the λ threshold) to generate a smoothed time series.
Peak Detection. Peak detection was achieved by identifying local maxima and minima through iterative analysis of the smoothed NDVI time-series curves. Specifically, each NDVI value was compared with its preceding value to determine an increasing or decreasing trend. A point was recorded as a peak (local maximum) when the NDVI transitioned from an increasing to a decreasing trend. Conversely, a point was recorded as a trough (local minimum) when the NDVI shifted from a decreasing to an increasing trend.
Elimination of False Peaks. To detect and filter phenological peaks, we employed a method based on LSWI and NDVI time series that identifies true phenological peaks while excluding false peaks caused by noise or non-vegetation signals, thereby ensuring robust cycle detection. A complete crop growth cycle was decomposed into one peak and two troughs (Yang et al., 2023). The first criterion required that the NDVI amplitude of the right trough, relative to the annual maximum amplitude, exceed 35 %. Second, the NDVI value at the right trough had to fall below the NDVI threshold (NDVIthld), calculated according to Eq. (4). In addition, the time span between the left and right troughs had to exceed 120 d to ensure that the cycle represented a biologically reasonable rice-growing season in South and mainland Southeast Asia. Each growth cycle meeting these criteria was recorded, including the peak dates (day of year, DOY), while all other signals were discarded as noise.
where NDVIthld is the NDVI threshold, NDVImin is the minimum NDVI value within the considered period, and NDVImax is the maximum NDVI value within the considered period.
2.3.2 Phenology-based approach for identifying rice fields and their cropping intensity
The phenology-based rice mapping method identifies rice by detecting the unique biophysical characteristic of fields being flooded during the transplanting period. In this study, we first selected imagery data within a 90 d time window preceding the peak date of each growing season. Subsequently, flood signal detection was performed on the imagery data within this time window by applying the rule LSWI EVI (Xiao et al., 2005; Xiao et al., 2006; Dong and Xiao, 2016). Notably, the LSWI and EVI used here differ from those employed in crop peak identification, as these vegetation indices (VIs) do not require smoothing. Additionally, to minimize interference from factors such as precipitation and soil background effects, we applied the rule that, when a flood signal is detected, EVI must be ≤0.35 and LSWI must be >0.05 (Zhao et al., 2025). Pixels meeting these conditions were classified as rice (pixel value =1).
For rice cropping intensity, we integrated multi-season rice detections by calculating the number of valid rice-cropping cycles identified for each pixel within the corresponding composite-period time series. This process generated the final composite-period rice cropping-intensity map, with values ranging from 1 to 3, representing single-, double-, or triple-season rice detected within the composite period, respectively.
2.4 Confidence layer generation
Optical-based rice mapping is often affected by cloud contamination, which reduces the availability of valid observations during critical phenological stages. To support downstream applications and provide an estimate of data reliability, an observation-based confidence layer was generated. For each pixel, the number of valid observations used in the time-series analysis was calculated within the 90 d temporal window preceding the identified crop peak. Pixels with more valid observations generally provide more reliable phenological signals for rice detection; therefore, the observation frequency was used as a proxy for mapping confidence. The observation count was further normalized by the total number of compositing intervals to produce a confidence score ranging from 0 to 1.
where Nobs represents the number of valid observations within the 90 d window before the detected crop peak, and Nmax is the total number of compositing intervals in that window.
2.5 Accuracy assessment and comparisons
2.5.1 Validation samples
Validation samples for 2024 were primarily derived through visual interpretation using multiple complementary data sources. First, false-color composites of Sentinel-2 imagery (R/G/B = SWIR1, NIR, Red) were generated to represent different rice growth stages, in which rice fields during the flooded transplanting period typically appear dark green. Second, following the approach of Sun et al. (2023), Sentinel-1 VH time series were used to calculate the maximum, minimum, and variance values, which were combined into RGB composites (R: VH_max, G: VH_min, B: VH_variance). In these composites, flooded rice fields generally appeared purple, providing an effective means of identifying rice in persistently cloudy and rainy tropical regions. An example of this visualization approach has been implemented and is available at the following link: https://code.earthengine.google.com/7dd210998c6812da2e79ebebc1536822 (last access: 13 July 2026).
Based on these two sets of composites, rice sample points were manually labeled and further cross-validated using ultra-high-resolution Google Earth imagery and the Global Geo-Referenced Field Photo Library (Xiao et al., 2011). In total, 4000 rice samples were collected across the study area. For the remaining 4000 non-rice samples, random sampling was first conducted within the study area, and each point was then visually verified using the same image composites to ensure the absence of rice-related features.
Although the above approach was effective for sample generation, manually labeling samples for periods before the launch of Sentinel-1 and Sentinel-2 satellites was labor-intensive and constrained by the limited availability of valid imagery. Therefore, a sample migration algorithm (Huang et al., 2020) was employed to transfer the 8000 manually labeled samples to other target years. To ensure the reliability of the validation results, an additional set of 2371 validation samples was independently generated through manual visual interpretation for the 1995, 2005, and 2015 nominal reference-year products. These samples were used solely for independent accuracy assessment, and the corresponding validation results are presented in the Supplement (Table S1).
2.5.2 Rice products and statistical data
To evaluate the reliability of our mapping results, we conducted spatial comparisons with several established rice mapping products, including the JAXA High-Resolution Land-Use and Land-Cover Map (2020 Vietnam and 2023 Southeast Asia products; https://www.eorc.jaxa.jp/ALOS/en/dataset/lulc_e.htm, last access: 13 July 2026), the long-term paddy rice dataset of Li et al. (2025), the rice mapping product of Sun et al. (2023), NESEA-Rice10 (Han et al., 2021), and Open-SEA-Rice-10 (Ginting et al., 2025). These comparisons allowed us to assess the spatial consistency and cropping intensity agreement across products. In addition, national-level statistical data from the Food and Agriculture Organization (FAO) were employed to evaluate the consistency between mapped rice areas and official statistical records.
3.1 Accuracy assessment of paddy rice mapping in South and mainland Southeast Asia
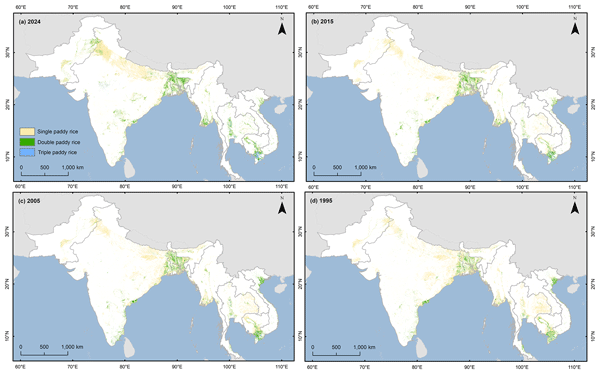
The spatial distribution and cropping intensity of rice across South and mainland Southeast Asia are illustrated in Fig. 3. An interactive version of this map is available on the GEE platform at: https://ee-zhaozizhangcau.projects.earthengine.app/view/rice-planting-intensity--south--southeast-asia (last access: 14 July 2026) (Zhao et al., 2026).
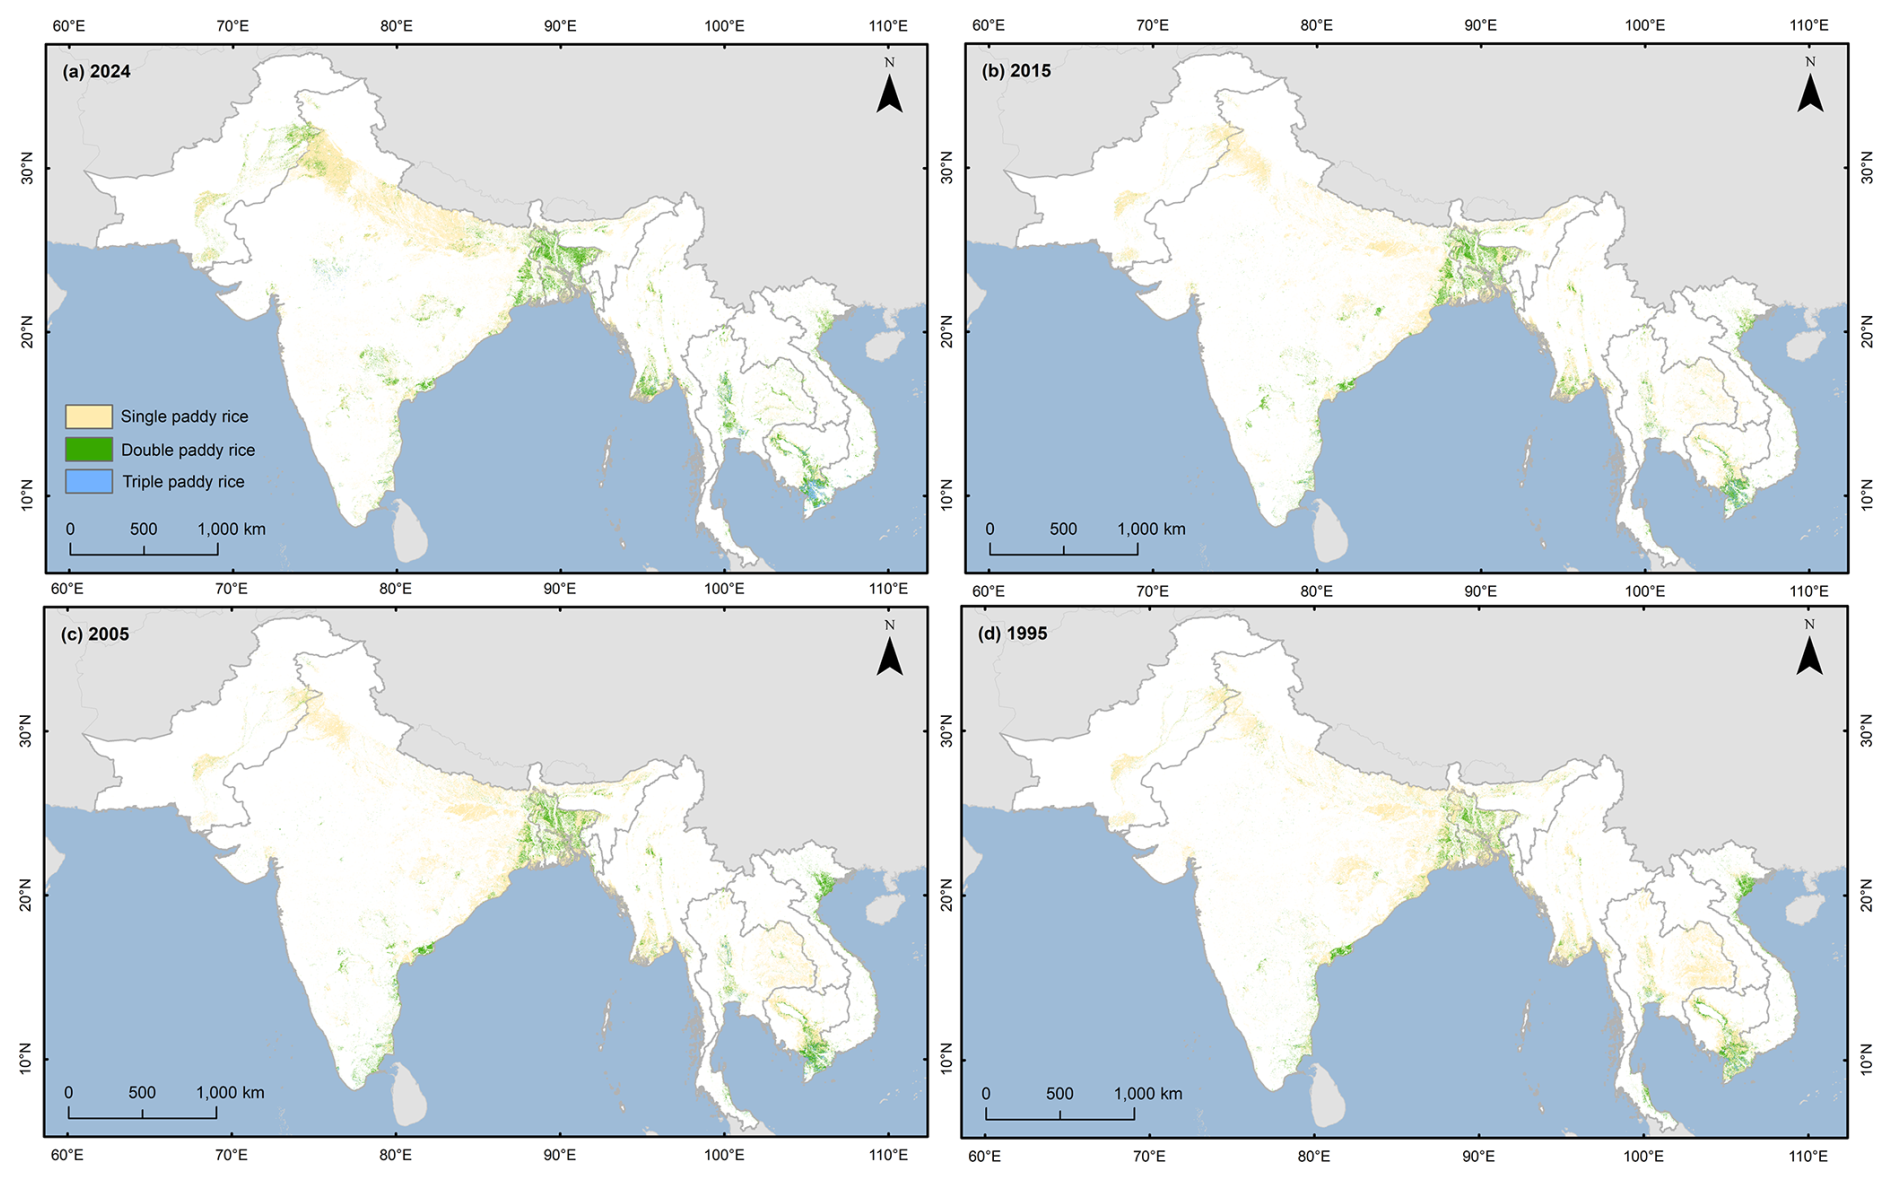
Figure 3Multi-year composite rice distribution and cropping-intensity products for South and mainland Southeast Asia, represented by the nominal reference years 1995, 2005, 2015, and 2024.
Based on validation using 23 396 sample points, the mapping accuracies for the four nominal reference-year composite products are summarized in Table 3, with overall accuracies ranging from 83.74 % to 87.60 % and F1-scores between 0.7872 and 0.8628. The 2024 results achieved the highest accuracy, primarily because the higher temporal frequency of Sentinel-2 observations enabled more effective detection of flooding signals than was possible with the earlier Landsat sensors. Mapping accuracies for the other nominal reference-year products did not show a declining trend over time, mainly due to the aggregation of multi-year image archives and the use of half-monthly composite imagery, which stabilized rice extraction performance. Although Landsat-8 data were incorporated for the 2015 (2014–2016) period, residual striping effects from Landsat-7 imagery slightly degraded the classification accuracy.
Table 3Accuracy assessment of paddy rice mapping results in South and mainland Southeast Asia.

To further evaluate the accuracy of our results, we compared the estimated rice area from our generated rice products with FAO statistical data (Fig. 4). The results showed that the R2 values for all four years exceeded 0.9, with a multi-year average RMSE of approximately 4.15×10⁶ ha. Based on the remote-sensing estimates, the mapped rice area across South and mainland Southeast Asian countries increased by approximately 22.5×10⁶ ha since the 1990s, with the largest increases observed in India and Bangladesh. However, we note that the total rice area in the early years may have been underestimated due to limited valid observations and data constraints. Among the four nominal reference years, the 2024 product showed the smallest discrepancy with FAO statistics. In Bangladesh, the remote-sensing estimates were relatively lower, potentially due to the influence of frequent flooding and cloud cover in the region.
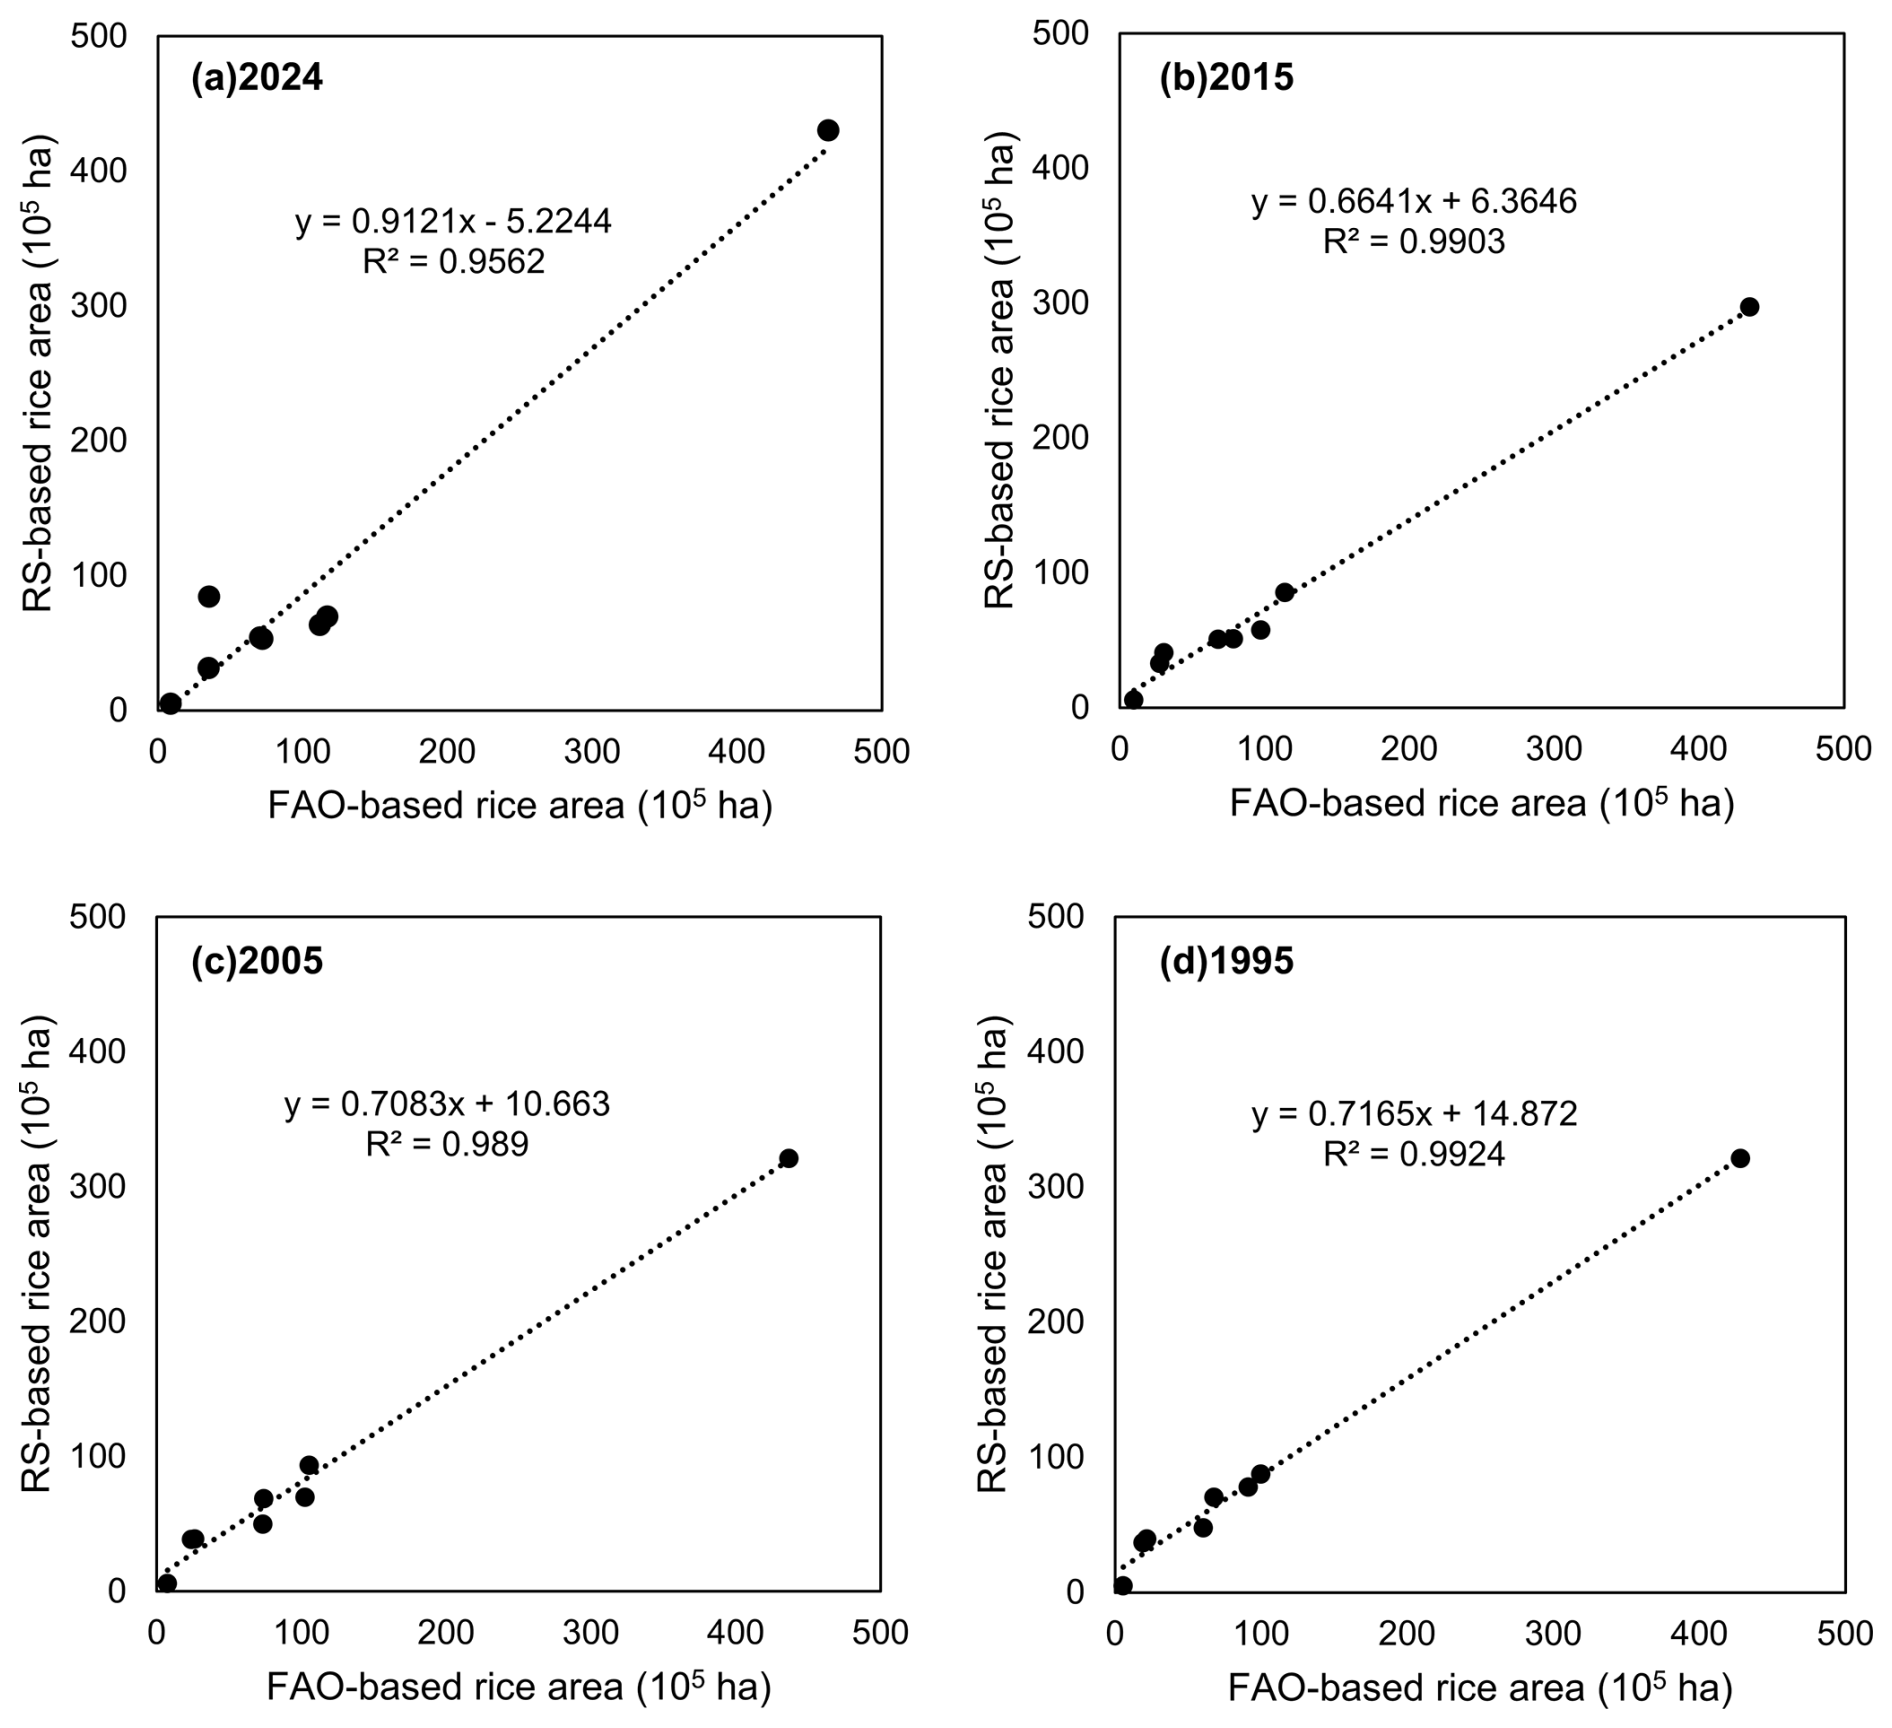
Figure 4Comparison of RS-based rice area estimates with FAO statistics for South and mainland Southeast Asia (1995, 2005, 2015, 2024).
3.2 Comparison with other rice maps
We selected several typical rice-growing areas within the study region for visual comparison with other rice mapping products. In Vietnam, our results were compared with the JAXA land-cover product, including its rice layer, and showed high spatial consistency across multiple years (Fig. S1 in the Supplement). In addition, our mapped rice distribution exhibited good spatial correspondence with rice patterns derived from Sentinel-1 observations (Fig. S2).
For India in 2024, the spatial distribution of rice in our product was generally consistent with that reported by Li et al. (2025) (Fig. 5). However, for the 1995 mapping of Punjab and other northern Indian regions, Li's results were visibly affected by limited observation availability, resulting in strip-like artifacts. In contrast, our multi-year compositing approach largely mitigated this issue. In particular, rice pixels identified in our product showed higher spatial agreement with dark-green areas in Landsat false-color composites, which indicate flooding signals during the transplanting stage.
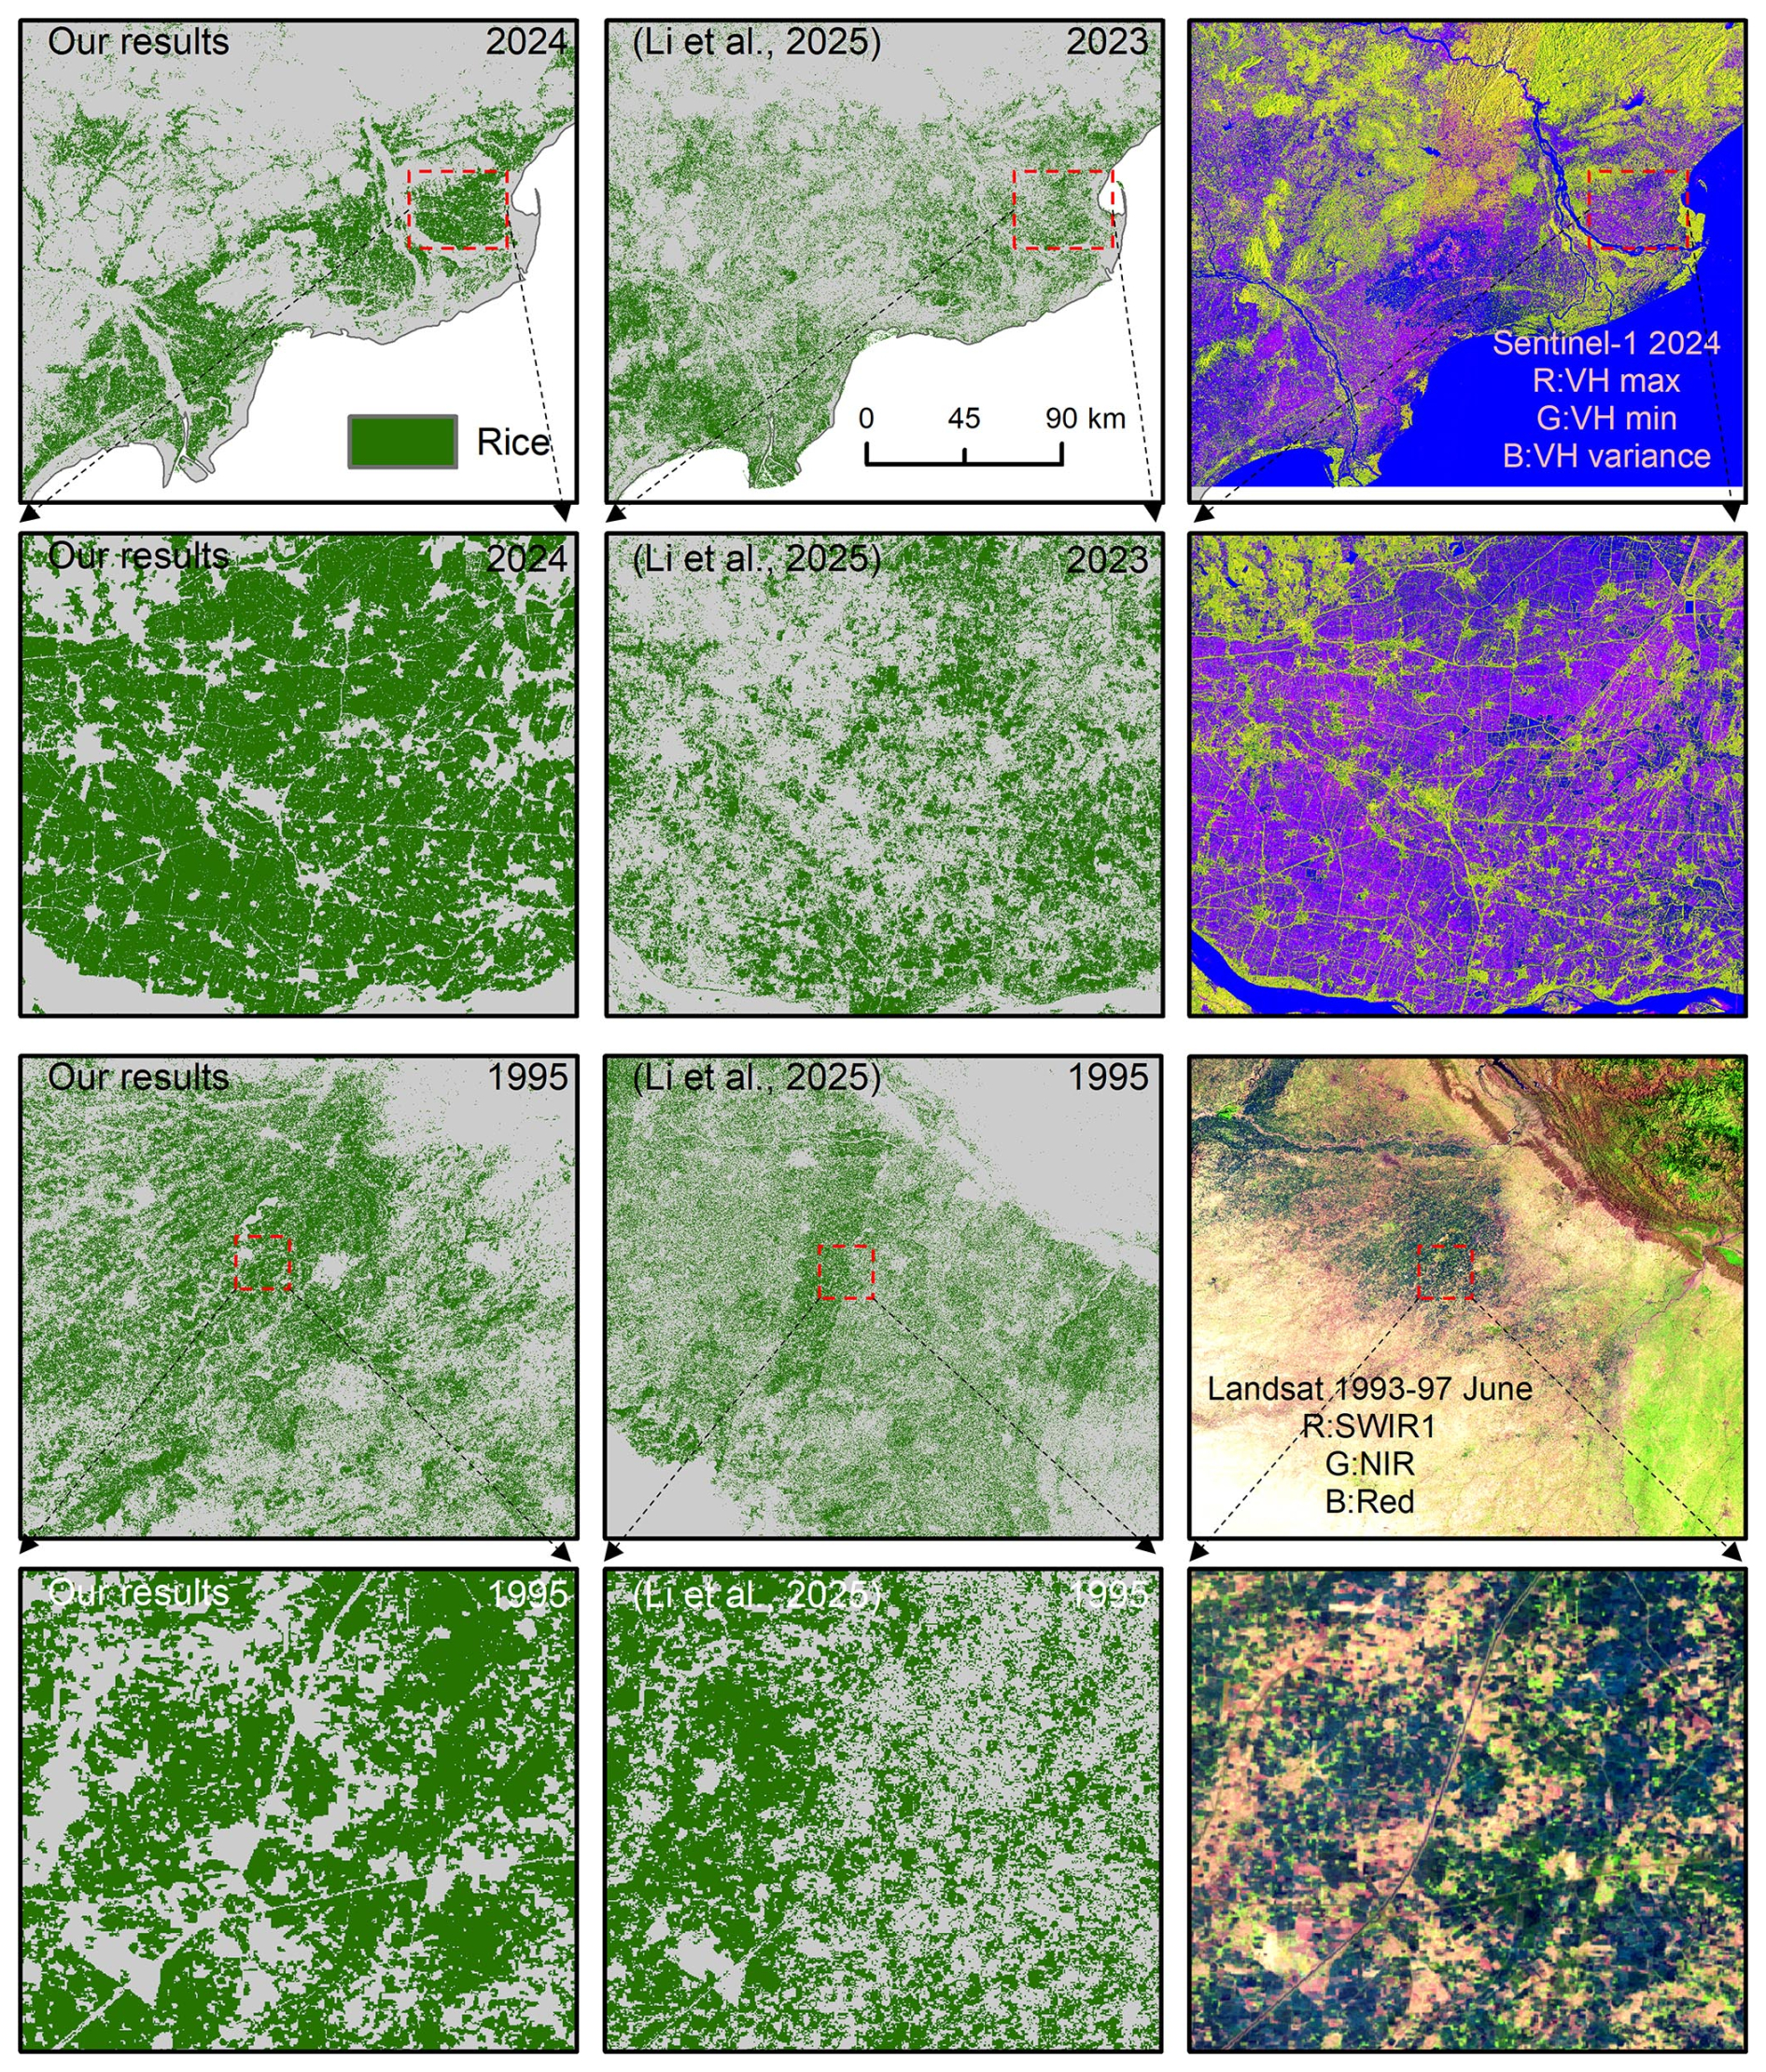
Figure 5Comparison of rice distribution maps in South Asia between this study and Li et al. (2025). The comparison includes this study's 2024 and 1995 products, Li et al.'s 2023 and 1995 products, and corresponding Sentinel-1 and Landsat false-color composites.
Notably, Fig. 6 presents a spatial comparison of five rice mapping products across Southeast Asia, including our results. Among them, products (a1), (b1), and (e1) exhibit relatively similar spatial distributions, whereas the NESEA-Rice10 product captures the smallest rice extent. In contrast, (c1) and (d1) identified a greater number of rice pixels, particularly in central–eastern Thailand, where both products detected extensive rice areas. We attribute these differences mainly to the distinct responses of irrigated (paddy) and rainfed rice systems. The (e2) panel, derived from the JAXA LULC dataset, provides supporting evidence for this interpretation, as it delineates these regions predominantly as paddy fields (see Sect. 4.1 for further discussion). Additional pixel-level visual comparisons are provided in Fig. S3.
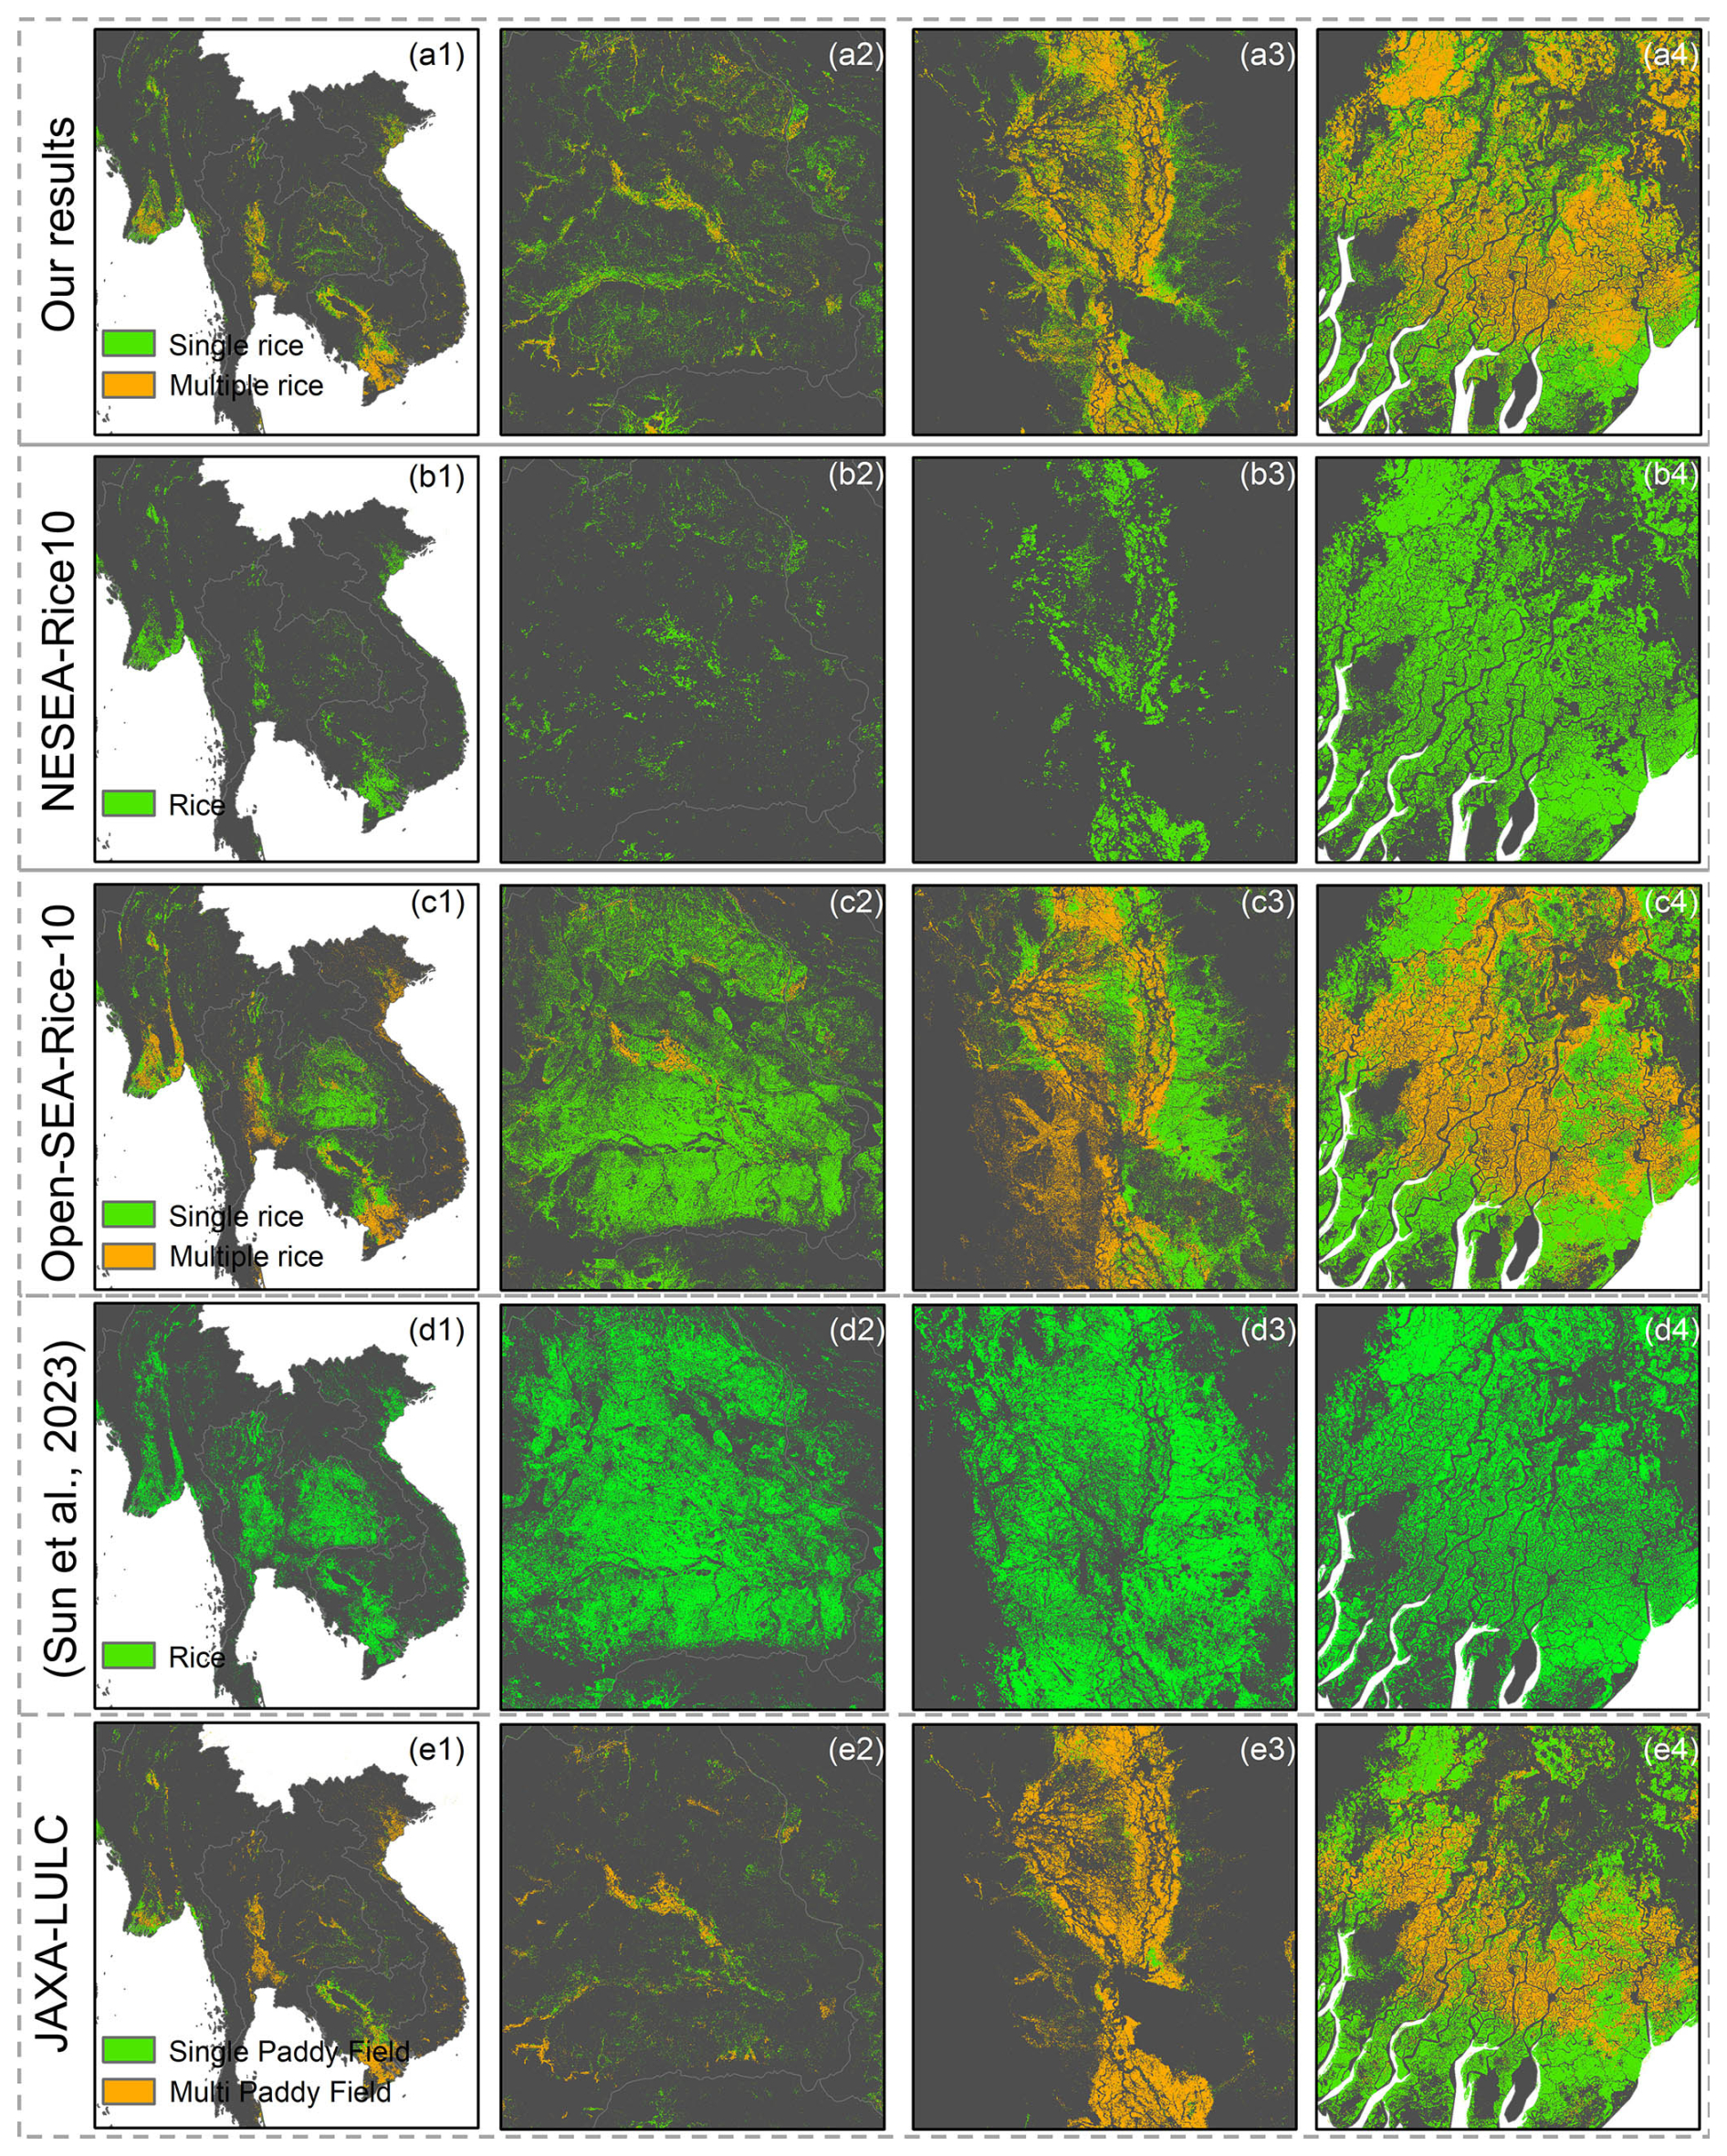
Figure 6Comparison of single- and multiple-season rice maps across Southeast Asia. Panels (a1)–(a4) display results from this study, (b1)–(b4) from NESEA-Rice10, (c1)–(c4) from Open-SEA-Rice-10, and (d1)–(d4) from Sun et al. (2023). Panels (e1)–(e4) show JAXA-LULC data, retaining the original land cover classifications of Single Paddy Field and Multi Paddy Field.
Panels (a3)–(e3) illustrate the rice-growing regions in western Thailand, where three intensity-based products consistently identified multi-season rice cultivation. However, the (c3) product shows clear image boundary artifacts, likely due to inconsistencies in image mosaicking. Spatially, the (b3) product, which was derived from a single-year dataset, identified a smaller extent of rice cultivation, while the (d3) product appears to have overestimated rice coverage. In contrast, along the moisture-rich coastal areas of Myanmar, all products exhibited relatively consistent spatial patterns with minimal discrepancies.
3.3 Spatial patterns and long-term changes in rice cultivation during 1995–2024
In South and mainland Southeast Asia, rice is predominantly distributed in plains and riverine areas with abundant freshwater resources. Between the 1995 and 2024 composite-period products, mapped rice areas showed an expansion trend, primarily in central-western India and Pakistan (Fig. 3). Rice cropping intensity is dominated by double- and single-season rice (this study's statistics focus solely on rice cropping intensity, excluding other crops). The Mekong Delta region in Vietnam is predominantly characterized by triple rice cultivation.
Based on the analysis of Figs. 3 and 7, substantial changes in rice cultivation patterns have occurred across South and mainland Southeast Asia over the past three decades. In these regions, intensification within existing rice croplands (manifested as increased cropping intensity in stable areas) has become a more prevalent trend than the expansion of rice-growing areas. For instance, regions previously dominated by single-cropping systems, such as southern Thailand, have transitioned toward double-cropping regimes. Likewise, northern Pakistan and eastern India have shown a pronounced increase in rice cropping intensity. In contrast, the Mekong Delta has experienced a shift from double- to triple-cropping systems. Areas with reduced rice extent are primarily associated with cropland degradation or conversion to other crops rather than a decline in cropping intensity. The most notable reductions are concentrated in eastern Thailand and the southern Mekong Delta estuary, corresponding respectively to shifts from irrigated to rainfed systems and a loss of arable land.
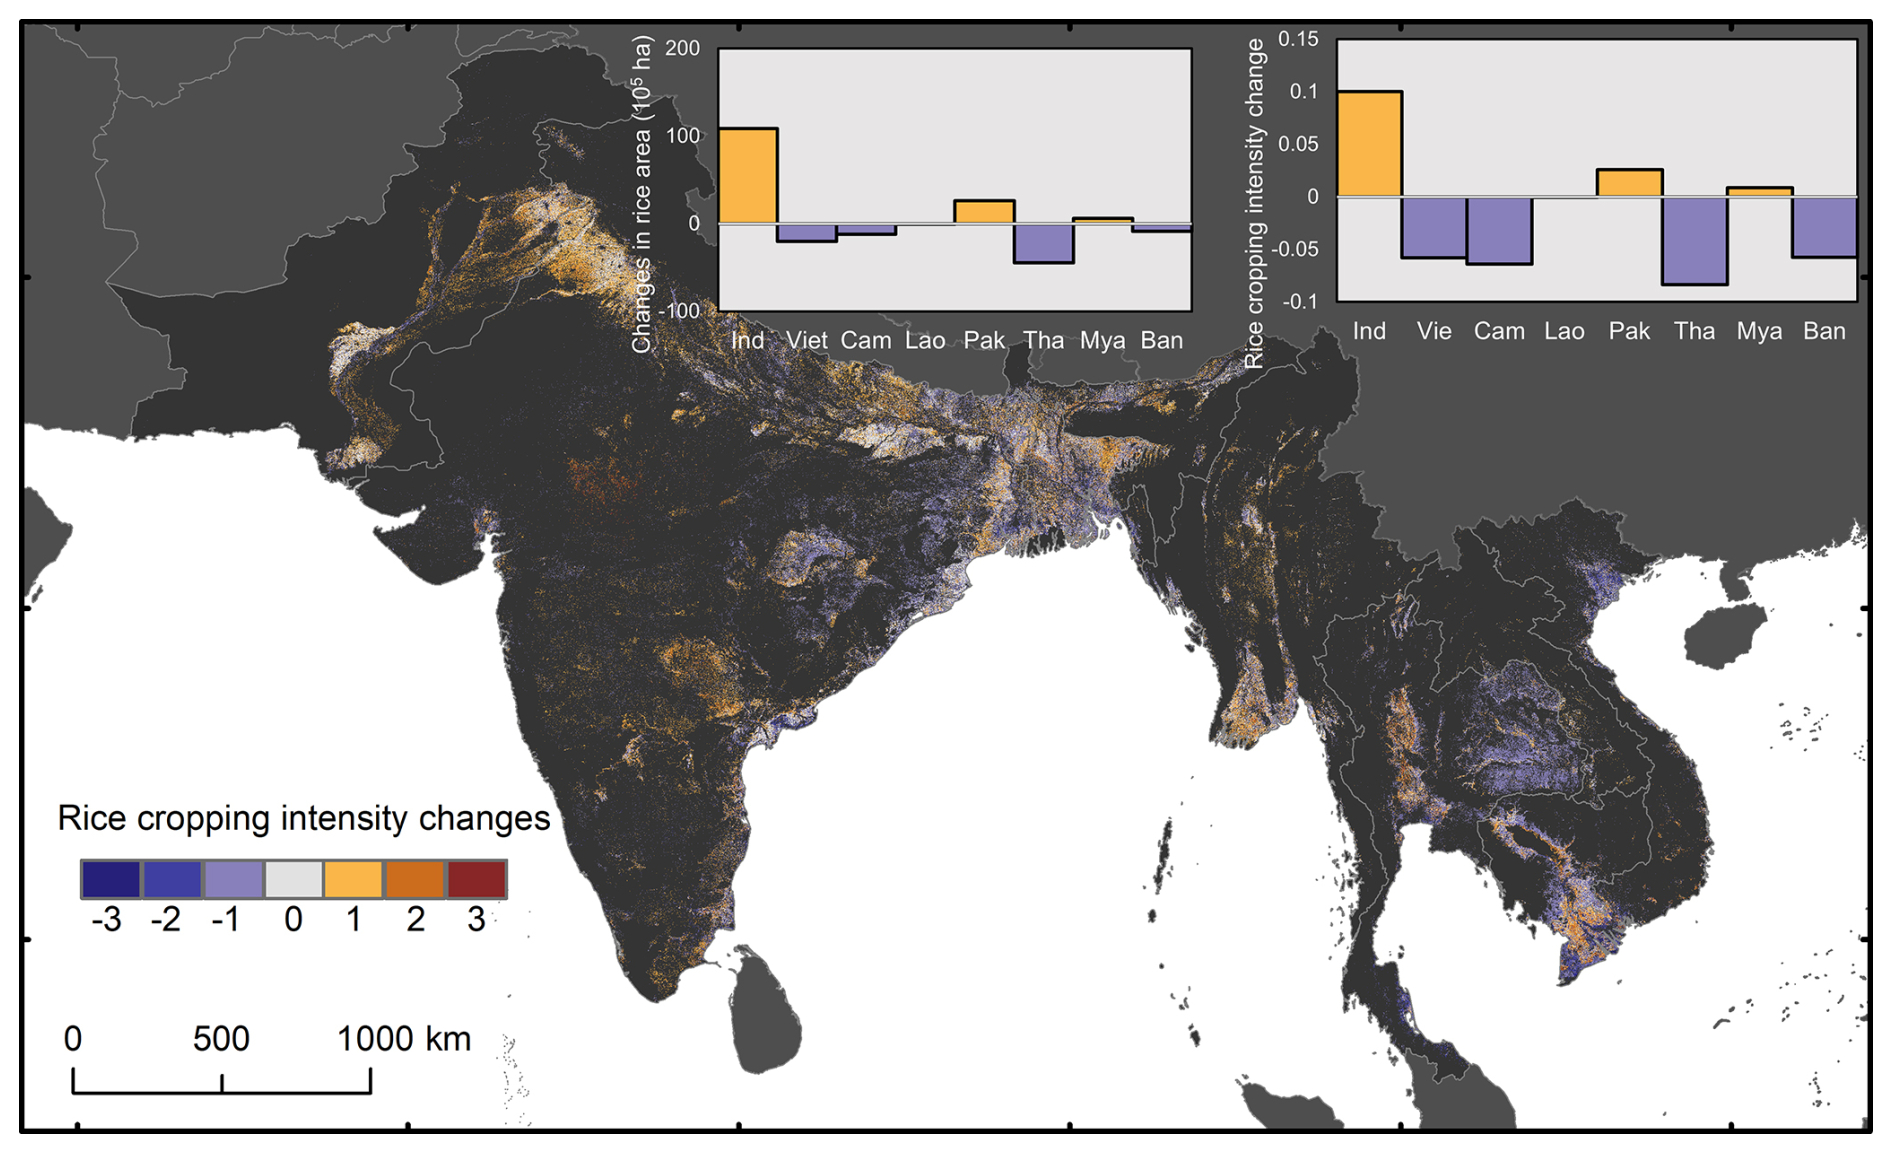
Figure 7Spatial distribution and cropping-intensity changes of paddy rice in South and mainland Southeast Asia (1995–2024). Positive values indicate increased cropping intensity or spatial expansion of paddy rice, whereas negative values indicate decreased cropping intensity or spatial contraction of paddy rice. Gray indicates stable rice areas. Insets show national-level changes in mapped rice area and mean cropping intensity.
As shown in Fig. 7, we further quantified changes in rice cultivation area and mean cropping intensity at the national scale. Among all countries, India exhibited the most substantial expansion in rice cultivation area, whereas most Southeast Asian countries experienced a general decline over the past three decades. In terms of cropping intensity, India showed an average increase of approximately 0.1, whereas most Southeast Asian countries showed slight decreases, generally around 0.05 in mean cropping intensity. Together with the mapped area changes, these results suggest intensified rice cultivation in South Asia and localized rice-area contraction in parts of Southeast Asia.
4.1 Differences between rainfed and irrigated rice
In the product comparison, substantial discrepancies among rice mapping products were observed in central–western Thailand. To investigate the underlying causes, we analyzed the time-series profiles of selected sample points over three consecutive years using the JAXA land-cover product, our phenology-based rice maps, and the Open-SEA-Rice-10 dataset (Fig. 8).
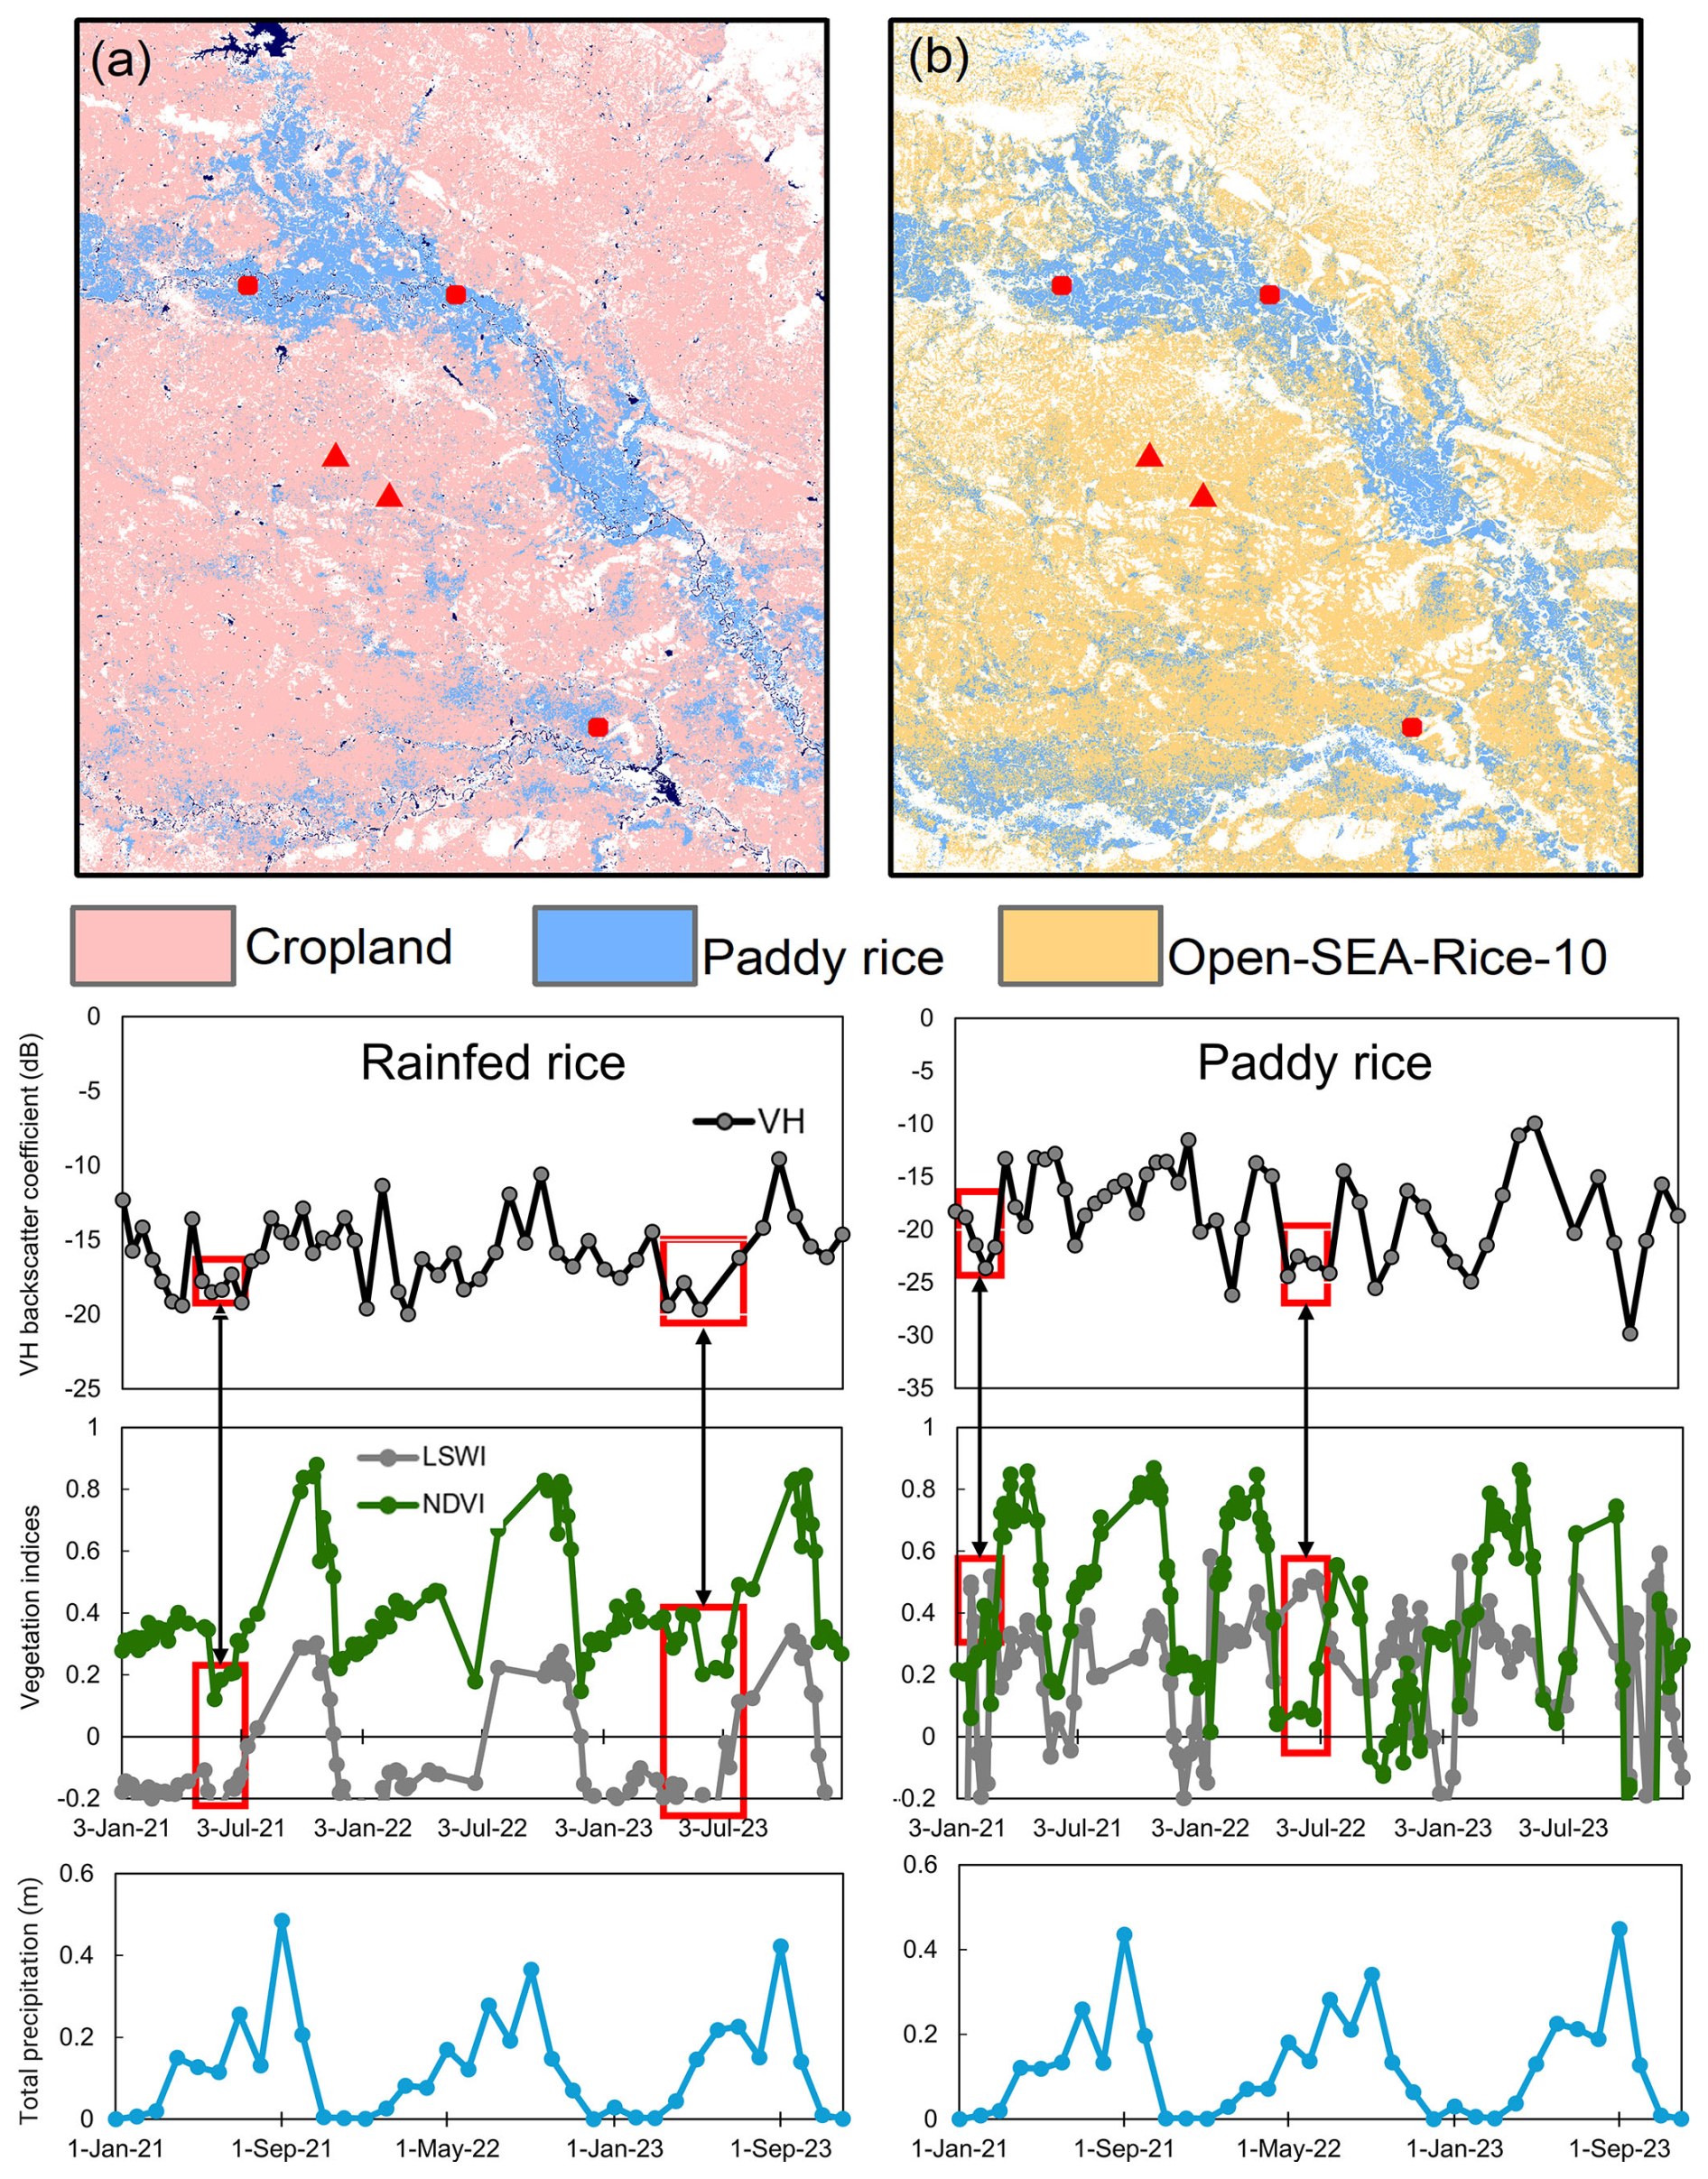
Figure 8Spatial comparison and time-series analysis of vegetation indices, VH backscatter, and total precipitation between rainfed and irrigated (paddy) rice in Thailand. (a) JAXA land-cover product, where pink represents non-paddy croplands and blue indicates paddy fields. (b) Comparison between the Open-SEA-Rice-10 dataset (orange) and this study's paddy rice product (blue; overlaid on orange). Red circles and triangles indicate the selected sample pixels for paddy rice and rainfed rice, respectively. The lower panels show the corresponding time-series curves for rainfed and paddy rice.
From the optical time series, it is evident that rainfed rice fields do not maintain stable surface water coverage during the transplanting stage. Consequently, they often fail to produce a clear flooding signal, because LSWI does not consistently approach or exceed EVI or NDVI during the transplanting period. This explains why our optical-based approach and other similar methods tend to identify fewer rice pixels compared with the radar-based products shown in Fig. 6.
By contrast, radar observations capture a distinct VH backscatter trough, indicating an increase in soil moisture that alters the soil dielectric constant. As crop growth progresses, VH backscatter gradually rises, resulting in large VH time series variations. This characteristic enables SAR-based methods to better detect rainfed rice, even in areas without persistent standing water. Moreover, these VH minima typically coincide with the onset of the monsoon season, marking the beginning of the rice growth cycle (Fig. 8).
For irrigated rice, each valid cropping cycle is usually accompanied by a strong flooding signal that can be effectively captured by water-sensitive optical indices (e.g., combinations of SWIR, Red, or Green bands; Zhao et al., 2025). In radar observations, paddy fields exhibit deeper VH troughs than rainfed fields, and the subsequent increase after the trough (rice growing stage) reflects higher canopy water content (VWC) and a stronger dielectric response, which amplifies VH time series variations. Unlike rainfed rice, the timing of irrigated rice cultivation is typically decoupled from monsoon onset, owing to irrigation management.
However, we also note a potential source of misclassification when relying solely on Sentinel-1 VH backscatter for rice mapping, especially in temperate regions outside tropical zones. Although radar-based algorithms perform well in persistently cloudy and humid environments, our previous findings indicate that several non-rice crops (both rainfed and irrigated, such as maize and soybean) can exhibit amplitude variations comparable to those of paddy rice (Zhao et al., 2024). Consequently, such V-shaped radar signatures are not unique to rainfed or paddy rice, but rather represent a general biophysical response to canopy development and surface moisture dynamics.
4.2 Advantages of the proposed product
Recent advances in remote sensing have produced numerous high-accuracy rice mapping algorithms (Deng et al., 2025). However, their application to long-term, large-scale mapping remains constrained by data availability and computational demands. For instance, although SAR can effectively improve mapping accuracy (Adrian et al., 2021), its use is limited in earlier periods due to the absence of Sentinel-1 observations. In addition, the computational complexity of large-scale mapping remains a considerable challenge, even when implemented on cloud-based platforms such as Google Earth Engine.
To overcome these challenges, this study employs a streamlined phenology-based rice mapping framework specifically optimized for the biophysical and climatic conditions of South and Southeast Asia. Instead of extracting detailed phenological phases (e.g., tillering or harvest), the method focuses on detecting key phenological peaks, providing a robust solution under conditions of high cropping intensity, short intervals between multiple rice cycles, and persistent monsoon-related cloud cover. For instance, in the Mekong Delta, the interval between two consecutive rice seasons can be shorter than 15 d (Fig. S4), meaning that even a slight temporal offset in detecting the flooded transplanting stage may cause the short-lived flooding signal to be missed. Thus, identifying phenological peaks offers a more reliable and practical strategy than full-season tracking using Landsat imagery.
Multi-year image compositing also affects the mapping results. As shown in the comparison with NESEA-Rice10 (Fig. 6), although both studies employ flooding-signal-based approaches, our results identify a larger number of rice pixels in some regions, mainly due to the increased availability of valid observations. This effect is particularly evident for the 1990s. As illustrated in Fig. 9, rice maps derived from single-year imagery show pronounced spatial instability, especially for 1995, owing to severe limitations in observation frequency. In contrast, the five-year composite produces a more spatially coherent and stable rice distribution. Under such data-limited conditions, the uncertainty associated with single-year mapping may exceed the potential smoothing effect introduced by multi-year compositing. The temporal representativeness and uncertainty of the five-year composite products are further quantified and discussed in Sect. 4.3.
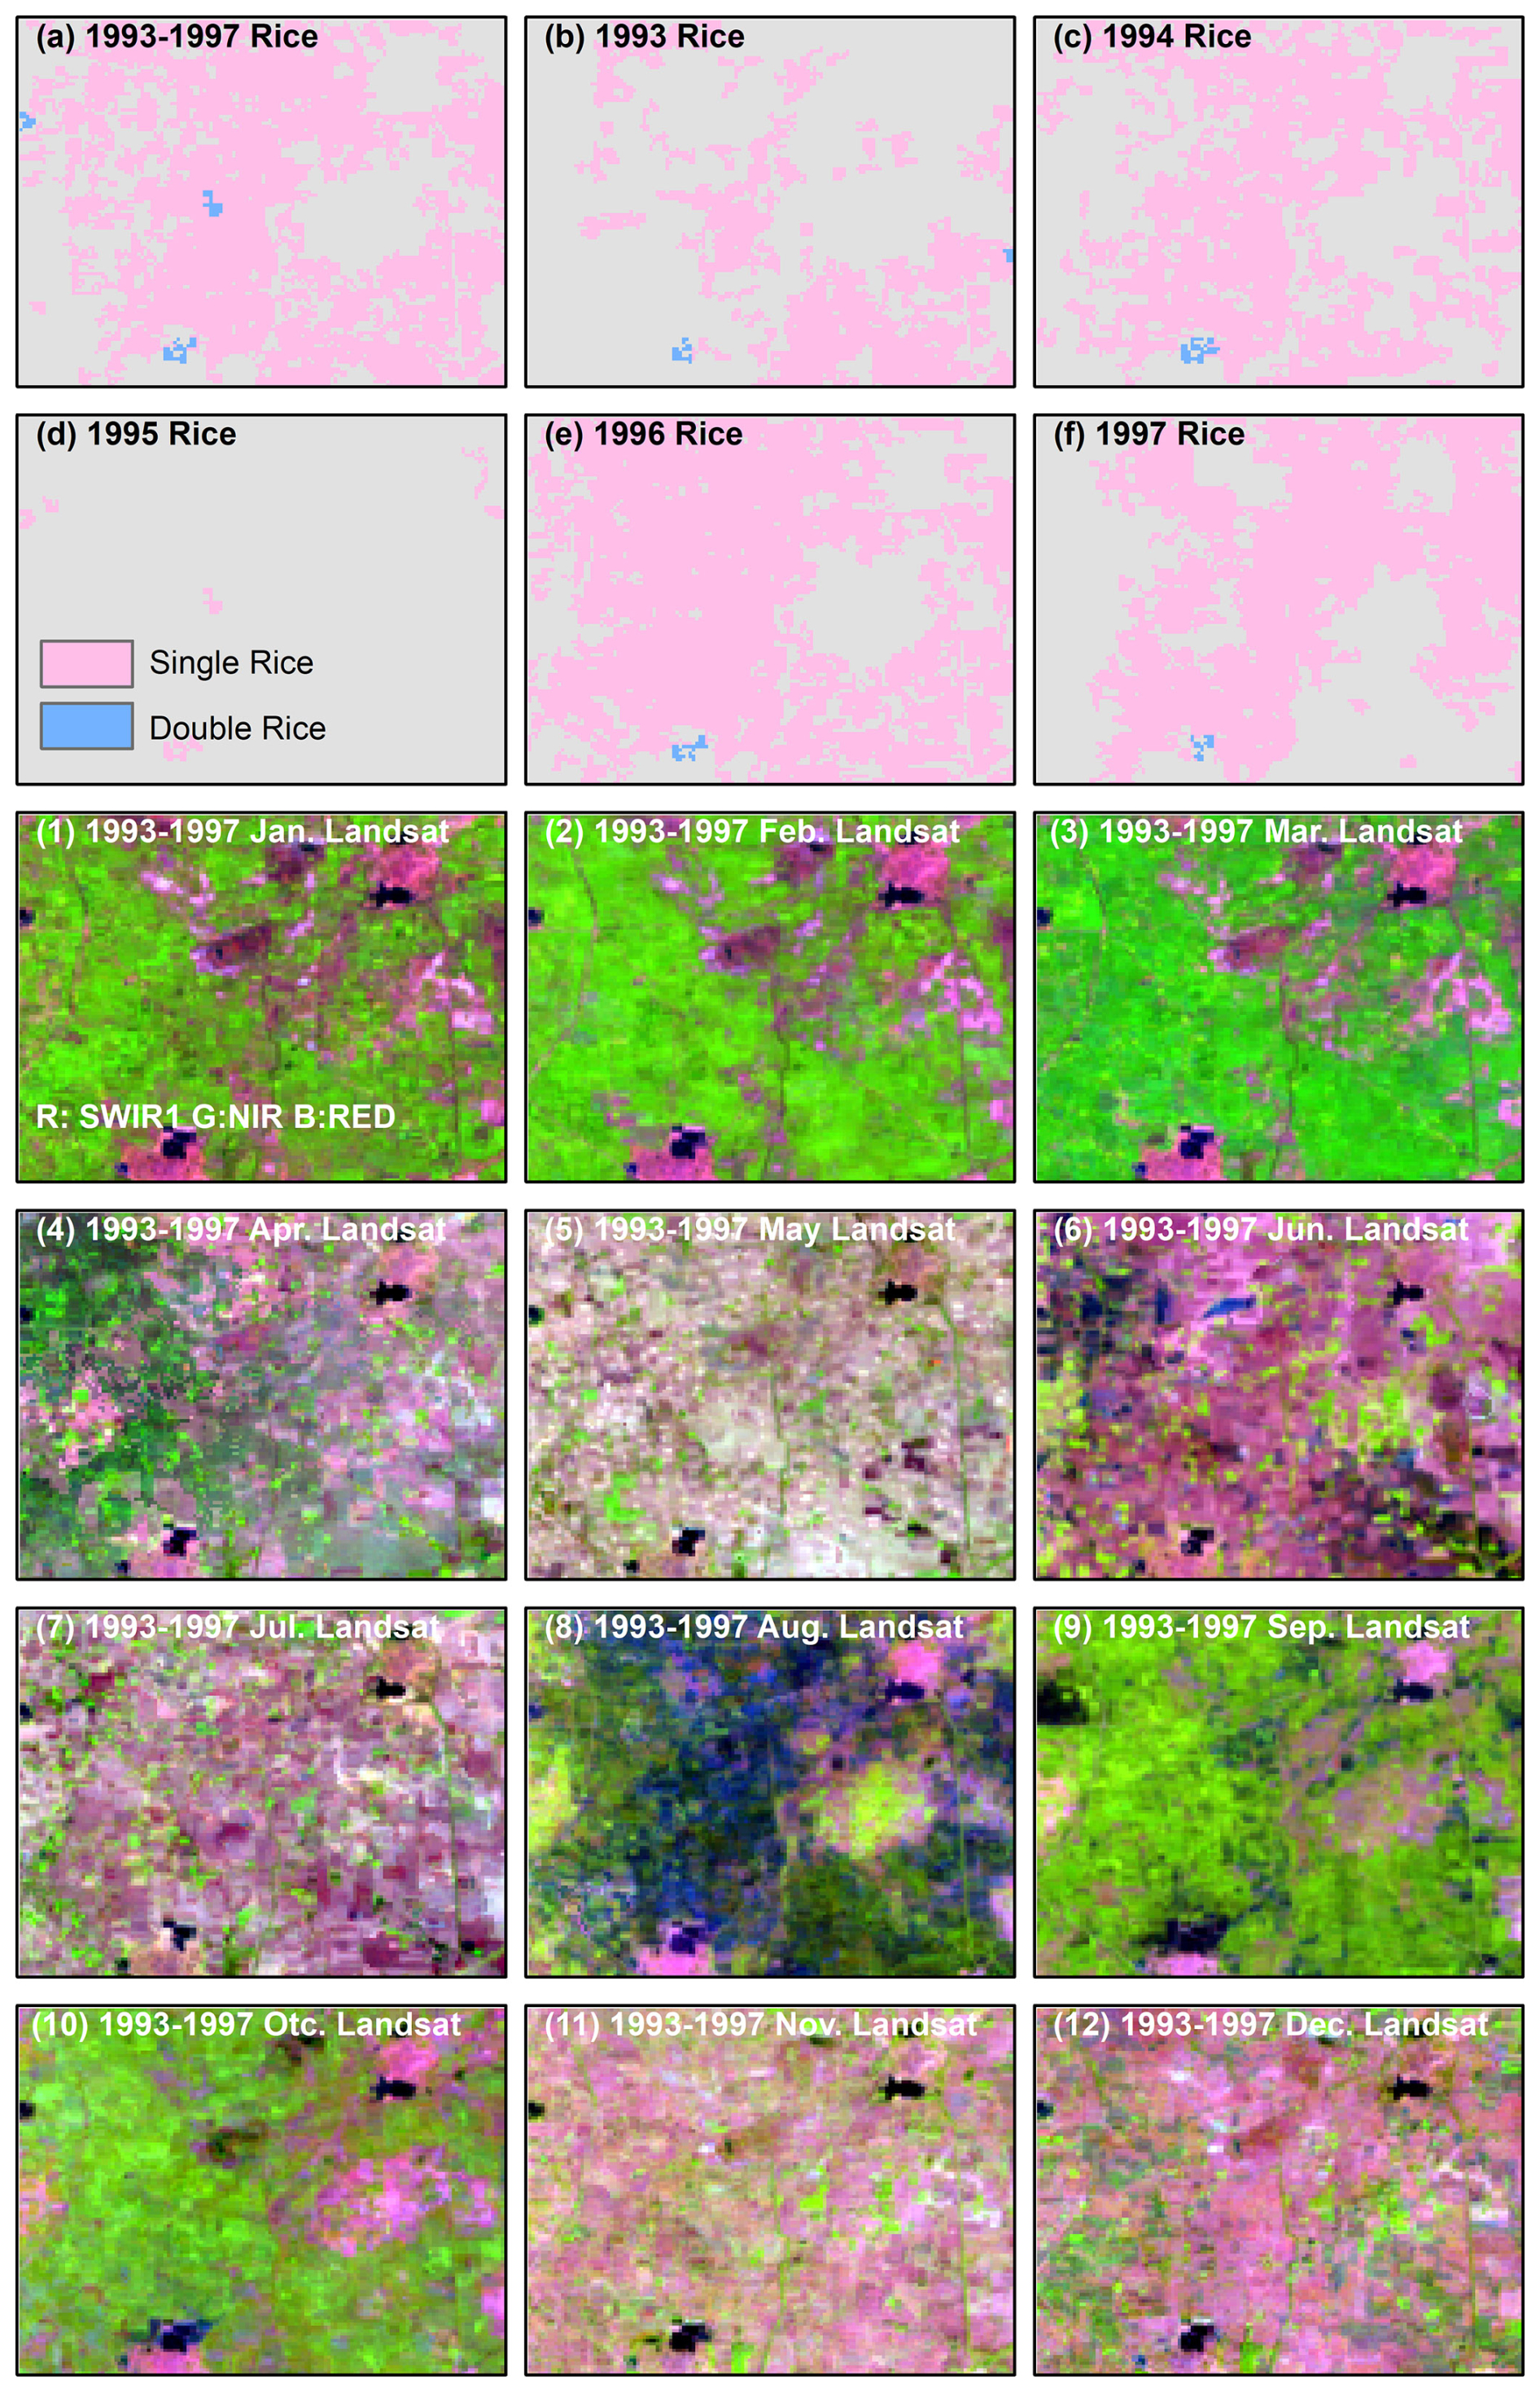
Figure 9Comparison of rice maps derived from single-year imagery and five-year composite imagery in the mid-1990s.
An example of fixed-window limitations
Another advantage of the proposed framework is the use of dynamically detected crop peaks rather than predefined phenological calendars. To illustrate this point, we conducted a comparison using transplanting windows derived from the RiceAtlas phenology database (hereafter referred to as the RiceAtlas approach).
As shown in Fig. S5, the RiceAtlas approach relies on fixed planting windows (e.g., DOY 196–227 for the first season in the example location). However, during the monsoon period, temporary flooding events may cause LSWI to exceed EVI even in non-rice areas. When flooding detection is applied within these predefined windows, such transient signals can be incorrectly interpreted as rice transplanting events.
In contrast, the proposed method first identifies valid crop peaks from the vegetation index time series and then restricts flooding detection to phenologically consistent crop growth cycles. This strategy effectively reduces the influence of seasonal flooding signals. In the example shown in Fig. S5, the RiceAtlas-based approach identifies an additional rice season, leading to an overestimation of cropping intensity, whereas our method avoids this flood-induced overestimation.
4.3 Uncertainty assessment
4.3.1 Temporal representativeness of five-year composites
Although multi-year compositing increases valid observation density, it may also smooth interannual variability in rice distribution and cropping intensity. To quantify this effect, we conducted an annual-versus-composite experiment for the recent data-rich period of 2021–2025 using only Landsat and Sentinel-2 observations available within each individual year (Figs. S8–S13). The annual maps showed that the broad rice extent was comparatively stable at the regional scale, with a mean total rice extent of 50.67 Mha and a coefficient of variation of 6.7 % (Table S2). By contrast, cropping-intensity classes were more sensitive to annual observation availability, with coefficients of variation of 15.4 % and 31.9 % for double- and triple-season rice, respectively (Table S2). Compared with the annual mean, the five-year composite product showed only a moderate difference in intensity-weighted rice area (+5.3 %; Table S3), suggesting that the main effect of compositing lies in the allocation and detectability of cropping-intensity classes rather than in the overall harvested-area proxy.
In intensive rice-producing regions, such as the Ayeyarwady Delta and Mekong Delta, the five-year composite product may identify more multi-season rice than individual annual maps (Fig. S9). This pattern can be explained by both phenological and observational factors. Multi-season rice systems often include crop cycles that begin in the preceding calendar year or extend into the following year, while persistent monsoon cloud contamination may cause single-year optical composites to miss key flooding, transplanting, or peak-growth phases. Consequently, annual maps may omit or downgrade one or more rice seasons when valid observations are insufficient during these short diagnostic windows. The five-year compositing strategy therefore improves the probability of capturing complete rice phenological and flooding signals, but the resulting products should be interpreted as multi-year composite-period rice maps rather than strict annual maps, especially for cropping intensity. Detailed annual-versus-composite comparisons are provided in the Supplementary Materials (Tables S2–S3 and Figs. S8–S13).
4.3.2 Observation-related uncertainties
The primary source of uncertainty in the products stems from optical observation quality and the availability of valid observations. Specifically, the striping issue in Landsat-7 data led to omission errors in some rice fields. Despite using all available imagery over a five-year period for compositing, striped gaps persisted in certain areas, resulting in the failure to effectively identify rice fields, particularly in the results for 2005 and 2015.
Additionally, sample-based validation revealed omission errors in northern India due to limited valid optical observations. Based on the extracted rice phenological peaks, this region is characterized by a rice–wheat double-cropping system, with rice transplanting typically occurring between June and July. However, as shown in Fig. S6, many pixels in this region have very few valid observations during this period because of persistent cloud cover. Consequently, optical imagery often fails to capture the flooding signals of rice, leading to underestimation of rice extent and reduced accuracy in northern India.
To address this issue, we re-mapped the 2024 rice intensity and spatial distribution for northern India using our previously developed Rice-Sentinel algorithm, which effectively integrates Sentinel-1 radar observations to compensate for missing optical data. Nevertheless, the original optical-based results are also retained and provided for comparison and reference by other researchers.
The spatial distribution and cropping-intensity maps of rice in South and mainland Southeast Asia are available from the Zenodo dataset at https://doi.org/110.5281/zenodo.21349862 (Zhao et al., 2026). We welcome other researchers to validate these products and collaborate in improving the accuracy of rice mapping in this region.
The source code developed in this study is available through Google Earth Engine at https://code.earthengine.google.com/40b82a35265b3da6e5cd2db740150793 (last access: 14 July 2026). An archived version of the source code is also available from Zenodo at https://doi.org/10.5281/zenodo.21349862 (Zhao et al., 2026).
This study employed a refined phenology-based rice mapping algorithm using the full archives of Landsat and Sentinel-2 satellite data to generate high-resolution multi-year composite products of paddy rice distribution and cropping intensity across South and mainland Southeast Asia for four composite periods represented by the nominal reference years 1995, 2005, 2015, and 2024. By applying optical image compositing and false-peak elimination, the method effectively addressed the challenges of mapping long-term rice cropping intensity in tropical regions. The resulting products achieved overall accuracies ranging from 83.74 % to 87.60 % across the four periods, based on validation against 23 396 independent samples, and exhibited R2 values exceeding 0.9 when compared with FAO statistical data for South and mainland Southeast Asian countries. In conclusion, this study fills a critical gap in high-resolution, long-term rice mapping, providing a robust foundation for sustainable agricultural practices and policy development in South and mainland Southeast Asia, with broader implications for global food security and environmental sustainability.
The supplement related to this article is available online at https://doi.org/10.5194/essd-18-5583-2026-supplement.
Conceptualization, methodology: ZZ and GZ. Validation, Software, Supervision: ZZ, GZ, JD and JY. Writing (original draft preparation), Visualization: ZZ, JD, XX. Writing (review and editing): ZZ, GZ, CF and RL. Funding acquisition: GZ and JD.
The contact author has declared that none of the authors has any competing interests.
Publisher's note: Copernicus Publications remains neutral with regard to jurisdictional claims made in the text, published maps, institutional affiliations, or any other geographical representation in this paper. The authors bear the ultimate responsibility for providing appropriate place names. Views expressed in the text are those of the authors and do not necessarily reflect the views of the publisher.
The authors gratefully acknowledge the organizations and data providers for making the satellite imagery, ancillary land-cover products, and statistical data used in this study publicly available. We also acknowledge Google Earth Engine for providing the cloud-computing platform used for large-scale satellite data processing. The authors thank the editor and the two anonymous reviewers for their constructive comments, which helped improve the manuscript.
This research has been supported by the National Natural Science Foundation of China (grant nos. 42461144212, 42171115, 42271375, 42525108).
This paper was edited by Peng Zhu and reviewed by two anonymous referees.
Adrian, J., Sagan, V., and Maimaitijiang, M.: Sentinel SAR-optical fusion for crop type mapping using deep learning and Google Earth Engine, ISPRS J. Photogramm. Remote Sens., 175, 215–235, https://doi.org/10.1016/j.isprsjprs.2021.02.018, 2021.
Carrasco, L., Fujita, G., Kito, K., and Miyashita, T.: Historical mapping of rice fields in Japan using phenology and temporally aggregated Landsat images in Google Earth Engine, ISPRS J. Photogramm. Remote Sens., 191, 277–289, https://doi.org/10.1016/j.isprsjprs.2022.07.018, 2022.
Chen, Z., Balasus, N., Lin, H., Nesser, H., and Jacob, D. J.: African rice cultivation linked to rising methane, Nat. Clim. Change, 14, 148–151, https://doi.org/10.1038/s41558-023-01907-x, 2024.
Cheng, M., Li, Z., Li, L., He, W., Zhang, L., and Zhang, H.: 25-year, quarterly land change maps of China's Loess Plateau reveal long-term and substantial water-induced soil erosion mitigation, Earth Syst. Sci. Data, 18, 3303–3340, https://doi.org/10.5194/essd-18-3303-2026, 2026.
Deng, Y., Peng, B., Guan, K., Runkle, B. R. K., Moreno-García, B., Wu, X., Wang, S., Zhou, Q., and Reba, M. L.: Detecting the onset of rice field inundation in the Lower Mississippi River Basin via Harmonized Landsat Sentinel-2 (HLS) satellite time series, ISPRS J. Photogramm. Remote Sens., 228, 28–43, https://doi.org/10.1016/j.isprsjprs.2025.07.003, 2025.
Dong, J. and Xiao, X.: Evolution of regional to global paddy rice mapping methods: A review, ISPRS J. Photogramm. Remote Sens., 119, 214–227, https://doi.org/10.1016/j.isprsjprs.2016.05.010, 2016.
Dong, J., Xiao, X., Kou, W., Qin, Y., Zhang, G., Li, L., Jin, C., Zhou, Y., Wang, J., Biradar, C., Liu, J., and Moore, B.: Tracking the dynamics of paddy rice planting area in 1986–2010 through time series Landsat images and phenology-based algorithms, Remote Sens. Environ., 160, 99–113, https://doi.org/10.1016/j.rse.2015.01.004, 2015.
Dong, J., Xiao, X., Menarguez, M. A., Zhang, G., Qin, Y., Thau, D., Biradar, C., and Moore, B.: Mapping paddy rice planting area in northeastern Asia with Landsat 8 images, phenology-based algorithm and Google Earth Engine, Remote Sens. Environ., 185, 142–154, https://doi.org/10.1016/j.rse.2016.02.016, 2016.
Foley, J. A., DeFries, R., Asner, G. P., Barford, C., Bonan, G., Carpenter, S. R., Chapin, F. S., Coe, M. T., Daily, G. C., Gibbs, H. K., Helkowski, J. H., Holloway, T., Howard, E. A., Kucharik, C. J., Monfreda, C., Patz, J. A., Prentice, I. C., Ramankutty, N., and Snyder, P. K.: Global Consequences of Land Use, Science, 309, 570–574, https://doi.org/10.1126/science.1111772, 2005.
Gao, Y., Pan, Y., Zhu, X., Li, L., Ren, S., Zhao, C., and Zheng, X.: FARM: A fully automated rice mapping framework combining Sentinel-1 SAR and Sentinel-2 multi-temporal imagery, Comput. Electron. Agr., 213, 108262, https://doi.org/10.1016/j.compag.2023.108262, 2023.
Ge, J., Zhang, H., Zuo, L., Xu, L., Jiang, J., Song, M., Ding, Y., Xie, Y., Wu, F., Wang, C., and Huang, W.: Large-scale rice mapping under spatiotemporal heterogeneity using multi-temporal SAR images and explainable deep learning, ISPRS J. Photogramm. Remote Sens., 220, 395–412, https://doi.org/10.1016/j.isprsjprs.2024.12.021, 2025.
Ginting, F. I., Rudiyanto, R., Fatchurrachman, Mohd Shah, R., Che Soh, N., Eng Giap, S. G., Fiantis, D., Setiawan, B. I., Schiller, S., Davitt, A., and Minasny, B.: High-resolution maps of rice cropping intensity across Southeast Asia, Sci. Data, 12, 1408, https://doi.org/10.1038/s41597-025-05722-1, 2025.
Godfray, H. C. J., Beddington, J. R., Crute, I. R., Haddad, L., Lawrence, D., Muir, J. F., Pretty, J., Robinson, S., Thomas, S. M., and Toulmin, C.: Food Security: The Challenge of Feeding 9 Billion People, Science, 327, 812–818, https://doi.org/10.1126/science.1185383, 2010.
Han, J., Zhang, Z., Luo, Y., Cao, J., Zhang, L., Cheng, F., Zhuang, H., Zhang, J., and Tao, F.: NESEA-Rice10: high-resolution annual paddy rice maps for Northeast and Southeast Asia from 2017 to 2019, Earth Syst. Sci. Data, 13, 5969–5986, https://doi.org/10.5194/essd-13-5969-2021, 2021.
Han, J., Zhang, Z., Luo, Y., Cao, J., Zhang, L., Zhuang, H., Cheng, F., Zhang, J., and Tao, F.: Annual paddy rice planting area and cropping intensity datasets and their dynamics in the Asian monsoon region from 2000 to 2020, Agr. Syst., 200, 103437, https://doi.org/10.1016/j.agsy.2022.103437, 2022.
He, Y., Dong, J., Liao, X., Sun, L., Wang, Z., You, N., Li, Z., and Fu, P.: Examining rice distribution and cropping intensity in a mixed single- and double-cropping region in South China using all available Sentinel 1/2 images, Int. J. Appl. Earth Obs., 101, 102351, https://doi.org/10.1016/j.jag.2021.102351, 2021.
Huang, H., Wang, J., Liu, C., Liang, L., Li, C., and Gong, P.: The migration of training samples towards dynamic global land cover mapping, ISPRS J. Photogramm. Remote Sens., 161, 27–36, https://doi.org/10.1016/j.isprsjprs.2020.01.010, 2020.
Karra, K., Kontgis, C., Statman-Weil, Z., Mazzariello, J. C., Mathis, M., and Brumby, S. P.: Global land use/land cover with Sentinel 2 and deep learning, 2021 IEEE International Geoscience and Remote Sensing Symposium IGARSS, 11–16 July, 4704–4707, https://doi.org/10.1109/IGARSS47720.2021.9553499, 2021.
Li, S., Shen, R., Jiang, J., Peng, Q., Chen, X., Dong, J., Dong, J., and Yuan, W.: A long-term paddy rice distribution dataset in Asia at a 30 m spatial resolution, Sci. Data, 12, 1052, https://doi.org/10.1038/s41597-025-05374-1, 2025.
Lin, Z., Zhong, R., Xiong, X., Guo, C., Xu, J., Zhu, Y., Xu, J., Ying, Y., Ting, K. C., Huang, J., and Lin, T.: Large-scale rice mapping using multi-task spatiotemporal deep learning and Sentinel-1 SAR time series, Remote Sens., 14, 699, https://doi.org/10.3390/rs14030699, 2022.
Mehta, P., Siebert, S., Kummu, M., Deng, Q., Ali, T., Marston, L., Xie, W., and Davis, K. F.: Half of twenty-first century global irrigation expansion has been in water-stressed regions, Nat. Water, 2, 254–261, https://doi.org/10.1038/s44221-024-00206-9, 2024.
Ni, R., Tian, J., Li, X., Yin, D., Li, J., Gong, H., Zhang, J., Zhu, L., and Wu, D.: An enhanced pixel-based phenological feature for accurate paddy rice mapping with Sentinel-2 imagery in Google Earth Engine, ISPRS J. Photogramm. Remote Sens., 178, 282–296, https://doi.org/10.1016/j.isprsjprs.2021.06.018, 2021.
Persaud, N. and Dagher, R.: The United Nations: 2030 Sustainable Development Goals Agenda, in: The Role of Monitoring and Evaluation in the UN 2030 SDGs Agenda, edited by: Persaud, N. and Dagher, R., Springer International Publishing, Cham, 1–41, https://doi.org/10.1007/978-3-030-70213-7_1, 2021.
Potapov, P., Turubanova, S., Hansen, M. C., Tyukavina, A., Zalles, V., Khan, A., Song, X.-P., Pickens, A., Shen, Q., and Cortez, J.: Global maps of cropland extent and change show accelerated cropland expansion in the twenty-first century, Nat. Food, 3, 19–28, https://doi.org/10.1038/s43016-021-00429-z, 2022.
Song, M., Xu, L., Ge, J., Zhang, H., Zuo, L., Jiang, J., Ding, Y., Xie, Y., and Wu, F.: EARice10: a 10 m resolution annual rice distribution map of East Asia for 2023, Earth Syst. Sci. Data, 17, 661–683, https://doi.org/10.5194/essd-17-661-2025, 2025.
Sun, C., Zhang, H., Xu, L., Ge, J., Jiang, J., Zuo, L., and Wang, C.: Twenty-meter annual paddy rice area map for mainland Southeast Asia using Sentinel-1 synthetic-aperture-radar data, Earth Syst. Sci. Data, 15, 1501–1520, https://doi.org/10.5194/essd-15-1501-2023, 2023.
Thorp, K. R. and Drajat, D.: Deep machine learning with Sentinel satellite data to map paddy rice production stages across West Java, Indonesia, Remote Sens. Environ., 265, 112679, https://doi.org/10.1016/j.rse.2021.112679, 2021.
Wang, Y., Hollingsworth, P. M., Zhai, D., West, C. D., Green, J. M. H., Chen, H., Hurni, K., Su, Y., Warren-Thomas, E., Xu, J., and Ahrends, A.: High-resolution maps show that rubber causes substantial deforestation, Nature, 623, 340–346, https://doi.org/10.1038/s41586-023-06642-z, 2023.
Xiao, X., Boles, S., Liu, J., Zhuang, D., Frolking, S., Li, C., Salas, W., and Moore, B.: Mapping paddy rice agriculture in southern China using multi-temporal MODIS images, Remote Sens. Environ., 95, 480–492, https://doi.org/10.1016/j.rse.2004.12.009, 2005.
Xiao, X., Boles, S., Frolking, S., Li, C., Babu, J. Y., Salas, W., and Moore, B.: Mapping paddy rice agriculture in South and Southeast Asia using multi-temporal MODIS images, Remote Sens. Environ., 100, 95–113, https://doi.org/10.1016/j.rse.2005.10.004, 2006.
Xiao, X., Dorovskoy, P., Biradar, C. M., and Bridge, E.: A library of georeferenced photos from the field, Eos Trans. AGU, 92, 453–454, https://doi.org/10.1029/2011EO490002, 2011.
Xu, S., Zhu, X., Chen, J., Zhu, X., Duan, M., Qiu, B., Wan, L., Tan, X., Xu, Y. N., and Cao, R.: A robust index to extract paddy fields in cloudy regions from SAR time series, Remote Sens. Environ., 285, 113374, https://doi.org/10.1016/j.rse.2022.113374, 2023.
Yang, J., Dong, J., Liu, L., Zhao, M., Zhang, X., Li, X., Dai, J., Wang, H., Wu, C., You, N., Fang, S., Pang, Y., He, Y., Zhao, G., Xiao, X., and Ge, Q.: A robust and unified land surface phenology algorithm for diverse biomes and growth cycles in China by using harmonized Landsat and Sentinel-2 imagery, ISPRS J. Photogramm. Remote Sens., 202, 610–636, https://doi.org/10.1016/j.isprsjprs.2023.07.017, 2023.
Zabel, F., Delzeit, R., Schneider, J. M., Seppelt, R., Mauser, W., and Václavík, T.: Global impacts of future cropland expansion and intensification on agricultural markets and biodiversity, Nat. Comm., 10, 2844, https://doi.org/10.1038/s41467-019-10775-z, 2019.
Zanaga, D., Van De Kerchove, R., Daems, D., De Keersmaecker, W., Brockmann, C., Kirches, G., Wevers, J., Cartus, O., Santoro, M., Fritz, S., Lesiv, M., Herold, M., Tsendbazar, N.-E., Xu, P., Ramoino, F., and Arino, O.: ESA WorldCover 10 m 2021 v200, Zenodo [data set], https://doi.org/10.5281/zenodo.7254221, 2022.
Zeng, Z., Estes, L., Ziegler, A. D., Chen, A., Searchinger, T., Hua, F., Guan, K., Jintrawet, A., and F. Wood, E.: Highland cropland expansion and forest loss in Southeast Asia in the twenty-first century, Nat. Geosci., 11, 556–562, https://doi.org/10.1038/s41561-018-0166-9, 2018.
Zhan, P., Zhu, W., and Li, N.: An automated rice mapping method based on flooding signals in synthetic aperture radar time series, Remote Sens. Environ., 252, 112112, https://doi.org/10.1016/j.rse.2020.112112, 2021.
Zhang, G., Xiao, X., Dong, J., Xin, F., Zhang, Y., Qin, Y., Doughty, R. B., and Moore, B.: Fingerprint of rice paddies in spatial–temporal dynamics of atmospheric methane concentration in monsoon Asia, Nat. Comm., 11, 554, https://doi.org/10.1038/s41467-019-14155-5, 2020.
Zhang, G., Xiao, X., Biradar, C. M., Dong, J., Qin, Y., Menarguez, M. A., Zhou, Y., Zhang, Y., Jin, C., Wang, J., Doughty, R. B., Ding, M., and Moore, B.: Spatiotemporal patterns of paddy rice croplands in China and India from 2000 to 2015, Sci. Total Environ., 579, 82–92, https://doi.org/10.1016/j.scitotenv.2016.10.223, 2017.
Zhang, X., Liu, L., Chen, X., Gao, Y., Xie, S., and Mi, J.: GLC_FCS30: global land-cover product with fine classification system at 30 m using time-series Landsat imagery, Earth Syst. Sci. Data, 13, 2753–2776, https://doi.org/10.5194/essd-13-2753-2021, 2021.
Zhao, Z., Dong, J., Zhang, G., Yang, J., Liu, R., Wu, B., and Xiao, X.: Improved phenology-based rice mapping algorithm by integrating optical and radar data, Remote Sens. Environ., 315, 114460, https://doi.org/10.1016/j.rse.2024.114460, 2024.
Zhao, Z., Dong, J., Yang, J., Liu, L., You, N., Xiao, X., and Zhang, G.: From rice planting area mapping to rice agricultural system mapping: A holistic remote sensing framework for understanding China's complex rice systems, ISPRS J. Photogramm. Remote Sens., 224, 382–397, https://doi.org/10.1016/j.isprsjprs.2025.03.026, 2025.
Zhao, Z., Dong, J., Zhang, G., Yang, J., and Xiao, X.: Mapping paddy rice distribution and cropping intensity in South and Southeast Asia (1995–2024) at 30 m resolution, Zenodo [code and data set], https://doi.org/10.5281/zenodo.21349862, 2026.