the Creative Commons Attribution 4.0 License.
the Creative Commons Attribution 4.0 License.
 | 29 Jul 2026
Munition piles in the German Baltic Sea: inventory and maritime hazard perspectives
Mareike Keller
Jochen Mohrmann
Alexander Pechmann
Samar Ensenbach
Jens Greinert
For the first time, this paper presents two datasets that detail the distribution of piles of dumped munitions in the German Baltic Sea (Lübeck Bay and north of Kiel Fjord). Multibeam echosounder data and photomosaics were collected between 2017 and 2024. Dataset A contains basic information on 484 known and potential munition piles and their geographic context, with a focus on maritime activities in their surroundings. It is available at https://doi.org/10.1594/PANGAEA.988426 (Frey et al., 2026a). Dataset B is a subset of the former, where visual investigation enabled the detailed assessment of 39 munition piles by experts, so that a greater level of detail on the properties of the munitions was collected. It is Supplement 1 to this paper. The paper contextualises the data in terms of the munitions' properties and their geospatial surroundings. It identifies a typical munition pile in the study area to be inhomogeneous, most likely layered, with partially buried objects and munition casings that are weakly corroded. Munition pile properties were found to differ between dump sites – particularly in terms of the number and size of objects on a pile. Based on the information in datasets A and B, it was possible to extrapolate the number of objects on all (potential) munition piles across Lübeck Bay. The assessment demonstrates that survey data do not match historical recordings in archival documents. Distance measurements reveal that munition piles are located close to protected areas and sediment deposit sites, while subsea cables are located furthest away. The paper identifies six clusters of munition piles, two of which are located in areas with very high traffic density (>2000 vessels annually). These data are presented to encourage scientific debate on holistic management strategies, clearance approaches, cost estimates, policy relevance, and prioritisation of remediation activities. The findings show that several munition piles require attention by the respective authorities.
- Article
(5613 KB) - Full-text XML
-
Supplement
(967 KB) - BibTeX
- EndNote


In recent years, the literature on munitions in the sea has grown remarkably. However, scientific discussions on holistic management strategies, clearance approaches, cost estimates, and prioritisation of action are missing. This paper prepares the ground for such debate by providing an inventory of munition piles in the German Baltic Sea, focusing on dump sites in Lübeck Bay but also considering Kolberger Heide north of Kiel Fjord. The paper describes these data with the aims of understanding the geographic distribution of munition piles and assessing their properties (Sect. 4.1). It also seeks to extrapolate known information to areas of greater uncertainty (Sect. 4.2). In addition, it uses publicly available maritime data to discuss the spatial context in which the munition piles are located (Sect. 4.3). To this end, the paper presents the following two living datasets:
-
Dataset A: this is a dataset with information on 484 known and suspected munition piles in the German Baltic Sea at the time of publication (Sect. 3.1.1). A data list was published that includes their properties and information on the maritime geographic context in which they are located (Sect. 3.2) (Frey et al., 2026a).
-
Dataset B: this is a subset of 39 munition piles for which photomosaics are available which were annotated and visually assessed by four experts. A data list that details their properties as annotated and assessed by each expert (Sect. 3.1.2) is Supplement 1 to this paper.
Research on munitions in the German Baltic Sea is a continuous process that gradually reveals new information as additional cruises are conducted, data are processed and, clearance of munitions commences. Accordingly, dataset A was set up as the first entry in a dataset publication series on PANGAEA (Frey et al., 2026a). As new piles are identified or information on their properties are investigated, new entries can be published in the series. Under consideration of this journal's living data process, this may entail submission of a new or updated manuscript.
Due to the sensitive nature of the munitions issue, some information that enables discussions on clearance strategies and prioritisation is subject to security considerations. The authors take these concerns seriously. The matter is exemplified by the case of discontinued proliferation of information on German munition dump sites on the HELCOM Map and data service. A previously available dataset was not released for continued display (HELCOM, 2023c). The paper responds to the security challenge by withholding coordinates of munitions. Datasets A and B are limited to information that is required for the paper and to allow for discussions on munitions management in the future. We resort to displaying munition pile properties and maritime economic data as charts to understand their value distributions and as rasterised maps to understand their spatial distributions. Maps have been subject to scrutiny by security experts listed in the acknowledgements.
In Europe, the issue of munitions in the sea has been in the public eye for roughly 15 years. Several reports have addressed the matter and summarised available information on the location and distribution of munition hot spots such as dump sites or other affected areas. Knowledge was collected for the North (Nixon, 2009), Baltic (HELCOM, 2013, 2025), and Mediterranean Seas (UNEP, 2009), for European waters (European Commission, 2022) as a whole, and, most comprehensively, for German waters (Böttcher et al., 2011). Some of these reports present tonnages of submerged munitions. They are based on reviews of historical documents or revisions of existing literature. Even though their publication dates vary quite a bit, these reports serve as helpful introductory literature. In addition, one paper compiled affected sites globally (Beck et al., 2018). Information on individual dump sites and the munitions located within them is included in some papers detailing various aspects of the contained munition. Corrosion of casings is one such topic, e.g., at dump sites in Hawaii (Silva and Chock, 2016) or the Eastern Scheldt (the Netherlands) (den Otter et al., 2024). Another is the detection of munitions, which has been discussed exemplarily for German dump sites Kolberger Heide (Kampmeier et al., 2020; Frey et al., 2022), in Lübeck Bay (Greinert et al., 2024), and at Minsener Oog (Wehner et al., 2026).
None of the above contain detailed and holistic assessments of munition properties, such as country of origin, production period, object dimensions, material and state of corrosion of the casing, type and state of the fuze, and type and mass of explosive materials. Given that pertinent guidelines on explosive ordnance disposal (EOD) name munition properties as driving factors for clearance decision-making (Frey, 2020; Cooper and Cooke, 2015), this is noteworthy. A greater level of detail can be found in a publication on the Eastern Scheldt. In particular, it assesses mass ratios of various munition compounds and casing materials (van Ham, 2002). Another study discusses munitions that were subject to EOD from German waters. It describes distributions of munition mass, explosive charge mass, munition dimensions, and burial depth, most of which were cleared in preparation of offshore construction efforts (Frey, 2025).
Detailed scientific discussions on the maritime spatial context and environmental conditions in which munition hotspots are located are missing altogether. This is remarkable, since there is wide consensus that munitions present a hazard to maritime actors, particularly those that require bottom contact (HELCOM, 2025). Section 3.2 explores this matter. Data on maritime use are publicly available, but thus far they have not been analysed in combination with information on munition location, distribution, and properties. While this paper does not seek to quantify these hazards, the munition pile datasets can be used to investigate the maritime spatial context in which they are located.
Hazard implications depend on the type of maritime activity and its proximity to the known munition piles. For conventional (i.e., non-chemical) munitions, the hazard is associated with an explosion when the munitions are disturbed or with direct contact with the toxic explosive compounds (e.g., HELCOM, 2025). Thus, avoidance of highly contaminated areas would be expected for fishing. However, some potential munition piles in dataset A show signs of mobile bottom contacting gear use – potentially bottom trawls. Marine traffic flows above and in the vicinity of dump sites, but bottom contact is limited to anchoring. Most areas discussed in this paper are labelled as foul ground in nautical charts. Reports on unexplained explosions that may affect shipping exist (Koch, 2009), but they are considered to be very rare (Beddington and Kinloch, 2005). Recreational users of the sea can be subjected to munition hazards as well. Encounters of munitions or parts thereof at the coast are commonplace in the vicinity of hotspots (Böttcher et al., 2011; Nixon, 2009). In addition, it is known that munitions in the sea affect the marine environment (e.g., Greinert et al., 2019; Beck et al., 2018).
From a detonation hazard perspective, all piles that are located closer than 500 m to a maritime activity are particularly relevant. This is the minimum safety distance that is generally observed during EOD activities (e.g., SeaTerra, 2025). It may therefore be considered a relevant distance when assessing the detonation hazard of a single object. One study found that for one munition pile, a minimum distance of 4082 m should be maintained to avoid the consequences of sympathetic detonations (i.e., detonations of adjacent munitions due to the initial detonation; Zhang et al., 2020) on that pile (Ehlers, 2023). The likelihood of such an event is subject to debate. In addition to the explosive hazard, there are the hazards of environmental contamination (relevant for protected areas) and of direct contact to the toxic explosive compounds (relevant for bathing sites) (HELCOM, 2025). While current velocity and direction play a role as well (Martin, 2002), it is reasonable to assume a greater hazard when munition piles are located closer to these maritime activities.
This section details how munition data in the living datasets are acquired using multibeam echosounder (MBES) and autonomous underwater vehicle (AUV)-based cameras. It describes the processing workflow used to firstly produce MBES rasters for target point annotation and secondly create photomosaics from camera images for detailed munition pile annotation and assessment. The section further lists the steps of subsequent data processing and analysis that were used to produce the results in Sect. 4. Due to the wide scope of the paper, materials and methods are very versatile. All were selected with the aim of presenting munition pile and maritime context data.
3.1 Munition data acquisition and processing
The study presents and discusses two munition pile datasets. The first is a vector (polygon) dataset that was produced by manually annotating suspected munition piles in the MBES raster data, i.e., bathymetric grids (dataset A, Sect. 3.1.1). While their presence inside or in the vicinity of a munition dump site strongly suggests that the features in the MBES raster are in fact munitions, they must be treated as unconfirmed targets until visually verified. Despite this shortcoming, these data can be used to understand the implications of the presence of munition piles for the maritime spatial planning and use. The second dataset is a subset of 39 munition piles that were visually confirmed in photogrammetric reconstructions of large amounts of image data (dataset B, Sect. 3.1.2). This dataset can be used to understand the composition of munition piles, build an inventory, and extrapolate information onto those piles for which no complete visual information is available yet.
All data were collected in the dump sites Kolberger Heide north of Kiel Fjord and Haffkrug and Pelzerhaken in Lübeck Bay. For descriptions of the dump sites the reader is referred to Kampmeier et al. (2020) and Frey et al. (2022) for Kolberger Heide and Greinert et al. (2024) for Lübeck Bay.
3.1.1 Multibeam echosounder data acquisition and target point annotation
MBES data are acquired and processed to produce bathymetric grids and annotate target points of munition piles and individual munitions. The workflow resulted in dataset A, with 484 known and suspected munition piles.
MBES is a hydroacoustic sensing technology that emits multiple sound beams across a wide swath beneath a survey vessel. It enables detailed capturing of the seafloor bathymetry and the detection of objects. MBES has been demonstrated to be a particularly effective tool for identifying underwater obstructions and variations in seafloor composition, due to its high resolution and accuracy (de Jong et al., 2002; Lurton, 2010). The resulting data are usually presented as georeferenced rasters. These can be analysed and correlated with other spatial data. The capacity for munition detection is contingent upon data resolution, which is influenced by water depth (more precisely the distance between transducer and seafloor) and the technical properties of the hardware (e.g., the beam opening angle) (Frey, 2020).
For surveys that inform dataset A, the working areas are typically required to be deeper than 10 m to allow for the operation of the research vessel Alkor, which is used most frequently. The multibeam system RESON T51 (Teledyne, 2024) (during earlier cruises RESON T50; Teledyne, 2025) is installed in the vessel's moon pool. Motion compensation is achieved by using an SBG Apogee-U INS system (SBG Systems, 2025), while sound velocity profiles are measured with a Valeport Swift SVP Profiler (Valeport, 2024). The collection of GPS and RTK data is facilitated by the Septentrio AsteRx-U Marine (GPS, GLONASS, Galileo, Beidou) GNSS receiver (Septentrio, 2025) and via GSM NTRIP (AxioNet). The MBES operation frequency is 400 kHz, and typical swath widths are 120 to 140°. When using 600 beams (best ratio of overlapping beam footprints and point density), ping rates of 15 pings per second to 30 pings per second and a maximum survey speed of 3.5 kn, a data resolution of 25 cm in Lübeck Bay (around 23 m water depth) and 15 to 20 cm in Kolberger Heide (10 to 20 m water depth) can be accomplished. Dense line spacing (varying with water depth and footprint) leads to overlapping data, at least for the outer beams. The Haffkrug and Pelzerhaken munition dump sites have been mapped comprehensively, both within and beyond their officially published boundaries (see, e.g., Fig. 4) over the course of eight research cruises that took place between 2018 and 2024 (POS530; Kampmeier et al., 2018, L13-20; Kampmeier, 2020, AL548; Kampmeier et al., 2021, AL567; Greinert et al., 2023a, AL583 (Greinert et al., 2023b), AL590 (Kampmeier et al., 2023), AL603; Kampmeier et al., 2024, and AL615; Keller et al., 2025). In addition, a dataset by the German Federal Maritime and Hydrographic Agency was used. Kolberger Heide data used in this paper have been acquired over the course of seven cruises from 2017 to 2024 (H17-05, L18-02, AL548; Kampmeier et al., 2021, AL567; Greinert et al., 2023a, AL583; Greinert et al., 2023b, AL590; Kampmeier et al., 2023, and AL615; Keller et al., 2025). They cover 68 % of the dump site's total extent and some of its surroundings. Additional information is provided in the referenced cruise reports. Figure 3 shows the extent of the area for which MBES data have been acquired in dark orange.
Subsequently, MBES data are corrected for offset and refraction, cleaned and gridded in QPS Qimera. To enhance the 3D appearance of objects and visually emphasise them, hillshading is used (which simulates a light source on the bathymetry). All data are visually examined in QGIS, and suspected munition piles and single munitions are manually annotated with polygons and points, respectively. Points are subsequently buffered to capture the area of the object. It is not possible to establish definitive rules for a required number of objects or maximum distance between them to qualify as a pile. The MBES rasters are visually comprehensible representations of individual sonic data pings that are rasterised at a resolution (15 to 25 cm). They are not actual visual information of a surface. Therefore, it is often not fully clear where one object ends and the next begins, how large objects are in reality, or whether small objects are not visible due to the given resolution. Annotators often use a visible scour around the piles to determine its boundaries. However, ultimately determining whether a group of visible features in an MBES raster constitute several individual objects or a pile is a case-by-case expert decision (Fig. 1). Based on visual assessment of the MBES grids, it was decided that an area of 20 m2 constitutes the threshold that qualifies a polygon as a munition pile.
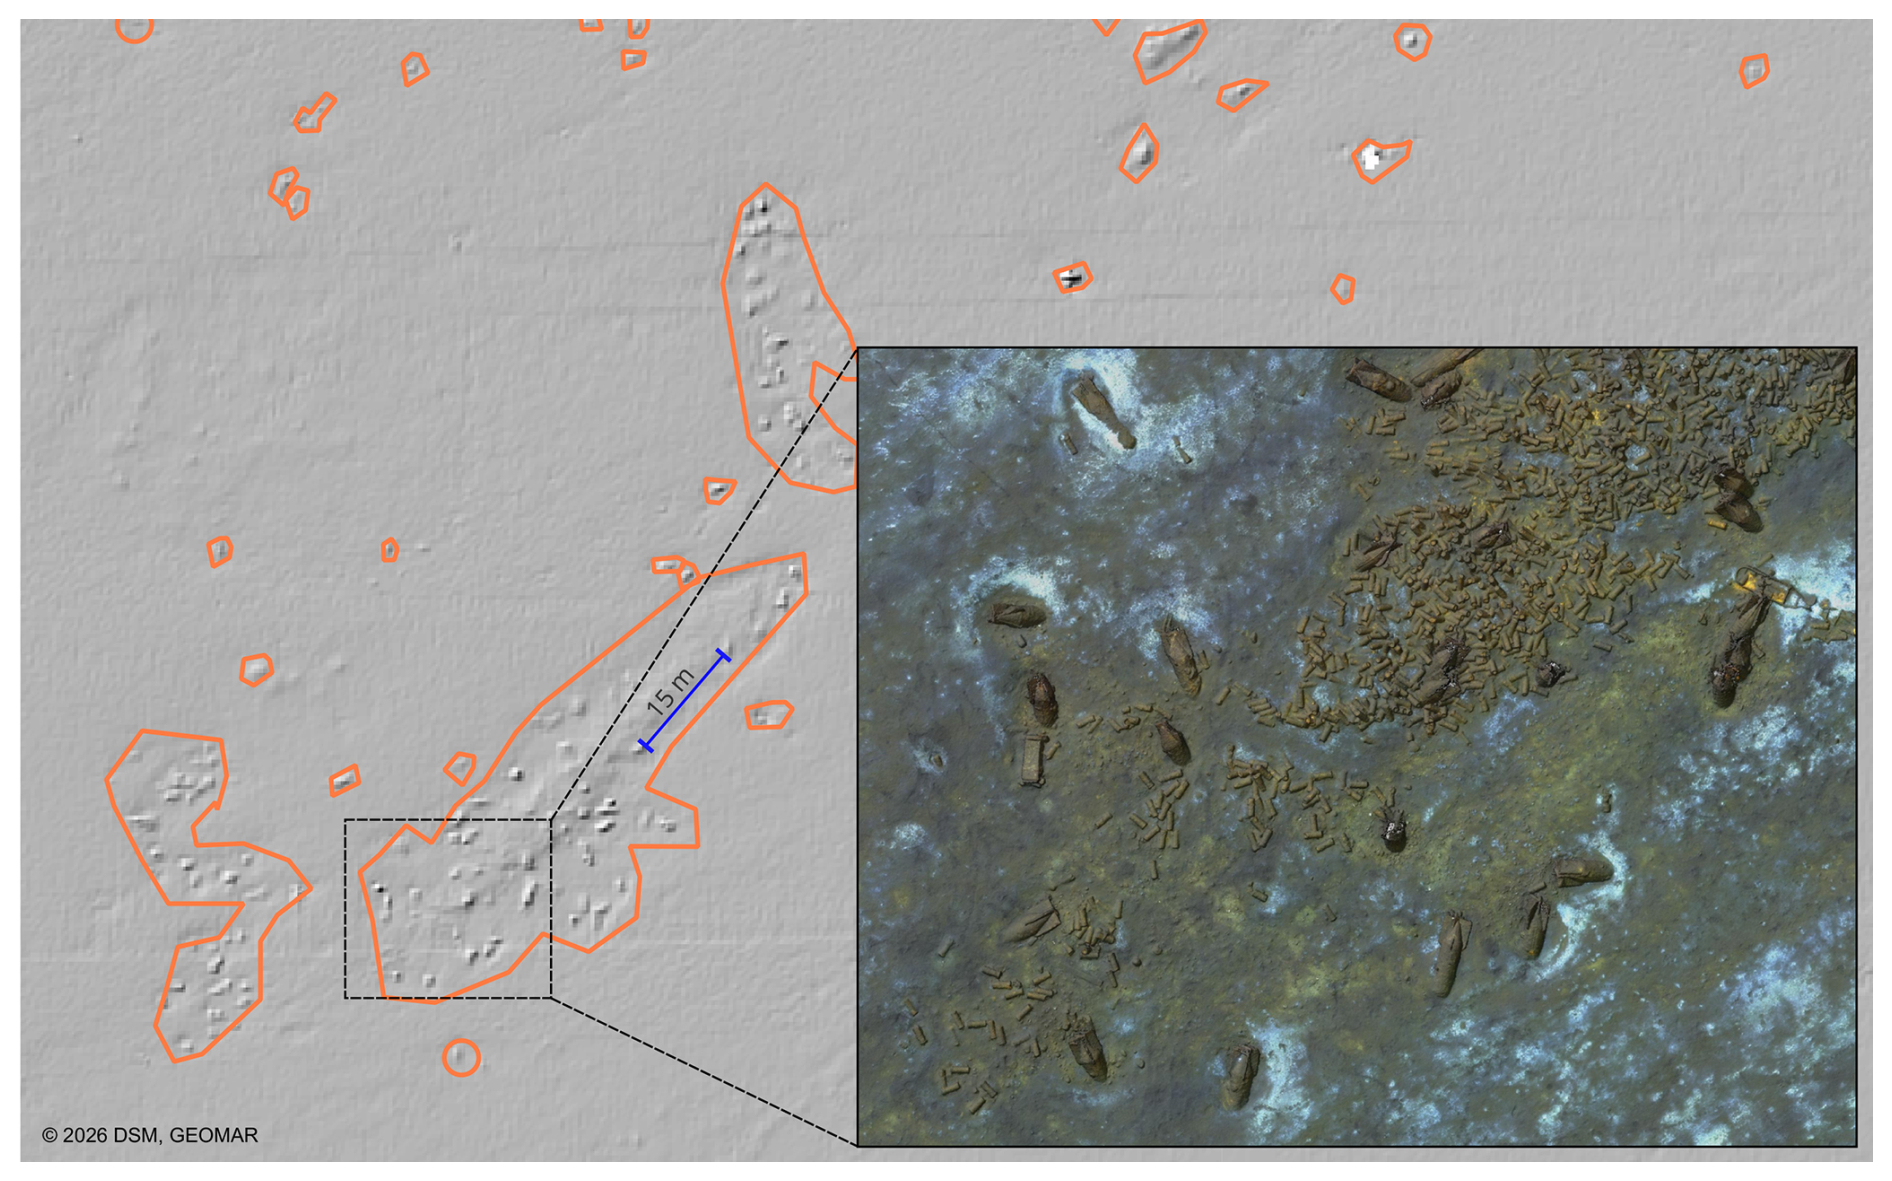
Figure 1Example part of an annotated MBES raster. From the MBES raster, it appears that the large polygon in the middle (pile Pzh_00222, see Supplement 1) outlines a group of roughly 30 features, some of which are 15 m apart. During visual inspection (see Sect. 3.1.2), experts counted 3978 munitions, most of which were only 40 cm long and 15 cm in diameter. The figure demonstrates the challenges of MBES annotation.
Following MBES data acquisition, processing, and annotation, target points are investigated visually using various types of camera systems (AUV dives, remotely operated underwater vehicle (ROV) dives, and towed cameras (Greinert et al., 2024)) during the same or one of the following cruises. Selection of target points for detailed investigation does not follow a specific pattern. Instead, factors like underwater visibility, scheduling of the research cruises, vicinity to other piles, or curiosity regarding the shape of a given feature in the MBES dataset drive the selection process. Consequently, munition presence is confirmed or rejected, and information on objects found at target points is entered into dataset A. ROVs and towed cameras can be used to gain initial impressions of target points. However, they are not suitable for detailed munition pile assessment.
3.1.2 Image acquisition, photomosaic creation and munition pile assessment
This section discusses how images for photomosaic calculation were captured and processed. It also describes how experts assessed and annotated these photomosaics. The workflow resulted in dataset B, with 39 munition piles.
Images are acquired with two Girona 500 AUVs (autonomous underwater vehicles), Anton and Luise, that are equipped with the downward-looking camera system CoraMo MK2. The camera can take up to 2 images per second with a resolution of 12.34 MP (Hissmann et al., 2020). It is situated behind a dome port with the camera's optical centre in the centre of the sphere. As a result, the additional air-glass-water interface does not introduce optical refraction. Illumination is provided by a ring of LEDs around the camera housing. The LEDs are synchronised with the camera to act as a flash. This enables uniform illumination of the scene below the AUV while maximising the distance between the camera and the light source on the confined platform. The setup reduces light scattering off particles in the water column. For additional information on the sensor setup aboard the AUVs, the reader is referred to Seidel et al. (2023).
Surveys are conducted in a lawnmower pattern with 0.8 to 1.0 m line spacing. With a high frame rate of 2 frames per second, an altitude above the sea floor ranging from 1.0 to 1.5 m, and a velocity of 0.2 to 0.5 m s−1, the along-track overlap between images is guaranteed. The combination of the wide field of view of the camera and additional cross lines over the survey area ensures overlap between neighbouring images.
To calculate photomosaics from the images, the software Agisoft Metashape (Agisoft, 2025) is used. Depending on the visibility at the seafloor, about 75 % of all conducted photomosaic AUV surveys deliver data that can be processed into useful photomosaics. In other cases the visibility was poor, and the generation of photomosaics was not possible, even though some structures can be seen on the raw images. Each image is scanned for a number of feature points (e.g., via Speeded Up Robust Features (SURF) (Bay et al., 2006) or Scale Invariant Feature Transform (SIFT) (Panchal et al., 2013)) that describe a pixel neighbourhood. Feature pairs between overlapping images that correspond to the same world coordinate are established. They constrain the relative orientation and camera parameters of the image pair. The combination of points from multiple connected image pairs forms a sparse point cloud, which is subsequently extended into a dense point cloud by projecting additional pixels from the images. The dense point cloud is used as a basis for a digital terrain model (DTM) with millimetre resolution. The original images are projected on top of this DTM, creating a mosaic with a resolution of 2 to 5 mm per pixel. A typical photomosaic is based on 7000 images. In combination, DTM and mosaic allow visualising the entire scene in 2.5 dimensions. The entire workflow is described in greater detail in a practical guidance document by Mohrmann et al. (2025).
For this paper, 47 photomosaics of 39 munition piles were used. Some piles were investigated numerous times, originally with the aim of identifying potential changes in biofouling, corrosion, dissolution of explosives, or burial. All photomosaics were visually assessed by four experts. Every expert rated each munition pile with regard to the properties' variability, layering of objects, state of the fuze, state of corrosion of the casing, and burial state. For each property, a semi-quantitative rating scale was used (see Fig. 5). The assessment may inform future clearance decisions, that might be based on the projected complexity of the EOD operation. Hence, experts were asked to base their assessment on the single object that exhibits the strongest corrosion and strongest burial, as this object constitutes the most challenging case for performing EOD of that pile (Frey, 2025). The results section (Sect. 4.1) does not discuss the state of the fuze, due to a lack of information. Dumped munitions were usually not fuzed (Böttcher et al., 2011) and the experts used this assumption for their assessment. The exception is one pile in Kolberger Heide, where the type of munition suggests that fuzes might be present (Frey, 2025). Following this visual assessment, photomosaics were manually annotated by three experts. Each expert counted the number of munitions and measured the dimensions of an individually selected subset on each pile in the software Ocean Floor Observation Protocol (OFOP) (Huetten and Greinert, 2008). Since the area of each pile is known, the number of objects per m2 could be calculated. Figure 2 shows an example of an annotated photomosaic. Dataset B includes the experts' assessments of the pile's properties as well as the results of the annotations. If an expert's assessments and annotations of photomosaics of a pile across different photomosaics were inconsistent, the mean value was used. The published version of dataset B reflects the status quo of knowledge and annotations in April 2025.
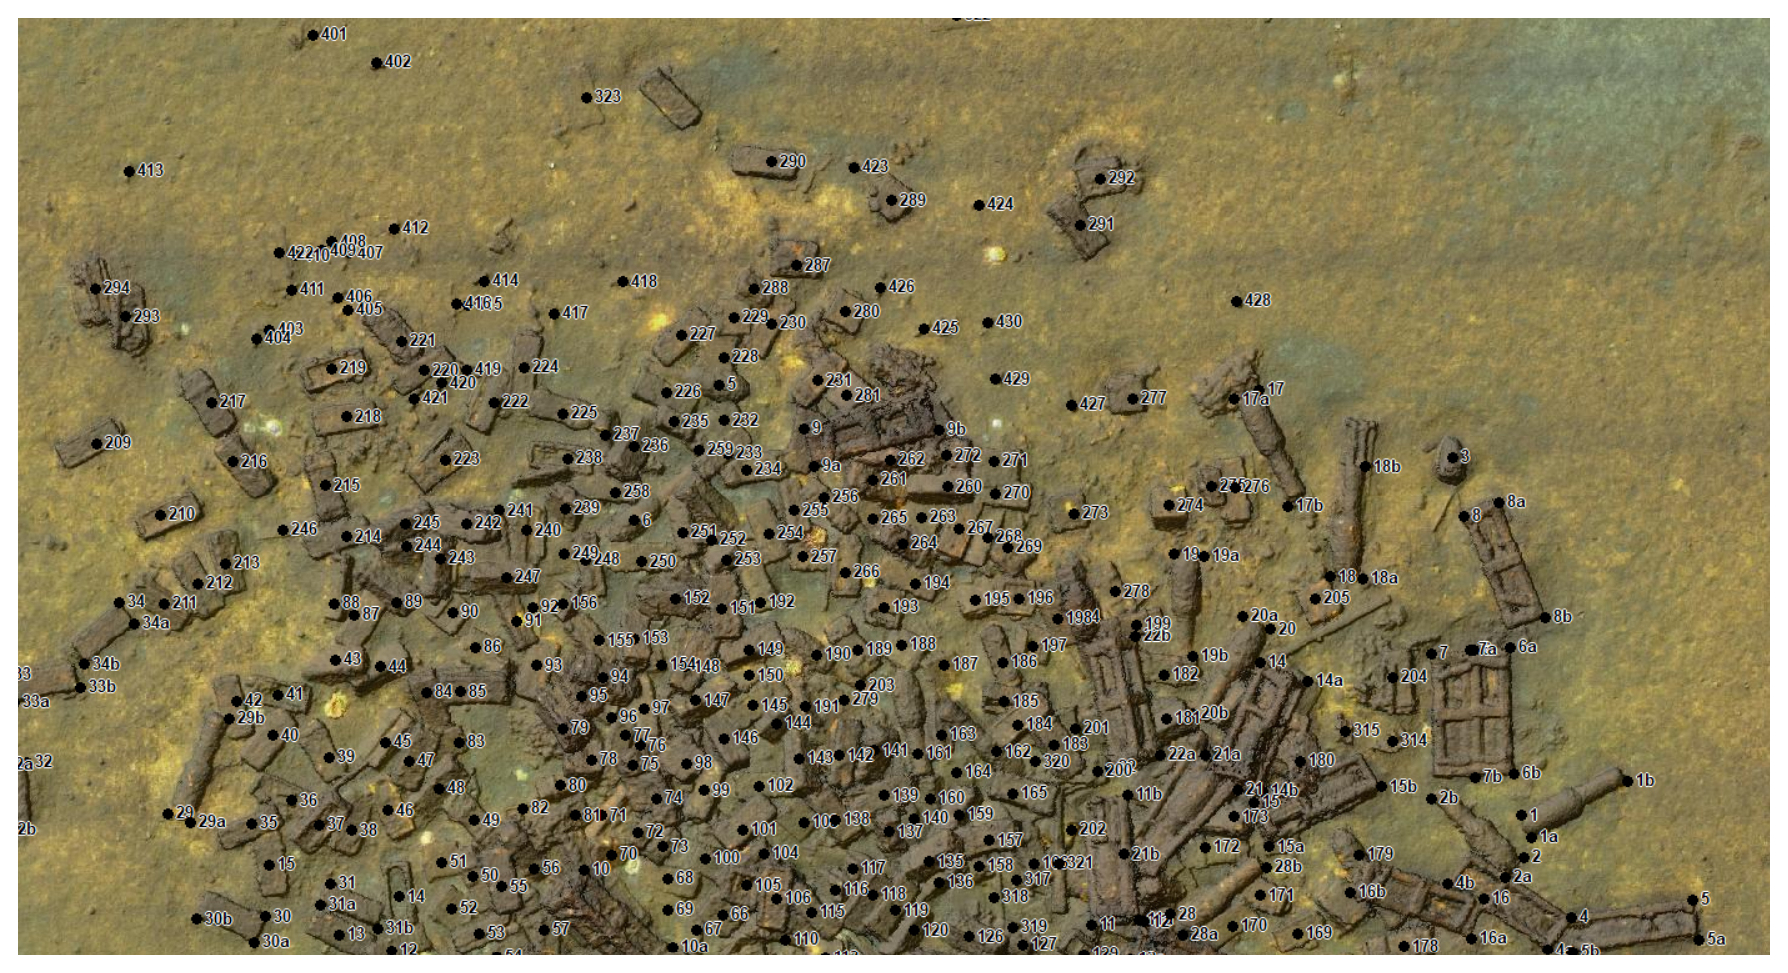
Figure 2Example part of an annotated photomosaic. The figure shows the northern half of munition pile Haf_00318 as annotated by expert 1. Numbers with lowercase letters indicate objects that were measured in two dimensions (e.g., objects 1 and 8 in the east). The expert counted 483 objects and measured 52 of them, with the largest one measuring 1.24 m in length (© 2026 DSM, GEOMAR).
To understand relationships between munition pile properties, they were assessed for possible correlations. Since only the variability of the piles is normally distributed, Pearson's correlation was not appropriate (Hauke and Kossowski, 2011). Instead, a Spearman's rank correlation coefficient (ρ) was calculated (Spearman, 1904) and tested for significance. Furthermore, an investigation of possible significant stochastic differences in munition pile properties among dump sites was undertaken. To this end, a Mann–Whitney U test was performed (Mann and Whitney, 1947) with Haffkrug and Pelzerhaken piles. Again, since munition pile properties were usually not normally distributed, a regular t test was not viable (Wall Emerson, 2023).
To extrapolate the number of objects from annotated photomosaics (dataset B) to all non-annotated known and suspected munition piles in Lübeck Bay (44 in Haffkrug and 387 in Pelzerhaken in dataset A), a log–log regression was performed (Benoit, 2011). Kolberger Heide was ignored since only one photomosaic was available. Based on the piles' areas, the number of objects was predicted per pile with , where y is the predicted number of objects, α is the log-intercept with the y axis (so that eα is the scaling constant), and β is the slope in log–log-space. Outliers in the number of objects and area exist in dataset B. They were included, since they represent real-world extremes that must not be considered measurement errors. A power trendline was fitted on dump-site-specific scatter plots to derive α and β. To account for residual scatter, for each pile, upper and lower statistical prediction bounds were calculated with and , respectively, at a confidence level of 95 %. Here, sϵ is the sample standard deviation of the residual error ϵ in log-space.
During the German immediate action programme for munitions clearance in the sea (Sichermann, 2024), a partial pilot EOD activity took place inter alia at pile Haf_00002. A post-clearance photomosaic of the pile is available but not included in dataset B. By comparing the annotated number of objects with the reported number of cleared objects, a correction factor for the extrapolation was calculated. Resulting extrapolations were used for mass predictions on a mass-per-area and a mass-per-object basis.
3.2 Maritime data collection and use
OSPAR distinguishes between munition encounters during diving, dredging, fishing, mine hunting, cable and pipeline laying, underwater construction, finds on shore and other (e.g., OSPAR Commission, 2021, 2024). In an assessment of munitions and their impacts in the Baltic Sea, HELCOM discusses effects on fishers, offshore construction workers and nautical personnel, harbour workers, recreational divers, beach visitors, and seafood consumers (HELCOM, 2025).
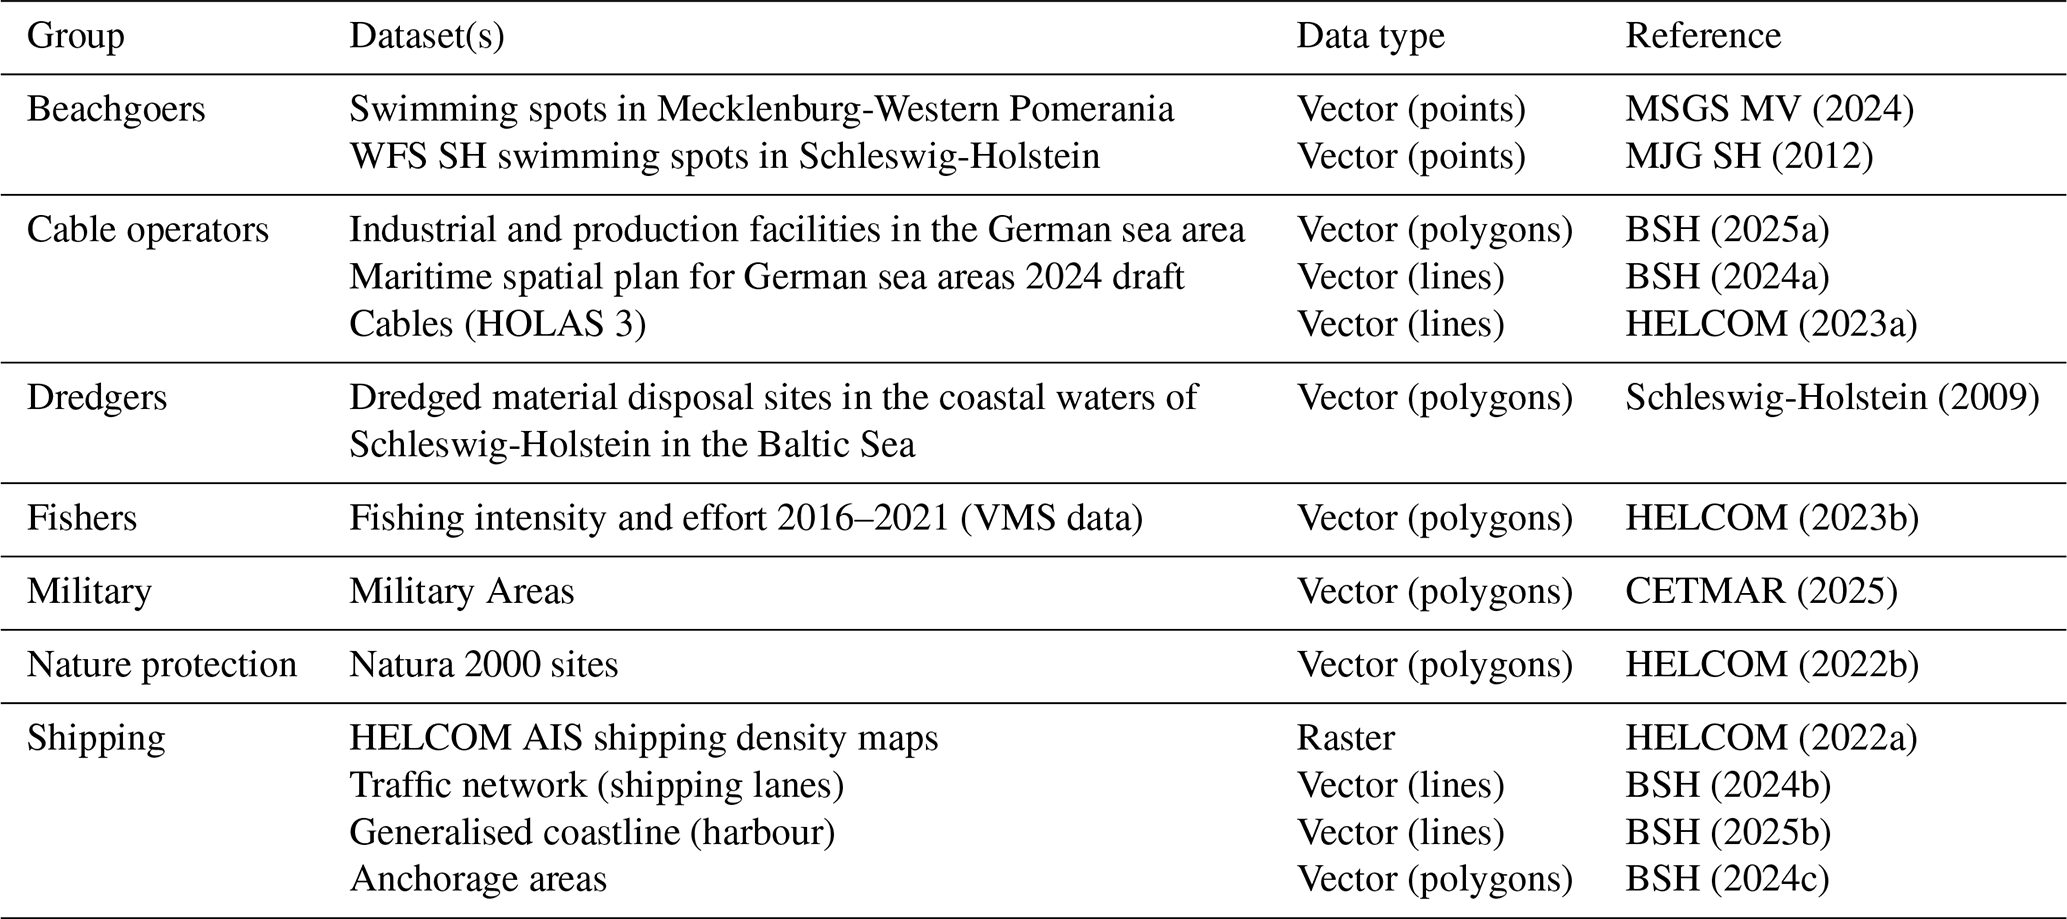
Next to munition pile properties, dataset A also contains a wide array of other data. They include environmental properties (e.g., current velocity, water depth, sediment type at the piles' locations), maritime use data (e.g., distances to maritime activities, traffic density, fishing intensity), and munition-related contamination (e.g., in water and biota). The dataset includes a reference to a handbook (Frey et al., 2026b), that details the data origin, rationale for data selection, and processing steps. In this paper, we do not discuss all of these data but focus on hazard implications for various forms of maritime use. The paper shows and discusses the distributions of munition pile distances to nature-protected areas, bathing sites, cables, sediment deposite sites, and shipping lanes. It also assesses traffic density of passenger, cargo, and other vessels over clusters of munition piles. The discussion on the affected groups in this paper (see Sect. 4.3), is based on the datasets that are listed in Table 1. Most of these data represent official maritime spatial allocation and do not necessarily reflect real-world use. Traffic density maps are the notable exception.
MSGS MV (2024)MJG SH (2012)BSH (2025a)BSH (2024a)HELCOM (2023a)Schleswig-Holstein (2009)HELCOM (2023b)CETMAR (2025)HELCOM (2022b)HELCOM (2022a)BSH (2024b)BSH (2025b)BSH (2024c)Table 1Dataset overview for groups and sectors that are potentially affected by munition piles in the German Baltic Sea.
This paper does not assess all groups that are mentioned in the literature with similar detail. The (German) navy is not considered an affected party, as its interactions with munitions in the sea are voluntary, e.g., during mine hunting exercises. Underwater construction and offshore development, although affected by dispersed munitions (Frey, 2025), mostly avoid highly contaminated areas (European Subsea Cables Association, 2018), which are the focus of this paper. Seafood consumers are absent from this paper since concentrations of explosive compounds in seafood are currently not considered to be of concern for consumers (Beck et al., 2022). In addition, with current data it is not possible to attribute explosive compound concentrations to every individual munition pile. Concerning divers, no reliable maritime use data that would allow discussing their hazard could be found. Basing the assessment on water depth data alone was considered insufficient.
Where necessary (beachgoers, cable operators, shipping), data were merged into a single data layer for further use. For fishing, annual data per polygon (which align with c-square) were added up to a total value. Based on their location, fishing intensity values were assigned to piles. For shipping data, the year 2022 was selected, as it was the only year that included a distinction of vessel types. This allowed for an assessment of the hazard implications of, e.g., cargo and passenger ships.
To discuss the hazard that munition piles may pose to maritime activities, the shortest Euclidean distances between each munition pile's centroid and nature-protected areas, bathing sites, cables, sediment deposite sites, and shipping lanes (a merged dataset of the shipping lanes proper, anchorage areas, and harbours) were measured. The map in Fig. 3 shows these maritime activities, as well as areas that are used by the military. To visualise the distribution of distances, an unnormalised kernel density estimation was performed (Rosenblatt, 1956). A bandwidth of h=5 was determined visually, which is a common approach (Krisp et al., 2009), to avoid both overfitting and oversmoothing resulting curves.
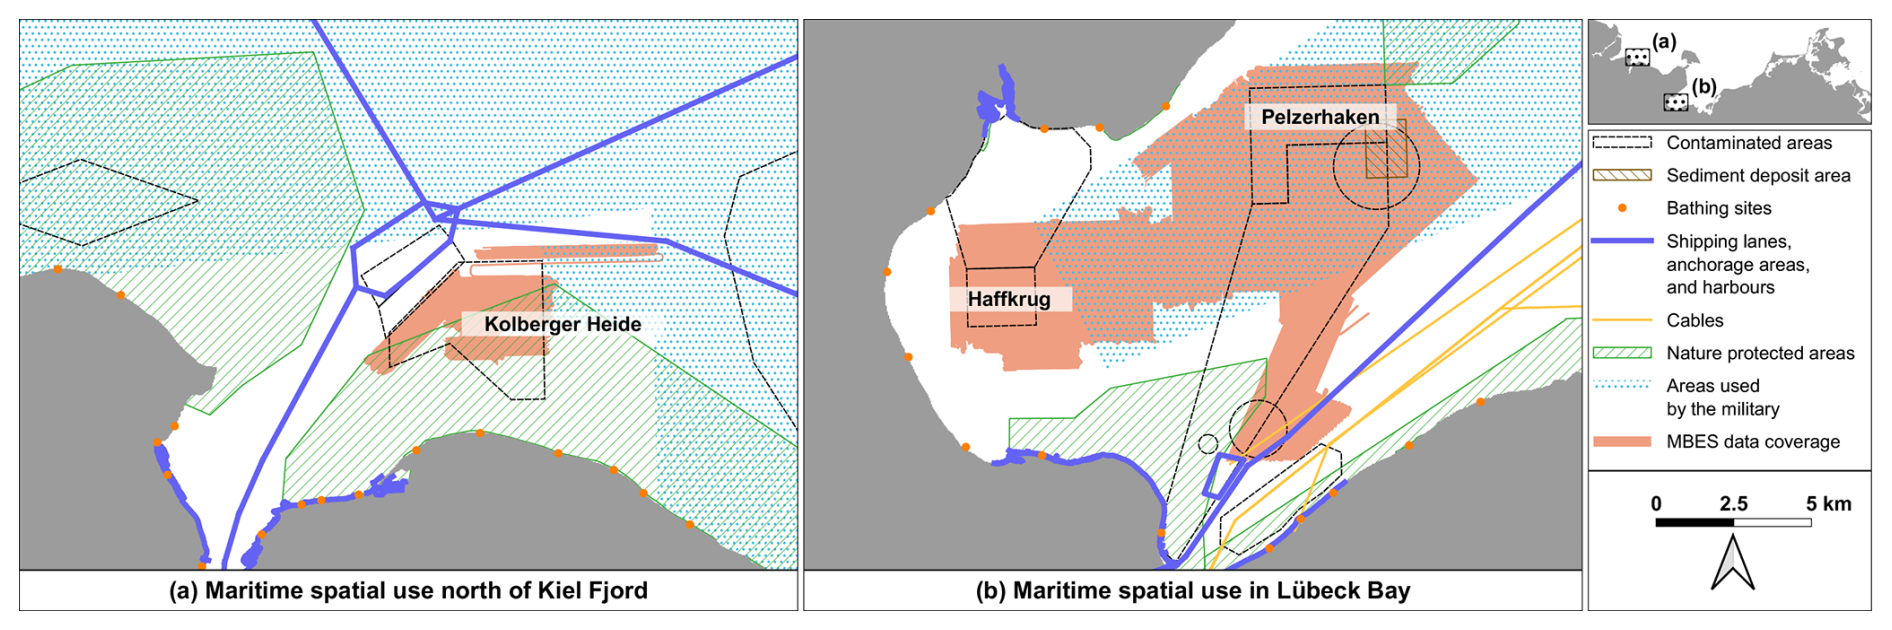
Figure 3Maritime spatial use north of Kiel Fjord and in Lübeck Bay.
Another aspect of maritime use is traffic density. For the analysis, HELCOM AIS shipping density maps were used. Vessel density is measured as the aggregate number of IMO-registered ships crossing each raster cell annually (HELCOM, 2022a). For all vessel types merged, data from 2016 till 2022 were available, and a mean annual traffic density was calculated. For individual vessel types, 2022 data were used. The HELCOM data were subdivided into the following vessel types: cargo, container, fisheries, other, passenger, roro cargo, service, tanker, and unknown. For this paper they were converged into three categories:
-
Passenger ships for which munitions pose the greatest human risk, consist of HELCOM type passenger.
-
Cargo ships for which munitions pose the greatest economic risk, consist of HELCOM types cargo, container, roro cargo, and tanker.
-
Other ships consist of HELCOM types fisheries, other, service, and unknown. Fishing vessels were not assessed individually with this dataset. AIS data only track vessel location, while vessel monitoring system (VMS) data inform about fishing activities (see Table 1).
Resulting grids were smoothed with a Gaussian kernel with standard deviations of σ=1 for 1×1 km2 and σ=2 for 0.5×0.5 km2 grids and a kernel size of h=32. For both resolutions, σ corresponds to 1 km. It was selected since 500 m constitutes the minimum safety radius that is usually observed during EOD operations (e.g., SeaTerra, 2025). Resulting smoothed traffic density values were then sampled at munition pile centroids. This method allows weighting traffic density with distance to target piles while avoiding harsh cutoffs at boundaries.
To assess traffic density in relation to munition piles, the latter were clustered geographically with DBSCAN in QGIS. In contrast to k-means clustering, DBSCAN allows for more complex cluster shapes (Ester et al., 1996). The minimum number of points per cluster was set to the default value for 2-dimensional data (minPts=4). The maximum allowed Euclidean distance between clustered points was defined as ϵ=1500 m. Points for which minPts or ϵ were not satisfied were not assigned to any cluster, unless they are border points. Determining the maximum allowed Euclidean distance by the visual or a mathematical elbow method, did not yield useful clusters or excluded too many points.
A minor methodological constraint is the fact that munition piles are areas in reality but are treated as centroid points for this analysis. Measured distances will be slightly greater for centroids than for areas (with an error that is typically <25 m). This also applies to the distance measurement of ϵ for clustering purposes. In addition, a munition pile may in reality lie in more than one traffic density grid cell. Here it is treated like being located at the centroid location. The Gaussian kernel smoothing of traffic density data mediates this case if it exists.
This section describes datasets A and B. It also discusses some analyses that were conducted with the help of these datasets and the data listed in Table 1. Below, Sect. 4.1 shows that most piles and objects are located inside demarcated dump sites and contaminated areas. Nonetheless, a significant number of piles was detected outside these bounds. It also concludes that a typical munition pile in the study area is not homogeneous in terms of munition types, it is most likely layered, partially buried, and munition casings exhibit a weak degree of corrosion. Section 4.2 discusses that the majority of munitions that were supposedly dumped after the war are either not present in the area or have not yet been detected. Finally, Sect. 4.3 addresses maritime hazard implications. Protected areas and sediment deposit sites tend to be located closest to the munition piles. It also identifies six spatial clusters of munition piles. Two of these are located in areas of very high traffic density.
4.1 Munition piles and their properties
The inventory of munition in the German Baltic Sea is a living dataset. Dataset A contains 484 potential munition piles. Of these, 149 have been confirmed, by AUV dives, ROV dives, and towed cameras (see Sect. 3.1.1). This leaves 335 piles unverified. In addition, 20 piles have been confirmed not to be munitions and are not included in dataset A. In addition, 2407 individual scattered objects that are not allocated to a pile have been annotated, 325 of which have been confirmed to be munitions. Another 46 were found to not be munitions. These numbers demonstrate that MBES annotations are successful, with less than 15 % of the investigated piles and objects turning out to be false positives.
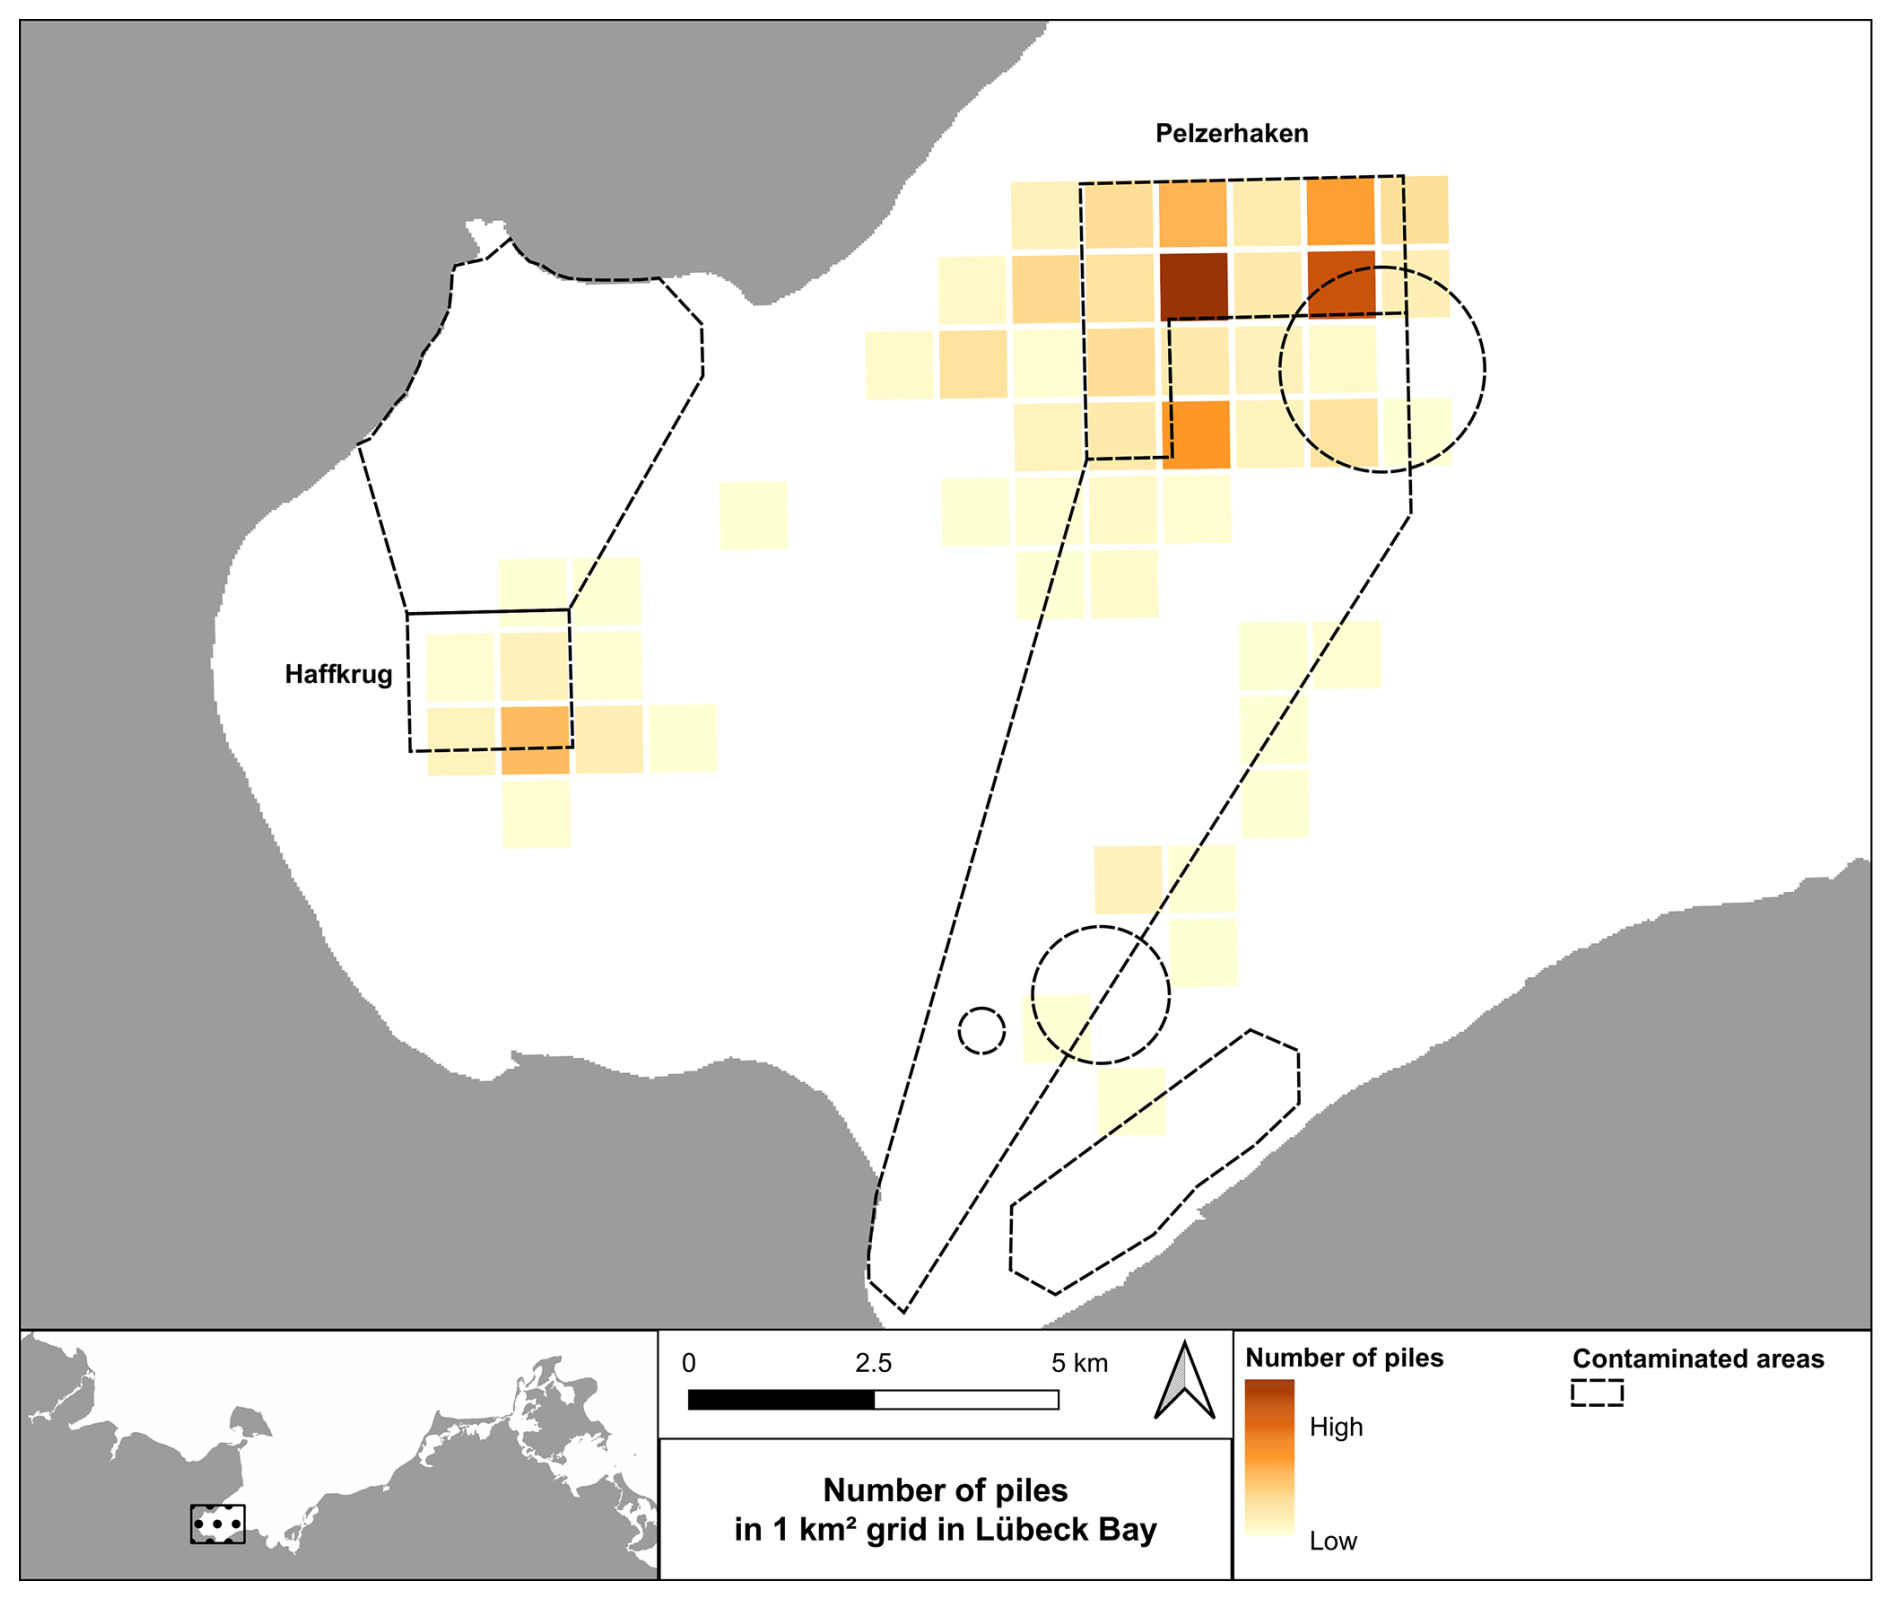
Figure 4Number of potential and confirmed munition piles in a 1 km2 grid in Lübeck Bay.
The map in Fig. 4 shows the 1 km2 INSPIRE grid (EEA, 2013) in Lübeck Bay, where the colour of each cell signifies the number of munition piles located inside. It is apparent that concentrations are highest inside the official munition dump sites. However, a considerable number of 77 piles is located outside of dump sites and areas otherwise marked as contaminated. Another observation is that the number of both piles and objects is considerably higher in the area known as Pelzerhaken to the north-east compared to the Haffkrug area further to the south-west. For the discussion in this paper, we allocate each pile to a dump site, even if they are not located within the boundaries. This amounts to 414 piles in Pelzerhaken and 54 piles in Haffkrug. The easternmost column in the Pelzerhaken site is missing a grid cell. This is due to the presence of blast furnace slag and fly ash that were dumped in the area, potentially covering pre-existing munitions (Kampmeier et al., 2021; LASH, 1960). In Kolberger Heide 16 piles (3 outside the dump site) were annotated and included in dataset A. The geological conditions at the site make it challenging to identify piles and impossible to discriminate individual munitions from geological objects such as boulders.
Figure 5 shows the results of the photomosaic-based munition pile assessment and annotation. In each chart the leftmost bar represents the most favourable condition for EOD. The expected complexity of a remediation operation increases to the right. Figure 5a through d uses the rounded values of the expert assessments for each pile. They exhibit a distribution around central rating classes. This means that munition piles with very favourable or unfavourable properties are rather uncommon. Figure 5e and f shows the largest object size and the median object size on a pile. Unsurprisingly, the median object sizes on piles are smaller than the largest objects' sizes. In combination with the variability chart (Fig. 5a), it is possible to assume that many piles comprise many objects of similar size and a couple of larger objects. Finally, Fig. 5g indicates that roughly half the piles consist of more than 100 objects. Many objects that were annotated are boxes, so that the number of individual munitions in the piles will often be considerably higher. In summary, a typical munition pile in the study area is not homogeneous but contains at least a few different types of munitions or boxes. It is most likely layered, with objects on top of each other, and munition casings exhibit a weak degree of corrosion. At least some of its objects are partially buried.
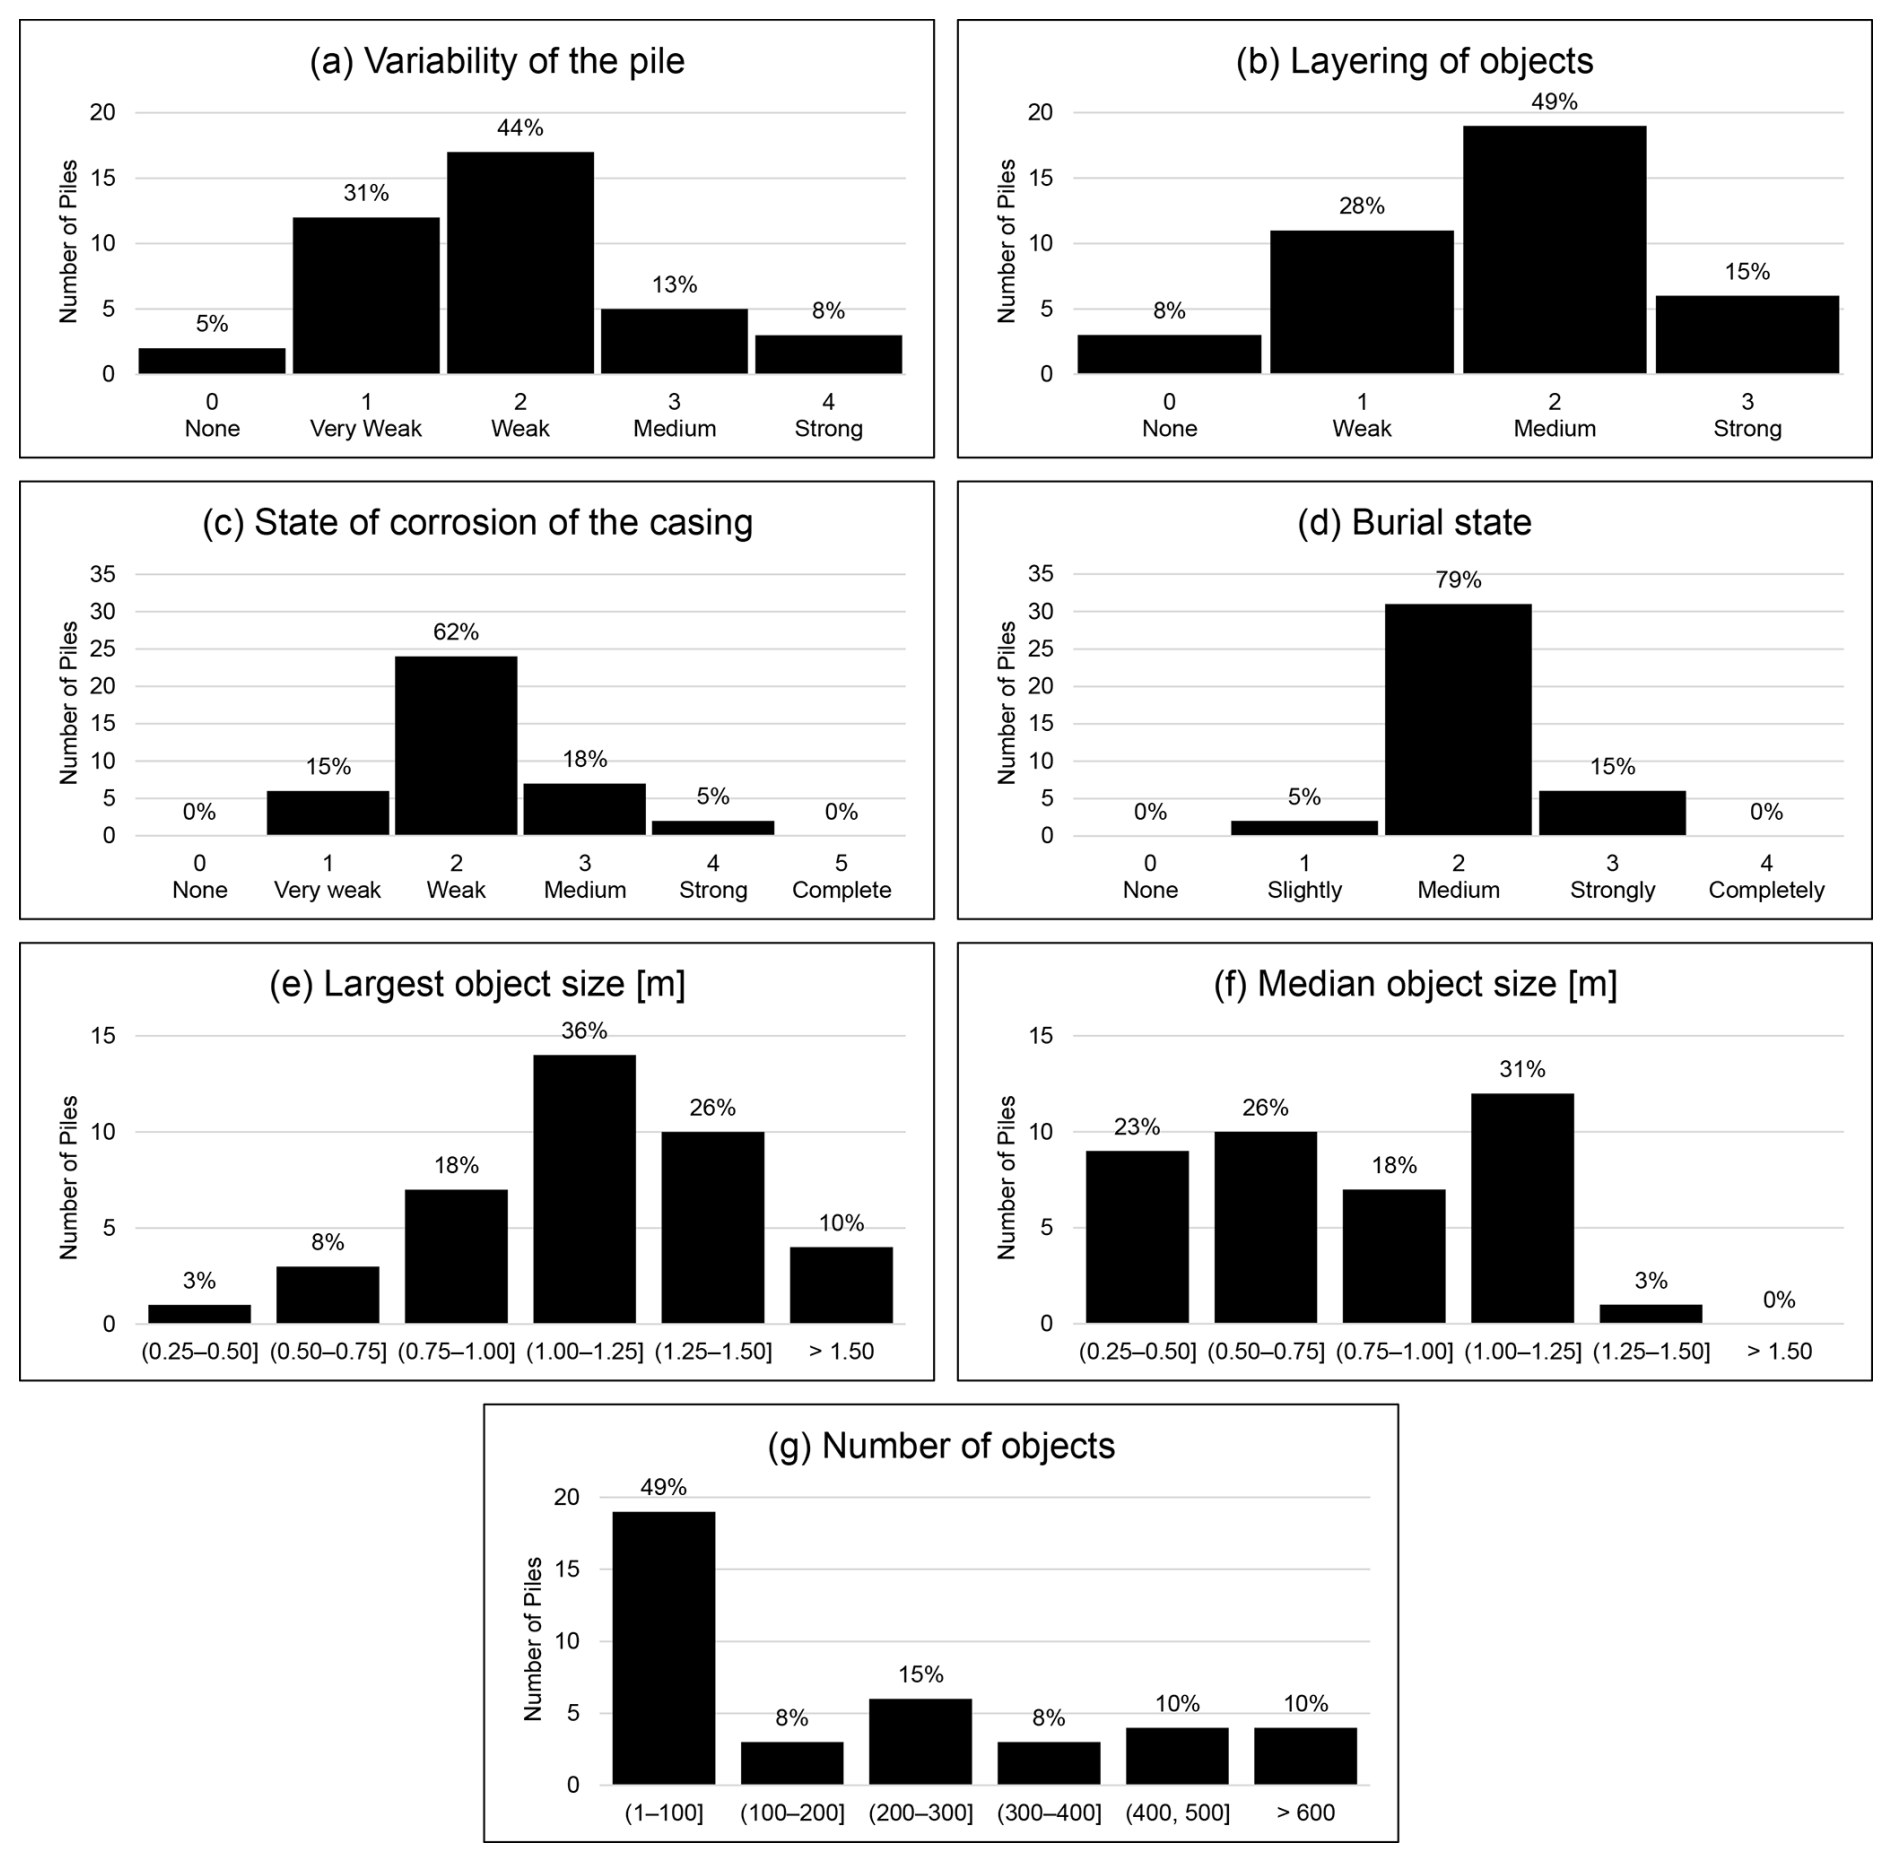
Figure 5Distribution of various munition pile properties. (a) Variability of the pile (none, very weak (e.g., only one or two objects differ from the main type, two types of munition boxes), weak (e.g., several types of munition boxes), medium, strong (very disorderly)). (b) Layering of objects on a pile. (c) State of corrosion of the casing (none, very weak (assumed no corrosion/corrosion at the surface), weak (holes and cracks visible/deformation due to corrosion), medium (large holes), strong (over 50 % gone/almost complete corrosion), complete (complete corrosion/loose explosives)). (d) Burial state – not buried, a little buried (scour visible), medium buried, strongly buried (identification not possible), completely buried (only for magnetic data). (e) Largest object size. (f) Median object size. (g) Number of objects.
The matrix in Table 2 shows the results of Spearman's rank correlation tests. Asterisks indicate the significance of the correlation coefficients. The strongest significant correlation was found between the number and layering of objects. The variability of the pile positively correlates with layering and number of objects (strong correlations (Schober et al., 2018)) as well as area (moderate) and negatively with the median object size (moderate). Similar correlations can be observed between the layering of the objects and the median object size (moderate negative) as well as the area (moderate positive). Notably, there is a positive moderate correlation between the area and the number of objects. This allows for some extrapolations in terms of the total number of objects in the dump sites (see Sect. 4.2).
Table 2Spearman's correlation coefficients (ρ) between munition pile properties.
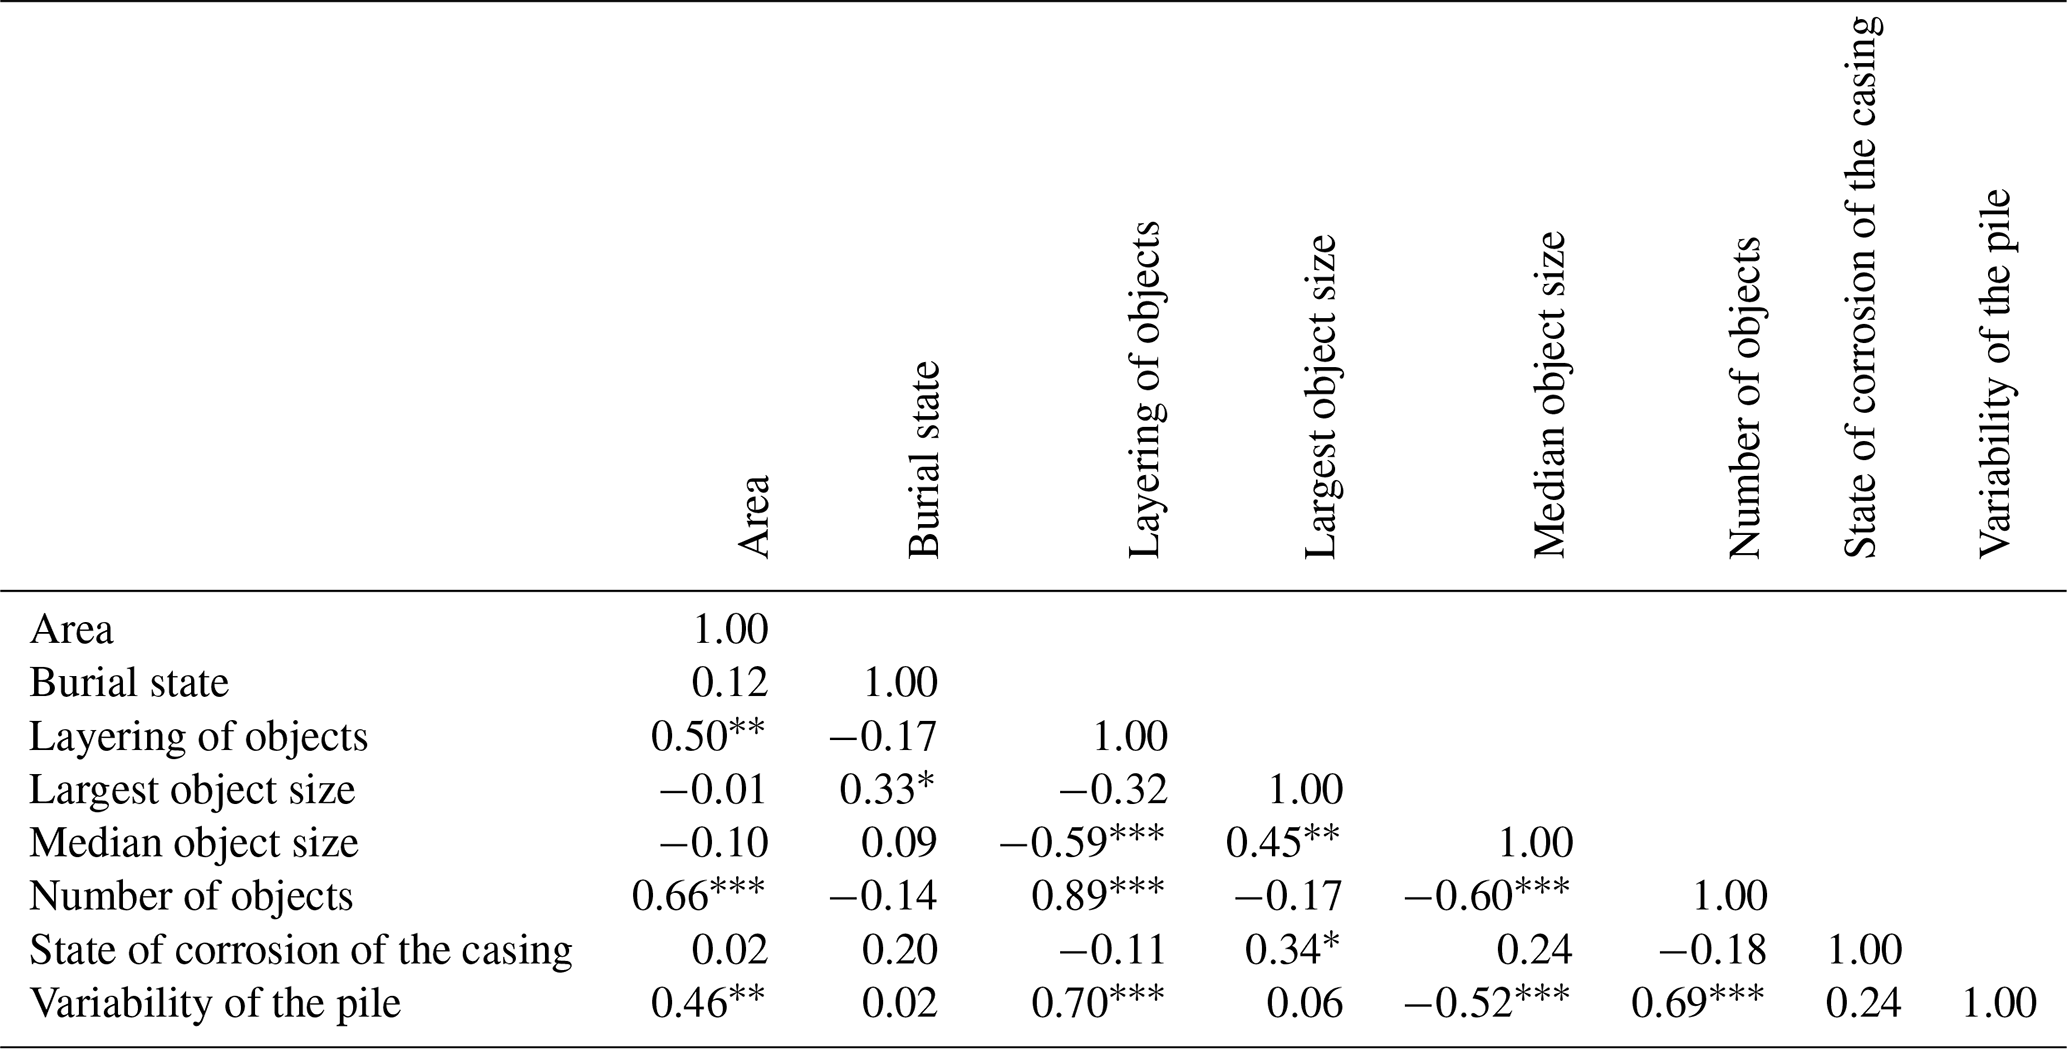
Asterisks indicate significance: * p<0.050, p<0.010, p<0.001. Non-significant values are not marked.
Table 3 summarises the results of the Mann–Whitney U test and compares medians and interquartile ranges (IQRs) overall and per dump site for each property. If p<0.050, a significant stochastic difference between both groups exists, i.e., one group tends to produce larger or smaller values than the other. The difference may be explained by shape, spread, or tails, the medians, or combinations thereof. Significant stochastic differences between dump sites exist for the layering of objects, the largest object size, the median object size, and the number of objects on a pile. In Haffkrug it can be assumed that a considerably greater number of objects are present per pile and that their layering is stronger. Larger objects must be expected in Pelzerhaken, where Q1=Q3 of Haffkrug. The IQR for the median object size in Pelzerhaken is over 2 times greater than that in Haffkrug. This is an indication that the Pelzerhaken dump site exhibits a greater variety of dumped munition types. Despite differing median and quartile values among dump sites, no such statements can be made for the burial state, state of corrosion, and variability of a given pile. Particularly the burial state shows little spread with an IQR of 0.5 over all piles. Remarkably, no significant difference was found for the area. In light of the difference in the number of objects and the significant correlation between the pile area and number of objects found in Table 2, this is a surprising result. It may be attributed to imprecise annotations, the MBES raster's resolution of 0.25 cm × 0.25 cm, and gaps between objects on piles (especially those with large objects). In summary, the results of the Mann–Whitney U test demonstrate that some dump-site-specific pile properties can be observed. They allow for reasonable assumptions on the properties for all those piles for which no visual information is currently available.
Table 3Munition pile properties – sample size (n), median (), first and third quartile (Q1) and Q3, respectively) – in Lübeck Bay differentiated for dump sites Haffkrug and Pelzerhaken.
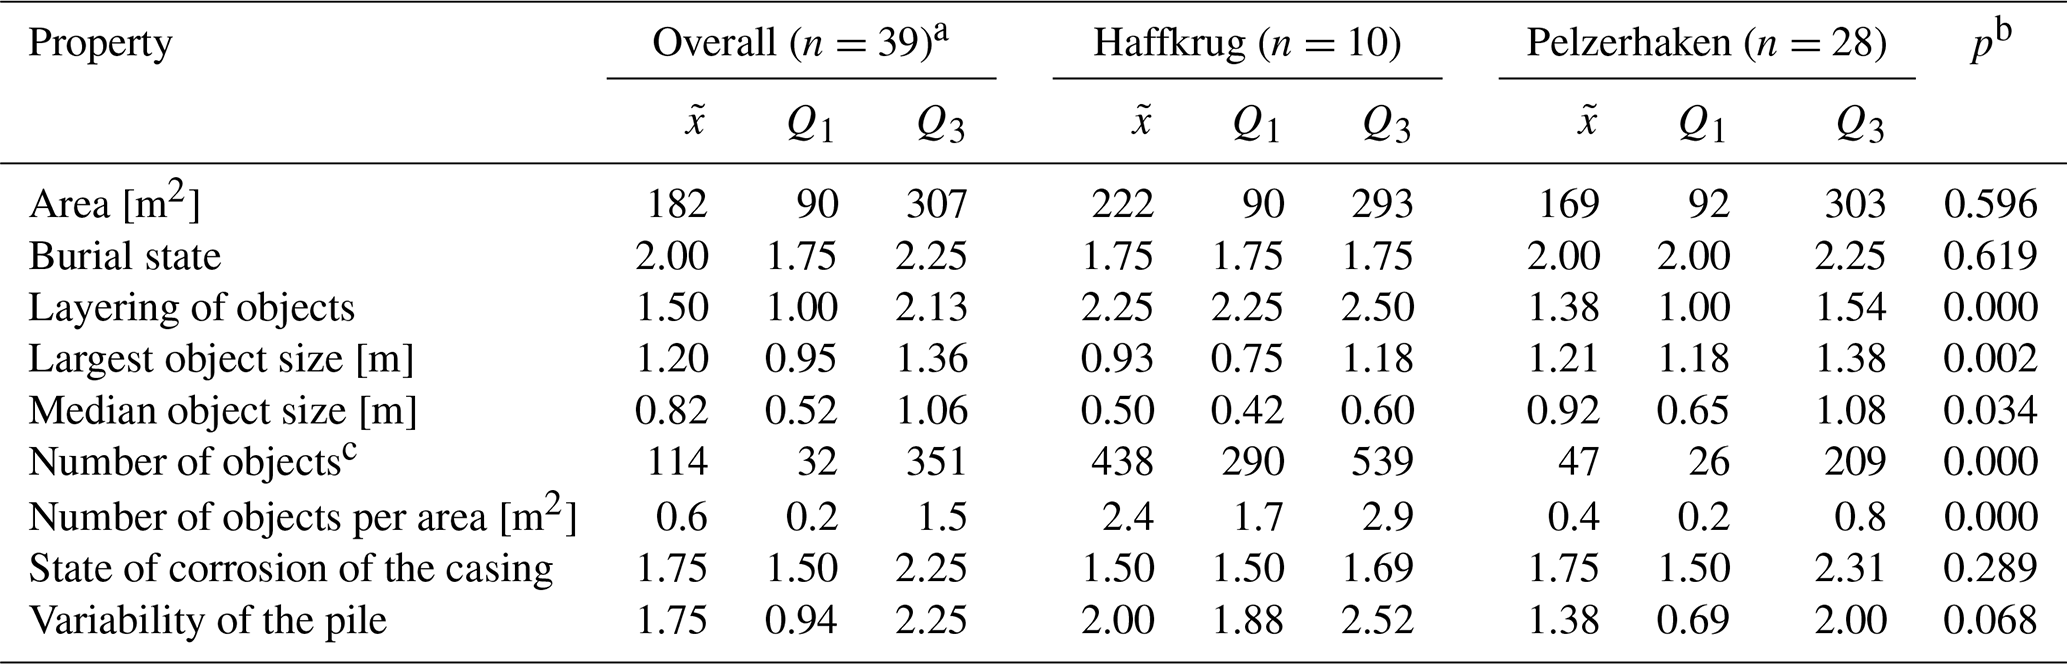
a Dataset B includes one munition pile from Kolberger Heide that was assessed and annotated. b p value of the Mann–Whitney U test, with Haffkrug piles as group 1 and Pelzerhaken piles as group 2. c Numbers have decimal places, since each pile's value is a mean of the count of the three experts who performed the annotation.
4.2 Extrapolation of the number of objects
The significant correlation between the area of a pile and the number of objects (see Table 2) invites speculation on the total number of objects in each dump site. Extrapolation allows for such an estimate without having to survey and annotate each pile. A Mann–Whitney U test of the number of objects per area revealed that Haffkrug and Pelzerhaken exhibit significant stochastic differences (see Table 3). Power trendlines expressing the relationship of the number of objects over the area yielded scaling constants of eα=42.409 and eα=0.071, slopes of β=0.416 and β=1.342 and sample standard deviations of the residual error of sϵ=0.305 and sϵ=0.546, respectively. These numbers were used for the extrapolations.
During the partial pilot clearance of Haf_00002, 157 objects with a total mass of 5895.9 kg (SeaTerra, 2025) were cleared on 26.8 % of the pile's area. On a pre-clearance photomosaic, expert annotation of that sub-area counted only 96 cleared objects. The resulting ratio of 1.635 can likely be attributed to limited visibility during the annotation process, e.g., due to layering or burial. The ratio was applied as a correction factor to the extrapolated numbers of objects per pile.
Without consideration of the residual error, (rounded) numbers of objects per pile range from 5 for Pzh_00108 to 6504 for Pzh_00222, both of which were annotated. When uncertainty from the regression residuals is considered, the low-case scenario predicts numbers between 2 objects for Pzh_00095 and 6504 objects for Pzh_00222. The high-case scenario ranges from 5 objects for Pzh_00108 to 16 485 objects for Pzh_00218. In Haffkrug, the extrapolated total number of objects is 25 777 (or ranging from 17 249 to 41 275 when considering the residual error). In Pelzerhaken, the predicted number is 79 734 objects (or 34 686 to 210 961). These numbers do not include the individually scattered objects that are not assigned to any pile.
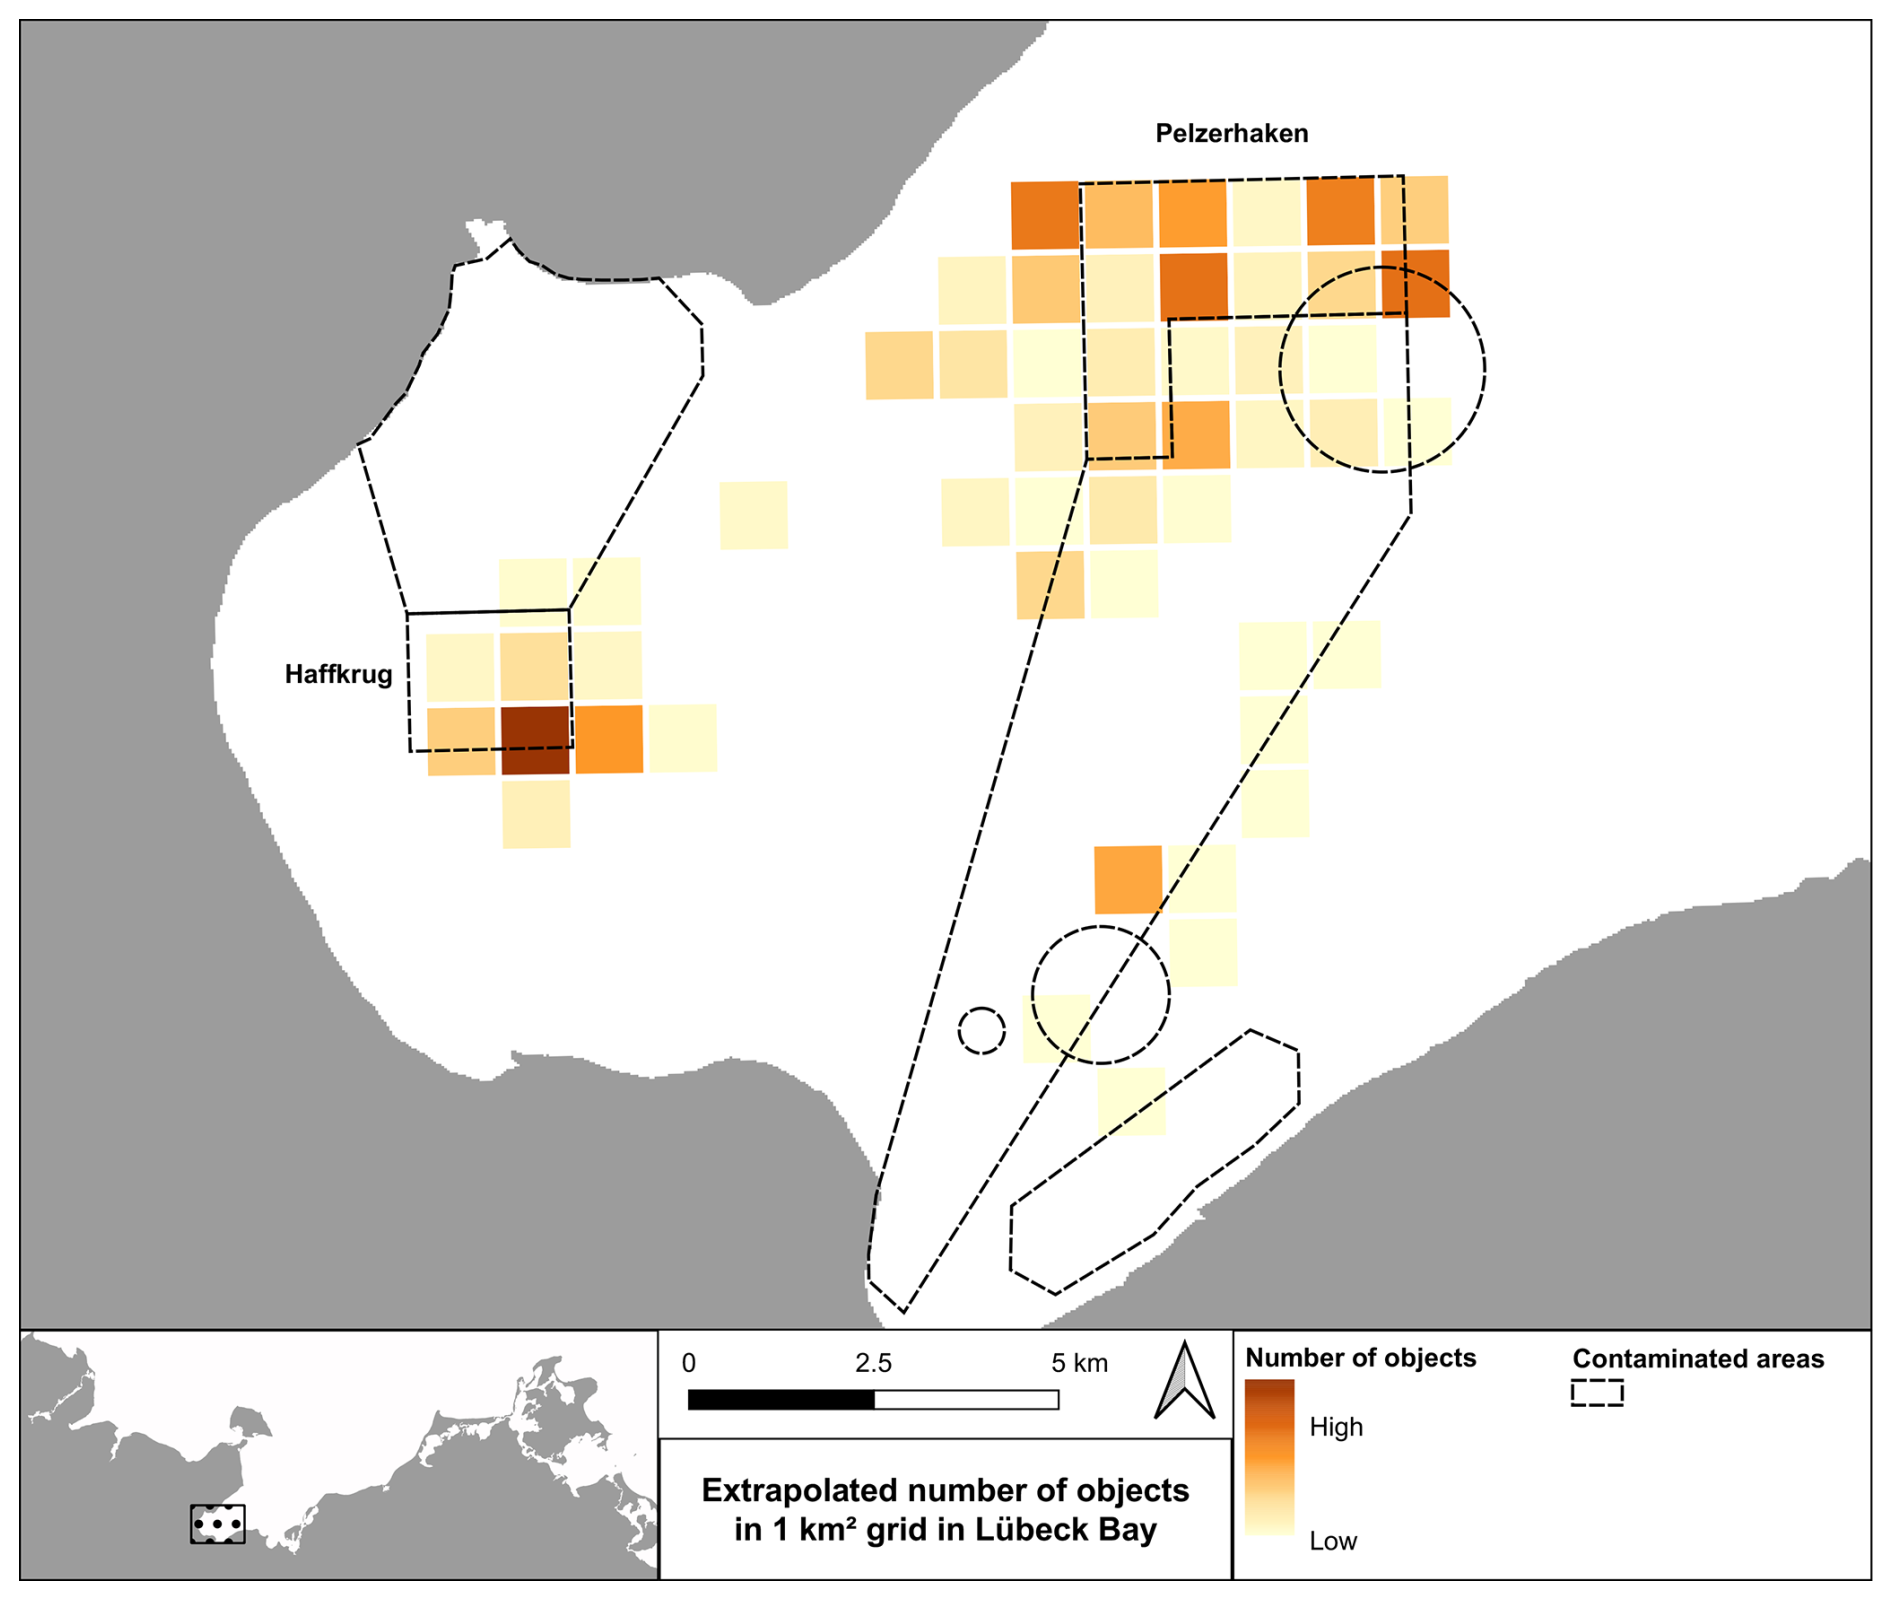
Figure 6Extrapolated number of objects (boxes or munitions) in a 1 km2 grid in Lübeck Bay.
Figure 6 shows the results of the extrapolation without the residual error in 1 km2 INSPIRE grid cells. It shows many similarities with Fig. 4, particularly concerning areas with low contamination. Few munition piles generally lead to a low extrapolated number of objects. Some remarkable differences are visible in areas of higher contamination. A grid cell in Haffkrug is projected to contain most objects, while it contained a medium number of piles. This variation can be attributed to the higher number of objects per area when compared to Pelzerhaken (see Table 3). In Pelzerhaken, effects of the log-log regression are visible: the extrapolated number of objects does not scale linearly with the number of piles.
Finally, two approaches were used to extrapolate the cleared mass from Haf_00002 to all munition piles in Lübeck Bay. These are a mass per object approach (37.6 kg per object) and a mass per area approach (83.6 kg m−2). Following the first approach, a total of 3961 t (968 t in Haffkrug and 2993 t in Pelzerhaken) were detected and annotated in MBES data. Under consideration of the uncertainty from the regression, the total mass ranges from 1950 to 9469 t. According to the mass per area approach, the mass amounts to 7152 t (635 t in Haffkrug and 6517 t in Pelzerhaken). Both approaches are imprecise and simplified. Nonetheless, these are the best possible approximations based on currently available survey data. Historical references point to 50 000 t of munitions that were dumped in Pelzerhaken and 15 000 t in Haffkrug (HELCOM, 2025), 16 000 t of which were removed later (Bünning et al., 2025). This disparity may be due to various factors, including potential burial of objects, the resolution in MBES data which does not allow detecting small objects (Wehner and Frey, 2022), removal or dispersion of objects by fishers, and imprecise numbers in the historical records (Böttcher et al., 2011). The most likely scenario is burial under blast furnace slag that was deliberately dumped on top of the munitions (LASH, 1960).
4.3 Maritime hazard implications
The violin charts in Fig. 7 summarise distance measurements of munition piles to various maritime spatial uses. Protected areas (Fig. 7a) tend to be closest to munition piles (with a median of m), with 14 piles being located inside them and none further away than 5 km. The median m is even lower for sediment deposit sites (Fig. 7e) with 9 piles located inside. However, 69 munition piles (all in Kolberger Heide and all but one in Haffkrug) are located further away than 10 km. The low median is therefore driven by piles in the Pelzerhaken area. Cables are located furthest away ( m), with only 16 munition piles being closer than 4 km and 16 piles being further away than 10 km. The distribution is widest for sediment deposit sites and cables, which contain 72 and 32 outliers, respectively. The full width of the distributions is not visible in Fig. 7, as it only shows distances of up to 10 km. A narrower distribution can be observed for the distance to shipping lanes (Fig. 7b). These happen to pass by munition dump sites at a rather uniform distance (see Fig. 3) with m. Bathing sites (Fig. 7c) exhibit a relatively narrow distribution with m and no outliers. It ranges roughly from 1.5 to 7 km, with the majority of piles being grouped around the median. In Fig. 7, black-framed nodes show medians. The Tukey-style whiskers show and . According to the IQR rule, all piles outside these whiskers are considered outliers (Tukey, 1977). Concerning the detonation hazard, the number of piles closer than 500 m to maritime uses is relevant. These amount to 19 piles for protected areas, 2 for shipping lanes, none for bathing sites, 1 for cables, and 89 for sediment deposit sites. Overall 399 munition piles are located inside a military underwater exercise area. Of the remaining 85 piles, the median and maximum distances to any military area are 1894 and 4784 m, respectively.
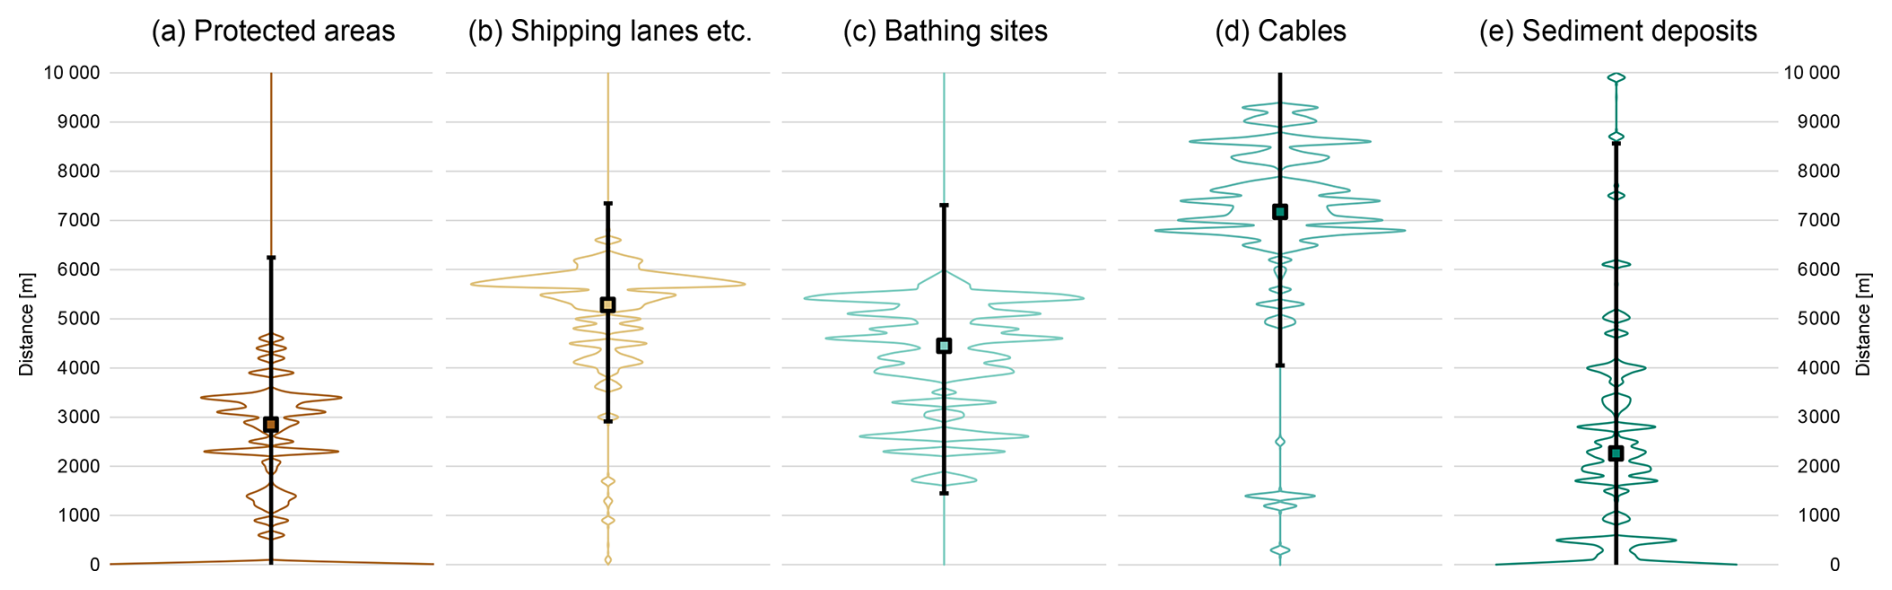
Figure 7Violin diagrams with the distribution of distances of munition piles to various maritime spatial uses – (a) protected areas, (b) shipping lanes, anchorage areas, and harbours, (c) bathing sites, (d) cables, and (e) sediment deposit sites. The diagrams represent Gaussian kernel density estimates of the distances with a bandwidth of h=5. Black-framed nodes show medians (), and Tukey-style whiskers show 1.5×IQR. Notes: (a, e) piles inside protected or deposit areas are shown as located at a distance of 0 km. (d, e) Piles with a distance > 10 km are not displayed.
Figure 8 shows maps of the area north of Kiel Fjord (Fig. 8a) and Lübeck Bay (Fig. 8b). They display the locations of geographic munition pile clusters. Outlines of clusters follow the same 1 km2 INSPIRE grid that was used for the pile counts in Figs. 4 and 6. The background shows the smoothed mean annual traffic density, also at a 1 km2 resolution. Cluster 1 (n=8, Area A=2 km2) is located in the north-west and cluster 2 (n=8, A=5 km2) in the south of Kolberger Heide. Cluster 3 (n=53, A=10 km2) covers most of the Haffkrug dump site and an area to its east. Cluster 4 (n=398, A=32 km2) is by far the largest one in terms of size and munition pile count. It spaciously covers the Pelzerhaken dump site and its surroundings to the west and south. Finally, clusters 5 (n=4, A=3 km2) and 6 (n=10, A=4 km2) are located along the historical route towards the same dump site. Piles that are included in dataset B (annotated and visually assessed piles) are located in clusters 2 (n=1), 3 (n=10), and 4 (n=28). Only 3 munition piles are not assigned to any cluster.
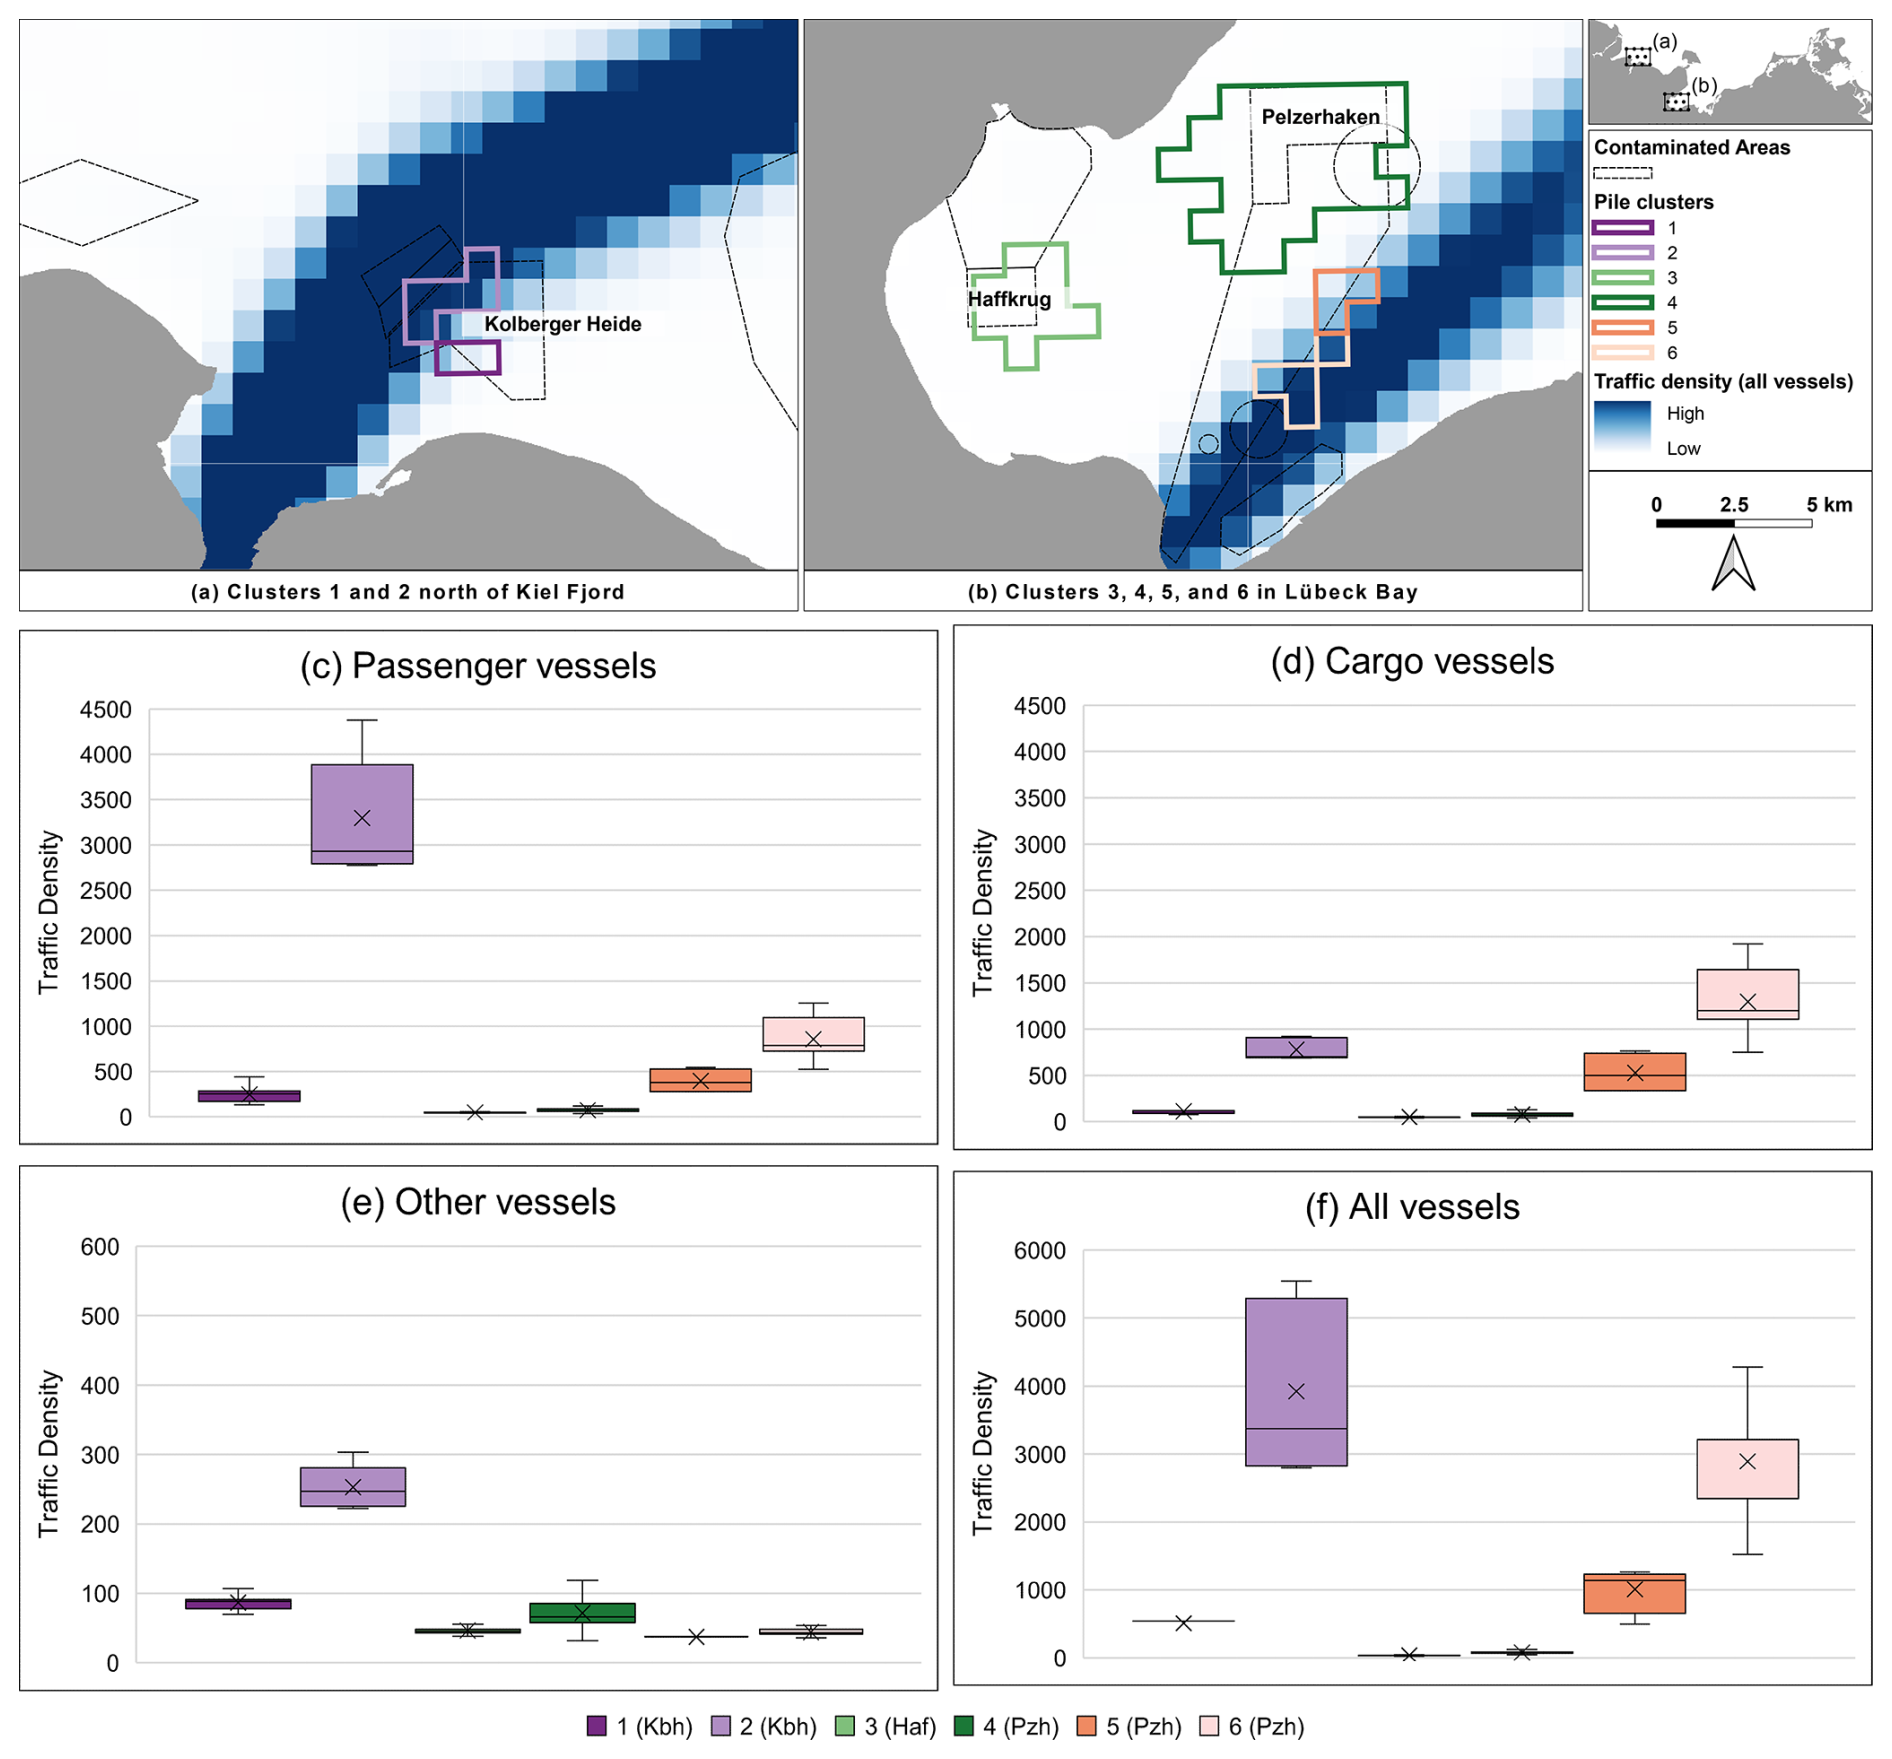
Figure 8Traffic density and munition pile clusters. Maps of (a) Kolberger Heide and (b) Lübeck Bay with six munition pile clusters, munition-contaminated areas, and smoothed traffic density for all vessel types (annual mean for the years 2016 to 2022). Box plots with Tukey-style whiskers of traffic density at munition pile location for six munition pile clusters for (c) passenger vessels in 2022, (d) cargo vessels in 2022, (e) other vessels in 2022, and (f) all vessel types (annual mean from 2016 to 2022). Note the differing y axis scales. Missing whiskers indicate that minimum or maximum values equal Q1 or Q3, respectively. A missing horizontal median bar inside the box indicates that the median equals Q1 or Q3. Both effects occur more commonly with small sample sizes. Crosses indicate mean values.
Box-and-whisker plots in Fig. 8c through f visually summarise the distributions of vessel-type-specific traffic densities for the six clusters. Colours in box plots match the outlines of pile clusters in the maps (Fig. 8a and b). Box plots show the distribution of smoothed vessel density per pile in the clusters. Overall, distributions of clusters 2, 5, and 6 tend to be wider (signified by taller boxes) than those of other clusters. This demonstrates a disconnect between cluster size and traffic density distribution width. Despite their considerable numerical and geographic size, clusters 3 and 4 exhibit narrow traffic density distributions. It also appears that greater vessel density is associated with a wider distribution, i.e., boxes that are located further up the y-axis tend to be taller. Unsurprisingly, clusters 2, 5, and 6, which are located closer to shipping lanes, display greater vessel densities. Following the IQR rule, a mean smoothed traffic density above 2243 vessels annually in a km2-cell is an outlier. Therefore, clusters 2 and 6 are located in what must be considered very high traffic areas. Cluster 2 is located close to the shipping lane leaving and entering Kiel Fjord. It displays the highest traffic density values for all vessel types except passenger ships. Its overall greatest traffic density is clearly driven by cargo shipping. The opposite is true for clusters 5 and 6, but not nearly as pronounced. Here traffic density is increased rather by passenger than by cargo vessels. For clusters 2, 5, and 6, the non-passenger and non-cargo types (other vessels) play a minor role. The same cannot be said for clusters 1, 3, and 4, where other vessels appear on the same order of magnitude as passenger and cargo ships (usually <100). Dataset A contains all traffic density data per pile.
The dataset also informs about fishing intensity with bottom contacting gear, measured in fhr (fishing hours). Only 71 piles are located in areas for which no fishing with such gear was reported. This applies to all piles in Kolberger Heide, all but 1 Haffkrug pile and to 2 Pelzerhaken piles. 391 piles are located in areas with comparatively low fishing intensity, ranging from a total of 80 to 200 fhr in the years 2016 to 2021. Four outliers are located in the north-east of Pelzerhaken, at the edge of a c-square where 691 fhr were reported. For comparison, this is the 41st highest value in the German Baltic Sea out of 747 c-square, with a maximum of 2140 fhr.
Dataset A was published by PANGAEA (https://doi.org/10.1594/PANGAEA.988426, Frey et al., 2026a). Dataset B is Supplement 1 to this paper.
This paper presents two munition pile datasets, their acquisition, and their processing. Dataset A contains all currently known and suspected munition piles in the German Baltic Sea, and dataset B (a subset of the former) contains more detailed information on those munition piles that have already been visually assessed and annotated. The paper describes the munition data and identifies a typical munition pile in the study area as being inhomogeneous, most likely layered, with partially buried objects and munition casings that are weakly corroded. Further, it identifies various statistically significant differences between munition piles in dump sites Haffkrug and Pelzerhaken. Most notably, Haffkrug munition piles exhibit a greater number of objects both in absolute terms and in relation to the piles' areas. Pelzerhaken piles contain considerably larger munitions. The article presents different approaches to extrapolate information from dataset B to dataset A to estimate the number of munitions in piles that have not been visually examined yet. The overall result of no more than around 10 000 t of munitions does not match information on the dumped amount in historical documents (around 50 000 t). While a refined extrapolation after a continued exploration of the sites may yield a higher number, the gap is unlikely to be closed. Munitions buried under furnace slag, relocation of munitions by fishers, and imprecise historical records, or a combination thereof are likely explanations.
The paper also discusses the munition piles in the spatial maritime context where they are located. Of the investigated maritime uses, protected areas and sediment deposit sites tend to be located closest to munition piles, while cables are usually located furthest away. Finally, it identifies six munition pile clusters. Two of them are located in high-traffic areas where the vessel count surpasses a value of 2000 annually. Munition piles that are located in close proximity to areas of maritime use, such as protected zones, sediment deposit sites, or shipping lanes, may require authorities to assess whether the situation poses significant risks that justify targeted attention. The relatively frequent co-location of protected areas and sediment deposit sites with munition piles may warrant further investigation into the specific risks of these overlaps. Similarly, the two pile clusters located in areas with exceptionally high vessel density should be examined more closely to assess potential exposure and management needs.
The assessment of this paper allows for some preliminary conclusions concerning future EOD operations. The rather weak variability of the piles means that clearance procedures, methods, and tools, once established, can likely be successfully applied throughout an entire pile. Therefore, efficiency gains can be expected as the EOD operation proceeds. Almost all piles consist of more than 10 objects. Numbers above 100 objects (many of which look similar in photomosaics) are commonplace as well. This may increase efficiency further. Layering suggests that a vertical clearance method (i.e., operating downward from the water surface) may be superior to lateral options. This aligns with the experience made during the German immediate action programme, where the deployment of a crawler did not lead to the desired success (SeaTerra, 2025). The state of corrosion suggests that most objects can be grabbed and lifted without falling apart in the process. Even minor holes in the casings through which explosives interface with seawater may alter their properties (Pfeiffer, 2012). This should be considered during EOD operations. The fact that almost each pile comprises objects that are at least partially buried means that tools for dredging must be available during EOD. Otherwise, complete clearance of piles will often not be possible. In addition, both the layering and the burial mean that the visual assessment of the piles that is the basis of dataset B cannot be considered final. It should continue throughout the EOD operations. Regarding the size, only a few piles consist entirely of objects that are smaller than 0.75 m. Accordingly, EOD operators should generally be prepared to clear larger and, therefore, heavier objects. This notion supports the findings of another study that reviewed properties of cleared munitions. It concluded that objects ranging from 0.90 to 1.00 m are commonly encountered (Frey, 2025). Given the triadic correlation of variability, layering, and number of objects on a pile, EOD operators should have a versatile and flexible tool set at their disposal when approaching munition piles with many objects. A lack thereof may impede clearance efficiency and prevent positive scaling effects. Larger median object size is associated with lower variability, layering, and number of objects. For clearance operations of piles with few large objects, it may therefore be advisable to focus on case-specific tailored equipment and personnel to reduce costs.
The work presented in this paper serves to facilitate scientific investigation and debate concerning issues like holistic munition management strategies, cost estimates, clearance approaches, and prioritisation in dump sites. With the data presented here, the scientific community is encouraged to perform more in-depth analyses, such as:
-
Economic analyses (e.g., on cost-effectiveness or cost-efficiency) of future EOD activities, potentially projecting costs for full clearance of the described dump sites
-
Risk assessments of various types and goods of protection, e.g., human, environmental, or economic risk assessment
-
More sophisticated mass estimates of detected munitions, e.g., by distinguishing between object types
-
Formulation of policy recommendations for the management of munitions in the sea.
The greatest benefit can possibly be achieved by the development of a methodologically rigorous decision-making tool that makes transparent use of the data presented. For onshore munition contamination, numerous site prioritisation tools (with a focus on shooting ranges and unexploded ordnance) exist (MacDonald et al., 2004). The munition data presented here are a cornerstone for a tool that considers the specific challenges of munitions in the sea and their management.
The supplement related to this article is available online at https://doi.org/10.5194/essd-18-5563-2026-supplement.
TF designed the study, processed data with regard to the results in Sect. 4, drafted the manuscript. MK and JG planned and led surveys. MK acquired, processed MBES data. MK and JG annotated MBES data. MK and JM acquired photos and produced photomosaics. TF, AP, SE, and JG assessed photomosaics. TF, SE, and JG annotated photomosaics. All authors discussed the results and revisited and finalized the manuscript. TF, MK, and JG organized funding. JG coordinated all efforts.
The contact author has declared that none of the authors has any competing interests.
Publisher's note: Copernicus Publications remains neutral with regard to jurisdictional claims made in the text, published maps, institutional affiliations, or any other geographical representation in this paper. The authors bear the ultimate responsibility for providing appropriate place names. Views expressed in the text are those of the authors and do not necessarily reflect the views of the publisher.
We thank the crews of the research vessels R/V Alkor, FK Littorina, MV Haithabu, and R/V Poseidon for their support during data acquisition cruises. The GEOMAR AUV team enabled the visual investigations and acquisition of photos. Rakesh Swain Kumar processed MBES data and photomosaics. The security advisory board of the MMinE-SwEEPER project and the EOD squad of the state of Schleswig-Holstein advised us on data security matters. The first author would like to thank Paul Lehmann and the colleagues at Leipzig University for allowing a continued status as a guest researcher.
All maps were produced with QGIS Desktop V3.30.3. The grammar and spelling of the article were checked and corrected by use of QuillBot.
This research has been supported by the Bundesministerium für Forschung und Technologie (grant no. 03F0912).
The article processing charges for this open-access publication were covered by the GEOMAR Helmholtz Centre for Ocean Research Kiel.
This paper was edited by Sabine Schmidt and reviewed by two anonymous referees.
Agisoft: Metashape Professional, Agisoft LLC, St. Petersburg, 2025. a
Bay, H., Tuytelaars, T., and van Gool, L.: SURF: Speeded Up Robust Features, in: Computer Vision – ECCV 2006, vol. 3951 of Lecture Notes in Computer Science, edited by: Leonardis, A., Bischof, H., and Pinz, A., Springer-Verlag GmbH, Berlin Heidelberg, 404–417, ISBN 978-3-540-33833-8, https://doi.org/10.1007/11744023_32, 2006. a
Beck, A. J., Gledhill, M., Schlosser, C., Stamer, B., Böttcher, C., Sternheim, J., Greinert, J., and Achterberg, E. P.: Spread, Behavior, and Ecosystem Consequences of Conventional Munitions Compounds in Coastal Marine Waters, Front. Marine Sci., 5, https://doi.org/10.3389/fmars.2018.00141, 2018. a, b
Beck, A. J., Gledhill, M., Kampmeier, M., Feng, C., Schlosser, C., Greinert, J., and Achterberg, E. P.: Explosives compounds from sea-dumped relic munitions accumulate in marine biota, Sci. Total Environ., 806, 151266, https://doi.org/10.1016/j.scitotenv.2021.151266, 2022. a
Beddington, J. and Kinloch, A. J.: Munitions Dumped at Sea: A Literature Review, https://tinyurl.com/v7wxwmdm (last access: 19 June 2026), 2005. a
Benoit, K.: Linear Regression Models with Logarithmic Transformations, https://tinyurl.com/mr8sr3ta (last access: 19 June 2026), 2011. a
Böttcher, C., Knobloch, T., Rühl, N.-P., Sternheim, J., Wichert, U., and Wöhler, J.: Munitionsbelastung der deutschen Meeresgewässer – Bestandsaufnahme und Empfehlungen (Stand 2011) [Munition contamination in German marine waters – inventory and recommendations (as of 2011)], https://tinyurl.com/y48mettb (last access: 24 July 2026), 2011. a, b, c, d
BSH: Flächenentwicklungsplan für deutsche Seegebiete 2024 Draft [Maritime Spatial Plan for German sea areas 2024 Draft], https://tinyurl.com/muut9n53 (last access: 19 June 2026), 2024a. a
BSH: Verkehrsnetze (Schifffahrtswege) [Traffic network (shipping lanes)], https://tinyurl.com/ncbwpd3n (last access: 19 June 2026), 2024b. a
BSH: Anchorage_Areas_WGS84_UTM_32N [data set], Bundesamt für Seeschifffahrt und Hydrographie, Hamburg, Rostock, 2024c. a
BSH: Industrie- und Produktionsanlagen im deutschen Seegebiet [Industrial and production facilities in the German sea area], https://tinyurl.com/37yy229y (last access: 24 July 2026), 2025a. a
BSH: Generalised Coastline: Harbour, https://tinyurl.com/4drkdvap (last access: 19 June 2026), 2025b. a
Bünning, T. H., Strehse, J. S., and Maser, E.: Towards a good environmental status: a 4-year monitoring study on the contamination of the Bay of Luebeck with energetic compounds prior to munitions remediation, Arch. Toxicol., 99, 2313–2325, https://doi.org/10.1007/s00204-025-04027-x, 2025. a
CETMAR: Military Areas, https://tinyurl.com/34xhyej3 (last access: 19 June 2026), 2025. a
Cooper, N. and Cooke, S.: Assessment and management of unexploded ordnance (UXO) risk in the marine environment, in: vol. C754 of CIRIA, CIRIA, London, ISBN 978-0-86017-760-9, 2015. a
de Jong, C. D., Elema, I. A., Lachapelle, G., and Skone, S.: Hydrography, Series on mathematical geodesy and positioning, in: 1st Edn., DUP Blue Print, Delft, ISBN 90-407-2359-1, 2002. a
den Otter, J. H., Olde, M. C., van de Steeg, W., Volker, A. W. F., and van der Heijden, A. E. D. M.: Deterioration study of sea‐dumped munitions in the eastern Scheldt, Propellants Explosiv. Pyrotech., 49, e202300302, https://doi.org/10.1002/prep.202300302, 2024. a
EEA: EEA reference grid for Europe (1 km), https://tinyurl.com/bdcp4zct (last access: 19 June 2026), 2013. a
Ehlers, S.: An analysis of the conflict potential of munitions clearance operations with respect to the parameters of navigation, fisheries, and nature conservation in the area of Lübeck Bay (Baltic Sea), MS thesis, Kiel University, Kiel, 2023. a
Ester, M., Kriegel, H.-P., Sander, J., and Xu, X.: A density-based algorithm for discovering clusters in large spatial databases with noise, in: Proceedings, edited by: Simoudis, E., Han, J., and Fayyad, U. M., AAAI Press, Menlo Park, CA, 226–231, ISBN 1-57735-004-9, 1996. a
European Commission: Study on underwater unexploded munition: Final Report, https://doi.org/10.2926/5356, 2022. a
European Subsea Cables Association: Power Cable Installation Guidelines, https://doi.org/10.2926/5356, 2018. a
Frey, T.: Quality Guideline for Offshore Explosive Ordnance Disposal, in: 1st Edn., Beuth Verlag GmbH, Berlin, Zurich, Vienna, ISBN 978-3-410-29879-3, 2020. a, b
Frey, T.: A New Risk Assessment Model for Unexploded Underwater Military Munitions, Dissertation, Leipzig University, Leipzig, Zenodo, https://doi.org/10.5281/zenodo.14620239, 2025. a, b, c, d, e
Frey, T., Seidel, M., Koschinski, S., Strehse, J. S., Wehner, D., Wichert, U., Kampmeier, M., Andresen, C., and Greinert, J.: Kampfmittel im Meer – Der Umgang mit Belastungsschwerpunkten [Explosive ordnance in the sea – dealing with contamination hotspots], in: Handbuch Altlastensanierung und Flächenmanagement online, edited by: Franzius, V., Altenbockum, M., and Gerhold, T., Vorschriften; Arbeitshilfen; Anschriften Sanierungsbeteiligter, rehm, ISBN 978-3-8073-2401-2, https://tinyurl.com/3ux2xzey (last access: 19 June 2026), 2022. a, b
Frey, T., Keller, M., Mohrmann, J., Pechmann, A., Ensenbach, S., and Greinert, J.: Munition pile inventory in the German Baltic Sea, 2017 to 2024, PANGAEA [data set], https://doi.org/10.1594/PANGAEA.988426, 2026a. a, b, c, d
Frey, T., Pechmann, A., and Ensenbach, S.: The multi-criteria analysis for dumped munition prioritization tool (MCA-DuMP): Handbook and Criterion Descriptions, GEOMAR, https://doi.org/10.3289/DSMR-0002, 2026b. a
Greinert, J., Appel, D., Beck, A. J., Eggert, A., Gräwe, U., Kampmeier, M., Martin, H.-J., Maser, E., Schlosser, C., Song, Y., Strehse, J. S., van der Lee, E. M., Vortmeyer-Kley, R., Wichert, U., and Frey, T.: Practical Guide for Environmental Monitoring of Conventional Munitions in the Seas: Results from the BMBF funded project UDEMM “Umweltmonitoring für die Delaboration von Munition im Meer”, GEOMAR, https://doi.org/10.3289/GEOMAR_REP_NS_54_2019, 2019. a
Greinert, J., Kampmeier, M., Barradas, F., Beck, A. J., Diller, N., Seidel, M., and von See, T.-B.: Mine Monitoring in the German Baltic Sea 2021; Dumped munition monitoring, GEOMAR, https://doi.org/10.3289/CR_AL567, 2023a. a, b
Greinert, J., Kampmeier, M., Beck, A., Diller, N., Seidel, M., von See, T.-B., Raupers, B., and Arinaitwe, K.: Mine Monitoring in the German Baltic Sea 2022, GEOMAR, https://doi.org/10.3289/CR_AL583, 2023b. a, b
Greinert, J., Kampmeier, M., Buck, V., and Frey, T.: Marine dumped munition: Example from Lübeck Bay where test clearance will start in 2024, J. Appl. Hydrogr., 34–41, https://doi.org/10.23784/HN128-05, 2024. a, b, c
Hauke, J. and Kossowski, T.: Comparison of Values of Pearson's and Spearman's Correlation Coefficients on the Same Sets of Data, QUAGEO, 30, 87–93, https://doi.org/10.2478/v10117-011-0021-1, 2011. a
HELCOM: Chemical Munitions: Dumped in the Baltic Sea, https://tinyurl.com/3eupy7b9 (last access: 19 June 2026), 2013. a
HELCOM: HELCOM AIS Shipping density maps, https://tinyurl.com/5h5878mx (last access: 19 June 2026), 2022a. a, b
HELCOM: Natura 2000 sites, https://tinyurl.com/2pt668ye (last access: 19 June 2026), 2022b. a
HELCOM: Cables (HOLAS 3), https://tinyurl.com/yp83mzvz (last access: 19 June 2026), 2023a. a
HELCOM: Fishing intensity and effort 2016–2021 (VMS data), https://tinyurl.com/544m2h6h (last access: 10 September 2025), 2023b. a
HELCOM: Dumping areas, https://tinyurl.com/bk9fjtfw (last access: 19 June 2026), 2023c. a
HELCOM: HELCOM Thematic assessment on hazardous submerged objects in the Baltic Sea. Warfare materials in the Baltic Sea, https://tinyurl.com/3u9k7hb4 (last access: 19 June 2026), 2025. a, b, c, d, e, f
Hissmann, K., Rothenbeck, M., Wenzlaff, E., Weiß, T., and Leibold, P.: RV ALKOR Fahrtbericht/Cruise Report AL533 – Mutual Field Trials of the Manned Submersible JAGO and the Hover-AUVs ANTON and LUISE off the Aeolian Islands, Mediterranean Sea, Catania (Italy) – La Seyne-sur-mer (France) 05.02. – 18.02.2020, GEOMAR, https://doi.org/10.3289/GEOMAR_REP_NS_55_2020, 2020. a
Huetten, E. and Greinert, J.: Ocean Floor Observatory Protocol (OFOP), 2008. a
Kampmeier, M.: RV Littorina L13-20: Cruise Report, https://tinyurl.com/2vyntttb (last access: 19 June 2026), 2020. a
Kampmeier, M., Greinert, J., Strehse, J. S., Beck, A. J., Wichert, U., Diller, N., Kurbjuhn, T., Wenzlaff, E., and Schröder, J.: POS530 Cruise Report: “MineMoni 2018”: Mine Monitoring in the German Baltic Sea 2018; Environmental baseline study testing UDEMM Best Practices, https://tinyurl.com/muhprakv (last access: 19 June 2026), 2018. a
Kampmeier, M., van der Lee, E. M., Wichert, U., and Greinert, J.: Exploration of the munition dumpsite Kolberger Heide in Kiel Bay, Germany: Example for a standardised hydroacoustic and optic monitoring approach, Cont. Shelf Res., 198, 104108, https://doi.org/10.1016/j.csr.2020.104108, 2020. a, b
Kampmeier, M., Greinert, J., Beck, A. J., Diller, N., Seidel, M., and Frey, T.: Mine Monitoring in the German Baltic Sea 2020; Dumped munition monitoring, GEOMAR, https://doi.org/10.3289/CR_AL548, 2021. a, b, c
Kampmeier, M., Greinert, J., Beck, A. J., Arinaitwe, K., Mohrmann, J., Krüger, M., Schmaljohann, H., Nolte, G., and Wei, T.: Monitoring ecological consequences of marine munition in the Baltic Sea 2023, GEOMAR, https://doi.org/10.3289/CR_AL590, 2023. a, b
Kampmeier, M., Greinert, J., Beck, A. J., Arinaitwe, K., Diller, N., Nolte, G., Schöntag, P., and Weiß, T.: Monitoring ecological consequences of marine munition in the Baltic Sea 2023, GEOMAR, https://doi.org/10.3289/CR_AL603, 2024. a
Keller, M., Beck, A. J., Diller, N., Greinert, J., Nolte, G., Schmaljohann, H., and Weiß, T.: Monitoring ecological consequences of marine munition in the Baltic Sea 2024, GEOMAR, https://doi.org/10.3289/CR_AL615, 2025. a, b
Koch, M.: Subaquatische Kampfmittelaltlasten in der Ostsee [Underwater explosive ordnance remnants in the Baltic Sea]: Neubewertung des Status Quo, Risikopotenziale und resultierende Handlungsszenarien [Reassessment of the status quo, potential risks and resulting action scenarios], Dissertation, Leuphana Universität Lüneburg, Lüneburg, https://doi.org/10.48548/pubdata-329, 2009. a
Krisp, J. M., Peters, S., Murphy, C. E., and Fan, H.: Visual Bandwidth Selection for Kernel Density Maps, Photogram. Fernerkdg. Geoinf., 2009, 445–454, https://doi.org/10.1127/1432-8364/2009/0032, 2009. a
LASH: Endgültige Räumung Munition, LASH Abt. 617-188, Landesarchiv Schleswig-Holstei, Schleswig, 1960. a, b
Lurton, X.: An introduction to underwater acoustics: Principles and applications, in: Springer-Praxis books in geophysical sciences, 2nd Edn., Springer and Praxis Publishing, Berlin, Heidelberg, Dordrecht, London, New York, Chichester, ISBN 978-3540784807, 2010. a
MacDonald, J., Knopman, D., Lockwood, J. R., Cecchine, G., and Willis, H.: Unexploded Ordnance: A Critical Review of Risk Assessment Methods, vol. MR-1674-A, RAND Corporation, Santa Monica and Arlington and Pittsburgh, ISBN 0-8330-3432-4, 2004. a
Mann, H. B. and Whitney, D. R.: On a Test of Whether one of Two Random Variables is Stochastically Larger than the Other, Ann. Math. Stat., 18, 50–60, https://doi.org/10.1214/aoms/1177730491, 1947. a
Martin, J.: Quantifying the risks of unexploded ordnance drifting ashore or burying in the sea bed, in: Chemical munition dump sites in coastal environments, edited by: Missiaen, T. and Henriet, J.-P., Federal Office for Scientific, Technical and Cultural Affairs (OSTC) and Federal Ministry of Social Affairs, Public Health and the Environment, Brussels, 107–120, https://tinyurl.com/2vynnax9 (last access: 19 June 2026), 2002. a
MJG SH: Badestellen in Schleswig-Holstein [Swimming spots in Schleswig-Holstein], https://tinyurl.com/2654n93t (last access: 24 July 2026), 2012. a
Mohrmann, J., Frey, T., Diller, N., Heger, K., von See, T. B., Greinert, J., and von See, T.-B.: Practical Guide for Underwater Photogrammetric Reconstruction, GEOMAR, https://doi.org/10.3289/DSMR-0001, 2025. a
MSGS MV: Badestellen in Mecklenburg-Vorpommern [Swimming spots in Mecklenburg–Western Pomerania], https://tinyurl.com/y538t3ks (last access: 16 September 2024), 2024. a
Nixon, E.: Assessment of the impact of dumped conventional and chemical munitions (update 2009), in: vol. 365/2008 of Biodiversity Series, OSPAR Commission, London, ISBN 978-1-906840-05-1, 2009. a, b
OSPAR Commission: OSPAR Encounters with Dumped Chemical and Conventional Munitions – 2018, https://tinyurl.com/2majprdu (last access: 19 June 2026), 2021. a
OSPAR Commission: OSPAR Encounters with Dumped Chemical and Conventional Munitions – 2022, https://tinyurl.com/2s4x8vb8 (last access: 19 June 2026), 2024. a
Panchal, P. M., Panchal, S. R., and Shah, S. K.: A Comparison of SIFT and SURF, Int. J. Innov. Res. Comput. Commun. Eng., 1, 323–327, 2013. a
Pfeiffer, F.: Changes in Properties of Explosives Due to Prolonged Seawater Exposure, Mar. Technol. Soc. J., 46, 102–110, https://doi.org/10.4031/MTSJ.46.1.5, 2012. a
Rosenblatt, M.: Remarks on Some Nonparametric Estimates of a Density Function, Ann. Math. Stat., 27, 832–837, https://doi.org/10.1214/aoms/1177728190, 1956. a
SBG Systems: Apogee Marine Series: Ultimate Accuracy MEMS: Inertial Navigation System, https://tinyurl.com/25pytz9u (last access: 19 June 2026), 2025. a
Schleswig-Holstein: Anhang (zu den “Gemeinsamen Übergangsbestimmungen zum Umgang mit Baggergut in Küstengewässern”). Ergänzungen zur behördlichen Umsetzung dieser Bestimmungen in Schleswig-Holstein [Appendix (to the “Joint Transitional Provisions on the Handling of Dredged Material in Coastal Waters”). Additions to the official implementation of these provisions in Schleswig-Holstein], https://tinyurl.com/5v6bjeyc (last access: 24 July 2026), 2009. a
Schober, P., Boer, C., and Schwarte, L. A.: Correlation Coefficients: Appropriate Use and Interpretation, Anesthes. Analges., 126, 1763–1768, https://doi.org/10.1213/ANE.0000000000002864, 2018. a
SeaTerra: Abschlussbericht Kampfmitteluntersuchungen und -räumung für LOS 1 – Munitionsversenkungsgebiet Haffkrug [Final report on explosive ordnance surveys and clearance for LOT 1 – Haffkrug munition dump site], SeaTerra GmbH, Wandlitz, 2025. a, b, c, d
Seidel, M., Frey, T., and Greinert, J.: Underwater UXO detection using magnetometry on hovering AUVs, J. Field Robot., 40, 848–861, https://doi.org/10.1002/rob.22159, 2023. a
Septentrio: AsteRx-U3 Marine: Multi-constellation, dual-antenna GNSS receiver for marine applications, https://tinyurl.com/bde42txf (last access: 24 July 2026), 2025. a
Sichermann, W.: Das Sofortprogramm Munitionsaltlasten in Nord- und Ostsee [The immediate action programme for munition contamination in the North and Baltic Seas], Hydrographische Nachrichten, 33–37, https://doi.org/10.23784/HN128-05, 2024. a
Silva, J. A. and Chock, T.: Munitions integrity and corrosion features observed during the HUMMA deep-sea munitions disposal site investigations, Deep-Sea Res. Pt. II, 128, 14–24, https://doi.org/10.1016/j.dsr2.2015.09.001, 2016. a
Spearman, C.: The Proof and Measurement of Association between Two Things, Am. J. Psychol., 15, 72, https://doi.org/10.2307/1412159, 1904. a
Teledyne: SeaBat T51-R: Revolutionary combination of high resolution, high frequency and high efficiency, https://tinyurl.com/cwsufcs8 (last access: 19 June 2026), 2024. a
Teledyne: SeaBat T50-P: Ultra high resolution portable Multibeam Echosounder, https://tinyurl.com/4bwc62ww (last access: 19 June 2026), 2025. a
Tukey, J. W.: Exploratory data analysis, Addison-Wesley series in behavioral science quantitative methods, Addison-Wesley, Reading, Mass., ISBN 978-0201076165, 1977. a
UNEP: Ammunitions Dumping Sites in the Mediterranean Sea, https://tinyurl.com/3pxs247m (last access: 19 June 2026), 2009. a
Valeport: SWiFT SVP: Sound Velocity Profiler, https://tinyurl.com/bddy3brk (last access: 19 June 2026), 2024. a
van Ham, N. H.: Investigations of risks connected to sea-dumped munitions, in: Chemical munition dump sites in coastal environments, edited by: Missiaen, T. and Henriet, J.-P., Federal Office for Scientific, Technical and Cultural Affairs (OSTC) and Federal Ministry of Social Affairs, Public Health and the Environment, Brussels, 81–93, https://tinyurl.com/2vynnax9 (last access: 19 June 2026), 2002. a
Wall Emerson, R.: Mann–Whitney U test and t-test, J. Vis. Impair. Blind., 117, 99–100, https://doi.org/10.1177/0145482X221150592, 2023. a
Wehner, D. and Frey, T.: Offshore Unexploded Ordnance Detection and Data Quality Control – A Guideline, IEEE J. Select. Top. Appl. Earth Obs. Remote Sens., 15, 7483–7498, https://doi.org/10.1109/JSTARS.2022.3200144, 2022. a
Wehner, D., Frey, T., and Seidel, M.: Offshore unexploded ordnance detection and data quality control – A field example, IEEE Access, https://doi.org/10.1109/JSTARS.2022.3200144, in revision, 2026. a
Zhang, Z., Wang, C., Hu, H., and Yang, T.: Investigation of Underwater Sympathetic Detonation, Propellants Explosiv. Pyrotech., 45, 1736–1744, https://doi.org/10.1002/prep.202000099, 2020. a