the Creative Commons Attribution 4.0 License.
the Creative Commons Attribution 4.0 License.
 | 22 Jul 2026
Lagoon temperature and hydrodynamics of Reao Atoll (Tuamotu Archipelago, French Polynesia) before and during the 2024 El-Niño marine heatwave
Esther Ladet
Carla Chevillard
Romain Le Gendre
Thomas Trophime
Sébastien Petton
Simon Van Wynsberge
In French Polynesia, semi-closed atolls of the eastern Tuamotu Archipelago are home to fisheries and mariculture activities based on giant clam resources. These activities are increasingly vulnerable to global warming, as evidenced by the mass bleaching event observed in Reao atoll in March 2024, triggered by the most intense and prolonged Marine Heatwave (MHW) ever recorded in this lagoon. The GAIA project (manaGement strAtegy evaluatIon for small-scale fisheries in Atoll lagoons) was launched to address this issue and aimed to explore the sustainability of giant clam fisheries under climate change, with a particular focus on processes driving thermal exposure during MHWs. To achieve this, spatial and temporal temperature fluctuations, lagoon circulation, and water exchange dynamics between ocean and lagoon across the atoll rim were monitored using moored autonomous oceanographic sensors. A total of 6 monitoring periods took place between December 2016 and May 2025, with the most extensive instrumentation covering the entire February–March 2024 MHW event. The strength of these observations lies not only in their coverage of a unique and poorly sampled ecosystem, but also in their comprehensive documentation of an exceptional MHW event, from its onset and peak to its dissipation, providing an unprecedented record of the full life cycle of a major thermal anomaly in a tropical semi-closed atoll lagoon. This dataset also supports future modelling efforts to simulate temperature dynamics and identify thermal refugia in atoll lagoons under changing climate scenarios. All data were post-processed, quality-controlled, and formatted into interoperable NetCDF files. The full dataset is openly accessible through the SEANOE marine data platform: https://doi.org/10.17882/105885 (Le Gendre et al., 2025a).
- Article
(9377 KB) - Full-text XML
- BibTeX
- EndNote


Semi-closed lagoons are widespread in the eastern Tuamotu Archipelago, French Polynesia, yet they represent unique hydrodynamic systems primarily shaped to their geomorphological configuration (Rougerie, 1995; Andréfouët and Paul, 2023). Unlike previously documented lagoons (Bruyère et al., 2023), semi-closed atolls are characterized by the absence of reef pass, with shallow channels (approximately 1–2 m deep) crossing the rim (“hoa”) found only on one side of the atoll. In semi-open atolls (those including passes), water inflows through the hoa and the reef pass are mainly driven by tide and oceanic incident waves, and outflow of excess water is drained mostly through the pass (Dumas et al., 2012; Aucan et al., 2021). However, for semi-closed atolls, hydrodynamic behaviour can differ markedly and these lagoons may become temporarily isolated from the ocean (Van Wynsberge et al., 2017; McCabe et al., 2010). Water exchange from the ocean into these lagoons occurs only when offshore wave energy reaches a threshold sufficient to drive oceanic water across the atoll rim, through hoa. This threshold is likely modulated by tidal range and regional sea level anomalies. During periods of low swell, or when swell direction is not congruent with the open rim's orientation, exchanges become minimal or even interrupted, causing lagoon water levels to drop significantly due to enhanced evaporation – a condition locally referred to as ranoa. Consequently, these atolls can experience long periods of highly restricted water renewal, during which they are particularly sensitive to atmospheric conditions and heat fluxes (Andréfouët et al., 2022). While semi-closed lagoons can become temporarily isolated from the ocean, they are also highly vulnerable to the opposite extreme. Extreme surges generated by prolonged, powerful incident swells, and associated land flooding (Storlazzi et al., 2018; Andréfouët et al., 2023), are exacerbated in semi-closed lagoons, due to the lack of a pass to drain excess water. Monitoring lagoon water levels during such events provides key insights into lagoon responses to extreme hydrodynamic forcing.
When these lagoons temporarily behave as closed systems, thermal stress imputed to marine organisms can be aggravated (Van Wynsberge et al., 2017; 2026), sometimes leading to mass mortalities (Van Wynsberge and Andréfouët, 2017; Andréfouët et al., 2022). These dynamics have important consequences for giant clam populations (Tridacna maxima), a species of ecological, economic, and cultural significance across Indo-Pacific coral reef ecosystems (Neo et al., 2015; Mies et al., 2017). In the semi-closed lagoons of the Tuamotu Archipelago, giant clams can form dense aggregations that support local fisheries and mariculture (Gilbert et al., 2005; Remoissenet and Wabnitz, 2012; Van Wynsberge et al., 2016; Andréfouët et al., 2025). However, their symbiotic relationship with Symbiodiniaceae makes them vulnerable to thermal stress (Teaniniuraitemoana et al., 2025), raising concerns under climate change scenarios. In particular, recurrent mass bleaching events linked to El Niño-driven marine heatwaves (MHWs) have impacted T. maxima stocks, with implications for both the fishery and the aquarium trade (Andréfouët et al., 2015; Van Wynsberge et al., 2026). In this context, characterizing the spatial and temporal variability of local temperature regimes, and understanding their drivers is essential, notably with intensifying climate extremes.
This study presents a rare and comprehensive dataset of multi-year monitoring of temperature and sea level inside the semi-closed lagoon of Reao, spanning December 2016 to May 2025. Modelling work of Van Wynsberge et al. (2026) evidenced that this lagoon experienced more than 20 MHW over the past decade, with strongest events that occurred in March–April 2016 (duration: 40 d; maximum intensity: 1.8 °C above the climatology), in January–February 2017 (38 d; 1.8 °C), and in February–March 2024 (41 d; 2.4 °C). Here a more extensive instrumentation setup (see Fig. 3) enabled enhanced lagoon sampling before and during the most prolonged and intense MHW ever recorded locally (Van Wynsberge et al., 2026), which was associated with the 2024 strong mixed El Niño (Pagli et al., 2026). The sampling strategy captured both horizontal and vertical temperature variability via moored sensors at relevant lagoon sites and depths, as well as through vertical profiles (from CTD casts). Continuous measurements of lagoon level, circulation, and ocean-lagoon exchanges have also been acquired during the austral summer 2023–2024. Instrumenting the diverse geomorphological strata, including hoa, the inner reef slope, lagoon patch reefs, and deep lagoon areas, provides a system-wide view of the hydrodynamic variability and processes within the lagoon before and during such an extreme event, and sheds light on the hydrodynamic and atmospheric forcings that control intensity and duration of MHW inside semi-closed atoll lagoons. After a presentation of the study site in Sect. 2, the instruments and deployment methods are described in Sect. 3, followed by the sampling strategy (Sect. 4) and the data processing and quality control procedures in Sect. 5. Finally, illustrative observations of this semi-closed atoll dynamics are shown in Sect. 6.
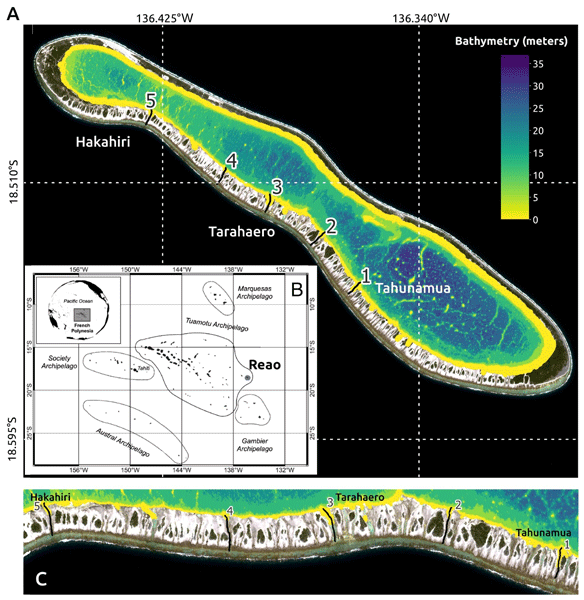
Reao Atoll (18.45–18.6° S; 136.25–136.5° W) located at the eastern end of the Tuamotu archipelago (French Polynesia; Fig. 1B) is a shallow atoll known for harboring one of the world's highest densities of the giant clam Tridacna maxima (Van Wynsberge and Andréfouët, 2017). Its population (329 inhabitants according to the 2022 census) lives mainly in the village located on the northwestern part of the atoll, and largely rely on giant clam resources (for flesh or aquarium trade). Reao is classified as a semi-closed atoll, with a fully and permanently emerged rim in its north-eastern part, and a southern rim segmented by an alternation of low-lying sandy islets, locally known as motu, and numerous shallow natural channels (hoa), which allow limited water exchange between the lagoon and the open ocean (Fig. 1). Large swell events (eventually combined with spring tides) can overtop the reef and fill hoa with water. This generates variable lagoon aperture (defined as the ratio of the sum of the widths of all functional channels to the atoll perimeter) in time, ranging from 1 % to 13 % depending on water level (Andréfouët et al., 2022). The numerous hoa vary greatly in shape (see Fig. 1C and Appendix A, Fig. A2), width and depth, but the most active ones are located in the central part of the southern rim (Tarahaero; Fig. 1C). The atoll rim delimits a lagoon of 38.33 km2 with an average depth of 16 m (maximum depth: 32 m). Elongated along a northwest–southeast axis, the lagoon comprises three distinct basins, the northwestern (NW), the intermediate, and the southeastern (SE) basins, which progressively widen and deepen from north to south (Fig. 1A; Quéré et al., 2025a, b). Overall, the three basins exhibit a bowl-shaped morphology, with shallower margins surrounding deeper central areas.
Four distinct daily wind regimes (WRs) affect the area (Dutheil et al., 2020). The dominant regime (WR1) corresponds to a persistent trade-wind pattern, characterized by a strong homogeneous east-southeast flow (WR1, 6.3 m s−1, ∼ 100° N). Two additional easterly regimes (WR2 and WR3), differ mainly in intensity (resp. 4.4 and 3.9 m s−1) or orientation (resp. 107.5° N and 75.3° N). A fourth regime (WR4) associated with weaker north-easterly winds (64.9° N, 3 m s−1) predominates during the austral summer and disappears in austral winter (in opposition to WR1). Regarding the wave climate, the region is dominated in austral winter by high-amplitude, long period southwesterly incoming swells (R1, Hs=2.5 m, Tp=13.4 s and coming from 190° N). During austral summer, northwesterly swells (R3) of lower amplitude (235° N, 2 m) but similar periods prevail; yet Reao Atoll remains largely unaffected due to its impermeable northern rim. South-southeast wind waves (R2) generated by tradewinds also occur year-round with a peak in May–July (Dutheil et al., 2021). Finally regarding offshore tide, the approximate tidal range is 0.93 m (FES2012 global tide solution) in the open ocean south of Reao. The oceanic tidal regime is semi-diurnal in this region (Form factor = 0.058).

Figure 1(A) Map of Reao with locality of the five main hoa (1–5). Background color refers to satellite-derived bathymetry retrieved from Sentinel-2 imagery (Copernicus Sentinel-2, 2021; Quéré et al., 2025a, b) using the method of Amrari et al. (2021). (B) Location of Reao within the French Polynesian archipelagos (Credit: Oriane Bruyère). (C) Zoom on the southern rim and its hoa. Numbers indicate the 5 main hoa that were selected for instrumentation. Hoa no. 3 (locally called Tarahaero), located along the central section of the southern rim, is associated with the highest ocean-lagoon exchange efficiency, whereas hoa no. 1 (locally called Tahunamua), located along the southern section of the southern rim, is associated with the lowest.
Various physical oceanographic instruments were deployed during the GAIA project to monitor thermal variability, ocean-lagoon exchanges and lagoon dynamics (Fig. 3). A total of six legs were conducted, each leg corresponding to the observation period between the deployment of instruments and their subsequent withdrawal. These included moored compact loggers dedicated to temperature and pressure (stations labeled with “T”), as well as different types of current meters: point-measurement devices (stations labeled with “L”) and vertical profilers (stations labeled with “A” or “ADCP”). During each field campaign, conductivity–temperature–depth (CTD) profiles (stations labeled with “M”) were performed throughout the lagoon allowing to capture the vertical structure of the water column. All profiles were performed manually from a boat. A detailed list of all instruments, including manufacturer, model, raw and processed parameters, deployment location, logging frequency, and deployment period, is provided in Appendix A (Table A1).
All moorings were deployed by scuba diving and adapted to the seabed habitats and deployment sites to ensure stability during highly energetic events. Mooring supports were constructed from a variety of materials, including concrete blocks, steel bars, and equipped with sacrificial anodes to prevent corrosion or electrolysis damage (see Fig. 2). To minimize biological fouling, Acoustic Doppler Current Profilers (ADCPs) were coated with cayenne pepper and grease and then wrapped with electrical tape, while smaller compact loggers were enclosed in perforated plastic cylinders (see Fig. 2a) to allow water circulation while providing protection against biofouling and mechanical damage. Mooring depths were measured using a dive computer (for sensors without pressure) or derived from the mean water depth over the whole deployment period (for sensors equipped with pressure). All moored instruments were autonomous, containing internal batteries and memory to support long-term deployment.
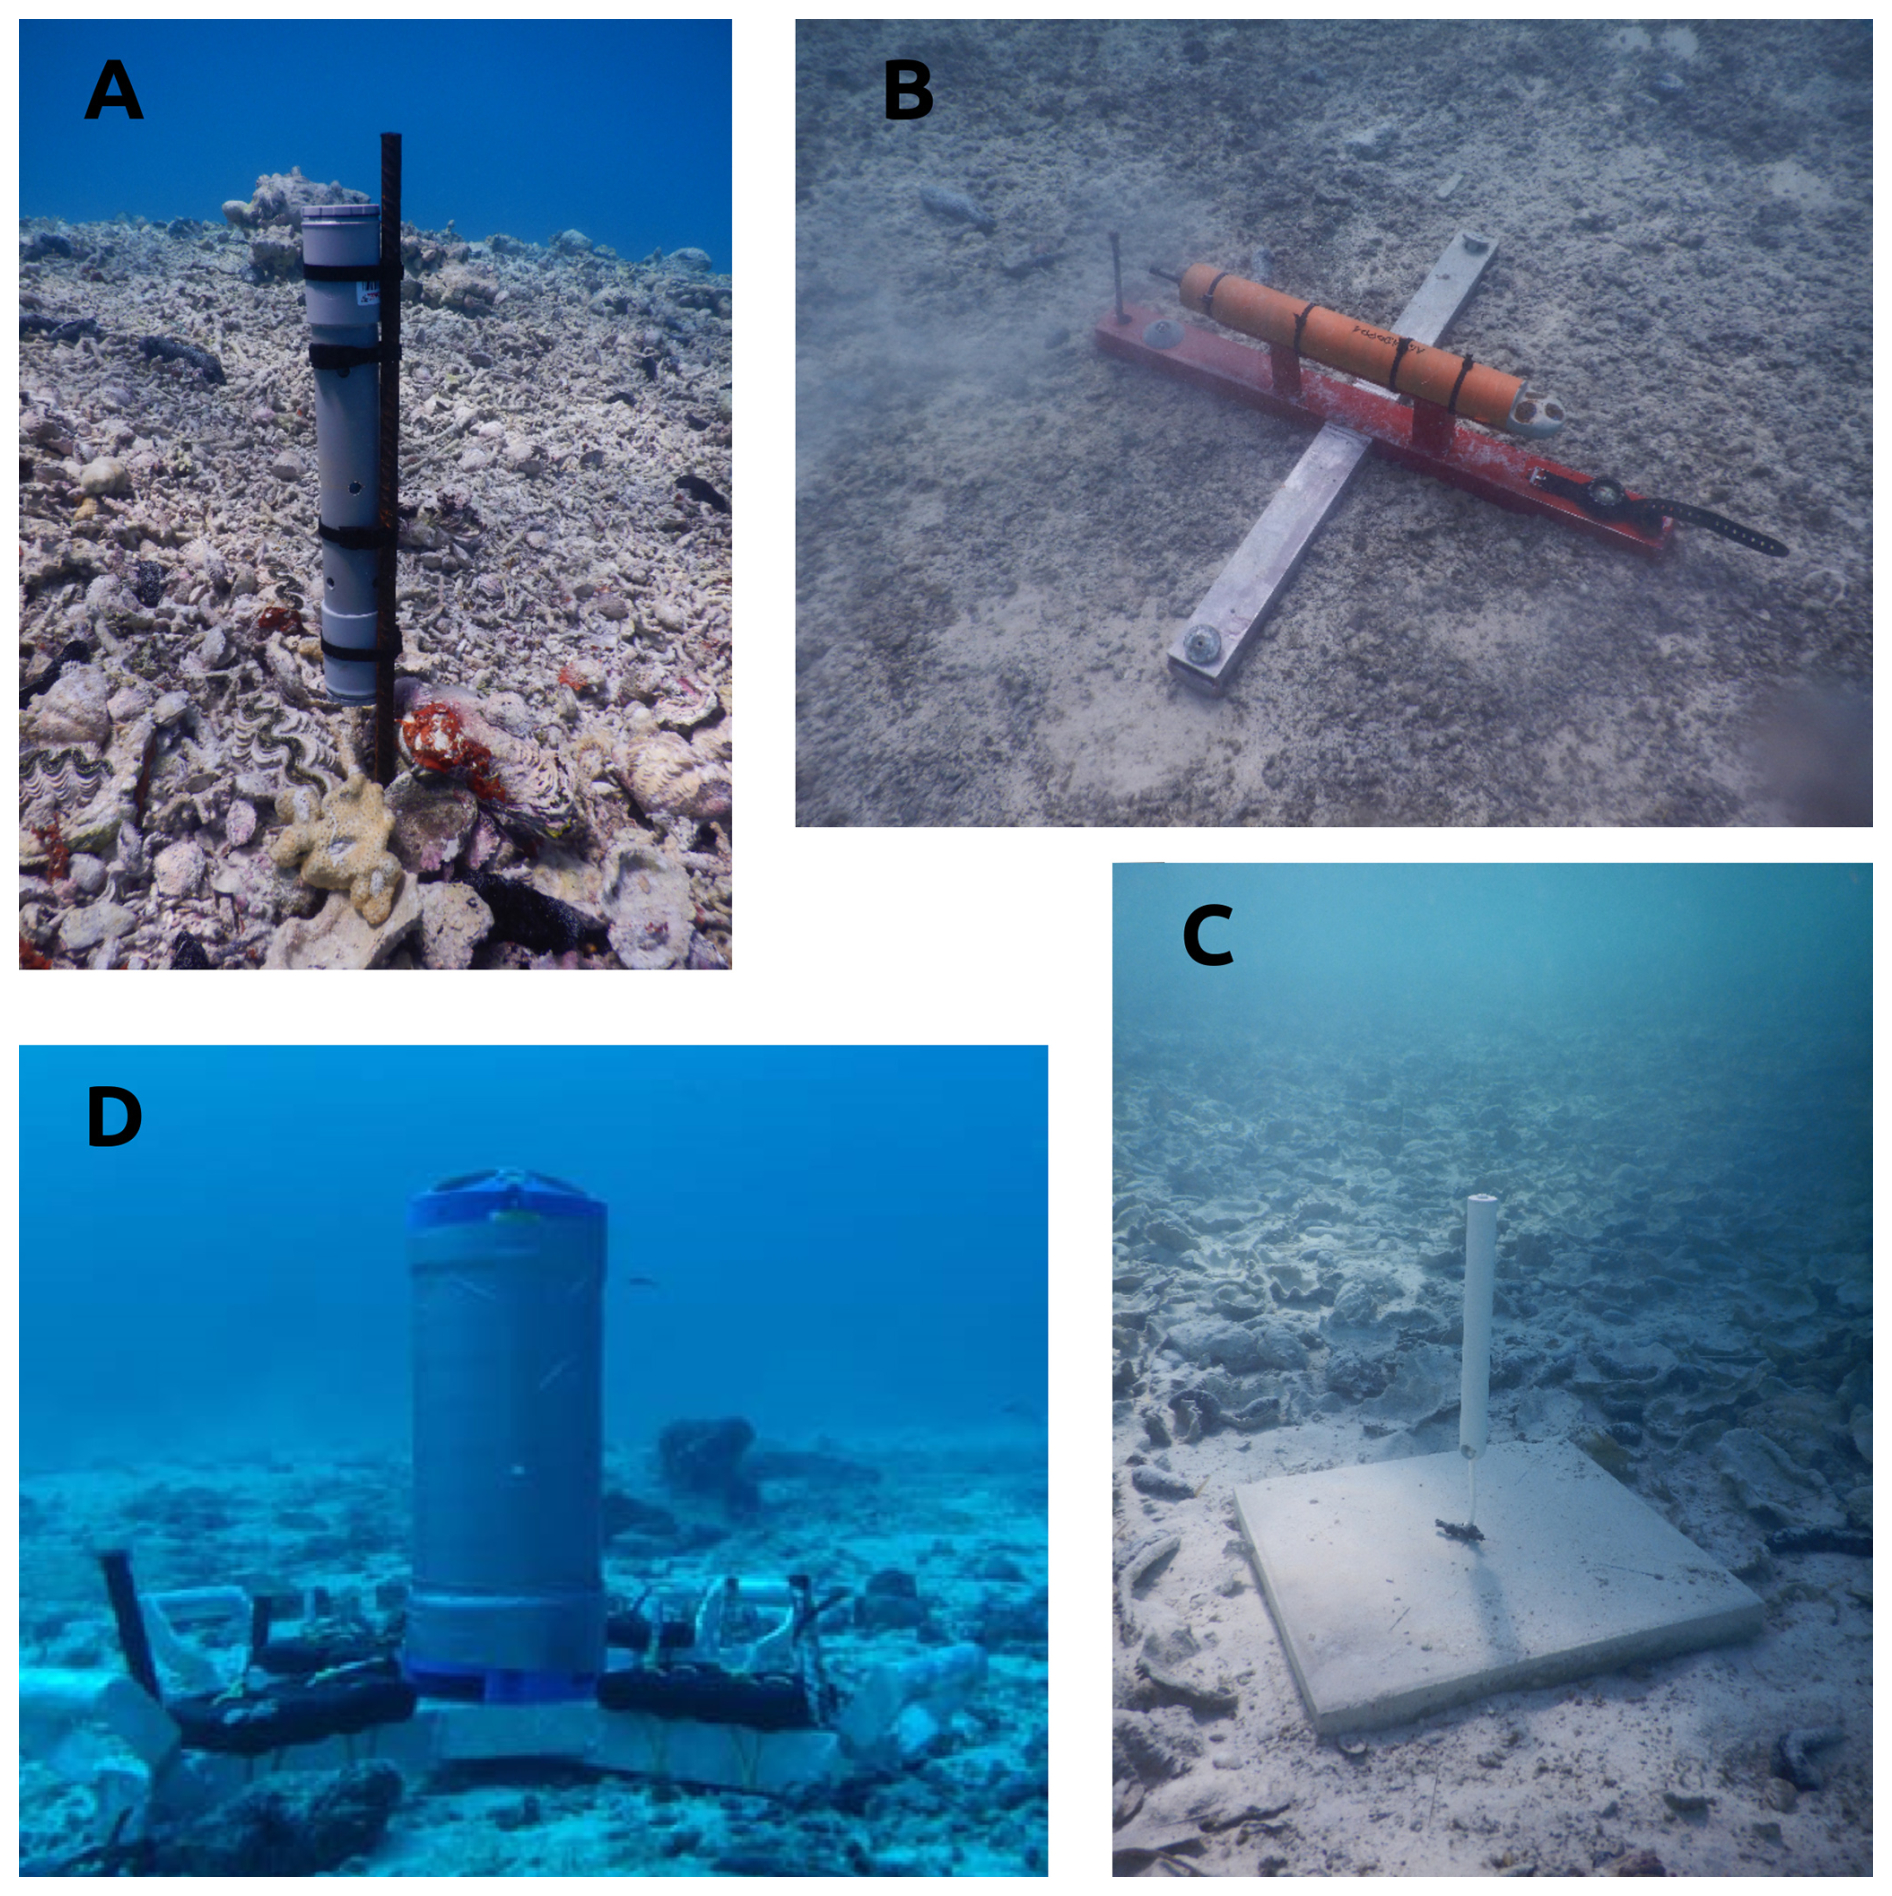
Figure 2Photos of the moored sensors deployed in Reao Lagoon: RBRduet/SBE56 inside its protective PVC tube (A), Nortek Aquadopp (B), Lowell TCM-4 (C), Teledyne RDI ADCP Sentinel (D). Photo credit: Simon Van Wynsberge.
3.1 Compact loggers: Temperature and Pressure
Three types of compact loggers were used across the various deployments to monitor either temperature or temperature and pressure. The first set of sensors included 15 SBE56 loggers (Sea-Bird Scientific Inc.: https://www.seabird.com/sbe-56-temperature-sensor/product?id=54627897760, last access: 7 November 2025). All SBE56 deployed during the GAIA project were new and directly came from the manufacturer, thus, given the specifications of these high-accuracy sensors, the data are delivered with a maximum uncertainty of ±0.01 °C. The typical sampling period was 1 min (Appendix A – Table A1). The second set of compact loggers consisted of two RBR Ltd. models, namely TWR-2050 and RBduet T.D (https://www.bodc.ac.uk/data/documents/nodb/pdf/rbr_tide_wave_07apr2011.pdf, https://rbr-global.com/products/compact-loggers/rbrduet-td/, last access: 7 November 2025). The TWR-2050, a 10 dbar range sensor, was deployed during the first deployment period only (2016–2017) and sampled water level and temperature every 30 min. Its maximum uncertainty regarding pressure was estimated around 0.5 % of full scale (±5 cm) and ±0.01 °C for temperature. All RBRduet Temperature-Depth sensors (RBR Ltd) were returned from the manufacturer recalibration just before the start of sampling. Based on their specifications, a maximum uncertainty of less than 1 cm in level and 0.004 °C in temperature can be expected. Typical sampling periods were set to 1 Hz.
3.2 Current meters
Two types of current meters, namely drag-tilt current meters and ADCPs, were installed in Reao lagoon to monitor the austral summer 2023–2024. The Lowell TCM-4 drag-tilt current meter is an autonomous, low-cost instrument that estimates current velocity and direction from sensor tilt, while also recording temperature (https://lowellinstruments.com/tilt-current-meters/tcm-4-tilt-current-meter/, last access: 7 November 2025). Five TCM4 were used during the GAIA project sampling. All these sensors were new at the beginning of their deployment (Leg 4) thus providing a maximum uncertainty of 5 cm s−1 in current speed, 5° in direction and 0.1 °C in temperature. Their typical sampling period was set to 1 min. ADCP Sentinel V series (Teledyne RD Instruments; https://www.teledynemarine.com/en-us/products/SiteAssets/RD%20Instruments/Sentinel_V_combined.pdf, last access: 7 November 2025) provide current profiling over the water column in coastal environments. Two models were deployed: a Sentinel V20 and two Sentinel V50. The Sentinel V-series provides three-dimensional velocity measurements as well as bottom temperature and pressure observations. The northern basin was equipped with a V20 (1000 kHz), and two Sentinel V50 (500 kHz) were deployed in the intermediate and southern basins. Globally, bursts were programmed every 20 min, with 90 pings per burst (1 s ping interval). Cell sizes were set to 0.5 m for the V20 and 1 m for the V50 and the first measured cell above the blanking zone was at 1.01 m (resp 2.22 m) for V20 (resp. V50). Both awaited standard deviation for current speed was 0.74 cm s−1. The Aquadopp (Nortek) is an acoustic current meter used to measure current speed, direction, temperature, and pressure in shallow environments (https://www.nortekgroup.com/products/aquadopp-profiler2-1-mhz, last access: 7 November 2025). During the GAIA project the two models were 2MHz side-looking heads deployed in hoa. Burst sampling period was programmed to 20 min, with a cell size of 0.2 m, and a blanking distance of 0.2 m leading to precision of horizontal velocity observations of 2.3 cm s−1.
3.3 CTD Profiles
The CTD (Conductivity Temperature Depth) profiles were obtained using a Sea-Bird 19Plus V2 SeaCAT Profiler CTD (Sea-Bird Scientific; https://www.seabird.com/sbe-19plus-v2-seacat-profiler-ctd/product?id=60761421596, last access: 7 November 2025), which measures conductivity, temperature, and pressure at a sampling frequency up to 4 Hz. The SBE19Plus V2 provides high-resolution and highly reliable measurements. Its last maintenance and manufacturer recalibration date back to 2022, which ensures high measurement accuracy (maximum uncertainty lower than that of moored loggers). During each cast, the CTD was hand-lowered from the boat, stabilized near 2 m depth during 1 min, then returned to near the surface before being lowered at a constant rate of approx 10 m min−1 to the lagoon bottom and immediately brought back to the surface at 20–40 m min−1. Only profiles acquired during the descent were retained in the NetCDF dataset made available.
The sampling design implemented under the GAIA project evolved throughout its duration to progressively address both thermal and sea-level vulnerabilities of semi-closed atoll lagoons. Prior to the GAIA project, an early historical 7-month deployment of a temperature and pressure sensor was performed (Leg 1, Station T1 from 17 December 2016 to 29 June 2017) and helped design the project sampling.
At the early stage of the project, a first temperature logger was deployed in June 2021 (Fig. 3 – Station T2 – Leg 2 to 6) during a first fieldwork dedicated to giant clam stock assessment and health monitoring. The initial objective was to begin a continuous interannual record of lagoon temperature, providing a baseline reference and ensuring long-term monitoring of Reao's lagoon temperature observations that are included in the SNO (National Observation Service) ReefTEMPS network (Le Gendre et al., 2025b). Following the acquisition of additional instruments within the GAIA project, the spatial coverage of the monitoring network was substantially increased, allowing a refined characterization of thermal dynamics across key lagoon sectors.
Subsequent field campaigns (Legs 4 to 6; from June 2023 to May 2025) implemented a more advanced experimental design using up to 18 moored instruments, aimed at better understanding of the hydrodynamic functioning of the lagoon, including ocean–lagoon exchanges, lagoonal circulation, and spatial and vertical temperature dynamics through multi-depth moorings.
4.1 Ocean-lagoon exchanges and lagoon level
One of the key objectives of the GAIA sampling strategy was to better understand the mechanisms governing water exchanges between the ocean and the lagoon through the hoa. The selection of hoa to be instrumented (see Figs. 1B and A3) was made following extensive field reconnaissance during the beginning of Leg 4, combining direct observations of their functioning with geomorphological characteristics (depth, width, orientation) and local knowledge of their hydrodynamic behaviour.
The monitoring design aimed to cover hoa distributed across different sectors of the reef rim and representative of the three main lagoonal basins (northern, intermediate, and southern). To this end, five Lowell TCM-4 drag–tilt current meters were deployed at stations L1 to L5 during Leg 4 (Fig 3A). These autonomous instruments recorded current speed and direction, together with temperature, providing insights into the temporal variability of ocean–lagoon fluxes.
During Leg 5, the setup was complemented by two Nortek Aquadopp current profilers deployed at stations A1 and A2, corresponding respectively to the TCM-4 sites L3 and L1. These profilers allowed finer characterization of velocity structure across selected hoa, while also documenting temperature and sea-level variability.
Lagoon water level variability was monitored during several legs of the GAIA project. The first observations were obtained during Leg 1 using an RBR TWR-2050 sensor deployed at station T1, followed by an RBRduet T.D logger installed at station T11 from legs 3 to 5. These long-term pressure records were specifically designed to document lagoon-level variability under varying environmental conditions, notably the influence of incident oceanic swells and sea-level anomalies. During Leg 5, additional sea level measurements were available from pressure records provided by the Aquadopp profilers positioned in the hoa (stations A1 and A2, Fig. 3A), as well as from the three ADCP Sentinel V instruments deployed within the lagoon.
4.2 Lagoonal circulation
The three ADCPs (stations B1 to B3, Fig. 3A) were strategically located to capture current profiles from the surface to the bottom in each of the three main lagoonal basins and broadly positioned along the atoll's main axis. This configuration enabled the characterization of internal lagoon circulation patterns and their response to hydrodynamic forcing, including wind stress and ocean–lagoon exchange processes. Combined, these complementary observations provide a comprehensive view of lagoon-level variability and circulation dynamics under contrasting meteorological and oceanic conditions.
Building on this carefully designed sampling strategy, the following section describes the procedures applied to process, validate, and standardize the collected data to produce a high-quality, interoperable dataset.
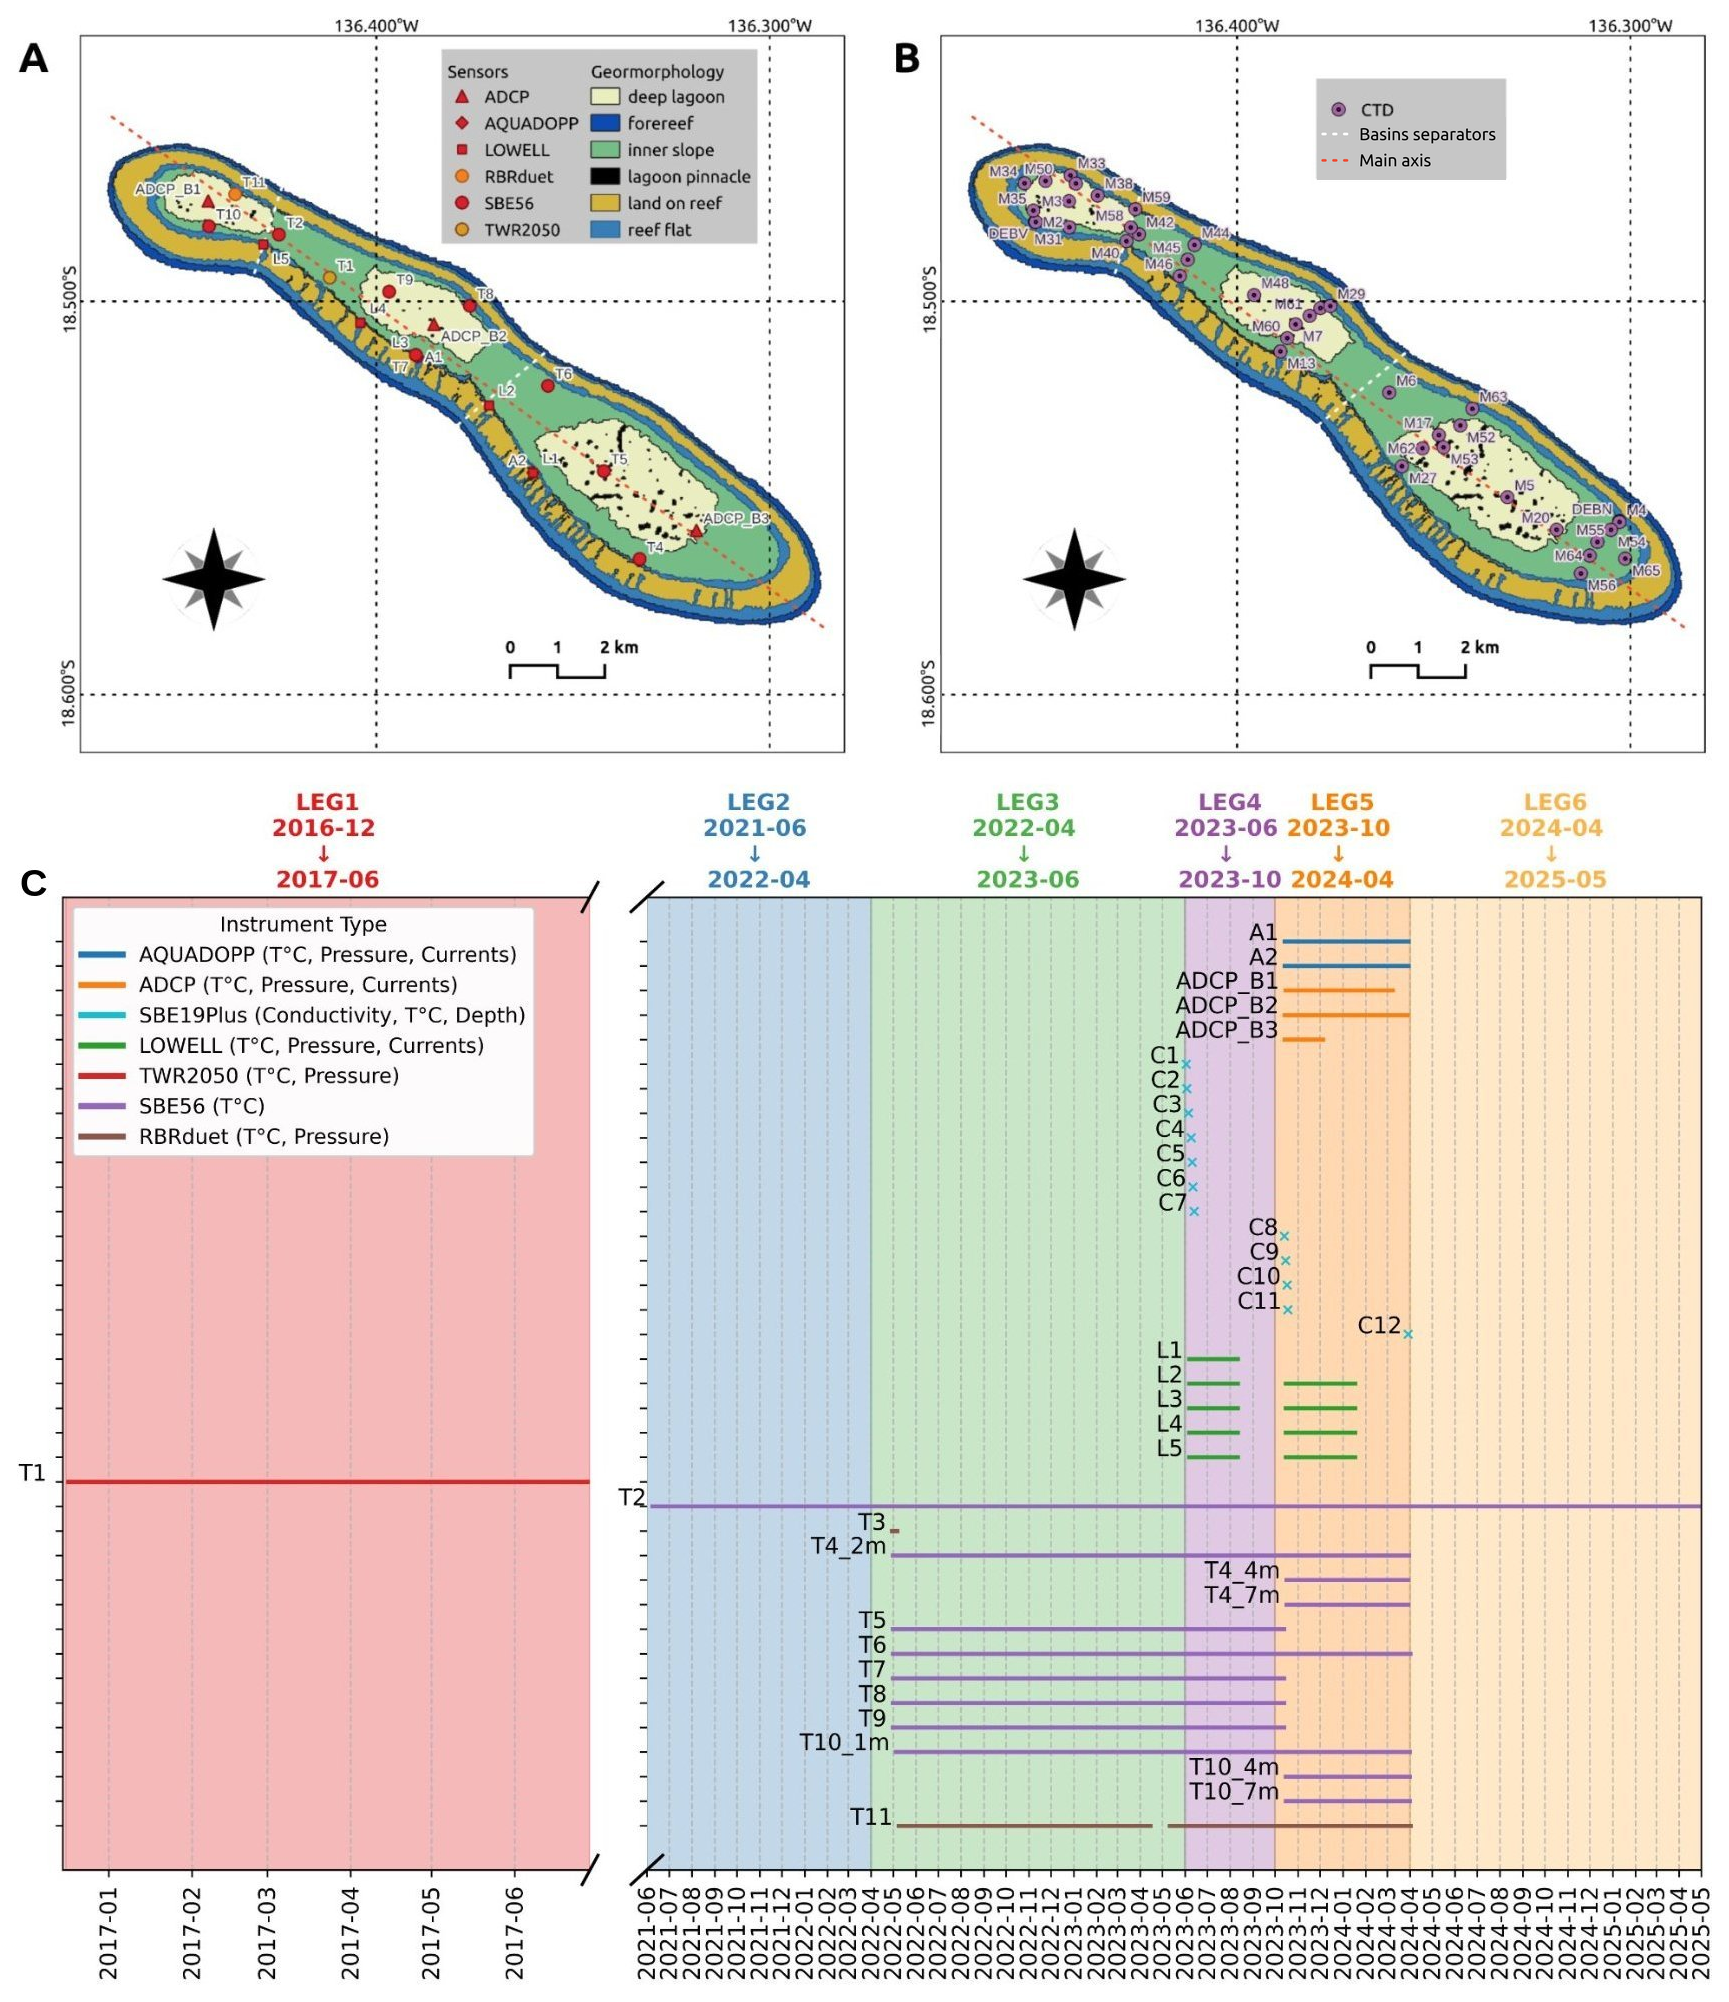
Figure 3Spatial and temporal coverage of the observation network at Reao Atoll. (A) Deployment location of moored loggers and (B) Reference stations during Conductivity, Temperature, Depth (CTD) vertical casts. Background colors on the map refer to reef geomorphology, from Andrefouet et al. (2023). The timeline (C) details the temporal coverage of all deployed instruments, including the initial campaign (December 2016 to June 2017) and the subsequent legs conducted under the GAIA project (June 2021 to May 2025). For the SBE19Plus CTD profiles, each marker C1–C12 indicates a distinct date where several stations shown in (B) were sampled (Le Gendre et al., 2025a).
4.3 Spatial and vertical temperature variability
To characterize spatial temperature variability, a network of moored SBE56 loggers was deployed across different lagoonal and rim environments (stations T1 to T11; Fig. 3A), covering the northern, intermediate, and southern basins for periods ranging from 6 to 34 months, depending on the sensor (Table A1). Temperature loggers were placed in the 1–3 m depth range where giant clams are preferentially found. However, two lagoon patch reefs (stations T4 and T10) were instrumented with additional loggers placed deeper (4.5 and 7 m depth) to set up vertical temperature sensor arrays during Leg 5 (6 months), which includes the February–March 2024 MHW event. Vertical stratification of temperature was further characterized with CTD vertical profiles performed in June 2023 (2–13 June), October 2023 (13–18 October), and during the 2024 MHW, on 29 March. CTD profiles were spatially distributed to cover the Northern basin, where mariculture activities take place, and along five radials crossing the lagoon widthwise according to a distance gradient to the open rim (Fig. 3B). Because CTD profiles measured both temperature and salinity, they also provided insights on water renewal, basin characteristics and vertical stability of water masses.
The processing and quality control procedures applied to this dataset build upon extensive prior experience in lagoon monitoring. To ensure both data quality and interoperability – using consistent file formats and instrument types – the same methods for processing, formatting, and quality control as described in previous studies were applied (Bruyère et al., 2022, 2023, 2024).
Raw data were retrieved from each instrument using the manufacturer's software and saved on a secure network drive. Each file was renamed following a standardized nomenclature containing key deployment information: Atollname_Station_Instrument-Model_SerialNumber_Depth_LegNumber.filetype. Data were then visually inspected to identify and remove bad records (e.g., out-of-water readings, spikes, or outliers) and to determine the exact start and end times of valid observations (based on our field notes and confirmed using pressure and temperature plots).
Data was subsequently converted into formats suitable for processing with Python 3 routines, typically ASCII or MATLAB files, processed as needed and finally exported as NetCDF files. Each NetCDF file includes temperature, pressure, current, or other relevant variables, together with comprehensive metadata such as deployment dates, time reference (expressed in UTC for all instruments), geospatial coordinates, depth, instrument model and serial number, project and investigator information, processing history, and comments to ensure reusability.
Specific processing steps were applied depending on instrument type:
-
RBRduet T.D sensors: pressure data were corrected for a constant atmospheric pressure (101 325 Pa) to minimize weather-related variability. No precise vertical referencing by DGPS was possible due to deployment conditions. Water level was calculated relative to the long-term mean depth. For wave analysis, pressure records were filtered using a Fourier transform to obtain a pressure spectrum (3–25 s period), and linear wave theory with a homogenous cut-off frequency (0.33) was applied to compute wave parameters. Two output files were generated: one with 1 min resolution for temperature and water level, and another with 1 h resolution containing derived wave parameters.
-
Current meters (ADCPs, Aquadopps, and Lowell TCM-4): vertical profiles near the surface were removed to avoid contamination from acoustic reflections or noise. Data were converted to consistent coordinate systems (East – North – Up), and orientation conventions were harmonized with oceanographic standards. Temporal and vertical resolutions were retained according to deployment settings.
-
Compact loggers (SBE56): temperature data were generally retained at the original sampling frequency without additional processing.
-
CTD casts: standard processing using SeatermV2 software was applied, including conversion to .cnv, low-pass filtering, alignment of sensors, derivation of secondary parameters, and vertical bin averaging (0.5 m). No specific treatments for handling salinity spikes were required as no such spikes were recorded in the data.
After processing, all datasets were visually inspected using Ferret and NetCDF tools to certify the quality of the time series and detect eventual anomalies. Any remaining outliers or unusual observations were flagged in the NetCDF global attributes. Metadata were systematically checked to verify the completeness and correctness of global and variables' attributes. These procedures ensure a high-quality, standardized, and interoperable dataset suitable for scientific analysis and long-term monitoring of lagoon dynamics.
In this datapaper, an overview of observations is provided in order to highlight the quality and scientific interest of the dataset. This section is, however, not intended to provide an extensive analysis and interpretation of data. To enhance trust-building, external sources of wind, wave, sea surface temperature (SST) and tide data have hereafter been used and aligned with our temperature, water level and current data. Winds, waves and SST were extracted from ERA5 reanalysis (https://cds.climate.copernicus.eu/datasets/reanalysis-era5-single-levels?tab=overview, last access: 20 July 2026; Hersbach et al., 2020). Tidal harmonics were extracted from the Finite Element Solution oceanographic model, version 2012 (Stammer et al., 2014), and tidal recomposition was performed using the first 8 harmonics. Winds and SST data were extracted at the grid point closest to the center of the atoll (18.5° S, 136.5° W), while incident waves and tidal harmonics were extracted at an oceanic grid point at the vicinity of the southern rim of Reao (18.75° S, 136.6° W). Finally, marine heat waves categories were determined using the long-term series of lagoon temperatures modeled by Van Wynsberge et al. (2026) as climatology. Briefly, they used the in-situ temperature time series to train and validate Generalized Additive Models (gam) that infer the daily minimum temperature and the diurnal temperature range, from oceanic and atmospheric regional data.
6.1 Ocean-lagoon exchanges and lagoon level
Lagoon water level was strongly influenced by ocean-lagoon exchanges. Figure 4 shows the temporal variability of ocean–lagoon exchanges over a 5 d subset for the five instrumented hoa, highlighting differences in exchange intensity and dynamics among sites, together with lagoon-level variations at station T11. This period was selected as it encompasses a short but energetic incident swell event (from 22 to 24 October 2023, Fig. 4).
Briefly, inflow and outflow were calculated using scatter plots of current speed (y-axis) as function of current directions (x-axis), with dots representing observations in their initial sampling frequency (every 1 min for Lowell inclinometers and every 20 min for Aquadopp currentmeters). These scatter plots of data were similar to two gaussians, centered on the direction of inflow and outflow, respectively. The direction for which the current speed reached its maximum was considered as the main direction of the hoa. We then defined inflow currents as currents entering the hoa with the main direction ±90°. Other currents were characterised as outflows.
Globally, a good synchronicity in the patterns of inflow/outflow between the five instrumented hoa was observed (based on velocity projections along each hoa's main axis). For all of them, inflows and outflows followed the offshore tidal trend, with inflows dominating between mid-flood and mid-ebb, and vice versa (Fig. 4). During this period, current speed in the hoa reached values exceeding 1 m s−1 (station L2 at the peak of the event). Within the lagoon, tidal variability ranges from a complete absence of tidal signal during Ranoa phases (when no exchanges between ocean and lagoon) to only a few centimeters of tidal amplitude (maximum observed 25 cm) when lagoon water levels are particularly high (Fig. 6). It is noteworthy that during the swell episode shown in Fig. 4, the most active hoa – i.e., those exhibiting the strongest inflowing currents – were the central ones along the southern rim (L3, A1, and L2). At the peak of the event, all hoa were almost exclusively inflowing for about two consecutive tidal cycles. Similarly, lagoon drainage appears to occur mainly through the central hoa (L4, L3, A1 and L2), which exhibit longer durations and higher intensities of outgoing currents compared to those located at the northern and southern extremities. Figure 4 also demonstrates good congruence between Aquadopp and Lowell-TMC4 records, since similar currents speed and direction were found for instruments A1 and L3, which were positioned a few meters apart, in the same hoa. Finally, the lagoon water level rises more rapidly during the filling phase than it falls during the drainage phase, with an increase in lagoon level exceeding 30 cm in less than 24 h.
At the beginning of the time series, A2 currents exhibit intra-phase flow reversal alternating between inflow and outflow within a single drainage or filling phase. This inconsistent behaviour of A2 currents with other currents might be explained by the location of the sensor in a hoa with a coarser complex bathymetry (see locations of sensors in the different hoa in Appendix A2) and the slightly different orientation of this section of rim. Such location appears to have an impact on A2 currents when current speed is rather low in other hoa. When currents' speed increase due to swell events, a better coherence is observed with A2.
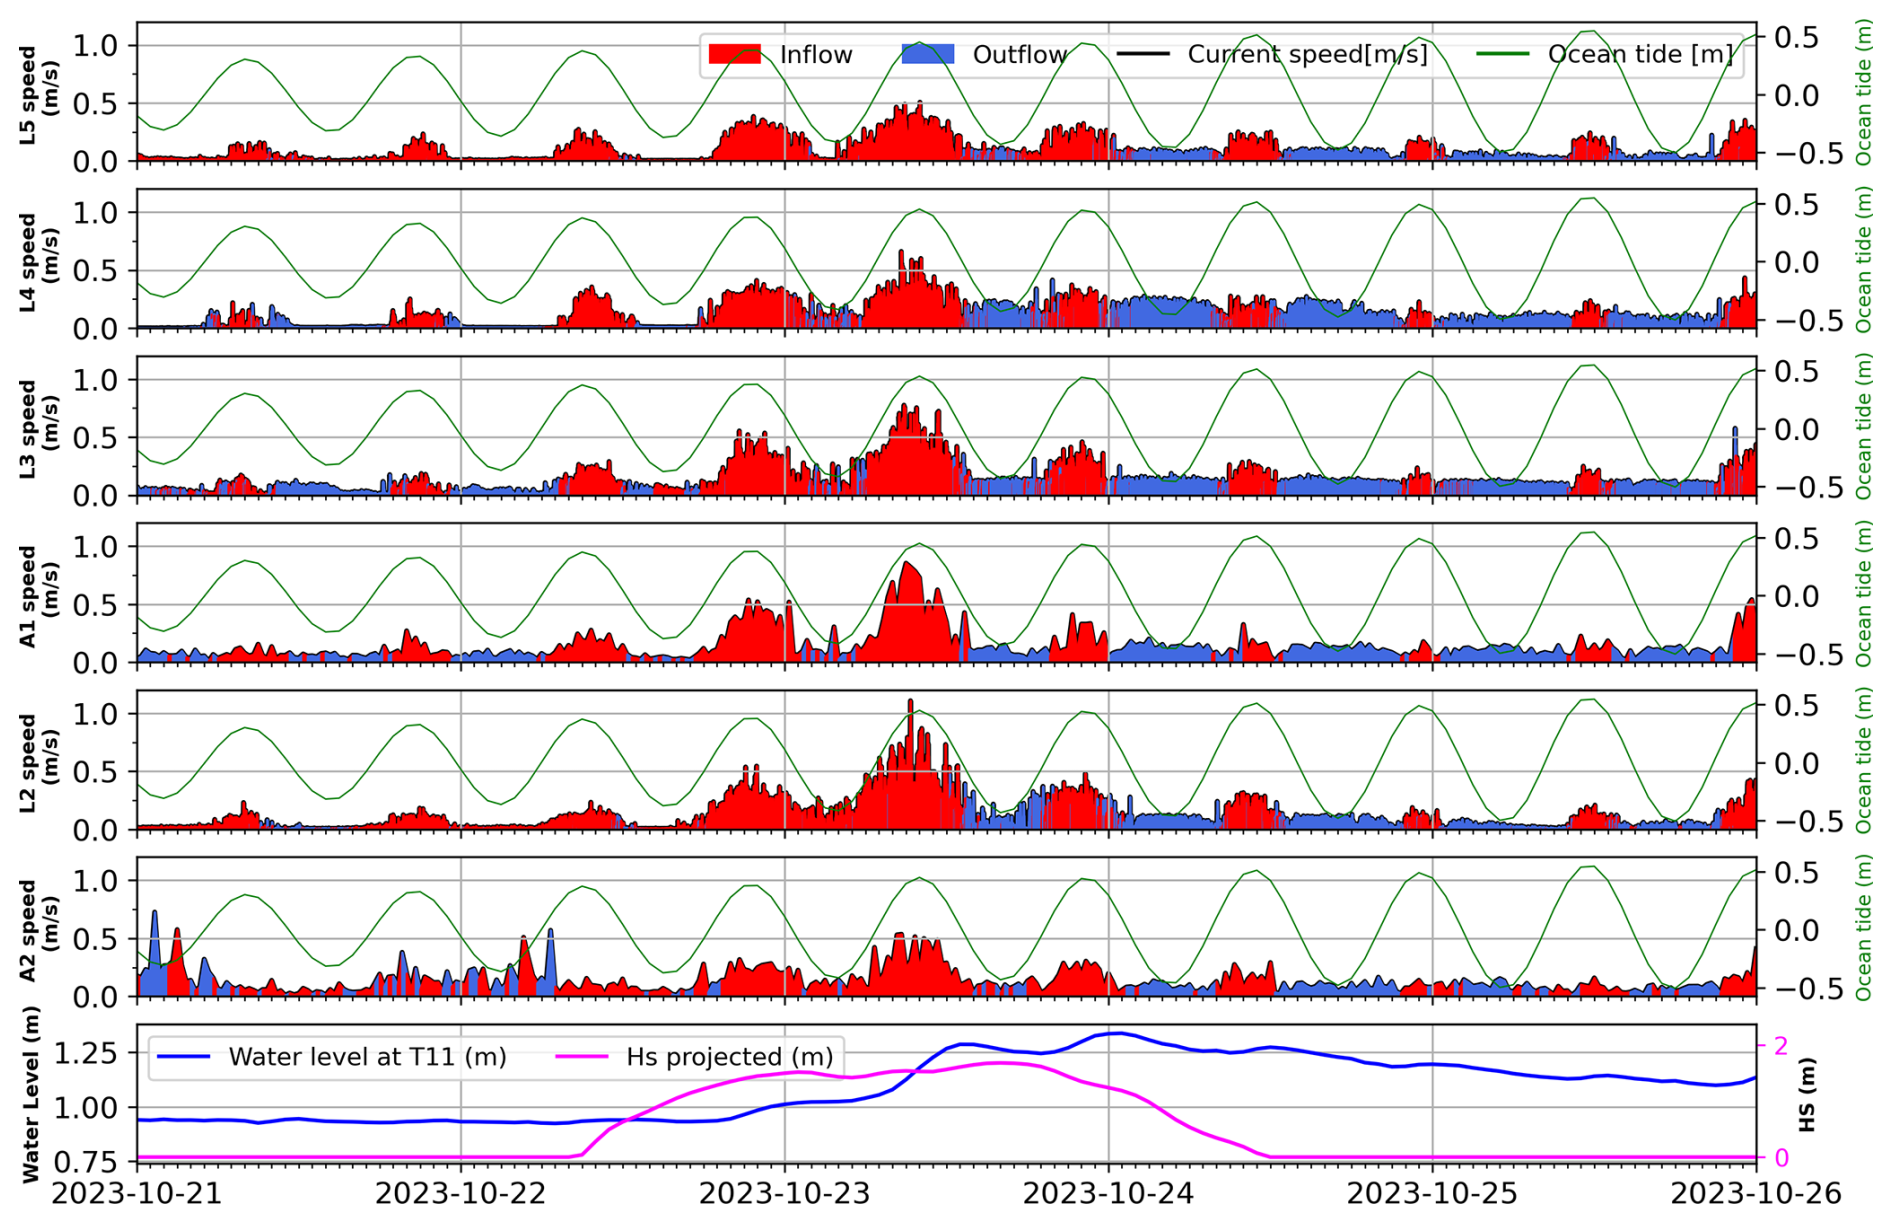
Figure 4Current speed and direction (inflow in red, outflow in blue) recorded by Lowell-TCM4 (L2, L3, L4, L5) and Aquadopp (A1, A2) in hoa. Instruments A1 and L3 were positioned a few meters apart within the same hoa. The ocean tide (recomposed from FES2012 global tidal harmonics at 18.75° S, 136.6° W) is shown as solid green lines in each panel. The bottom panel displays the lagoon water level at T11 (blue) and ERA5 projected significant wave height (pink, Hs at 18.75° S, 136.6° W) projected onto the direction normal to the southern rim (210°).
6.2 Lagoonal circulation
Globally, current velocities display very low magnitudes (average velocities around 2.5 cm s−1 for the three instruments, and for all cells across the profiles). Depth-averaged current velocities generally exhibit relatively stronger currents in the northern basin than in the intermediate and southern basins (up to 0.1, 0.07, 0.06 m s−1 maximum current velocities respectively for B1, B2 and B3). Figure 5 presents a 7 d example (25 November–1 December 2023) of circulation observed by the three current profilers (stations B1, B2 and B3) in relation to wind-induced slope. Winds and currents are both projected along Reao's main axis and slope is computed as the difference in depth anomalies between B1 and B3. During most of the period, positive projected wind values indicate weak trade winds (blowing from east-southeast), which induce a slight sea surface slope (up to 2 cm approximately). Over the displayed period, currents exhibit vertically sheared structures at all stations and the subsurface currents mainly tend to flow slowly southeastward (note that the first few meters from the surface were discarded to avoid “contaminated” values). Around 28 November, a wind reversal event (northwest slight wind burst) is observed. The effects of this reversal are most clearly visible at station B3. During this event, surface currents in B3 are predominantly directed southeastward, in agreement with the wind forcing, while subsurface currents show a marked intensification northwestward. This results in a temporary reorganization of the vertical current structure compared to the preceding period. At stations B1 and B2, this signal is present but less clearly defined although currents in the intermediate part of the water column also show a reversal and intensification toward the northwest. These patterns suggest the existence of overturning circulations as described in Dumas et al. (2012) for the case of Ahe atoll. At this stage, we cannot determine whether these circulation cells are specific to each basin, but further hydrodynamics modeling will provide insights about these patterns..
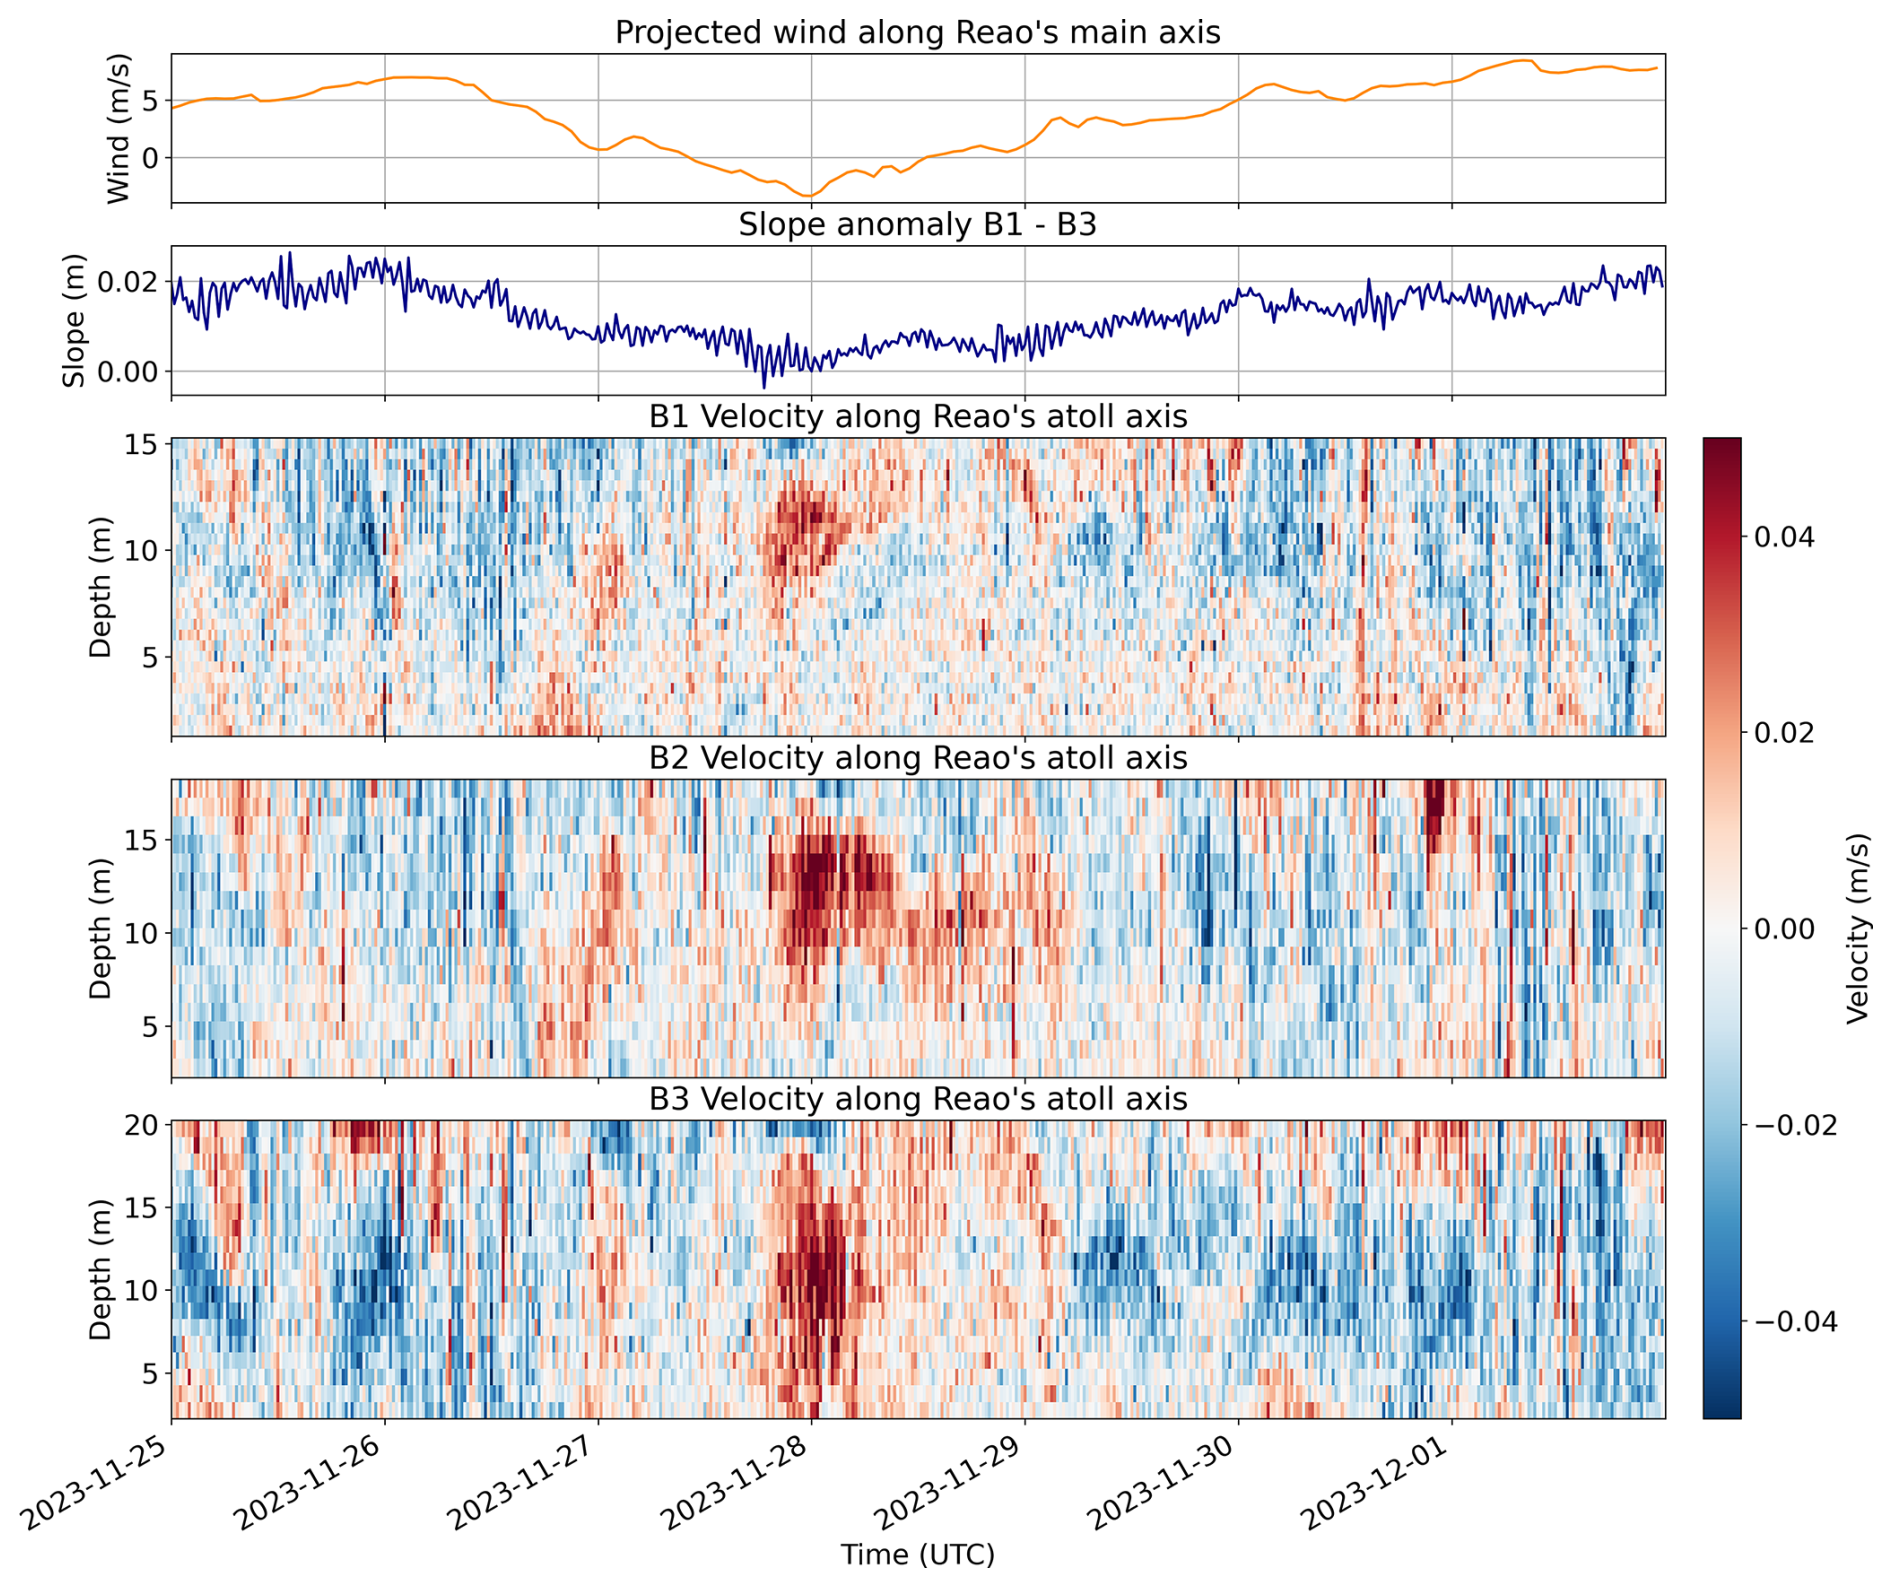
Figure 5From top to bottom: ERA5 winds (18.5° S, 136.5° W) projected onto Reao's major axis (positive values indicate winds blowing from southeast toward northwest); Time-varying sea surface slope, computed from sea level anomalies between ADCP B1 and ADCP B3; positive values indicate higher water levels at B1 relative to B3; Profiles of projected current velocities along Reao's main axis (positive values indicate currents flowing toward the northwest along the same axis). Note that all variables are expressed as projections onto the atoll's main axis (Fig. 3), which is oblique relative to geographic directions; therefore, the color scale represents along-axis flow components rather than strictly zonal or meridional directions.
6.3 Observed thermal patterns with a focus on the 2024 MHW event
The temperature time series allowed us to characterize the seasonal trend of temperature in Reao's lagoon. As already described in other atoll lagoons (Van Wynsberge et al., 2017), lagoon temperature showed a greater annual amplitude than ocean SST (here ERA5 SST at 18.75° S, 136.6° W), with higher lagoon temperature than ocean SST in austral summer, and vice versa in austral winter (Fig. 6A). Although not shown in the figures presented here, the Reao dataset also highlighted differences in temperature within the lagoon depending on reef geomorphology, bathymetry, and proximity to ocean-water exchanges, which is a common feature of atoll systems (Rogers et al., 2016; Green et al., 2019; Grimaldi et al., 2023; Reid et al., 2020).
During the GAIA sampling, the Reao lagoon experienced four distinct MHWs: three short category I events and one category III event (Van Wynsberge et al., 2026). The category I events spanned 13 d (25 March–7 April 2023), 5 d (24–29 April 2023), and 6 d (3–9 January 2024). MHW categories are defined, following Hobday et al. (2018), based on the difference between the daily SST 90th percentile and the SST climatology (here computed on the 1993–2022 period) for the corresponding day of the year. Briefly, if the SST on a given day reaches the climatology plus this difference, the event is classified as a Category I MHW; if it reaches twice the difference, it is a Category II MHW, and higher multiples correspond to higher categories.
The category III event, which occurred from 19 February to the end of March 2024, persisted for 41 d and resulted in mass bleaching of giant clams (Van Wynsberge et al., 2026). During this period, both oceanic SST and lagoon temperature increased, but the lagoon warmed more rapidly, remaining at 1 m depth on average 1.42 °C (at maximum 1.7 °C) above SST at T2, 1.45 °C (max 1.77 °C) above SST at T10, 1.45 °C (max 1.76 °C) above SST at T11, and 1.27 °C (max 1.55 °C) above SST at T4. Although not shown in the figure presented here, it is worth noting that during the 2024 MWH, slightly higher temperature was found at T10 in the shallow northern basin than at T4 located in the deep wide southern basin (0.15 °C difference in mean at 4.5 m depth). This is in congruence with previous temperature gradients reported across Reao's lagoon during austral summer (Van Wynsberge et al., 2024). Only weak vertical temperature gradients were observed between 1, 4, and 7 m depths at station T10, although the diurnal amplitude was more pronounced at 1 m (Fig. 6B). Temperature recorded in the middle of the lagoon at 22 m depth at the B2 station followed the same general trend, with a delayed response and smoother daily variability, indicating greater thermal inertia of deep lagoon waters. The apparent flattening of the diurnal signal at B2 during the night can be explained by higher wind speeds during the day than at night. Stronger daytime winds enhance vertical mixing, allowing the daily temperature cycle to reach deeper layers, whereas weaker nighttime winds limit this mixing. Overall, during this unprecedented event, the lagoon alternated between high-level of water and ranoa phases, and winds were blowing mostly from E/SE. Unexpectedly, oceanic (exacerbated ocean-lagoon exchanges during certain periods such as the end of February 2024) and wind forcings seemed to have little affected the high temperature trends. This suggests that exceptionally strong solar fluxes, likely associated with anomalously warm air temperatures, were the primary contributing factors, although assessing the validity of this hypothesis requires further analyses (i.e., heat budget calculations) which are beyond the scope of this datapaper.
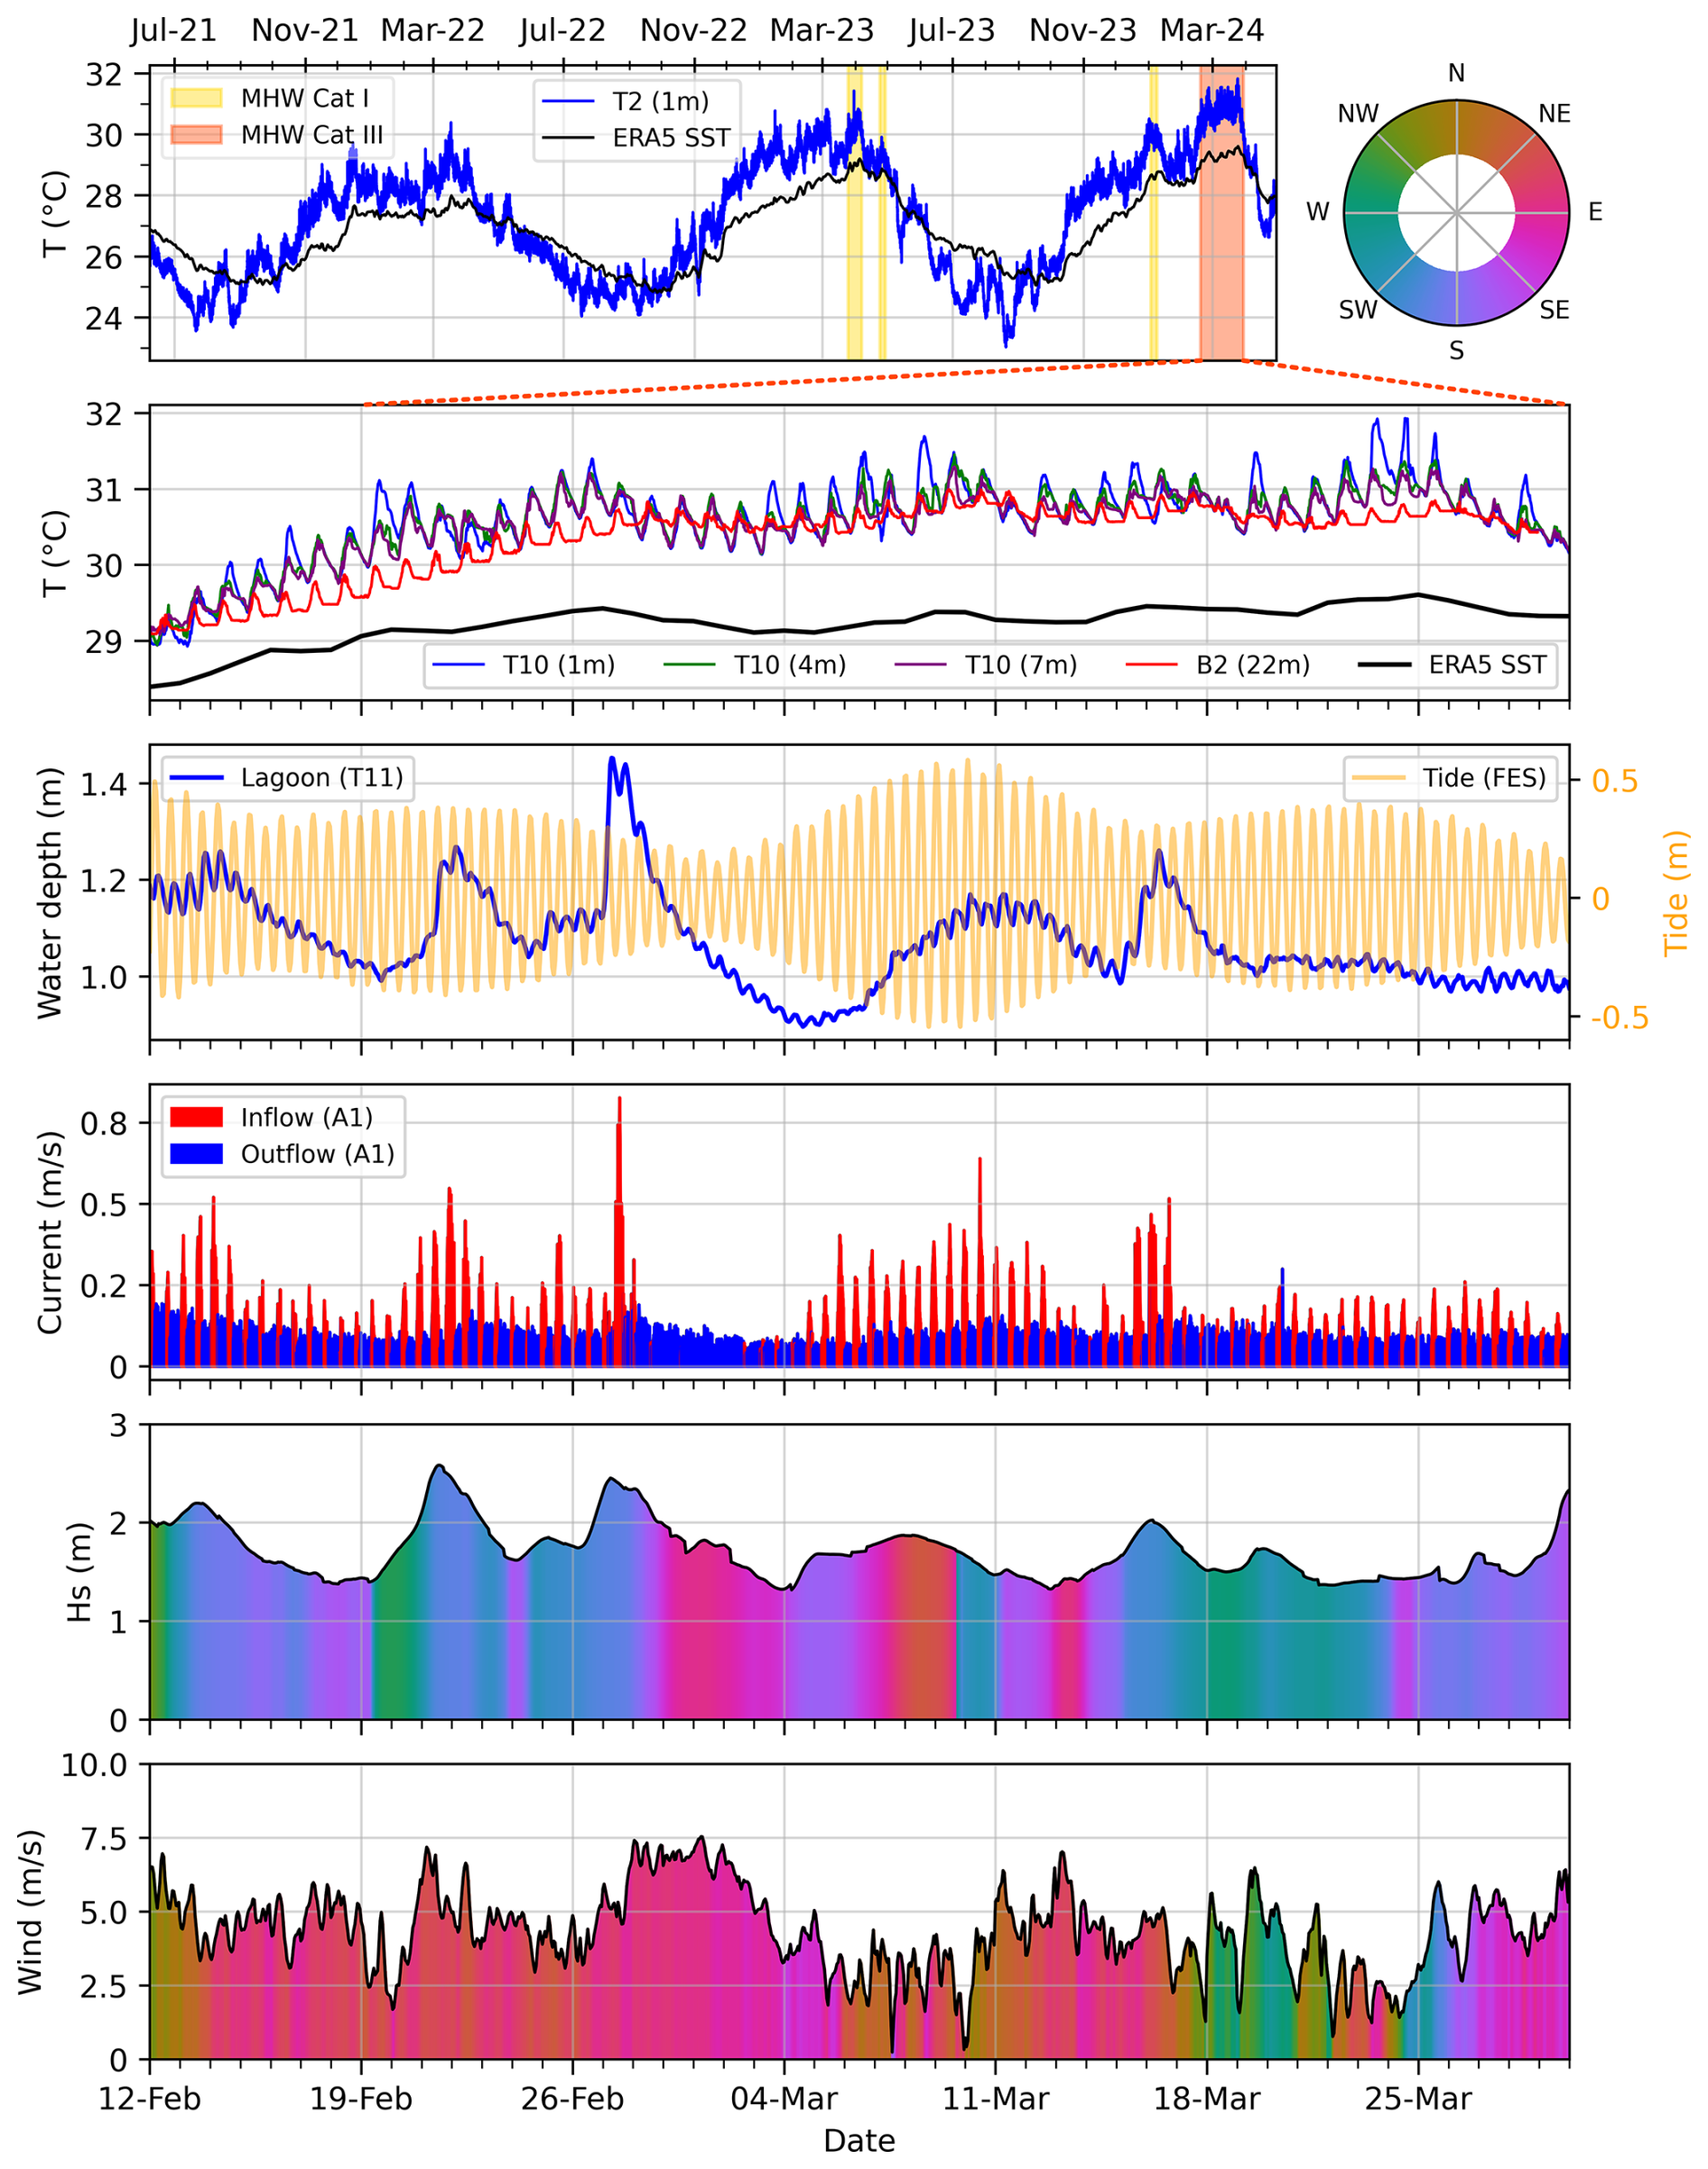
Figure 6From top to bottom: (A) Temperature interannual time series at T2 station (blue) and ERA5 SST at 18.5° S, 136.5° W (black). Marine heatwave categories were computed from a statistical hindcast model of temperature (Van Wynsberge et al., 2026), following Hobday et al. (2016) method, without any detrending of time series and using the period 1993–2022 as climatology (30 years). (B) Zoom on the 2024 MHW category III event at T10 (1, 4, 7 m), ADCP B2 station and outside the lagoon (ERA5 SST). (C) Lagoon water level at T11 and oceanic tide (recomposed from FES2012 global tide solution at 18.75° S, 136.6° W) and (D) Current speed and direction (as inflow/outflow between ocean and lagoon) in hoa at A1. (E) Significant wave height and wave direction extracted from ERA5 at 18.75° S, 136.6° W. (F) Wind speed and direction computed from wind components extracted from ERA5 at 18.5° S, 136.5° W.
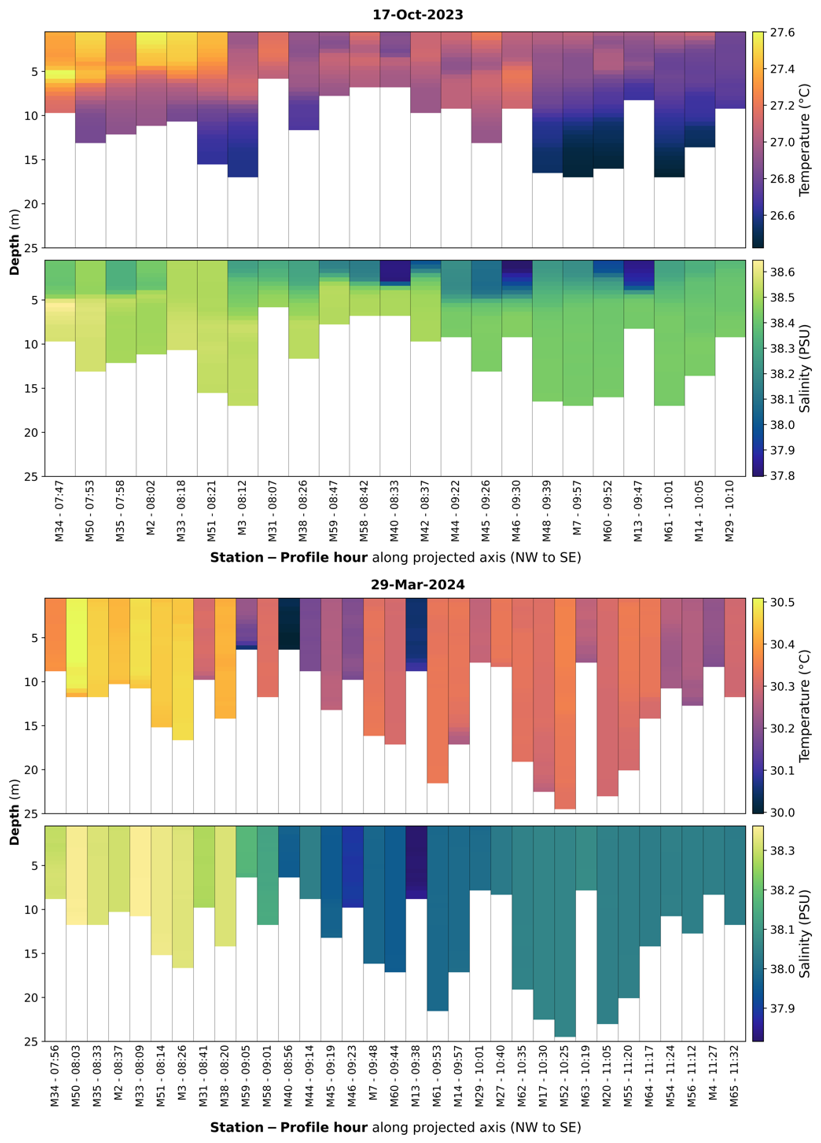
Figure 7Temperature and salinity profiles for stations projected along Reao's main axis. Profiles are arranged from northwest (left) to southeast (right) across the atoll lagoon. Top: CTD profiles on 17 October 2023. Bottom: CTD Profiles during the 2024 MHW event on 29 March 2024. CTD cast times are given in local time (UTC-10).
Figure 7 displays CTD profiles at two different sampling dates (17 October 2023 and 29 March 2024). Globally, CTD network evidenced a southeast-northwest gradient across the three basins, the northwest basins showing warmer and more saline waters. Toward the southeastern part of the lagoon, temperature and salinity decreased at both dates. CTD profiles network (that did not cover the southeast part of the lagoon) captured on 17 October 2023 shows quite marked vertical stratification, due to low wind before and during the period of measurement. In the shallow Northwest basin, a thermocline and a halocline were well formed, with surface water (∼ 0–5 m depth) warmer and less saline than deeper water. Although similar patterns were observed at some stations in the intermediate basin, stations located closer to the hoa exhibited an inverted temperature profile, with lower temperatures in the surface layer, associated with a pronounced salinity stratification (nearly 0.6 PSU less in surface water than bottom values). These differences are explained by the inflow of fresher and less saline water than the lagoon through the hoa, which primarily affects the surface layer at these stations. During the 2024 MHW event (29 March 2024), water columns displayed limited vertical stratification in terms of both temperature and salinity, probably because of higher wind speed at the time of measurements. Spatial differences nevertheless persisted between basins (highest temperature and salinity in the northwestern basin), and lowest temperatures were found at immediate proximity of hoa (e.g. M40, M15, 341 Fig. 3B) in the intermediate basin.
The whole dataset presented herein is publicly available in NetCDF format through the SEANOE open data platform (https://www.seanoe.org/, last access: 21 July 2026; Merceur et al., 2022) in a dedicated repository at https://doi.org/10.17882/105885 (Le Gendre et al., 2025a).
Our dataset presented for the lagoon of Reao Atoll provides a unique and comprehensive record of thermal fluctuations and hydrodynamics in a semi-closed tropical ecosystem, including an exceptional MHW event in summer 2024. Multi-year and multi-depth observations will allow for a detailed characterization of the spatial and vertical variability of temperature, ocean-lagoon exchanges through the hoa, internal circulation, and lagoon water level dynamics. Beyond improving our understanding of the functioning of semi-closed atolls and their vulnerability to thermal stress, these data will provide valuable support for future modeling (e..g statistical or hydrodynamics) and remote sensing analyses. The availability of the data in a standardized NetCDF format, along with comprehensive metadata, facilitates reuse for future works.
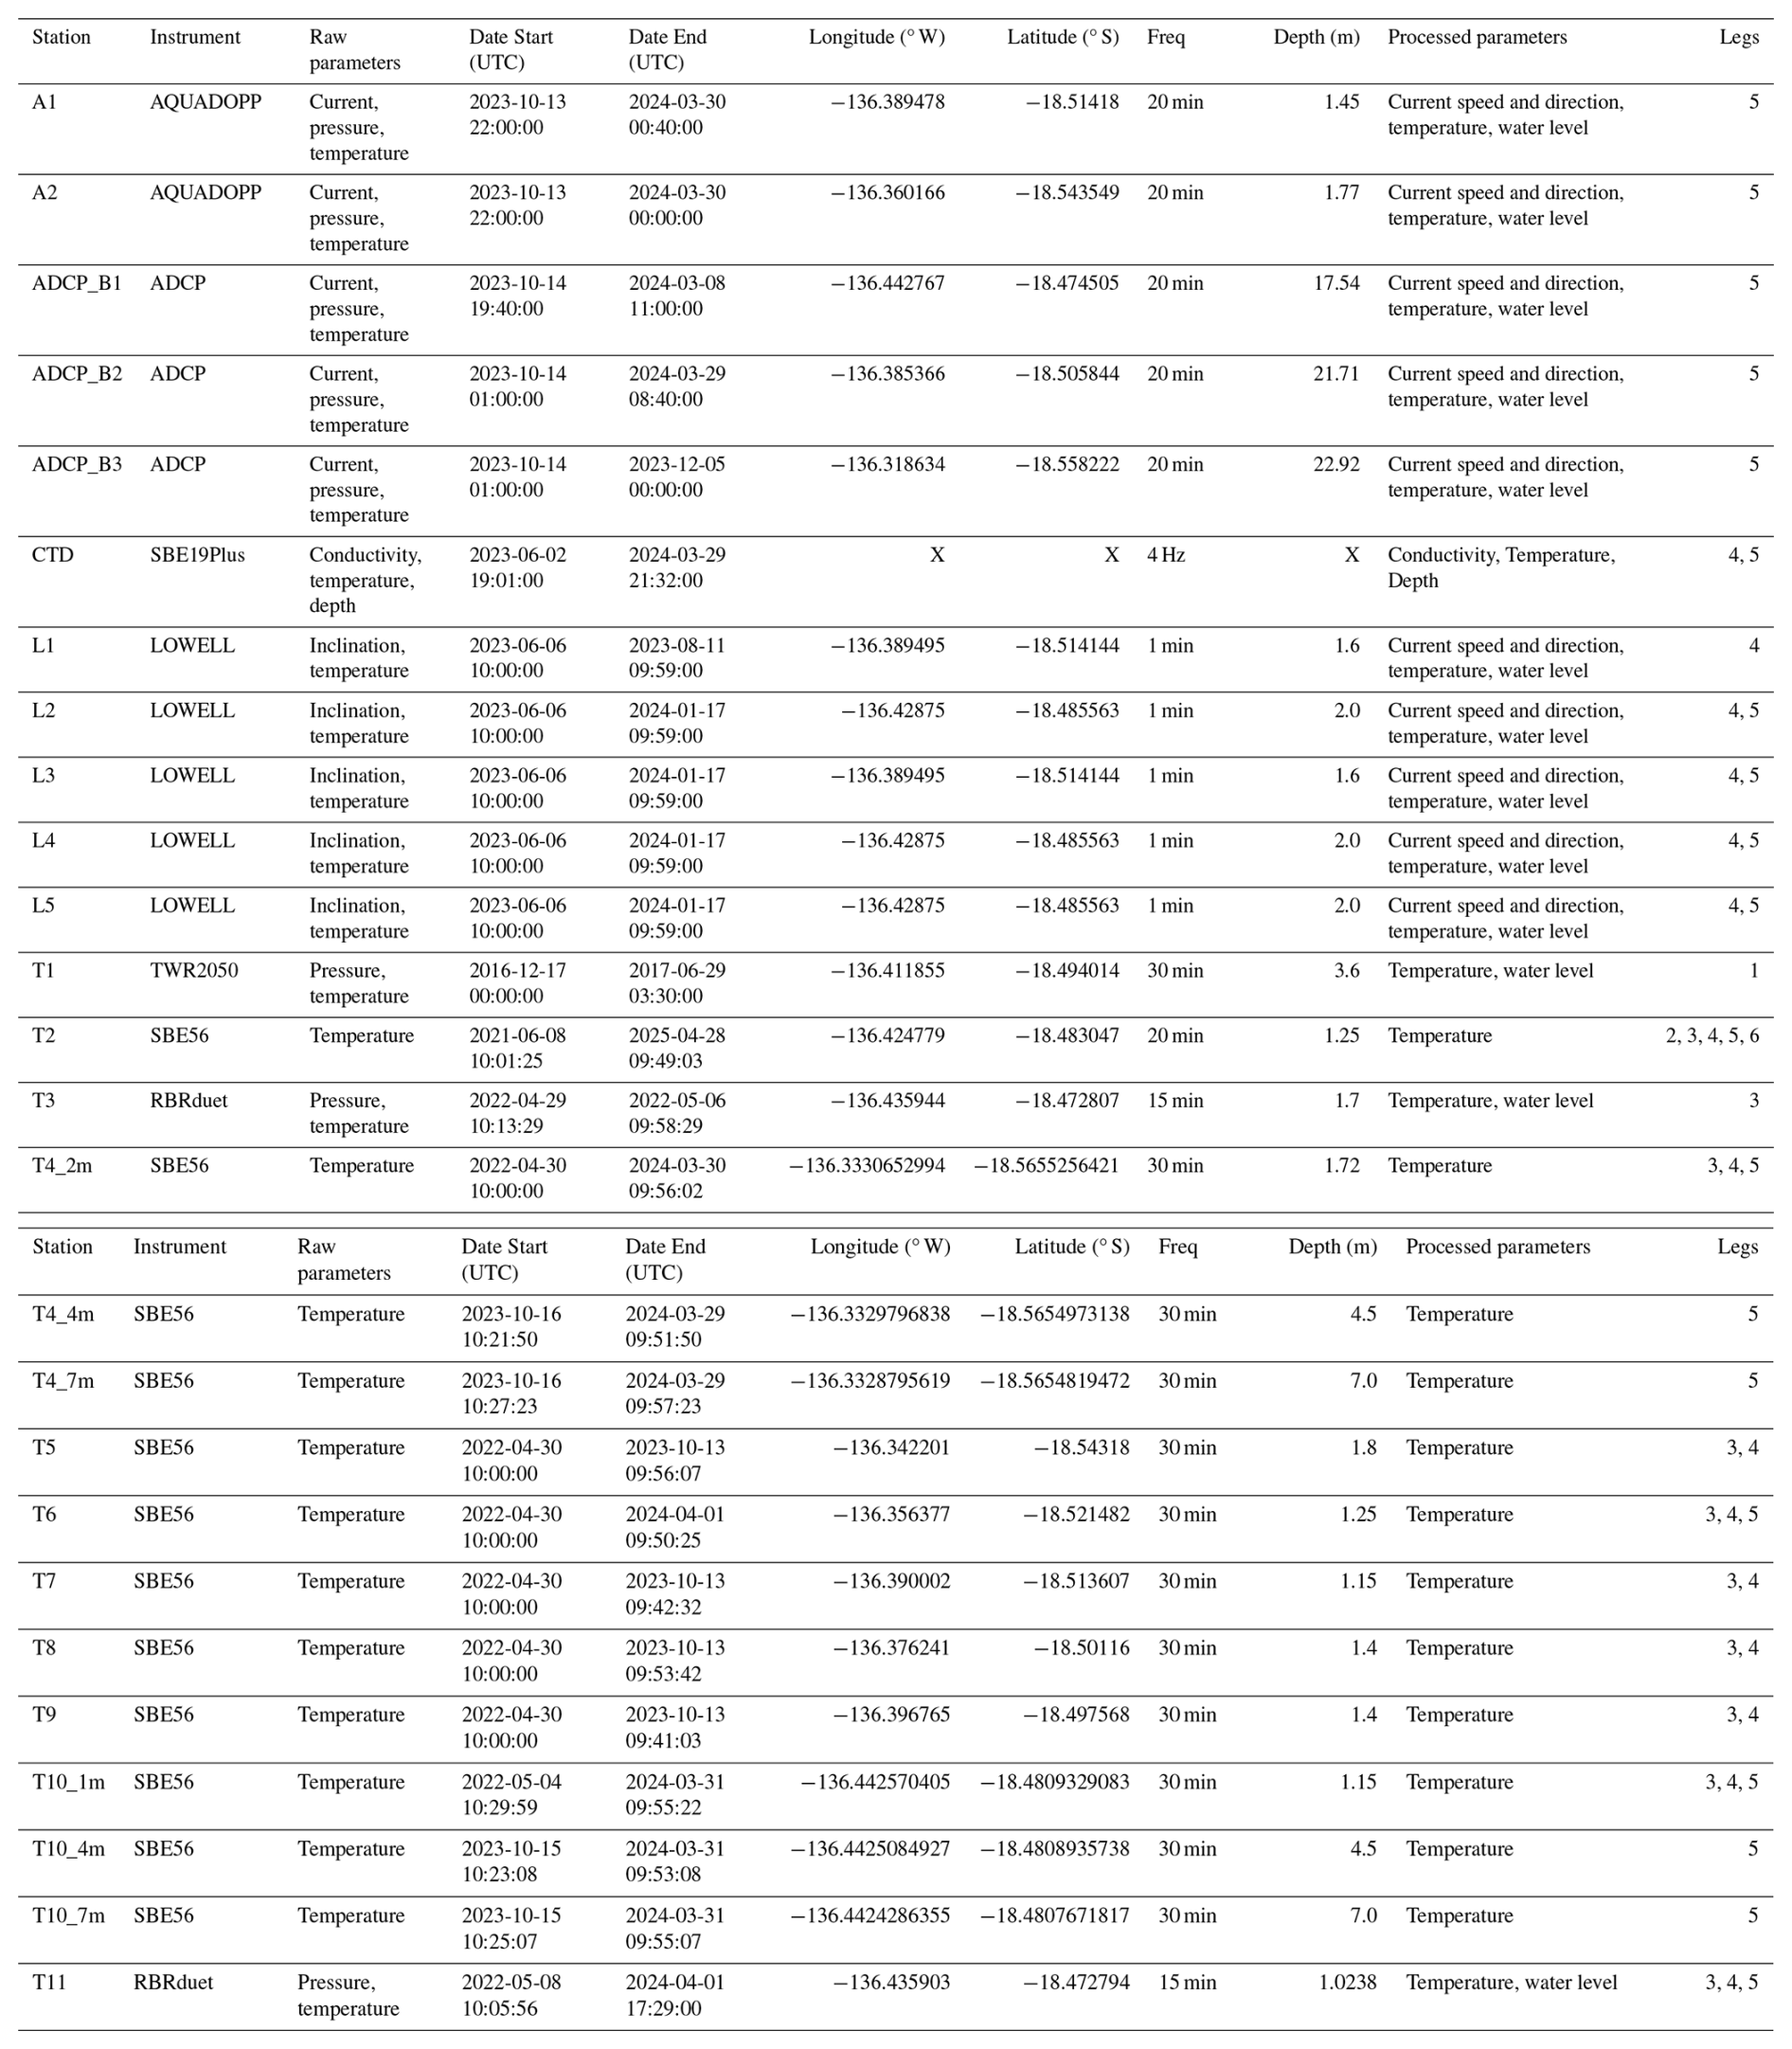
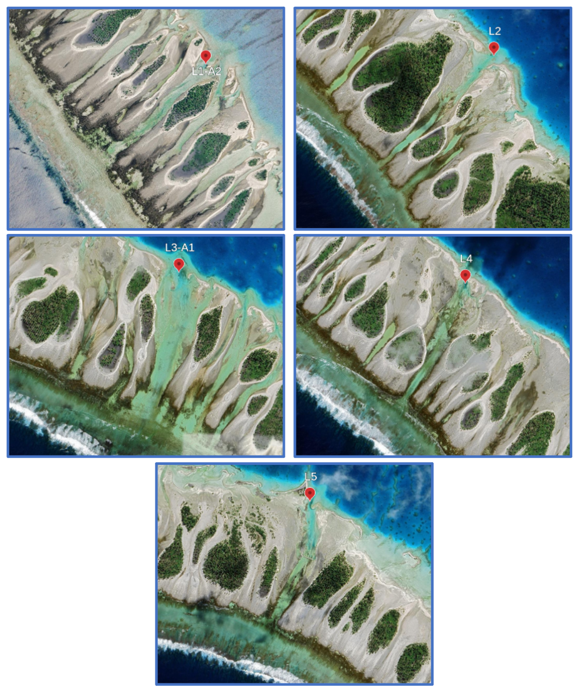
Figure A1Zooms on the locations of the five instrumented hoa (Imagery © 2025 Airbus, CNES/Airbus, Maxar Technologies, Map Data, © 2025 Google).
SVW set up the ANR GAIA project and raised funds. RLG and SVW designed and conducted the experiments as principal investigators. EL and CC organized, processed, checked, and archived the data sets. EL prepared the initial version of the paper and designed the figures, with contributions from all co-authors.
The contact author has declared that none of the authors has any competing interests.
Publisher's note: Copernicus Publications remains neutral with regard to jurisdictional claims made in the text, published maps, institutional affiliations, or any other geographical representation in this paper. The authors bear the ultimate responsibility for providing appropriate place names. Views expressed in the text are those of the authors and do not necessarily reflect the views of the publisher.
This work was supported by the Agence National de la Recherche [ANR-21-CE32-0011-01 GAIA] and the Direction des Ressources Marine (DRM). We thank Pahuatini Michel, Liao Vetea, Maamaatuaiahutapu Moana, Moeroa Matangi, Remoissenet Georges, Richmond Teriipaia, and Varillon David for their assistance with logger maintenance, and the mayor of Reao Mr M. Lenoir for giving us permission to deploy the instruments in the lagoon. We also extend our gratitude to Serge Andréfouët and Oriane Bruyère for their advice that helped design the sampling strategy and for providing the map of French Polynesia.
This research has been supported entirely by the Agence National de la Recherche [ANR-21-CE32-0011-01 GAIA] and the Direction des Ressources Marines (DRM) of French Polynesia.
This paper was edited by François G. Schmitt and reviewed by Alejandra Sanchez-Rios and Camille Grimaldi.
Amrari, S., Bourassin, E., Andréfouët, S., Soulard, B., Lemonnier, H., and Le Gendre, R.: Shallow Water Bathymetry Retrieval Using a Band-Optimization Iterative Approach: Application to New Caledonia Coral Reef Lagoons Using Sentinel-2 Data, Remote Sens., 13, 4108, https://doi.org/10.3390/rs13204108, 2021.
Andréfouët, S. and Paul, M.: Atolls of the world: A reappraisal from an optical remote sensing and global mapping perspective, Mar. Pollut. Bull., 194, 115400, https://doi.org/10.1016/j.marpolbul.2023.115400, 2023.
Andréfouët, S., Dutheil, C., Menkes, C. E., Bador, M., and Lengaigne, M.: Mass mortality events in atoll lagoons: environmental control and increased future vulnerability, Glob. Change Biol., 21, 195–205, https://doi.org/10.1111/gcb.12699, 2015.
Andréfouët, S., Desclaux, T., Buttin, J., Jullien, S., Aucan, J., Le Gendre, R., and Liao, V.: Periodicity of wave-driven flows and lagoon water renewal for 74 Central Pacific Ocean atolls, Mar. Pollut. Bull., 179, 113748, https://doi.org/10.1016/j.marpolbul.2022.113748, 2022.
Andréfouët, S., Bruyère, O., Liao, V., and Le Gendre, R.: Hydrodynamical impact of the July 2022 “Code Red” distant mega-swell on Apataki Atoll, Tuamotu Archipelago, Global Planet. Change, 228, 104194, https://doi.org/10.1016/j.gloplacha.2023.104194, 2023.
Andréfouët, S., Van Wynsberge, S., and Remoissenet, G.: A typology of giant clam shell deposits in eastern Tuamotu-Gambier atolls (French Polynesia) to guide conservation and exploitation measures, Reg. Stud. Mar. Sci., 89, 104364, https://doi.org/10.1016/j.rsma.2025.104364, 2025.
Aucan, J., Desclaux, T., Le Gendre, R., Liao, V., and Andréfouët, S.: Tide and wave driven flow across the rim reef of the atoll of Raroia (Tuamotu, French Polynesia), Mar. Pollut. Bull., 171, 112718, https://doi.org/10.1016/j.marpolbul.2021.112718, 2021.
Bruyère, O., Soulard, B., Lemonnier, H., Laugier, T., Hubert, M., Petton, S., Desclaux, T., Van Wynsberge, S., Le Tesson, E., Lefèvre, J., Dumas, F., Kayara, J.-F., Bourassin, E., Lalau, N., Antypas, F., and Le Gendre, R.: Hydrodynamic and hydrological processes within a variety of coral reef lagoons: field observations during six cyclonic seasons in New Caledonia, Earth Syst. Sci. Data, 14, 5439–5462, https://doi.org/10.5194/essd-14-5439-2022, 2022.
Bruyère, O., Le Gendre, R., Chauveau, M., Bourgeois, B., Varillon, D., Butscher, J., Trophime, T., Follin, Y., Aucan, J., Liao, V., and Andréfouët, S.: Lagoon hydrodynamics of pearl farming atolls: the case of Raroia, Takapoto, Apataki and Takaroa (French Polynesia), Earth Syst. Sci. Data, 15, 5553–5573, https://doi.org/10.5194/essd-15-5553-2023, 2023.
Bruyère, O., Le Gendre, R., Liao, V., and Andréfouët, S.: Lagoon hydrodynamics of pearl farming islands: the case of Gambier (French Polynesia), Earth Syst. Sci. Data, 16, 667–679, https://doi.org/10.5194/essd-16-667-2024, 2024.
Dumas, F., Le Gendre, R., Thomas, Y., and Andréfouët, S.: Tidal flushing and wind driven circulation of Ahe atoll lagoon (Tuamotu Archipelago, French Polynesia) from in situ observations and numerical modelling, Mar. Pollut. Bull., 65, 425–440, https://doi.org/10.1016/j.marpolbul.2012.05.041, 2012.
Dutheil, C., Andrefouët, S., Jullien, S., Le Gendre, R., Aucan, J., and Menkes, C.: Characterization of south central Pacific Ocean wind regimes in present and future climate for pearl farming application, Mar. Pollut. Bull., 160, 111584, https://doi.org/10.1016/j.marpolbul.2020.111584, 2020.
Dutheil, C., Jullien, S., Aucan, J., Menkes, C., Le Gendre, R., and Andréfouët, S.: The wave regimes of the Central Pacific Ocean with a focus on pearl farming atolls, Mar. Pollut. Bull., 162, 111751, https://doi.org/10.1016/j.marpolbul.2020.111751, 2021.
Gilbert, A., Yan, L., Remoissenet, G., Andréfouët, S., Payri, C., and Chancerelle, Y.: Extraordinarily high giant clam density under protection in Tatakoto atoll (Eastern Tuamotu archipelago, French Polynesia), Coral Reefs, 24, 495–495, https://doi.org/10.1007/s00338-005-0494-2, 2005.
Green, R. H., Lowe, R. J., Buckley, M. L., Foster, T., and Gilmour, J. P.: Physical mechanisms influencing localized patterns of temperature variability and coral bleaching within a system of reef atolls. Coral Reefs, 38, 759–771, 2019.
Grimaldi, C. M., Lowe, R. J., Benthuysen, J. A., Cuttler, M. V. W., Green, R. H., and Gilmour, J. P.: Hydrodynamic and atmospheric drivers create distinct thermal environments within a coral reef atoll, Coral Reefs, 42, 693–706, 2023.
Hobday, A. J., Alexander, L. V., Perkins, S. E., Smale, D. A., Straub, S. C., Oliver, E. C. J., Benthuysen, J. A., Burrows, M. T., Donat, M. G., Feng, M., Holbrook, N. J., Moore, P. J., Scannell, H. A., Sen Gupta, A., and Wernberg, T.: A hierarchical approach to defining marine heatwaves, Prog. Oceanogr., 141, 227–238, https://doi.org/10.1016/j.pocean.2015.12.014, 2016.
Hobday, A., Oliver, E., Sen Gupta, A., Benthuysen, J., Burrows, M., Donat, M., Holbrook, N., Moore, P., Thomsen, M., Wernberg, T., and Smale, D.: Categorizing and Naming Marine Heatwaves, Oceanography, 31, https://doi.org/10.5670/oceanog.2018.205, 2018.
Hersbach, H., Bell, B., Berrisford, P., Hirahara, S., Horányi, A., Muñoz-Sabater, J., Nicolas, J., Peubey, C., Radu, R., Schepers, D., Simmons, A., Soci, C., Abdalla, S., Abellan, X., Balsamo, G., Bechtold, P., Biavati, G., Bidlot, J., Bonavita, M., De Chiara, G., Dahlgren, P., Dee, D., Diamantakis, M., Dragani, R., Flemming, J., Forbes, R., Fuentes, M., Geer, A., Haimberger, L., Healy, S., Hogan, R. J., Hólm, E., Janisková, M., Keeley, S., Laloyaux, P., Lopez, P., Lupu, C., Radnoti, G., de Rosnay, P., Rozum, I., Vamborg, F., Villaume, S., and Thépaut, J.-N.: The ERA5 global reanalysis, Q. J. Roy. Meteor. Soc., 146, 1999–2049, 2020.
Le Gendre, R., Ladet, E., Chevillard, C., Trophime, T., Bruyere, O., and Van Wynsberge, S.: Lagoon temperature and hydrodynamics of Reao atoll (Tuamotu Archipelago), SEANOE [data set], https://doi.org/10.17882/105885, 2025a.
Le Gendre, R., Varillon, D., Fiat, S., Hocdé, R., de Ramon N'Yeurt, A., Andréfouët, S., Aucan, J., Cravatte, S., Duphil, M., Ganachaud, A., Gaudron, B., Kestenare, E., Liao, V., Pelletier, B., Peltier, A., Schaefer, A.-L., Trophime, T., Van Wynsberge, S., Dandonneau, Y., Allenbach, M., and Menkes, C.: ReefTEMPS: the Pacific Islands coastal temperature network, Earth Syst. Sci. Data, 17, 5277–5301, https://doi.org/10.5194/essd-17-5277-2025, 2025b.
McCabe, R. M., Estrade, P., Middleton, J. H., Melville, W. K., Roughan, M., and Lenain, L.: Temperature variability in a shallow, tidally isolated coral reef lagoon, J. Geophys. Res.-Oceans, 115, https://doi.org/10.1029/2009JC006023, 2010.
Merceur, F., Petit de la Villeon, L., and Van Iseghem, S.: Seanoe – A thematic repository, Research Data Sharing and Valorization – Developments, Tendencies, Models, 5, 77–96, https://doi.org/10.1002/9781394163410.ch5, 2022.
Mies, M., Dor, P., Güth, A. Z., and Sumida, P. Y. G.: Production in Giant Clam Aquaculture: Trends and Challenges, Rev. Fish. Sci. Aquac., 25, 286–296, https://doi.org/10.1080/23308249.2017.1285864, 2017.
Neo, M. L., Eckman, W., Vicentuan, K., Teo, S. L.-M., and Todd, P. A.: The ecological significance of giant clams in coral reef ecosystems, Biol. Conserv., 181, 111–123, https://doi.org/10.1016/j.biocon.2014.11.004, 2015.
Pagli, B., Izumo, T., Barboni, A., Chevillard, C., Dutheil, C., Legrand, R., Menkes, C., Rocuet, C., and Cravatte, S.: Marine heatwaves across the central South Pacific: characteristics, mechanisms, and modulation by El Niño Southern Oscillation, Ocean Sci., 22, 1329–1352, https://doi.org/10.5194/os-22-1329-2026, 2026.
Quéré, R., Friot, C., Van Wynsberge, S., and Le Gendre, R.: Bathymetry of the lagoon and hoa of Reao, Tuamotu Archipelago, SEANOE [data set], https://doi.org/10.17882/108293, 2025a.
Quéré, R., Van Wynsberge, S., and Le Gendre, R.: Optimisation d'une bathymétrie dérivée satellite pour le lagon de Reao, Tuamotu, https://archimer.ifremer.fr/doc/00971/108285 (last access: 20 July 2026), 2025b.
Reid, E. C., Lentz, S. J., DeCarlo, T. M., Cohen, A. L., and Davis, K. A.: Physical processes determine spatial structure in water temperature and residence time on a wide reef flat, J. Geophys. Res.-Oceans, 125, e2020JC016543, https://doi.org/10.1029/2020JC016543, 2020.
Remoissenet, G. and Wabnitz, C. C.: Postlarval capture and culture of Tridacna maxima giant clams in French Polynesia, Lettre d'information sur les pêches de la CPS, 139, 16–19, https://www.spc.int/aquaculture/index.php?option=com_content &view=article&id=85:postlarval-capture-and-culture-of-tridacna-maxima-giant-clams-in-french-polynesia&catid=15:articles (last access: 21 July 2026), 2012.
Rogers, J. S., Monismith, S. G., Koweek, D. A., Torres, W. I., and Dunbar, R. B.: Thermodynamics and hydrodynamics in an atoll reef system and their influence on coral cover, Limnol. Oceanogr., 61, 2191–2206, 2016.
Rougerie, F.: Nature et fonctionnement des atolls des Tuamotu (Polynésie Française), Oceanol. Ac., 18, 61–78, 1995.
Stammer, D., Ray, R. D., Andersen, O. B., Arbic, B. K., Bosch, W., Carrere, L., and Yi, Y.: Accuracy assessment of global barotropic ocean tide models, Rev. Geophys., 52, 243–282, 2014.
Storlazzi, C. D., Gingerich, S. B., van Dongeren, A., Cheriton, O. M., Swarzenski, P. W., Quataert, E., Voss, C. I., Field, D. W., Annamalai, H., Piniak, G. A., and McCall, R.: Most atolls will be uninhabitable by the mid-21st century because of sea-level rise exacerbating wave-driven flooding, Sci. Adv., 4, eaap9741, https://doi.org/10.1126/sciadv.aap9741, 2018.
Teaniniuraitemoana, V., Monaco, C. J., Célariès, M., Jauffrais, T., and Van Wynsberge, S.: Light intensity modulates the effect of thermal stress on giant clams and their symbiotic zooxanthellae, Coral Reefs, 44, 1449–1465, https://doi.org/10.1007/s00338-025-02708-8, 2025.
Van Wynsberge, S. and Andréfouët, S.: The Future of Giant Clam-Dominated Lagoon Ecosystems Facing Climate Change, Curr. Clim. Change Rep., 3, 261–270, https://doi.org/10.1007/s40641-017-0078-6, 2017.
Van Wynsberge, S., Andréfouët, S., Gaertner-Mazouni, N., Wabnitz, C. C. C., Gilbert, A., Remoissenet, G., Payri, C., and Fauvelot, C.: Drivers of density for the exploited giant clam Tridacna maxima: a meta-analysis, Fish Fish., 17, 567–584, https://doi.org/10.1111/faf.12127, 2016.
Van Wynsberge, S., Menkes, C., Le Gendre, R., Passfield, T., and Andréfouët, S.: Are Sea Surface Temperature satellite measurements reliable proxies of lagoon temperature in the South Pacific?, Estuar. Coast. Shelf S., 199, 117–124, https://doi.org/10.1016/j.ecss.2017.09.033, 2017.
Van Wynsberge, S., Quéré, R., Andréfouët, S., Autret, E., and Le Gendre, R.: Spatial variability of temperature inside atoll lagoons assessed with Landsat-8 satellite imagery, Remote Sens. Appl., 36, 101340, https://doi.org/10.1016/j.rsase.2024.101340, 2024.
Van Wynsberge, S., Ladet, E., Chevillard, C., Le Gendre, R., Maamaatuaiahutapu, M., Moeroa, M., Remoissenet, G., Richmond, T., Poltavtseef, L., Tepapatahi, T., Teaka, R., Teara, M., Tefau, A., Petton, S., Jullien, S., Lafille, M.-A., and Andréfouët, S.: Optimised thermal-stress indices explain giant clam bleaching observations in a semi-closed atoll lagoon, Coral Reefs, https://doi.org/10.1007/s00338-026-02860-9, 2026.
- Abstract
- Introduction
- Study site
- Instruments, methods and deployments
- Sampling strategy
- Data processing and quality controls
- Overview of observations
- Data availability
- Conclusions
- Appendix A
- Author contributions
- Competing interests
- Disclaimer
- Acknowledgements
- Financial support
- Review statement
- References
- Abstract
- Introduction
- Study site
- Instruments, methods and deployments
- Sampling strategy
- Data processing and quality controls
- Overview of observations
- Data availability
- Conclusions
- Appendix A
- Author contributions
- Competing interests
- Disclaimer
- Acknowledgements
- Financial support
- Review statement
- References