the Creative Commons Attribution 4.0 License.
the Creative Commons Attribution 4.0 License.
 | 22 Jul 2026
MATCHA, a novel regional hydroclimate-chemical reanalysis: System description and evaluation
Chayan Roychoudhury
Rajesh Kumar
Cenlin He
William Y. Y. Cheng
Kirpa Ram
Naoki Mizukami
Avelino F. Arellano
We present MATCHA (Model for Atmospheric Transport and Chemistry in Asia), a 17-year (2003–2019) regional hydroclimate-chemical reanalysis for Asia (58–140° E, 4– 40° N) at 12 km resolution. MATCHA couples the Weather Research and Forecasting model with Chemistry (WRF-Chem), Community Land Model (CLM), and SNow, Ice, and Aerosol Radiative (SNICAR) model, and assimilates aerosol optical depth (AOD) from the Moderate Resolution Imaging Spectroradiometer (MODIS) and carbon monoxide (CO) profiles from the Measurement of Pollution in the Troposphere (MOPITT) every three hours, to explicitly represent interactions between atmospheric composition and regional hydroclimate (including aerosol-snowpack interactions) across High Mountain Asia (HMA). MATCHA comprises hourly surface and column-integrated fields and 3-hourly three-dimensional fields across different light-absorbing aerosol species, e.g., black carbon (BC), dust, and brown carbon (BrC), trace gases, and a broad set of meteorological, hydrological, and land-surface variables over the region. We evaluate 12 key variables in the reanalysis against in-situ and satellite observations. Surface and upper-air meteorology is reproduced well, with Kling-Gupta efficiencies (KGEs) of 0.65 to 1, although high-elevation regions show a persistent winter cold and dry bias and too-strong surface winds. Snow cover fraction seasonality is captured across the major glacier regions, with a slight underestimation during snowmelt, and daily precipitation agrees most closely during the monsoon (KGE up to 0.6). MATCHA reproduces the spatial and seasonal patterns of AOD and single scattering albedo (SSA) at 550 nm but overestimates summer AOD over India and Southeast Asia; surface PM2.5 and PM10 are biased high and surface CO is underestimated relative to observations. A distinguishing feature of MATCHA is a set of tagged BC tracers that attribute concentrations to specific emission sectors and source regions. These tracers show anthropogenic BC peaking in winter (Chinese sources over eastern and northern HMA, Indian sources over the west and center) and biomass-burning BC dominating in March-April. MATCHA is the first high-resolution reanalysis over HMA to fully couple aerosols, radiation, and snow. It supports research on aerosol-cryosphere feedbacks, air quality, and hydroclimate over a region where observations are sparse, and its resolution and 17-year length make it suitable as a training set for statistical and machine-learning models. The dataset is publicly available at https://doi.org/10.5067/CG4OT8DJX2Z7 (Kumar et al., 2024).
- Article
(81281 KB) - Full-text XML
- BibTeX
- EndNote


High-mountain Asia (HMA), often referred to as the Third Pole, is the largest freshwater source in the Earth's cryosphere after the polar regions (Immerzeel et al., 2010). It also acts as the “water tower” for major Asian river systems that supply freshwater to approximately 1.5 billion people (Immerzeel et al., 2010; Yao et al., 2022). These river systems are fed by runoff from direct precipitation and glacial melt in the region, marked by a complex terrain that acts as an elevated heat source for sustaining the Asian summer monsoon (Hahn and Manabe, 1975). Hydrological changes in HMA's glaciers and the dynamic processes affecting them are especially sensitive to climate change, with significant socio-economic consequences due to the presence of rapidly developing and highly populated economies in the vicinity of these glaciers (Pepin et al., 2022). Recent advancements in satellite observations, in situ measurements, and model simulations have characterized multiple changes in HMA, including high elevation warming, increased precipitation, heterogeneous retreating of glaciers, declining snow cover, and enhanced greening and vegetation growth (Hasson et al., 2016; Maina et al., 2022b, a, c; Notarnicola, 2022). These changes impact downstream regions by affecting water supply, regional ecology, land-use practices, and even the risk of natural hazards like landslides and glacial lake outburst floods (Kirschbaum et al., 2020).
The changes observed in HMA are driven by a combination of factors, including precipitation and temperature patterns, greenhouse gas (GHG) dynamics, and the emissions of light-absorbing particles (LAP), including black carbon (BC), dust, and brown carbon (BrC). LAP have been shown to cause significant reductions in snow albedo and accelerate the melting of snow and glaciers, with an efficacy comparable to greenhouse gases (Flanner et al., 2007; Qian et al., 2015; Ramachandran et al., 2023; Yasunari et al., 2013). Deposition of LAP on the glaciers of HMA has been found to contribute to at least 10 % of snow albedo reduction, with an associated radiative forcing of up to more than 100 W m−2 locally (Sarangi et al., 2019). This forcing can account for approximately 15 % of total glacier melt in the southeastern Tibetan Plateau (TP) and up to a 6.3 % increase in the summer melting rate of Pamir glaciers in the western TP (Schmale et al., 2017; Zhang et al., 2018). Snow albedo feedback is a significant contributor to warming in the cryosphere, which is further exacerbated by LAP due to interactions of absorbing aerosols with the surface snow and near-surface meteorology (Flanner et al., 2007). Despite growing evidence linking deposition of LAP to rapid warming and enhanced snowmelt in High Mountain Asia, our understanding of their precise physical impacts and the relative contribution of different types of LAP remains limited. Observational challenges, model uncertainties, and complex interactions between aerosols and snow properties contribute to this gap. Significant gaps in our knowledge stem from uncertainties in aerosol emission estimates, incomplete understanding of aerosol radiative properties and chemical composition, and the lack of accurate representations of LAP-snowpack-meteorology interactions and BrC aerosols in coupled climate-chemistry models (Collins et al., 2017; Liu et al., 2020; Qian et al., 2015; Roychoudhury et al., 2022, 2025; Skiles et al., 2018; Xu et al., 2021). Current global and regional chemical transport models tend to underestimate BC and dust concentrations, leading to underestimations of LAP in source pollution regions, surface snow, and columnar aerosol absorption (Goto et al., 2011; He et al., 2014). These discrepancies in LAP concentrations and LAP-related aerosol properties result in significant errors in estimates of aerosol-climate interactions (such as radiative forcing and aerosol-induced snow albedo feedback) (Liu et al., 2020; Tuccella et al., 2021; Xu et al., 2021).
Despite the critical role of HMA as a major Asian freshwater source, monitoring the changes in this region is a challenging task because of the complex terrain of HMA along with the heterogeneous nature of glaciers, which makes it very difficult to set up and maintain in situ network measurements, and leads to relatively large uncertainties in satellite retrievals. Polar orbiting satellite retrievals such as those from the Moderate Resolution Imaging Spectroradiometer (MODIS) and Measurement of Pollution in the Troposphere (MOPITT) have a good spatial coverage but limited temporal (1–2 times per day) coverage. Dynamical models serve as another option to create datasets to study long-term changes in HMA. However, such model simulations have their own biases due to spatial resolution, simplified representation of different physics and chemistry processes via parameterizations, and inaccuracies in model input datasets (Tarek et al., 2021). This issue can be partially addressed by global and regional reanalyses that assimilate available in situ and satellite observations into models. Although individual satellite retrievals carry uncertainty, what assimilation does is weigh observations by their error covariances relative to the model background, so that noisier retrievals exert less influence on the analysis. This allows the spatio-temporal coverage of the retrievals to correct systematic model errors while keeping the model state as close to observations as possible within the constraints of model and observation errors. The reanalyses represent spatio-temporally continuous and dynamically consistent datasets and can be used to assess trends and emerging patterns in climate, snow properties, precipitation, temperature, and aerosols. Several global meteorological and chemical reanalysis datasets are available and widely used, such as ERA5, CAMS-EAC4, and MERRA-2. However, coarser spatial resolution in global reanalyses leads to biases in precipitation, snow properties, temperature, and atmospheric chemistry estimates over HMA due to inaccurate representation of the complex topography and the inability of the models to resolve the spatial heterogeneity in such regions. For precipitation, ERA5 overestimates gauge-constrained flows across HMA river basins by 33 % to 106 %, traced largely to overestimated precipitation, so that bias correction is needed before hydrological use (Sun et al., 2021). For aerosols, the mean AOD bias of MERRA-2 and CAMS over Asia (up to about 0.15) is larger than over any other region of the globe (Ansari and Ramachandran, 2024); over the Indo-Gangetic Plain the two products even disagree in the sign of their error, with MERRA-2 underestimating AOD and CAMS overestimating it, and MERRA-2 single scattering albedo biased low from overestimated black carbon absorption (Ansari and Ramachandran, 2023). Additionally, existing reanalyses that include atmospheric chemistry neither consider the coupling between aerosols and meteorology to its fullest extent nor provide concentrations for species like BrC, which also significantly contributes to LAP-induced radiative forcing. While there are ongoing efforts to enhance the representation of aerosol-meteorology-snow interactions in advanced models (Fast et al., 2006; Grell et al., 2005; He, 2022; He et al., 2014, 2018; Kumar et al., 2014) and to improve Asian emission inventories (Govardhan et al., 2016; Sadavarte and Venkataraman, 2014), recent model developments suggest that assimilation of satellite retrievals of quantities like carbon monoxide (CO) and aerosol optical depth (AOD) can significantly improve simulations of aerosol species (Arellano et al., 2010; Kumar et al., 2019; Liu et al., 2011; Saide et al., 2013; Werner et al., 2019). Regional reanalyses attempt to address this issue by employing higher spatial resolution and smaller time steps and better resolving mesoscale processes to constrain these uncertainties. Several regional reanalyses have been developed over HMA, such as the 18-year HMA Snow Reanalysis (HMASR) dataset, the High Asia Refined analysis (HAR) that focuses on snow properties and meteorological variables, as well as a multi-decadal land reanalysis focusing on hydrological budget over the region (Liu et al., 2021; Maina et al., 2024; Wang et al., 2021). However, none have been developed so far that provide a long-term (more than a decade) record across meteorological, snow and atmospheric composition quantities over HMA, especially a chemical reanalysis that constrains atmospheric composition using satellite observations and simultaneously accounts for interactions across atmospheric composition, meteorology, land surface, and snow.
Given the issues related to the representation of LAP, their feedbacks and impact on climate over HMA, as well as the potential of data assimilation of relevant satellite retrievals to improve atmospheric composition estimates, we present a first attempt towards developing a new regional hydroclimate-chemical reanalysis called MATCHA (Model for Atmospheric Transport and Chemistry in Asia) and evaluate its ability to simulate meteorological, hydrological, and air quality parameters (Kumar et al., 2024). This reanalysis encompasses around 17 years of simulations from 1 January 2003 to 31 August 2019. It is based on the Weather Research and Forecasting model coupled with Chemistry (WRF-Chem) that uses the Community Land Model (CLM) coupled with SNICAR (SNow, ICe, and Aerosol Radiative) model for land surface processes to capture aerosol-snowpack interaction. The MATCHA reanalysis provides hourly (for two-dimensional quantities) to three-hourly (for three-dimensional quantities) estimates at a spatial grid spacing of 12 km over the Asian domain (58–140° E, 4–40° N) and 35σ levels extending from the surface to 50 hPa. The novelty of this regional reanalysis includes:
-
coupling aerosol species with radiation and snowpack using CLM-SNICAR coupled with WRF-Chem.
-
assimilating nearly two decades of aerosol optical depth (AOD) data from MODIS and carbon monoxide profiles from MOPITT.
-
simulating the lifecycle of BrC aerosols, including its deposition on snowpack.
-
providing BC, dust, and BrC abundances and quantifying BC deposition (both wet and dry) in HMA from 10 Asian source regions using a tagged-tracer approach for source attribution of anthropogenic pollution and its impact on HMA's cryosphere.
This study (1) presents the model description behind MATCHA and the assimilation methods involved, and (2) evaluates a variety of key meteorological and chemical quantities from MATCHA with observations (ground-based and satellite measurements) to understand the model biases in simulating these quantities. The primary objective of this paper is to provide a comprehensive validation of the MATCHA dataset and document error characteristics for different parameters so that future users have a better understanding of when and where this dataset can be applied. The remainder of the paper is structured as follows: Sect. 2 describes the model configuration, the tagged-tracer approach, the daily assimilation setup, and the various observations that are used for evaluations. Section 3 describes the evaluation results across different meteorological and chemical variables, with a discussion on the model biases and the factors causing them. Section 4 discusses the key findings related to the evaluation and the applicability of the reanalysis for future studies.
2.1 Model Description and Setup
We employed version 3.9.1 of the WRF-Chem model coupled with CLMv4-SNICAR to simulate the three-dimensional distributions of meteorological parameters, and chemical constituents including LAP, their deposition and evolution in the atmosphere and snow-covered areas over HMA. Our fully-fledged WRF-Chem-CLM-SNICAR (WC-CS) modeling system simulates the interactions between atmospheric composition (trace gases and aerosols), radiation, clouds, snowpack, and land-surface processes. The model domain covers the majority of Asia on a Lambert conformal grid centered at 32° N, 97° E with a horizontal grid spacing of 12 km by 12 km and 35 vertical levels stretching from the surface up to 50 hPa. Meteorological fields from the ERA-Interim (Dee et al., 2011) were used to nudge the temperature, specific humidity, and wind variables in the model every six hours, except for the lowest ten model levels (below the planetary boundary layer), to constrain the large-scale dynamics (Bowden et al., 2012; Seaman et al., 1995). We adopt key model configurations for meteorological, chemical, and land surface processes from Kumar et al. (2013, 2015a), building on our past efforts to simulate key meteorological and chemical characteristics of south Asia (see Table 1 for the schemes and configurations). For simulation of aerosols, the Model for Simulating Aerosol Interactions and Chemistry (MOSAIC) 4-bin sectional aerosol scheme was utilized. MOSAIC simulates both the mass and size distribution of aerosols, thereby enabling interactions of aerosols with cloud microphysics and radiation as demonstrated by previous studies over Asia (Kumar et al., 2015b; Matsui, 2016; Sarangi et al., 2019). Anthropogenic emissions are from the CAMS-GLOB-ANT v4.2 inventory (Granier et al., 2019; Soulie et al., 2024), which provides monthly, sector-resolved emissions at 0.1° resolution for gas-phase species and aerosols including BC and OC. Year-specific monthly emissions for 2003–2019 were regridded to the MATCHA domain, so MATCHA represents the interannual emission evolution. Biomass burning emissions are from FINN v2.5 (Wiedinmyer et al., 2023). A detailed description of both inventories and an observation-constrained assessment of their BC biases are given in Roychoudhury et al. (2026).
Table 1Domain configuration and parameterizations used in the MATCHA model set-up.
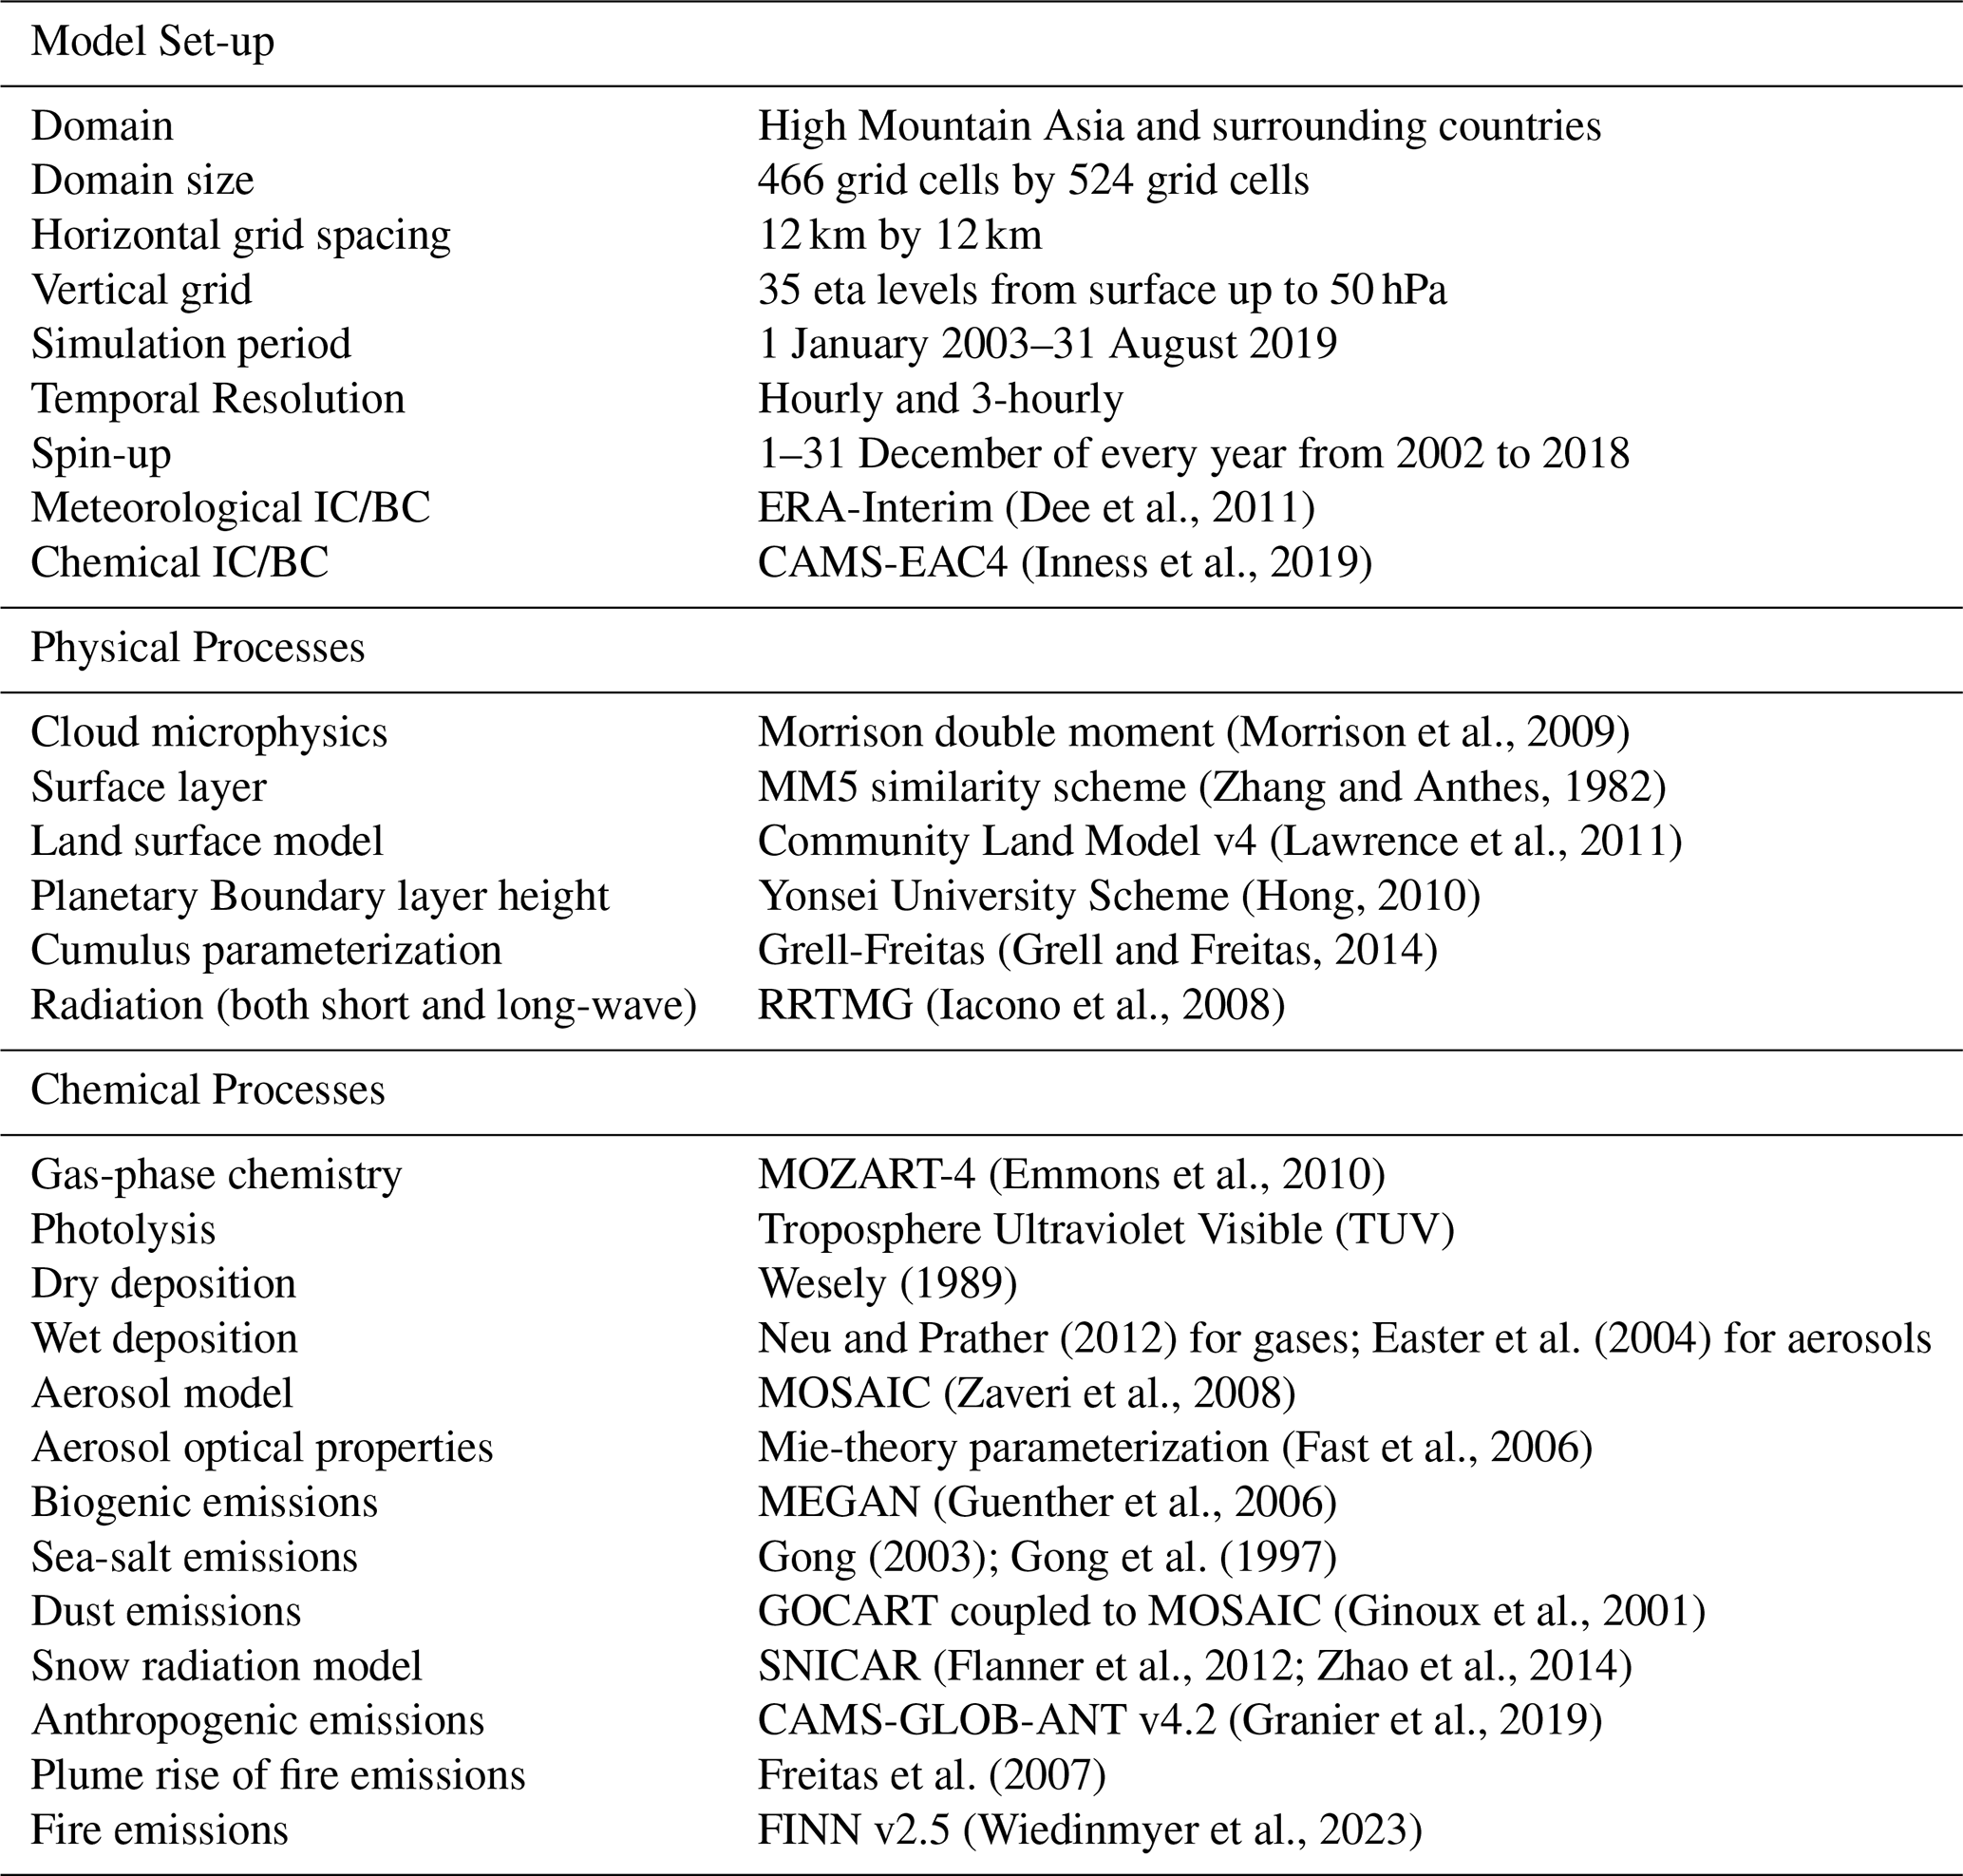
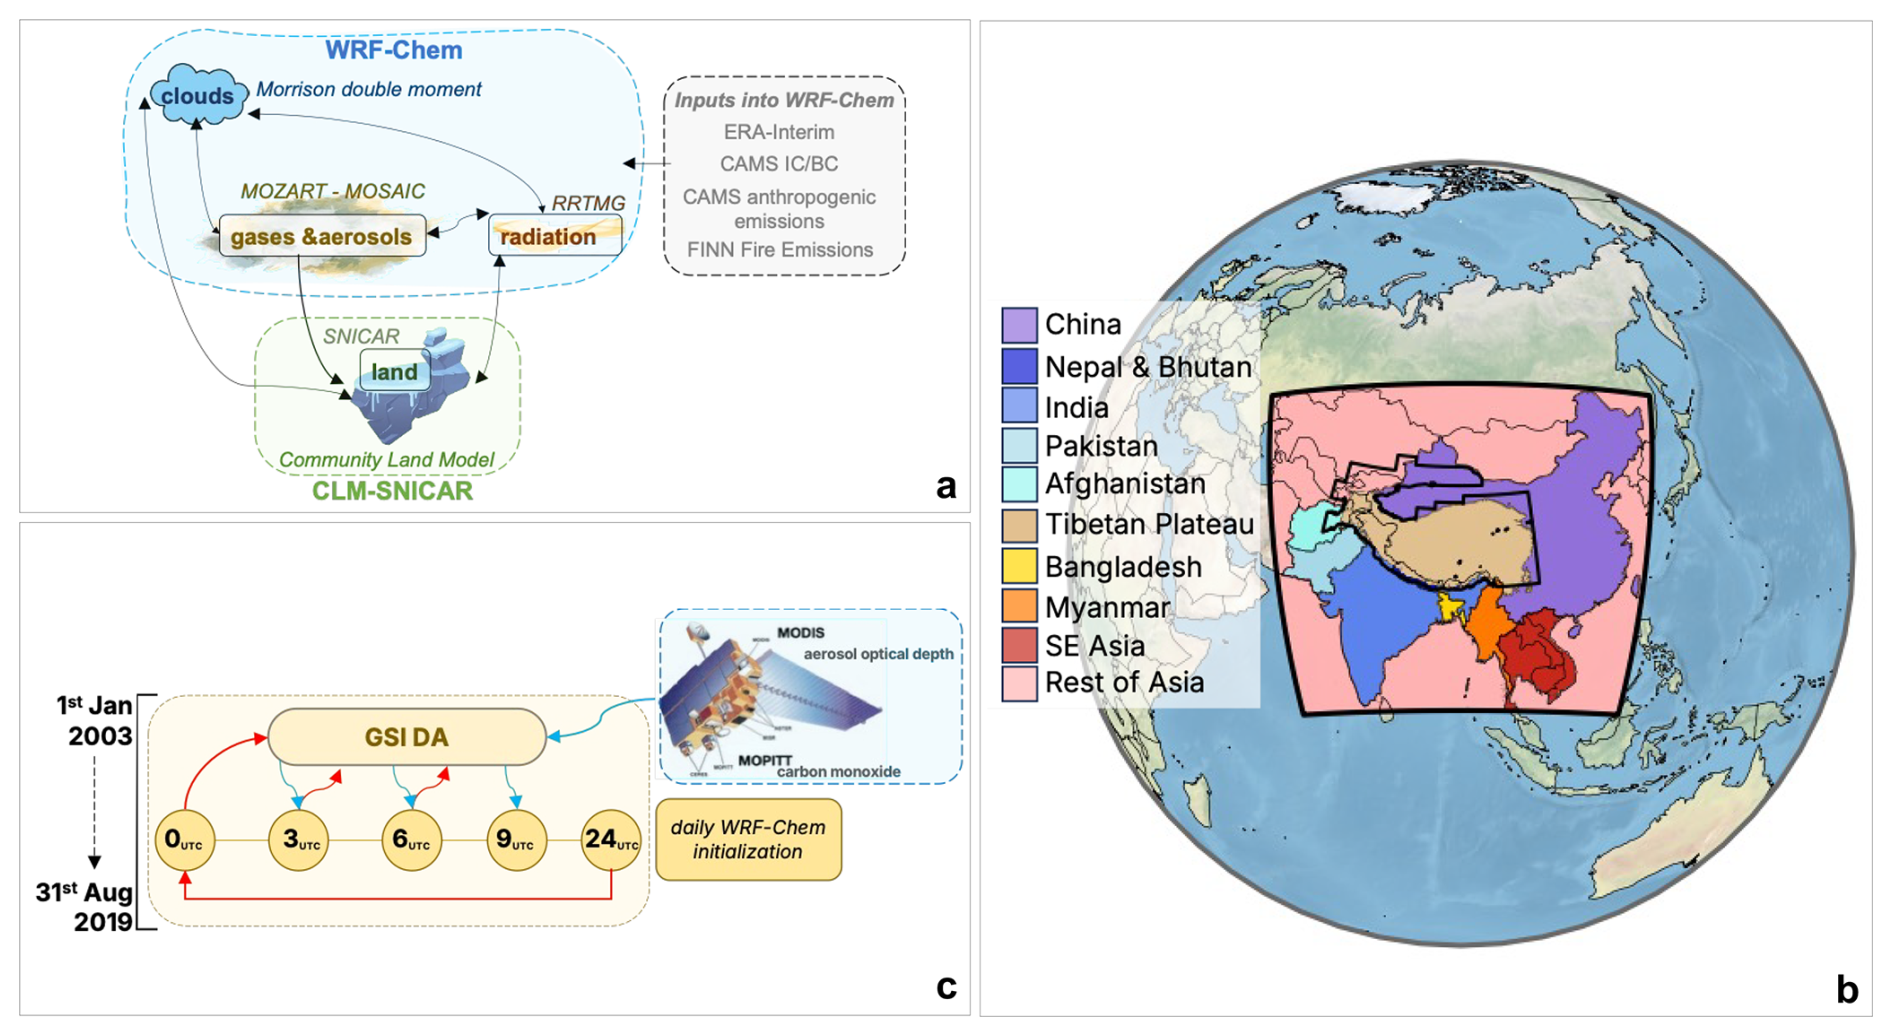
Figure 1The MATCHA framework. (a) Schematic representation of the model setup in MATCHA. Within WRF-Chem (blue box), gas-phase chemistry and aerosols (MOZART-MOSAIC) are coupled to radiation (RRTMG), clouds (Morrison double-moment microphysics), and the land surface (CLM with the SNICAR snow-radiation module; green box), with grey arrows denoting the exchange of fields between components. External forcings (grey dashed box) comprise emission inputs as well as meteorological and chemical initial and boundary conditions. (b) The 10 tagged source regions for anthropogenic BC over the entire study domain. (c) The assimilation workflow used in MATCHA, where MODIS AOD and MOPITT CO profiles were assimilated every 3 h into the WRF-Chem-CLM-SNICAR model for the 17 years of simulation period. The model advances through successive 3 h windows daily. Blue arrows show MODIS AOD and MOPITT CO retrievals together with the model background state, ingested into the GSI data assimilation system; red arrows show the analysis returned to WRF-Chem and the re-initialization carrying the model state at the end of the day into the next day's 00:00 UTC cycle.
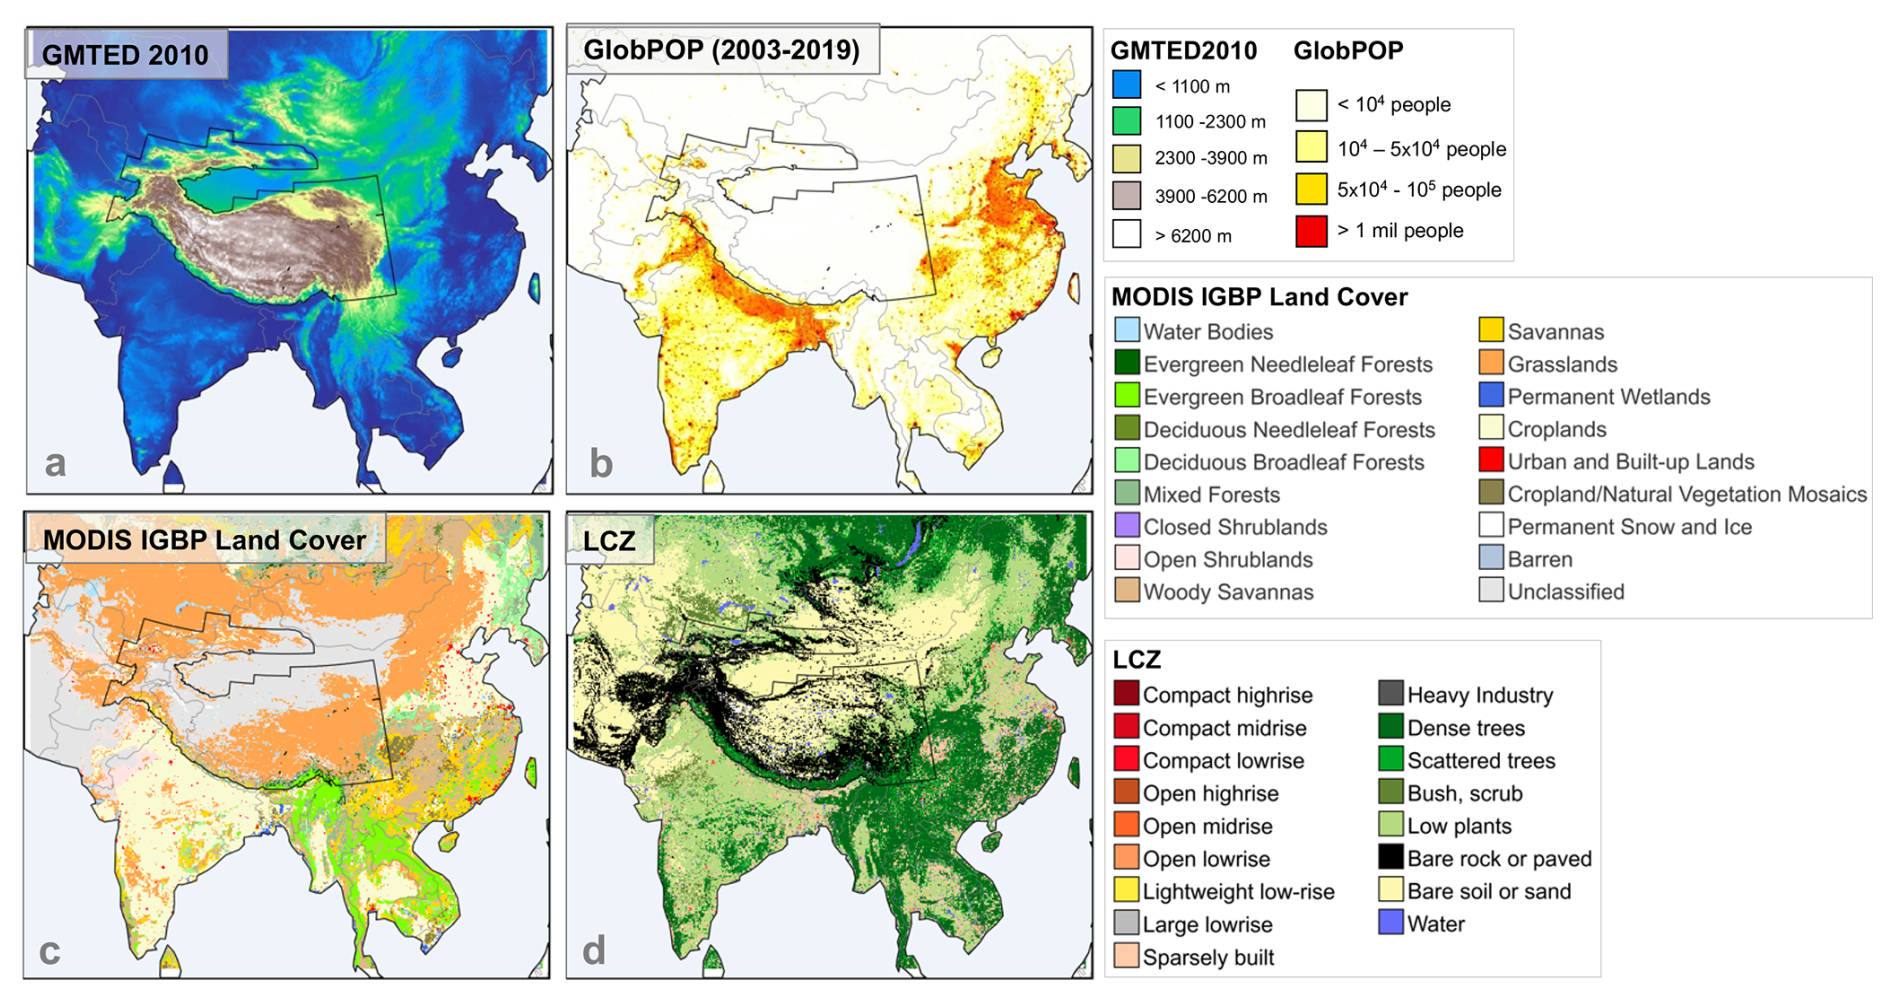
Figure 2General characteristics over the model domain in MATCHA, spanning across topography (elevation from GMTED 2010) in (a), population count from the GlobPOP dataset (b), land cover from MODIS IGBP averaged from 2003–2019 (c), and local climate zones (see Sect. 2) mapped over the domain (d).
Figure 2 highlights key environmental characteristics of the MATCHA domain, including elevation, population density, land cover, and local climate zones, to provide context for the region's physical and human landscape. The complex topography of the region can be seen through the sparsely populated high elevation regions of the Himalayas and the Tibetan Plateau (> 2.3 km) in Fig. 2a, in contrast with the low elevation regions of the Indo-Gangetic Plain and eastern China (< 1.5 km), which accommodates approximately 10 % of the world's population, including some of the most polluted cities globally (Mogno et al., 2021). The clustered population hotspots over the Indo-Gangetic Plain and eastern China can be seen in Fig. 2b, depicting the total population count in the model grid (12 km) averaged between 2003–2019 from the GlobPOP dataset (Liu et al., 2024). The land cover classification averaged (mode) across the domain from the MODIS International Geosphere Biosphere Programme (IGBP) global vegetation classification scheme in Fig. 2c shows extensive croplands in areas of high population, and natural forests (mixed forests and grasslands) in areas of high elevation. Finally, in Fig. 2d, the local climate zones, mapped by Demuzere et al., 2022, highlight the level of urbanization and rapid development across Asia with pockets of major metropolitan centers (in red) interspersed with natural vegetation (green) and low-density developments (light orange). Previous studies have shown how air quality and weather patterns in Asia are impacted by the complex interactions between the complex topography, population density, urbanization effects, and land use patterns (Ganzeveld et al., 2010; Stewart et al., 2013; Tian et al., 2021).
2.1.1 Tagged-Tracer Approach for Source Contribution of BC
A tracer approach implemented in WRF-Chem tracks BC particles and their deposition fluxes (both wet and dry) from 10 different emission source regions and different sources across Asia, following the method described in our previous study (Kumar et al., 2015a). The BC tracers are independent variables added to the model simulation that experience the same atmospheric processes as standard BC particles (emissions, transport, aging, and deposition) but do not interfere with the model simulation/processes (e.g., radiation, clouds, atmospheric chemistry) or other aerosol particles. The BC tracers account for all sources of BC in the model by tracking BC emitted from anthropogenic (BC-ANT) and biomass burning (BC-BB) sources within the domain, as well as BC inflow from the lateral domain boundaries resulting from all emission sources located outside the model domain (BC-BDY) to provide insights into the background levels of BC in HMA. In addition to these emission sources, ten regional tracers are added to track BC emitted from different Asian countries or source regions, as shown in Fig. 1a. The anthropogenic emissions of BC from outside of these 10 regions are tracked separately as a tracer and defined as “Rest of Asia”. The tracers for the source regions do not strictly follow administrative (country) boundaries, some of which are defined based on elevation. For instance, grid cells above 1500 m are defined as part of the Tibetan Plateau and Nepal tracers rather than India. The ability to quantify the BC abundance from these regions individually can thus help attribute the deposition of BC over snowpacks in HMA. This tagged-tracer approach has been applied to previous air quality studies for both CO and BC to assess sectoral, regional, and local contributions in Asia and Africa (Ghude et al., 2020; Kumar et al., 2013, 2015b, 2022).
2.1.2 Implementation of BrC aerosols in WC-CS
We implement a BrC lifecycle scheme in WRF-Chem that explicitly tracks both primary and secondary BrC species through key processes: direct emissions, secondary formation, direct interaction with radiation (absorption and scattering), interaction with clouds (as cloud condensation nuclei), wet and dry deposition, and interaction with snowpack post-deposition (reducing snow albedo). Specifically, the wavelength-dependent BrC refractive indices follow Wang et al. (2014) who derived a best-fitting line based on previous observations. The refractive indices are used to compute BrC optical properties (extinction and absorption cross-sections, single-scattering albedo, asymmetry factor) based on the Mie theory in WRF-Chem. We only consider the biofuel and biomass burning sources for primary BrC emissions, since previous studies found that fossil fuel combustion contributes very slightly to BrC emissions and is poorly characterized (Saleh et al., 2015). Primary BrC emissions are estimated by assuming that all light absorption from total organic aerosol (OA) at the time of emissions is from BrC. This is done by matching the total OA absorption at emissions, which is computed using the BC/OA emission ratio based on the observationally derived parameterization from Lu et al., 2015. The secondary BrC formation is assumed to be aromatic secondary organic aerosol (SOA) production following previous studies (Nakayama et al., 2010; Zhang et al., 2020). The BrC photobleaching process follows the parameterization by Wang et al. (2018). The BrC transported from global boundary conditions is set to 20 % of total OC boundary transport fluxes based on the mean global BrC/OC burden ratio (Jo et al., 2016). The BrC transport, interaction with radiation and clouds, and deposition processes follow the default WRF-Chem treatments of OC. The BrC evolution in snowpack after deposition and impact on snow albedo reduction are represented following Flanner et al. (2009).
2.1.3 Chemical data assimilation (DA) system and set-up
We use the three-dimensional variational scheme from the community GSI (Gridpoint Statistical Interpolation) system to assimilate satellite observations: MODIS AOD and MOPITT CO, into the WRF-Chem-CLM-SNICAR model background. This assimilation is performed every three hours to produce an optimal analysis state for chemical species. Previous studies have demonstrated the improvement in PM2.5 forecasts from MODIS AOD and CO simulations from MOPITT CO profiles (Kumar et al., 2019, 2025). The assimilation system consists of four major components:
- a.
Quality control of satellite observations to be assimilated. Level 2 retrievals of MODIS AOD Collection 6.1 and MOPITT CO version 8 are selected within the simulation period using quality assurance flags within the products, following previous studies (Kumar et al., 2025).
- b.
Background error covariance (BEC). The BEC represents the error in the model background. The National Meteorological Center (NMC) method of the community Generalized Background Error (GEN_BE) system is used for calculating winter and summer representative BEC (Parrish and Derber, 1992). The NMC method uses two different WRF-Chem forecasts valid at the same time to calculate the statistical parameters in BEC. It calculates every 3 h to be consistent with the assimilation cycles. Anthropogenic and biomass burning emission uncertainties are considered in the design of the BEC following a 100 % uncertainty assumption in both types of emission sources (Kumar et al., 2020).
- c.
Observation error covariance. The observation error covariance for AOD is specified following Remer et al. (2005). For CO retrievals, the uncertainty reported in the MOPITT products is used for the observation error covariance (NASA/LARC/SD/ASDC, 2000).
- d.
Observation operator. The observation/forward operator converts model-simulated chemical species into corresponding satellite-observed quantities (AOD and CO here). The default forward operator in GSI is modified for transforming the MOSAIC simulated aerosols in WRF-Chem into AOD based on the parameterization from Malm and Hand (2007) as follows,
where represents the vertical layers in the WC-CS model, represents the extinction coefficient for layer i, values in the square brackets represent the mass concentrations of different aerosol compounds, f(RH) and f(RH)SS represents the relative humidity (RH) correction factor that accounts for hydroscopic growth of sulfate-nitrate-ammonium and sea salt aerosol components respectively. f(RH) and f(RH)SS are determined from look-up tables. Extinction due to other aerosol components is assumed to be invariant with RH. The forward operator for assimilating MOPITT CO follows that of (Kumar et al., 2025). This forward operator convolves WRF-Chem CO profiles using a priori profiles and averaging kernels from MOPITT before calculating the innovation in CO.
The analysis and background states consist of different LAP and CO concentrations simulated in MATCHA. Daily assimilation of MODIS AOD and 8ITT CO is performed as shown in Fig. 1c. For MODIS AOD, exploration of the satellite products from both Terra and Aqua showed that the swaths cover the HMA domain between 01:30 to 09:30 UTC. The assimilation is performed in a series of three-hour windows until 09:00 UTC daily. The assimilation configuration used here is adopted from previously validated implementations (Kumar et al., 2019, 2020, 2025). Quantifying the contributions of AOD and CO assimilation to the skill reported in Sect. 3 (Results) would require dedicated observing-system experiments which are beyond the scope of this dataset description and evaluation study.
2.1.4 CLM-SNICAR to simulate LAP-snow-radiation interactions
Deposition fluxes (wet and dry) of LAP, calculated in WRF-Chem (see Table 1), are supplied online to the CLM version 4.0 land scheme (integrated within WRF-Chem) coupled with the SNICAR snow albedo model. This coupling allows for the simulation of LAP' evolution and their impact within the snowpack. In particular, CLM-SNICAR is used to compute the albedo and radiative flux of the vertically resolved multi-layer (up to five layers) snowpack containing LAP (Flanner et al., 2007, 2009). BC and BrC particles in snow are represented as both externally and internally mixed with snow grains based on deposition mechanisms following Zhao et al., 2014 while dust in four size bins is only treated as externally mixed with snow. Snow aging processes and meltwater transport are accounted for within CLM-SNICAR, which scavenges LAP from the top layers to the bottom layers and redistributes LAP through the snow layers (Flanner et al., 2007). The LAP-induced snowpack water and energy changes are used to simulate corresponding changes in other land surface conditions (e.g., soil moisture and runoff) and associated feedback in the atmosphere. The CLM-SNICAR scheme coupled with WRF-Chem has been successfully used to reproduce snow albedo and LAP in snow over other global mid-latitude mountain regions (e.g., Huang et al., 2022). The impact of LAP deposition on the snowpack and the resulting hydrological response (timing of snow cover disappearance, runoff, evapotranspiration, and streamflow) over major river basins in HMA is assessed in a companion study using this MATCHA dataset (Mizukami et al., 2025).
2.2 Observations
This section provides a brief overview of the observational datasets used to evaluate the MATCHA reanalysis. We draw on available chemical, meteorological, and hydrological measurements from global networks and satellite missions, with a focus on key variables that influence aerosol–meteorology interactions and snow processes. We evaluate across 12 key variables that represent meteorology (temperature, relative humidity, and wind speeds; both surface and profiles), land-atmosphere interactions and hydrology (daily precipitation, boundary layer height, and snow cover), and atmospheric composition (aerosol optical depth, single scattering albedo, and surface measurements of particulate matter and CO).
2.2.1 OpenAQ
OpenAQ is an open-source platform that compiles air quality data from multiple sources (public sources, environmental agencies, and international organizations) across the globe (Hasenkopf et al., 2016; Velasco et al., 2024), and can be accessed at https://openaq.org/ (last access: 20 July 2026). We obtained fine particulate matter (PM2.5), coarse particulate matter (PM10), and CO measurements during 2003–2019 across Asia within the model domain to compare with surface layer simulations from MATCHA. The OpenAQ measurements across all species were all post-2015 at an hourly resolution. In total, we had obtained approximately 10 million hourly measurements across 1705 (for PM2.5), 1588 (for PM10), and 1705 (for CO) sites. Considering that OpenAQ data do not have any quality assurance standard within the retrieved and compiled data, we used a modified version of the probabilistic outlier detection system from Wu et al. (2018) to detect three types of outliers from the retrieved OpenAQ data for surface PM2.5, PM10, and CO. The outliers were based on large variances and periodic discrepancies for each site and each of these species, as well as spatio-temporal outliers based on neighboring sites. Detecting spatio-temporal outliers requires a characteristic localization length that defines the radius within which neighboring stations influence a given site. An exploratory analysis of how inter-site correlations decay with distance indicated two such suitable lengths: 342 km for the dense networks across China and 117 km for stations elsewhere in the domain. We show the percentage of outliers removed across four seasons for each of the three species (PM2.5, PM10, and CO) in Fig. A1. The number of outliers removed for PM2.5 is highest, particularly in summer (2 %, ∼ 19 600 observations removed), while CO-related outliers were removed the least (less than 0.05 %). Overall, the outlier detection system shows the strongest impact in summer for PM2.5, suggesting greater variability in the observations across the 1705 sites over the domain.
2.2.2 Aerosol Robotic Network (AERONET)
The AERONET network provides radiometer measurements of aerosol optical properties like AOD and single scattering albedo (SSA) at different wavelengths across ground-based sites globally (Sinyuk et al., 2020; Holben et al., 1998). The AOD measurements have an estimated uncertainty of 0.01 at visible wavelengths and 0.02 at near-ultraviolet wavelengths (Dubovik et al., 2000). The uncertainty due to instrumental calibration for SSA is within 0.03 for AOD at 440 nm greater than 0.4 (Dubovik et al., 2000; Giles et al., 2019). We used AERONET Level 2 (cloud-screened and quality-controlled) data version 3 for AOD at 550 nm across 185 sites that lie within the MATCHA domain, and the inversion products were used to calculate SSA at 550 nm across 153 sites. AERONET AOD is available at 340, 380, 440, 500, 675, 870, and 1020 nm, sparingly across all sites. For this study, AOD at 550 nm (denoted as AOD550 hereafter) is estimated by using AOD values at nearby available wavelengths (500–675 nm or 440–675 nm) to calculate the Angström exponent using the higher and lower wavelengths, which was further used to estimate AOD at 550 nm.
SSA at 550 nm (denoted as SSA550 hereafter), on the other hand, is calculated using the following relation,
where AOD and AAOD (absorption AOD) at 550 nm are calculated using the following relation,
where τ is the AOD/AAOD at the corresponding wavelength, and α is the Angström exponent for 440 to 870 nm, available in the Level 2 inversion products. We note that AERONET datasets have been widely used in evaluating model aerosol simulations, reanalyses, and satellite retrievals globally (Bright and Gueymard, 2019; Gueymard and Yang, 2020; Xian et al., 2024).
2.2.3 Integrated Multi-satellitE Retrievals for GPM (IMERG)
The Integrated Multi-satellitE Retrievals for GPM (IMERG) from NASA is a global surface precipitation product at 0.1° resolution generated from the Global Precipitation Measurement (GPM) satellite constellation as a NASA-JAXA collaborative effort (Huffman et al., 2014). In this study, we use the daily accumulated precipitation from the final run version of IMERG (IMERG-F), which calibrates the satellite measurements through monthly rain gauge analysis from the Global Precipitation Climatology Centre (GPCP). We considered the calibrated daily accumulated precipitation files from 2003 through 2019 and performed a first-order conservative interpolation to the MATCHA grid for comparison. Among available satellite products, the IMERG Final Run is one of the most accurate for daily and monthly precipitation over HMA and much of Asia, although, like other precipitation datasets, it exhibits systematic biases over complex terrain and during extreme rainfall events (Dollan et al., 2024; Lee et al., 2019; Yu et al., 2021).
2.2.4 Integrated Global Radiosonde Archive (IGRA)
The Integrated Global Radiosonde Archive (IGRA) version 2 from NCEI-NOAA (National Oceanic and Atmospheric Administration's National Centers for Environmental Information) hosts radiosonde and weather balloon observations across the globe from multiple sources with observations of temperature and relative humidity profiles at 00:00 and 12:00 UTC (Durre et al., 2018). While the records are quality controlled for climatological and temperature-related outliers (in addition to other issues), there exist some known limitations, particularly unreliable humidity measurements above 250 hPa, inhomogeneities in temperature and wind profiles due to changes in instruments, station locations, and lack of uncertainty estimates in the records (Durre et al., 2006, 2018; Madonna et al., 2022). The observations are standardized at the following pressure levels: 1000, 925, 850, 700, 500, 400, 300, 250, 200, 150, 100, 70, 50, 30, 20, and 10 hPa. We obtained radiosonde profiles of temperature, relative humidity, and wind speed from 129 sites over the MATCHA domain and only considered layers up to 100 hPa for comparison, considering the model top pressure of 50 hPa in the MATCHA model configuration (see Table 1). In addition, we obtained planetary boundary layer (PBLH) height values derived within IGRA v2 (based on the parcel method in Seidel et al., 2010) at 00:00 and 12:00 UTC for 125 sites within the model domain and simulation period, for comparison with MATCHA. It is important to note here that the actual launch time of the radiosondes and their derived PBLH may differ from the standard reporting times (00:00/12:00 UTC); therefore, we used the nearest time from the hourly simulations of MATCHA to obtain the spatiotemporally collocated model PBLH. Most observations were launched before the standard reporting time, with a median lead time of approximately 30 min with a similar variability. Although the derived PBLH values are reported to have an uncertainty of a few 100 m (Seidel et al., 2010), sparse sampling in the vertical within IGRA can result in large uncertainties in deriving the PBLH, compared to high-resolution soundings (Guo et al., 2021; Liu and Liang, 2010). The parcel method used to derive PBLH within the IGRA archive has also been shown to yield systematically lower values than other methods, with greater diurnal and seasonal variability (Seidel et al., 2010). Uncertainties in humidity sensors onboard radiosondes also contribute to the overall uncertainty in PBLH estimates. Additionally, radiosonde observations from IGRA do not include near-surface wind measurements, which can introduce discrepancies in the derived PBLH reported within IGRA (Madonna et al., 2021). Considering the absence of quality assurance of these derived PBLH within the archive, we implemented a three-step outlier detection process for our evaluation of PBLH as follows,
-
We applied a rolling window-based method to both observed and modeled PBLH time series for each site, using a window of seven consecutive data points, corresponding to a week of measurements at 00:00 and 12:00 UTC, analyzed separately. We then calculated the local median and median absolute deviation (MAD) across this window (Leys et al., 2013) and scaled the MAD by multiplying it by 1.4826 to make it comparable to the standard deviation for Gaussian data. Modeled and observed PBLH values were then considered outliers if their absolute deviation from the median exceeded twice the scaled MAD. A multiplier of 2 was chosen to make the outlier detection conservative based on empirical testing of different values.
-
After identifying the outliers in both the modeled and observed PBLH, we computed their differences and applied the same window-based method with a multiplier of 2 to identify periods of exceptionally high disagreements between the observations and the model. These discrepancies may be attributed to measurement errors, model biases associated with strong daytime convective mixing, very stable nocturnal boundary layers, complex topography, and spatio-temporal representativeness issues.
-
We finally applied a simple MAD-based filter (using a multiplier of 2 again) across the full set of observed and modeled PBLH values. This step helps identify additional extreme values that may not have been flagged by the rolling window approach.
This method allows robust filtering across datasets of spurious values that might arise from both observational and model uncertainties. The window-based approach allows us to filter out periodic outliers, while the last step allows us to filter out highly variable values from the entire dataset. Figure A2 shows histograms of both observed and modeled PBLH at 00:00 and 12:00 UTC across seasons, comparing the distributions with and without outlier removal. In the top row (the original dataset with outliers), there are pronounced tails extending to higher PBLH values, particularly during summer at 12:00 UTC, suggesting that a small fraction of extreme values dominate the upper range of PBLH values. In the bottom row (after outlier removal), these tails are substantially reduced, resulting in more plausible distributions of PBLH.
2.2.5 NOAA's Integrated Surface Database (ISD)
The Integrated Surface Database (ISD) from NOAA consists of sub-daily measurements of several meteorological parameters pertaining to surface climate across tens of thousands of ground-based stations globally (Smith et al., 2011). We obtained six-hourly surface measurements of temperature at 2 m, dewpoint at 2 m, and wind speed at 10 m, after applying quality flags (Lott, 2004) from 1114 sites within the model domain and simulation period, and compared them with MATCHA. We calculated relative humidity at 2 m from temperature and dewpoint at 2 m from the ISD values based on Hyland and Wexler (1983) and compared them with relative humidity at 2 m in MATCHA (which was estimated based on Hyland and Wexler, 1983), using temperature, specific humidity at 2 m, and surface pressure from MATCHA). The ISD database has been used in a couple of previous studies as a validation dataset for meteorology over Asia (Faber et al., 2024; Kumar et al., 2015b; Xi, 2021; Yin et al., 2022).
2.2.6 BC Observations
Daily surface BC measurements between 2015–2019 were obtained from the Atmospheric Pollution and Cryospheric Changes (APCC) program, a monitoring network established over the Third Pole (Tibetan Plateau) and its surroundings to study the impact of atmospheric pollutants on the cryospheric changes over the region (Kang et al., 2022). We obtained daily BC measurements from 19 sites in the APCC program across the Tibetan Plateau and the Himalayas and compared them with surface BC abundance from MATCHA. In addition, monthly atmospheric surface BC measurements from 13 sites (across India and the Tibetan Plateau) for the year 2006 and seasonal averages of surface BC for 24 sites over India were obtained from He et al. (2014) and Kumar et al. (2015b).
2.2.7 MODIS Snow Cover Fraction
Given that MATCHA incorporates CLM coupled with SNICAR, we specifically evaluated snow cover fraction (SCF in %) between MATCHA and satellite-based MODIS retrievals. We use daily SCF at a spatial resolution of 0.05° based on the Normalized Difference Snow Index (NDSI) (Hall and Riggs, 2007). Specifically, we use the MODIS (Terra and Aqua) Daily Level 3 (L3) Global 0.05 Deg Climate Modeling Grid Version 6 product with pixels having only recommended quality flags of 0 (best). We resampled the MODIS pixels to MATCHA's 12 km resolution by aggregating and averaging the finer pixels. For our comparison, our results are particularly focused on the aggregated first-order glacier regions over HMA based on the Randolph Glacier Inventory (RGI v6) (Pfeffer et al., 2014). These products have been used in previous studies over the domain, where they have reported promising results and high accuracy over HMA (Immerzeel et al., 2009; Li et al., 2018; Pu et al., 2007).
2.3 Evaluation metrics
We use four metrics: mean bias difference (MB), root mean square error (RMSE), Spearman's rank correlation (R), and a non-parametric version of the Kling-Gupta efficiency (KGE) statistic (Gupta et al., 2009; Pool et al., 2018) to evaluate the performance of MATCHA. MB represents the deviation of model (MATCHA) values from observations in both magnitude and sign, ranging from −∞ to ∞ with a perfect value of 0. RMSE represents the positive deviation of the model from observations, ranging from −∞ to ∞, with a perfect value of 0. R represents the degree of monotonic relationship between models and observations and is less sensitive to outliers compared to the commonly used Pearson's correlation (Wilcox, 2016). KGE quantifies the overall accuracy of the model by integrating correlation, bias, and variability. It ranges from −∞ to 1, with a perfect value of 1. Here we use the non-parametric version of the original KGE metric based on Pool et al. (2018). The definitions of these metrics are as follows,
where M and O are the model and observed values respectively, i refers to the seasonal average per site or grid cell, r refers to the ranks of the model and observed values, σ refers to the standard deviation of the ranks, cov refers to the covariance of the ranks r, β refers to the bias ratio, and α refers to the variability ratio. βand α are defined as follows,
where and are the model and observed values, sorted and normalized by the product of their mean and sample size, as follows,
where xi is the ith largest value of the model or observed set of values, μx is the model or observed mean, and N is the number of values. The non-parametric variant of KGE uses the Spearman correlation (R), instead of Pearson's correlation in the original KGE, and the variability ratio in the non-parametric version is based on quantifying the similarity in the empirical distributions of the model and observed values, rather than the ratio of their means as in the original KGE.
These metrics are based on the seasonal averages at each site or grid cell (depending on the scale of the observations used) per variable and report them per season in Tables 2, 3, and 4. For our evaluation, we show a spatial representation of the seasonal average of the variable from the observation source and MATCHA, as well as their model bias. We define four seasons as follows: DJF (winter), MAM (spring), JJA (summer), and SON (fall).
In this section, we present and discuss the evaluation of MATCHA across three key groupings: (1) meteorology, (2) land-atmosphere interactions and hydrology, and (3) atmospheric composition, each reflecting core aspects of the model's coupled atmospheric and surface processes.
3.1 Meteorology
3.1.1 Temperature
Surface temperature at 2 m from both observations and MATCHA (Fig. 3) highlights the zonal temperature gradient and captures spatial variations very well when compared to surface observations from ISD. The largest biases, exceeding 2 °C, occur during winter over Asia, particularly in mainland India and southern China. Over the Indo-Gangetic Plain, MATCHA exhibits a consistent cold bias greater than 1 °C across all seasons, whereas eastern China shows a pronounced cold bias (< 2 °C) in winter, absent in other seasons. Overall, MATCHA tends to exhibit a cold bias across most seasons, except during summer, where a slight warm bias is noted (MB of 0.07 °C; Table 2). The highest cold bias appears in winter (MB of −0.38 °C). RMSEs are lowest in fall (2.5 °C) and peak in winter (4 °C). Correlations across the domain are very strong (R > 0.95) in all seasons except for the slight decline in summer (R of 0.85), indicating that MATCHA captures surface temperature patterns effectively across all seasons. KGE values are highest during transition seasons (0.95), suggesting best model performance, which worsens a bit during winter (KGE of 0.82). The IMDAA (Indian Monsoon Data Assimilation and Analysis) regional reanalysis over the Indian subcontinent, with a resolution comparable to MATCHA, has also shown near-surface temperature biases exceeding 2 °C over India, which is consistent with the findings of our study (Ashrit et al., 2020).
Table 2Evaluation metrics for all variables related to meteorology from MATCHA evaluated in this study across four seasons.
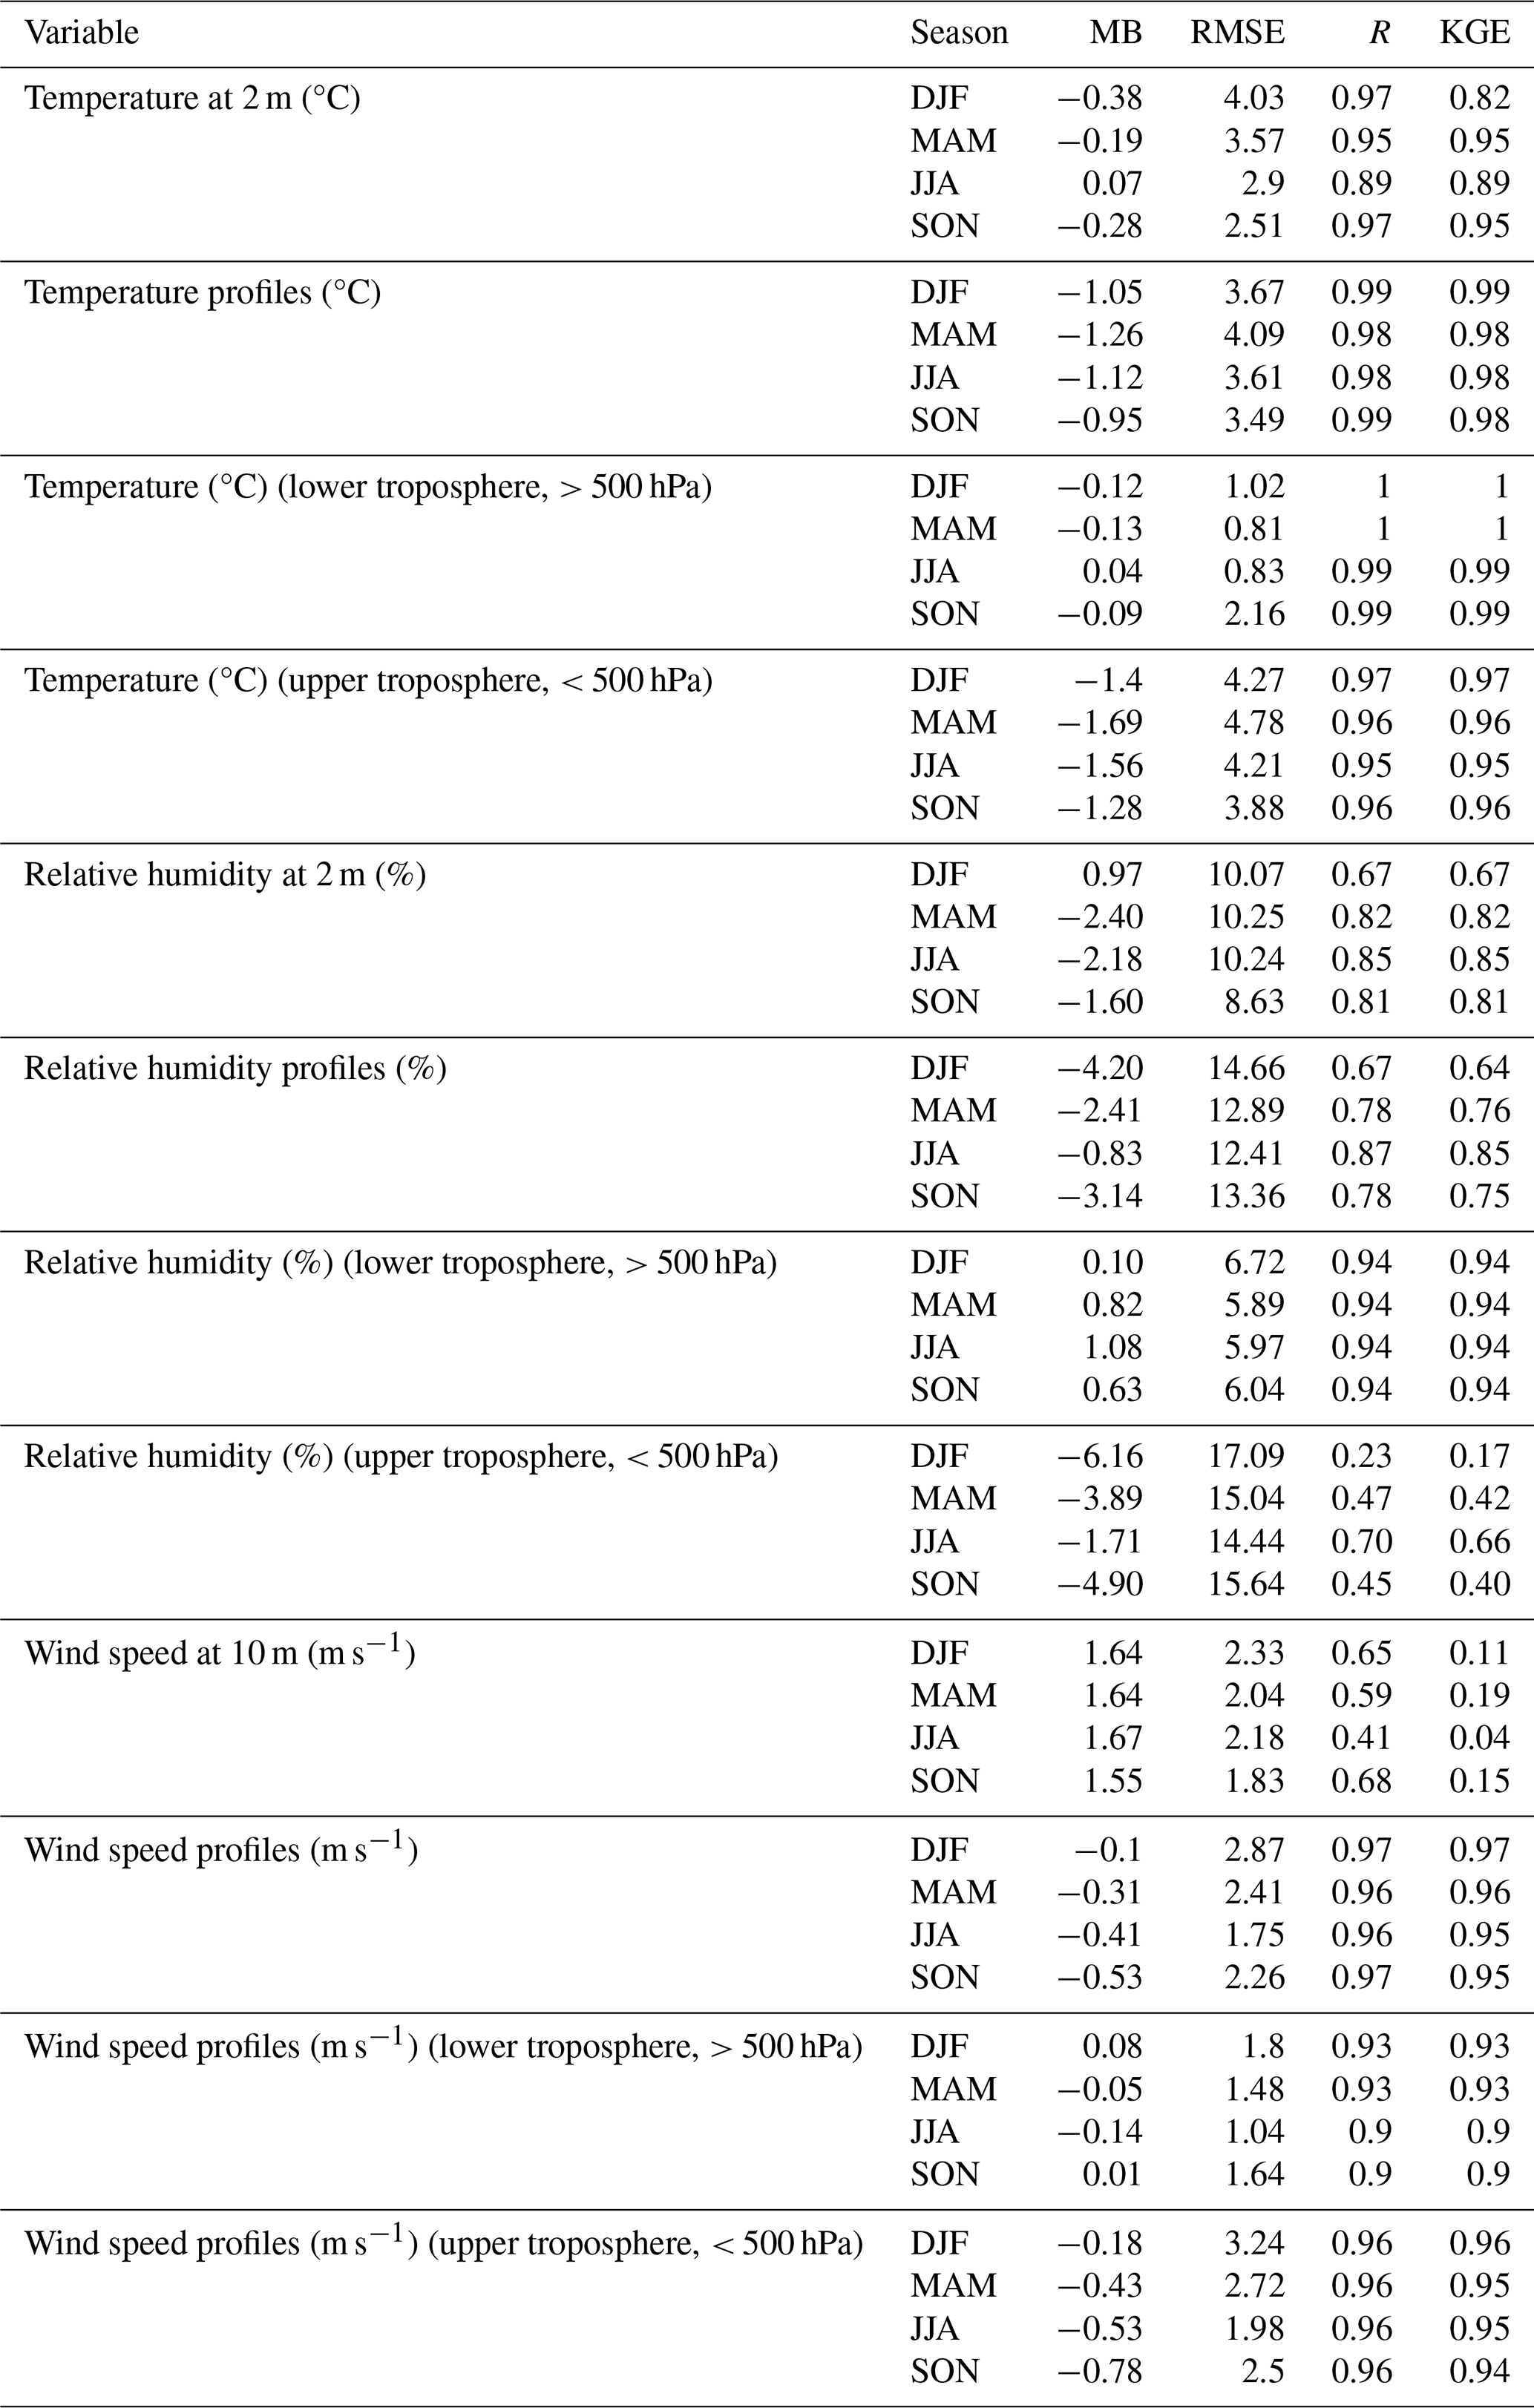
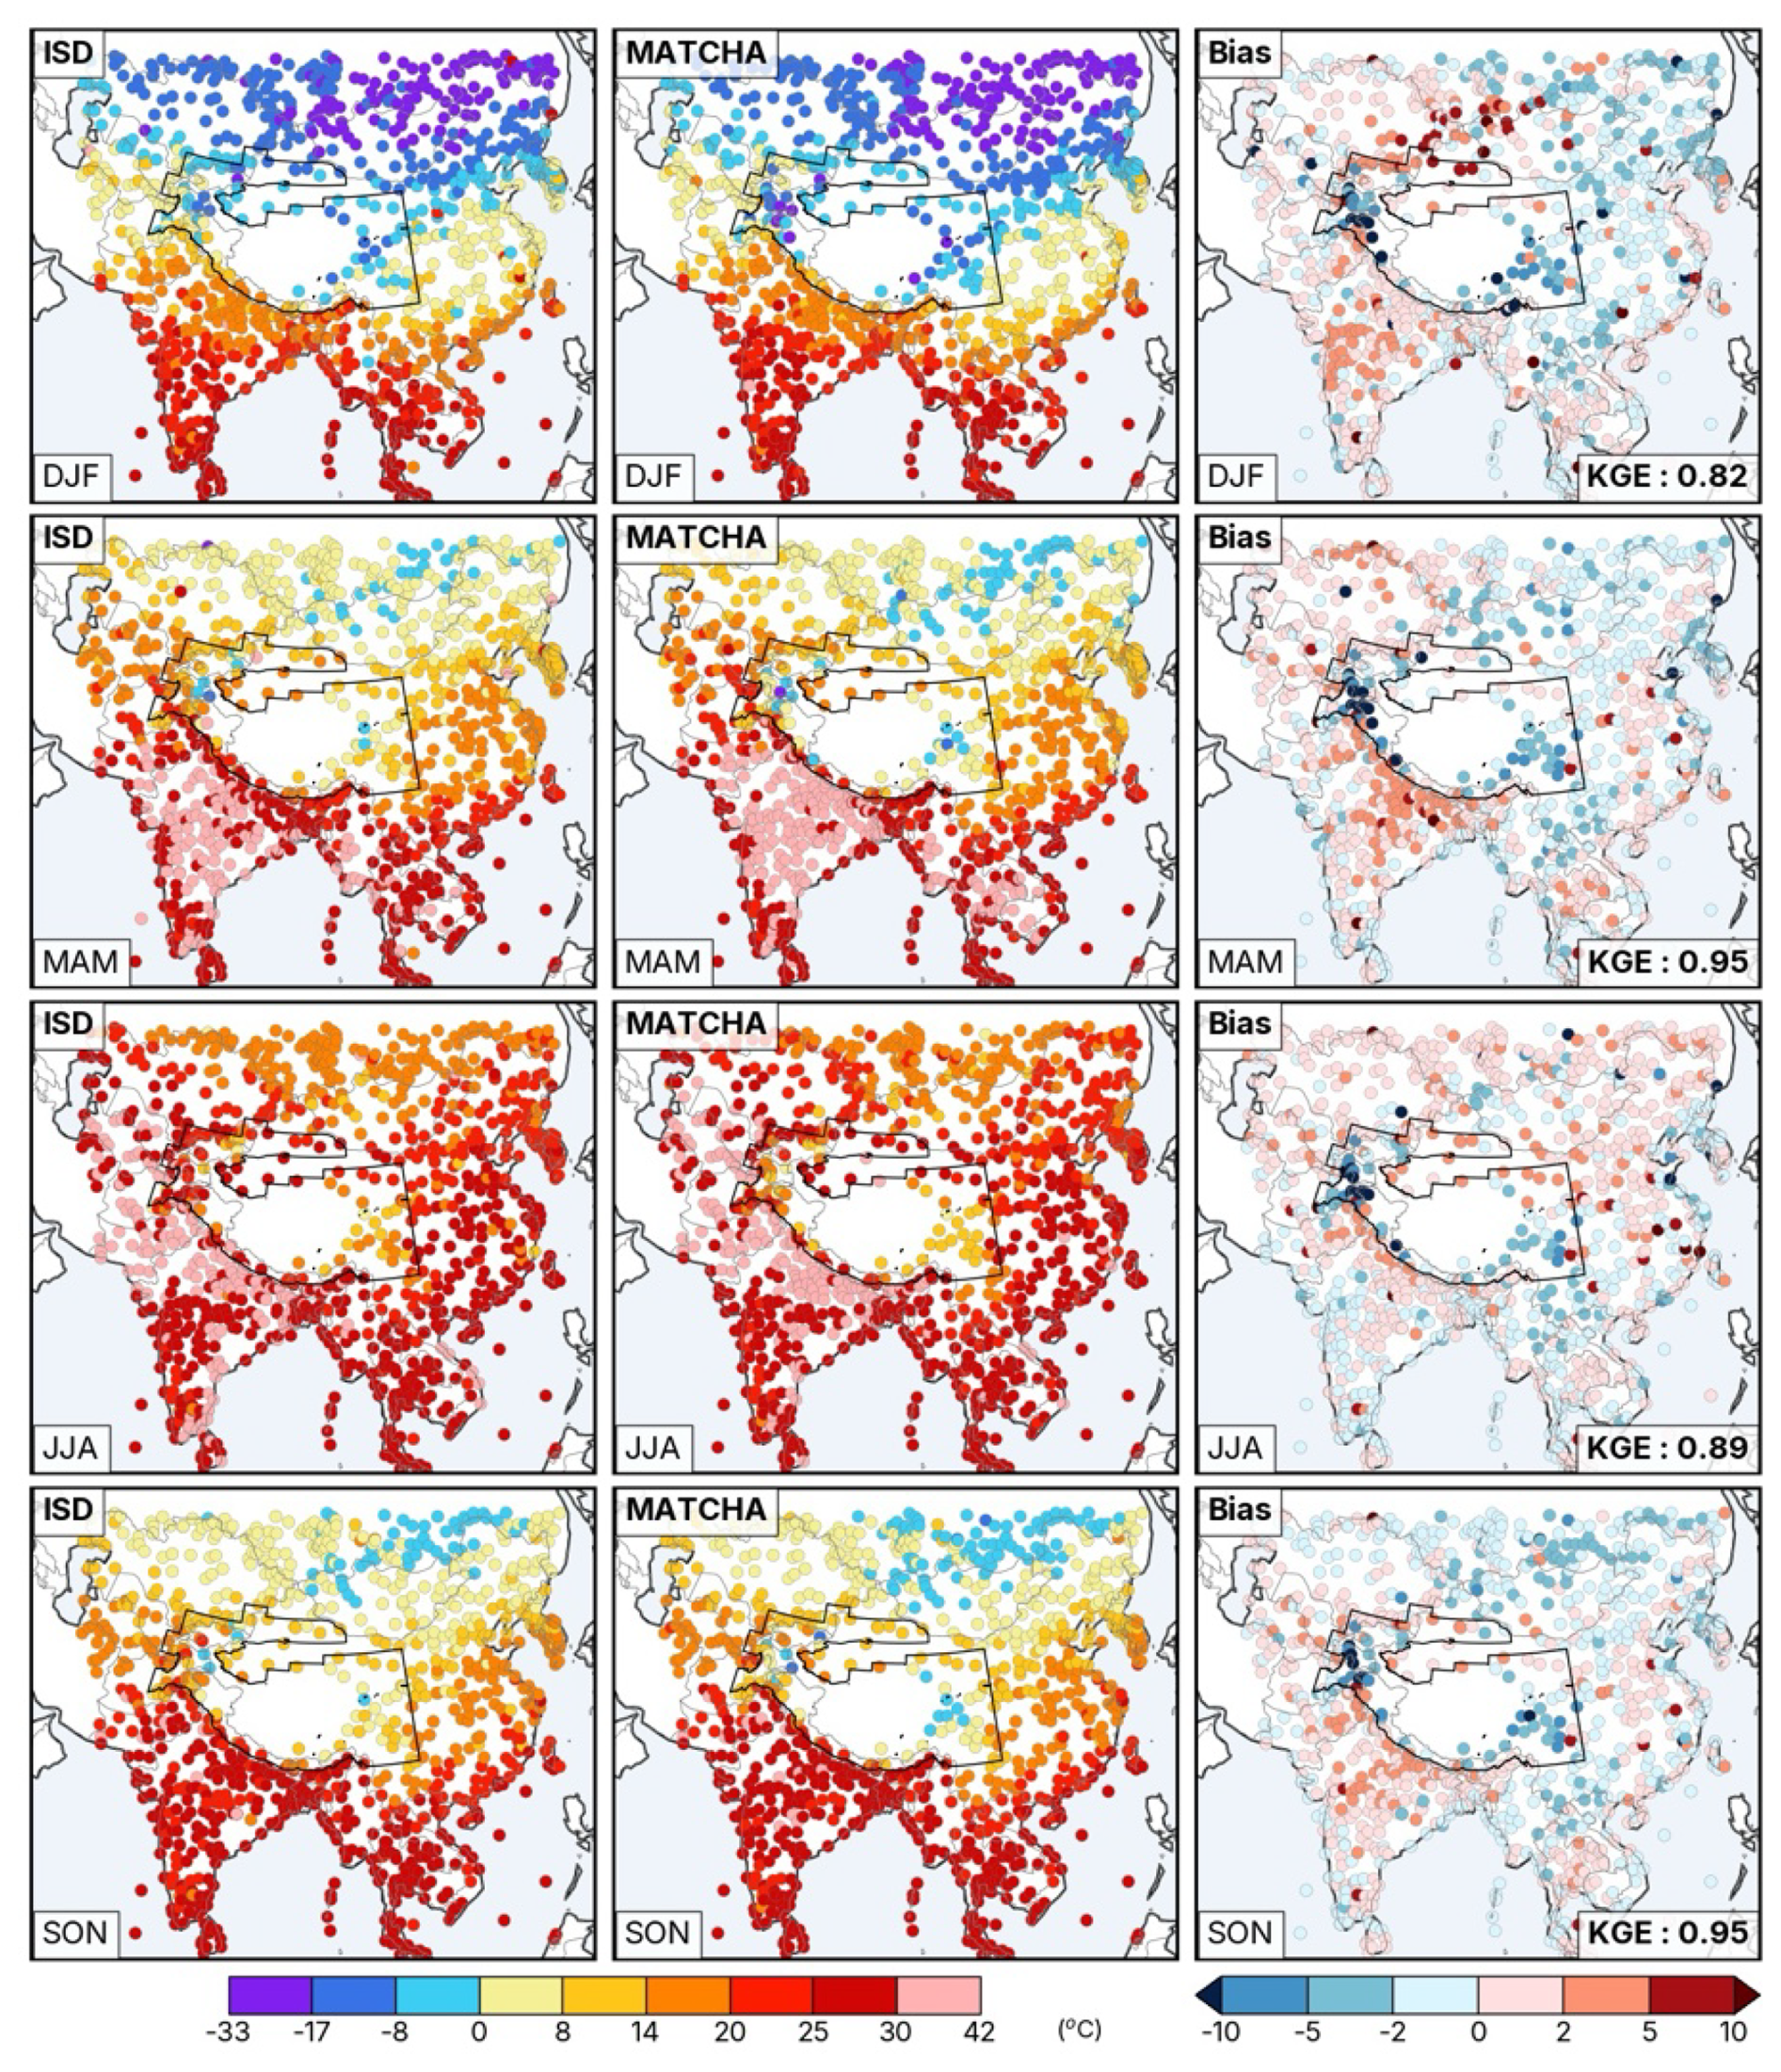
Figure 3Seasonal averages of temperature at 2 m (in °C) from the ISD archive (left column), MATCHA (middle column), and the associated model bias (MATCHA – ISD, right column).
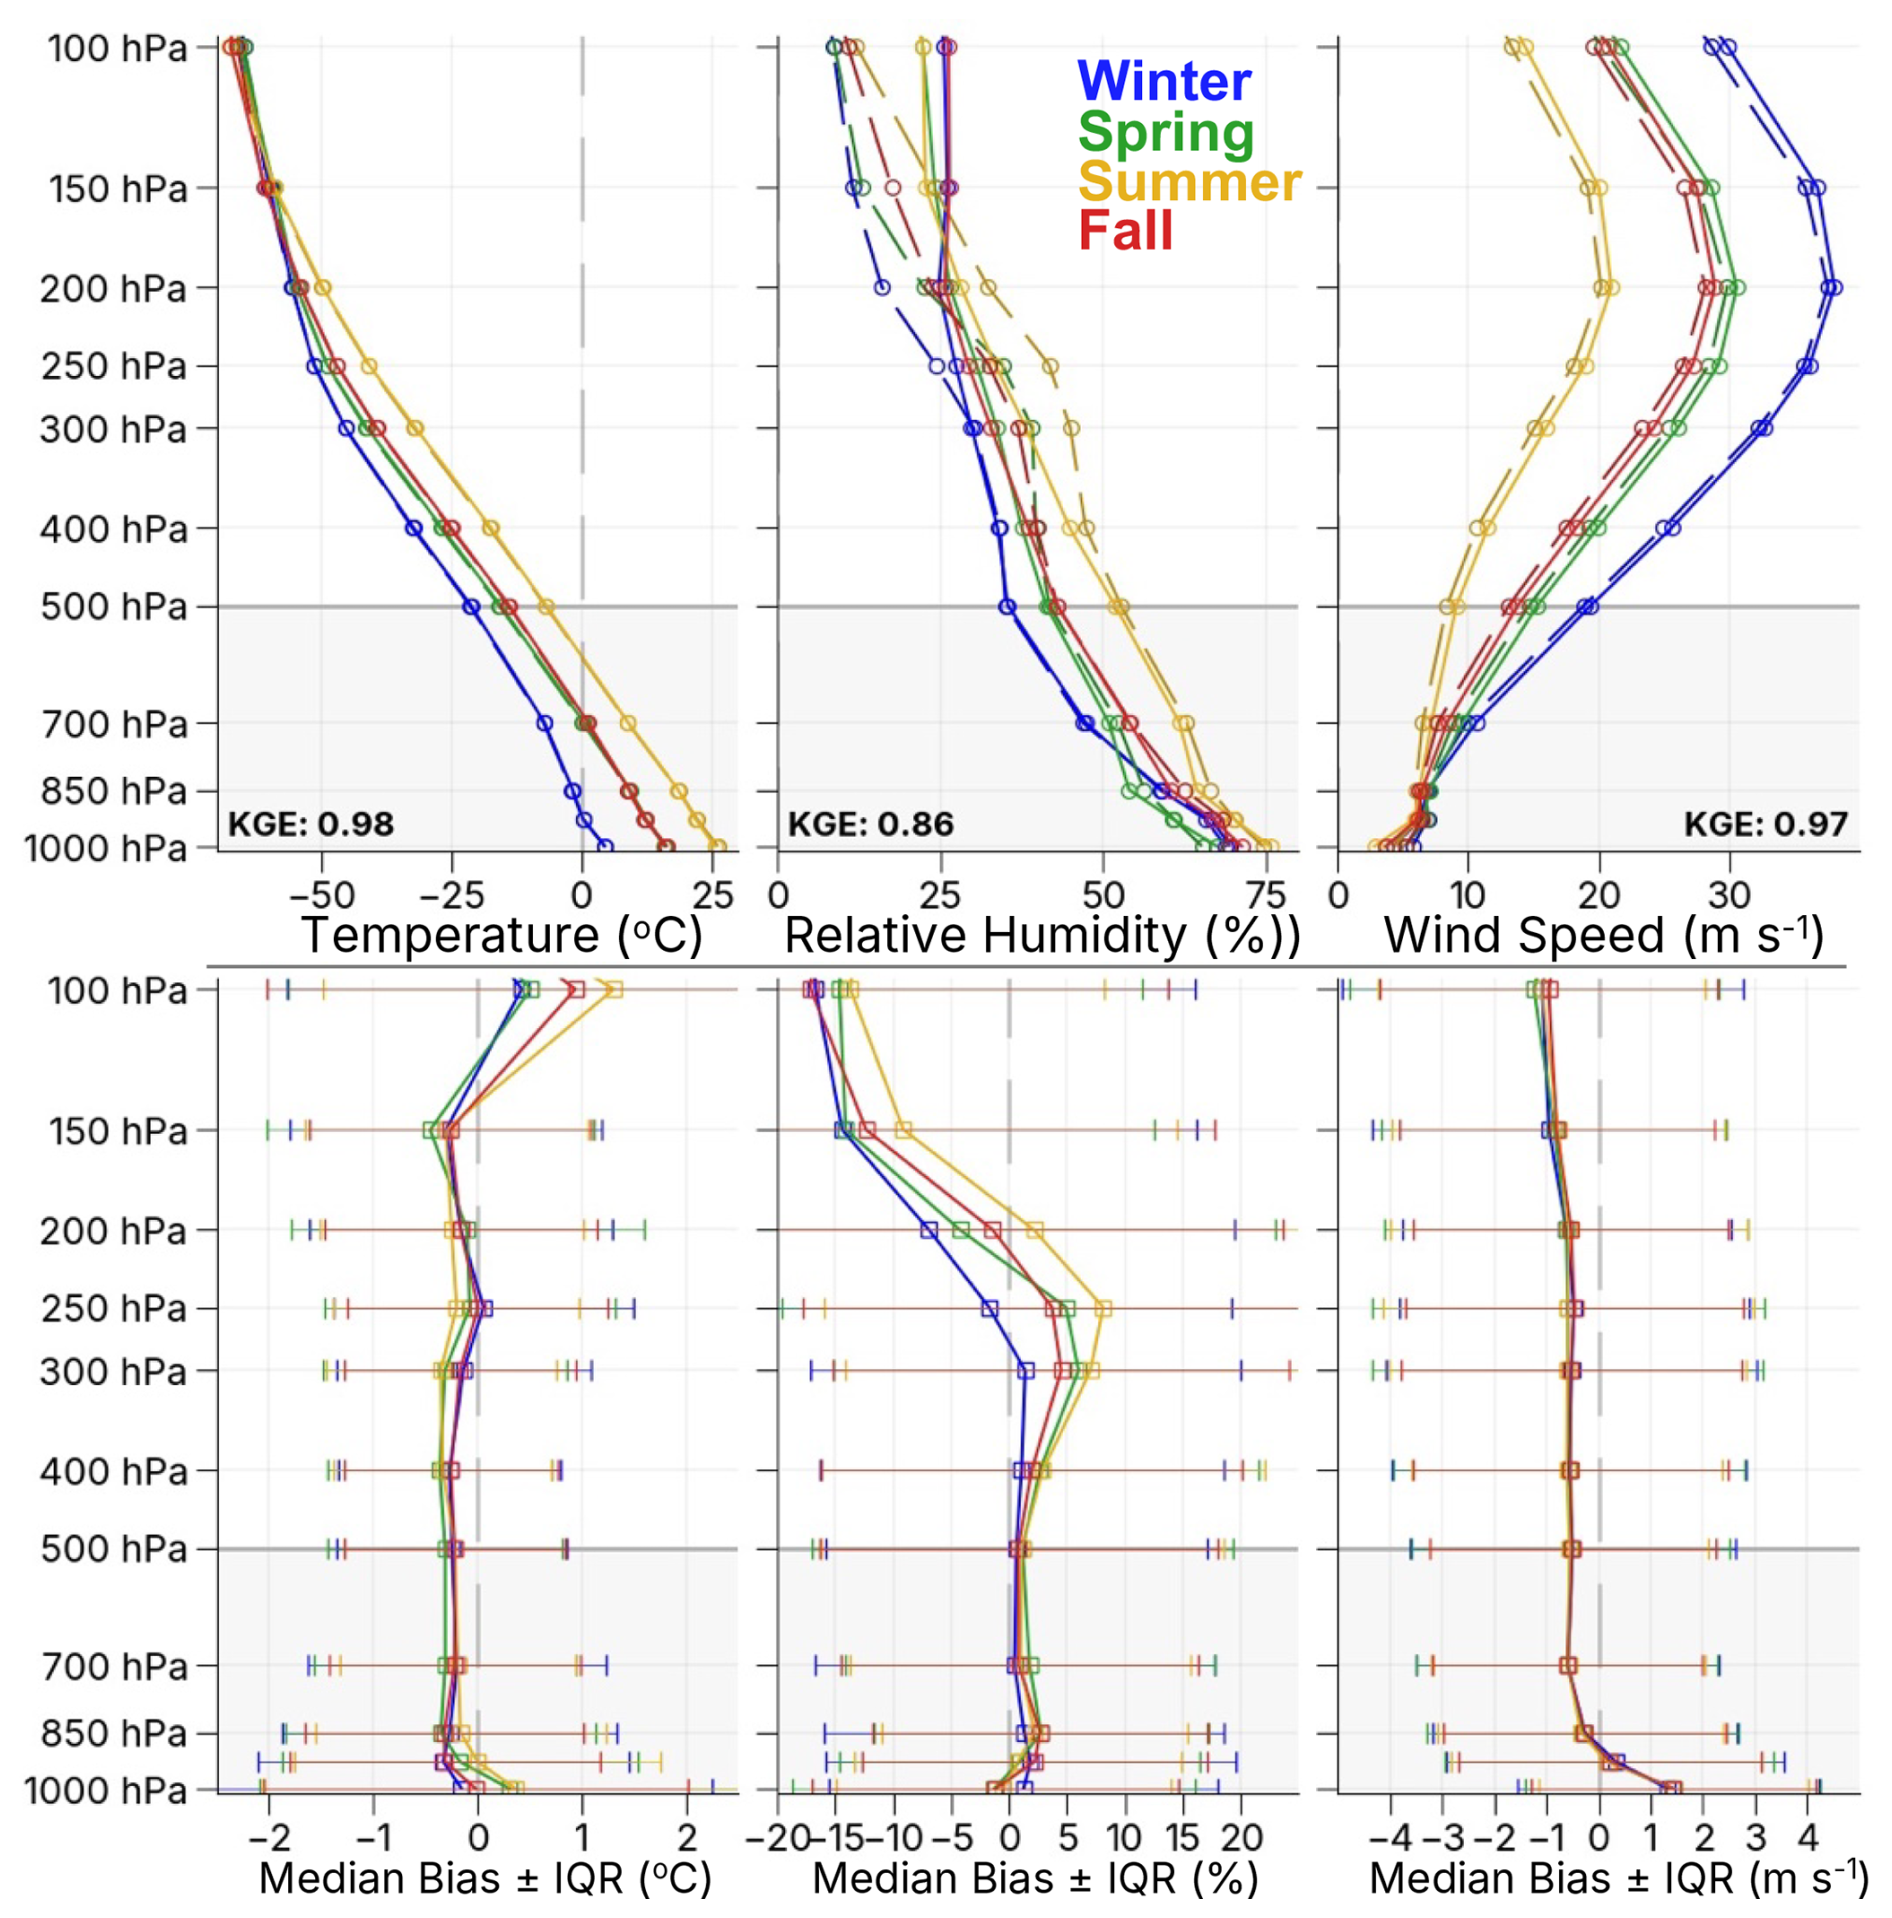
Figure 4Seasonal averages of temperature, relative humidity, and wind speed profiles across the domain (top panel) from the IGRA radiosonde archive, and their relative biases (MATCHA-IGRA) in the bottom panel. The dashed lines in the top panel refer to profiles from MATCHA, while the solid lines refer to profiles from IGRA. Horizontal error bars in the bottom panel correspond to the interquartile range of the relative bias across all sites.
The temperature profiles from MATCHA align well with radiosonde profiles from IGRA in Fig. 4. These profiles reveal a consistent cold bias across the domain for most seasons, especially in the lower troposphere (below 500 hPa), and a slight warm bias in the upper troposphere. The median biases across all sites are at a maximum of 2 °C. The cold bias is most pronounced in spring (−1.3 °C) and smallest in fall (−0.95 °C), with RMSEs following a similar seasonal pattern (4 °C versus 3.5 °C). Correlations across all sites and atmospheric layers remain high (R > 0.98) across all seasons, suggesting that MATCHA reasonably captures the vertical temperature structure despite the systematic cold bias. This is also confirmed by the KGE values across the seasons (0.98), suggesting almost “perfect” model agreement. KGE values for the lower troposphere (below 500 hPa) are slightly higher (KGE ≥ 0.99) than the upper troposphere (KGE between 0.95–0.97), suggesting better agreement in the lower troposphere.
3.1.2 Relative Humidity
Relative humidity (RH) at 2 m across ISD sites and corresponding MATCHA values are shown in Fig. 5. MATCHA captures the seasonal cycle very well, with a strong moisture gradient peaking from spring and declining till winter. Correlation across the domain is strong (R > 0.64; Table 2), which varies from 0.85 in summer to 0.64 in winter. However, MATCHA generally simulates drier conditions (negative model bias) compared to observed surface RH measurements. This dry bias is pronounced in northern India, northern and eastern China, and the Himalayas, particularly during winter and spring. Conversely, a prominent moist bias is observed in central and northern India, Pakistan, Afghanistan, and southeast Asia during spring and summer. The wet bias in Pakistan and Afghanistan peaks in summer (> 15 %) and becomes rather drier during winter (> −5 %). Central Asia exhibits a consistent dry bias (> −10 %), which is strongest in summer (> −15 %). Across seasons, spring and summer exhibit a general wet bias, while winter and fall are characterized by a general dry bias. The domain-averaged biases are highest in winter (MB = −2 %) and lowest in summer (MB of 1 %). RMSE values, however, are much larger (> 9 %) and peak in winter (RMSE of 10 %), while being lowest in fall (9 %). KGE values lie between 0.6 to 0.85, suggesting good model performance, with the best agreement across the domain in summer that slightly worsens in winter. Overall, MATCHA most accurately reproduces surface RH values across all seasons.
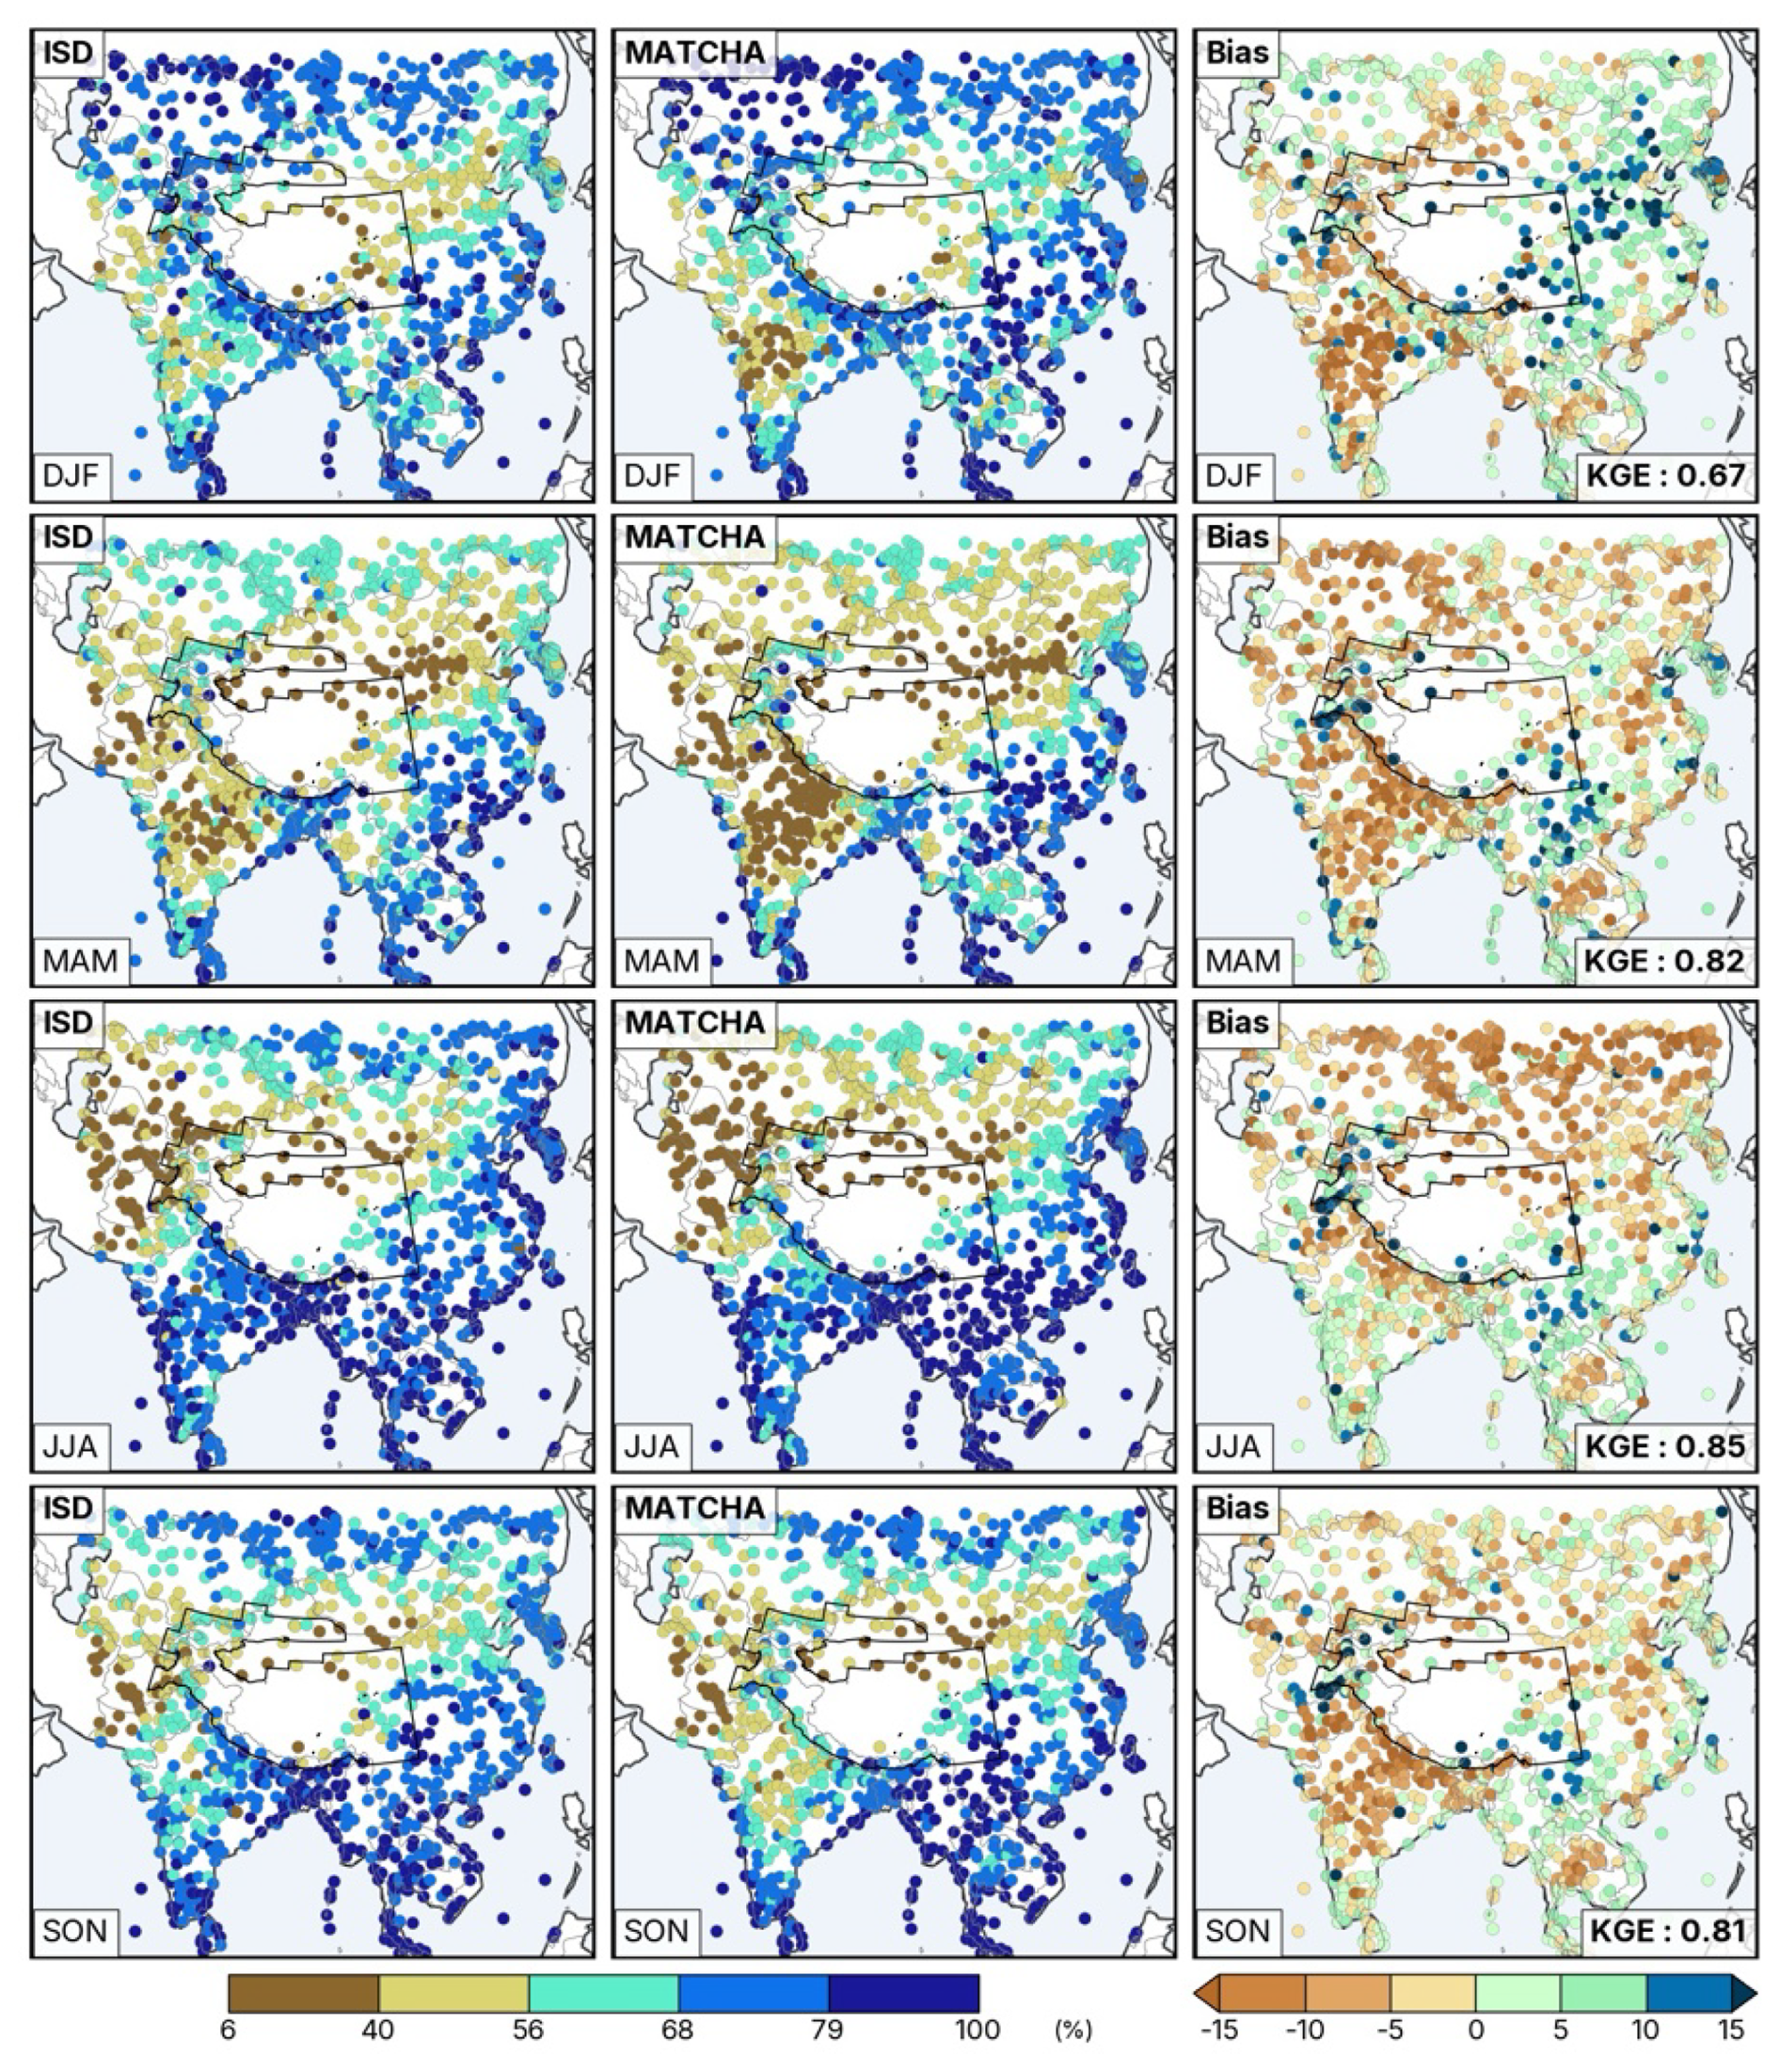
Figure 5Seasonal averages of relative humidity at 2 m (in %) from the ISD archive (left column), MATCHA (middle column), and the associated model bias (MATCHA – ISD, right column).
RH profiles from MATCHA in Fig. 4 display a slight moist bias (< 5 %) in the lower troposphere, transitioning to a drier bias (> 5 %) in the upper troposphere, which increases near the tropopause. The median biases across all sites vary at most by 20 %, with the strongest differences occurring mostly for winter across all layers. Across the domain, the moist bias below 500 hPa is relatively low (< 1 %) compared to the upper troposphere values, where the biases are drier and higher (−1 % to −5 %). This upper tropospheric dry bias is most prominent in spring and summer. Across the domain, the dry bias (see Table 2) across all tropospheric levels is strongest in winter (MB = −3.3 %) and weakest in summer (−0.6 %). RMSE values are comparatively high (> 10 %) across all seasons, peaking at 15 % in winter. Correlations are strong (> 0.66) and highest in summer (0.87). KGE values for all layers lie between 0.64–0.85, suggesting good model performance, with the best (worst) agreement in summer (winter). The model agreement, however, worsens for the upper troposphere with a strong contrast between the KGE values for winter versus summer (0.2 versus 0.7).
3.1.3 Wind Speed
The simulated and observed wind speed at 10 m across ISD sites are compared in Fig. 6. MATCHA shows moderate skills in capturing the seasonal cycle of 10 m wind speed with moderately strong correlation coefficient values of 0.4 to 0.7 across the domain. MATCHA also simulates higher wind speeds compared to observations, with a strong positive bias exceeding 2 m s−1 at most sites. This positive bias is particularly prominent over south Asia, especially during summer, and decreases gradually through fall and winter. In northern India, underestimations (negative bias) are observed at some sites in winter. Domain-wide seasonal biases (Table 2) indicate a consistent positive bias around 1.5–1.7 m s−1 across all seasons. RMSE values are also relatively stable across seasons, ranging between 2.3 m s−1 in winter to 1.8 m s−1 in fall. KGE values lie between 0.1–0.2, suggesting slightly poor model performance, with the best agreement during transition seasons (spring and fall). WRF is known to overestimate 10 m wind speeds for low to moderate wind speeds using all available PBL schemes, particularly over complex terrain (Cheng and Steenburgh, 2005; Jiménez and Dudhia, 2012; Mass and Ovens, 2010). Previous studies show a similar windier bias within the MERRA-2 reanalysis (Faber et al., 2024), particularly at inland stations (Carvalho, 2019).
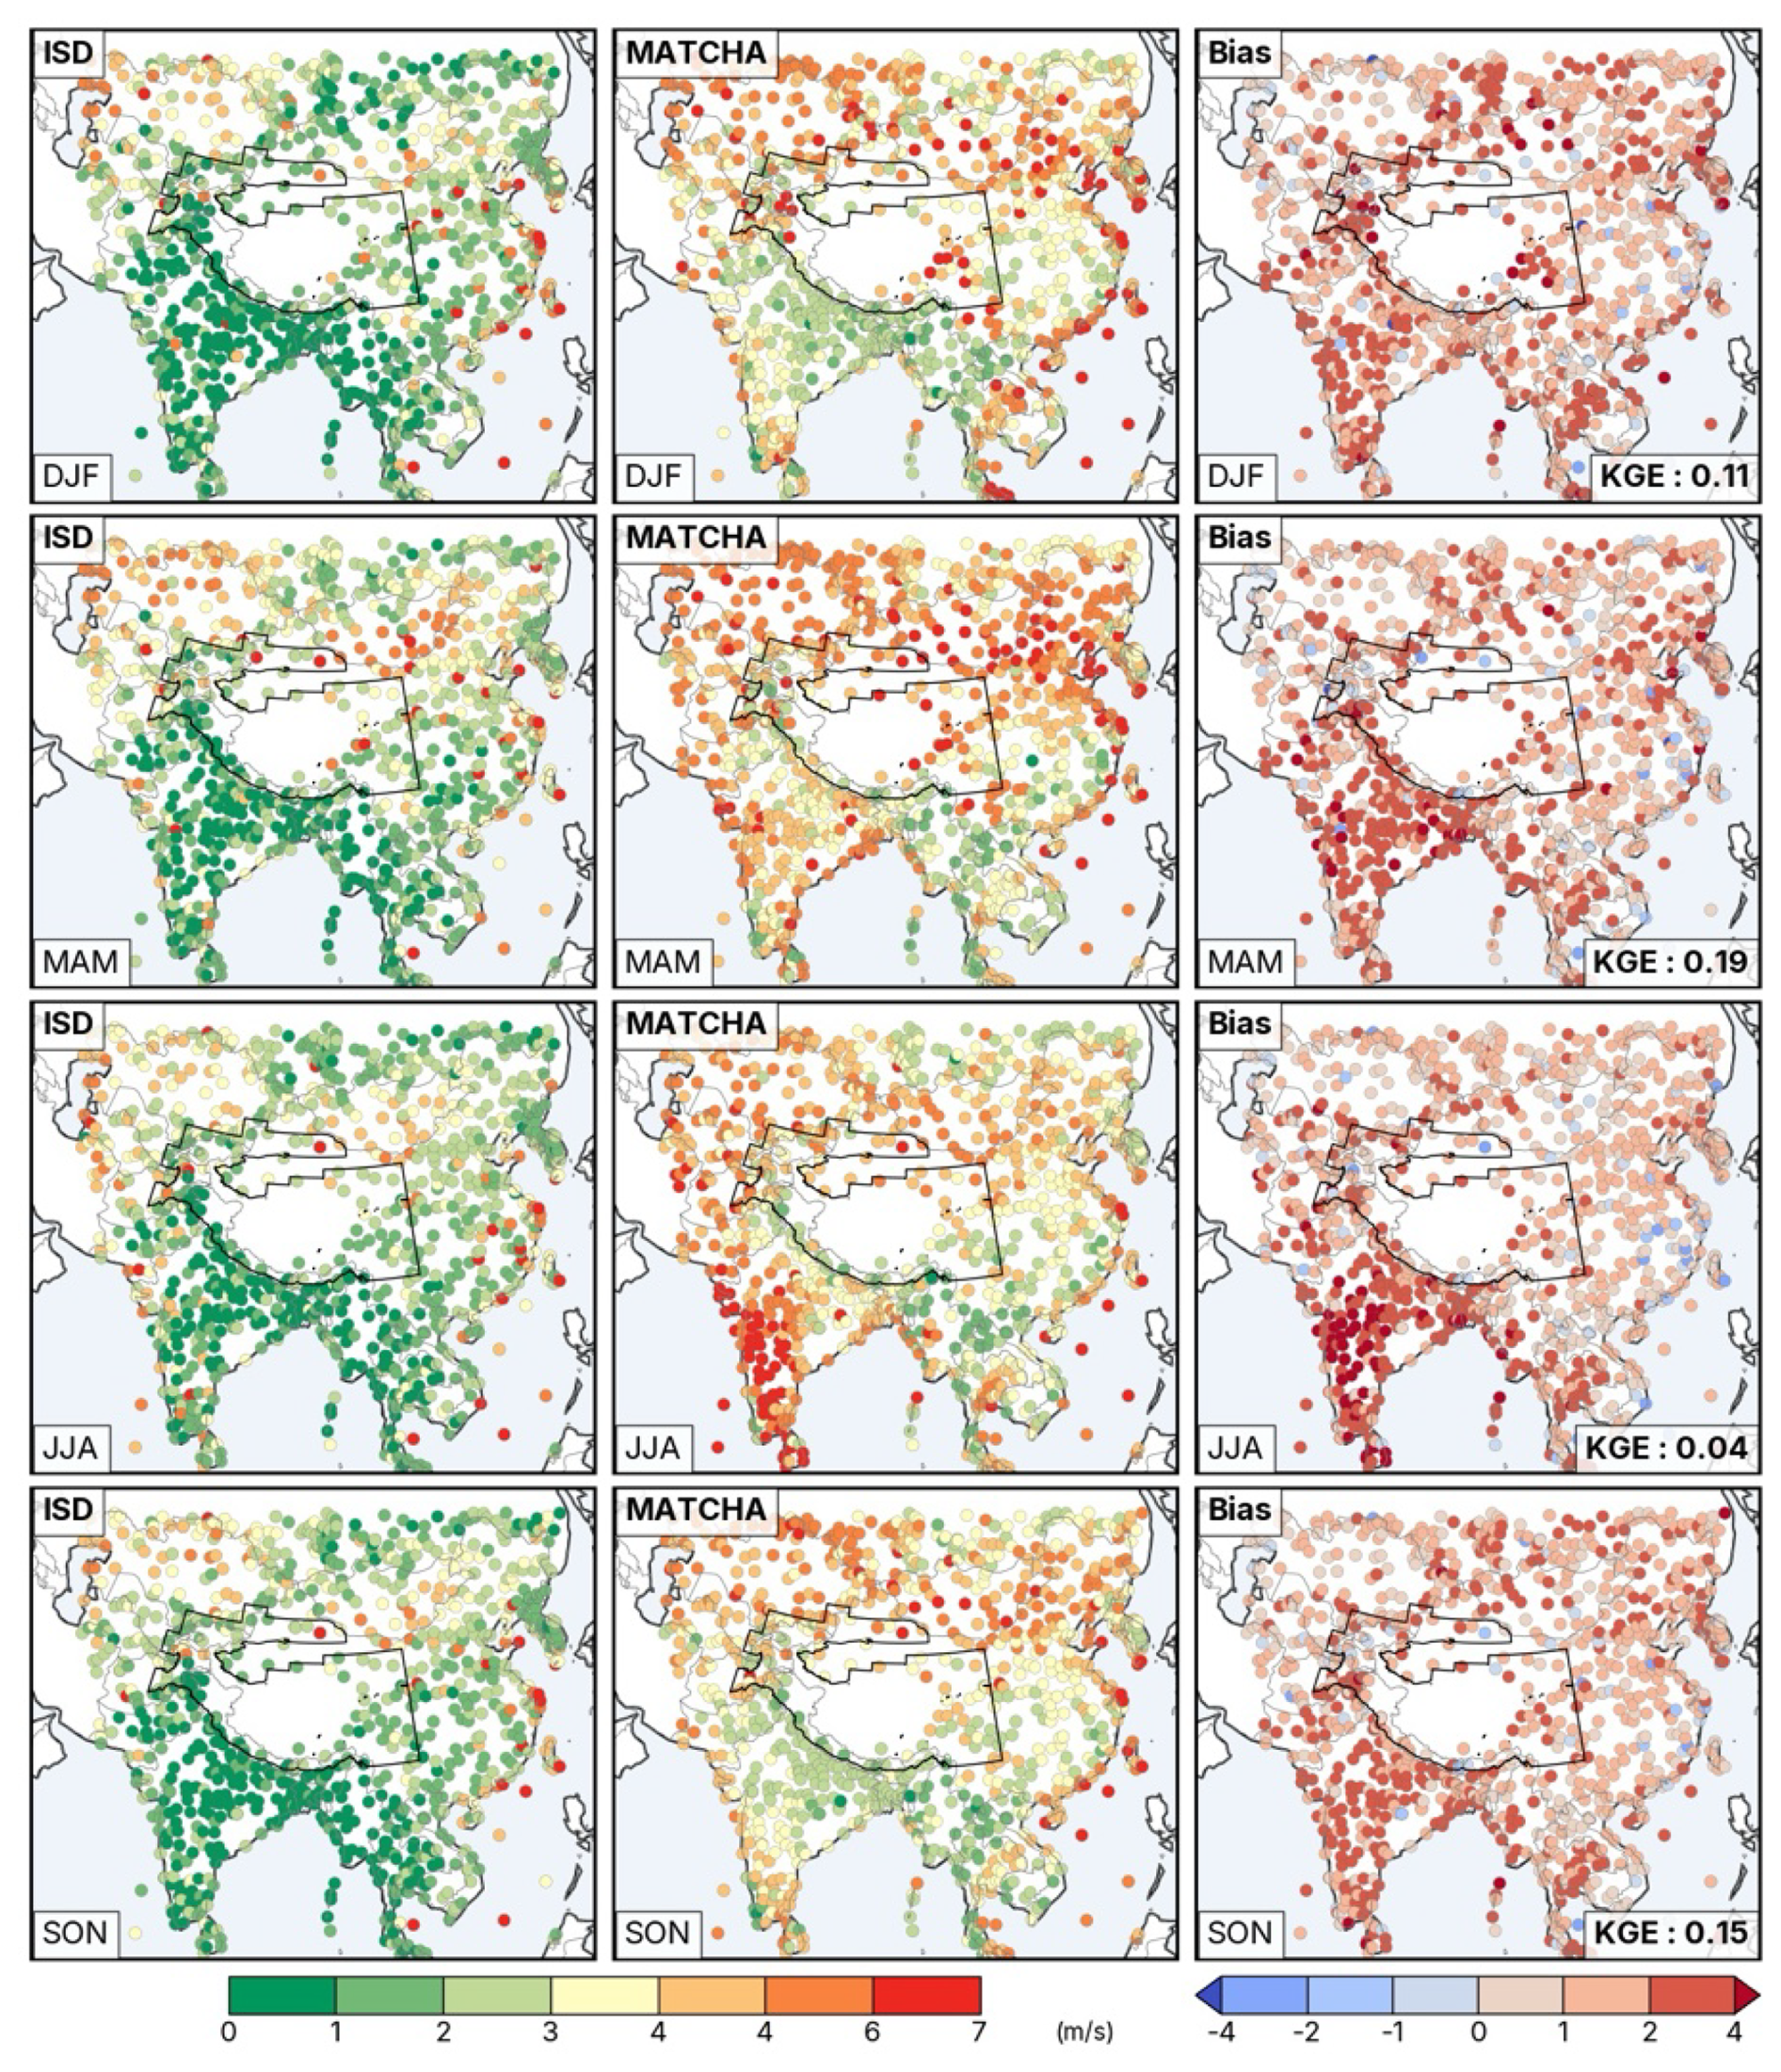
Figure 6Seasonal averages of wind speed at 10 m (in m s−1) from the ISD archive (left column), MATCHA (middle), and the associated model bias (MATCHA – ISD, right column).
Vertical wind profiles, as shown in Fig. 4, however, demonstrate good agreement between MATCHA and IGRA observations across all seasons, as seen from the relatively high KGE values (> 0.95), suggesting good model performance across profiles. The average bias across all pressure levels is small and rather negative in contrast to the positive bias at the surface, ranging from −0.1 m s−1 in winter to −0.5 m s−1 in fall. RMSE values are higher at upper levels, peaking at 3 m s−1 in winter, suggesting increased variability in performance with altitude. The biases and RMSEs are lower for the lower troposphere and higher in the upper troposphere. KGE values, however, are slightly better in the upper troposphere (> 0.95) than in the lower troposphere (∼ 0.9). However, correlations averaged across all pressure levels are high (> 0.9), indicating that MATCHA effectively captures overall wind profiles but exhibits biases near the surface and in the upper troposphere.
3.2 Land-Atmosphere Interactions and Hydrology
3.2.1 Precipitation
Figure 7 presents a comparison of seasonal average daily accumulated precipitation between IMERG-F and MATCHA across four seasons. The precipitation patterns show a strong south-to-north gradient, particularly in summer and fall, depicting the onset and retreat of the Asian summer monsoon, with maximum intensity observed in the Indian subcontinent, especially in summer. During winter and spring, precipitation remains low except for coastal regions and parts of south Asia across both datasets. The high precipitation intensities are clustered in high elevation regions, with MATCHA successfully reproducing the broad spatial patterns of precipitation across Asia. MATCHA also captures localized features along the mountain foothills and coastal regions, particularly during summer/monsoon, which are smoothed over in IMERG-F. Similar localized patterns are seen in the IMDAA regional reanalysis when compared with a spatially smoother precipitation from the ERA-Interim reanalysis (Ashrit et al., 2020; Dee et al., 2011). Average daily accumulated precipitation from IMERG-F is highest (lowest) during the summer/monsoon (winter), with a gradual increase in spring followed by a decline in fall. MATCHA captures this seasonality over the domain but shows strong biases in southeast Asia (wet bias), northern India (dry bias), southern and eastern China (dry bias), and the Tibetan Plateau (dry bias). Over India and eastern China, a dry bias progressively develops in MATCHA from winter to summer (> −1 mm), except for a prominent wet bias in summer over the Himalayan foothills and the Bay of Bengal (> 1 mm). In summer, MATCHA captures high bands of precipitation above 6 mm, especially over the Bay of Bengal, albeit drier by 4 mm or more. A consistent wet bias (∼ 1 mm or more) is seen in the Tibetan Plateau across all seasons, suggesting limitations in MATCHA to represent convective processes and orographic precipitation over complex terrain and high elevation areas, which has been noted by previous studies across models (Cannon et al., 2017; Sugimoto et al., 2024). Overestimation of precipitation in higher elevation regions of HMA has also been reported across reanalyses in studies, particularly in summer (Dollan et al., 2024). A prominent dry bias is seen in southern China and southeast Asia during fall (> 0.1 mm), suggesting issues in the model to simulate the seasonal retreat of the summer monsoon. Across the domain, the evaluation statistics as discussed in Sect. 2.3 are shown in Table 3. An overall dry bias is observed, which is highest (lowest) in summer (winter) (MB of −1.8 mm versus −0.4 mm). The RMSE also shows similar seasonality (5.2 mm in summer versus 1.2 mm in winter). The correlation across the domain is relatively strong, and highest (lowest) in summer (winter) (R of 0.8 versus 0.7). The higher correlation during summer can be seen due to general patterns of high precipitation bands associated with the Indian summer monsoon, as captured by MATCHA. The KGE values vary between 0.5 to 0.6 across seasons, with the relatively best (worst) agreement in summer (winter), indicating moderate skill in reproducing the daily precipitation climatology. Xie et al. (2022) compared daily precipitation products from both IMERG and ERA5-Land (with a similar resolution of 9 km) with rain gauges over China and reported median KGE values in the 0.5 range, as in our study. Contrary to the overall biases, MATCHA captures several important features of the daily precipitation cycle well, especially in the Indian subcontinent, while the performance worsens during winter in high-elevation and desert regions of Central Asia. The regional biases observed, particularly the wet bias in high elevation regions, highlight areas where further improvements in convection, land-atmosphere coupling schemes, as well as representation of orographic precipitation across complex topography, might be necessary (Barros and Arulraj, 2020; Mishra et al., 2021).
Table 3Evaluation metrics for all variables related to land-atmosphere interactions from MATCHA evaluated in this study across four seasons.
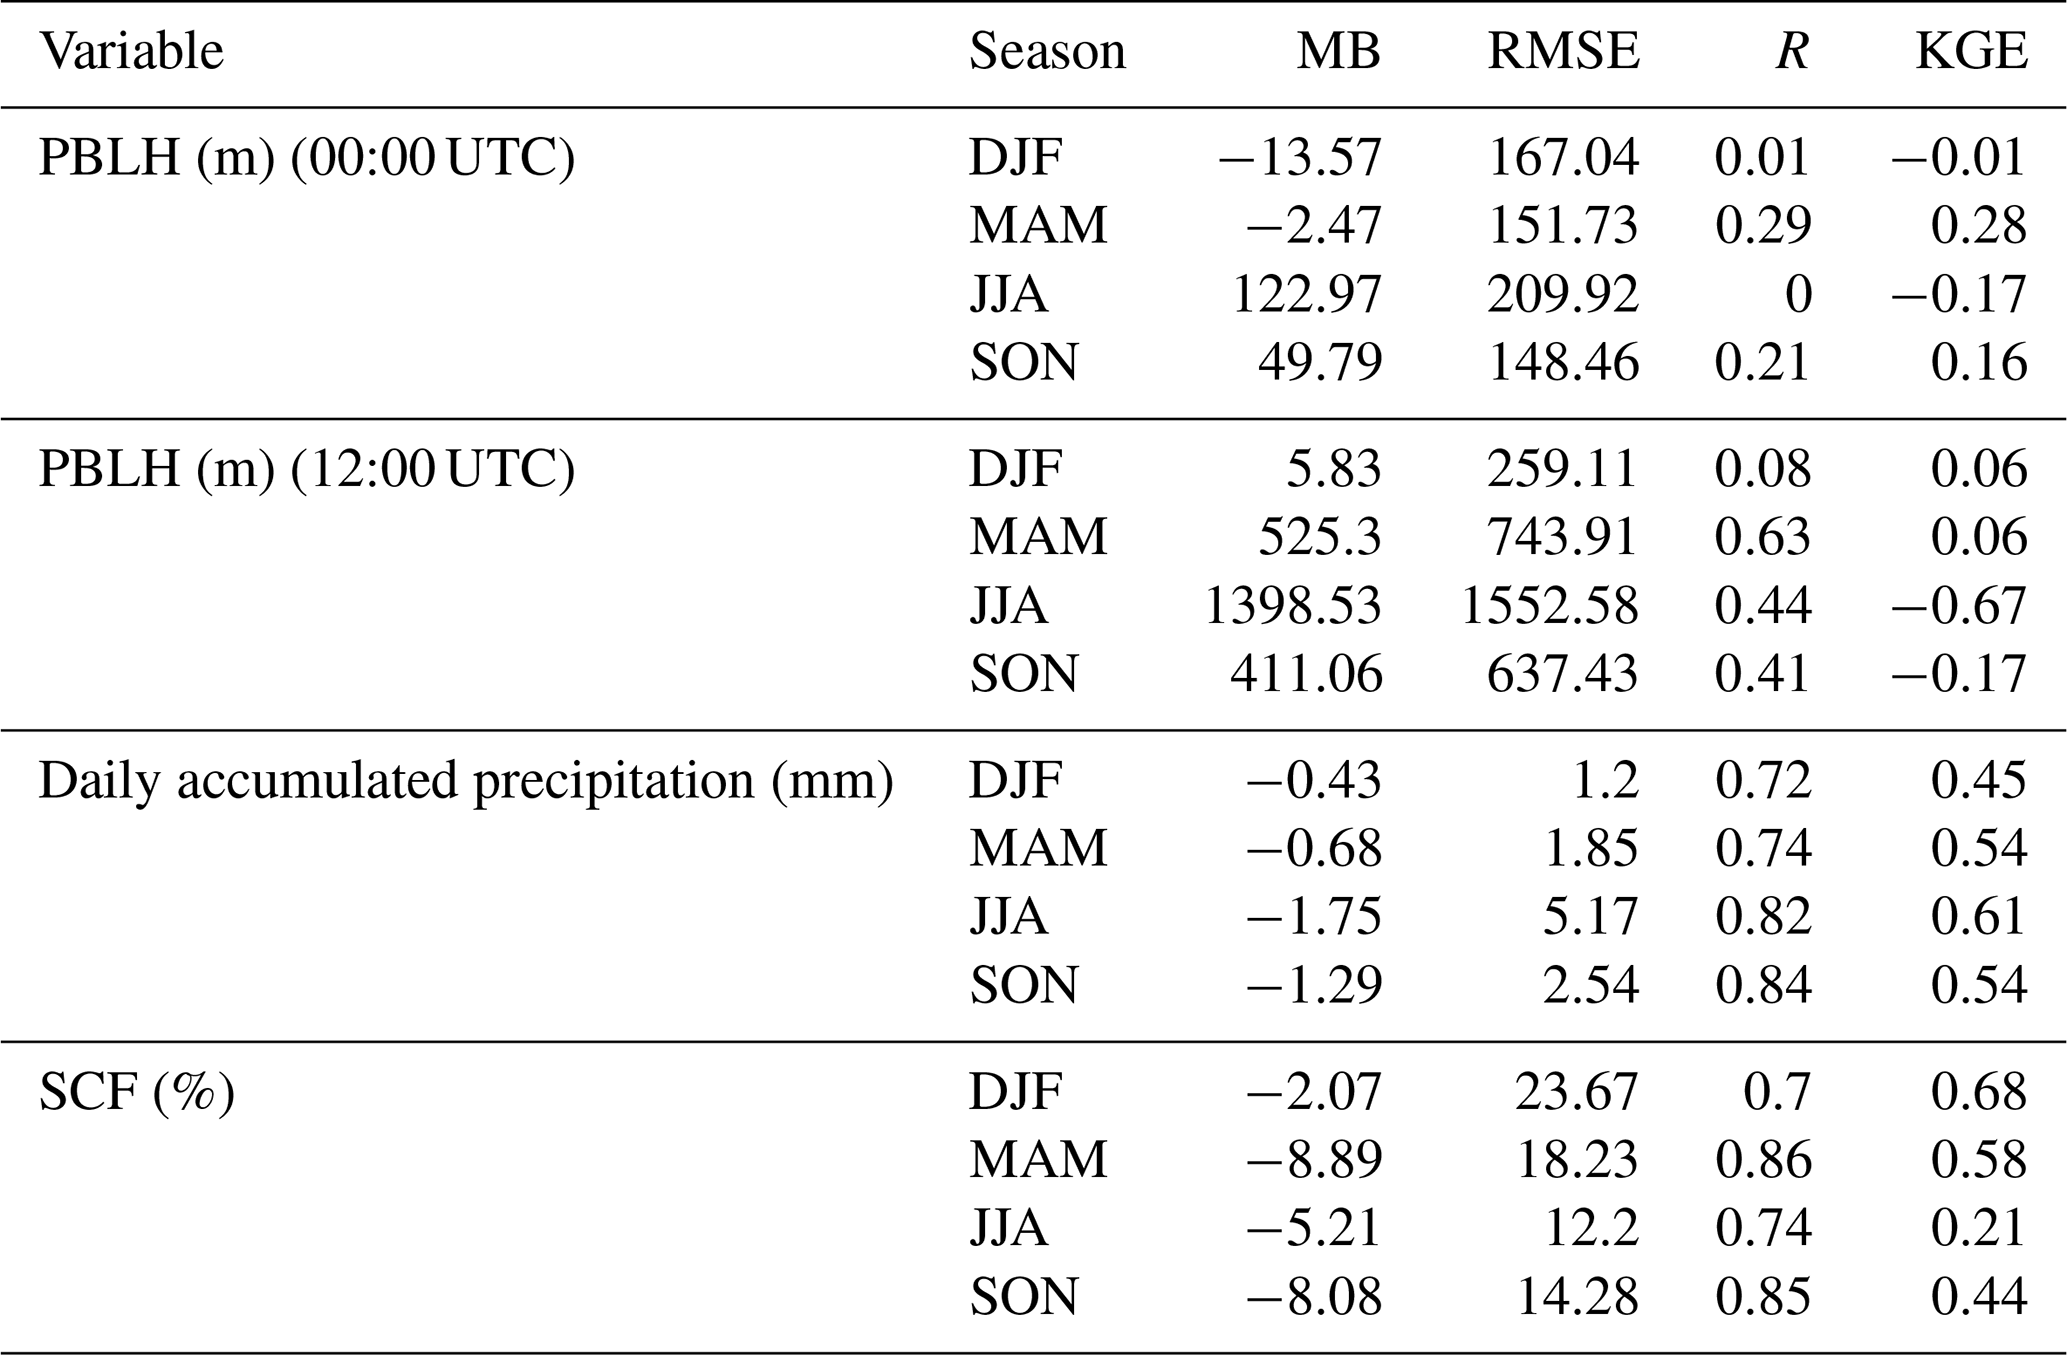
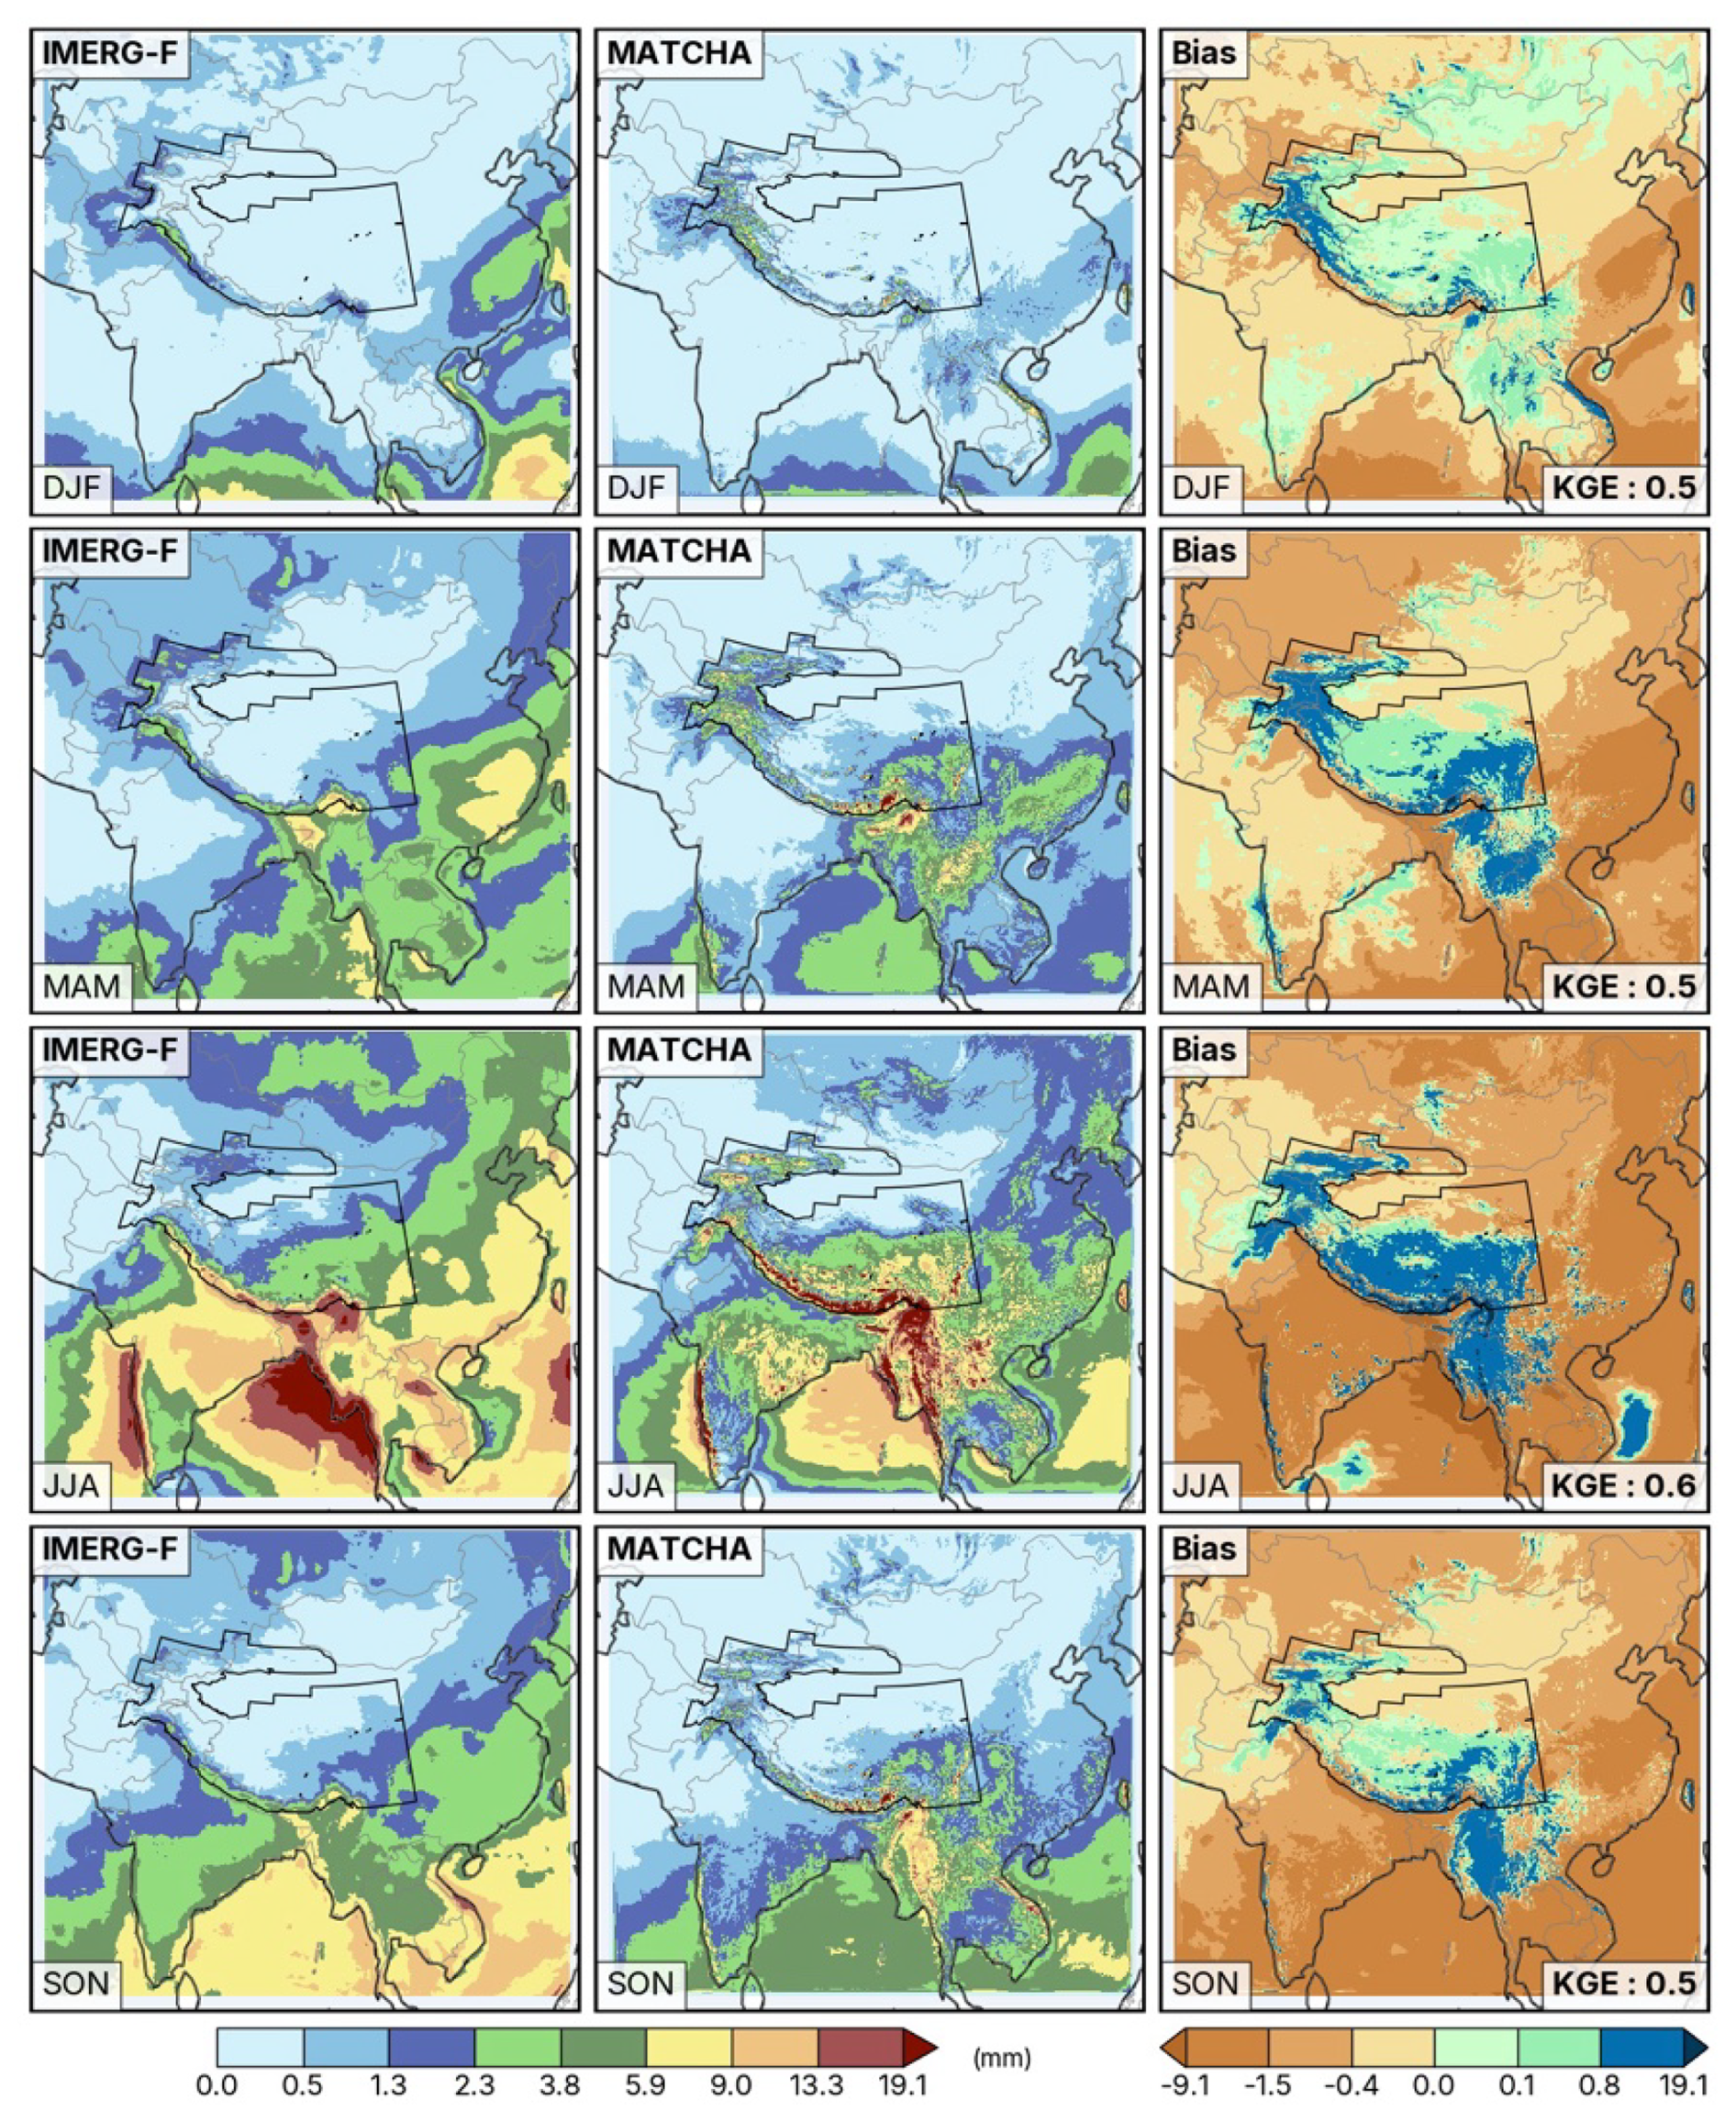
Figure 7Seasonal averages of daily accumulated precipitation (in mm) across the domain from IMERG (left column), MATCHA (middle column), and the associated model bias (MATCHA-IMERG, right column).
3.2.2 Planetary Boundary Layer Height (PBLH)
PBLH measurements at 00:00 and 12:00 UTC from IGRA (following the outlier approach in Sect. 2.2.4) across four seasons are shown in Figs. 8 and 9, respectively. Within the study domain, PBLH at 00:00 UTC represents the dawn to morning PBLH (from 03:30 to 09:30 local hours) on average, whereas at 12:00 UTC, the values correspond to the late afternoon to night PBLH (from 15:30 to 21:30 local hours). Figures 8 and 9 show the approximate shadow zones (nighttime conditions) at 00:00 and 12:00 UTC, based on sun elevation angle and local time. MATCHA captures the diurnal variability (increase from morning to afternoon, 00:00 to 12:00 UTC) except in winter when the 12:00 UTC PBLH is significantly underestimated, particularly over the Indian subcontinent. MATCHA generally reproduces the seasonal variability from a shallower PBLH in winter to a deeper PBLH in summer, especially for 12:00 UTC. For 00:00 UTC, the biases are generally negative, with the largest underestimation observed over India and near the coasts during all seasons. An exception occurs in summer, where overestimations exceeding 200 m are prominent in eastern China (Fig. 8). For 12:00 UTC, positive biases dominate across the domain, particularly during summer (> 350 m) (Fig. 9). In winter, however, MATCHA sometimes underestimates PBLH by more than −200 m, particularly over the Indian subcontinent. Biases over eastern China remain predominantly positive across seasons, except for winter at certain sites. Over India, positive biases (above 330 m) are observed exclusively during summer.
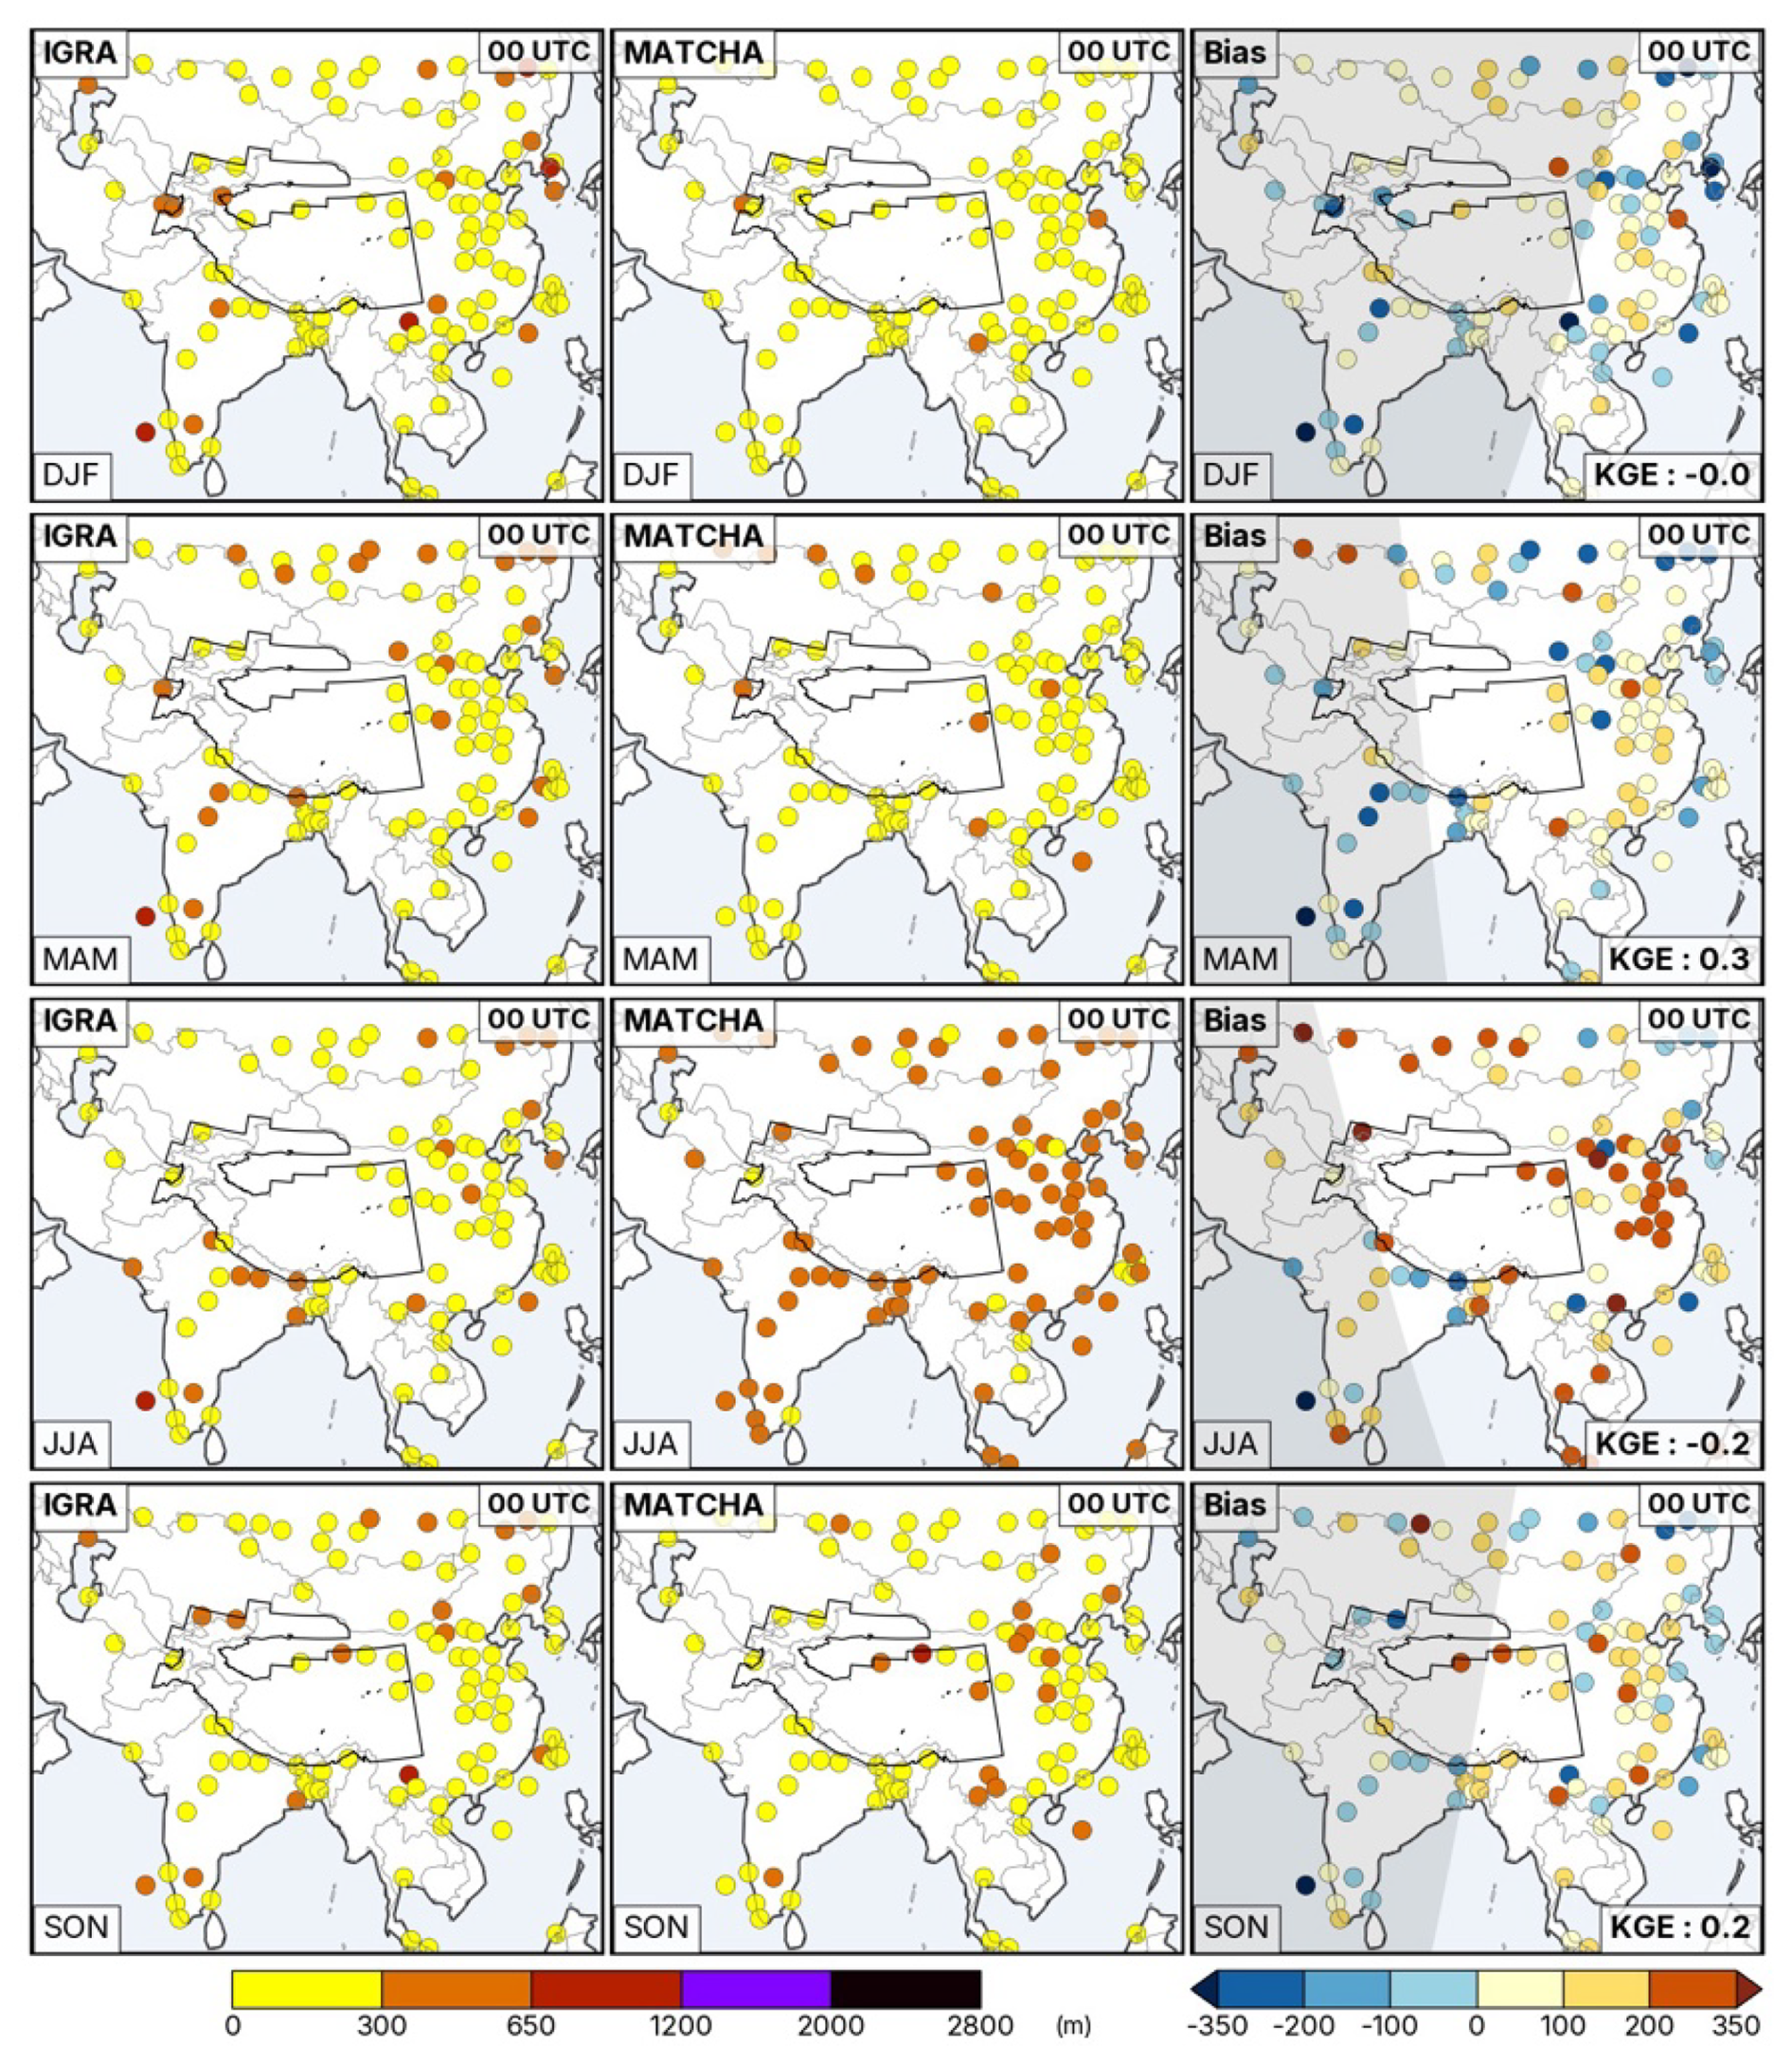
Figure 8Seasonal averages of planetary boundary layer height at approximately 00:00 UTC from the IGRA archive (left column), MATCHA (middle column), and the associated model bias (MATCHA – IGRA, right column). The shadow zones show parts of the domain with nighttime conditions depending on the solar elevation angle on the 15th of the months; January (for DJF), April (for MAM), July (for JJA), and October (for SON), for the year 2003.
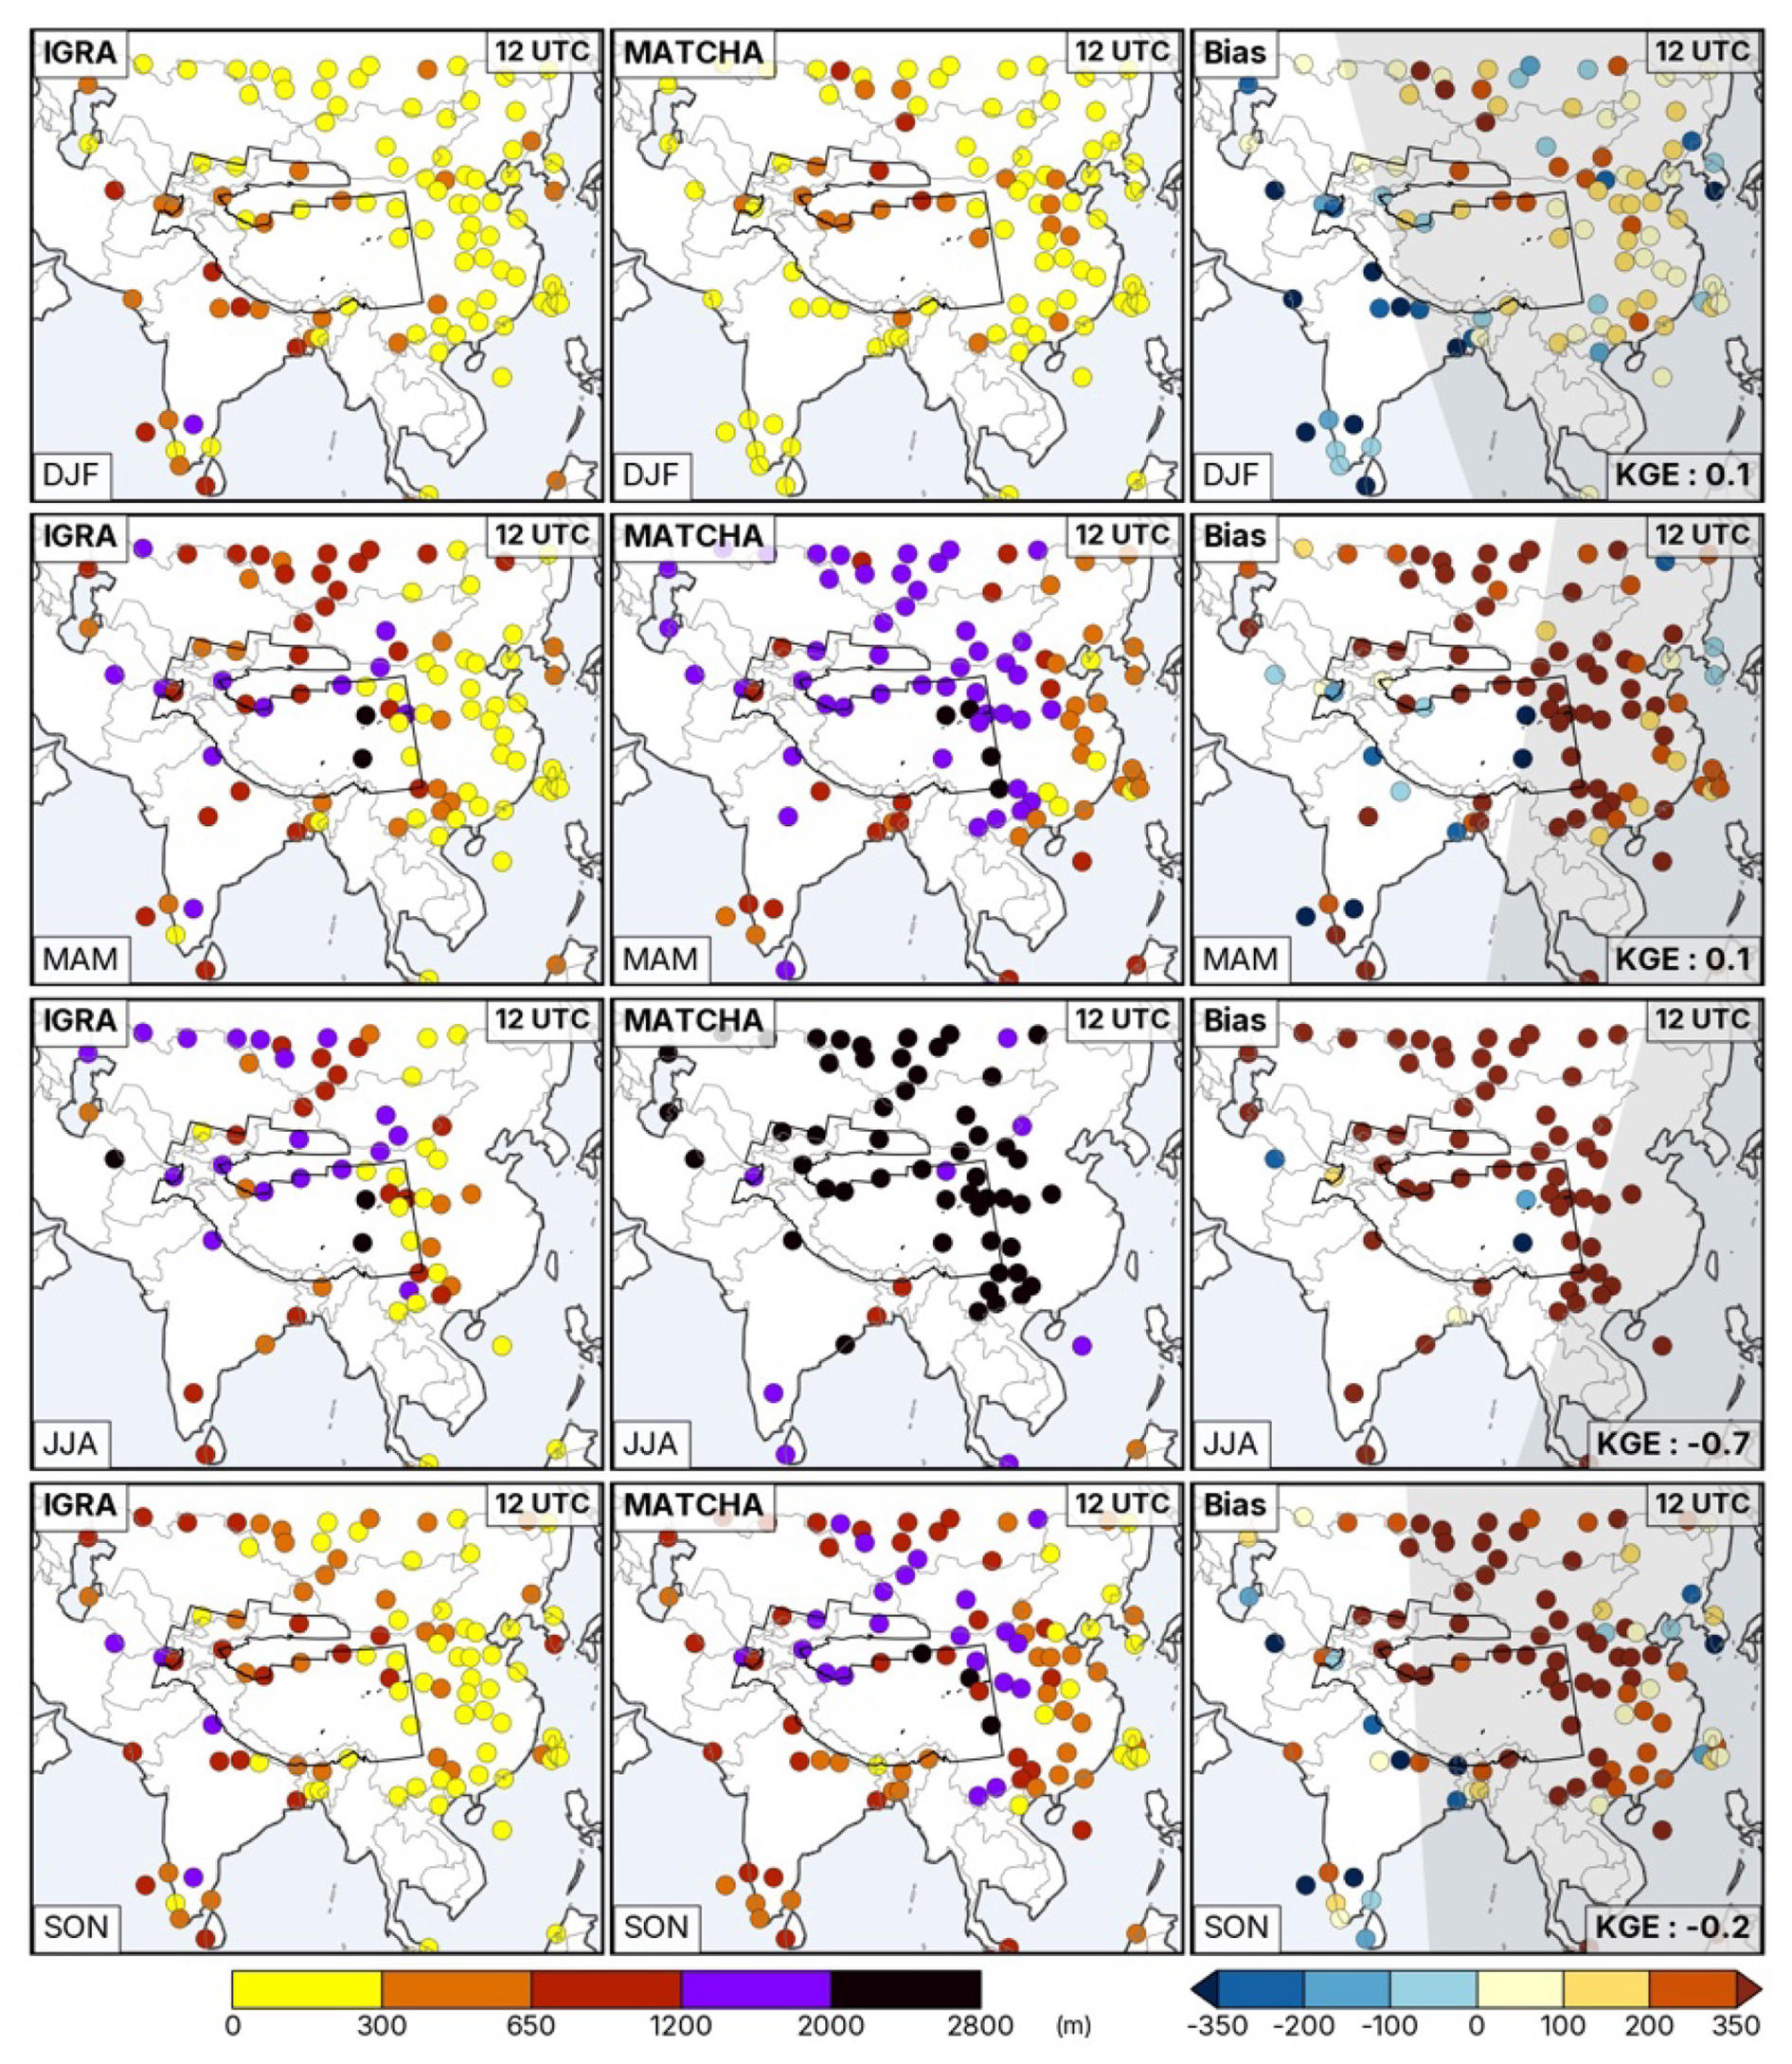
Figure 9Seasonal mean of boundary layer height at approximately 12:00 UTC from the IGRA archive (left column), MATCHA (middle column), and the associated model bias (MATCHA – IGRA, right column). The shadow zones show parts of the domain with nighttime conditions depending on the solar elevation angle on the 15th of the months; January (for DJF), April (for MAM), July (for JJA), and October (for SON), for the year 2003.
Domain-wise metrics (in Table 3) at 00:00 UTC reveal low biases across all seasons, which is highest in summer (MB of 123 m), except for a mild underestimation in spring (MB of −2 m) and winter (MB of −14 m). RMSE values range from 167 m in winter to 210 m in summer, indicating larger variability in summer. At 00:00 UTC, the mean bias remains within ±125 m in every season, indicating that the WC-CS model reproduces the nocturnal PBLH (pre-sunrise) reasonably well. At 12:00 UTC, however, the bias becomes positive and highly variable across seasons, rising from 6 m in winter to 1400 m in summer, indicating a significant seasonal variability. There are strong overestimations at 12:00 UTC across the domain, particularly in summer, where the errors are the highest (MB of 1399 m, RMSE of 1552 m), compared to winter, where the errors are quite low (MB = 6 m, RMSE = 259 m). Models often struggle to capture the diurnal cycle of PBLH at the transition periods during morning and evening, where the decay during the transition from the daytime convective boundary layer to the nocturnal stable layer (and vice versa, a rapid rise from stable BL to convective BL during morning) can lead to the significant PBLH biases around 12:00 or 00:00 UTC (Cuchiara and Rappenglück, 2017; Hong, 2010; Taylor et al., 2014). For our domain, most of the observations belong to this transition period because radiosonde launches at and 00:00 (12:00) UTC in most of Asia span from (pre-dawn) afternoon to daytime (night) locally, and we can see that (western) eastern part of the domain remains at nighttime conditions in Figs. 8 and 9 across all seasons. In Fig. A3a, we see that around 42 % of the launches are at the transition zone or night times conditions (referring to D(LS), CT(M), CT(E), and N; low sun during day, civil twilight in the morning, evening, and night respectively) across all seasons, which coincide with the largest PBLH biases (MATCHA-IGRA, −500 to 2200 m) (in Fig. A3b) as well. We group the local launch times of all the observations across five solar regimes, based on the solar elevation angle: N/night (°), CT/civil twilight (−6 to 0°, morning (M) or evening (E) by the solar azimuth), D (LS)/Day Low Sun (0 to 10°), and D(HS)/Day High Sun (> 10°). The model biases are particularly high for D(LS) and CT(E) solar regimes, particularly during summer, as seen in Table 3. At 00:00 UTC, when most of the transition-related launches (∼ 19 % of total launches) fall into the N, CT(M) and D(LS) regimes, MATCHA shows negligible biases (< 125 m) and lower RMSEs (150–210 m, Table 3), confirmed by the smaller spread in Fig. A3b. In contrast, at 12:00 UTC, the large variability in errors is seen by the large spread in Fig. A3b, where the transition-related launches (∼ 23 %) fall into the N, CT(E), and D(LS) regimes. In Fig. A3e–f, we also show the distribution of shortwave downward radiation (SWDOWN) and surface sensible heat flux (sSHF) that drives convective BL, collocated at the observations. We can see that MATCHA still simulates high radiances and fluxes during the transition regimes, particularly at D(LS), CT(E), and even N, well after the Sun has crossed the horizon locally (within 10° elevation). This can indicate that the sustained surface forcing leads to increased buoyant turbulence, where the model PBLH continues to deepen, when it should already collapse. For instance, in summer, we see that the median sSHF in CT(E) exceeds 150 W m−2, leading to PBLH biases up to 2000 m, while during CT(M) or N, the sSHF falls near/below 0, and the biases collapse to 200 m. It is also important to note that we are limited to the nearest hour by the collocated MATCHA samples, when the actual launch times might be varied by minutes. A preliminary analysis showed that during the transition hours, around half (52 %) of the radiosonde launches are released within ±15 min of the model hour, with an inter-quartile range of model biases up to 1000 m across all seasons. These findings indicate that residual heating due to a mismatch in radiation timing within the model can drive these high biases within MATCHA, particularly in summer, due to the delayed collapse in PBL in the transition hours.
For 00:00 UTC, correlation coefficients are weak across seasons, except weak correlations (0.1–0.2) for transition seasons (spring and fall), reflecting weak agreement between MATCHA simulations and IGRA observations. Correlations, however, are improved for 12:00 UTC compared to morning/daytime PBLH values, with the strongest correlation during summer (R of 0.5). KGE values, however, are slightly better for 00:00 UTC than 12:00 UTC, with the best model performance during spring for both 00:00 and 12:00 UTC. The overestimation during summer suggests enhanced vertical mixing within the model due to strong convection over tropical regions. Previous studies have reported an overestimation of nighttime PBLH by factors of three or at least by 1400 m over regions in Asia from models (Lee et al., 2023; Zhang et al., 2022). A global analysis of daytime PBLH across reanalysis products like ERA5 and MERRA-2 has shown an average bias of up to 640 m in Asia across seasons (Guo et al., 2021). These discrepancies, characterized by high RMSE and low correlation, likely stem from the coarser model resolution in the horizontal and vertical (only 35 vertical levels), parameterizations to represent sub-grid scale convection and surface energy budgets, particularly in complex and high terrain, as well as the diurnal phase mismatch during the evening transition, as discussed in previous studies (Meng et al., 2023; Mues et al., 2018; Shin and Dudhia, 2016). Note that this validation is not representative of the model's ability to capture the diurnal cycle of PBL but is only an attempt to validate the model performance at two specific times (00:00 and 12:00 UTC) that belong to morning and evening transition zones in daily PBLH evolution. Nevertheless, our results point to the need for a deeper investigation into the uncertainties in both the observed and modeled PBLH, particularly in such regions with complex terrain (Chen et al., 2023).
3.2.3 Snow Cover
In Fig. 10, we compare SCF (in %) from MODIS and MATCHA across four seasons over the six aggregated major first-order glacier regions of HMA, based on the Randolph Glacier Inventory (RGI v6). The six HMA glacier regions from RGI v6 are defined as follows: INT: Inner Tibet, S and E Tibet; HTQ: Hengduan Shan, Qilian Shan; TNS: W and E Tien Shan; KNL: W and E Kun Lun; HIM: W, C, and E Himalayas; HKPH: Hindu Kush, Karakoram, Pamir, and Hissar Alay. MATCHA in general captures the seasonal as well as spatial distribution of SCF observed by MODIS, with the highest SCF in winter and lowest in summer. Both MODIS and MATCHA show widespread high SCF in winter across most regions, except for strong overestimation in INT (> 20 %) and strong underestimation in TNS (> 20 %). As snow begins to ablate in spring, MATCHA seems to suggest more snowmelt as seen by the negative biases across most regions, while some regions of INT, eastern HIM, and southern HTQ show positive biases, indicating lagged snow ablation. In summer, the highest SCF is mostly limited to the higher altitudes but is much lower in MATCHA compared to MODIS, particularly in HIM and HKPH. In fall, as snow begins to accumulate, MATCHA continues to exhibit negative biases over regions the high elevation areas, with some sporadic overestimations in the HMA. Across the glacier regions, MATCHA shows reasonable agreement with MODIS in winter over HIM, except for the larger biases during snowmelt. Highly rugged regions like HKPH also show strong biases likely due to limitations in resolving sub-grid processes. Areas like INT and HTQ show the strongest biases during winter. Domain-wide metrics in Table 3 show the lowest bias in winter (MB of −2 %) and the strongest bias in spring (MB of −9 %). RMSE values peak in winter (24 %) and are lowest in summer (12 %), suggesting greater variability in SCF in winter despite the lowest bias. Correlation values are strong across all seasons (R > 0.7), while the KGE values show the best agreement during winter, followed by spring (0.7 and 0.6). These results suggest that overall, MATCHA seems to struggle mostly during snowmelt periods. A recent study comparing SCF across various reanalyses over the TP found that the TP-averaged SCF was around 12 %–14 %, which closely aligns with our estimates of SCF from MATCHA (11 %) and MODIS (12 %) over the INT region (Yan et al., 2024).
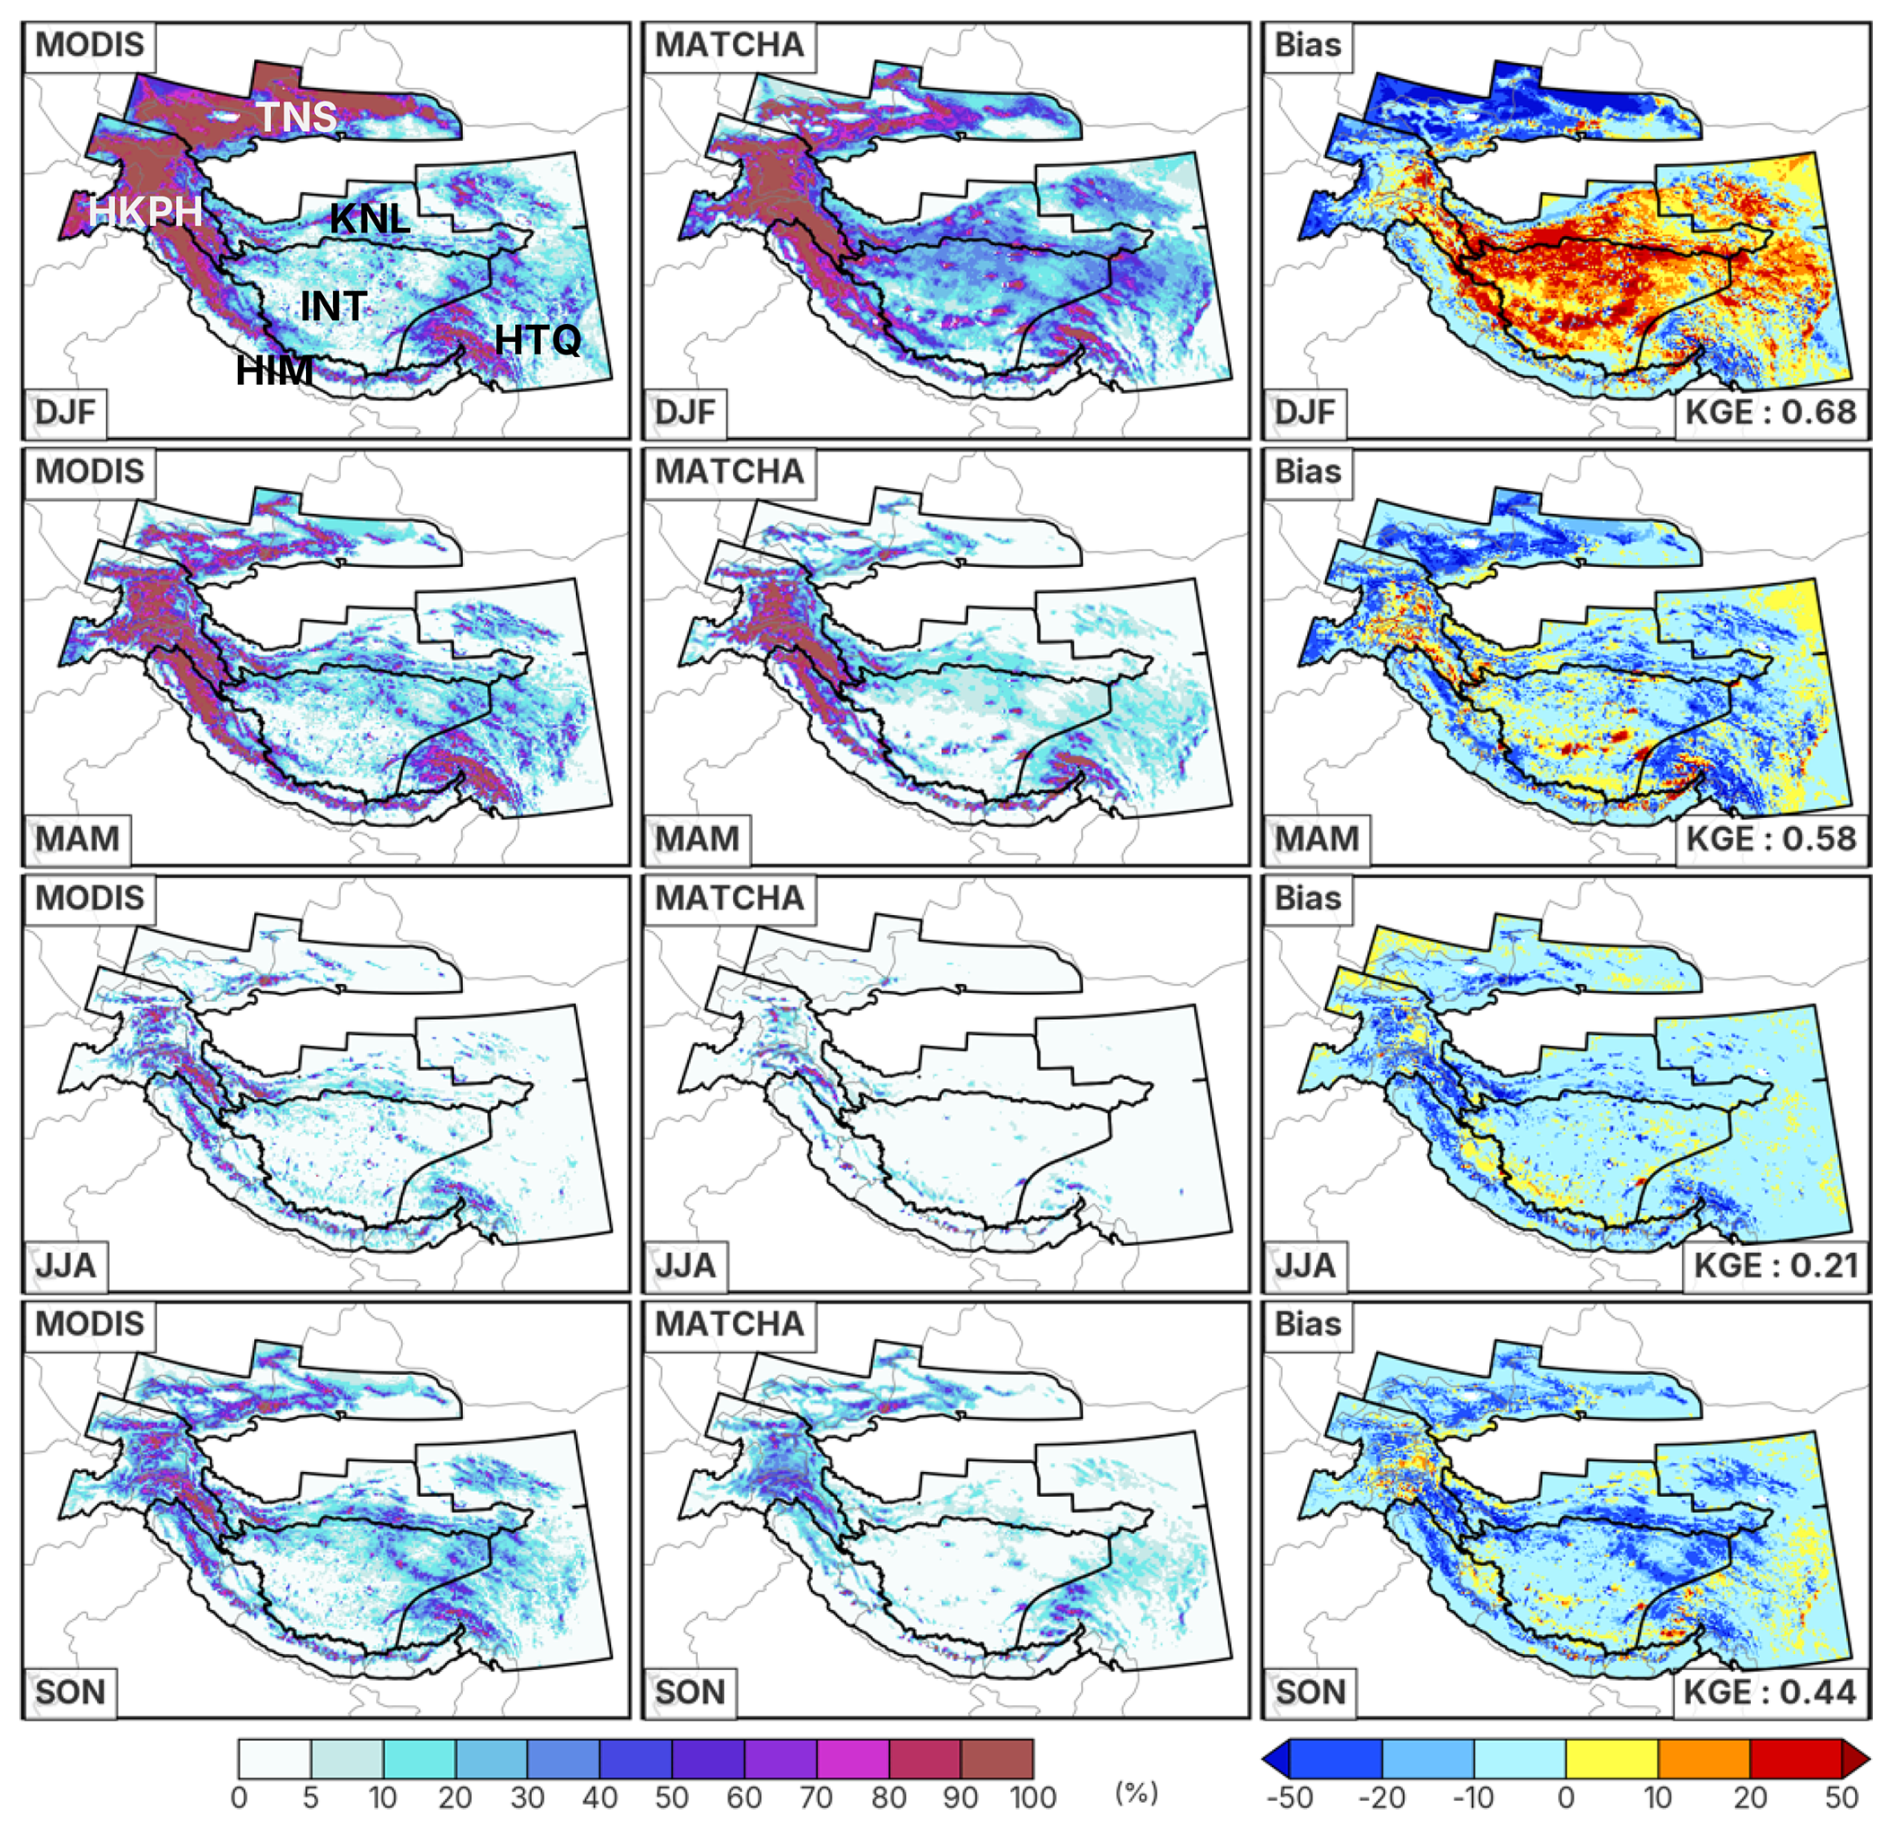
Figure 10Seasonal averages of snow cover fraction (%) during 2003–2018 for the six aggregated first-order glacier regions of HMA from RGI v6 (INT: Inner Tibet, S and E Tibet; HTQ: Hengduan Shan, Qilian Shan; TNS: W and E Tien Shan; KNL: W and E Kun Lun; HIM: W, C, and E Himalayas, HKPH: Hindu Kush, Karakoram, Pamir, and Hissar Alay). The spatial averages are shown for MODIS (left column), for MATCHA (middle column), and the associated model bias (MATCHA-MODIS, right column).
3.3 Atmospheric Composition
3.3.1 AOD and SSA at 550 nm
We compare mean daily AOD550 across seasons as shown in Fig. 11. MATCHA successfully captures the overall spatial patterns observed in AERONET, including consistently low values over the Tibetan Plateau, the Gobi and Taklamakan deserts, and the higher values over the Indian subcontinent due to pollution hotspots across all seasons except in summer, where the positive biases are the highest (> 0.5). The seasonal cycle is also captured well, with AOD550 peaking in summer and declining during fall. A consistent negative bias is seen in spring, transitioning to a strong positive bias in southeast Asia and over India during summer. Over eastern China, the bias remains consistently positive during winter and spring and turns generally negative post-spring. Domain-wide metrics (Table 4) show a positive bias in all seasons, peaking in winter (MB of 0.2) with a slight negative bias in spring (MB of −0.01). RMSE values lie between 0.2 to 0.6, with the highest RMSE in winter (0.4) and the lowest in spring (0.2). Correlation values are highest in fall (0.7) and lowest in winter (0.5), with KGE values ranging between 0.7 in spring to 0.2 in summer, suggesting good agreement between MATCHA and AERONET values, with the best (worst) performance in spring (summer). Previous studies comparing AOD550 from AERONET across several reanalysis products have highlighted similar model biases over Asia, with bias values around 0.1–0.2 and RMSE values exceeding 0.2 for polluted regions, which is in line with our evaluation (Ansari and Ramachandran, 2024; Gueymard and Yang, 2020; Singh et al., 2017; Xian et al., 2024). These studies have also highlighted the fact that AOD550 biases over Asia are higher than in other regions of the globe. In addition to the magnitude of AOD550, we also look at the monthly climatology of AOD550 as seen from AERONET and MATCHA in Fig. A8, where we visualize the median AOD550 across months for sites grouped by tagged-tracer regions within MATCHA. While the seasonality and variability of AOD550 are captured at most sites, especially in China, we see major discrepancies during summer months among sites over India and Nepal. Similar discrepancies can be seen for Bangladesh, Myanmar, and southeast Asia, where AOD550 is much higher in the model during summer months than in AERONET. This highlights issues in the model regarding wet scavenging and deposition during the Asian monsoon, as well as convective transport to high-elevation regions, which leads to the higher bias during the summer months.
Table 4Evaluation metrics for all variables related to atmospheric composition from MATCHA evaluated in this study across four seasons.
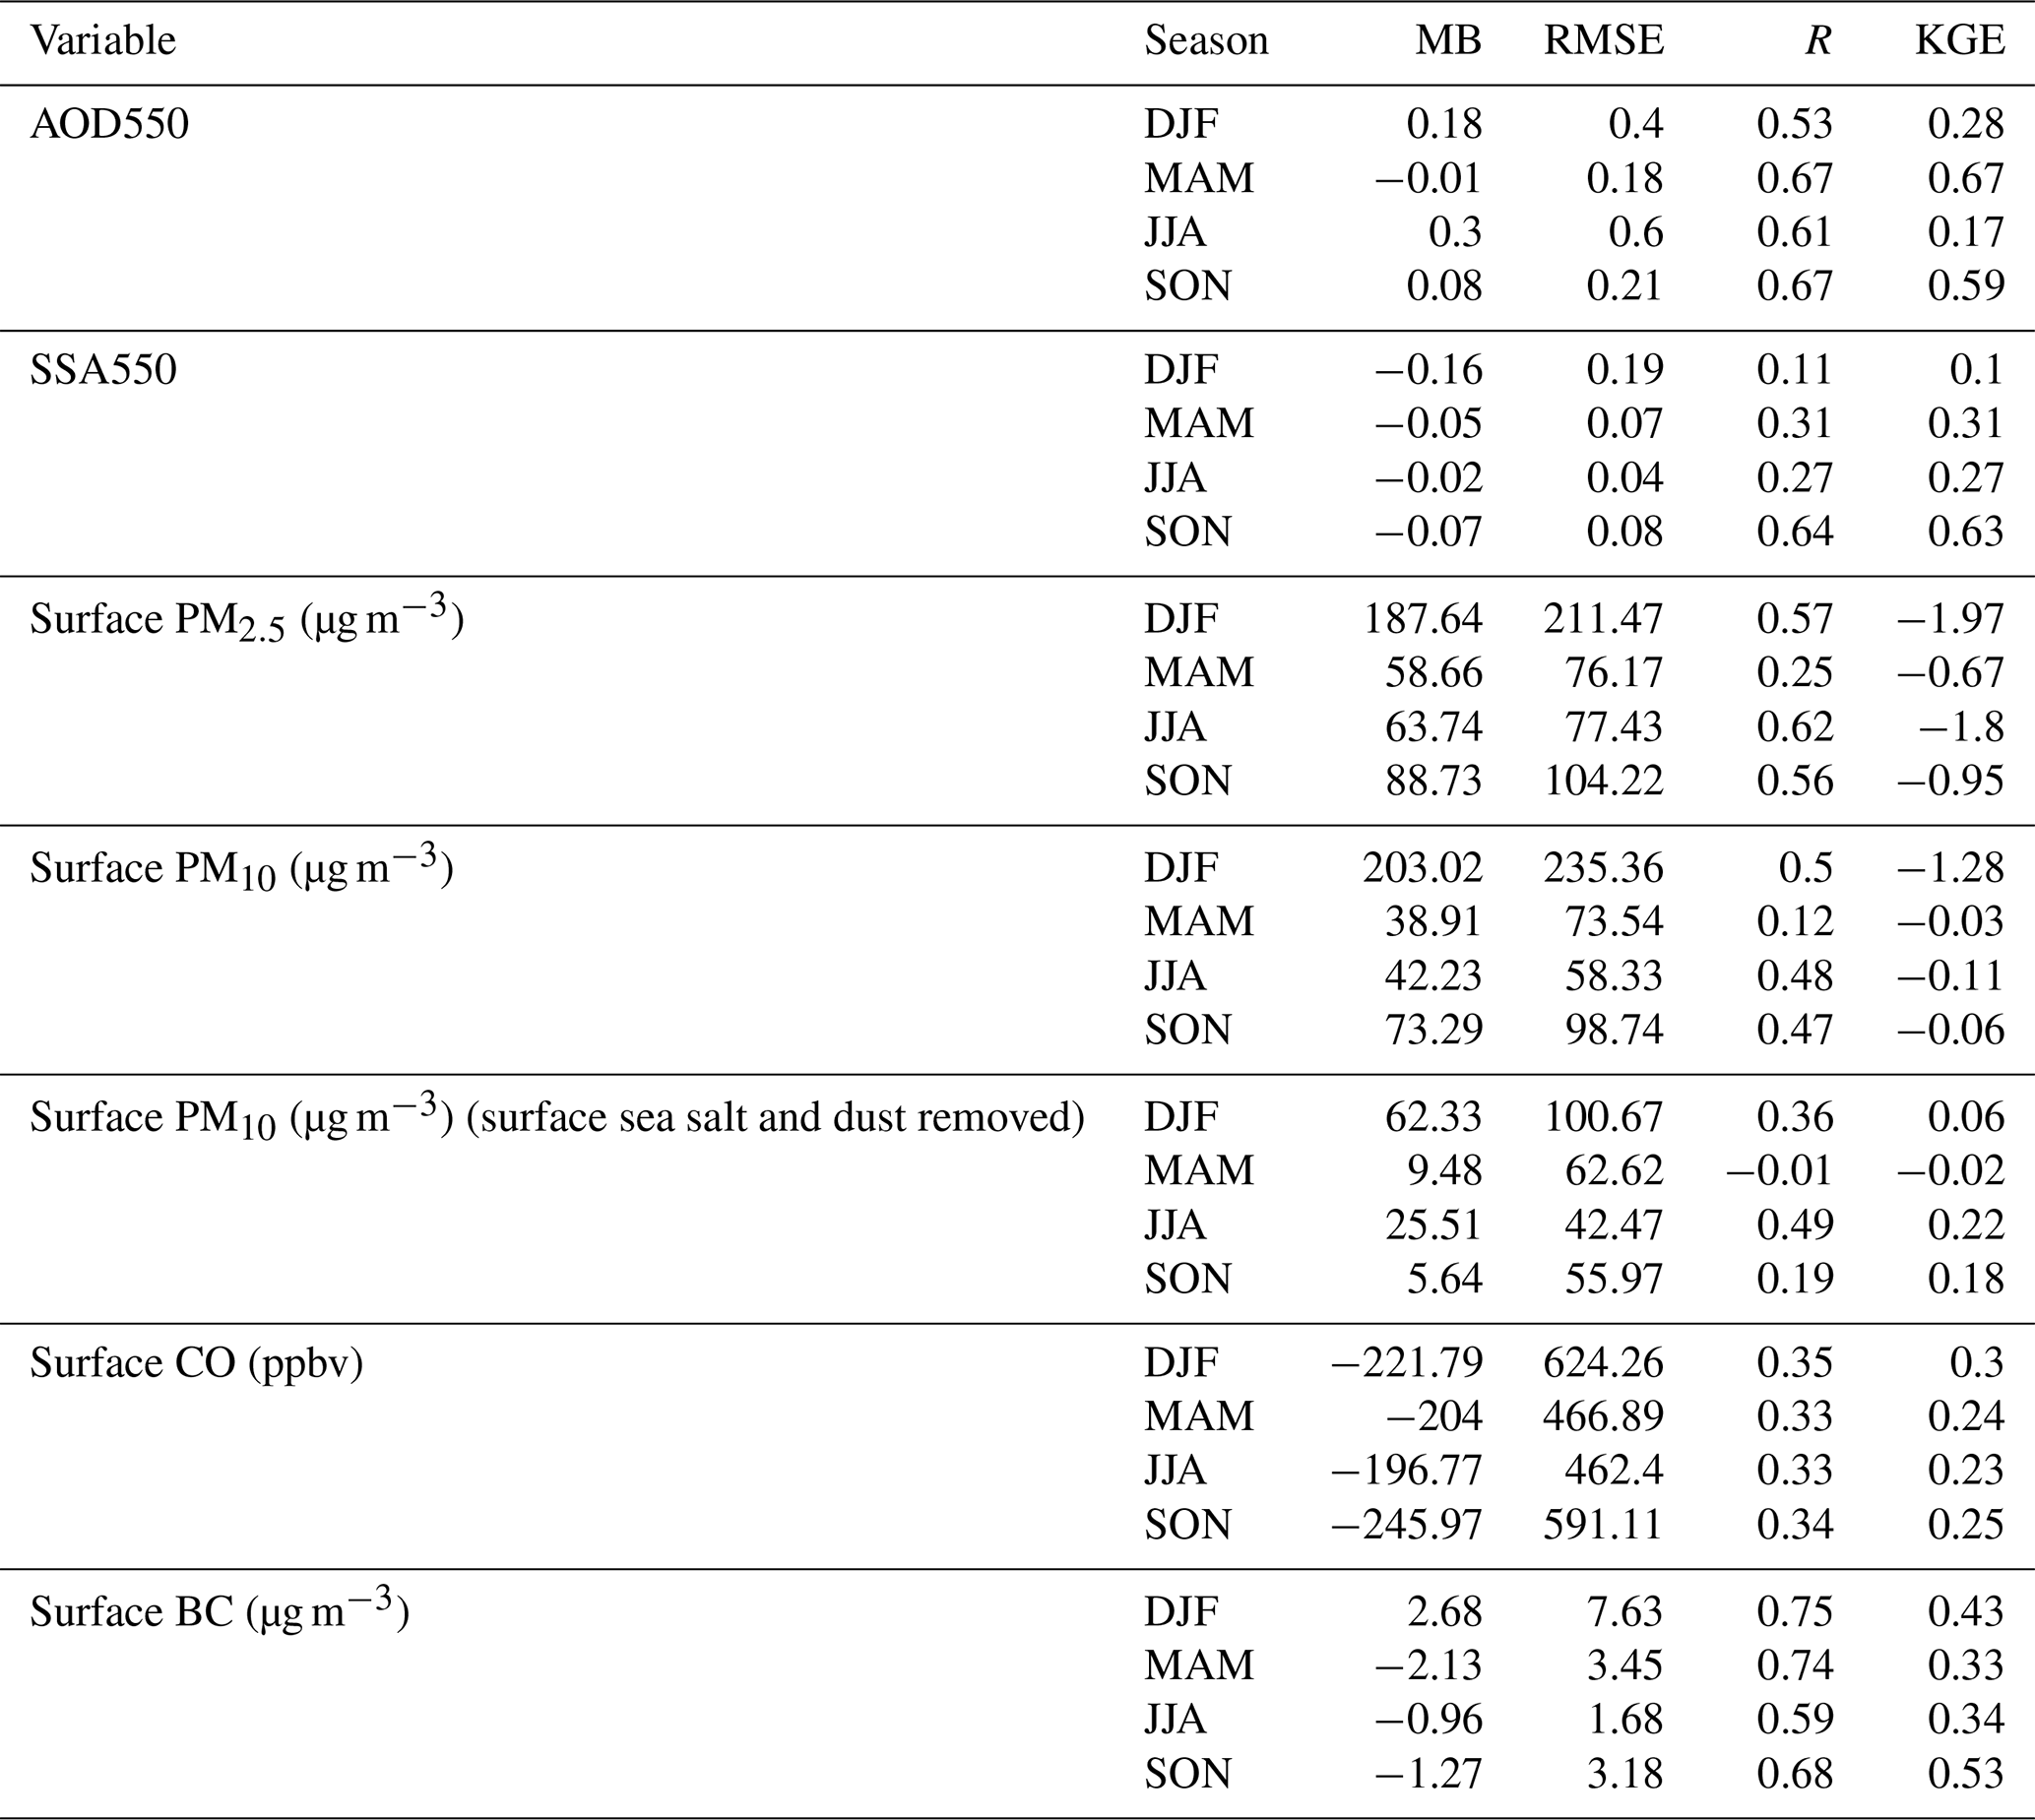
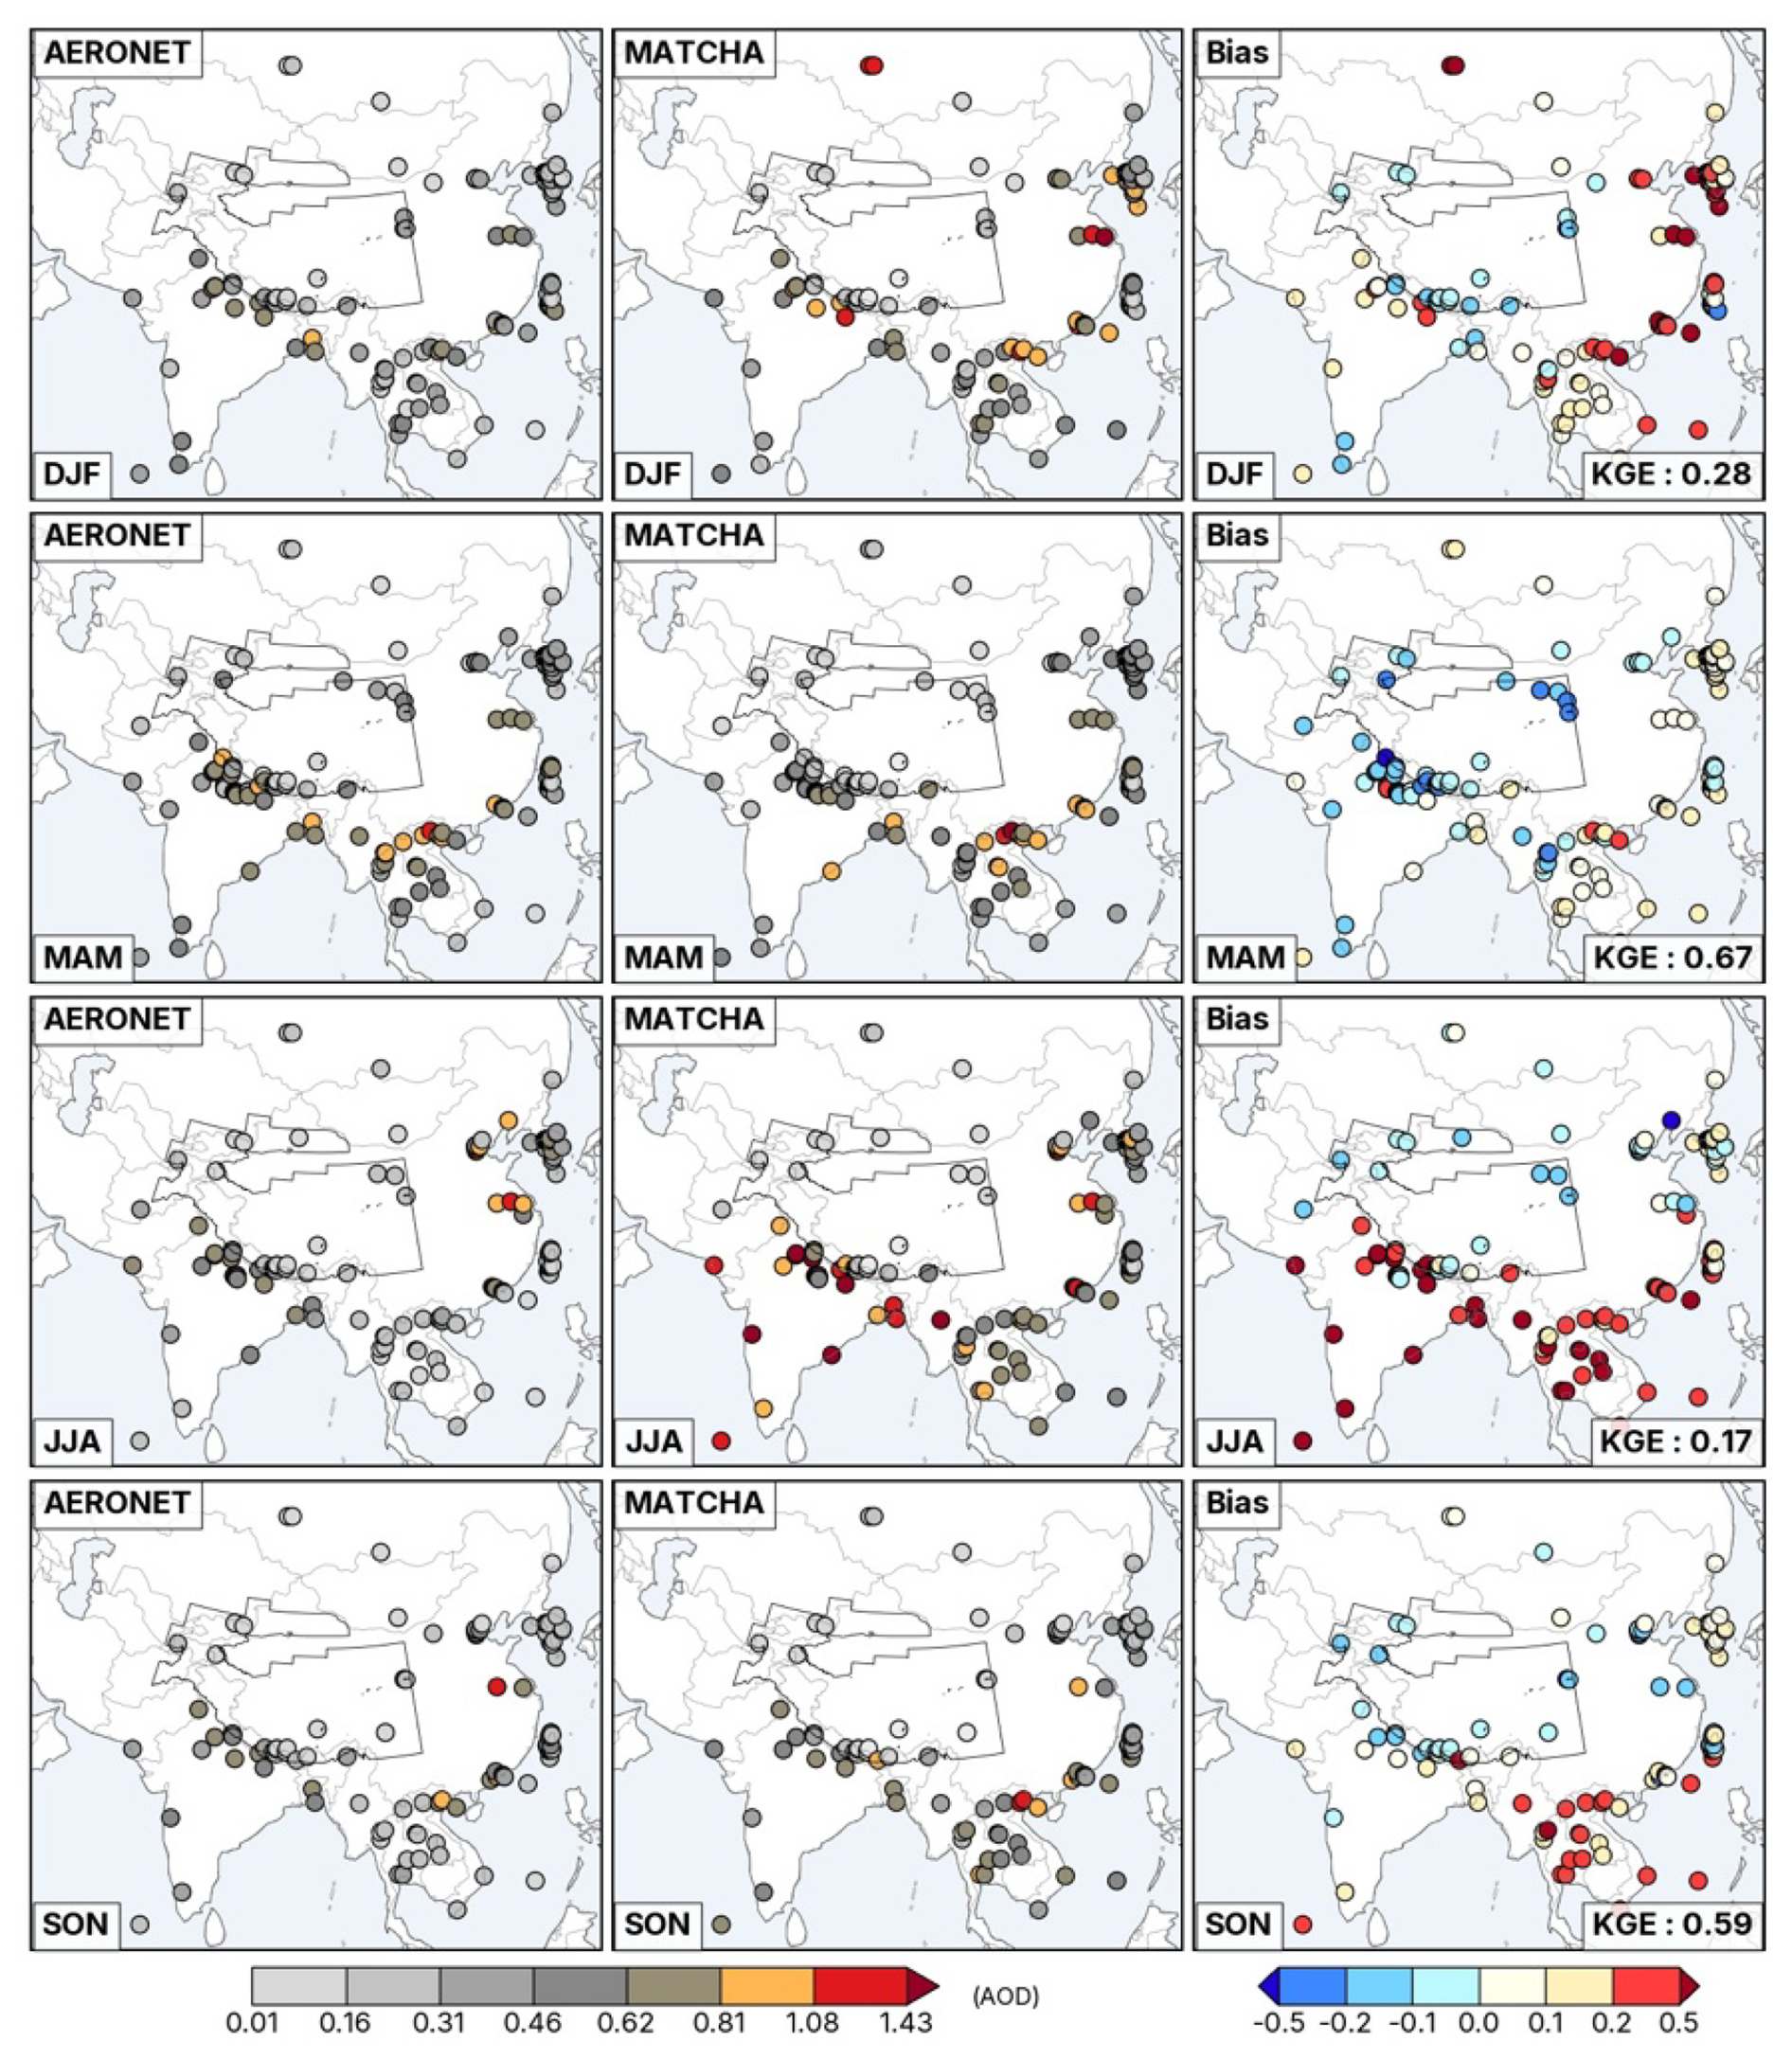
Figure 11Seasonal averages of AOD at 550 nm (unitless) from AERONET sites (circles) across the domain (left column), MATCHA (middle), and the associated model bias (MATCHA-Observations, right column).
We also evaluated SSA550 from AERONET and MATCHA simulations in Fig. 12 to assess the relative contributions of scattering and absorbing aerosols represented in MATCHA. MATCHA generally underestimates SSA550 across the domain, indicating a higher fraction of absorbing aerosols in its simulations compared to AERONET. The negative bias in SSA550 peaks at −0.1 during winter and fall over most regions except in summer, where there is a slight positive bias (0.05) over India and southeast Asia, suggesting the influence of marine aerosols (which are scattering in nature) during monsoon. The seasonality of SSA550 is also captured in MATCHA as seen by the peak SSA550 (> 0.93) in summer, with the lowest SSA550 in winter (∼ 0.65). Across the domain, a negative bias is seen across all seasons that peaks in winter (−0.2) and is lowest in summer (−0.02). RMSE values are highest in winter (0.2) and lowest in summer (0.04) as well. Correlation and KGE values are relatively low, except in fall (R of 0.6), suggesting relatively strong agreement. These results suggest that while MATCHA captures the optical properties post-spring, it struggles particularly in winter. The negative SSA550 bias across the domain indicates more absorbing aerosols simulated within MATCHA, which, when deposited on snow via the SNICAR module, darken the surface and accelerate snowmelt and can help drive the negative SCF bias observed in MATCHA (Sect. 3.2.3).
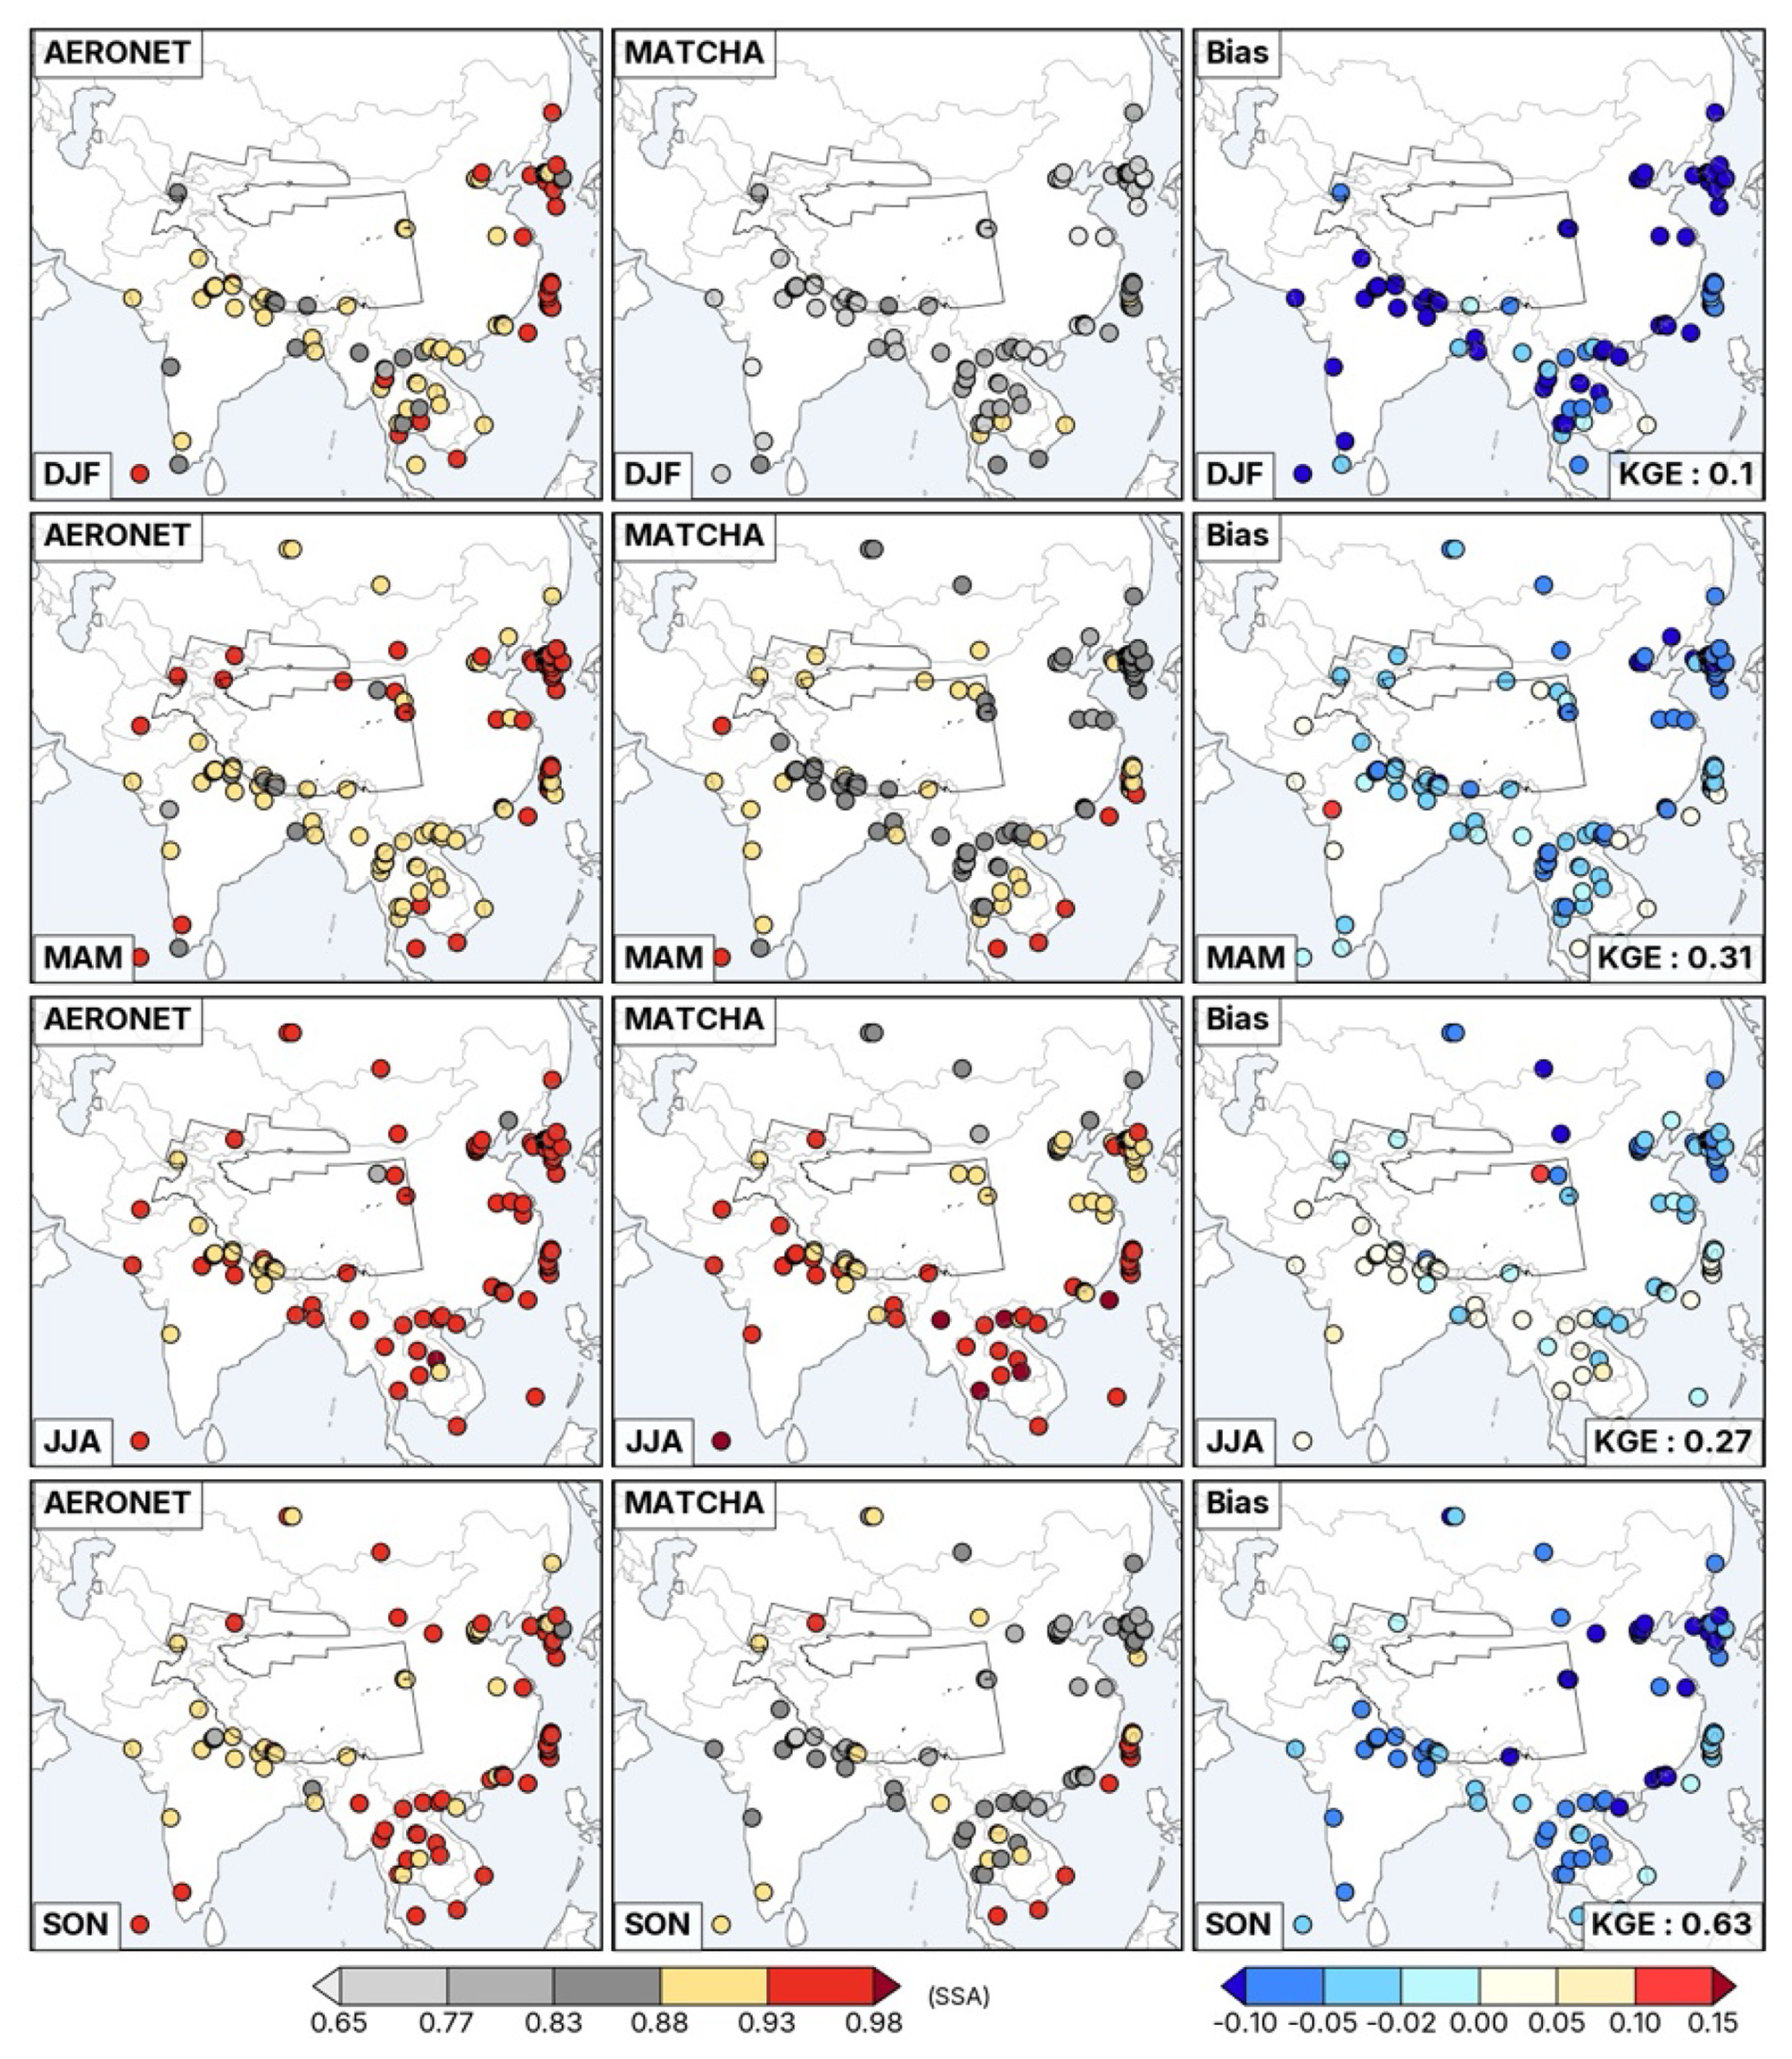
Figure 12Seasonal averages of SSA at 550 nm (unitless) from AERONET sites across the domain (left column), from MATCHA (middle), and the associated model bias (MATCHA-AERONET, right column).
Uncertainties in SSA550 in previous studies across WRF-Chem and other reanalyses have been reported to be up to 0.05, in contrast with the biases in MATCHA particularly for winter, suggesting differences in atmospheric composition within the model that can arise due to the emission inputs, and model parameterization related to deposition schemes and transport within the model. Biases in SSA within models often arise from physical and chemical assumptions related to aerosol composition and treatment. Internal mixing of absorbing particles (e.g., BC with sulphate), as employed in the MOSAIC aerosol model, tends to increase absorption, thereby lowering SSA values. Studies have shown that accounting for proper mixing state, refractive index, and including brown carbon and realistic dust size distributions can reduce SSA biases. Others report SSA underestimations in polluted regions, largely driven by emissions that overestimate absorbing aerosols inventories or the underestimation of scattering from hygroscopic growth (Dong et al., 2023).
3.3.2 PM2.5, PM10, and CO surface measurements
Figure 13 shows the spatial distribution of seasonally averaged surface PM2.5 mass concentrations from OpenAQ observations and MATCHA simulations. While MATCHA reproduces PM2.5 seasonality in general, it diverges in magnitude, with pronounced regional differences. OpenAQ observations show the highest PM2.5 concentrations during winter, followed by a decline in spring, the lowest levels in summer, and a rebound in fall. MATCHA captures this seasonal pattern over China but deviates over India, where it successfully simulates the fall-to-winter increase and the winter-to-spring decrease but inaccurately predicts an increase from spring to summer, contrary to the observed decline. MATCHA exhibits large positive biases over eastern China across all seasons, peaking in winter (> 107 µg m−3) and reaching a minimum in summer (< 62 µg m−3). In contrast, MATCHA consistently underestimates PM2.5 over western China and HMA, with negative biases exceeding −6 µg m−3 throughout the year. Over India, biases are predominantly positive across all seasons, with the smallest deviations observed in spring and fall (within ±62 µg m−3). These discrepancies point to uncertainties in emission inventories and limitations in MATCHA's representation of transport, transformation, and deposition processes, particularly in regions with complex topography.
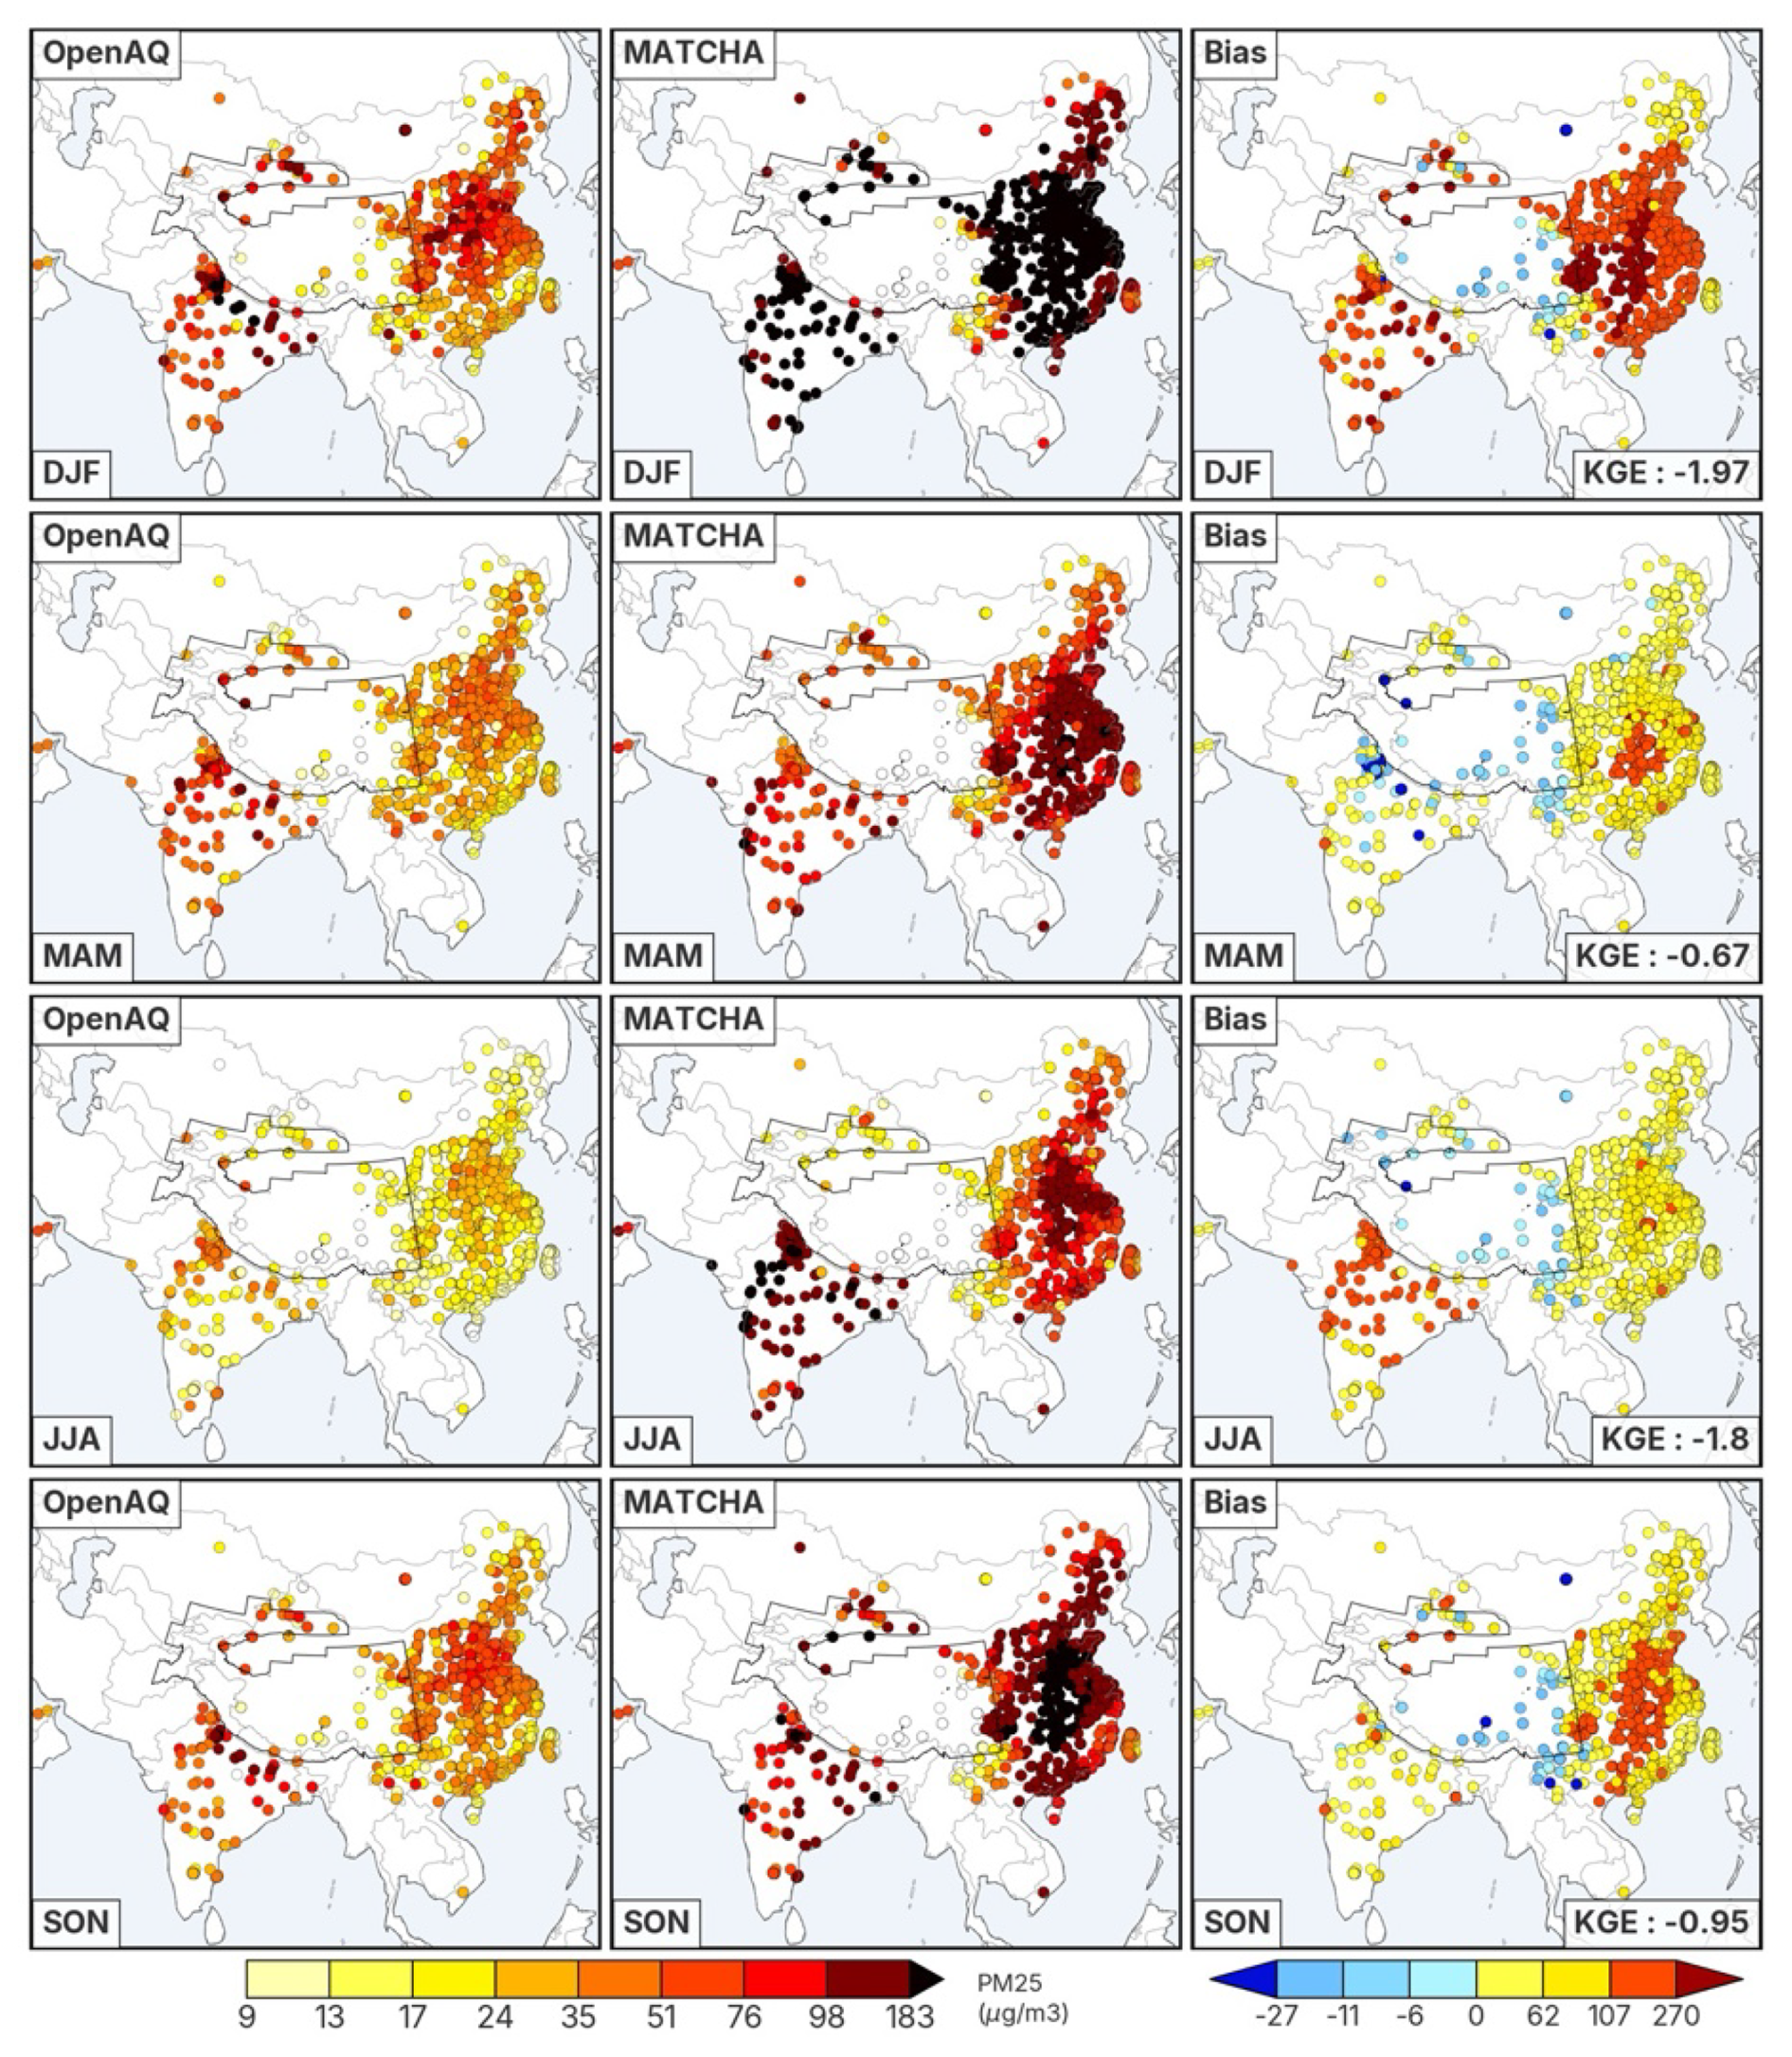
Figure 13Seasonal averages of surface PM2.5 (in µg m−3) across the domain from OpenAQ (left column), MATCHA (middle), and the associated model bias (MATCHA-OpenAQ, right column).
4 Across the domain (see Table 2), the positive bias is highest in winter (188 µg m−3), while the lowest is in spring (59 µg m−3). RMSE values are also substantial, peaking in winter (212 µg m−3) and reaching their lowest in both spring and summer (77 µg m−3). The significant RMSE values indicate marked seasonal variability, particularly in spring and summer, where similar mean biases (∼ 61 µg m−3) and RMSE values are seen (117 µg m−3 in spring versus 94 µg m−3 in summer). Correlation values across the domain are moderate (∼ 0.5–0.6) except in spring (R of 0.2), while KGE values are negative, reflecting limited agreement between MATCHA simulations and observed PM2.5 concentrations. The KGE values suggest that MATCHA performs best during the transition seasons and struggles particularly in winter.
To investigate the processes contributing to the positive biases in surface PM2.5, we analyzed the contributions of various aerosol species to surface PM2.5 mass concentrations across the model domain. Additional analyses using the MATCHA dataset revealed several potential causes for these strong positive biases:
-
Elevated near-surface wind speeds along the Arabian Sea coastline, as seen in MATCHA, contribute to higher concentrations of surface sea salt and dust aerosols. An overestimation of near-surface winds (see Sect. 3.1.3) impacts the sea salt parameterization scheme within MATCHA based on (Gong et al., 1997), which strongly depends on 10 m wind speeds. Previous studies have demonstrated the overestimation of sea salt emissions from models based on this parameterization (Chen et al., 2016; Neumann et al., 2016; Saide et al., 2012). Section 3.1.3 highlights a positive bias in 10 m wind speeds, which aligns with this observation. Figure A4 shows the spatial distribution of sodium and chloride (components of sea salt) across four seasons, alongside average 10 m wind speeds. During summer, average wind speeds exceed 4 m s−1 along the western coast of the Indian subcontinent, transporting marine aerosols from the Arabian Sea to inland regions. Consequently, high concentrations of sodium and chloride are simulated in summer, exceeding 51 µg m−3.
-
Over the arid desert regions along the western edge of the domain, MATCHA overestimates surface dust and, in turn, PM2.5 and PM10 (Fig. A5). The GOCART dust emission scheme (Ginoux et al., 2001) used in the model setup of MATCHA combines a high prescribed erodibility over these regions with a low soil-moisture-dependent threshold, producing strong emission even under moderate winds, a behavior linked to dust and PM overestimation in WRF-Chem over the arid regions of southwest Asia (Parajuli et al., 2019). The emitted mass is also redistributed from the GOCART size sections onto the MOSAIC bins in a way that places an excessive fraction below 2.5 µm, so the overestimation also affects PM2.5 and not only PM10 (Pino-Carmona et al., 2024). Dust reaches the domain both through emissions generated within the domain and through the CAMS-EAC4 chemical boundary conditions (Table 1), which carry long-range transport from sources such as the Arabian and Thar deserts. Dust is not tagged as a tracer in MATCHA, so the two pathways cannot be partitioned quantitatively. The enhancement over the western source regions, however, is generated within the domain rather than advected through the lateral boundaries, as the concentration maximum sits several hundred kilometres inland and is co-located with the simulated emission flux. Surface dust and PM magnitudes over these western source regions should therefore be read as an upper bound.
-
Lower precipitation intensity simulated during summer, compared to observations, reduces wet scavenging efficiency, allowing aerosols to persist in the atmosphere. Precipitation totals in Fig. 7 highlight a dry bias over the Arabian Sea during summer, further supporting this underestimation. This reduced precipitation intensity limits aerosol removal, contributing to higher concentrations of marine aerosols in the region.
-
Errors in the partitioning of gas-phase NO2 into particle-phase NO3 aerosols lead to an overestimation of nitrate aerosols over India. The MOSAIC aerosol scheme used in MATCHA relies on several factors for gas-to-particle partitioning: (1) availability of hydroxyl (OH) radicals for oxidizing NO2 to HNO3, (2) high aerosol concentrations promoting HNO3 condensation, and (3) favorable conditions such as lower ambient temperatures and higher RH for HNO3-to-NO3 partitioning. Several studies have mentioned the overestimation of nitrates in models (Sha et al., 2022; Zakoura and Pandis, 2018). Figure A6 compares daily tropospheric column NO2 concentrations from MATCHA (for 2014) to satellite-based observations from the Ozone Monitoring Instrument (OMI) (Boersma et al., 2017). In summer, a distinct negative bias in tropospheric column NO2 (> 1.4 molec. cm−2) is seen over India, suggesting excessive conversion of gas-phase NO2 to nitrate aerosols, which increases PM2.5 concentrations in MATCHA.
-
The high positive biases in PM2.5 over eastern China can be attributed to discrepancies in the emission inventory. Specifically, the CAMS-GLOB-ANT inventory used in MATCHA shows emissions stabilising around 2013 rather than the steeper observed decline over China (Soulie et al., 2024; Roychoudhury et al. 2026), likely resulting in an overestimation of PM2.5 in MATCHA for this region. Our recent inversion study using the MATCHA BC tracers and 91 surface sites over HMA found prior BC (model/MATCHA) underestimated by up to fourfold over the Tibetan Plateau and Bangladesh, within ±20 % over China and India, and underestimated biomass-burning over Southeast Asia (Roychoudhury et al., 2026).
These findings highlight key limitations in the representation of marine aerosols, wet scavenging processes, gas-particle partitioning, and emission trends within the MATCHA model, each of which contributes to the positive biases in surface PM2.5.
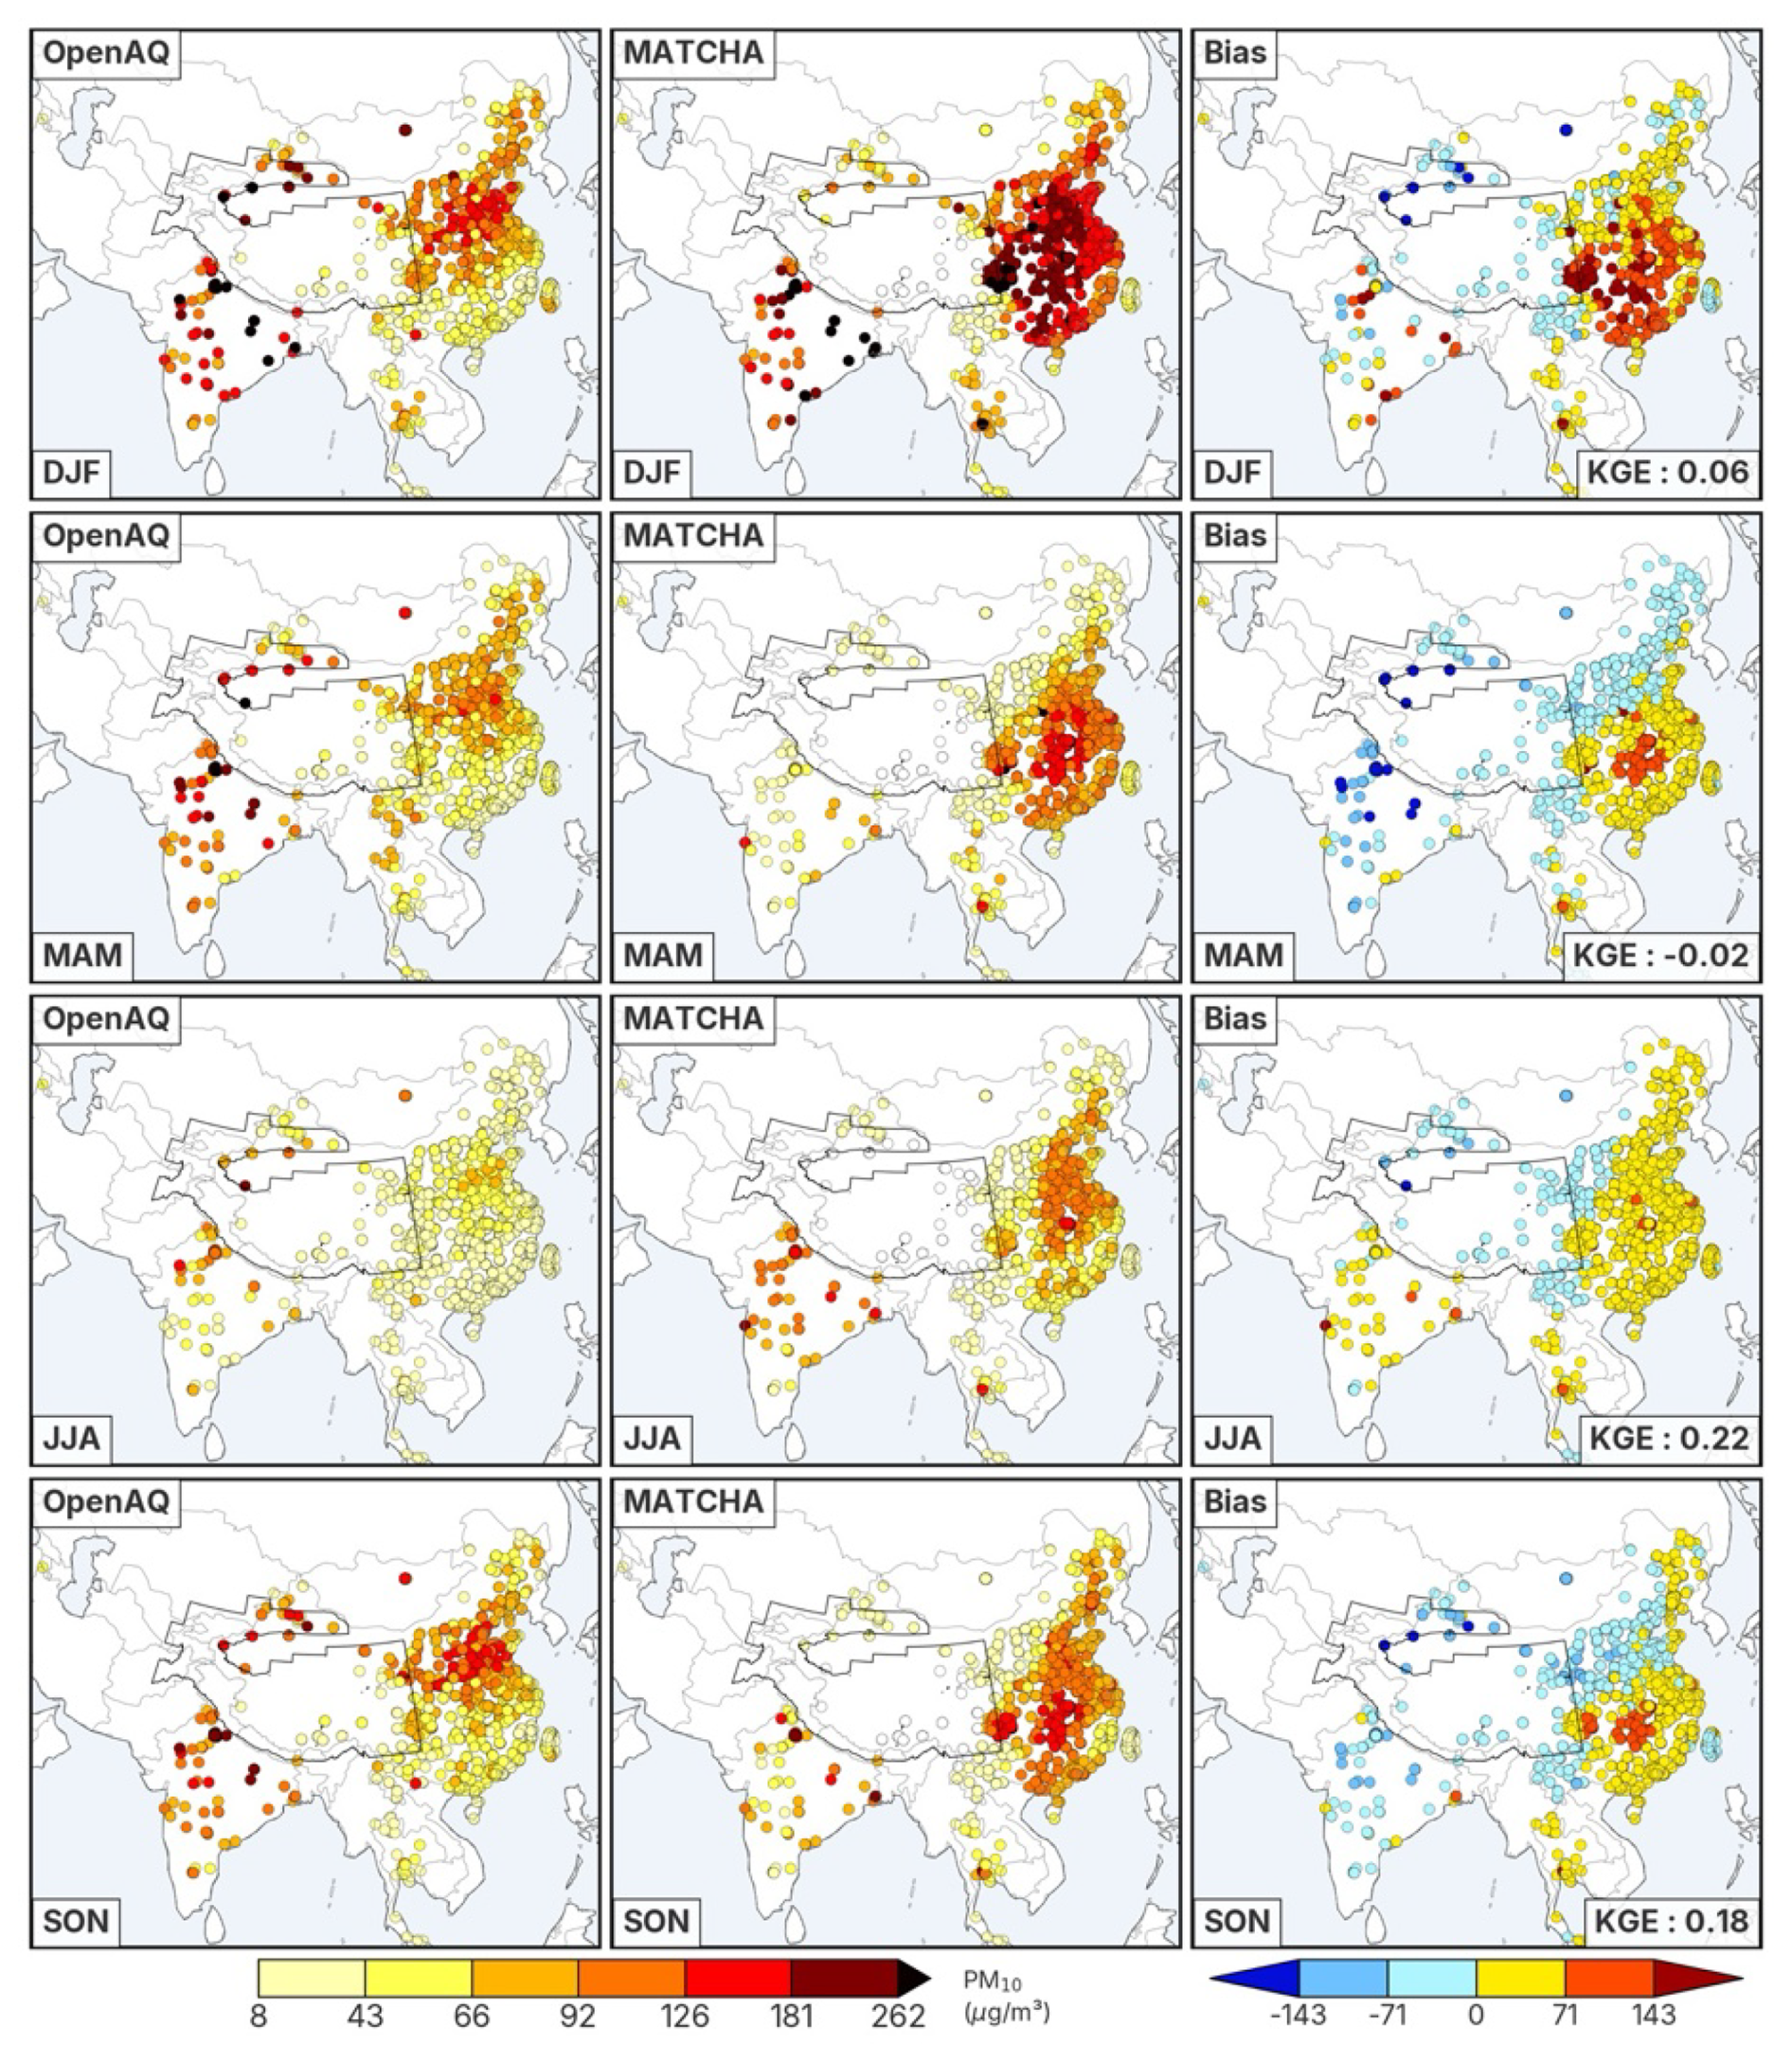
Figure 14Seasonal averages of adjusted surface PM10 (after removing surface sea salt and dust) (in µg m−3) across the domain from OpenAQ (left column), MATCHA (middle), and the associated model bias (MATCHA-OpenAQ, right column).
Similar to PM2.5, MATCHA exhibits significant biases in PM10, particularly during the summer season (Fig. 14). To understand if errors in simulations of natural aerosols are the primary contributors to biases in PM10, we recalculated the mean bias in PM10 by removing the contributions of these species from MATCHA simulations, as shown in Fig. 14 and the domain-wide statistics in Table 4. As in PM2.5, the seasonality of PM10 concentrations is consistent between OpenAQ observations and MATCHA. After removing sea salt and dust that are overestimated by MATCHA (Table 4), the mean bias in winter decreases substantially from 203 to 62 µg m−3, and in spring, the bias reduces from 39 µg m−3 to just 9 µg m−3. Overall, removing sea salt and dust improves the mean bias, with the largest reduction observed during winter. When expressed as the difference between the total and adjusted domain-mean bias (Table 4), sea salt and dust together contribute 141, 29, 17, and 68 µg m−3 to the PM10 bias in winter, spring, summer, and fall. The seasonal maps for total (unadjusted) PM10 are shown in Fig. A5 for comparison with the adjusted fields in Fig. 14. The contrast is most visible over India in summer and eastern China in winter, where sea salt and dust account for most of the positive bias. Despite this adjustment, MATCHA still shows a consistent positive bias, particularly in winter, indicating an important contribution of error in anthropogenic emissions to the overestimation of PM10 by MATCHA. Compared to PM2.5, the strong positive wintertime bias in PM10 is more localized, primarily observed over eastern China, while PM2.5 biases are prominent over both India and China. For the adjusted surface PM10 concentrations (excluding sea salt and dust), the highest domain-wide bias occurs in winter (MB of 62 µg m−3) and the lowest in fall (MB of 6 µg m−3). RMSE values are highest in winter (100 µg m−3) and lowest in summer (42 µg m−3), highlighting greater variability in winter. Correlation values remain moderate overall, peaking in summer (R of 0.5) except in spring (R of −0.01). KGE values suggest the best model agreement of the adjusted PM10 values in summer and fall. If sea salt and dust are not removed, the positive biases increase substantially, particularly in winter (from 62 to 203 µg m−3) and fall (from 6 to 73 µg m−3), further emphasizing the contribution of these species to the observed overestimation in MATCHA.
Surface CO, in contrast, is consistently underestimated by MATCHA across all seasons, although the biases are smaller compared to PM2.5 and PM10. In winter, high surface CO concentrations are observed over the Indo-Gangetic Plain and eastern China in both OpenAQ and MATCHA (Fig. 15). MATCHA exhibits strong seasonality in surface CO, similar to OpenAQ, albeit with a negative bias persistent across the domain and all seasons. The domain-wide smallest negative biases occur in summer (MB of −197 ppbv), while the largest is seen in fall (MB = −246 ppbv). Correlation values for CO are consistently moderate across seasons (R of 0.3–0.4), with the highest correlation in winter (R of 0.35). KGE values suggest similar moderate agreement across the seasons (0.2–0.3), with the best performance during winter (KGE of 0.3). The persistent negative bias across all seasons is likely due to constraints imposed by the daily data assimilation (DA) system used in MATCHA. MOPITT has limited sensitivity to near-surface CO and constrains mainly the mid- and free troposphere (Deeter et al., 2022; Jiang et al., 2015), so the analysis weakly constrains the surface CO, bringing its magnitude below the in-situ OpenAQ values (Hooghiemstra et al., 2012). Underestimated regional surface CO emissions over India and China likely contribute as a secondary factor (Gaubert et al., 2020; Ojha et al., 2016).
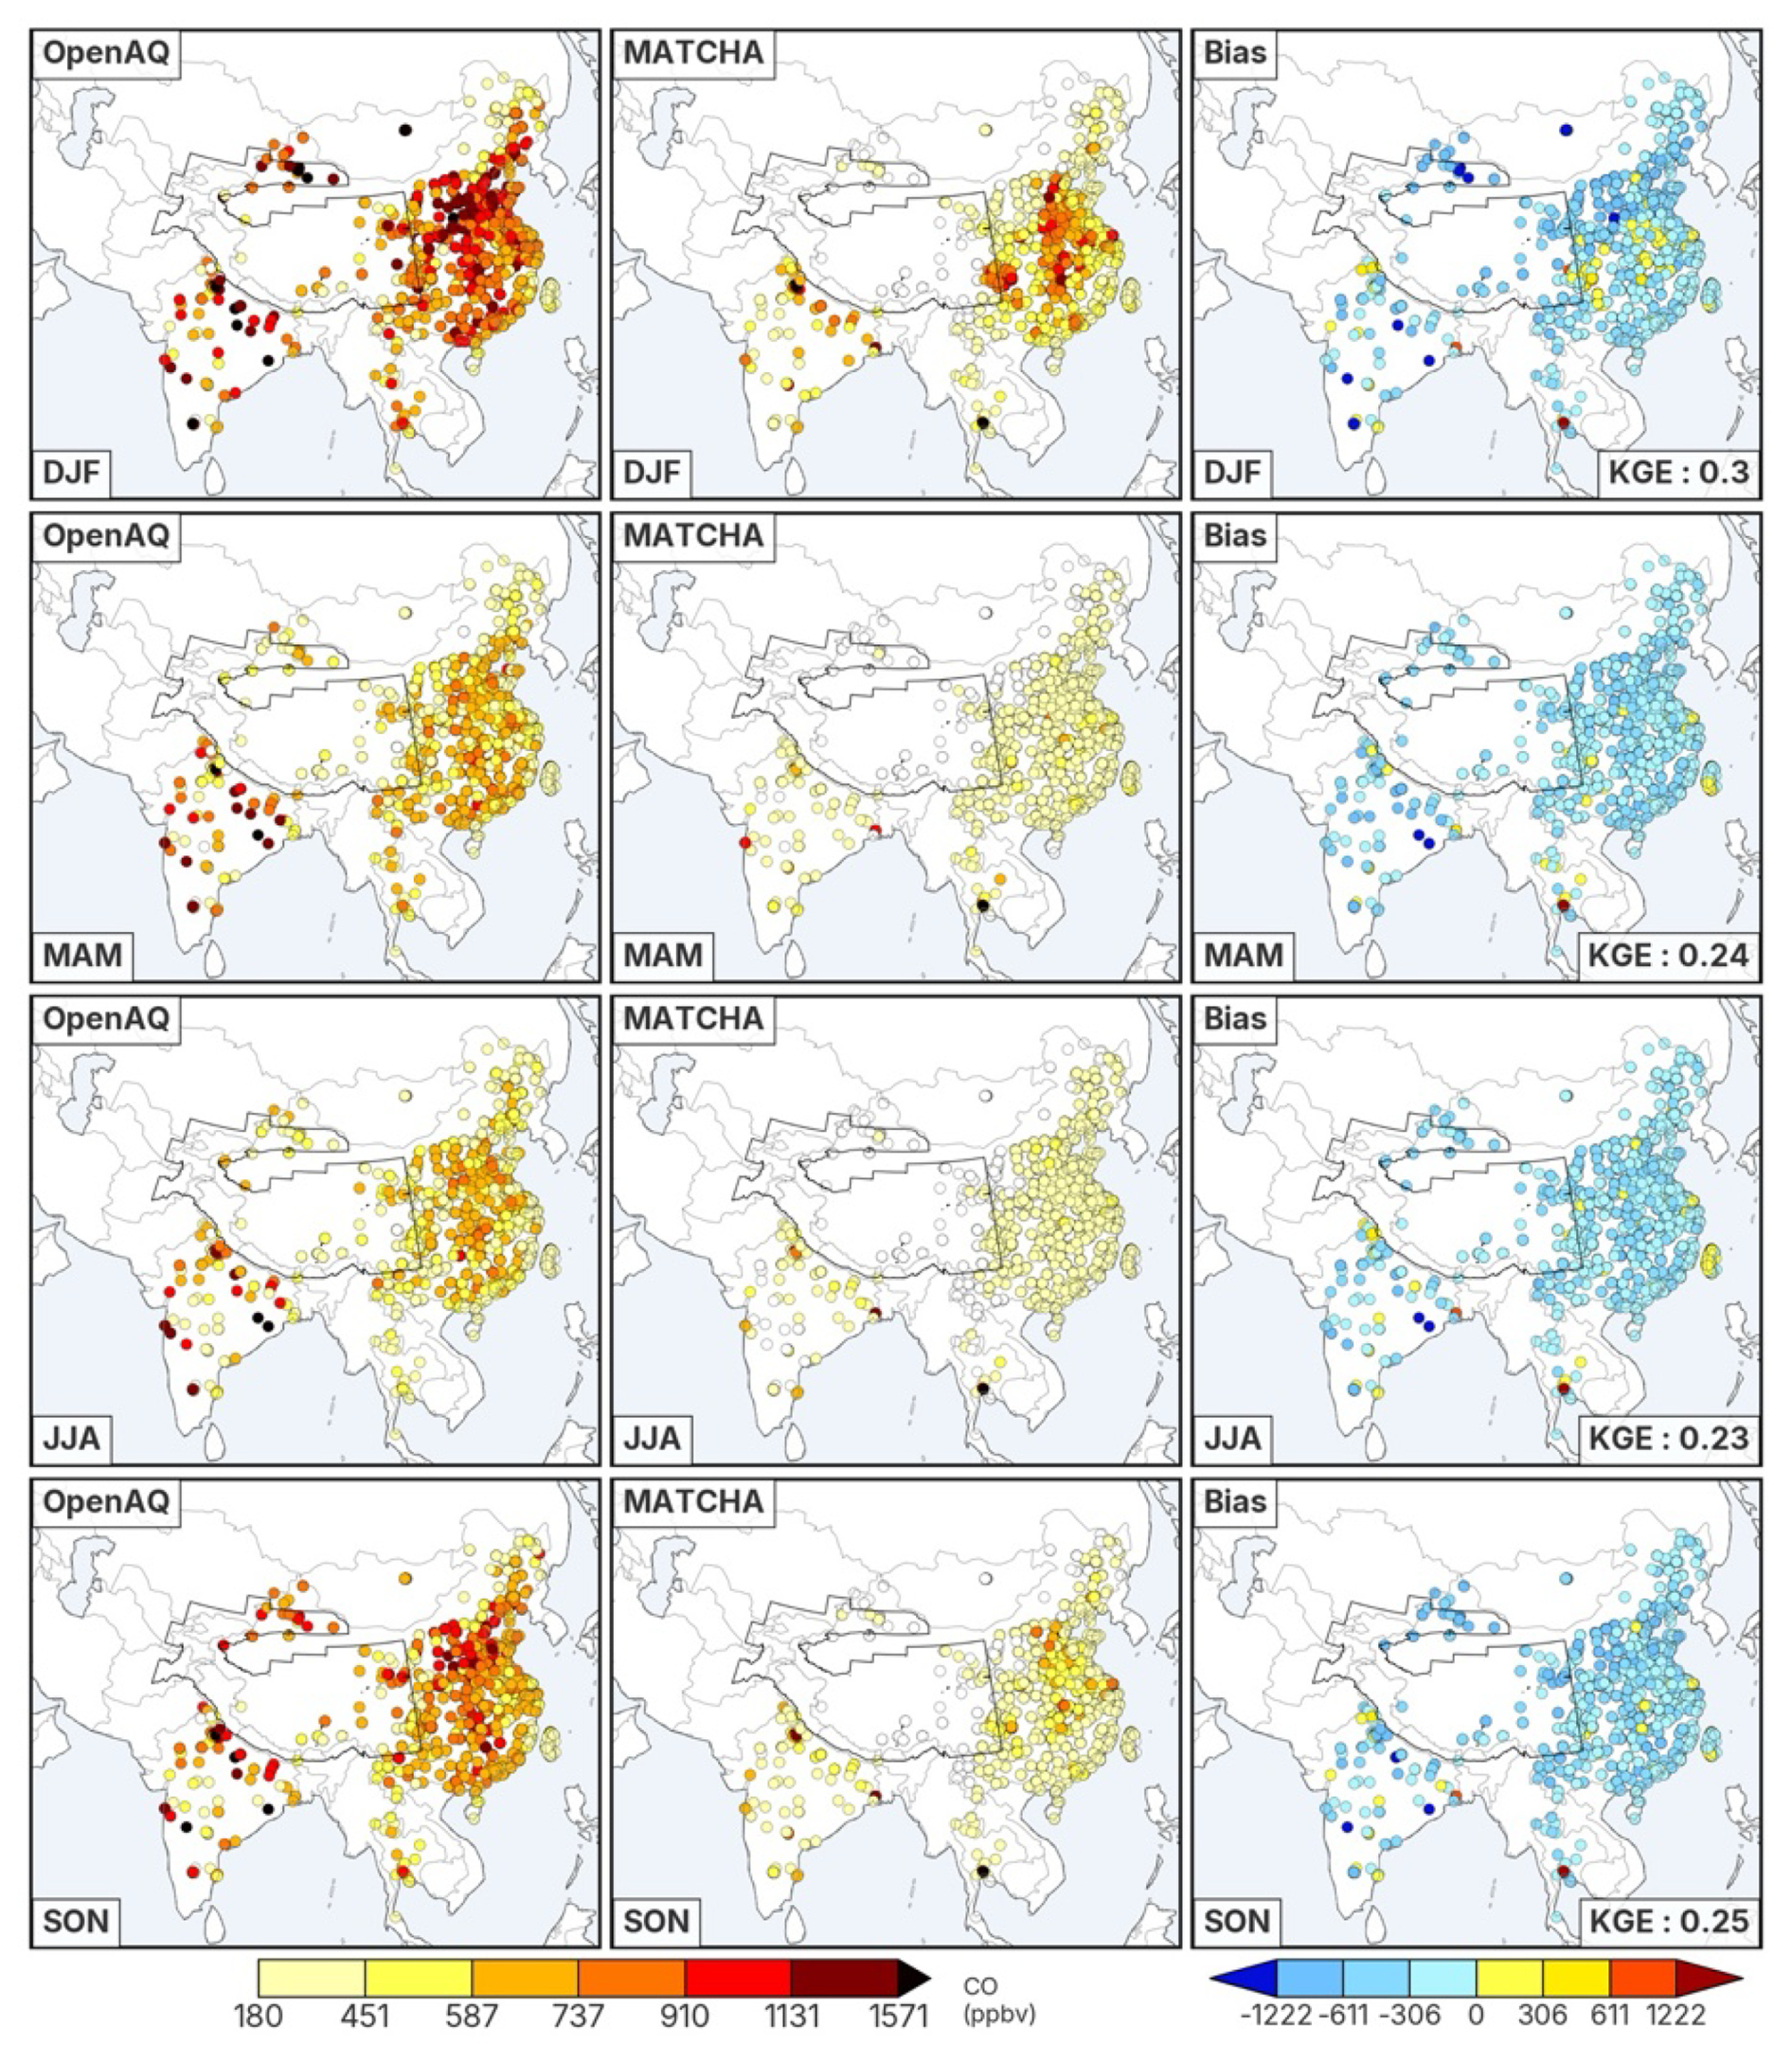
Figure 15Seasonal mean of surface CO (in ppbv) across the domain from OpenAQ (left column), MATCHA (middle), and the associated model bias (MATCHA-OpenAQ, right column).
3.3.3 Surface BC
Atmospheric black carbon (BC) abundances near the surface are evaluated in Fig. 16. MATCHA shows a strong overestimate of surface BC concentrations over India during winter, while underestimates are observed in most other seasons. Both observations and model simulations exhibit strong seasonality in BC abundances. Higher-elevation regions, such as the Tibetan Plateau and the Himalayas, consistently show underestimation by the model across all seasons, whereas urban areas at lower elevations exhibit weak positive biases. This spatial pattern of the biases and reproduction of the BC seasonal cycle by MATCHA suggests that the elevated PM burden previously noted in MATCHA is primarily driven by natural aerosol emissions (e.g., sea salt and dust) rather than anthropogenic sources such as BC. Across the domain, the biases in MATCHA are negative across all seasons except in winter, where the bias is positive and highest (MB of 3 µg m−3). Winter also exhibits the highest RMSE (8 µg m−3), reflecting significant variability in BC concentrations. This is also suggested by the positive bias in PM10 observed in Fig. 14 (Sect. 3.3.2) after removing the contribution of natural aerosols to the total PM10 burden. The largest negative bias occurs in spring (MB = −2 µg m−3), while summer shows the lowest bias (−1 µg m−3) and RMSE (2 µg m−3). Correlations between MATCHA and observations are relatively strong across all seasons (0.6–0.7), with the highest correlation observed in spring and winter (R of 0.75), while the lowest is in summer (R of 0.6). KGE values indicate consistent performance across all seasons, with the best agreement in fall (0.5) followed by winter (0.4). These results indicate that while MATCHA captures the general spatial and seasonal trends of BC, it struggles to accurately represent BC abundances in some regions, particularly over India during winter and in high-altitude regions throughout the year.
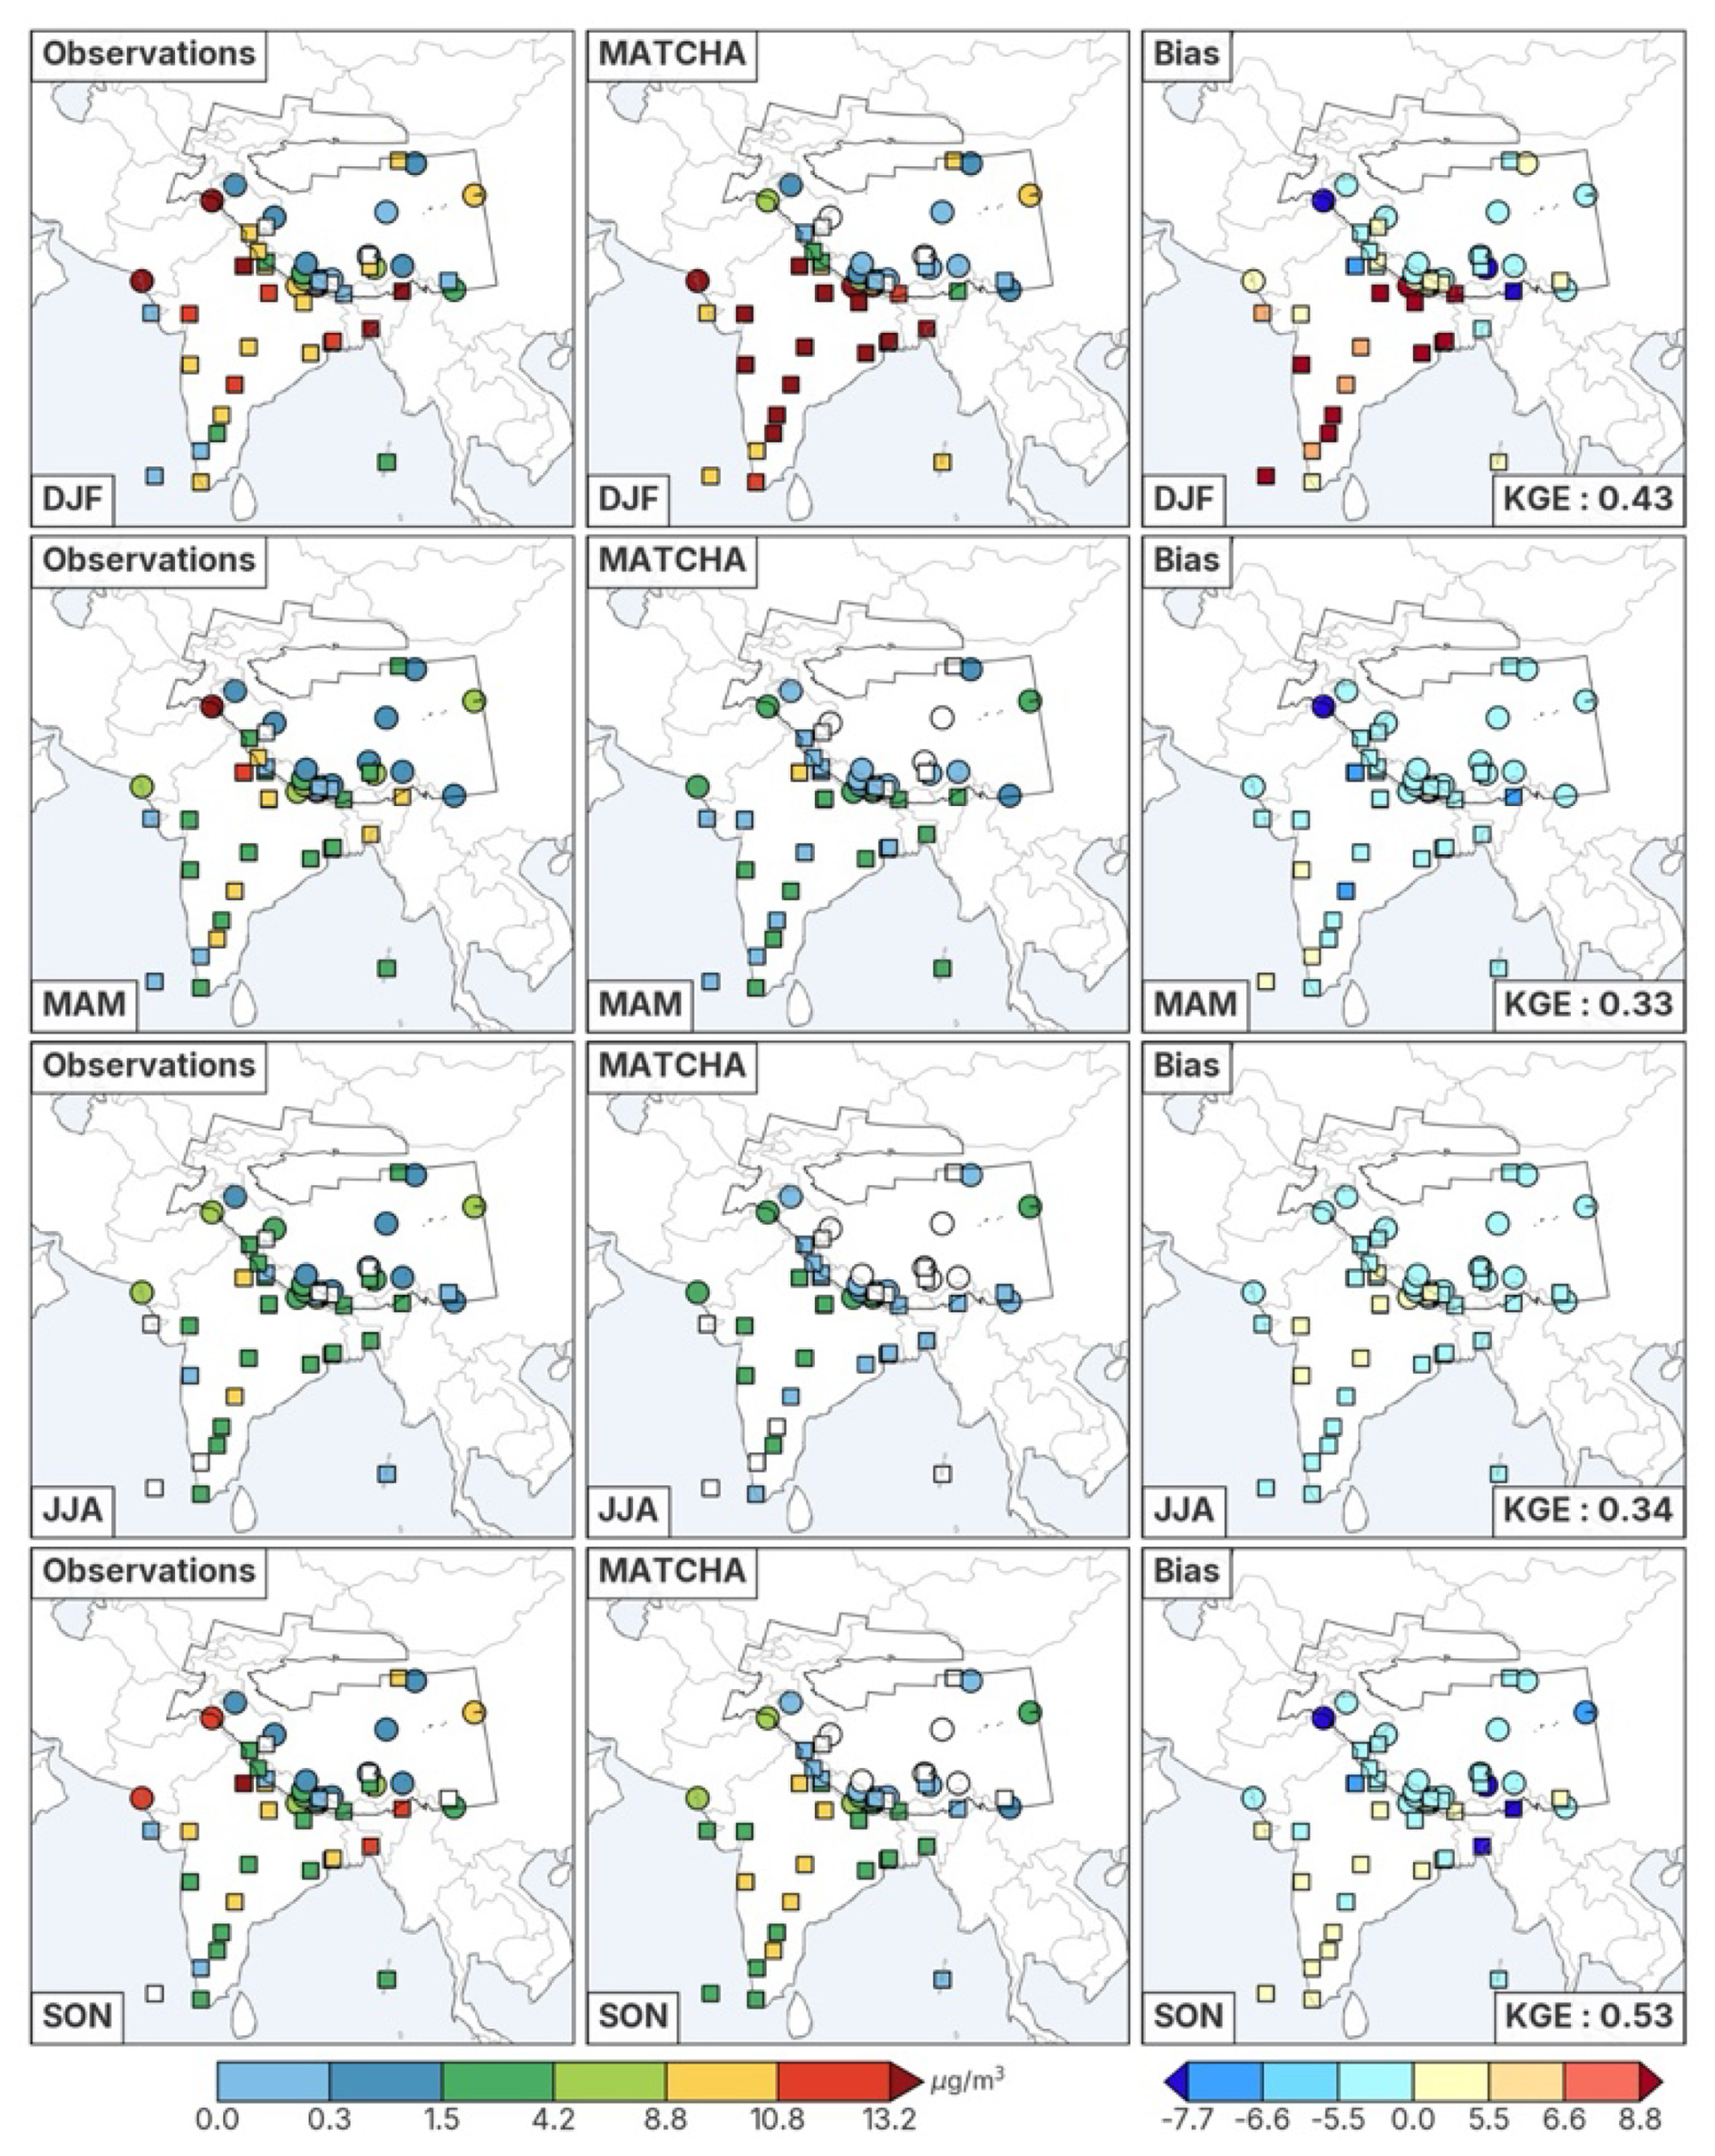
Figure 16Seasonal mean of surface BC mass concentrations (in µg m−3) across observation sites in the domain from ground-based observation sites (left column), MATCHA (middle), and the median model bias (MATCHA-sites, right column). Circle markers denote sites from the APCC network with daily observations, and square markers denote sites with monthly or seasonal measurements (see main text for details).
3.3.4 Additional surface aerosol species
To gain insights into whether anthropogenic emission sources might be contributing to errors in MATCHA simulated PM, we compare surface observations of PM10 as well as eight other aerosol for an urban site named Kanpur (26.5° N, 80.3° E) in the northwestern India with MATCHA based on daily samples collected between January of 2007 to March of 2008 (Ram et al., 2010). The observations are daily averages (between 0600 and 1800 local time) collected using high-volume samplers. Samples for the monsoon months (July to September) were not collected and hence not shown in Fig. 17. We see reasonable agreement for bulk PM10 and several species (as seen by KGE ≥ 0.2 in Fig. 17) in all months except for Ca2+, Na+, and Cl−, where we see significant differences (as seen by the negative KGEs). Na+ shows significant overestimations across all months, Ca2+ is almost absent in most months, while Cl− concentrations are significantly high during spring. These biases can stem from the parameterizations related to natural aerosols and dust speciation, (as discussed in Sect. 3.3.2). In Fig. A7, we show the monthly average percentage contributions of these eight species to total PM, from the observations and MATCHA (based on collocated observations and model simulations for the site at Kanpur, as well as based on the average 17-year contribution over the site from MATCHA). Observations reveal organic carbon (OC) as the dominant contributor, peaking in winter months (November–February), with consistently higher contributions compared to MATCHA. Contribution of SO is overestimated in MATCHA during summer (May–June), particularly in the 17-year average, which shows a more uniform seasonal contribution. NO contribution peaks during winter and is consistently underestimated by MATCHA. Thus, observations indicate stronger seasonal variability in components like OC, NO, and NH, while MATCHA (both 1- and 17-year averages) smooths out these fluctuations. MATCHA overpredicts SO and NH during non-winter months while underestimating components like OC and elemental carbon (EC), particularly in winter. These results point towards more accurate emission inventories and improved parameterizations of sea salt and dust speciation for accurate simulation of PM within models.
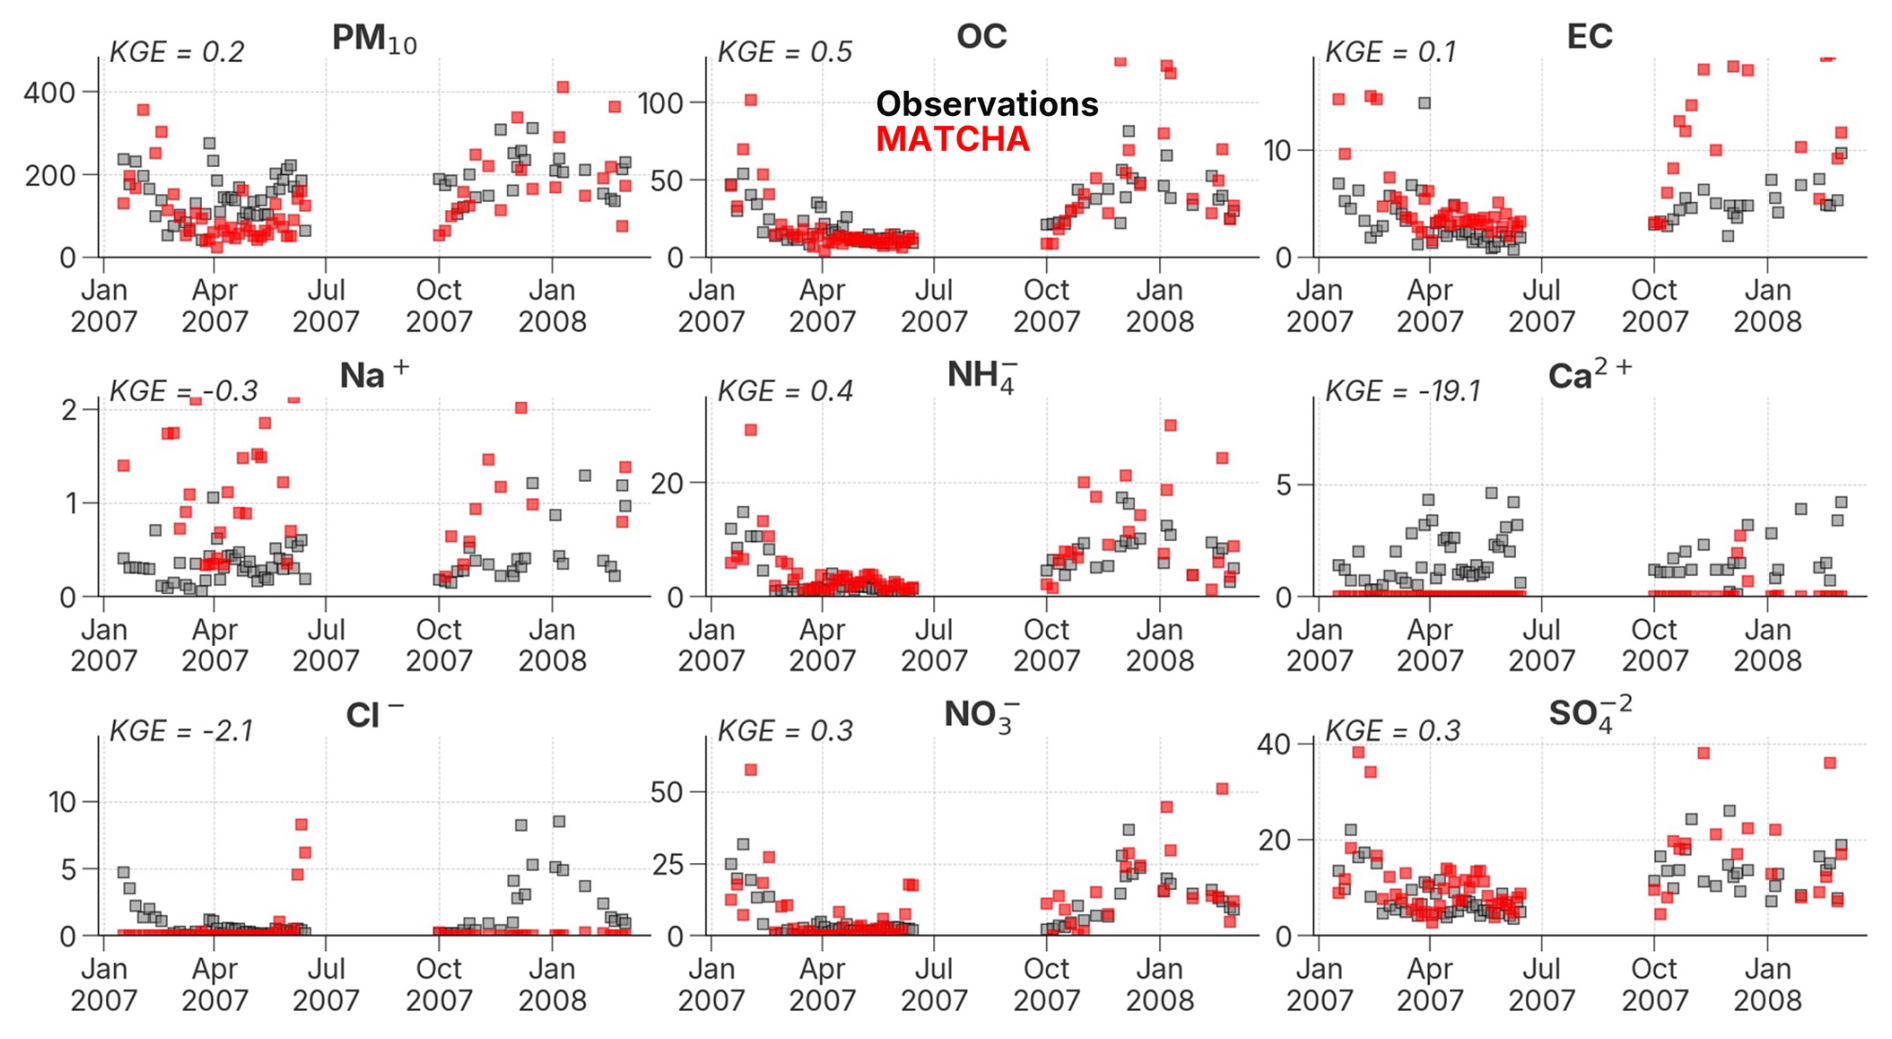
Figure 17Observed (black) versus MATCHA-simulated (red) daily averaged (between 06:00–18:00 IST) concentrations (in µg m−3) of total PM10 and eight chemical species at Kanpur (26.5° N, 80.3° E) from January 2007 to March 2008.
3.3.5 Source attribution of BC
We used the tagged-tracers of anthropogenic BC across ten Asian regions within MATCHA, along with biomass burning and boundary inflow, to quantify the relative contribution of black carbon (BC) from anthropogenic emissions originating in ten different countries or regions, as well as sectors to the BC burden in HMA. Figure 18a–c shows the monthly averaged total column burden BC (tBC in µg m−2) for these tracers across 17 years (2003–2019), spatially averaged over HMA (based on aggregated first-order regions from the Randolph Glacier Inventory (RGI) v6; see Sect. 3.2.3). Winter exhibits the highest tBC for total BC (total refers to the sum of anthropogenic, BB, and transboundary sources of BC) and the highest variability, while anthropogenic tBC shows the highest variability across all months. Biomass burning tBC peaks in March–April, coinciding with seasonal agricultural burning in south, east, and southeast Asia (Wiedinmyer et al., 2023). Anthropogenic tBC is primarily dominated by China and India (Fig. 18b), with China showing the largest seasonal variability, particularly in winter. Pakistan and the Tibetan Plateau (Fig. 18c) show peak concentrations and variability during the summer and monsoon months, followed by the remaining regions of the model domain (Rest of Asia; Fig. 18c). In Fig. 18d, we show the average ∼ 17-year contribution of 12 tags (ten tagged regions + biomass burning + boundary inflow) to tBC over the six major glacier regions of HMA. India and China are the dominant sources across all seasons, with India contributing more to the western and central regions of HMA (e.g., HKH, HIM) and China to the northern and eastern regions (e.g., HTQ, TNS). Contributions to anthropogenic tBC from other regions, like southeast Asia and Pakistan, increase during spring and summer, especially in the southern areas of HMA. Contributions from boundary inflow also dominate for most of the glacier regions across all seasons, which indicates the significance of long-range transport of BC at high-altitude areas. The tagged-tracers within MATCHA can thus assist in inferring the contribution of major Asian regions to anthropogenic BC, as well as separating the influence of biomass burning and boundary inflow over the domain. This source attribution capacity can help determine which emission sources affect the BC loading over HMA during different seasons. These estimates can provide critical input for process-level studies in investigating aerosol-meteorology-snow interactions over HMA, where snowmelt impacts downstream freshwater availability (Roychoudhury et al., 2022, 2025).
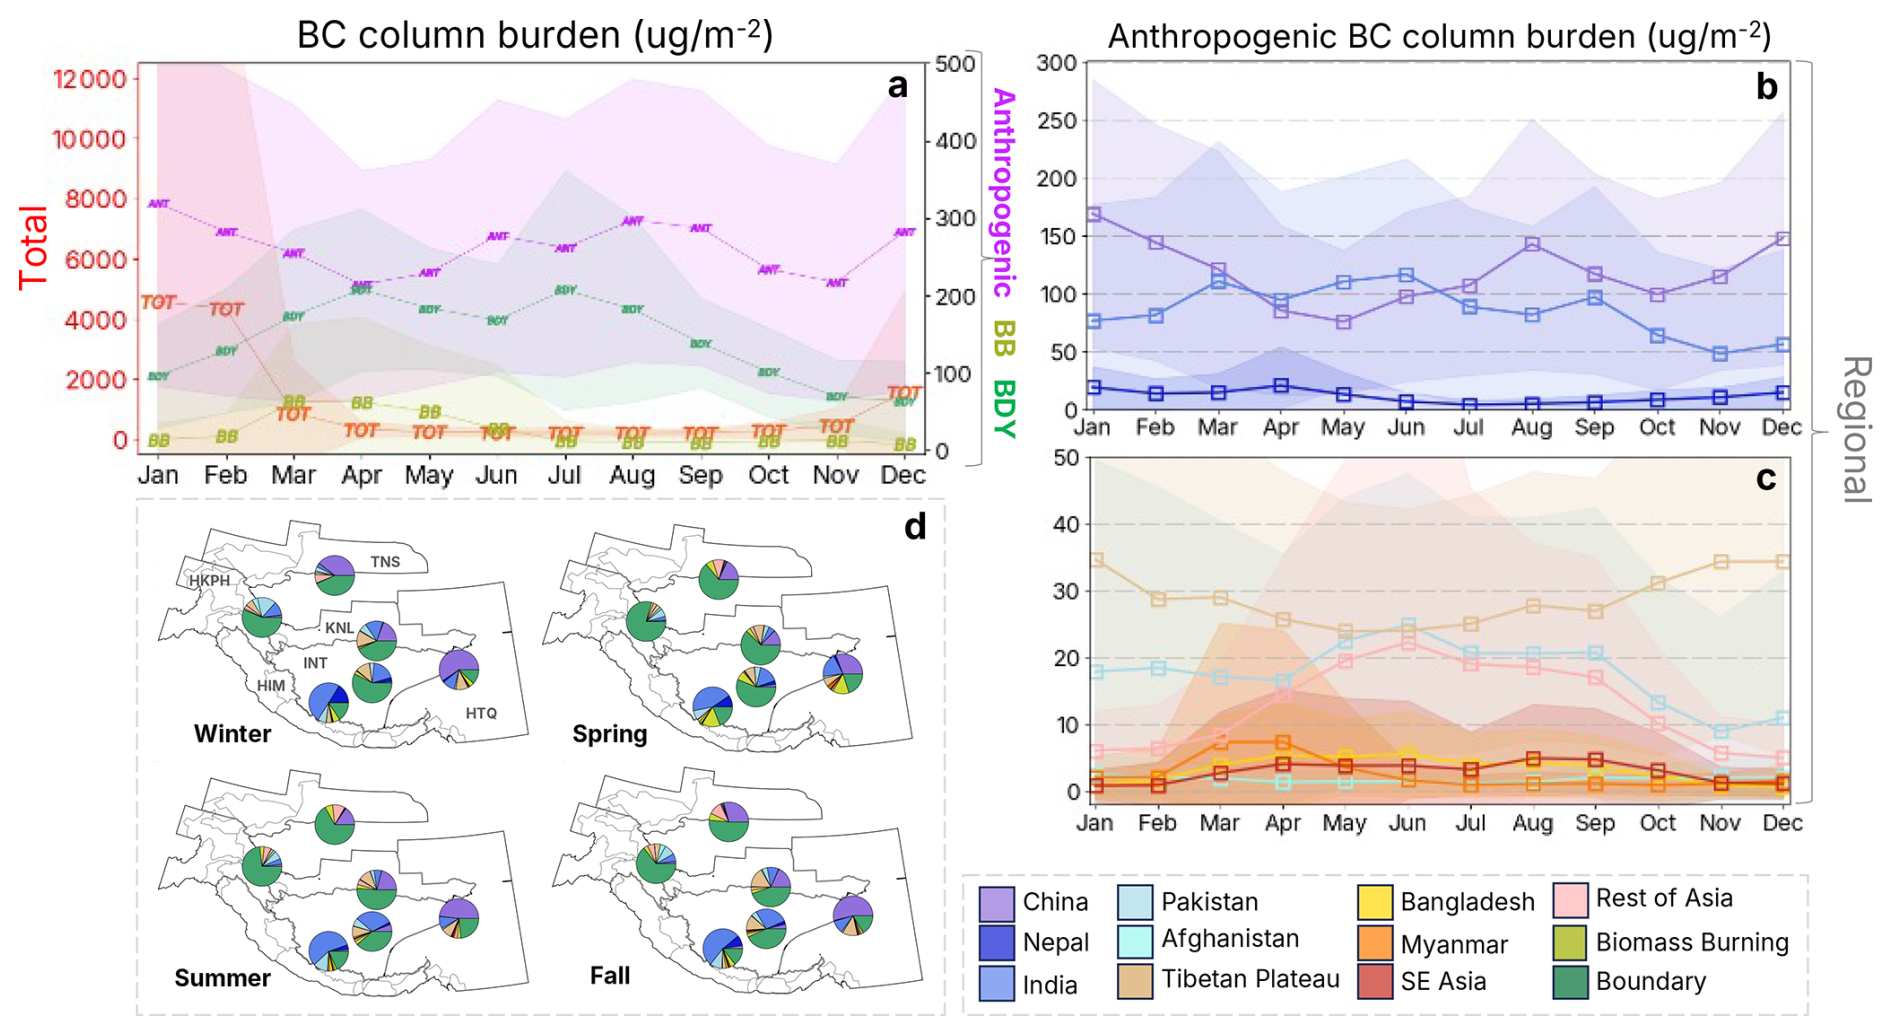
Figure 18Average total column BC burden in µg m−2 across sectors (a), across ten tagged regions of anthropogenic total column BC (b–c), and the seasonal contribution (%) of the 12 tags (d) (ten tagged regions + biomass burning + trans-boundary inflow) at six HMA first-order glacier regions from RGI v6 (INT: Inner Tibet, S and E Tibet; HTQ: Hengduan Shan, Qilian Shan; TNS: W and E Tien Shan; KNL: W and E Kun Lun; HIM: W, C, and E Himalayas, HKPH: Hindu Kush, Karakoram, Pamir, and Hissar Alay). The shaded regions for (a)–(c) refer to the average standard deviation across all six regions. The legend refers to the colors of the regional and the sectoral tags applicable for (b)–(d).
The MATCHA reanalysis is available through the National Snow and Ice Data Center (NSIDC) (https://nsidc.org/data/hma2_matcha/versions/1 (last access: 20 July 2026); DOI: https://doi.org/10.5067/CG4OT8DJX2Z7, Kumar et al., 2024). MODIS SCF (v6.1), AOD (v6.1), and MOPITT CO (V8) were downloaded from NASA Earthdata (https://search.earthdata.nasa.gov/search, last access: 20 July 2026). AERONET AOD and associated inversion products (v3) were downloaded from the AERONET website (https://aeronet.gsfc.nasa.gov/new_web/download_all_v3_aod.html, last access: 20 July 2026). OpenAQ data can be accessed through the OpenAQ API (https://docs.openaq.org/about/about, last access: 20 July 2026). IMERG Final Run daily data were downloaded from NASA GES DISC (https://disc.gsfc.nasa.gov/, last access: 20 July 2026). IGRA sounding data and derived products were downloaded from NOAA NCEI's website (https://www.ncei.noaa.gov/products/weather-balloon/integrated-global-radiosonde-archive, last access: 20 July 2026). ISD products for sub-daily surface meteorological measurements across sites can be obtained from NOAA NCEI's website (https://www.ncei.noaa.gov/products/land-based-station/integrated-surface-database, last access: 20 July 2026).
This paper presents a novel hydroclimate-chemical regional reanalysis, MATCHA (Model for Atmospheric Transport and Chemistry in Asia), to support research on light-absorbing particles and their impacts on the cryosphere over High Mountain Asia (HMA). Compared to existing global reanalyses, MATCHA offers strong coupling between atmospheric chemistry, land surface processes, and aerosol–snowpack interactions, thus making it the only regionally focused, fully coupled chemical reanalysis currently available for HMA. Our recent work analyzed the degree of coupling incorporated in the model framework across MATCHA, ERA5, and MERRA-2 over HMA and found that MATCHA reflects the highest degree of coupling that contributes to a more accurate representation of snow cover during the snow ablation season over HMA (Roychoudhury et al., 2025). MATCHA assimilates nearly two decades (2003–2019) of MODIS AOD and MOPITT CO satellite retrievals into the WRF-Chem–CLM–SNICAR modeling framework, producing a 12 km resolution dataset with hourly to three-hourly temporal outputs for ∼ 17 years. Key features of this dataset include the simulation of BrC aerosol processes, source-tagged-tracers of BC, and coupling of aerosols with radiation and snowpack processes. We evaluate the dataset against multiple in situ and satellite observations, and the results provide detailed insights into model biases and uncertainties across meteorological, land, and atmospheric composition variables.
Table 5Summary of MATCHA performance across all evaluated variables, based on Tables 2 to 4. The R and KGE columns give the range across seasons. The dominant bias column summarizes the seasonal mean bias. The remarks column is based on KGE (strong, KGE ≥ 0.8; good, 0.6 ≤ KGE < 0.8; moderate, 0.4 ≤ KGE < 0.6; limited, KGE < 0.4) and is cross-checked against R, with the weakest season or regime in parentheses.
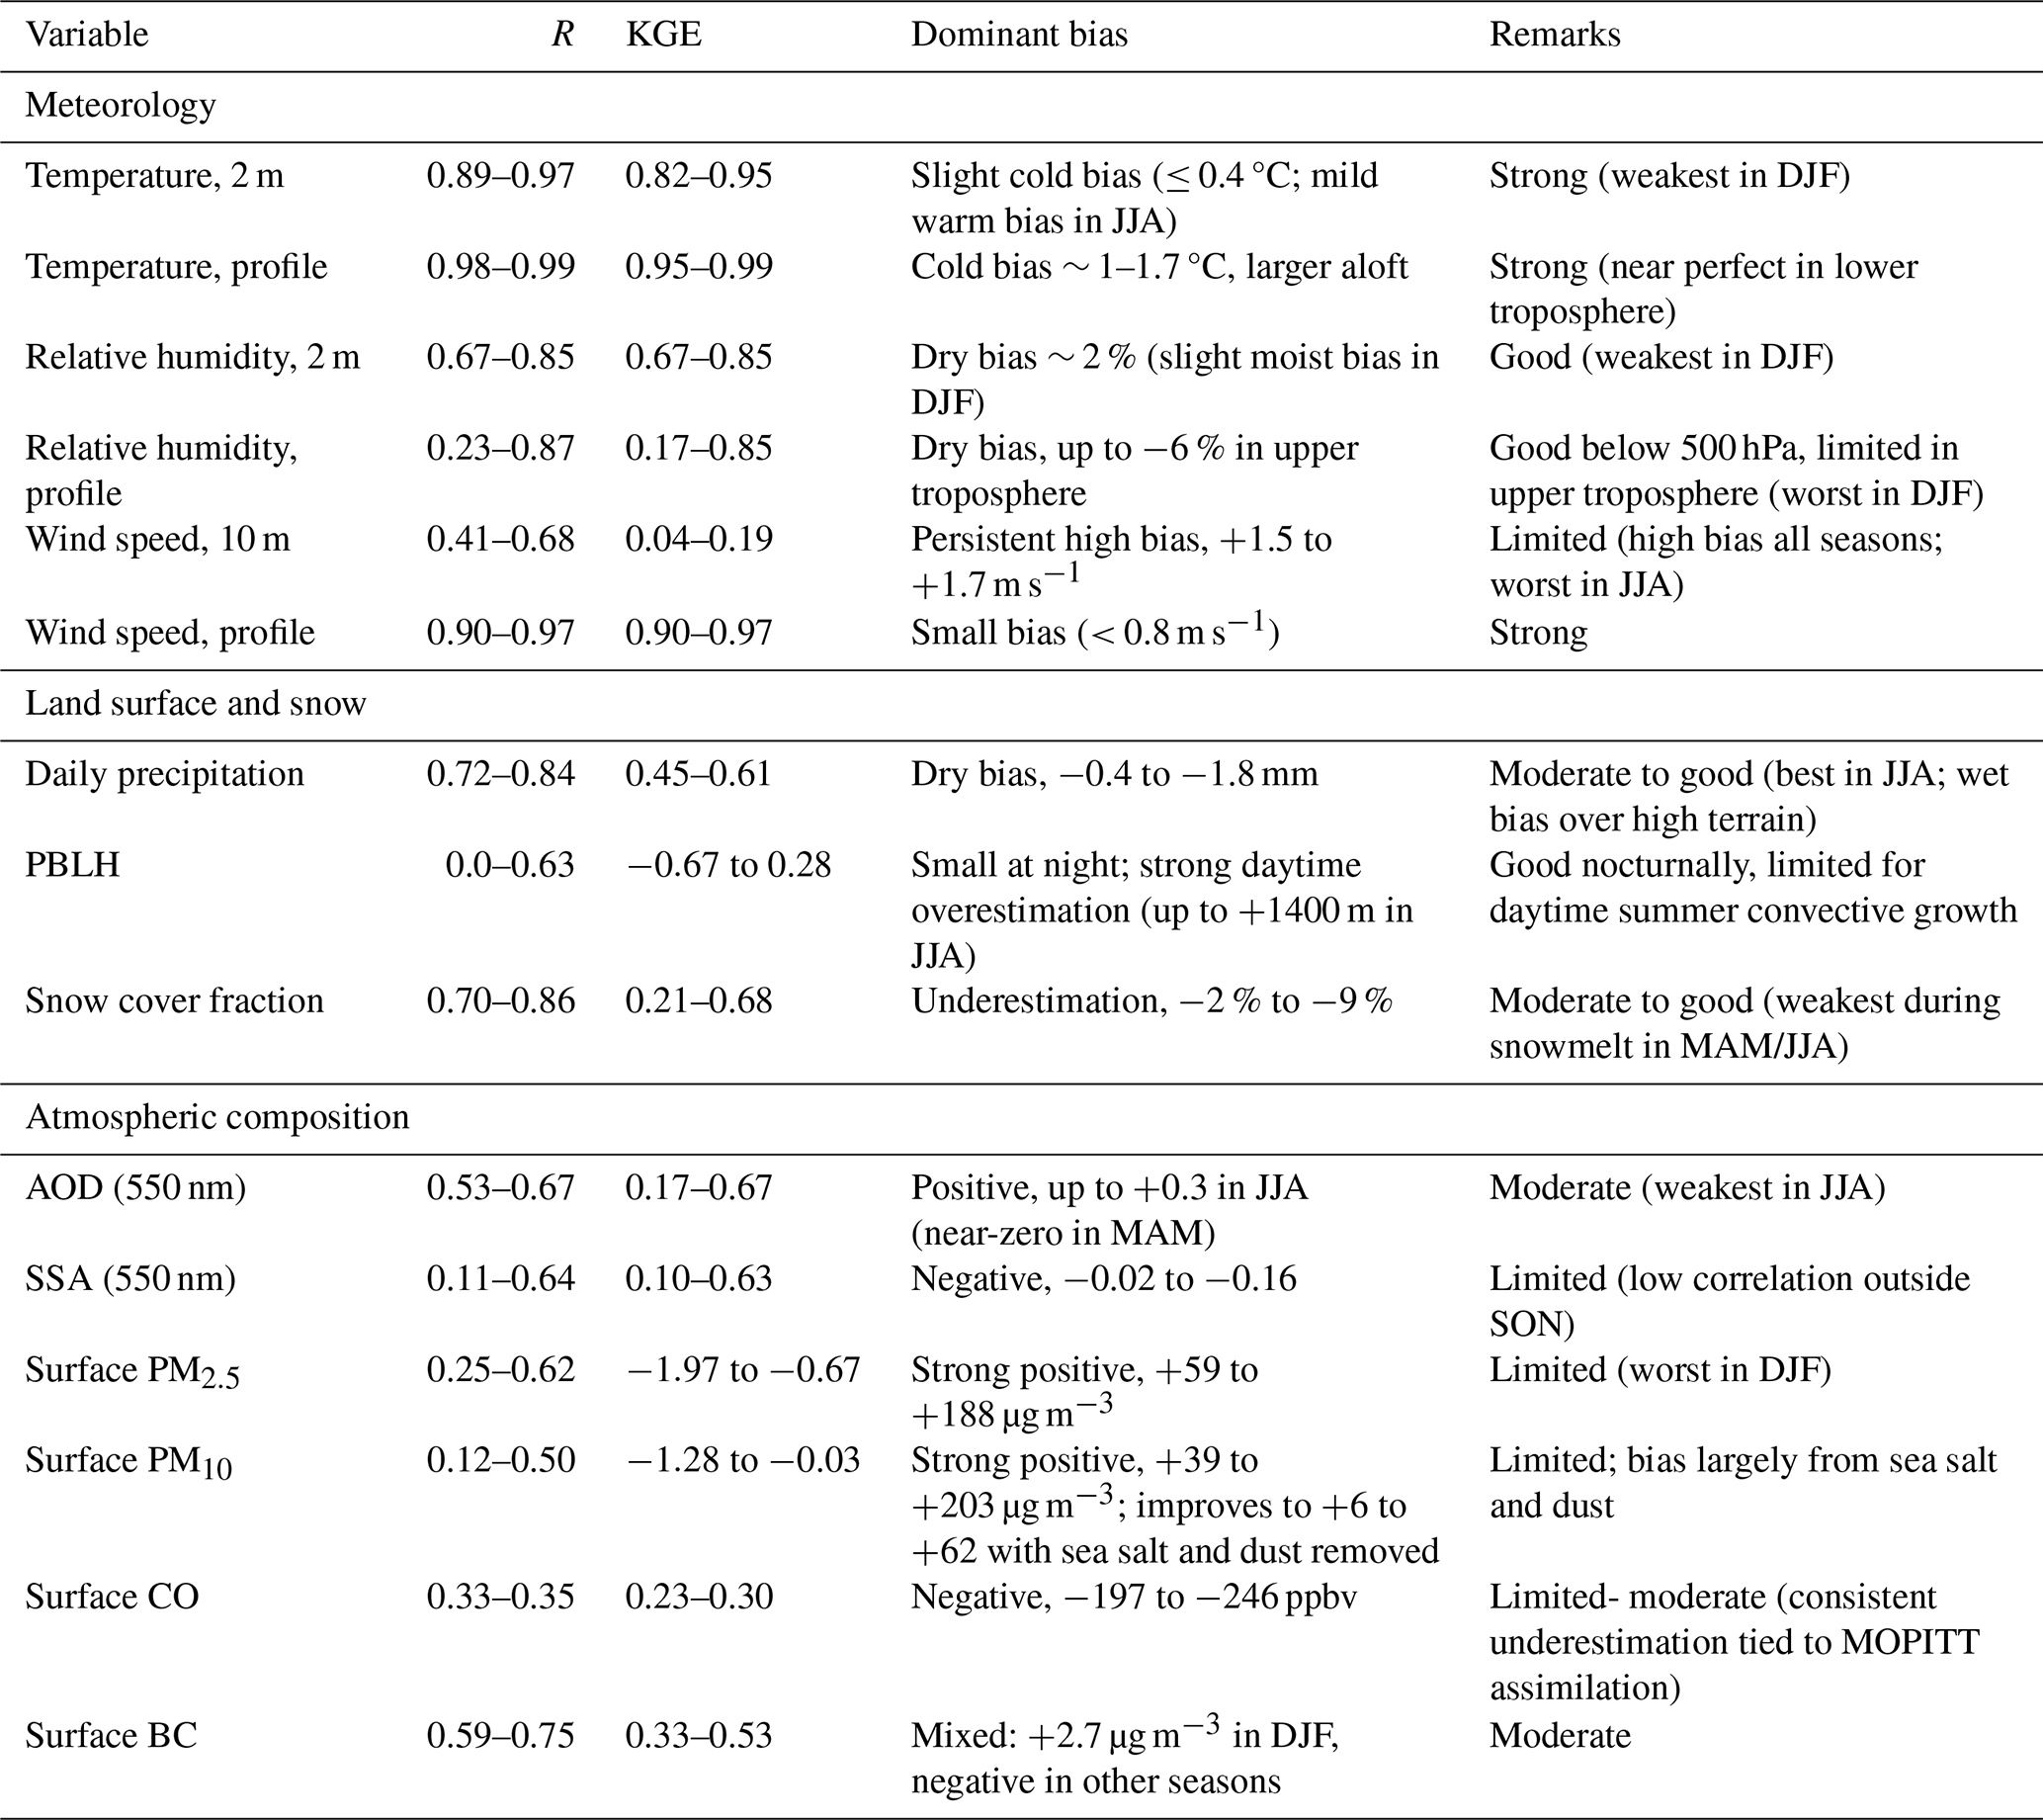
Table 5 summarizes the evaluation metrics from Tables 2 to 4 for all evaluated variables, reporting the seasonal range of R and KGE, the dominant bias and some comments on the skill of MATCHA. We summarize the evaluation results as follows,
-
Surface temperature, relative humidity, wind speed, and their vertical profiles show the strongest overall skill (KGE of 0.65–1.0 for temperature, relative humidity, and the profiles) across all evaluated variables. Minor issues include a cold, dry bias in winter at high elevations and a domain-wide 10 m wind overestimate; in the upper troposphere, temperature/RH are slightly low, whereas winds are high.
-
Daily accumulated precipitation compared with satellite measurements from IMERG Final Runs is realistically represented, with the monsoon rainband and localized features over the Indian sub-continent reproduced the best (domain mean KGE of 0.6 in JJA). Systematic underestimation persists over high terrain, peaking in summer, reflecting the difficulty most regional models face with orographic convection.
-
Diurnal and seasonal cycles of PBLH are effectively captured, but MATCHA underestimates early-morning PBLH (00:00 UTC) over India/coastal zones and overestimates afternoon PBLH (12:00 UTC) across most sites in summer, leading to biases that trace back to the YSU PBL scheme, limited vertical resolution, complex terrain, as well as transition of daytime to nocturnal PBLH. The skill is highest in spring, and the magnitude of the biases is within the ranges reported in the literature.
-
Over HMA, MATCHA recreates the observed snow cover fraction seasonality (R of 0.7–0.9; winter KGE ≈ 0.7), with only minor negative biases during the melt period. This can be attributed to negative SSA550 biases observed across the domain, suggesting more absorbing aerosols, which lead to increased snowmelt, with the CLM-SNICAR coupling within MATCHA.
-
Spatial and seasonal patterns of AOD550 and SSA550 are well reproduced, capturing major pollution hot spots. MATCHA overestimates summer AOD550 over the Indian sub-continent and SE Asia and exhibits a larger-than-typical negative SSA550 bias, pointing to shortcomings in emission inventories and model parameterizations of natural emissions of aerosols.
-
Surface particulate matter (PM) measurements, based on a network of over 1500 sites from OpenAQ, exhibit seasonality and spatial patterns consistent with Asian pollution hotspots identified in MATCHA. However, MATCHA significantly overestimates surface PM2.5 and PM10 concentrations, particularly during winter. Preliminary analysis attributes this bias to four interlinked factors: (i) overstated Arabian Sea winds inflating sea salt and dust emissions, (ii) underestimated monsoon rainfall reducing wet scavenging, (iii) excessive NO2-NO partitioning enhancing nitrate mass, and (iv) the absence of China's recent downward PM trends in the CAMS-GLOB-ANT emission inventory used as input for MATCHA.
-
Furthermore, based on aerosol chemical composition measurements of different chemical species from an urban site in Kanpur, India, MATCHA captures the bulk PM10 load and the seasonality of most constituents. However, it overestimates marine and soil tracers (Na+, Cl−, Ca2+) while failing to reproduce the strong winter peaks in carbonaceous (OC, EC) and nitrate (NO) aerosols seen in observations. Specifically, the reanalysis underestimates OC, EC, and NO during November–February and overestimates SO and NH during the pre-monsoon and post-monsoon periods. These discrepancies suggest overly efficient secondary inorganic aerosol production and underrepresentation of primary combustion sources in MATCHA. Overall, the species-specific biases are consistent with the broader regional PM discrepancies and underscore the need for refined emission inventories and improved aerosol chemistry parameterizations in future MATCHA updates.
-
The tagged-tracers from MATCHA are a unique feature within the MATCHA reanalysis that offer insights into the sources (both regional and sectoral) of BC in the domain across two decades. Initial analysis of these tracers reveals that the total column burden of BC peaks in winter, with China and India being the dominant anthropogenic sources of the total column burden of anthropogenic BC. China shows the greatest seasonal variability in total column burden of anthropogenic BC, particularly over eastern and northern China, while India contributes more to the total column burden over western and central HMA. Biomass burning BC peaks in March to April, while trans-boundary inflow (representing the influence of emissions sources located outside our domain) is significant across all seasons. Regional contributions vary, with additional influences from Pakistan, the Tibetan Plateau, and southeast Asia during spring and summer.
Overall, MATCHA effectively captures the spatiotemporal distributions and general trends of key meteorological and chemical variables. Its performance in representing meteorological fields is particularly strong, with KGE values greater than 0.65. In contrast, variables associated with land–atmosphere interactions, such as precipitation, planetary boundary layer height (PBLH), and snow cover fraction (SCF), exhibit moderate skill, with maximum KGE values around 0.7. For atmospheric composition, MATCHA accurately reproduces the spatiotemporal patterns of anthropogenic aerosols, although biases in natural aerosol species contribute to discrepancies in surface PM2.5 and PM10 concentrations. Surface CO measurements, however, are more tightly constrained, likely due to the implementation of a daily assimilation workflow within MATCHA. Isolating how much of the evaluated skill is attributable to the assimilation of MODIS AOD versus MOPITT CO is left to dedicated observing system experiments in a future work. The identified biases underscore the need for improved parameterizations of surface-atmosphere interactions, cloud microphysics, and precipitation processes, as well as the improvements required in emission inventories to enhance the simulation of chemical species. While this study presents an initial assessment of 12 variables spanning meteorology, land–atmosphere coupling, and atmospheric composition at a seasonal scale, further analyses are necessary. Specifically, extending evaluations to capture regional differences and long-term trends over the past 1 years, across finer spatiotemporal scales, will be crucial to fully understand the value added by the high-resolution datasets provided by MATCHA for a region as complex as Asia. Moreover, rigorous intercomparisons with other reanalysis products are needed, alongside investigations into additional essential climate variables offered by MATCHA.
MATCHA is intended for (i) aerosol–cryosphere and hydroclimate researchers studying LAP deposition and snow feedback over HMA, with well-constrained meteorology (KGE 0.65–1.0), snow cover fraction (R 0.7–0.9), and the coupled aerosol–radiation–snow simulations that distinguish MATCHA. (ii) air-quality and atmospheric-composition researchers needing a long, dynamically consistent, high-resolution regional record, and (iii) the statistical and machine-learning community, for which the 17-year, 12 km dataset can be used as training data. Users should weigh these strengths against the biases documented in Sect. 3 when selecting variables. In particular, surface PM2.5 and PM10 concentrations carry substantial positive biases, especially in winter (Sect. 3.3.2), so MATCHA might not be suitable for direct regulatory air-quality assessment or human-exposure estimates without observational bias correction. Where MATCHA informs emission mitigation, that value derives from the relative source attribution provided by the BC tagged tracers (Sect. 3.3.5), which identify the regions and sectors dominating BC delivery to HMA's cryosphere across seasons.
Despite its limitations, MATCHA represents a state-of-the-art, high-resolution, long-term regional chemical reanalysis for Asia, specifically designed to address major gaps in representing LAP and their feedbacks in climate-vulnerable regions like HMA. MATCHA's most distinguishing feature is its explicit coupling of aerosols, radiation, and snowpack processes, allowing it to capture complex non-linear interactions among atmospheric composition, meteorology, and the cryosphere (e.g., snow hydrology). In contrast to global reanalyses such as ERA5 and MERRA-2, which offer longer periods exceeding 17 years but operate at coarser resolutions (25–50 km) and lack aerosol-snow coupling, MATCHA provides higher-resolution outputs (12 km) and includes parameterizations that allow for more accurate representation of the cryosphere-atmosphere feedbacks critical to regional hydroclimate. Among current reanalyses, MERRA-2 includes aerosol–radiation interactions but not aerosol–snow feedbacks, limiting its utility for evaluating LAP' impacts on snowpack and glacier melt. MATCHA further distinguishes itself by assimilating nearly two decades of MODIS AOD and MOPITT CO retrievals and simulating the full cycle of black carbon (BC), dust, and brown carbon (BrC), including their deposition on snow surfaces. Beyond retrospective analysis across the last two decades, MATCHA offers high-resolution datasets that facilitate assessments of the sensitivity of regional hydroclimate and air quality to nonlinear aerosol–climate interactions. Additionally, tagging of regional sources of anthropogenic BC with MATCHA enable more precise source attribution studies, providing critical insights to prioritize emission-relevant interventions, particularly for hydroclimate-vulnerable regions such as the HMA.
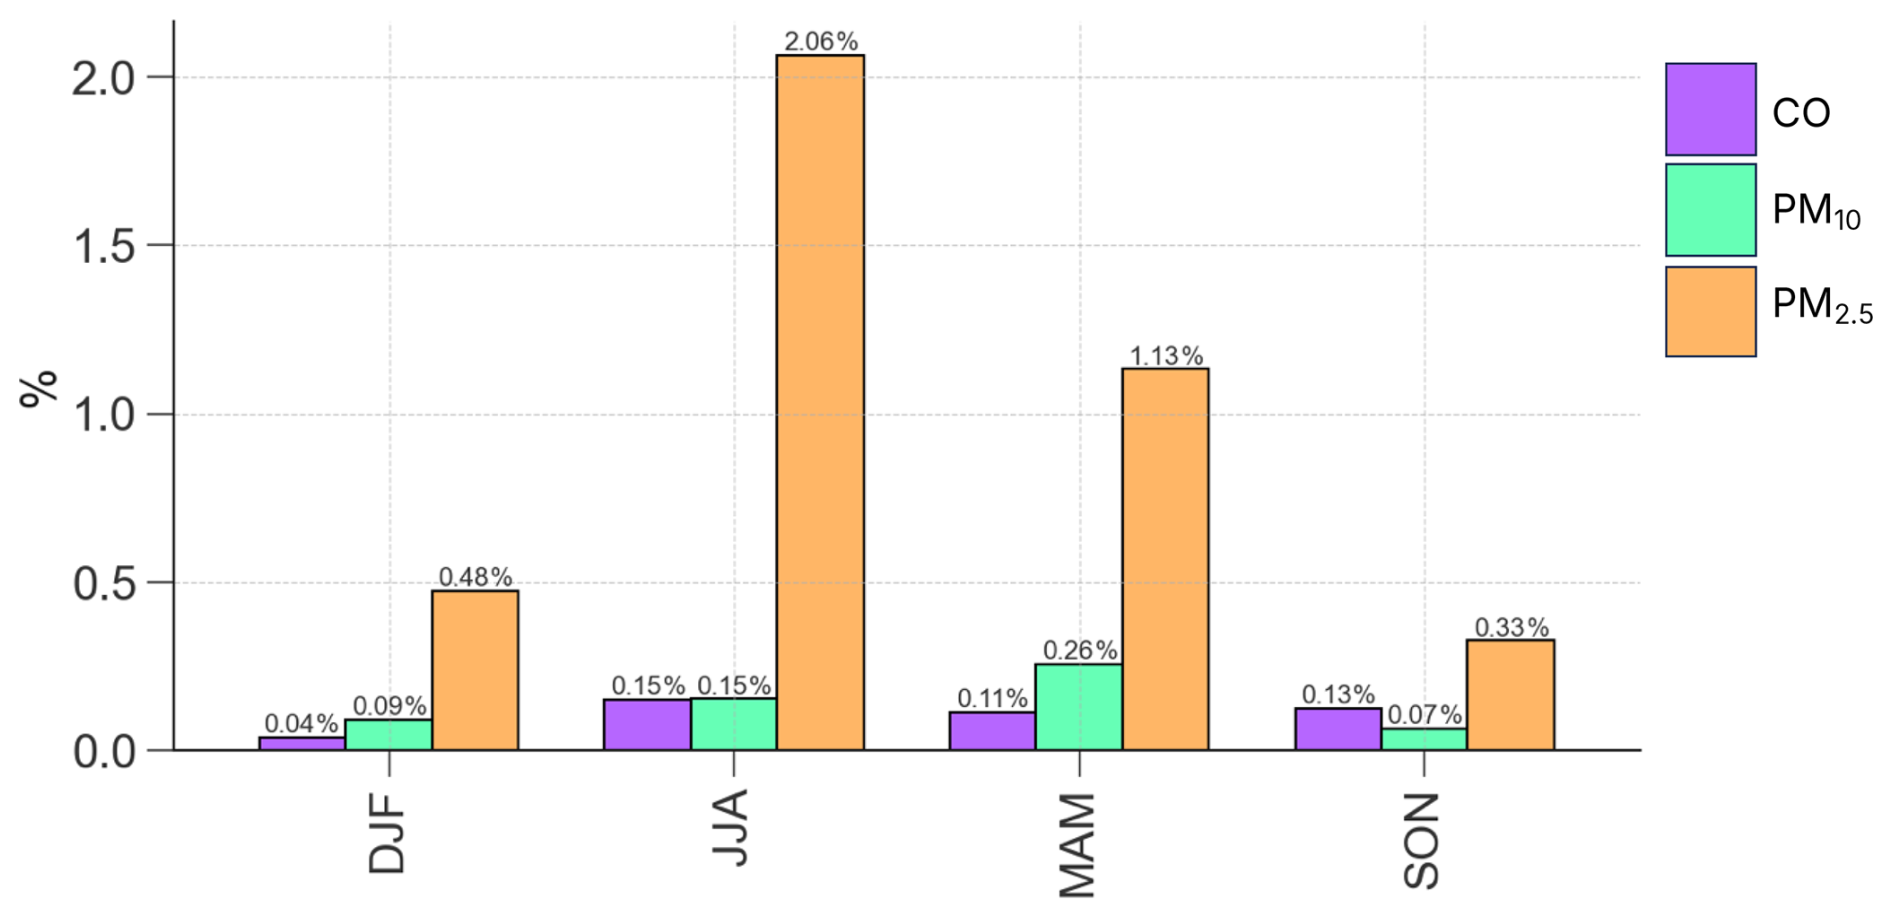
Figure A1Percentage of outliers removed from retrieved OpenAQ data of surface CO, PM10, and PM2.5 (purple, green and orange, respectively) using the outlier detection system in Wu et al. (2018) (see main text).
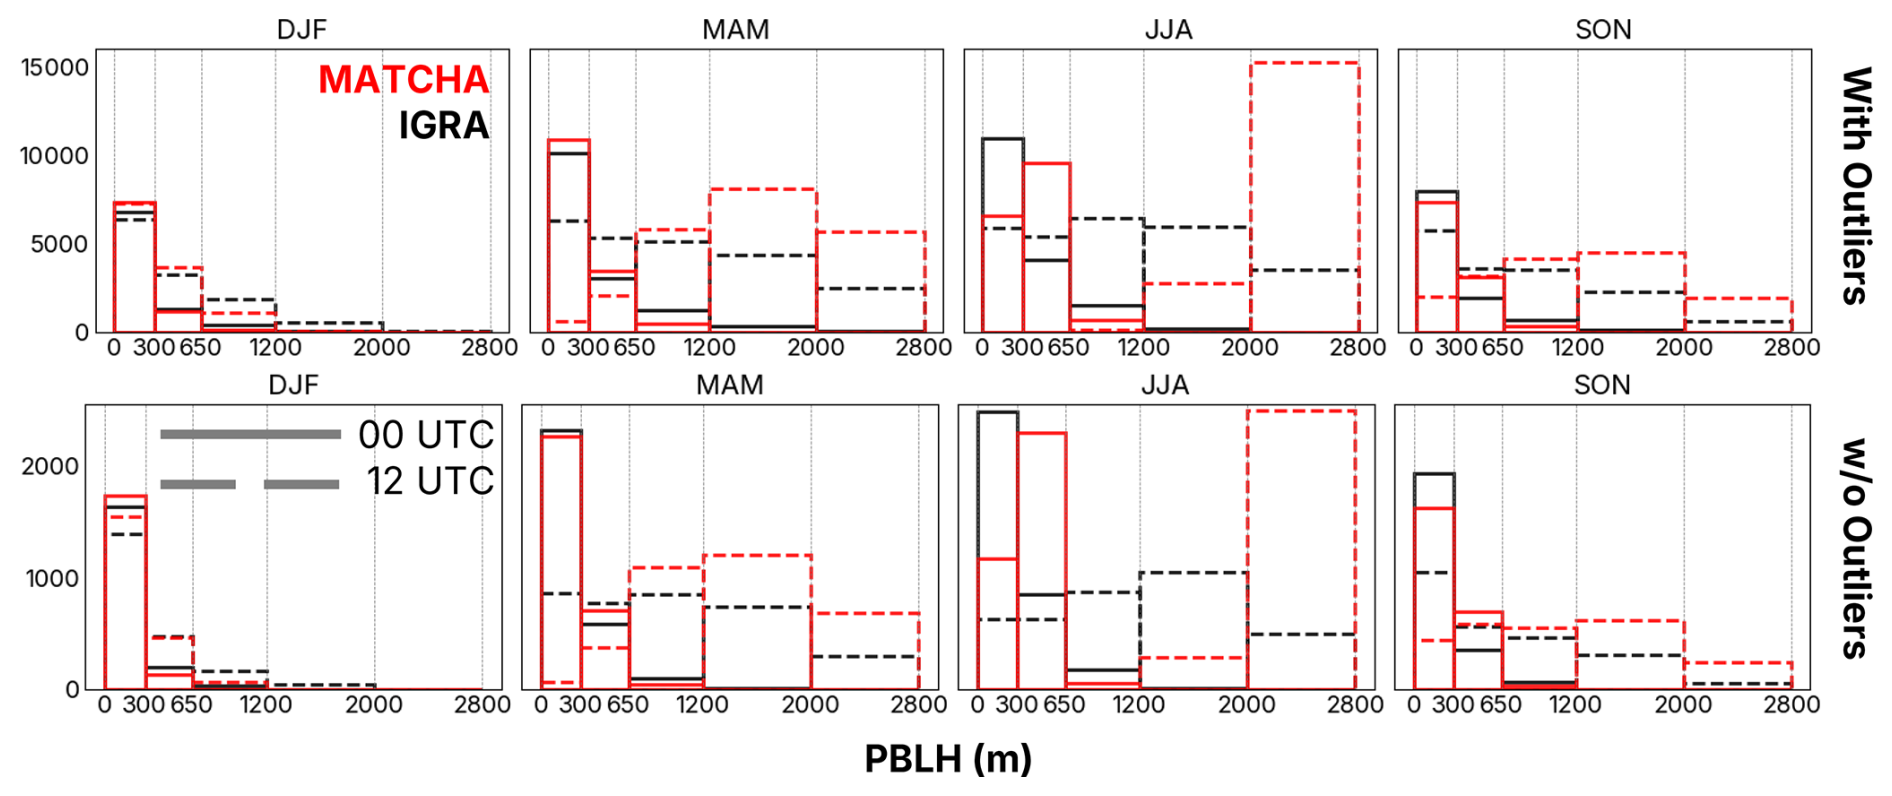
Figure A2Histograms of both model (red) and observed (black) PBLH values compared across seasons and standard radiosonde launch times (solid for 00:00 UTC and dashed for 12:00 UTC) before and after applying the outlier-detection approach described in Sect. 2.2.4 of the main text.
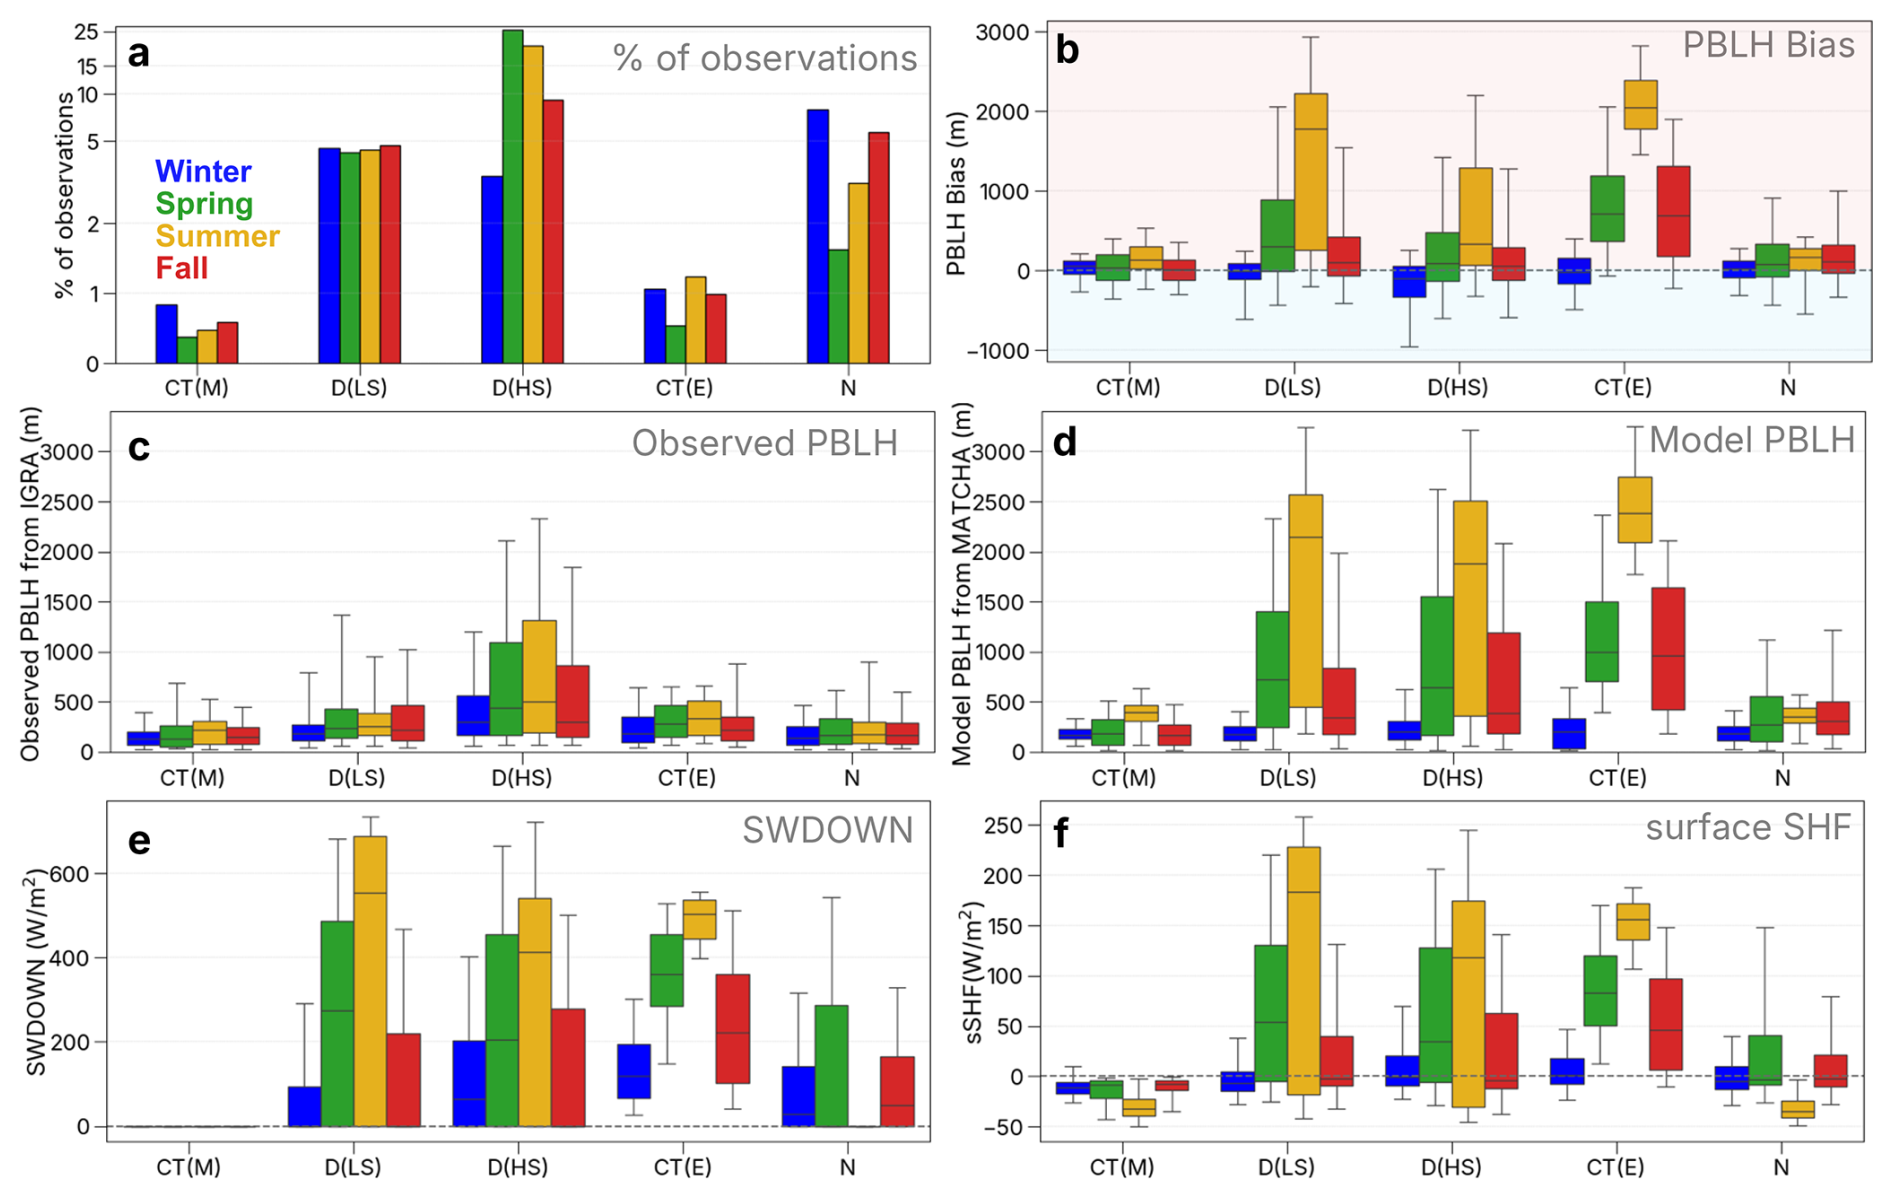
Figure A3(a) Fraction (in %) of all 00:00 and 12:00 UTC radiosonde launches in the domain across different solar regimes (CT(M) = Morning Civil Twilight; D(LS) = Day – Low Sun; D(HS) = Day – High Sun; CT(E) = Evening Civil Twilight; N = Night) for each season. Solar regimes were defined by computing the solar elevation angle at the exact launch time of each radiosonde observations and classifying them into five exclusive categories: N (°), CT (−6 to 0°, split into morning or evening by solar azimuth), D (LS) (0 to 10°), and D(HS) (> 10°). (b) PBLH bias (model-observed), (c) observed PBLH, and (d) modeled PBLH from IGRA and MATCHA across the solar regimes and seasons. (e) Downward shortwave radiation flux (SWDOWN) and (f) surface sensible heat flux (sSHF) collocated at IGRA sites from MATCHA across solar regimes and seasons.
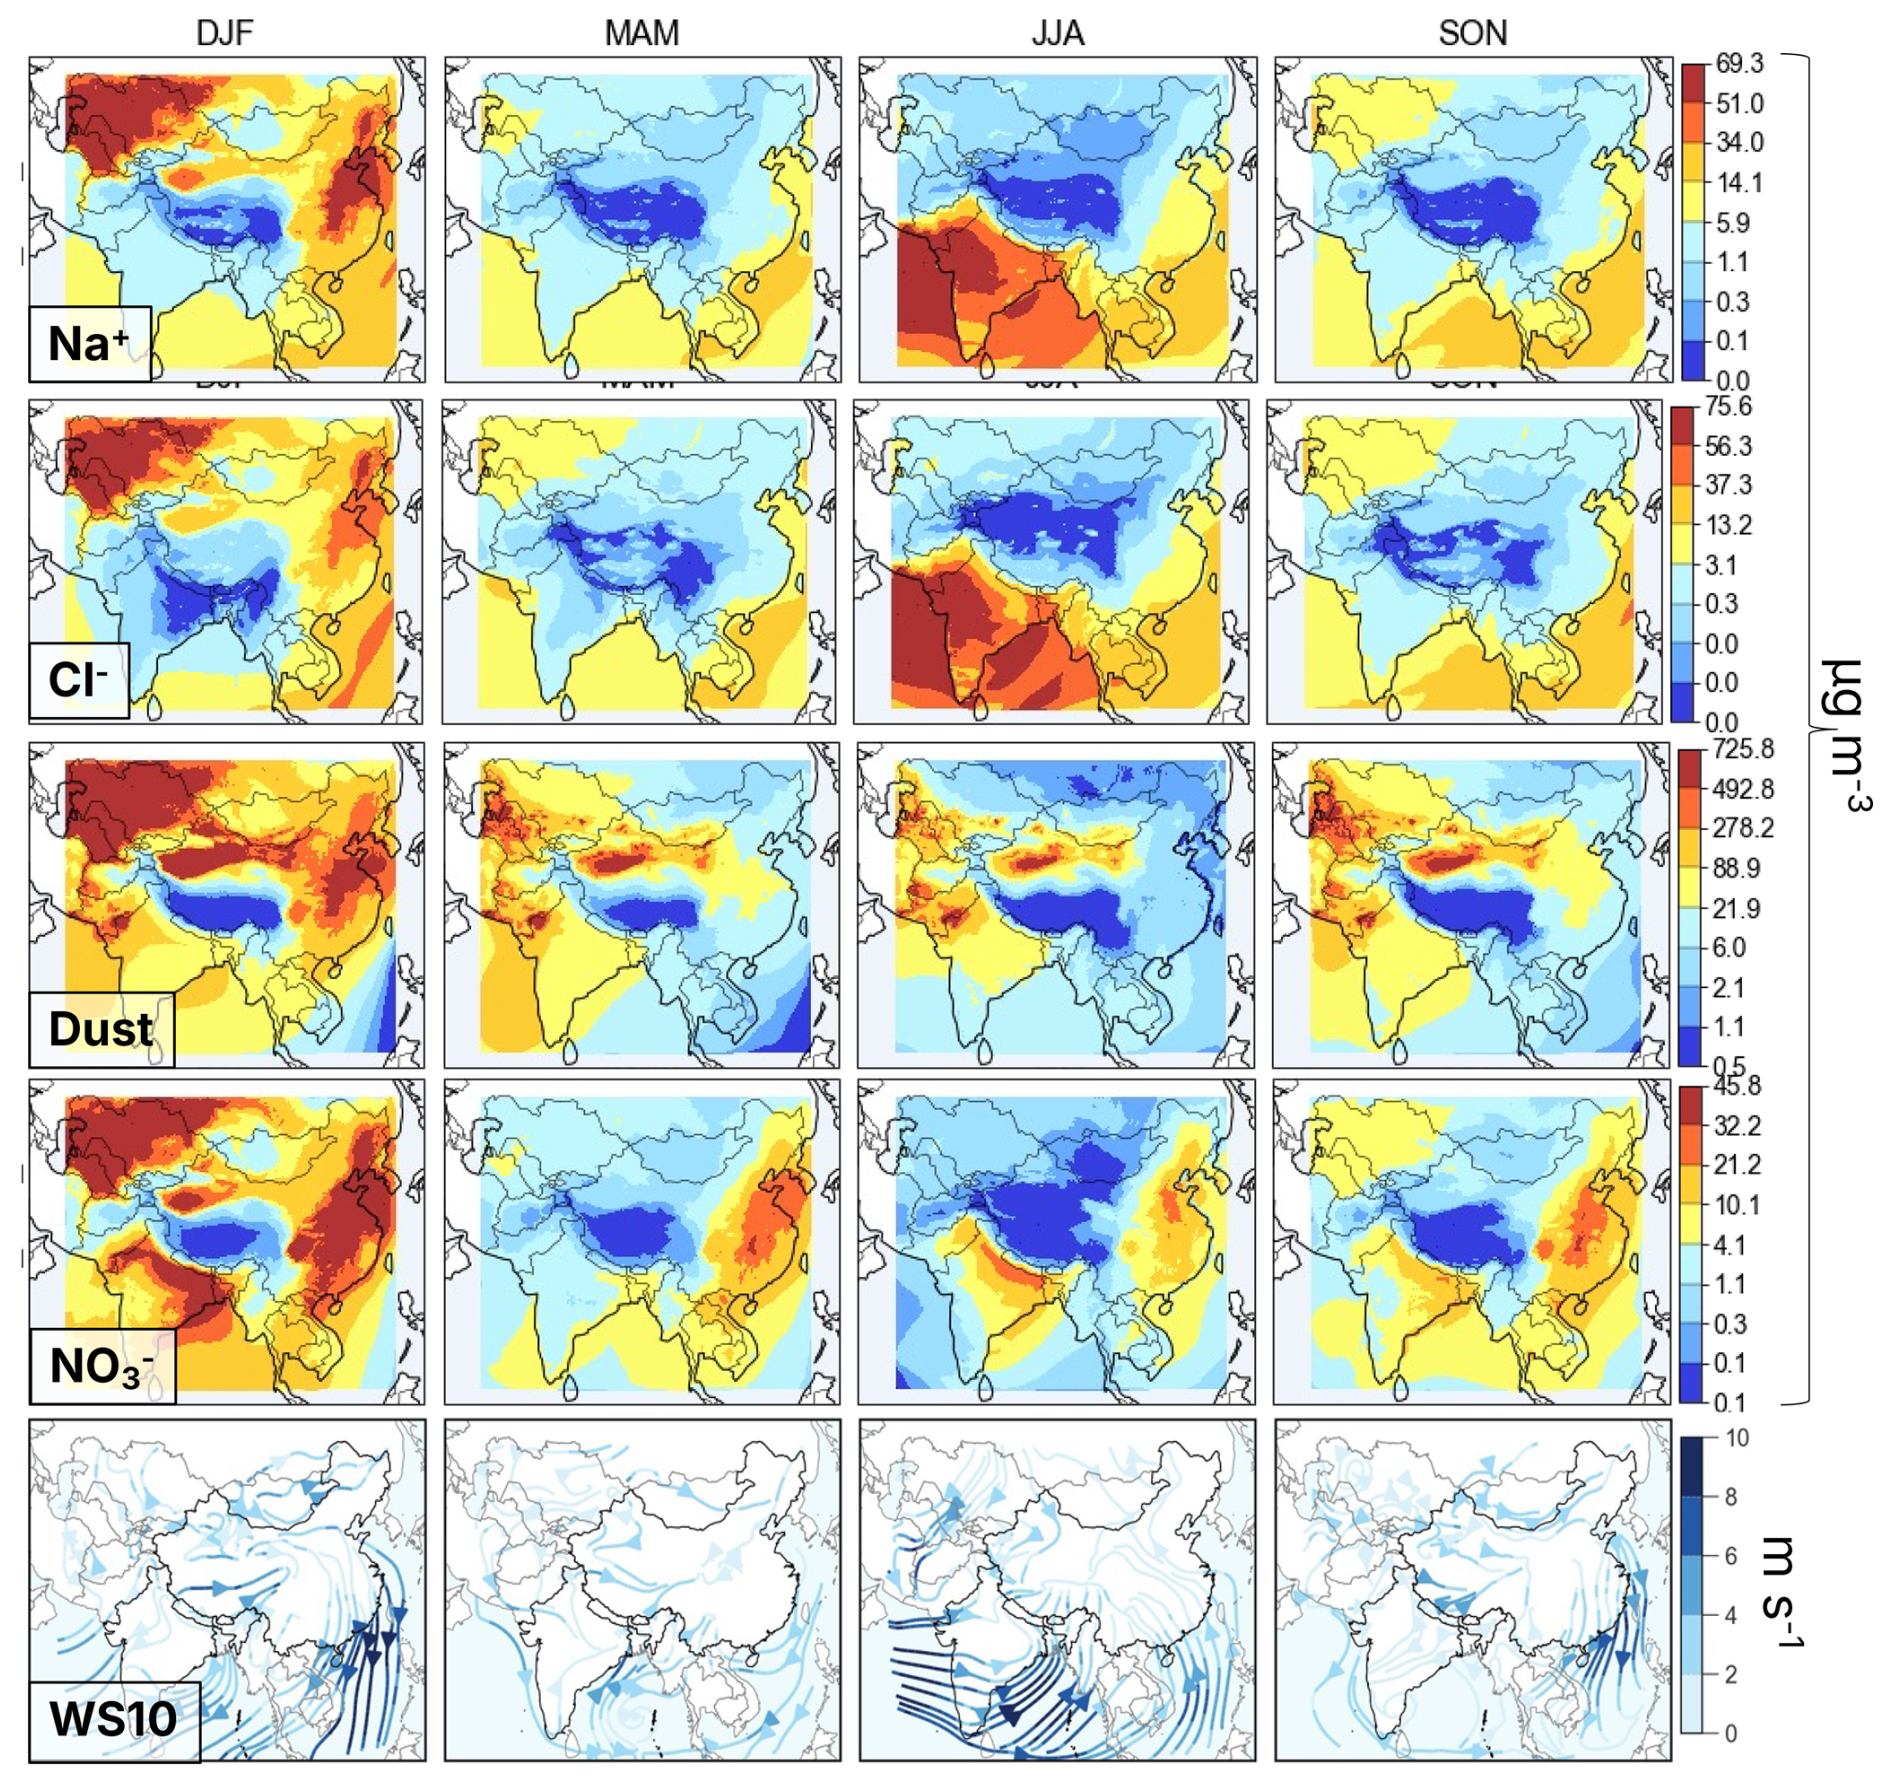
Figure A4Seasonal averages of surface sea-salt partitioned to sodium and chloride (in µg m−3), surface nitrate aerosols (in µg m−3), surface dust (in µg m−3) and wind speed at 10 m (in m s−1) over the model domain.
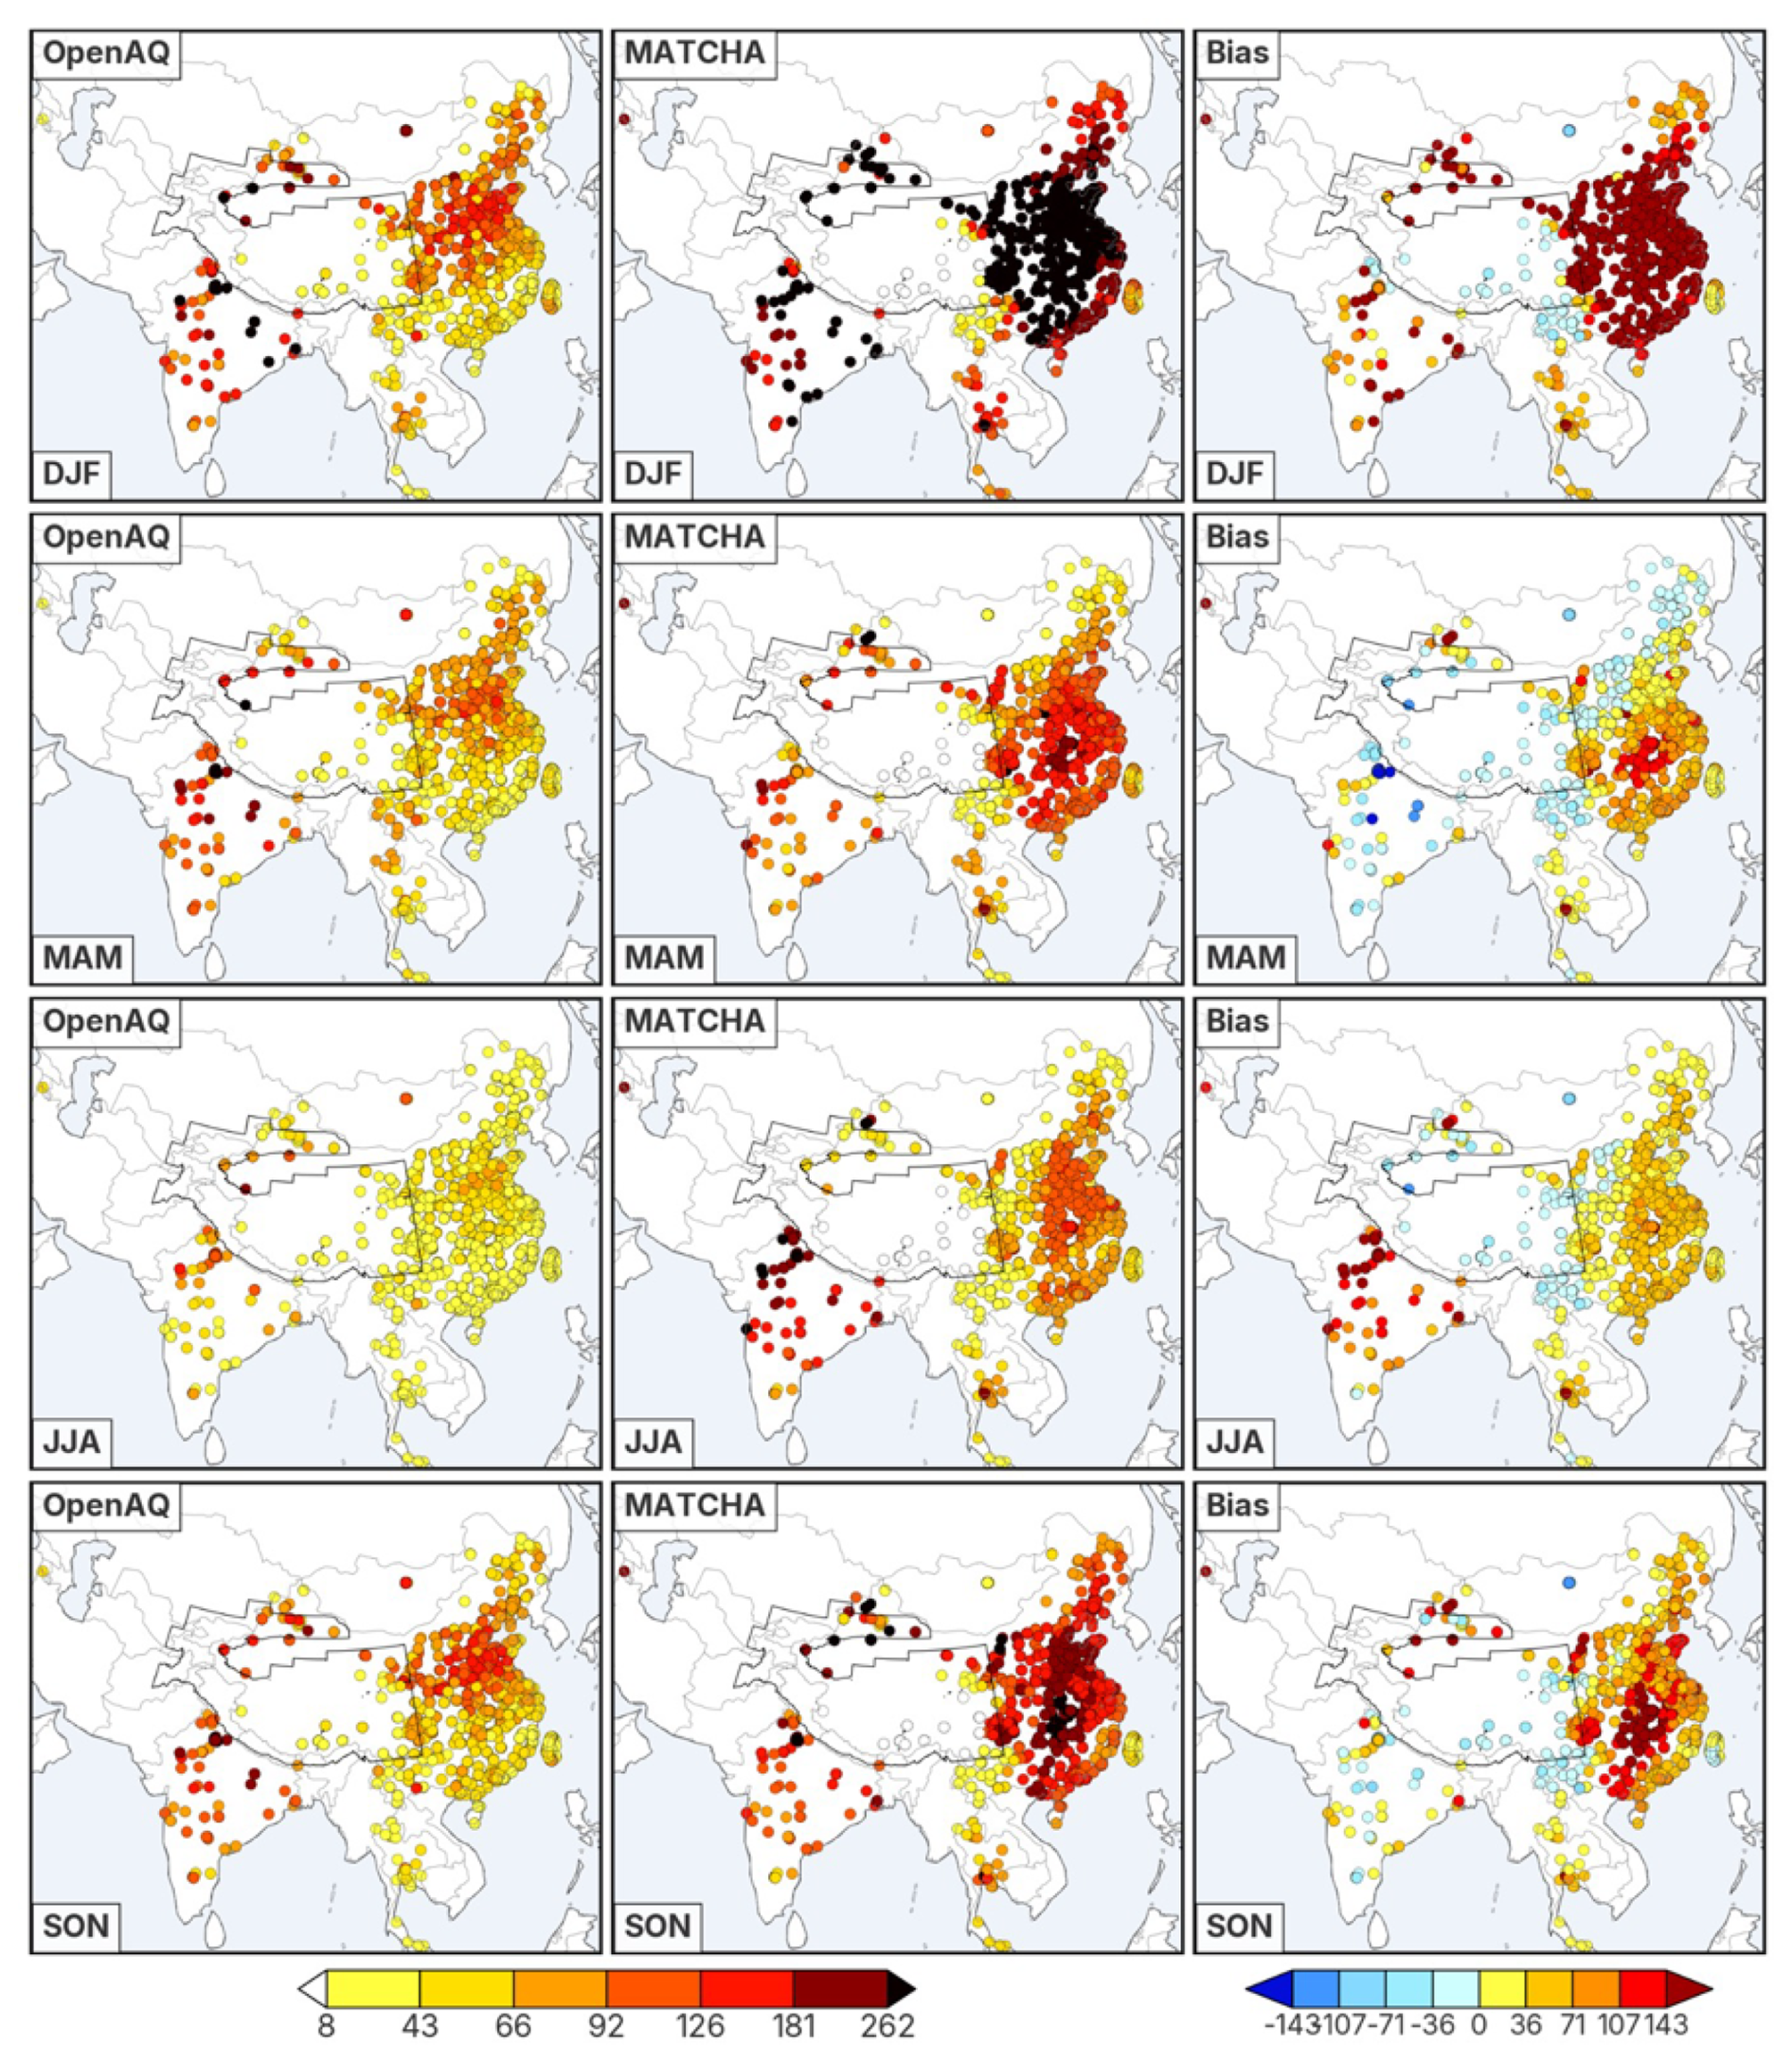
Figure A5Seasonal averages of total surface PM10 (in µg m−3) across the domain from OpenAQ (left column), MATCHA (middle), and the associated model bias (MATCHA-OpenAQ, right column).
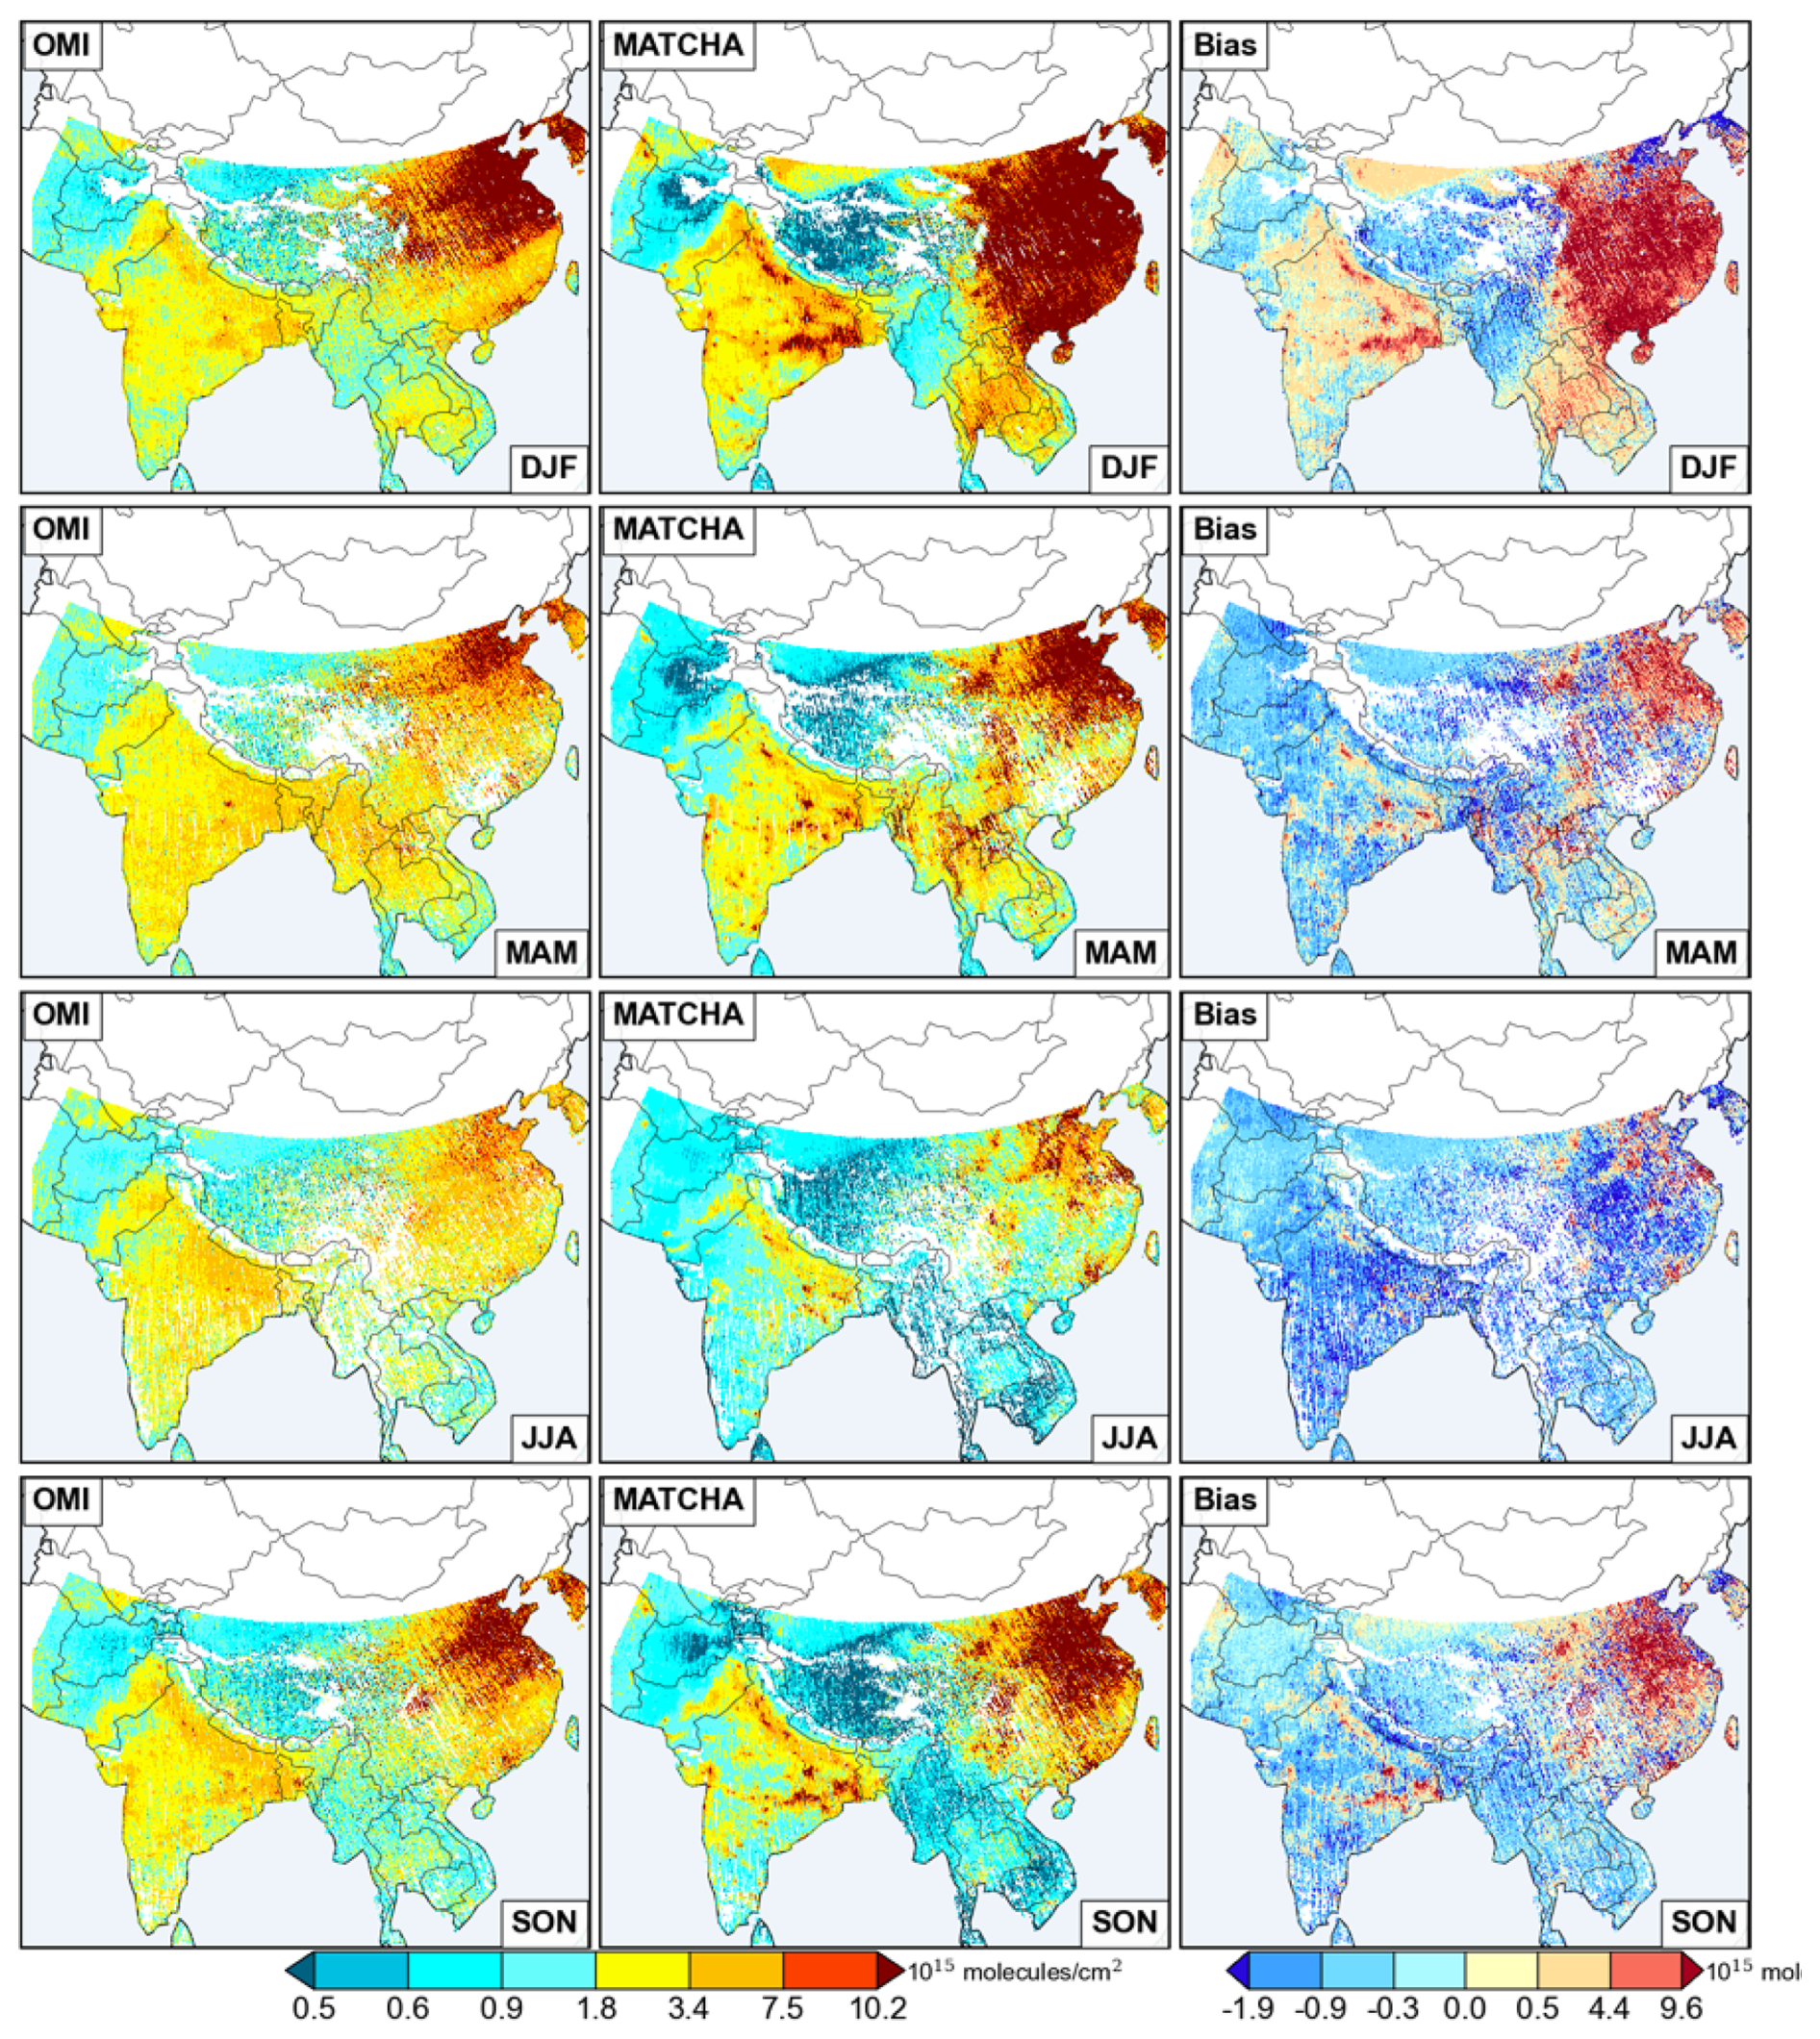
Figure A6Seasonal averages for the year 2014 of tropospheric column NO2 concentrations (molec. cm−2) from OMI satellite observations (L2 products) regridded to MATCHA's 12 km resolution (left column), MATCHA (middle column), and the associated model bias (MATCHA-OMI, right column).
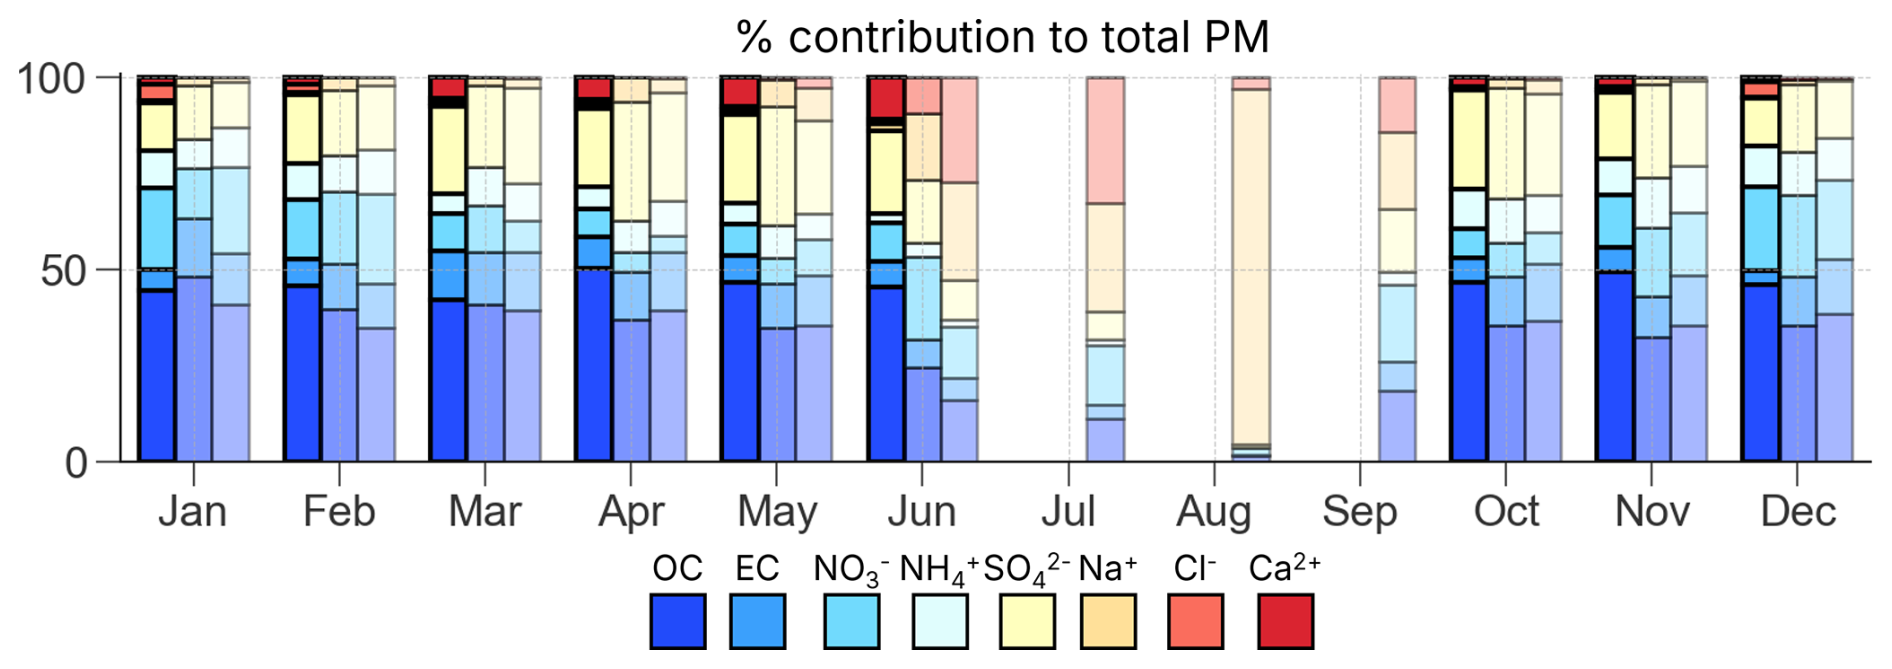
Figure A7Monthly averaged percentage contribution of eight chemical species to total particulate matter over the Kanpur site based on ∼ 1 year of observations from the site (first group of bars), ∼ 1 year of model simulation over the site (second group) and 17-year contribution (third group) from the model simulation over the site.
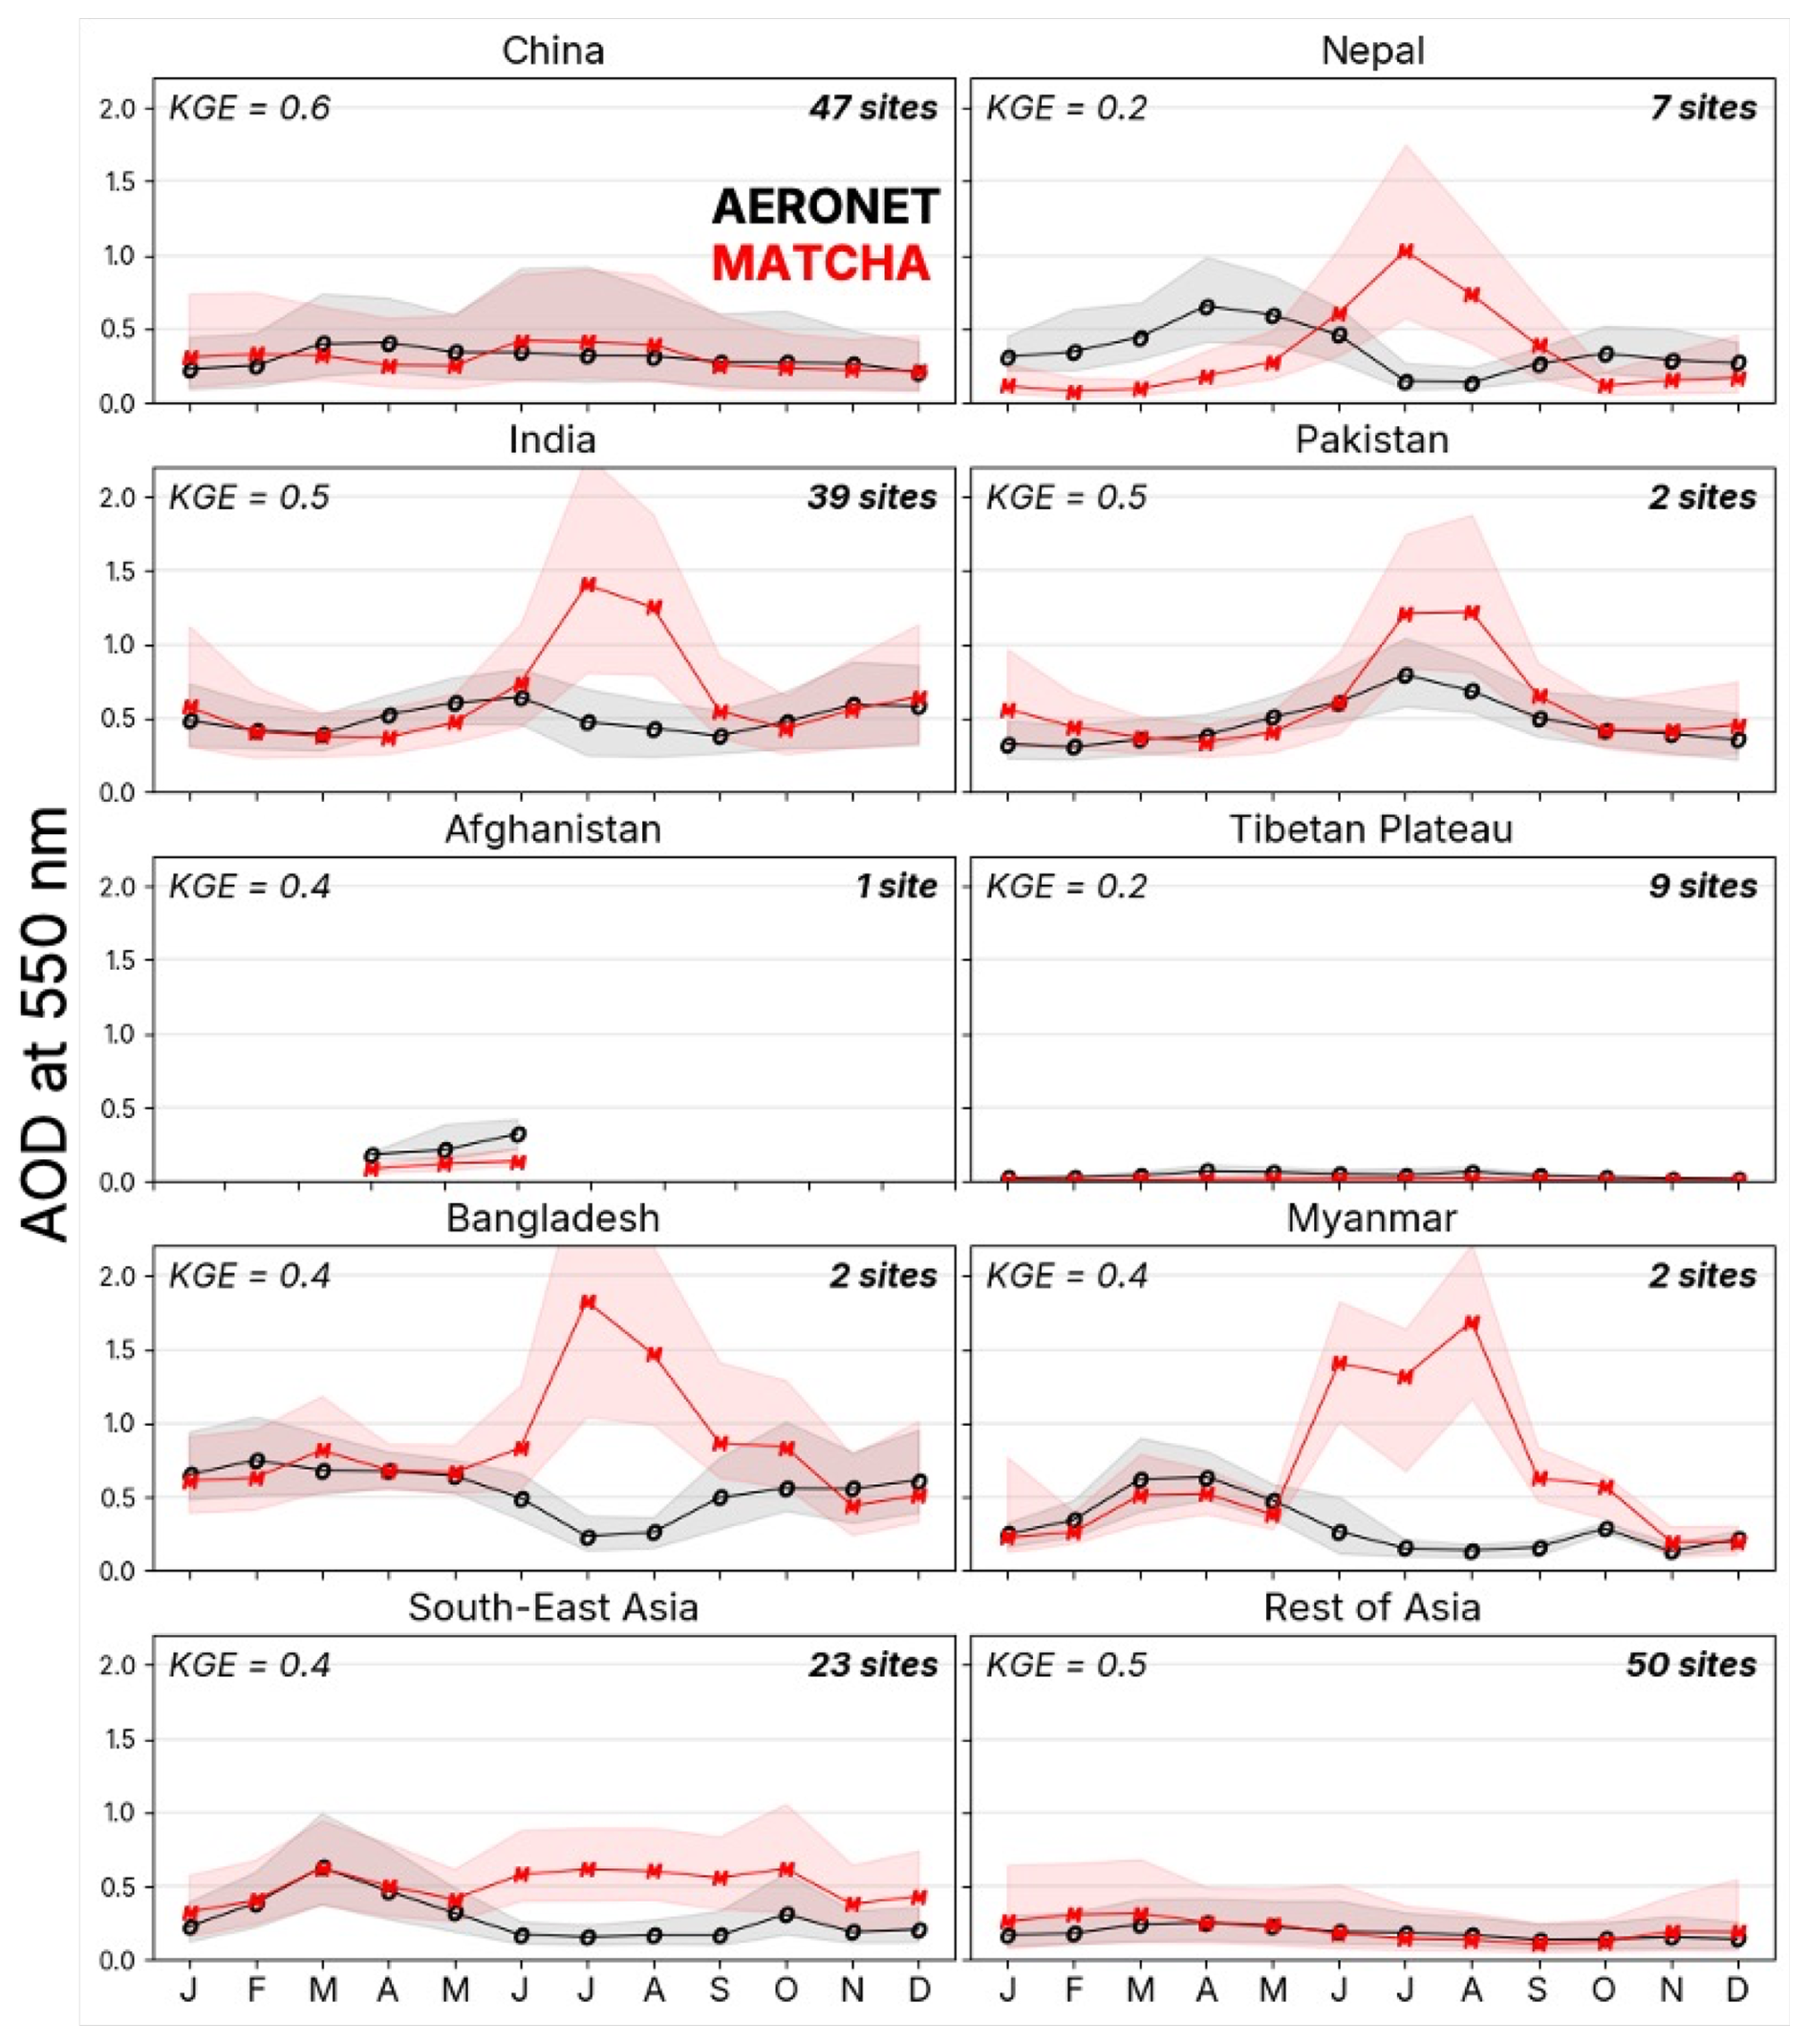
Figure A8Monthly median AOD at 550 nm with their interquartile ranges across AERONET sites (black) compared with corresponding values from MATCHA (red) across the ten tagged tracer regions within MATCHA (defined in the main text).
CR contributed to the conceptualization, methodology, formal analysis, investigation, visualization, writing- original draft, reviewing, and editing. RK contributed to the conceptualization, investigation, project administration, validation, resources, software, funding acquisition, writing-review & editing. CH contributed to the resources, software, validation, project administration, funding acquisition, writing-review & editing. WC contributed to the data curation, software, validation, writing-review & editing. KR contributed to the validation, writing-review & editing. NM contributed to validation, writing-review & editing. AFAJ contributed to the conceptualization, supervision, funding acquisition, and writing-review & editing.
The contact author has declared that none of the authors has any competing interests.
Publisher's note: Copernicus Publications remains neutral with regard to jurisdictional claims made in the text, published maps, institutional affiliations, or any other geographical representation in this paper. The authors bear the ultimate responsibility for providing appropriate place names. Views expressed in the text are those of the authors and do not necessarily reflect the views of the publisher.
This work is supported by a NASA HiMAT2 grant (#NNH19ZDA001N-HMA). HiMAT2 is an interdisciplinary multi-investigator effort to understand the cryospheric and hydrological state of HMA. This work is in tandem with the goals of the Aerosol subgroup under HiMAT2, to quantify the deposition of aerosols over snow in HMA. We also acknowledge the National Center for Atmospheric Research (NCAR) (sponsored by the National Science Foundation (NSF)) for assisting this ongoing study through high-performance computing support from Cheyenne and Derecho HPC from NCAR's Computational and Information Systems Laboratory, as well as for model runs and data curation.
This research has been supported by the Earth Sciences Division (grant no. #NNH19ZDA001N-HMA).
This paper was edited by Graciela Raga and reviewed by Narendra Ojha and one anonymous referee.
Ansari, K. and Ramachandran, S.: Aerosol characteristics over Indo-Gangetic Plain from ground-based AERONET and MERRA-2/CAMS model simulations, Atmos. Environ., 293, 119434, https://doi.org/10.1016/j.atmosenv.2022.119434, 2023.
Ansari, K. and Ramachandran, S.: Optical and physical characteristics of aerosols over Asia: AERONET, MERRA-2 and CAMS, Atmos. Environ., 326, 120470, https://doi.org/10.1016/j.atmosenv.2024.120470, 2024.
Arellano Jr., A. F., Hess, P. G., Edwards, D. P., and Baumgardner, D.: Constraints on black carbon aerosol distribution from Measurement of Pollution in the Troposphere (MOPITT) CO, Geophys. Res. Lett., 37, https://doi.org/10.1029/2010GL044416, 2010.
Ashrit, R., Indira Rani, S., Kumar, S., Karunasagar, S., Arulalan, T., Francis, T., Routray, A., Laskar, S. I., Mahmood, S., Jermey, P., Maycock, A., Renshaw, R., George, J. P., and Rajagopal, E. N.: IMDAA Regional Reanalysis: Performance Evaluation During Indian Summer Monsoon Season, J. Geophys. Res.-Atmos., 125, e2019JD030973, https://doi.org/10.1029/2019JD030973, 2020.
Barros, A. P. and Arulraj, M.: Remote Sensing of Orographic Precipitation, in: Satellite Precipitation Measurement: Volume 2, edited by: Levizzani, V., Kidd, C., Kirschbaum, D. B., Kummerow, C. D., Nakamura, K., and Turk, F. J., Springer International Publishing, Cham, 559–582, https://doi.org/10.1007/978-3-030-35798-6_6, 2020.
Boersma, K. F., Eskes, H., Richter, A., De Smedt, I., Lorente, A., Beirle, S., Van Geffen, J., Peters, E., Van Roozendael, M., and Wagner, T.: QA4ECV NO2 tropospheric and stratospheric vertical column data from OMI (Version 1.1), Royal Netherlands Meteorological Institute (KNMI) [data set], https://doi.org/10.21944/qa4ecv-no2-omi-v1.1, 2017.
Bowden, J. H., Otte, T. L., Nolte, C. G., and Otte, M. J.: Examining Interior Grid Nudging Techniques Using Two-Way Nesting in the WRF Model for Regional Climate Modeling, J. Climate, 25, 2805–2823, https://doi.org/10.1175/JCLI-D-11-00167.1, 2012.
Bright, J. M. and Gueymard, C. A.: Climate-specific and global validation of MODIS Aqua and Terra aerosol optical depth at 452 AERONET stations, Sol. Energy, 183, 594–605, https://doi.org/10.1016/j.solener.2019.03.043, 2019.
Cannon, F., Carvalho, L. M. V., Jones, C., Norris, J., Bookhagen, B., and Kiladis, G. N.: Effects of topographic smoothing on the simulation of winter precipitation in High Mountain Asia, J. Geophys. Res.-Atmos., 122, 1456–1474, https://doi.org/10.1002/2016JD026038, 2017.
Carvalho, D.: An Assessment of NASA's GMAO MERRA-2 Reanalysis Surface Winds, J. Climate, 32, 8261–8281, https://doi.org/10.1175/JCLI-D-19-0199.1, 2019.
Chen, X., Yang, T., Wang, Z., Wang, F., and Wang, H.: An ensemble method for improving the estimation of planetary boundary layer height from radiosonde data, Atmos. Meas. Tech., 16, 4289–4302, https://doi.org/10.5194/amt-16-4289-2023, 2023.
Chen, Y., Cheng, Y., Ma, N., Wolke, R., Nordmann, S., Schüttauf, S., Ran, L., Wehner, B., Birmili, W., van der Gon, H. A. C. D., Mu, Q., Barthel, S., Spindler, G., Stieger, B., Müller, K., Zheng, G.-J., Pöschl, U., Su, H., and Wiedensohler, A.: Sea salt emission, transport and influence on size-segregated nitrate simulation: a case study in northwestern Europe by WRF-Chem, Atmos. Chem. Phys., 16, 12081–12097, https://doi.org/10.5194/acp-16-12081-2016, 2016.
Cheng, W. Y. Y. and Steenburgh, W. J.: Evaluation of Surface Sensible Weather Forecasts by the WRF and the Eta Models over the Western United States, Weather Forecast., 20, 812–821, https://doi.org/10.1175/WAF885.1, 2005.
Collins, W. J., Lamarque, J.-F., Schulz, M., Boucher, O., Eyring, V., Hegglin, M. I., Maycock, A., Myhre, G., Prather, M., Shindell, D., and Smith, S. J.: AerChemMIP: quantifying the effects of chemistry and aerosols in CMIP6, Geosci. Model Dev., 10, 585–607, https://doi.org/10.5194/gmd-10-585-2017, 2017.
Cuchiara, G. C. and Rappenglück, B.: Single-column model and large eddy simulation of the evening transition in the planetary boundary layer, Environ. Fluid Mech., 17, 777–798, https://doi.org/10.1007/s10652-017-9518-z, 2017.
Dee, D. P., Uppala, S. M., Simmons, A. J., Berrisford, P., Poli, P., Kobayashi, S., Andrae, U., Balmaseda, M. A., Balsamo, G., Bauer, P., Bechtold, P., Beljaars, A. C. M., van de Berg, L., Bidlot, J., Bormann, N., Delsol, C., Dragani, R., Fuentes, M., Geer, A. J., Haimberger, L., Healy, S. B., Hersbach, H., Hólm, E. V., Isaksen, L., Kållberg, P., Köhler, M., Matricardi, M., McNally, A. P., Monge-Sanz, B. M., Morcrette, J.-J., Park, B.-K., Peubey, C., de Rosnay, P., Tavolato, C., Thépaut, J.-N., and Vitart, F.: The ERA-Interim reanalysis: configuration and performance of the data assimilation system, Q. J. Roy. Meteor. Soc., 137, 553–597, https://doi.org/10.1002/qj.828, 2011.
Deeter, M., Francis, G., Gille, J., Mao, D., Martínez-Alonso, S., Worden, H., Ziskin, D., Drummond, J., Commane, R., Diskin, G., and McKain, K.: The MOPITT Version 9 CO product: sampling enhancements and validation, Atmos. Meas. Tech., 15, 2325–2344, https://doi.org/10.5194/amt-15-2325-2022, 2022.
Demuzere, M., Kittner, J., Martilli, A., Mills, G., Moede, C., Stewart, I. D., van Vliet, J., and Bechtel, B.: A global map of local climate zones to support earth system modelling and urban-scale environmental science, Earth Syst. Sci. Data, 14, 3835–3873, https://doi.org/10.5194/essd-14-3835-2022, 2022.
Dollan, I. J., Maina, F. Z., Kumar, S. V., Nikolopoulos, E. I., and Maggioni, V.: An assessment of gridded precipitation products over High Mountain Asia, J. Hydrol. Reg. Stud., 52, 101675, https://doi.org/10.1016/j.ejrh.2024.101675, 2024.
Dong, Y., Li, J., Yan, X., Li, C., Jiang, Z., Xiong, C., Chang, L., Zhang, L., Ying, T., and Zhang, Z.: Retrieval of aerosol single scattering albedo using joint satellite and surface visibility measurements, Remote Sens. Environ., 294, 113654, https://doi.org/10.1016/j.rse.2023.113654, 2023.
Dubovik, O., Smirnov, A., Holben, B. N., King, M. D., Kaufman, Y. J., Eck, T. F., and Slutsker, I.: Accuracy assessments of aerosol optical properties retrieved from Aerosol Robotic Network (AERONET) Sun and sky radiance measurements, J. Geophys. Res.-Atmos., 105, 9791–9806, https://doi.org/10.1029/2000JD900040, 2000.
Durre, I., Vose, R. S., and Wuertz, D. B.: Overview of the Integrated Global Radiosonde Archive, J. Climate, 19, 53–68, https://doi.org/10.1175/JCLI3594.1, 2006.
Durre, I., Yin, X., Vose, R. S., Applequist, S., and Arnfield, J.: Enhancing the Data Coverage in the Integrated Global Radiosonde Archive, J. Atmos. Ocean. Tech., 35, 1753–1770, https://doi.org/10.1175/JTECH-D-17-0223.1, 2018.
Easter, R. C., Ghan, S. J., Zhang, Y., Saylor, R. D., Chapman, E. G., Laulainen, N. S., Abdul-Razzak, H., Leung, L. R., Bian, X., and Zaveri, R. A.: MIRAGE: Model description and evaluation of aerosols and trace gases, J. Geophys. Res.-Atmos., 109, https://doi.org/10.1029/2004JD004571, 2004.
Emmons, L. K., Walters, S., Hess, P. G., Lamarque, J.-F., Pfister, G. G., Fillmore, D., Granier, C., Guenther, A., Kinnison, D., Laepple, T., Orlando, J., Tie, X., Tyndall, G., Wiedinmyer, C., Baughcum, S. L., and Kloster, S.: Description and evaluation of the Model for Ozone and Related chemical Tracers, version 4 (MOZART-4), Geosci. Model Dev., 3, 43–67, https://doi.org/10.5194/gmd-3-43-2010, 2010.
Faber, E., Rocha-Lima, A., Colarco, P., and Baker, B.: Evaluation of 10-m Wind Speed From ISD Meteorological Stations and the MERRA-2 Reanalysis: Impacts on Dust Emission in the Arabian Peninsula, J. Geophys. Res.-Atmos., 129, e2024JD040885, https://doi.org/10.1029/2024JD040885, 2024.
Fast, J. D., Gustafson Jr., W. I., Easter, R. C., Zaveri, R. A., Barnard, J. C., Chapman, E. G., Grell, G. A., and Peckham, S. E.: Evolution of ozone, particulates, and aerosol direct radiative forcing in the vicinity of Houston using a fully coupled meteorology-chemistry-aerosol model, J. Geophys. Res.-Atmos., 111, https://doi.org/10.1029/2005JD006721, 2006.
Flanner, M. G., Zender, C. S., Randerson, J. T., and Rasch, P. J.: Present-day climate forcing and response from black carbon in snow, J. Geophys. Res.-Atmos., 112, https://doi.org/10.1029/2006JD008003, 2007.
Flanner, M. G., Zender, C. S., Hess, P. G., Mahowald, N. M., Painter, T. H., Ramanathan, V., and Rasch, P. J.: Springtime warming and reduced snow cover from carbonaceous particles, Atmos. Chem. Phys., 9, 2481–2497, https://doi.org/10.5194/acp-9-2481-2009, 2009.
Flanner, M. G., Liu, X., Zhou, C., Penner, J. E., and Jiao, C.: Enhanced solar energy absorption by internally-mixed black carbon in snow grains, Atmos. Chem. Phys., 12, 4699–4721, https://doi.org/10.5194/acp-12-4699-2012, 2012.
Freitas, S. R., Longo, K. M., Chatfield, R., Latham, D., Silva Dias, M. A. F., Andreae, M. O., Prins, E., Santos, J. C., Gielow, R., and Carvalho Jr., J. A.: Including the sub-grid scale plume rise of vegetation fires in low resolution atmospheric transport models, Atmos. Chem. Phys., 7, 3385–3398, https://doi.org/10.5194/acp-7-3385-2007, 2007.
Ganzeveld, L., Bouwman, L., Stehfest, E., van Vuuren, D. P., Eickhout, B., and Lelieveld, J.: Impact of future land use and land cover changes on atmospheric chemistry-climate interactions, J. Geophys. Res.-Atmos., 115, https://doi.org/10.1029/2010JD014041, 2010.
Gaubert, B., Emmons, L. K., Raeder, K., Tilmes, S., Miyazaki, K., Arellano Jr., A. F., Elguindi, N., Granier, C., Tang, W., Barré, J., Worden, H. M., Buchholz, R. R., Edwards, D. P., Franke, P., Anderson, J. L., Saunois, M., Schroeder, J., Woo, J.-H., Simpson, I. J., Blake, D. R., Meinardi, S., Wennberg, P. O., Crounse, J., Teng, A., Kim, M., Dickerson, R. R., He, H., Ren, X., Pusede, S. E., and Diskin, G. S.: Correcting model biases of CO in East Asia: impact on oxidant distributions during KORUS-AQ, Atmos. Chem. Phys., 20, 14617–14647, https://doi.org/10.5194/acp-20-14617-2020, 2020.
Ghude, S. D., Kumar, R., Jena, C., Debnath, S., Kulkarni, R. G., Alessandrini, S., Biswas, M., Kulkrani, S., Pithani, P., Kelkar, S., Sajjan, V., Chate, D. M., Soni, V. K., Singh, S., Nanjundiah, R. S., and Rajeevan, M.: Evaluation of PM2.5 forecast using chemical data assimilation in the WRF-Chem model, Curr. Sci., 118, 1803–1815, 2020.
Giles, D. M., Sinyuk, A., Sorokin, M. G., Schafer, J. S., Smirnov, A., Slutsker, I., Eck, T. F., Holben, B. N., Lewis, J. R., Campbell, J. R., Welton, E. J., Korkin, S. V., and Lyapustin, A. I.: Advancements in the Aerosol Robotic Network (AERONET) Version 3 database – automated near-real-time quality control algorithm with improved cloud screening for Sun photometer aerosol optical depth (AOD) measurements, Atmos. Meas. Tech., 12, 169–209, https://doi.org/10.5194/amt-12-169-2019, 2019.
Ginoux, P., Chin, M., Tegen, I., Prospero, J. M., Holben, B., Dubovik, O., and Lin, S.-J.: Sources and distributions of dust aerosols simulated with the GOCART model, J. Geophys. Res.-Atmos., 106, 20255–20273, https://doi.org/10.1029/2000JD000053, 2001.
Gong, S. L.: A parameterization of sea-salt aerosol source function for sub- and super-micron particles, Global Biogeochem. Cy., 17, https://doi.org/10.1029/2003GB002079, 2003.
Gong, S. L., Barrie, L. A., and Blanchet, J.-P.: Modeling sea-salt aerosols in the atmosphere: 1. Model development, J. Geophys. Res.-Atmos., 102, 3805–3818, https://doi.org/10.1029/96JD02953, 1997.
Goto, D., Schutgens, N. A. J., Nakajima, T., and Takemura, T.: Sensitivity of aerosol to assumed optical properties over Asia using a global aerosol model and AERONET, Geophys. Res. Lett., 38, https://doi.org/10.1029/2011GL048675, 2011.
Govardhan, G. R., Nanjundiah, R. S., Satheesh, S. K., Moorthy, K. K., and Takemura, T.: Inter-comparison and performance evaluation of chemistry transport models over Indian region, Atmos. Environ., 125, 486–504, https://doi.org/10.1016/j.atmosenv.2015.10.065, 2016.
Granier, C., Darras, S., Denier van der Gon, H., Doubalova, J., Elguindi, N., Galle, B., Gauss, M., Guevara, M., Jalkanen, J.-P., Kuenen, J., Liousse, C., Quack, B., Simpson, D., and Sindelarova, K.: The Copernicus Atmosphere Monitoring Service global and regional emissions (April 2019 version), Copernicus Atmosphere Monitoring Service (CAMS) [data set], https://doi.org/10.24380/d0bn-kx16, 2019.
Grell, G. A. and Freitas, S. R.: A scale and aerosol aware stochastic convective parameterization for weather and air quality modeling, Atmos. Chem. Phys., 14, 5233–5250, https://doi.org/10.5194/acp-14-5233-2014, 2014.
Grell, G. A., Peckham, S. E., Schmitz, R., McKeen, S. A., Frost, G., Skamarock, W. C., and Eder, B.: Fully coupled “online” chemistry within the WRF model, Atmos. Environ., 39, 6957–6975, https://doi.org/10.1016/j.atmosenv.2005.04.027, 2005.
Guenther, A., Karl, T., Harley, P., Wiedinmyer, C., Palmer, P. I., and Geron, C.: Estimates of global terrestrial isoprene emissions using MEGAN (Model of Emissions of Gases and Aerosols from Nature), Atmos. Chem. Phys., 6, 3181–3210, https://doi.org/10.5194/acp-6-3181-2006, 2006.
Gueymard, C. A. and Yang, D.: Worldwide validation of CAMS and MERRA-2 reanalysis aerosol optical depth products using 15 years of AERONET observations, Atmos. Environ., 225, 117216, https://doi.org/10.1016/j.atmosenv.2019.117216, 2020.
Guo, J., Zhang, J., Yang, K., Liao, H., Zhang, S., Huang, K., Lv, Y., Shao, J., Yu, T., Tong, B., Li, J., Su, T., Yim, S. H. L., Stoffelen, A., Zhai, P., and Xu, X.: Investigation of near-global daytime boundary layer height using high-resolution radiosondes: first results and comparison with ERA5, MERRA-2, JRA-55, and NCEP-2 reanalyses, Atmos. Chem. Phys., 21, 17079–17097, https://doi.org/10.5194/acp-21-17079-2021, 2021.
Gupta, H. V., Kling, H., Yilmaz, K. K., and Martinez, G. F.: Decomposition of the mean squared error and NSE performance criteria: Implications for improving hydrological modelling, J. Hydrol., 377, 80–91, https://doi.org/10.1016/j.jhydrol.2009.08.003, 2009.
Hahn, D. G. and Manabe, S.: The Role of Mountains in the South Asian Monsoon Circulation, J. Atmos. Sci., 32, 1515–1541, https://doi.org/10.1175/1520-0469(1975)032<1515:TROMIT>2.0.CO;2, 1975.
Hall, D. K. and Riggs, G. A.: Accuracy assessment of the MODIS snow products, Hydrol. Process., 21, 1534–1547, https://doi.org/10.1002/hyp.6715, 2007.
Hasenkopf, C. A., Flasher, J. C., Veerman, O., Scalamogna, A., Silva, D., Salmon, M., Buuralda, D., and DeWitt, L. H.: Stories from OpenAQ, a Global and Grassroots Open Air Quality Community, AGU Fall Meeting Abstracts, ADS Bibcode: 2016AGUFMPA43A2162H, PA43A-2162, 2016.
Hasson, S. ul, Gerlitz, L., Schickhoff, U., Scholten, T., and Böhner, J.: Recent Climate Change over High Asia, in: Climate Change, Glacier Response, and Vegetation Dynamics in the Himalaya: Contributions Toward Future Earth Initiatives, edited by: Singh, R., Schickhoff, U., and Mal, S., Springer International Publishing, Cham, 29–48, https://doi.org/10.1007/978-3-319-28977-9_2, 2016.
He, C.: Modelling light-absorbing particle–snow–radiation interactions and impacts on snow albedo: fundamentals, recent advances and future directions, Environ. Chem., 19, 296–311, https://doi.org/10.1071/EN22013, 2022.
He, C., Li, Q., Liou, K.-N., Takano, Y., Gu, Y., Qi, L., Mao, Y., and Leung, L. R.: Black carbon radiative forcing over the Tibetan Plateau, Geophys. Res. Lett., 41, 7806–7813, https://doi.org/10.1002/2014GL062191, 2014.
He, C., Flanner, M. G., Chen, F., Barlage, M., Liou, K.-N., Kang, S., Ming, J., and Qian, Y.: Black carbon-induced snow albedo reduction over the Tibetan Plateau: uncertainties from snow grain shape and aerosol–snow mixing state based on an updated SNICAR model, Atmos. Chem. Phys., 18, 11507–11527, https://doi.org/10.5194/acp-18-11507-2018, 2018.
Holben, B. N., Eck, T. F., Slutsker, I., Tanré, D., Buis, J. P., Setzer, A., Vermote, E., Reagan, J. A., Kaufman, Y. J., Nakajima, T., Lavenu, F., Jankowiak, I., and Smirnov, A.: AERONET – A Federated Instrument Network and Data Archive for Aerosol Characterization, Remote Sens. Environ., 66, 1–16, https://doi.org/10.1016/S0034-4257(98)00031-5, 1998.
Hong, S.-Y.: A new stable boundary-layer mixing scheme and its impact on the simulated East Asian summer monsoon, Q. J. Roy. Meteor. Soc., 136, 1481–1496, https://doi.org/10.1002/qj.665, 2010.
Hooghiemstra, P. B., Krol, M. C., Bergamaschi, P., de Laat, A. T. J., van der Werf, G. R., Novelli, P. C., Deeter, M. N., Aben, I., and Röckmann, T.: Comparing optimized CO emission estimates using MOPITT or NOAA surface network observations, J. Geophys. Res.-Atmos., 117, https://doi.org/10.1029/2011JD017043, 2012.
Huang, H., Qian, Y., He, C., Bair, E. H., and Rittger, K.: Snow Albedo Feedbacks Enhance Snow Impurity-Induced Radiative Forcing in the Sierra Nevada, Geophys. Res. Lett., 49, e2022GL098102, https://doi.org/10.1029/2022GL098102, 2022.
Huffman, G. J., Bolvin, D., Braithwaite, D., Hsu, K., Joyce, R., and Xie, P.: GPM IMERG Final Precipitation L3 1 day 0.1 degree x 0.1 degree V06, https://doi.org/10.5067/GPM/IMERGDF/DAY/06, 2014.
Hyland, R. W. and Wexler, A.: Formulations for the thermodynamic properties of the saturated phases of H2O from 173.15 K to 473.15 K, ASHRAE T., 89, 500–519, 1983.
Iacono, M. J., Delamere, J. S., Mlawer, E. J., Shephard, M. W., Clough, S. A., and Collins, W. D.: Radiative forcing by long-lived greenhouse gases: Calculations with the AER radiative transfer models, J. Geophys. Res.-Atmos., 113, https://doi.org/10.1029/2008JD009944, 2008.
Immerzeel, W. W., Droogers, P., de Jong, S. M., and Bierkens, M. F. P.: Large-scale monitoring of snow cover and runoff simulation in Himalayan river basins using remote sensing, Remote Sens. Environ., 113, 40–49, https://doi.org/10.1016/j.rse.2008.08.010, 2009.
Immerzeel, W. W., van Beek, L. P. H., and Bierkens, M. F. P.: Climate Change Will Affect the Asian Water Towers, Science, 328, 1382–1385, https://doi.org/10.1126/science.1183188, 2010.
Inness, A., Ades, M., Agustí-Panareda, A., Barré, J., Benedictow, A., Blechschmidt, A.-M., Dominguez, J. J., Engelen, R., Eskes, H., Flemming, J., Huijnen, V., Jones, L., Kipling, Z., Massart, S., Parrington, M., Peuch, V.-H., Razinger, M., Remy, S., Schulz, M., and Suttie, M.: The CAMS reanalysis of atmospheric composition, Atmos. Chem. Phys., 19, 3515–3556, https://doi.org/10.5194/acp-19-3515-2019, 2019.
Jiang, Z., Jones, D. B. A., Worden, H. M., and Henze, D. K.: Sensitivity of top-down CO source estimates to the modeled vertical structure in atmospheric CO, Atmos. Chem. Phys., 15, 1521–1537, https://doi.org/10.5194/acp-15-1521-2015, 2015.
Jiménez, P. A. and Dudhia, J.: Improving the Representation of Resolved and Unresolved Topographic Effects on Surface Wind in the WRF Model, J. Appl. Meteorol. Clim., 51, 300–316, https://doi.org/10.1175/JAMC-D-11-084.1, 2012.
Jo, D. S., Park, R. J., Lee, S., Kim, S.-W., and Zhang, X.: A global simulation of brown carbon: implications for photochemistry and direct radiative effect, Atmos. Chem. Phys., 16, 3413–3432, https://doi.org/10.5194/acp-16-3413-2016, 2016.
Kang, S., Zhang, Y., Chen, P., Guo, J., Zhang, Q., Cong, Z., Kaspari, S., Tripathee, L., Gao, T., Niu, H., Zhong, X., Chen, X., Hu, Z., Li, X., Li, Y., Neupane, B., Yan, F., Rupakheti, D., Gul, C., Zhang, W., Wu, G., Yang, L., Wang, Z., and Li, C.: Black carbon and organic carbon dataset over the Third Pole, Earth Syst. Sci. Data, 14, 683–707, https://doi.org/10.5194/essd-14-683-2022, 2022.
Kirschbaum, D., Kapnick, S. B., Stanley, T., and Pascale, S.: Changes in Extreme Precipitation and Landslides Over High Mountain Asia, Geophys. Res. Lett., 47, e2019GL085347, https://doi.org/10.1029/2019GL085347, 2020.
Kumar, R., Naja, M., Pfister, G. G., Barth, M. C., and Brasseur, G. P.: Source attribution of carbon monoxide in India and surrounding regions during wintertime, J. Geophys. Res.-Atmos., 118, 1981–1995, https://doi.org/10.1002/jgrd.50134, 2013.
Kumar, R., Barth, M. C., Pfister, G. G., Naja, M., and Brasseur, G. P.: WRF-Chem simulations of a typical pre-monsoon dust storm in northern India: influences on aerosol optical properties and radiation budget, Atmos. Chem. Phys., 14, 2431–2446, https://doi.org/10.5194/acp-14-2431-2014, 2014.
Kumar, R., Barth, M. C., Nair, V. S., Pfister, G. G., Suresh Babu, S., Satheesh, S. K., Krishna Moorthy, K., Carmichael, G. R., Lu, Z., and Streets, D. G.: Sources of black carbon aerosols in South Asia and surrounding regions during the Integrated Campaign for Aerosols, Gases and Radiation Budget (ICARB), Atmos. Chem. Phys., 15, 5415–5428, https://doi.org/10.5194/acp-15-5415-2015, 2015a.
Kumar, R., Barth, M. C., Pfister, G. G., Nair, V. S., Ghude, S. D., and Ojha, N.: What controls the seasonal cycle of black carbon aerosols in India?, J. Geophys. Res.-Atmos., 120, 7788–7812, https://doi.org/10.1002/2015JD023298, 2015b.
Kumar, R., Delle Monache, L., Bresch, J., Saide, P. E., Tang, Y., Liu, Z., da Silva, A. M., Alessandrini, S., Pfister, G., Edwards, D., Lee, P., and Djalalova, I.: Toward Improving Short-Term Predictions of Fine Particulate Matter Over the United States Via Assimilation of Satellite Aerosol Optical Depth Retrievals, J. Geophys. Res.-Atmos., 124, 2753–2773, https://doi.org/10.1029/2018JD029009, 2019.
Kumar, R., Ghude, S. D., Biswas, M., Jena, C., Alessandrini, S., Debnath, S., Kulkarni, S., Sperati, S., Soni, V. K., Nanjundiah, R. S., and Rajeevan, M.: Enhancing Accuracy of Air Quality and Temperature Forecasts During Paddy Crop Residue Burning Season in Delhi Via Chemical Data Assimilation, J. Geophys. Res.-Atmos., 125, e2020JD033019, https://doi.org/10.1029/2020JD033019, 2020.
Kumar, R., He, C., Bhardwaj, P., Lacey, F., Buchholz, R. R., Brasseur, G. P., Joubert, W., Labuschagne, C., Kozlova, E., and Mkololo, T.: Assessment of regional carbon monoxide simulations over Africa and insights into source attribution and regional transport, Atmos. Environ., 277, 119075, https://doi.org/10.1016/j.atmosenv.2022.119075, 2022.
Kumar, R., He, C., Roychoudhury, C., Cheng, W., Mizukami, N., and Arellano A. F.: High Mountain Asia 12 Km Modeled Estimates Of Aerosol Transport, Chemistry, And Deposition Reanalysis, 2003–2019, Version 1, https://doi.org/10.5067/CG4OT8DJX2Z7, 2024.
Kumar, R., Bhardwaj, P., He, C., Boehnert, J., Lacey, F., Alessandrini, S., Sampson, K., Casali, M., Swerdlin, S., Wilhelmi, O., Pfister, G. G., Gaubert, B., and Worden, H.: A long-term high-resolution air quality reanalysis with a public-facing air quality dashboard over the Contiguous United States (CONUS), Earth Syst. Sci. Data, 17, 1807–1834, https://doi.org/10.5194/essd-17-1807-2025, 2025.
Lawrence, D. M., Oleson, K. W., Flanner, M. G., Thornton, P. E., Swenson, S. C., Lawrence, P. J., Zeng, X., Yang, Z.-L., Levis, S., Sakaguchi, K., Bonan, G. B., and Slater, A. G.: Parameterization improvements and functional and structural advances in Version 4 of the Community Land Model, J. Adv. Model. Earth Sy., 3, https://doi.org/10.1029/2011MS00045, 2011.
Lee, H.-J., Jo, H.-Y., Kim, J.-M., Bak, J., Park, M.-S., Kim, J.-K., Jo, Y.-J., and Kim, C.-H.: Nocturnal Boundary Layer Height Uncertainty in Particulate Matter Simulations during the KORUS-AQ Campaign, Remote Sens., 15, 300, https://doi.org/10.3390/rs15020300, 2023.
Lee, J., Lee, E.-H., and Seol, K.-H.: Validation of Integrated MultisatellitE Retrievals for GPM (IMERG) by using gauge-based analysis products of daily precipitation over East Asia, Theor. Appl. Climatol., 137, 2497–2512, https://doi.org/10.1007/s00704-018-2749-1, 2019.
Leys, C., Ley, C., Klein, O., Bernard, P., and Licata, L.: Detecting outliers: Do not use standard deviation around the mean, use absolute deviation around the median, J. Exp. Soc. Psychol., 49, 764–766, https://doi.org/10.1016/j.jesp.2013.03.013, 2013.
Li, C., Su, F., Yang, D., Tong, K., Meng, F., and Kan, B.: Spatiotemporal variation of snow cover over the Tibetan Plateau based on MODIS snow product, 2001–2014, Int. J. Climatol., 38, 708–728, https://doi.org/10.1002/joc.5204, 2018.
Liu, D., He, C., Schwarz, J. P., and Wang, X.: Lifecycle of light-absorbing carbonaceous aerosols in the atmosphere, npj Clim. Atmos. Sci., 3, 1–18, https://doi.org/10.1038/s41612-020-00145-8, 2020.
Liu, L., Cao, X., Li, S., and Jie, N.: A 31-year (1990–2020) global gridded population dataset generated by cluster analysis and statistical learning, Sci. Data, 11, 124, https://doi.org/10.1038/s41597-024-02913-0, 2024.
Liu, S. and Liang, X.-Z.: Observed Diurnal Cycle Climatology of Planetary Boundary Layer Height, J. Climate, 23, 5790–5809, https://doi.org/10.1175/2010JCLI3552.1, 2010.
Liu, Y., Fang, Y., and Margulis, S. A.: High Mountain Asia UCLA daily snow reanalysis, version 1, NASA National Snow and Ice Data Center Distributed Active Archive Center [data set], https://doi.org/10.5067/HNAUGJQXSCVU, 2021.
Liu, Z., Liu, Q., Lin, H.-C., Schwartz, C. S., Lee, Y.-H., and Wang, T.: Three-dimensional variational assimilation of MODIS aerosol optical depth: Implementation and application to a dust storm over East Asia, J. Geophys. Res.-Atmos., 116, https://doi.org/10.1029/2011JD016159, 2011.
Lott, J. N.: The quality control of the Integrated Surface Hourly database, in: 14th conference on applied climatology, 2004.
Lu, Z., Streets, D. G., Winijkul, E., Yan, F., Chen, Y., Bond, T. C., Feng, Y., Dubey, M. K., Liu, S., Pinto, J. P., and Carmichael, G. R.: Light Absorption Properties and Radiative Effects of Primary Organic Aerosol Emissions, Environ. Sci. Technol., 49, 4868–4877, https://doi.org/10.1021/acs.est.5b00211, 2015.
Madonna, F., Summa, D., Di Girolamo, P., Marra, F., Wang, Y., and Rosoldi, M.: Assessment of Trends and Uncertainties in the Atmospheric Boundary Layer Height Estimated Using Radiosounding Observations over Europe, Atmosphere, 12, 301, https://doi.org/10.3390/atmos12030301, 2021.
Madonna, F., Tramutola, E., Sy, S., Serva, F., Proto, M., Rosoldi, M., Gagliardi, S., Amato, F., Marra, F., Fassò, A., Gardiner, T., and Thorne, P. W.: The New Radiosounding HARMonization (RHARM) Data Set of Homogenized Radiosounding Temperature, Humidity, and Wind Profiles With Uncertainties, J. Geophys. Res.-Atmos., 127, e2021JD035220, https://doi.org/10.1029/2021JD035220, 2022.
Maina, F. Z., Kumar, S. V., Dollan, I. J., and Maggioni, V.: Development and Evaluation of Ensemble Consensus Precipitation Estimates over High Mountain Asia, J. Hydrometeorol., 23, 1469–1486, https://doi.org/10.1175/JHM-D-21-0196.1, 2022a.
Maina, F. Z., Kumar, S. V., and Gangodagamage, C.: Irrigation and warming drive the decreases in surface albedo over High Mountain Asia, Sci. Rep., 12, 16163, https://doi.org/10.1038/s41598-022-20564-2, 2022b.
Maina, F. Z., Kumar, S. V., Albergel, C., and Mahanama, S. P.: Warming, increase in precipitation, and irrigation enhance greening in High Mountain Asia, Commun. Earth Environ., 3, 1–8, https://doi.org/10.1038/s43247-022-00374-0, 2022c.
Maina, F. Z., Xue, Y., Kumar, S. V., Getirana, A., McLarty, S., Appana, R., Forman, B., Zaitchik, B., Loomis, B., Maggioni, V., and Zhou, Y.: Development of a multidecadal land reanalysis over High Mountain Asia, Sci. Data, 11, 827, https://doi.org/10.1038/s41597-024-03643-z, 2024.
Malm, W. C. and Hand, J. L.: An examination of the physical and optical properties of aerosols collected in the IMPROVE program, Atmos. Environ., 41, 3407–3427, https://doi.org/10.1016/j.atmosenv.2006.12.012, 2007.
Mass, C. and Ovens, D.: WRF Model Physics: Problems, Solutions and a New Paradigm for Progress, Preprints, 2010 WRF Users' Workshop, NCAR, Boulder, CO, https://www2.mmm.ucar.edu/wrf/users/workshops/WS2010/presentations/session%204/4-1_WRFworkshop2010Final.pdf, (last access: 20 July 2026), 2010.
Matsui, H.: Black carbon simulations using a size- and mixing-state-resolved three-dimensional model: 1. Radiative effects and their uncertainties, J. Geophys. Res.-Atmos., 121, https://doi.org/10.1002/2015jd023998, 2016.
Meng, J., Gao, Y., Wang, Y., Sheng, L., and Zhang, S.: Evaluating the climate projections for China through the lens of the simulations of planetary boundary layer height, Atmos. Res., 294, 106975, https://doi.org/10.1016/j.atmosres.2023.106975, 2023.
Mishra, S. K., Rupper, S., Kapnick, S., Casey, K., Chan, H. G., Ciraci', E., Haritashya, U., Hayse, J., Kargel, J. S., Kayastha, R. B., Krakauer, N. Y., Kumar, S. V., Lammers, R. B., Maggioni, V., Margulis, S. A., Olson, M., Osmanoglu, B., Qian, Y., McLarty, S., Rittger, K., Rounce, D. R., Shean, D., Velicogna, I., Veselka, T. D., and Arendt, A.: Grand Challenges of Hydrologic Modeling for Food-Energy-Water Nexus Security in High Mountain Asia, Front. Water, 3, https://doi.org/10.3389/frwa.2021.728156, 2021.
Mizukami, N., Minallah, S., He, C., Roychoudhury, C., Cheng, W. Y. Y., and Kumar, R.: Hydrologic implications of aerosol deposition on snow in High Mountain Asia river basins, EGUsphere [preprint], https://doi.org/10.5194/egusphere-2025-4586, 2025.
Mogno, C., Palmer, P. I., Knote, C., Yao, F., and Wallington, T. J.: Seasonal distribution and drivers of surface fine particulate matter and organic aerosol over the Indo-Gangetic Plain, Atmos. Chem. Phys., 21, 10881–10909, https://doi.org/10.5194/acp-21-10881-2021, 2021.
Morrison, H., Thompson, G., and Tatarskii, V.: Impact of Cloud Microphysics on the Development of Trailing Stratiform Precipitation in a Simulated Squall Line: Comparison of One- and Two-Moment Schemes, Mon. Weather Rev., 137, 991–1007, https://doi.org/10.1175/2008MWR2556.1, 2009.
Mues, A., Lauer, A., Lupascu, A., Rupakheti, M., Kuik, F., and Lawrence, M. G.: WRF and WRF-Chem v3.5.1 simulations of meteorology and black carbon concentrations in the Kathmandu Valley, Geosci. Model Dev., 11, 2067–2091, https://doi.org/10.5194/gmd-11-2067-2018, 2018.
Nakayama, T., Matsumi, Y., Sato, K., Imamura, T., Yamazaki, A., and Uchiyama, A.: Laboratory studies on optical properties of secondary organic aerosols generated during the photooxidation of toluene and the ozonolysis of α-pinene, J. Geophys. Res.-Atmos., 115, https://doi.org/10.1029/2010JD014387, 2010.
NASA/LARC/SD/ASDC:MOPITT CO gridded monthly means (Near and Thermal Infrared Radiances) V008, NASA Langley Atmospheric Science Data Center DAAC [data set], https://doi.org/10.5067/TERRA/MOPITT/MOP03JM_L3.008, 2000.
Neu, J. L. and Prather, M. J.: Toward a more physical representation of precipitation scavenging in global chemistry models: cloud overlap and ice physics and their impact on tropospheric ozone, Atmos. Chem. Phys., 12, 3289–3310, https://doi.org/10.5194/acp-12-3289-2012, 2012.
Neumann, D., Matthias, V., Bieser, J., Aulinger, A., and Quante, M.: A comparison of sea salt emission parameterizations in northwestern Europe using a chemistry transport model setup, Atmos. Chem. Phys., 16, 9905–9933, https://doi.org/10.5194/acp-16-9905-2016, 2016.
Notarnicola, C.: Overall negative trends for snow cover extent and duration in global mountain regions over 1982–2020, Sci. Rep., 12, 13731, https://doi.org/10.1038/s41598-022-16743-w, 2022.
Ojha, N., Pozzer, A., Rauthe-Schöch, A., Baker, A. K., Yoon, J., Brenninkmeijer, C. A. M., and Lelieveld, J.: Ozone and carbon monoxide over India during the summer monsoon: regional emissions and transport, Atmos. Chem. Phys., 16, 3013–3032, https://doi.org/10.5194/acp-16-3013-2016, 2016.
Parajuli, S. P., Stenchikov, G. L., Ukhov, A., and Kim, H.: Dust emission modeling using a new high-resolution dust source function in WRF-Chem with implications for air quality, J. Geophys. Res.-Atmos., 124, 10109–10133, https://doi.org/10.1029/2019JD030248, 2019.
Parrish, D. F. and Derber, J. C.: The National Meteorological Center's Spectral Statistical-Interpolation Analysis System, Mon. Weather Rev., 120, 1747–1763, https://doi.org/10.1175/1520-0493(1992)120<1747:TNMCSS>2.0.CO;2, 1992.
Pepin, N. C., Arnone, E., Gobiet, A., Haslinger, K., Kotlarski, S., Notarnicola, C., Palazzi, E., Seibert, P., Serafin, S., Schöner, W., Terzago, S., Thornton, J. M., Vuille, M., and Adler, C.: Climate Changes and Their Elevational Patterns in the Mountains of the World, Rev. Geophys., 60, e2020RG000730, https://doi.org/10.1029/2020RG000730, 2022.
Pfeffer, W. T., Arendt, A. A., Bliss, A., Bolch, T., Cogley, J. G., Gardner, A. S., Hagen, J.-O., Hock, R., Kaser, G., Kienholz, C., Miles, E. S., Moholdt, G., Mölg, N., Paul, F., Radić, V., Rastner, P., Raup, B. H., Rich, J., Sharp, M. J., and The Randolph Consortium: The Randolph Glacier Inventory: a globally complete inventory of glaciers, J. Glaciol., 60, 537–552, https://doi.org/10.3189/2014JoG13J176, 2014.
Pino-Carmona, M., Ruiz-Arias, J. A., Fernández-Carvelo, S., Bravo-Aranda, J. A., and Alados-Arboledas, L.: Intercomparison of WRF-Chem aerosol schemes during a dry Saharan dust outbreak in Southern Iberian Peninsula, Atmos. Environ., 339, 120872, https://doi.org/10.1016/j.atmosenv.2024.120872, 2024.
Pool, S., Vis, M., and Seibert, J.: Evaluating model performance: towards a non-parametric variant of the Kling-Gupta efficiency, Hydrolog. Sci. J., 63, 1941–1953, https://doi.org/10.1080/02626667.2018.1552002, 2018.
Pu, Z., Xu, L., and Salomonson, V. V.: MODIS/Terra observed seasonal variations of snow cover over the Tibetan Plateau, Geophys. Res. Lett., 34, https://doi.org/10.1029/2007GL029262, 2007.
Qian, Y., Yasunari, T. J., Doherty, S. J., Flanner, M. G., Lau, W. K. M., Ming, J., Wang, H., Wang, M., Warren, S. G., and Zhang, R.: Light-absorbing particles in snow and ice: Measurement and modeling of climatic and hydrological impact, Adv. Atmos. Sci., 32, 64–91, https://doi.org/10.1007/s00376-014-0010-0, 2015.
Ram, K., Sarin, M. M., and Tripathi, S. N.: A 1 year record of carbonaceous aerosols from an urban site in the Indo-Gangetic Plain: Characterization, sources, and temporal variability, J. Geophys. Res.-Atmos., 115, https://doi.org/10.1029/2010JD014188, 2010.
Ramachandran, S., Rupakheti, M., Cherian, R., and Lawrence, M. G.: Aerosols heat up the Himalayan climate, Sci. Total Environ., 894, 164733, https://doi.org/10.1016/j.scitotenv.2023.164733, 2023.
Remer, L. A., Kaufman, Y. J., Tanré, D., Mattoo, S., Chu, D. A., Martins, J. V., Li, R.-R., Ichoku, C., Levy, R. C., Kleidman, R. G., Eck, T. F., Vermote, E., and Holben, B. N.: The MODIS Aerosol Algorithm, Products, and Validation, J. Atmos. Sci., 62, 947–973, https://doi.org/10.1175/JAS3385.1, 2005.
Roychoudhury, C., He, C., Kumar, R., McKinnon, J. M., and Arellano Jr., A. F.: On the Relevance of Aerosols to Snow Cover Variability Over High Mountain Asia, Geophys. Res. Lett., 49, e2022GL099317, https://doi.org/10.1029/2022GL099317, 2022.
Roychoudhury, C., He, C., Kumar, R., and Arellano Jr., A. F.: Diagnosing aerosol–meteorological interactions on snow within Earth system models: a proof-of-concept study over High Mountain Asia, Earth Syst. Dynam., 16, 1237–1266, https://doi.org/10.5194/esd-16-1237-2025, 2025.
Roychoudhury, C., He, C., Kumar, R., and Arellano, A. F.: Revisiting black carbon emission estimates in the Third Pole: a hierarchical Bayesian synthesis inversion perspective, Environ. Res. Commun., 8, 035019, https://doi.org/10.1088/2515-7620/ae4858, 2026.
Sadavarte, P. and Venkataraman, C.: Trends in multi-pollutant emissions from a technology-linked inventory for India: I. Industry and transport sectors, Atmos. Environ., 99, 353–364, https://doi.org/10.1016/j.atmosenv.2014.09.081, 2014.
Saide, P. E., Spak, S. N., Carmichael, G. R., Mena-Carrasco, M. A., Yang, Q., Howell, S., Leon, D. C., Snider, J. R., Bandy, A. R., Collett, J. L., Benedict, K. B., de Szoeke, S. P., Hawkins, L. N., Allen, G., Crawford, I., Crosier, J., and Springston, S. R.: Evaluating WRF-Chem aerosol indirect effects in Southeast Pacific marine stratocumulus during VOCALS-REx, Atmos. Chem. Phys., 12, 3045–3064, https://doi.org/10.5194/acp-12-3045-2012, 2012.
Saide, P. E., Carmichael, G. R., Liu, Z., Schwartz, C. S., Lin, H. C., da Silva, A. M., and Hyer, E.: Aerosol optical depth assimilation for a size-resolved sectional model: impacts of observationally constrained, multi-wavelength and fine mode retrievals on regional scale analyses and forecasts, Atmos. Chem. Phys., 13, 10425–10444, https://doi.org/10.5194/acp-13-10425-2013, 2013.
Saleh, R., Marks, M., Heo, J., Adams, P. J., Donahue, N. M., and Robinson, A. L.: Contribution of brown carbon and lensing to the direct radiative effect of carbonaceous aerosols from biomass and biofuel burning emissions, J. Geophys. Res.-Atmos., 120, 10285–10296, https://doi.org/10.1002/2015JD023697, 2015.
Sarangi, C., Qian, Y., Rittger, K., Bormann, K. J., Liu, Y., Wang, H., Wan, H., Lin, G., and Painter, T. H.: Impact of light-absorbing particles on snow albedo darkening and associated radiative forcing over high-mountain Asia: high-resolution WRF-Chem modeling and new satellite observations, Atmos. Chem. Phys., 19, 7105–7128, https://doi.org/10.5194/acp-19-7105-2019, 2019.
Schmale, J., Flanner, M., Kang, S., Sprenger, M., Zhang, Q., Guo, J., Li, Y., Schwikowski, M., and Farinotti, D.: Modulation of snow reflectance and snowmelt from Central Asian glaciers by anthropogenic black carbon, Sci. Rep., 7, 40501, https://doi.org/10.1038/srep40501, 2017.
Seaman, N. L., Stauffer, D. R., and Lario-Gibbs, A. M.: A Multiscale Four-Dimensional Data Assimilation System Applied in the San Joaquin Valley during SARMAP. Part I: Modeling Design and Basic Performance Characteristics, J. Appl. Meteorol., 34, 1739–1761, https://doi.org/10.1175/1520-0450(1995)034<1739:AMFDDA>2.0.CO;2, 1995.
Seidel, D. J., Ao, C. O., and Li, K.: Estimating climatological planetary boundary layer heights from radiosonde observations: Comparison of methods and uncertainty analysis, J. Geophys. Res.-Atmos., 115, https://doi.org/10.1029/2009JD013680, 2010.
Sha, T., Ma, X., Wang, J., Tian, R., Zhao, J., Cao, F., and Zhang, Y.-L.: Improvement of inorganic aerosol component in PM2.5 by constraining aqueous-phase formation of sulfate in cloud with satellite retrievals: WRF-Chem simulations, Sci. Total Environ., 804, 150229, https://doi.org/10.1016/j.scitotenv.2021.150229, 2022.
Shin, H. H. and Dudhia, J.: Evaluation of PBL Parameterizations in WRF at Subkilometer Grid Spacings: Turbulence Statistics in the Dry Convective Boundary Layer, Mon. Weather Rev., 144, 1161–1177, https://doi.org/10.1175/MWR-D-15-0208.1, 2016.
Singh, R., Singh, C., Ojha, S. P., Kumar, A. S., and Kumar, A. S. K.: Development of an improved aerosol product over the Indian subcontinent: Blending model, satellite, and ground-based estimates, J. Geophys. Res.-Atmos., 122, 367–390, https://doi.org/10.1002/2016JD025335, 2017.
Sinyuk, A., Holben, B. N., Eck, T. F., Giles, D. M., Slutsker, I., Korkin, S., Schafer, J. S., Smirnov, A., Sorokin, M., and Lyapustin, A.: The AERONET Version 3 aerosol retrieval algorithm, associated uncertainties and comparisons to Version 2, Atmos. Meas. Tech., 13, 3375–3411, https://doi.org/10.5194/amt-13-3375-2020, 2020.
Skiles, S. M., Flanner, M., Cook, J. M., Dumont, M., and Painter, T. H.: Radiative forcing by light-absorbing particles in snow, Nat. Clim. Change, 8, 964–971, https://doi.org/10.1038/s41558-018-0296-5, 2018.
Smith, A., Lott, N., and Vose, R.: The Integrated Surface Database: Recent Developments and Partnerships, B. Am. Meteorol. Soc., 92, 704–708, https://doi.org/10.1175/2011BAMS3015.1, 2011.
Soulie, A., Granier, C., Darras, S., Zilbermann, N., Doumbia, T., Guevara, M., Jalkanen, J.-P., Keita, S., Liousse, C., Crippa, M., Guizzardi, D., Hoesly, R., and Smith, S. J.: Global anthropogenic emissions (CAMS-GLOB-ANT) for the Copernicus Atmosphere Monitoring Service simulations of air quality forecasts and reanalyses, Earth Syst. Sci. Data, 16, 2261–2279, https://doi.org/10.5194/essd-16-2261-2024, 2024.
Stewart, I. D., Oke, T. R., and Krayenhoff, E. S.: Evaluation of the “Local Climate Zone” Scheme Using Temperature Observations and Model Simulations, Int. J. Climatol., 34, 1062–1080, https://doi.org/10.1002/joc.3746, 2013.
Sugimoto, S., Xue, Y., Sato, T., and Takahashi, H. G.: Influence of convective processes on weather research and forecasting model precipitation biases over East Asia, Clim. Dynam., 62, 2859–2875, https://doi.org/10.1007/s00382-022-06587-5, 2024.
Sun, H., Su, F., Yao, T., He, Z., Tang, G., Huang, J., Zheng, B., Meng, F., Ou, T., and Chen, D.: General overestimation of ERA5 precipitation in flow simulations for High Mountain Asia basins, Environ. Res. Commun., 3, 121003, https://doi.org/10.1088/2515-7620/ac40f0, 2021.
Tarek, M., Brissette, F., and Arsenault, R.: Uncertainty of gridded precipitation and temperature reference datasets in climate change impact studies, Hydrol. Earth Syst. Sci., 25, 3331–3350, https://doi.org/10.5194/hess-25-3331-2021, 2021.
Taylor, A. C., Beare, R. J., and Thomson, D. J.: Simulating Dispersion in the Evening-Transition Boundary Layer, Bound.-Lay. Meteorol., 153, 389–407, https://doi.org/10.1007/s10546-014-9960-0, 2014.
Tian, R., Ma, Y., Ma, W., Zhao, X., and Zha, D.: Longer Time-Scale Variability of Atmospheric Vertical Motion Over the Tibetan Plateau and North Pacific and the Climate in East Asia, Atmosphere, 12, 630, https://doi.org/10.3390/atmos12050630, 2021.
Tuccella, P., Pitari, G., Colaiuda, V., Raparelli, E., and Curci, G.: Present-day radiative effect from radiation-absorbing aerosols in snow, Atmos. Chem. Phys., 21, 6875–6893, https://doi.org/10.5194/acp-21-6875-2021, 2021.
Velasco, E., Retama, A., and Stratoulias, D.: Ambient Air Quality Monitoring, in: Air Quality Management and Research in Southeast Asia, edited by: Velasco, E., Retama, A., and Stratoulias, D., Springer Nature Switzerland, Cham, 45–67, https://doi.org/10.1007/978-3-031-69088-4_5, 2024.
Wang, X., Heald, C. L., Ridley, D. A., Schwarz, J. P., Spackman, J. R., Perring, A. E., Coe, H., Liu, D., and Clarke, A. D.: Exploiting simultaneous observational constraints on mass and absorption to estimate the global direct radiative forcing of black carbon and brown carbon, Atmos. Chem. Phys., 14, 10989–11010, https://doi.org/10.5194/acp-14-10989-2014, 2014.
Wang, X., Heald, C. L., Liu, J., Weber, R. J., Campuzano-Jost, P., Jimenez, J. L., Schwarz, J. P., and Perring, A. E.: Exploring the observational constraints on the simulation of brown carbon, Atmos. Chem. Phys., 18, 635–653, https://doi.org/10.5194/acp-18-635-2018, 2018.
Wang, X., Tolksdorf, V., Otto, M., and Scherer, D.: WRF-based dynamical downscaling of ERA5 reanalysis data for High Mountain Asia: Towards a new version of the High Asia Refined analysis, Int. J. Climatol., 41, 743–762, https://doi.org/10.1002/joc.6686, 2021.
Werner, M., Kryza, M., Pagowski, M., and Guzikowski, J.: Assimilation of PM2.5 ground base observations to two chemical schemes in WRF-Chem – The results for the winter and summer period, Atmos. Environ., 200, 178–189, https://doi.org/10.1016/j.atmosenv.2018.12.016, 2019.
Wesely, M. L.: Parameterization of surface resistances to gaseous dry deposition in regional-scale numerical models, Atmos. Environ., 23, 1293–1304, https://doi.org/10.1016/0004-6981(89)90153-4, 1989.
Wiedinmyer, C., Kimura, Y., McDonald-Buller, E. C., Emmons, L. K., Buchholz, R. R., Tang, W., Seto, K., Joseph, M. B., Barsanti, K. C., Carlton, A. G., and Yokelson, R.: The Fire Inventory from NCAR version 2.5: an updated global fire emissions model for climate and chemistry applications, Geosci. Model Dev., 16, 3873–3891, https://doi.org/10.5194/gmd-16-3873-2023, 2023.
Wilcox, R. R.: Comparing dependent robust correlations, British J. Math. Stat. Psychol., 69, 215–224, https://doi.org/10.1111/bmsp.12069, 2016.
Wu, H., Tang, X., Wang, Z., Wu, L., Lu, M., Wei, L., and Zhu, J.: Probabilistic Automatic Outlier Detection for Surface Air Quality Measurements from the China National Environmental Monitoring Network, Adv. Atmos. Sci., 35, 1522–1532, https://doi.org/10.1007/s00376-018-8067-9, 2018.
Xi, X.: Revisiting the Recent Dust Trends and Climate Drivers Using Horizontal Visibility and Present Weather Observations, J. Geophys. Res.-Atmos., 126, e2021JD034687, https://doi.org/10.1029/2021JD034687, 2021.
Xian, P., Reid, J. S., Ades, M., Benedetti, A., Colarco, P. R., da Silva, A., Eck, T. F., Flemming, J., Hyer, E. J., Kipling, Z., Rémy, S., Sekiyama, T. T., Tanaka, T., Yumimoto, K., and Zhang, J.: Intercomparison of aerosol optical depths from four reanalyses and their multi-reanalysis consensus, Atmos. Chem. Phys., 24, 6385–6411, https://doi.org/10.5194/acp-24-6385-2024, 2024.
Xie, W., Yi, S., Leng, C., Xia, D., Li, M., Zhong, Z., and Ye, J.: The evaluation of IMERG and ERA5-Land daily precipitation over China with considering the influence of gauge data bias, Sci. Rep., 12, 8085, https://doi.org/10.1038/s41598-022-12307-0, 2022.
Xu, L., Peng, Y., Ram, K., Zhang, Y., Bao, M., and Wei, J.: Investigation of the Uncertainties of Simulated Optical Properties of Brown Carbon at Two Asian Sites Using a Modified Bulk Aerosol Optical Scheme of the Community Atmospheric Model Version 5.3, J. Geophys. Res.-Atmos., 126, e2020JD033942, https://doi.org/10.1029/2020JD033942, 2021.
Yan, S., Chen, Y., Hou, Y., Liu, K., Li, X., Xing, Y., Wu, D., Cui, J., Zhou, Y., Pu, W., and Wang, X.: Which global reanalysis dataset has better representativeness in snow cover on the Tibetan Plateau?, The Cryosphere, 18, 4089–4109, https://doi.org/10.5194/tc-18-4089-2024, 2024.
Yao, T., Bolch, T., Chen, D., Gao, J., Immerzeel, W., Piao, S., Su, F., Thompson, L., Wada, Y., Wang, L., Wang, T., Wu, G., Xu, B., Yang, W., Zhang, G., and Zhao, P.: The imbalance of the Asian water tower, Nat. Rev. Earth Environ., 3, 618–632, https://doi.org/10.1038/s43017-022-00299-4, 2022.
Yasunari, T. J., Tan, Q., Lau, K.-M., Bonasoni, P., Marinoni, A., Laj, P., Ménégoz, M., Takemura, T., and Chin, M.: Estimated range of black carbon dry deposition and the related snow albedo reduction over Himalayan glaciers during dry pre-monsoon periods, Atmos. Environ., 78, 259–267, https://doi.org/10.1016/j.atmosenv.2012.03.031, 2013.
Yin, G., Baik, J., and Park, J.: Comprehensive analysis of GEO-KOMPSAT-2A and FengYun satellite-based precipitation estimates across Northeast Asia, GIScience Remote Sens., 59, 782–800, https://doi.org/10.1080/15481603.2022.2067970, 2022.
Yu, L., Leng, G., Python, A., and Peng, J.: A Comprehensive Evaluation of Latest GPM IMERG V06 Early, Late and Final Precipitation Products across China, Remote Sens., 13, 1208, https://doi.org/10.3390/rs13061208, 2021.
Zakoura, M. and Pandis, S. N.: Overprediction of aerosol nitrate by chemical transport models: The role of grid resolution, Atmos. Environ., 187, 390–400, https://doi.org/10.1016/j.atmosenv.2018.05.066, 2018.
Zaveri, R. A., Easter, R. C., Fast, J. D., and Peters, L. K.: Model for Simulating Aerosol Interactions and Chemistry (MOSAIC), J. Geophys. Res.-Atmos., 113, https://doi.org/10.1029/2007JD008782, 2008.
Zhang, A., Wang, Y., Zhang, Y., Weber, R. J., Song, Y., Ke, Z., and Zou, Y.: Modeling the global radiative effect of brown carbon: a potentially larger heating source in the tropical free troposphere than black carbon, Atmos. Chem. Phys., 20, 1901–1920, https://doi.org/10.5194/acp-20-1901-2020, 2020.
Zhang, D. and Anthes, R. A.: A High-Resolution Model of the Planetary Boundary Layer – Sensitivity Tests and Comparisons with SESAME-79 Data, J. Appl. Meteorol., 21, 1594–1609, https://doi.org/10.1175/1520-0450(1982)021<1594:AHRMOT>2.0.CO;2, 1982.
Zhang, Y., Kang, S., Sprenger, M., Cong, Z., Gao, T., Li, C., Tao, S., Li, X., Zhong, X., Xu, M., Meng, W., Neupane, B., Qin, X., and Sillanpää, M.: Black carbon and mineral dust in snow cover on the Tibetan Plateau, The Cryosphere, 12, 413–431, https://doi.org/10.5194/tc-12-413-2018, 2018.
Zhang, Z., Mu, L., and Li, C.: Comparison of Planetary Boundary Layer Height Derived from Lidar in AD-Net and ECMWFs Reanalysis Data over East Asia, Atmosphere, 13, 1976, https://doi.org/10.3390/atmos13121976, 2022.
Zhao, C., Hu, Z., Qian, Y., Ruby Leung, L., Huang, J., Huang, M., Jin, J., Flanner, M. G., Zhang, R., Wang, H., Yan, H., Lu, Z., and Streets, D. G.: Simulating black carbon and dust and their radiative forcing in seasonal snow: a case study over North China with field campaign measurements, Atmos. Chem. Phys., 14, 11475–11491, https://doi.org/10.5194/acp-14-11475-2014, 2014.