the Creative Commons Attribution 4.0 License.
the Creative Commons Attribution 4.0 License.
 | 21 Jul 2026
Glacial Lake Observatory (GLO): annual dataset of glacial lakes in Nepal and transboundary catchments (2017–2024)
Lauren D. Rawlins
Rakesh Bhambri
Nitesh Khadka
Mohan B. Chand
Global glacier mass loss is accelerating the formation and expansion of glacial lakes. These lakes store meltwater, contribute to enhanced glacier mass loss through positive feedback mechanisms, and in some cases can pose a risk to downstream populations, infrastructure, and ecosystems through glacial lake outburst floods (GLOFs). Although satellite-derived inventories of glacial lakes exist at both global and regional scales, they vary in spatial and temporal resolution. Critically, fully automated and systematic monitoring of lake area changes is lacking, yet such monitoring is essential for detecting anomalous changes, estimating water storage, and understanding lake-glacier feedbacks. Here, we present a foundational dataset to support lake monitoring for the Glacial Lake Observatory (GLO), with an initial focus on lakes in Nepal and transboundary catchments. We trained a deep learning model to extract water bodies from Sentinel-1 and Sentinel-2 image mosaics from 2017 to 2024, subsequently classifying them as glacier-fed or non-glacier-fed based on their hydrological connectivity. In total, 18 129 and 22 294 individual lake outlines (≥0.001 km2) were mapped respectively from Sentinel-1 and Sentinel-2 imagery (2017–2024), resulting in 2967 and 4150 uniquely identified lakes (respectively). Overlapping lake detections from both sensors were also integrated to provide a combined analysis of glacial lake extent. The number and total area of lakes increased over the eight-year period, driven largely by sustained expansion in the Koshi basin, which hosts about 61 % of all mapped lakes and nine out of ten of the fastest expanding. On average, glacial lakes covered an average annual area of 169 km2, with growth concentrated in high-elevation, glacier-fed systems. Validation against existing inventories and manually digitised outlines demonstrated good accuracy of our deep learning datasets (F1 scores=0.80–0.92), with Sentinel-2 most reliably capturing smaller lakes. Datasets, as well as deep learning models, are openly available and will be updated in subsequent releases (https://doi.org/10.5281/zenodo.17802333; Rawlins et al., 2025).
- Article
(8112 KB) - Full-text XML
-
Supplement
(1543 KB) - BibTeX
- EndNote


High Mountain Asia (HMA) also known as the “Third Pole”, is home to the largest concentration of glaciers outside the polar regions (Maharjan et al., 2018; Yao et al., 2022), making it a critical component of the global cryosphere. These glaciers are not only sensitive indicators of climate change but serve as vital freshwater reservoirs for billions of people across High Mountain Asia (HMA; Immerzeel et al., 2020; Jones et al., 2021; Mir et al., 2021). Atmospheric warming across HMA has occurred at a rate twice as fast as the global average (World Meteorological Organization, 2025), leading to accelerated glacier mass loss and, consequently, the development and dramatic expansion of glacial lakes (Shugar et al., 2020; Wang et al., 2020; Zhang et al., 2023). Studies consistently report an increase in the number, area and volume of glacier lakes worldwide, with HMA experiencing some of the highest rates of glacial lake growth annually (both in terms of area and volume) (Shugar et al., 2020; Zhang et al., 2024a). Glacial lakes store and regulate meltwater runoff (Irvine-Fynn et al., 2017; Shugar et al., 2020) and also provide hydropower potential in high mountain catchments (Farinotti et al., 2019). However, in some cases, glacial lakes can pose risks to downstream communities and infrastructure due to the potential for glacier lake outburst floods (GLOFs): the rapid release of water from glacial lakes following a triggering factor, such as mass movement into the lake (Niggli et al., 2024; Schwanghart et al., 2016; Taylor et al., 2023; Veh et al., 2020). These floods can occur from proglacial, supraglacial, subglacial, or ice-dammed lakes. The potential for GLOF frequency to increase with climate warming and deglaciation (Harrison et al., 2018; Haeberli et al., 2017; Zheng et al., 2021), coupled with the high socio-economic impacts in countries such as Nepal, India and Bhutan (Carrivick and Tweed, 2016), highlights the importance of monitoring lake evolution. Additionally, the presence of glacial lakes initiates a positive feedback mechanism, where small ponds forming on the glacier surface absorb solar radiation, accelerating the melting of subaqueous glacier ice (Benn et al., 2001; Rohl, 2008; Sakai et al., 2000b). These ponds can then coalesce into larger lakes where calving process accelerates glacier retreat and in turn forms a space for upward pro-glacial lake expansion (Haritashya et al., 2018; King et al., 2019; Shukla et al., 2018).
Glacial lake mapping techniques can be typically categorised into three key groups, (1) manual digitisation (e.g. Zhang et al., 2015, 2024a), (2) semi-automated classification via segmentation, spectral indices and/or thresholding (e.g. Chand and Watanabe, 2019; Chen et al., 2021; Gardelle et al., 2011; Khadka et al., 2018; Kumar et al., 2025; Nie et al., 2013; Shugar et al., 2020; Watson et al., 2018), and (3) automatic classification using machine and deep learning techniques (e.g. Sharma and Prakash, 2024; Tang et al., 2024a; Xu et al., 2024). Classifications in each of these groups may also include ancillary datasets to improve map accuracy, such as digital elevation models (DEMs), and typically include a manual data refinement stage to remove erroneous classifications or improve lake polygon outlines. Advancements in remote sensing technologies, semi-automatic and, increasingly, automatic techniques for glacial lake boundary vectorisation are being used for the development of glacial lake inventories. In particular, automatic deep learning techniques can provide reliable and transferable classification schema, with the caveat that the effectiveness of such models is dependent on the quantity and quality of often manually derived training data (Ma et al., 2025; Sahu and Singh, 2025). Recent advances in satellite data availability and processing have led to a rapid expansion of glacial lake inventories, ranging from local to global scales (Table 1; Kumar et al., 2025; Shugar et al., 2020; Wang et al., 2020; Zhang et al., 2024a). For example, Sentinel-1 (Synthetic Aperture Radar, or SAR) provides all-weather, day-and-night imaging capabilities, which can enable consistent data acquisition even under cloudy conditions that are common in high-mountain areas, where optical sensors are obscured by atmospheric interference (Tom et al., 2025). Whereas Sentinel-2 offers high spatial resolution (10–20 m) and multispectral bands that capture detailed surface water changes, making it ideal for detecting subtle variations in lake extent and supporting regional analyses (Wangchuk and Bolch, 2020). Methodologies including both optical and SAR datasets can overcome common classification challenges owing to variable lake turbidity, seasonal freezing and ice calving, and cloud cover obscuring the lakes (Wangchuk and Bolch, 2020). This integration can facilitate multi-temporal monitoring for a Glacial Lake Observatory allowing for the tracking of lake evolution, early detection of hazardous expansions, and improved GLOF risk assessments. This is important, as existing inventories often lack the temporal resolution and scalability needed for ongoing monitoring.
Table 1Examples of existing glacial lake inventories with full or partial coverage of our study area.
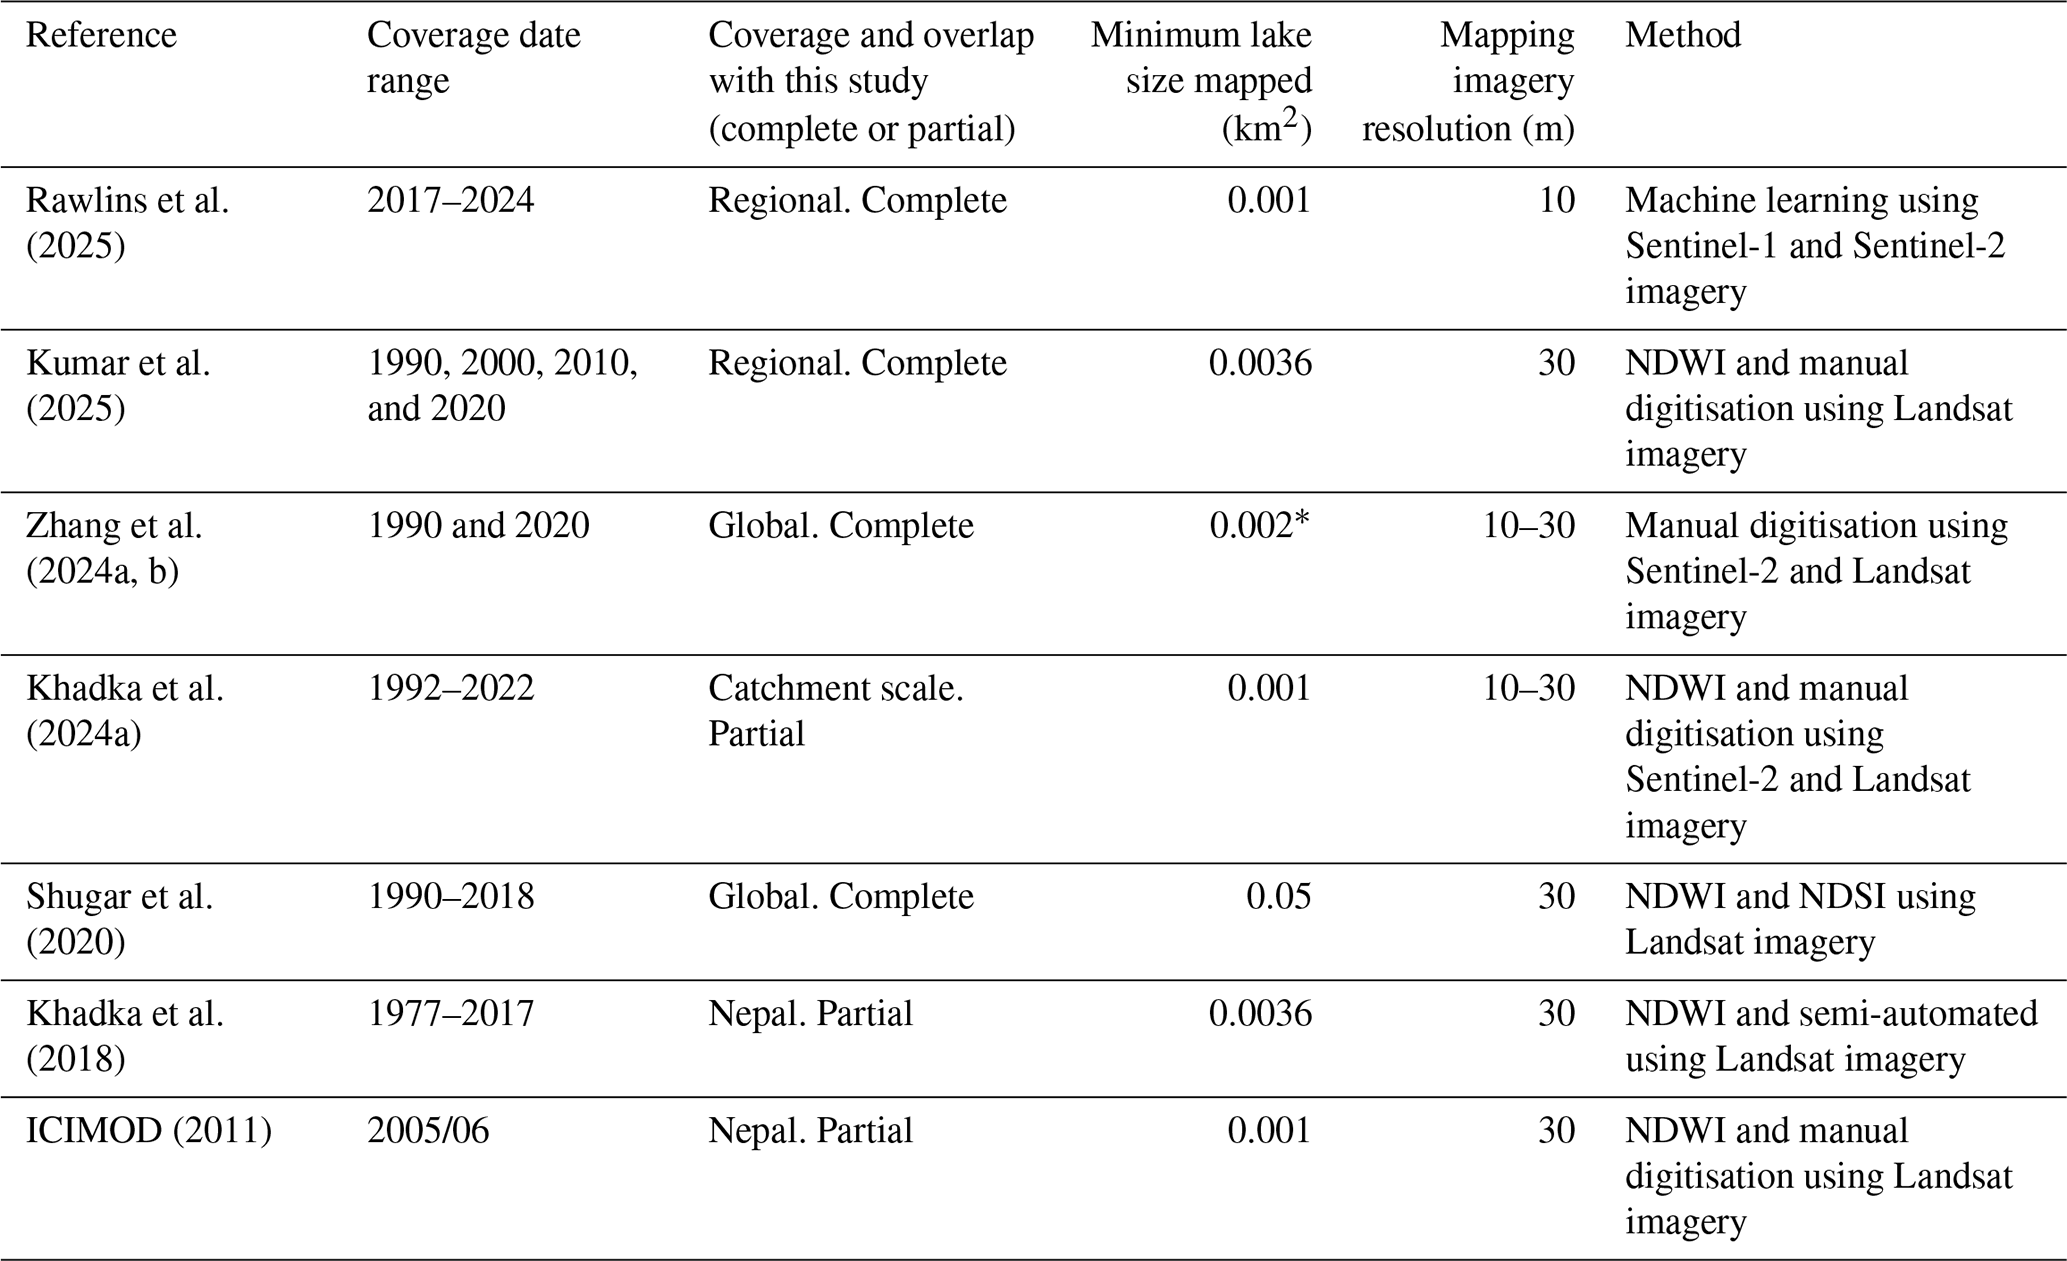
∗ Dataset includes lakes with a minimum lake size of 0.001 km2 (Zhang et al., 2024a, b).
Our overarching aim was to establish a foundation for systematic glacial lake monitoring that does not require manual intervention. Therefore, in this study, we aimed to (1) develop an automated workflow to map lakes using Sentinel-1 and Sentinel-2 data, (2) produce an annual time series of glacier-fed and non-glacier-fed lake areas (2017–2024) and, (3) validate the results against existing regional inventories to establish a framework for ongoing automated lake monitoring. The data are available open access at https://doi.org/10.5281/zenodo.17802333 (Rawlins et al., 2025), and will be accessible through the GLO data and analytics portal that is under development.
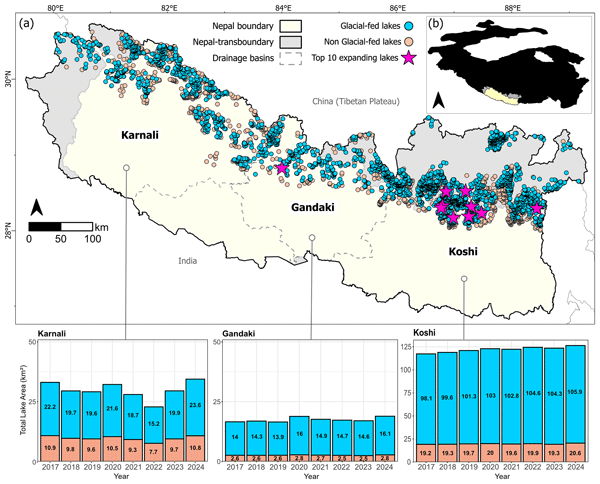
Our study region covered the glaciated areas of Nepal and its transboundary catchments in India and China, including the Karnali, Gandaki and Koshi river basins (Fig. 1). This region of the Central Himalaya is an area of high glacier mass loss (Bolch et al., 2012; Brun et al., 2017; Rounce et al., 2020), and subsequent glacial lake development (Chen et al., 2021; Shugar et al., 2020; Zhang et al., 2024a). Our analysis focussed on a 59 602 km2 area that formed a 10 km buffer around RGI v7.0 South Asia East glaciers (RGI Consortium, 2023) within the boundary of Nepal and transboundary catchments. The climate is dominated by the Indian Summer Monsoon, where the majority of precipitation falls between June and September (Bookhagen and Burbank, 2006; Hrudya et al., 2021) and glacier melting increases in response to warmer temperatures and rainfall in the ablation zone (Fugger et al., 2022; Fujita et al., 1998). The temperature of glacial lakes is also observed to peak in the monsoonal period, following spring thaw of the lake surface ice that persists over winter (Sakai et al., 2000a; Watson et al., 2020).
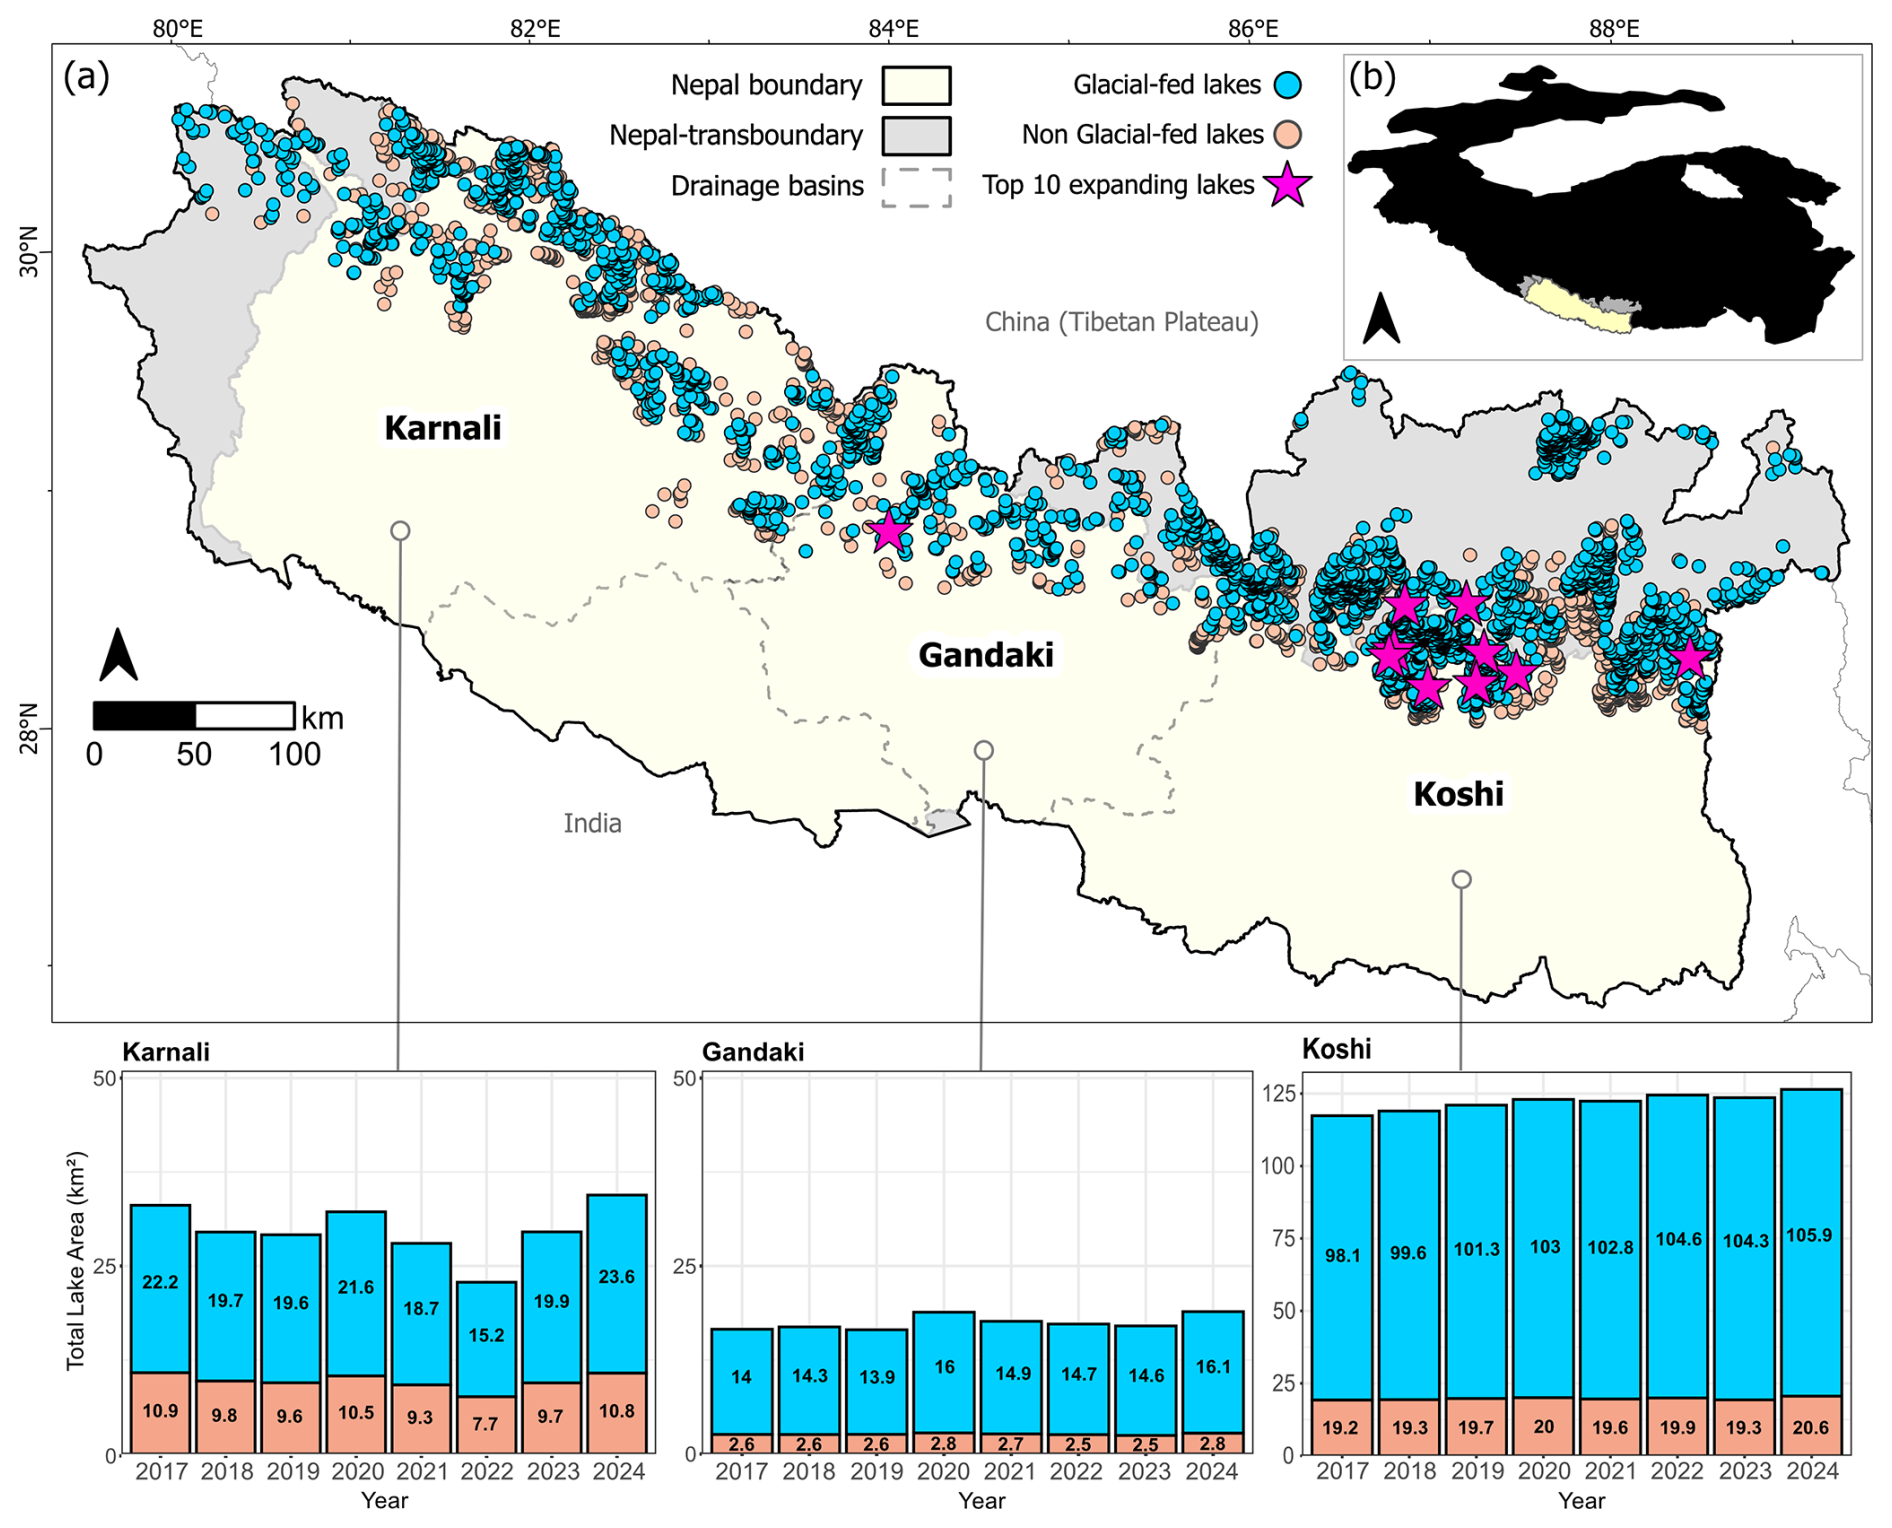
Figure 1(a) An overview of the lakes mapped for the Nepal-transboundary region from Sentinel-2 imagery (2017–2024), split into glacier-fed and non-glacier-fed lakes per drainage basin (basins defined by ICIMOD, 2021) and transboundary catchments were derived from HydroSHEDs basins (Lehner et al., 2008). The top 10 highest expanding glacial lakes are represented by a star symbol, with 9 out of 10 located in the Koshi basin. Graphs below represent the total lake area (km2) per year for glacier and non-glacier-fed lakes in each basin. (b) Inset map showing the Nepal-transboundary location within High Mountain Asia (Bolch et al., 2019).
Glacial lakes in the study region are typically supraglacial, proglacial, or ice marginal lakes. Across different studies (Table 1), there is a utilisation of different thresholds, distance of glacial lake from glaciers and size thresholds. For example, some studies classify all water bodies within a set distance from the nearest glaciers (e.g. 10 km) and refer to all lakes within this area as glacial lakes. A distinction between supraglacial and proglacial lakes can also be made using glacier outlines (Gardelle et al., 2011). Others make a distinction for lakes that are both in close proximity to the glacial environment, and hydrologically connected (glacier-fed; Zhang et al., 2024a), which is the approach we adopt here due to a lack of up-to-date glacier outlines. Additionally, a glacial lake area threshold of ≥0.001 km2 was applied, which is a common lower threshold used in numerous lake inventories (Khadka et al., 2024a; Zhang et al., 2024a) and captures both large and small lakes, meaning that our dataset is directly comparable to others.
Our processing pipeline (Fig. 2) was designed to produce two deep learning models based on the DeepLabV3 semantic segmentation architecture (Chen et al., 2017) for classifying water bodies in Sentinel-1 and -2 imagery, respectively. The processing steps are detailed in the following sections, which include image processing in Google Earth Engine (GEE, Gorelick et al., 2017), model training in ArcGIS Pro, application of the models to Sentinel-1 and -2 imagery spanning 2017–2024, and validation of the deep learning lake outlines against both published glacial lake datasets (reference data) and manually digitised outlines.
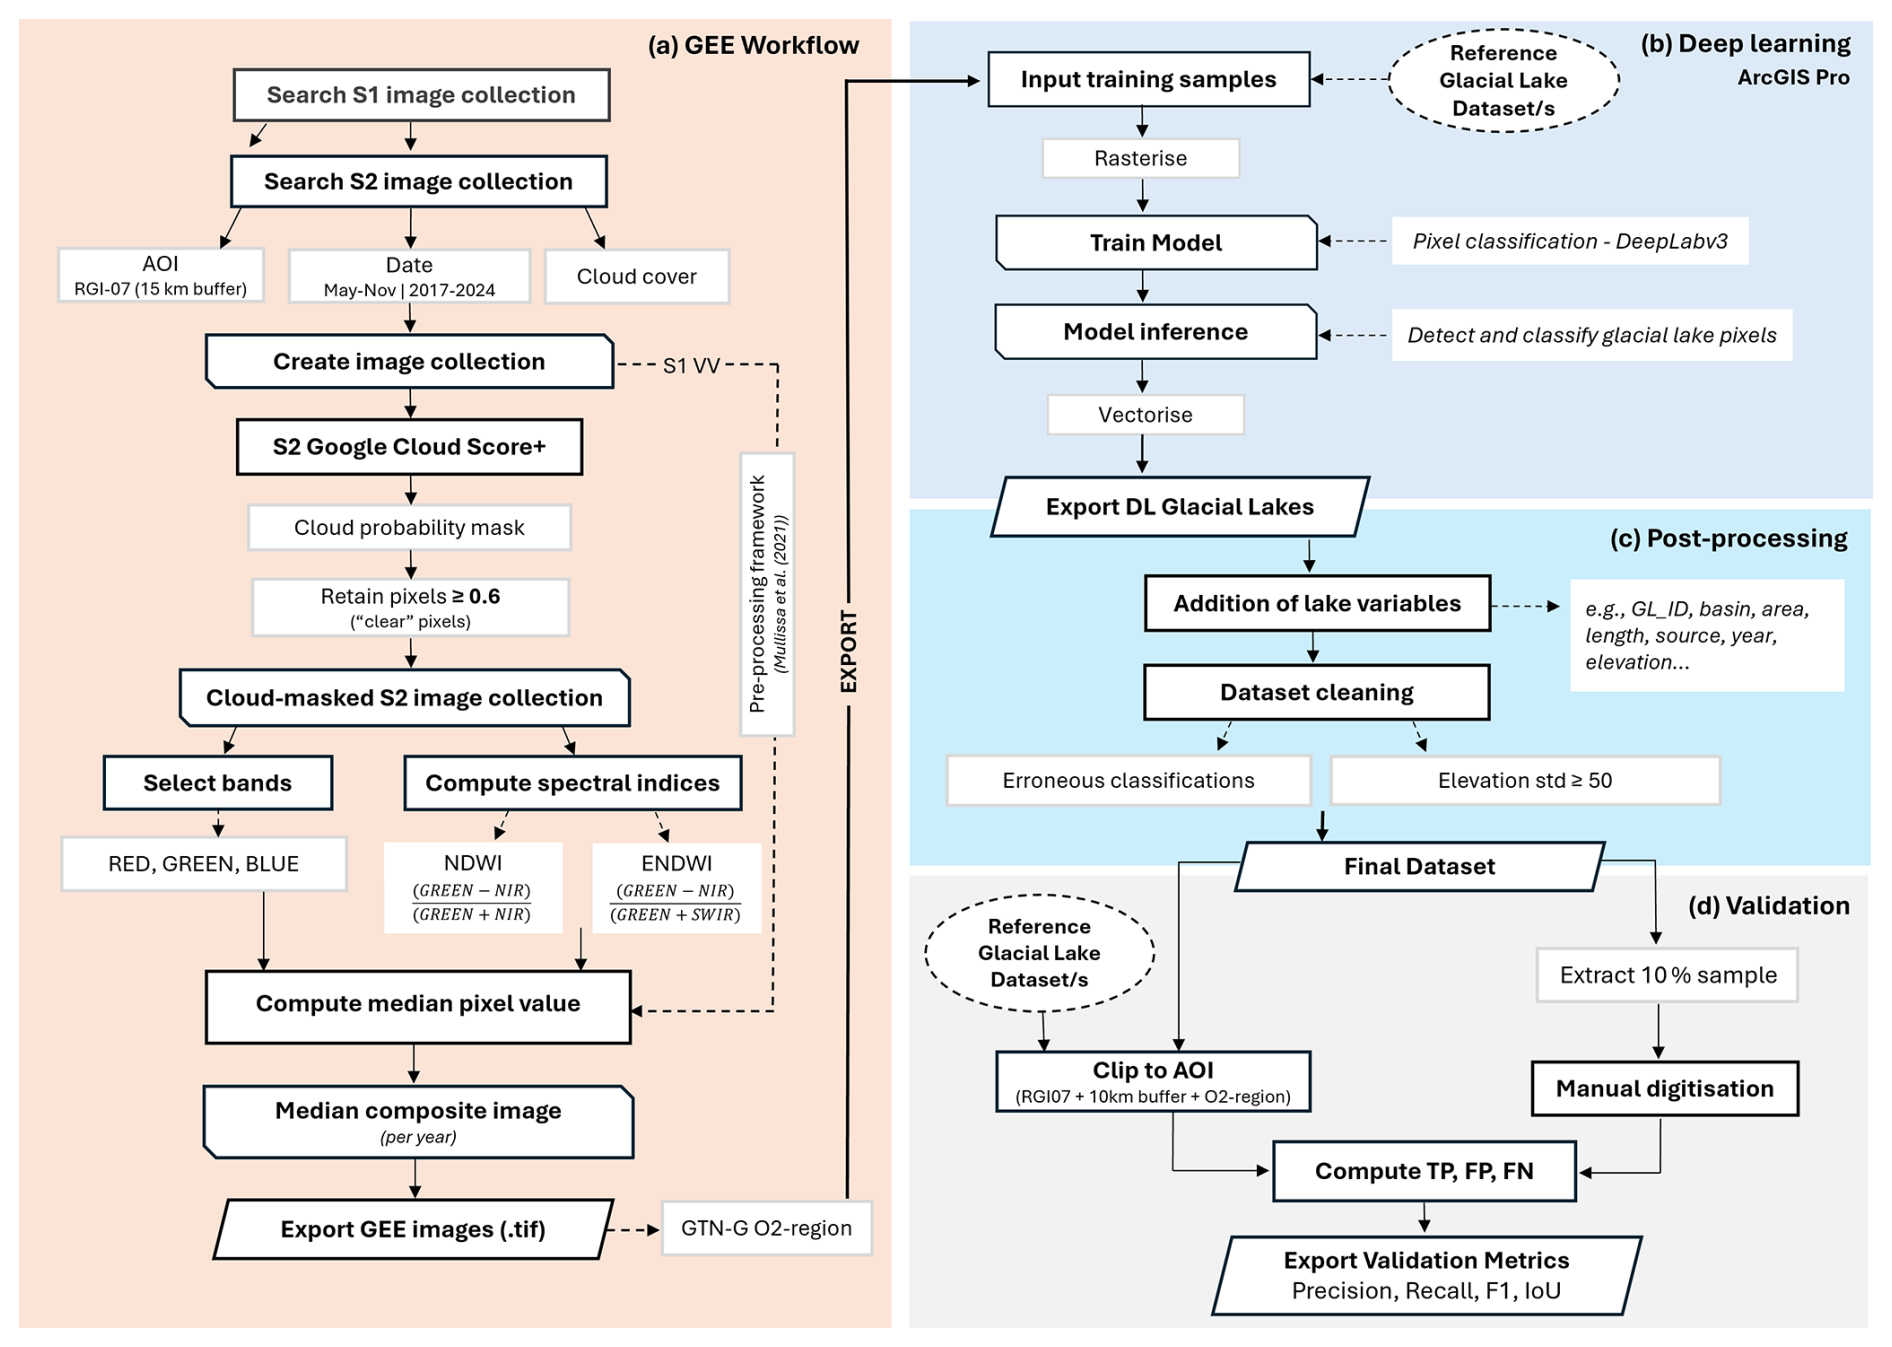
Figure 2Data processing pipeline for the deep learning-generated GLO glacial lakes. (a) The workflow used in GEE for Sentinel-1 and Sentinel-2 image processing, with composite median images exported from GEE per GTN-G O2-region. Pre-processing of Sentinel-1 followed the analysis ready data format framework of Mullissa et al. (2021); (b) the deep learning workflow performed in ArcGIS Pro, including the use of training samples, model training and exporting; (c) the post-processing phase of the deep learning glacial lakes before validation; (d) the validation process, whereby the final deep learning dataset was validated against reference datasets and manually digitised lakes.
3.1 Data acquisition via Google Earth Engine
Sentinel-1 and -2 data for the year 2020 were acquired and processed as outlined below for all High-Mountain Asia. To align with the standardised Global Terrestrial Network for Glaciers (GTN-G) framework for internationally coordinated glacier monitoring (GTN-G, 2023), fifteen GTN-G second order (O2) regions spanning High-Mountain Asia (regions 13-01 to 13-09, 14-01 to 14-03, and 15-01 to 15-03) were selected for image acquisition and model development and are shown in Fig. S1a in the Supplement. This full, regional coverage ensured that model training captured the broad climatic, glaciological and spectral variability characteristic of the region to enhance model robustness. Subsequent model refinement and validation were then focussed on the Nepal-transboundary study region (GTN-G regions 15-01 and 15-02, with a 200 m overlap into region 13-08) to best test and compare the model with pre-existing lake inventories and manually digitised validation data available for this region.
3.1.1 Sentinel-1
Sentinel-1 Ground Range Detected (GRD) images (2017–2024) were processed to analysis ready data format following the framework of Mullissa et al. (2021) in GEE, which included speckle filtering, radiometric terrain normalisation, border noise correction and masking of radar shadow and layover areas (e.g., Fig. S5). The vertical-vertical (VV) polarisation band, which displays good contrast between water and land (Wangchuk et al., 2019), from all ascending and descending orbit tracks were processed and used to create annual median mosaics covering 1 July to 30 August each year. Median compositing improves the signal-to-noise ratio and minimises the potential presence of lake surface ice in the output composite. A smaller date range was used compared to Sentinel-2 processing (Sect. 3.1.2), as the Sentinel-1 backscatter is not affected by cloud cover, allowing for more images to be available for compositing during the post-Monsoon period when lakes are typically ice-free and near their seasonal maximum extent. Whilst some lake extent variability may occur due to these time window differences per sensor, Sentinel-1 data is intended to be complimentary by contributing temporally when optical observations are limited. Images were exported on the dB scale at 10 m resolution. A total of 10 899 Sentinel-1 images were used across the eight-year study period (Table S1 in the Supplement).
3.1.2 Sentinel-2
All available Sentinel-2 images (L1C) were used within the date range of May to November for years 2017 to 2024. This broader date range was used to coincide with the Monsoon season and late-ablation period, when the surface of glacial lakes is typically unfrozen, while also maximising the availability of cloud-free observations and reducing spatial data gaps in this persistently cloudy region. There was insufficient imagery to create composite images in 2016 and so these data were excluded. The Harmonised Sentinel-2 Level-1C top of atmosphere (TOA) data were used to create median pixel composite mosaics in GEE. TOA data were chosen over the Level 2 surface reflectance product due to the presence of processing artefacts over glacial lakes, particularly those that were rapidly expanding. To create the median composites, the archive was initially searched for low-cloud imagery in the collection, followed by cloud masking using Google Cloud Score Plus and a detection threshold of 0.6 (Pasquarella et al., 2023) (Fig. 2). Additional bands were added to the image composites before export, including the Normalised difference water index (NDWI) using the near infrared (NIR) and green bands (McFeeters, 1996), and the enhanced normalised difference water index (ENDWI) using the green, NIR and SWIR bands (Cheng et al., 2025). These bands were then exported at 10 m resolution along with the red, green, and blue bands. A total of 98 500 Sentinel-2 images were used across the eight-year study period across HMA (2017–2024; Table S1).
3.2 Deep learning
Deep learning models such as U-Net, originally designed for biomedical image segmentation (Ronneberger et al., 2015), or DeepLabV3 for semantic segmentation (Chen et al., 2017), are increasingly used for a broad range of geoscience classification tasks. For glacial lake mapping, DeepLabV3 is already a well-supported model choice, with previous studies demonstrating its performance for lake detection across heterogeneous mountain environments (Siddique et al., 2023; Tang et al., 2024; Xu et al., 2024). U-Net has also shown promise for glacial lake detection, particularly in catchment-scale studies (Ali et al., 2025; Sharma et al., 2024), however some challenges with frozen surfaces, small lake separation and boundary accuracy in diverse mountain terrain have been noted (Cao et al., 2025; He et al., 2021; Tang et al., 2024). In preliminary testing for this study, both U-Net and DeepLabV3 models were evaluated using the same training data, a variety of spectral bands (and indices) and comparable backbone configurations, with both models achieving the same F1 scores (0.85), although U-Net required twice the inference runtime of DeepLabV3. SAMLoRA (ViT-H backbone) was also evaluated with the same input data and spectral bands, and again produced a comparable F1 score (0.80) but required more than four times the inference runtime than DeepLabV3. As a result, DeepLabV3 was selected, as this model provided a favourable balance between segmentation accuracy and computational efficiency, ideal for scaling up to larger geographical areas. Additionally, its combined architecture of atrous (dilated) convolution and atrous spatial pyramid pooling (ASPP) makes it capable of classifying features across a range of scales and with complex backgrounds (Chen et al., 2017). For the training data, manually digitised lake outlines for 2020 from Zhang et al. (2024a) and Kumar et al. (2025) were used. These data were merged, incorporating all lakes from Zhang et al. (2024a), and then supplemented with any additional lakes from Kumar et al. (2025), which were typically smaller supraglacial lakes that were not present in the Zhang et al. (2024a) data. The lake outlines were used to generate training data (512-pixel image chips) with the corresponding 2020 Sentinel-1 and -2 image composites. There was no systematic coregistration offset between the lake outlines and the imagery we used for training. However, local shifts may occur, particularly in Sentinel-1 data, since the lake outlines were derived from optical imagery. Nonetheless, since the models learn generalised patterns rather than exact pixel level boundaries, we expect the overall impact to be limited. A total of 52 567 chips and lake labels were generated for Sentinel-1 and 53 414 for Sentinel-2. The image chips and labels were used to train DeepLabV3 models for the Sentinel-1 and Sentinel-2 datasets, using the ResNet-50 backbone model, with training conducted over 50 epochs, an automatically derived learning rate, a batch size of 16, and a validation sample size of 10 %. The models were then applied across the full timeseries of Sentinel-1 and -2 images for GTN-G regions 15-01 and 15-02 only to classify lakes in Nepal and associated transboundary catchments.
3.3 Lake post-processing
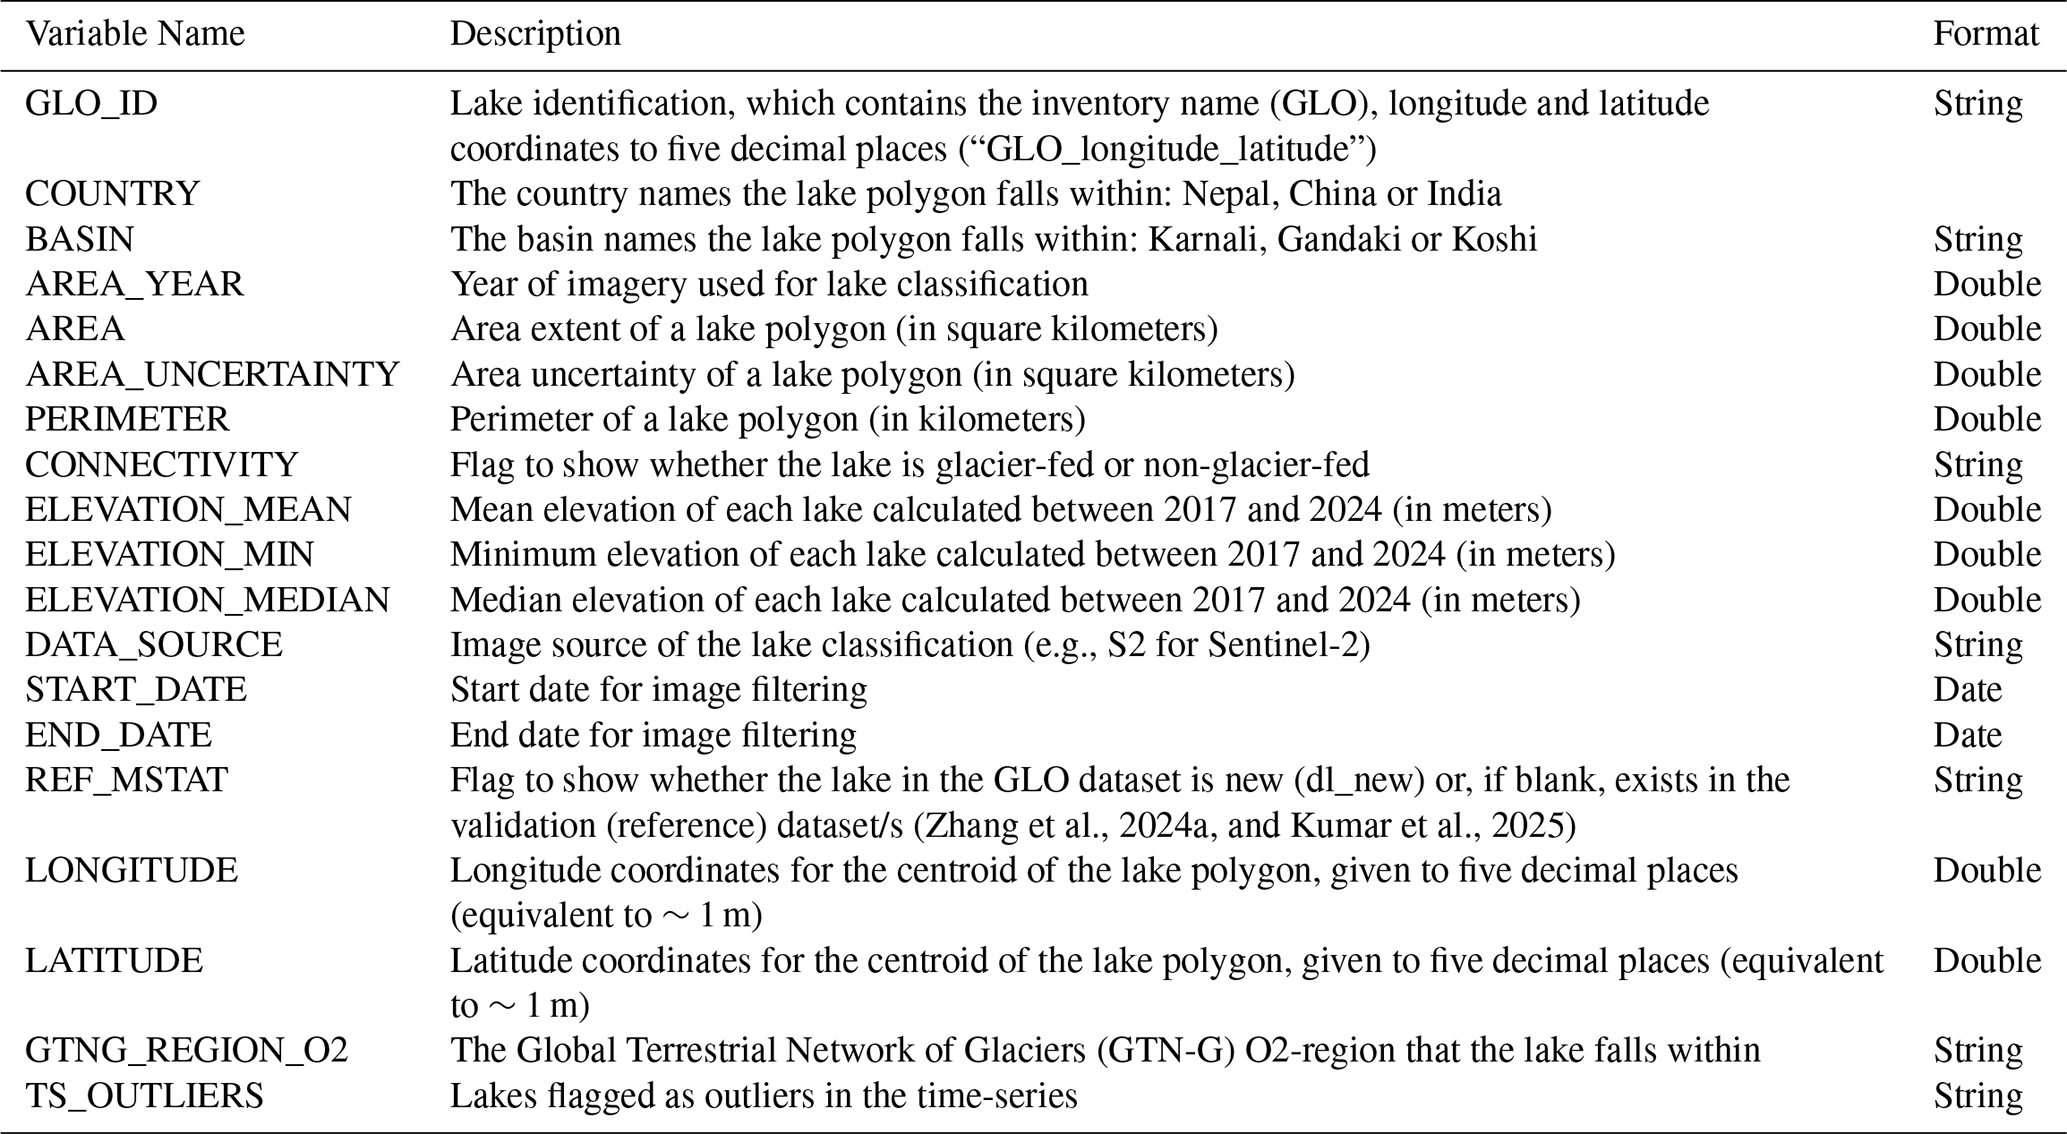
First, lake area, area uncertainty, and perimeter indices were calculated, with lakes that did not meet the minimum threshold criteria (≥0.001 km2) subsequently removed. For each lake, false positive and false negative areas were calculated by intersecting the model output with the manually digitised lake outlines (Sect. 3.4.2). The total area error was defined as the sum of these false positive and false negative areas and expressed as a percentage of the manually digitised lake area. The relationship between area uncertainty and lake size was used to fit a power-law model, which was then applied to the model outputs to estimate uncertainty in lake delineation (Eq. 1).
Unique lake IDs were generated by creating a centroid (point on lake surface) latitude and longitude point from lake outlines dissolved from the full timeseries of classifications, which would represent the lake's maximum extent. These IDs were then joined to each outline in the timeseries. Following Zhang et al. (2024a), lakes were classified based on their hydrological connectivity to a glacier within the original 10 km glacier buffer. The ALOS Global Digital Surface Model V4.1 (AW3D30 DSM) (JAXA, 2024; Tadono et al., 2014) covering the study area was smoothed with a 3×3 median filter, hydrologically corrected by filling sinks, and then used to derive D-Infinity flow accumulation downstream of RGI glacier outlines, with a minimum stream definition threshold of 10 accumulation cells. Any lakes intersecting with this network were classed as glacier-fed, and where lakes did not they were classed as non-glacier-fed. Additional attributes were added to the lake database (Table 2) including area and perimeter derived in ESRI:102025 – WGS 1984 Albers for Northern Asia projection, corresponding river basin locations (Koshi, Gandaki, and Karnali) using basin outlines from ICIMOD (ICIMOD, 2021) and elevation statistics (minimum, mean, median and standard deviation) derived from the AW3D30 DSM V4.1 (JAXA, 2024; Tadono et al., 2014) using buffered (−10 m) lake polygons to assist with the reduction of mixed pixel edge effects on such statistics. No manual editing of the lake outlines was undertaken; however, we removed (i) erroneous classifications at the overlapping edges of composite imagery; (ii) the Shey Phoksundo landslide dammed lake ( E, N) and; (iii) lakes with anomalously high elevation standard deviations (e.g., ≥50 m) indicative of false positives (e.g., increased error on steep slopes, obscureness by shadows) or DSM artefacts (Fig. S2). This conservative elevation threshold was less restrictive in order to avoid excluding true lake polygon delineations. A total of 856 lake polygons, or 4 % of the dataset, were removed from the final dataset across the eight-year study period.
Table 2A summary of key metadata included for each glacial lake in the inventory.
3.4 Data evaluation
To quantify annual lake area change rates and identify time series outliers, a robust linear regression (RLM) model was applied to the timeseries data of lake surface area. Lakes with fewer than five unique years of data were excluded. For each lake, residuals from the fitted model were standardised, and years with absolute standardised residuals greater than two standard deviations from the mean were flagged as outliers and excluded from further analysis. Bootstrap resampling (1000 iterations) was applied to the cleaned dataset to estimate the rate of area change and a 95 % confidence interval (Canty and Ripley, 1999; Davison and Hinkley, 1997; Venables and Ripley, 2013). For each lake outline per year, an outlier flag was recorded and the area change was deemed significant if the 95 % confidence interval of the annual change rate excluded zero.
3.4.1 Evaluation against existing datasets
Lake classifications were evaluated against the Zhang et al. (2024a) (derived from Sentinel-2 and Landsat data) and Kumar et al. (2025) (derived from Landsat data) glacial lake inventories for 2020 after clipping to the same geographic extent and reprojecting to the coordinate system ESRI:102025. These inventories used similar resolution data, so the classifications should be comparable, though smaller lakes may be missed due to the mapping resolution. For example, supraglacial lakes can be missed or mapped with greater uncertainty when using 10–30 m resolution imagery, compared to smaller scale lake inventories that use high-resolution imagery (<1–3 m) (Chand and Watanabe, 2019; Taylor et al., 2022; Watson et al., 2016, 2018). Lakes could also have expanded or drained, making it difficult to draw a definitive comparison with the existing inventories, although any changes are constrained to a single year (2020). Accuracy assessment metrics were calculated, including precision, recall, intersection-over-union (IoU) and F1 score. These output a 0–1 score, where 1 represents a perfect match between the two compared datasets.
3.4.2 Evaluation against manually digitised datasets
A sample of ∼10 % of the lakes classified in 2020 were selected through stratified random sampling and manually digitised by a single author at 1:3000 to 1:5000 scale using the Sentinel-2 imagery composites from 2017, 2020, and 2024. This was repeated for 2020 data by a second author for cross-comparison. The validation dataset corresponded to 895 lake outlines from 239 individual lakes. Four class strata were defined from the data quartiles to ensure a representative sample of lake sizes were selected: Class 1: area (m2) ≤ 6843 m2, Class 2: area > 6843 and ≤ 15 212, Class 3: area > 15 212 and ≤ 367 056, and Class 4: area > 36 706 (Fig. S1b). Accuracy assessment metrics (Sect. 3.4.1) were derived by comparing the lake classifications with the manual validation data. Further validation analysis was also undertaken to assess classification robustness as a function of lake size and elevation for both Sentinel-1 and -2 data. For size-dependent performance, F1 scores were examined across lake area and used to identify the approximate minimum lake size at which robust classification (F1≥0.85) was achieved. For the influence of elevation on classification performance, median elevation was extracted for each lake polygon (−10 m buffer) using the AW3D30 DSM (JAXA, 2024; Tadono et al., 2014) and a multiple linear regression performed to assess the effects of lake area and median elevation on F1 score for the sensor-comparable years of 2020.
4.1 Comparison with other inventories and accuracy assessment
4.1.1 Deep learning classifications and existing inventories
As outlined in Sect. 3.4.1, our GLO deep learning classified lakes from Sentinel-1 and -2 datasets were compared against the existing glacial lake inventories of Zhang et al. (2024a) and Kumar et al. (2025) (e.g. Fig. 3a and b) to evaluate the accuracy and spatial consistency relative to established regional inventories. First, comparisons with Zhang et al. (2024a) found good agreement in detections between the datasets, resulting in F1 scores of 0.82 for Sentinel-1 and 0.87 for Sentinel-2 (Table S2), with corresponding IoU values of 0.70 and 0.78, respectively.
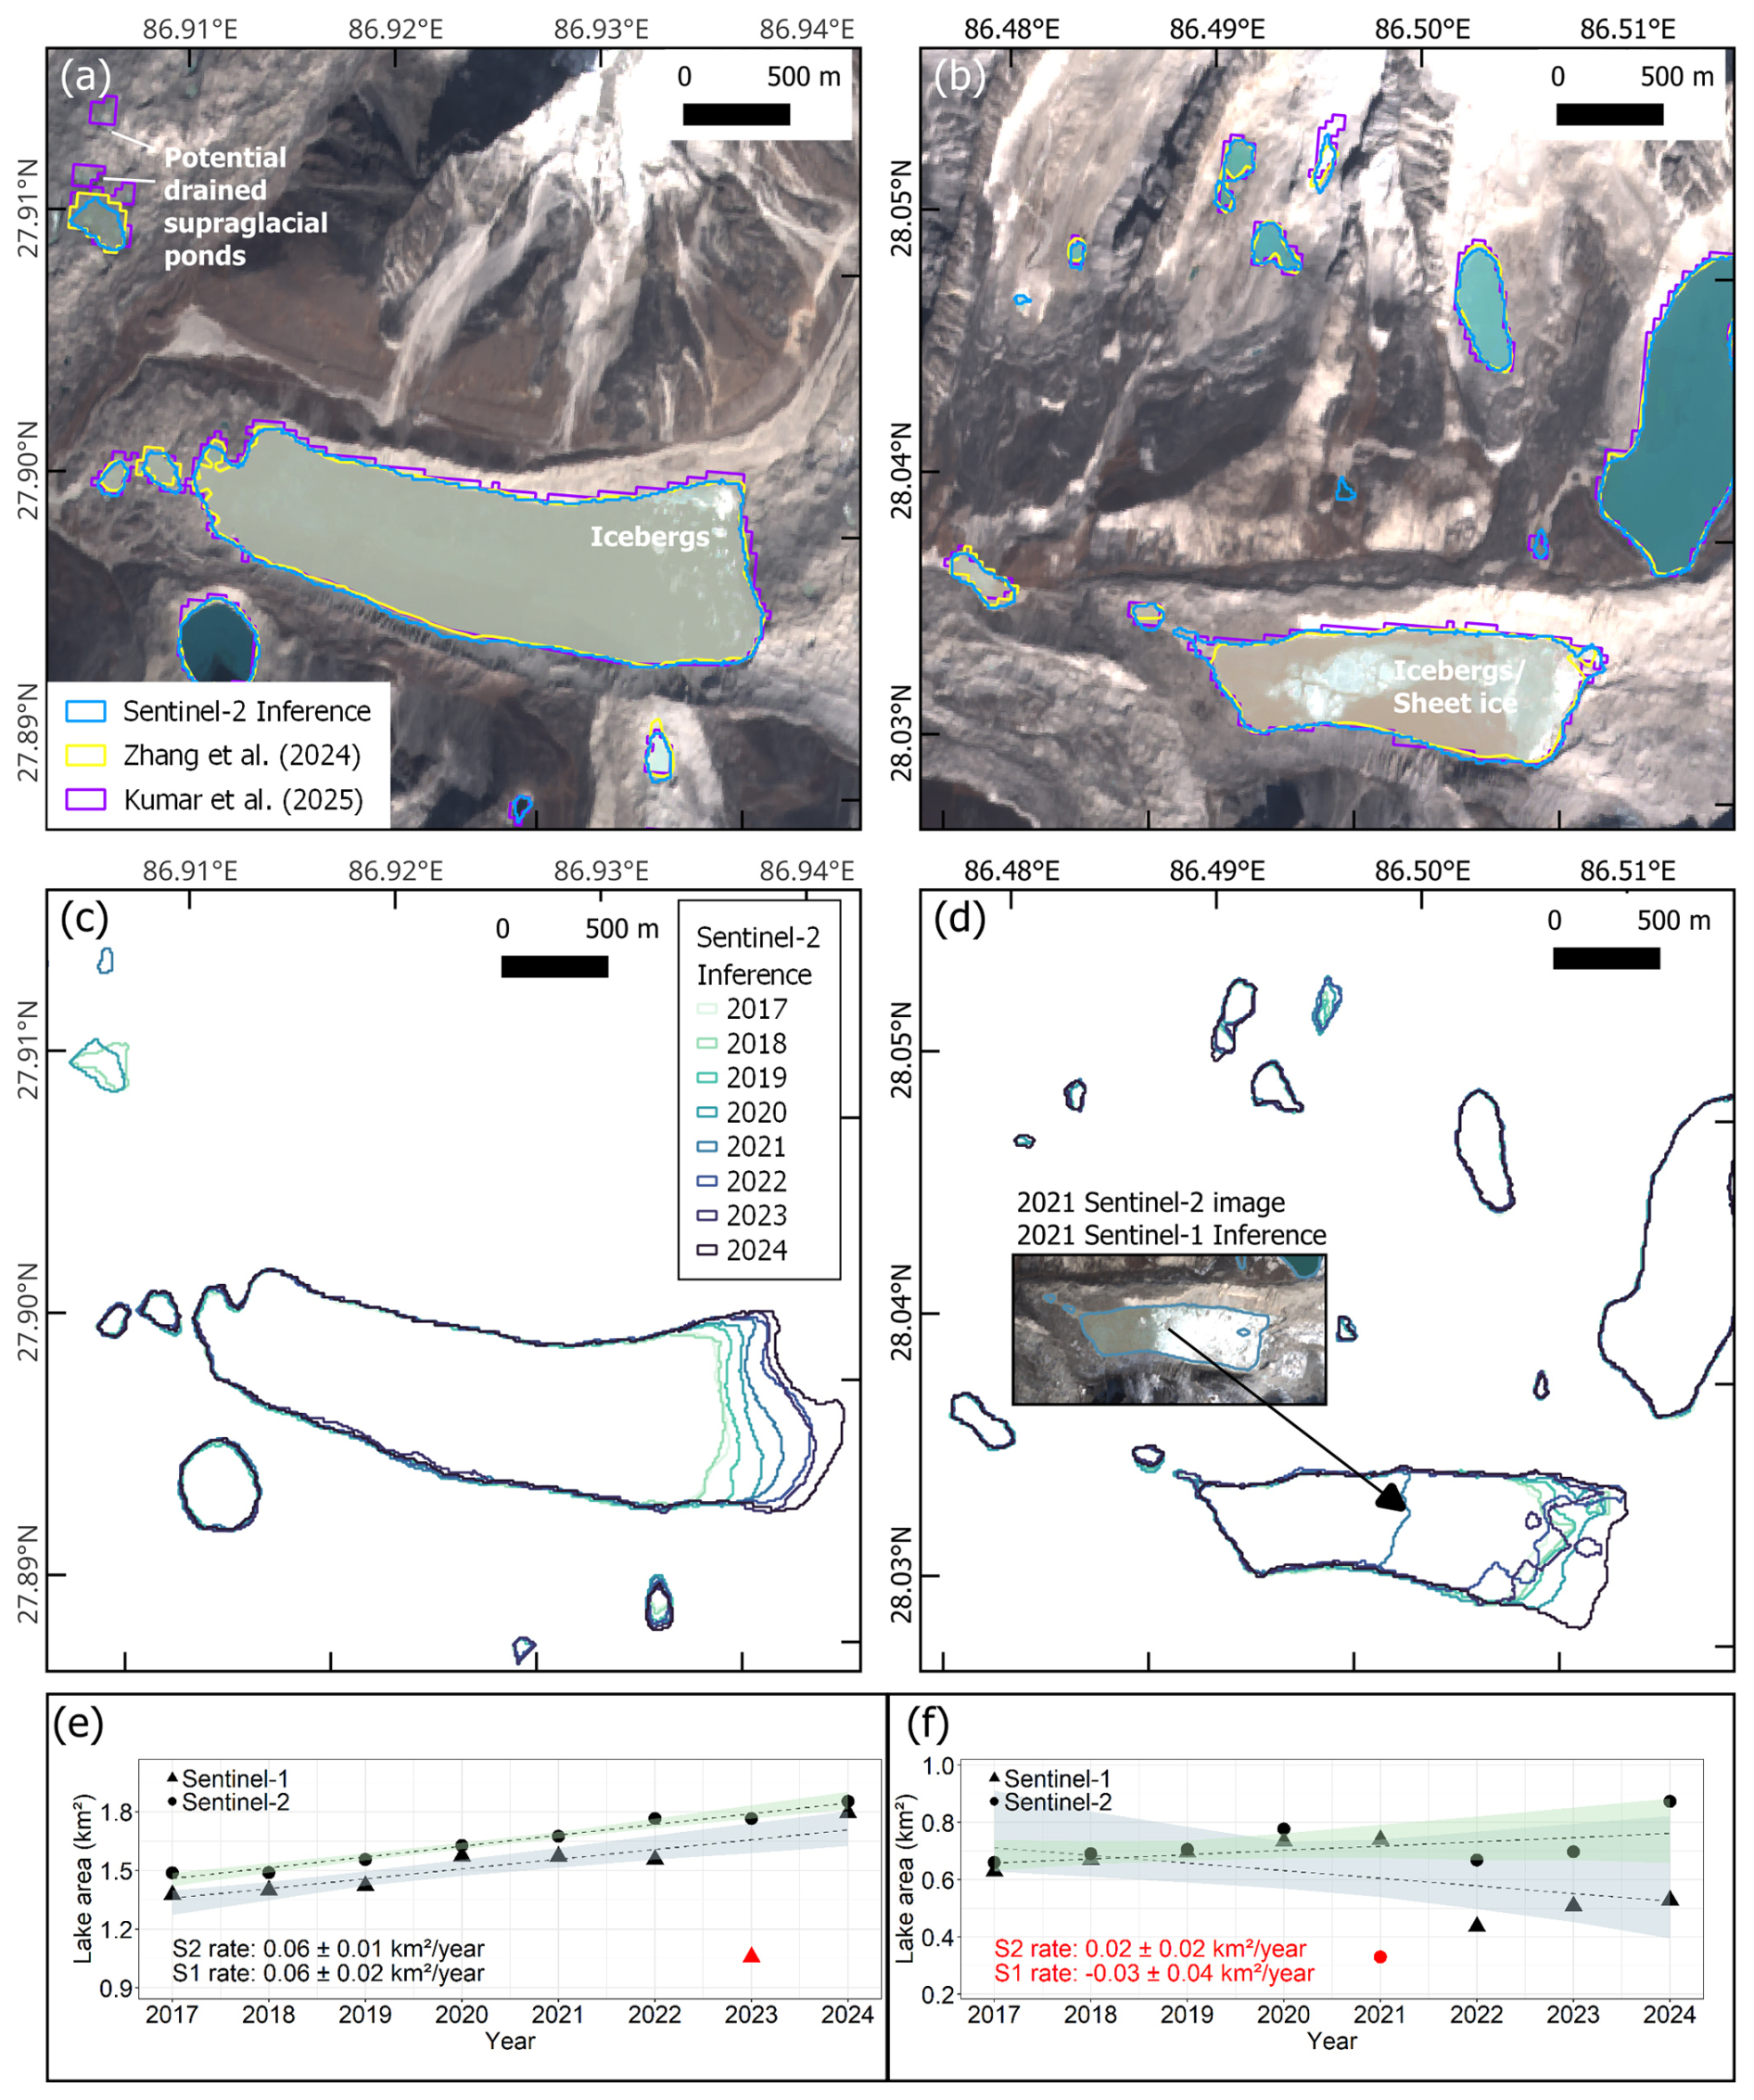
Figure 3Example of lake classification outlines and timeseries for two lakes (a) GLO_86.92845_27.89838 (Imja lake) and (b) GLO_86.50218_28.03313. (a, b) 2020 Sentinel-2 inference from this study compared to the 2020 outlines of Zhang et al. (2024a) and Kumar et al. (2025). Background imagery is the 2020 Sentinel-2 composites used for inferencing. (c, d) The Sentinel-2 inference timeseries for each lake. (e, f) Lake area expansion rates derived from Sentinel-1 and Sentinel-2 timeseries. Outliers and non-significant change rates are coloured red. Dashed lines indicate robust regression fits to each series, excluding statistical outliers (red points). Shaded ribbons represent bootstrapped 95 % prediction intervals, with pastel blue for Sentinel-1 and pastel green for Sentinel-2, reflecting model uncertainty in annual area estimates.
When compared against the combined Zhang et al. (2024a) and Kumar et al. (2025) inventories the F1 scores were slightly lower, with 0.79 and 0.85 for Sentinel-1 and -2 respectively, with corresponding IoU values of 0.66 and 0.74. Again, these results demonstrate good spatial agreement across datasets of differing sensors. The timeseries change of each lake was used to derive lake expansion rates and identify outliers (e.g. Fig. 3c–f). An example of an outlier (2021) in the Sentinel-2 timeseries is shown in Fig. 3d, where lake delineation was affected by the presence of large icebergs and/or surface sheet ice (see inset image). The Sentinel-1 outline shown on the same inset image captured the lake in its entirety.
4.1.2 Deep learning classifications and manual reference dataset
A 10 % stratified sample of classified lakes from both Sentinel-1 and -2 datasets were validated against manually digitised lake outlines, as well as compared directly against one another to further assess the consistency and accuracy of the deep learning classifications (as per Sect. 3.4.2). First, to establish the reliability of the manually digitised lakes as a reference dataset, the independently digitised outlines from two authors were compared, producing a high F1 score of 0.95 (Fig. 4, Table S3) and confirming the internal consistency of this reference dataset for use in comparison to the automated classifications.
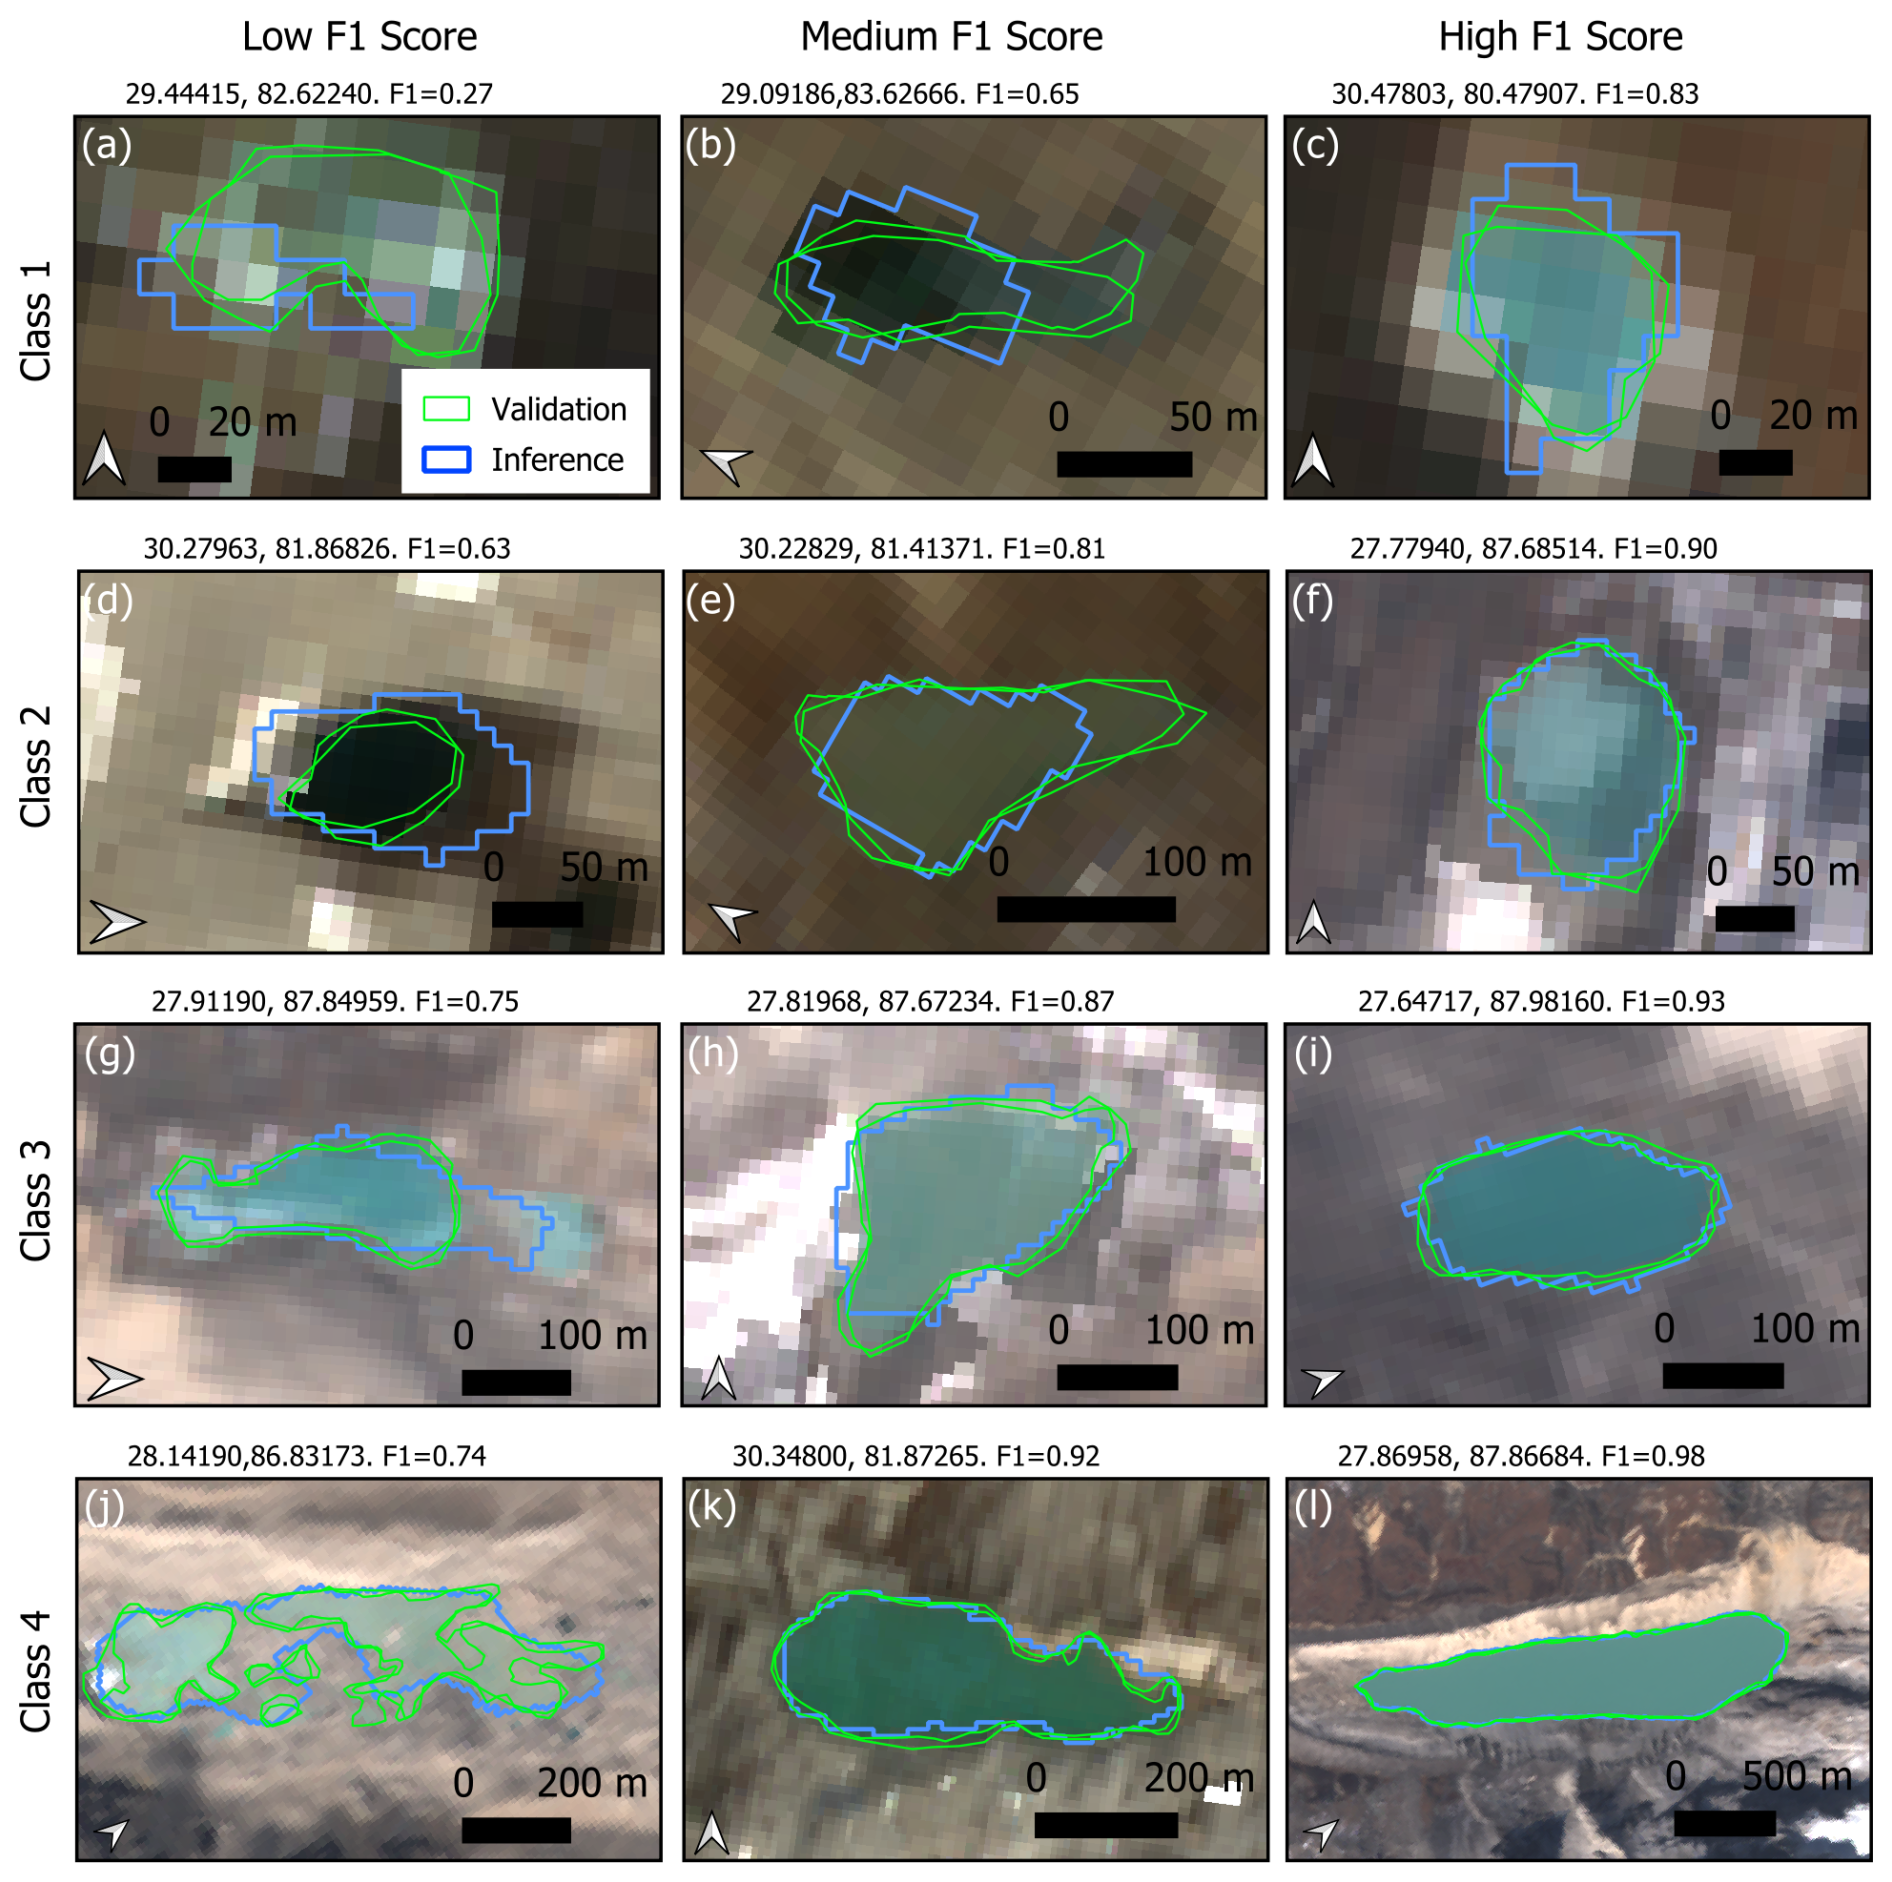
Figure 4Example lake outline comparisons from the manual digitisation (validation – green outlines) and Sentinel-2 inference (inference – blue outline) for the year 2020. For each lake class of increasing size (rows showing classes 1 to 4), the figure columns show an example of a low, middle, and high F1 score. Two validation outlines are shown for each lake, representing the manual digitisation from two study authors and the highest F1 score is annotated. The background image is the 2020 Sentinel-2 composite used for inferencing.
Validation of the sampled deep learning classification lakes against the manual reference dataset for 2020 showed that the deep learning model performed well for both sensors (0.82 and 0.92, respectively), with Sentinel-2 overall demonstrating stronger agreement (Table S3). This validation for Sentinel-2 against 2017 and 2024 produced similarly high results, with consistent F1 scores of 0.91. When comparing the Sentinel-1 and -2 datasets directly, fewer lakes and a smaller total mapped lake area were present in Sentinel-1 (Fig. S3a). However, where lakes were present in both inventories, the mapped areas generally corresponded well (R2=0.95) (Fig. S3a and b), yielding an F1 score of 0.86 and IoU of 0.76. Comparing manually digitised lake outlines with the Sentinel-2 deep learning classification showed greater uncertainty for smaller lakes and highlights the variation in lake colour and shape (Figs. 4 and 5). The median area error for the largest class of lakes was 14.3 % compared to 61.5 % for the smallest lakes (Fig. 5a). For lake area (Fig. 5), the error is shown to decrease with increasing lake size, following a log-log linear power law (R2=0.54; Fig. 5b), with smaller lakes more likely to become misclassified or omitted. The corresponding F1 scores are shown in Fig. 5c, coloured by year of the validation data.
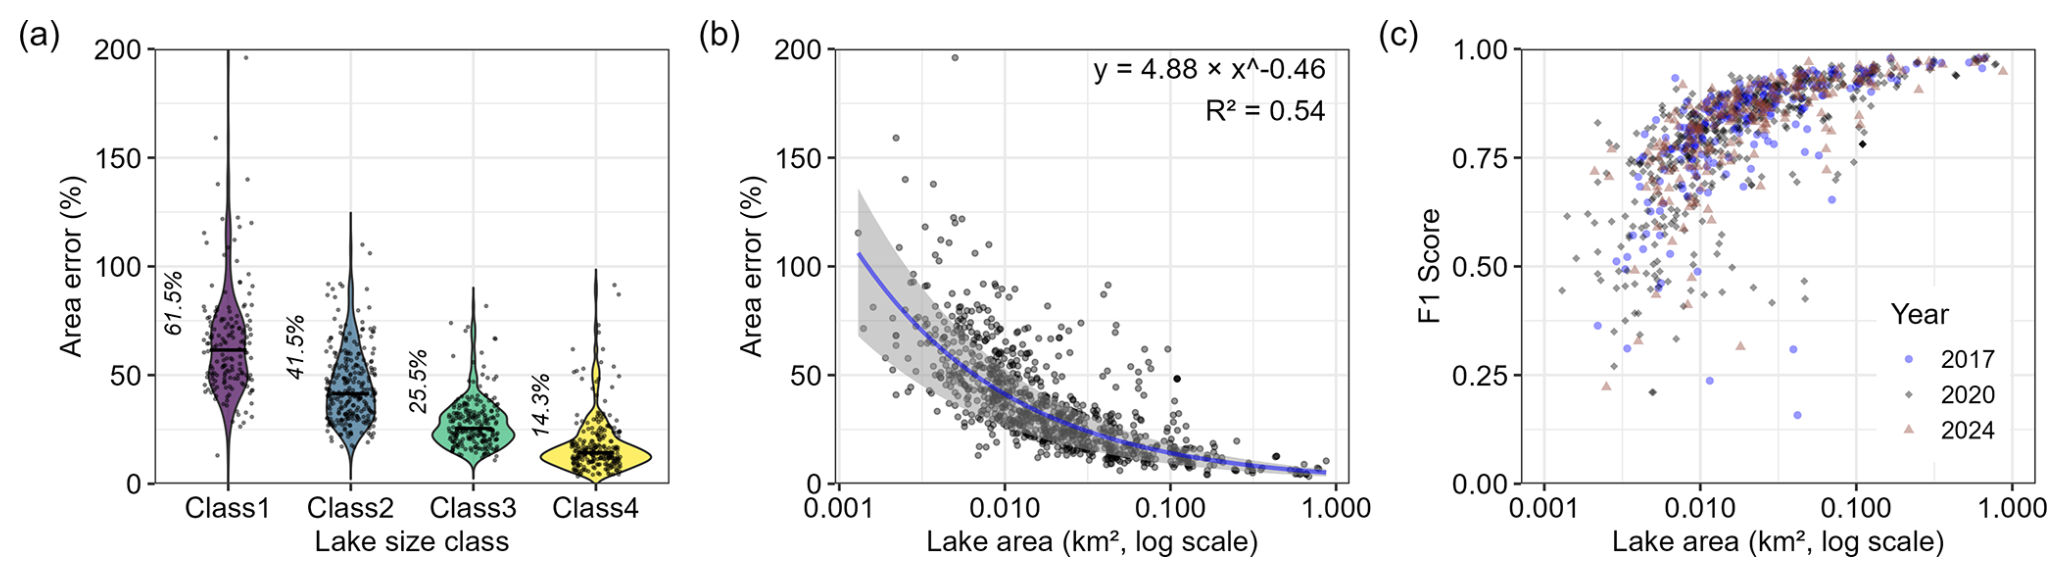
Figure 5Lake area errors derived by comparing Sentinel-2 lake inferences with manual lake digitisation (n=895) from two study authors. (a) Percentage lake area error for each lake strata (see methods). (b) Percentage lake area error for each manually validated lake. A log-log linear power law model was fitted to the data (blue line), indicating a decreasing trend in relative error with increasing lake size. The shaded grey ribbon represents an alternative modelled fit (R2=0.88) from a ±0.5 pixel (lower bound), or 1 pixel (upper bound) uncertainty around the lake perimeters. (c) Accuracy assessment F1 scores for the lake validation coloured by year.
This size dependence of lakes is also used to approximate the threshold at which robust classification performance of the model is reached. For Sentinel-2, a robust performance score (F1≥0.85) was generally achieved for lakes of above 0.028 km2 across the study period, whilst for complimentary data provided by Sentinel-1, a larger size threshold of 0.084 km2 was required to reach the same classification performance (F1≥0.85), indicating lower robustness for smaller lakes in the SAR-derived dataset. Although the overall elevation distributions of both datasets were similar (median elevations ∼5020–5060 m), lower-F1 lakes did tend to occur at slightly higher elevations and were generally smaller in area.
However, the multiple linear regression showed that lake area was the dominant control on F1 score for both Sentinel-1 and Sentinel-2. For Sentinel-2, lake area alone explained 42 % of F1 variability (R2=0.42; β=0.19; p<0.001), with a strong positive significant relationship whereby a 10-fold increase in lake area was associated with an increase in F1 score by ∼0.19. The addition of elevation provided little improvement to the model although it did have a weak negative but significant influence (; p=0.02). Sentinel-1 showed a similar positive relationship between F1 and lake area (R2=0.24; β=0.19; p<0.001), however lake area explained less of the variance in F1 when compared to optical, indicating lower overall predictability of SAR classifications. For elevation, this had no significant independent effect on Sentinel-1 performance (; p=0.33). Overall, Sentinel-1 was associated with lower and more variable F1 scores than Sentinel-2, consistent with the lower robustness of the SAR-derived dataset, particularly for smaller and more geometrically complex lakes.
4.2 Lake abundance
Based on Sentinel-1 imagery, 18 129 lake polygons (≥0.001 km2), including all annual detections and repeat observations, were delineated across the Nepal-transboundary region between 2017 and 2024 (Table S4). Of these, 2967 lakes were uniquely identified. Over the timeseries, on average 2267 lakes were mapped per year across the eight-year period, with a maximum of 2354 lakes mapped in 2017 (Table 3). The mean annual total area of lakes across the eight-year study period was 156.02 ± 3.22 km2, with an average individual lake size of 0.069 ± 0.23 km2. Glacially-fed lakes accounted for 57 % (n=10 264) of all lakes identified in the Sentinel-1 dataset.
Table 3Summary statistics of lakes extracted from Sentinel-1 and Sentinel-2 imagery in the GLO inventory. Sentinel-2 statistics are given in bold.
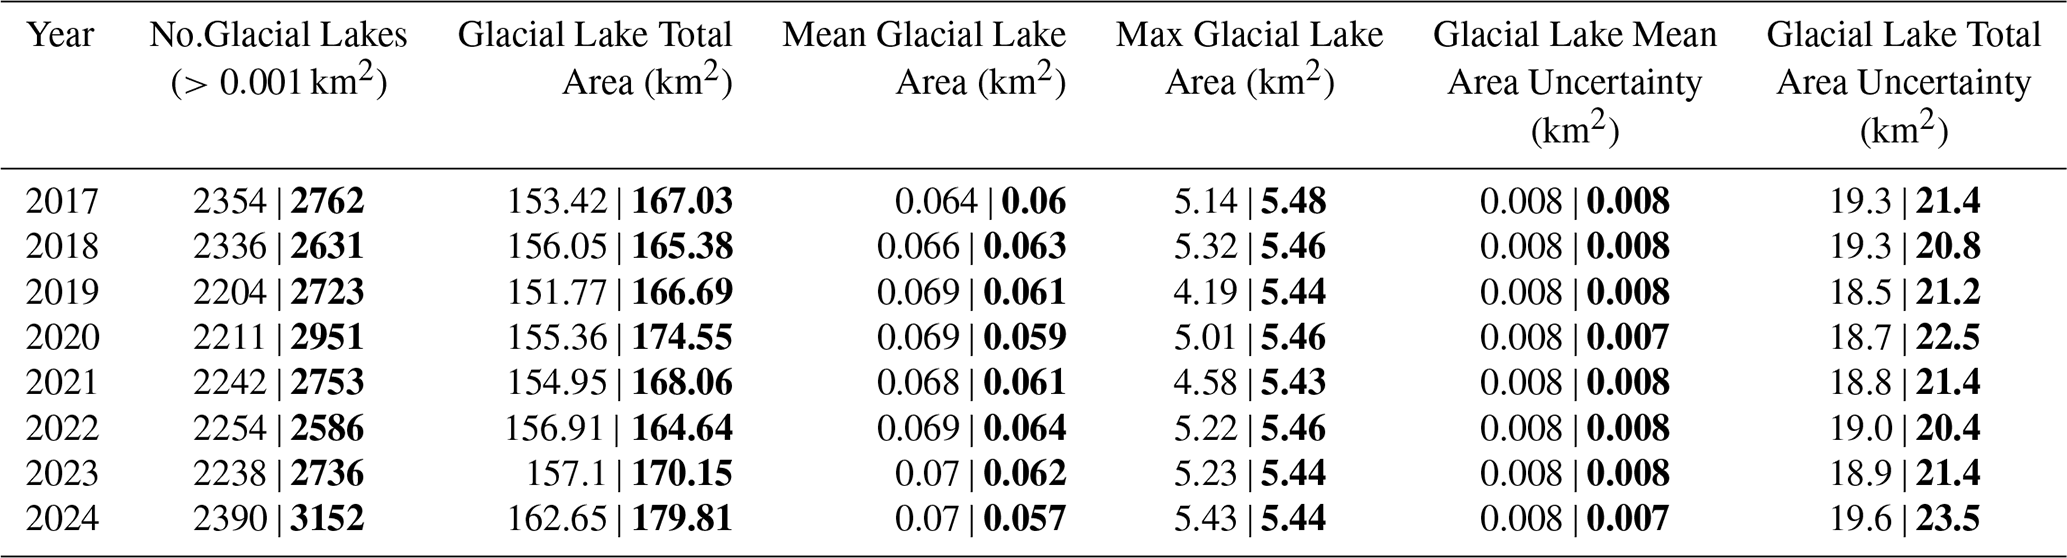
From Sentinel-2 imagery, a total of 22 294 individual lake polygons (≥0.001 km2) were mapped across the Nepal-transboundary region over the same period, corresponding to 4150 unique lakes (Table S4). The number of lakes ranged from 2762 (2017) to 3152 lakes (2024), indicating a gradual increase in lake abundance overtime, with some annual variability (Table 3). The mean annual total lake area was 169.5 ± 5.12 km2, with an average individual lake size of 0.06 ± 0.22 km2. The largest lake named Galongco (Allen et al., 2022) (GLO_85.84205_28.32067), with an area of 5.44 km2 in 2024, was recorded in 2017 and consistently detected in both Sentinel-1 and -2 datasets. Glacially-fed lakes represented 59 % (n=13 048) of the Sentinel-2 derived dataset.
Collectively the two lake datasets derived from SAR and optical Sentinel sensors (respectively) show broadly comparable spatial patterns across the Nepal-transboundary but differ slightly in their interannual detection behaviour likely due to sensor-specific characteristics. Sentinel-2 captured 23 % (n=4165) more lakes over the time period with a greater number of unique lakes and year-to-year variability, whilst Sentinel-1 provided more consistent annual detection lake counts with lower year-to-year variability.
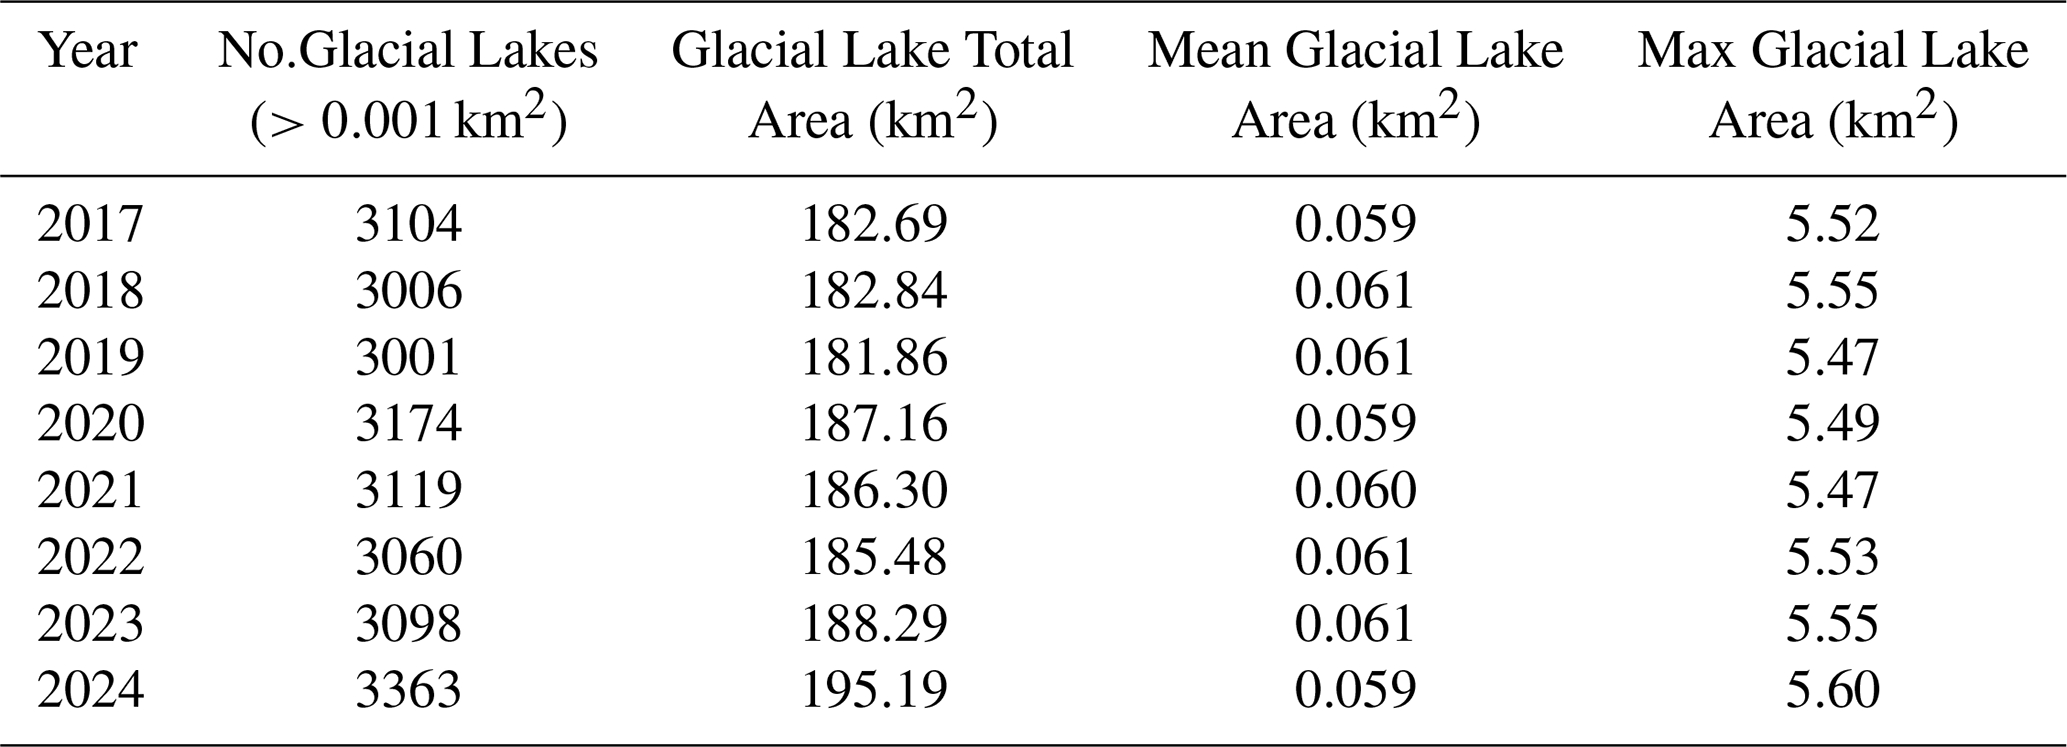
To examine glacial lake detections from both Sentinel sensors collectively, overlapping lake polygons identified independently from Sentinel-1 and -2 imagery were merged within each year. This resulted in a total of 24 925 annual lake delineations across the study period and 4453 unique lakes between 2017 and 2024. Sentinel-2 detections comprised approximately 90 % of all annual lake delineations and 93 % of the unique lakes identified through this combined analysis. On average, 3116 lakes were mapped per year, with annual lake totals ranging between 3001 (2019) and 3363 (2024) (Table 4). The mean annual total lake area in the combined inventory was 186.22 ± 4.29 km2, with average individual lake size 0.06 ± 0.21 km2. Glacially-fed lakes accounted for 59 % (n=14 675) of all lakes captured within the combined dataset.
Table 4Summary statistics of the combined Sentinel-1/Sentinel-2 lake analysis for the Nepal-transboundary region (2017–2024). Lake polygons derived from Sentinel-1 and Sentinel-2 datasets were spatially merged to remove duplicate detections but retain the maximum mapped extent of each lake.
4.3 Lake basin and country characteristics
When examining the spatial distribution of mapped lakes across the three major basins of the Nepal-transboundary region, both Sentinel-1 and -2 derived lakes show that the Koshi basin hosts the largest number and total area of glacial lakes from 2017 to 2024 (Fig. 6). The Karnali basin contains the second highest number and total cumulative area of lakes, while the Gandaki basin consistently exhibits the fewest.
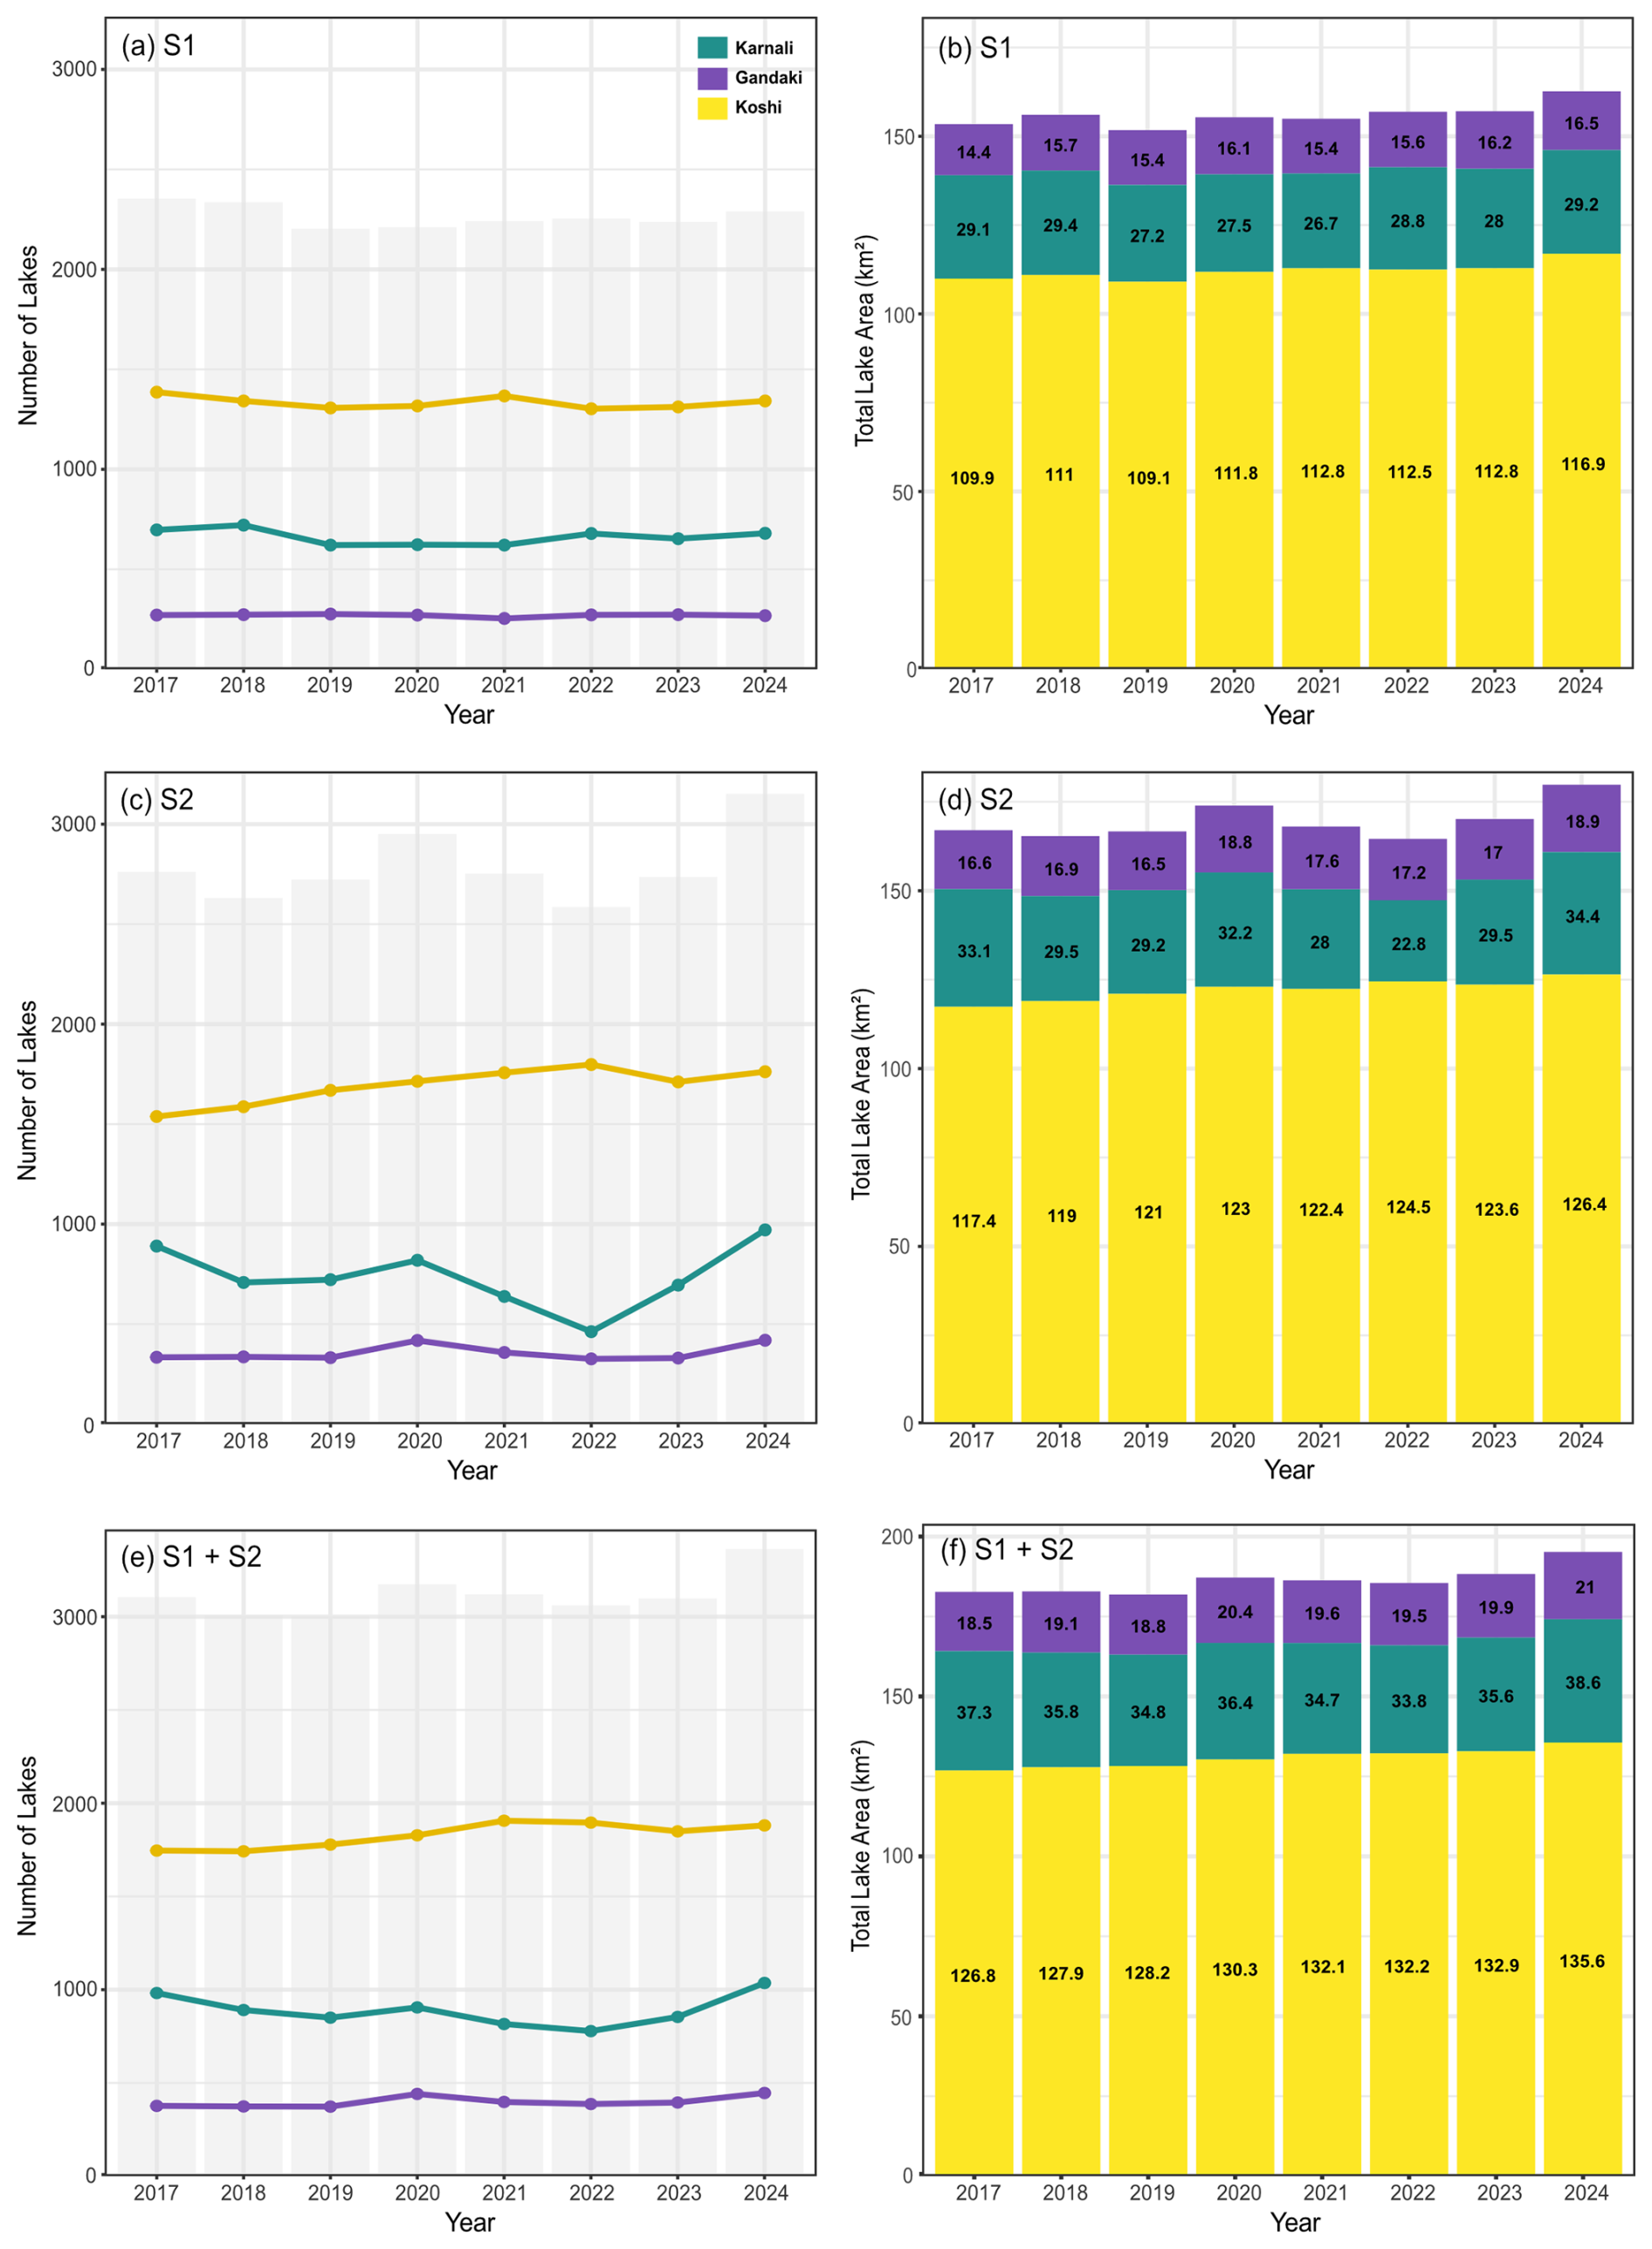
Figure 6Annual glacial lake statistics for the Nepal-transboundary region (2017–2024) derived from Sentinel-1, Sentinel-2 and combined Sentinel inventories. Panels show the annual number of lakes (a, c, e) and total lake area (km2; b, d, f) by basin for Sentinel-1 (a, b), Sentinel-2 (c, d) and the combined Sentinel-1/Sentinel-2 inventory (e, f). The combined inventory integrates overlapping Sentinel-1/Sentinel-2 lake detections within each year. Grey bars indicate the total number of lakes mapped each year.
For Sentinel-1 (Fig. 6a and b), lake numbers remained relatively stable across the eight-year study period across all basins. For Koshi, 59 % of all lakes mapped (n=10 676) across the study period occurred within this basin, with yearly counts ranging between 1303 (2022) and 1386 (2017). The cumulative total area in Koshi increased gradually from 109.9 km2 in 2017 to 116.9 km2 in 2024, with an average total area of 112.1 km2. Whereas Karnali and Gandaki basins averaged 28.3 km2 and 15.6 km2 respectively, with only minor year-to-year variability. Across all basins, mean lake size ranged between 0.04 and 0.09 km2, but the Koshi basin consistently contained the largest individual lakes (5.43 km2 in 2024).
From Sentinel-2 mapped lakes per basin (Fig. 6c and d), a similar spatial pattern can be seen, but with a more pronounced upward trend in both the number of lakes and total lake area overtime. Koshi accounted for 61 % of all lakes mapped across the eight-year period (n=13 536) and 72 % of the total cumulative lake area across the Nepal-transboundary region in the Sentinel-2 dataset. Lake counts in Koshi increased from 1538 in 2017 to 1762 in 2024, with total cumulative lake area increasing by 8 %, from 117.4 to 126.4 km2. Linear regression confirmed a significant temporal increase in both lake number (R2=0.73, p=0.007) and total cumulative lake area (R2=0.89, p=0.001) for the Koshi basin, with an increase of ∼32 lakes yr−1 and an area increase of ∼1.15 km2 yr−1, indicating consistent expansion of glacial lake coverage over the study period. No detectable, significant temporal trends were found for lake counts or cumulative lake area overtime for the Karnali (n: , p=0.84; area: , p=0.80) or Gandaki basins (n: , p=0.38; area: R2=0.20, p=0.15).
Again, Koshi consistently contained the largest mean (0.07 km2) and maximum (5.48 km2) sized glacial lakes. Despite Karnali accounting for 26 % of lakes in the dataset, lakes here generally have a lower mean (0.04 km2) and maximum size (0.74 km2) compared to Gandaki, which accounts for 13 % of lakes but has a slightly higher mean (0.05 km2) and larger maximum size (3.6 km2). When broken down into hydrologically-connected status, 62 % of all glacier-fed lakes were found in Koshi (Karnali: 24 %; Gandaki: 15 %). Predictably, glacier-fed lakes were found to be at significantly higher mean elevations than non-glacier-fed lakes (Fig. 7). Independent two-sample t-tests found that these differences were statistically significant (p<0.001) in each basin, with mean elevation differences of 125 m in Karnali, 335 m in Gandaki, and 265 m in Koshi.
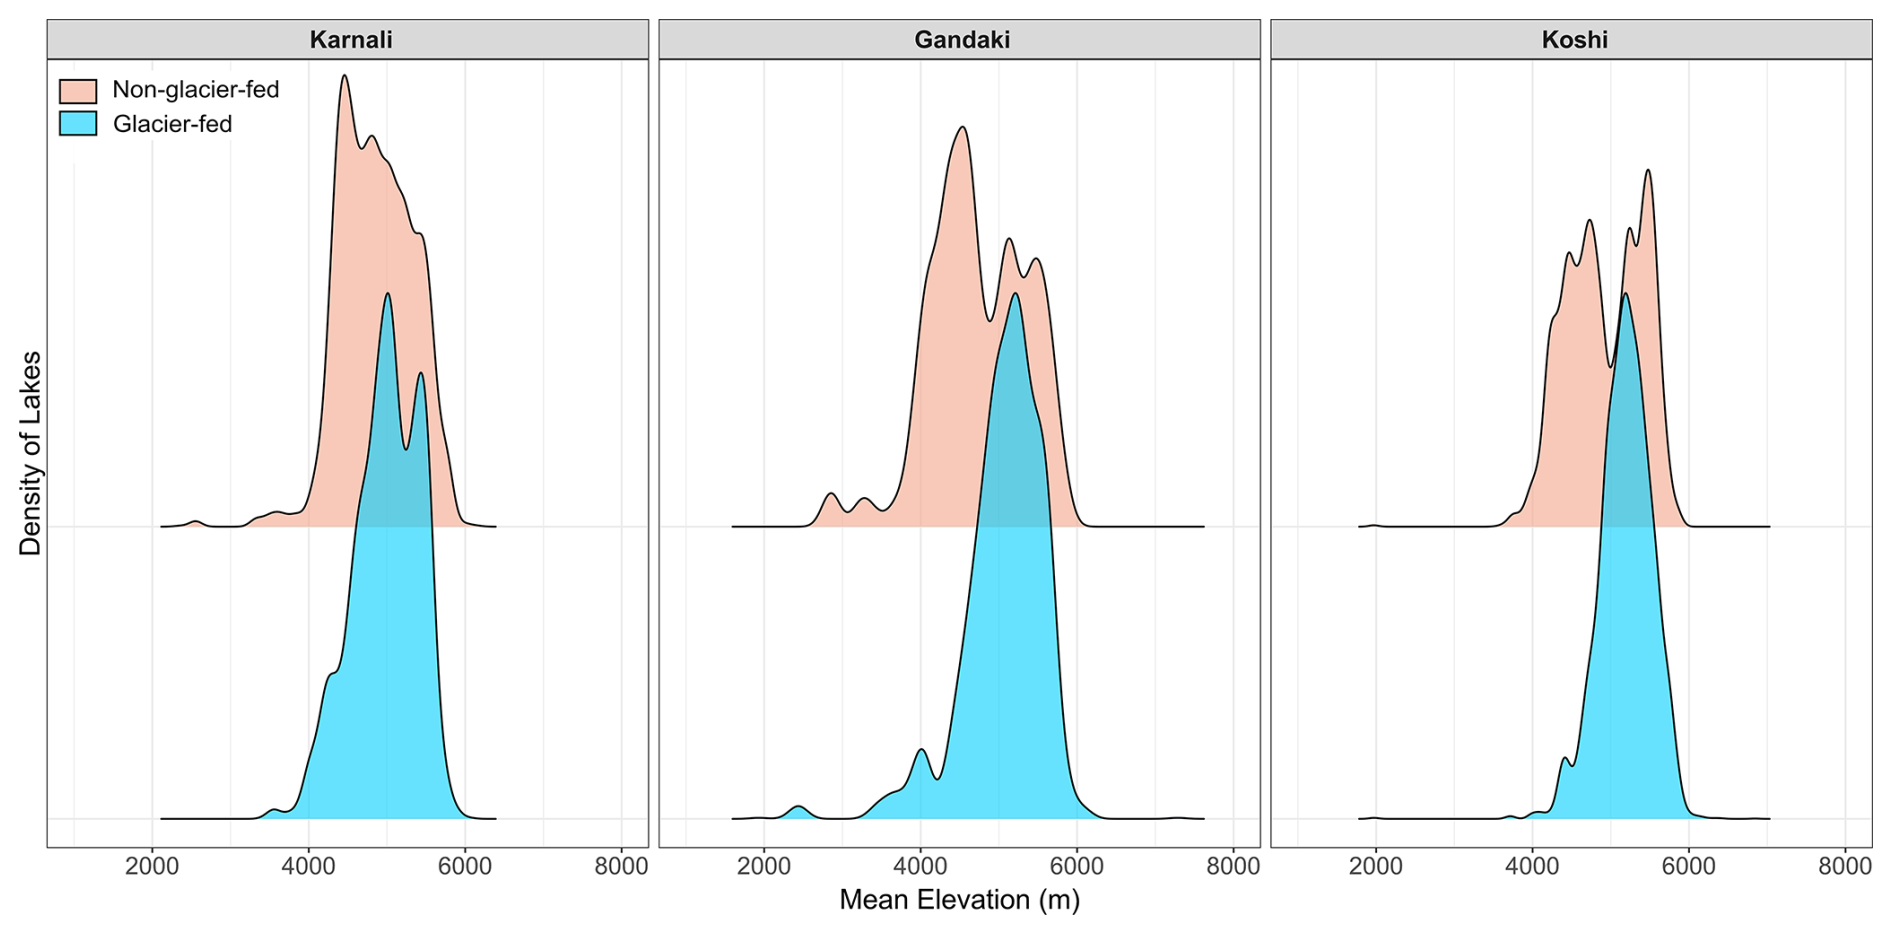
Figure 7Density distribution of glacier-fed and non-glacier-fed lakes from Sentinel-2 across mean elevation (m) within the three major Nepal-transboundary river basins: Karnali, Gandaki, and Koshi. Shaded areas represent the relative density of lakes by elevation, highlighting the elevational preferences of glacier-fed (blue) and non–glacier-fed (orange) lakes in each basin.
Consistent with the Sentinel-2 inventory, the combined Sentinel-1/-2 detections showed significant increases in both lake number and total cumulative lake area only in the Koshi Basin (Fig. 6e and f). The Koshi basin accounted for 59 % of all lakes mapped across the eight-year period (n=14 624) and 70 % of the total cumulative lake area across the Nepal-transboundary region, increasing from 1746 in 2017 to 1881 in 2024, with the largest count occurring in 2021 (n=1905). Total cumulative area increased by 7 % from 126.8 km2 to 135.6 km2. Basin-scale trend analysis confirmed that the number of mapped lakes increased significantly only in the Koshi Basin (22.8 lakes yr−1, R2=0.71, p=0.008), whereas no significant trends were detected in the Gandaki or Karnali basins. Similarly, total lake area increased significantly in both the Koshi (1.19 km2 yr−1, R2=0.96, p<0.001) and Gandaki (0.27 km2 yr−1, R2=0.63, p=0.018) basins, while no significant change was observed in the Karnali Basin (0.03 km2 yr−1, R2<0.01, p=0.925). Mean lake area remained stable in all three basins, with no significant temporal trends detected. In contrast, maximum lake area increased significantly only in the Gandaki Basin (0.041 km2 yr−1, R2=0.55, p=0.036), whereas no significant changes were observed in the Koshi or Karnali basins.
Collectively, these results indicate that recent changes in Nepal–transboundary glacial lakes have been concentrated in the Koshi Basin, where both lake number and total cumulative lake area increased significantly between 2017 and 2024. In contrast, the Gandaki Basin exhibited a significant increase in total lake area without a corresponding increase in lake number, while no significant temporal trends were detected in the Karnali Basin.
Predictably, glacier-fed lakes occurred at significantly higher mean elevations than non-glacier-fed lakes (Figs. 7 and S4). Independent two-sample t-tests confirmed that these differences were statistically significant (p<0.001) across all basins in both the Sentinel-2 inventory and the combined Sentinel-1/-2 analysis. The largest mean elevation differences were observed in the Koshi Basin (406 m), followed by Gandaki (354 m) and Karnali (126 m).
In terms of glacial lakes and their country of origin across the Nepal-transboundary region, as expected, the largest percentage of lakes (54 %) were found in Nepal, followed by 45 % in transboundary China and the remainder (1 %) in India.
On an annual basis, China accounts for up to 58 % of the total cumulative annual lake area across the Nepal-transboundary region, with a mean lake size of 0.08 km2 and a maximum lake size of 5.48 km2: the largest (and same) lake recorded in both the Sentinel-1 and -2 datasets. In 2024, Nepal contained the greatest number of glacier-fed lakes (n=1046; 51.4 %), closely followed by China (n=954; 46.9 %), whereas India contained only 34 glacier-fed lakes (1.7 %) (Table 5). Despite this, China contained the largest cumulative glacier-fed lake area (90.84 km2; 59.7 % of the total), compared with 60.21 km2 (39.6 %) in Nepal and 1.13 km2 (0.7 %) in India, reflecting the generally larger lake sizes within China. The majority (84 %) of the Nepal-transboundary lakes within China occur within the Koshi basin, which as mentioned previously, has seen a significant increase in the both the number and cumulative area of glacial lakes across the eight-year period.
Table 5Sentinel-1 and Sentinel-2 (bold) derived glacial lake counts in Nepal and the transboundary catchments of India and China in 2024.

Examination of the glacial lakes at a national scale, China exhibited a statistically significant increase in both the number of lakes (R2=0.57, p=0.01) and cumulative area (R2=0.61, p=0.01), indicating continued expansion of lake coverage, primarily through the formation of new lakes (∼22 lakes yr−1). In contrast, Nepal showed no significant temporal trend in either lake number (, p=0.62) or cumulative area (R2=0.003, p=0.35), with mean lake size remaining relatively stable (, p=0.84). These results suggest that much of the recent growth of glacial lakes has occurred within the Nepal-China transboundary headwaters of the Koshi basin, highlighting the growing cross-border significance of glacial lake development and evolution.
4.4 Lake area timeseries
Using the Sentinel-2 lake area timeseries (2017–2024), ten of the fastest expanding lakes across the Nepal-transboundary were identified and ranked (Figs. 8 and 9), with all lakes classified as glacial-fed and nine out of ten of the lakes occurring within the Koshi basin. All ten lakes exhibit statistically significant positive trends in area (R2>0.93), with the highest rate of expansion observed at lake GLO_87.08864_27.79792 (commonly known as Lower Barun, located in Nepal), increasing by 0.0820 ± 0.0132 km2 yr−1. This is followed by GLO_86.92845_27.89838 (commonly known as Imja Lake, located in Nepal), which increased by 0.0551 ± 0.0112 km2 yr−1. Overall, these ten lakes have a mean elevation of 4849 ± 330.47 m a.s.l, with a maximum elevation of 5219 m observed for lake GLO_86.86315_28.11165, which is supraglacial in origin (Fig. 9i).
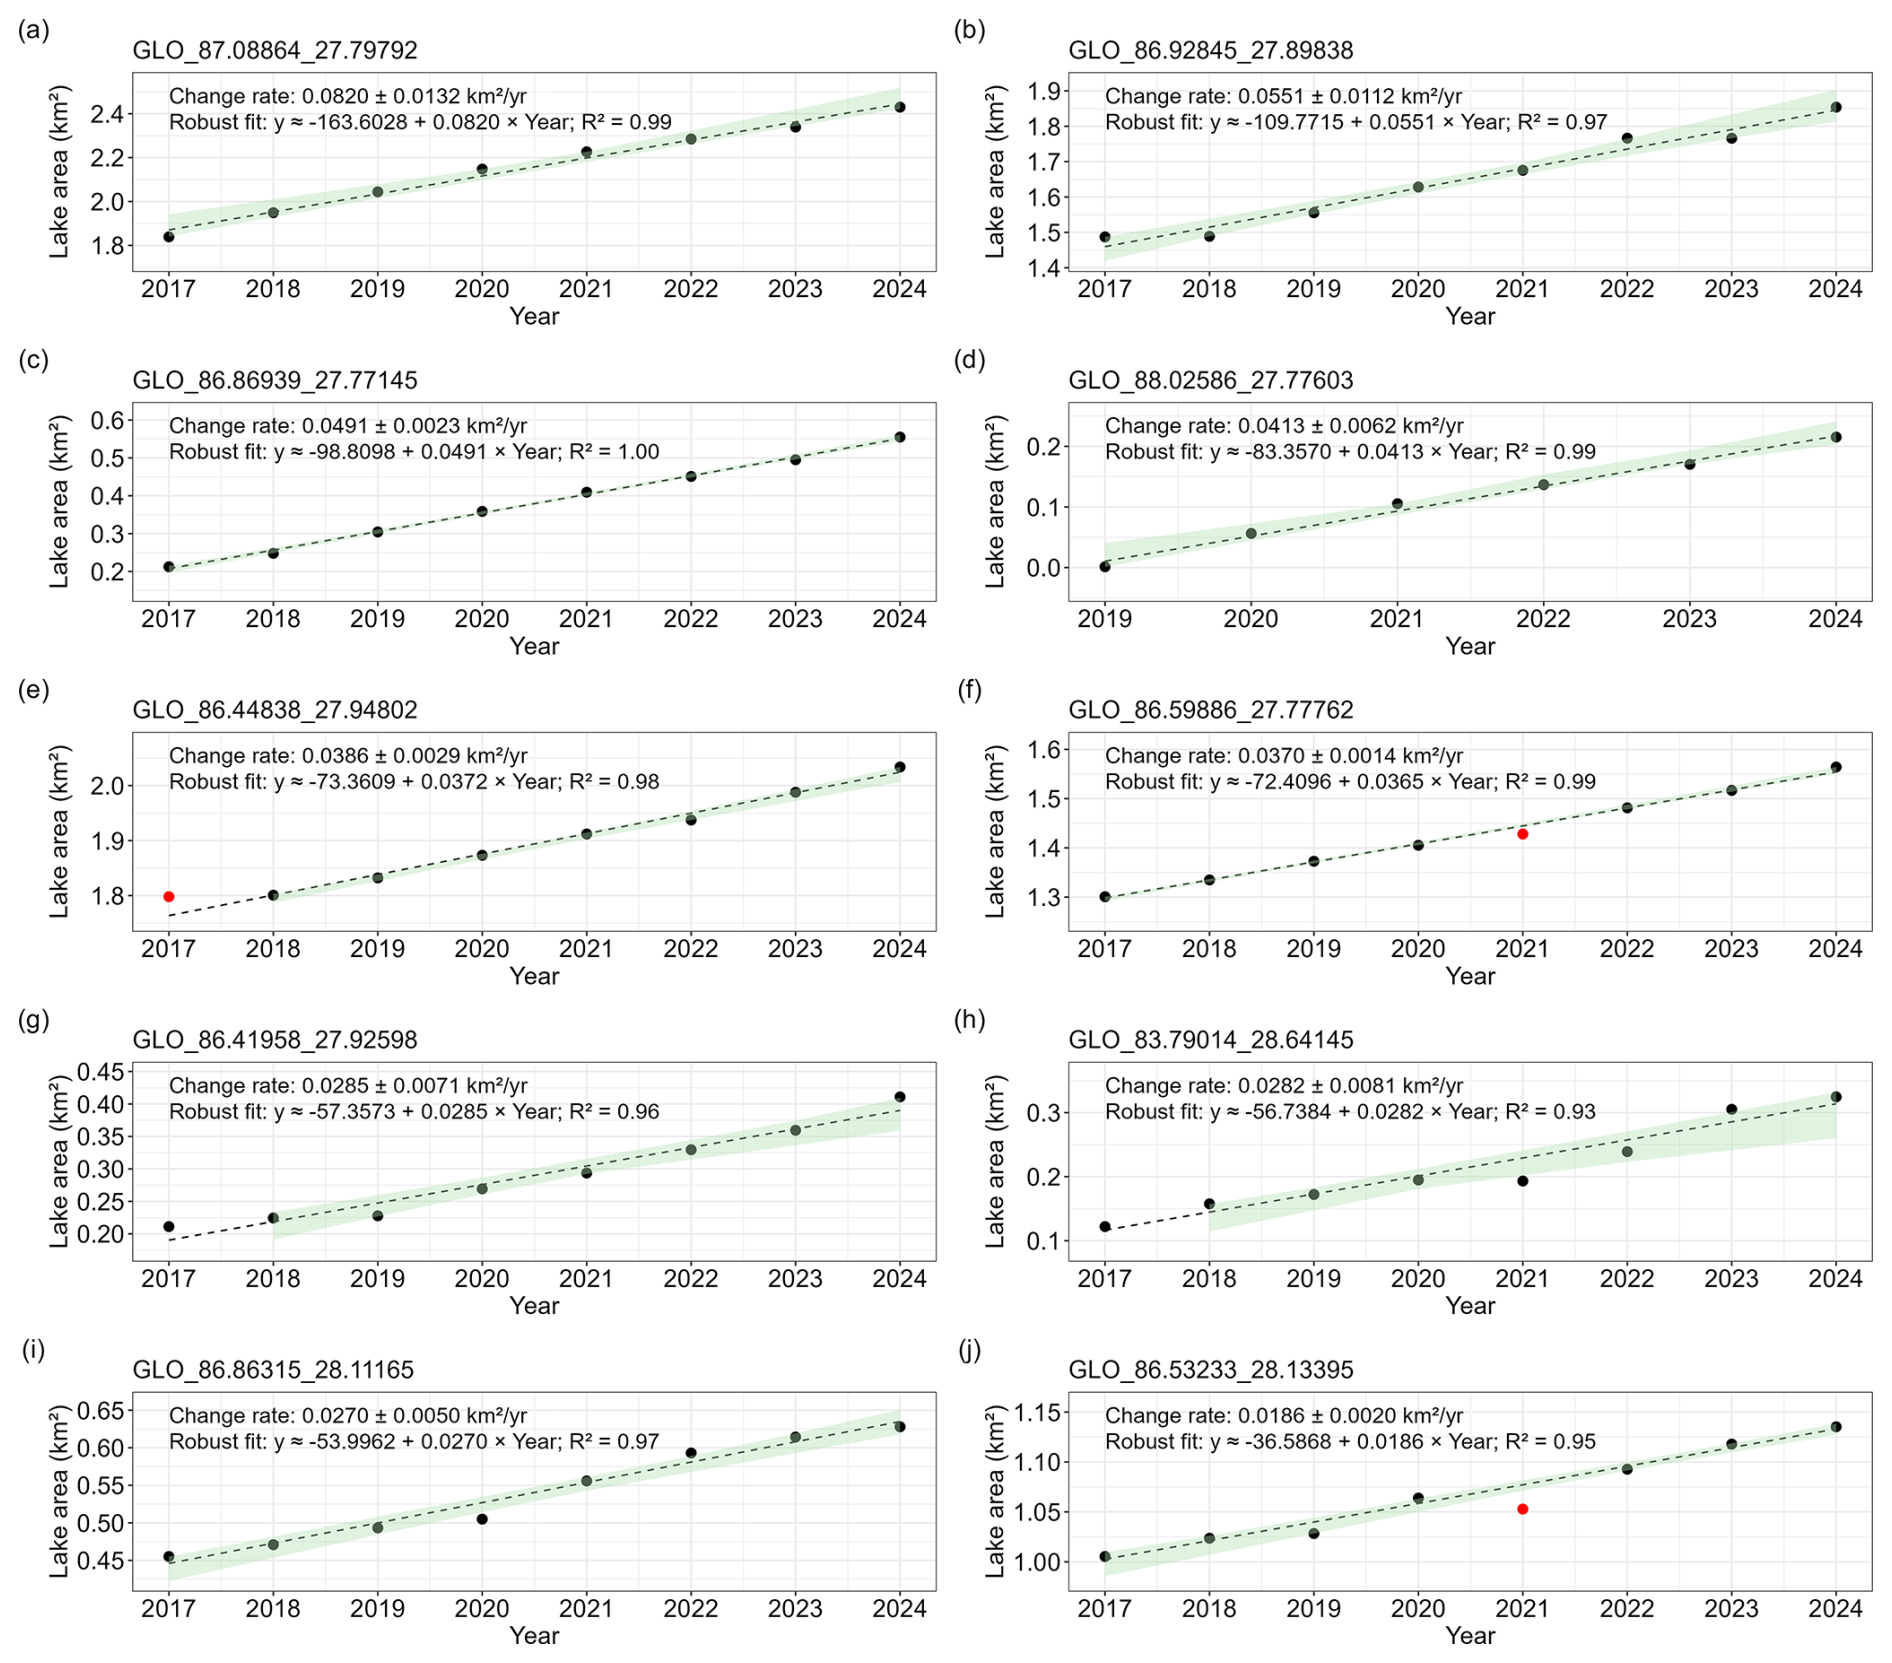
Figure 8Lake area rates of change for the top ten fastest expanding lakes. Dashed lines indicate robust regression fits to each series, excluding statistical outliers (red points). Shaded ribbons represent bootstrapped 95 % prediction intervals.
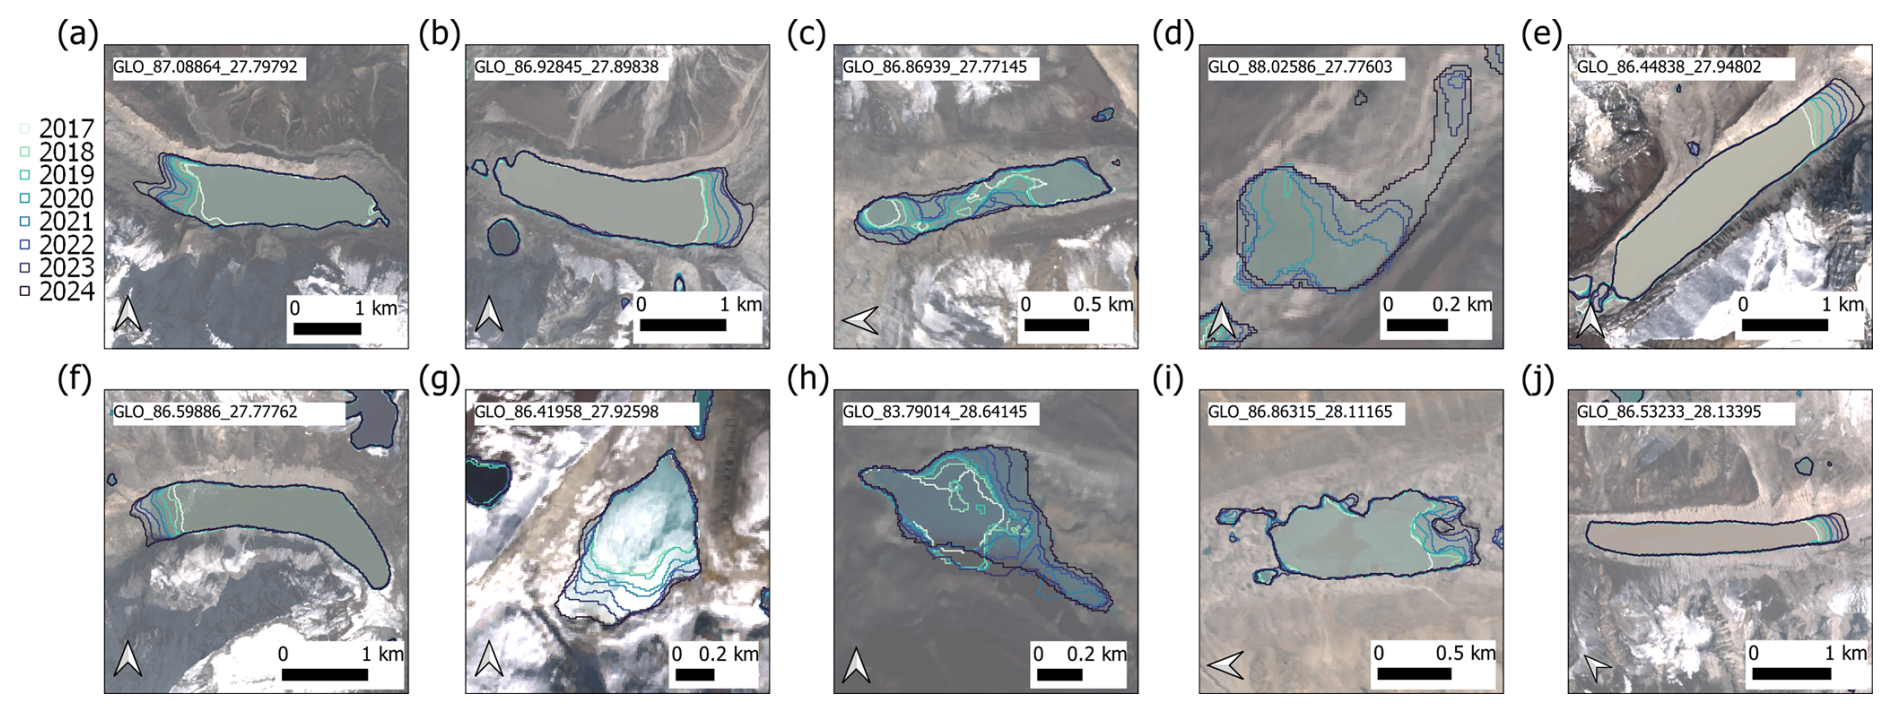
Figure 9Lake area timeseries for the top ten fastest expanding lakes. Background images are the 2024 Sentinel-2 composites used for inferencing, shown with partial transparency.
5.1 Methodological performance and dataset accuracy
The application of deep learning architecture, specifically DeepLabV3, to multi-sensor satellite imagery has demonstrated the strong capabilities of convolutional neural networks to efficiently and effectively map spatio-temporal glacial lakes and lake change in high mountain terrain. The model, overall, shows good performance across the Nepal-transboundary region, with strong agreement with delineated glacial lakes when compared to independent reference data (including manually digitised sample data), confirming its suitability for large-scale, automated mapping with no manual boundary editing. As shown in previous “proof of concept” deep learning studies (Kaushik et al., 2022; Tang et al., 2024), the direct use of existing glacial lake inventories, in this case Zhang et al. (2024a), provides an efficient strategy for employing a reliable and labelled training dataset, removing the need for extensive manual annotations or data curation (Qayyum et al., 2020). The use of a pre-existing inventory also ensured the model was generally trained on a range of glacial lake shapes, sizes and surface conditions for the region, resulting in a consistent and transferable automatic classification framework.
Across the multi-year record, our model achieved high performance, with F1 scores of 0.79–0.82 for Sentinel-1 and 0.87–0.92 for Sentinel-2, and corresponding IoU values of 0.66–0.70 and 0.74–0.78, respectively, in-line with comparable deep learning studies (Tang et al., 2024; Xu et al., 2024). Such F1 and IoU values indicate good spatial overlap between predicted and reference lake extents, with Sentinel-2 achieving closer boundary matches and reduced edge discrepancies than those captured by Sentinel-1. An IoU approaching 0.8 suggests that the majority of mapped lake extents are spatially consistent with the compared inventories, with the remaining differences a result of lake boundary positioning rather than a misclassification. Slightly lower F1 and IoU values for Sentinel-1 reflect a greater uncertainty in those lake extent boundaries, which is likely associated with mixed lake shoreline pixels and/or SAR backscatter variability, particularly for smaller or more irregular lakes. Sentinel-2 generally achieved higher accuracies of lake boundaries, capturing various lake sizes and morphologies. However, as observed in other deep learning-based glacial lake inventories (e.g., Ma et al., 2025), the persistence of snow, ice or icebergs on lake surfaces can reduce classification accuracy. This was observed in the Karnali basin in the west of our study region in 2022 (e.g. Fig. S5). In such cases, Sentinel-1 imagery improves the chances of observing the lake surface in a snow and ice-free state. This complimentary multi-sensor approach of optical and SAR sources therefore forms a robust, multi-sensor framework for high mountain glacial lake monitoring that considers time periods affected by persistent atmospheric or seasonal interferences (e.g., Fig. S6).
5.2 Spatial and temporal coverage, and characteristics of the Nepal-transboundary glacial lake inventories
The Nepal-transboundary glacial lake inventory developed here provides comprehensive spatio-temporal coverage from 2017 to 2024, covering the Karnali, Gandaki and Koshi basins that span Nepal and its bordering regions with India and China. From a water resource perspective, these lakes contribute to the Ganges–Brahmaputra river systems that supports hundreds of millions of people (Whitehead et al., 2015). The assessment of transboundary lakes is crucial for managing cross-border hazards and shared water resources, since GLOFs and meltwater flows do not obey political boundaries and affect all downstream populations (Carrivick and Tweed, 2016). Our dataset confirms the spatial completeness of existing regional inventories but improves the temporal coverage (e.g. Kumar et al., 2025; Zhang et al., 2024a) and provides the foundation for ongoing monitoring.
Rapid glacier mass loss in the Himalaya leads to increased meltwater storage in the high-altitude lakes (Immerzeel et al., 2020). The rate of mass loss for Himalayan glaciers has almost doubled in the last few decades (Maurer et al., 2019), resulting in new proglacial moraine-dammed lakes coalescing from supraglacial ponds, which store meltwater and enhance glacier mass loss (Benn et al., 2001; King et al., 2019). In our inventory, glacier-fed lakes cover ∼57 %–61 % of the total detection and are primarily concentrated between ∼4500 and 5500 m a.s.l., where they act as temporary reservoirs that control downstream runoff (e.g. Irvine-Fynn et al., 2017; Shugar et al., 2020). Model projections suggest that glacier mass loss could increase by 30 %–70 % at the end of the century (Kraaijenbrink et al., 2017; Rounce et al., 2020), which will create new glacial lakes and potentially increase the risk of GLOFs (Harrison et al., 2018). The more frequent occurrence of glacier-fed lakes at higher elevations compared to non-glacier-fed lakes further highlights the strong cryospheric control on lake development in the study area.
Our dataset indicates a general increase in both the number and total area of glacial lakes between 2017 and 2024 (Fig. 6). Sentinel-2 data shows the number of lakes increases from 2762 (2017) to 3152 (2024) and the total lake area of the Koshi basin increased by 8 %. Sentinel-1 data complement these findings to detect partially ice-covered lakes, which are often hidden in optical imagery (Wangchuk et al., 2019). Sentinel-2 detected 22 294 lake polygons corresponding to 4150 unique lakes, while Sentinel-1 identified 18 129 polygons for 2967 unique lakes, reflecting a 23 % higher detection rate in optical data, likely due to better delineation of small features under clear conditions (Wangchuk and Bolch, 2020). When detections from both sensors were combined, Sentinel-2 accounted for 90 % of all annual lake delineations and 93 % of unique lakes, indicating that the optical dataset captured the vast majority of mapped glacial lakes, while Sentinel-1 primarily contributed additional detections where optical observations were limited. The most substantial lake expansion occurred in the Koshi basin in the east of Nepal, which covered 72 % of the total lake area in Sentinel-2 observations. This distribution aligns with the east–west gradient of glacier coverage and monsoon influence (Bookhagen and Burbank, 2006; Hrudya et al., 2021).
Out of the ten fastest-expanding lakes identified from the Sentinel-2 time series, nine are located within the Koshi basin. The most rapid expansion is observed at large moraine-dammed Lower Barun lake (GLO_87.08864_27.79792), which is growing at a rate of 0.0820 ± 0.0132 km2 yr−1, followed by Imja Lake (GLO_86.92845_27.89838) at 0.0551 ± 0.0112 km2 yr−1. Rongbuk lake (GLO_86.86315_28.11165, 5219 m), located in Koshi basin, also shows a strong expansion trend (R2>0.93). Three of these lakes, GLO_87.08864_27.79792 (Lower Barun), GLO_86.92845_27.89838 (Imja), and GLO_86.59886_27.77762 (Lumding) were classified as potentially dangerous glacial lakes by ICIMOD (Bajracharya et al., 2020) due to their rapid volume increase and proximity to downstream communities (ICIMOD, 2011; Niggli et al., 2024; Veh et al., 2020). Each lake exceeds 1.0 km2 in area and are located within the Koshi basin, with three in Nepal and two in China. However, recent GLOFs have demonstrated the importance of monitoring all lake types, as even small or interconnected pond systems can pose a flood risk (Byers et al., 2018, 2022; Miles et al., 2018; Sattar et al., 2022).
5.3 Dataset applications, recommended use and future GLO inventory
5.3.1 Dataset applications and transboundary relevance
Our dataset provides the foundation for systematic glacial lake monitoring, which can support research on lake development, implications for glacier dynamics, downstream ecosystems, water storage trends, water resource management, and potential hazards. Using Sentinel-1 data, lake outlines could be classified for every acquisition during the ablation season, whereas for Sentinel-2 there is a requirement for multi-image compositing to create cloud free mosaics. The planned integration of the data into a centralised open access platform will support open data analysis and monitoring capabilities. This is particularly important for effective hazard assessment, which requires multinational monitoring and coordination to reduce socio-economic losses. For example, the Koshi basin contains around 50 %–56 % of the study areas unique lakes and covers the Nepal–China border, and lakes on both sides of Mount Everest pose a transboundary GLOF risk (Khadka et al., 2024b). This amplified by the vulnerability of communities and rapid infrastructure development in the China-Nepal border regions, including the expansion of transnational highways, trading ports, hydropower projects, and planned railway lines (Gouli et al., 2025; Khadka et al., 2024b). Historical events in Himalaya have already confirmed their potential to affect transboundary countries simultaneously (Dubey et al., 2024; Khadka et al., 2024a; Sattar et al., 2022). Between India and Nepal, existing management efforts, such as the bilateral Koshi River Treaty of 1954 (Ministry of External Affairs, Government of India, and His Majesty's Government of Nepal, 1966), support data sharing for flood forecasting, but still lack specific provisions to address GLOF hazards. More recent initiatives by ICIMOD's regional cooperation programs, emphasise integrated basin management to improve resilience (ICIMOD, 2019). Collaboration between China and Nepal has also expanded under the Belt and Road Initiative (Government of Nepal, Ministry Of Foreign Affairs, 2024), and a data sharing agreement to address GLOFs (OneWorld SouthAsia, 2025). The strengthening of transboundary frameworks based on real-time and open-access satellite monitoring systems is an important step to enhance collaborative risk reduction efforts. Additionally, recent damaging GLOFs in Nepal including from Birendra Lake in 2024 (Khadka et al., 2025; Poudel et al., 2025), Upper and Lower Ngole Cho in 2024 (Maharjan et al., 2025), and a transboundary supraglacial lake drainage in 2025 from Purepu Glacier, highlights the requirement for ongoing monitoring of glacial lakes. To date, more than 26 such transboundary GLOF events have been recorded, concentrated during the monsoon season (April–October) (Shrestha et al., 2023). This seasonal pattern highlights a critical disconnect in current hazard assessment methodologies as existing regional glacial lake inventories predominantly rely on post-monsoon satellite imagery due to minimal cloud cover, thereby missing the dynamic and hydrologically critical conditions during the peak hazard period. High-frequency seasonal monitoring could be achieved with Sentinel-1 data, which is not affected by cloud cover during the monsoon when lakes are most dynamic.
5.3.2 Recommended use and detection limits
The dataset produced here provides a consistent and reproducible inventory of glacial lakes across the Nepal-transboundary region across the eight-year study period, making it well suited to regional-scale assessments of lake distribution, presence/absence, and broader interannual change. As with any regional-scale inventory, data confidence varies according to lake size and sensor type. Although a minimum mapping threshold of 0.001 km2 was applied in this study, classification performance remains largely size dependent. For Sentinel-2, robust performance (F1≥0.85) was generally achieved for lakes of above 0.028 km2, whilst for complimentary data provided by Sentinel-1, a larger size threshold of 0.084 km2 was required to reach the same classification performance (F1≥0.85). A multiple linear regression model further showed that lake area was a dominant control on F1 score for both sensors, whilst elevation exerted a very small secondary influence. For Sentinel-2, the effect was weakly negative and statistically significant (p=0.02), but of negligible magnitude, whereas for Sentinel-1 this was not significant. Together, these results indicate that reduced performance in small, often high-elevation lakes is driven primarily by lake size and the difficulty of complete delineation, rather than elevation itself acting as a strong independent control.
That said, small, irregular and high-elevation lakes do remain particularly challenging due to increased mixed pixel boundaries of water, snow and ice, combined with steep terrain and seasonal partial freezing (Kumar and Vijay, 2026; Qayyum et al., 2020; Watson et al., 2018). This likely explains the slightly lower agreement observed when lake comparisons included the Kumar et al. (2025) inventory, which contained a greater proportion of smaller lakes near the minimum mapping threshold (0.001 km2). Additionally, some smaller lakes are highly ephemeral (e.g., supraglacial lakes) and may partially drain or disappear during the compositing period. In this case, while it would appear as a false negative when compared to Kumar's dataset, it is in fact a true negative, as the lakes were absent at the time of observation. In this context, higher-resolution imagery such as PlanetScope may support improved delineation for small or irregular lakes by resolving these mixed-pixel edge effects (Xu et al., 2024). However, this capability relies on quota-limited free research-programme data access, or paid access to the commercial dataset (https://www.planet.com/industries/education-and-research/, last access: 13 July 2026) and may be most effectively applied to targeted training data or validation.
In terms of sensor specifics, the two sensors provide strengths for glacial lake monitoring. Sentinel-2 is shown to be better suited to the accurate delineation of individual lake boundaries, including smaller lakes, and should therefore be considered the primary dataset for more detailed and complete lake mapping. Sentinel-1 provides a valuable complimentary perspective by offering more consistent, all-weather observations, assisting with supplementing optical data gaps (i.e., the capture of lakes during monsoon or cloudy periods) and improve visibility of snow-or-ice covered lakes (Figs. S5 and S6). It is noted, however, that these Sentinel-1 delineations are more prone to fragmented or irregular lake outlines, particularly for smaller lakes, likely reflecting known SAR challenges including speckle noise, look direction, incidence angle and backscatter variability over water and rugged terrain (Khan et al., 2025; Miles et al., 2017). At the same time, the Sentinel-1 dataset provided more temporally consistent lake counts, which is a likely reflection of a combination of factors: (i) the narrower acquisition compositing window meaning lakes were more likely to be captured at a similar time each year; (ii) a greater omission of smaller lakes, reducing year-to-year variability in the seasonal changes of smaller lakes, that are then intermittently captured by Sentinel-2; (iii) the use of median SAR composites which are more likely to exclude small, highly dynamic lakes (Kumar and Vijay, 2026). As such, Sentinel-1 should be interpreted as reflecting a more conservative subset of lake detections, rather than completeness. Finally, the annual Sentinel-1 and Sentinel-2 mosaics were generated from different acquisition windows to balance the observational capabilities and data availability of each sensor, so some minor differences between the two datasets may reflect differences in temporal sampling. Additionally, the Sentinel-1 model was trained using lake outlines derived from optical imagery (Kumar et al., 2025; Zhang et al., 2024a) which may introduce some minor boundary mismatch between training labels and the SAR signal. Given the current lack of SAR-based training data, this approach is a reasonable compromise for Sentinel-1 model development and highlights an important avenue for future model refinement using SAR-based training labels. Beyond the overall strong performance shown of both sensors in this study, and the known limitations, ongoing work will set to further refine the classification models, with additional training and inference planned for the wider Himalayan region.
5.3.3 Beyond borders: a Glacial Lake Observatory (GLO)
The establishment of a Glacial Lake Observatory (GLO) using the data generated here is proposed to address the gap in continuous lake monitoring. By leveraging optical and SAR data, the GLO would provide an open-access platform for the reliable and automated monitoring of all glacial lakes during the monsoon season and on an annual basis. This shift to temporally relevant data is a necessary foundation for proactive GLOF hazard and risk assessment to prevent disasters through shared knowledge and coordinated action. However, our accuracy assessment does demonstrate a need to further refine the classification models or integrate additional data sources to improve the detection of smaller lakes, and to evaluate high-frequency classifications using SAR data. Nonetheless, the prevalence of open access data and cloud computing makes this approach scalable and suitable for broader application.
The GLO database is distributed under the Creative Commons Attribution 4.0 License.
All image-processing scripts implemented in Google Earth Engine (GEE) are openly accessible, including for Sentinel-1 (https://code.earthengine.google.com/c5f25b9006cf0755a6d22ab7de36ff30, Glacial Lake Observatory, 2025a) and Sentinel-2 (https://code.earthengine.google.com/75bcb7bac5481c382ce17c1bb1ada94f, Glacial Lake Observatory, 2025b). Deep learning models and the GLO glacial lake dataset presented in this manuscript are hosted on the Zenodo data repository at https://doi.org/10.5281/zenodo.17802333 (Rawlins et al., 2025). Our trained deep learning models rely on ArcGIS for deployment.
Here, we present a foundational dataset of glacial lakes within the Nepal and transboundary catchments of India and China to support ongoing lake monitoring for the Glacial Lake Observatory (GLO) inventory. Using a deep learning workflow applied to multi-year Sentinel-1 and Sentinel-2 image mosaics, annual glacial lake datasets spanning 2017 to 2024 were created and validated against existing lake inventories and manually digitised sampling. Overall, results reveal a sustained increase in the number and total area of glacial lakes across the Nepal-transboundary region, driven primarily by the growth of glacial lakes within the Koshi basin at headwaters shared by Nepal and China. This highlights the transboundary nature of glacial lake development, evolution, and downstream risk.
The integration of both Sentinel-1 SAR and Sentinel-2 optical imagery provides complementary and promising capabilities for glacial lake mapping, enabling reliable detection across a range of challenging environmental conditions, including cloud cover, shadows and seasonal snow and ice coverage. This multi-sensor, deep learning framework establishes a robust, reproducible and scalable foundation for the systematic monitoring of glacial lakes across High Mountain Asia and beyond. Further refinements to these classification models will enhance ongoing glacial lake mapping, particularly for smaller and newly formed lakes.
By capturing consistent, long-term trends in glacial lake evolution, the GLO provides a much-needed basis for continuous lake monitoring within high mountain regions, not only for improving understanding of regional water storage, but also enabling the identification of emerging GLOF hazards. The GLO inventory will be updated annually and made openly available at https://glacial-lake-observatory.org/ (last access: 13 July 2026).
The supplement related to this article is available online at https://doi.org/10.5194/essd-18-5143-2026-supplement.
All the authors have read and agreed to the published version of the paper. CSW designed the concept with LDR. LDR and CSW performed the analysis, prepared the figures, and wrote the paper with input from RB, NK, and MBC.
The contact author has declared that none of the authors has any competing interests.
Publisher's note: Copernicus Publications remains neutral with regard to jurisdictional claims made in the text, published maps, institutional affiliations, or any other geographical representation in this paper. The authors bear the ultimate responsibility for providing appropriate place names. Views expressed in the text are those of the authors and do not necessarily reflect the views of the publisher.
We gratefully acknowledge Google Earth Engine (GEE) for providing the cloud-computing platform used for data search and processing. We also acknowledge the open-access Copernicus Sentinel-1 Synthetic Aperture Radar (SAR) and Sentinel-2 Multispectral Instrument (MSI) data made freely available by the European Commission and the European Space Agency (ESA). Finally, we are grateful to editor George Veh and reviewers Celia A. Baumhoer, Katrina Lutz and one anonymous referee for their comments in improving the manuscript.
This work was supported by a UK Research and Innovation Future Leaders Fellowship (grant number MR/Y016564/1).
This paper was edited by Georg Veh and reviewed by Celia A. Baumhoer, Katrina Lutz, and one anonymous referee.
Ali, S., Ali, S., Wang, L., Ul Hassan, S. R., Khan, G., Ali, S., Hussain, T., and Ali, D.: Deep learning model to detect glacial lakes using high-resolution optical and radar satellite images, Remote Sens. Appl. Soc. Environ., 38, 101579, https://doi.org/10.1016/j.rsase.2025.101579, 2025.
Allen, S. K., Sattar, A., King, O., Zhang, G., Bhattacharya, A., Yao, T., and Bolch, T.: Glacial lake outburst flood hazard under current and future conditions: worst-case scenarios in a transboundary Himalayan basin, Nat. Hazards Earth Syst. Sci., 22, 3765–3785, https://doi.org/10.5194/nhess-22-3765-2022, 2022.
Bajracharya, S. R., Maharjan, S. B., Shrestha, F., Sherpa, T. C., Wagle, N., and Shrestha, A. B.: Inventory of glacial lakes and identification of potentially dangerous glacial lakes in the Koshi, Gandaki, and Karnali river basins of Nepal, the Tibet Autonomous Region of China, and India, ICIMOD – International Centre for Integrated Mountain Development, https://doi.org/10.53055/ICIMOD.773, 2020.
Benn, D. I., Wiseman, S., and Hands, K. A.: Growth and drainage of supraglacial lakes on debris-mantled Ngozumpa Glacier, Khumbu Himal, Nepal, J. Glaciol., 47, 626–638, https://doi.org/10.3189/172756501781831729, 2001.
Bolch, T., Kulkarni, A., Kääb, A., Huggel, C., Paul, F., Cogley, J. G., Frey, H., Kargel, J. S., Fujita, K., Scheel, M., Bajracharya, S., and Stoffel, M.: The State and Fate of Himalayan Glaciers, Science, 336, 310–314, https://doi.org/10.1126/science.1215828, 2012.
Bolch, T., Shea, J. M., Liu, S., Azam, F. M., Gao, Y., Gruber, S., Immerzeel, W. W., Kulkarni, A., Li, H., Tahir, A. A., Zhang, G., and Zhang, Y.: Status and Change of the Cryosphere in the Extended Hindu Kush Himalaya Region, in: The Hindu Kush Himalaya Assessment: Mountains, Climate Change, Sustainability and People, edited by: Wester, P., Mishra, A., Mukherji, A., and Shrestha, A. B., Springer International Publishing, Cham, 209–255, https://doi.org/10.1007/978-3-319-92288-1_7, 2019.
Bookhagen, B. and Burbank, D. W.: Topography, relief, and TRMM-derived rainfall variations along the Himalaya, Geophys. Res. Lett., 33, 1–5, https://doi.org/10.1029/2006gl026037, 2006.
Brun, F., Berthier, E., Wagnon, P., Kaab, A., and Treichler, D.: A spatially resolved estimate of High Mountain Asia glacier mass balances from 2000 to 2016, Nat. Geosci., 10, 668–673, https://doi.org/10.1038/ngeo2999, 2017.
Byers, A. C., Rounce, D. R., Shugar, D. H., Lala, J. M., Byers, E. A., and Regmi, D.: A rockfall-induced glacial lake outburst flood, Upper Barun Valley, Nepal, Landslides, https://doi.org/10.1007/s10346-018-1079-9, 2018.
Byers, A. C., Shugar, D. H., Chand, M. B., Portocarrero, C., Shrestha, M., Rounce, D. R., and Watanabe, T.: Three Recent and Lesser-Known Glacier-Related Flood Mechanisms in High Mountain Environments, Mt. Res. Dev., 42, A12–A22, 2022.
Canty, A. and Ripley, B.: boot: Bootstrap Functions, [R package], CRAN – Comprehensive R Archive Network, https://doi.org/10.32614/CRAN.package.boot, 1999.
Cao, B., Chen, Y., Zhao, X., Tian, X., and Wang, F.: Refined identification and expansion mechanisms of glacier-fed lakes in high mountain Asia, Int. J. Digit. Earth, 18, 2591977, https://doi.org/10.1080/17538947.2025.2591977, 2025.
Carrivick, J. L. and Tweed, F. S.: A global assessment of the societal impacts of glacier outburst floods, Global Planet. Change, 144, 1–16, https://doi.org/10.1016/j.gloplacha.2016.07.001, 2016.
Chand, M. B. and Watanabe, T.: Development of Supraglacial Ponds in the Everest Region, Nepal, between 1989 and 2018, Remote Sens.-Basel, 11, 1058, https://doi.org/10.3390/rs11091058, 2019.
Chen, F., Zhang, M., Guo, H., Allen, S., Kargel, J. S., Haritashya, U. K., and Watson, C. S.: Annual 30 m dataset for glacial lakes in High Mountain Asia from 2008 to 2017, Earth Syst. Sci. Data, 13, 741–766, https://doi.org/10.5194/essd-13-741-2021, 2021.
Chen, L.-C., Papandreou, G., Schroff, F., and Adam, H.: Rethinking Atrous Convolution for Semantic Image Segmentation, arXiv, https://doi.org/10.48550/arXiv.1706.05587, 5 December 2017.
Cheng, X., Shangguan, D., Yang, C., Li, W., Zhou, Z., Liu, X., Li, D., Zhang, X., Ding, H., Liu, Z., Yu, Y., Wang, X., He, B., Yang, Q., Li, Y., Wang, R., Liu, Y., Deng, L., and Shi, Y.: Temporal and spatial changes of glacial lakes in the central Himalayas and their response to climate change based on multi-source remote sensing data, Global Planet. Change, 245, 104675, https://doi.org/10.1016/j.gloplacha.2024.104675, 2025.
Davison, A. C. and Hinkley, D. V.: Bootstrap Methods and their Application, 1st edn., Cambridge University Press, https://doi.org/10.1017/CBO9780511802843, 1997.
Dubey, S., Sattar, A., Gupta, V., Goyal, M. K., Haritashya, U. K., and Kargel, J. S.: Transboundary hazard and downstream impact of glacial lakes in Hindu-Kush Karakoram Himalayas, Sci. Total Environ., 914, 169758, https://doi.org/10.1016/j.scitotenv.2023.169758, 2024.
Farinotti, D., Round, V., Huss, M., Compagno, L., and Zekollari, H.: Large hydropower and water-storage potential in future glacier-free basins, Nature, 575, 341–344, https://doi.org/10.1038/s41586-019-1740-z, 2019.
Fugger, S., Fyffe, C. L., Fatichi, S., Miles, E., McCarthy, M., Shaw, T. E., Ding, B., Yang, W., Wagnon, P., Immerzeel, W., Liu, Q., and Pellicciotti, F.: Understanding monsoon controls on the energy and mass balance of glaciers in the Central and Eastern Himalaya, The Cryosphere, 16, 1631–1652, https://doi.org/10.5194/tc-16-1631-2022, 2022.
Fujita, K., Takeuchi, N., and Seko, K.: Glaciological observations of Yala Glacier in Langtang Valley, Nepal Himalayas, 1994 and 1996, Glacier Res., 16, 75–78, 1998.
Gardelle, J., Arnaud, Y., and Berthier, E.: Contrasted evolution of glacial lakes along the Hindu Kush Himalaya mountain range between 1990 and 2009, Global Planet. Change, 75, 47–55, https://doi.org/10.1016/j.gloplacha.2010.10.003, 2011.
Glacial Lake Observatory, Google Earth Engine script repository: Sentinel-1 image-processing script, Google Earth Engine Code Editor, https://code.earthengine.google.com/c5f25b9006cf0755a6d22ab7de36ff30 (last access: 13 July 2026), 2025a.
Glacial Lake Observatory, Google Earth Engine script repository: Sentinel-2 image-processing script, Google Earth Engine Code Editor, https://code.earthengine.google.com/75bcb7bac5481c382ce17c1bb1ada94f (last access: 13 July 2026), 2025b.
Gorelick, N., Hancher, M., Dixon, M., Ilyushchenko, S., Thau, D., and Moore, R.: Google Earth Engine: Planetary-scale geospatial analysis for everyone, Remote Sens. Environ., 202, 18–27, https://doi.org/10.1016/j.rse.2017.06.031, 2017.
Gouli, M. R., Hu, K., Khadka, N., Liu, S., Yifan, S., Adhikari, M., and Talchabhadel, R.: Quantitative assessment of the GLOF risk along China-Nepal transboundary basins by integrating remote sensing, machine learning, and hydrodynamic model, Int. J. Disast. Risk Re., 118, 105231, https://doi.org/10.1016/j.ijdrr.2025.105231, 2025.
Government of Nepal, Ministry Of Foreign Affairs: Framework for belt and road cooperation between the Government of Nepal and the Government of the People's Republic of China | Ministry Of Foreign Affairs, https://mofa.gov.np/content/641/framework-for-belt-and-road-cooperation-between/ (last access: 16 October 2025), 2024.
GTN-G: GTN-G Glacier Regions, Global Terrestrial Network for Glaciers, https://doi.org/10.5904/gtng-glacreg-2023-07, 2023.
Haeberli, W., Schaub, Y., and Huggel, C.: Increasing risks related to landslides from degrading permafrost into new lakes in de-glaciating mountain ranges, Geomorphology, 293, 405–417, https://doi.org/10.1016/j.geomorph.2016.02.009, 2017.
Haritashya, U., Kargel, J., Shugar, D., Leonard, G., Strattman, K., Watson, C., Shean, D., Harrison, S., Mandli, K., and Regmi, D.: Evolution and Controls of Large Glacial Lakes in the Nepal Himalaya, Remote Sens.-Basel, 10, 798, https://doi.org/10.3390/rs10050798, 2018.
Harrison, S., Kargel, J. S., Huggel, C., Reynolds, J., Shugar, D. H., Betts, R. A., Emmer, A., Glasser, N., Haritashya, U. K., Klimeš, J., Reinhardt, L., Schaub, Y., Wiltshire, A., Regmi, D., and Vilímek, V.: Climate change and the global pattern of moraine-dammed glacial lake outburst floods, The Cryosphere, 12, 1195–1209, https://doi.org/10.5194/tc-12-1195-2018, 2018.
He, Y., Yao, S., Yang, W., Yan, H., Zhang, L., Wen, Z., Zhang, Y., and Liu, T.: An Extraction Method for Glacial Lakes Based on Landsat-8 Imagery Using an Improved U-Net Network, IEEE J. Sel. Top. Appl., 14, 6544–6558, https://doi.org/10.1109/JSTARS.2021.3085397, 2021.
Hrudya, P. H., Varikoden, H., and Vishnu, R.: A review on the Indian summer monsoon rainfall, variability and its association with ENSO and IOD, Meteorol. Atmos. Phys., 133, 1–14, https://doi.org/10.1007/s00703-020-00734-5, 2021.
ICIMOD: Glacial Lakes and Glacial Lake Outburst Floods in Nepal, https://lib.icimod.org/records/2kqn5-yrm13 (last access: 16 October 2025), 2011.
ICIMOD: River Basins and Cryosphere – Information Sheets, https://lib.icimod.org/records/1vagr-wq318 (last access: 16 October 2025), 2019.
ICIMOD: Major River Basins in the Hindu Kush Himalaya (HKH) Region [Data set], ICIMOD [data set], https://doi.org/10.26066/RDS.2732, 2021.
Immerzeel, W. W., Lutz, A. F., Andrade, M., Bahl, A., Biemans, H., Bolch, T., Hyde, S., Brumby, S., Davies, B. J., Elmore, A. C., Emmer, A., Feng, M., Fernández, A., Haritashya, U., Kargel, J. S., Koppes, M., Kraaijenbrink, P. D. A., Kulkarni, A. V., Mayewski, P. A., Nepal, S., Pacheco, P., Painter, T. H., Pellicciotti, F., Rajaram, H., Rupper, S., Sinisalo, A., Shrestha, A. B., Viviroli, D., Wada, Y., Xiao, C., Yao, T., and Baillie, J. E. M.: Importance and vulnerability of the world's water towers, Nature, 577, 364–369, https://doi.org/10.1038/s41586-019-1822-y, 2020.
Irvine-Fynn, T. D. L., Porter, P. R., Rowan, A. V., Quincey, D. J., Gibson, M. J., Bridge, J. W., Watson, C. S., Hubbard, A., and Glasser, N. F.: Supraglacial Ponds Regulate Runoff From Himalayan Debris-Covered Glaciers, Geophys. Res. Lett., 44, 894–904, https://doi.org/10.1002/2017GL075398, 2017.
JAXA – Japan Aerospace Exploration Agency: ALOS World 3D – 30 m (AW3D30), Version 4.1, EORC – Earth Observation Research Center [data set], https://www.eorc.jaxa.jp/ALOS/en/dataset/aw3d30/ (last access: 18 October 2025), 2024.
Jones, D. B., Harrison, S., Anderson, K., Shannon, S., and Betts, R. A.: Rock glaciers represent hidden water stores in the Himalaya, Sci. Total Environ., 793, 145368, https://doi.org/10.1016/j.scitotenv.2021.145368, 2021.
Kaushik, S., Singh, T., Joshi, P. K., and Dietz, A. J.: Automated mapping of glacial lakes using multisource remote sensing data and deep convolutional neural network, Int. J. Appl. Earth Obs., 115, 103085, https://doi.org/10.1016/j.jag.2022.103085, 2022.
Khadka, N., Zhang, G., and Thakuri, S.: Glacial Lakes in the Nepal Himalaya: Inventory and Decadal Dynamics (1977–2017), Remote Sens.-Basel, 10, 1913, https://doi.org/10.3390/rs10121913, 2018.
Khadka, N., Chen, X., Liu, W., Gouli, M. R., Zhang, C., Shrestha, B., and Sharma, S.: Glacial lake outburst floods threaten China-Nepal connectivity: Synergistic study of remote sensing, GIS and hydrodynamic modeling with regional implications, Sci. Total Environ., 948, 174701, https://doi.org/10.1016/j.scitotenv.2024.174701, 2024a.
Khadka, N., Chen, X., Shrestha, M., and Liu, W.: Risk perception and vulnerability of communities in Nepal to transboundary glacial lake outburst floods from Tibet, China, Int. J. Disast. Risk Re., 107, 104476, https://doi.org/10.1016/j.ijdrr.2024.104476, 2024b.
Khadka, N., Zheng, G., Chen, X., Zhong, Y., Allen, S. K., and Gouli, M. R.: An ice-snow avalanche triggered small glacial lake outburst flood in Birendra Lake, Nepal Himalaya, Nat. Hazards, 121, 6357–6365, https://doi.org/10.1007/s11069-024-07014-0, 2025.
Khan, I., Vardaman, M., Johnston, J., and Jacobs, J. M.: Glacial lake mapping: Progress, challenges, and future directions, Arct. Antarct. Alp. Res., 57, 2592365, https://doi.org/10.1080/15230430.2025.2592365, 2025.
King, O., Bhattacharya, A., Bhambri, R., and Bolch, T.: Glacial lakes exacerbate Himalayan glacier mass loss, Sci. Rep.-UK, 9, 18145, https://doi.org/10.1038/s41598-019-53733-x, 2019.
Kraaijenbrink, P. D. A., Bierkens, M. F. P., Lutz, A. F., and Immerzeel, W. W.: Impact of a global temperature rise of 1.5 degrees Celsius on Asia's glaciers, Nature, 549, 257–260, https://doi.org/10.1038/nature23878, 2017.
Kumar, A., Mal, S., Schickhoff, U., and Dimri, A. P.: Basin-scale spatio-temporal development of glacial lakes in the Hindukush-Karakoram-Himalayas, Global Planet. Change, 245, 104656, https://doi.org/10.1016/j.gloplacha.2024.104656, 2025.
Kumar, R. and Vijay, S.: Automated satellite-based glacial lake inventory and change detection in High Mountain Asia, Sci. Rep.-UK, 16, 5760, https://doi.org/10.1038/s41598-026-35446-0, 2026.
Lehner, B., Verdin, K., and Jarvis, A.: New Global Hydrography Derived From Spaceborne Elevation Data, Eos T. Am. Geophys. Un., 89, 93–94, https://doi.org/10.1029/2008EO100001, 2008.
Ma, D., Li, J., and Jiang, L.: Efficient glacial lake mapping by leveraging deep transfer learning and a new annotated glacial lake dataset, J. Hydrol., 657, 133072, https://doi.org/10.1016/j.jhydrol.2025.133072, 2025.
Maharjan, S. B., Mool, P. K., Lizong, W., Xiao, G., Shrestha, F., Shrestha, R. B., Khanal, N. R., Bajracharya, S. R., Joshi, S., Shai, S., and Baral, P.: The Status of Glacial Lakes in the Hindu Kush Himalaya, ICIMOD Res. Rep. 20181, https://doi.org/10.53055/ICIMOD.742, 2018.
Maharjan, S. B., Sherpa, T. C., and Shrestha, A. B.: Thame Valley Glacial Lake Outburst Flood 2024: Causes, impacts and future risks, https://doi.org/10.53055/ICIMOD.1101, 2025.
Maurer, J. M., Schaefer, J. M., Rupper, S., and Corley, A.: Acceleration of ice loss across the Himalayas over the past 40 years, Sci. Adv., 5, eaav7266, https://doi.org/10.1126/sciadv.aav7266, 2019.
McFeeters, S. K.: The use of the Normalized Difference Water Index (NDWI) in the delineation of open water features, Int. J. Remote Sens., 17, 1425–1432, https://doi.org/10.1080/01431169608948714, 1996.
Miles, E. S., Watson, C. S., Brun, F., Berthier, E., Esteves, M., Quincey, D. J., Miles, K. E., Hubbard, B., and Wagnon, P.: Glacial and geomorphic effects of a supraglacial lake drainage and outburst event, Everest region, Nepal Himalaya, The Cryosphere, 12, 3891–3905, https://doi.org/10.5194/tc-12-3891-2018, 2018.
Miles, K. E., Willis, I. C., Benedek, C. L., Williamson, A. G., and Tedesco, M.: Toward Monitoring Surface and Subsurface Lakes on the Greenland Ice Sheet Using Sentinel-1 SAR and Landsat-8 OLI Imagery, Front. Earth Sci., 5, https://doi.org/10.3389/feart.2017.00058, 2017.
Ministry of External Affairs, Government of India, and His Majesty's Government of Nepal: Amended Agreement concerning the Koshi Project (Revision of the Agreement of 25 April 1954), Amended Annexure A. Kathmandu, https://www.cawater-info.net/bk/water_law/pdf/nepal-india-1966.pdf (last access: 18 October 2025), 1966.
Mir, B. H., Kumar, R., Lone, M. A., and Tantray, F. A.: Climate change and water resources of Himalayan region – review of impacts and implication, Arab. J. Geosci., 14, 1088, https://doi.org/10.1007/s12517-021-07438-z, 2021.
Mullissa, A., Vollrath, A., Odongo-Braun, C., Slagter, B., Balling, J., Gou, Y., Gorelick, N., and Reiche, J.: Sentinel-1 SAR Backscatter Analysis Ready Data Preparation in Google Earth Engine, Remote Sens.-Basel, 13, 1954, https://doi.org/10.3390/rs13101954, 2021.
Nie, Y., Liu, Q., and Liu, S.: Glacial Lake Expansion in the Central Himalayas by Landsat Images, 1990–2010, PLoS ONE, 8, 1–8, https://doi.org/10.1371/journal.pone.0083973, 2013.
Niggli, L., Allen, S., Frey, H., Huggel, C., Petrakov, D., Raimbekova, Z., Reynolds, J., and Wang, W.: GLOF Risk Management Experiences and Options: A Global Overview, https://doi.org/10.1093/acrefore/9780199389407.013.540, 2024.
OWSA – One World South Asia: Climate Change: Nepal, China Unite to Tackle Growing Threat of Glacial Lake Outbursts, OneWorld SouthAsia, 27 August 2025, https://owsa.in/climate-change-nepal-china-unite-to-tackle-growing-threat-of-glacial- lake-outbursts/ (last access: 18 October 2025), 2025.
Pasquarella, V. J., Brown, C. F., Czerwinski, W., and Rucklidge, W. J.: Comprehensive quality assessment of optical satellite imagery using weakly supervised video learning, in: 2023 IEEE/CVF Conference on Computer Vision and Pattern Recognition Workshops (CVPRW), 2023 IEEE/CVF Conference on Computer Vision and Pattern Recognition Workshops (CVPRW), 2125–2135, https://doi.org/10.1109/CVPRW59228.2023.00206, 2023.
Poudel, U., Gouli, M. R., Hu, K., Khadka, N., Regmi, R. K., and Thapa, B. R.: Multi-breach GLOF hazard and exposure analysis of Birendra Lake in the Manaslu Region of Nepal, Nat. Hazards Res., https://doi.org/10.1016/j.nhres.2025.03.007, 2025.
Qayyum, N., Ghuffar, S., Ahmad, H. M., Yousaf, A., and Shahid, I.: Glacial Lakes Mapping Using Multi Satellite PlanetScope Imagery and Deep Learning, ISPRS Int. J. Geo-Inf., 9, 560, https://doi.org/10.3390/ijgi9100560, 2020.
Rawlins, L. D., Watson, C. S., Bhambri, R., Khadka, N., and Chand, M. B.: Datasets supporting – Glacial Lake Observatory (GLO): A dataset of glacial lakes in Nepal and transboundary catchments (2017–2024), Zenodo, https://doi.org/10.5281/zenodo.17802333, 2025.
RGI Consortium: Randolph Glacier Inventory – A Dataset of Global Glacier Outlines, Version 7.0, NSIDC: National Snow and Ice Data Center, Boulder, Colorado USA, https://doi.org/10.5067/f6jmovy5navz, 2023.
Rohl, K.: Characteristics and evolution of supraglacial ponds on debris-covered Tasman Glacier, New Zealand, J. Glaciol., 54, 867–880, https://doi.org/10.3189/002214308787779861, 2008.
Ronneberger, O., Fischer, P., and Brox, T.: U-Net: Convolutional Networks for Biomedical Image Segmentation, arXiv, https://doi.org/10.48550/arXiv.1505.04597, 18 May 2015.
Rounce, D. R., Hock, R., and Shean, D. E.: Glacier Mass Change in High Mountain Asia Through 2100 Using the Open-Source Python Glacier Evolution Model (PyGEM), Front. Earth Sci., 7, https://doi.org/10.3389/feart.2019.00331, 2020.
Sahu, R. and Singh, D. P.: Conventional and deep learning approaches for glacial lake mapping using remote sensing data: a comprehensive review, Int. J. Remote Sens., 46, 3992–4020, https://doi.org/10.1080/01431161.2025.2496001, 2025.
Sakai, A., Chikita, K., and Yamada, T.: Expansion of a moraine-dammed glacial lake, Tsho Rolpa, in Rolwaling Himal, Nepal Himalaya, Limnol. Oceanogr., 45, 1401–1408, 2000a.
Sakai, A., Takeuchi, N., Fujita, K., Nakawo, M., Nakawo, M., Raymond, C. F., and Fountain, A.: Role of supraglacial ponds in the ablation process of a debris-covered glacier in the Nepal Himalayas, https://api.semanticscholar.org/CorpusID:130792649 (last access: 16 October 2025), 2000b.
Sattar, A., Haritashya, U. K., Kargel, J. S., and Karki, A.: Transition of a small Himalayan glacier lake outburst flood to a giant transborder flood and debris flow, Sci. Rep.-UK, 12, 12421, https://doi.org/10.1038/s41598-022-16337-6, 2022.
Schwanghart, W., Worni, R., Huggel, C., Stoffel, M., and Korup, O.: Uncertainty in the Himalayan energy–water nexus: estimating regional exposure to glacial lake outburst floods, Environ. Res. Lett., 11, 1–9, 2016.
Sharma, A. and Prakash, C.: Glacial lakes mapping using satellite images and deep learning algorithms in Northwestern Indian Himalayas, Model. Earth Syst. Environ., 10, 2063–2077, https://doi.org/10.1007/s40808-023-01885-1, 2024.
Sharma, A., Prakash, C., and Thakur, D.: Glacier lakes detection utilizing remote sensing integration with satellite imagery and advanced deep learning method, Appl. Geomat., 16, 829–850, https://doi.org/10.1007/s12518-024-00594-3, 2024.
Shrestha, F., Steiner, J. F., Shrestha, R., Dhungel, Y., Joshi, S. P., Inglis, S., Ashraf, A., Wali, S., Walizada, K. M., and Zhang, T.: A comprehensive and version-controlled database of glacial lake outburst floods in High Mountain Asia, Earth Syst. Sci. Data, 15, 3941–3961, https://doi.org/10.5194/essd-15-3941-2023, 2023.
Shugar, D. H., Burr, A., Haritashya, U. K., Kargel, J. S., Watson, C. S., Kennedy, M. C., Bevington, A. R., Betts, R. A., Harrison, S., and Strattman, K.: Rapid worldwide growth of glacial lakes since 1990, Nat. Clim. Change, 10, 939–945, https://doi.org/10.1038/s41558-020-0855-4, 2020.
Shukla, A., Garg, P. K., and Srivastava, S.: Evolution of Glacial and High-Altitude Lakes in the Sikkim, Eastern Himalaya Over the Past Four Decades (1975–2017), Front. Environ. Sci., 6, https://doi.org/10.3389/fenvs.2018.00081, 2018.
Siddique, M. A., Basit, A., Qayyum, N., Naseer, E., Bhatti, M. K., Minchew, B., Ali, M., Perez, C. S., and Marino, A.: Towards Automated Monitoring Of Glacial Lakes In Hindu Kush And Himalayas Using Deep Learning, in: IGARSS 2023–2023 IEEE International Geoscience and Remote Sensing Symposium, 2165–2168, https://doi.org/10.1109/IGARSS52108.2023.10281471, 2023.
Tadono, T., Ishida, H., Oda, F., Naito, S., Minakawa, K., and Iwamoto, H.: Precise global DEM generation by ALOS PRISM, ISPRS Ann. Photogramm. Remote Sens. Spat. Inf. Sci., 2, 71, https://doi.org/10.5194/isprsannals-II-4-71-2014, 2014.
Tang, Q., Zhang, G., Yao, T., Wieland, M., Liu, L., and Kaushik, S.: Automatic extraction of glacial lakes from Landsat imagery using deep learning across the Third Pole region, Remote Sens. Environ., 315, 114413, https://doi.org/10.1016/j.rse.2024.114413, 2024.
Taylor, C., Robinson, T. R., Dunning, S., Carr, J. R., and Westoby, M.: Glacial lake outburst floods threaten millions globally, Nat. Commun., 14, 487, https://doi.org/10.1038/s41467-023-36033-x, 2023.
Taylor, C. J., Carr, J. R., and Rounce, D. R.: Spatiotemporal supraglacial pond and ice cliff changes in the Bhutan–Tibet border region from 2016 to 2018, J. Glaciol., 68, 101–113, https://doi.org/10.1017/jog.2021.76, 2022.
Tom, M., Odermatt, D., David, C. H., Cerbelaud, A., Wade, J., and Frey, H.: Monitoring earth's glacial lakes from space with machine learning, Sci. Remote Sens., 12, 100277, https://doi.org/10.1016/j.srs.2025.100277, 2025.
Veh, G., Korup, O., and Walz, A.: Hazard from Himalayan glacier lake outburst floods, P. Natl. Acad. Sci. USA, 117, 907–912, https://doi.org/10.1073/pnas.1914898117, 2020.
Venables, W. N. and Ripley, B. D.: Modern applied statistics with S, Springer Science & Business Media, https://doi.org/10.1007/978-0-387-21706-2, 2013.
Wang, X., Guo, X., Yang, C., Liu, Q., Wei, J., Zhang, Y., Liu, S., Zhang, Y., Jiang, Z., and Tang, Z.: Glacial lake inventory of high-mountain Asia in 1990 and 2018 derived from Landsat images, Earth Syst. Sci. Data, 12, 2169–2182, https://doi.org/10.5194/essd-12-2169-2020, 2020.
Wangchuk, S. and Bolch, T.: Mapping of glacial lakes using Sentinel-1 and Sentinel-2 data and a random forest classifier: strengths and challenges, Sci. Remote Sens., 100008, https://doi.org/10.1016/j.srs.2020.100008, 2020.
Wangchuk, S., Bolch, T., and Zawadzki, J.: Towards automated mapping and monitoring of potentially dangerous glacial lakes in Bhutan Himalaya using Sentinel-1 Synthetic Aperture Radar data, Int. J. Remote Sens., 1–26, https://doi.org/10.1080/01431161.2019.1569789, 2019.
Watson, C. S., Quincey, D. J., Carrivick, J. L., and Smith, M. W.: The dynamics of supraglacial ponds in the Everest region, central Himalaya, Global Planet. Change, 142, 14–27, https://doi.org/10.1016/j.gloplacha.2016.04.008, 2016.
Watson, C. S., King, O., Miles, E. S., and Quincey, D. J.: Optimising NDWI supraglacial pond classification on Himalayan debris-covered glaciers, Remote Sens. Environ., 217, 414–425, https://doi.org/10.1016/j.rse.2018.08.020, 2018.
Watson, C. S., Kargel, J. S., Shugar, D. H., Haritashya, U. K., Schiassi, E., and Furfaro, R.: Mass Loss From Calving in Himalayan Proglacial Lakes, Front. Earth Sci., 7, https://doi.org/10.3389/feart.2019.00342, 2020.
Whitehead, P. G., Barbour, E., Futter, M. N., Sarkar, S., Rodda, H., Caesar, J., Butterfield, D., Jin, L., Sinha, R., Nicholls, R., and Salehin, M.: Impacts of climate change and socio-economic scenarios on flow and water quality of the Ganges, Brahmaputra and Meghna (GBM) river systems: low flow and flood statistics, Environ. Sci.-Proc. Imp., 17, 1057–1069, https://doi.org/10.1039/C4EM00619D, 2015.
World Meteorological Organization: State of the Climate in Asia 2024, United Nations, Geneva, https://library.wmo.int/idurl/4/69575 (last access: 18 October 2025), 2025.
Xu, X., Liu, L., Huang, L., and Hu, Y.: Combined use of multi-source satellite imagery and deep learning for automated mapping of glacial lakes in the Bhutan Himalaya, Sci. Remote Sens., 10, 100157, https://doi.org/10.1016/j.srs.2024.100157, 2024.
Yao, T., Bolch, T., Chen, D., Gao, J., Immerzeel, W., Piao, S., Su, F., Thompson, L., Wada, Y., Wang, L., Wang, T., Wu, G., Xu, B., Yang, W., Zhang, G., and Zhao, P.: The imbalance of the Asian water tower, Nat. Rev. Earth Environ., 3, 618–632, https://doi.org/10.1038/s43017-022-00299-4, 2022.
Zhang, G., Yao, T., Xie, H., Wang, W., and Yang, W.: An inventory of glacial lakes in the Third Pole region and their changes in response to global warming, Global Planet. Change, 131, 148–157, https://doi.org/10.1016/j.gloplacha.2015.05.013, 2015.
Zhang, T., Wang, W., An, B., and Wei, L.: Enhanced glacial lake activity threatens numerous communities and infrastructure in the Third Pole, Nat. Commun., 14, 8250, https://doi.org/10.1038/s41467-023-44123-z, 2023.
Zhang, T., Wang, W., and An, B.: Heterogeneous changes in global glacial lakes under coupled climate warming and glacier thinning, Commun. Earth Environ., 5, 374, https://doi.org/10.1038/s43247-024-01544-y, 2024a.
Zhang, T., Wang, W., and An, B.: Heterogeneous changes in global glacial lakes under coupled climate warming and glacier thinning – Global Glacial Lake Dataset, https://doi.org/10.11888/Cryos.tpdc.300938, 2024b.
Zheng, G., Allen, S. K., Bao, A., Ballesteros-Cánovas, J. A., Huss, M., Zhang, G., Li, J., Yuan, Y., Jiang, L., Yu, T., Chen, W., and Stoffel, M.: Increasing risk of glacial lake outburst floods from future Third Pole deglaciation, Nat. Clim. Change, 11, 411–417, https://doi.org/10.1038/s41558-021-01028-3, 2021.
Glacial lakes are expanding as glaciers melt in High Mountain Asia. These lakes store meltwater but can trigger dangerous outburst floods (GLOFs), threatening downstream communities. Using satellite imagery and deep learning, we mapped lakes across the Nepal-transboundary region (2017–2024) and found rapid growth, especially in the Koshi basin. This research supports the Glacial Lake Observatory, which will enable long-term monitoring and hazard reduction.
Glacial lakes are expanding as glaciers melt in High Mountain Asia. These lakes store...