the Creative Commons Attribution 4.0 License.
the Creative Commons Attribution 4.0 License.
 | 20 Jul 2026
Unveiling the deep ocean warming: observed bottom ocean dataset across Mediterranean Sea
Beatrice Giambenedetti
Davide Embriaco
Paolo Bagiacchi
Claudia Fratianni
Riccardo Vagni
Giuditta Marinaro
The deep ocean was long assumed to be in a quasi-stationary state, and therefore excluded from studies on climate variability. The awareness of the unsteady state of the deep ocean is a fairly recent achievement, but despite its pivotal role in the assessment of climate variability, the understanding of abyssal ocean dynamics remains largely unknown, primarily due to the scarcity of observations. This is why any observations below 2000 m depth, although poor or widely dispersed, constitute valuable knowledge that is mandatory to enhance and make available.
This work presents validated oceanographic time series collected by benthic multidisciplinary observatories across key locations in the Mediterranean Sea region. It includes details on the data processing and quality control methods used to ensure reliability and aims to deliver high-quality data, as well as standardization in the quality control procedures for deep-sea measurements.
The dataset provides a comprehensive description of seafloor observations collected over different time periods during the past decade, contributing to the long-term characterization and understanding of abyssal ocean variability in the region (MOIST, https://doi.org/10.13127/MD/MOIST, Azzarone et al., 2010).
- Article
(7227 KB) - Full-text XML
- BibTeX
- EndNote


The deep ocean is the largest, yet least observed, component of the Earth's climate system. For decades, it was assumed to be a quasi-stationary environment (Stommel and Arons, 1960; Munk, 1966) and thus was largely excluded from global monitoring strategies. The unsteady state of the deep ocean is a recent achieved knowledge (Ferrari et al., 2016; MacKinnon et al., 2017; Polzin and McDougall, 2021) that emphasizes the significance of abyssal processes in redistributing heat and energy, thereby influencing surface climate variability.
Recent findings (Talley et al., 2011; Desbruyères et al., 2016; Artale et al., 2018) show that, all over, the deep ocean is far from being a stable environment; rather, it is an active part of the climate system, exerting measurable impacts on decadal time scales. The deep sea is indeed governed by physical and biogeochemical processes occurring on a wide range of temporal and spatial scales, resulting in a complex system. It is influenced by the continuous vertical exchanges across the water column and at the air-sea interface, as well as by lateral exchange with surrounding ocean basins, guided by morphological dynamics. Given the crucial role of the oceans in absorbing planetary energy imbalance (93 %) (Rhein et al., 2013), understanding how and on what timescale deep-water masses redistribute this energy is essential for assessing long-term climate variability and ocean circulation dynamics (Lo Bue et al., 2021). Deep sea variability and the impacts of climate change on it are difficult to interpret, and it is difficult to disentangle the different contributions given the small number of available observations, as well as discriminate between local variability and climate change. These knowledge gaps are reflected in current global climate models, where abyssal processes are not well-represented, leading to important biases in the global climate variation estimates. Global climate models need observations for model design, tuning, and validation, so it is straightforward that the under-observed deep ocean results in being poorly represented (Heuzè et al., 2022). Recognition of observation as a critical element for ocean health and planet sustainability boosted observing efforts since 2000, but this has almost exclusively concerned the surface ocean (Visbeck, 2018). Therefore, the capacity to comprehend and quantify the energy redistribution in the deep ocean and its effects on climate variability will remain underestimated until enhancements in systematic monitoring across a substantial volume of (deep) ocean are achieved. Over the past decade, several global ocean observing programmes, such as ARGO, OceanSITES, GO-SHIP, OOI, ONC, and EMSO, have contributed to continuous monitoring of the deep ocean. In the Mediterranean Sea, programmes such as HydroChanges (Fuda et al., 2007) and Med-SHIP (Schroeder et al., 2015) have provided periodic observations since 2002 and 2013, respectively, documenting long-term changes in thermohaline characteristics. However, these efforts still cover only a limited and spatially scattered portion of the vast ocean (Levin et al., 2019). Currently, just 6 % of hydrographic observations extend below 2100 m in depth (de Lavergne et al., 2016), while the global mean ocean depth exceeds 4000 m.
As suggested by the UN decade (Howell et al., 2021), there is an urgent need to fill the knowledge gap about the deep ocean and to better understand the rapid changes currently being observed, including those occurring in the Mediterranean Sea (Chiggiato et al., 2023). This requires a collaborative, synergistic effort that places priority on enhancing observation networks and monitoring programs across various domains as well as delivering standardized, high-quality datasets to support both process studies and model development. High-resolution, long-term datasets are essential not only for understanding deep ocean variability but also for reducing biases in global climate models, which currently lack robust parameterizations for abyssal processes (Heuzé et al., 2022).
In this context, we present a collection of validated, long-term oceanographic datasets acquired by benthic observatories deployed at key sites across the deep Mediterranean Sea. These observatories provide unique data for sampling strategies, heterogeneity, location, and endurance. The aim is to facilitate knowledge sharing and promote a harmonized approach to deep-sea monitoring that supports broader scientific efforts in climate research, model validation, and new ocean insight.
Accurate and continuous deep-sea monitoring requires advanced data acquisition systems capable of withstanding extreme conditions and capturing a broad range of environmental variables over extended periods. In this sense, benthic multidisciplinary observatories, such as GEOSTAR-type systems (Favali et al., 2006, 2009, 2013) (Fig. 1), are essential tools, integrating physical, chemical, and geophysical sensors to acquire high-resolution data in challenging deep-ocean conditions, where pressure, oxidation, and temperature can affect the functioning of the system itself.
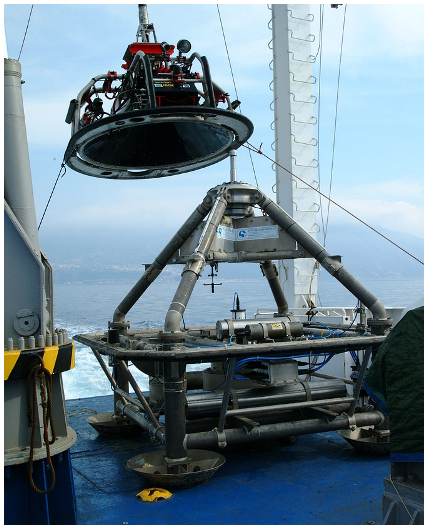
Figure 1Example of a GEOSTAR-type observatory integrating multidisciplinary sensors. The image shows the NEMO-SN1 benthic observatory during the GNDT-1 campaign (2002–2003).
Benthic observatories can be broadly categorized into two types: autonomous (standalone) and cabled systems. The choice between these configurations depends on monitoring objectives, site accessibility, power and data requirements, and logistical constraints.
Autonomous systems are designed to operate without external power or data transmission infrastructure. Powered by onboard lithium batteries, these systems store data locally until physical recovery. Low-power electronics are used to optimize battery life, and sensor data are timestamped using high-precision rubidium clocks and stored in a central internal memory. Special attention is paid to sensor placement to minimize interference from the frame structure and to ensure optimal sampling conditions. Depending on the mission configuration, autonomous systems can operate for periods up to one year (Embriaco et al., 2014; Marinaro et al., 2006; Favali et al., 2006; Beranzoli et al., 1998). The autonomous nature of these systems makes them particularly valuable for deployments in remote areas where establishing a continuous power or data connection is impractical. However, their reliance on limited battery life and local data storage means that they require periodic recovery and maintenance, limiting their ability to provide real-time data.
Cabled observatories, by contrast, are connected to shore stations via electro-optical submarine cables, allowing for real-time data transmission and continuous power supply. A cabled observatory such as NEMO-SN1 (Favali et al., 2013; Giovanetti et al., 2016) incorporates an electro-optical jumper and a 28 km-long submarine cable that connects the system to a dedicated onshore acquisition system. This setup enables uninterrupted data collection, remote control of sensors, and real and near-real-time quality control (depending on the type of data acquired). Time synchronization is achieved via a GPS signal received at the shore station, ensuring high temporal accuracy across all measurements. Cabled systems are ideal for deep long-term monitoring in accessible regions requiring high-frequency, real-time data. Table 1 summarizes the observatories, deployment sites, and sensor configurations described in this study.
Table 1Overview of the benthic observatories, including site location, deployment period, sensor types and models, sampling frequency, and sensor efficiency.
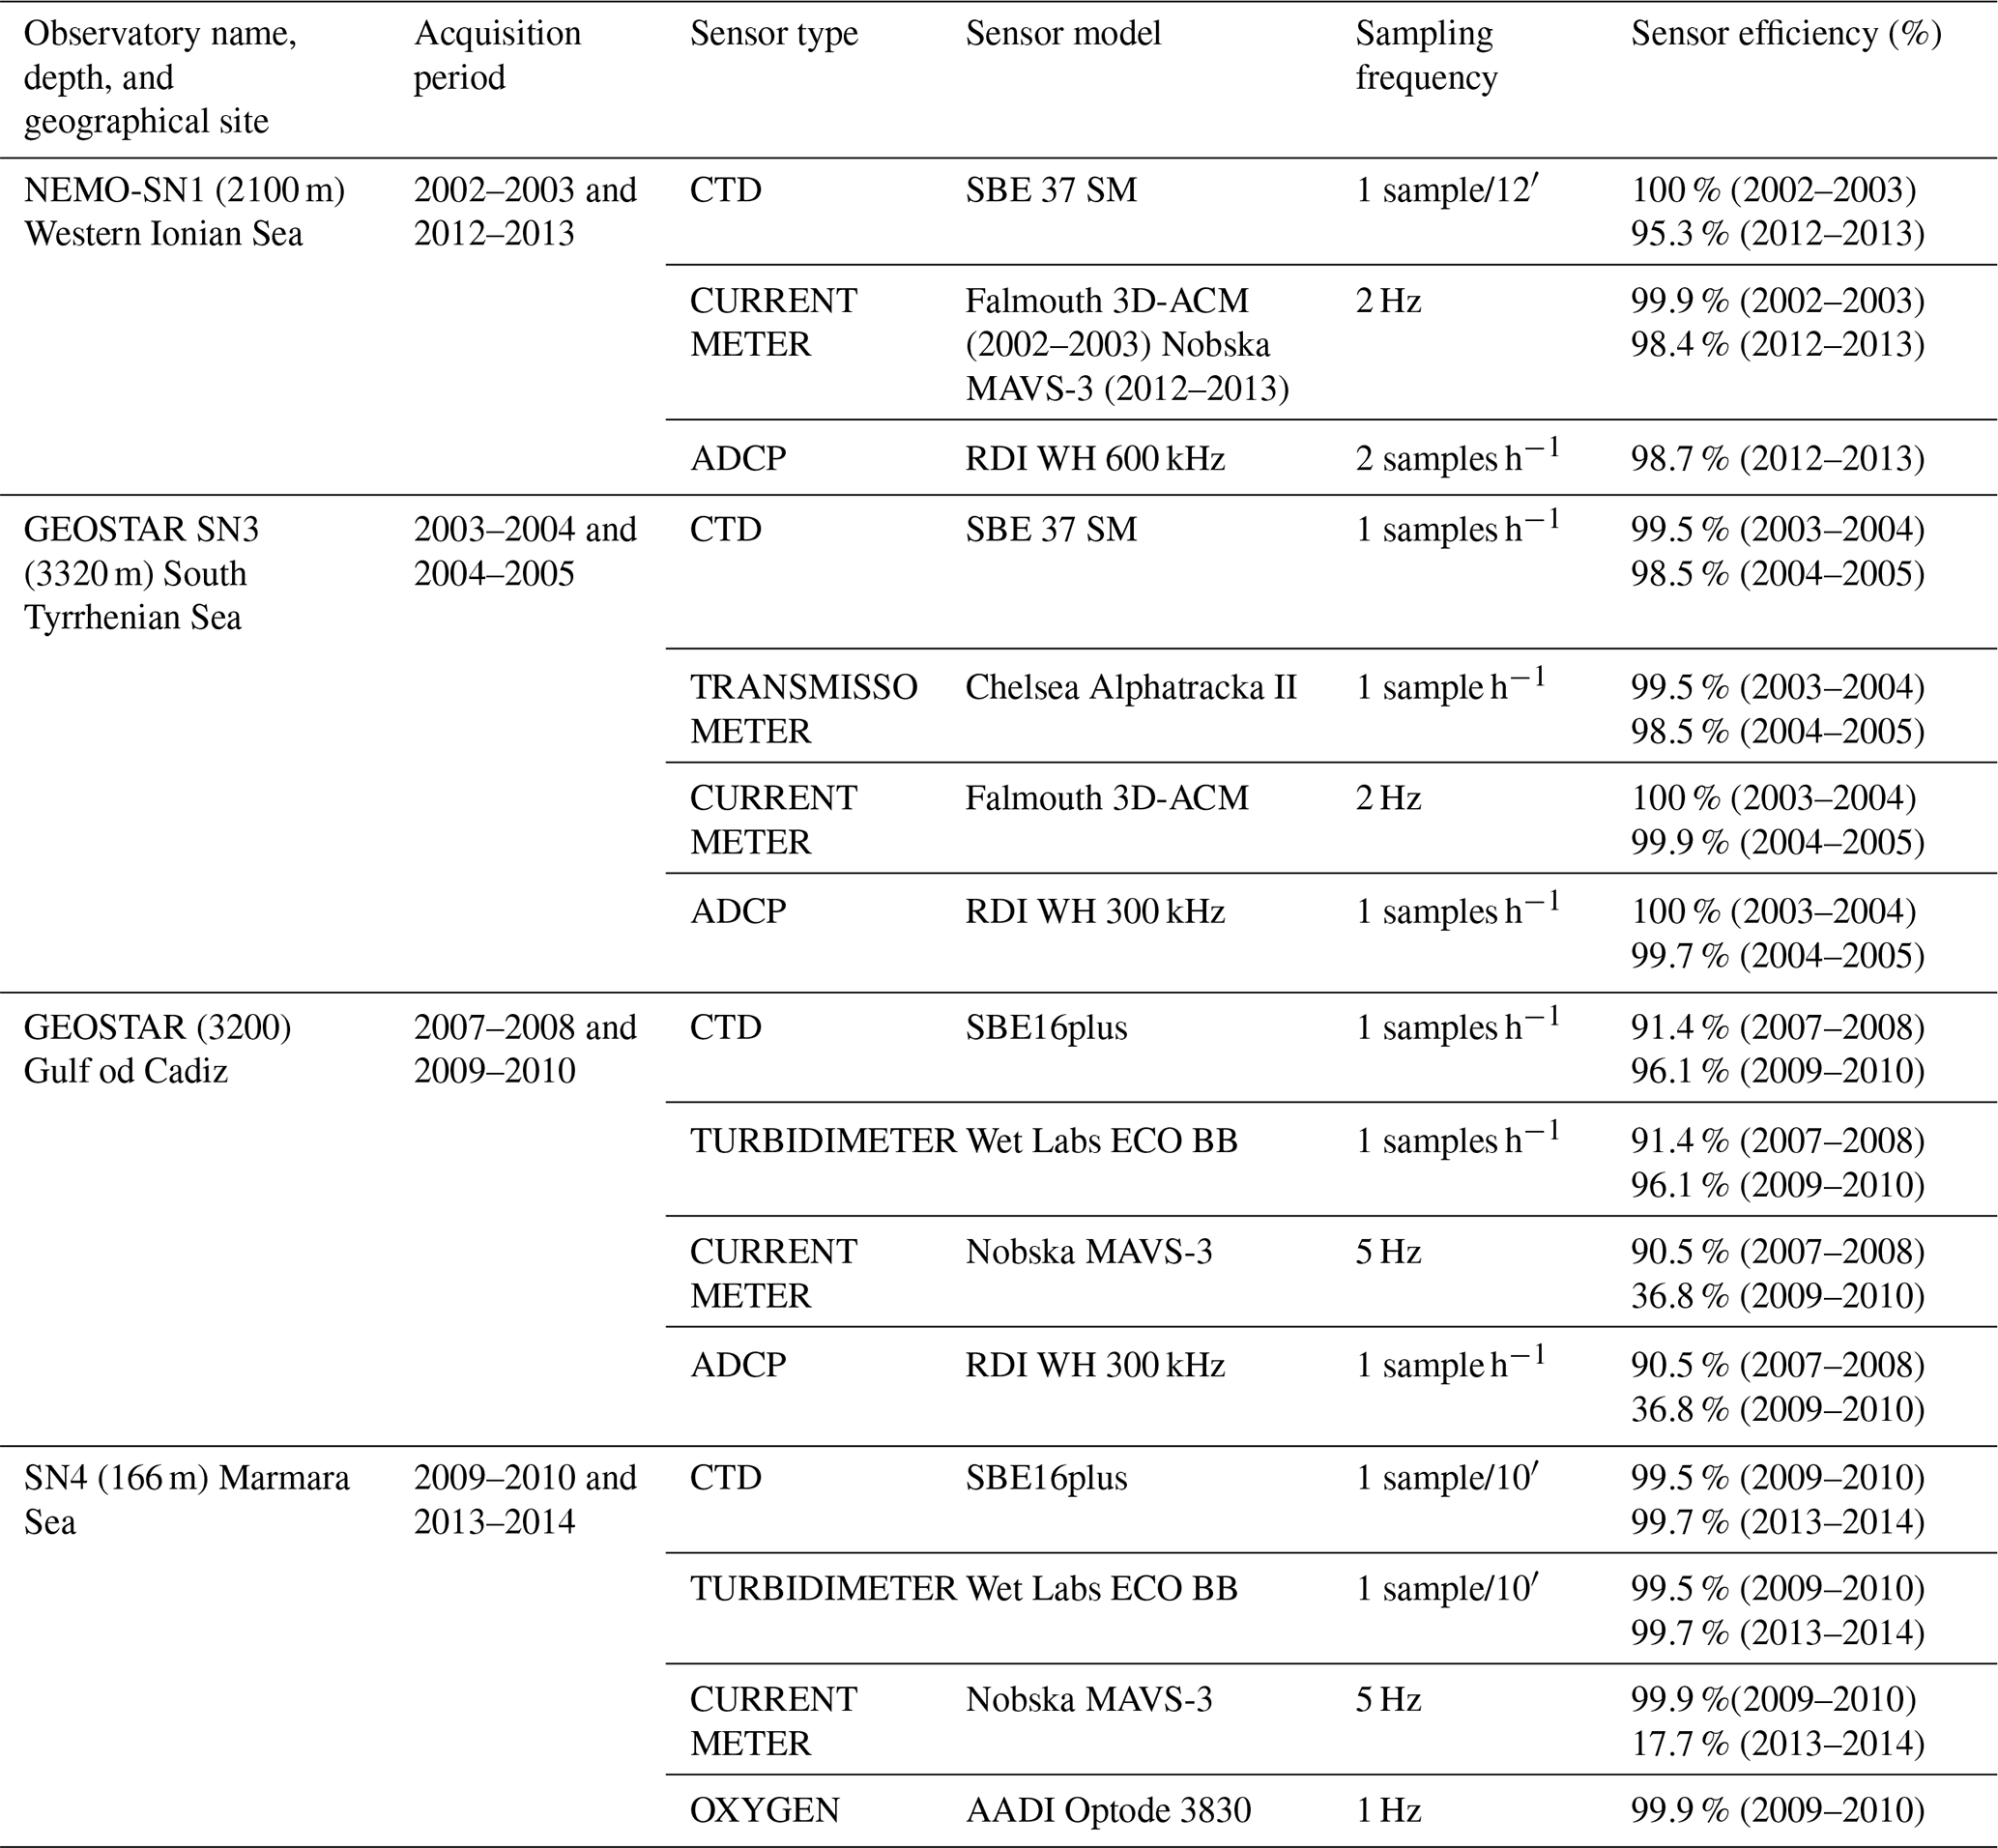
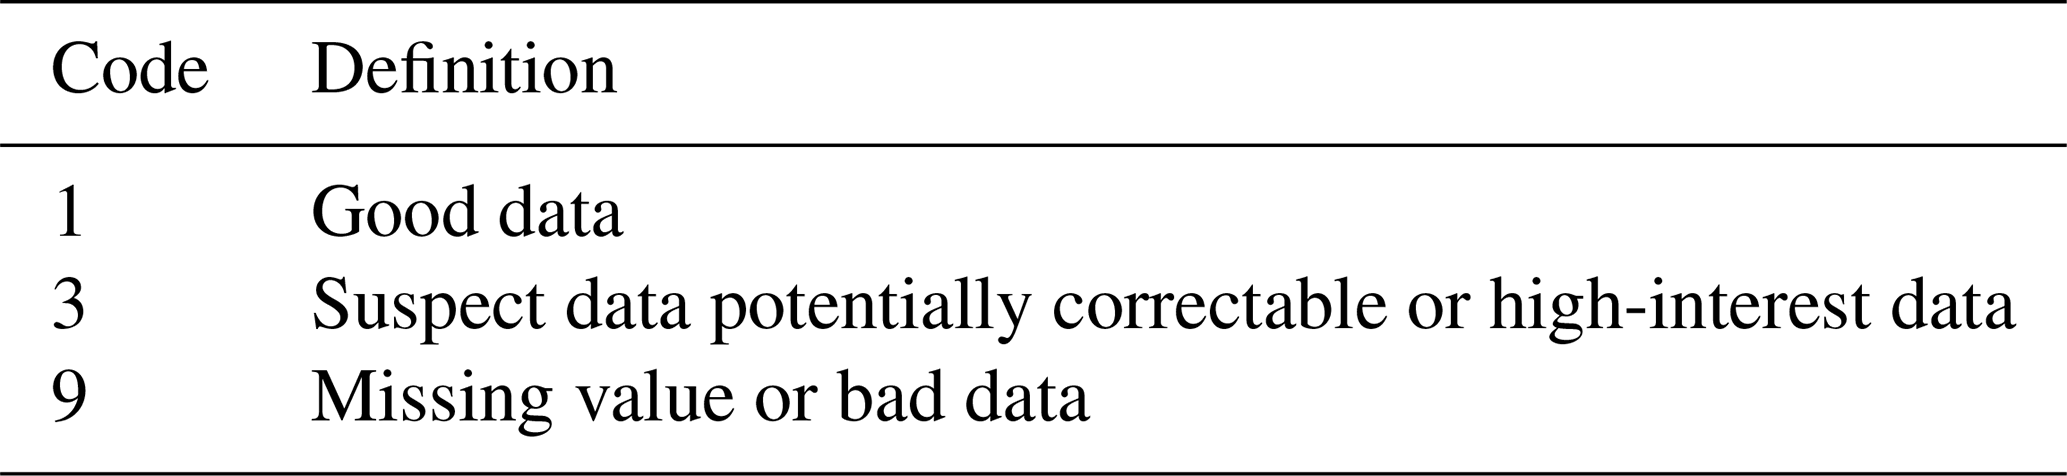
Table 2Definitions of quality flags applied to datasets. Missing and Bad data (flag 9) are not retained and replaced in the new QC datasets with NaNs.
Monitoring the deep sea presents significant challenges, from instrument deployment and data recovery to ensuring the accuracy, quality, and comparability of measurements, primarily due to its remote and extreme environment. Harsh environmental conditions, logistical complexity, and technological variability across observatories result in heterogeneous datasets requiring robust processing and harmonization. This section outlines the datasets, their characteristics, and the quality assurance (QA), the standardized post-processing, and quality control (QC) procedures adopted to enhance data integrity, reliability, and interoperability.
3.1 Datasets
Between 2002 and 2014, eight long-term multidisciplinary time series were collected by four different benthic observatories strategically located across the Mediterranean Sea (Fig. 2). Each observatory hosts a wide array of geophysical sensors. However, for the purposes of this paper, we focus only on those measuring physical and biogeochemical parameters, notably: temperature, conductivity, pressure, turbidity, and ocean currents. Sensor operation varied across deployments, with sampling intervals depending on the sensor type and mission objectives. A central data acquisition unit guarantees time synchronization among sensors that operate with different sampling intervals, ranging from hourly to a frequency as high as 5 Hz. Table 1 provides a summary of each observatory, including deployment periods, sensor types and models, sampling frequencies, and overall sensor efficiency, defined as the percentage of successfully recorded data relative to the total expected data acquisition load. Below, we present a detailed description of the datasets acquired at each site.
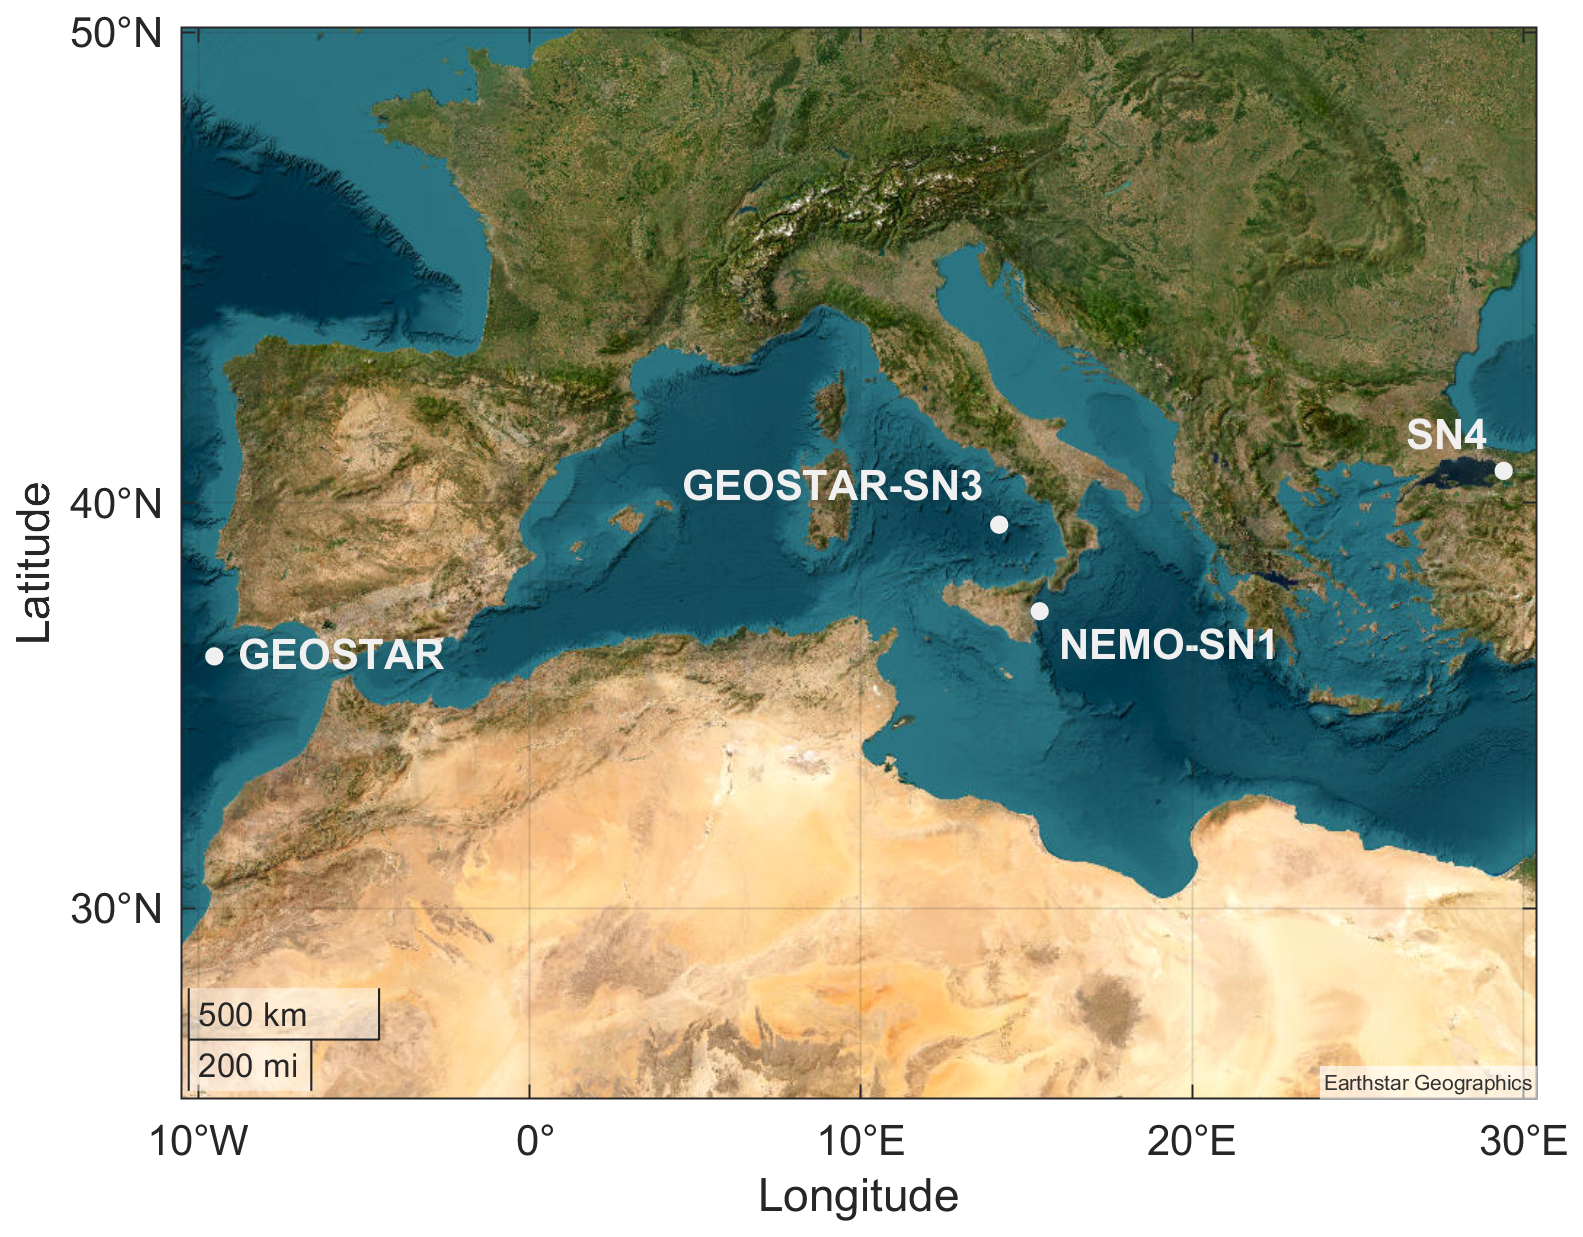
Figure 2Location of the benthic multidisciplinary observatories: GEOSTAR (Gulf of Cadiz), GEOSTAR-SN3 (Tyrrhenian Sea), NEMO-SN1 (Ionian Sea), and SN4 (Marmara Sea) (Map generated using MATLAB R2024b and the Mapping Toolbox (MathWorks, USA); basemap attribution: © Earthstar Geographics).
NEMO-SN1 observatory (Western Ionian Sea, 2100 m), located ∼ 25 km off the coast of Eastern Sicily (37.5° N, 15.4° E), yielded two different monitoring campaigns: October 2002–February 2003 and June 2012–June 2013 (Favali et al., 2006, 2011, 2013). The first deployment included a CTD probe (SBE 37SM) sampling every 12 min, and an acoustic punctual current meter (Falmouth 3D-ACM) operating at 2 Hz. This sensor payload was then improved for the second campaign (2012–2013) by adding an ADCP (RDI WorkHorse, 600 kHz), sampling current profiles every 30 min. Also, a new punctual acoustic current meter (Nobska MAVS-3 3-axis) replaced the previous one, maintaining the same sampling frequency, while the sampling rate of the CTD was changed to 1 sample per hour. This site is a key transition zone for water mass exchange between the Levantine Basin, Adriatic Sea, and Western Mediterranean, and plays a central role in deep thermohaline circulation of the Eastern Mediterranean (Malanotte-Rizzoli et al., 1997; Lascaratos et al., 1999; Gačić et al., 2010; Budillon et al., 2010).
GEOSTAR-SN3 (Southern Tyrrhenian Sea, 3320 m), located on the Marsili abyssal plain (39.5° N, 14.2° E), GEOSTAR-SN3 represents the first long-term pilot deployment at this site. This observatory was implemented to act as the main node of an underwater network of deep-sea observatories (Favali et al., 2009). It operated in two consecutive missions: 2003–2004 and 2004–2005. The observatory was equipped with a CTD (SBE 16plus), a transmissometer (Chelsea Alphatracka II), an ADCP (RDI WorkHorse 300 kHz), and a point current meter (Falmouth 3D-ACM), all sampling at hourly intervals, except for the last sensor that operated at 2 Hz. Due to the presence of the Marsili Volcano, which represents one of the largest European underwater volcanoes of the Plio-Pleistocenic age, this area is key for addressing both geophysical and oceanographic topics (Beranzoli et al., 2009).
GEOSTAR (Gulf of Cadiz, Iberian Sea, 3200 m), an updated version of the GEOSTAR seafloor observatory, was then deployed between 2007 and 2010 near shore in the Gulf of Cadiz (Iberian Sea – 36.4° N, 9.5° W). This deployment was part of the CE NEAREST project (Integrated observation from NEAR shore sourcES of Tsunami: Towards an early warning system) (Favali et al., 2009), which aimed to enhance the near-real-time detection of signals through a multiparameter seafloor observatory designed to characterize potential sources of tsunamis, contributing to the development of a prototype Early Warning System (EWS). From an oceanographic perspective, this site is significant for monitoring interaction between the North Atlantic current and the Mediterranean outflow, contributing to the oceanographic characterization of a key interbasin exchange zone (Alves et al., 2011; García-Lafuente et al., 2006; Ochoa and Bray, 1991). The sensor suite included a CTD (SBE 16plus), a turbidimeter (Wet Labs ECO BB), an ADCP (RDI WorkHorse 300 kHz) sampling every 10 min and a punctual current meter (Nobska MAVS-3) sampling at 5 Hz.
SN4 (Marmara Sea, 166 m), deployed along the North Anatolian Fault in the Gulf of Izmit (40.7° N, 29.4° E), SN4 monitored seismic activity and its coupling with environmental parameters. Campaigns were conducted in 2009–2010 and 2013–2014, with durations of 5 and 7 months, respectively. Although SN4 is one of the smallest GEOSTAR-class observatories, its instrumentation includes both geophysical and oceanographic sensors (Favali et al., 2009; Marinaro et al., 2006), hosting CTD (SBE 16plus), a turbidimeter (Wet Labs ECO NTU), an oxygen optode (AADI 3830), and a point current meter (Nobska MAVS-3), with sampling frequencies ranging from 1 sample every 10 min (CTD, turbidity) to 1 Hz (oxygen) and 5 Hz (currents). The observatory's purpose is to investigate potential correlations between seismic activity and gas methane emissions in the surrounding environment, given the area's status as an active seismic zone (Embriaco et al., 2014).
3.2 post-processing and quality control
The long-term deployment of observatories, along with the evolution of instrumentation over the years, has resulted in variability in data formats and metadata structures. Consequently, a tailored post-processing procedure for each observatory was required to face these discrepancies. To provide a more reliable comparison for future dissemination and usage of the data, in compliance with the FAIR (Findable, Accessible, Interoperable, and Reusable) principles for data sharing, the post-processing workflow consisted of several steps: converting raw data into usable formats, harmonizing metadata, and applying quality checks. Preliminary analysis was always conducted to evaluate the sensor efficiency (Table 1). The raw data extracted from the deck unit were converted into a readable format using custom-designed software tailored for each specific observatory, whereas certain types of data, such as ADCP data, required conversion using the manufacturer's software. Each dataset underwent post-processing utilizing specific multi-step standardized procedures following the manufacturer's recommendation. This process enhances the accuracy, reliability, and interpretability of the raw data, refining its quality and facilitating better interpretation. The QC procedures were guided by recommendations from international frameworks such as GOOS (IOC, 2010; EuroGOOS, 2011) and QUARTOD (Bushnell et al., 2019). Tests included checks for time consistency, value ranges, rate of change, and internal consistency across sensors. Data were flagged based on severity and usability (Table 2), with bad or missing data replaced by NaNs to maintain data integrity.
3.2.1 Post-processing
The first stage aimed to collect, convert, and verify the data gathered by different acquisition systems, considering the diverse types of sensors and the relative data format, to enhance the quality and reliability of the collected information. A thorough post-processing phase was undertaken to refine and further validate the data. This involved primarily an inspection of the efficiency of the sensors and their proper functioning through meticulous post-calibration and validation procedures to ensure the integrity of the data, providing a solid foundation for subsequent analysis and interpretation. Table 1 reports the efficiency for each sensor and mission elaborated, where the overall acquisition efficiency is calculated as the percentage of data recorded on the total acquisition load. The efficiency of the oceanographic sensors was generally greater than 90 %, with a few exceptions, most notably in the Marmara Sea (Table 1), where the Nobska MAVS-3 sensor stopped functioning relatively early in the mission. Subsequently, several checks were performed to verify timestamp validity, ensure alignment of multivariable measurements, and assess instrument efficiency.
Moreover, regression analysis was employed to verify internal consistency, particularly between current meters and ADCPs. For instance, the eastward velocity component (U) measured by the punctual current meter and by the ADCP deployed at GEOSTAR-SN3 during the 2003–2004 mission showed moderate agreement (R2= 0.28, Fig. 3). This result should be interpreted in the light of the differences in functioning, and positioning: the ADCP samples the open water column, whereas the punctual current meter operates within the observatory frame. Also, the current-meter record, acquired at 2 Hz, was smoothed using a 1 h moving average and sampled at hourly intervals to allow comparison with the ADCP data.
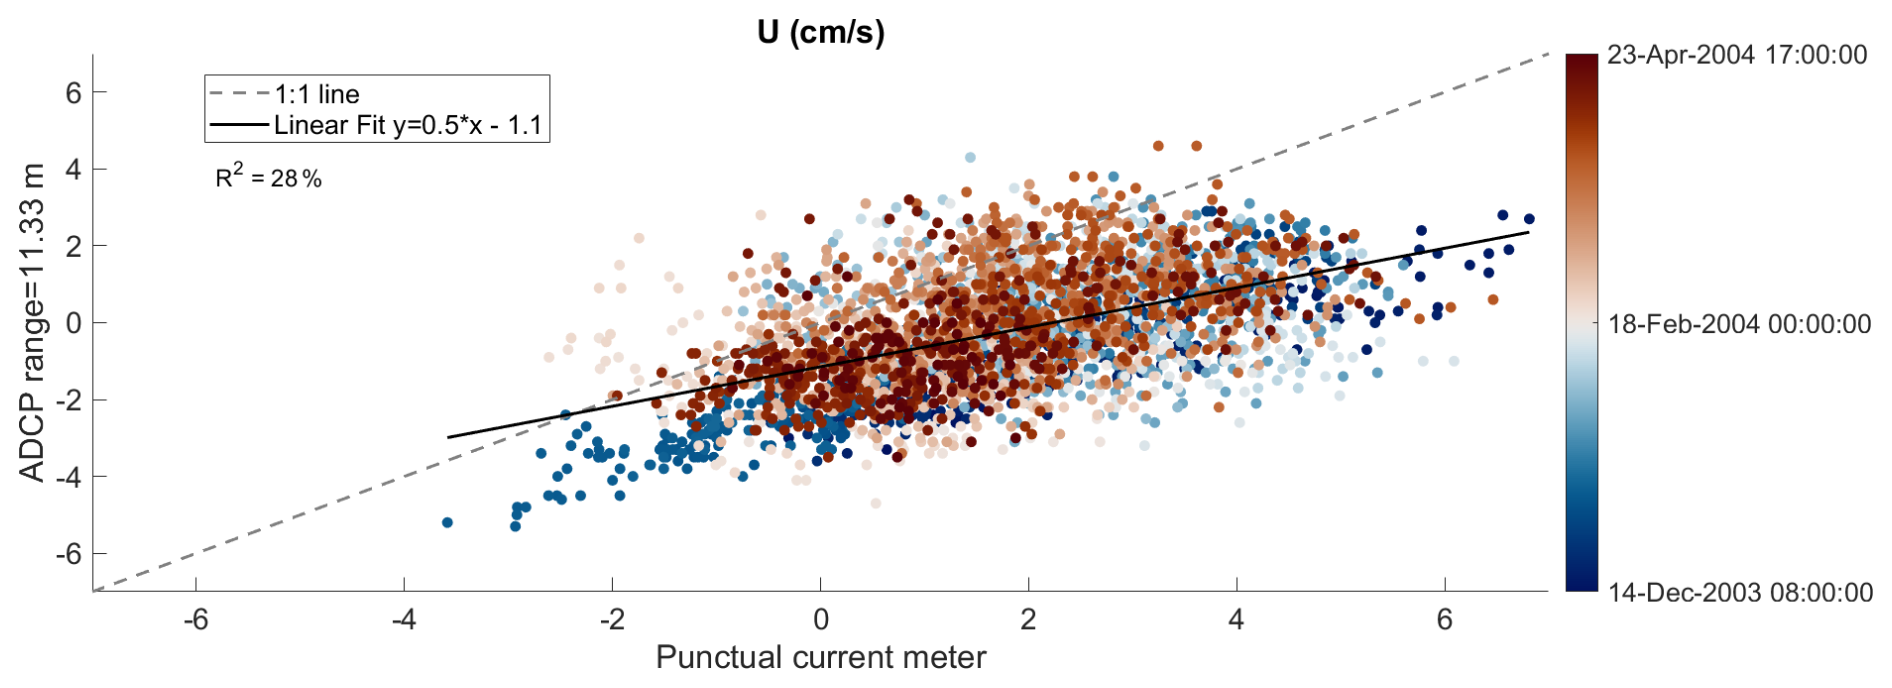
Figure 3Comparison of the eastward velocity component (U) velocity components from punctual current meter (located approximately 1 m above the seabed) and ADCP (data refers to measurements taken at 11.33 m above the seabed) at GEOSTAR-SN3 (2003–2004). To match these two different types of data we considered the hourly time series.
The RDI Workhorse 300 kHz ADCP measurements correspond to ensemble-averaged profiles (100 pings per ensemble, 6 s ping interval), which produce one velocity profile per hour. This moderate consistency was observed despite differences in their operating principle, measurement accuracy and installation height from the seafloor. The ADCP profiles a section of the water column above the observatory (up to 20–30 m in this example), while the punctual current meter captures velocity closes to the sensor itself, close to the bottom. This comparison helps confirm the reliability of the collected data.
3.2.2 Quality Control Procedures
Before any QC procedure can be meaningfully applied, rigorous Quality Assurance (QA) is essential to ensure that the sensors themselves provide measurements within their expected accuracy and long-term stability specifications (i.e., limited drift over time). In these cases, QA included pre-deployment sensor calibration and in situ verification through dedicated CTD casts performed using high-accuracy shipborne CTD systems (e.g., SBE 911plus) and conducted both immediately before the observatory deployment and after recovery. These steps establish the baseline performance of each instrument, allow the identification of sensor drift or malfunction. Ensuring robust QA is fundamental, as even the most sophisticated QC procedures cannot fully compensate for poorly calibrated or improperly functioning sensors (Bushnell et al., 2019; Waldmann et al., 2022); rather, effective QA provides the foundation upon which reliable real-time and delayed-mode QC can be built. Whether performed in real-time or in delayed mode, QC data is crucial for ensuring the accuracy, reliability, and consistency of the data collected. For cabled observing systems, real-time QC serves as necessary tool for assessing, monitoring sensor performance and developing possible real-time applications. It also helps prevent the storage and analysis of erroneous data, while enabling prompt corrections that can minimize inaccuracies during critical monitoring periods.
In contrast, delayed mode QC provides a more comprehensive review to improve data accuracy. It involves comparing measurements with reference datasets, historical records, and, where appropriate, model outputs, to assess the consistency of the observations. This process supports the identification and correction of errors that may have been missed during real-time processing. Sensor recalibration and cross-referencing with nearby instruments are commonly applied. By applying advanced statistical and tailored threshold-based techniques (e.g. range tests, spike and outlier detection), together with time series methods (e.g. low-pass/high-pass filtering, trend analysis, autocorrelation), delayed mode QC can effectively address issues such as missing data, spikes, and sensor drift, thereby substantially enhancing overall data quality. Since deep ocean data is often collected over extended periods, delayed mode QC plays a crucial role in identifying and correcting inconsistencies caused by sensor degradation or calibration drift. This is especially important for long-term environmental studies, where maintaining consistency across datasets is essential for reliable trend analysis and meaningful comparisons.
All datasets here described, whether collected through stand-alone or cabled system, have been processed in delayed mode with the aim of archiving the dataset for long-term use and sharing high-quality data with the scientific community.
Following QUARTOD (QA/QC for Real-Time Oceanographic Data) recommendations (EuroGOOS, 2011), a QC protocol was customized for each sensor type and designed to be as automated as possible. Data that failed one or more tests were either flagged or removed according to the test rules. Missing or bad (removed) data were substituted with NaNs, while preserving their corresponding timestamps to maintain a regular temporal grid in the dataset. Custom thresholds were defined for regional and seasonal variability based on climatological data from the Mediterranean Sea (Robinson et al., 2001; Millot and Taupier-Letage, 2005) (Table 3).
Table 3Example of regional thresholds used in quality control tests for the Mediterranean Sea, including seasonal and climatological variability.
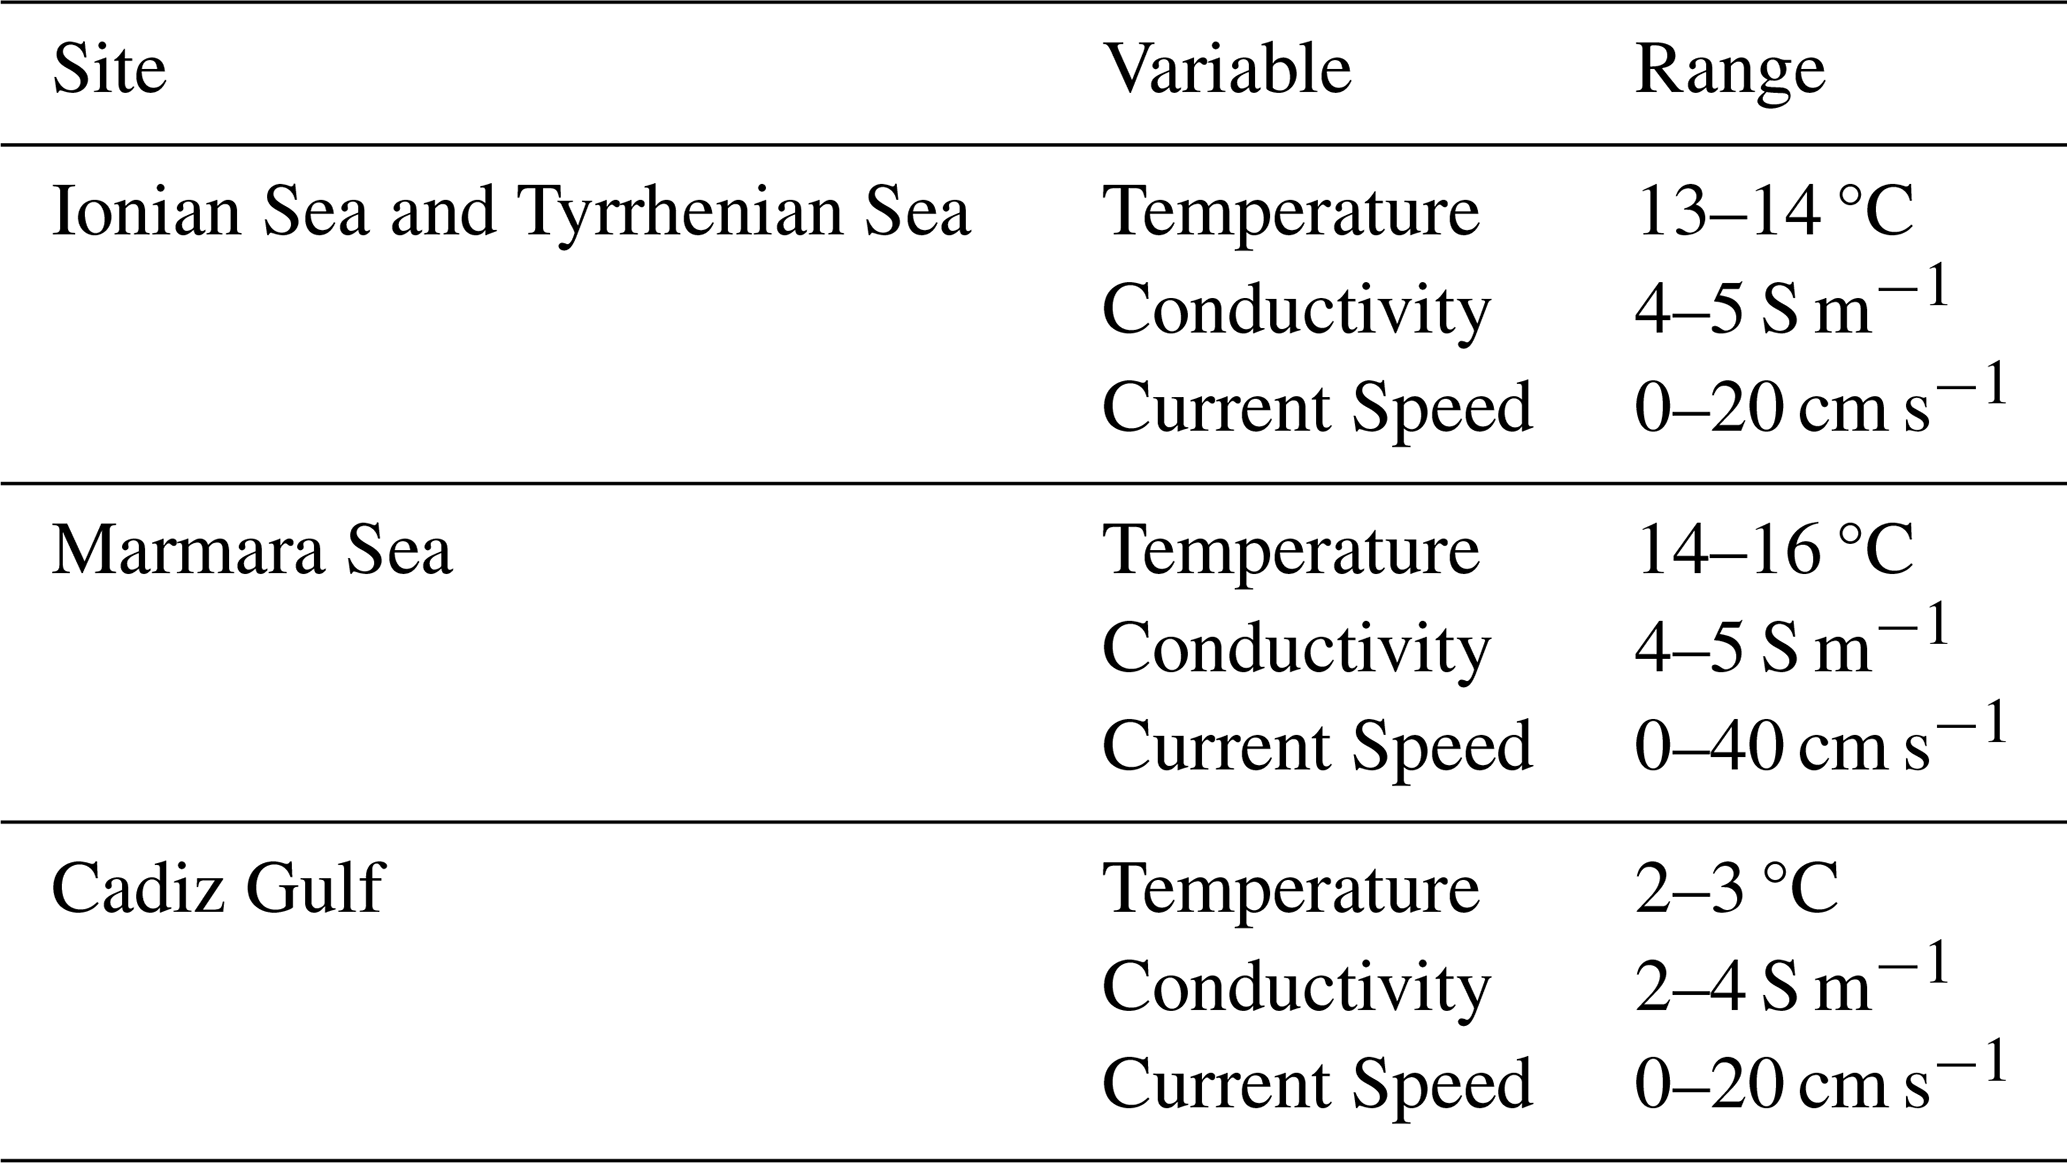
These measures ensured that flagged data reflected real anomalies rather than environmental variability. Figure 4 provides an overview of the quality of the seafloor observatory data after applying the post-processing and the QC procedure using flags defined in Table 2.
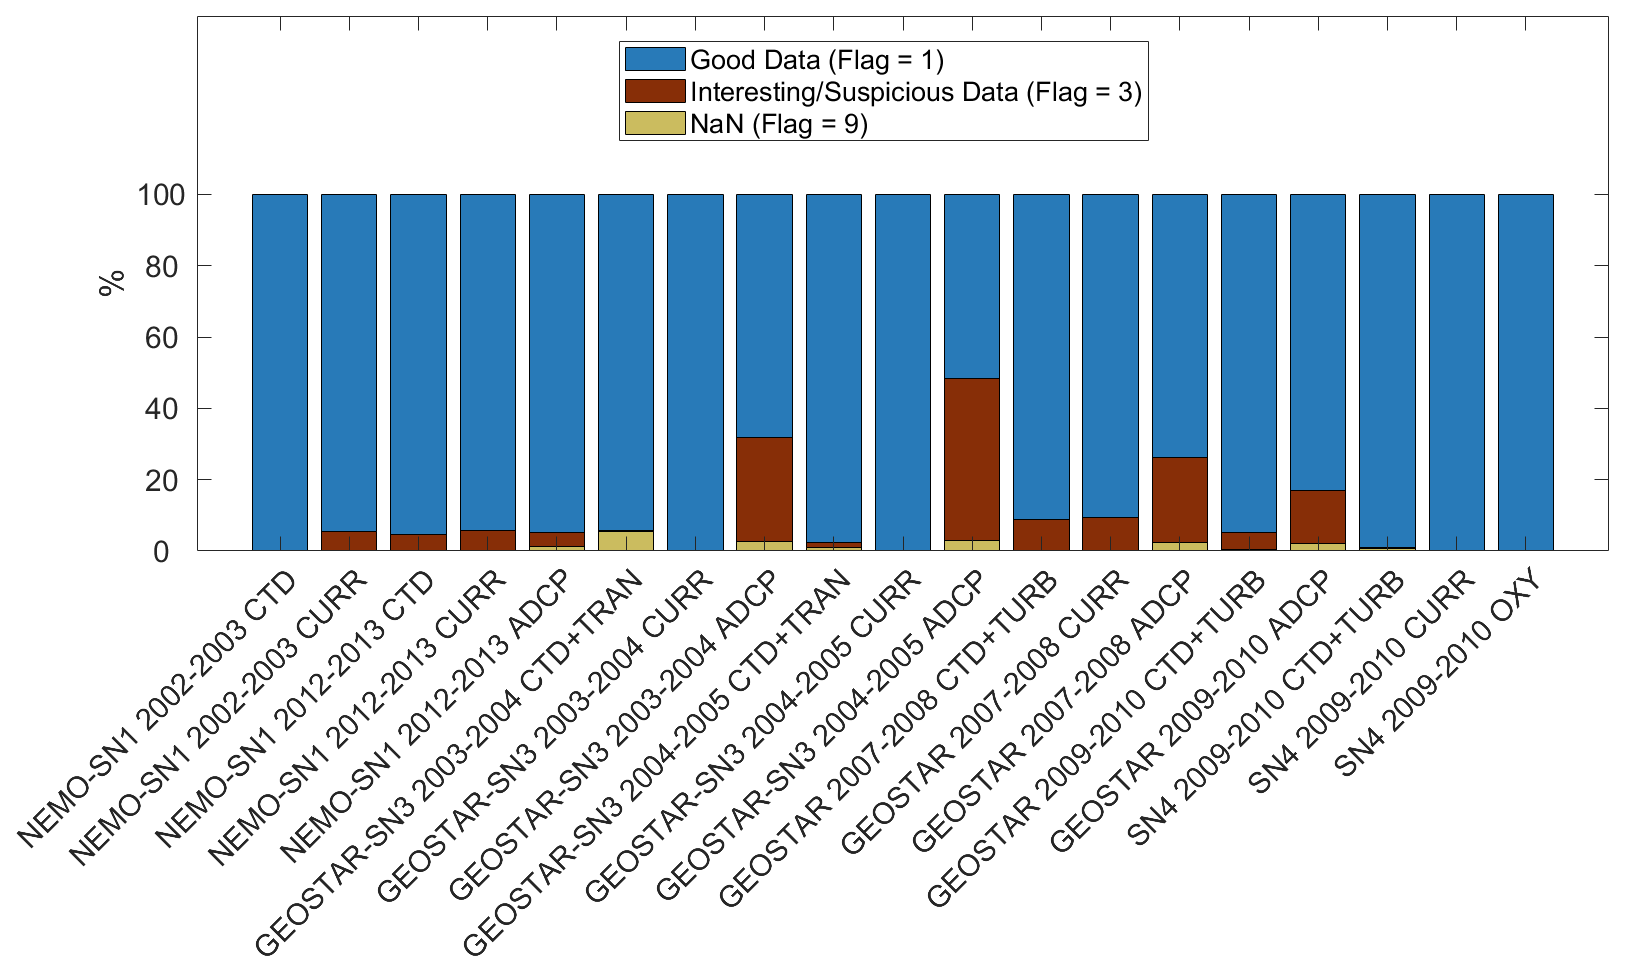
Figure 4Data quality distribution across observatories and sensors after QC. Data quality flags as percentages for all processed datasets. Bars indicate observatory name, campaign years, and sensor type. Flag codes: Good Data (Flag = 1); Interesting/Suspicious Data (Flag = 3); NaN (Flag = 9).
The QC procedure was carried out through a stepwise sequence of tests, such as:
-
Time check. The test concerns missing timestamps. It requires that the observation date and time are reliable and cover the whole campaign duration with the frequency of the instrument. Missing data are typically detected and flagged. In some cases, the acquisition system automatically inserts a standard out-of-range value (e.g., “999”) in the raw data to indicate a malfunction; these values are identified and replaced with NaNs.
-
Out of range test. Removing any measurements that exceed the output-range thresholds assigned individually to each sensor.
-
Gross Range test. The gross range test evaluates each observed value against the full spectrum of physically plausible measurements, encompassing both the extreme conditions expected in the oceans and the operational limits of the sensors. Any value that falls outside this predefined range is automatically flagged or removed, ensuring that clearly erroneous measurements are excluded from subsequent analyses.
-
Percent Good (ADCP only). This test uses the percent good of the beams, which indicates what fraction of the pings were accepted for a given ensemble. The percent good test determines whether the data that are being returned are sufficient to provide the required data quality. For Teledyne RDI ADCPs, when the coordinate frame is not set to beam coordinates, the Percent Good test refers to the percentage of valid three- and four-beam solutions, i.e., the proportion of data for which no beams or only one beam has been rejected by the sensor.
-
Error velocity test (ADCP only). Uses error velocity, which derives from the four-beam geometry of an ADCP, each pair of opposing beams providing two independent measurements of velocity. The error velocity can be treated as an indicator of errors for each depth bin. Threshold specification from the sensor manufacturer.
-
Regional/Seasonal range test. This is a variation on the gross range test, where the thresholds are adjusted to seasonal averages (e.g., climatological ranges, expected variability from the measured region). Table 3 provides an example of specific ranges for observations from the Mediterranean Sea.
-
Spike test. This test checks for single value spikes usually due to an electrical signal from the sensor, relative to adjacent data points. Spikes consisting of more than one data point are difficult to capture, but their onset may be flagged by the following Rate of change test.
-
Rate of change. This test inspects the time series for changes between consecutive observations that exceed a defined threshold. The observed quantities can change substantially over short periods in some locations, hindering the value of this test, so the thresholds have been chosen carefully and tailored based on the sensor's operational limits and location. The threshold is defined using the local variability of the signal (e.g., a multiple of the standard deviation computed over a moving time window). Unlike classical outlier detection methods based on deviation from a mean value, this test evaluates the temporal consistency of the measurements and flags, rather than removes, suspect data. In the case of dissolved oxygen measurements, because of its dynamic nature (Fusi et al., 2023), this test does not involve the removal of outliers but flagging.
-
Flat line. A common sensor failure mode can provide a data series that is nearly a flat line suggesting sensor failure. This test checks for a continuously repeated observation of the same value. Since in the deep sea there is generally little variability, this kind of test is performed for flagging suspicious data which it cannot be considered necessarily bad in this specific case.
-
Sensor Tilt (for current meter and ADCP). Current sensors must be aligned within an expected range of tilt angles to properly measure horizontal and vertical currents. For fixed-mounted sensors, as in the case of seafloor observatories, significant variations in tilt are not expected, and the applicability of this test is therefore limited. In this context, we examined the vertical consistency of ADCP velocity profiles (i.e., gradients along depth), which can help identify non-physical variations potentially associated with instrumental issues or platform disturbances, although this approach does not represent a direct substitute for tilt measurements.
-
Echo Intensity (ADCP only). If a beam reflects off a boundary, then the echo intensity increases from the previous bin. The test checks for echo intensities that may indicate interaction with the surface, bottom, or in-water structures.
-
Current gradient (ADCP only). The current speed is expected to change at a gradual rate with depth. This test checks for excessive current speed/direction changes in the vertical profile.
An example of the QC procedure is shown in Fig. 5, using the eastward velocity component measured by the punctual current meter on GEOSTAR-SN3 during the 2003–2004 mission. The raw data initially contained numerous spikes, out-of-range values, and outliers, making interpretation difficult (Fig. 5a). Applying only the out-of-range test significantly improved data clarity (Fig. 5b) and completing the full QC process resulted in a clean and accurate representation of the eastward velocity component (Fig. 5c). All tests were conducted within the valid measurement range for the instrument, as specified in Table 4. These QC procedures, excluding the tilt test, were also applied to CTD probes, turbidimeters, and transmissometers. For CTD data, derived quantities were calculated using the international TEOS-10 (Thermodynamic Equation of SeaWater, 2010) subroutines (McDougall and Barker, 2011), including in-situ salinity (S, PSU), absolute salinity (SA, g kg−1), conservative temperature (CT, °C), potential temperature (θ, °C), and in-situ density (ρ, kg m−3).
Table 4Statistical parameters computed for time series from all observatories, including sensor type and campaign details.
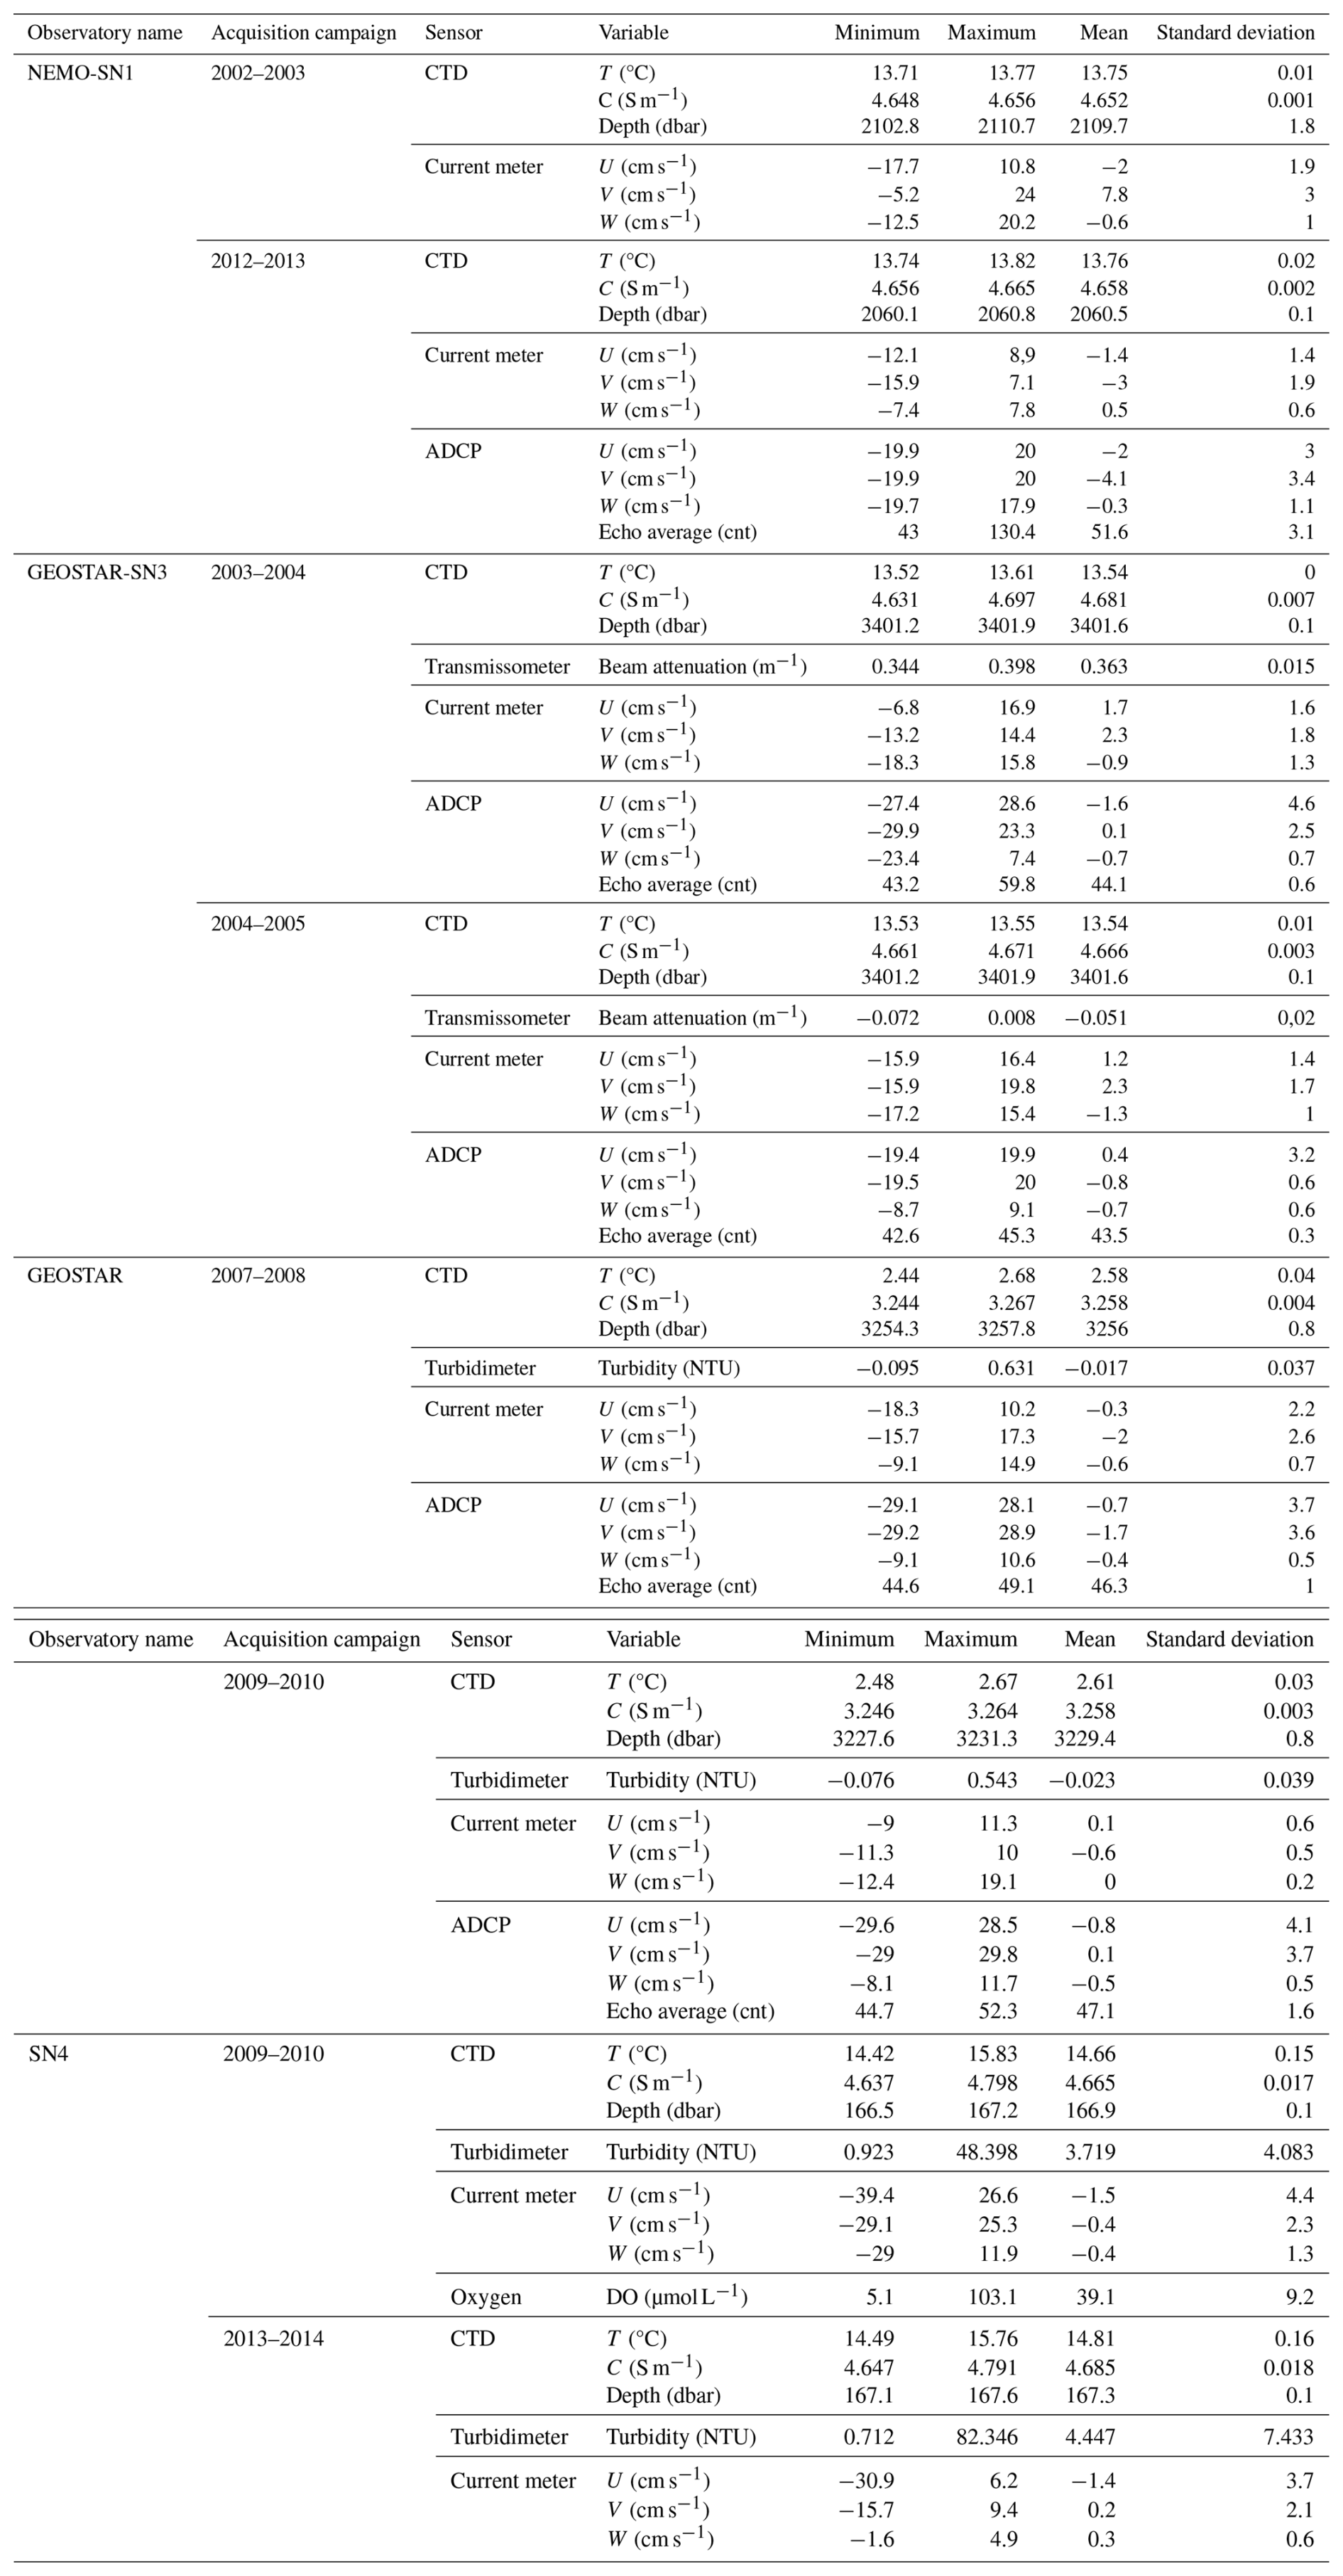
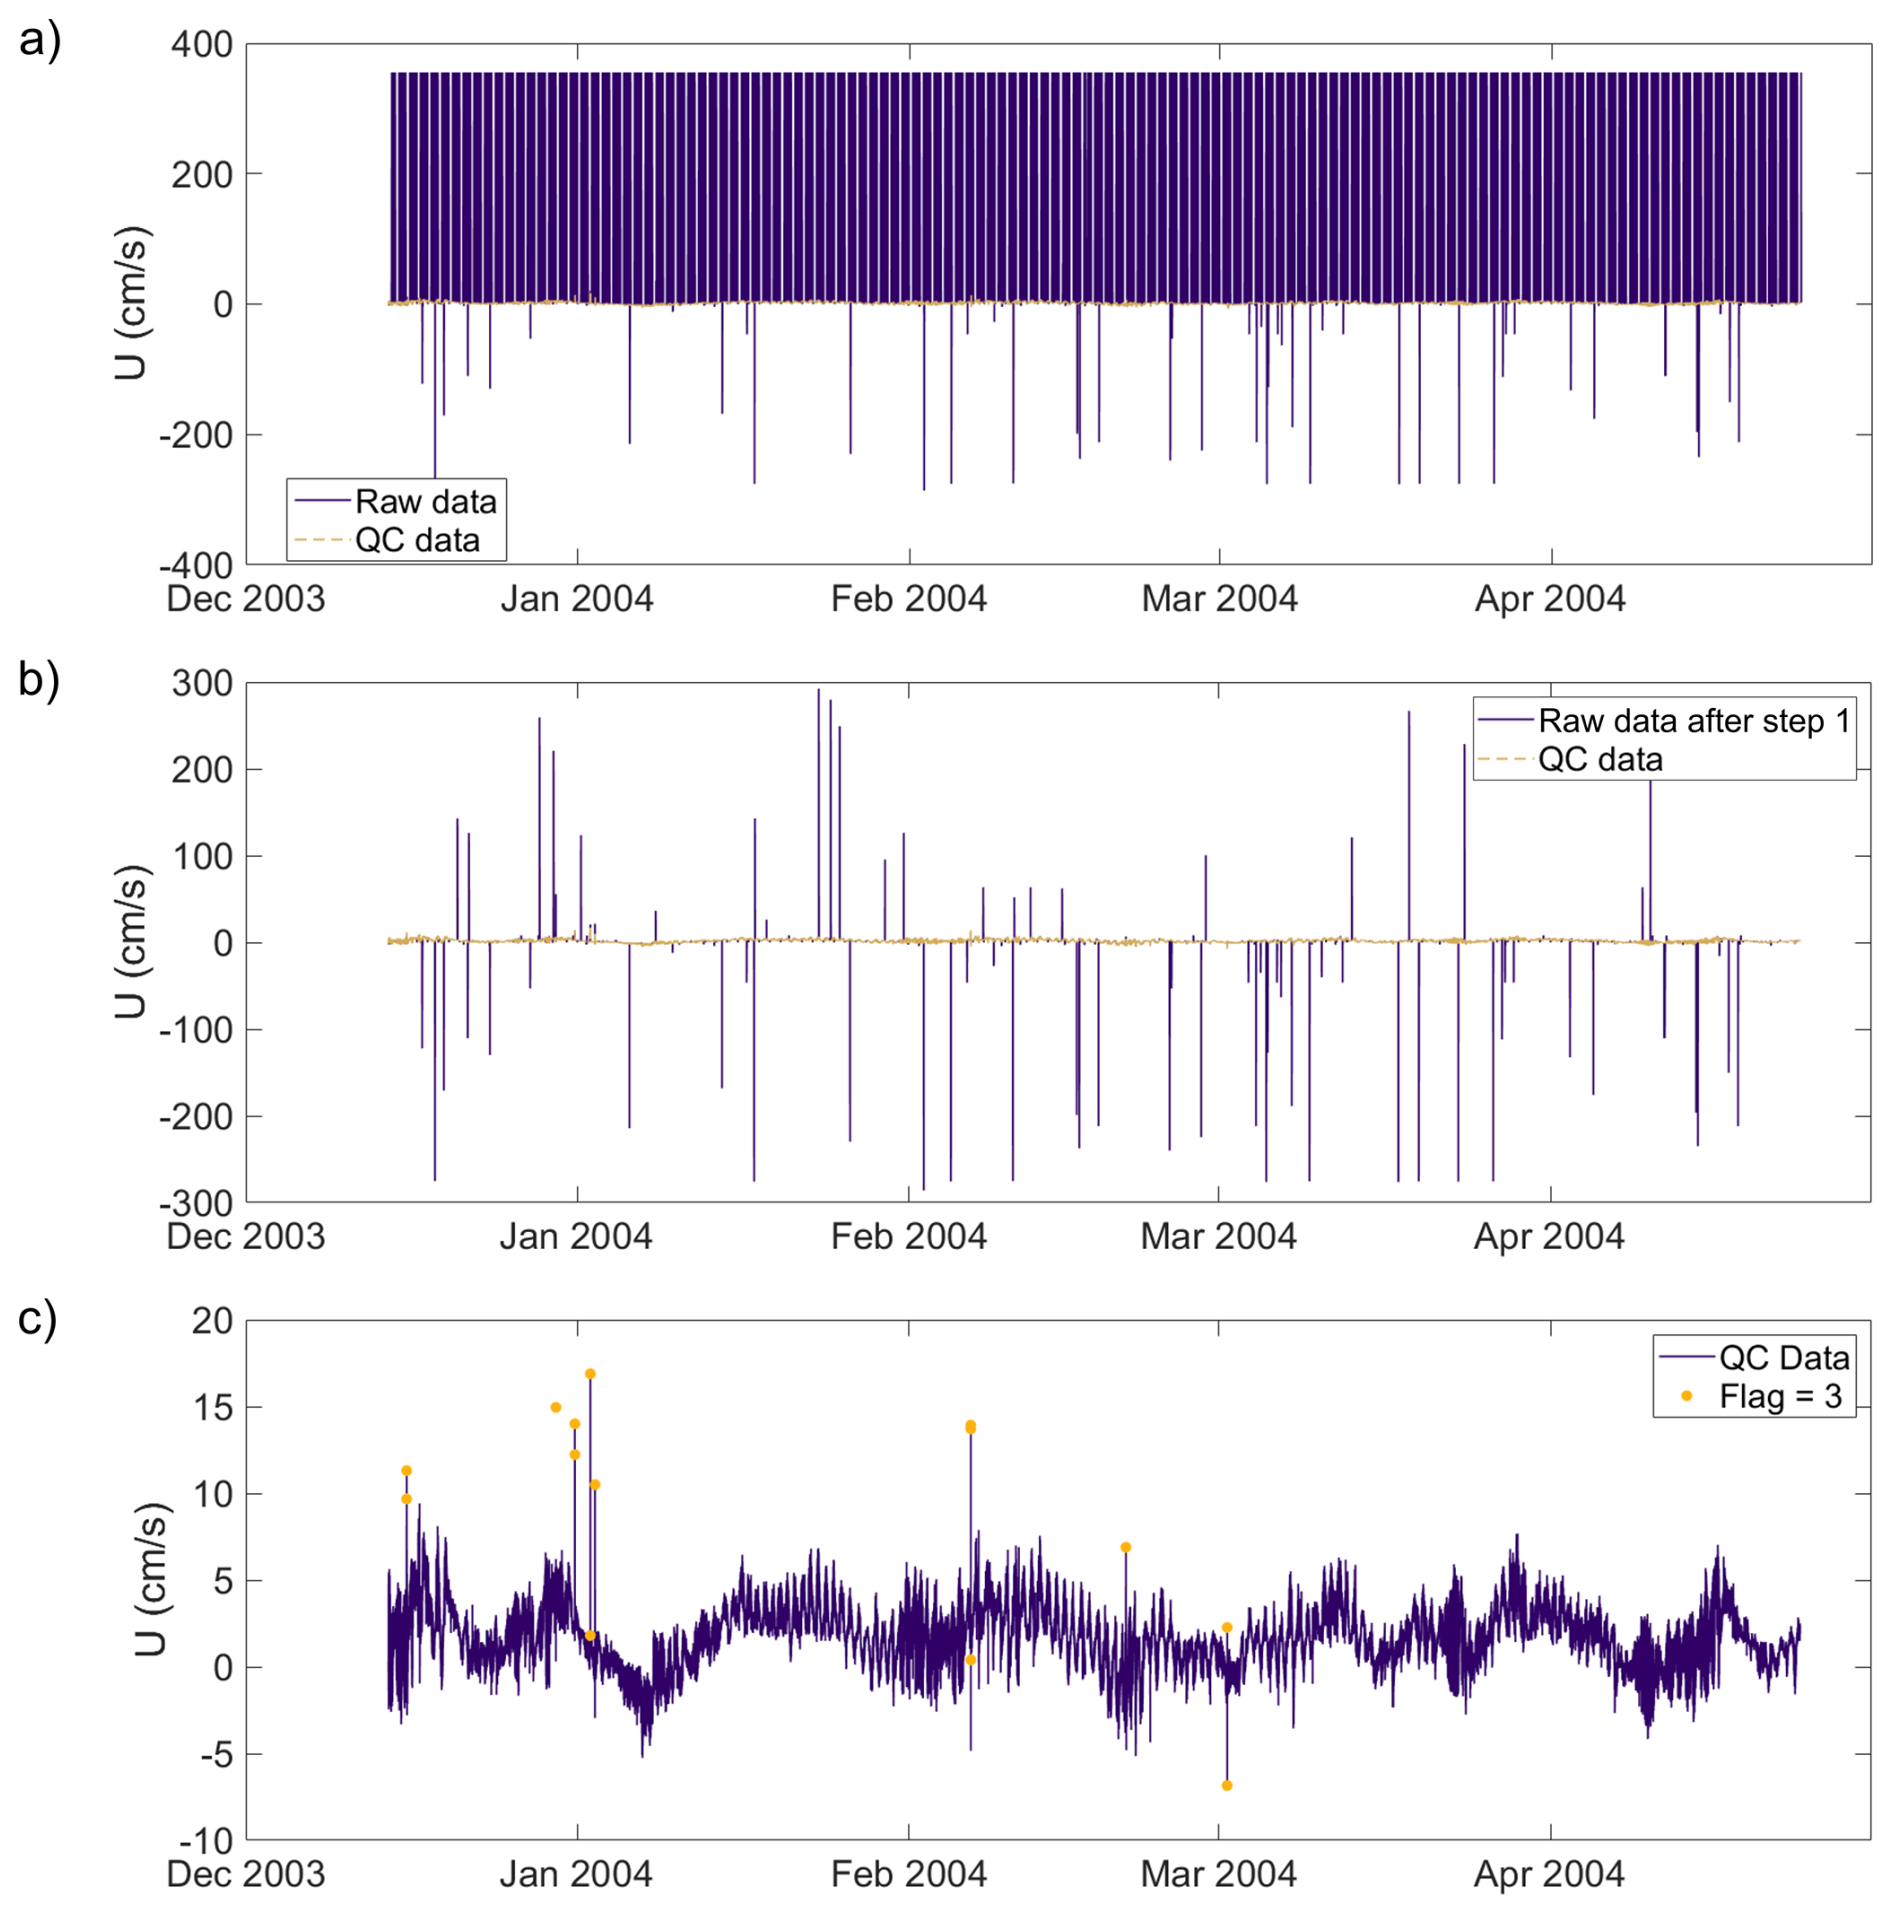
Figure 5QC procedure applied to the eastward velocity component measured by the punctual current meter at GEOSTAR-SN3 (2003–2004). (a) Raw data showing outliers; (b) intermediate results after range and spike tests; (c) final cleaned dataset after applying full QC protocol.
For dissolved oxygen measurements, the same QC procedures were used, with a modified rate-of-change test to account for the dynamic nature of oxygen in the marine environment (Fusi et al., 2023).
The ADCP measurements required a slightly different approach compared to the other sensors due to their operational differences. Figure 6 shows an example of the QC steps applied to the velocity magnitude measured by the ADCP mounted on SN3 observatory during the 2003–2004 acquisition campaign.
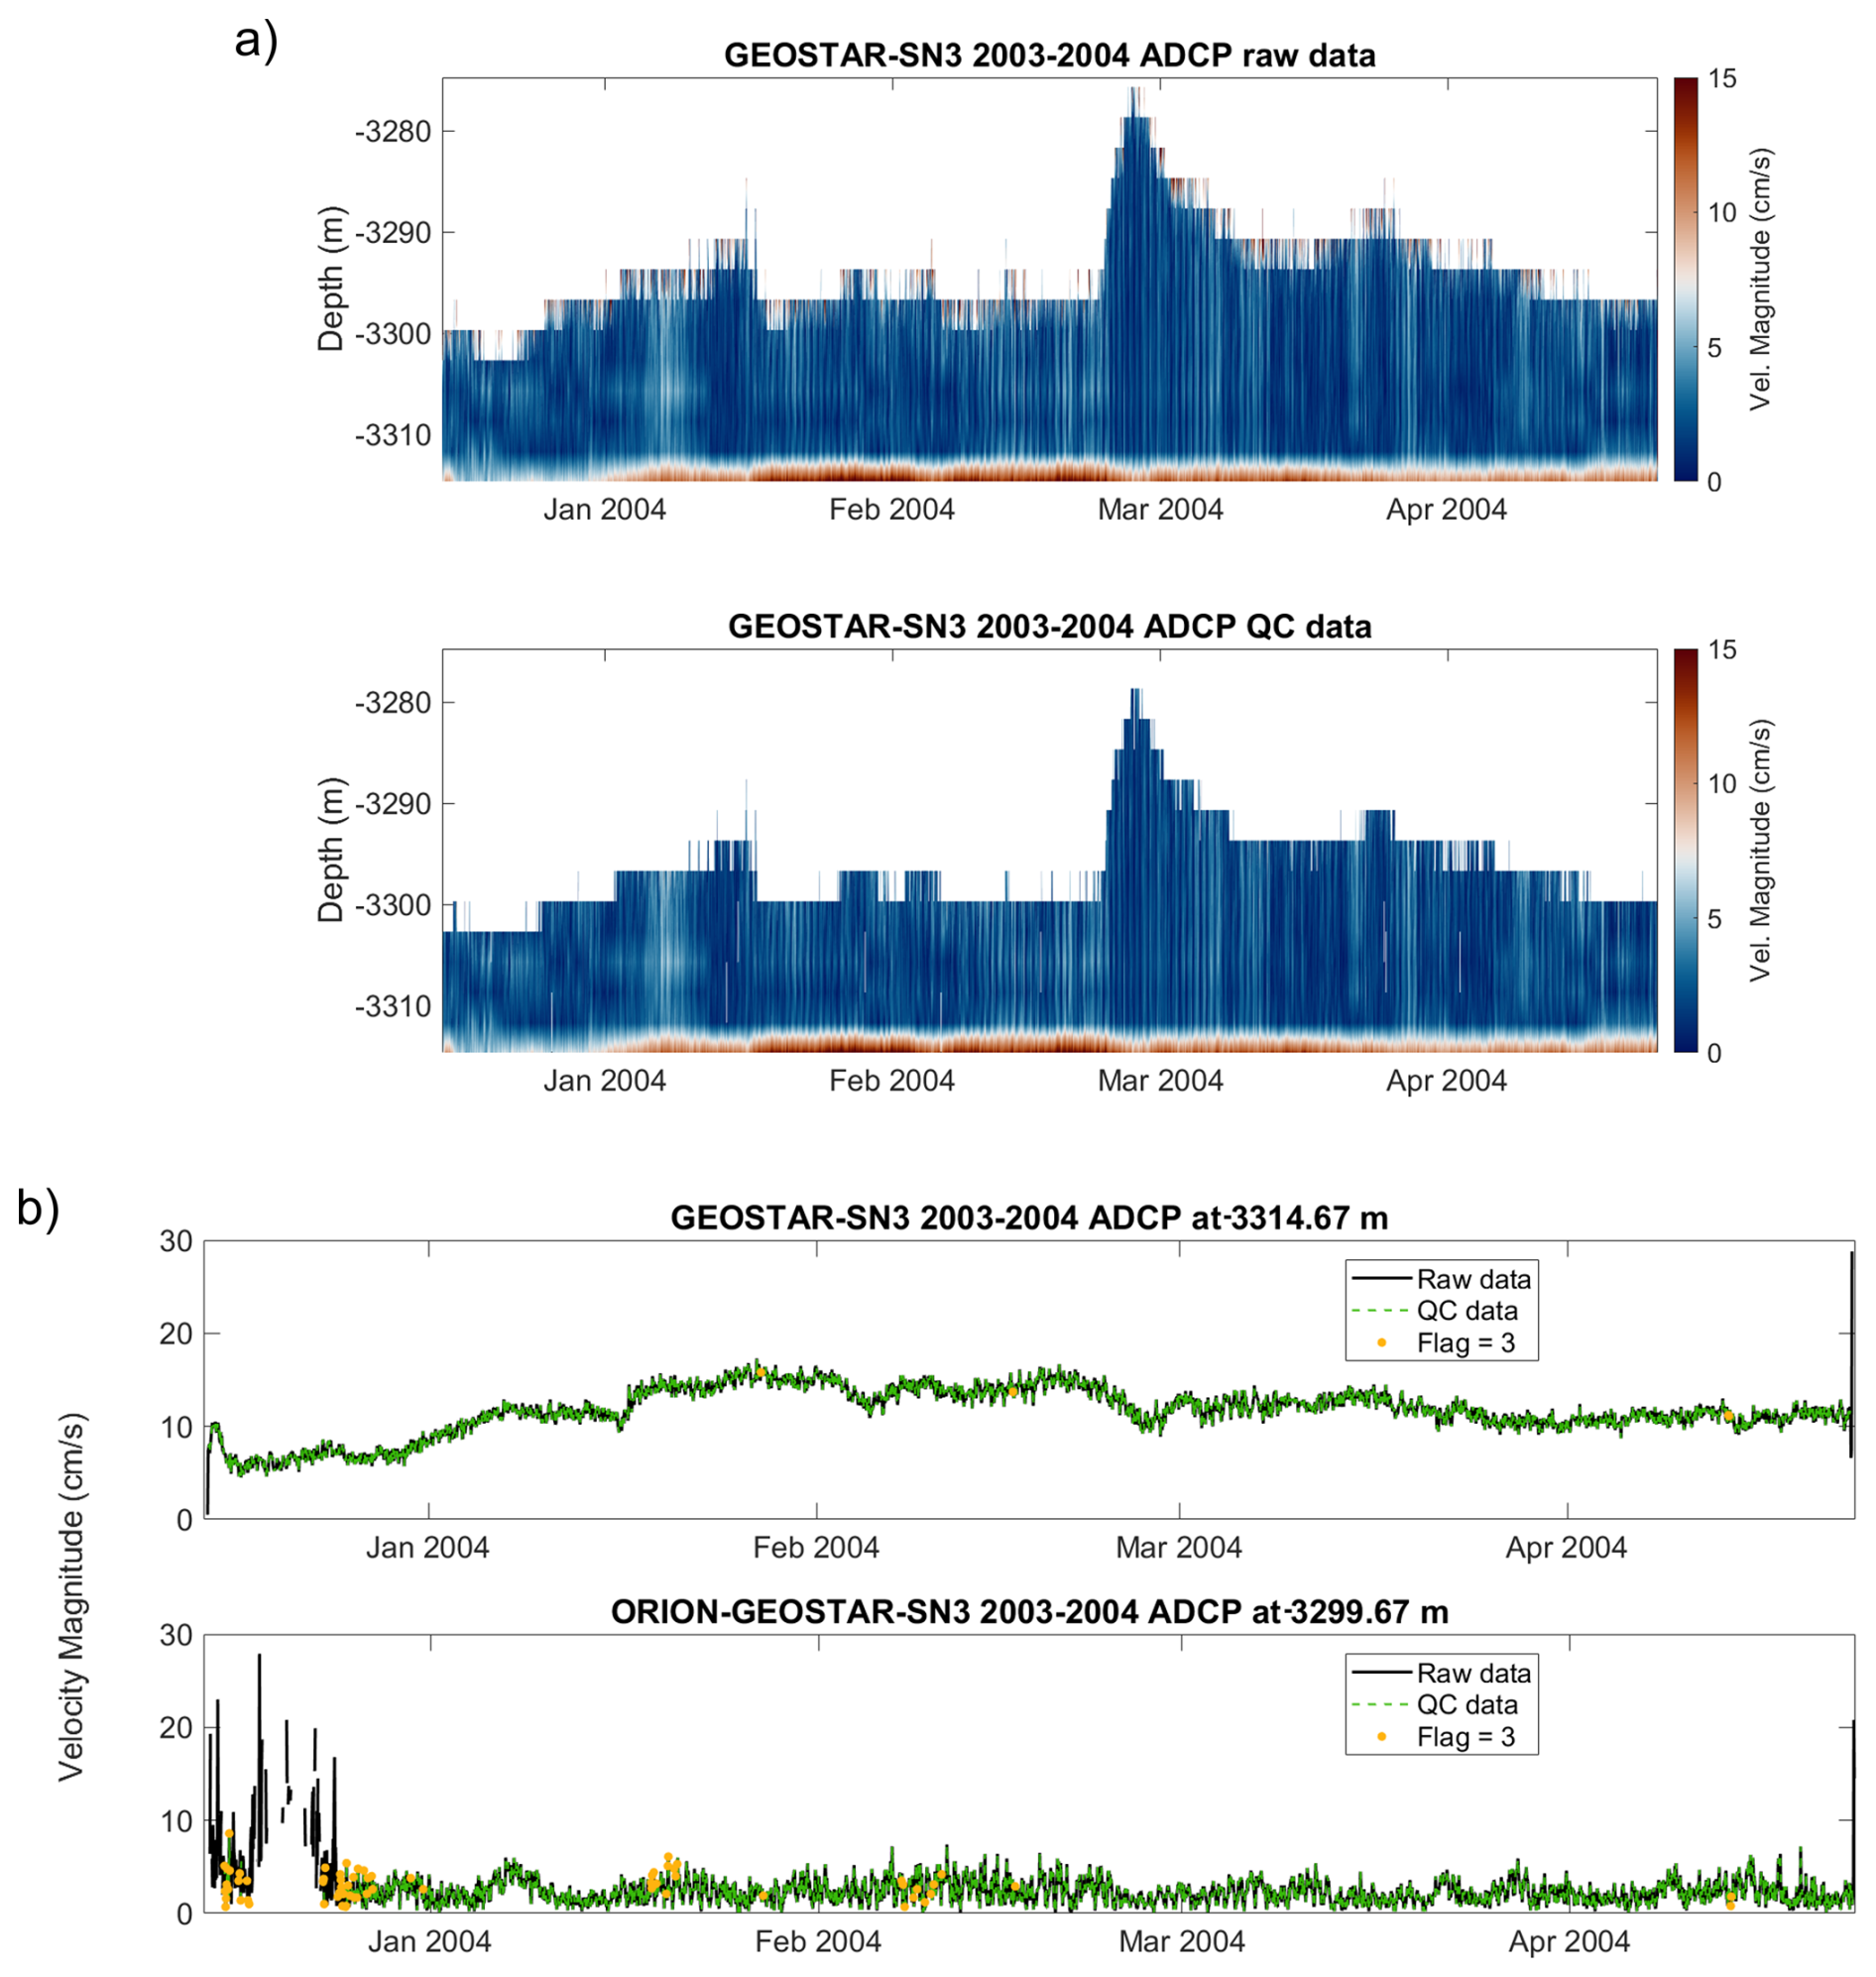
Figure 6Quality control of ADCP velocity magnitude data at GEOSTAR-SN3 (2003–2004). (a) Color map of current magnitude across depth: top panel = raw data; bottom = QC-checked. (b) Time series from two depth bins: range 5.33 m corresponding to −3314.67 m depth (on the top panel), and range 20.33 m corresponding to −3299.67 m (bottom panel). Black = raw data, green = quality-checked data, yellow = flagged.
This sensor measures indirectly current time series across various depth ranges, up to ∼ 20 m from the top of the observatory. Consequently, visual inspection of the raw dataset is more difficult to interpret, and noisy data is not immediately evident in the raw data, as can be seen in Fig. 6a. The two panels of Fig. 6a have been limited to a single month to better highlight the differences between the raw and the quality checked data, particularly in the upper ranges where the measurements are noisier due to greater signal dispersion. Figure 6b displays detailed data extracted from two different depths at 5.33 and 20.33 m above the sensor, highlighting more clearly the effects of the QC procedures. Each depth range is tested for ranges, spikes, outliers, flat lines, and tilt, like the other sensors. Additionally, the rate of change in the vertical direction, the percentage of data acquired using three or more beams, echo intensities to account for spurious ping interactions, and the velocity error range are also evaluated.
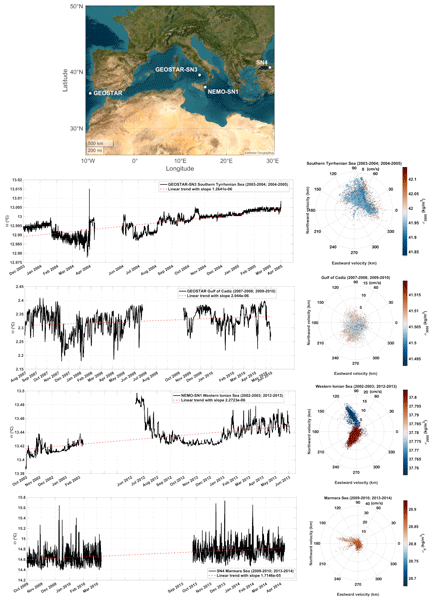
Although the acquired datasets pertain to several EOVs (Essential Ocean Variables), the results reported here primarily concern temperature data, intending to provide some benchmarks of the deep layer state over the last decade across the Mediterranean Sea, from the Sea of Marmara to the Cádiz area. After post-processing a QC validation routine has been performed, potential temperature (θ) and density anomaly (σ0,σ2000, and σ3000 calculated with reference pressure of 0, 2000 and 3000 dbar respectively) data derived following TEOS-10 international standards (https://teos-10.org/, last access: 8 July 2026), exhibit interesting variability at all sea-bottom sites monitored during these years (Fig. 7).
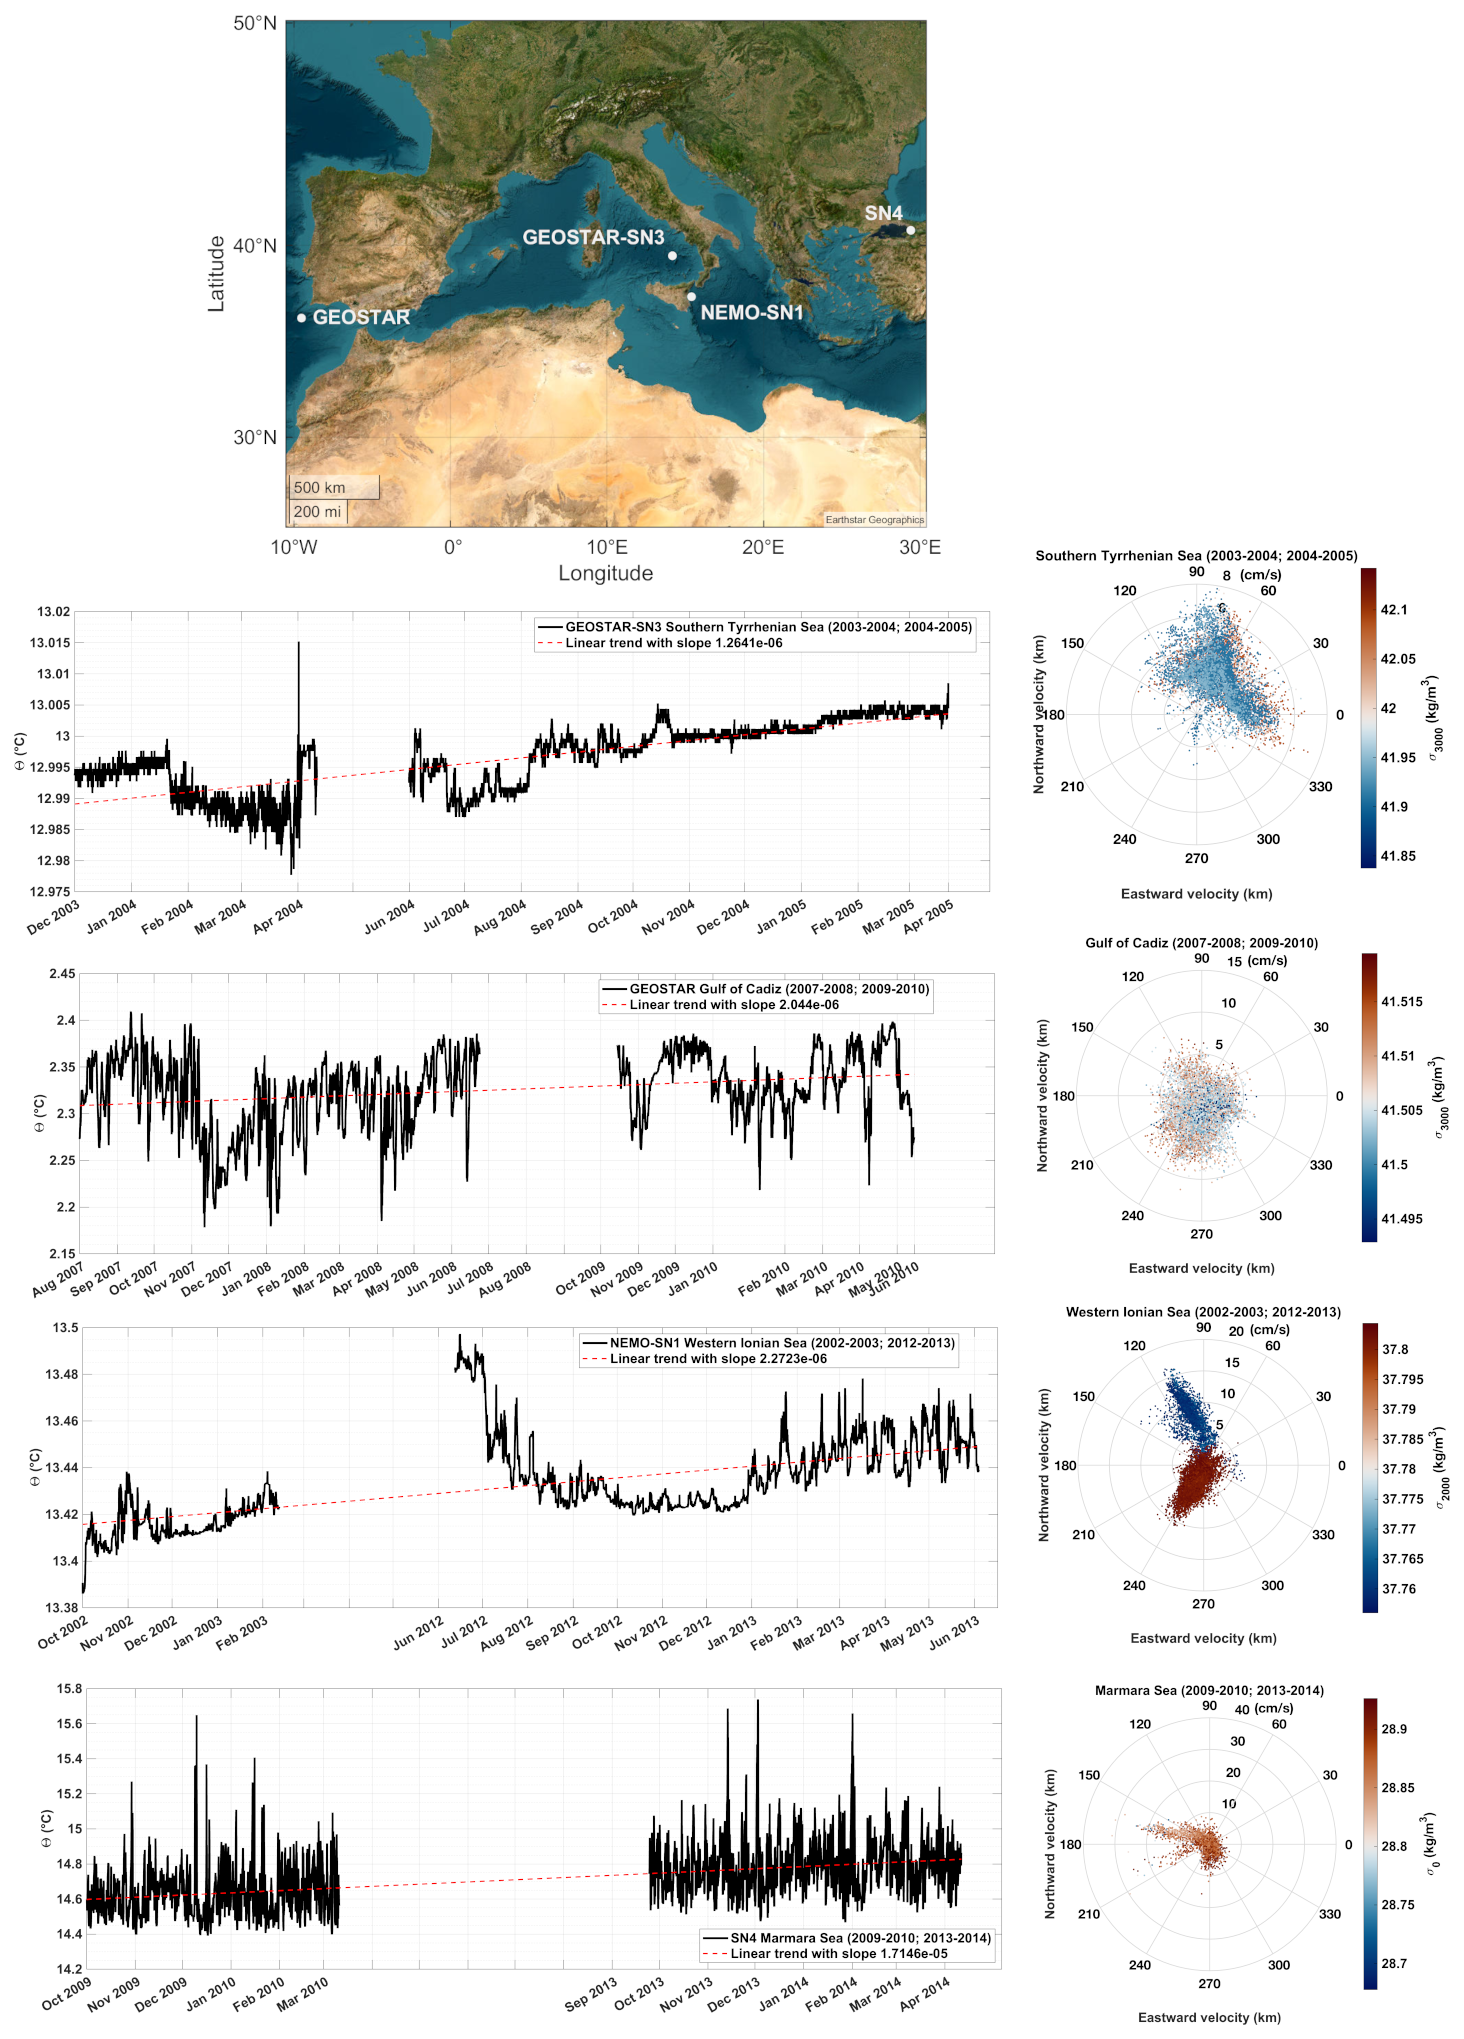
Figure 7Potential temperature time series and corresponding current hodographs, along with potential density anomalies (calculated relative to in situ pressure), reveal a warming trend and variability observed between 2001 and 2013 in the Tyrrhenian Sea (a), the Ionian Sea (b), the Marmara Sea (c), and the Gulf of Cádiz (d) across the Mediterranean region (Map generated using MATLAB R2024b and the Mapping Toolbox (MathWorks, USA); basemap attribution: © Earthstar Geographics).
While the available time series are relatively short for each site and might therefore reflect regional or decadal variability, all temperature trends measured between 2001 and 2013 at all deep layers are coherently positive and broadly consistent with the warming patterns reported in the literature (IPCC, 2013). Although the statistical weight varies among sites depending on the length of the observation period, the annual rate of temperature increase, calculated for all datasets using least-squares linear fits to hourly measurements, remains within the same order of magnitude, ranging from +0.011 °C yr−1 in the Tyrrhenian Sea to +0.018 °C yr−1 in the Gulf of Cadiz and +0.047 °C yr−1 in the Ionian Sea. The higher value observed in the Ionian Sea reflects the fact that it was derived from two time series collected a decade apart, providing observational evidence of a positive temperature tendency in the deep layer. The only exception is the Marmara Sea, where the rate is an order of magnitude higher (+0.15 °C yr−1), likely due to its shallower depth (166 m).
At all sites, temperature data reveal notable internal variability, but the recorded variations are not directly comparable as they result from differences in monitoring periods and local characteristics; therefore, they have to be assessed on a case-by-case basis. In the NEMO-SN1 case in the Ionian Sea, the variability observed over one decade does not represent a simple warming signal but also changes in deep-water mass properties and circulation patterns (Malanotte-Rizzoli et al., 1999; Hainbucher et al., 2006; Artale et al., 2018). This is evident looking at the current hodograph, also showing potential density anomaly (σ2000), where velocities are found to be oriented toward NW with a mean potential density anomaly of 37.86 kg m−3 on the period 2001–2002, while they are oriented toward SW with a mean potential density anomaly of 37.9 kg m−3 for the other period 2012–2013 (Fig. 7b). In ten years, it reveals a change of Δσ2= 0.05 kg m−3, which is four times bigger than the usual range of inter-annual variability expected at these depths in the Ionian bottom water (Hainbucher et al., 2006; Artale et al., 2018). Along with changes in thermohaline properties, the current hodograph for the Ionian Sea also reveals a clear shift in the direction of prevailing currents (Giambenedetti et al., 2024), offering a rare snapshot of water mass redistribution.
This shift may be attributed to the alternating advection of dense water masses that the Ionian basin receives from the Adriatic or Aegean Sea, which could sustain the better-known decadal reversals (BIOS) occurring in the upper-layer circulation (Gačić et al., 2010). This is an example of how the variability of the deep layer, generally assumed to be a stationary state environment, can instead feed internal processes impacting properties of the water masses and circulation dynamics.
Despite their scientific importance, deep-ocean time series remain sparse in both time and space. Therefore, developing techniques to handle data gaps and maximize the information content of existing records is essential. All-time series here reported contain missing data, with gap lengths varying according to maintenance needs, technological refurbishments, or ship availability. To address these discontinuities, a combination of Singular Spectrum Analysis (SSA) and Optimal Interpolation (OI) was applied to selected time-series (Fig. 8). Given the relatively short duration of the records and the presence of substantial gaps, a rigorous assessment of reconstruction accuracy is not feasible. The SSA/OI approach was therefore not intended to provide a quantitatively validated reconstruction, but rather to obtain a continuous time series suitable for estimating large-scale, low-frequency variability and associated trends.
SSA is a fully data-driven, nonparametric method particularly suitable for time series with relatively long and continuous gaps. It does not require a priori assumptions on a predefined model that might introduce artificial oscillations in the variability, although it still requires methodological choices (Ghil et al., 2002; Kondrashov and Ghil, 2006; Beckers and Rixen, 2003). The approach involves two main steps: (i) SSA extracts the dominant deterministic components, such as trends, seasonal and tidal oscillations, and low-frequency variability, providing a continuous background estimate across missing intervals; and (ii) OI is then applied to the detrended and SSA-backgrounded residuals, optimally merging observed data with the reconstructed background field based on their covariance structure.
This SSA–OI approach combines the signal reconstruction capability of SSA with the statistical optimality of OI, effectively filling both short and long gaps while preserving the realistic variance and autocorrelation structure of the original record. Missing segments were reconstructed by identifying and interpolating the dominant modes (6 mode) selected based on the fraction of explained variance, retaining the leading components that capture the associated physical oceanographic variability (Marullo et al., 2011). This approach aims to maintain the temporal coherence and dynamical consistency of the reconstructed time series. Beyond data reconstruction, this approach enhances the performance of subsequent analyses, such as Power Spectral Density (PSD) estimation.
Figure 8 presents the reconstructed temperature time series (left part), and their corresponding power spectra (right part). The comparison between the time-domain and frequency-domain representations helps to interpret the nature of the observed variability.
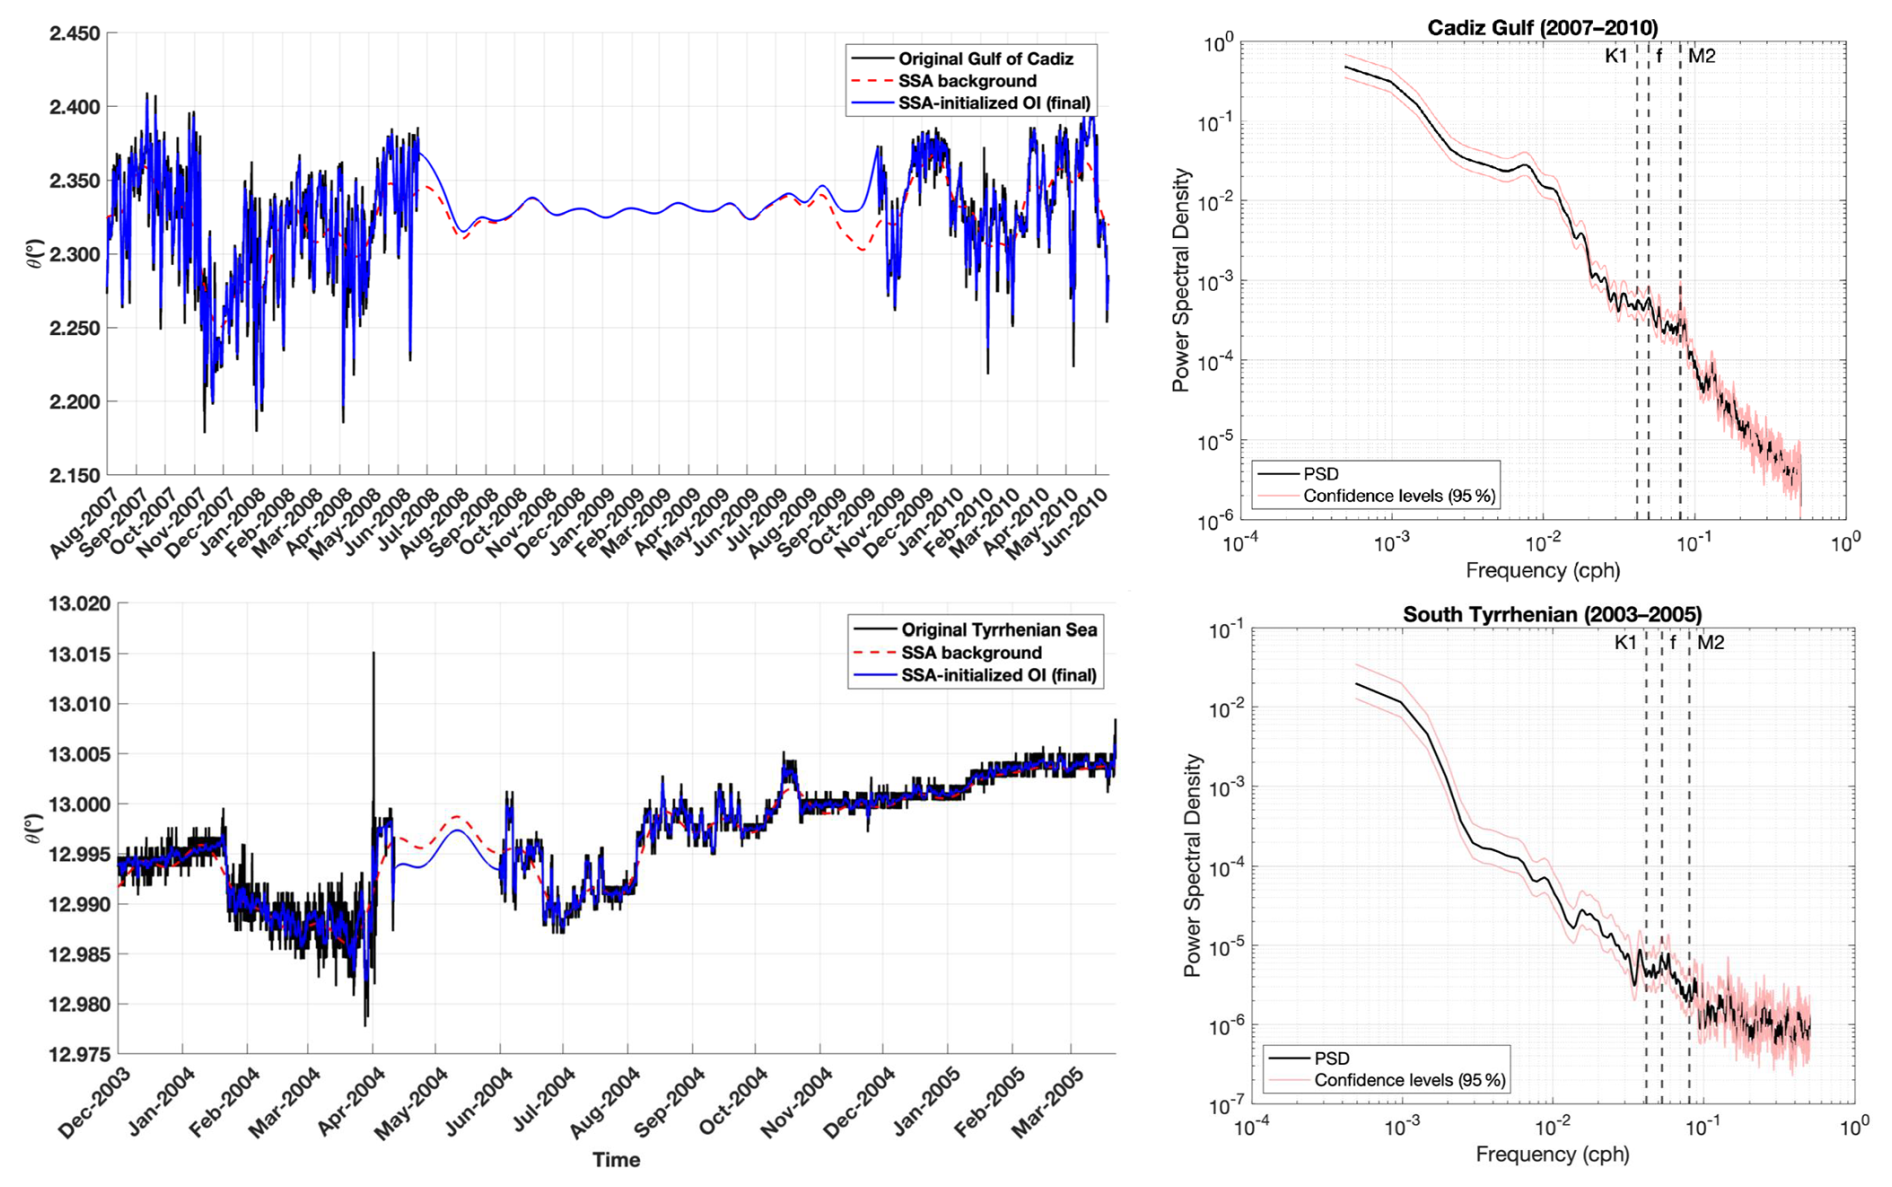
Figure 8Time series from the Gulf of Cádiz (upper left) and the Tyrrhenian Sea (lower left) showing original data with gaps (black), SSA-based background estimation (red dashed line), and the reconstructed signal (blue line). Corresponding spectra (upper and lower right) highlight dominant low-frequency energy, indicating slow, persistent variability associated with long-term warming recorded.
In both sites, the reconstructed series exhibit a gradual low-frequency warming signal, which is reflected in the spectra by the concentration of variance at low frequencies, consistent with slow and persistent deep-water changes. The spectral estimates are further supported by the 95 % confidence limits, within which the main spectral features are contained. In addition, peaks are visible near the K1 (lunisolar diurnal) and M2 (lunar semidiurnal) tidal frequencies, and near the local inertial frequency f, generated by the Coriolis effect. These higher-frequency components, although weaker than the low-frequency signal, indicate that tidal and inertial dynamics remain active in the deep ocean and may influence the redistribution of heat.
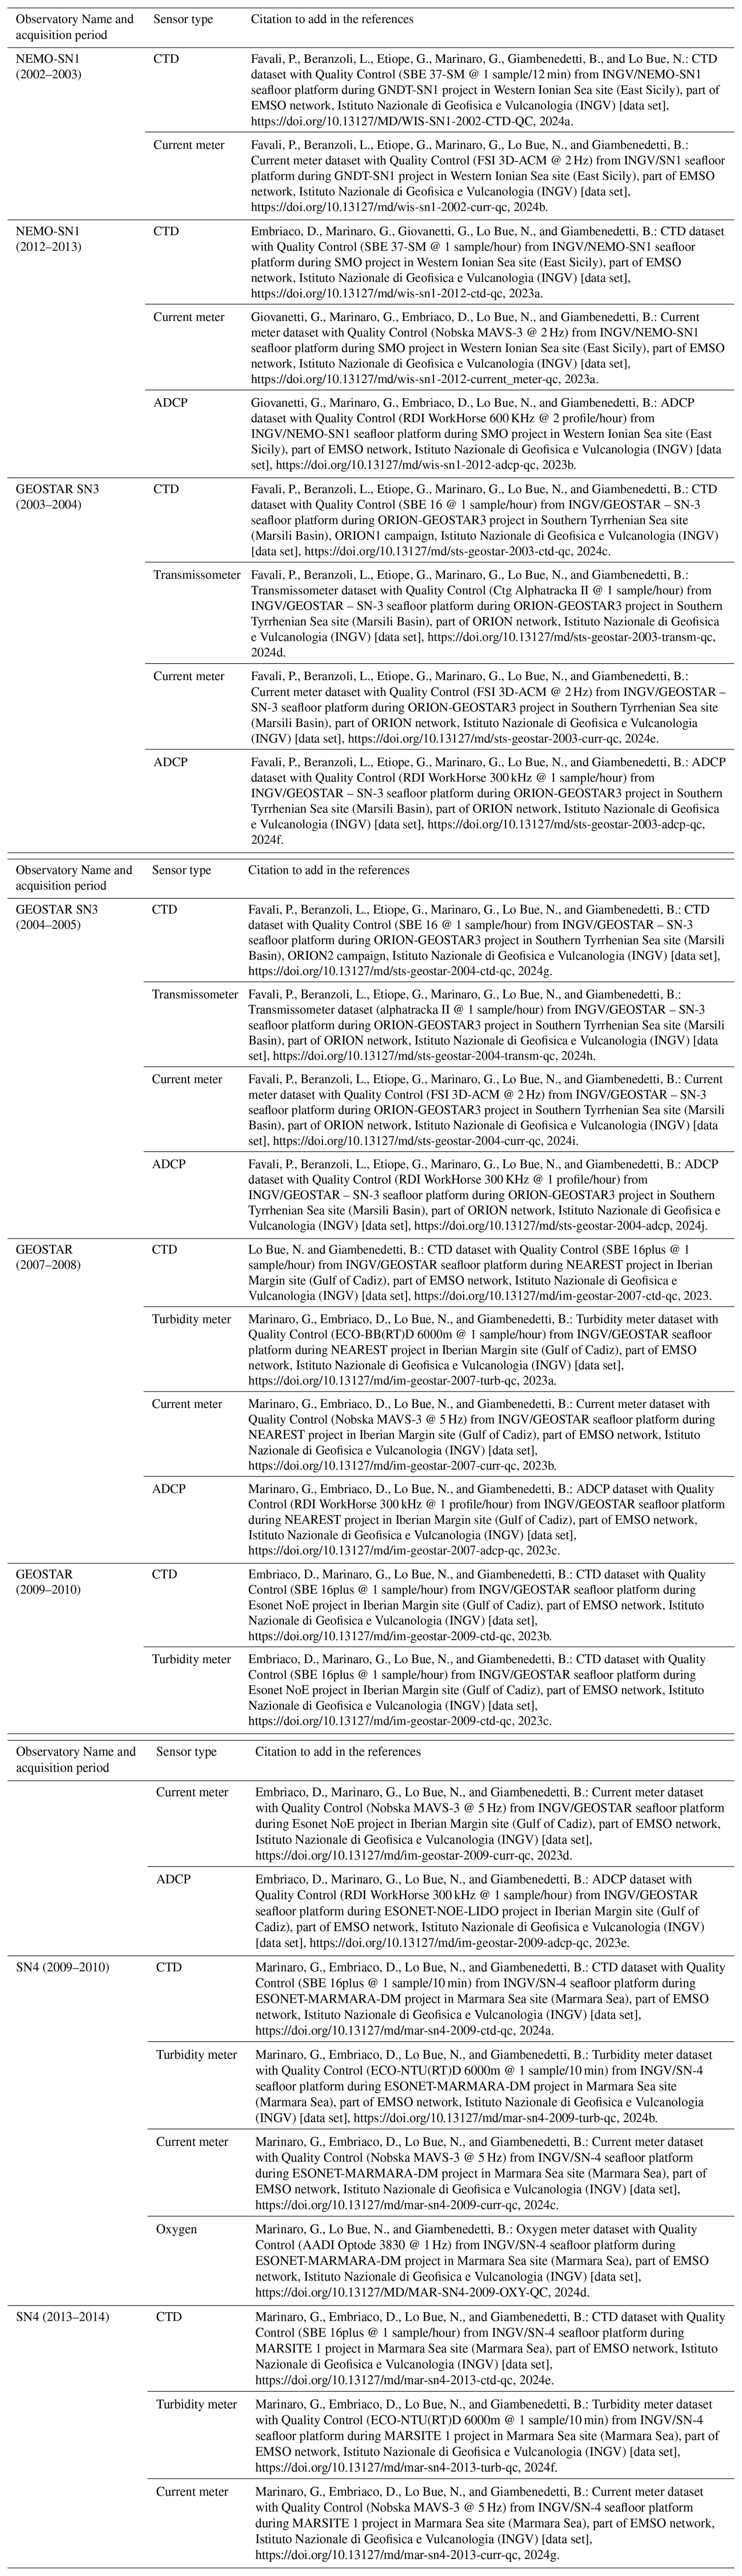
The datasets described in this study can be accessed through the Multidisciplinary Oceanic Information SysTem (MOIST, https://doi.org/10.13127/MD/MOIST, Azzarone et al., 2010) and via the INGV ERDDAP server (http://oceano.bo.ingv.it/erddap/index.html, last access: 8 July 2026) (Table A1 provides the complete references for each dataset). Data and metadata have been formatted into NetCDF (Network Common Data Form) and comply with Climate and Forecasting (CF) metadata conventions. These specifications are also aligned with OceanSITES and SeaDataNet vocabularies, ensuring semantic clarity, long-term interoperability, and machine-readability. Domain-specific metadata attributes are harmonized using the NERC Vocabulary Server (NVS), which provides authoritative controlled vocabularies for parameter descriptions, units, and semantic consistency across datasets. Organizational identifiers follow the European Directory of Marine Organisations (EDMO) and the Research Organization Registry (ROR), and SPDX is used for licensing. In line with the INGV Data Policy, all datasets are released under a Creative Commons Attribution 4.0 International License (CC BY 4.0), allowing free use with appropriate citation. To be fully compliant with FAIR principles, each dataset is registered and assigned a Digital Object Identifier (DOI) through the INGV Data Registry (https://data.ingv.it/, last access: 8 July 2026), acknowledging the efforts of those who contributed to generating the data and products and assuring data availability in further scientific publications. Multiple datasets are available, each corresponding to a specific observatory and mission. A comprehensive summary, including DOIs and citation formats, is available on the MOIST portal for each dataset.
The implementation of harmonized post-processing and quality control (QC) procedures for deep-sea data is a key step toward expanding the availability of reliable, high-quality oceanographic observations from the least sampled regions of the global ocean. Standardizing these methods ensures data consistency and facilitates the effective use and sharing of information essential to understanding deep-sea variability, still among the most poorly characterized components of the climate system. Beyond data collection, the analytical approaches presented in this study provide a framework for investigating the temporal variability of oceanographic records and identifying dominant modes of variability across a range of time scales. Furthermore, the reconstruction of longer and more continuous records can facilitate spectral estimates by reducing data gaps and improving the characterization of periodic signals, thereby supporting a more comprehensive interpretation of the frequencies associated with the observed oceanographic processes.
Strengthening and extending the deep-ocean observational network, particularly in under-sampled regions, remains essential to improve both regional process understanding and global climate modelling. By promoting open access and adherence to FAIR data principles, this effort contributes to the goals of the UN Decade of Ocean Science, supporting the development of a more integrated, sustainable, and climate-relevant deep-ocean observing framework.
Table A1Summary of all datasets discussed in the paper, including their DOIs and corresponding citations.
Concept development and manuscript writing were carried out by NLB and BG, with input from all co-authors. Measurements were performed by NLB and GM. Data processing and analysis were conducted by NLB and BG, while data curation was handled by BG, DE, PB, CF, and RV. All authors have read and approved the final version of the manuscript.
The contact author has declared that none of the authors has any competing interests.
Publisher's note: Copernicus Publications remains neutral with regard to jurisdictional claims made in the text, published maps, institutional affiliations, or any other geographical representation in this paper. The authors bear the ultimate responsibility for providing appropriate place names. Views expressed in the text are those of the authors and do not necessarily reflect the views of the publisher.
We wish to express our gratitude to all those who, over the past 30 years, have contributed to the development of deep-sea observatory technology, from the preparation and management of several EC projects that enabled their creation, to their design, construction, and deployment at sea. This achievement was made possible through the combined efforts of numerous researchers, engineers, and technicians, all united by a shared spirit of experimentation and scientific curiosity.
This study was developed and financially supported within the framework of the INGV departmental project MACMAP.
This paper was edited by François G. Schmitt and reviewed by two anonymous referees.
Alves, J. M. R., Carton, X., and Ambar, I.: Hydrological structure, circulation and water mass transport in the Gulf of Cadiz, Int. J. Geosci., 2, 432–456, https://doi.org/10.4236/ijg.2011.24047, 2011.
Artale, V., Falcini, F., Marullo, S. Bensi, M., Kokoszka, F., Iudicone, D., and Rubino, A.: Linking mixing processes and climate variability to the heat content distribution of the Eastern Mediterranean abyss, Sci. Rep., 8, 11317, https://doi.org/10.1038/s41598-018-29343-4, 2018.
Azzarone, A., Marcucci, N. M., and Marinaro, G.: Multidisciplinary Oceanic Information SysTem (MOIST), Istituto Nazionale di Geofisica e Vulcanologia (INGV) [data set], https://doi.org/10.13127/MD/MOIST, 2010.
Beckers, J. M. and Rixen, M.: EOF calculations and data filling from incomplete oceanographic datasets, J. Atmos. Ocean. Tech., 20, 1839–1856, https://doi.org/10.1175/1520-0426(2003)020<1839:ECADFF>2.0.CO;2, 2003.
Beranzoli, L., De Santis, A., Etiope, G., Favali, P., Frugoni, F., Smriglio, G., Gasparoni, F., and Marigo, A.: GEOSTAR: a geophysical and oceanographic station for abyssal research, Phys. Earth Planet. In., 108, 175–183, https://doi.org/10.1016/S0031-9201(98)00094-6, 1998.
Beranzoli, L., De Santis, A., Calcara, M., Ciafardini, A., De Caro, M., Favali, P., Frugoni, F., Iafolla, V., Lo Bue, N., Marinaro, G., Monna, S., Montuori, C., Qamili, E., Sgroi, T., and Vitale, S.: Multiparametric seafloor exploration: the Marsili Basin and volcanic seamount case (Tyrrhenian Sea, Italy), in: Proc. 3rd IASME/WSEAS Int. Conf. Geology and Seismology (GES'09), WSEAS Press, https://doi.org/10.1007/978-3-642-11374-1, 2009.
Budillon, G., Lo Bue, N., Siena, G., and Spezie, G.: Hydrographic characteristics of water masses and circulation in the Northern Ionian Sea, Deep-Sea Res. Pt. II, 57, 441–457, https://doi.org/10.1016/j.dsr2.2009.08.017, 2010.
Bushnell, M., Waldmann, C., Seitz, S., Buckley, E., Tamburri, M., Hermes, J., Henslop, E., and Lara-Lopez, A.: Quality assurance of oceanographic observations: standards and guidance adopted by an international partnership, Front. Mar. Sci., 6, 706, https://doi.org/10.3389/fmars.2019.00706, 2019.
Chiggiato, J., Artale, V., Durrieu de Madron, X., Schroeder, K., Taupier-Letage, I., Velaoras, D., and Vargas-Yáñez, M.: Chapter 9 – Recent changes in the Mediterranean Sea, in: Oceanography of the Mediterranean Sea, edited by: Schroeder, K., and Chiggiato, J., Elsevier, 2023, 289–334, ISBN 9780128236925, https://doi.org/10.1016/B978-0-12-823692-5.00008-X, 2023.
de Lavergne, C., Madec, G., Capet, X., Maze, G., and Roquet, F.: Getting to the bottom of the ocean, Nat. Geosci., 9, 857–858, https://doi.org/10.1038/ngeo2850, 2016.
Desbruyères, D. G., Purkey, S. G., McDonagh, E. L., Johnson, G. C., and King, B. A.: Deep and abyssal ocean warming from 35 years of repeat hydrography, Geophys. Res. Lett., 43, 10356–10365, https://doi.org/10.1002/2016GL070413, 2016.
Embriaco, D., Marinaro, G., Frugoni, F., Monna, S., Etiope, G., Gasperini, L., Polonia, A., Del Bianco, F., Catagay, M. N., Ulgen, U. B., and Favali, P.: Monitoring of gas and seismic energy release along the North Anatolian Fault (Sea of Marmara, NW Turkey), Geophys. J. Int., 196, 850–866, 2014.
Embriaco, D., Marinaro, G., Giovanetti, G., Lo Bue, N., and Giambenedetti, B.: CTD dataset with Quality Control (SBE 37-SM @ 1 sample/hour) from INGV/NEMO-SN1 seafloor platform during SMO project in Western Ionian Sea site (East Sicily), part of EMSO network, Istituto Nazionale di Geofisica e Vulcanologia (INGV) [data set], https://doi.org/10.13127/md/wis-sn1-2012-ctd-qc, 2023a.
Embriaco, D., Marinaro, G., Lo Bue, N., and Giambenedetti, B.: CTD dataset with Quality Control (SBE 16plus @ 1 sample/hour) from INGV/GEOSTAR seafloor platform during Esonet NoE project in Iberian Margin site (Gulf of Cadiz), part of EMSO network, Istituto Nazionale di Geofisica e Vulcanologia (INGV) [data set], https://doi.org/10.13127/md/im-geostar-2009-ctd-qc, 2023b.
Embriaco, D., Marinaro, G., Lo Bue, N., and Giambenedetti, B.: CTD dataset with Quality Control (SBE 16plus @ 1 sample/hour) from INGV/GEOSTAR seafloor platform during Esonet NoE project in Iberian Margin site (Gulf of Cadiz), part of EMSO network, Istituto Nazionale di Geofisica e Vulcanologia (INGV) [data set], https://doi.org/10.13127/md/im-geostar-2009-ctd-qc, 2023c.
Embriaco, D., Marinaro, G., Lo Bue, N., and Giambenedetti, B.: Current meter dataset with Quality Control (Nobska MAVS-3 @ 5 Hz) from INGV/GEOSTAR seafloor platform during Esonet NoE project in Iberian Margin site (Gulf of Cadiz), part of EMSO network, Istituto Nazionale di Geofisica e Vulcanologia (INGV) [data set], https://doi.org/10.13127/md/im-geostar-2009-curr-qc, 2023d.
Embriaco, D., Marinaro, G., Lo Bue, N., and Giambenedetti, B.: ADCP dataset with Quality Control (RDI WorkHorse 300 kHz @ 1 sample/hour) from INGV/GEOSTAR seafloor platform during ESONET-NOE-LIDO project in Iberian Margin site (Gulf of Cadiz), part of EMSO network, Istituto Nazionale di Geofisica e Vulcanologia (INGV) [data set], https://doi.org/10.13127/md/im-geostar-2009-adcp-qc, 2023e.
EuroGOOS: Recommendations for Real-Time Quality Control of In-Situ Oceanographic Data, European Global Ocean Observing System, Belgium, https://coilink.org/20.500.12592/wx77h1 (last access: 7 July 2026), 2011.
Favali, P., Beranzoli, L., D'Anna, G., Gasparoni, F., and Gerber, H. W.: NEMO-SN-1: the first real-time seafloor observatory of ESONET, Nucl. Instrum. Meth. A, 567, 462–467, 2006.
Favali, P., Beranzoli, L., D'Anna, G., Gasparoni, F., Marvaldi, J., Clauss, G., Gerber, H. W., Nicot, M., Marani, M. P., and Gamberi, F.: A fleet of multiparameter observatories for geophysical and environmental monitoring at seafloor, Ann. Geophys., 49, https://doi.org/10.4401/ag-3126, 2009.
Favali, P., Beranzoli, L., Italiano, F., Migneco, E., Musumeci, M., and Papaleo, R.: NEMO-SN1 developments in view of the EMSO and KM3Net infrastructures, Nucl. Instrum. Meth. A, 626–627, S53–S56, 2011.
Favali, P., Chierici, F., Marinaro, G., Giovanetti, G., Azzarone, A., Beranzoli, L., De Santis, A., Embriaco, D., Monna, S., Lo Bue, N., Sgroi, T., Cianchini, G., Badiali, L., Qamili, E., De Caro, M.G., Falcone, G., Montuori, C., Frugoni, F., Riccobene, G., and Pavan, G.: NEMO-SN1 cabled observatory in the Western Ionian Sea, IEEE J. Oceanic Eng., 38, 358–374, 2013.
Favali, P., Beranzoli, L., Etiope, G., Marinaro, G., Giambenedetti, B., and Lo Bue, N.: CTD dataset with Quality Control (SBE 37-SM @ 1 sample/12 min) from INGV/NEMO-SN1 seafloor platform during GNDT-SN1 project in Western Ionian Sea site (East Sicily), part of EMSO network, Istituto Nazionale di Geofisica e Vulcanologia (INGV) [data set], https://doi.org/10.13127/MD/WIS-SN1-2002-CTD-QC, 2024a.
Favali, P., Beranzoli, L., Etiope, G., Marinaro, G., Lo Bue, N., and Giambenedetti, B.: Current meter dataset with Quality Control (FSI 3D-ACM @ 2 Hz) from INGV/SN1 seafloor platform during GNDT-SN1 project in Western Ionian Sea site (East Sicily), part of EMSO network, Istituto Nazionale di Geofisica e Vulcanologia (INGV) [data set], https://doi.org/10.13127/md/wis-sn1-2002-curr-qc, 2024b.
Favali, P., Beranzoli, L., Etiope, G., Marinaro, G., Lo Bue, N., and Giambenedetti, B.: CTD dataset with Quality Control (SBE 16 @ 1 sample/hour) from INGV/GEOSTAR – SN-3 seafloor platform during ORION-GEOSTAR3 project in Southern Tyrrhenian Sea site (Marsili Basin), ORION1 campaign, Istituto Nazionale di Geofisica e Vulcanologia (INGV) [data set], https://doi.org/10.13127/md/sts-geostar-2003-ctd-qc, 2024c.
Favali, P., Beranzoli, L., Etiope, G., Marinaro, G., Lo Bue, N., and Giambenedetti, B.: Transmissometer dataset with Quality Control (Ctg Alphatracka II @ 1 sample/hour) from INGV/GEOSTAR – SN-3 seafloor platform during ORION-GEOSTAR3 project in Southern Tyrrhenian Sea site (Marsili Basin), part of ORION network, Istituto Nazionale di Geofisica e Vulcanologia (INGV) [data set], https://doi.org/10.13127/md/sts-geostar-2003-transm-qc, 2024d.
Favali, P., Beranzoli, L., Etiope, G., Marinaro, G., Lo Bue, N., and Giambenedetti, B.: Current meter dataset with Quality Control (FSI 3D-ACM @ 2 Hz) from INGV/GEOSTAR – SN-3 seafloor platform during ORION-GEOSTAR3 project in Southern Tyrrhenian Sea site (Marsili Basin), part of ORION network, Istituto Nazionale di Geofisica e Vulcanologia (INGV) [data set], https://doi.org/10.13127/md/sts-geostar-2003-curr-qc, 2024e.
Favali, P., Beranzoli, L., Etiope, G., Marinaro, G., Lo Bue, N., and Giambenedetti, B.: ADCP dataset with Quality Control (RDI WorkHorse 300 kHz @ 1 sample/hour) from INGV/GEOSTAR – SN-3 seafloor platform during ORION-GEOSTAR3 project in Southern Tyrrhenian Sea site (Marsili Basin), part of ORION network, Istituto Nazionale di Geofisica e Vulcanologia (INGV) [data set], https://doi.org/10.13127/md/sts-geostar-2003-adcp-qc, 2024f.
Favali, P., Beranzoli, L., Etiope, G., Marinaro, G., Lo Bue, N., and Giambenedetti, B.: CTD dataset with Quality Control (SBE 16 @ 1 sample/hour) from INGV/GEOSTAR – SN-3 seafloor platform during ORION-GEOSTAR3 project in Southern Tyrrhenian Sea site (Marsili Basin), ORION2 campaign, Istituto Nazionale di Geofisica e Vulcanologia (INGV) [data set], https://doi.org/10.13127/md/sts-geostar-2004-ctd-qc, 2024g.
Favali, P., Beranzoli, L., Etiope, G., Marinaro, G., Lo Bue, N., and Giambenedetti, B.: Transmissometer dataset (alphatracka II @ 1 sample/hour) from INGV/GEOSTAR – SN-3 seafloor platform during ORION-GEOSTAR3 project in Southern Tyrrhenian Sea site (Marsili Basin), part of ORION network, Istituto Nazionale di Geofisica e Vulcanologia (INGV) [data set], https://doi.org/10.13127/md/sts-geostar-2004-transm-qc, 2024h.
Favali, P., Beranzoli, L., Etiope, G., Marinaro, G., Lo Bue, N., and Giambenedetti, B.: Current meter dataset with Quality Control (FSI 3D-ACM @ 2 Hz) from INGV/GEOSTAR – SN-3 seafloor platform during ORION-GEOSTAR3 project in Southern Tyrrhenian Sea site (Marsili Basin), part of ORION network, Istituto Nazionale di Geofisica e Vulcanologia (INGV) [data set], https://doi.org/10.13127/md/sts-geostar-2004-curr-qc, 2024i.
Favali, P., Beranzoli, L., Etiope, G., Marinaro, G., Lo Bue, N., and Giambenedetti, B.: ADCP dataset with Quality Control (RDI WorkHorse 300 KHz @ 1 profile/hour) from INGV/GEOSTAR – SN-3 seafloor platform during ORION-GEOSTAR3 project in Southern Tyrrhenian Sea site (Marsili Basin), part of ORION network, Istituto Nazionale di Geofisica e Vulcanologia (INGV) [data set], https://doi.org/10.13127/md/sts-geostar-2004-adcp, 2024j.
Ferrari, R., Mashayek, A., McDougall, T. J., Nikurashin, M., and Campin, J.-M.: Turning ocean mixing upside down, J. Phys. Oceanogr., 46, 2239–2261, https://doi.org/10.1175/JPO-D-15-0244.1, 2016.
Fuda, J.-L., Font, J., García Lafuente, J., Gasparini, G. P., Millot, C., Astraldi, M., Ben Ismail, S., Bertin, V.,, Emelianov, M., Escoffier, S., Manca, B., Raimbault, P., Rougier, G., Salat, J., Sammari, C., Tamburini, C. , Tber, Y., Tesi, E., and Vargas, M.: Hydrochanges: first results and perspectives, Rapp. Comm. Int. Médit., 38, p. 27, https://ciesm.org/marine/programs/Fuda_et_al_2007.pdf (last access: 8 July 2026), 2007.
Fusi, M., Rigaud, S., Guadagnin, G., Barausse, A., Marasco, R., Daffonchio, D., Régis, J., Huchet, L., Camin, C., Pettit, L., Vina-Herbon, C., and Giomi, F.: Ideas and perspectives: The fluctuating nature of oxygen shapes the ecology of aquatic habitats and their biogeochemical cycles – the aquatic oxyscape, Biogeosciences, 20, 3509–3521, https://doi.org/10.5194/bg-20-3509-2023, 2023.
Gačić, M., Borzelli, G. E., Civitarese, G., Cardin, V., and Yari, S.: Can internal processes sustain reversals of ocean upper circulation? The Ionian Sea example, Geophys. Res. Lett., 37, L09608, https://doi.org/10.1029/2010GL043216, 2010.
García-Lafuente, J., Delgado, J., Criado-Aldeanueva, F., Bruno, M., del Rio, J., and Vargas J. M.: Water mass circulation on the continental shelf of the Gulf of Cádiz, Deep-Sea Res. Pt. II, 53, 1182–1197, https://doi.org/10.1016/j.dsr2.2006.04.011, 2006.
Ghil, M., Allen, M. R., Dettinger, M. D., Ide, K., Kondrashov, D., Mann, M. E., Robertson, A. W., Saunders, A., Tian, Y., Varadi, F., and Yiou, P.: Advanced spectral methods for climatic time series, Rev. Geophys., 40, 1003, https://doi.org/10.1029/2000RG000092, 2002.
Giambenedetti, B., Lo Bue, N., and Artale, V.: Study of the role of abyssal ocean stratification in the rearrangement of potential vorticity through the water column, Ocean Sci., 20, 1209–1228, https://doi.org/10.5194/os-20-1209-2024, 2024.
Giovanetti, G., Monna, S., Lo Bue, N., Embriaco, D., Frugoni, F., Marinaro, G., De Caro, M., Sgroi, T., Montuori, C., De Santis, A., Cianchini, G., Beranzoli, L., and Favali, P.: Observing volcanoes from the seafloor in the central Mediterranean area, Remote Sens., 8, 298, https://doi.org/10.3390/rs8040298, 2016.
Giovanetti, G., Marinaro, G., Embriaco, D., Lo Bue, N., and Giambenedetti, B.: Current meter dataset with Quality Control (Nobska MAVS-3 @ 2 Hz) from INGV/NEMO-SN1 seafloor platform during SMO project in Western Ionian Sea site (East Sicily), part of EMSO network, Istituto Nazionale di Geofisica e Vulcanologia (INGV) [data set], https://doi.org/10.13127/md/wis-sn1-2012-current_meter-qc, 2023a.
Giovanetti, G., Marinaro, G., Embriaco, D., Lo Bue, N., and Giambenedetti, B.: ADCP dataset with Quality Control (RDI WorkHorse 600 KHz @ 2 profile/hour) from INGV/NEMO-SN1 seafloor platform during SMO project in Western Ionian Sea site (East Sicily), part of EMSO network, Istituto Nazionale di Geofisica e Vulcanologia (INGV) [data set], https://doi.org/10.13127/md/wis-sn1-2012-adcp-qc, 2023b.
Hainbucher, D., Rubino, A., and Klein, B.: Water mass characteristics in the deep layers of the western Ionian Basin, Geophys. Res. Lett., 33, L05608, https://doi.org/10.1029/2005GL025318, 2006.
Heuzé, C., Purkey, S. G., and Johnson, G. C.: It is high time we monitor the deep ocean, Environ. Res. Lett., 17, 121002, https://doi.org/10.1088/1748-9326/aca622, 2022.
Howell, K. L., Hilário, A., Allcock, A. L., Bailey, D., Baker, M., Clark, M. R., Colaço, A., Copley, J., Cordes, E. E., Davovaro, R., Dissanayake, A., Escobar, E., Esquete, P., Gallagher, A. J., Gates, A. R., Gaudron, S. M., German, C. R., Gjerde, K. M., Higgs, N. D., Le Bris, N., Levin, L. A., Manea, E., McClain, C., Menot, L., Mestre, N. C., Metaxas, A., Milligan, R., Muthumbi, A. W. N., Narayanaswamy, B. E., Ramalho, S. P., Ramirez-Llodra, E., Robson, L. M., Rogers, A. D., Sellanes, J., Sigwart, J. D., Sink, K., Snelgrove, P. V. R., Stefanoudis, P. V., Sumida, P. Y., Taylor, M. L., Thurber, A. R., Vieira, R., Watanabe, H. K., Woodall, L. C., and Xavier, J. R.: A decade to study deep-sea life, Nat. Ecol. Evol., 5, 265–267, https://doi.org/10.1038/s41559-020-01352-5, 2021.
IOC, SCOR, and IAPSO: The international thermodynamic equation of seawater – 2010, Manuals and Guides, 56, 196 pp., https://www.teos-10.org/pubs/TEOS-10_Manual.pdf (last access: 8 July 2026), 2010.
IPCC: Climate Change 2013: The Physical Science Basis. Contribution of Working Group I to the Fifth Assessment Report of the Intergovernmental Panel on Climate Change, edited by: Stocker, T. F., Qin, D., Plattner, G.-K., Tignor, M., Allen, S. K., Boschung, J., Nauels, A., Xia, Y., Bex, V., and Midgley, P. M., Cambridge University Press, Cambridge, United Kingdom and New York, NY, USA, 1535 pp., https://www.ipcc.ch/report/ar5/wg1/ (last access: 8 July 2026), 2013.
Kondrashov, D. and Ghil, M.: Spatio-temporal filling of missing points in geophysical data sets, Nonlin. Processes Geophys., 13, 151–159, https://doi.org/10.5194/npg-13-151-2006, 2006.
Lascaratos, A., Roether, W., Nittis, K., and Klein, B.: Recent changes in deep water formation and spreading in the eastern Mediterranean Sea, Prog. Oceanogr., 44, 5–36, https://doi.org/10.1016/S0079-6611(99)00019-1, 1999.
Levin, L. A., Bett, B. J., Gates, A. R., Heimbach, P., Howe, B. M., Janssen, F., McCurdy, A., Ruhl, H. A., Snelgrove, P., Stocks, K. I., Bailey, D., Baumann-Pickering, S., Beaverson, C., Benfield, M. C., Booth, D. J., Carreiro-Silva, M., Colaço, A., Eblé, M. C., Fowler, A. M., Gjerde, K. M., Jones, D. O. B., Katsumata, K., Kelley, D., Le Bris, N., Leonardi, A. P., Lejzerowicz, F., Macreadie, P. I., McLean, D., Meitz, F., Morato, T., Netburn, A., Pawlowski, J., Smith, C. R., Sun, S., Uchida, H., Vardaro, M. F., Venkatesan, R., and Weller, R. A.: Global observing needs in the deep ocean, Front. Mar. Sci., 6, 241, https://doi.org/10.3389/fmars.2019.00241, 2019.
Lo Bue, N. and Giambenedetti, B.: CTD dataset with Quality Control (SBE 16plus @ 1 sample/hour) from INGV/GEOSTAR seafloor platform during NEAREST project in Iberian Margin site (Gulf of Cadiz), part of EMSO network, Istituto Nazionale di Geofisica e Vulcanologia (INGV) [data set], https://doi.org/10.13127/md/im-geostar-2007-ctd-qc, 2023.
Lo Bue, N., Artale, V., and Schroeder, K.: Impact of deep oceanic processes on circulation and climate variability, Front. Mar. Sci., 8, 801479, https://doi.org/10.3389/fmars.2021.801479, 2021.
McDougall, T. J. and Barker, P. M.: Getting started with TEOS-10 and the GSW Oceanographic Toolbox, SCOR/IAPSO WG127, 28 pp., https://www.teos-10.org/ (last access: 8 July 2026), 2011.
MacKinnon, J. A., Zhao, Z., Whalen, C. B., Waterhouse, A. F., Trossman, D. S., Sun, O. M., St. Laurent, L. C., Simmons, H. L., Polzin, K., Pinkel, R., Pickering, A., Norton, N. J., Nash, J. D., Musgrave, R., Merchant, L. M., Melet, A. V., Mater, B., Legg, S., Large, W. G., Kunze, E., Klymak, J. M., Jochum, M., Jayne, S. R., Hallberg, R. W, Griffies, S. M., Diggs, S., Danabasoglu, G., Chassignet, E. P., Buijsman, M. C., Bryan, F. O., Briegleb, B. P., Barna, A., Arbic, B. K., Ansong, J. K., and Alford, M. H.: Climate Process Team on internal wave–driven ocean mixing, B. Am. Meteorol. Soc., 98, 2429–2454, https://doi.org/10.1175/BAMS-D-16-0030.1, 2017.
Malanotte-Rizzoli, P., Manca, B. B., d'Alcalà, M. R., Theocharis, A., Bergamasco, A., Bregant, D., Budillon, G., Civitarese, G., Georgopoulos, D., Michelato, A., Sansone, E., Scarazzato, P., and Souvermezoglu, E.: Hydrography and circulation in the Ionian Sea during POEM-Phase I, Prog. Oceanogr., 39, 153–204, https://doi.org/10.1016/S0079-6611(97)00013-X, 1997.
Malanotte-Rizzoli, P., Manca, B. B., d'Alcalà, M. R., Theocharis, A., Brenner, S., Budillon, G., and Ozsoy, E.: The Eastern Mediterranean in the 80s and 90s: transition of intermediate and deep circulations, Dynam. Atmos. Oceans, 29, 365–395, https://doi.org/10.1016/S0377-0265(99)00011-1, 1999.
Marinaro, G., Etiope, G., Lo Bue, N., Favali, P., Papatheodorou, G., Christodoulou, D., Furlan, F., Gasparoni, F., Ferentinos, G., Masson, M., and Rolin, J.-F.: Monitoring of a methane-seeping pockmark by cabled benthic observatory, Geo-Mar. Lett., 26, 297–302, https://doi.org/10.1007/s00367-006-0040-4, 2006.
Marinaro, G., Embriaco, D., Lo Bue, N., and Giambenedetti, B.: Turbidity meter dataset with Quality Control (ECO-BB(RT)D 6000m @ 1 sample/hour) from INGV/GEOSTAR seafloor platform during NEAREST project in Iberian Margin site (Gulf of Cadiz), part of EMSO network, Istituto Nazionale di Geofisica e Vulcanologia (INGV) [data set], https://doi.org/10.13127/md/im-geostar-2007-turb-qc, 2023a.
Marinaro, G., Embriaco, D., Lo Bue, N., and Giambenedetti, B.: Current meter dataset with Quality Control (Nobska MAVS-3 @ 5 Hz) from INGV/GEOSTAR seafloor platform during NEAREST project in Iberian Margin site (Gulf of Cadiz), part of EMSO network, Istituto Nazionale di Geofisica e Vulcanologia (INGV) [data set], https://doi.org/10.13127/md/im-geostar-2007-curr-qc, 2023b.
Marinaro, G., Embriaco, D., Lo Bue, N., and Giambenedetti, B.: ADCP dataset with Quality Control (RDI WorkHorse 300 kHz @ 1 profile/hour) from INGV/GEOSTAR seafloor platform during NEAREST project in Iberian Margin site (Gulf of Cadiz), part of EMSO network, Istituto Nazionale di Geofisica e Vulcanologia (INGV) [data set], https://doi.org/10.13127/md/im-geostar-2007-adcp-qc, 2023c.
Marinaro, G., Embriaco, D., Lo Bue, N., and Giambenedetti, B.: CTD dataset with Quality Control (SBE 16plus @ 1 sample/10 min) from INGV/SN-4 seafloor platform during ESONET-MARMARA-DM project in Marmara Sea site (Marmara Sea), part of EMSO network, Istituto Nazionale di Geofisica e Vulcanologia (INGV) [data set], https://doi.org/10.13127/md/mar-sn4-2009-ctd-qc, 2024a.
Marinaro, G., Embriaco, D., Lo Bue, N., and Giambenedetti, B.: Turbidity meter dataset with Quality Control (ECO-NTU(RT)D 6000m @ 1 sample/10 min) from INGV/SN-4 seafloor platform during ESONET-MARMARA-DM project in Marmara Sea site (Marmara Sea), part of EMSO network, Istituto Nazionale di Geofisica e Vulcanologia (INGV) [data set], https://doi.org/10.13127/md/mar-sn4-2009-turb-qc, 2024b.
Marinaro, G., Embriaco, D., Lo Bue, N., and Giambenedetti, B.: Current meter dataset with Quality Control (Nobska MAVS-3 @ 5 Hz) from INGV/SN-4 seafloor platform during ESONET-MARMARA-DM project in Marmara Sea site (Marmara Sea), part of EMSO network, Istituto Nazionale di Geofisica e Vulcanologia (INGV) [data set], https://doi.org/10.13127/md/mar-sn4-2009-curr-qc, 2024c.
Marinaro, G., Lo Bue, N., and Giambenedetti, B.: Oxygen meter dataset with Quality Control (AADI Optode 3830 @ 1 Hz) from INGV/SN-4 seafloor platform during ESONET-MARMARA-DM project in Marmara Sea site (Marmara Sea), part of EMSO network, Istituto Nazionale di Geofisica e Vulcanologia (INGV) [data set], https://doi.org/10.13127/MD/MAR-SN4-2009-OXY-QC, 2024d.
Marinaro, G., Embriaco, D., Lo Bue, N., and Giambenedetti, B.: CTD dataset with Quality Control (SBE 16plus @ 1 sample/hour) from INGV/SN-4 seafloor platform during MARSITE 1 project in Marmara Sea site (Marmara Sea), part of EMSO network, Istituto Nazionale di Geofisica e Vulcanologia (INGV) [data set], https://doi.org/10.13127/md/mar-sn4-2013-ctd-qc, 2024e.
Marinaro, G., Embriaco, D., Lo Bue, N., and Giambenedetti, B.: Turbidity meter dataset with Quality Control (ECO-NTU(RT)D 6000m @ 1 sample/10 min) from INGV/SN-4 seafloor platform during MARSITE 1 project in Marmara Sea site (Marmara Sea), part of EMSO network, Istituto Nazionale di Geofisica e Vulcanologia (INGV) [data set], https://doi.org/10.13127/md/mar-sn4-2013-turb-qc, 2024f.
Marinaro, G., Embriaco, D., Lo Bue, N., and Giambenedetti, B.: Current meter dataset with Quality Control (Nobska MAVS-3 @ 5 Hz) from INGV/SN-4 seafloor platform during MARSITE 1 project in Marmara Sea site (Marmara Sea), part of EMSO network, Istituto Nazionale di Geofisica e Vulcanologia (INGV) [data set], https://doi.org/10.13127/md/mar-sn4-2013-curr-qc, 2024g.
Marullo, S., Artale, V., and Santoleri, R.: The SST multidecadal variability in the Atlantic–Mediterranean region and its relation to AMO, J. Climate, 24, 4385–4401, 2011.
Millot, C. and Taupier-Letage, I. :Circulation in the Mediterranean Sea, in: The Mediterranean Sea. Handbook of Environmental Chemistry, edited by: Saliot, A., vol. 5K, Springer, Berlin, Heidelberg, https://doi.org/10.1007/b107143, 2005.
Munk, W.: Abyssal recipes, Deep-Sea Res., 13, 707–730, https://doi.org/10.1016/0011-7471(66)90602-4, 1966.
Ochoa, J. and Bray, N.: Water mass exchange in the Gulf of Cádiz, Deep-Sea Res. Pt. A, 38, S465–S503, https://doi.org/10.1016/S0198-0149(12)80021-5, 1991.
Polzin, K. L. and McDougall, T.: Mixing at the ocean's bottom boundary, in: Drivers, Mechanisms and Impacts, Elsevier, https://doi.org/10.1029/JC083iC04p01971, 2021.
Rhein, M., Rintoul, S., Aoki, S., Campos, E., Chambers, D., Feely, R., and Wang, F.: Observations: Ocean, in: Climate Change 2013: The Physical Science Basis, IPCC, https://www.ipcc.ch/site/assets/uploads/2018/02/WG1AR5_Chapter03_FINAL.pdf (last access: 8 July 2026), 2013.
Robinson, A. R., Leslie, W. G., Theocharis, A., and Lascaratos, A.: Mediterranean Sea Circulation, Encyclopedia of Ocean Science, 3, 1689–1705, https://doi.org/10.1006/rwos.2001.0376, 2001.
Schroeder, K., Tanhua, T., Bryden, H. L., Álvarez, M., Chiggiato, J., and Aracri, S.: Mediterranean Sea Ship-based Hydrographic Investigations Program (Med-SHIP), Oceanography, 28, https://doi.org/10.5670/oceanog.2015.71, 2015.
Stommel, H. and Arons, A. B.: On the abyssal circulation of the world ocean–II, Deep-Sea Res., 6, 217–233, https://doi.org/10.1016/0146-6313(59)90075-9, 1960.
Talley, L. D., Pickard, G. L., and Emery, W. J.: Descriptive Physical Oceanography, 6th edn., Academic Press, https://www.inspectioncopy.elsevier.com/book/details/9780750645522 (last access: 8 July 2026), 2011.
Visbeck, M.: Ocean science research is key for a sustainable future, Nat. Commun., 9, 690, https://doi.org/10.1038/s41467-018-03158-3, 2018.
Waldmann, C., Fischer, P., Seitz, S., Köllner, M., Fischer, J-G., Bergenthal, M, Brix, H., Weinreben, S., and Huber, R.: A methodology to uncertainty quantification of essential ocean variables, Front. Mar. Sci., 9, 1002153, https://doi.org/10.3389/fmars.2022.1002153, 2022.