the Creative Commons Attribution 4.0 License.
the Creative Commons Attribution 4.0 License.
 | 13 Jul 2026
Long-term irrigation water use datasets from multiple Earth Observation-based methods in major irrigated regions
Pierre Laluet
Jacopo Dari
Louise Busschaert
Zdenko Heyvaert
Gabrielle De Lannoy
Pia Langhans
Sara Modanesi
Christian Massari
Luca Brocca
Carla Saltalippi
Renato Morbidelli
Clément Albergel
Wouter Dorigo
Irrigation water use (IWU) is widely considered the largest direct human intervention in the terrestrial water cycle, yet it remains poorly characterised at the spatial and temporal scales required for climate research. We present a long-term archive of monthly IWU estimates at 0.25° spatial resolution for four major irrigated regions – the contiguous United States (CONUS), India, the Murray-Darling Basin in Australia, and the Ebro Basin in Spain – spanning up to two decades depending on input data availability. The datasets are derived using three distinct approaches: (i) a Soil Moisture (SM)-based Delta method that infers irrigation from discrepancies between satellite and model SM and evapotranspiration, (ii) an SM-based Inversion of the soil water balance constrained by satellite SM, and (iii) a Model-observation integration scheme combining a land surface model with satellite-based irrigated-area maps. Across regions, these approaches yield up to six SM-based Delta products, five SM-based Inversion products, and one Model-observation integration product. Validation against available irrigation records shows that several method-input combinations reproduce the order of magnitude of annual state-level irrigation volumes in the CONUS, with typical errors for the best-performing datasets of about 4–5 km3 yr−1 in root mean square deviation and 1–2 km3 yr−1 in bias. In the Murray-Darling and Ebro basins, the products capture the main features of the seasonal irrigation cycle, with variations in spatial patterns, magnitude, and timing across methods. In India, where no observational records are available, the datasets reproduce the expected agricultural seasons while exhibiting a wider inter-method spread. This coordinated dataset collection, produced with multiple Earth Observation (EO)-based approaches and harmonised inputs across regions, provides long-term, spatially explicit IWU estimates and a basis for better quantifying and representing irrigation in large-scale hydrological and climate studies. The complete archive of datasets is freely available at https://doi.org/10.5281/zenodo.14988197 (Laluet et al., 2025).
- Article
(5732 KB) - Full-text XML
-
Supplement
(351 KB) - BibTeX
- EndNote


Irrigation is widely considered the largest direct human intervention in the terrestrial water cycle, accounting for about 45 %–90 % of global freshwater withdrawals (Puy et al., 2025). Beyond its direct pressure on water resources and its role in sustaining agricultural productivity, irrigation strongly influences land-atmosphere fluxes, the surface energy balance, and regional climate patterns by altering evapotranspiration, surface albedo, and soil moisture regimes. These modifications, in turn, can affect temperature and precipitation, with potential implications for larger-scale circulation patterns (e.g., Thiery et al., 2017, 2020; Seneviratne and Hauser, 2020; McDermid et al., 2023; Lunel et al., 2024).
With global demand for irrigation projected to rise due to population growth, dietary shifts, and climate change (Elliott et al., 2014), quantifying when, where, and how much water is used for irrigation is essential for managing water resources and for advancing climate research. In particular, long-term, spatially consistent records of irrigation water use (IWU) are indispensable not only for capturing present-day irrigation dynamics but also for assessing historical trends and their sustainability, as well as for quantifying the long-term impacts of irrigation on local and regional climate. Such records enable irrigation hotspots to be more accurately represented in climate and land surface models.
Despite its importance, IWU remains one of the least well-quantified components of the water cycle (Dorigo et al., 2021). While national statistics and survey-based databases such as FAO's AQUASTAT (FAO, 2025) provide a useful baseline, they are affected by large uncertainties, due to limitations in country-reported irrigation statistics (Ajaz et al., 2019) and inconsistencies between national reports and AQUASTAT estimates (Puy et al., 2021). Global hydrological and land surface models increasingly include irrigation modules (e.g., Wada et al., 2014; Arboleda-Obando et al., 2024), but model-based IWU estimates remain highly uncertain, as they depend on assumptions that often deviate from actual practices, such as irrigation triggering rules (Olivera-Guerra et al., 2023), or on poorly constrained parameters, for instance those related to irrigation efficiency (Puy et al., 2022).
Earth Observation (EO) has opened new opportunities for detecting and monitoring irrigation from space (Massari et al., 2021). Various satellite observations capture irrigation-related signals, including vegetation properties (e.g., Ambika et al., 2016; Deines et al., 2019; Dari et al., 2024), land surface temperature (e.g., Corbari et al., 2025; Jalilvand et al., 2026), soil moisture (e.g., Modanesi et al., 2022; Dari et al., 2023; Zappa et al., 2024; Laluet et al., 2024), and evapotranspiration (e.g., Zhang and Long, 2021; Kragh et al., 2023; Zipper et al., 2024). These approaches have shown promising results from field to basin scales, and several have been extended to continental or global domains (e.g., Zaussinger et al., 2019; Zohaib and Choi, 2020; Zhang and Long, 2021). However, long-term large-scale IWU datasets remain scarce, and existing EO-based products rely on heterogeneous input datasets and retrieval strategies, which limits their comparability, generalisation, and use in cross-regional analysis or climate-oriented applications.
Against this background, this study provides a coordinated assessment of multiple EO-based IWU retrieval techniques within a unified framework. We present a harmonised archive of IWU datasets for four major irrigated regions – the contiguous United States (CONUS), India, the Murray-Darling Basin (Australia), and the Ebro Basin (Spain) – delivering monthly estimates at 0.25° resolution over up to two decades, depending on data availability.
The archive is generated using three complementary approaches. The Soil Moisture (SM)-based Delta approach (e.g., Zaussinger et al., 2019; Zappa et al., 2021, 2024) quantifies IWU by contrasting satellite-based soil moisture and evapotranspiration datasets (which implicitly include irrigation) with model estimates that exclude irrigation. The SM-based Inversion approach (e.g., Dari et al., 2020, 2025b) estimates irrigation through the inversion of a soil water balance, constrained mainly by satellite soil moisture observations. Finally, the Model-observation integration approach uses the Noah-MP land surface model (Niu et al., 2011) equipped with an irrigation scheme (Ozdogan et al., 2010), and scales the simulated irrigation amounts using EO-derived irrigated area fractions within each grid cell.
Together, these datasets provide the first coordinated collection of EO-based IWU estimates with harmonised inputs and consistent processing across several major irrigated regions worldwide. They are intended as a foundation for building a climate data record of IWU and for improving the representation of irrigation in hydrological and climate studies. The remainder of this paper describes the study regions (Sect. 2.1), the methods used to generate the IWU archive (Sect. 2.2), the input datasets (Sect. 2.3), evaluates the results against available observations and across methods (Sect. 3), and discusses limitations and perspectives (Sect. 4).
2.1 Study regions
Figure 1 presents the four regions studied here, together with a map of area equipped for irrigation (GMIA version 5; Siebert et al., 2013), originally at 5 arcmin (∼ 10 km) resolution and resampled to 0.25° using an area-weighted aggregation.
The CONUS spans a strong climatic gradient, from humid subtropical and temperate conditions in the east to semi-arid and desert climates in the west. Irrigation is concentrated in western and central hotspots: the California Valley (mostly orchards and vineyards), Snake River Plain (mainly potatoes, sugar beets, and alfalfa), Great Plains (mostly maize, wheat, and soybeans), and the Mississippi Floodplain (mainly rice, soybeans, and cotton). Water sources include both groundwater from major aquifers, such as the High Plains (Ogallala) and Central Valley systems (Scanlon et al., 2012), and surface water conveyed through canal networks. Irrigation is primarily applied through sprinkler or gravity methods, with an increasing use of drip systems in high-value crop regions, such as California (USDA NASS, 2019; Evett et al., 2020).
The Ebro Basin in Spain has a semi-arid Mediterranean climate, with irrigation concentrated mainly in the central and eastern parts of the basin, supporting mostly winter cereals, maize, orchards, olives, and vineyards. Water comes from snowmelt-fed reservoirs in the Pyrenees distributed through canals, with both modern pressurised and traditional surface irrigation systems (Paolini et al., 2023).
The Murray-Darling Basin in southeastern Australia spans hot semi-arid regions in the north and cooler semi-arid zones in the south. Irrigation is primarily located along the southern rivers, especially the Murray and Murrumbidgee, supporting crops such as cotton, rice, vineyards, and fruit orchards. Water is sourced from both surface reservoirs and groundwater aquifers (Bretreger et al., 2020).
India hosts the world's most intensively irrigated regions, dominated by the Indo-Gangetic Plain in the north, where irrigation supports year-round multi-cropping systems (Kharif, Rabi, and Zaid seasons) with major crops including rice, wheat, and sugarcane. Groundwater is the primary source of irrigation water across much of the country and has supported a marked expansion of irrigated areas over recent decades, particularly in northern India, even as groundwater resources have become increasingly depleted (Asoka et al., 2018; Mehta et al., 2024).
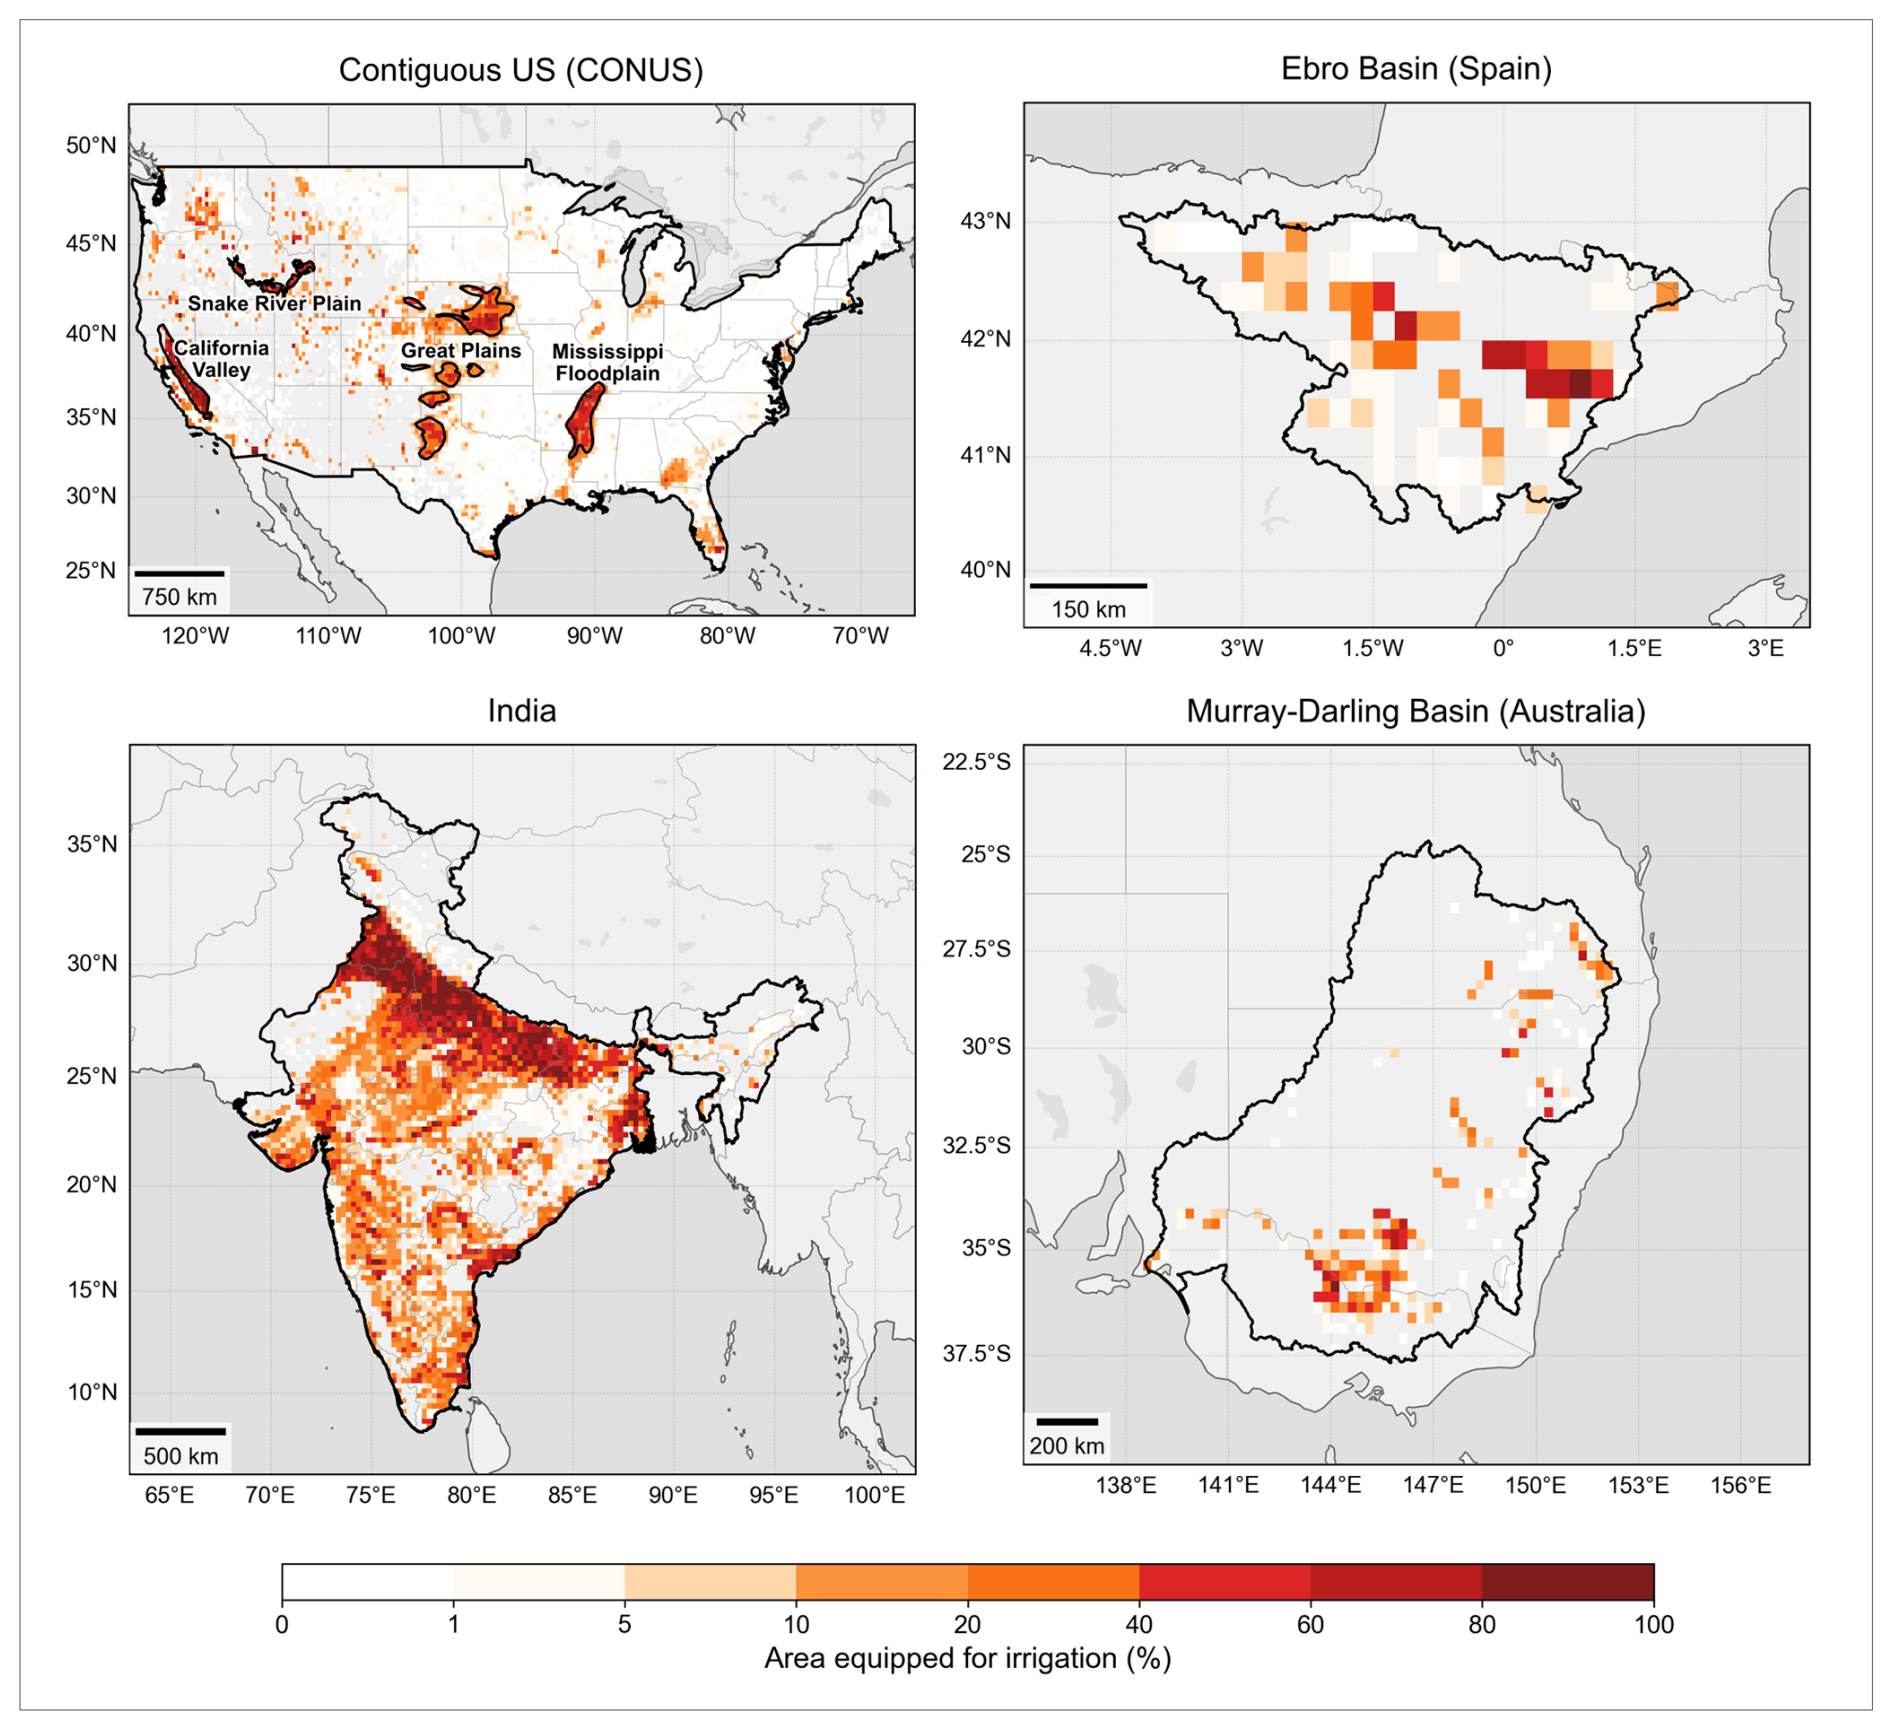
Figure 1Study regions considered in this work, for which IWU archives are available. Colour shading indicates the percentage of area equipped for irrigation (GMIA v5; Siebert et al., 2013). Black outlines show the study domains: contiguous United States, with four main irrigated subregions (California Valley, Great Plains, Mississippi Floodplain, Snake River Plain); India; Ebro Basin (Spain); and Murray-Darling Basin (Australia).
2.2 Overview of algorithms
2.2.1 SM-based Delta
The SM-based Delta approach estimates IWU by contrasting EO-derived and model-simulated soil water balance dynamics, with the latter excluding irrigation (e.g., Zaussinger et al., 2019; Zappa et al., 2021). The underlying assumption is that, in irrigated areas, discrepancies between EO- and model-based estimates primarily reflect the influence of irrigation, which affects both SM and ET.
To ensure comparability between EO- and model-derived SM, satellite SM time series are first rescaled to the distribution of the model simulations using a mean–standard deviation adjustment. We further assume that EO-based and model-simulated ET agree under non-irrigated conditions, such that any departures in irrigated areas can be attributed to irrigation. This assumption is consistent with Laluet et al. (2026) (their Fig. 5), who showed that EO-based and model-based ET products exhibit similar values over irrigated regions outside the irrigation season, while substantial differences emerge when irrigation is active. The EO SM and ET datasets used in this approach are described in Sect. 2.3.
The soil water balance equation for EO-based soil moisture (SMEO) can be written as:
and for model-simulated soil moisture (SMmodel) as:
where P [mm] is precipitation, I [mm] is irrigation, ET [mm] is evapotranspiration, R [mm] is runoff, and ΔSrest [mm] represents other storage changes below the surface layer (e.g., drainage). Z [mm] is the soil depth used to convert volumetric soil moisture into water storage, fixed at 50 mm following Zaussinger et al. (2019).
Subtracting Eq. (2) from Eq. (1) expresses the EO–model discrepancies in terms of irrigation, under the assumption that differences in precipitation, runoff, and other storage terms are either negligible or do not systematically differ between the two formulations. The resulting IWU estimate is:
To reduce spurious irrigation signals due to noise in the satellite SM data, IWU is only considered between two consecutive time steps when the relative increase in soil moisture exceeds a predefined threshold of 0.12, as determined from the sensitivity analysis in Zaussinger et al. (2019).
2.2.2 SM-based Inversion
The SM-based Inversion approach estimates IWU by inverting the soil water balance equation, following a formulation conceptually similar to the SM2RAIN method (Brocca et al., 2014) originally developed to retrieve precipitation from soil moisture. In this framework, temporal variations in soil moisture SM(t) are used to infer the total water input (precipitation plus irrigation), and the known precipitation component is subsequently removed.
The general form of the soil water balance is:
where n [–] is the soil porosity, Z [mm] the effective soil depth, SM [–] the volumetric soil moisture, I and P [mm] the irrigation and precipitation inputs (with precipitation taken from the ERA5 forecast fields; Hersbach et al., 2020), G [mm] the drainage, SR [mm] the surface runoff, and ET [mm] the actual evapotranspiration.
Defining the total water input as , Eq. (4) can be rearranged as:
from which irrigation is retrieved as
Following Dari et al. (2023), the drainage term is represented as G(t)=a SM(t)b, where a and b are parameters related to soil hydraulic properties. Actual evapotranspiration is expressed as ET(t)=F SM(t) PET(t), where PET [mm] is potential evapotranspiration and F [–] is a scaling parameter modulating the sensitivity of ET to SM. The parameters a, b, F, and nZ are calibrated jointly during rainfall-free periods over the non-irrigated season and rainfall days within the irrigation season. Surface runoff is assumed to be negligible, as the major irrigated areas analysed here are predominantly located in flat agricultural regions. Negative irrigation estimates are set to zero, and spurious low values are filtered out using a precipitation-based threshold, following Jalilvand et al. (2019) and Dari et al. (2023).
2.2.3 Model-observation integration
The Model-observation integration approach estimates IWU using simulations from the Noah-MP land surface model (v4.0.1; Niu et al., 2011) implemented within NASA's Land Information System (LIS; Kumar et al., 2006, 2008). Irrigation is simulated following the sprinkler scheme of Ozdogan et al. (2010), in which irrigation is applied during the growing season whenever root-zone moisture availability (MA) falls below a prescribed threshold. Here, a threshold of 0.45 is used, following Modanesi et al. (2022); sensitivity tests confirmed that this value yields the most realistic irrigation behaviour (not shown). The start and end of the growing season are derived from a monthly climatological greenness dataset (Gutman and Ignatov, 1998), with irrigation allowed only when greenness exceeds 40 % of its annual range (Ozdogan et al., 2010).
The model is forced with ERA5 forecast fields, which do not assimilate land-surface observations and therefore avoid introducing irrigation-related signals. Soil texture is taken from the Harmonized World Soil Database (FAO, 2023), and soil hydraulic properties follow Cosby et al. (1984) with adaptations from Chen and Dudhia (2001).
Root-zone moisture availability MA is computed as:
where θ is the simulated volumetric soil moisture, and θWP and θFC are the water contents at wilting point and field capacity, respectively. When MA drops below the threshold of 0.45, irrigation is applied to restore the root zone to field capacity.
Noah-MP is run over all land pixels using a homogeneous cropland land-cover type to ensure that the irrigation scheme is active everywhere. A satellite-based irrigated-area map is then used to constrain the spatial distribution of irrigation, retaining simulated irrigation only over irrigated pixels and scaling it by the irrigated fraction within each 0.25° grid cell. For this study, we use the ensemble mean of 24 Noah-MP simulations driven by perturbed meteorological forcings (radiation and precipitation, as in Modanesi et al., 2022).
2.3 Main input data
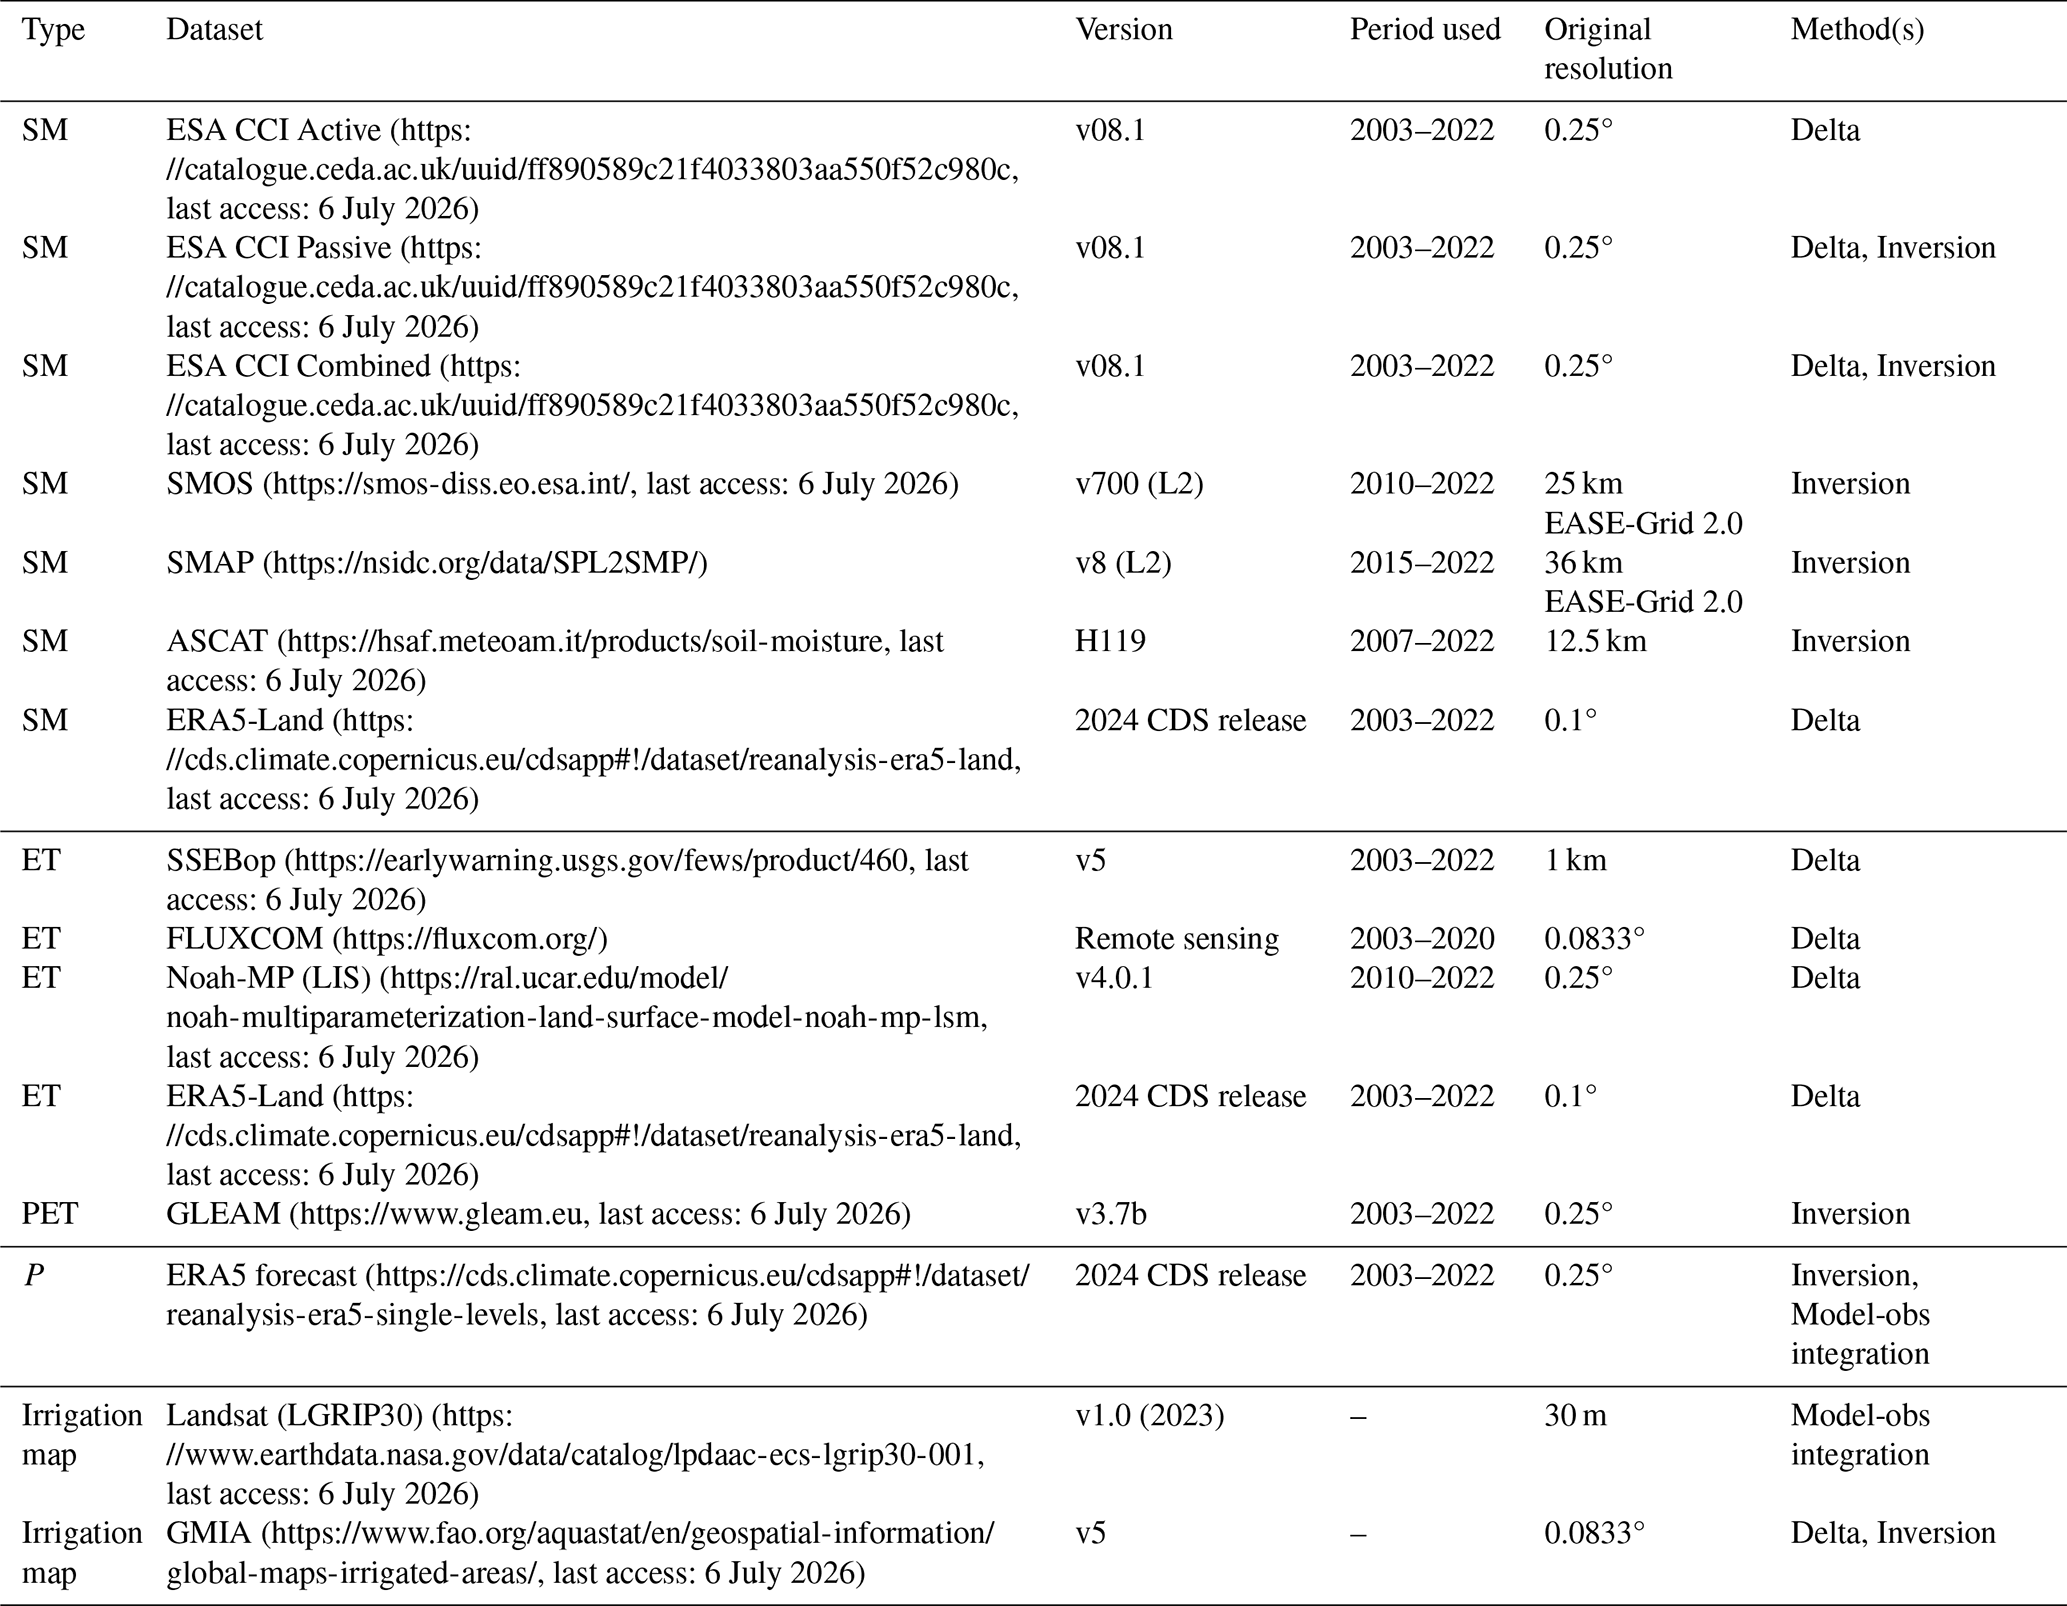
Table 1 summarises the main input datasets, together with the methods in which they are employed.
2.3.1 Soil moisture datasets
We use seven surface SM datasets, including both satellite-based and model-based products. The satellite products, which are expected to contain irrigation signals (e.g., Lawston et al., 2017; Crow et al., 2025), comprise three long-term records from the ESA Climate Change Initiative (CCI) Soil Moisture version 08.1 data collection (Dorigo et al., 2017, 2023). These datasets provide volumetric SM [m3 m−3] for the upper 0–5 cm soil layer at a daily time step and 0.25° spatial resolution. They include (i) the ACTIVE dataset, merging scatterometer observations from ERS-1, ERS-2, and ASCAT (MetOp-A/B/C); (ii) the PASSIVE dataset, combining microwave radiometer measurements from multiple missions and sensors (SMMR, SSM/I, TMI, AMSR-E, WindSat, AMSR2, SMOS, SMAP, FengYun, and GPM); and (iii) the COMBINED dataset, which integrates all active and passive retrievals into a single harmonised product. We also include three additional satellite datasets: Soil Moisture and Ocean Salinity (SMOS; Kerr et al., 2016), Soil Moisture Active Passive (SMAP; Entekhabi et al., 2010), and Advanced Scatterometer (ASCAT; Wagner et al., 2013). Finally, ERA5-Land (Muñoz-Sabater et al., 2021) is used as a model-based reference dataset, providing volumetric SM for the upper 0–5 cm at hourly resolution and 0.1° spatial resolution. ERA5-Land does not assimilate land-surface observations (e.g., SM or land surface temperature) and does not include any explicit representation of irrigation. However, it is forced by ERA5 atmospheric fields, which may carry an indirect imprint of irrigation introduced through atmospheric data assimilation. In practice, our analyses (not shown) indicate that ERA5-Land exhibits no detectable irrigation signal in the study regions and can therefore be used as a non-irrigated reference.
2.3.2 Evapotranspiration datasets
We use four ET datasets. Two of them are observation-based products that integrate satellite information and therefore contain irrigation signals (e.g., Laluet et al., 2026): (i) SSEBop v5 (Senay, 2018), based on MODIS land surface temperature and vegetation data; and (ii) FLUXCOM (Remote Sensing version) (Jung et al., 2019), obtained by machine-learning upscaling of eddy-covariance fluxes using satellite-derived predictors. The remaining two datasets are model-based products that do not explicitly represent irrigation: Noah-MP ET (forced with ERA5 forecast meteorology) and ERA5-Land ET. Noah-MP ET is available for 2010–2022 for the CONUS and Murray-Darling Basin domains, while ERA5-Land ET is used for the remaining regions and periods. In addition, we use potential evapotranspiration from the GLEAM v3.7b dataset (Martens et al., 2017) in the SM-based Inversion approach; GLEAM v3.7b potential evapotranspiration is computed using the Priestley–Taylor equation and meteorological forcing.
2.3.3 Irrigated area maps
To constrain irrigation estimates in the Model-observation integration approach, we use the Landsat-derived Global Rainfed and Irrigated-Cropland product at 30 m resolution (LGRIP30; Teluguntla et al., 2023) for the nominal year 2015. LGRIP30 provides spatially detailed irrigated and rainfed cropland fractions based on Landsat surface reflectance time series and machine-learning classification. In addition, the Global Map of Irrigated Areas v5 (GMIA v5; Siebert et al., 2013) is used in the SM-based Delta and SM-based Inversion approaches as a spatial mask to restrict the analysis to regions equipped for irrigation. GMIA v5, provided at 0.0833° resolution, compiles subnational agricultural statistics, census information, and international reports on irrigated areas for the period 2000–2008.
Table 1Summary of soil moisture (SM), evapotranspiration (ET), precipitation (P), and irrigated-area datasets used as main inputs, including temporal coverage, original resolution, and version information. Dataset names link to their respective data repositories.
2.3.4 Spatial and temporal processing
All input datasets were regridded to the 0.25° regular latitude–longitude grid used in the ESA CCI SM products. SMOS and SMAP were resampled using nearest–neighbour interpolation to preserve their native retrieval characteristics. All other datasets (ASCAT, ERA5-Land SM and ET, FLUXCOM, SSEBop, Noah-MP ET, and GMIA v5) were aggregated to the 0.25° grid using spatial averaging. The LGRIP30 irrigated area map, which provides a binary classification of irrigated versus rainfed cropland at 30 m resolution, was similarly aggregated by computing the fraction of irrigated pixels within each 0.25° grid cell.
A spatial mask was applied to the SM-based Delta and SM-based Inversion IWU outputs, retaining only pixels with at least 5 % of land equipped for irrigation according to the GMIA v5 dataset, in order to avoid spurious irrigation signals in non-irrigated areas. For the Model-observation integration approach, irrigation amounts are already restricted and scaled to the irrigated fraction within each grid cell using the LGRIP30 irrigated area map.
A temporal mask was applied to the SM-based Delta and SM-based Inversion estimates to restrict the analysis to active irrigation periods: April–September for CONUS, April–October for the Ebro Basin, September–March for the Murray-Darling Basin, and November–June for India. In India, irrigation also occurs during the monsoon months (July to October), but these months were excluded to ensure consistency across methods, as the SM-based Inversion approach uses this period for parameter calibration. For the Model-observation integration approach, a temporal mask was applied only in the Murray-Darling Basin, where the climatological greenness threshold from Gutman and Ignatov (1998) is outdated and cannot be used to define irrigation timing. Finally, all 0.25° IWU estimates were temporally aggregated to monthly values.
These spatial and temporal masks also serve as safeguards against potential confusion between snowmelt-driven soil moisture increases and irrigation signals, as snow accumulation and melt predominantly occur in mountainous areas and periods that fall outside the retained pixels and time windows.
2.4 In situ and survey-based reference datasets
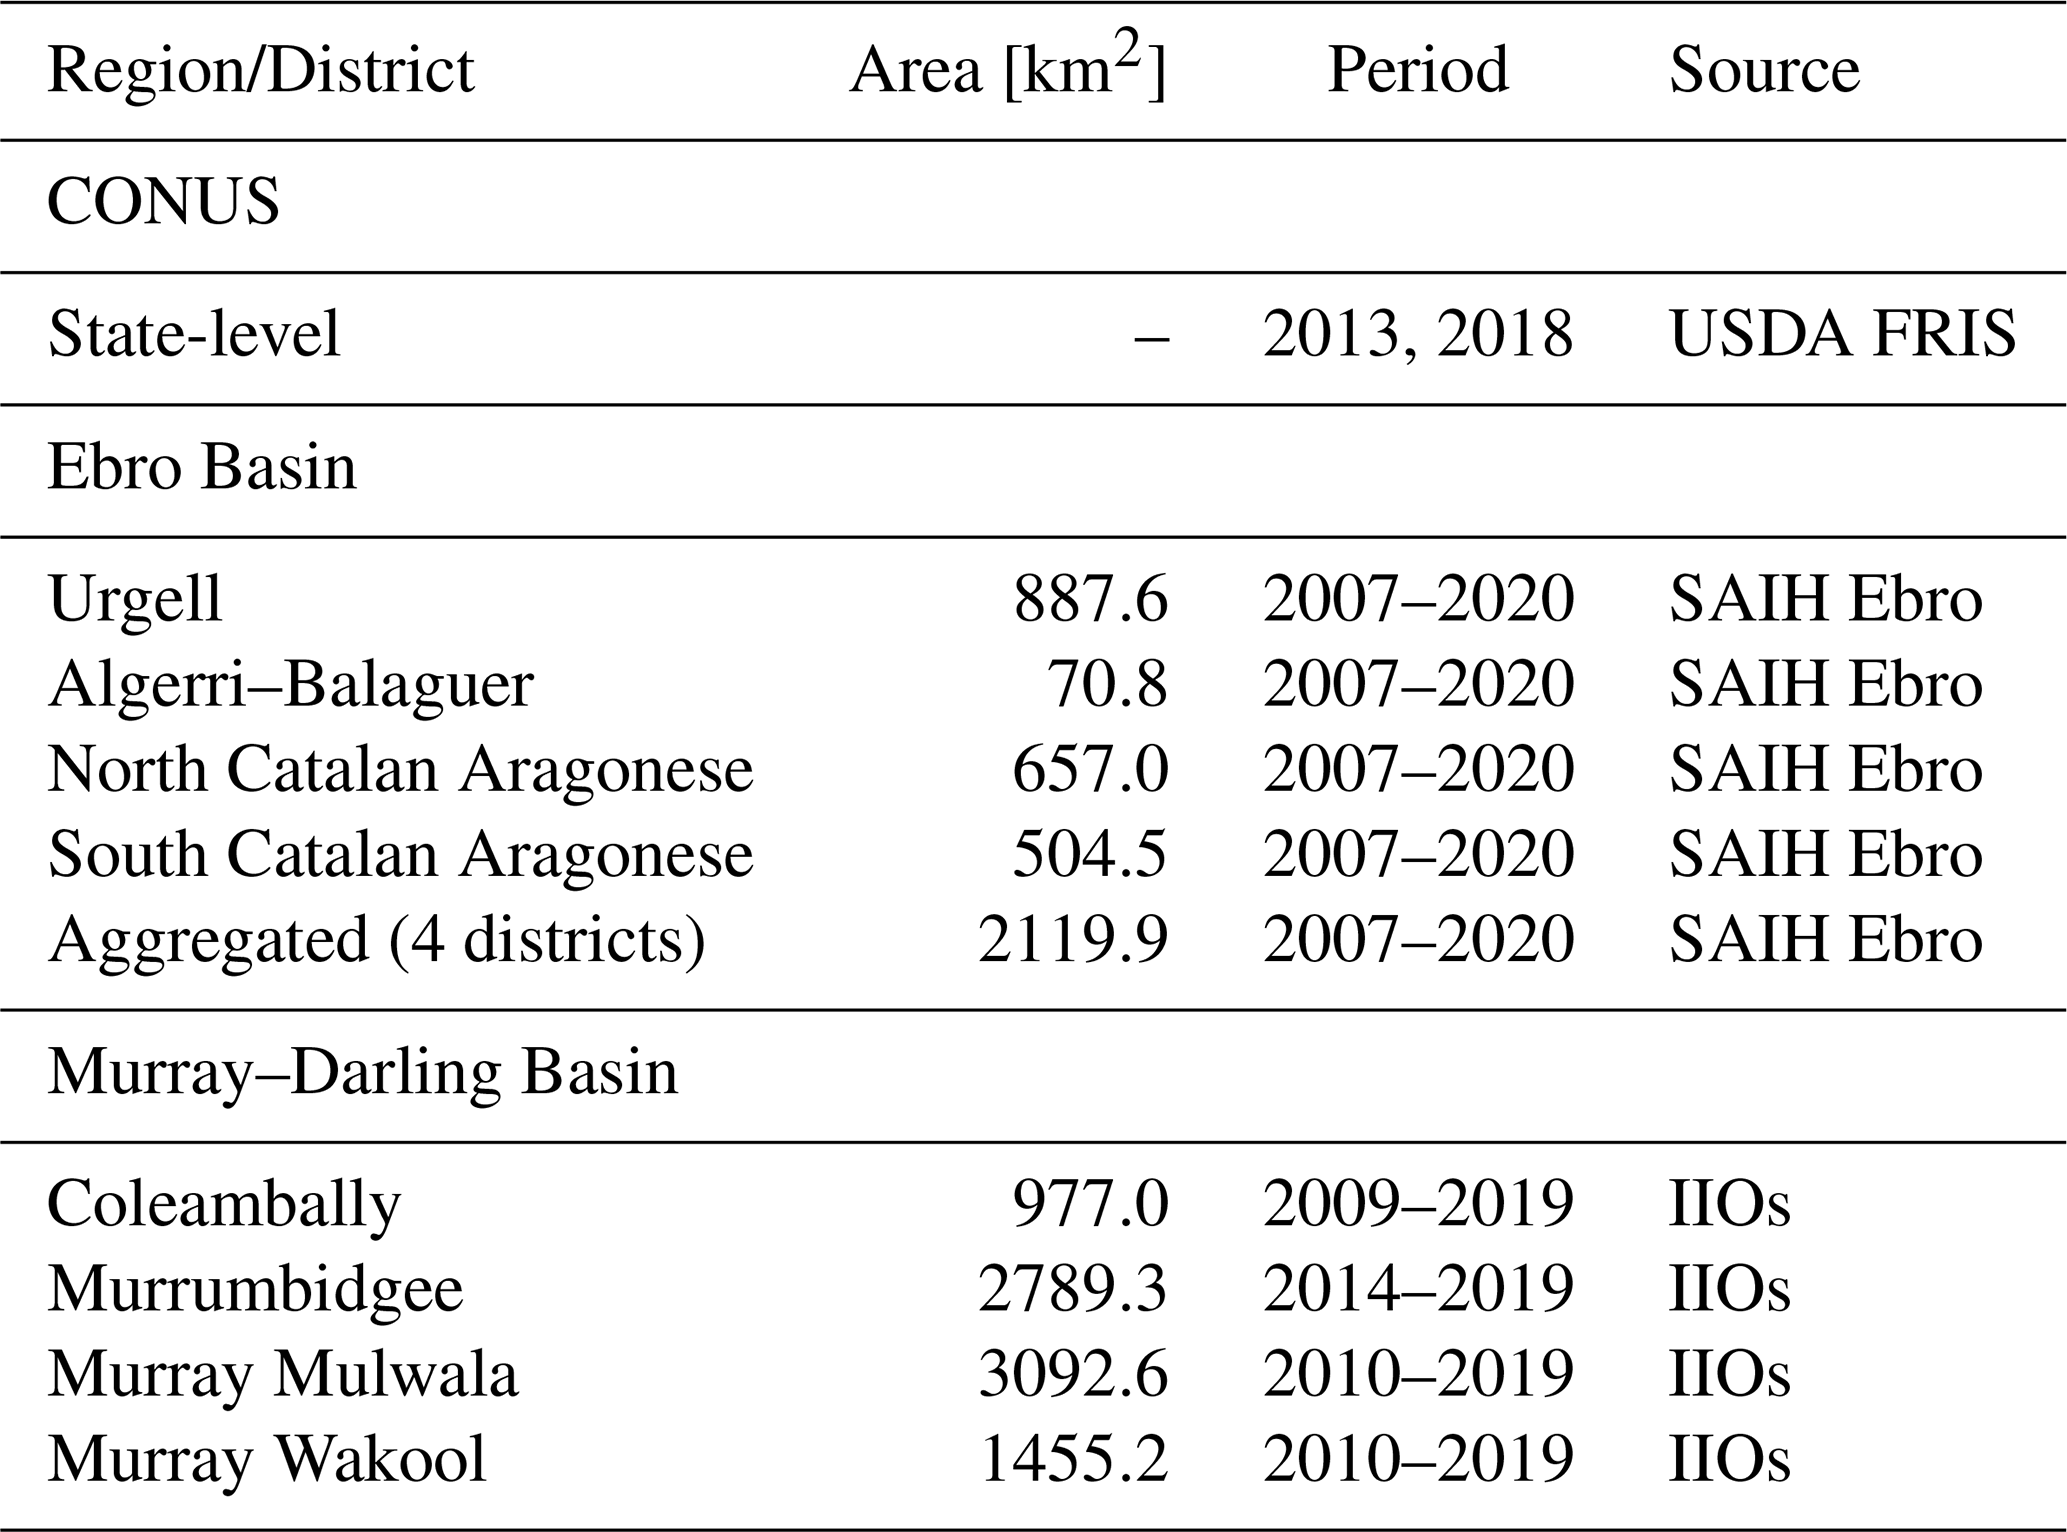
Table 2 summarises the reference datasets used for validation, including their spatial coverage, period of record, and data source. For CONUS, we used annual state-level irrigation volumes from the United States Department of Agriculture (USDA) Farm and Ranch Irrigation Survey (FRIS) for 2013 and 2018. The survey, compiled by the National Agricultural Statistics Service (NASS), is based on representative farm and ranch samples, which are then expanded to state totals using statistical weights.
For the Ebro Basin, we used daily canal-delivery volumes from the Automatic Hydrological Information System (SAIH) monitoring network for the years 2007 to 2020, covering four major irrigation districts in the eastern basin: Urgell, Algerri–Balaguer, North Catalan and Aragonese, and South Catalan and Aragonese (Fig. 6c). Reported pumped volumes were corrected for conveyance and application losses using district-specific factors from Dari et al. (2020), yielding actual IWU. The corrected values were expressed in millimetres over each district and then combined into a single basin-wide monthly time series by area-weighted averaging, yielding one representative IWU time series for the four districts. This aggregation was necessary because the individual districts are smaller than the 0.25° grid cells of the IWU datasets.
For the Murray-Darling Basin, we used daily irrigation volumes reported by the Australian Irrigation Infrastructure Operators (IIOs) for four districts in southern New South Wales: Murrumbidgee, Murray Wakool, Murray Mulwala, and Coleambally (Fig. 8c; Bretreger et al., 2020). Reported volumes (litres) were converted to millimetres by dividing by each district's irrigated area, and the daily data were subsequently aggregated to monthly values.
For India, no in situ or survey-based irrigation records were available for the study period. Consequently, no direct validation could be performed; analyses for this region are therefore limited to inter-dataset comparisons and to the examination of spatial and temporal IWU patterns.
Table 2In situ and survey-based reference datasets used for validation, including area, period of record, and data source for each region and irrigation district.
2.5 Overview of generated datasets
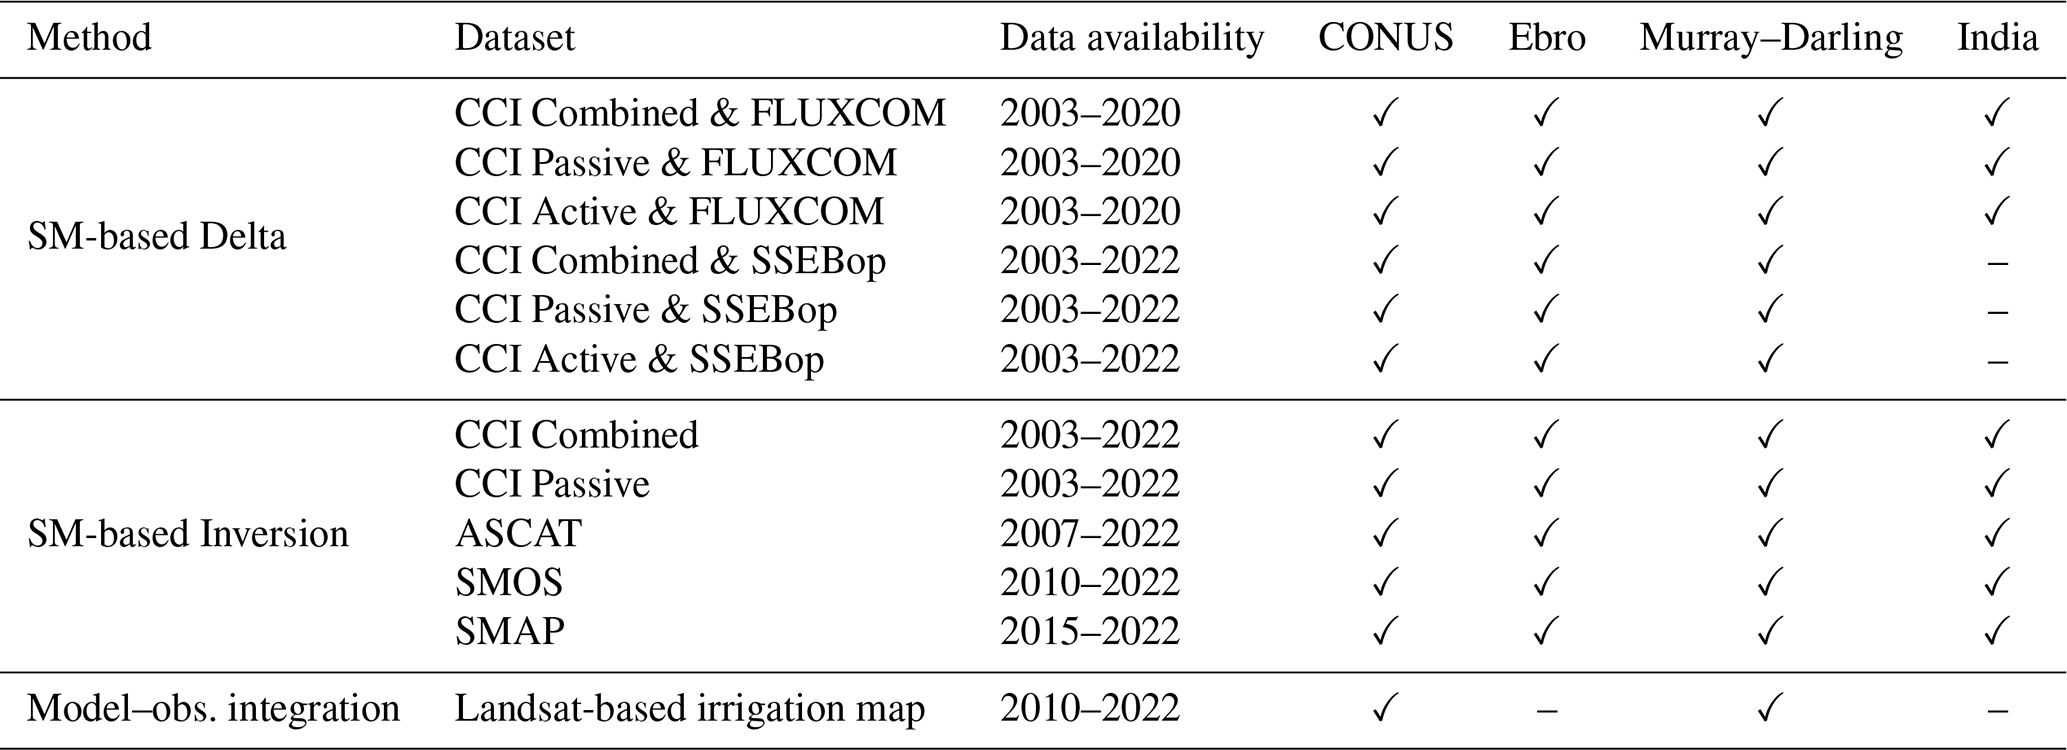
Table 3 provides an overview of the IWU archive generated in this study. Each dataset corresponds to a specific combination of methods and input datasets, and its availability depends on both the region and the temporal coverage of the input data. A check mark indicates that a dataset is included in the archive for a given region, while a dash indicates that it is not. Periods refer to the effective time span covered by each dataset.
For the SM-based Delta method, only FLUXCOM-based estimates were retained for India, as SSEBop yielded unrealistically high ET values compared to ERA5 precipitation, consistent with Kragh et al. (2023).
For the Model-observation integration approach, IWU estimates were produced only for CONUS and the Murray-Darling Basin. These two regions were selected for the first implementation of the regional-scale ensemble Noah-MP irrigation simulations because they provide the most comprehensive in situ reference data for evaluation among the four study regions, whereas observational records are more limited in the Ebro Basin and unavailable for India.
Table 3Datasets generated in this study: method, dataset, time coverage, and regional availability. A check mark (✓) indicates availability; a dash (–) indicates that the dataset is not available.
3.1 Contiguous United States (CONUS)
3.1.1 Summary of performance
Figure 2 presents a heatmap of the time-averaged spatial root mean square deviation (RMSD), bias, and Pearson correlation coefficient (R) computed between observed and estimated state-level irrigation volumes from FRIS and the corresponding IWU estimates. Each metric is derived from the comparison of state-level values (one point per state, as illustrated in Fig. 3b), and then averaged over the two FRIS reference years (2013 and 2018). Results for the two years evaluated separately are provided in the Supplementary Material (Table S1). To ensure consistency with the FRIS-reported units (km3 yr−1 per state), IWU estimates originally expressed in millimetres were converted to cubic kilometres by multiplying by each state's area.
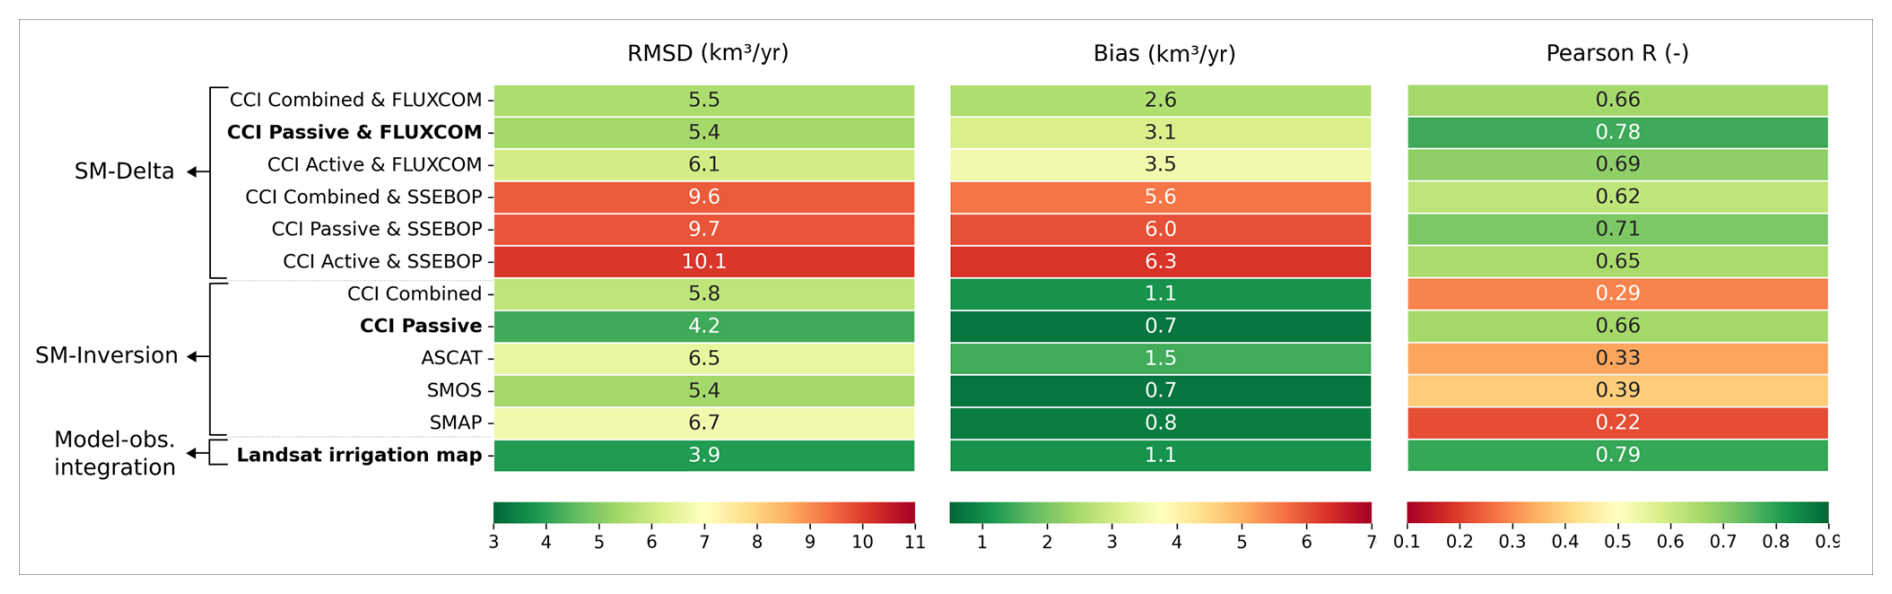
Figure 2Performance metrics for CONUS: spatial RMSD, bias, and Pearson correlation (R) between state-level FRIS observations (km3 yr−1) and aggregated IWU estimates for each method-inputs combination, averaged over the 2013 and 2018 years. The best-performing dataset for each approach is highlighted in bold.
For SM-based Delta datasets, those relying on ET from SSEBop show the weakest agreement with the reference data, with mean RMSD of 9.6–10.1 km3 yr−1 and biases of 5.6–6.3 km3 yr−1. In contrast, SM-based Delta datasets using FLUXCOM ET perform better, with mean RMSD ranging from 5.4–6.1 km3 yr−1, biases of 2.6–3.5 km3 yr−1, and higher correlations.
For the SM-based Inversion approach, the CCI Passive dataset shows the closest agreement with the reference data, combining a low mean RMSD (4.2 km3 yr−1) and bias (0.7 km3 yr−1) with the highest correlation (R = 0.66) among all SM-based Inversion products. The CCI Combined dataset also performs reasonably well (RMSD = 5.8 km3 yr−1, bias = 1.1 km3 yr−1, R = 0.29), whereas datasets based on ASCAT, SMOS, and SMAP show weaker performance, with generally higher RMSD values (5.4–6.7 km3 yr−1) and lower correlations (R = 0.22–0.39).
For the Model-observation integration approach, the Landsat-derived irrigation map dataset performs within the same range as the better SM-based datasets, with a mean RMSD of 3.9 km3 yr−1, a mean bias of 1.1 km3 yr−1, and a mean correlation of R=0.79.
Overall, the best-performing SM-based datasets are CCI Passive & FLUXCOM for the SM-based Delta approach and CCI Passive for the SM-based Inversion approach. Together with the Landsat-based dataset from the Model-observation integration approach, these three products were retained for further analysis in this region.
3.1.2 Spatial patterns and state-level agreement
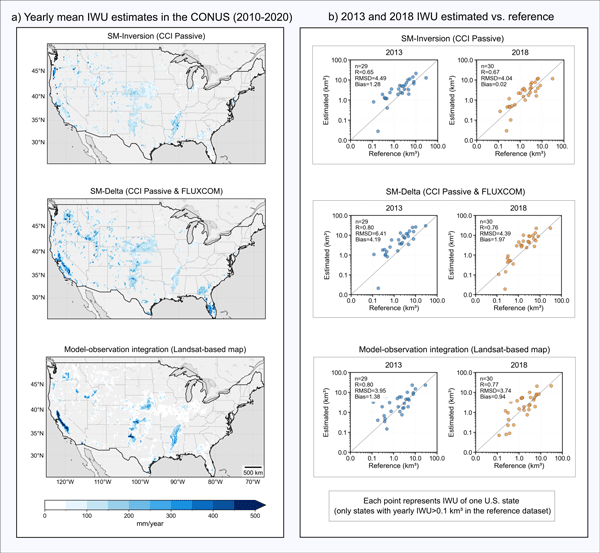
Figure 3a shows mean annual IWU over CONUS (2010–2020) for the three selected datasets. The major irrigation regions identified in Fig. 1 (California Valley, Snake River Plain, Great Plains, and Mississippi Floodplain) emerge, particularly in the Model-observation integration dataset. Figure 3b presents state-level scatterplots comparing estimated and observed IWU volumes for 2013 (blue) and 2018 (orange), highlighting year-specific relationships and associated performance metrics.
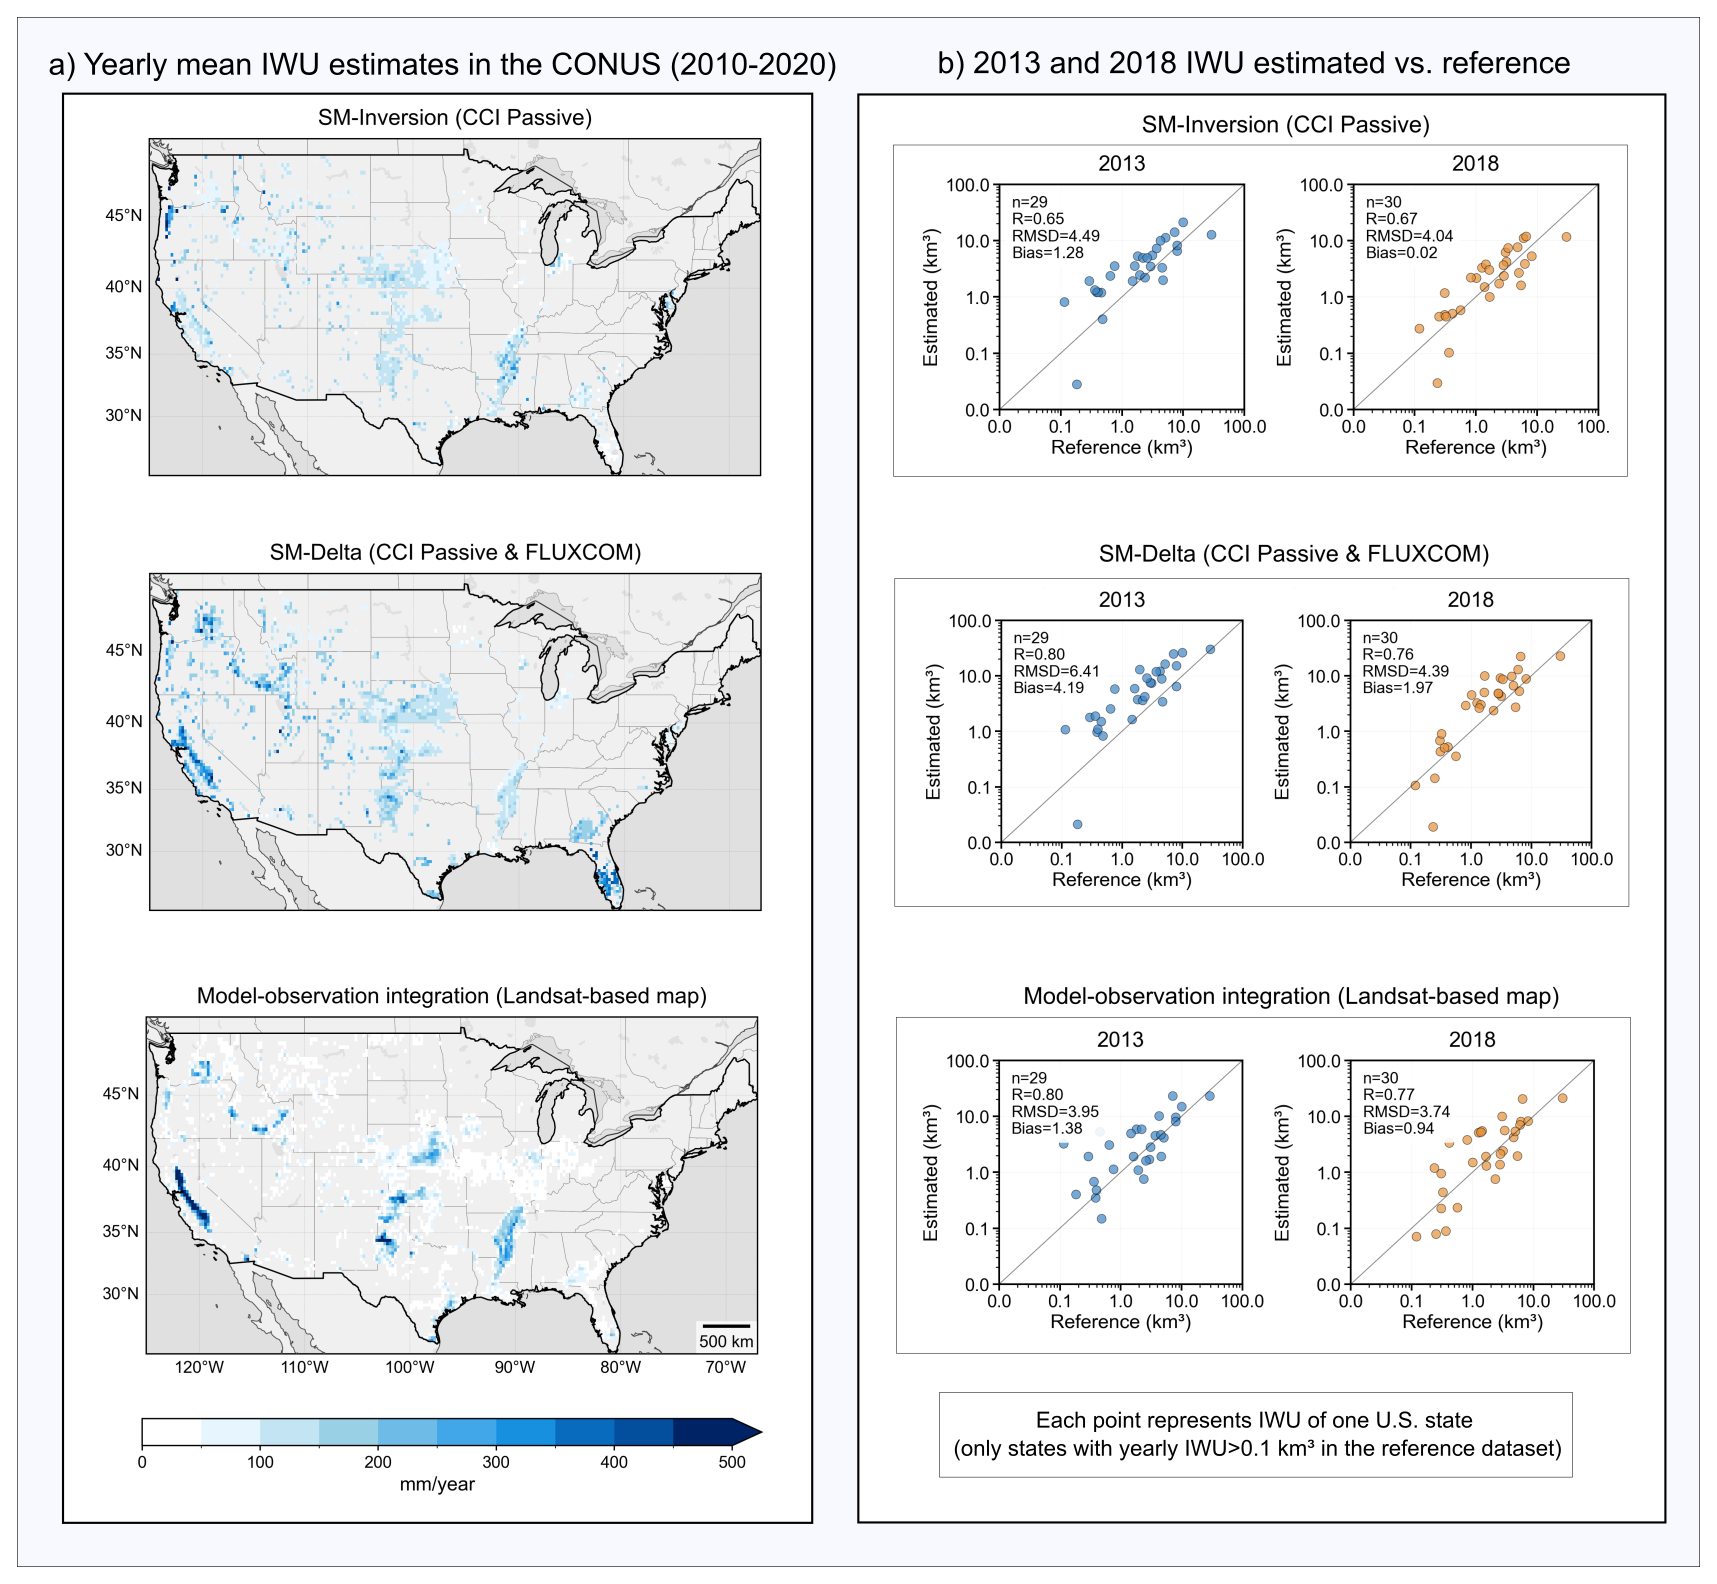
Figure 3(a) Spatial distribution of mean annual IWU (2010–2020) over CONUS derived from the three approaches: SM-based Inversion (CCI Passive), SM-based Delta (CCI Passive & FLUXCOM), and Model-observation integration (Landsat-based irrigation map). (b) State-level scatterplots comparing estimated IWU volumes (km3) from each dataset with observed FRIS irrigation volumes for 2013 and 2018.
The three IWU datasets exhibit distinct spatial patterns, which reflect the information content and assumptions of each approach. The SM-based Inversion (CCI Passive) dataset shows a relatively uniform distribution, with most pixels ranging between 50 and 150 mm yr−1, consistent with the spatially averaged and potentially weak irrigation signal that may result from inferring irrigation primarily from soil moisture variations at 0.25° resolution. In contrast, the SM-based Delta (CCI Passive & FLUXCOM) dataset displays a west-east gradient, with many western areas exceeding 150 mm yr−1 (locally >350 mm yr−1), while the Mississippi Floodplain generally remains below 50 mm yr−1, with the notable exception of Florida, where locally higher values are observed; the stronger spatial gradients in this approach likely reflect the additional use of ET differences, which are generally more sensitive to irrigation than near-surface soil moisture at this scale (Crow et al., 2025). The Model-observation integration dataset shows the strongest spatial heterogeneity, highlighting distinct irrigation hotspots: parts of the California Valley exceed 500 mm yr−1, while the Mississippi Floodplain typically exhibits values between 150 and 200 mm yr−1; this heterogeneity is largely inherited from the LGRIP30 irrigated-area fraction used to scale simulated irrigation within each 0.25° grid cell.
3.1.3 Time series and seasonal cycles
Figure 4 shows monthly IWU estimates from SM-based Inversion (CCI Passive, blue line), SM-based Delta (CCI Passive & FLUXCOM, green line), and Model-observation integration (Landsat-based map, red line) for the Great Plains, California Valley, Snake River Plain, and Mississippi Floodplain over 2010–2020. These four major irrigated regions, defined as in Fig. 1 (top-left panel), span a strong climatic gradient, from the arid western domains (California Valley, Snake River Plain) to the more humid Great Plains and Mississippi Floodplain. Values are spatially averaged by region, and mean seasonal cycles are also displayed.
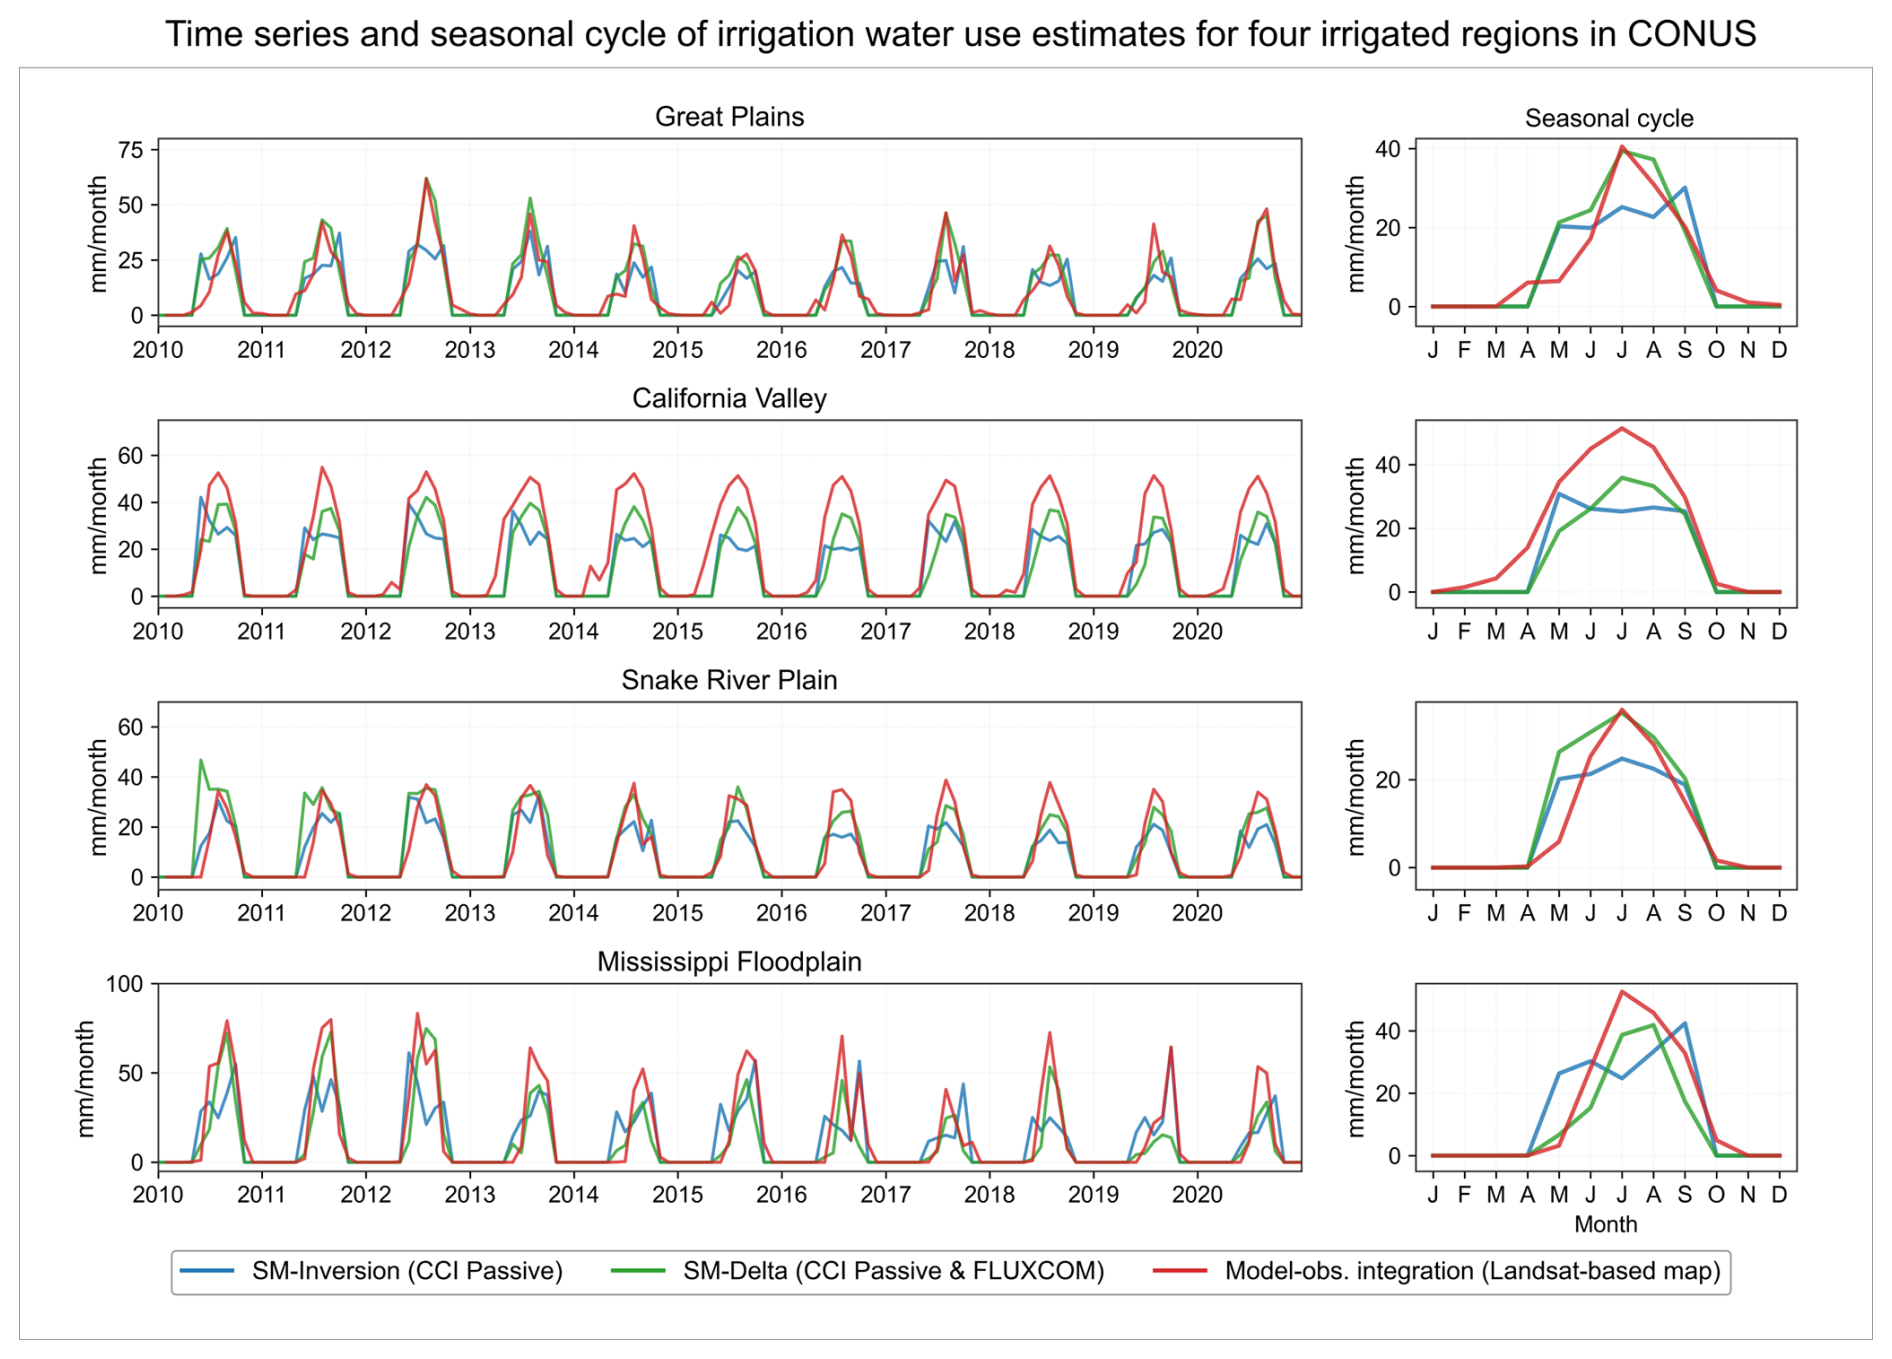
Figure 4Monthly IWU (2010–2020) estimated by the three approaches over four major irrigated regions in the CONUS: Great Plains, California Valley, Snake River Plain, and Mississippi Floodplain. SM-based Delta (CCI Passive & FLUXCOM, in green), SM-based Inversion (CCI Passive, in blue), and Model-observation integration (Landsat-based map, in red) estimates are spatially averaged by region. Mean seasonal cycles are shown in the right panels.
Both the SM-based Delta and Model-observation integration datasets reproduce the July–August irrigation peak and show similar interannual variability, especially in the Great Plains. By contrast, the SM-based Inversion (CCI Passive) dataset yields lower summer IWU volumes and displays a different seasonal cycle. The SM-based estimates always start in April and end in September by design, whereas model-based irrigation sometimes starts earlier (in the Great Plains and California Valley) and continues slightly later in the year, which may reflect the absence of explicit harvest timing in the model (De Lannoy et al., 2024).
3.2 Ebro Basin
3.2.1 Summary of performance
Figure 5 presents a heatmap of RMSD, bias, and Pearson correlation (R) between observed monthly IWU and the generated IWU datasets at the aggregated district level in the eastern Ebro Basin over 2007–2020. Metrics were computed only for the irrigation season (April–October), and only pixels with at least 25 % of their surface area within the irrigation districts were retained.
Among the six SM-based Delta datasets, performance is relatively consistent, with all products underestimating irrigation volumes (mean bias of about −20 mm per month). The best agreement is obtained for the SM-based Delta (CCI Passive & FLUXCOM) and SM-based Delta (CCI Combined & SSEBop) configurations, with correlations of R=0.63 and R=0.60, RMSD of 29.0 and 27.3 mm per month, and biases of −17.1 and −17.2 mm per month, respectively.
For the SM-based Inversion datasets, the CCI Passive dataset performs best, with R of 0.63, RMSD of 30.0 mm per month, and bias of −23.0 mm per month, yielding results comparable to the best SM-based Delta products. Other SM-based Inversion datasets show weaker agreement, with lower correlations and larger negative biases.
Overall, the best-performing datasets are CCI Passive & FLUXCOM for the SM-based Delta approach and CCI Passive for the SM-based Inversion approach. These two datasets are therefore retained for further analysis in this region.
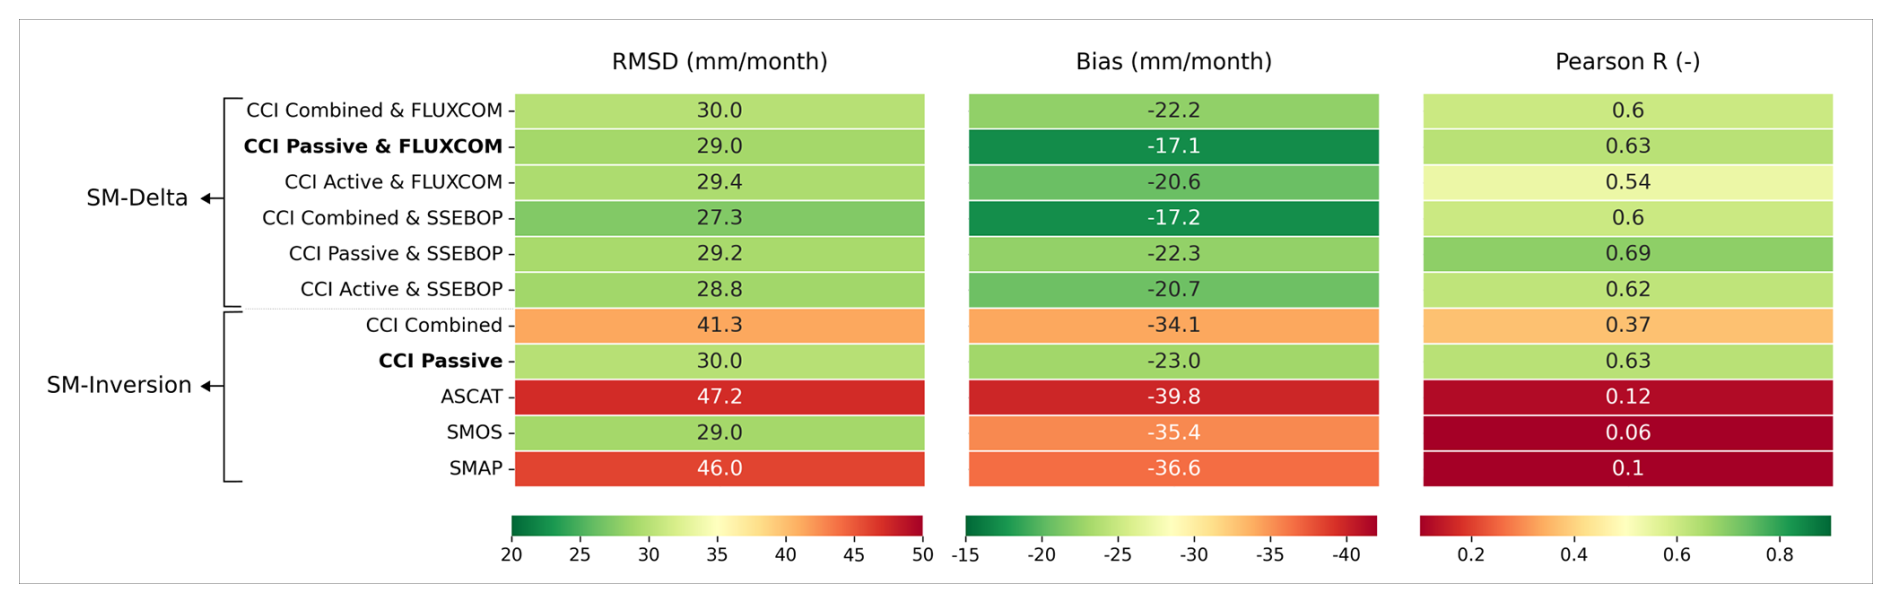
Figure 5Performance metrics in the Ebro Basin: RMSD, bias, and Pearson correlation (R) between observed monthly IWU at the aggregated district level and estimates from each method-inputs combination (2007–2020). The best-performing dataset for each approach is highlighted in bold.
3.2.2 Time series, seasonal cycles, and spatial patterns
Figure 6a shows monthly in situ IWU observations (grey shading) together with estimates from SM-based Delta (CCI Passive & FLUXCOM, green line) and SM-based Inversion (CCI Passive, blue line), averaged over the merged irrigation districts for 2007–2020. Both datasets capture the timing of the irrigation season, with a marked peak in June–August, but they consistently underestimate irrigation volumes. They exhibit stronger interannual variability compared to in situ observations but show similar year-to-year fluctuations among themselves, suggesting that both methods respond similarly to interannual forcing in this region despite their different formulations.
Figure 6b shows maps of mean annual IWU over 2003–2020 for the two datasets. The SM-based Delta (CCI Passive & FLUXCOM) dataset indicates higher IWU in the eastern basin, broadly consistent with the distribution of irrigated areas in GMIA v5 (see Fig. 1). The SM-based Inversion (CCI Passive) dataset also exhibits a heterogeneous pattern, with localised hotspots of high IWU, including the Ebro Delta in the south-east, a region of intensive irrigation. These differences are consistent with the methodological characteristics discussed for the CONUS (Sect. 3.1.2). The consistent underestimation by both datasets may partly result from the dilution of irrigation signals within 0.25° grid cells, as the irrigated districts in this region are relatively small and fragmented. The location and extent of the irrigation districts with available in situ observations are shown in Fig. 6c.
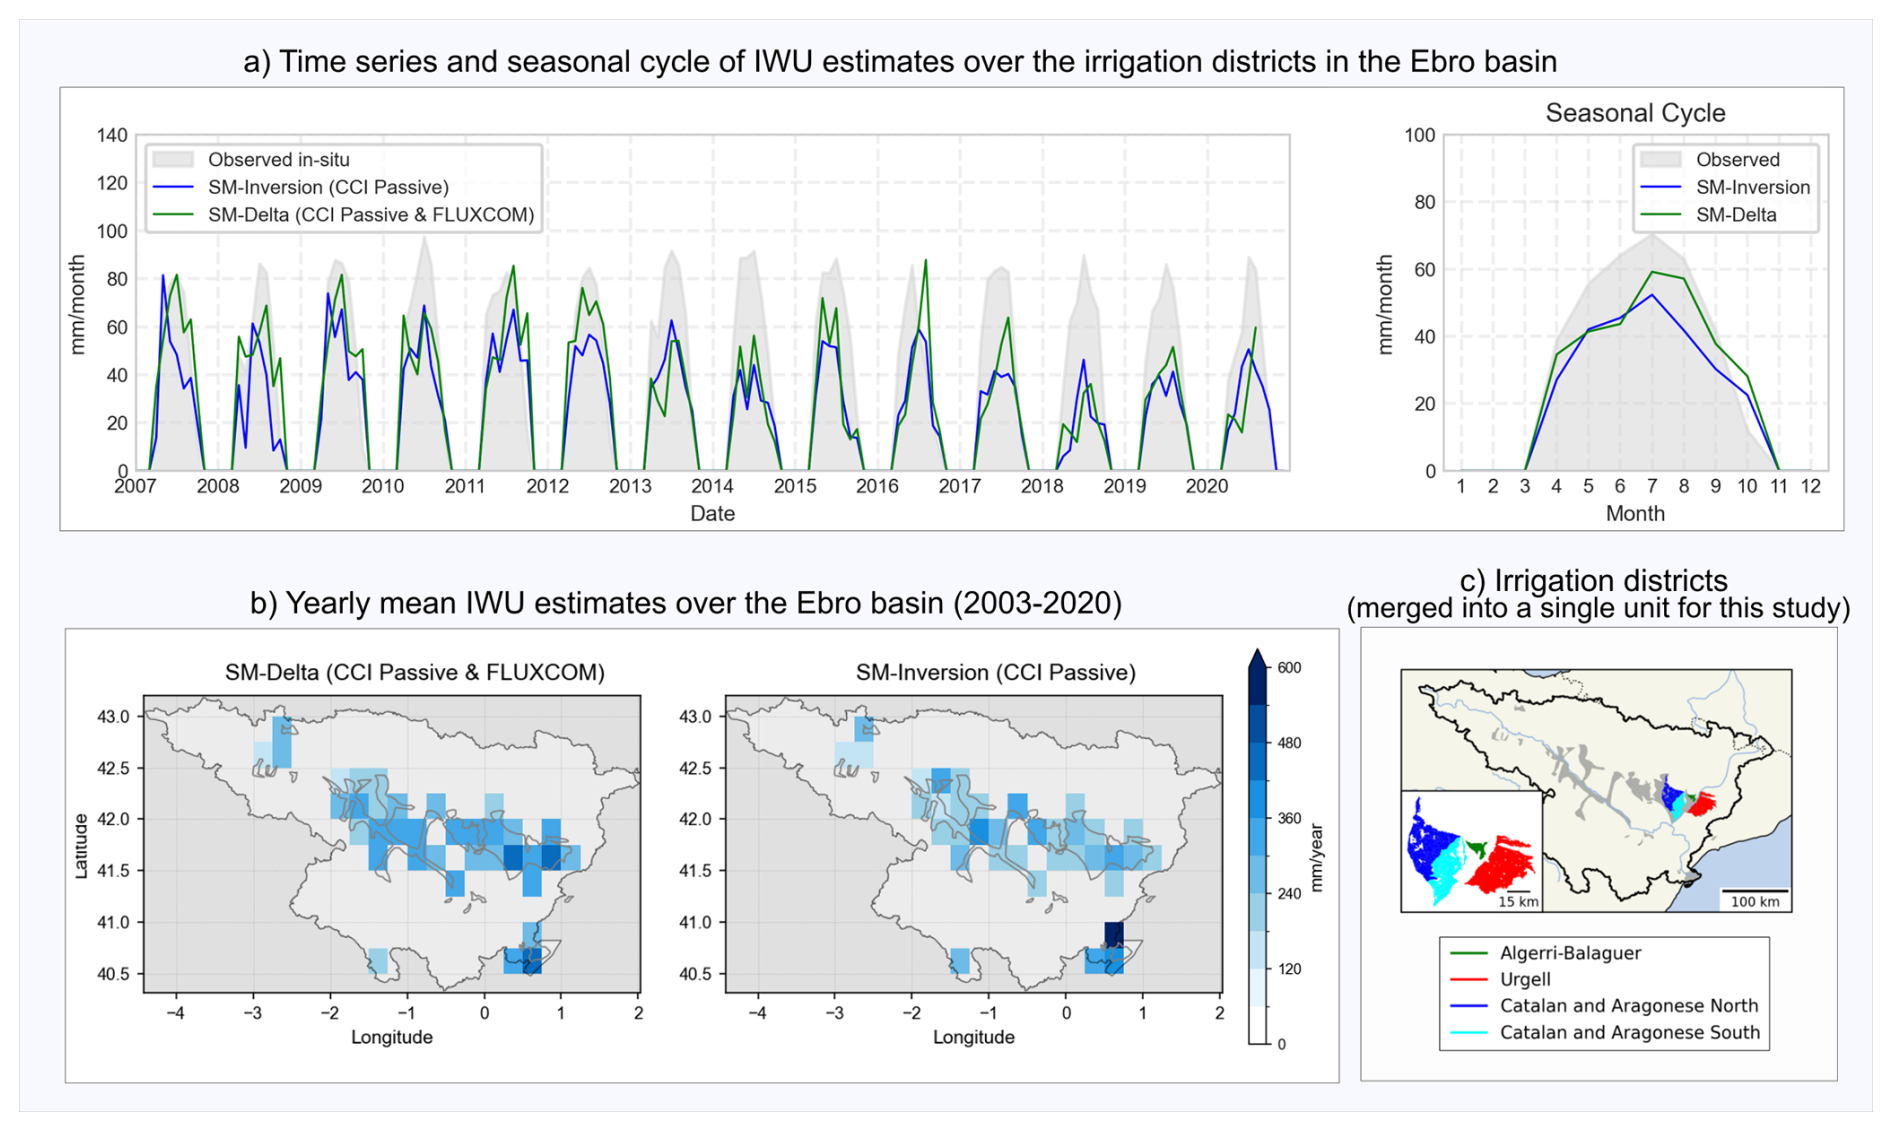
Figure 6(a) Monthly IWU time series (2007–2020; left) and mean seasonal cycle (right) averaged over the Ebro irrigation districts, compared with in situ observations (grey shading). (b) Spatial distribution of mean annual IWU (2003–2020) from SM-based Delta (CCI Passive & FLUXCOM; left) and SM-based Inversion (CCI Passive; right). (c) Location and extent of the four irrigation districts (Urgell, Algerri–Balaguer, North Catalan and Aragonese, and South Catalan and Aragonese), merged into a single unit for this study.
3.3 Murray-Darling Basin
3.3.1 Summary of performance
Figure 7 presents a heatmap of RMSD, bias, and Pearson correlation (R) between monthly observed IWU and the corresponding estimates from each method-input combination. Metrics are computed over the irrigation season (September–March) and averaged across the four irrigation districts of the Murray–Darling Basin, with values reported as mean ± standard deviation across districts. Evaluation periods vary by dataset according to data availability, and only pixels whose centroids fall within district boundaries were included. District-level metrics are provided in the Supplement (Tables S2–S3).
For all datasets, performance varies considerably across the four irrigation districts, as indicated by the large standard deviations. Among the SM-based Delta products, those using SSEBop ET generally outperform those using FLUXCOM ET. The CCI Combined & SSEBop dataset, in particular, shows the most balanced performance across the three metrics, with the lowest RMSD (13.5 ± 1.9 mm per month), a moderate bias (3.8 ± 2.7 mm per month), and relatively higher correlations (). For SM-based Inversion, CCI Combined, CCI Passive, and SMAP datasets perform best. SMAP shows the lowest mean RMSD (12.5 ± 2.6 mm per month) and lower bias (5.6 ± 2.6 mm per month), but is limited to the post-2015 period. CCI Passive reaches the highest mean correlation (), while CCI Combined provides a more balanced trade-off between RMSD and bias. The Model-observation integration dataset achieves the highest mean correlation overall (), but with large bias and substantial variability between districts.
No single method–input combination performs best across all districts, as reflected by the large standard deviations. However, some datasets show comparatively better and more consistent results across the three metrics and the four districts. For the following analysis, we therefore retain one representative dataset from each approach: SM-based Delta (CCI Combined & SSEBop), SM-based Inversion (CCI Combined), and Model-observation integration (Landsat-based map).
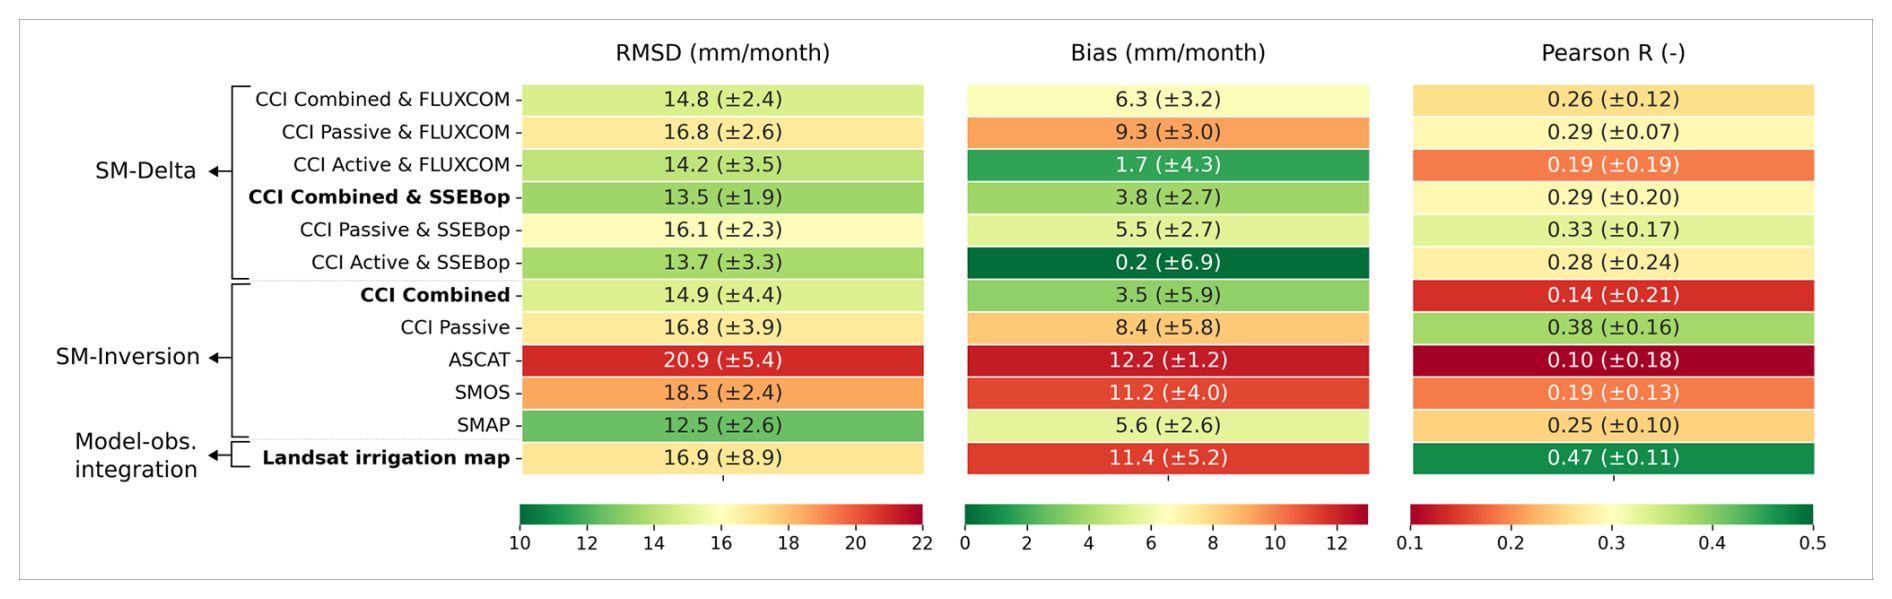
Figure 7Heatmap of district-averaged performance metrics for the Murray–Darling Basin. Values represent mean monthly RMSD, bias, and Pearson correlation (R), with “±” indicating inter-district standard deviation.
3.3.2 Time series, seasonal cycles, and spatial patterns
Figure 8a shows monthly IWU time series and mean seasonal cycles for the four Murray–Darling irrigation districts (districts shown in panel c), with in situ IWU in shaded grey and estimates from the three selected datasets SM-based Delta (CCI Combined & SSEBop), SM-based Inversion (CCI Combined), and Model-observation integration (Landsat-based map) in colour. All datasets exhibit substantial interannual variability, but their temporal fluctuations show limited agreement with the observed records.
The Model-observation integration dataset tends to overestimate IWU, except in the Murrumbidgee district, where values are closer to the observations than in other regions. The SM-based Delta (CCI Combined & SSEBop) and SM-based Inversion (CCI Combined) datasets exhibit IWU magnitudes generally closer to the observations than the Model-observation integration dataset, though both substantially overestimate in the Murray Wakool district. When averaged over all years, the mean seasonal cycle shows that only the Model-observation integration dataset reproduces the distinct January peak also seen in the in situ records.
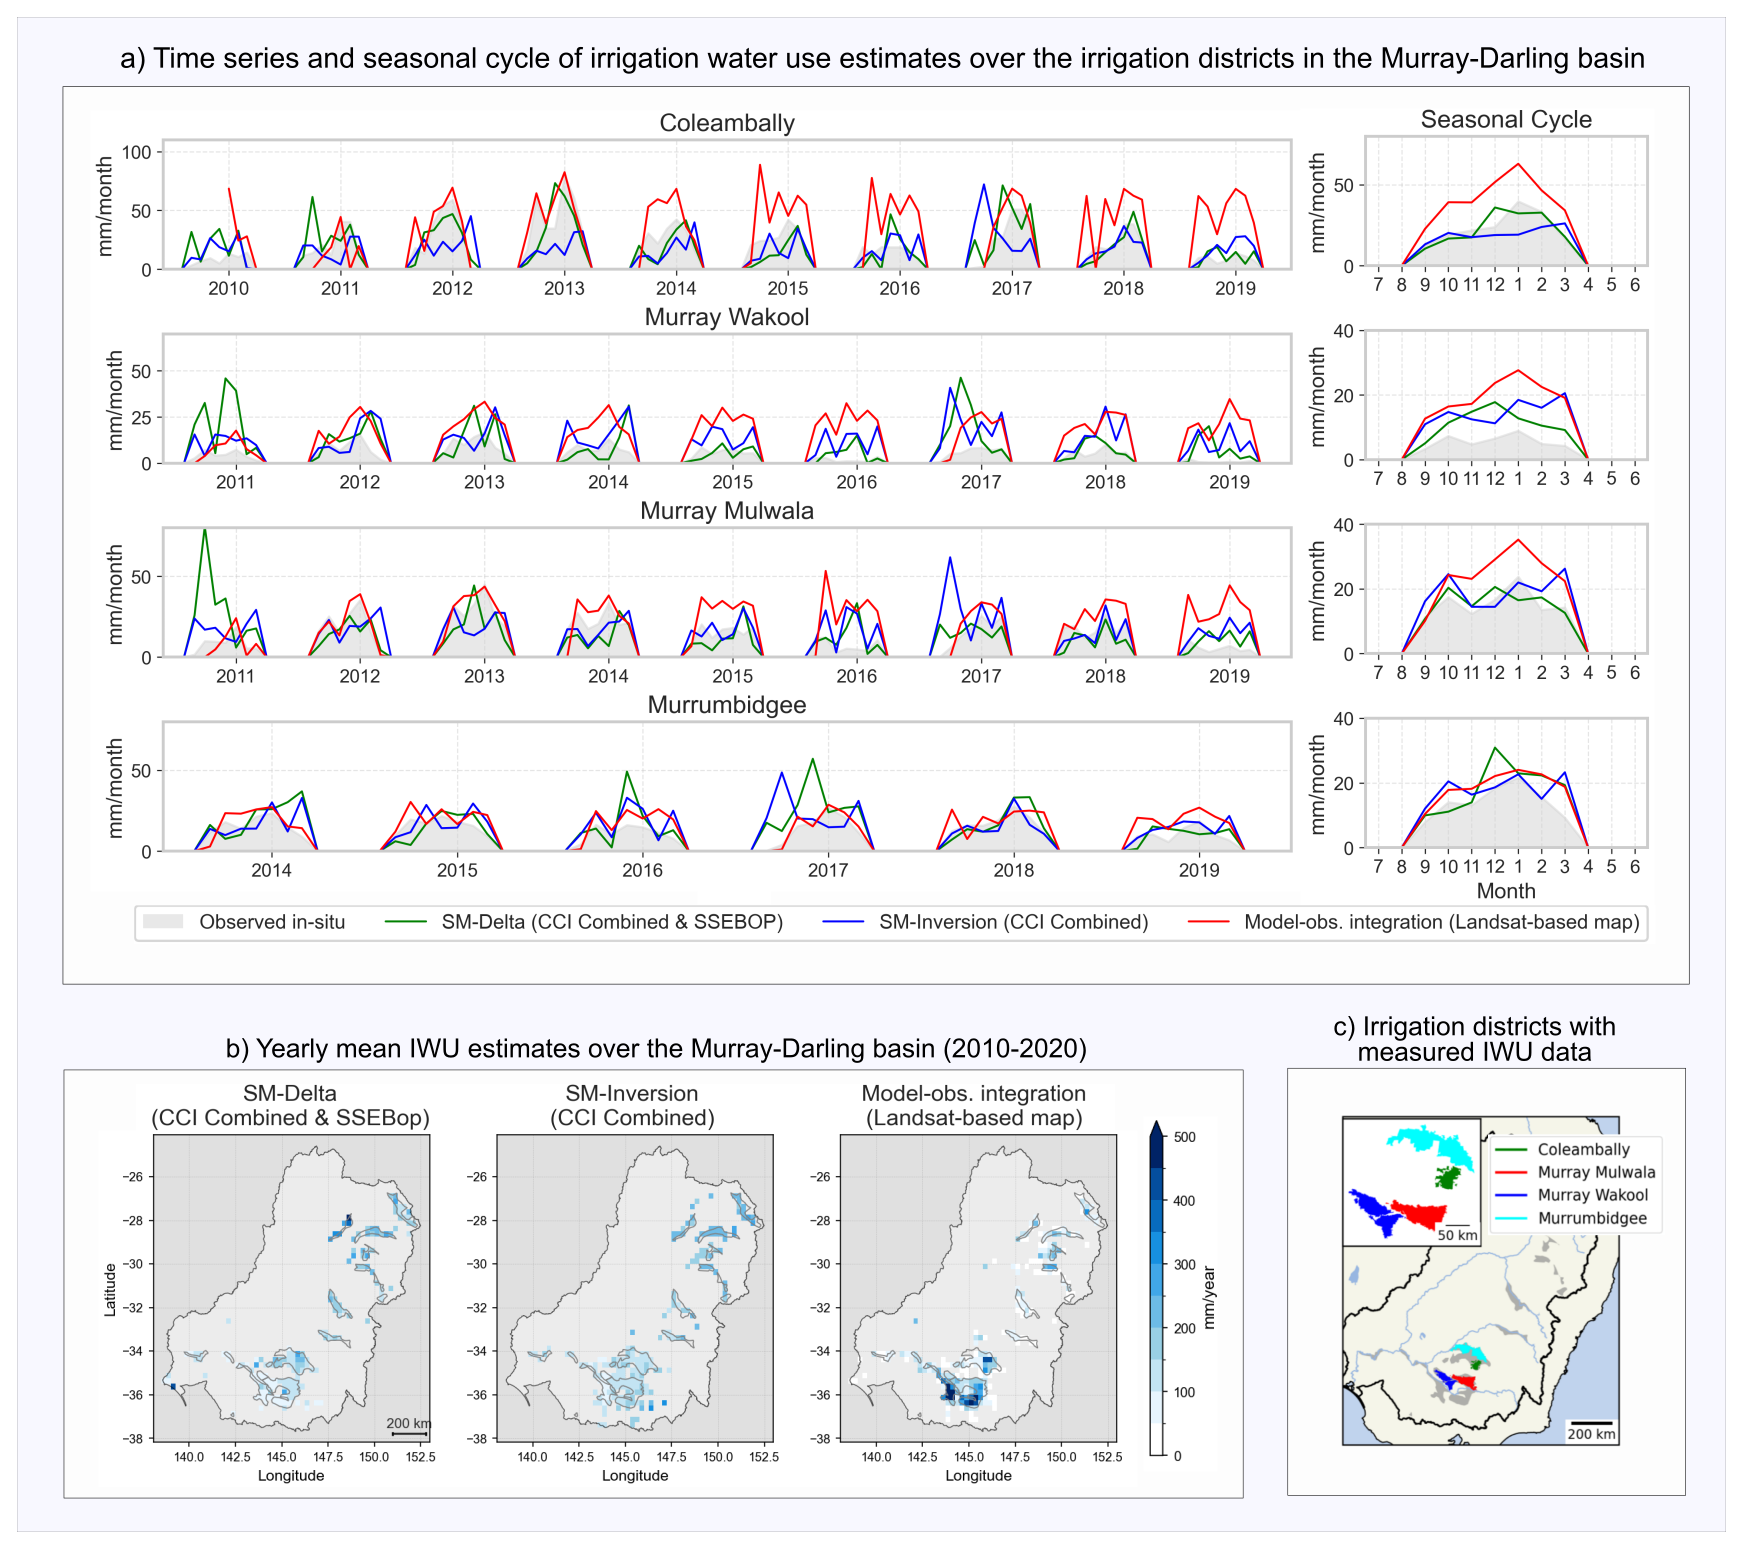
Figure 8(a) Monthly IWU time series (left) and mean seasonal cycles (right) for four irrigation districts in the Murray-Darling Basin, with in situ observations (grey) and estimates from the three selected datasets: SM-based Delta (CCI Combined & SSEBop, in green), SM-based Inversion (CCI Combined, in blue), and Model-observation integration (Landsat-based map, in red). (b) Spatial distribution of mean annual IWU (2010–2020) from the three selected datasets. (c) Location and extent of the four irrigation districts.
Figure 8b shows maps of mean annual IWU (2010–2020) for the three selected datasets. SM-based Delta (CCI Combined & SSEBop) yields values mostly between 100 and 250 mm yr−1, with higher values in the northwest of the basin. SM-based Inversion (CCI Combined) also ranges between 100 and 250 mm yr−1 but is more spatially uniform, with slightly higher values in the northern part. In contrast, the Model-observation integration dataset shows marked spatial heterogeneity, with the highest values (locally exceeding 500 mm yr−1) concentrated in the southern basin.
As in the CONUS (Sect. 3.1.2), the SM-based approaches produce more spatially uniform patterns, while the Model-observation integration dataset concentrates irrigation where the LGRIP30 map indicates the highest irrigated-area fractions. The overestimation by the latter in several districts likely reflects the parameterisation of the Noah-MP land surface model, including irrigation-triggering thresholds and soil hydraulic properties.
3.4 India (Gangetic Plain)
3.4.1 Mean IWU estimates across datasets
Table 4 summarises monthly mean IWU over the Gangetic Plain (aggregation domain shown in Fig. 9c) for three SM-based Delta and six SM-based Inversion datasets. Values are reported separately for two cropping seasons, Rabi (November–March) and Zaid (April–June), while the Kharif season (July–October) is excluded due to temporal masking. The “Annual” column corresponds to the mean over the combined November–June period. Reported values represent the mean over the full temporal coverage of each dataset, which varies depending on data availability (see the “Period” column in Table 4).
Table 4Mean monthly IWU (± standard deviation) (in mm) over the Gangetic Plain for SM-based Delta and SM-based Inversion datasets. Values are reported separately for the Rabi (November–March) and Zaid (April–June) seasons, and for the combined November–June period (“Annual” column). The Kharif season (July–October) is excluded due to temporal masking. The rightmost column indicates the period over which the mean IWU values were computed for each dataset.
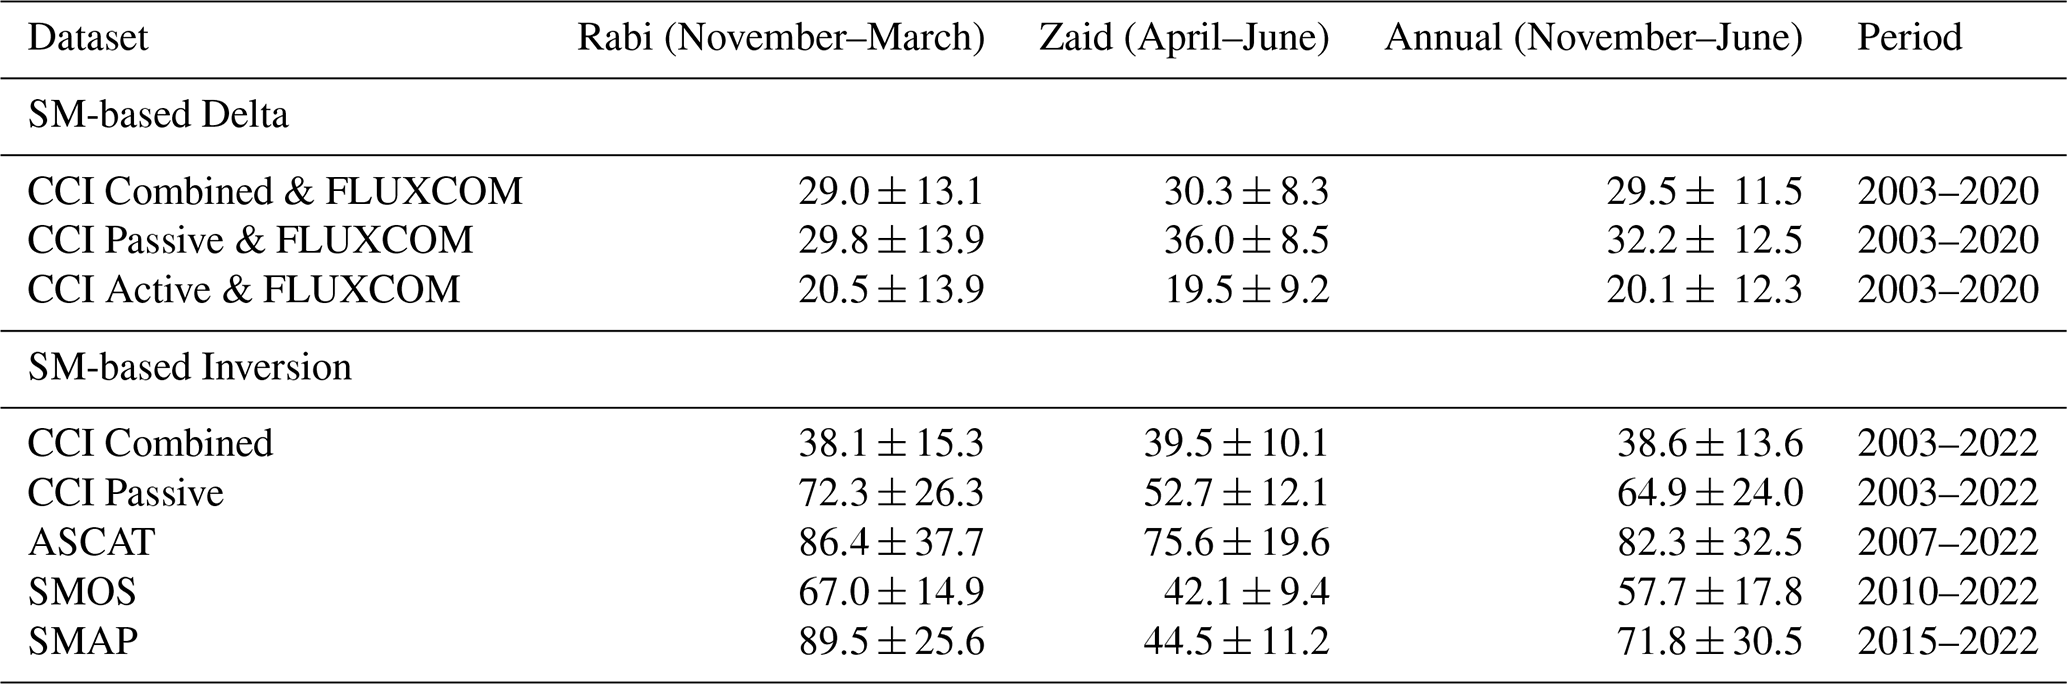
SM-based Delta datasets yield annual mean IWU values between 20 and 32 mm per month, with relatively small differences between the Rabi and Zaid seasons. The associated standard deviations (8 to 14 mm per month) indicate marked month-to-month and interannual variability, generally higher during Rabi than during Zaid. SM-based Inversion datasets exhibit a much wider range of annual IWU, from about 39 mm per month (CCI Combined) to more than 80 mm per month (ASCAT), together with higher variability. Within this group, the CCI Combined product is the closest in magnitude and variability to the SM-based Delta datasets, whereas the other products (CCI Passive, ASCAT, SMOS, SMAP) systematically yield larger totals.
For the following analyses, we focus on SM-based Delta (CCI Combined & FLUXCOM) and SM-based Inversion (CCI Combined), as they provide the most consistent estimates across methods and align reasonably well with the magnitudes reported by Kragh et al. (2023). Since no direct validation data are available, this does not imply that these datasets are necessarily closer to real IWU, but they offer a pragmatic choice to ensure comparability between approaches.
3.4.2 Temporal dynamics and spatial distribution
Figure 9a shows monthly IWU time series (2003–2020) from the two selected datasets averaged over the Gangetic Plain, with the monsoon months (July–October) excluded. Both datasets generally reproduce a dominant Rabi season (November–March) and a smaller Zaid peak (April–June). The main difference lies in the timing and magnitude of the Rabi maximum: SM-based Inversion (CCI Combined) produces sharper and higher peaks in November–December, whereas SM-based Delta (CCI Combined & FLUXCOM) yields smoother dynamics, generally peaking in March.
Because the monsoon period (Kharif; July–October) is masked, both datasets likely miss an irrigation peak typically associated with this cropping phase. This is supported by FAO crop calendars (FAO, 2010), which indicate widespread irrigation for rice, maize, and other water-demanding crops during the monsoon months. For the Rabi season, the simulated magnitudes (10–50 mm per month, with a March maximum) are consistent with previous findings by Kragh et al. (2023), particularly matching the SM-based Delta (CCI Combined & FLUXCOM) dataset pattern.
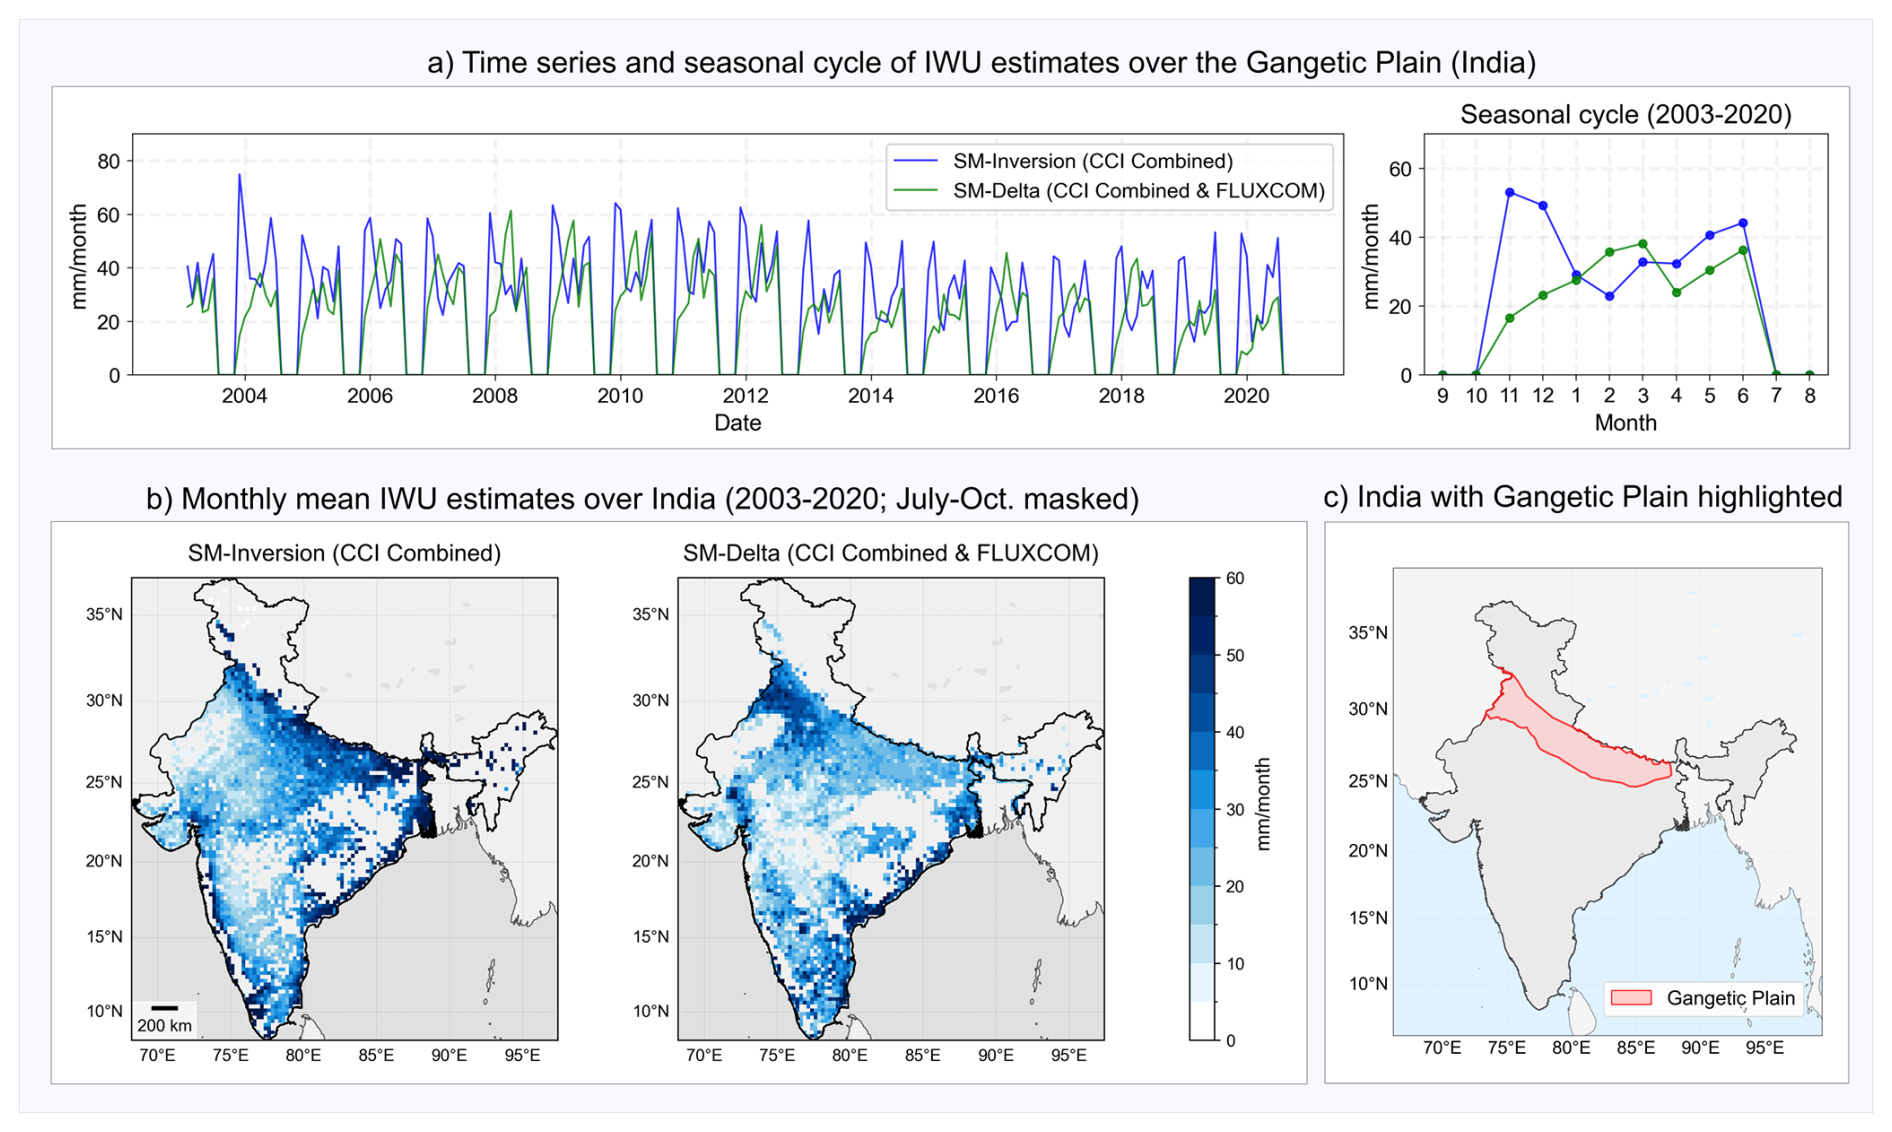
Figure 9(a) Monthly IWU time series (left) and mean seasonal cycle (right) over the Gangetic Plain derived from SM-based Inversion (CCI Combined, in blue) and SM-based Delta (CCI Combined & FLUXCOM, in green), with monsoon months (July–October) masked. (b) Spatial distribution of monthly mean IWU (2003–2020) over India for both approaches (computed over November–June). (c) Extent of the Gangetic Plain used for aggregation.
Spatially, both datasets (Fig. 9b) identify the Gangetic Plain as an important irrigation hotspot. In this area, SM-based Delta (CCI Combined & FLUXCOM) shows values mostly between 20 and 50 mm per month, with higher levels (40–60 mm per month) in the northwestern part of the plain, near the Indus Basin. SM-based Inversion (CCI Combined) presents a more uniform distribution across the plain, with elevated values in the eastern part (around 40–60 mm per month).
The wider inter-method spread in India compared to other regions likely reflects the different climatic conditions and the complexity of the irrigation landscape, with widespread and multi-seasonal irrigation, which amplifies the sensitivity differences between methods discussed in Sect. 3.1.2.
4.1 SM-based approaches: methodological considerations
The SM-based Delta and SM-based Inversion approaches rely on SM and ET datasets that provide indirect signatures of irrigation and remain affected by retrieval uncertainties. Satellite SM is sensitive only to the near-surface layer, so irrigation signals may be weak depending on infiltration rates, timing relative to satellite overpasses, or irrigation method. In addition, SM retrievals tend to saturate in wet or frequently irrigated conditions. ET products are likewise influenced by methodological assumptions and uncertainties in their inputs, such as land surface temperature, vegetation parameters, and meteorological forcing.
Differences in IWU estimates obtained when using alternative SM or ET datasets reflect this sensitivity and are consistent with the spread reported among ET products in irrigated regions (e.g., Laluet et al., 2026) and among SM retrievals (e.g., Escorihuela and Quintana-Seguí, 2016; García-García et al., 2026). At the 0.25° resolution considered here, irrigation signals in SM and ET datasets can also be diluted in regions where irrigated areas are small or highly fragmented (e.g., Zappa et al., 2022; Dari et al., 2023), which further limits detectability.
Although these limitations are partly intrinsic to the EO datasets, methodological refinements may help characterise their impact. In particular, current SM-based IWU products do not include formal uncertainty estimates; future developments could incorporate ensemble or Monte Carlo perturbations of key inputs (e.g., SM, ET, precipitation, irrigated-area masks) to quantify the robustness of the retrieved irrigation signal. The SM-based approaches also rely on fixed thresholds, such as the 0.12 relative SM increase filter in the Delta method (Zaussinger et al., 2019) or the 5 % GMIA irrigation mask, which were adopted from previous studies and applied uniformly across regions. Assessing the sensitivity of the IWU estimates to these settings would help further characterise the robustness of the retrieved irrigation signal.
4.2 Model-observation integration: methodological considerations
The Model-observation integration dataset inherits several structural assumptions from the underlying land surface model. These include the parameterisation of soil hydraulic properties, the formulation of irrigation-triggering thresholds, and the use of a generic vegetation representation, all of which influence the magnitude and spatial distribution of simulated irrigation. Such assumptions may contribute to regional overestimation, as observed in parts of the Murray-Darling Basin.
Potential improvements include the introduction of crop-specific parameterisations and the optimisation of irrigation-related parameters, as well as the sequential assimilation of satellite observations to better constrain SM and irrigation dynamics (De Lannoy et al., 2024). At the 0.25° spatial resolution, irrigation is applied uniformly over the model grid cell, which cannot fully represent sub-grid variability in irrigation practices and may influence the simulated irrigation amounts (Modanesi et al., 2025). In addition, the scaling of simulated irrigation by the irrigated-area fraction depends on the accuracy of the underlying irrigated-area map (here LGRIP30), which directly affects the spatial pattern of the resulting IWU estimates.
Current uncertainty estimates are solely based on perturbations of the meteorological forcing. Developing ensembles that also vary irrigated-area maps and key land-surface parameters would provide a more comprehensive characterisation of structural uncertainty in this approach.
4.3 Irrigated-area maps and their influence on IWU estimates
An additional source of uncertainty relates to the irrigated-area maps used across the three approaches. The SM-based Delta and SM-based Inversion methods use GMIA v5, representing conditions around 2005, while the Model-observation integration approach uses the Landsat-derived LGRIP30 map for the year 2015. Neither map captures temporal changes in irrigation extent, which may affect long-term IWU estimates in regions where irrigated areas have evolved over the study period. The main irrigated regions analysed here have generally exhibited relatively stable irrigation extents over the last two decades (Mehta et al., 2024), although local changes may still have occurred. Future developments could benefit from recently available temporally resolved irrigation maps (e.g., Kebede et al., 2025) to better account for such changes.
4.4 Data availability and validation constraints
The evaluation of the IWU datasets is restricted to regions and periods where irrigation records are available (CONUS and selected districts within the Ebro and Murray-Darling Basins). Outside these domains, data quality can only be assessed indirectly, for example, through consistency with irrigated-area maps or crop calendars. The reference datasets themselves also contain uncertainties: survey-based annual estimates (e.g., FRIS) may be affected by reporting or sampling limitations, and district-level time series in the Ebro and Murray-Darling Basins may be influenced by measurement uncertainties or changes in monitoring practices. Expanding and improving the availability of observational irrigation data would greatly support future validation and benchmarking efforts.
4.5 Recommendations for users
Given the methodological and data-related considerations outlined above, the IWU datasets should be interpreted with care, especially in regions where uncertainties cannot be directly evaluated due to the lack of validation data. Users are encouraged to assess spatial and temporal patterns in conjunction with ancillary information, such as irrigated-area maps, meteorological conditions, and crop calendars.
Beyond these interpretation guidelines, the datasets are primarily designed as a coordinated benchmarking resource for the irrigation research community, supporting large-scale analyses, intercomparison exercises (e.g., Dari et al., 2025a), and model benchmarking, rather than as ready-to-use products for specific applications. Combining them with complementary observations or model outputs can further support robust interpretation and help mitigate uncertainties associated with individual datasets. Users should consider the evaluation results presented in Sect. 3 when assessing the suitability of specific datasets for their intended use.
All irrigation water use datasets described in this paper are openly available on Zenodo: https://doi.org/10.5281/zenodo.14988197 (Laluet et al., 2025). In situ reference data are available from the following sources:
-
Ebro basin irrigation districts: Automatic Hydrologic Information System of the Ebro River Basin (SAIH Ebro), available at http://www.saihebro.com/saihebro/index.php?url=/datos/canales (Confederaci´n Hidrográfica del Ebro, 2026; last access: 6 July 2026).
-
CONUS: Farm and Ranch Irrigation Survey (FRIS), produced by the National Agricultural Statistics Service (NASS), United States Department of Agriculture (USDA), available at https://www.nass.usda.gov/Surveys/Guide_to_NASS_Surveys/Farm_and_Ranch_Irrigation/index.php (USDA NASS, 2019; last access: 6 July 2026).
No dedicated code repository is available. Data processing and analysis steps are described in Sects. 2 and 3.
This study presents a coordinated archive of long-term IWU datasets for four major irrigated regions worldwide, produced at 0.25° spatial resolution and a monthly time step. The archive combines three distinct approaches – SM-based Delta, SM-based Inversion, and Model-observation integration – implemented with multiple soil moisture, evapotranspiration, and irrigated-area datasets. The number of available products varies by region depending on input data availability, with up to six SM-based Delta products, five SM-based Inversion products, and one Model-observation integration product. Beyond dataset generation, the study provides a first multi-regional assessment of the consistency and behaviour of these IWU retrieval approaches over extended time periods.
Validation against in situ irrigation records in the CONUS, Ebro, and Murray-Darling Basins shows that several datasets reproduce the main features of the seasonal irrigation cycle and the broad spatial patterns of irrigation. However, notable differences remain in both magnitude and timing across methods and relative to the reference data. The Model-observation integration approach tends to emphasise irrigation hotspots inherited from the irrigated-area maps, whereas the SM-based approaches produce smoother spatial patterns, reflecting the coarser resolution and retrieval sensitivities of soil moisture and evapotranspiration products. Interannual variability is only partly captured, primarily due to methodological limitations; the limited availability of multi-year ground-based irrigation records further constrains our ability to evaluate this aspect of the datasets.
These datasets represent an initial step toward a harmonised, long-term IWU record built on satellite observations and model-data integration. Future developments should prioritise expanding and diversifying validation datasets, improving the spatial resolution of the IWU estimates, and refining methodological elements such as irrigation-triggering rules and uncertainty characterisation. Such advances would enhance the usefulness of IWU products for hydrological research and climate modelling. Ultimately, this coordinated archive lays the groundwork for future efforts to better quantify irrigation water use and to improve the representation of irrigation-climate interactions in large-scale Earth system analyses.
The supplement related to this article is available online at https://doi.org/10.5194/essd-18-4833-2026-supplement.
All authors contributed to the study design. Data processing and analyses were performed by P. Laluet, P. Langhans, J. Dari, L. Busschaert, Z. Heyvaert, S. Modanesi, and C. Massari. P. Laluet wrote the first draft of the manuscript. All authors contributed to the interpretation of the results and to the revision and editing of the manuscript.
The contact author has declared that none of the authors has any competing interests.
Publisher's note: Copernicus Publications remains neutral with regard to jurisdictional claims made in the text, published maps, institutional affiliations, or any other geographical representation in this paper. The authors bear the ultimate responsibility for providing appropriate place names. Views expressed in the text are those of the authors and do not necessarily reflect the views of the publisher.
This work was carried out with support from the European Space Agency under the Climate Change Initiative – Anthropogenic Water Use (CCI–AWU) precursor project (contract number 4000142449/23/I-NB). We gratefully acknowledge the providers of the input datasets and irrigation reference data used in this study. The authors acknowledge the TU Wien Bibliothek for financial support through its Open Access Funding Programme.
This research has been supported by the European Space Agency (contract number 4000142449/23/I-NB) and the TU Wien Bibliothek through its Open Access Funding Programme.
This paper was edited by Yun Yang and reviewed by Sam Zipper and two anonymous referees.
Ajaz, A., Karimi, P., Cai, X., De Fraiture, C., and Akhter, M. S.: Statistical Data Collection Methodologies of Irrigated Areas and Their Limitations: A Review, Irrig. Drain., 68, 702–713, https://doi.org/10.1002/ird.2365, 2019. a
Ambika, A. K., Wardlow, B., and Mishra, V.: Remotely sensed high resolution irrigated area mapping in India for 2000 to 2015, Sci. Data, 3, 160 118, https://doi.org/10.1038/sdata.2016.118, 2016. a
Arboleda-Obando, P. F., Ducharne, A., Yin, Z., and Ciais, P.: Validation of a new global irrigation scheme in the land surface model ORCHIDEE v2.2, Geosci. Model Dev., 17, 2141–2164, https://doi.org/10.5194/gmd-17-2141-2024, 2024. a
Asoka, A., Wada, Y., Fishman, R., and Mishra, V.: Strong linkage between precipitation intensity and monsoon season groundwater recharge in India, Geophys. Res. Lett., 45, 5536–5544, https://doi.org/10.1029/2018GL078466, 2018. a
Bretreger, D., Yeo, I.-Y., Hancock, G., and Willgoose, G.: Monitoring irrigation using Landsat observations and climate data over regional scales in the Murray–Darling Basin, J. Hydrol., 590, 125356, https://doi.org/10.1016/j.jhydrol.2020.125356, 2020. a, b
Brocca, L., Ciabatta, L., Massari, C., Moramarco, T., Hahn, S., Hasenauer, S., Kidd, R., Dorigo, W., Wagner, W., and Levizzani, V.: Soil as a natural rain gauge: Estimating global rainfall from satellite soil moisture data, J. Geophys. Res.-Atmos., 119, 5128–5141, https://doi.org/10.1002/2014JD021489, 2014. a
Chen, F. and Dudhia, J.: Coupling an Advanced Land Surface–Hydrology Model with the Penn State–NCAR MM5 Modeling System. Part I: Model Implementation and Sensitivity, Mon. Weather Rev., 129, 569–585, https://doi.org/10.1175/1520-0493(2001)129<0569:CAALSH>2.0.CO;2, 2001. a
Confederaci´n Hidrográfica del Ebro (CHE): Sistema Automático de Información Hidrológica (SAIH) del Ebro – Datos: Canales, http://www.saihebro.com/saihebro/index.php?url=/datos/canales, last access: 6 July 2026. a
Corbari, C., Paciolla, N., Sheffield, J., Labbassi, K., Dos Santos Araujo, D. C., Berendsen, S., and Szantoi, Z.: Estimates of Irrigation Water Volume by Assimilation of Satellite Land Surface Temperature or Soil Moisture Into a Water-Energy Balance Model in Morocco, Water Resour. Res., 61, e2024WR038926, https://doi.org/10.1029/2024WR038926, 2025. a
Cosby, B. J., Hornberger, G. M., Clapp, R. B., and Ginn, T. R.: A Statistical Exploration of the Relationships of Soil Moisture Characteristics to the Physical Properties of Soils, Water Resour. Res., 20, 682–690, https://doi.org/10.1029/WR020i006p00682, 1984. a
Crow, W. T., Anderson, M. C., Volk, J. M., and Colliander, A.: Value of microwave soil moisture and thermal-infrared evapotranspiration retrievals for the mapping of irrigation coverage, Int. J. Appl. Earth Obs., 143, 104773, https://doi.org/10.1016/j.jag.2025.104773, 2025. a, b
Dari, J., Brocca, L., Quintana-Seguí, P., Escorihuela, M. J., Stefan, V., and Morbidelli, R.: Exploiting High-Resolution Remote Sensing Soil Moisture to Estimate Irrigation Water Amounts over a Mediterranean Region, Remote Sens., 12, 2593, https://doi.org/10.3390/rs12162593, 2020. a, b
Dari, J., Brocca, L., Modanesi, S., Massari, C., Tarpanelli, A., Barbetta, S., Quast, R., Vreugdenhil, M., Freeman, V., Barella-Ortiz, A., Quintana-Seguí, P., Bretreger, D., and Volden, E.: Regional data sets of high-resolution (1 and 6 km) irrigation estimates from space, Earth Syst. Sci. Data, 15, 1555–1575, https://doi.org/10.5194/essd-15-1555-2023, 2023. a, b, c, d
Dari, J., Morbidelli, R., Quintana-Seguí, P., and Brocca, L.: The Temporal-Stability-Based Irrigation MAPping (TSIMAP) Method: A Virtuous Trade-Off between Accuracy, Flexibility, and Facility for End-Users, Water, 16, 644, https://doi.org/10.3390/w16050644, 2024. a
Dari, J., Brocca, L., Laluet, P., Morbidelli, R., Saltalippi, C., Modanesi, S., Dorigo, W. A., and Albergel, C.: Satellite-based estimates of irrigation water use versus modeling reconstructions: how much do they differ?, ESS Open Archive [preprint], https://doi.org/10.22541/essoar.176218923.33215210/v1, 2025a. a
Dari, J., Presti, S. L., and Brocca, L.: Irrigation monitoring from satellite at hyper-high resolution: Paving the way for remote-sensing-based agricultural water management support services, Agr. Water Manage., 317, 109627, https://www.sciencedirect.com/science/article/pii/S0378377425003415 (last access: 6 July 2026), 2025b. a
De Lannoy, G. J. M., Bechtold, M., Busschaert, L., Heyvaert, Z., Modanesi, S., Dunmire, D., Lievens, H., Getirana, A., and Massari, C.: Contributions of Irrigation Modeling, Soil Moisture and Snow Data Assimilation to High-Resolution Water Budget Estimates Over the Po Basin: Progress Towards Digital Replicas, J. Adv. Model. Earth Sy., 16, e2024MS004433, https://doi.org/10.1029/2024MS004433, 2024. a, b
Deines, J. M., Kendall, A. D., Crowley, M. A., Rapp, J., Cardille, J. A., and Hyndman, D. W.: Mapping three decades of annual irrigation across the US High Plains Aquifer using Landsat and Google Earth Engine, Remote Sens. Environ., 233, 111400, https://doi.org/10.1016/j.rse.2019.111400, 2019. a
Dorigo, W., Wagner, W., Albergel, C., Albrecht, F., Balsamo, G., Brocca, L., Chung, D., Ertl, M., Forkel, M., Gruber, A., Haas, E., Hamer, P. D., Hirschi, M., Ikonen, J., de Jeu, R., Kidd, R., Lahoz, W., Liu, Y. Y., Miralles, D., Mistelbauer, T., Nicolai-Shaw, N., Parinussa, R., Pratola, C., Reimer, C., van der Schalie, R., Seneviratne, S. I., Smolander, T., and Lecomte, P.: ESA CCI Soil Moisture for improved Earth system understanding: State-of-the art and future directions, Remote Sens. Environ., 203, 185–215, https://doi.org/10.1016/j.rse.2017.07.001, 2017. a
Dorigo, W., Dietrich, S., Aires, F., Brocca, L., Carter, S., Cretaux, J.-F., Dunkerley, D., Enomoto, H., Forsberg, R., Güntner, A., Hegglin, M. I., Hollmann, R., Hurst, D. F., Johannessen, J. A., Kummerow, C., Lee, T., Luojus, K., Looser, U., Miralles, D. G., Pellet, V., Recknagel, T., Vargas, C. R., Schneider, U., Schoeneich, P., Schröder, M., Tapper, N., Vuglinsky, V., Wagner, W., Yu, L., Zappa, L., Zemp, M., and Aich, V.: Closing the Water Cycle from Observations across Scales: Where Do We Stand?, B. Am. Meteorol. Soc., 102, E1897–E1935, https://doi.org/10.1175/BAMS-D-19-0316.1, 2021. a
Dorigo, W., Preimesberger, W., Hahn, S., Van der Schalie, R., De Jeu, R., Kidd, R., Rodriguez-Fernandez, N., Hirschi, M., Stradiotti, P., Frederikse, T., Gruber, A., and Madelon, R.: ESA Soil Moisture Climate Change Initiative (Soil_Moisture_cci): Version 08.1 data collection, http://catalogue.ceda.ac.uk/uuid/ff890589c21f4033803aa550f52c980c ( last access: 20 October 2025), 2023. a
Elliott, J., Deryng, D., Müller, C., Frieler, K., Konzmann, M., Gerten, D., Glotter, M., Flörke, M., Wada, Y., Best, N., Eisner, S., Fekete, B. M., Folberth, C., Foster, I., Gosling, S. N., Haddeland, I., Khabarov, N., Ludwig, F., Masaki, Y., Olin, S., Rosenzweig, C., Ruane, A. C., Satoh, Y., Schmid, E., Stacke, T., Tang, Q., and Wisser, D.: Constraints and potentials of future irrigation water availability on agricultural production under climate change, P. Natl. Acad. Sci. USA, 111, 3239–3244, https://doi.org/10.1073/pnas.1222474110, 2014. a
Entekhabi, D., Njoku, E. G., O'Neill, P. E., Kellogg, K. H., Crow, W. T., Edelstein, W. N., Entin, J. K., Goodman, S. D., Jackson, T. J., Johnson, J., Kimball, J., Piepmeier, J. R., Koster, R. D., Martin, N., McDonald, K. C., Moghaddam, M., Moran, S., Reichle, R., Shi, J. C., Spencer, M. W., Thurman, S. W., Tsang, L., and Van Zyl, J.: The Soil Moisture Active Passive (SMAP) Mission, Proc. IEEE, 98, 704–716, https://doi.org/10.1109/JPROC.2010.2043918, 2010. a
Escorihuela, M. J. and Quintana-Seguí, P.: Comparison of remote sensing and simulated soil moisture datasets in Mediterranean landscapes, Remote Sens. Environ., 180, 99–114, https://doi.org/10.1016/j.rse.2016.02.046, 2016. a
Evett, S. R., Colaizzi, P. D., Lamm, F. R., O'Shaughnessy, S. A., Heeren, D. M., Trout, T. J., Kranz, W. L., and Lin, X.: Past, Present, and Future of Irrigation on the U.S. Great Plains, T. ASABE, 63, 703–729, https://doi.org/10.13031/trans.13620, 2020. a
FAO: Crop Calendar, https://cropcalendar.apps.fao.org/ (last access: 20 August 2025), 2010. a
FAO: Harmonized World Soil Database version 2.0, FAO, International Institute for Applied Systems Analysis (IIASA), ISBN 978-92-5-137499-3, https://openknowledge.fao.org/handle/20.500.14283/cc3823en (last access: 6 July 2026), 2023. a
FAO: AQUASTAT – FAO's Global Information System on Water and Agriculture, https://www.fao.org/aquastat (last access: 21 August 2025), 2025. a
García-García, A., Stradiotti, A., Delogu, F., Jonas, M., Tzounis, G. I. G., Raja, P., Rakovec, V. A., Beck, H. E., Dorigo, W., Pôças, C., and Martens, B.: Intercomparison of Earth Observation products for hyper-resolution hydrological modelling over Europe, Remote Sens. Environ., 333, 115131, https://doi.org/10.1016/j.rse.2025.115131, 2026. a
Gutman, G. and Ignatov, A.: The derivation of the green vegetation fraction from NOAA/AVHRR data for use in numerical weather prediction models, Int. J. Remote Sens., 19, 1533–1543, https://doi.org/10.1080/014311698215333, 1998. a, b
Hersbach, H., Bell, B., Berrisford, P., Hirahara, S., Horányi, A., Muñoz-Sabater, J., Nicolas, J., Peubey, C., Radu, R., Schepers, D., Simmons, A., Soci, C., Abdalla, S., Abellan, X., Balsamo, G., Bechtold, P., Biavati, G., Bidlot, J., Bonavita, M., De Chiara, G., Dahlgren, P., Dee, D., Diamantakis, M., Dragani, R., Flemming, J., Forbes, R., Fuentes, M., Geer, A., Haimberger, L., Healy, S., Hogan, R. J., Hólm, E., Janisková, M., Keeley, S., Laloyaux, P., Lopez, P., Lupu, C., Radnoti, G., de Rosnay, P., Rozum, I., Vamborg, F., Villaume, S., and Thépaut, J.-N.: The ERA5 global reanalysis, Q. J. Roy. Meteor. Soc., 146, 1999–2049, https://doi.org/10.1002/qj.3803, 2020. a
Jalilvand, E., Tajrishy, M., Ghazi Zadeh Hashemi, S. A., and Brocca, L.: Quantification of irrigation water using remote sensing of soil moisture in a semi-arid region, Remote Sens. Environ., 231, 111226, https://doi.org/10.1016/j.rse.2019.111226, 2019. a
Jalilvand, E., Kumar, S. V., Truong, C., Haacker, E., and Mahanama, S.: Characterization of irrigation timing using thermal satellite observations, a data-driven approach, Remote Sens. Environ., 333, 115153, https://doi.org/10.1016/j.rse.2025.115153, 2026. a
Jung, M., Koirala, S., Weber, U., Ichii, K., Gans, F., Camps-Valls, G., Papale, D., Schwalm, C., Tramontana, G., and Reichstein, M.: The FLUXCOM ensemble of global land-atmosphere energy fluxes, Sci. Data, 6, 74, https://doi.org/10.1038/s41597-019-0076-8, 2019. a
Kebede, E. A., Oluoch, K. O., Siebert, S., Mehta, P., Hartman, S., Jägermeyr, J., Ray, D., Ali, T., Brauman, K. A., Deng, Q., Xie, W., and Davis, K. F.: A global open-source dataset of monthly irrigated and rainfed cropped areas (MIRCA-OS) for the 21st century, Sci. Data, 12, 208, https://doi.org/10.1038/s41597-024-04313-w, 2025. a
Kerr, Y. H., Al-Yaari, A., Rodriguez-Fernandez, N., Parrens, M., Molero, B., Leroux, D., Bircher, S., Mahmoodi, A., Mialon, A., Richaume, P., Delwart, S., Al Bitar, A., Pellarin, T., Bindlish, R., Jackson, T. J., Rüdiger, C., Waldteufel, P., Mecklenburg, S., and Wigneron, J. P.: Overview of SMOS performance in terms of global soil moisture monitoring after six years in operation, Remote Sens. Environ., 180, 40–63, https://doi.org/10.1016/j.rse.2016.02.042, 2016. a
Kragh, S. J., Fensholt, R., Stisen, S., and Koch, J.: The precision of satellite-based net irrigation quantification in the Indus and Ganges basins, Hydrol. Earth Syst. Sci., 27, 2463–2478, https://doi.org/10.5194/hess-27-2463-2023, 2023. a, b, c, d
Kumar, S. V., Peters-Lidard, C. D., Tian, Y., Houser, P. R., Geiger, J., Olden, S., Lighty, L., Eastman, J. L., Doty, B., Dirmeyer, P., Adams, J., Mitchell, K., Wood, E. F., and Sheffield, J.: Land information system: An interoperable framework for high resolution land surface modeling, Environ. Modell. Softw., 21, 1402–1415, https://doi.org/10.1016/j.envsoft.2005.07.004, 2006. a
Kumar, S. V., Reichle, R. H., Peters-Lidard, C. D., Koster, R. D., Zhan, X., Crow, W. T., Eylander, J. B., and Houser, P. R.: A land surface data assimilation framework using the land information system: Description and applications, Adv. Water Resour., 31, 1419–1432, https://doi.org/10.1016/j.advwatres.2008.01.013, 2008. a
Laluet, P., Olivera-Guerra, L. E., Altés, V., Paolini, G., Ouaadi, N., Rivalland, V., Jarlan, L., Villar, J. M., and Merlin, O.: Retrieving the irrigation actually applied at district scale: Assimilating high-resolution Sentinel-1-derived soil moisture data into a FAO-56-based model, Agr. Water Manage., 293, 108704, https://doi.org/10.1016/j.agwat.2024.108704, 2024. a
Laluet, P., Dari, J., Busschaert, L., Heyvaert, Z., Brocca, L., Massari, C., Modanesi, S., Dorigo, W., Langhans, P., De Lannoy, G., Bechtold, M., Saltalippi, C., Morbidelli, R., Rulli, M. C., Chiarelli, D. D., and Galli, N.: Regional datasets of long-term and coarse resolution irrigation estimates from space, Zenodo [data set], https://doi.org/10.5281/zenodo.14988197, 2025. a, b
Laluet, P., Corbari, C., Baez-Villanueva, O., Walther, S., Zhang, Y., Muñoz-Sabater, J., Albergel, C., and Dorigo, W.: Assessing the suitability of global evapotranspiration products over irrigated areas, Hydrol. Earth Syst. Sci., 30, 1779–1799, https://doi.org/10.5194/hess-30-1779-2026, 2026. a, b, c
Lawston, P. M., Santanello Jr, J. A., and Kumar, S. V.: Irrigation Signals Detected From SMAP Soil Moisture Retrievals, Geophys. Res. Lett., 44, 11860–11867, https://doi.org/10.1002/2017GL075733, 2017. a
Lunel, T., Boone, A. A., and Le Moigne, P.: Irrigation strongly influences near-surface conditions and induces breeze circulation: Observational and model-based evidence, Q. J. Roy. Meteor. Soc., 150, 2798–2819, https://doi.org/10.1002/qj.4736, 2024. a
Martens, B., Miralles, D. G., Lievens, H., van der Schalie, R., de Jeu, R. A. M., Fernández-Prieto, D., Beck, H. E., Dorigo, W. A., and Verhoest, N. E. C.: GLEAM v3: satellite-based land evaporation and root-zone soil moisture, Geosci. Model Dev., 10, 1903–1925, https://doi.org/10.5194/gmd-10-1903-2017, 2017. a
Massari, C., Modanesi, S., Dari, J., Gruber, A., De Lannoy, G. J. M., Girotto, M., Quintana-Seguí, P., Le Page, M., Jarlan, L., Zribi, M., Ouaadi, N., Vreugdenhil, M., Zappa, L., Dorigo, W., Wagner, W., Brombacher, J., Pelgrum, H., Jaquot, P., Freeman, V., Volden, E., Fernandez Prieto, D., Tarpanelli, A., Barbetta, S., and Brocca, L.: A Review of Irrigation Information Retrievals from Space and Their Utility for Users, Remote Sens., 13, 4112, https://doi.org/10.3390/rs13204112, 2021. a
McDermid, S., Nocco, M., Lawston-Parker, P., Keune, J., Pokhrel, Y., Jain, M., Jägermeyr, J., Brocca, L., Massari, C., Jones, A. D., Vahmani, P., Thiery, W., Yao, Y., Bell, A., Chen, L., Dorigo, W., Hanasaki, N., Jasechko, S., Lo, M.-H., Mahmood, R., Mishra, V., Mueller, N. D., Niyogi, D., Rabin, S. S., Sloat, L., Wada, Y., Zappa, L., Chen, F., Cook, B. I., Kim, H., Lombardozzi, D., Polcher, J., Ryu, D., Santanello, J., Satoh, Y., Seneviratne, S., Singh, D., and Yokohata, T.: Irrigation in the Earth system, Nat. Rev. Earth Environ., 4, 435–453, https://doi.org/10.1038/s43017-023-00438-5, 2023. a
Mehta, P., Siebert, S., Kummu, M., Deng, Q., Ali, T., Marston, L., Xie, W., and Davis, K. F.: Half of twenty-first century global irrigation expansion has been in water-stressed regions, Nature Water, 2, 254–261, https://doi.org/10.1038/s44221-024-00206-9, 2024. a, b
Modanesi, S., Massari, C., Bechtold, M., Lievens, H., Tarpanelli, A., Brocca, L., Zappa, L., and De Lannoy, G. J. M.: Challenges and benefits of quantifying irrigation through the assimilation of Sentinel-1 backscatter observations into Noah-MP, Hydrol. Earth Syst. Sci., 26, 4685–4706, https://doi.org/10.5194/hess-26-4685-2022, 2022. a, b, c
Modanesi, S., Busschaert, L., Lannoy, G. D., Santis, D. D., Natali, M., Dari, J., Quintana-Seguí, P., Castelli, M., Grasso, F. M., and Massari, C.: Accounting for scaling effects on irrigation optimization within a land surface model using satellite observations: impacts on water and carbon cycle dynamics, ESS Open Archive [preprint], https://doi.org/10.22541/essoar.174721778.84342159/v1, 2025. a
Muñoz-Sabater, J., Dutra, E., Agustí-Panareda, A., Albergel, C., Arduini, G., Balsamo, G., Boussetta, S., Choulga, M., Harrigan, S., Hersbach, H., Martens, B., Miralles, D. G., Piles, M., Rodríguez-Fernández, N. J., Zsoter, E., Buontempo, C., and Thépaut, J.-N.: ERA5-Land: a state-of-the-art global reanalysis dataset for land applications, Earth Syst. Sci. Data, 13, 4349–4383, https://doi.org/10.5194/essd-13-4349-2021, 2021. a
Niu, G.-Y., Yang, Z.-L., Mitchell, K. E., Chen, F., Ek, M. B., Barlage, M., Kumar, A., Manning, K., Niyogi, D., Rosero, E., Tewari, M., and Xia, Y.: The community Noah land surface model with multiparameterization options (Noah-MP): 1. Model description and evaluation with local-scale measurements, J. Geophys. Res.-Atmos., 116, https://doi.org/10.1029/2010JD015139, 2011. a, b
Olivera-Guerra, L.-E., Laluet, P., Altés, V., Ollivier, C., Pageot, Y., Paolini, G., Chavanon, E., Rivalland, V., Boulet, G., Villar, J.-M., and Merlin, O.: Modeling actual water use under different irrigation regimes at district scale: Application to the FAO-56 dual crop coefficient method, Agr. Water Manage., 278, 108119, https://doi.org/10.1016/j.agwat.2022.108119, 2023. a
Ozdogan, M., Rodell, M., Beaudoing, H. K., and Toll, D. L.: Simulating the Effects of Irrigation over the United States in a Land Surface Model Based on Satellite-Derived Agricultural Data, J. Hydrometeorol., 11, 171–184, https://doi.org/10.1175/2009JHM1116.1, 2010. a, b, c
Paolini, G., Escorihuela, M. J., Merlin, O., Laluet, P., Bellvert, J., and Pellarin, T.: Estimating multi-scale irrigation amounts using multi-resolution soil moisture data: A data-driven approach using PrISM, Agr. Water Manage., 290, 108594, https://doi.org/10.1016/j.agwat.2023.108594, 2023. a
Puy, A., Borgonovo, E., Lo Piano, S., Levin, S. A., and Saltelli, A.: Irrigated areas drive irrigation water withdrawals, Nat. Commun., 12, 4525, https://doi.org/10.1038/s41467-021-24508-8, 2021. a
Puy, A., Lankford, B., Meier, J., van der Kooij, S., and Saltelli, A.: Large variations in global irrigation withdrawals caused by uncertain irrigation efficiencies, Environ. Res. Lett., 17, 044014, https://doi.org/10.1088/1748-9326/ac5768, 2022. a
Puy, A., Linga, S. N., Wei, N., Flinders, S., Callow, B., Allen, G., Cross, B., Aguiló-Rivera, C., and Lankford, B.: Widely cited global irrigation statistics lack empirical support, PNAS Nexus, 4, pgaf323, https://doi.org/10.1093/pnasnexus/pgaf323, 2025. a
Scanlon, B. R., Faunt, C. C., Longuevergne, L., Reedy, R. C., Alley, W. M., McGuire, V. L., and McMahon, P. B.: Groundwater depletion and sustainability of irrigation in the U.S. High Plains and Central Valley, P. Natl. Acad. Sci. USA, 109, 9320–9325, https://doi.org/10.1073/pnas.1200311109, 2012. a
Senay, G.: Satellite Psychrometric Formulation of the Operational Simplified Surface Energy Balance (SSEBop) Model for Quantifying and Mapping Evapotranspiration, Appl. Eng. Agr., 34, 555–566, https://doi.org/10.13031/aea.12614, 2018. a
Seneviratne, S. I. and Hauser, M.: Regional Climate Sensitivity of Climate Extremes in CMIP6 Versus CMIP5 Multimodel Ensembles, Earth's Future, 8, e2019EF001474, https://doi.org/10.1029/2019EF001474, 2020. a
Siebert, S., Henrich, V., Frenken, K., and Burke, J.: Update of the digital global map of irrigation areas to version 5, Technical Report, https://doi.org/10.13140/2.1.2660.6728, 2013. a, b, c
Teluguntla, P., Thenkabail, P., Oliphant, A., Gumma, M., Aneece, I., Foley, D., and McCormick, R.: Landsat-derived Global Rainfed and Irrigated-Cropland Product @ 30-m (LGRIP30) of the World (GFSADLGRIP30WORLD), The Land Processes Distributed Active Archive Center (LP DAAC) of NASA and USGS, iP-148728, https://doi.org/10.5067/Community/LGRIP/LGRIP30.001, 2023. a
Thiery, W., Davin, E. L., Lawrence, D. M., Hirsch, A. L., Hauser, M., and Seneviratne, S. I.: Present-day irrigation mitigates heat extremes, J. Geophys. Res.-Atmos., 122, 1403–1422, https://doi.org/10.1002/2016JD025740, 2017. a
Thiery, W., Visser, A. J., Fischer, E. M., Hauser, M., Hirsch, A. L., Lawrence, D. M., Lejeune, Q., Davin, E. L., and Seneviratne, S. I.: Warming of hot extremes alleviated by expanding irrigation, Nat. Commun., 11, 290, https://doi.org/10.1038/s41467-019-14075-4, 2020. a
USDA NASS: 2018 Irrigation and Water Management Survey, Tech. rep., U.S. Department of Agriculture, National Agricultural Statistics Service, https://www.nass.usda.gov/Publications/AgCensus/2017/Online_Resources/Farm_and_Ranch_Irrigation_Survey/ (last access: 6 July 2026), 2019. a, b
Wada, Y., Wisser, D., and Bierkens, M. F. P.: Global modeling of withdrawal, allocation and consumptive use of surface water and groundwater resources, Earth Syst. Dynam., 5, 15–40, https://doi.org/10.5194/esd-5-15-2014, 2014. a
Wagner, W., Hahn, S., Kidd, R., Melzer, T., Bartalis, Z., Hasenauer, S., Figa-Saldaña, J., de Rosnay, P., Jann, A., Schneider, S., Komma, J., Kubu, G., Brugger, K., Aubrecht, C., Züger, J., Gangkofner, U., Kienberger, S., Brocca, L., Wang, Y., Blöschl, G., Eitzinger, J., and Steinnocher, K.: The ASCAT Soil Moisture Product: A Review of its Specifications, Validation Results, and Emerging Applications, Meteorol. Z., 5–33, https://doi.org/10.1127/0941-2948/2013/0399, 2013. a
Zappa, L., Schlaffer, S., Bauer-Marschallinger, B., Nendel, C., Zimmerman, B., and Dorigo, W.: Detection and Quantification of Irrigation Water Amounts at 500 m Using Sentinel-1 Surface Soil Moisture, Remote Sens., 13, 1727, https://doi.org/10.3390/rs13091727, 2021. a, b
Zappa, L., Schlaffer, S., Brocca, L., Vreugdenhil, M., Nendel, C., and Dorigo, W.: How accurately can we retrieve irrigation timing and water amounts from (satellite) soil moisture?, Int. J. Appl. Earth Obs., 113, 102979, https://doi.org/10.1016/j.jag.2022.102979, 2022. a
Zappa, L., Dari, J., Modanesi, S., Quast, R., Brocca, L., De Lannoy, G., Massari, C., Quintana-Seguí, P., Barella-Ortiz, A., and Dorigo, W.: Benefits and pitfalls of irrigation timing and water amounts derived from satellite soil moisture, Agr. Water Manage., 295, 108773, https://doi.org/10.1016/j.agwat.2024.108773, 2024. a, b
Zaussinger, F., Dorigo, W., Gruber, A., Tarpanelli, A., Filippucci, P., and Brocca, L.: Estimating irrigation water use over the contiguous United States by combining satellite and reanalysis soil moisture data, Hydrol. Earth Syst. Sci., 23, 897–923, https://doi.org/10.5194/hess-23-897-2019, 2019. a, b, c, d, e, f
Zhang, C. and Long, D.: Estimating Spatially Explicit Irrigation Water Use Based on Remotely Sensed Evapotranspiration and Modeled Root Zone Soil Moisture, Water Resour. Res., 57, e2021WR031382, https://doi.org/10.1029/2021WR031382, 2021. a, b
Zipper, S., Kastens, J., Foster, T., Wilson, B. B., Melton, F., Grinstead, A., Deines, J. M., Butler, J. J., and Marston, L. T.: Estimating irrigation water use from remotely sensed evapotranspiration data: Accuracy and uncertainties at field, water right, and regional scales, Agr. Water Manage., 303, 109036, https://doi.org/10.1016/j.agwat.2024.109036, 2024. a
Zohaib, M. and Choi, M.: Satellite-based global-scale irrigation water use and its contemporary trends, Sci. Total Environ., 714, 136719, https://doi.org/10.1016/j.scitotenv.2020.136719, 2020. a