the Creative Commons Attribution 4.0 License.
the Creative Commons Attribution 4.0 License.
 | 06 Jul 2026
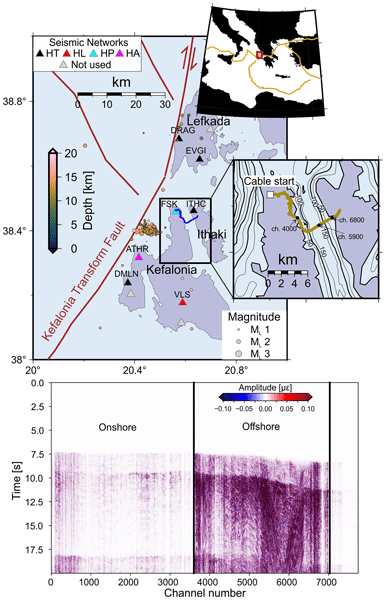
Earthquake catalog and continuous waveforms from a two-week distributed acoustic sensing experiment on Kefalonia Island, Greece
Emanuele Bozzi
Marco P. Roth
Sonja Gaviano
Giulio Pascucci
Francesco Grigoli
Ettore Biondi
Efthimios Sokos
Rebecca M. Harrington
In this work, we present a new, high-resolution earthquake catalog for the Kefalonia region, Greece, together with the distributed acoustic sensing (DAS) waveform dataset used for its construction (https://doi.org/10.60517/cv43p1601, Bocchini et al., 2025; https://doi.org/10.5281/zenodo.20558686, Bocchini, 2026). We build the catalog from DAS data recorded between 1 August 2024, 23:00 UTC and 15 August 2024, 23:00 UTC, combined with open-access seismic-station recordings from the Hellenic Unified Seismic Network (HUSN). The DAS dataset consists of continuous strain measurements acquired along a 15 km long telecommunications fiber-optic cable connecting northern Kefalonia and Ithaki. We use a semblance-based detector on the DAS waveforms to identify 5734 earthquakes within ∼50 km of the cable origin. We jointly locate 356 high-SNR (SNR >12 dB) events with DAS and seismic stations and calculate their local magnitudes from seismic records. We then apply waveform cross-correlation to match unlocated detections with the most similar template events and estimate relative magnitudes from amplitude ratios to enhance the newly constructed catalog. Enhancement adds 2515 earthquakes, resulting in 2871 events with assigned locations and magnitudes and represents a ∼32-fold increase in the number of earthquakes with respect to the official National Observatory of Athens (NOA) catalog. Most events (2790) cluster within a ∼5 km radius offshore northwest of Kefalonia, where seismicity rates reach >100 events per hour. We achieve a ∼38-fold increase in the number of earthquakes with respect to the official catalog from NOA in the region encompassing the earthquake cluster northwest of Kefalonia. Our dataset provides a detailed spatio-temporal view of seismicity in a region with limited station coverage and demonstrates the value of integrating DAS with conventional seismic networks to monitor intense earthquake sequences. The combination of high seismicity and open-access data from the HUSN makes this DAS dataset particularly valuable for the seismological community. We provide a 2-week-long catalog, the full detection list (local and distant events and false detections), and two weeks of continuous DAS recordings. Possible applications of the datasets include testing and benchmarking DAS processing algorithms for tectonic earthquakes, as well as studies of physical processes associated with complex seismic sequences.
- Article
(18508 KB) - Full-text XML
-
Supplement
(4211 KB) - BibTeX
- EndNote


1.1 Why a new open-access dataset of DAS records?
Distributed acoustic sensing (DAS) has become an increasingly innovative approach in seismology to enable effective continuous spatiotemporal sampling of the recorded seismic wavefield through strain or strain-rate measurements on fiber-optic cables (Zhan, 2020). The dense sampling has proven particularly well suited for applications that include seismic and microseismic monitoring (Glubokovskikh et al., 2023; Lellouch et al., 2021; Lindsey et al., 2017; Lior et al., 2021a; Porras et al., 2024), seismic imaging (Biondi et al., 2023a; Zeng et al., 2017), earthquake source-parameter estimation (Li et al., 2023; Lior et al., 2021b), and monitoring of volcanic activity (Currenti et al., 2023; Jousset et al., 2022; Li et al., 2025), among others. Nevertheless, despite its rapid adoption, several factors still limit the broader exploitation of DAS data. The high sampling rates and density of measurement points generate large data volumes that challenge effective data storage and sharing (Seguí et al., 2025). Moreover, because DAS technology is still relatively new in seismology, many aspects of data processing and interpretation remain under active development, including seismic event detection and location, signal enhancement, strain-to-ground-motion calibration, and earthquake source parameter analysis. A further limitation is that most large publicly available DAS datasets are mainly related to microseismic monitoring of industrial operations (e.g., hydraulic stimulations) rather than natural seismicity, as technology evolved from industry. While several open-access datasets dedicated to the monitoring of natural earthquakes are present, they often lack elevated seismicity rates and/or data from permanent seismic networks to augment the DAS experiment. The capability of using publicly available DAS datasets for the analysis of highly productive seismic sequences remains limited, slowing the validation and generalization of emerging data analysis methods across different tectonic contexts. Among the DAS datasets now publicly available (as of September 2025), PubDAS provides a repository with data from a variety of experiments, including natural and induced seismicity (Spica et al., 2023). The collection spans urban noise monitoring, volcanic environments, underground mines, and teleseismic events (Spica et al., 2023). FORGE (Frontier Observatory for Research in Geothermal Energy) (Pankow, 2022) and PoroTomo (Feigl et al., 2016) offer DAS data closely tied to geothermal research, including microseismicity monitoring related to hydraulic stimulation operations and subsurface characterization. Greenland Calving-Front Dataset offers a demonstration of the DAS and DTS potential in cryospheric research (Gräff et al., 2025). The Global DAS Month of February 2023 dataset (Wuestefeld et al., 2024) comprises globally coordinated DAS recordings acquired to advance efforts toward a Global Fiber Sensing Network and promote standardized, collaborative seismic monitoring.
Here we present a new dataset of DAS recordings that captured a period of high seismic activity near the Kefalonia Transform Fault (KTF) in Greece (Fig. 1). The main seismic sequence occurred northwest of Kefalonia at an epicentral distance of ∼15 km from the interrogated fiber-optic cable. Additional regional earthquakes were also recorded during the acquistion period. In addition, we complement the data from seven open-access permanent seismic stations of the Hellenic Unified Seismic Network (HUSN) that are located within ∼30 km of the cable's starting point to enhance the analysis. The integration of DAS and seismic station data enables the construction of an enhanced seismicity catalog in a natural tectonic setting, where such joint analysis remains relatively unexplored.
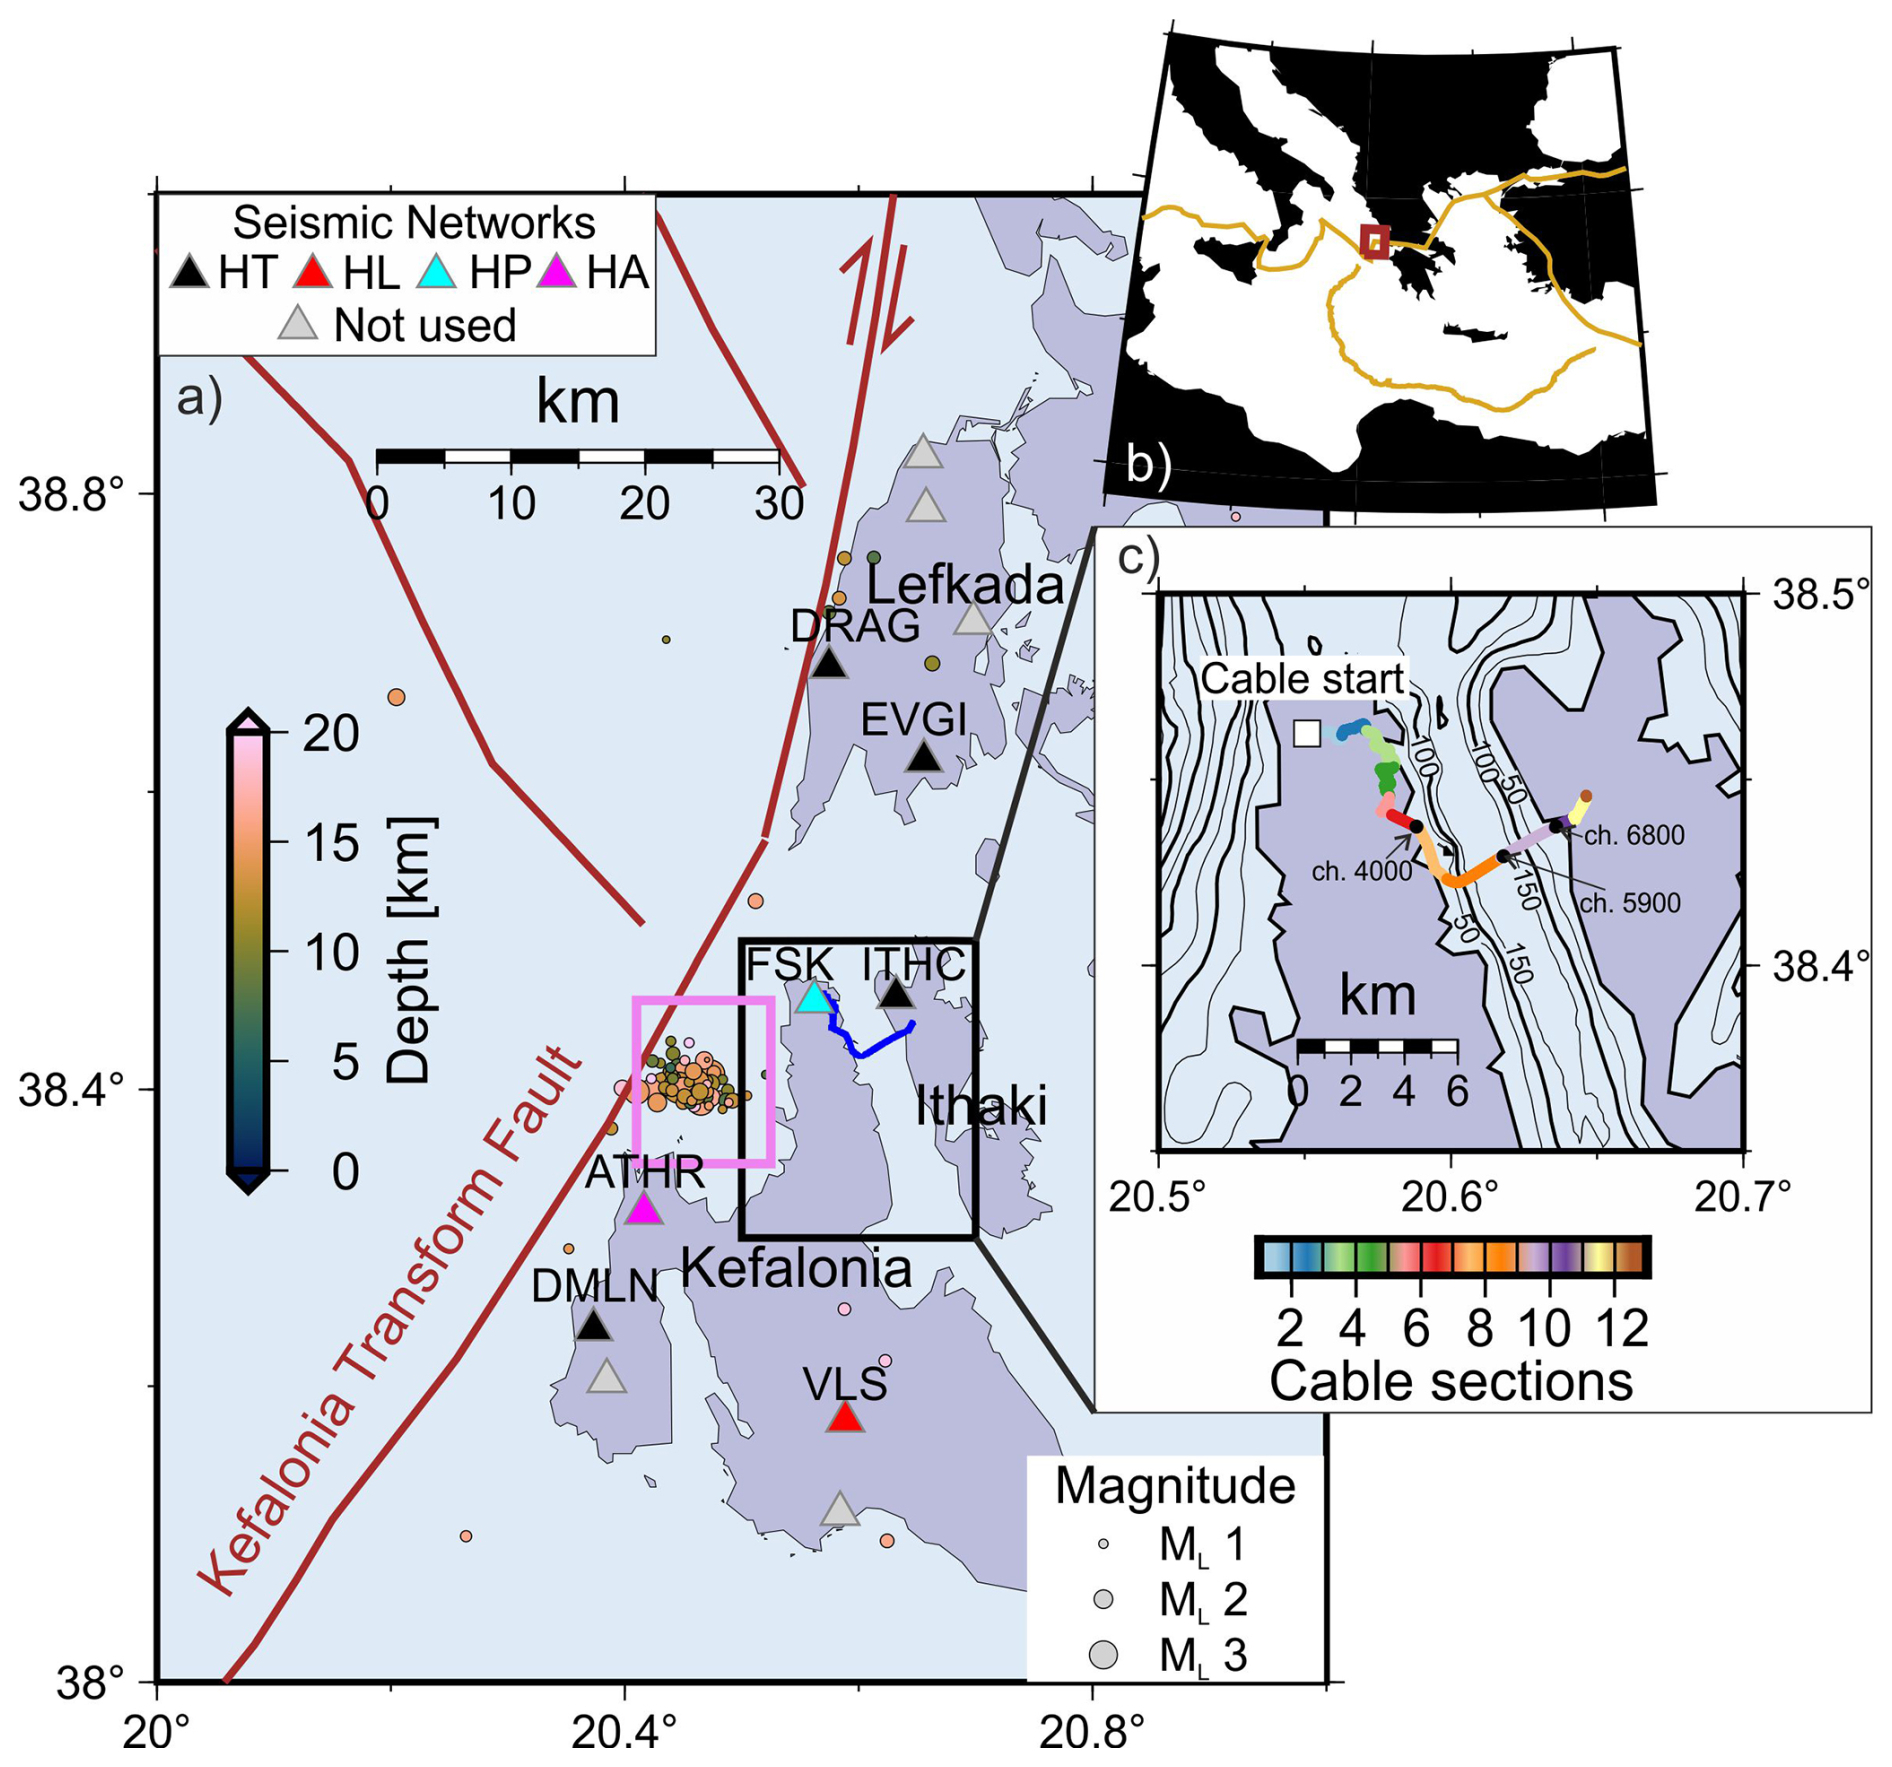
Figure 1(a) Map view of the study region, including the location of the fiber-optic cable, seismic events (colored circles) reported by NOA, and the publicly available seismic stations from the HUSN used (colored triangles) to locate seismic events. Grey triangles indicate public seismic stations from the HUSN not used in this study because they are too distant from the most seismically active region (pink box) or provide azimuthal coverage similar to that of closer seismic stations. Thick brown lines indicate major active faults (Basili et al., 2024). (b) Inset showing the location of the study region within the Central-Eastern Mediterranean Sea. (c) Zoom on the fiber-optic cable. The fiber-optic cable is divided into 12 segments (see methods) that are used for earthquake location. Continuous black lines indicate isobaths. Black circles along the cable indicated the position of channels (ch.) mentioned in the text.
This study releases two main products: (i) a high-resolution earthquake catalog covering a two-week period of elevated seismicity within ∼50 km of the start of the interrogated fiber-optic cable, and (ii) the continuous DAS waveform dataset from which we derived the catalog. In the following, we describe the methodological workflow we use to integrate DAS and seismic station data for catalog construction. We also provide additional supporting products, including a comprehensive detection list and cable geometry metadata.
The datasets presented here may support further research in DAS-based earthquake detection and processing, integration of DAS and seismic-station data, as well as studies in earthquake physics and statistical seismology, with potential benefits from the analysis of DAS data.
1.2 The Kefalonia Transform Fault and the 2024 seismic sequence
The KTF is a major tectonic structure in the Eastern Mediterranean that marks the transition from oceanic subduction to the south to continental collision to the north (Bocchini et al., 2018; Louvari et al., 1999; Royden and Papanikolaou, 2011; Scordilis et al., 1985). The KTF accommodates 2–2.5 cm yr−1 of differential convergence between the oceanic subduction and continental collision zones (Pérouse et al., 2012), making it one of the most seismically active faults in Europe, as evidenced by frequent M6–7+ earthquakes (Papadimitriou, 2002). A period of increased seismic activity started offshore northwest of Kefalonia at the end of February 2024 and lasted until the end of the year. The largest magnitude earthquakes (local magnitude, ML, 3.6–3.8) occurred in the first weeks of March 2024, and earthquakes with ML>3.0 were also recorded in April, August, and October and are listed in the revised catalog of the National Observatory of Athens (NOA) (https://bbnet.gein.noa.gr/HL/databases/database, last access: 20 September 2025). Anagnostou et al. (2025) analyzed the seismic activity from February to April 2024, interpreting it as a complex, swarm-like sequence for which fluid dynamics played a primary role in its triggering. Notably, the authors report that the primary structure(s) that were activated include WNW-ESE left-lateral strike-slip fault(s), rather than the main branch of the KTF.
1.3 Description of the DAS experiment in Kefalonia
We used DAS to measure strain along a dark telecommunications fiber-optic cable connecting the islands of Kefalonia and Ithaki, in the Ionian Sea (Greece) (Fig. 1). The cable starts in the village of Antipata (Kefalonia), runs inland for slightly more than half of its ∼15 km length, crosses the Strait of Ithaki over steep bathymetry, and terminates in the village of Stavros (Ithaki) (Fig. 1). The DAS measurement period ranges from early July to late September 2024, where we recorded continuous data using an OptaSense QuantX interrogator. This study focuses on the analysis of a two-week period that captures the highest activity within the earthquake cluster northwest of Kefalonia and the broader Kefalonia region (Fig. 1). Using the revised seismicity catalog from NOA as a basis for selection, we identify the study period as spanning 2–15 August 2024 (1 August 23:00 UTC–15 August 23:00 UTC) as well-suited to construct an enhanced earthquake catalog. We combine DAS strain recordings with continuous recordings of ground velocity from seven seismic stations of the HUSN to mitigate the azimuthal gap caused by the relatively short cable length, which is comparable to the epicentral distance between the cable and the recorded seismicity, and obtain higher quality earthquake locations than would be possible with DAS or seismic data alone. The complementary seismic data also enables more accurate magnitude estimations, which are hindered by the lack of a calibrated instrument response for converting strain to displacement (Lior et al., 2021b). In other words, complementing DAS with seismic station data enables building a high-quality, earthquake catalog during the two-week study period.
We recorded DAS data with a temporal sampling rate (i.e., ping rate) of 5000 Hz, which we decimated by a factor of 20 before storing them, yielding a sampling rate of 250 Hz. The system configuration has a gauge length of 10.2 m and a channel spacing of 2.04 m, resulting in a total of 7750 channels. Data is saved in 30 s segments (∼80 MB per file), resulting in a total size of 3.04 TB for the two-week experiment, with a short gap in data archiving occurring between 09:14 and 09:48 on 6 August 2024. The file name is UTC time +1 h (default naming from the system).
We performed tap tests on both Kefalonia and Ithaki islands to precisely identify the channel locations onshore. The cable onshore was visible along the entire length because it had been covered by asphalt along streets. Offshore, the cable path and channel positions are less certain. To reconstruct the offshore cable geometry and channel locations, we rely on the expected number of offshore channels (after subtracting those onshore) and refine the cable path by aligning the trend of the picked DAS P-wave arrival times with the earthquake-to-channel epicentral distances (using earthquake locations from NOA) (Fig. S1 in the Supplement). Automatic picking of P-wave arrivals along the cable result from applying PhaseNet-DAS (Zhu et al., 2023). We employ EMODnet bathymetry (https://emodnet.ec.europa.eu/en/, last access: 15 March 2025) to assign an elevation to the channels offshore, while for the onshore channels, we rely on the elevation from our GPS device. We also check for loops (typical of telecom infrastructure) in the onshore cable sections by analyzing the normalized energy recorded on each channel (Biondi et al., 2023b), and then cross-validate it with vehicle signals generated while driving along the cable (Fig. S2). We show the locations of identified loops in Fig. 2 (gray areas between dashed vertical lines).
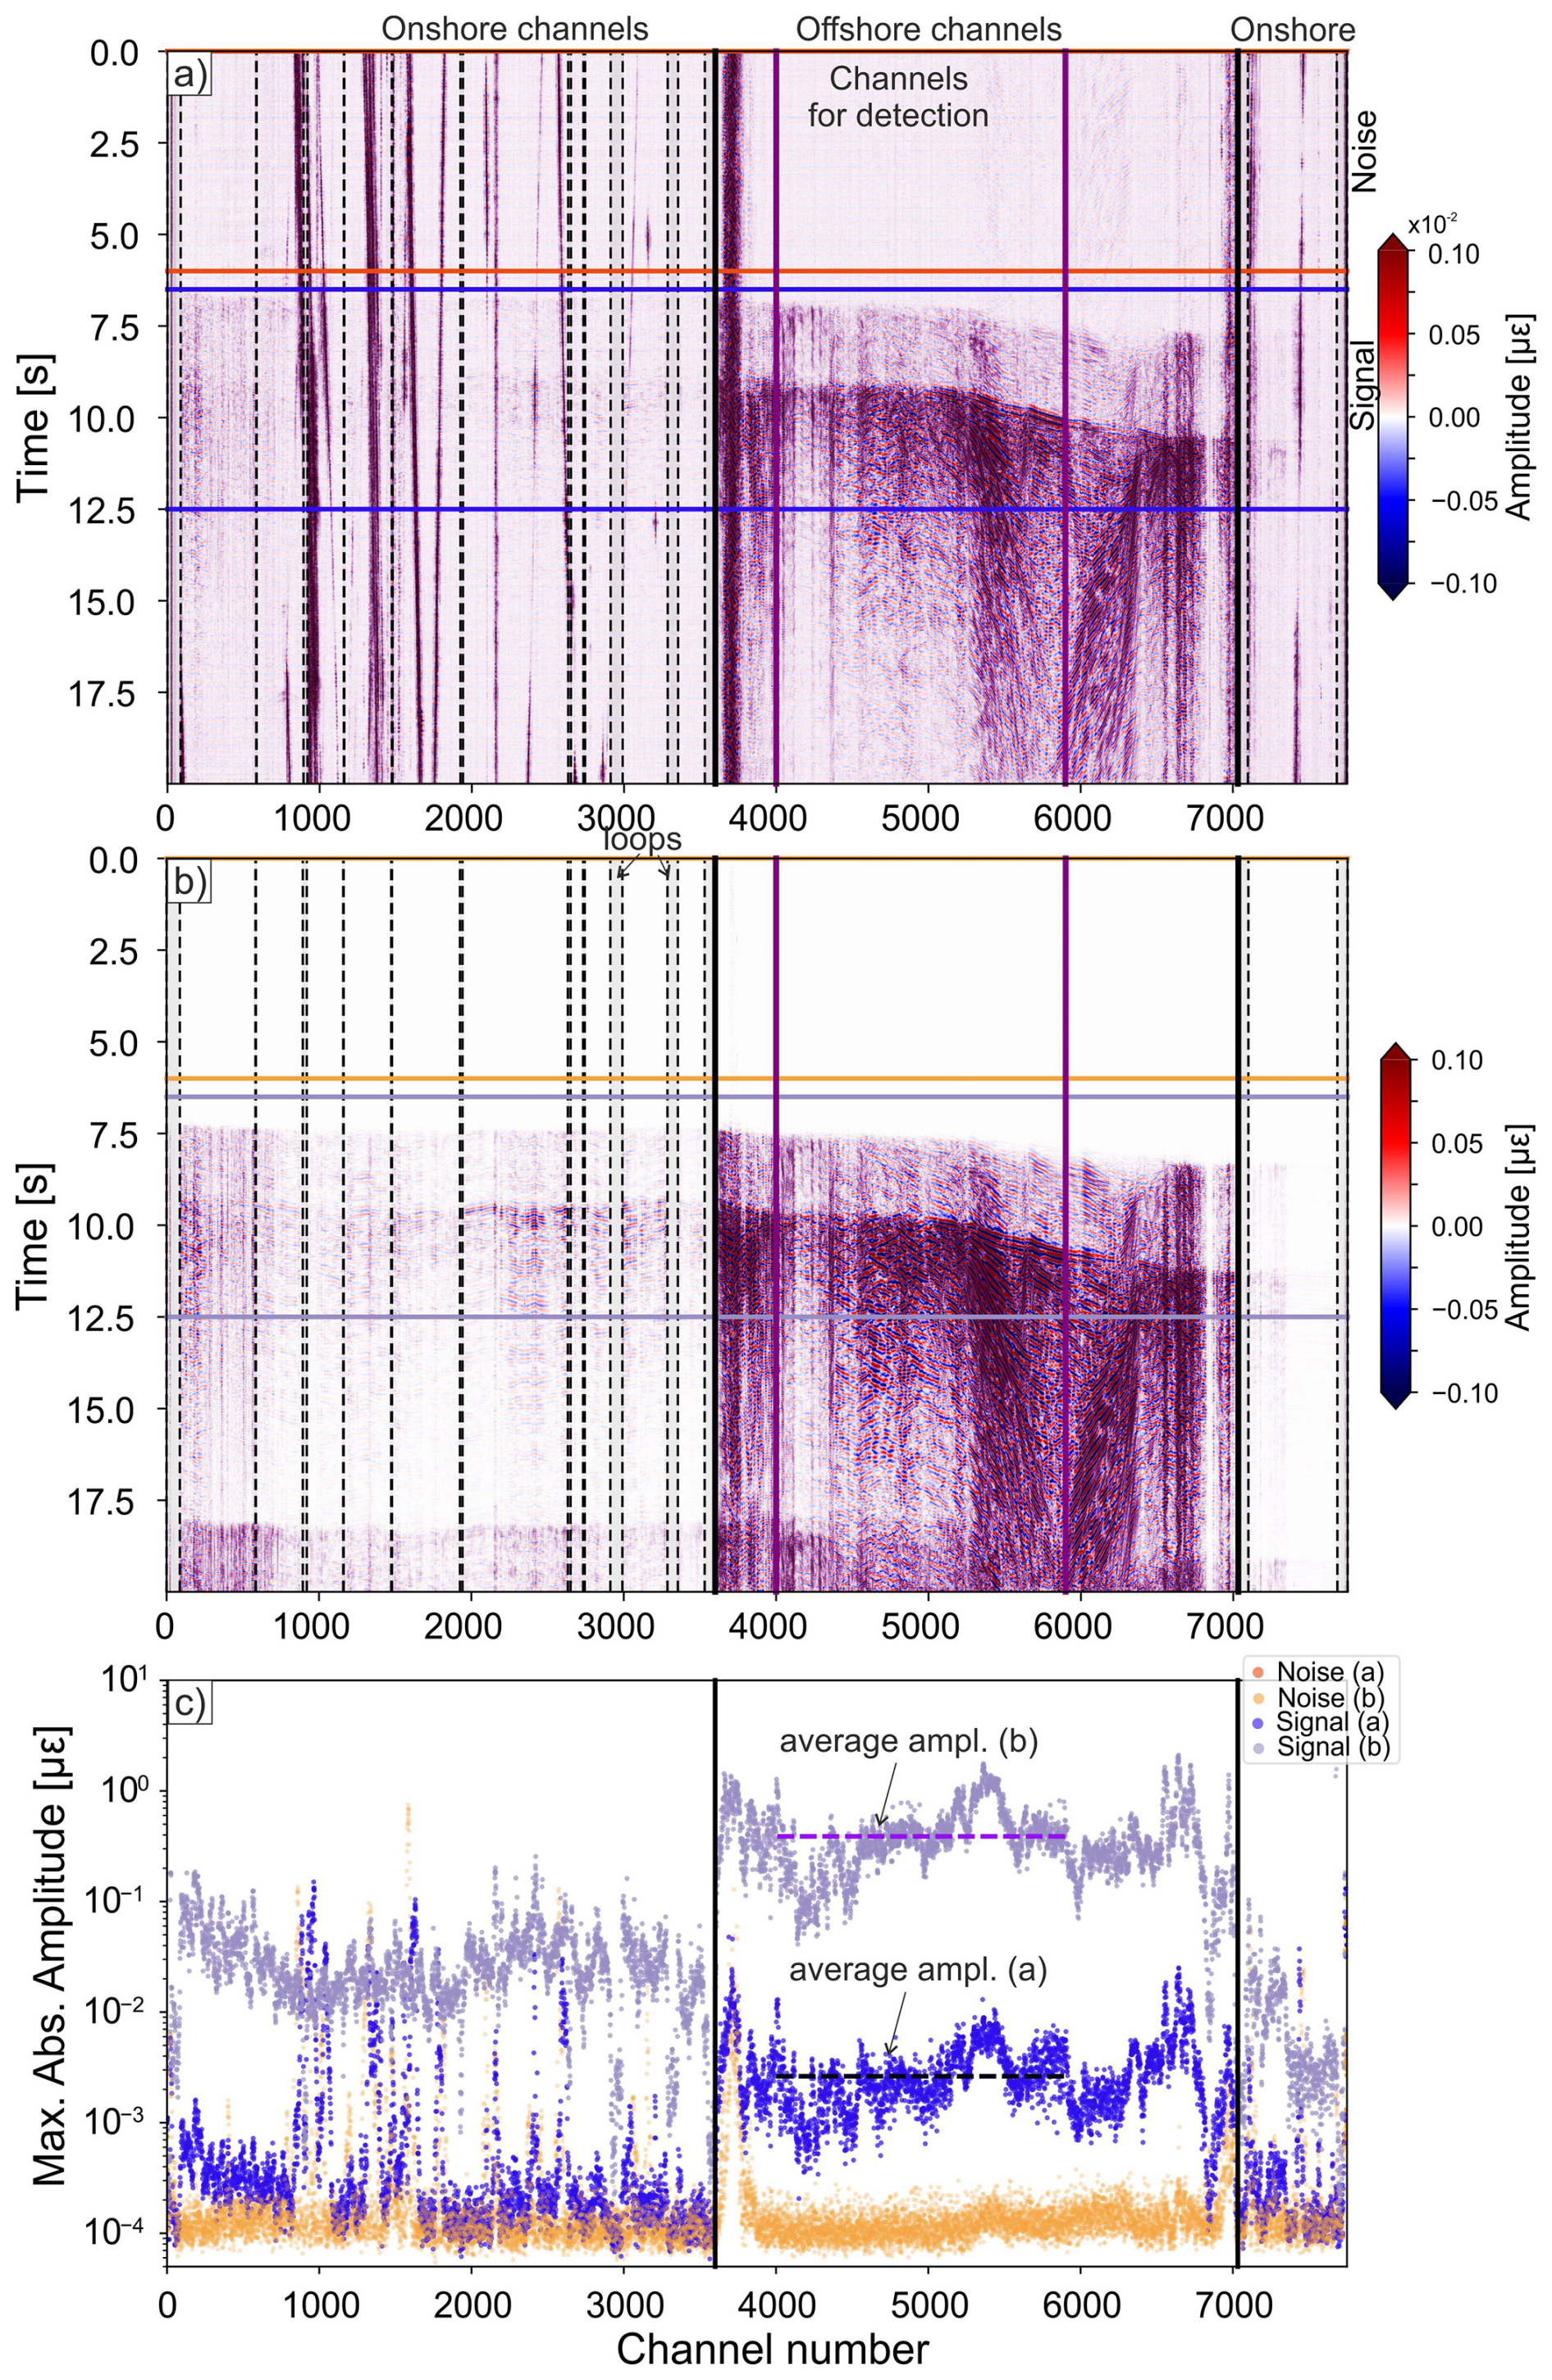
Figure 2Example of earthquakes recorded along the cable. (a) ML 0.6 on 8 August 2024 at 10:35 UTC (NOA event-id: noa2024pmvwc). (b) ML 3.0 Earthquake on 8 August 2024 at 19:18 UTC (NOA event-id: noa2024pnndk). (c) Maximum absolute amplitudes of signal and noise shown in panels (a)–(b). (c) Horizontal dashed black and purple lines indicate average amplitudes for events displayed in panel (a) and (b), respectively. The length of the horizontal lines shows the range of channels used for calculating the average amplitudes (4000–5900). Panels (a)–(b) detail the location of onshore and offshore channels, the location of the channels used for the detection, and the location of the identified loops. Traces are band-pass filtered 3–20 Hz. The light and dark orange, and violet and blue lines in panels (a)–(b) highlight the noise and signal windows shown in panel (c).
We perform an initial assessment of data quality by manually inspecting recordings of earthquakes within a ∼50 km radius of the cable starting point using the revised NOA catalog (ML 0.5–3.4). The catalog lists 91 earthquakes within the two-week study period, all of which are clearly visible along the cable (Figs. 2, S3). Earthquake recordings show strong amplification (a factor >10–20) in the offshore segment, while onshore and offshore maximum noise amplitudes are similar, with slightly higher noise amplitudes offshore (Fig. 2). We observe amplitude scaling with earthquake magnitude that is consistent with theoretical expectations. For example, we obtain an amplitude ratio of ∼148 between an ML 0.6 and ML 3.0 event separated by ∼1.7 km (epicentral locations from the NOA catalog), as shown in Fig. 2c. We compute the amplitude for each event as a trimmed mean after excluding the upper and lower 10 % of values to reduce the influence of outliers. We band-pass filter the waveforms between 3–20 Hz and use channels 4000–5900. Assuming a theoretical scaling of 10ΔM, where ΔM is the magnitude difference between the two events, the observed amplitude ratio corresponds to an implied ΔM≈2.17. This value is slightly lower than the idealized expectation for perfectly co-located events and may reflect the minor differences in source location and measurement uncertainties. We note that magnitude estimate of the ML 0.6 event in the NOA catalog is based on two station observations. We also observe consistently elevated amplitudes at both the onshore–offshore transition zones of the cable (Fig. 2). In addition, we successfully record signals from teleseismic earthquakes, predominantly on the offshore portion of the cable (Fig. S4).
The seven seismic stations of the HUSN that complement the DAS data include: FSK (University of Patras, 2000), ATHR (University of Athens, 2008), VLS (National Observatory of Athens, Institute of Geodynamics, 1975), EVGI, DLMN, ITHC, DRAG (Aristotle University of Thessaloniki, 1981) (Figs. 1, S3).
We use a semblance-based earthquake detector, HECTOR, to detect earthquakes recorded along the fiber-optic cable (Porras et al., 2024). The detector evaluates the coherence of the waveforms along pre-computed hyperbolic trajectories with varying curvature and vertex along the cable and time axes (x–t) using a modified semblance function (Fig. 3). The run of the detector requires a set of pre-processing steps that include: (1) removing the mean and linear trend of each trace; (2) normalizing trace amplitudes to reduce the effect of geometrical spreading, cable coupling, and nonlinear effects; (3) applying a band-pass filter of 5–30 Hz as well as a (4) common mode noise removal via a frequency–wavenumber (fk) filter by removing the zero-wavenumber (k=0) component, which corresponds to coherent signals that arrive simultaneously across all DAS channels without exhibiting any phase delay.
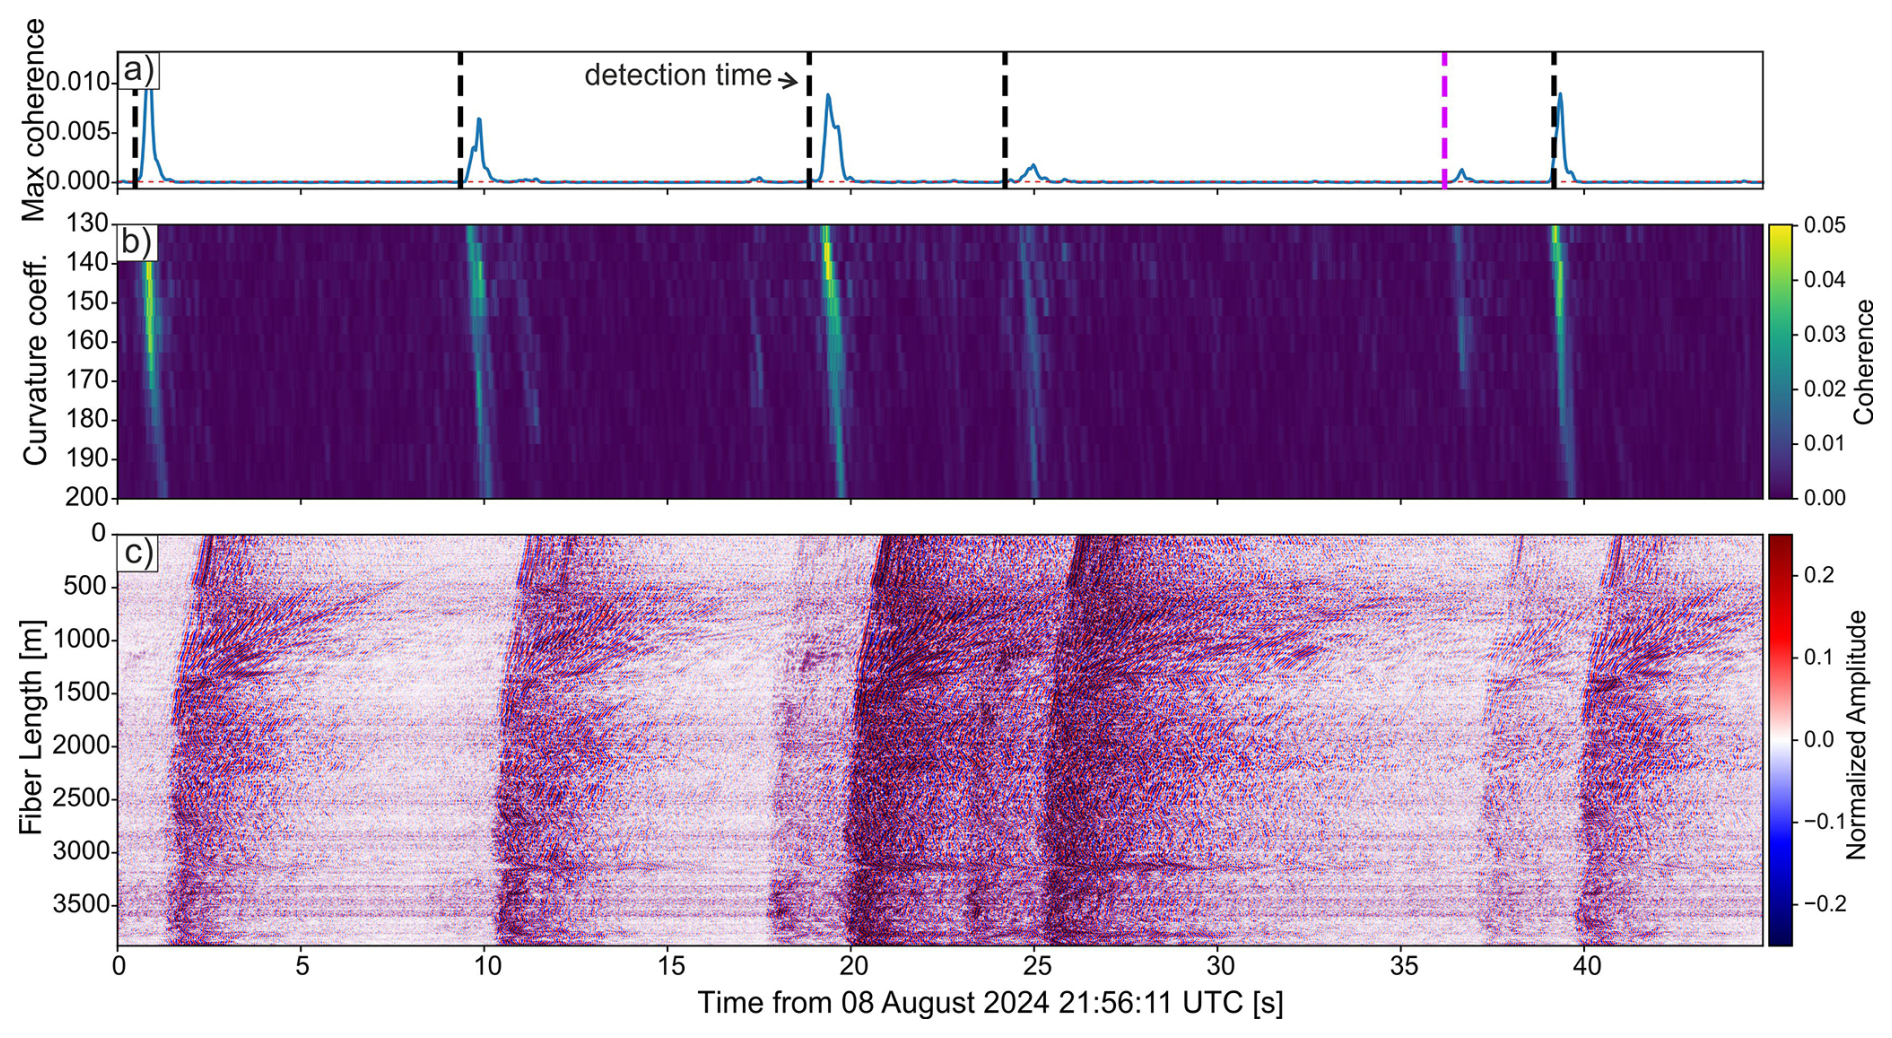
Figure 3(a) Coherence time series in a 45 s window showing six detections. Vertical dashed black lines mark detection times. Violet vertical dashed line (second from the right) indicates a detection identified in the subsequent window (30–75 s) and not in the time window shown here (see text). (b) Semblance matrix, where the coherence maxima highlight events detected by HECTOR (Porras et al., 2024). (c) DAS recording with y-axis channels ranging from 4000 (bottom) to 5900 (top). See text for details of trace processing (Sect. 3). Note that detection times may mark the S-wave arrival, where P-waves are not always clearly visible.
Owing to the strong signal amplification offshore and the clearer hyperbolic seismic phase arrival moveout, we perform detection using an offshore segment of the cable (Fig. 2). Testing different configurations led us to use channels 4000–5900 for detection (Figs. 1c, 2), corresponding to a total length of ∼3900 m. Since the target seismicity cluster northwest of Kefalonia lies beyond the cable's extent, we fix the hyperbola vertex at channel 4000 (bottom Fig. 3c). We let the curvature of the hyperbola vary between 130–200° with steps of 5° and use temporal windows of 30 samples with steps of 10 samples to calculate the semblance and evaluate the coherence of the signals. We run the detection algorithm on 45 s data windows with a 15 s overlap (Fig. 3). The overlap ensures that potential earthquakes that might occur across two consecutive files are not missed. To eliminate duplicate entries, we de-cluster the initial detection list by removing signals that occur within 3 s of each other, retaining only the earliest detection. We choose this 3 s threshold specifically to account for the detector's inability to distinguish between P- and S-wave arrivals, which would otherwise register as separate events. Because the observed TS–TP times, where TS and TP denote S- and P-wave arrival times, along along the offshore channels do not exceed ∼2.5 s for earthquakes within cluster northwest of Kefalonia (Fig. 2a–b), a 3 s window safely merges these phases into a single event identification for most detections. The 15 s overlap between consecutive windows may also cause the same event to be detected twice, which we also mitigate with the de-clustering. We note that detection time (Fig. 3a) may be shifted with respect to the phase arrival observed in Fig. 3c because the vertex and the curvature of the hyperbola provide the highest signal coherence, which may not perfectly correspond with the earliest time of the phase arrival.
Running the HECTOR detection algorithm on the 2 weeks of data leads to a total of 6817 detections (Fig. 4). The number of detections increases substantially relative to the revised NOA catalog, with the highest counts occurring after ML 2.5+ earthquakes listed in that catalog (Fig. 4). The number of detections within 1 h bins following ML 2.5+ events from the NOA catalog exceeds 100 and exhibits an Omori-like decay (Fig. 4). We note that all ML 2.5+ NOA earthquakes reported in Fig. 4 occurred within the active cluster northwest of Kefalonia (pink box in Fig. 1). Importantly, although we calibrate the detector parameters to maximize sensitivity to the region of elevated seismicity offshore northwest of Kefalonia Island, we successfully detect all 91 earthquakes reported in the NOA catalog that occurred within ∼50 km of the cable's starting point (Fig. 1). The sensitivity to various azimuthal directions, distances, and magnitudes suggests that the set of parameters, DAS channels, and waveform processing used in the detector (as applied in this study) offer sufficient flexibility.
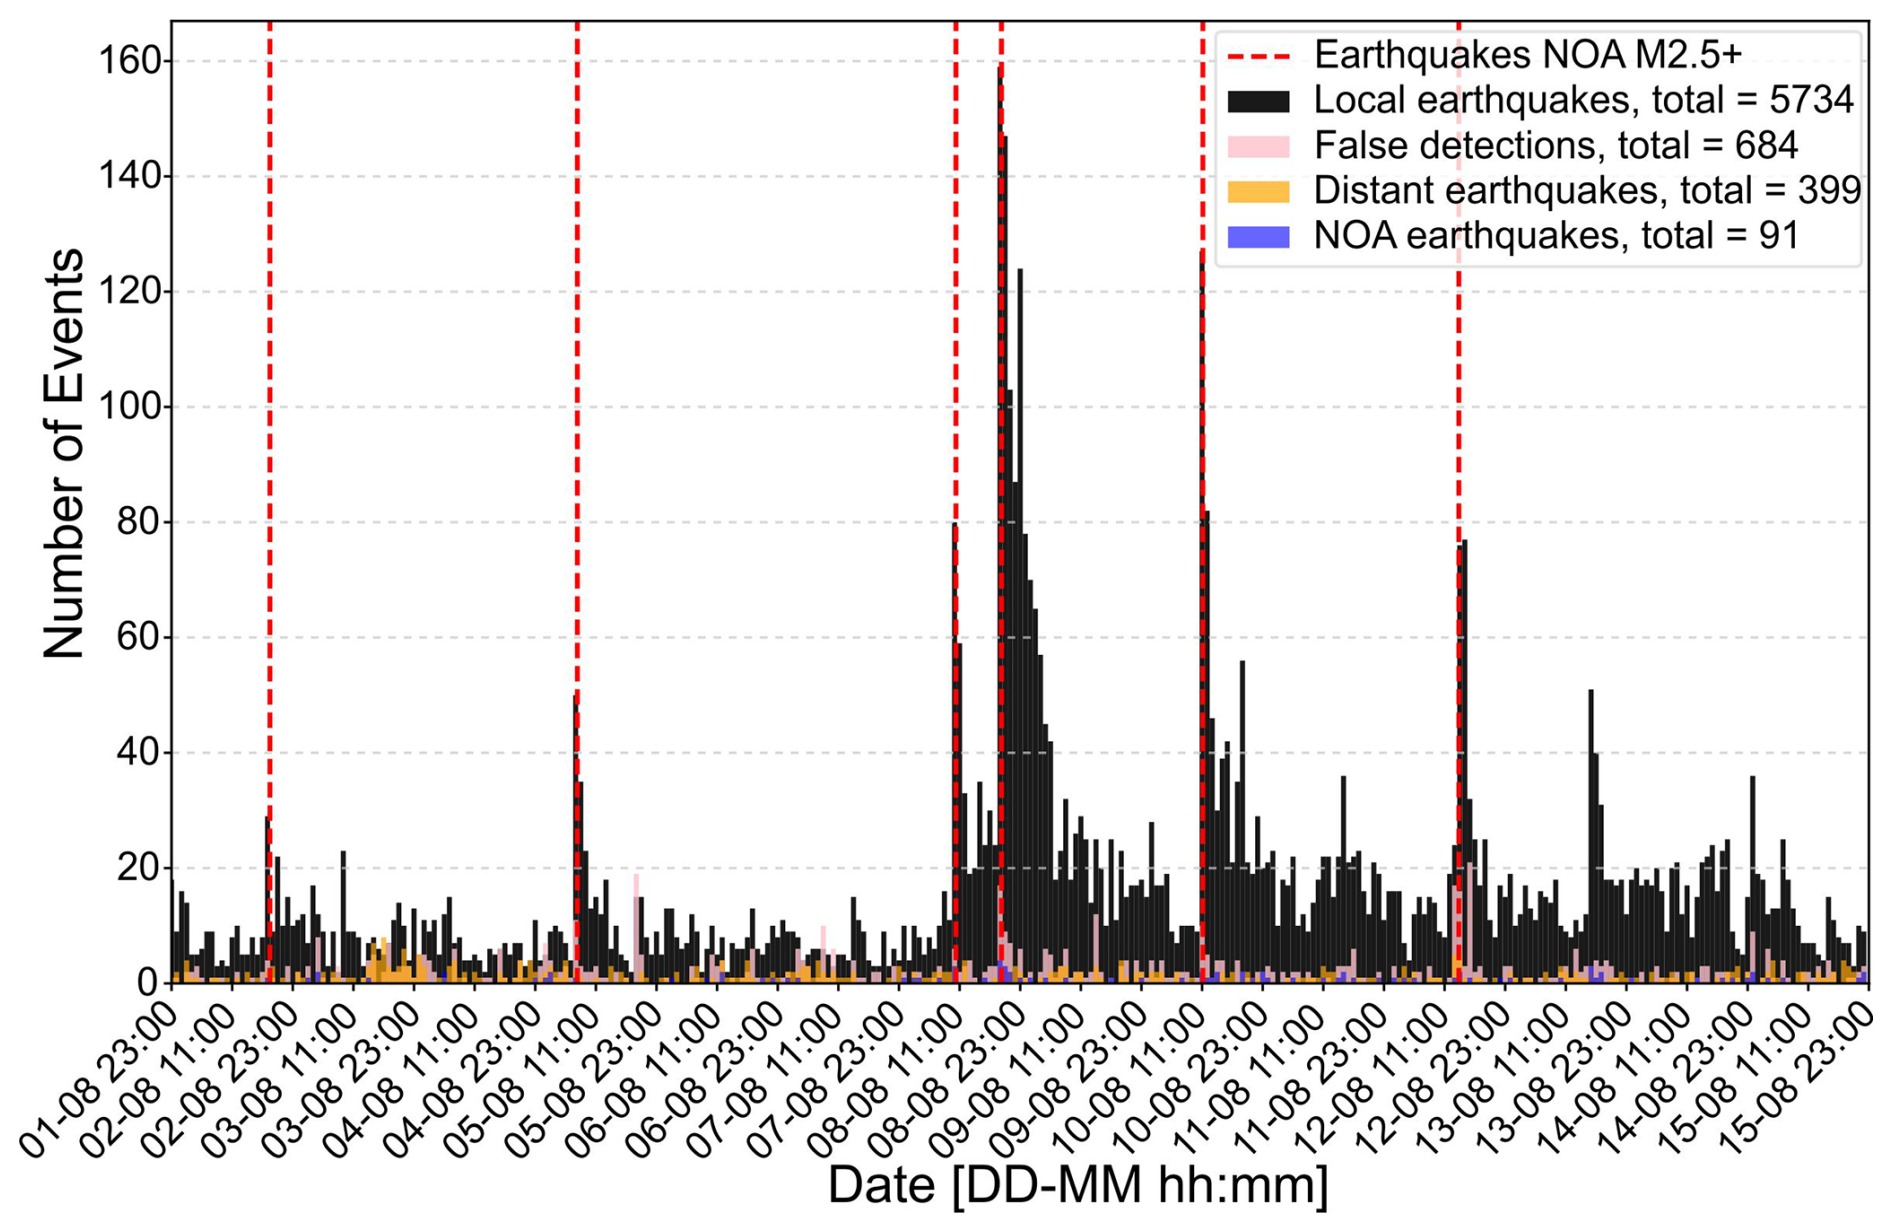
Figure 4Histogram of detections in 1 h bins obtained with HECTOR from 1 August 2024 at 23:00 to 15 August 2024 at 23:00. Detections are classified after manual inspection of the signals. Distant earthquakes represent signals with TS–TP>∼6 s, where all 91 earthquakes from the revised NOA catalog within ∼50 km of the cable starting point (Fig. 1b) are included in the histogram. Vertical lines indicate ML 2.5+ earthquakes from the revised NOA catalog.
We manually inspect all detections and classify them into three groups based on their manually determined TS–TP values and arrival moveout: (i) local earthquakes (Figs. 4, 5a–b), (ii) distant earthquakes (with TS–TP>∼6 s) (Figs. 4, 5c), and (iii) false detections (Figs. 4, 5d–e). Local earthquakes (5734) include events within ∼50 km of the start of the cable and are identified by coherent signals along the nodes that commonly have clearly visible P- and/or S-wave arrivals (Fig. 5a–b). Smaller-amplitude earthquakes are recognizable primarily from characteristic reverberations between channels 5000–5500 in the submarine section of the cable (Fig. 5b). We inspect some of the weaker amplitude earthquakes with a spectral over-subtraction denoiser (Pascucci et al., 2026) to confirm that the signals correspond to real seismic events (Fig. S4). False detections (684) include non-seismic signals (e.g., boat noise; Fig. 5d), triggers within the coda of larger events where P- and S-wave arrivals are absent or unclear (Fig. 5e), and duplicate entries. In the case of duplicate detections, we retain the earliest detection (typically the P-wave arrival) and classify the latter detection as false. For example, we retain the P-wave arrival in Fig. 5c as the detection of the distant event, while the S-wave arrival is rejected as a false detection. We obtain a false detection rate of approximately 6 % (399 out of 6817 detections), which we consider a conservative overestimate. This is because some cases classified as false detections correspond to S-wave arrivals for which the associated P-wave is also detected, but the S-wave was not automatically removed during the 3 s de-clustering process. Manual inspection of signals also reveals missed events, particularly during the most active periods (i.e., after 8 August, Fig. S6).
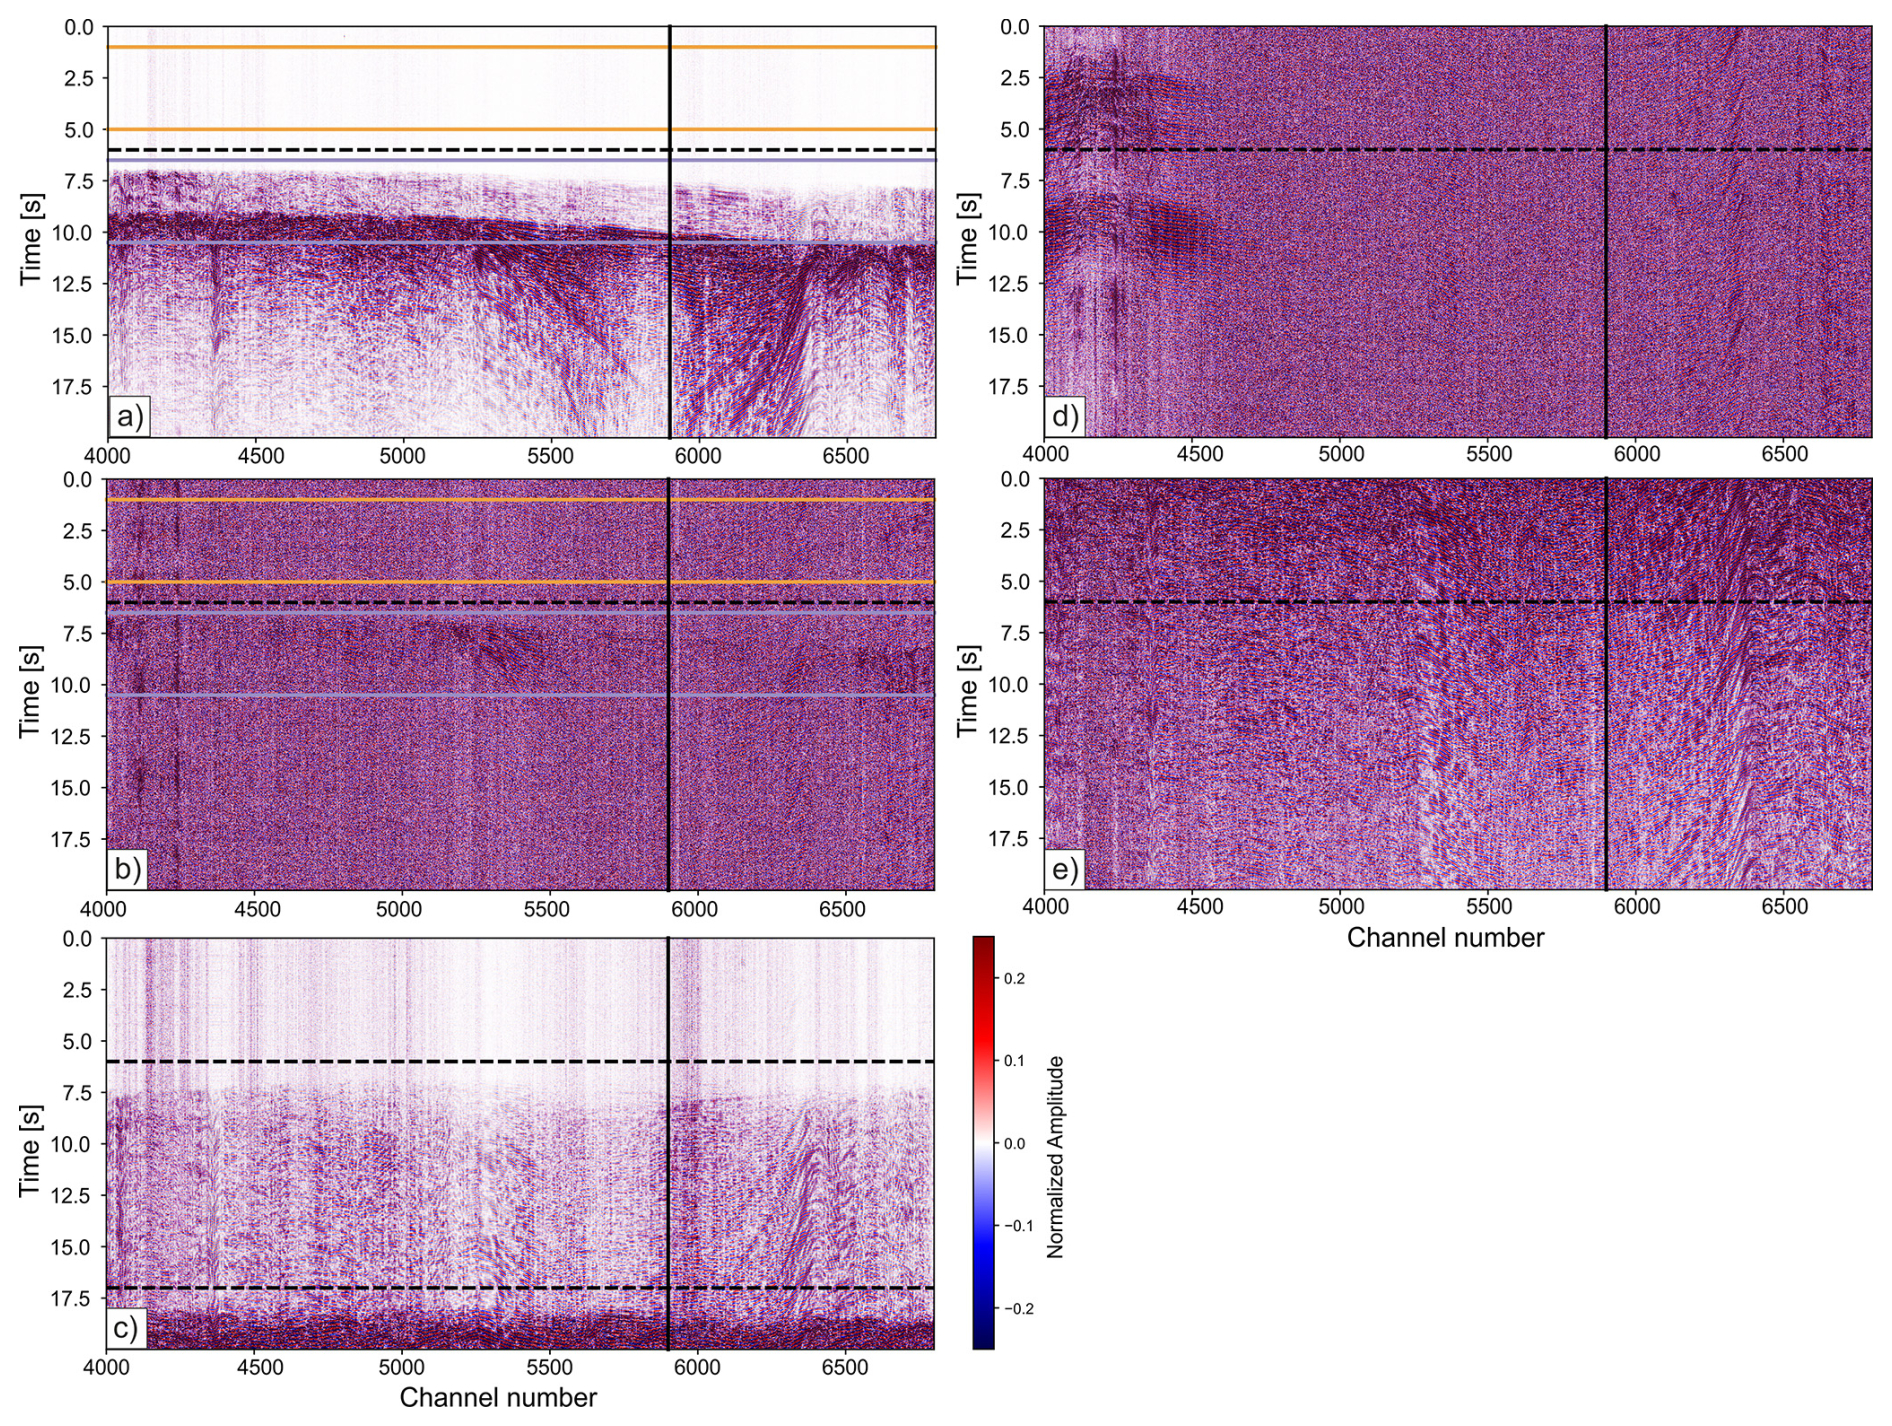
Figure 5Typical examples of detected signals. (a) ML 1.2 earthquake, (b) ML 0.3 earthquake, (c) distant earthquake, (d) false detection, (e) false detection. Panel (d) likely shows a signal from a boat while (e) represents a detection within the coda of an earthquake. We obtain two detections in panel (c), where the earlier detection (P-wave arrival) is retained. We declare the second detection from the S-wave arrival as false. Dashed horizontal lines indicate the detection time obtained from HECTOR while the orange and purple lines in panels (a)–(b) indicate noise and signal windows (4 s), respectively, that are used to calculate the signal-to-noise ratios (SNR). The detections are obtained from channels 4000–5900, while SNR are calculated from all offshore channels 4000–6800 (channels with the highest SNR, Fig. 2). Figure S5a–b shows the event in panel (b) before and after the application of a spectral over-subtraction denoiser.
We initially locate and calculate local magnitudes for high-SNR detected local earthquakes by combining DAS and seismic station data. We calculate SNR on offshore cable channels (4000–6800) considering a noise window from 1–5 s before the detection time and a signal window from 0.5–4.5 s after the detection time (Fig. 5). We compute the average Root-Mean-Square (RMS) values for noise and signal on traces band-pass filtered between 5–20 Hz, using a trimmed mean that removes the highest and lowest 10 % of values (trim fraction 0.1).
We then calculate SNR as follows:
We consider local earthquakes (following the criteria outlined above) with a SNR >12 dB for hypocentral location and magnitude estimation, resulting in a subset of 456 events out of the 5734 detected local earthquakes. We manually include a ML 3.4 earthquake on 8 August 2024 at 19:18 (event id: kef2196) despite its low SNR of 5.3 dB, as it represents the largest earthquake recorded northwest of Kefalonia during our study period. The low SNR results from the origin time being ∼12 s after a nearby ML 3.0 (event id: kef2195) whose coda wave contaminates the window containing the primary phase arrival of the ML 3.4 earthquake. Thus, our initial dataset consists of 457 earthquakes for location. The restrictive SNR threshold reflects the goal of building a high-quality reference catalog of locations and magnitudes. We perform automatic P- and S-wave arrival picking on DAS data using PhaseNet-DAS (Zhu et al., 2023) for each of the 457 earthquakes. We define 20 s windows for PhaseNet-DAS that start 6 s before the detection time and end 14 s after it (same as in Fig. 5). We follow the preprocessing used in the PhaseNet-DAS implementation (https://ai4eps.github.io/EQNet/phasenet_das/, last access: 26 May 2026), including conversion of strain to strain rate via temporal differentiation. We apply an additional band-pass filter between 5–40 Hz as part of our preprocessing. We manually inspect all picking results and observe good quality P- and S-phase picks (Fig. S7).
To reduce the number of DAS channels for earthquake location and achieve a number comparable to the seismic stations, we subdivide the cable into 12 segments (Fig. 1c) using a custom geometric clustering algorithm. The algorithm uses Density-Based Spatial Clustering of Applications with Noise (DBSCAN, Ester et al., 1996) to group channels exclusively by their spatial coordinates. It automatically instantiates a new segment boundary whenever the azimuthal angle variation exceeds a specified threshold. We allow a maximum azimuthal variation of 60°, applied an azimuth smoothing window of 50 channels, and enforce a minimum constraint of 100 channels per segment. We assign median P- and S-wave arrival times that we estimate in a prior step with PhaseNet-DAS applied to the entire cable to the median channel for each of the 12 segments. Finally, we download waveforms from the seven stations closest to the cable (Figs. 1, S3) and manually pick P- and S-wave arrival for each of the 457 earthquakes in Snuffler (Heimann et al., 2017) when data quality permits.
4.1 Earthquake location
We consider events with a P- or an S-wave arrival identified by Phasenet-DAS on at least 10 of the 12 cable segments and with a clear P- or S-wave arrival at a minimum of three seismic stations for earthquake location. The minimum required number of segments and stations assures adequate azimuthal coverage for the events in the cluster offshore northwest of Kefalonia. We compute earthquake locations with NLLoc (Lomax et al., 2000) using arrival times from both DAS and seismic station data and a local 1D velocity model (Haslinger et al., 1999). We revised the original velocity model by removing the second layer at 0.5 km depth (Vp =5.47 km s−1), maintaining lower velocities from 0 to 2 km depth (Table S1) to reflect the presence of unconsolidated sediments beneath the offshore cable segment. The removal of the second layer from the original velocity model reduces the number of very shallow earthquakes (0–1 km) and improves depth resolution slightly. We calculate static phase arrival time residuals at the seismic stations and DAS channels used for location and include them in the final NLLoc run. Incorporating these residuals partially accounts for velocity model heterogeneities and mitigates the limitations of a 1D model. We note, however, that static station corrections are influenced by the spatial distribution of seismicity and are most appropriate for the region with the highest event density for this data set. We successfully locate 356 of the 457 local earthquakes (Fig. 6). The remaining events were either recorded at only two seismic stations or lacked a median phase arrival time on at least 10 cable segments, which inhibited robust hypocentral solutions. We obtain average semi-major and semi-minor horizontal ellipse error axis values of 1.5±0.5 and 0.8±0.4 km, respectively, and vertical errors of 1.9±0.6 km (Fig. S8).
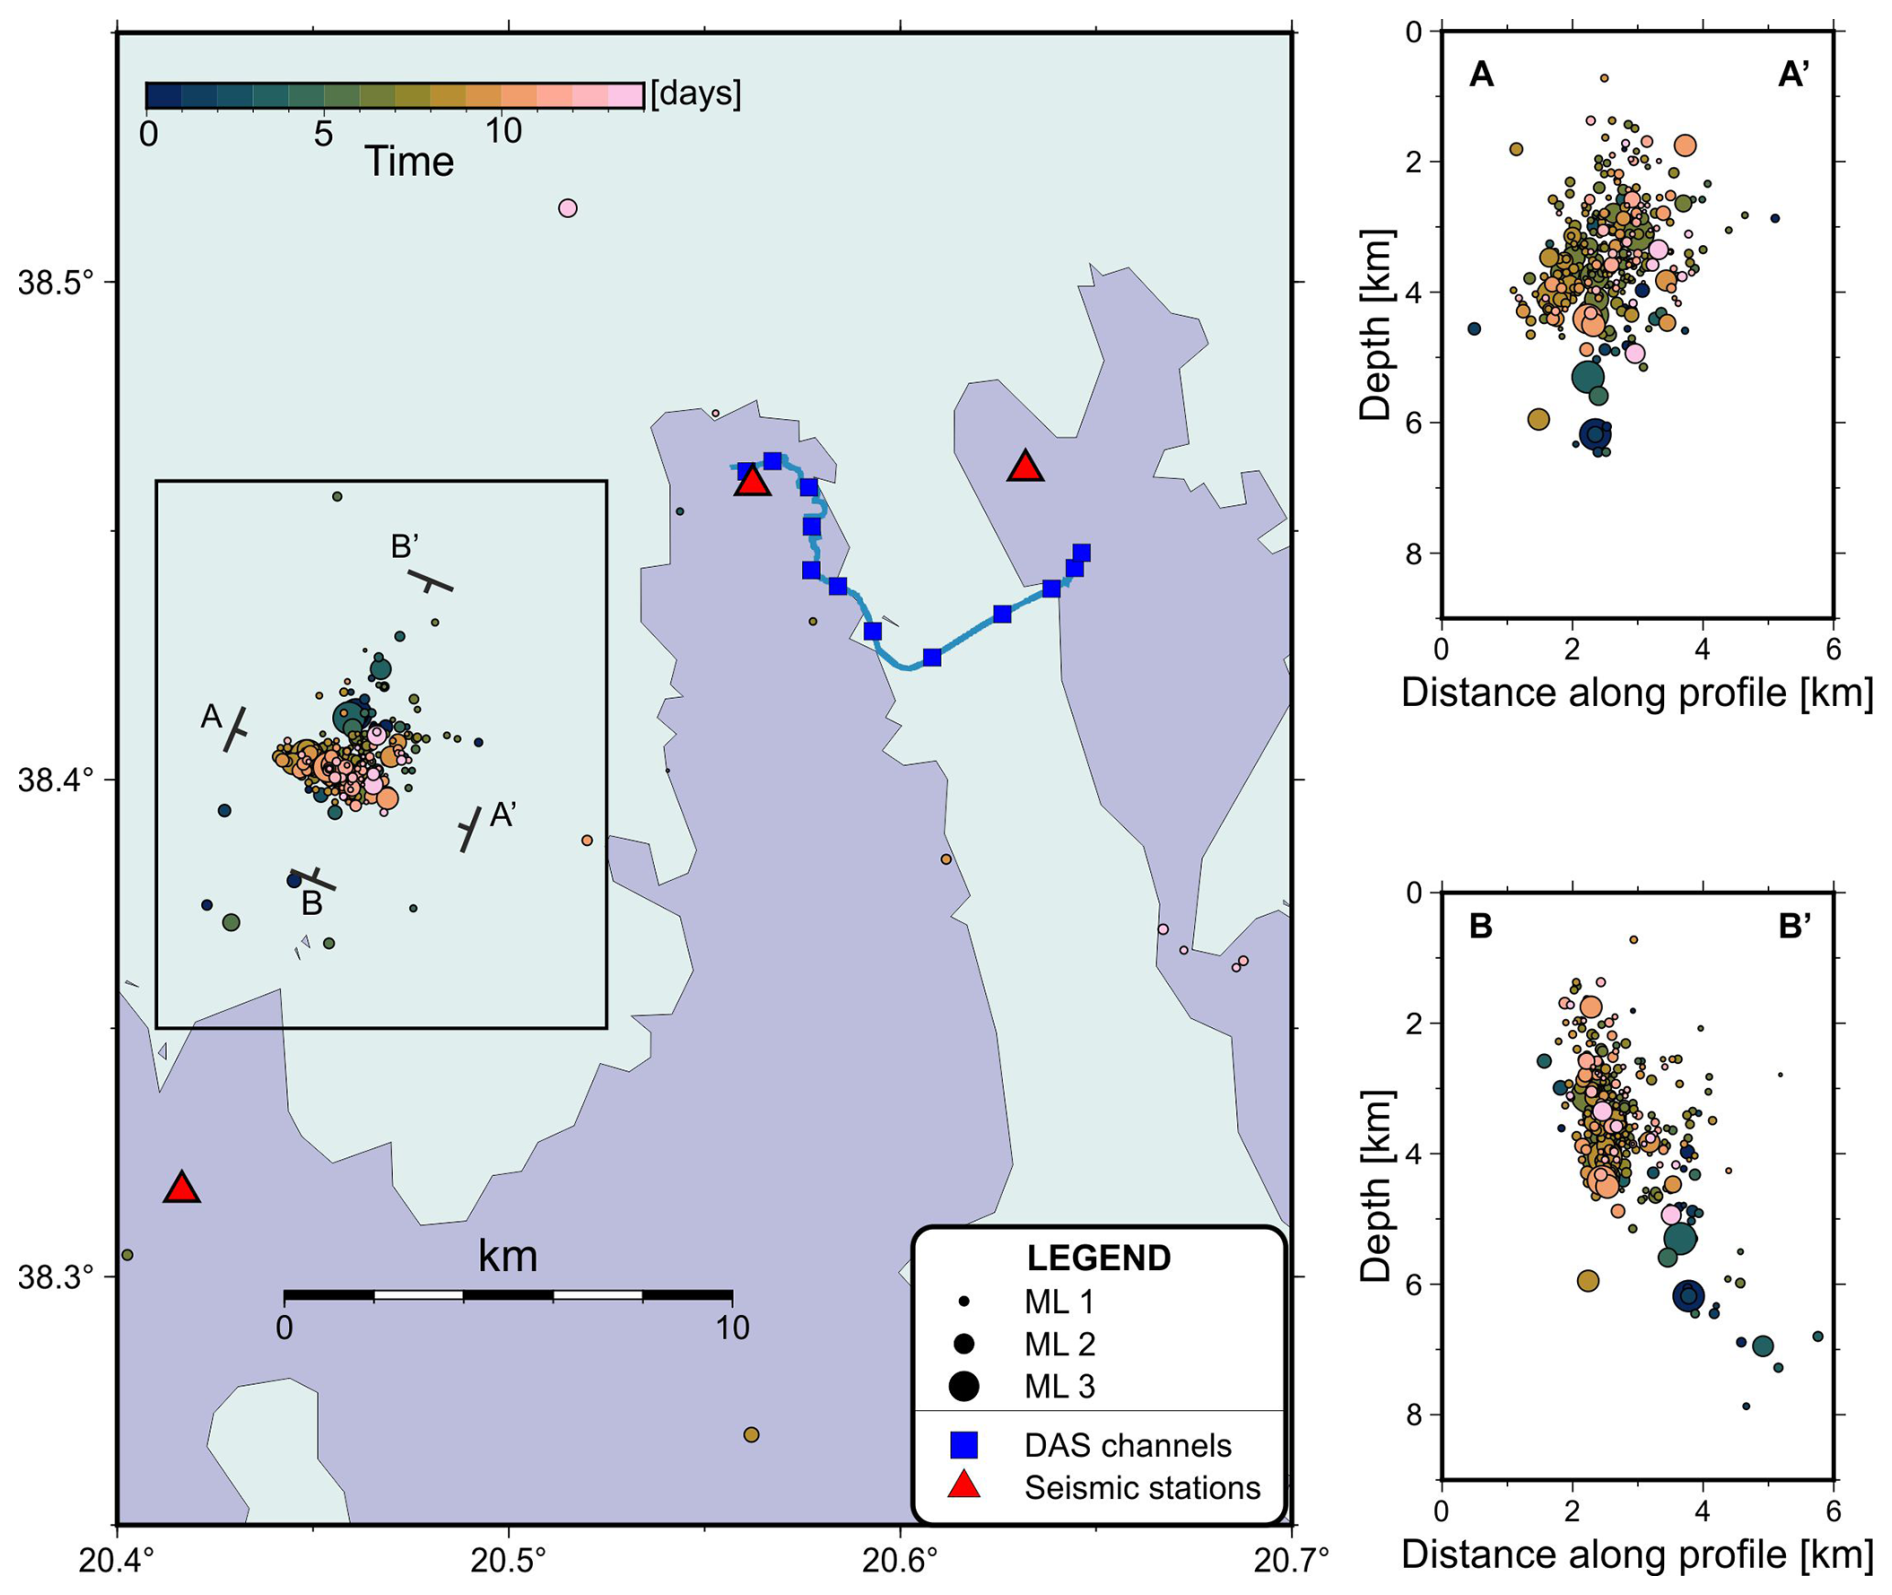
Figure 6EHypocentral locations of earthquakes with average SNR >12 dB, estimated along the offshore portion of the cable (channels 4000–6800) by combining P- and S-wave arrival times from DAS and seven nearby seismic station data. Local magnitudes are computed using data from the four seismic stations on Kefalonia and one on Ithaki (shown in Fig. 1). Blue squares indicate the median channel positions for each cable segment, associated with the corresponding median P- and S-wave arrival times (see Fig. 1 and Sect. 4). The black box denotes the area shown by the pink box in Fig. 1 and outlines the most seismically active region during the two-week study period. Seismicity cross-sections include events located within 2 km of either side of each profile trace.
4.2 Earthquake magnitude estimate
We estimate ML using seismic station data following the empirical relation of Hutton and Boore (1987) because the relation is also employed by NOA for ML calculations (Melis and Konstantinou, 2006). We remove instrument response and convert waveforms to Wood-Anderson equivalent amplitudes. We then apply a 1 Hz, high-pass filter before calculating amplitudes at seismic stations. The 1 Hz high-pass filter helps remove longer period microseismic noise and improves magnitude estimates for smaller earthquakes (ML< 0.6–0.8). We restrict the magnitude analysis to the four stations with the largest number of picks (FSK, DMLN, ITHC, VLS), as well as a fifth station, ATHR, because of its proximity to the cluster of seismicity northwest of Kefalonia (Fig. 1). For each station we use the maximum amplitude between the two horizontal components to estimate magnitude. Because some events have low amplitudes and are not always clearly visible at five stations, or because some signal windows may contain overlapping earthquakes, we calculate ML using only the individual station magnitudes that differ by less than ΔM=0.5 from the average event magnitude estimate. We require at least three station magnitudes with ΔM<0.5 to assign a final ML, which is then computed as the average of the retained values. ML estimates are possible for all 356 earthquakes based on the above quality control requirements, and values range from 0.2 to 3.4. A comparison of earthquake magnitudes estimated here and common events in the revised NOA catalog shows a correlation coefficient of R=0.95 and a near one-to-one relationship, with most of the absolute residuals < 0.1–0.2, suggesting a strong correlation (Fig. S9). The observed deviation between ML estimates from this study and those reported by NOA can be attributed to differences in the seismic stations used and in hypocentral locations.
For clarity in our catalog enhancement workflow, we define template events as earthquakes with absolute hypocentral locations and magnitude estimates derived from the seismic network, and target events denote local earthquakes whose locations and magnitudes are initially unknown. We begin catalog enhancement by using 352 of the 356 located earthquakes as templates. We omit four events from the group of templates that have either a semi-major horizontal error ellipse axis and/or a depth error >5 km, or a depth above the sea level. This error threshold is necessary because large location uncertainties propagate into significant errors in ML, which in turn, affect the relative magnitudes that are calculated during enhancement using the amplitude ratios between templates and target events. Prior to calculating these cross-correlations, the continuous waveform records are downsampled to 50 Hz and the analysis is restricted to the same offshore cable section (channels 4000–5900) used for event detection (Fig. 7). We band-pass filter all traces between 5–20 Hz before computing a channel-based cross-correlation coefficient (CCC) using 4 s time windows that begin 0.5 s after the detection time (Figs. 7 and 8). We cross-correlate each of the 5378 target events with the 352 template events. Each target event is subsequently assigned the location of its most highly correlated template event. We retain the initial absolute locations and magnitude estimates in the final catalog for the four events previously excluded from the template database due to large hypocentral errors (>5 km) or because located above sea level.
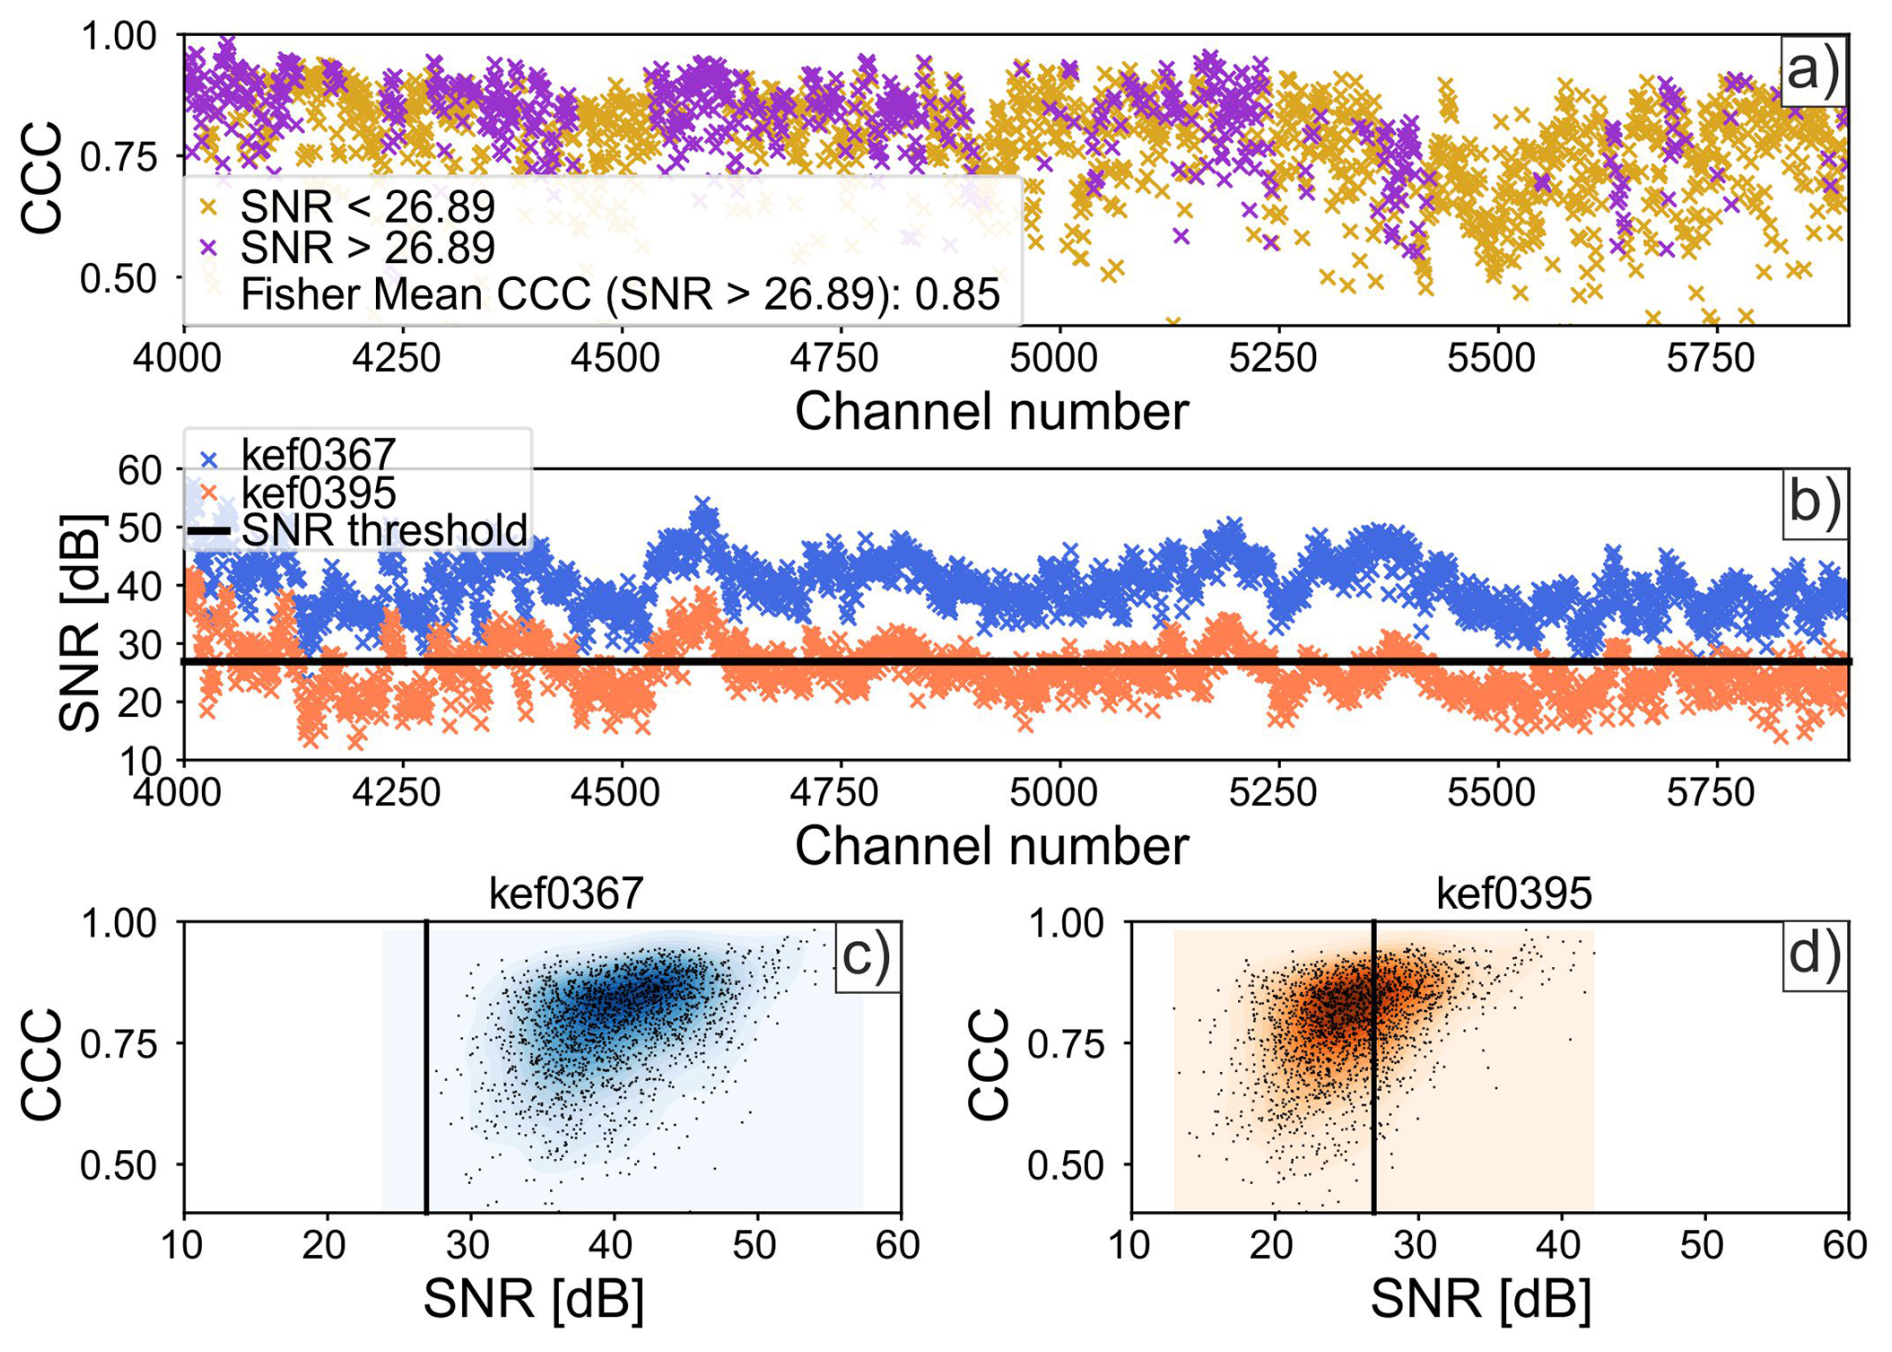
Figure 7Waveform cross-correlation coefficient (CCC) analysis for event pair kef0367 (ML 1.6) and kef0395 (ML 0.9). (a) CCC of individual DAS traces from channels 4000–5900. (a) Purple and gold symbols are CCC values above and below a SNR threshold calculated from the smaller amplitude event in the pair (see text and description in panel b of this figure). (b) Signal-to-noise ratio (SNR) of each event in the pair. SNR (in dB) is calculated as the ratio between the root-mean-square of the signal in 4 s windows starting 0.5 s after the detection time and noise windows of the same length starting 5 s before the detection time (refer to Fig. 3a for SNR windows). The thick horizontal black line marks the minimum SNR threshold required for the CCC calculation, which is defined by the lower-amplitude event. The threshold corresponds to the cutoff of the top 33 % of channels with the highest SNR. (c–d) CCC versus SNR for events kef0367 and kef0395. The vertical black line indicates the minimum SNR threshold. Average CCC of the event pair is 0.85, estimated as the Fisher mean of the individual CCC values. Traces are band-pass filtered 5–20 Hz. The correlation between SNR and CCC at individual traces is even clearer when showing CCC values over the entire cable (Fig. S10).
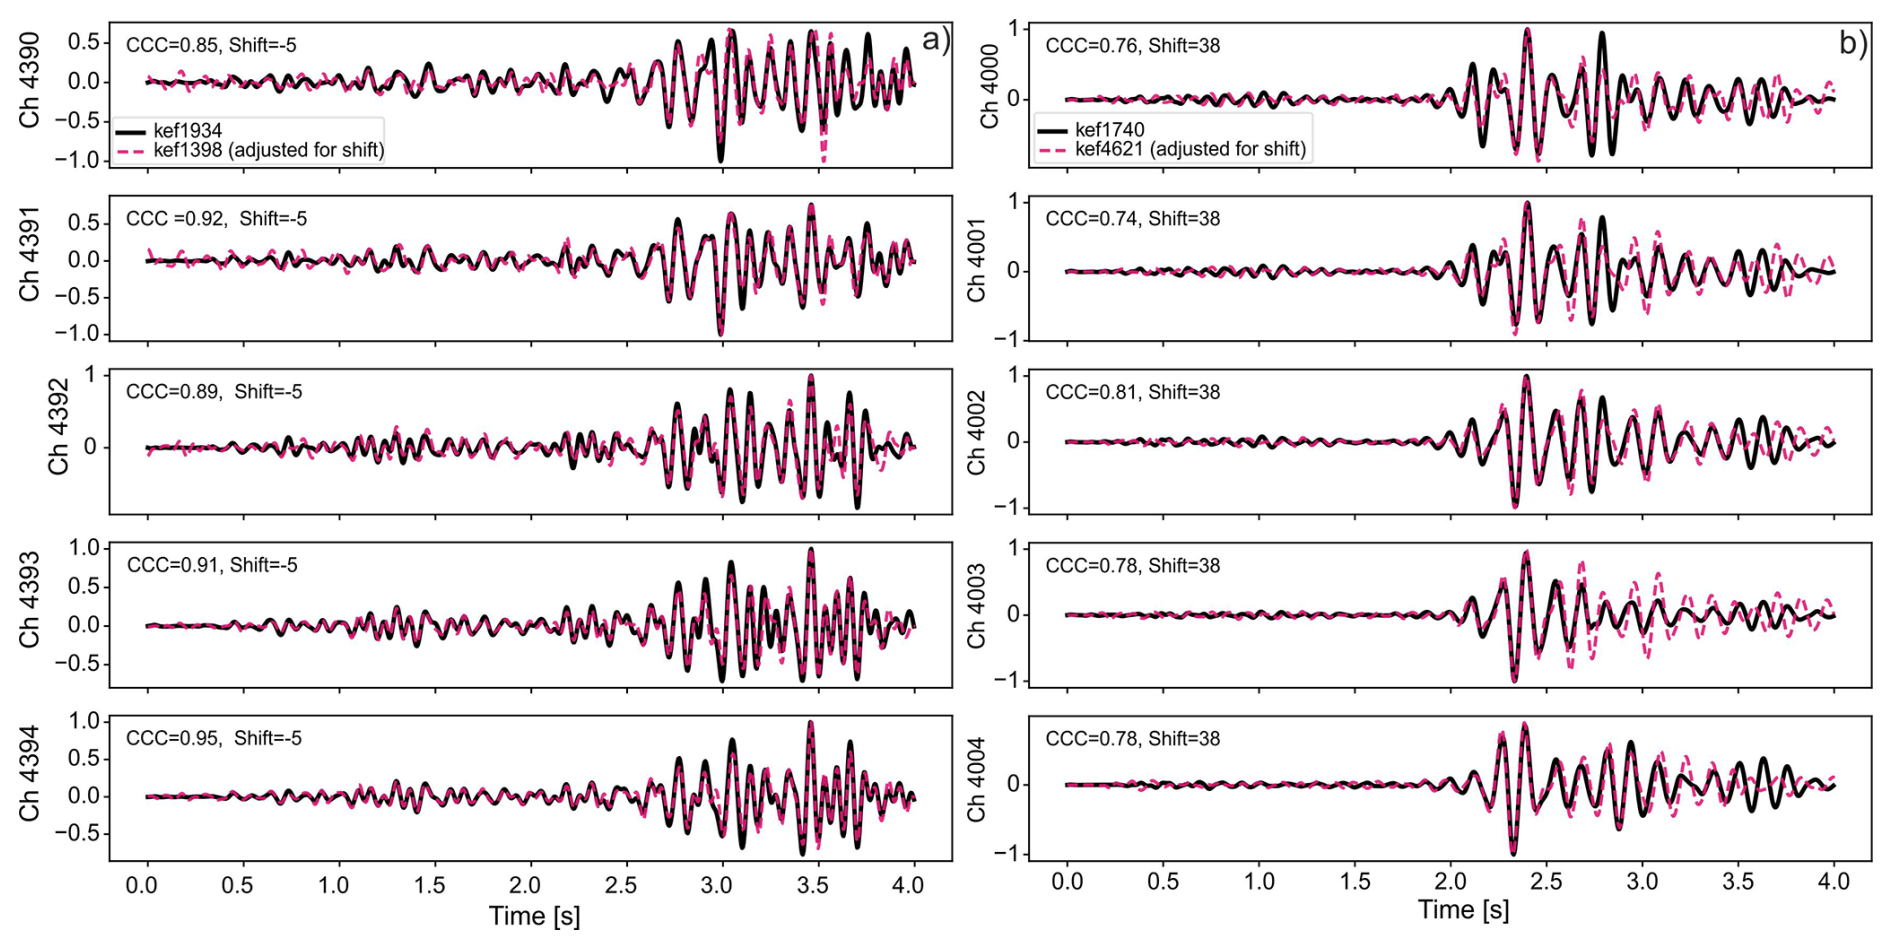
Figure 8Event pair (template-target) cross-correlation. Black traces are template events with location, and a ML estimates, while in magenta it is the target event with no (initial) location or magnitude estimate. (a) Event pair kef1934 (ML 1.3) and kef1398 (ML 0.3) with average CCC of 0.93. (b) Event pair kef1740 (ML 0.4) and kef4621 (ML −0.2) with an average CCC of 0.58. Traces are band-pass filtered at 5–20 Hz and normalized to make waveforms comparable. CCC is calculated in 4 s windows starting 0.5 s after the detection time. CCC at a given channel and time shift (in samples) are indicated for each subpanel.
We observe that CCC varies across channels (Figs. 7a, S10a) and that higher CCC values are associated with channels with higher SNR (Figs. 7c–d, S10c–d). To account for varying CCC with SNR, we apply a SNR criterion before averaging the CCC values of individual channels. We then compute the average CCC between event pairs using the Fisher mean (Fisher, 1921; Silver and Dunlap, 1987), after excluding 67 % of the channels (i.e., 1273 channels) with the lowest SNR (Figs. 7e, S10e). The SNR estimation uses the 4 s signal and noise windows noted above (Fig. 5), and the cutoff threshold is determined based on the lowest-amplitude earthquake in each event pair (Fig. 7b).
Before selecting the minimum CCC value for associating a target event with a template and proceeding with relative magnitude calculations, we first examine the expected decay of CCC with inter-event distance (Menke et al., 1990). We do so by cross correlating all independent template event pairs (excluding the four events noted above with larger hypocentral uncertainties) following the procedure outlined in the previous paragraph. We restrict the analysis to template earthquakes since we know their locations. Because our analysis relies solely on absolute event locations, the calculated inter-event distances for a given CCC value are likely to overestimate the true physical separation of the event pairs. As expected, we observe a systematic inverse correlation between CCC and inter-event distance (Fig. S11). For instance, we obtain a median inter-event distance of <2 km and a 95th percentile of ∼5 km for a pair with a CCC of 0.52 (Fig. S11). At 15 km distance, this corresponds to a magnitude error of 0.06 for a 2 km inter-event separation and 0.15 for a 5 km inter-event separation. At 10 km distance, the corresponding errors are 0.05 and 0.2, respectively. In this study, we use a CCC threshold of 0.52 that is empirically determined from the observed CCC–distance relationship. Specifically, Fig. S11 indicates a notable increase in inter-event distance for CCC values below ∼ 0.52–0.53. While median inter-event distances remain below ∼3 km for CCC values between 0.40 and 0.52, the 95th percentile increases substantially, indicating a higher risk of large spatial mismatches. We therefore exclude lower CCC values to ensure robustness of the event associations. By using a CCC threshold of 0.52, we associate 2515 target events to template events. We test slightly different CCC thresholds, namely 0.50 and 0.54, in addition to the preferred value of 0.52 used to construct the final enhanced catalog. We find that differences in the number of detected events occur primarily for magnitudes <−0.5 (Fig. S12). We provide all event-pair CCC values to enable reproducibility and allow assessment of the sensitivity of event associations to different CCC thresholds (see Data and code availability). Figure 8 shows examples of target-template pairs exceeding the CCC threshold. We observe that nearly all target events (>97 %) are associated with template events from the cluster northwest of Kefalonia (Fig. S13).
Before calculating amplitude ratios for the determination of relative magnitudes, we first inspect whether we can correctly retrieve the magnitudes of template events using amplitude ratios, where template ML estimates originate from seismic stations (Fig. 9). We associate each template event with its most similar template and recalculate the magnitude from the amplitude ratio of band-passed traces (3–20 Hz) on channels 4000–5900. The lower corner frequency of 3 Hz suppresses long-period noise present in the offshore DAS segment. The upper corner frequency of 20 Hz is sufficiently high to capture the peak amplitudes of smaller earthquakes (ML≈0) with expected peak spectral amplitudes below the source corner frequency (e.g., Baltay and Abercrombie, 2025), and is sufficiently low to minimize high-frequency effects related to source complexity (e.g., Trugman et al., 2021). We consider the average of the maximum amplitudes of traces between 4000–5900 after removing the highest and lowest 10 % values (i.e., trimmed mean) for event pairs with CCC values >0.52. We calculate relative magnitudes as follows:
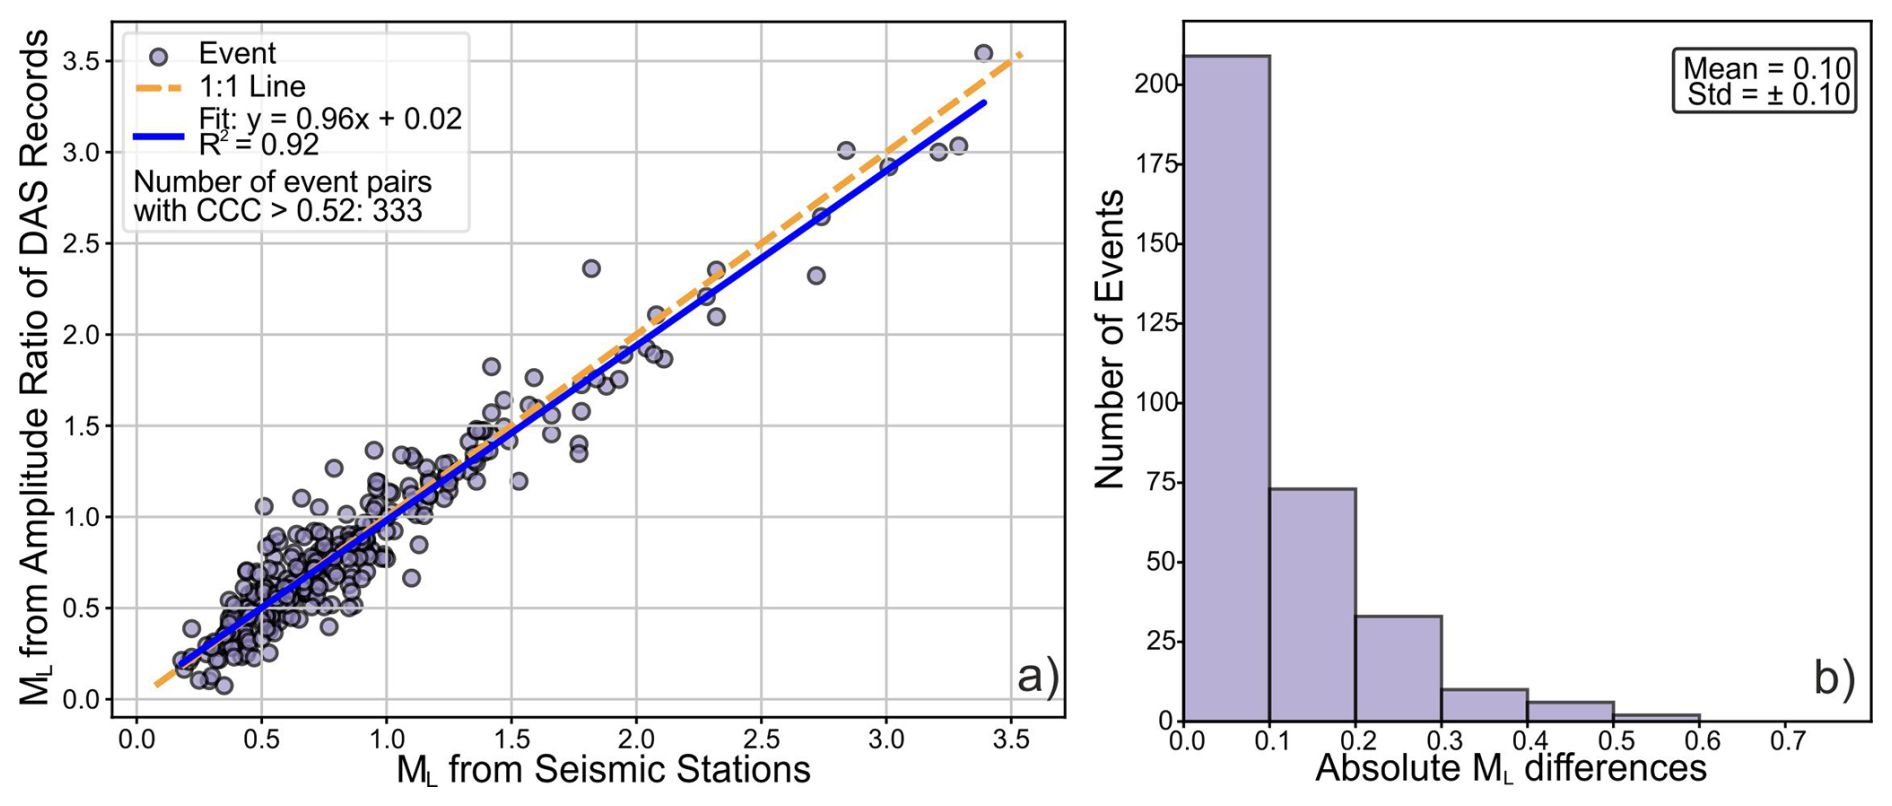
Figure 9(a) ML from seismic stations versus relative ML derived from DAS data. (b) Histogram of differences between ML from seismic stations and relative ML derived from DAS data. The analysis includes all located earthquakes (i.e. templates) with semi-major horizontal error ellipse axes and vertical error <5 km (352 events). Relative ML for each template event is obtained from the mean amplitude ratio with respect to the most similar event using band-pass filtered waveforms (5–20 Hz). Average amplitude ratios are calculated using event pairs with a cross-correlation coefficient >0.52 (333 of the 352 template events) on channels 4000–5900 using a trimmed mean that exclude the highest and lowest 10 % of values.
where M is the magnitude and A is the average of the maximum amplitude.
We observe good agreement between initial ML and relative ML estimates over the full magnitude range, as indicated by a coefficient of determination R2=0.92, mean absolute deviations of 0.1±0.1, and a best-fitting line with an approximately unit slope (Fig. 9). Remaining deviations between seismic-station ML and DAS-derived relative ML estimates may be attributed to imperfectly collocated event pairs and/or uncertainties in the initial magnitudes estimated from the seismic stations. Accordingly, we compute relative magnitudes for all target events with a minimum CCC >0.52 (2515 events) with respect to their template events.
Adding relative magnitude estimates to the 356 events with ML calculated from seismic stations leads to 2871 magnitude estimates (50 % of the local earthquakes). We observe that 2790 earthquakes with a magnitude estimate (97 %) are located offshore northwest of Kefalonia and are mostly clustered in space (Figs. 1, 5, S13). The remaining events are scattered within the study region (Fig. S13), with a few clusters located along the Strait of Ithaki. Figure S13 shows the distribution of all events detected and located in this study with a magnitude estimate. There are 10 events in common with the revised NOA catalog (the NOA catalog reports 91 earthquakes within a radius of 50 km from the start of the cable) that are not included in our catalog of 356 events, despite being successfully detected. Eight of the ten events common to the NOA catalog are omitted because of their average SNR at offshore DAS channels being <12 dB, and they were therefore not considered for initial location (Sect. 4.1). The last two of the ten events are omitted because we observe TS–TP>6 s at offshore DAS channels. The fact that we detect but do not locate a few earthquakes included in the revised NOA catalog reflects our focus on detecting and locating seismicity in the highly active region offshore northwest of Kefalonia. By considering events within the active region northwest of Kefalonia (Figs. 1, 5, S13), we observe a ∼38-fold increase in the number of events with a magnitude estimate relative to the revised NOA catalog (Fig. 10). All events in our catalog down to ML 2.4 are common to the NOA catalog (Fig. 10a), while the number of events from this study significantly increases at lower magnitudes (Fig. 10). Specifically, we estimate a magnitude of completeness of using both a maximum curvature and Goodness-of-Fit Test (Wiemer and Wyss, 2000) and a b-value based on the maximum likelihood estimate (Aki, 1965) (Fig. 10a). The enhanced earthquake catalog shows inter-event times as short as 3 s (the minimum allowed inter-event time from de-clustering) and average inter-event times for 100-event windows down to 30 s.
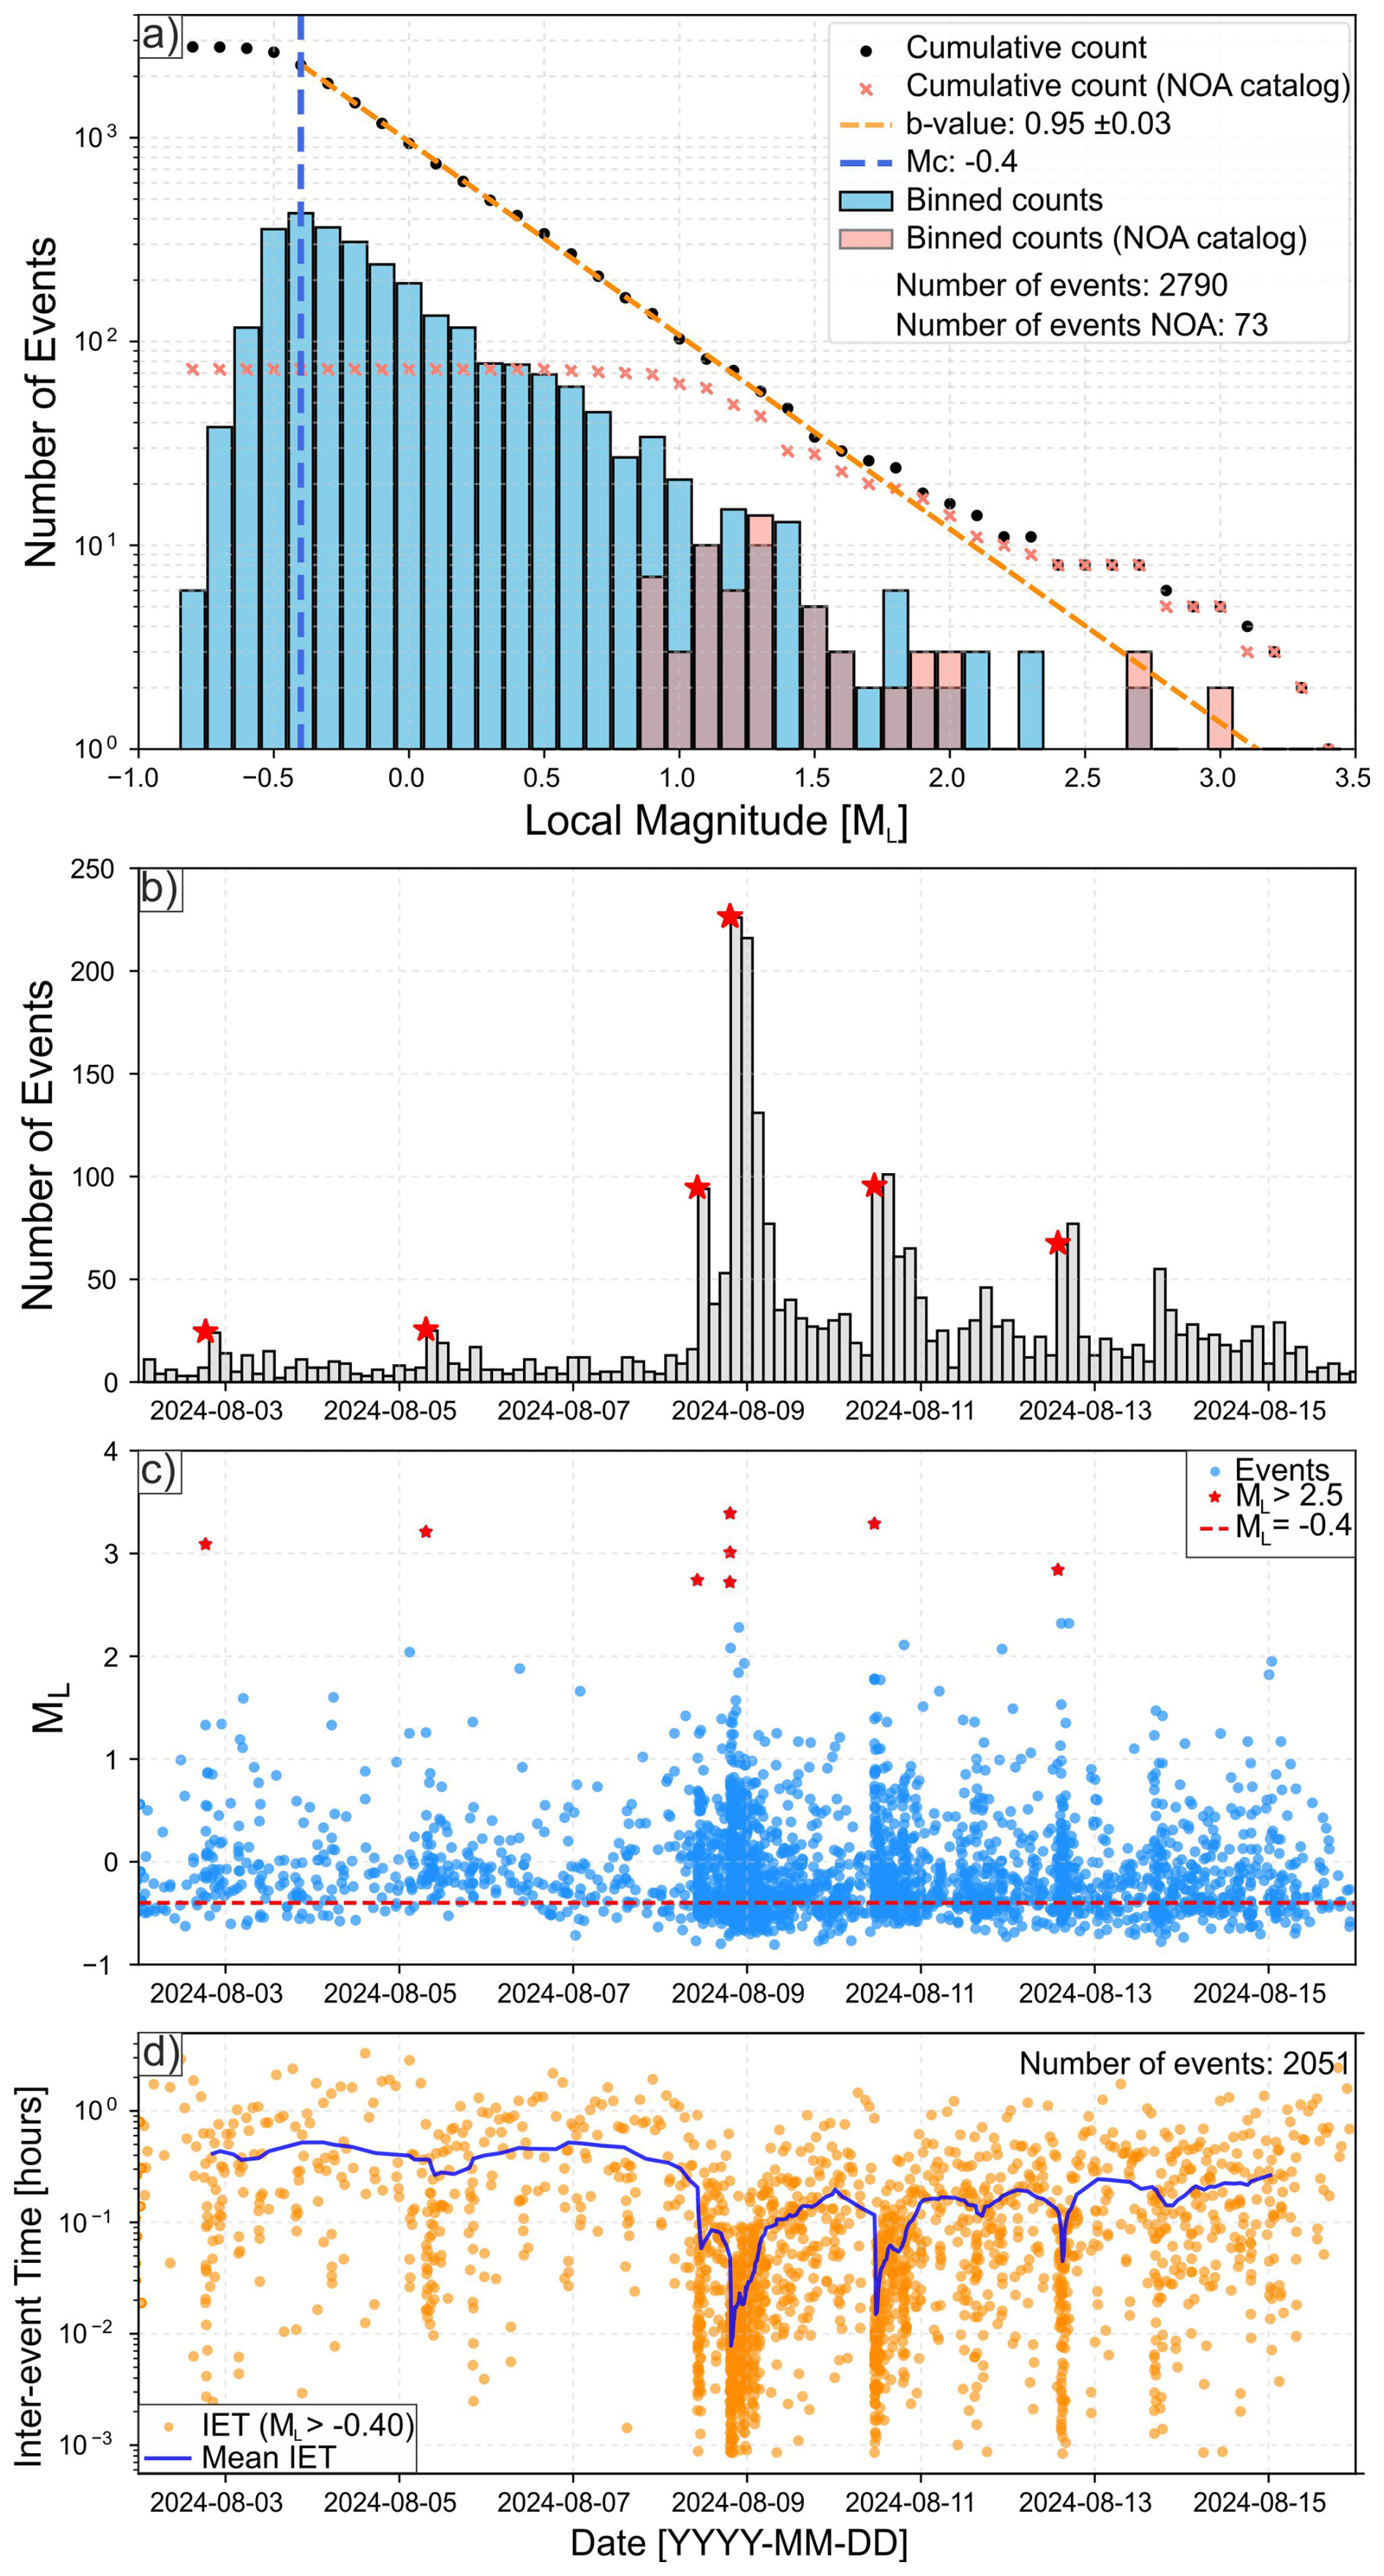
Figure 10Time–space–magnitude distribution of seismicity in the region 38.35–38.46° N, 20.41–20.525° E (black box in Figs. 1 and 6). (a) Frequency–magnitude distribution of events from this study compared with events from NOA for the same period and region. The b-value is estimated using Maximum Likelihood (Aki, 1965), and the magnitude of completeness (Mc) using the Goodness-of-Fit Test and Maximum Curvature method (Wiemer and Wyss, 2000). (b) Number of events over time (3 h bins). Red stars indicate ML>2.5 earthquakes. (c) Event magnitudes versus time for individual events. (d) Inter-event times (100-event sliding windows with 90 % overlap) between successive events with ML>Mc plotted against time.
This study releases two-week DAS waveforms and a high-resolution earthquake catalog derived from the integration of DAS recordings and publicly available data from conventional seismic stations. The dataset captures a period of exceptionally high seismicity within 10–15 km of the fiber-optic cable at rates exceeding 100 events per hour (Figs. 1, 6). Although other open-access DAS datasets also contain high event rates, most of them were acquired in boreholes and target induced seismicity (the FORGE dataset, Porras et al., 2024), rather than natural earthquake sequences.
The highest seismicity rates occur offshore in a cluster northwest of Kefalonia with a ∼5 km radius where azimuthal coverage from land stations is limited (Figs. 1, 6). The intense seismic activity combined with sparse station geometry are challenging for the monitoring of active seismic sequences (Grigoli et al., 2021; Karastathis et al., 2015). This work shows that combining DAS and seismic station data can make it possible to overcome some of the challenges associated with observing offshore earthquakes: using DAS channels for dense wavefield sampling and earthquake detection, combining DAS and seismic station data for determining hypocenter locations, and using seismic stations for amplitude calibration and magnitude estimation.
The enhanced catalog presented here exhibits high temporal resolution, with inter-event times as short as 3 s and a completeness magnitude of . It captures evolving statistical features of the seismic sequence, including a transition from more Poisson-like inter-event time distribution to densely clustered activity associated with mainshock–aftershock activity (Fig. 10c). The catalog also reveals notable changes in aftershock productivity. For instance, two M>3 earthquakes before 8 August 2024 were not followed by clear aftershock activity, whereas similar-sized and smaller events after that date produced pronounced aftershock sequences (Fig. 10b–c). After 8 August, we observe a systematic relation between mainshock magnitude and aftershock inter-event times, with larger mainshocks followed by shorter aftershock inter-event times (Fig. 10d). The distribution of the seismicity highlights a nearly vertical WNW-ESE striking fault (Fig. 6), which is consistent with the geometry observed by Anagnostou et al. (2025), who used 3-month data between the end of February and the end of April 2025. These observations underscore the high spatial and temporal resolution of the catalog that we will discuss in a detailed analysis of the space–time–magnitude patterns that will be addressed in a separate study.
The amphibious nature of the telecommunication cable introduces additional features of shallow crustal structure that warrant further investigation, including the strong signal amplification observed along the marine segment and its potential influence on magnitude determination when using DAS data alone. This offshore amplification may reflect not only variations in shallow crustal structure, but also differences in DAS sensitivity to body and surface waves, mechanical coupling, cable construction, and installation conditions across the onshore–offshore transition.
6.1 Distorted waveforms
The close proximity of the cable and the large magnitudes of the sequence also led to distorted waveforms on many channels after the S-wave arrival for earthquakes with ML>∼2. The distortion is mostly limited to offshore channels but can also appear on onshore channels for events with ML>∼2.8. This distortion is likely related to cycle-skipping issues in DAS caused by dynamic range limitations (Katakami et al., 2024). In fact, for a sample of earthquakes exhibiting distorted waveforms, we observe a phase shift corresponding to an integer multiple of 2π that is consistent with cycle-skipping. However, determining the exact cause is challenging because the data were decimated by a factor of 20 before storage (from 5000 to 250 Hz), eliminating higher-frequency energy above 125 Hz. With our settings, the maximum change measurable between consecutive samples is ∼0.033με (±π). While the QuantX instrument can measure larger signal amplitudes, it cannot track phase changes exceeding ±π between consecutive samples. Nevertheless, the observed distortion of the signals, likely due to cycle-skipping, did not affect our analysis: maximum earthquake amplitudes are correctly measured (Fig. 9), and waveform shapes remain undistorted after band-passing earthquakes in our frequency range of interest (Fig. 11).
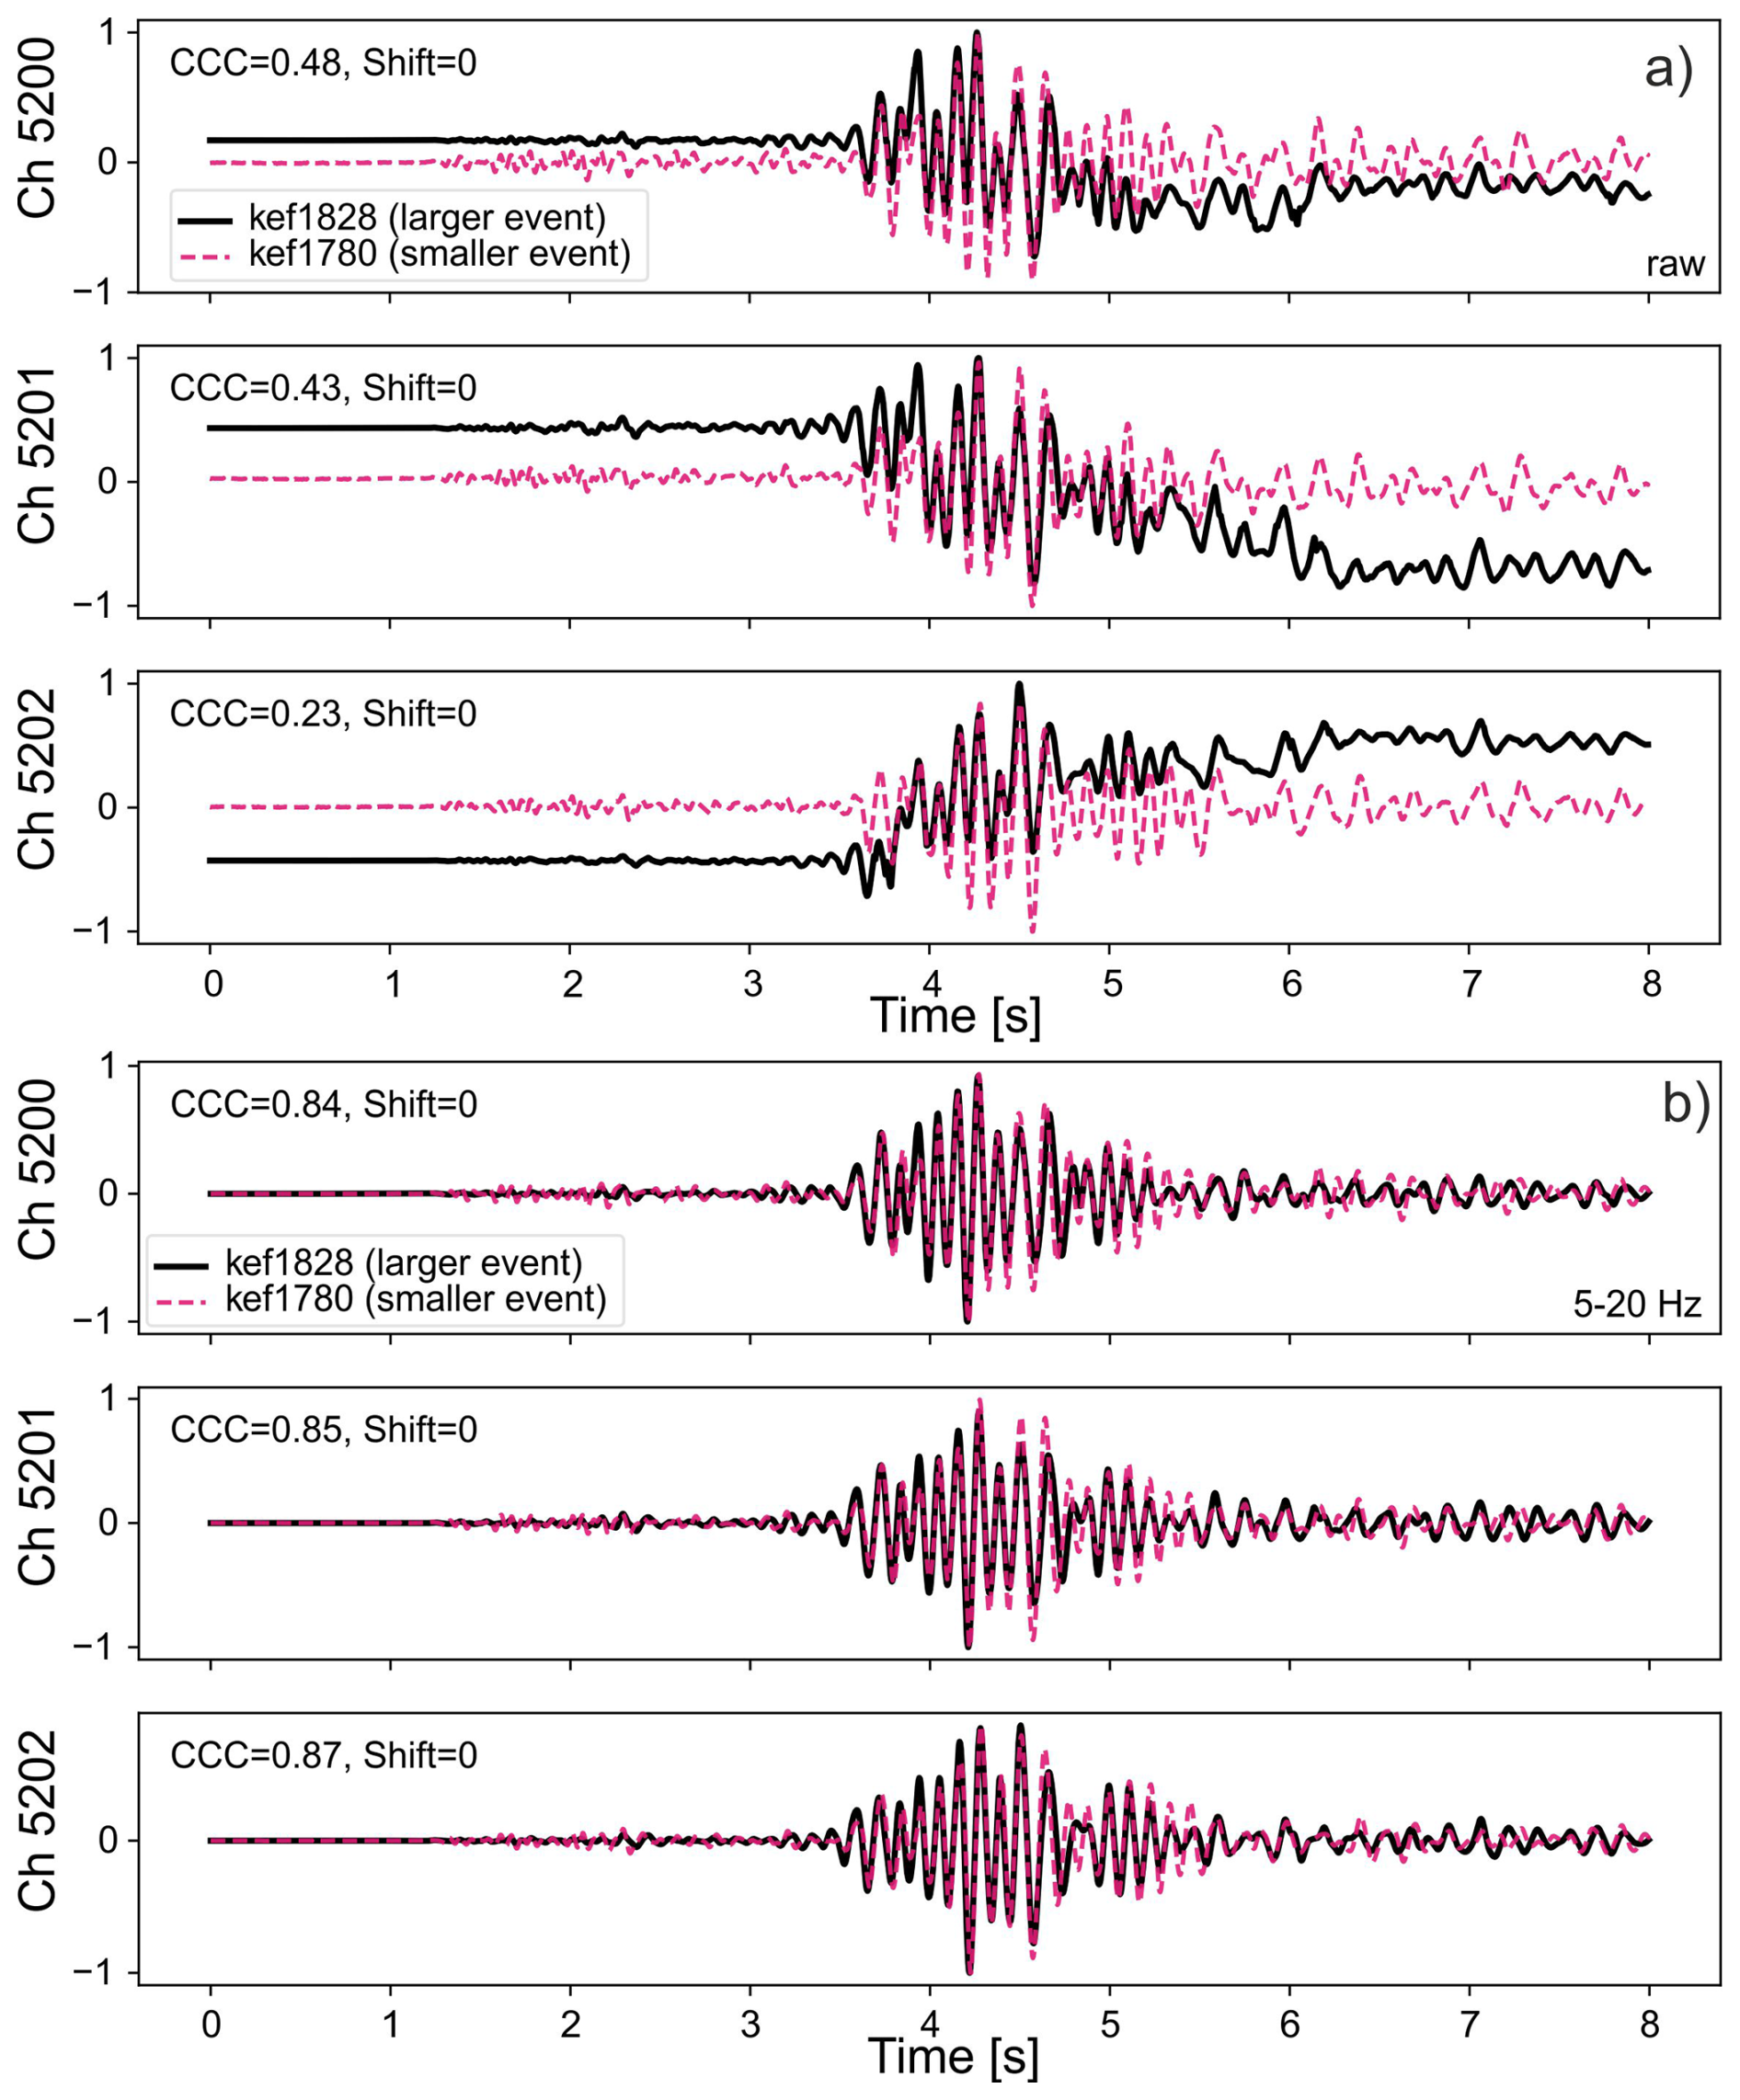
Figure 11Waveforms of similar events (average CCC =0.7 from DAS), one of which is affected by cycle skipping. The ML 2.7 event kef1828 (black) shows waveform distortion at the S-wave arrival, while the ML 1.4 event kef1780 (violet) does not. (a) Raw waveforms. (b) Band-pass filtered waveforms (5–20 Hz). Hypocentral locations: kef1780 – 38.4018° N, 20.4502° E, depth 3.41 km; kef1828 – 38.4018° N, 20.4547° E, depth 3.76 km. Note the high waveform similarity after filtering the traces. The events show an average CCC of 0.7 at seismic stations (Fig. S14).
The datasets released in this work may offer a range of potential applications. The exceptionally high seismicity rate with inter-event times as short as 3 s provides an ideal testbed for developing and evaluating advanced detection and location methods tailored to DAS data. To support such efforts, we provide a manually verified event catalog that can serve as a reference dataset. In addition, the inclusion of very small-amplitude signals, some with magnitude estimates and others without, may be useful for developing and testing denoising approaches (e.g., Fig. S5).
The integration of the DAS array within an open-access seismic network offers an opportunity to evaluate DAS-enhanced event location methods and explore hybrid location strategies. This setting also allows testing of various strategies to mitigate biases that could arise from the large differences in the number of sensors between the DAS cable and the traditional network, such as automatic DAS channel selection. Furthermore, DAS recordings acquired on seafloor cables may exhibit higher amplitudes compared to onshore cables, as observed in this study. Such differences could reflect a combination of site, coupling, and propagation effects that may in turn introduce biases in magnitude estimation. Finally, the dataset may offer valuable opportunities for machine learning applications. With nearly 6000 recorded events, it can be used to train new models or to investigate transfer learning of existing ones.
Continuous DAS data waveforms are available from Bocchini et al. (2025), https://doi.org/10.60517/cv43p1601.
Codes to read and plot the events (or detections) recorded along the fiber-optic cable, earthquake catalogs, event pairs cross-correlation coefficients, cable geometry, and PhaseNet-DAS picks are available from Bocchini (2026), https://doi.org/10.5281/zenodo.20558686.
We use _PhaseNet-DAS (Zhu et al., 2023) for phase picking on DAS data, which is available from https://ai4eps.github.io/EQNet/phasenet_das/ (last access: 26 May 2026).
We use HECTOR (Porras et al., 2024) for event detection on DAS data, which is available from https://github.com/juanucr/HECTOR/tree/main (Porras, 2024).
We use Snuffler, available through Pyrocko, for manual picking of seismic waveforms (https://doi.org/10.5880/GFZ.2.1.2017.001, Heimann et al., 2017).
We use Obspy for processing of seismic station waveforms (Beyreuther et al., 2010).
We create figures using Matplotlib (Hunter, 2007) and GMT (Wessel et al., 2019).
9.1 DAS Metadata
-
Interrogator: OptaSense QuantX
-
File Format: HDF5
-
Number of Channels: 7750
-
File Length: 30 s
-
Ping Rate: 5000 Hz
-
Sampling Rate: 250 Hz
-
Gauge Length: 10.2 m
-
Channel Spacing: 2.04 m
-
Data Unit: Optical phase shift1
9.2 Cable Geometry
The cable geometry is provided as a CSV file that defines the spatial coordinates of the DAS array after the removal of looped or otherwise non-usable cable sections. Consequently, the number of unique channels in this geometry file is lower than in the raw HDF5 waveform files; only channels explicitly listed in this file are considered valid for analysis. The CSV file contains the following columns:
-
channel_number_recorded: The channel number directly matching the channel numbers in the HDF5 files.
-
latitude/longitude: Geographic coordinates in decimal degrees.
-
elevation_m: Elevation in meters (negative values indicate channels below sea level).
-
comment: Label indicating whether the channel is located on Kefalonia, offshore, or on Ithaki.
-
final_section_id: Identifier for the specific cable sections used for earthquake locations.
9.3 Seismic Station Waveforms
-
Seismic Stations: HP.FSK, HA.ATHR, HL.VLS, HT.EVGI, HT.DLMN, HT.ITHC, HT.DRAG
-
Sampling Rate: 100 Hz
-
Data Source: Continuous seismic waveforms are publicly accessible via the NOA EIDA node (https://eida.gein.noa.gr/, last access: 26 May 2026).
9.4 Earthquake Catalogs
9.4.1 Catalog with Absolute Earthquake Locations
The catalog contains 356 earthquakes and is provided as a CSV file with the following columns: event_id (unique event identifier), origin_time (UTC origin time), longitude (decimal degrees), latitude (decimal degrees), depth (km), Nobs (number of observations), and gap (azimuthal gap). Uncertainties are reported in kilometers as H_err and h_err (the semi-major and semi-minor axes of the horizontal error ellipse, respectively) and z_err (depth uncertainty). The catalog also includes the local magnitude (ML) and its standard deviation (ML_std).
9.4.2 Enhanced Earthquake Catalog
This catalog expands upon the absolute locations dataset by incorporating additional events identified via waveform cross-correlation, bringing the total to 2871 events. The data is provided as a CSV file containing the following columns: event_id (unique event identifier), amplitude (event amplitude in micrometers), ML (local magnitude), reference (the template event ID associated with the target event), CCC (cross-correlation coefficient), detection_time (UTC detection time returned by the detector), longitude (decimal degrees), latitude (decimal degrees), and depth (km).
Note: The CCC and reference columns are left blank for the original 356 template earthquakes containing absolute locations.
In this study, we combine DAS recordings with permanent seismic stations from the HUSN to investigate seismicity on Kefalonia Island between 2–15 August 2024. Applying a semblance-based detector enables identification of more than 5700 earthquakes within a ∼50 km radius of the starting point of the fiber-optic cable. Combining DAS and seismic data analysis and waveform cross-correlation enables location and magnitude estimates of 2871 events, of which 2790 concentrate in an active cluster offshore northwest of Kefalonia. The catalog shows very high seismicity rates with peaks in earthquake rates that exceed 100 events per hour. Individual inter-event times are as short as 3 s, while average inter-event times calculated over moving 100-event windows decrease to ∼30 s. The short inter-event times and a Mc of −0.4 enable a detailed spatiotemporal analysis of seismicity.
A comparison of the catalog produced here and the revised earthquake catalog of NOA for the active cluster northwest of Kefalonia shows the same number of events down to ML 2.4, and a factor of ∼38 increase in smaller events for the DAS-seismic-data catalog. The detailed catalog underscores the benefit of using DAS to strengthen seismic monitoring in regions where station coverage is limited and seismicity is intense.
This work makes the following data products publicly available: the DAS-seismic station earthquake catalog, continuous DAS recordings, detection lists, and supporting metadata. The dataset provides a resource for future studies of DAS data processing, integration with seismic stations for earthquake monitoring, and analyses of seismicity, in large part because it targets a highly productive natural seismic sequence.
The supplement related to this article is available online at https://doi.org/10.5194/essd-18-4677-2026-supplement.
G.M.B. Conceptualization, Writing – original draft, Writing – review and editing, Methodology, Visualization, Formal analysis, Data curation, Investigation. E.B. Conceptualization, Writing – review and editing, Methodology, Formal Analysis. M.P.R. Formal analysis, Data curation, Investigation. S.G. Conceptualization, Formal Analysis. G.P. Conceptualization, Formal Analysis. F.G. Conceptualization, Methodology, Writing – review and editing. E.B. Writing – review and editing. E.S. Writing – review and editing. R.M.H. Funding acquisition, Conceptualization, Writing – review and editing, Investigation.
The contact author has declared that none of the authors has any competing interests.
The authors decline responsibility for any possible errors in the dataset that could lead to erroneous evaluations.
Publisher's note: Copernicus Publications remains neutral with regard to jurisdictional claims made in the text, published maps, institutional affiliations, or any other geographical representation in this paper. The authors bear the ultimate responsibility for providing appropriate place names. Views expressed in the text are those of the authors and do not necessarily reflect the views of the publisher.
The authors would like to acknowledge the National Observatory of Athens for maintaining and publicly sharing a manually reviewed earthquake catalog. The authors would like to thank the student assistants D. Drier and M. Roßbach for helping with the location of the DAS channels and with manual picking of events at seismic stations. The authors also thank M. Bagagli for helping with manual inspection of the initial list of detections. The authors would like to thank Dionisis Alisandratos for his patience and help during the set-up of the DAS experiment, and OTE Greece for providing access to the fiber-optic cable. G.M.B., M.P.R., and R.M.H., would like to thank Roger Crickmore (Luna Innovations) for the helpful discussion on cycle skipping in DAS.
G.M.B. and the DAS data acquisition were supported by the Volkswagen Foundation through a Momentum grant awarded to R.M.H.
This paper was edited by Andrea Rovida and reviewed by two anonymous referees.
Aki, K.: Maximum likelihood estimate of b in the formula log and its confidence limits, Bull. Earthq. Res. Inst., Tokyo Univ., 43, 237–239, 1965.
Anagnostou, V., Papadimitriou, E., Karakostas, V., and Bäck, T.: Investigating the 2024 Swarm-Like Activity Offshore Kefalonia Island, Aided by Machine Learning Algorithms, Pure Appl. Geophys., 1–31, https://doi.org/10.1007/S00024-025-03766-3, 2025.
Aristotle University of Thessaloniki: HT: Hellenic Unified Seismological Network [data set], International Federation of Digital Seismograph Networks, https://doi.org/10.7914/SN/HT, 1981.
Baltay, A. and Abercrombie, R. E.: Seismic Moment and Local Magnitude Scales in Ridgecrest, California, from the SCEC/USGS Community Stress Drop Validation Study, B. Seismol. Soc. Am., 115, 1279–1293, https://doi.org/10.1785/0120240162, 2025.
Basili, R., Danciu, L., Beauval, C., Sesetyan, K., Vilanova, S. P., Adamia, S., Arroucau, P., Atanackov, J., Baize, S., Canora, C., Caputo, R., Carafa, M. M. C., Cushing, E. M., Custódio, S., Demircioglu Tumsa, M. B., Duarte, J. C., Ganas, A., García-Mayordomo, J., Gómez de la Peña, L., Gràcia, E., Jamšek Rupnik, P., Jomard, H., Kastelic, V., Maesano, F. E., Martín-Banda, R., Martínez-Loriente, S., Neres, M., Perea, H., Šket Motnikar, B., Tiberti, M. M., Tsereteli, N., Tsironi, V., Vallone, R., Vanneste, K., Zupančič, P., and Giardini, D.: The European Fault-Source Model 2020 (EFSM20): geologic input data for the European Seismic Hazard Model 2020, Nat. Hazards Earth Syst. Sci., 24, 3945–3976, https://doi.org/10.5194/nhess-24-3945-2024, 2024.
Beyreuther, M., Barsch, R., Krischer, L., Megies, T., Behr, Y., and Wassermann, J.: ObsPy: A Python Toolbox for Seismology, Seismol. Res. Lett., 81, 530–533, https://doi.org/10.1785/GSSRL.81.3.530, 2010.
Biondi, E., Zhu, W., Li, J., Williams, E. F., and Zhan, Z.: An upper-crust lid over the Long Valley magma chamber, Sci. Adv., 9, https://doi.org/10.1126/SCIADV.ADI9878, 2023a.
Biondi, E., Wang, X., Williams, E. F., and Zhan, Z.: Geolocalization of Large-Scale DAS Channels Using a GPS-Tracked Moving Vehicle, Seismol. Res. Lett., 94, 318–330, https://doi.org/10.1785/0220220169, 2023b.
Bocchini, G. M.: Codes and Data for the Kefalonia Island DAS Experiment, Zenodo [data set and code], https://doi.org/10.5281/zenodo.20558686, 2026.
Bocchini, G. M., Brüstle, A., Becker, D., Meier, T., van Keken, P. E., Ruscic, M., Papadopoulos, G. A., Rische, M., and Friederich, W.: Tearing, segmentation, and backstepping of subduction in the Aegean: New insights from seismicity, Tectonophysics, 734–735, 96–118, https://doi.org/10.1016/j.tecto.2018.04.002, 2018.
Bocchini, G. M., Roth, M. P., and Harrington, R. M.: Earthquake Catalog and Continuous Waveforms From a Two-week Distributed Acoustic Sensing Experiment on Kefalonia Island, Greece, ReSeeD [data set], https://doi.org/10.60517/cv43p1601, 2025.
Currenti, G., Allegra, M., Cannavò, F., Jousset, P., Prestifilippo, M., Napoli, R., Sciotto, M., Di Grazia, G., Privitera, E., Palazzo, S., and Krawczyk, C.: Distributed dynamic strain sensing of very long period and long period events on telecom fiber-optic cables at Vulcano, Italy, Sci. Rep., 13, 1–17, https://doi.org/10.1038/S41598-023-31779-2, 2023.
Ester, M., Kriegel, H.-P., Sander, J., and Xu, X.: A Density-Based Algorithm for Discovering Clusters in Large Spatial Databases with Noise, In KDD, 96, 226–231, https://doi.org/10.5555/3001460.3001507, 1996.
Feigl, K., Reinisch, E., Patterson, J., Jreij, S., Parker, L., Nayak, A., Zeng, X., Cardiff, M., Lord, N., Fratta, D., Thurber, C., Wang, H., Robertson, M., Coleman, T., Miller, D., Spielman, P., Akerley, J., Kreemer, C., Morency, C., Matzel, E., Trainor-Guitton, W., and Davatzes, N.: PoroTomo Natural Laboratory Horizontal and Vertical Distributed Acoustic Sensing Data, Geothermal Data Repository [data set], https://doi.org/10.15121/1778858, 2016.
Fisher, R. A.: On the “Probable Error” of a Coefficient of Correlation Deduced from a Small Sample., Metron., 1, 3–32, 1921.
Glubokovskikh, S., Shashkin, P., Shapiro, S., Gurevich, B., and Pevzner, R.: Multiwell Fiber Optic Sensing Reveals Effects of CO2 Flow on Triggered Seismicity, Seismol. Res. Lett., 94, 2215–2230, https://doi.org/10.1785/0220230025, 2023.
Gräff, D., Lipovsky, B. P., Vieli, A., Dachauer, A., Jackson, R., Farinotti, D., Schmale, J., Ampuero, J. P., Berg, E., Dannowski, A., Kneib-Walter, A., Köpfli, M., Kopp, H., van der Loo, E., Mata Flores, D., Mercerat, D., Moser, R., Sladen, A., Walter, F., Wasser, D., Welty, E., Wetter, S., and Williams, E. F.: Calving-driven fjord dynamics resolved by seafloor fibre sensing, Nature, 644, 404–412, https://doi.org/10.1038/S41586-025-09347-7, 2025.
Grigoli, F., Ellsworth, W. L., Zhang, M., Mousavi, M., Cesca, S., Satriano, C., Beroza, G. C., and Wiemer, S.: Relative earthquake location procedure for clustered seismicity with a single station, Geophys. J. Int., 225, 608–626, https://doi.org/10.1093/GJI/GGAA607, 2021.
Haslinger, F., Kissling, E., Ansorge, J., Hatzfeld, D., Papadimitriou, E., Karakostas, V., Makropoulos, K., Kahle, H. G., and Peter, Y.: 3D crustal structure from local earthquake tomography around the Gulf of Arta (Ionian region, NW Greece), Tectonophysics, 304, 201–218, https://doi.org/10.1016/S0040-1951(98)00298-4, 1999.
Heimann, S., Kriegerowski, M., Isken, M., Cesca, S., Daout, S., Grigoli, F., Juretzek, C., Megies, T., Nooshiri, N., Steinberg, A., Sudhaus, H., Vasyura-Bathke, H., Willey, T., and Dahm, T.: Pyrocko – An open-source seismology toolbox and library, GFZ Data Services [code], https://doi.org/10.5880/GFZ.2.1.2017.001, 2017.
Hunter, J. D.: Matplotlib: A 2D graphics environment, Comput. Sci. Eng., 9, 90–95, https://doi.org/10.1109/MCSE.2007.55, 2007.
Hutton, L. K. and Boore, D. M.: The ML scale in Southern California, B. Seismol. Soc. Am., 77, 2074–2094, https://doi.org/10.1785/BSSA0770062074, 1987.
Jousset, P., Currenti, G., Schwarz, B., Chalari, A., Tilmann, F., Reinsch, T., Zuccarello, L., Privitera, E., and Krawczyk, C. M.: Fibre optic distributed acoustic sensing of volcanic events, Nat. Commun., 13, 1–16, https://doi.org/10.1038/S41467-022-29184-w, 2022.
Karastathis, V. K., Mouzakiotis, E., Ganas, A., and Papadopoulos, G. A.: High-precision relocation of seismic sequences above a dipping Moho: the case of the January–February 2014 seismic sequence on Cephalonia island (Greece), Solid Earth, 6, 173–184, https://doi.org/10.5194/se-6-173-2015, 2015.
Katakami, S., Noda, S., Korenaga, M., Araki, E., Takahashi, N., and Iwata, N.: Potential of Earthquake Strong Motion Observation Utilizing a Linear Estimation Method for Phase Cycle Skipping in Distributed Acoustic Sensing, J. Geophys. Res. Solid Earth, 129, e2023JB027327, https://doi.org/10.1029/2023JB027327, 2024.
Lellouch, A., Schultz, R., Lindsey, N. J., Biondi, B. L., and Ellsworth, W. L.: Low-Magnitude Seismicity With a Downhole Distributed Acoustic Sensing Array – Examples From the FORGE Geothermal Experiment, J. Geophys. Res. Solid Earth, 126, e2020JB020462, https://doi.org/10.1029/2020JB020462, 2021.
Li, J., Zhu, W., Biondi, E., and Zhan, Z.: Earthquake focal mechanisms with distributed acoustic sensing, Nat. Commun., 14, 1–9, https://doi.org/10.1038/S41467-023-39639-3, 2023.
Li, J., Biondi, E., Heimisson, E. R., Puel, S., Zhai, Q., Zhang, S., Hjörleifsdóttir, V., Wei, X., Bird, E., Klesh, A., Kamalov, V., Gunnarsson, T., Geirsson, H., and Zhan, Z.: Minute-scale dynamics of recurrent dike intrusions in Iceland with fiber-optic geodesy, Science, 388, 1189–1193, https://doi.org/https://doi.org/10.1126/science.adu0225, 2025.
Lindsey, N. J., Martin, E. R., Dreger, D. S., Freifeld, B., Cole, S., James, S. R., Biondi, B. L., and Ajo-Franklin, J. B.: Fiber-Optic Network Observations of Earthquake Wavefields, Geophys. Res. Lett., 44, 11792-11799, https://doi.org/10.1002/2017GL075722, 2017.
Lior, I., Sladen, A., Rivet, D., Ampuero, J. P., Hello, Y., Becerril, C., Martins, H. F., Lamare, P., Jestin, C., Tsagkli, S., and Markou, C.: On the Detection Capabilities of Underwater Distributed Acoustic Sensing, J. Geophys. Res. Solid Earth, 126, e2020JB020925, https://doi.org/10.1029/2020JB020925, 2021a.
Lior, I., Sladen, A., Mercerat, D., Ampuero, J. P., Rivet, D., and Sambolian, S.: Strain to ground motion conversion of distributed acoustic sensing data for earthquake magnitude and stress drop determination, Solid Earth, 12, 1421–1442, https://doi.org/10.5194/SE-12-1421-2021, 2021b.
Lomax, A., Virieux, J., Volant, P., and Berge-Thierry, C.: Probabilistic earthquake location in 3D and layered models, in: Advances in seismic event location, edited by: Thurber, C. H. and Rabinowitz, N., Springer, Dordrecht, Kluwer, Amsterdam, 101–134, https://doi.org/10.1007/978-94-015-9536-0_5, 2000.
Louvari, E., Kiratzi, A. A., and Papazachos, B. C.: The Cephalonia Transform Fault and its extension to western Lefkada Island (Greece), Tectonophysics, 308, 223–236, https://doi.org/10.1016/S0040-1951(99)00078-5, 1999.
Melis, N. S. and Konstantinou, K. I.: Real-time Seismic Monitoring in the Greek Region: An Example from the 17 October 2005 East Aegean Sea Earthquake Sequence, Seismol. Res. Lett., 77, 364–370, https://doi.org/10.1785/GSSRL.77.3.364, 2006.
Menke, W., Lerner-Lam, A. L., Dubendorff, B., and Pacheco, J.: Polarization and coherence of 5 to 30 Hz seismic wave fields at a hard-rock site and their relevance to velocity heterogeneities in the crust, B. Seismol. Soc. Am., 80, 430–449, https://doi.org/10.1785/BSSA0800020430, 1990.
National Observatory of Athens, Institute of Geodynamics: HL: Hellenic Unified Seismological Network, Hellenic Unified Seismological Network [data set], International Federation of Digital Seismograph Networks, https://doi.org/10.7914/SN/HL, 1975.
Pankow, K.: Utah FORGE: Distributed Acoustic Sensing Data 2022, University of Utah Seismograph Stations, Geothermal Data Repository [data set], https://gdr.openei.org/submissions/1393 (last access: 1 July 2026), 2022.
Papadimitriou, E. E.: Mode of Strong Earthquake Recurrence in the Central Ionian Islands (Greece): Possible Triggering due to Coulomb Stress Changes Generated by the Occurrence of Previous Strong Shocks, B. Seismol. Soc. Am., 92, 3293–3308, https://doi.org/10.1785/0120000290, 2002.
Pascucci, G., Gaviano, S., Pozzoli, A., and Grigoli, F.: Signal Enhancement of Distributed Acoustic Sensing Data Using a Spectral Subtraction-Based Approach, Seismol. Res. Lett., 97, 1905–1918, https://doi.org/10.1785/0220250105, 2026.
Pérouse, E., Chamot-Rooke, N., Rabaute, A., Briole, P., Jouanne, F., Georgiev, I., and Dimitrov, D.: Bridging onshore and offshore present-day kinematics of central and eastern Mediterranean: Implications for crustal dynamics and mantle flow, Geochem., Geophy., Geosy., https://doi.org/10.1029/2012GC004289, 2012.
Porras, J.: juanucr/HECTOR, GitHub [code], https://github.com/juanucr/HECTOR/tree/main (last access: 26 May 2026), 2024.
Porras, J., Pecci, D., Bocchini, G. M., Gaviano, S., De Solda, M., Tuinstra, K., Lanza, F., Tognarelli, A., Stucchi, E., and Grigoli, F.: A semblance-based microseismic event detector for DAS data, Geophys. J. Int., 236, 1716–1727, https://doi.org/10.1093/GJI/GGAE016, 2024.
Royden, L. H. and Papanikolaou, D. J.: Slab segmentation and late Cenozoic disruption of the Hellenic arc, Geochem., Geophy., Geosy., 12, 1–24, https://doi.org/10.1029/2010GC003280, 2011.
Scordilis, E. M., Karakaisis, G. F., Karacostas, B. G., Panagiotopoulos, D. G., Comninakis, P. E., and Papazachos, B. C.: Evidence for transform faulting in the Ionian sea: The Cephalonia island earthquake sequence of 1983, Pure Appl. Geophys., https://doi.org/10.1007/BF00880738, 1985.
Seguí, A., Ugalde, A., Fichtner, A., Ventosa, S., and Morros, J. R.: DASPack: Controlled Data Compression for Distributed Acoustic Sensing, Geophys. J. Int., https://doi.org/10.1093/GJI/GGAF397, 2025.
Silver, N. C. and Dunlap, W. P.: Averaging Correlation Coefficients: Should Fisher's z Transformation Be Used?, J. Appl. Psychol., 72, 146–148, https://doi.org/10.1037/0021-9010.72.1.146, 1987.
Spica, Z. J., Ajo-Franklin, J., Beroza, G. C., Biondi, B., Cheng, F., Gaite, B., Luo, B., Martin, E., Shen, J., Thurber, C., Viens, L., Wang, H., Wuestefeld, A., Xiao, H., and Zhu, T.: PubDAS: A PUBlic Distributed Acoustic Sensing Datasets Repository for Geosciences, Seismol. Res. Lett., 94, 983–998, https://doi.org/10.1785/0220220279, 2023.
Trugman, D. T., Chu, S. X., and Tsai, V. C.: Earthquake Source Complexity Controls the Frequency Dependence of Near-Source Radiation Patterns, Geophys. Res. Lett., 48, e2021GL095022, https://doi.org/10.1029/2021GL095022, 2021.
University of Athens: HA: Hellenic Unified Seismological Network, Seismological Laboratory [data set], https://doi.org/10.7914/SN/HA, 2008.
University of Patras: HP: Hellenic Unified Seismological Network [data set], International Federation of Digital Seismograph Networks, https://doi.org/10.7914/SN/HP, 2000.
Wessel, P., Luis, J. F., Uieda, L., Scharroo, R., Wobbe, F., Smith, W. H. F., and Tian, D.: The Generic Mapping Tools Version 6, Geochem., Geophy., Geosy., 20, 5556–5564, https://doi.org/10.1029/2019GC008515, 2019.
Wiemer, S. and Wyss, M.: Minimum magnitude of completeness in earthquake catalogs: Examples from Alaska, the Western United States, and Japan, B. Seismol. Soc. Am., 90, 859–869, https://doi.org/10.1785/0119990114, 2000.
Wuestefeld, A., Spica, Z. J., Aderhold, K., Huang, H. H., Ma, K. F., Lai, V. H., Miller, M., Urmantseva, L., Zapf, D., Bowden, D. C., Edme, P., Kiers, T., Rinaldi, A. P., Tuinstra, K., Jestin, C., Diaz-Meza, S., Jousset, P., Wollin, C., Ugalde, A., Barajas, S. R., Gaite, B., Currenti, G., Prestifilippo, M., Araki, E., Tonegawa, T., de Ridder, S., Nowacki, A., Lindner, F., Schoenball, M., Wetter, C., Zhu, H. H., Baird, A. F., Rørstadbotnen, R. A., Ajo-Franklin, J., Ma, Y., Abbott, R. E., Hodgkinson, K. M., Porritt, R. W., Stanciu, C., Podrasky, A., Hill, D., Biondi, B., Yuan, S., Luo, B., Nikitin, S., Morten, J. P., Dumitru, V. A., Lienhart, W., Cunningham, E., and Wang, H.: The Global DAS Month of February 2023, Seismol. Res. Lett., 95, 1569–1577, https://doi.org/10.1785/0220230180, 2024.
Zeng, X., Lancelle, C., Thurber, C., Fratta, D., Wang, H., Lord, N., Chalari, A., and Clarke, A.: Properties of Noise Cross-Correlation Functions Obtained from a Distributed Acoustic Sensing Array at Garner Valley, California, B. Seismol. Soc. Am., 107, 603–610, https://doi.org/10.1785/0120160168, 2017.
Zhan, Z.: Distributed Acoustic Sensing Turns Fiber-Optic Cables into Sensitive Seismic Antennas, Seismol. Res. Lett., 91, 1–15, https://doi.org/10.1785/0220190112, 2020.
Zhu, W., Biondi, E., Li, J., Yin, J., Ross, Z. E., and Zhan, Z.: Seismic arrival-time picking on distributed acoustic sensing data using semi-supervised learning, Nat. Commun., 14, 1–11, https://doi.org/10.1038/S41467-023-43355-3, 2023.
Note: The raw data can be converted to strain using the script provided in the accompanying repository (see Data and Code Availability section), which also demonstrates the HDF5 file structure and includes functions for data reading and visualization.
- Abstract
- Introduction
- Data
- Earthquake detection using DAS data
- Earthquake location and local magnitude estimates
- Catalog enhancement using waveform cross-correlation of DAS data
- Discussion
- Potential applications of the datasets
- Data and code availability
- Metadata
- Conclusions
- Author contributions
- Competing interests
- Disclaimer
- Acknowledgements
- Financial support
- Review statement
- References
- Supplement
- Abstract
- Introduction
- Data
- Earthquake detection using DAS data
- Earthquake location and local magnitude estimates
- Catalog enhancement using waveform cross-correlation of DAS data
- Discussion
- Potential applications of the datasets
- Data and code availability
- Metadata
- Conclusions
- Author contributions
- Competing interests
- Disclaimer
- Acknowledgements
- Financial support
- Review statement
- References
- Supplement