the Creative Commons Attribution 4.0 License.
the Creative Commons Attribution 4.0 License.
 | 06 Jul 2026
A four-decade global Lagrangian air-parcel trajectory dataset for atmospheric moisture and heat analysis
Victoria M. H. Deman
Damián Insua-Costa
Jessica Keune
Akash Koppa
Diego G. Miralles
Studying the pathways of atmospheric moisture and heat is crucial for understanding global water and energy cycles, and their response to climate change. Here, we present a new global dataset of atmospheric parcel trajectories generated with the FLEXible PARTicle dispersion model (FLEXPART v11) and forced by ERA5 reanalysis. The dataset spans 1979–2024 and provides a consistent and physically grounded record for studying Lagrangian moisture and heat transport. The dataset includes 20 million global, domain-filling air-parcel trajectories together with their (thermo)dynamic properties, enabling detailed investigation of long-range atmospheric transport processes. By providing the complete trajectory archive openly, the dataset enables quantitative analyses of moisture and heat pathways without the need to perform computationally expensive Lagrangian simulations. While the trajectory dataset itself can be used with any moisture and heat tracking attribution methodology, here it is explored using the new version of the Heat And MoiSture Tracking framEwoRk (HAMSTER v2). The dataset's usability is demonstrated by (i) global analyses of moisture source–sink patterns and recycling over multiple decades, (ii) global attribution of diabatic temperature increments to upwind surface sensible heat fluxes for a representative year (2021), and (iii) two local-scale case studies which showcase how the dataset and associated tools can be applied to hydrological and temperature extremes across a range of spatial and temporal scales. Overall, this resource lowers computational barriers and supports reproducible research across the atmospheric science community. The dataset is available at https://doi.org/10.5281/zenodo.17952362 (Deman et al., 2025).
- Article
(15760 KB) - Full-text XML
- BibTeX
- EndNote


Exchanges of water and energy fluxes between the Earth's surface (land and ocean) and the atmosphere play a central role in shaping climate. Surface latent and sensible heat fluxes influence large-scale circulation patterns, temperature extremes, and the initiation and intensity of precipitation (IPCC, 2021; Keune and Miralles, 2019; Horton et al., 2016; Trenberth and Shea, 2005). Heat and moisture can create physical connections between distant regions through long-range atmospheric transport. Through these pathways, local surface conditions can have climate impacts far from their source. These non-local interactions motivate integrated perspectives on land-use planning, water security, and climate adaptation (Keys et al., 2012; Keune and Miralles, 2019; te Wierik et al., 2021). They also govern how disturbances evolve within the climate system, shaping the onset and severity of both subseasonal to seasonal hazards such as droughts, floods, and heatwaves (e.g., Eltahir and Bras, 1996; Dirmeyer et al., 2009; Miralles et al., 2019; Schumacher et al., 2019, 2022; Zhang et al., 2024; Li et al., 2024a), and climate-scale phenomena such as dryland expansion (Koppa et al., 2024). As a result, understanding and modelling how moisture and heat sourced at land and ocean surfaces are transported through the atmosphere and ultimately affect precipitation patterns and atmospheric temperature downstream remains a key topic in hydrology and climate science (Eltahir and Bras, 1996; Keune et al., 2022; van der Ent and Tuinenburg, 2017; Staal et al., 2025).
The origin of precipitation has long been a subject of study. Early studies revealed the contribution of evaporation from land to terrestrial precipitation (Brubaker et al., 1993; Eltahir and Bras, 1996; van der Ent et al., 2010), often referred to as continental precipitation recycling. Still today, the relative importance of continental and oceanic sources under climate change is being debated. Recent studies point to an increasing role of oceanic moisture for terrestrial precipitation (Stohl and James, 2005; Findell et al., 2019; Gimeno et al., 2020a; Zhang et al., 2025). The concepts of local precipitation recycling and evaporation recycling formalised this coupling between the land surface and the atmosphere, quantifying the fraction of precipitation that originates from local evaporation (i.e., from the same region) and how much local evaporation returns as precipitation locally, respectively (Eltahir and Bras, 1996; van der Ent et al., 2010). Many studies on moisture recycling have been published since and have evaluated the source regions of precipitation for predefined sink regions (e.g., Wang et al., 2023; Shao et al., 2024; Pérez-Alarcón et al., 2025). In contrast to the extensive work on moisture sources for precipitation, the atmospheric pathways of air warmed through sensible heat have received far less attention. While early studies recognized the importance of land–atmosphere heat exchange (Trenberth and Shea, 2005), systematic analyses of sensible heat origins and pathways were largely absent until recent studies began tracing its role during droughts and heatwaves (Bieli et al., 2015; Quinting and Reeder, 2017; Schumacher et al., 2019, 2022).
A wide range of models have been developed to determine the source regions of precipitation. Early work relied on simple one-dimensional water–energy balance concepts (e.g., Budyko and Drozdov, 1953; Budyko, 1974). Lettau et al. (1979) later introduced one of the first explicit analytical formulations of precipitation recycling by treating the atmosphere above a region as a control volume. This line of work advanced in the early 1990s with two-dimensional box models (e.g., Brubaker et al., 1993; Eltahir and Bras, 1994), providing the first quantitative regional recycling estimates but requiring strong simplifying assumptions (e.g., a well-mixed atmosphere, or neglecting within-boundary processes and changes in atmospheric water storage) and did not explicitly resolve atmospheric pathways (Gimeno et al., 2020b, 2012). Several related analytical and box-model formulations emerged during this period (e.g., Savenije, 1995; Burde et al., 1996; Schär et al., 1999), offering valuable conceptual insights but sharing similar limitations. Building on these foundations, offline numerical Eulerian and Lagrangian tracking frameworks were developed, enabling explicit representation of moisture pathways (e.g., Stohl and James, 2004; Dirmeyer and Brubaker, 2007; Sodemann et al., 2008; Goessling and Reick, 2011; Miltenberger et al., 2013; Stein et al., 2015; Tuinenburg and Staal, 2020; Keune et al., 2022; Kalverla et al., 2025). In parallel, online methods based on model-internal water vapour tracers (e.g., Sodemann et al., 2009; Knoche and Kunstmann, 2013; Arnault et al., 2016; Insua-Costa and Miguez-Macho, 2018) have added further depth by allowing moisture sources and sinks to be identified and evaluated with greater physical detail and at much smaller time steps. Complementary to these modelling efforts, measurements on the composition of stable water isotopes (e.g., Dansgaard, 1954; Jouzel et al., 2013; Aemisegger et al., 2014) provide an observational alternative to estimate source–sink relationships (Gimeno et al., 2020b).
Lagrangian models for atmospheric moisture tracking can be broadly grouped into two methodological classes. The first, following Dirmeyer and Brubaker (1999), diagnoses moisture sources from surface evaporation and precipitation fields, imposing an observational constraint on the moisture budget, but relying on the well-mixed planetary boundary layer assumption, which may not always hold. This approach has been widely applied and evaluated in subsequent studies (e.g., Tuinenburg and Staal, 2020; Mu et al., 2026). The second approach, introduced by Stohl and James (2004), follows air parcels while explicitly tracking their evolving specific humidity and other state variables along trajectories. This avoids the well-mixed assumption, though changes in parcel humidity reflect only the net balance of evaporation and precipitation and thus cannot separate the two when they occur simultaneously. In practice, this approach is often implemented using Lagrangian particle dispersion models such as the FLEXible PARTicle dispersion model (FLEXPART, Stohl and James, 2004; Bakels et al., 2024), which provide the underlying air parcel trajectories and associated variables. Both types of Lagrangian approaches can provide high-resolution, flow-following diagnostics of moisture transport without reliance on a fixed spatial grid. However, they also depend on the accuracy of the driving wind fields, may not resolve subgrid-scale turbulence, convection, or local topographic effects, and can accumulate errors over long trajectories. Despite these limitations, Lagrangian frameworks have become essential tools for quantifying moisture transport with applications ranging from large-scale circulation features such as monsoons and climate variability to synoptic systems like cyclones and atmospheric rivers, as well as mesoscale phenomena including low-level jets. They are also widely used for attributing hydrometeorological extremes – such as floods, droughts – and heatwaves, to their upwind moisture sources (e.g., Vázquez et al., 2018; Winschall et al., 2014; Papritz et al., 2021; Pérez-Alarcón et al., 2023; Schumacher et al., 2019; Li et al., 2024a).
While these Lagrangian techniques have been widely used to study the atmospheric water cycle, their use in analysing heat transport is much more limited. Lagrangian approaches provide a physically consistent framework for tracking both moisture and sensible heat along air parcel trajectories, which remains difficult to achieve with Eulerian diagnostics, particularly for heat attribution. Early Lagrangian heat analyses were built on the LAGRANTO framework introduced by Wernli and Davies (1997), and have been widely applied to temperature extremes and airmass modification (e.g., Bieli et al., 2015; Zschenderlein et al., 2019; Röthlisberger and Papritz, 2023). These studies, while providing valuable insights into heatwave dynamics, were generally regional and event-focused, relying on backtracking parcels from a predefined heatwave regions only. In parallel, global FLEXPART-based approaches (Stohl and James, 2004; Bakels et al., 2024) have enabled global tracking of humidity and temperature changes along parcel trajectories, enabling a posteriori evaluation of these trajectories forward or backward in time. Recent tools such as the Heat And MoiSture Tracking framEwoRk (HAMSTER; Keune et al., 2022) and Lagrangian Atmospheric moisTure and heaT trackINg (LATTIN; Pérez-Alarcón et al., 2024) further advanced joint diagnostics of moisture and sensible heat sources, with HAMSTER additionally incorporating a bias-correction scheme. Bias-correction was shown to substantially affect both the magnitude and spatial structure of inferred source–receptor relationships and reduce associated uncertainties (Keune and Miralles, 2019; Keune et al., 2022).
Despite methodological advances, global Lagrangian analyses of moisture and sensible heat pathways remain largely constrained by the availability of suitable reanalysis data. Earlier studies primarily relied on earlier-generation reanalyses (e.g., ERA-40, ERA-Interim, NCEP), whose temporal resolution restricted the consistency of long-term trajectory calculations (Uppala et al., 2005; Dee et al., 2011). The availability of hourly ERA5 fields extending back to 1940 now enables global, long-term simulations, opening new possibilities for robust and internally consistent analyses of heat and moisture transport (Hersbach et al., 2020). In addition, most moisture and heat source–sink relationship studies have focused on specific regions, events, or limited time periods, primarily due to the high computational demands involved. Consequently, systematic analyses spanning multiple decades within a single global Lagrangian framework remain scarce, despite their importance for studying long-term variability and trends in atmospheric transport.
Here we present a global Lagrangian trajectory dataset covering the period 1979–2024. By providing the full trajectory archive directly, the dataset enables efficient analysis of atmospheric moisture and heat pathways without the need to rerun computationally expensive simulations. The dataset builds on recent efforts to produce global Lagrangian trajectory archives based on FLEXPART and ERA5 (e.g., Bakels et al., 2025; Vázquez et al., 2024). While these datasets share a similar modelling approach, the dataset presented here adopts a complementary configuration. Compared to Vázquez et al. (2024), our simulations use FLEXPART v11, which includes improvements in trajectory accuracy and process representation, and are fully open-access. Compared to LARA (Bakels et al., 2025), which provides continuous multi-year trajectories, our dataset follows a year-by-year simulation strategy with consistent particle initialization, limiting error accumulation and facilitating temporally consistent climatologies and trend analysis. In addition, the higher number of particles improves atmospheric sampling, particularly for regional analyses and studies of hydrometeorological extremes. Overall, this dataset complements existing trajectory archives and is particularly suited for hydroclimatic applications and integration with diagnostic frameworks such as HAMSTER. We demonstrate the dataset's applicability using global climatologies and event-scale case studies, and provide the full trajectory archive together with the HAMSTER v2 post-processing tool as open-access resources.
This paper presents a global dataset of atmospheric parcel trajectories generated with FLEXPART v11 (Bakels et al., 2024), driven by ERA5 reanalysis and covering the period 1979–2024. The trajectory archive constitutes the primary contribution of this study. To illustrate how the dataset can be used to diagnose moisture and heat source–sink relationships, we perform example analyses using a new parallelised version of HAMSTER (v2), which includes an updated bias-correction procedure.
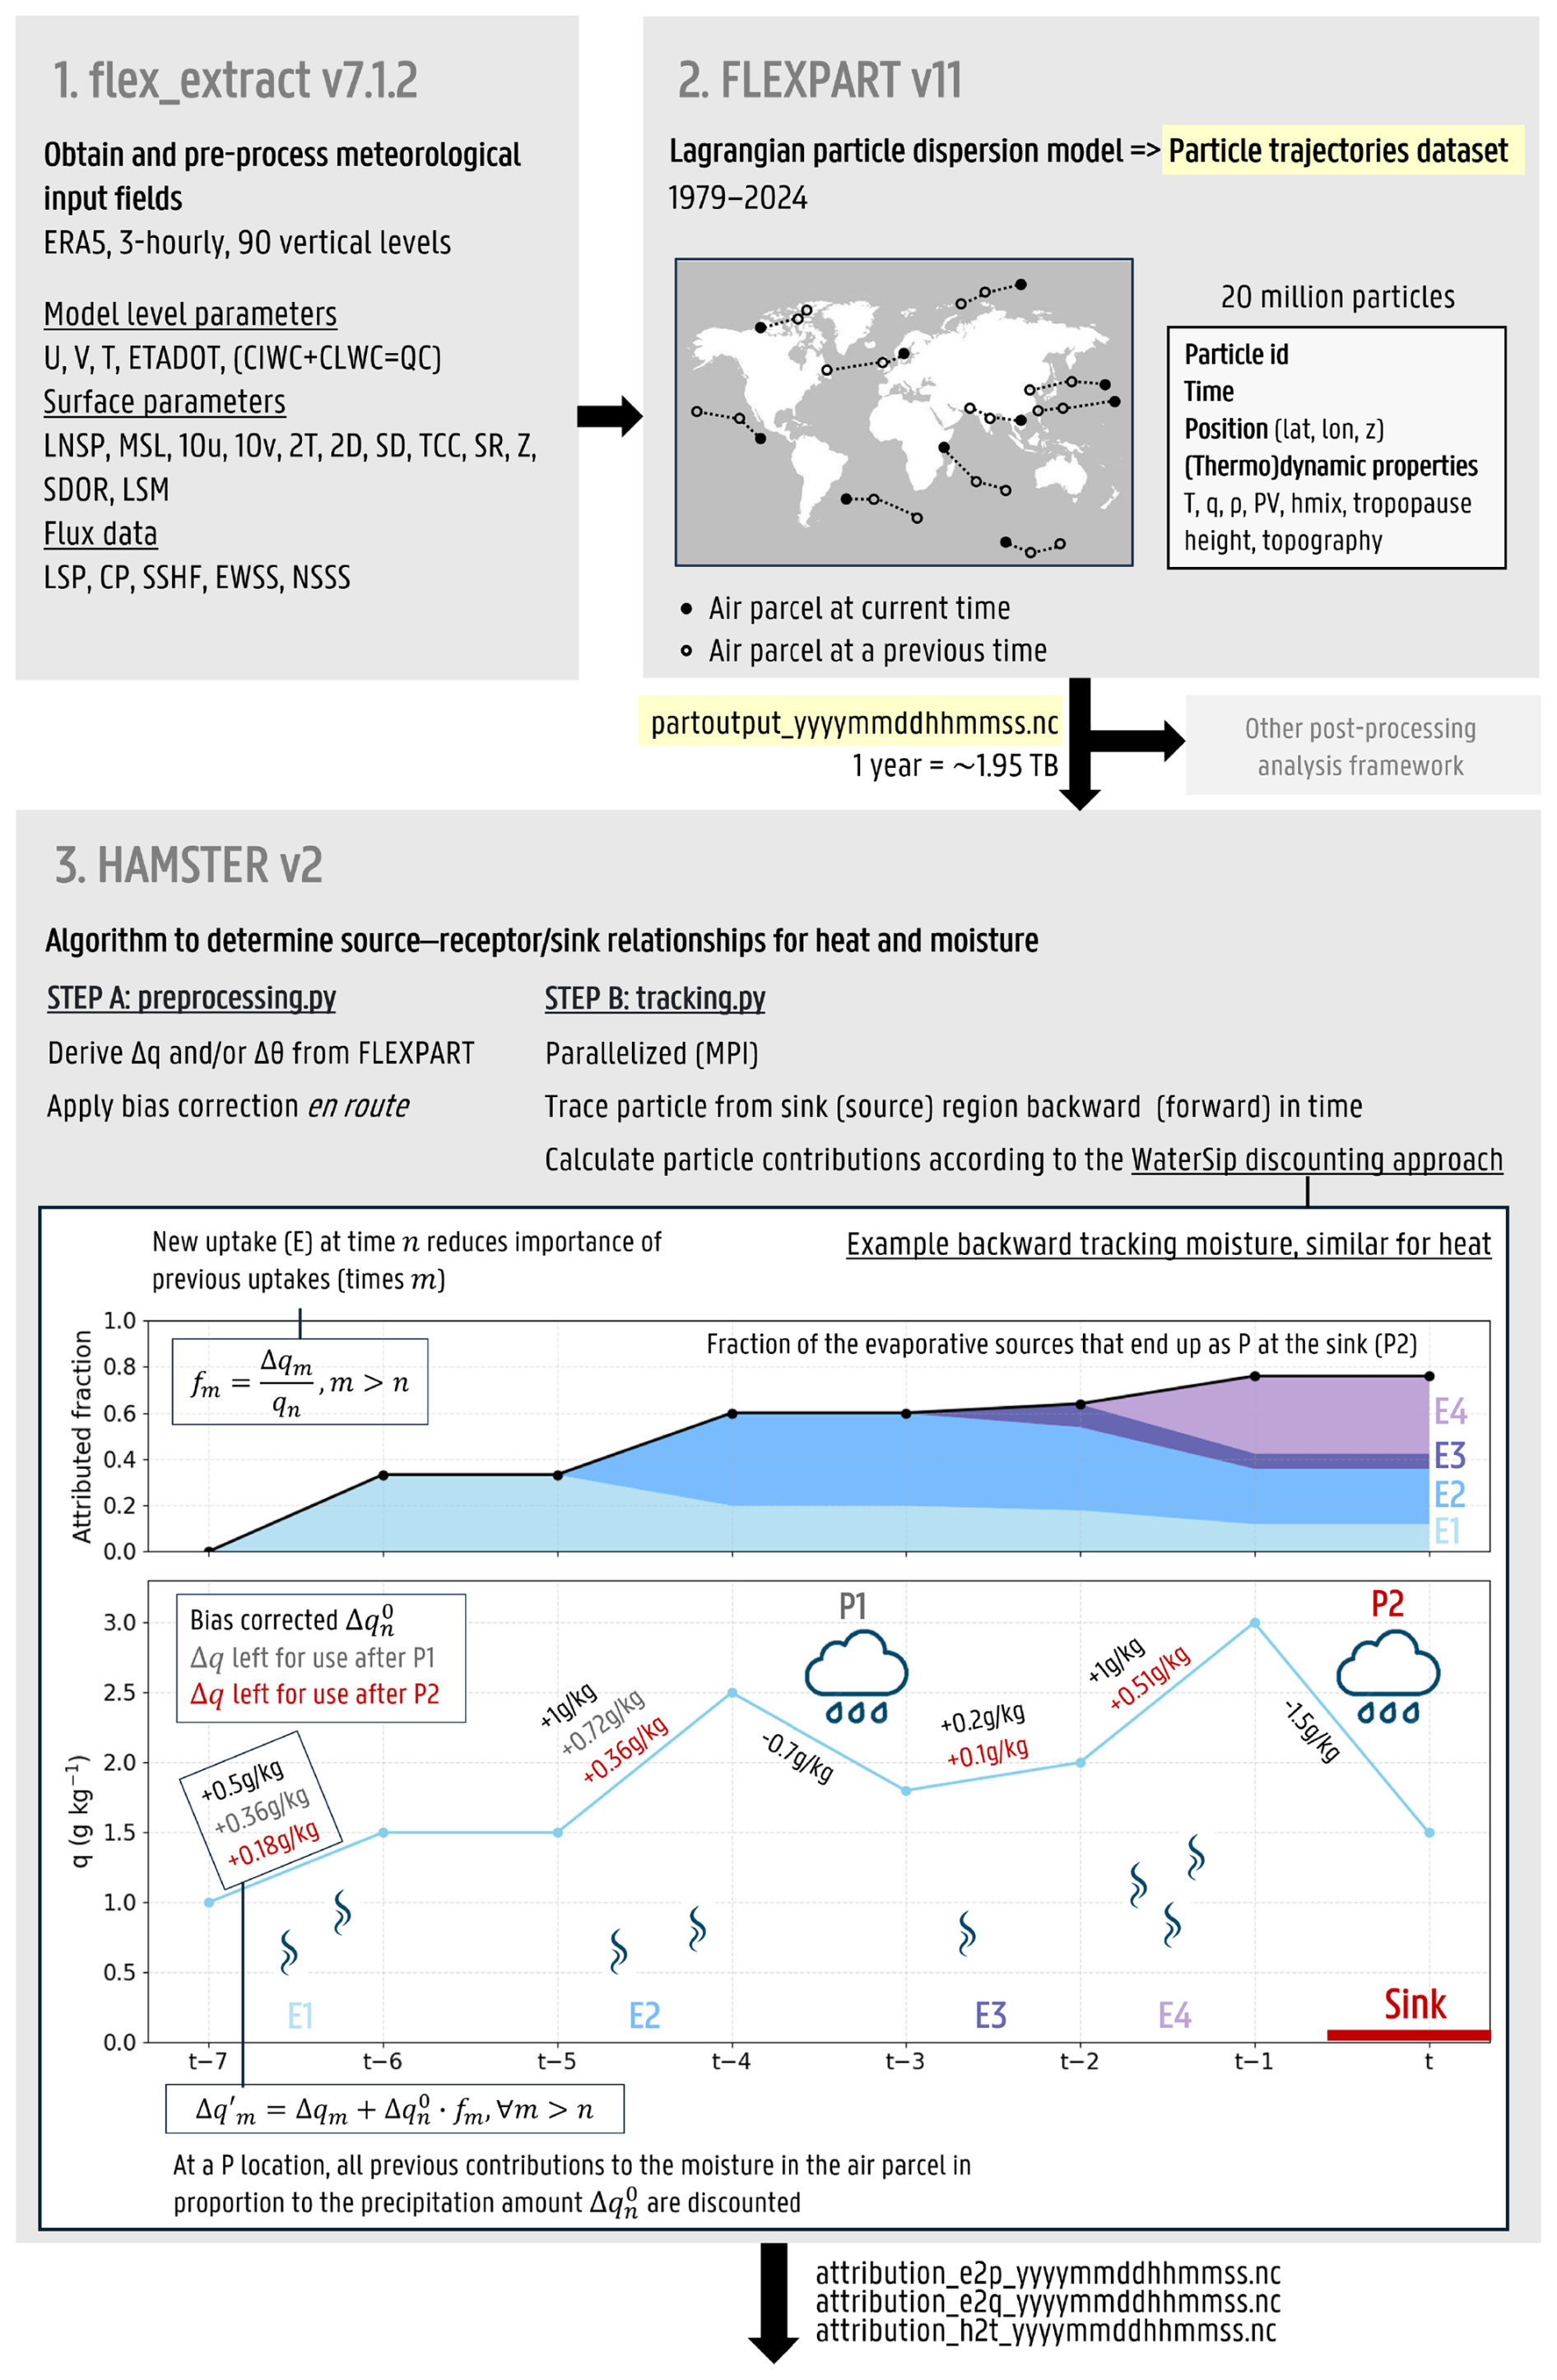
Figure 1Workflow overview.
Details of the FLEXPART trajectory dataset and the HAMSTER analysis tool are provided in the following sections, with Fig. 1 summarising the workflow adopted in this study.
2.1 Dataset construction and overview (FLEXPART v11)
The Lagrangian trajectory dataset is produced using FLEXPART v11 (Bakels et al., 2024). FLEXPART is a widely used offline Lagrangian tracking model that simulates the transport and dispersion of air particles (also referred to as “parcels”) based on large-scale winds derived from reanalysis input, complemented by parametrized small-scale fluctuations representing turbulence and convection. In this setup, air parcels are treated as non-mixing tracers with negligible internal motion, and their evolution in space and time reflects the resolved transport processes.
Meteorological input fields are obtained and preprocessed using flex_extract (v7.1.2), an open-source tool specifically developed to retrieve and convert ECMWF data, including ERA5 (Hersbach et al., 2020), into the native FLEXPART input format. Flex_extract handles the selection of required variables, vertical levels, and temporal frequency, reconstructs the native vertical velocity, and prepares flux fields (Tipka et al., 2020). This ensures that the FLEXPART simulations are driven by consistent, high-quality meteorological data. For the present dataset, ERA5 reanalysis fields are retrieved using flex_extract to download and preprocess the data into FLEXPART-ready input files at 3-hourly temporal resolution and at 0.5° horizontal resolution.
The FLEXPART simulations are carried out in forward mode from 1979 to 2024. This period is chosen to ensure a globally homogeneous and well-constrained atmospheric state, as the quality of reanalysis data decreases substantially further back in time, particularly prior to the satellite era, with pronounced hemispheric differences in observational coverage (Soci et al., 2024). Each simulation year is run separately and spans from 1 December of the previous year through 31 January of the subsequent year, capturing transitional meteorological conditions across annual boundaries for the duration of typical forward/backward tracking studies. Due to this year-by-year simulation setup, parcel trajectories are temporally bounded by the simulation period (December of the previous year to January of the following year) and cannot be extended further across calendar years.
To obtain a globally homogeneous sampling of the atmosphere, FLEXPART is run in domain-filling mode, releasing millions of equally weighted parcels that represent the full atmospheric mass and are vertically distributed according to the density profile. All parcels are initialized at the start of each simulation period and are uniformly distributed to represent the global atmospheric mass, rather than being continuously released from specific source regions. Each parcel is assigned a unique identifier and tracked throughout the simulation. For the final configuration, we track approximately 20 million air parcels distributed over the lowest 90 model levels (ECMWF levels 48–137), covering the troposphere up to the lower stratosphere. This vertical range targets the atmospheric layers most relevant for moisture transport. The number of vertical levels is restricted following flex_extract recommendations, as computational costs associated with meteorological preprocessing increase strongly with the number of extracted levels (Tipka et al., 2020). The number of particles is chosen to ensure adequate sampling of the atmospheric column based on FLEXPART's internal consistency criterion (i.e. ratio between the maximum number of particles in any column and the number of vertical model levels > 1). The resulting particle density provides sufficient representation of the vertical structure across atmospheric columns while maintaining computational efficiency. At regular output intervals (3-hourly), the position and associated (thermo)dynamic properties of each parcel (e.g., latitude, longitude, height, temperature, specific humidity, and density) are stored, forming the basis of the trajectory dataset.
Trajectory integration is performed using a numerical integration time step of 600 s. As in previous FLEXPART-based studies, much shorter adaptive time steps are applied in the turbulent atmospheric boundary layer to ensure realistic particle behaviour, corresponding to 10 % and 1 % of the variable Lagrangian time scale for horizontal and vertical motions, respectively. This configuration is achieved by setting the FLEXPART options CTL = 10 and IFINE = 10, following recommendations in Bakels et al. (2024, 2025). Turbulent mixing and convection are represented using FLEXPART's standard parameterizations and are turned on (LCONVECTION = 1) . The selected combination of vertical, temporal and spatial resolution, particle number, and integration time step reflects practical constraints while ensuring consistent large-scale transport diagnostics.
The FLEXPART trajectories form the basis for diagnosing atmospheric moisture and heat source–sink relationships. To promote transparency and reproducibility, the complete FLEXPART trajectory archive (1979–2024) is openly available through Globus (Sect. 5), together with the FLEXPART and flex_extract configuration files defining all model parameters and preprocessing steps.
2.2 Post-processing and source–sink diagnostics (HAMSTER v2)
HAMSTER v2 is used here to enable the post-processing and showcase the potential to derive moisture and heat source–sink diagnostics from the FLEXPART trajectory dataset. While applied in this study for dataset usage examples, the trajectory dataset itself is not tied to a specific analysis framework and can be analysed using alternative attribution methods or other applications. A description of HAMSTER v2 updates relative to earlier versions is provided in Appendix B, and the model code is openly available on Zenodo (Sect. 5).
HAMSTER traces all air parcels present over a user-defined study region backward in time to determine when and where they originally gained moisture and heat via evaporation and sensible heat flux, respectively. Source regions are identified by analysing changes in specific humidity (q) and potential temperature (θ) along each trajectory. For moisture, changes in q are interpreted as net moisture tendencies along the parcel path, where positive (negative) values indicate moisture uptake (loss). For sensible heat (H), analogous changes in potential temperature, calculated from temperature, specific humidity and density, are used to diagnose surface heat uptake (Keune et al., 2022). The algorithm is based on the WaterSip approach, introduced by Sodemann et al. (2008), which uses linear discounting so that earlier evaporative or sensible heat sources contribute less to the sink region when precipitation or heat losses occur along the trajectory. In backward mode, this yields fields of evaporation-to-precipitation (E2P), i.e. diagnostics quantifying the contribution of surface evaporation to precipitation in the sink region, and heat-to-temperature (H2T), i.e. diagnostics quantifying the influence of surface sensible heat fluxes on atmospheric temperature in the receptor region. H2T does not imply a decomposition of temperature into sensible heat components. Instead, it denotes the attribution of diabatic temperature (or potential temperature) tendencies along air-parcel trajectories to earlier surface sensible heat fluxes. However, potential temperature is also influenced by latent heating and radiative cooling, which cannot be separated in the present framework and should be kept in mind when interpreting these results (see Appendix B). A key feature and innovation of HAMSTER is its bias correction scheme, which constrains the diagnosed moisture and heat simulations with estimates of evaporation (or sensible heat flux) and precipitation, and can be applied with any observational or reanalysis dataset. In the standard configuration, and in this study, ERA5 is used for bias correction, ensuring consistency with the FLEXPART simulations.
HAMSTER is here applied in backward mode using a 30 d backtracking window, exceeding the typical ∼ 10 d atmospheric water vapour residence time (van der Ent and Tuinenburg, 2017) in order to capture long-lived remote moisture contributions that lie in the tail of the residence time distribution. To correct for a small residual inconsistency between aggregated E2P contributions and observed evaporation and precipitation, a final rescaling of the E2P fields is applied (see Appendix A and Fig. A1). Owing to the 30 d backtracking window and the associated budget-closure rescaling, the first and last years of the trajectory archive cannot be fully attributed, and the analyses are therefore limited to 1981–2023.
The FLEXPART trajectory dataset and HAMSTER post-processing tool enable a wide range of analyses of atmospheric moisture and heat pathways. Here, we provide several illustrative examples that demonstrate typical applications of the dataset (i) global climatologies of E2P and interregional source–sink relationships, (ii) seasonal variability of continental and oceanic moisture sources, (iii) global diagnostics of sensible heat source–sink linkages, and (iv) two event-scale case studies: the 2021 Central European floods and the 2023 northeastern China heatwave.
3.1 Global applications
3.1.1 Global E2P climatology and source–sink patterns
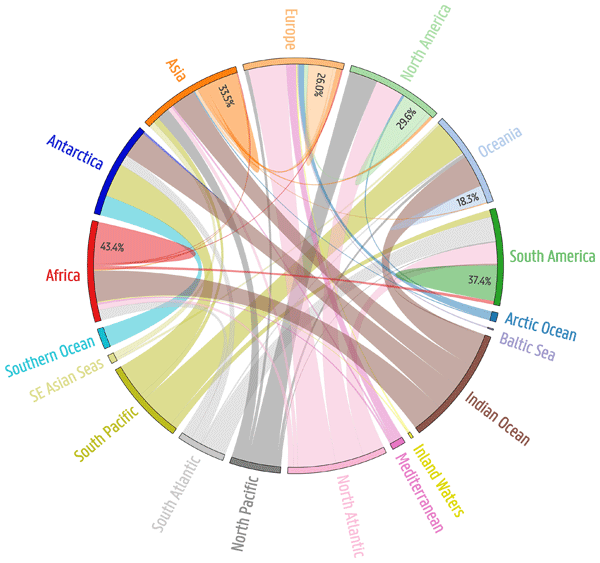
As a first demonstration of the dataset's capabilities, we quantify continental precipitation recycling and external moisture supply for the period 1981–2023. Figure 2 summarises these interregional moisture exchanges (numerical values in Fig. C1 in Appendix C). The continental recycling ratios show physically plausible contrasts across regions and are in line with the values found in van der Ent et al. (2010). Africa and South America exhibit the highest precipitation recycling values (43.4 % and 37.4 %), consistent with their large areas of deep convective precipitation, where shorter atmospheric transport distances favour higher recycling. Mid-latitude continents in the Northern Hemisphere depend more strongly on nearby oceans. Europe and North America receive large fractions of their precipitation from the North Atlantic (∼ 40 % and ∼ 30 %), while Asia shows an intermediate local moisture supply (33.5 %) with large contributions from the Indian Ocean. Oceania's precipitation is dominated by surrounding oceanic inflow (71.3 %), reflecting its reduced land mass and extensive semi-arid regions. The resulting global continental precipitation recycling fraction (38.9 %) closely matches independent Eulerian water-budget estimates, which are constantly close to 40 % (van der Ent et al., 2010; van der Ent and Savenije, 2011; Findell et al., 2019; van der Ent et al., 2014), providing confidence in the overall magnitude of the diagnosed fluxes.
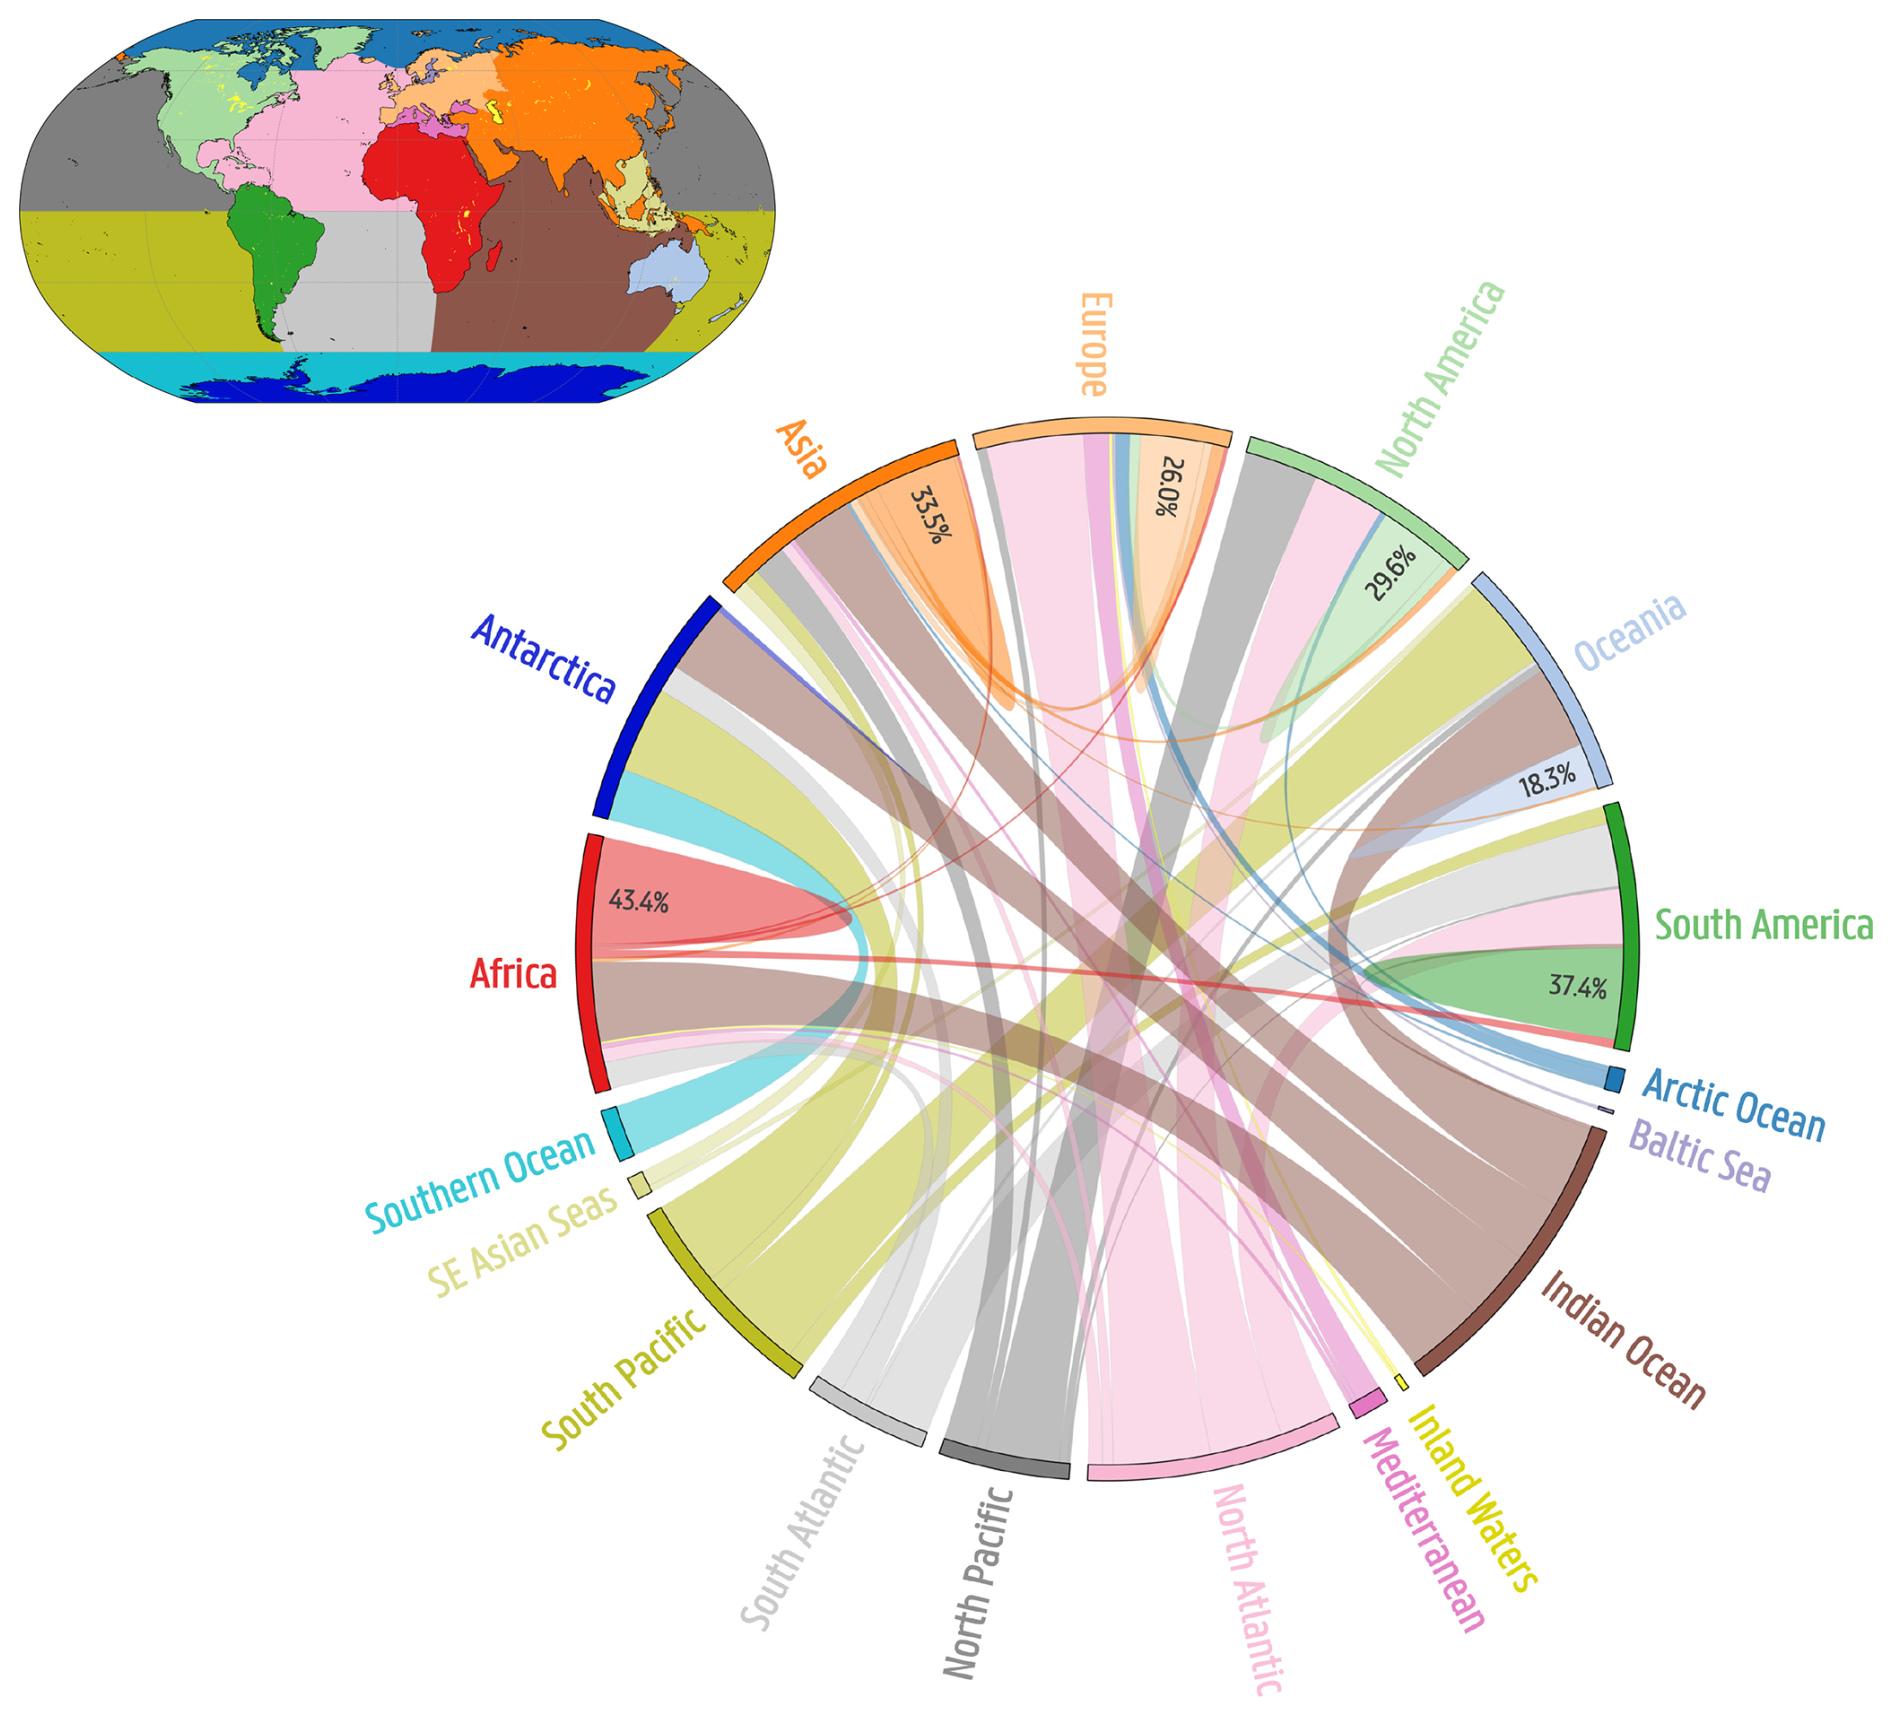
Figure 2Chord diagram illustrating the relative sources of precipitation for each continent (1981–2023). Percentages are precipitation recycling ratios, i.e. the fraction of each continent's precipitation originating from its own evaporation.
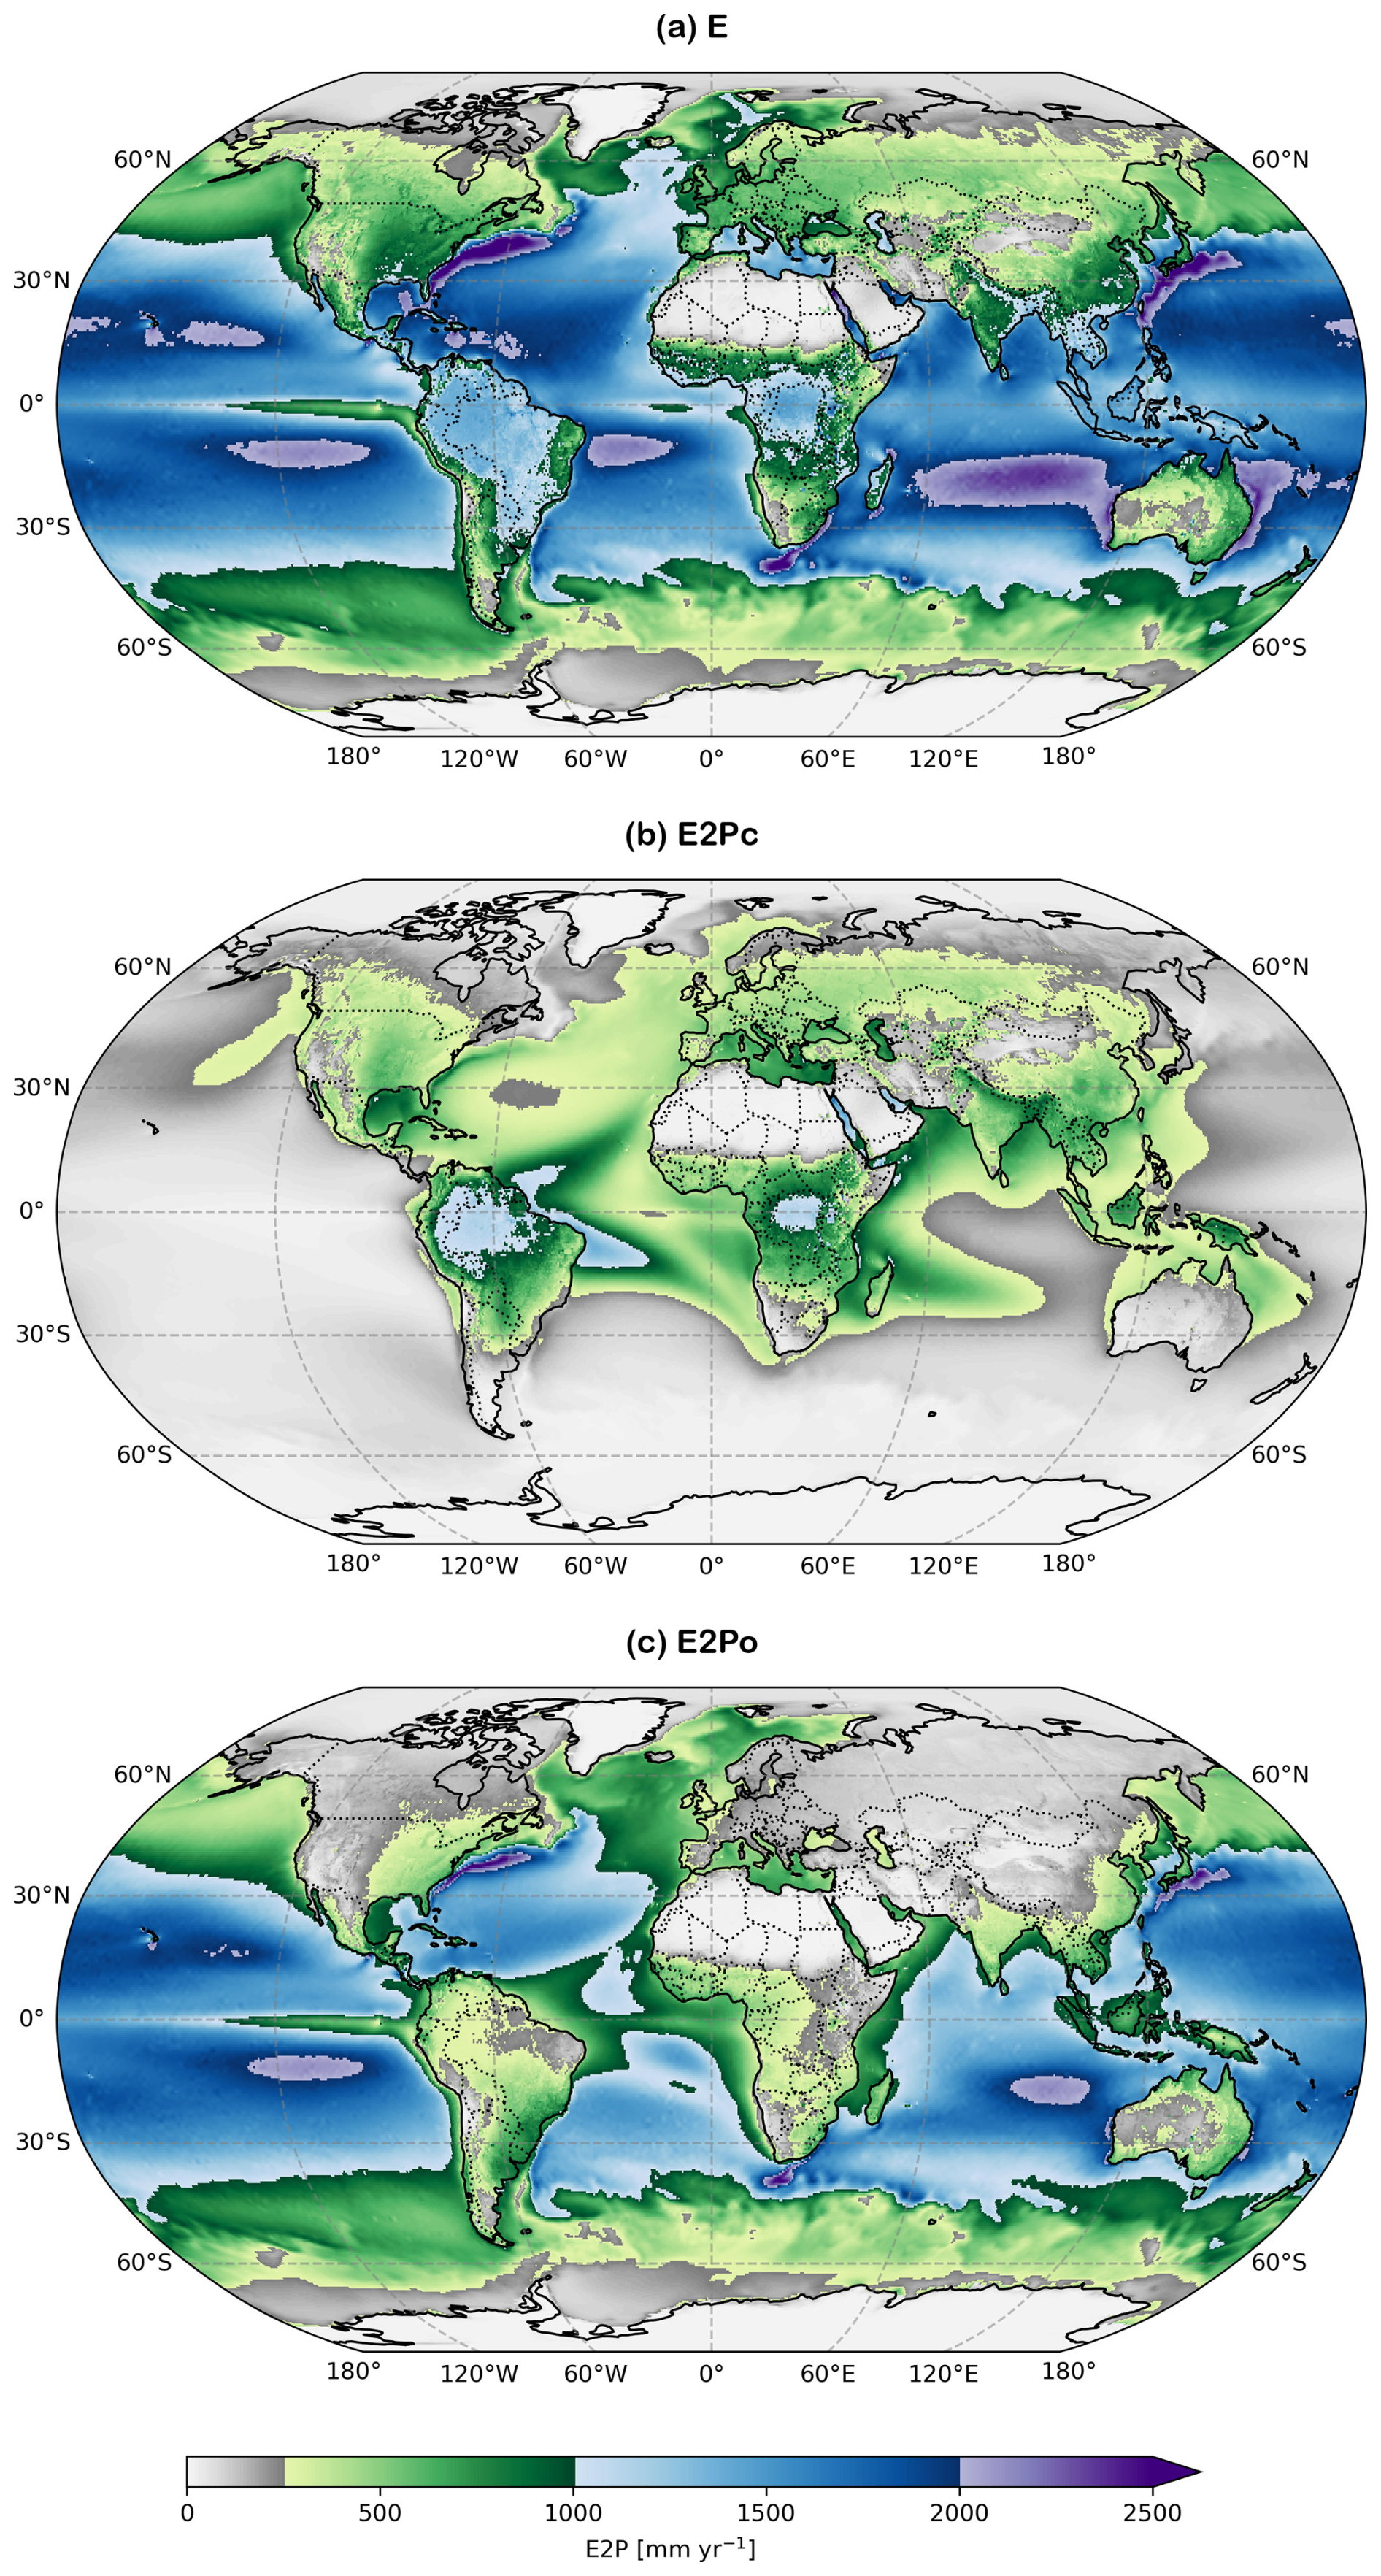
Figure 3Climatologies of (a) evaporation (E), (b) evaporation yielding continental precipitation (E2Pc), and (c) evaporation yielding oceanic precipitation (E2Po) over 1981–2023.
Figure 3 presents the gridded global E2P climatology, separated into contributions to ocean precipitation (E2Po) and to continental precipitation (E2Pc). Given that our sink regions collectively cover the globe, this is equivalent to decomposing the evaporation field (Fig. 3a) into the parts that rain over the continents (Fig. 3b) and over the ocean (Fig. 3c). Figure 3b illustrates the spatial variability underlying the continental-scale overview shown in Fig. 2. The gridded E2P fields highlight well-known features of the global moisture cycle and demonstrate the spatial detail provided by the dataset (Fig. 3 and the continental breakdown in Fig. C2), including strong continental moisture sources over tropical rainforest regions. In South America (Fig. C2e), Amazonia plays a leading role together with the north- and southeastward spread into the tropical Atlantic, a characterization of the prevailing easterlies. Similarly, in Africa, the Congo rainforest supplies much of Africa's rainfall (Fig. C2a) complemented by contributions from the Indian Ocean and, to a lesser extent, the tropical Atlantic. In Asia (Fig. C2b) major land sources include Southern mainland Asia, and the tropical rainforests of the Maritime Continent. Inflows from the Indian Ocean, Bay of Bengal, and western Pacific, reflect the region's diverse circulation regimes and the strong moisture supply linked to the Asian monsoon. In Europe (Fig. C2c), the maximum values of E2P occur over the Mediterranean Sea, particularly its northwestern sector, although in relative terms the contribution from recycling and from the North Atlantic are dominant (Fig. 2). North America (Fig. C2d) receives moisture from the eastern United States and the Gulf of Mexico, complemented with contributions from the western North Atlantic and eastern North Pacific following the prevailing westerlies. The Atlantic and Pacific supply comparable amounts of moisture to the continent (Fig. 2). Oceania (Fig. C2f) receives moisture primarily from the Coral Sea and surrounding western Pacific, supplemented by smaller contributions from northern and eastern Australia.
The E2Po fields (Figs. 3c and C3) confirm that oceanic evaporation sustains the majority of ocean precipitation (92.7%), with land contributions largely confined to coastal regions. These land-to-ocean moisture transfers are primarily controlled by large-scale circulation, producing enhanced E2Po signals along eastern continental margins in the mid-latitudes and along western continental margins in the tropics. Tropical land regions contribute comparatively little to open-ocean precipitation, with the notable exception of the Maritime Continent, where the island-dominated geography allows efficient export of terrestrial moisture to surrounding warm ocean basins.
While no direct observational ground truth exists for moisture source attribution, the close agreement of continental recycling with independent Eulerian estimates and the consistency of the spatial patterns with previous Eulerian and Lagrangian studies support the physical realism of the dataset (e.g., Gimeno et al., 2012, 2020b; van der Ent and Savenije, 2013). In line with earlier global analyses, our results reproduce the joint importance of oceanic and terrestrial moisture sources, with most rainfall originating from oceanic evaporation but with land surfaces, particularly tropical forests, playing a key role in sustaining precipitation downwind and moisture recycling. The results also show the influence of the prevailing winds on source–sink patterns (Stohl and James, 2005; van der Ent and Savenije, 2013). At the regional scale, the dataset captures several well-documented features of the global moisture cycle, including the dominant Atlantic influence on European, and South and North American precipitation despite its smaller basin size compared to the Pacific, monsoon-driven oceanic inflows over Asia, and the disproportionate contribution of relatively small ocean basins. In particular, the Mediterranean and Baltic Sea together account for 11.6 % of European precipitation, confirming earlier findings that the strength of these contributions are strongly modulated by seasonal and regional wind patterns rather than basin size alone (van der Ent and Savenije, 2013). By enabling the derivation of spatially explicit, bias-corrected E2P climatologies over more than four decades, the dataset, when combined with post-processing frameworks such as HAMSTER, extends previous studies in temporal coverage and internal consistency, demonstrating its suitability for a wide range of hydroclimatic and land–atmosphere interaction applications.
3.1.2 Seasonal moisture source variability
The seasonal climatologies (Fig. 4) illustrate that the dataset captures the expected hemispheric and latitudinal contrasts in E2Pc. During December–February (DJF), Northern Hemisphere continental contributions are weak due to winter suppression of surface fluxes; precipitation is primarily sustained by oceanic inputs, with eastern ocean basins in the midlatitudes and western ocean basins in the tropics as main oceanic moisture sources. Additionally, semi-enclosed basins such as the Mediterranean and the Red Sea emerge as strong moisture suppliers. In the transitional March–May (MAM) season, continental contributions increase as the Northern Hemisphere warms and vegetation activity increases, reaching a peak between June–August (JJA) when evaporation is highest, while oceanic hotspots such as the Gulf Stream fade in their relative importance throughout the year. In September–November (SON), Northern Hemisphere continental contributions weaken again as the system transitions back to austral dominance. The Inter-Tropical Convergence Zone (ITCZ) migration is clearly reflected in these patterns: in DJF, South America and southern-to-central Africa contribute strongly, while in JJA the E2Pc maximum in those continents shifts northward with the ITCZ before retreating southward in SON. Tropical rainforests remain perennial hotspots of high E2Pc due to their dense vegetation and year-round strong evaporation, whereas arid regions contribute negligibly in all seasons. Australia also shows a marked seasonal cycle, with some land contributions in the north in DJF (austral summer) and negligible contributions in JJA, when the Coral Sea and surrounding ocean sources dominate.
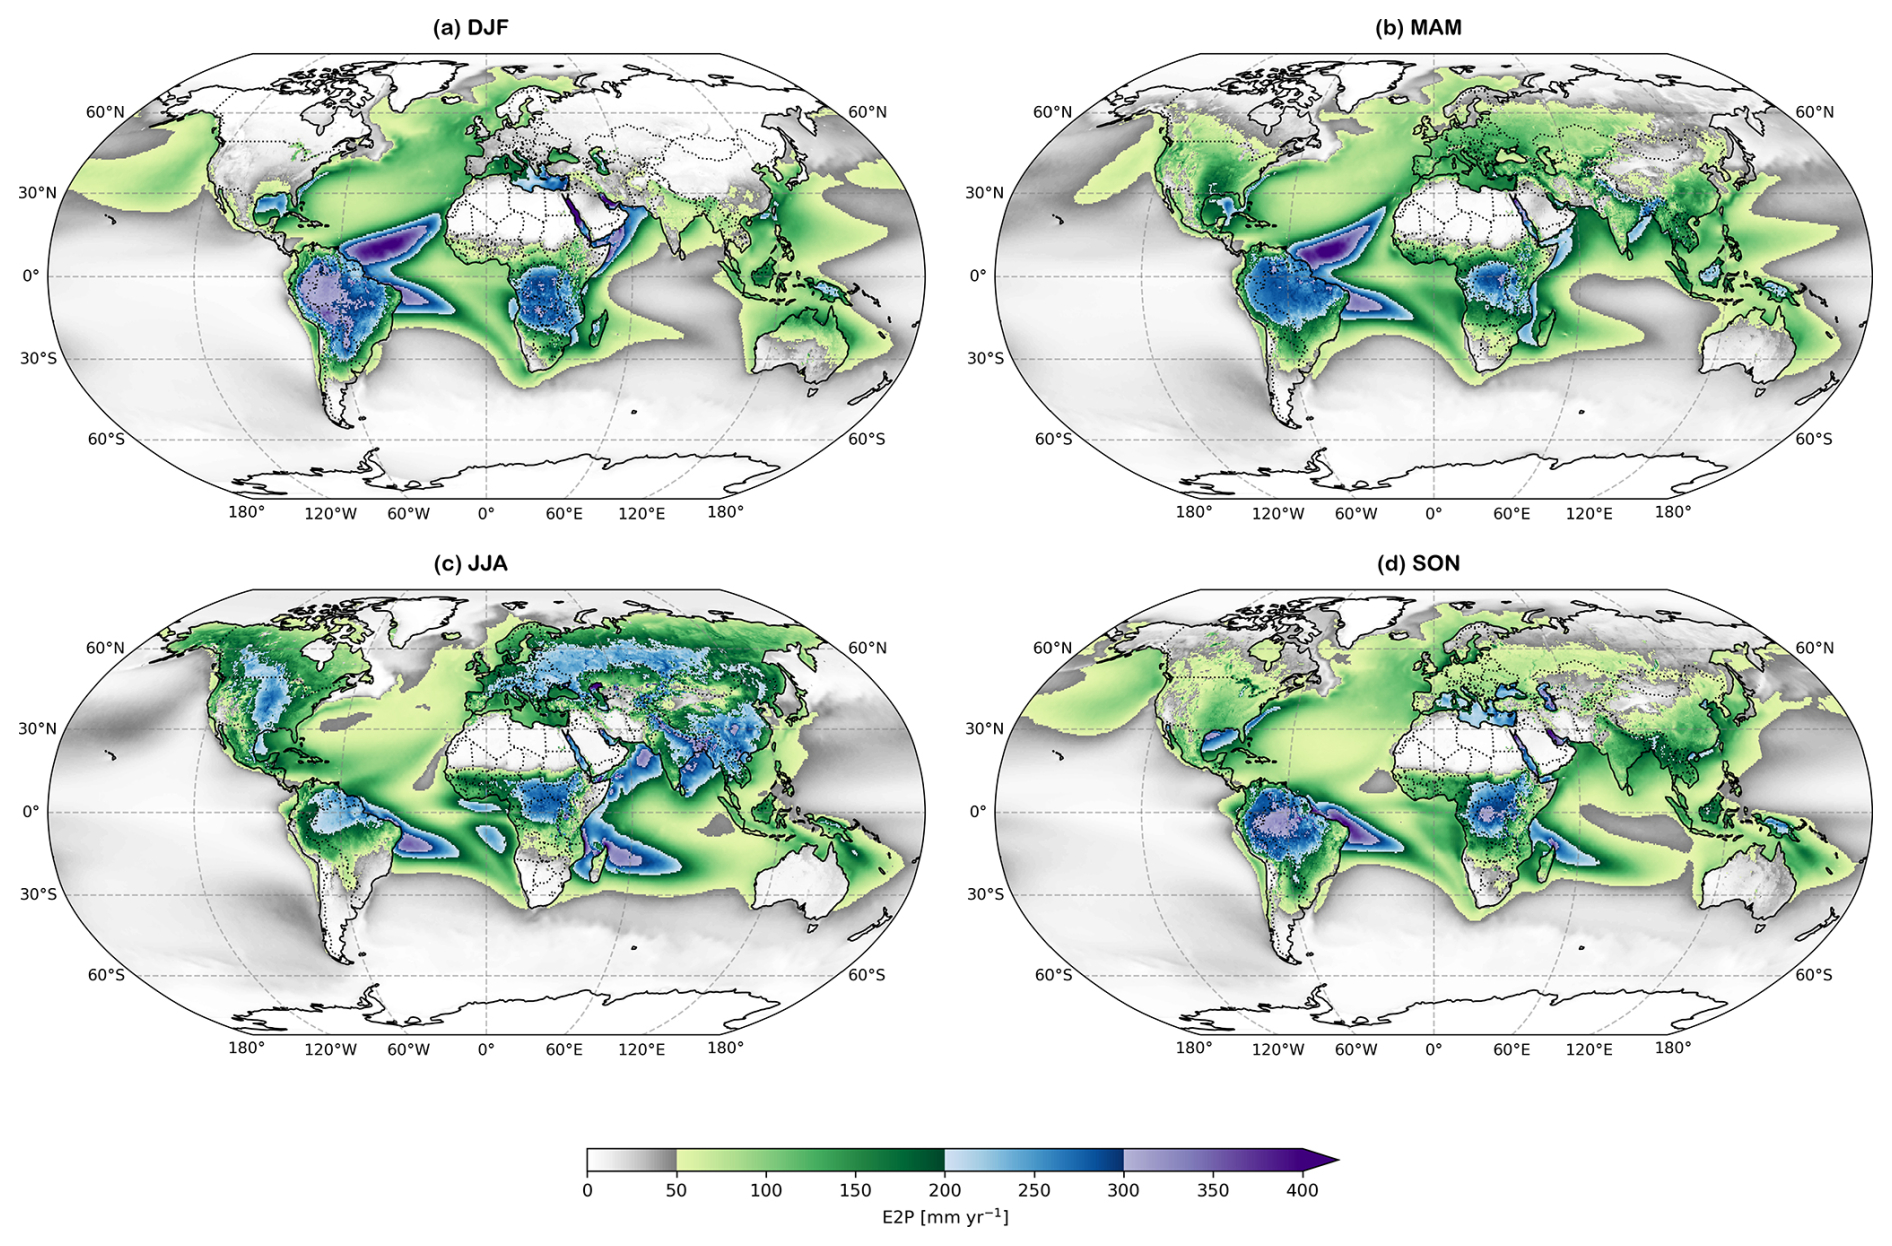
Figure 4Seasonal climatologies of evaporation yielding continental precipitation (E2Pc) over 1981–2023.
Oceans reveal a clear hemispheric seasonality, peaking during each hemisphere's winter, reflecting seasonal shifts in heating and large-scale circulation. The seasonal E2Po fields (Fig. C4) show a comparable hemispheric phasing, with DJF maxima along the Gulf Stream and Kuroshio in the Northern Hemisphere, and JJA maxima across the Southern Hemisphere oceans. Overall, the agreement with earlier studies confirms that the dataset reliably captures the large-scale seasonal structure of atmospheric moisture transport, including e.g. the seasonal strengthening of oceanic moisture supply to South and Southeast Asia during boreal summer, associated with the Asian monsoon (van der Ent and Savenije, 2013; Gimeno et al., 2020b), which is clearly reflected in the seasonal E2Pc fields. Beyond this large-scale agreement, the higher spatial and temporal resolution, together with the increased number of tracked air parcels (for Lagrangian simulations), enables a more detailed characterization of moisture pathways and surface–atmosphere exchanges.
3.1.3 Sensible heat origins
Here, we present an illustrative example of how the trajectory dataset can be used to diagnose large-scale heat source–sink relationships, shown for the year 2021. Figure 5 presents a global-scale example of fields that provide a proxy for the influence of sensible heat on on temperature (H2T). Analogous to the evaporation decomposition, surface sensible heat (Fig. 5a) can be decomposed into a component that ultimately warms continental air (H2Tc, Fig. 5b) and a component that ultimately warms oceanic air masses (H2To, Fig. 5c). Similarly, H in Fig. 5a will equate the sum of the H2T from all sinks, with mild deviations from ERA5 data due to internal consistency (Appendix A). The resulting H2T fields show that both H2Tc and H2To are almost exclusively of continental origin, with the strongest signals over arid and semi-arid regions such as the Sahara, Sahel, East Africa, Australia, and parts of North and South America. Over the open oceans, H2To values remain small and H2Tc values are close to zero. This is expected, as water bodies preferentially dissipate available energy as latent heat (evaporation), whereas land surfaces, especially dry and sparsely vegetated ones, transfer energy to the atmosphere as sensible heat more efficiently. Tropical forests, in contrast, exhibit less sensible heating, as their dense and moist canopies sustain high latent heat fluxes that largely govern the surface–atmosphere energy exchange, this can be seen in both H2Tc and H2To where contributions from Amazonia, Central Africa and the Maritime Continent remain low.
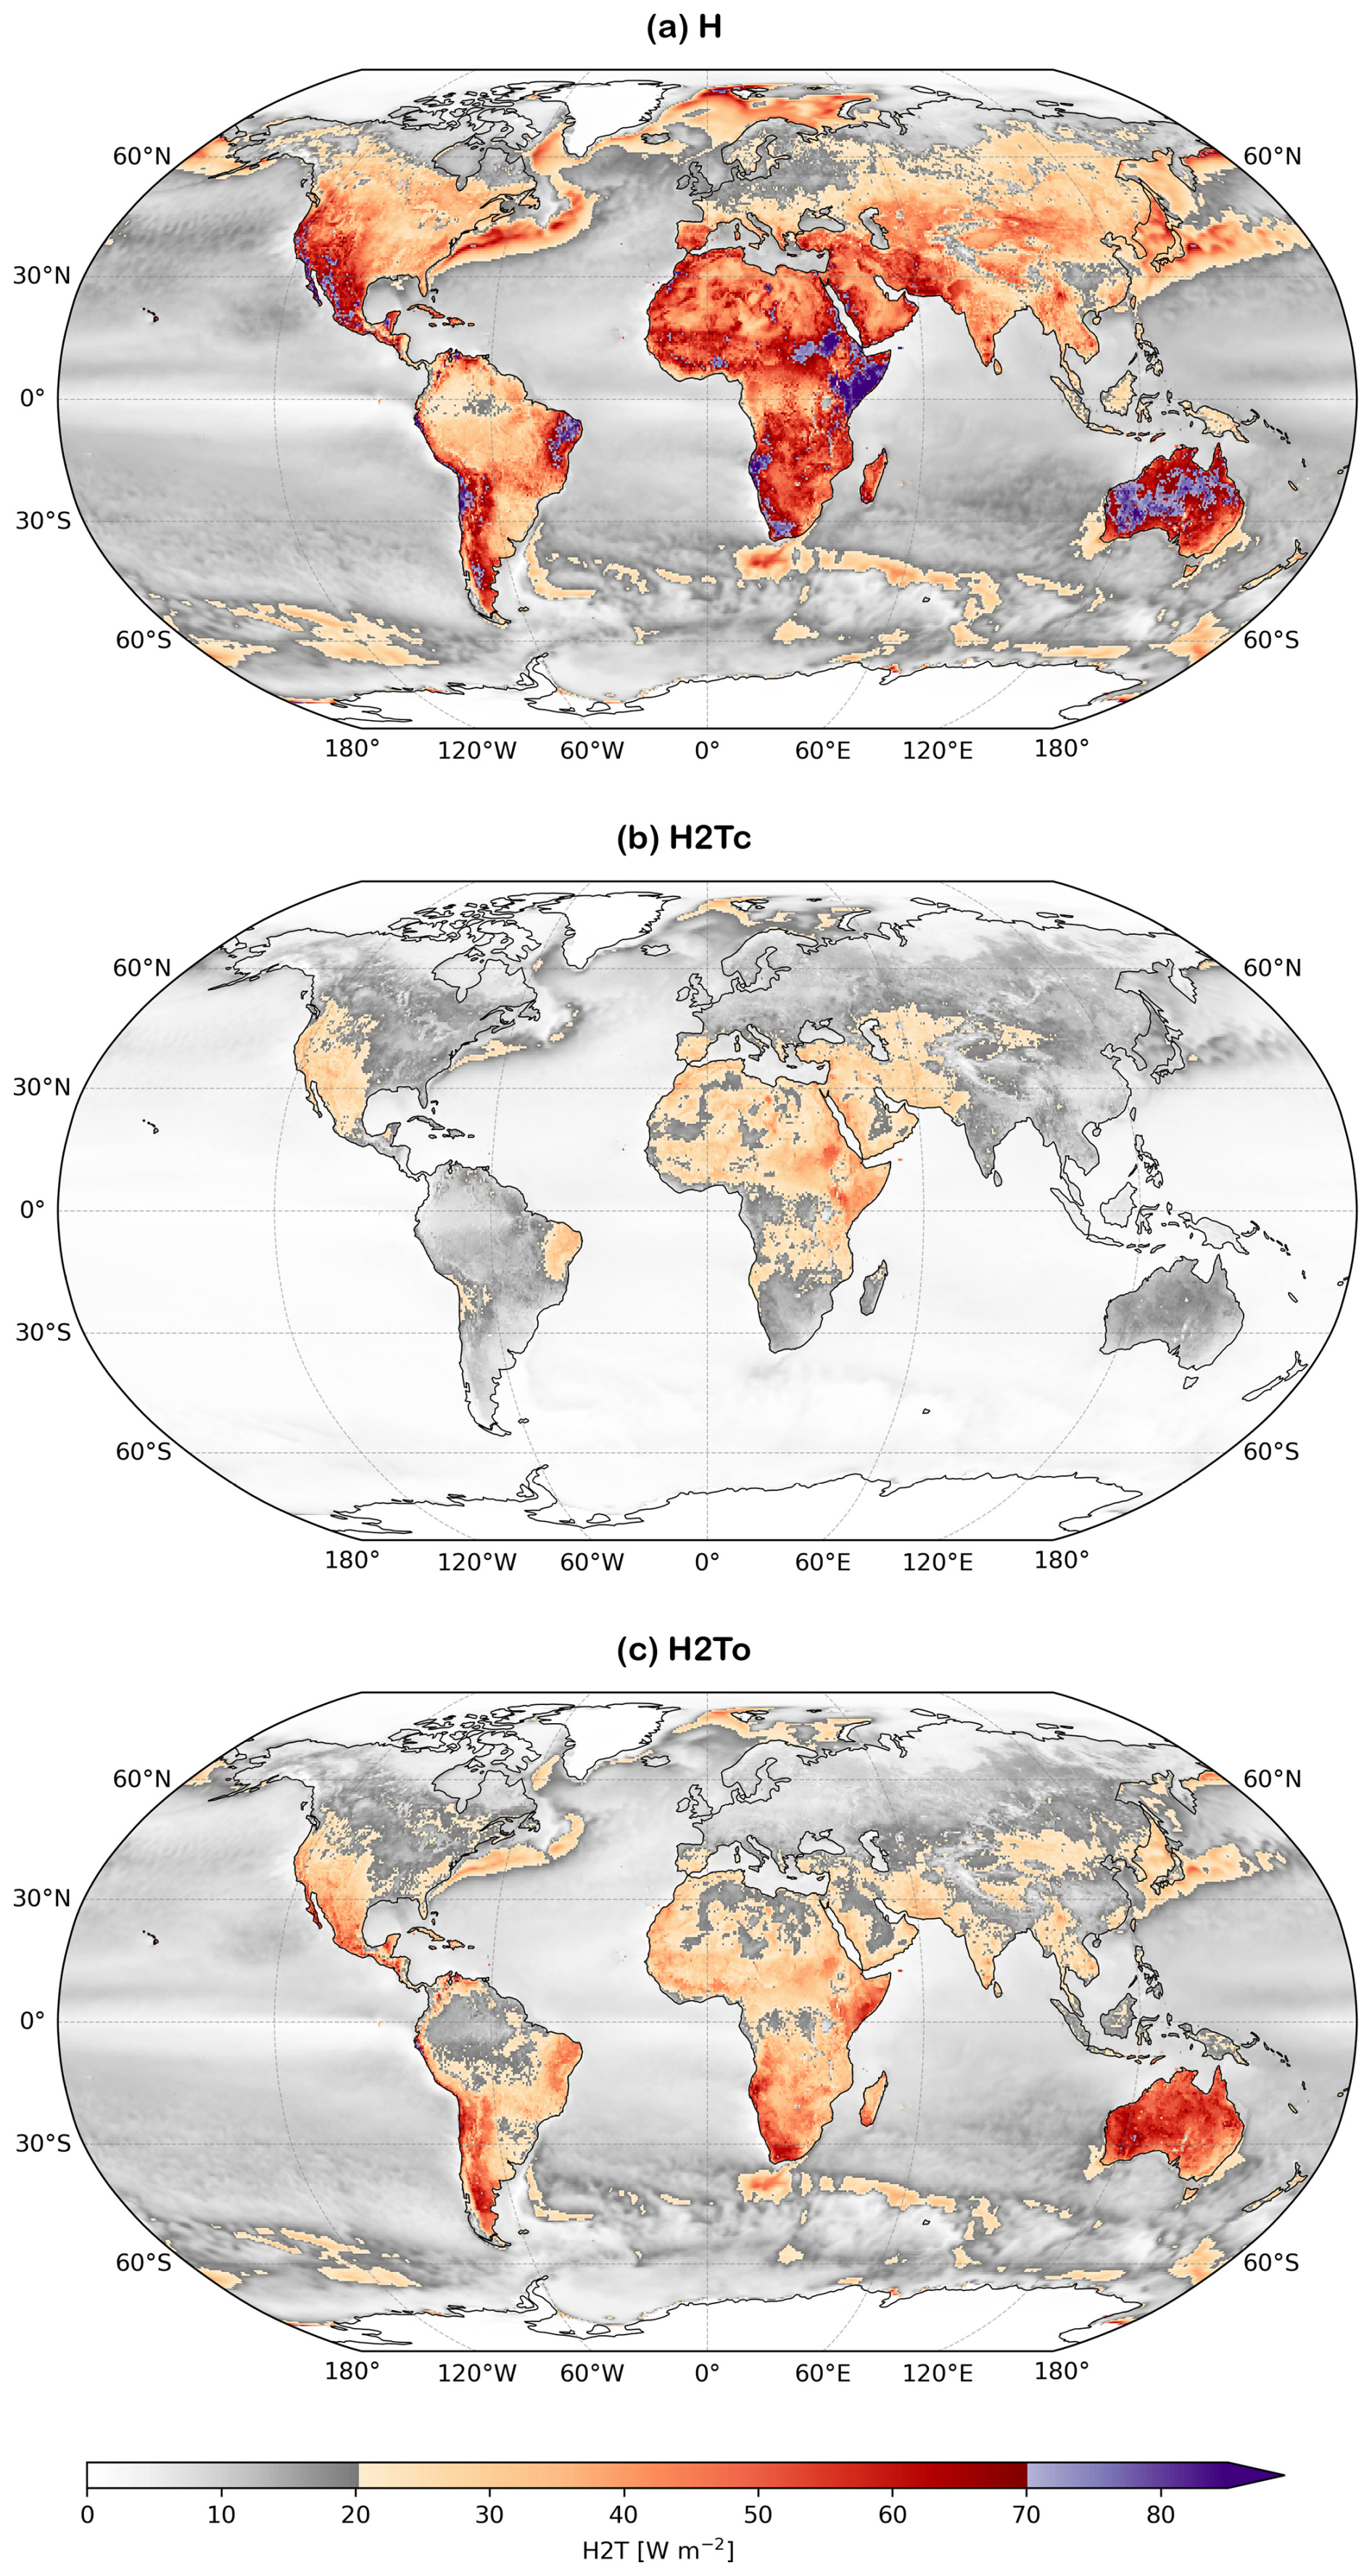
Figure 5Spatial distribution of (a) surface sensible heat (H), (b) surface sensible heat leading to continental air warming (H2Tc), and (c) surface sensible heat leading to oceanic air warming (H2To). Values represent averages for 2021.
Despite differences in magnitude, H2Tc and H2To exhibit systematic hemispheric contrasts. In the Southern Hemisphere, strong H2To signals appear around Australia, southern Africa, and subtropical South America, indicating efficient export of sensible heat from adjacent dry continental regions to nearby oceans. The intense H2To signature near Oceania reflects the combined effect of high insolation and limited soil moisture, with excess surface energy being rapidly transported toward the ocean. The hemispheric contrast reflects differences in land–ocean distribution and prevailing circulation patterns and illustrates the capacity of the dataset to resolve large-scale heat transport pathways. The Southern Hemisphere's greater ocean area favours rapid oceanward heat export, and the Northern Hemisphere's extensive landmasses and prevailing westerlies can keep part of the sensible heat inland. Overall, the global distribution of H, as expected, closely aligns with known energy-limited and water-limited regimes (McVicar et al., 2012), and aridity (UNEP, 1997; Donat et al., 2019).
While the H2T analysis represents only one example of the FLEXPART–HAMSTER framework, it demonstrates that the trajectory dataset can be used to extend Lagrangian source–sink diagnostics beyond atmospheric moisture to heat transport. To our knowledge, no comparable global diagnostics of sensible heat influence derived from Lagrangian trajectories currently exist, precluding direct comparison with earlier studies. Nevertheless, the spatial patterns obtained here are physically plausible and consistent with established understanding of surface energy partitioning and large-scale atmospheric transport. Based on the limited interannual variability observed in the spatial structure of moisture source regions, we expect the H2T patterns shown for 2021 to be broadly representative of climatological gradients and magnitudes.
3.2 Event-scale applications
Two contrasting extreme events were selected to illustrate the usability of the dataset at smaller spatial and temporal scales. The first case is the Central European flood of July 2021, a heavy rainfall event that affected western Germany and neighbouring countries between 13 and 16 July 2021, during which precipitation totals of up to 150 mm fell within 15–18 h, leading to severe flooding (Mohr et al., 2022). The analysis domain was defined as 49.5–51.5° N and 4.5–7.5° E, encompassing the main area of intense precipitation and flooding. To additionally demonstrate the value of heat tracking, we analysed the record-breaking heatwave in northeastern China in summer 2023, which occurred from 20 June to 20 July 2023 over the region 36–41.5° N and 114–118° E (Wang et al., 2024).
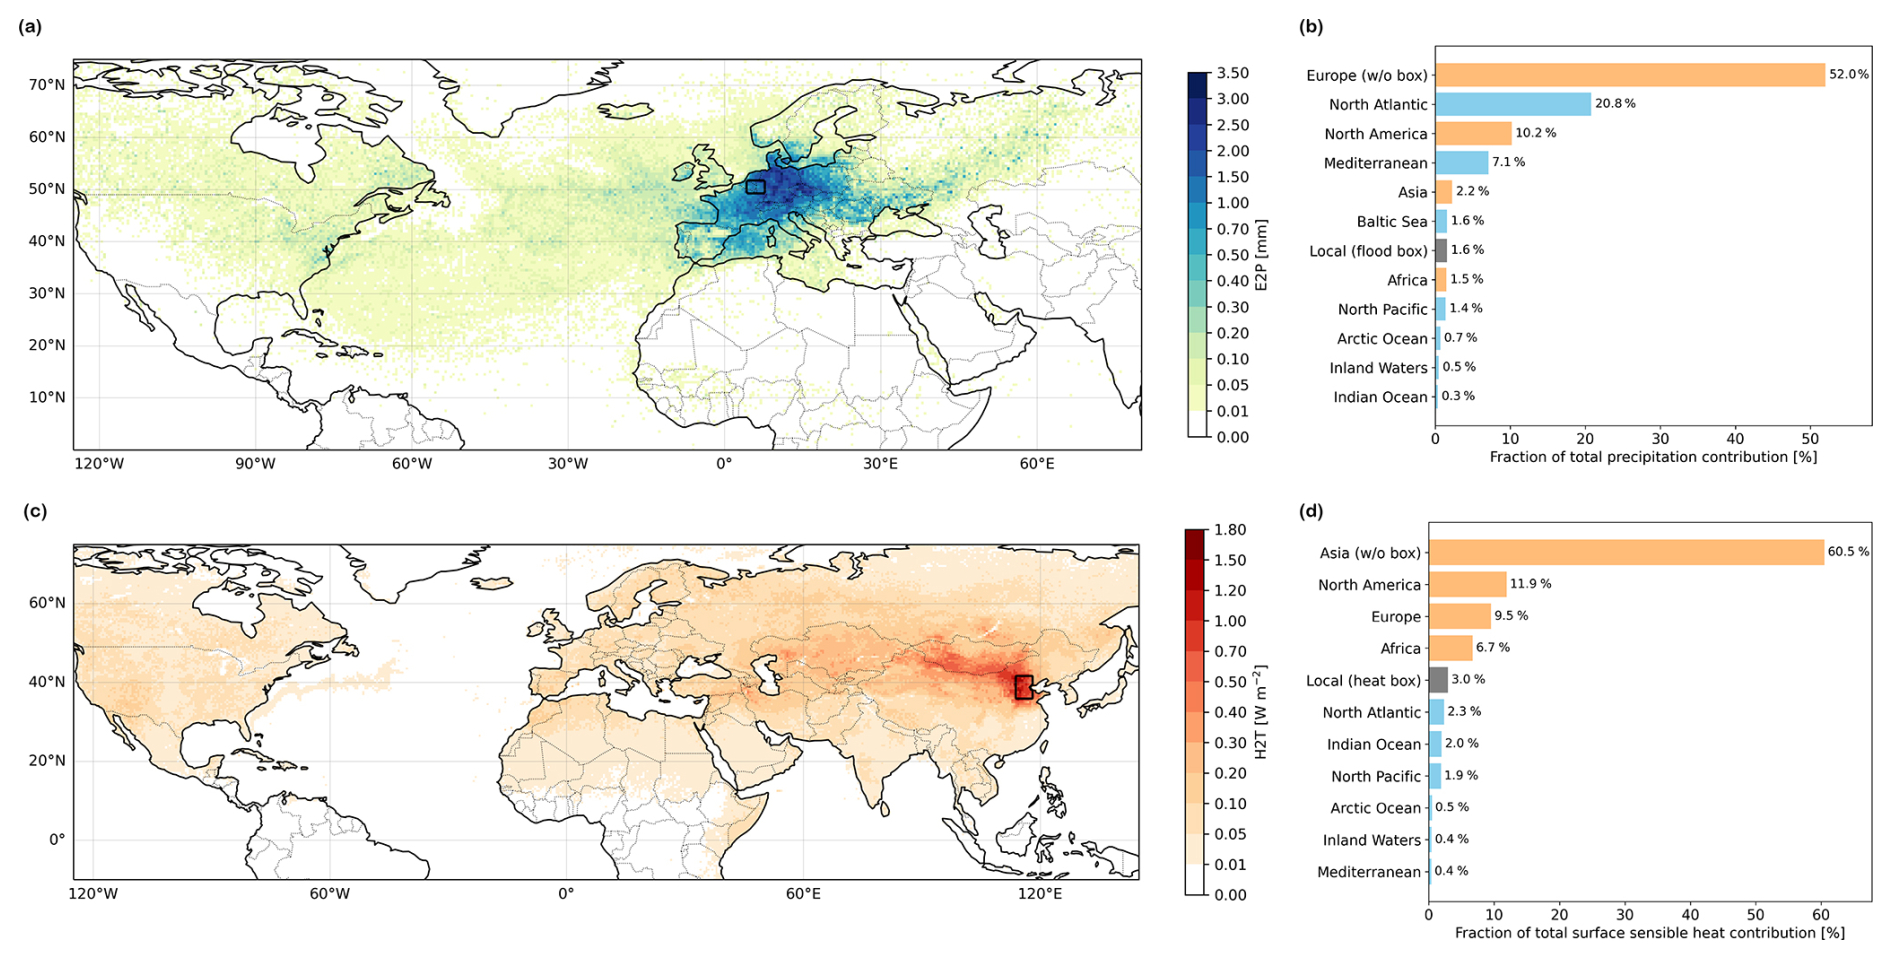
Figure 6Case studies: (a) E2P contributions for the Central European flood of 2021 and (b) associated source fractions; (c) H2T contributions for the 2023 northeastern China heatwave and (d) associated source fractions. The black box marks the study region. In (b) and (d), blue denotes water body sources and orange denotes continental sources.
The Central European flood was driven by a slow-moving low-pressure system that travelled eastward across Europe. As it passed over western Europe, a northeasterly flow transported warm, moist air from the anomalously warm Baltic Sea, producing exceptional rainfall over Belgium and Germany in the northwest sector of the depression (Mohr et al., 2022). While synoptic analyses emphasize the role of persistent blocking and enhanced Baltic Sea evaporation in building up moisture (Mohr et al., 2022), our source analyses provide a complementary, quantitative assessment of their contributions to the precipitation event (Fig. 6a, b). The majority of the precipitation (∼ 52 %) originated from evaporation within Europe, underscoring strong continental contributions under the quasi-stationary circulation. In contrast, the Baltic Sea, often highlighted in synoptic analyses, accounts for only ∼ 1.6 % in our source diagnostics. This means that, in our Lagrangian framework, the Baltic Sea does not emerge as a major moisture supplier, despite anomalously warm SSTs and its perceived importance in the synoptic narrative. On the other hand, the large inputs from the North Atlantic (∼ 21 %) and North America (∼ 10 %) reflect the long-range advection along the westerly flow preceding the blocking episode. Further contributions arose from the Mediterranean (∼ 7 %), with smaller but non-negligible inflows from Asia, Africa, and nearby regional seas, illustrating the spatially diffuse yet interconnected nature of moisture transport. Together, these findings show how continental moisture retention and remote Atlantic inflow jointly sustained the extreme rainfall over western Germany. This interpretation is consistent with three independent studies (Insua-Costa et al., 2022; Staal and Koren, 2023; Kalverla et al., 2025), reinforcing the robustness of our results and thus dataset.
The China heatwave was characterized by a persistent and abnormally strong high-pressure system dominating North China, reinforced by an east–west band of subtropical highs that blocked moisture transport from lower-latitude oceans. Preceding months of reduced rainfall had caused severe soil moisture depletion and diminished evaporation, amplifying surface sensible heat fluxes and accelerating surface warming (Wang et al., 2024; Gui and Zhou, 2025). This local land–atmosphere feedback played a key role in sustaining the extreme heat (Wang et al., 2024). The H2T analysis (Fig. 6c, d) highlights a strong dominance of local land sources within Asia (over 60 %), with only modest external inputs from other regions like North America and Europe. This dominance reflects the presence of an anomalous anticyclone aloft over North China, part of an unusually extended subtropical high-pressure belt linking the strengthened western North Pacific and Iran highs. The resulting subsidence and blocked moisture inflow suppressed convection and enhanced adiabatic warming under clear skies (Wang et al., 2024). During heatwaves, reduced soil moisture and high surface temperatures enhance sensible heat fluxes locally, thereby reinforcing the atmospheric heat burden over the affected region (Miralles et al., 2014; Barriopedro et al., 2023). This can be seen on the map where high H2T values are clearly visible within the heatwave box itself. Although its areal contribution is small, its per-pixel intensity ranks among the highest globally. Elevated H2T values northeast of the box coincide with the region influenced by the strengthened East Asian westerly jet and the westward-extended western North Pacific Subtropical high, which together favoured the persistence of hot, dry air over the area (Wang et al., 2024). At the same time, although the local contributions are larger, our analyses also reveal non-negligible inputs from very distant land regions. North America, for example, contributes ∼ 11 % despite its extreme distance from the heatwave box, likely reflecting long-range transport by the prevailing mid-latitude westerly winds. Oceanic sources play only a negligible role, underlining the continental origin of sensible heat anomalies. This pattern is consistent with the strong land–atmosphere feedback documented for this event: prolonged precipitation deficits led to soil drying, reduced evaporation, and a sharp increase in sensible heat, which in turn further amplified and maintained the heatwave (Gui and Zhou, 2025; Wang et al., 2024). This case therefore illustrates how the method can disentangle the spatial sources of sensible heat fluxes and confirms that extreme land–atmosphere coupling was central to the 2023 China heatwave.
Both events reveal a combination of regional and long-range contributions, underscoring the role of large-scale transport in shaping extremes. This contrast demonstrates that the dataset and its accompanying diagnostic tool can resolve both the advective connections and the thermodynamic feedbacks underlying such events. Hence, the case studies demonstrate the versatility of the dataset for (targeted) extreme-event analyses and, more generally, the usefulness of the dataset for smaller-scale studies. This is a direct consequence of how we designed our FLEXPART simulation setup: by including a very large number of particles (20 million globally), using many atmospheric levels and resolving transport at high temporal resolution, our dataset remains useful and valid for targeted regional and event-based case studies. For example, in the Central European flood and the northeastern China heatwave, we used subsets of 33 392 and 748 341 particles, respectively, representing a large subset despite the small sink regions (boxes in Fig. 6a and c) – helping to make the results of these analyses more robust.
Several limitations are inherent to the trajectory dataset and should be considered when interpreting the results or reusing the dataset. The FLEXPART simulations are driven by ERA5 reanalysis, which provides the required set of meteorological variables, vertical levels, and temporal resolution consistently over the full simulation period. As a result, the trajectory dataset inherits known uncertainties and regional biases present in ERA5, which propagate directly into Lagrangian moisture and heat diagnostics. Although ERA5 is currently considered the reference global reanalysis for atmospheric applications, these biases may affect the magnitude and spatial distribution of diagnosed source–sink relationships. Part of this uncertainty can be mitigated in post-processing by applying bias-aware frameworks such as HAMSTER, which constrain parcel humidity and heat tendencies using surface fluxes and precipitation fields, but residual reanalysis-related uncertainties inevitably remain.
Even with the methodological improvements introduced in FLEXPART v11 (e.g. improvement of wet deposition, cloud identification, precipitation interpolation, and trajectory accuracy through better particle density distribution), evaporation and precipitation cannot be uniquely separated along individual trajectories, as parcel humidity changes reflect the net balance of surface exchange processes (Bakels et al., 2024). Consequently, ambiguities in diagnosing moisture uptake persist. In addition, trajectory accuracy decreases with increasing integration time as numerical, interpolation, and turbulence-parametrization errors accumulate along the path (Bakels et al., 2024). To limit this effect, simulations are performed year by year rather than as a continuous multi-decadal run.
Moreover, vertical motion in FLEXPART partly depends on a stochastic convection parametrisation, which cannot reproduce the exact timing or depth of individual convective updrafts. Subgrid-scale atmospheric motions unresolved by the meteorological input, such as primarily boundary-layer turbulence, convective mixing, and wet or dry deposition, are likewise represented through simplified parametrisations rather than explicitly resolved. These approximations introduce uncertainty in the attribution of moisture and heat tendencies along parcel trajectories (Stohl and James, 2005; Pisso et al., 2019). This limits the physical specificity with which moisture and heat uptake can be linked to particular processes or surface conditions.
Parcel density further imposes a practical resolution limit: small-scale features, point-source signals, and localised convective systems cannot be resolved without dedicated high-resolution simulations. Meaningful Lagrangian statistics also require a sufficient number of parcels within the region of interest; at higher latitudes or in sparsely sampled areas, parcel counts may be too low to provide robust diagnostics, necessitating larger search volumes or smoothing at the expense of spatial specificity. Despite these constraints, our case studies demonstrate that the dataset remains suitable for analysing events as floods and heatwaves, benefiting from a comparatively high number of parcels relative to many existing studies that employ fewer than ten million particles, such as the dataset of Bakels et al. (2025), which uses six million particles.
Finally, practical considerations related to data volume and computational requirements may affect dataset usage. One year of the trajectory archive amounts to ∼ 1.95 TB of NetCDF data. Efficient analysis typically requires chunked, parallel workflows (e.g., using xarray and Dask) and access to high-performance computing or cloud-based resources. Event-scale analyses, such as those presented here, can be carried out using subsets of the data corresponding to the selected time period, substantially reducing storage and computational demands. Further discussion of methodological limitations, including aspects specific to HAMSTER v2, is provided in Appendix B.
ERA5 reanalysis data were obtained from the Copernicus Climate Data Store (CDS) and are publicly available at https://cds.climate.copernicus.eu/ (last access: 2 June 2026) (Hersbach et al., 2020). Flex_extract software (https://flexpart.img.univie.ac.at/flexextract/, last access: 13 May 2026) (Tipka et al., 2020) was used to retrieve these meteorological fields from the ECMWF. The FLEXPART model source code is openly available at https://www.flexpart.eu/ (last access: 13 May 2026) (Bakels et al., 2025).
The FLEXPART–ERA5 trajectory output used in this study covers 1979–2024 and amounts to approximately 1.95 TB yr−1. Due to its size, the full dataset is hosted at Globus (https://app.globus.org/file-manager?origin_id=269ce146-5835-4e3c-91d0-f37c9166c52a&origin_path=%2F, last access: 2 June 2026) and archived on Zenodo (https://doi.org/10.5281/zenodo.17952362, Deman et al., 2025). Each FLEXPART output file (partoutput_yyyymmddhhmmss.nc) contains trajectories for approximately 20 million air parcels, saved at 3-hourly intervals (00:00, 03:00, 06:00, 09:00, 12:00, 15:00, 18:00 and 21:00 UTC) to match the temporal resolution of the driving ERA5 fields. For every parcel and timestep, the dataset provides time, geographical position: latitude (lat; −90 to 90° north) and longitude (lon; −180 to 180° east), height above ground (z; m), and thermodynamic and dynamic properties including temperature (T; K), specific humidity (sh; kg kg−1), density (rho; kg m−3), and potential vorticity (pv; pvu). Gridded variables provided on the model latitude–longitude grid include mixing layer height (hmix; m above ground) and tropopause height (tro; m above ground). A static topography field (to; m above sea level) is also included. All output is stored in NetCDF format and organised into yearly folders to facilitate data access and parallel processing.
The source code for HAMSTER v2 is openly available at https://github.com/h-cel/HAMSTER-v2 (last access: 2 June 2026) and archived on Zenodo (https://doi.org/10.5281/zenodo.20181215, Insua-Costa et al., 2026). Aggregated monthly and annual diagnostic fields generated for this study, together with scripts to reproduce them, are available upon author request.
We present a global dataset of ∼ 20 million Lagrangian air-parcel trajectories driven by ERA5 reanalysis for the period 1979–2024, generated using FLEXPART v11. It provides a globally consistent archive of air-parcel trajectories sampled at 3-hourly resolution, including parcel position, height, and key thermodynamic and dynamic variables such as temperature, specific humidity, air density, and potential vorticity, together with gridded diagnostics of boundary-layer height, tropopause height, and surface topography. The dataset is designed to support analyses of large-scale atmospheric transport and associated land–atmosphere and ocean–atmosphere exchanges.
We employ the HAMSTER v2 post-processing framework to demonstrate how the dataset can be used. The usage examples show that the dataset captures coherent global moisture and heat pathways, and reproduces established continental recycling fractions. Seasonal and event-scale examples show the value of the dataset across different temporal and spatial scales to examine, e.g., circulation-driven variability, continental versus oceanic moisture supply, and the role of surface energy fluxes during extremes. While HAMSTER is used here, the trajectory dataset itself is fully tool-agnostic and can be analysed using alternative attribution or transport frameworks. By providing a unified dataset and an accessible tracking tool, both openly accessible and fully reproducible, this work lays the foundation for a wide range of future studies on atmospheric transport, hydrological connectivity, and land–atmosphere interactions.
We assess the framework through an internal-consistency evaluation, following a procedure previously used for water-vapour tracers (Insua-Costa and Miguez-Macho, 2018). As our sink masks cover the entire globe (Fig. 2), the sum of the contributions should amount to 100 %, meaning that when contributions are aggregated across all sinks, the total E2P should match the observed evaporation at every grid cell. The difference between these two fields represents the error of the method. The result is shown in Fig. A1a: our Lagrangian framework overestimates contributions over continents, the tropics, and high latitudes, while exhibiting a marked underestimation in subtropical oceanic regions. This pattern is consistent with previous studies reporting exaggerated local land contributions in WaterSip-based approaches (Li et al., 2024b) and lower remote ones in similar Lagrangian moisture attribution frameworks (Cloux et al., 2021), reflecting combined uncertainties in both the transport model and the attribution method. The latter is evident when considering that regions with negative values align with the subtropical semi-permanent high-pressure systems, where evaporation exceeds precipitation and moisture is exported to distant sinks, making them major remote source regions. In relative terms (Fig. A1b), these deviations are generally small except in areas of very low evaporation, such as northern Africa, highlighting the robustness of our approach. Nevertheless, because all sinks are explicitly represented in our analysis, we apply a final rescaling of the E2P fields to remove this residual error, ensuring that the summed E2P matches the observed evaporation and precipitation. This guarantees a very high level of internal consistency and further strengthens the reliability of the results presented in this study. Because the E2P rescaling requires information from both preceding and subsequent months, owing to the 30 d backtracking window, the earliest and latest years of the FLEXPART archive cannot be fully attributed. Consequently, despite trajectory availability from 1979 onward, the E2P analyses are limited to 1981–2023. In contrast to moisture, H2T represents instantaneous contributions along trajectories, which prevents a direct comparison with annual surface sensible heat fluxes.
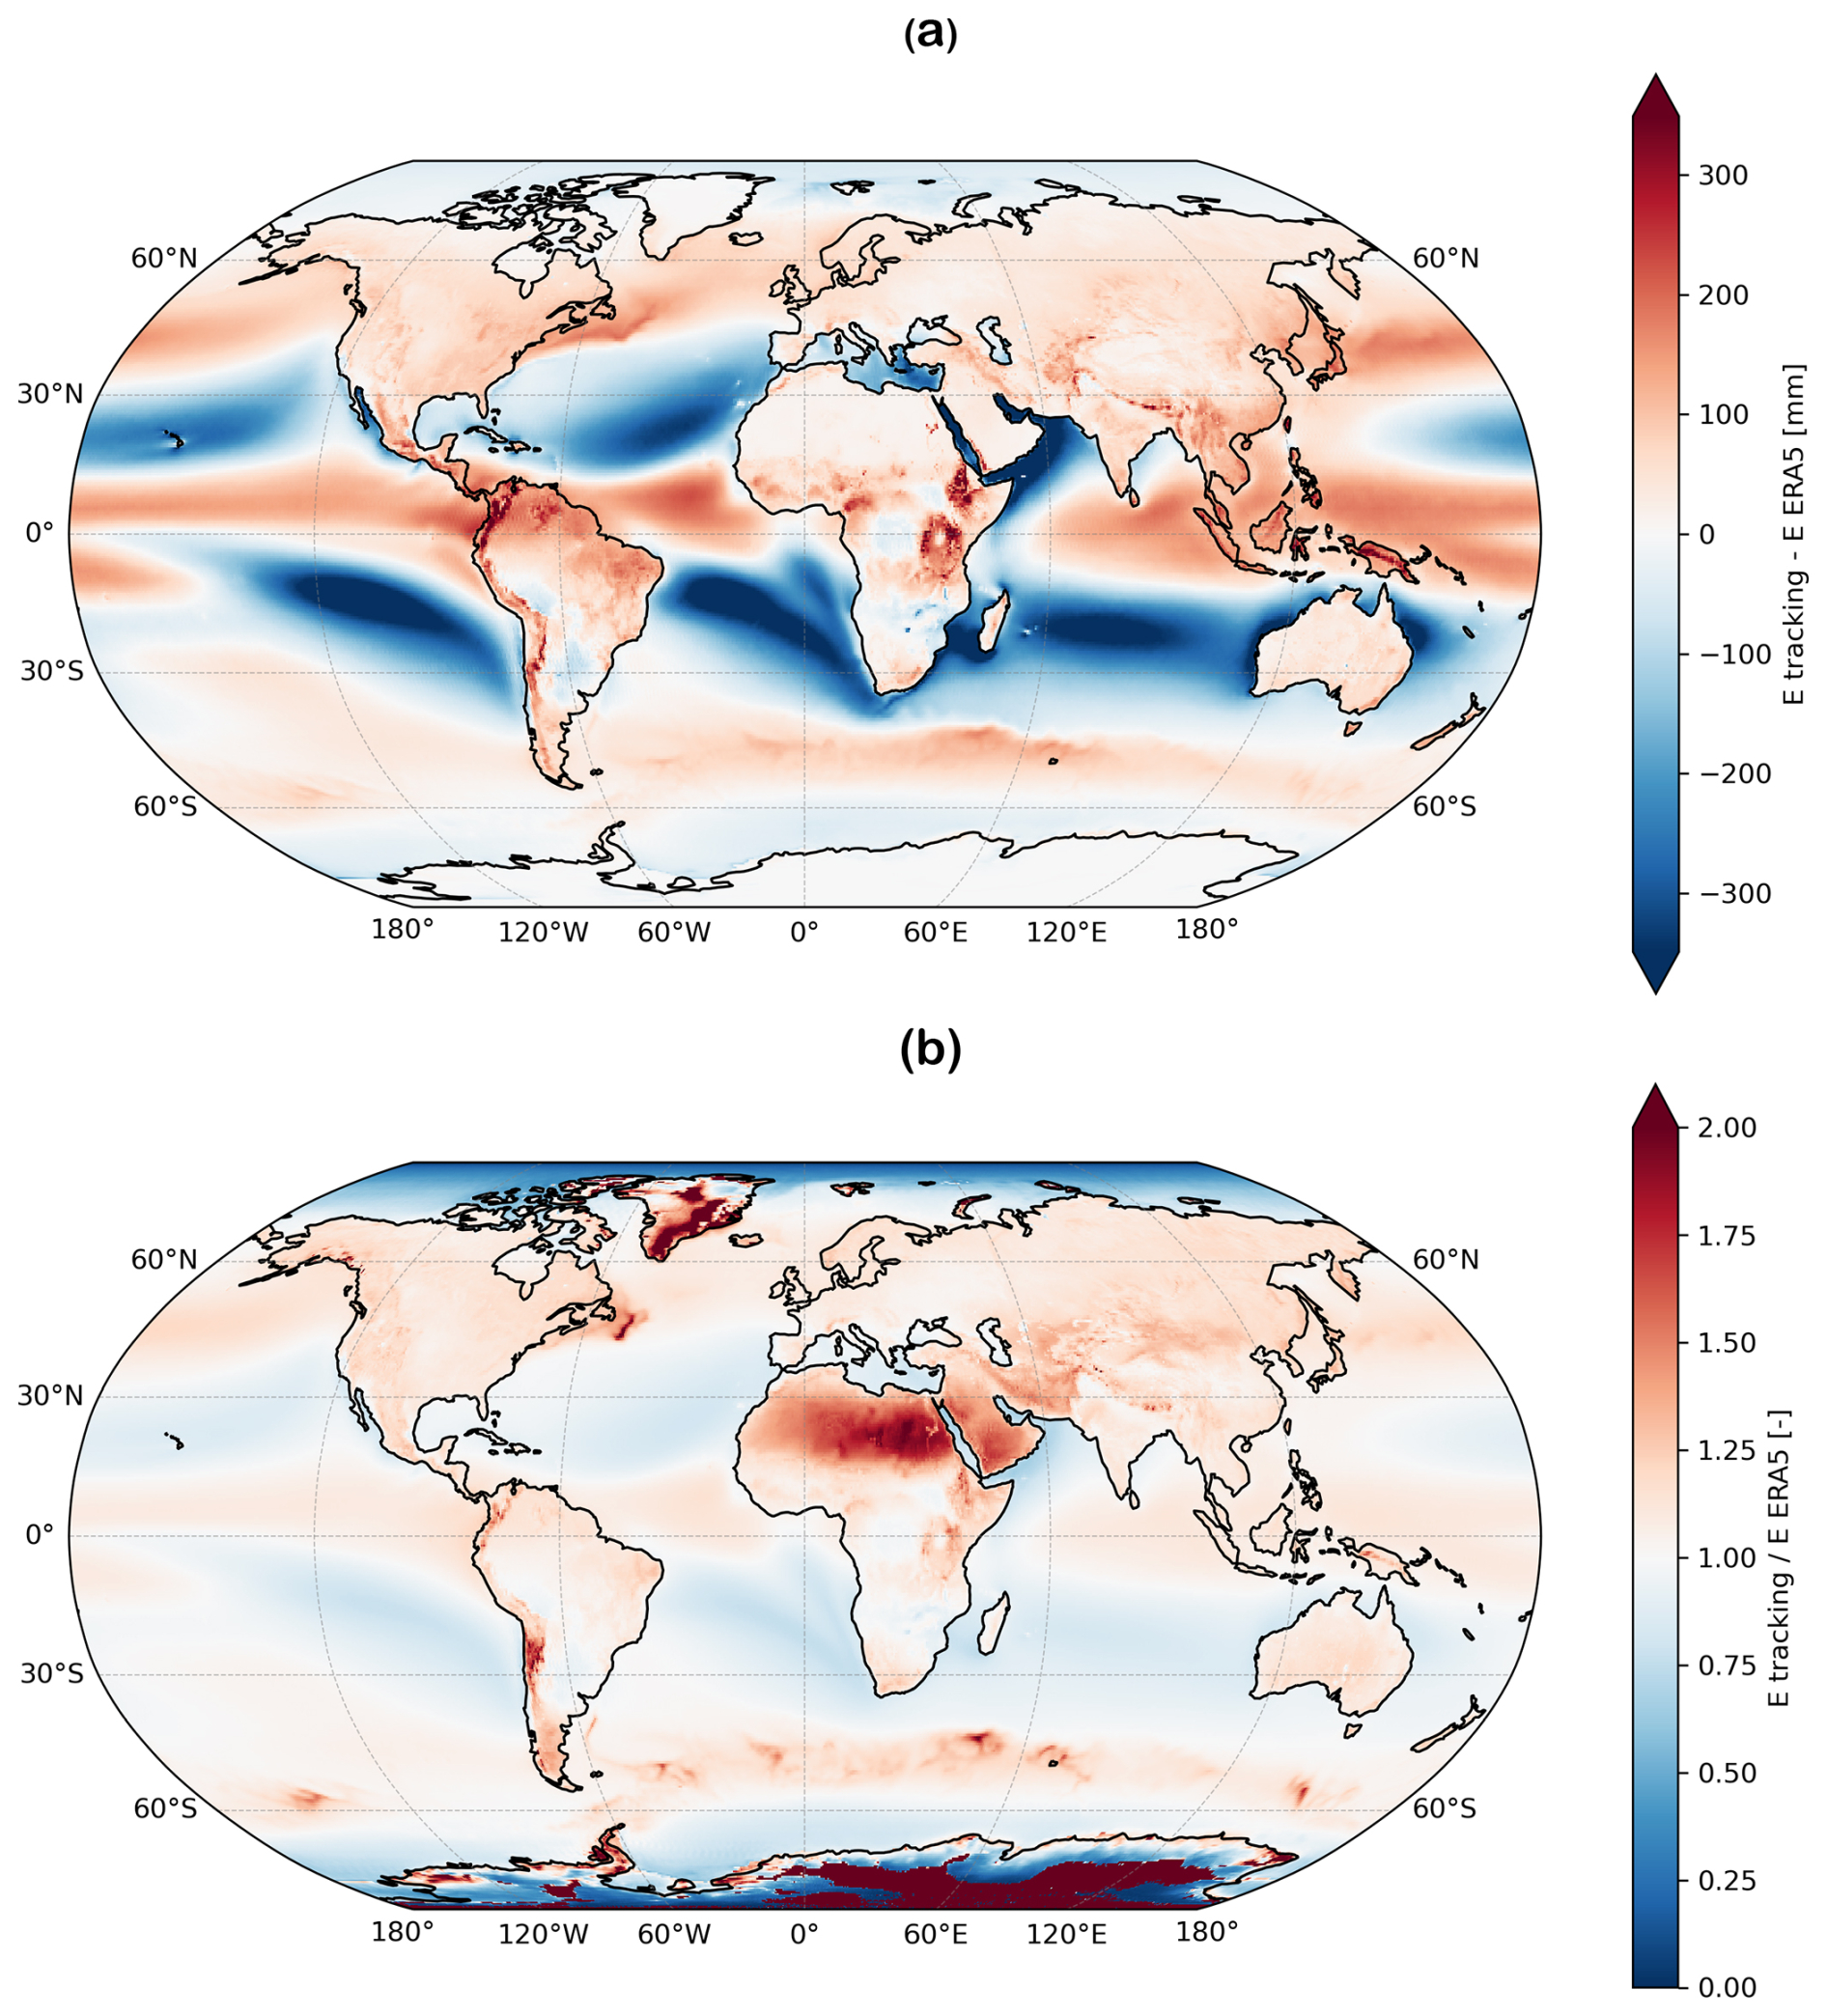
Figure A1Error in tracking method (a) yearly mean of total tracking evaporation minus ERA5 evaporation, and (b) yearly mean ratio of total tracking evaporation on ERA5 evaporation.
HAMSTER v2 incorporates several updates compared to previous versions. First, bias correction with surface fluxes is now applied directly to the changes in q and θ en route. As a result, no additional assumptions are required regarding the vertical extent of surface flux influences (e.g. restriction to the boundary layer) or precipitation occurrence based on relative humidity thresholds. For each time step, parcels are classified into two groups according to the sign of Δq: moisture uptake (Δq>0) and moisture loss (Δq<0). Those are accumulated on the grid to diagnose E and P fields from the trajectories. Parcel tendencies are then locally rescaled so that the gridded diagnosed E and P match the target fields at each location and time step (i.e., uptake scaled by and loss by ), with an analogous correction for H. This dynamic approach replaces the scheme in HAMSTER v1 (Keune et al., 2022), in which E2P fields were first scaled to be consistent with evaporation on a grid-cell basis, after which their total value was constrained to match the accumulated precipitation at the sink. Consequently, when only precipitation bias correction was applied, the procedure effectively reduces to a uniform scaling of the E2P field, enforcing consistency with precipitation constraints without altering the relative contributions of different source regions. Second, the code has been parallelized using MPI, substantially reducing computational cost and memory requirements. Additionally, HAMSTER v2 now directly processes NetCDF output from FLEXPART v11 and was restructured into two Python scripts (preprocessing.py and tracking.py), a utility library, and a flexible control file (namelist.input), improving performance and reproducibility. HAMSTER v2 is openly available (Sect. 5), enabling users to generate E2P, H2T, and other diagnostics for any region of interest starting from the dataset presented in this work.
Although internal moisture-tracking consistency is high for HAMSTER v2 (Fig. A1), a residual bias persists. This residual bias reflects the tendency of Lagrangian attribution to overestimate local contributions and underestimate remote sources, consistent with previous findings in WaterSip-based approaches (Cloux et al., 2021). A key reason is that negative changes in specific humidity along trajectories are commonly interpreted as precipitation losses, although they may also arise from processes such as the entrainment of dry air into the boundary layer. In such cases, remote moisture contributions can be artificially discounted too strongly, leading to a potential overestimation of nearby sources and an underestimation of distant ones (Cloux et al., 2021; Li et al., 2024b). The applied en route bias-correction procedure mitigates this effect by constraining parcel humidity tendencies to surface fluxes, unlike HAMSTER v1 (Keune et al., 2022), where the bias correction was applied only after attribution, while the longer backtracking period allows a larger fraction of long-range moisture transport to be captured. Together, these changes lead a more balanced representation of source–sink relationships, although the bias is not fully removed.
Furthermore, for sensible heat tracking, positive changes in potential temperature (Δθ) can be corrected using the observed surface sensible heat flux, but negative changes cannot be adjusted, so the bias correction remains incomplete compared with moisture. Finally, while the framework can track surface sensible heat, latent energy exchanges cannot yet be traced along parcel trajectories, limiting a full attribution of thermodynamic processes. This constraint also affects case-study interpretation: for the northeastern China heatwave, for instance, oceanic regions show negligible sensible heat contribution in our diagnostics, even though they likely influenced the event through latent heat release.
Methodologically, the study examples focused on backward tracking to quantify precipitation (E2P) and temperature origins (H2T). Complementary forward experiments, precipitation from evaporation (PFE) and temperature from surface sensible heat (TFH), would allow to assess the fate of surface fluxes and their downwind impacts (e.g., as in Link et al., 2020). Such forward analyses are also supported within the HAMSTER framework, enabling the diagnosis of upwind downwind impacts of surface fluxes. In addition, extending the H2T analysis beyond the single proof-of-concept year toward multi-decadal climatologies would enable the evaluation of variability and long-term trends in sensible heat contributions. More broadly, the Lagrangian framework can support investigations of evolving land–atmosphere feedbacks under climate change.
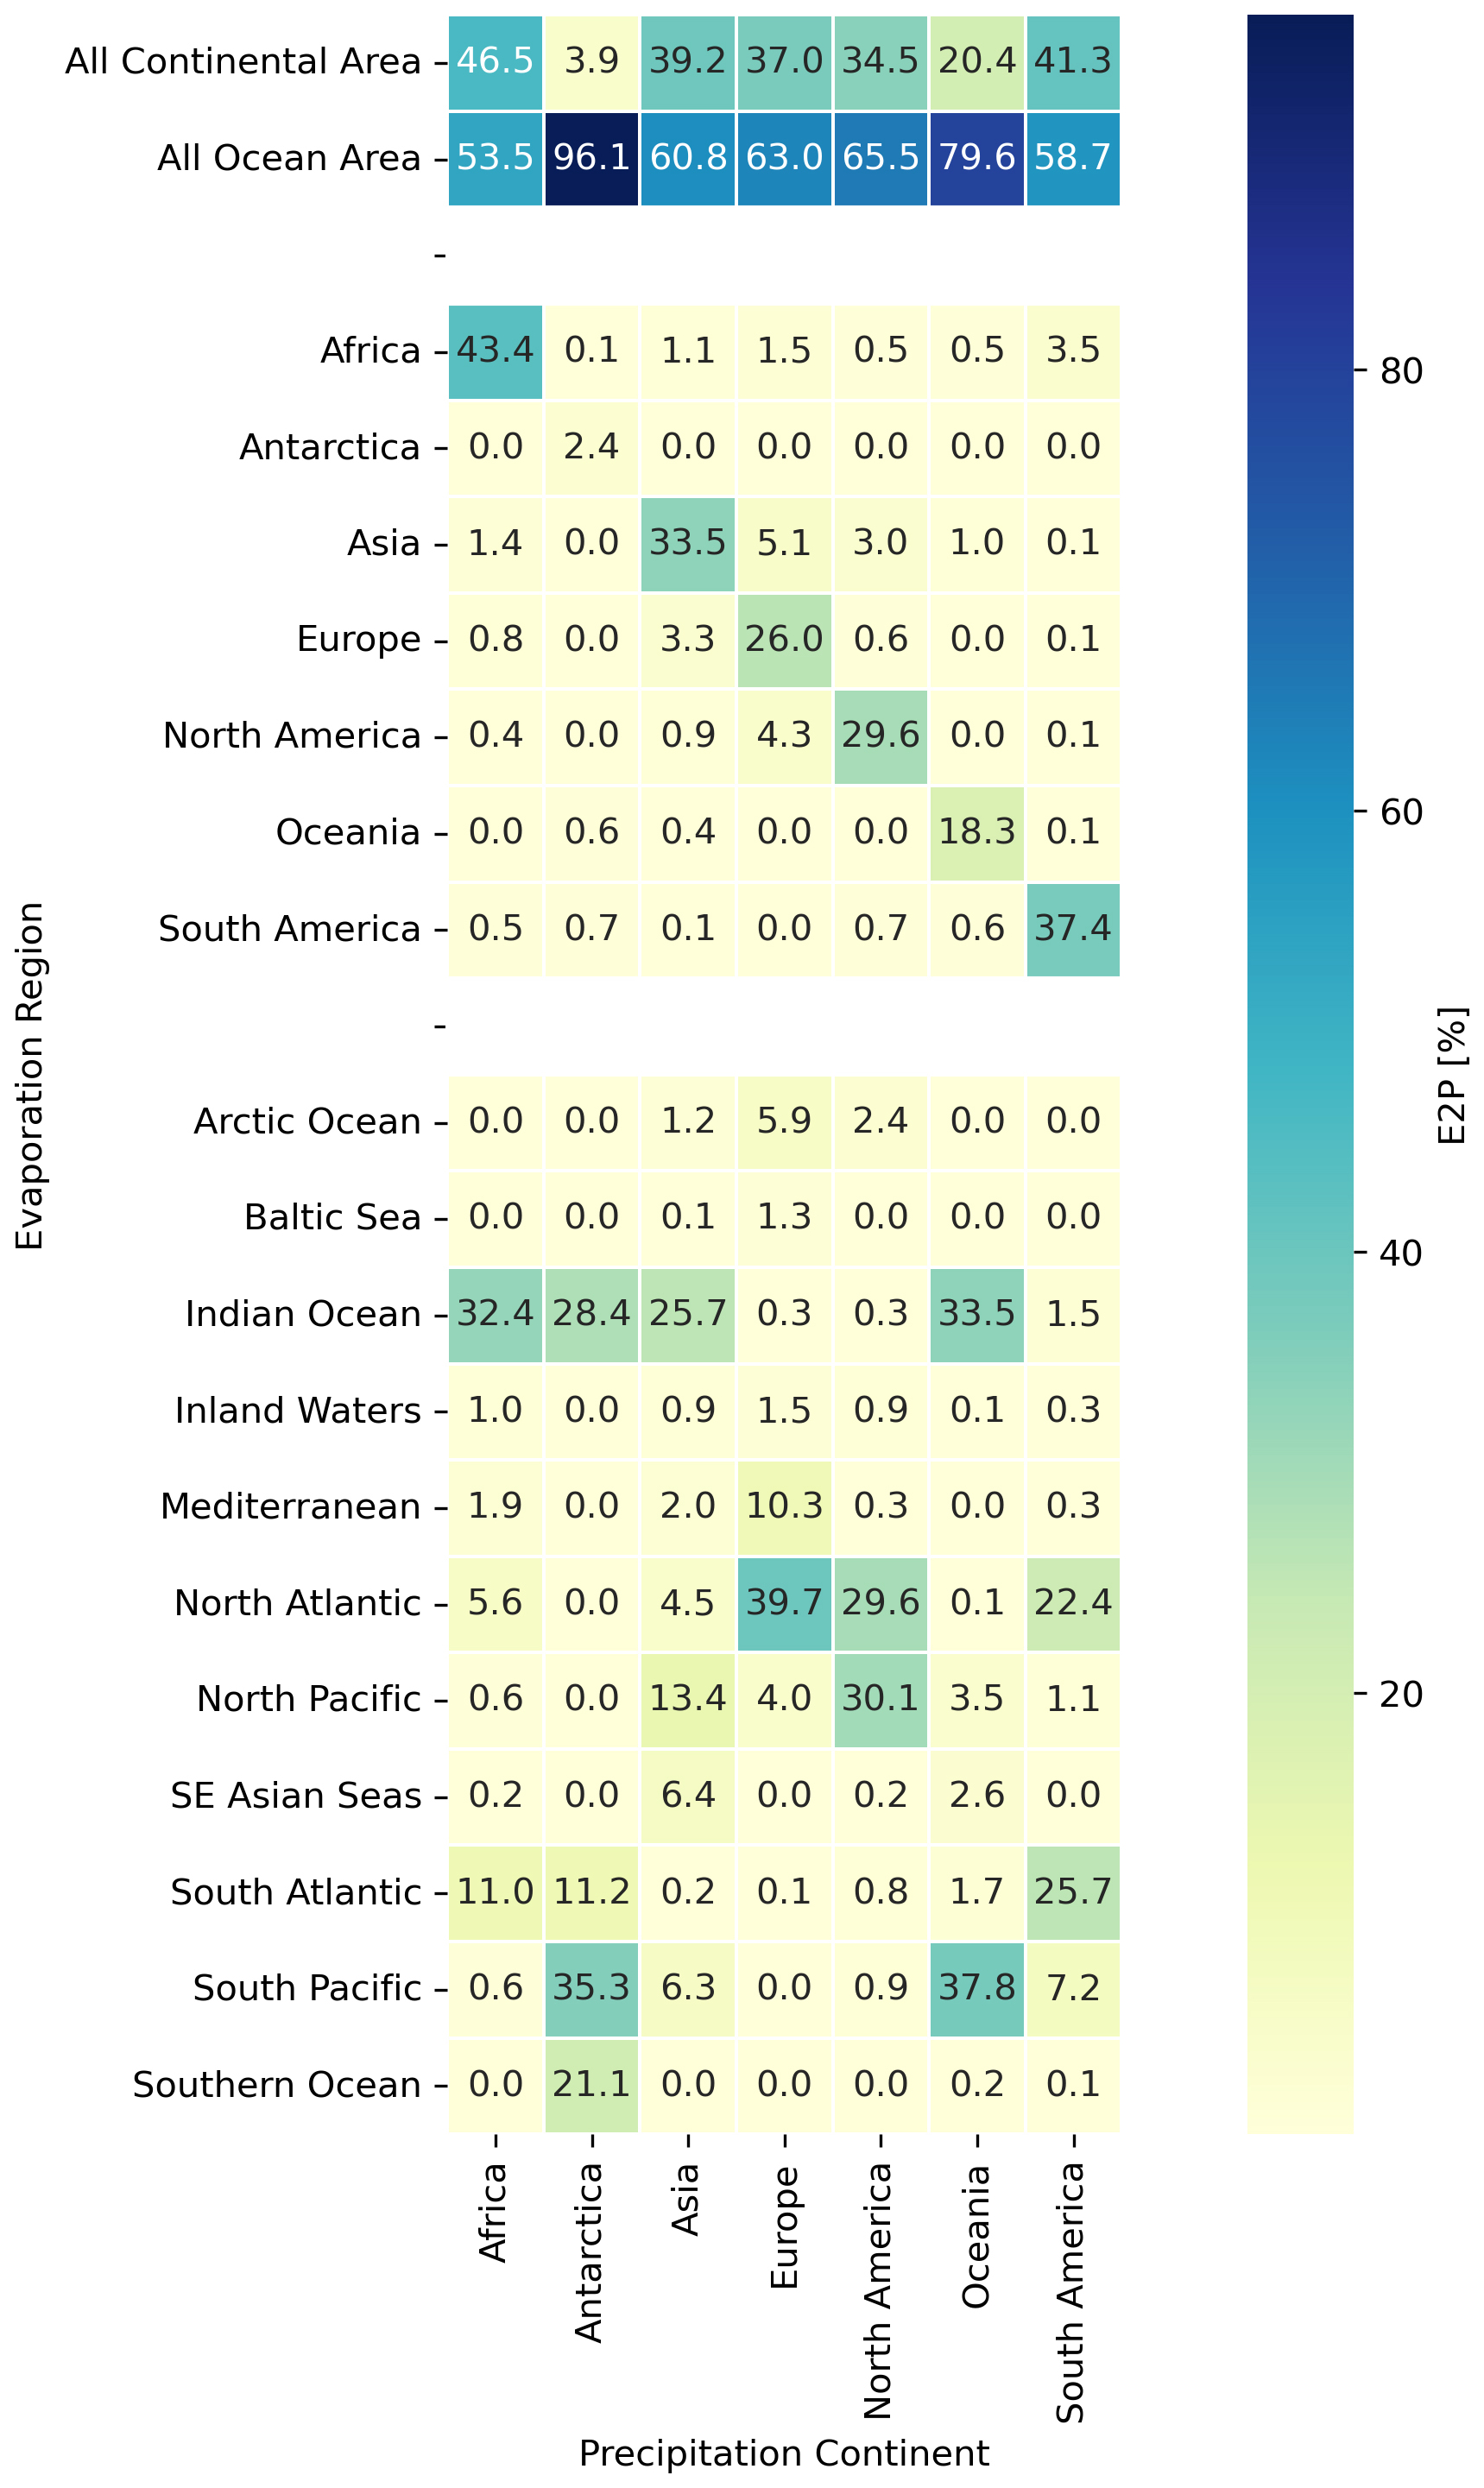
Figure C1Mean fractions of yearly evaporation contributions to continental precipitation (1981–2023).
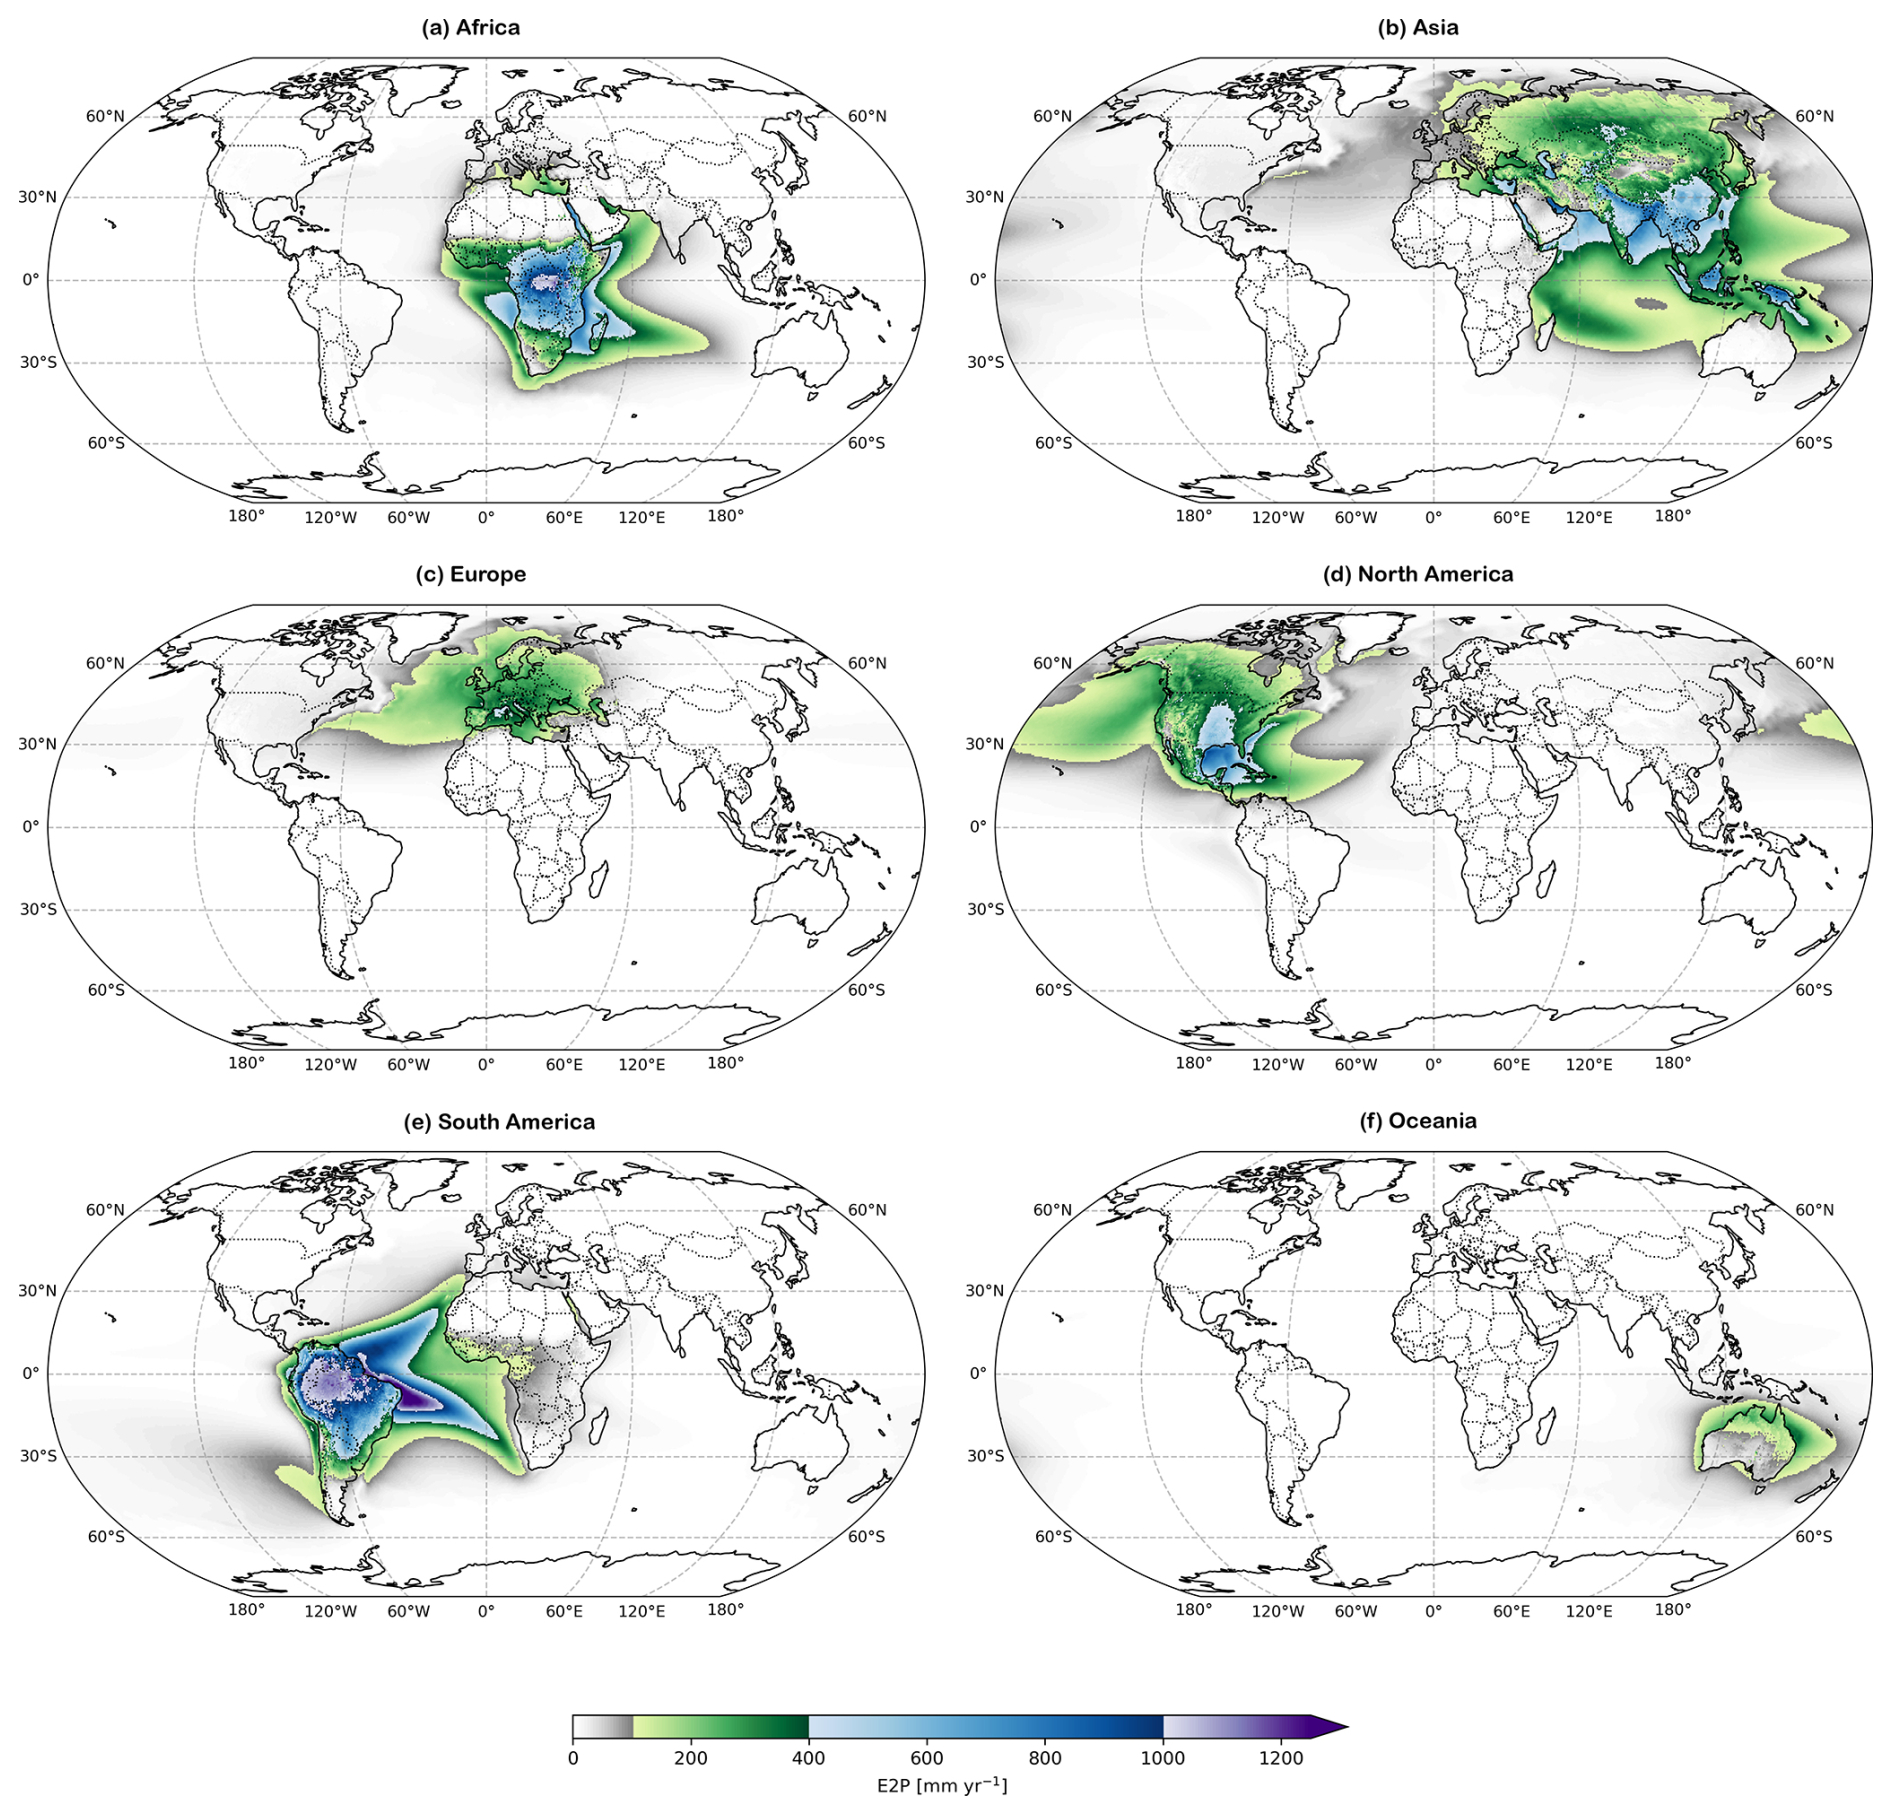
Figure C2Climatology of E2P over different continents (1981–2023): (a) Africa, (b) Asia, (c) Europe, (d) North America, (e) South America, (f) Oceania.
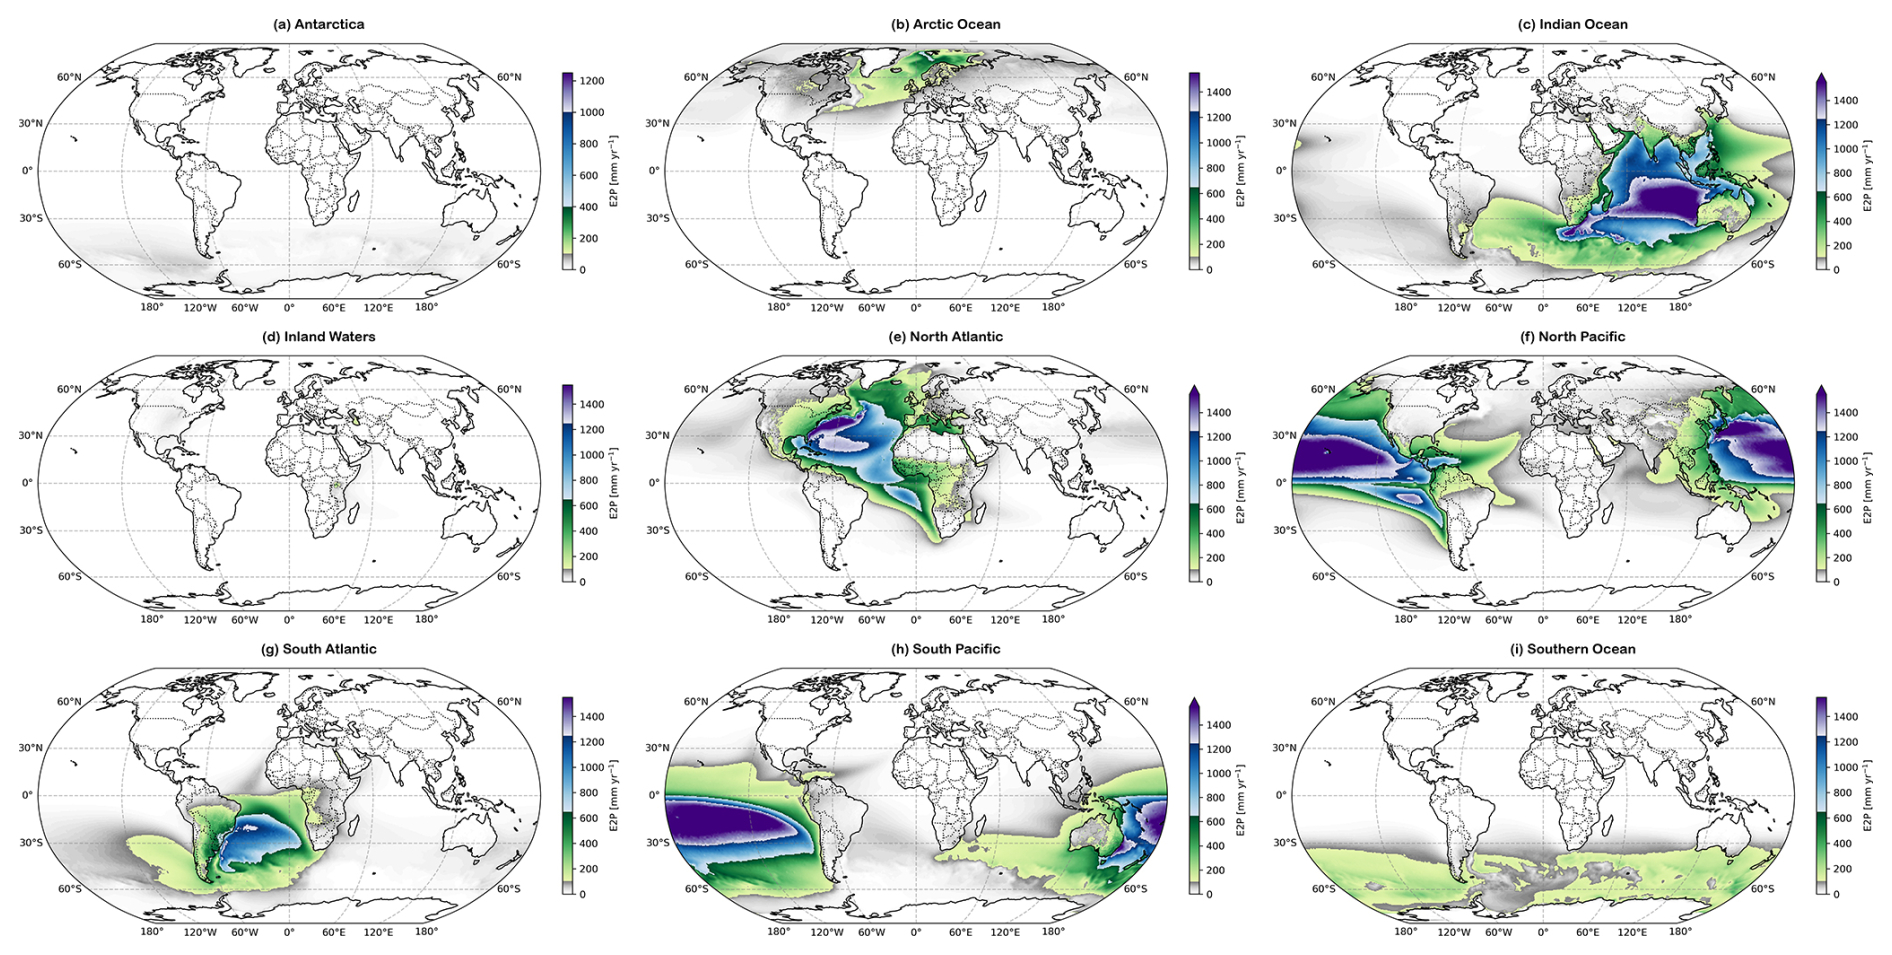
Figure C3Climatology of E2P over (a) Antarctica and (b–i) the different oceans (1981–2023).
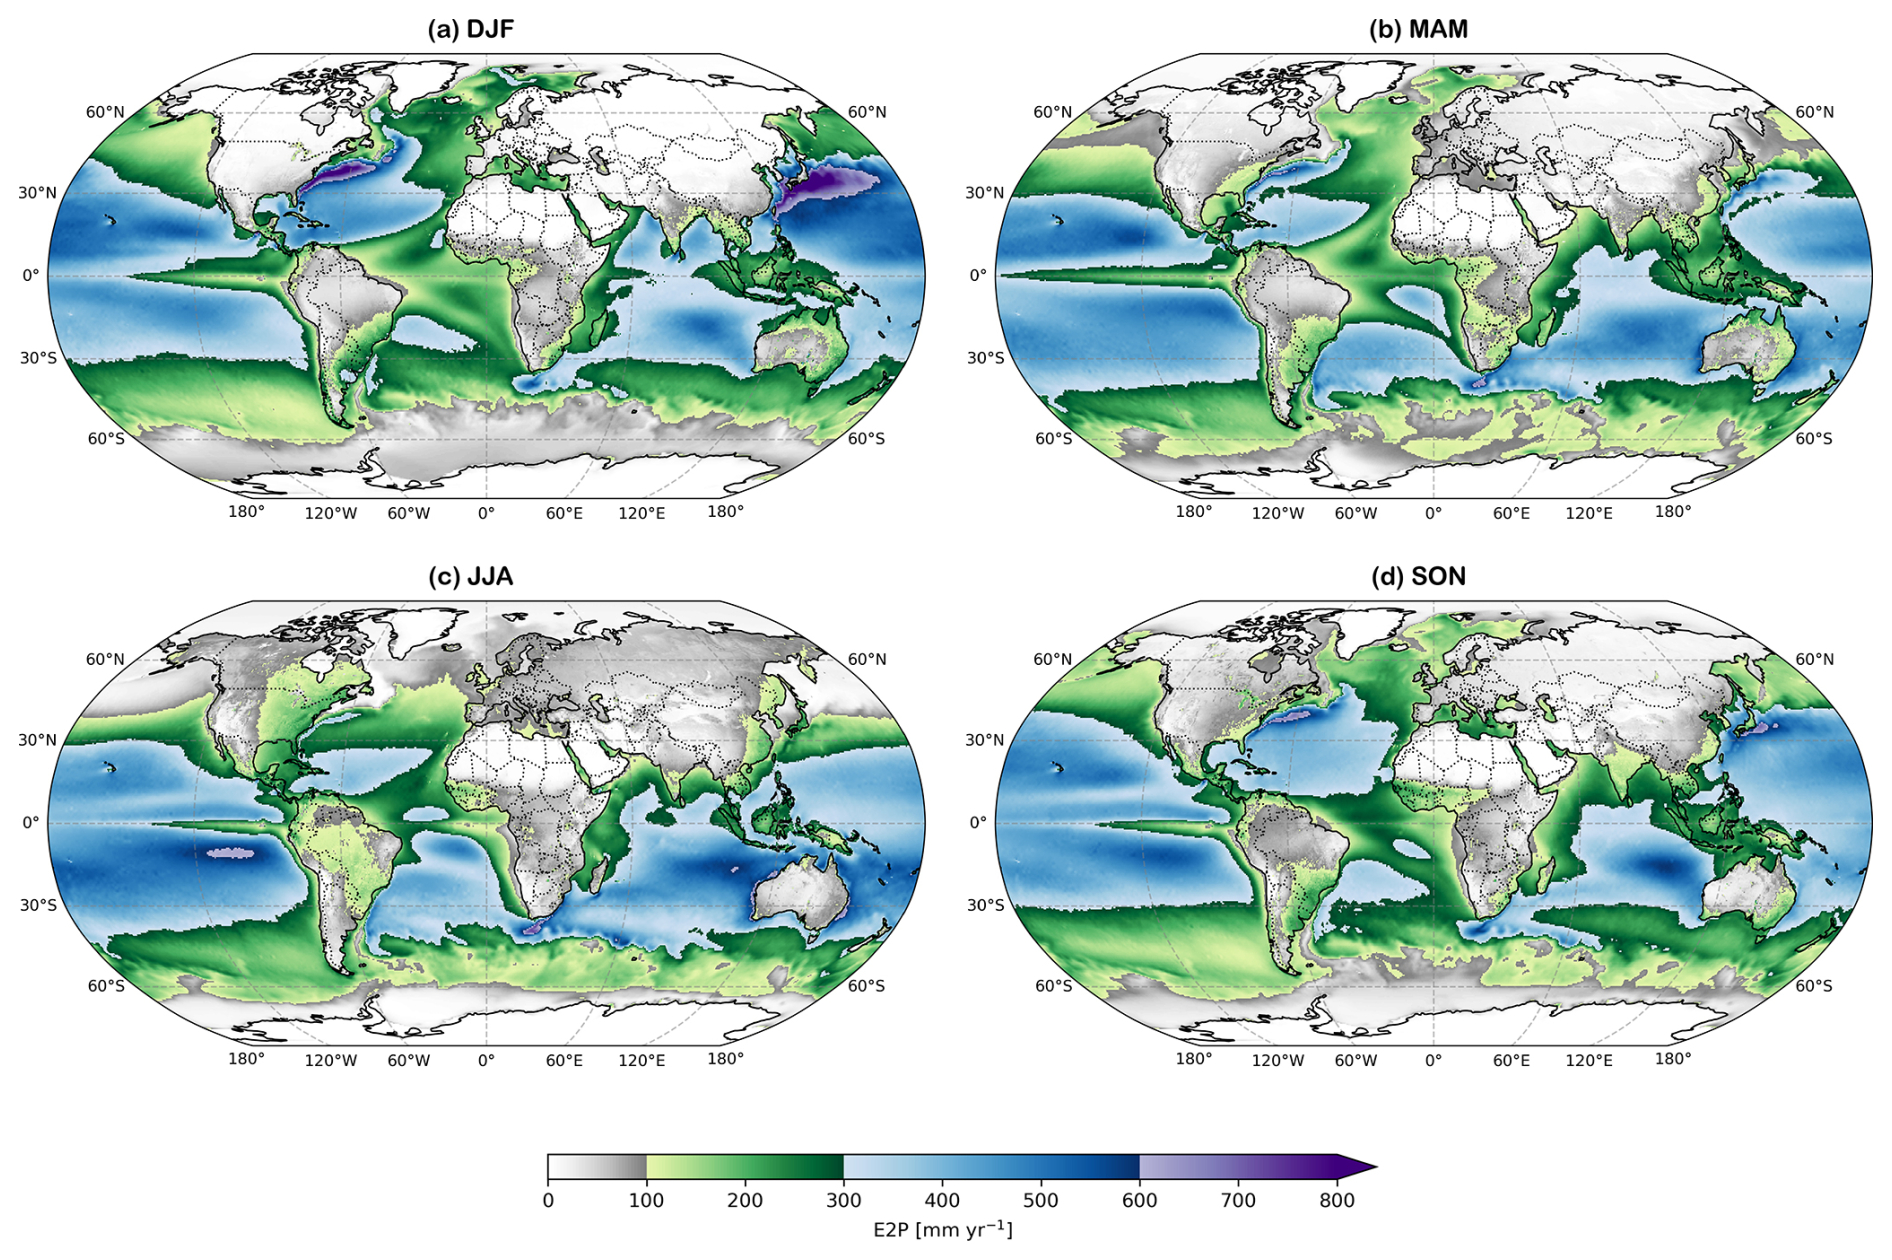
Figure C4Seasonal climatologies of evaporation yielding ocean precipitation (E2Po) over 1981–2023.
D.G.M., D.I.C and V.M.H.D. conceived the study. V.M.H.D. performed the FLEXPART simulations. V.M.H.D. and D.I.C. conducted the additional analysis. All authors contributed to the writing of the manuscript the interpretation of the results.
The contact author has declared that none of the authors has any competing interests.
Publisher's note: Copernicus Publications remains neutral with regard to jurisdictional claims made in the text, published maps, institutional affiliations, or any other geographical representation in this paper. The authors bear the ultimate responsibility for providing appropriate place names. Views expressed in the text are those of the authors and do not necessarily reflect the views of the publisher.
The computational resources and services used in this work were provided by the VSC (Flemish Supercomputer Center), funded by the FWO and the Flemish Government, Department of Economy, Science and Innovation (EWI). Diego G. Miralles. and Victoria M. H. Deman acknowledge support from the European Research Council (ERC) Consolidator grant HEAT (101088405). Damián Insua-Costa acknowledges funding from the Research Foundation–Flanders (FWO) (12A0Z26N). AI-assisted language tools were used to improve the clarity of the manuscript.
This research has been supported by the European Research Council, HORIZON EUROPE European Research Council (grant no. 101088405) and the Research Foundation–Flanders (grant no. 12A0Z26N).
This paper was edited by Tobias Gerken and reviewed by two anonymous referees.
Aemisegger, F., Pfahl, S., Sodemann, H., Lehner, I., Seneviratne, S. I., and Wernli, H.: Deuterium excess as a proxy for continental moisture recycling and plant transpiration, Atmos. Chem. Phys., 14, 4029–4054, https://doi.org/10.5194/acp-14-4029-2014, 2014. a
Arnault, J., Knoche, R., Wei, J., and Kunstmann, H.: Evaporation tagging and atmospheric water budget analysis with WRF: A regional precipitation recycling study for West Africa, Water Resour. Res., 52, 1544–1567, 2016. a
Bakels, L., Tatsii, D., Tipka, A., Thompson, R., Dütsch, M., Blaschek, M., Seibert, P., Baier, K., Bucci, S., Cassiani, M., Eckhardt, S., Groot Zwaaftink, C., Henne, S., Kaufmann, P., Lechner, V., Maurer, C., Mulder, M. D., Pisso, I., Plach, A., Subramanian, R., Vojta, M., and Stohl, A.: FLEXPART version 11: improved accuracy, efficiency, and flexibility, Geosci. Model Dev., 17, 7595–7627, https://doi.org/10.5194/gmd-17-7595-2024, 2024. a, b, c, d, e, f, g
Bakels, L., Blaschek, M., Dütsch, M., Plach, A., Lechner, V., Brack, G., Haimberger, L., and Stohl, A.: LARA: a Lagrangian Reanalysis based on ERA5 spanning from 1940 to 2023, Earth Syst. Sci. Data, 17, 4569–4585, https://doi.org/10.5194/essd-17-4569-2025, 2025. a, b, c, d, e
Barriopedro, D., García-Herrera, R., Ordónez, C., Miralles, D. G., and Salcedo-Sanz, S.: Heat waves: Physical understanding and scientific challenges, Rev. Geophys, 61, e2022RG000780, https://doi.org/10.1029/2022RG000780, 2023. a
Bieli, M., Pfahl, S., and Wernli, H.: A Lagrangian investigation of hot and cold temperature extremes in Europe, Q. J. Roy. Meteor. Soc., 141, 98–108, 2015. a, b
Brubaker, K. L., Entekhabi, D., and Eagleson, P.: Estimation of continental precipitation recycling, J. Climate, 6, 1077–1089, 1993. a, b
Budyko, M. I.: Climate and Life, Academic, New York, ISBN 0-12-139450 6, 1974. a
Budyko, M. I. and Drozdov, O. A.: Zakonomernosti vlagooborota v tmosphere (regularities of the hydrologic cycle in the atmosphere), Izv. Akad. Nauk SSSR Ser. Geogr., 4, 5–14, 1953. a
Burde, G. I., Zangvil, A., and Lamb, P. J.: Estimating the role of local evaporation in precipitation for a two-dimensional region, J. Climate, 9, 1328–1338, 1996. a
Cloux, S., Garaboa-Paz, D., Insua-Costa, D., Miguez-Macho, G., and Pérez-Muñuzuri, V.: Extreme precipitation events in the Mediterranean area: contrasting two different models for moisture source identification, Hydrol. Earth Syst. Sci., 25, 6465–6477, https://doi.org/10.5194/hess-25-6465-2021, 2021. a, b, c
Dansgaard, W.: The O18-abundance in fresh water, Geochim. Cosmochim. Ac., 6, 241–260, 1954. a
Dee, D. P., Uppala, S. M., Simmons, A. J., Berrisford, P., Poli, P., Kobayashi, S., Andrae, U., Balmaseda, M. A., Balsamo, G., Bauer, D. P., Bechtold, P., Beljaars, A. C. M., van de Berg, L., Bidlot, J., Bormann, N., Delsol, C., Dragani, R., Fuentes, M., Geer, A. J., Haimberger, L., Healy, S. B., Hersbach, H., Hólm, E. V., Isaksen, L., Kållberg, P., Köhler, M. Matricardi, M., McNally, A. P., Monge-Sanz, B. M., Morcrette, J.-J., Park, B.-K., Peubey, C., de Rosnay, P., Tavolato, C., Thépaut, J.-N., Vitart, F.: The ERA-Interim reanalysis: Configuration and performance of the data assimilation system, Q. J. Roy. Meteor. Soc., 137, 553–597, 2011. a
Deman, V. M. H., Insua-Costa, D., and Miralles, D. G.: FLEXPART v11 Global Trajectory Dataset (1979–2024), Zenodo [data set], https://doi.org/10.5281/zenodo.17952362, 2025. a, b
Dirmeyer, P. A. and Brubaker, K. L.: Contrasting evaporative moisture sources during the drought of 1988 and the flood of 1993, J. Geophys. Res.-Atmos., 104, 19383–19397, 1999. a
Dirmeyer, P. A. and Brubaker, K. L.: Characterization of the global hydrologic cycle from a back-trajectory analysis of atmospheric water vapor, J. Hydrometeorol., 8, 20–37, 2007. a
Dirmeyer, P. A., Brubaker, K. L., and DelSole, T.: Import and export of atmospheric water vapor between nations, J. Hydrol., 365, 11–22, 2009. a
Donat, M. G., Angélil, O., and Ukkola, A. M.: Intensification of precipitation extremes in the world's humid and water-limited regions, Environ. Res. Lett., 14, 065003, https://doi.org/10.1088/1748-9326/ab1c8e, 2019. a
Eltahir, E. A. B. and Bras, R. L.: Precipitation recycling in the Amazon basin, Q. J. Roy. Meteor. Soc., 120, 861–880, 1994. a
Eltahir, E. A. B. and Bras, R. L.: Precipitation recycling, Rev. Geophys., 34, 367–378, 1996. a, b, c, d
Findell, K. L., Keys, P. W., Van Der Ent, R. J., Lintner, B. R., Berg, A., and Krasting, J. P.: Rising temperatures increase importance of oceanic evaporation as a source for continental precipitation, J. Climate, 32, 7713–7726, 2019. a, b
Gimeno, L., Stohl, A., Trigo, R. M., Dominguez, F., Yoshimura, K., Yu, L., Drumond, A., Durán-Quesada, A. M., and Nieto, R.: Oceanic and terrestrial sources of continental precipitation, Rev. Geophys, 50, https://doi.org/10.1029/2012RG000389, 2012. a, b
Gimeno, L., Nieto, R., and Sorí, R.: The growing importance of oceanic moisture sources for continental precipitation, npj Clim. Atmos. Sci., 3, 27, https://doi.org/10.1038/s41612-020-00133-y, 2020a. a
Gimeno, L., Vázquez, M., Eiras-Barca, J., Sori, R., Stojanovic, M., Algarra, I., Nieto, R., Ramos, A. M., Duran-Quesada, A. M., and Dominguez, F.: Recent progress on the sources of continental precipitation as revealed by moisture transport analysis, Earth-Sci. Rev., 201, 103070, https://doi.org/10.1016/j.earscirev.2019.103070, 2020b. a, b, c, d
Goessling, H. F. and Reick, C. H.: What do moisture recycling estimates tell us? Exploring the extreme case of non-evaporating continents, Hydrol. Earth Syst. Sci., 15, 3217–3235, https://doi.org/10.5194/hess-15-3217-2011, 2011. a
Gui, K. and Zhou, T.: Soil moisture feedback amplified the earlier onset of the record-breaking three-day consecutive heatwave in 2023 in North China, Earths Future, 13, e2024EF005561, https://doi.org/10.1029/2024EF005561, 2025. a, b
Hersbach, H., Bell, B., Berrisford, P., Hirahara, S., Horányi, A., Muñoz-Sabater, J., Nicolas, J., Peubey, C., Radu, R., Schepers, D., Simmons, A., Soci, C., Abdalla, S., Abellan, X., Balsamo, G., Bechtold, P., Biavati, G., Bidlot, J., Bonavita, M., De Chiara, G., Dahlgren, P., Dee, D., Diamantakis, M., Dragani, R., Flemming, J., Forbes, R., Fuentes, M., Geer, A., Haimberger, L., Healy, S., Hogan, R. J., Hólm, E., Janisková, M., Keeley, S., Laloyaux, P., Lopez, P., Lupu, C., Radnoti, G., de Rosnay, P., Rozum, I., Vamborg, F., Villaume, S., and Thépaut, J.-N.: The ERA5 global reanalysis, Q. J. Roy. Meteor. Soc., 146, 1999–2049, 2020. a, b, c
Horton, R. M., Mankin, J. S., Lesk, C., Coffel, E., and Raymond, C.: A review of recent advances in research on extreme heat events, Current Climate Change Reports, 2, 242–259, 2016. a
Insua-Costa, D. and Miguez-Macho, G.: A new moisture tagging capability in the Weather Research and Forecasting model: formulation, validation and application to the 2014 Great Lake-effect snowstorm, Earth Syst. Dynam., 9, 167–185, https://doi.org/10.5194/esd-9-167-2018, 2018. a, b
Insua-Costa, D., Senande-Rivera, M., Llasat, M. C., and Miguez-Macho, G.: The central role of forests in the 2021 European floods, Environ. Res. Lett., 17, 064053, https://doi.org/10.1088/1748-9326/ac6f6b, 2022. a
Insua-Costa, D., Deman, V. M. H., and Miralles, D. G.: Heat And MoiSture Tracking framEwoRk version 2.0 (HAMSTER v2) (2.0.0), Zenodo [code], https://doi.org/10.5281/zenodo.20181215, 2026. a
IPCC: Chapter 8: Water Cycle Changes, in: Climate Change 2021: The Physical Science Basis. Contribution of Working Group I to the Sixth Assessment Report of the Intergovernmental Panel on Climate Change, edited by: Masson-Delmotte, V., Zhai, P., Pirani, A., Connors, S. L., Péan, C., Berger, S., Caud, N., Chen, Y., Goldfarb, L., Gomis, M. I., Huang, M., Leitzell, K., Lonnoy, E., Matthews, J. B. R., Maycock, T. K., Waterfield, T., Yelekçi, O., Yu, R., and Zhou, B., Cambridge University Press, Cambridge, United Kingdom and New York, NY, USA, 1055–1210, https://doi.org/10.1017/9781009157896.010, 2021. a
Jouzel, J., Delaygue, G., Landais, A., Masson-Delmotte, V., Risi, C., and Vimeux, F.: Water isotopes as tools to document oceanic sources of precipitation, Water Resour. Res., 49, 7469–7486, 2013. a
Kalverla, P., Benedict, I., Weijenborg, C., and van der Ent, R. J.: Atmospheric moisture tracking with WAM2layers v3, Geosci. Model Dev., 18, 4335–4352, https://doi.org/10.5194/gmd-18-4335-2025, 2025. a, b
Keune, J. and Miralles, D. G.: A precipitation recycling network to assess freshwater vulnerability: Challenging the watershed convention, Water Resour. Res., 55, 9947–9961, 2019. a, b, c
Keune, J., Schumacher, D. L., and Miralles, D. G.: A unified framework to estimate the origins of atmospheric moisture and heat using Lagrangian models, Geosci. Model Dev., 15, 1875–1898, https://doi.org/10.5194/gmd-15-1875-2022, 2022. a, b, c, d, e, f, g
Keys, P. W., van der Ent, R. J., Gordon, L. J., Hoff, H., Nikoli, R., and Savenije, H. H. G.: Analyzing precipitationsheds to understand the vulnerability of rainfall dependent regions, Biogeosciences, 9, 733–746, https://doi.org/10.5194/bg-9-733-2012, 2012. a
Knoche, H. R. and Kunstmann, H.: Tracking atmospheric water pathways by direct evaporation tagging: A case study for West Africa, J. Geophys. Res.-Atmos., 118, 12–345, 2013. a
Koppa, A., Keune, J., Schumacher, D. L., Michaelides, K., Singer, M., Seneviratne, S. I., and Miralles, D. G.: Dryland self-expansion enabled by land–atmosphere feedbacks, Science, 385, 967–972, 2024. a
Lettau, H., Lettau, K., and Molion, L. C. B.: Amazonia's hydrologic cycle and the role of atmospheric recycling in assessing deforestation effects, Mon. Weather Rev., 107, 227–238, 1979. a
Li, H., Keune, J., Gou, Q., Holgate, C. M., and Miralles, D.: Heat and moisture anomalies during crop failure events in the Southeastern Australian wheat belt, Earths Future, 12, e2023EF003901, https://doi.org/10.1029/2023EF003901, 2024a. a, b
Li, Y., Wang, C., Tang, Q., Yao, S., Sun, B., Peng, H., and Xiao, S.: Unraveling the discrepancies between Eulerian and Lagrangian moisture tracking models in monsoon- and westerly-dominated basins of the Tibetan Plateau, Atmos. Chem. Phys., 24, 10741–10758, https://doi.org/10.5194/acp-24-10741-2024, 2024b. a, b
Link, A., van der Ent, R., Berger, M., Eisner, S., and Finkbeiner, M.: The fate of land evaporation – a global dataset, Earth Syst. Sci. Data, 12, 1897–1912, https://doi.org/10.5194/essd-12-1897-2020, 2020. a
McVicar, T. R., Roderick, M. L., Donohue, R. J., Li, L. T., Van Niel, T. G., Thomas, A., Grieser, J., Jhajharia, D., Himri, Y., Mahowald, N. M., Mescherskaya, A. V., Kruger, A. C., Rehman, S., and Dinpashoh, Y.: Global review and synthesis of trends in observed terrestrial near-surface wind speeds: Implications for evaporation, J. Hydrol., 416, 182–205, 2012. a
Miltenberger, A. K., Pfahl, S., and Wernli, H.: An online trajectory module (version 1.0) for the nonhydrostatic numerical weather prediction model COSMO, Geosci. Model Dev., 6, 1989–2004, https://doi.org/10.5194/gmd-6-1989-2013, 2013. a
Miralles, D. G., Teuling, A. J., Van Heerwaarden, C. C., and Vilà-Guerau de Arellano, J.: Mega-heatwave temperatures due to combined soil desiccation and atmospheric heat accumulation, Nat. Geosci., 7, 345–349, 2014. a
Miralles, D. G., Gentine, P., Seneviratne, S. I., and Teuling, A. J.: Land–atmospheric feedbacks during droughts and heatwaves: state of the science and current challenges, Ann. N. Y. Acad. Sci., 1436, 19–35, 2019. a
Mohr, S., Ehret, U., Kunz, M., Ludwig, P., Caldas-Alvarez, A., Daniell, J. E., Ehmele, F., Feldmann, H., Franca, M. J., Gattke, C., Hundhausen, M., Knippertz, P., Küpfer, K., Mühr, B., Pinto, J. G., Quinting, J., Schäfer, A. M., Scheibel, M., Seidel, F., and Wisotzky, C.: A multi-disciplinary analysis of the exceptional flood event of July 2021 in central Europe – Part 1: Event description and analysis, Nat. Hazards Earth Syst. Sci., 23, 525–551, https://doi.org/10.5194/nhess-23-525-2023, 2023. a, b, c
Mu, Y., Evans, J. P., Taschetto, A. S., and Holgate, C.: Refining the Lagrangian approach for moisture source identification through sensitivity testing of assumptions using BTrIMS1.1, Geosci. Model Dev., 19, 1367–1385, https://doi.org/10.5194/gmd-19-1367-2026, 2026. a
Papritz, L., Aemisegger, F., and Wernli, H.: Sources and transport pathways of precipitating waters in cold-season deep North Atlantic cyclones, J. Atmos. Sci., 78, 3349–3368, 2021. a
Pérez-Alarcón, A., Coll-Hidalgo, P., Fernández-Alvarez, J. C., Trigo, R. M., Nieto, R., and Gimeno, L.: Impacts of tropical cyclones on the global water budget, npj Clim. Atmos. Sci., 6, 212, https://doi.org/10.1038/s41612-023-00546-5, 2023. a
Pérez-Alarcón, A., Fernández-Alvarez, J. C., Nieto, R., and Gimeno, L.: LATTIN: A Python-based tool for Lagrangian atmospheric moisture and heat tracking, Software Impacts, 20, 100638, https://doi.org/10.1016/j.simpa.2024.100638, 2024. a
Pérez-Alarcón, A., Vázquez, M., Trigo, R. M., Nieto, R., and Gimeno, L.: Towards an understanding of uncertainties in the Lagrangian analysis of moisture sources for tropical cyclone precipitation through a study case, Atmos. Res., 314, 107822, https://doi.org/10.1016/j.atmosres.2024.107822, 2025. a
Pisso, I., Sollum, E., Grythe, H., Kristiansen, N. I., Cassiani, M., Eckhardt, S., Arnold, D., Morton, D., Thompson, R. L., Groot Zwaaftink, C. D., Evangeliou, N., Sodemann, H., Haimberger, L., Henne, S., Brunner, D., Burkhart, J. F., Fouilloux, A., Brioude, J., Philipp, A., Seibert, P., and Stohl, A.: The Lagrangian particle dispersion model FLEXPART version 10.4, Geosci. Model Dev., 12, 4955–4997, https://doi.org/10.5194/gmd-12-4955-2019, 2019. a
Quinting, J. F. and Reeder, M. J.: Southeastern Australian heat waves from a trajectory viewpoint, Mon. Weather Rev., 145, 4109–4125, 2017. a
Röthlisberger, M. and Papritz, L.: Quantifying the physical processes leading to atmospheric hot extremes at a global scale, Nat. Geosci., 16, 210–216, 2023. a
Savenije, H. H. G.: New definitions for moisture recycling and the relationship with land-use changes in the Sahel, J. Hydrol., 167, 57–78, 1995. a
Schär, C., Lüthi, D., Beyerle, U., and Heise, E.: The soil–precipitation feedback: A process study with a regional climate model, J. Climate, 12, 722–741, 1999. a
Schumacher, D. L., Keune, J., Van Heerwaarden, C. C., Vilà-Guerau de Arellano, J., Teuling, A. J., and Miralles, D. G.: Amplification of mega-heatwaves through heat torrents fuelled by upwind drought, Nat. Geosci., 12, 712–717, 2019. a, b, c
Schumacher, D. L., Keune, J., Dirmeyer, P., and Miralles, D. G.: Drought self-propagation in drylands due to land–atmosphere feedbacks, Nat. Geosci., 15, 262–268, 2022. a, b
Shao, S., Zeng, X.-M., Wang, N., Ullah, I., and Lv, H.: Attribution of moisture sources for summer precipitation in the upstream catchment of the Three Gorges dam, J. Hydrometeorol., 25, 353–369, 2024. a
Soci, C., Hersbach, H., Simmons, A., Poli, P., Bell, B., Berrisford, P., Horányi, A., Muñoz-Sabater, J., Nicolas, J., Radu, R., Schepers, D., Villaume, S., Haimberger, L., Woollen, J., Buontempo, C., and Thépaut, J.-N.: The ERA5 global reanalysis from 1940 to 2022, Q. J. Roy. Meteor. Soc., 150, 4014–4048, 2024. a
Sodemann, H., Schwierz, C., and Wernli, H.: Interannual variability of Greenland winter precipitation sources: Lagrangian moisture diagnostic and North Atlantic Oscillation influence, J. Geophys. Res.-Atmos., 113, https://doi.org/10.1029/2007JD008503, 2008. a, b
Sodemann, H., Wernli, H., and Schwierz, C.: Sources of water vapour contributing to the Elbe flood in August 2002—A tagging study in a mesoscale model, Q. J. Roy. Meteor. Soc., 135, 205–223, 2009. a
Staal, A. and Koren, G.: Comment on ‘The central role of forests in the 2021 European floods’, Environ. Res. Lett., 18, 048002, https://doi.org/10.1088/1748-9326/acc260, 2023. a
Staal, A., Meijer, P., Nyasulu, M. K., Tuinenburg, O. A., and Dekker, S. C.: Global terrestrial moisture recycling in Shared Socioeconomic Pathways, Earth Syst. Dynam., 16, 215–238, https://doi.org/10.5194/esd-16-215-2025, 2025. a
Stein, A. F., Draxler, R. R., Rolph, G. D., Stunder, B. J. B., Cohen, M. D., and Ngan, F.: NOAA's HYSPLIT atmospheric transport and dispersion modeling system, B. Am. Meteorol. Soc., 96, 2059–2077, 2015. a
Stohl, A. and James, P.: A Lagrangian analysis of the atmospheric branch of the global water cycle. Part I: Method description, validation, and demonstration for the August 2002 flooding in central Europe, J. Hydrometeorol., 5, 656–678, 2004. a, b, c, d
Stohl, A. and James, P.: A Lagrangian analysis of the atmospheric branch of the global water cycle. Part II: Moisture transports between Earth’s ocean basins and river catchments, J. Hydrometeorol., 6, 961–984, 2005. a, b, c
te Wierik, S. A., Cammeraat, E. L., Gupta, J., and Artzy-Randrup, Y. A.: Reviewing the impact of land use and land-use change on moisture recycling and precipitation patterns, Water Resour. Res., 57, e2020WR029234, https://doi.org/10.1029/2020WR029234, 2021. a
Tipka, A., Haimberger, L., and Seibert, P.: Flex_extract v7.1.2 – a software package to retrieve and prepare ECMWF data for use in FLEXPART, Geosci. Model Dev., 13, 5277–5310, https://doi.org/10.5194/gmd-13-5277-2020, 2020. a, b, c
Trenberth, K. E. and Shea, D. J.: Relationships between precipitation and surface temperature, Geophys. Res. Lett., 32, https://doi.org/10.1029/2005GL022760, 2005. a, b
Tuinenburg, O. A. and Staal, A.: Tracking the global flows of atmospheric moisture and associated uncertainties, Hydrol. Earth Syst. Sci., 24, 2419–2435, https://doi.org/10.5194/hess-24-2419-2020, 2020. a, b
UNEP: World Atlas of Desertification, Edward Arnold, London, ISBN 0340691662, 1997. a
Uppala, S. M., Kållberg, P. W., Simmons, A. J., Andrae, U., Da Costa Bechtold, V., Fiorino, M., Gibson, J. K., Haseler, J., Hernandez, A., Kelly, G. A., Li, X., Onogi, K., Saarinen, S., Sokka, N., Allan, R. P., Andersson, E., Arpe, K., Balmaseda, M. A., Beljaars, A. C. M., Van De Berg, L., Bidlot, J., Bormann, N., Caires, S., Chevallier, F., Dethof, A., Dragosavac, M., Fisher, M., Fuentes, M., Hagemann, S., Hólm, E., Hoskins, B. J., Isaksen, L., Janssen, P. A. E. M., Jenne, R., McNally, A. P., Mahfouf, J.-F., Morcrette, J.-J., Rayner, N. A., Saunders, R. W., Simon, P., Sterl, A., Trenberth, K. E., Untch, A., Vasiljevic, D., Viterbo, P., and Woollen, J.: The ERA-40 re-analysis, Q. J. Roy. Meteor. Soc., 131, 2961–3012, 2005. a
van der Ent, R. J. and Savenije, H. H. G.: Length and time scales of atmospheric moisture recycling, Atmos. Chem. Phys., 11, 1853–1863, https://doi.org/10.5194/acp-11-1853-2011, 2011. a
van der Ent, R. J. and Savenije, H. H. G.: Oceanic sources of continental precipitation and the correlation with sea surface temperature, Water Resour. Res., 49, 3993–4004, 2013. a, b, c, d
van der Ent, R. J. and Tuinenburg, O. A.: The residence time of water in the atmosphere revisited, Hydrol. Earth Syst. Sci., 21, 779–790, https://doi.org/10.5194/hess-21-779-2017, 2017. a, b
van der Ent, R. J., Savenije, H. H. G., Schaefli, B., and Steele-Dunne, S. C.: Origin and fate of atmospheric moisture over continents, Water Resour. Res., 46, https://doi.org/10.1029/2010WR009127, 2010. a, b, c, d
van der Ent, R. J., Wang-Erlandsson, L., Keys, P. W., and Savenije, H. H. G.: Contrasting roles of interception and transpiration in the hydrological cycle – Part 2: Moisture recycling, Earth Syst. Dynam., 5, 471–489, https://doi.org/10.5194/esd-5-471-2014, 2014. a
Vázquez, M., Algarra, I., Eiras-Barca, J., Ramos, A. M., Nieto, R., and Gimeno, L.: Atmospheric rivers over the Arctic: Lagrangian characterisation of their moisture sources, Water, 11, 41, https://doi.org/10.3390/w11010041, 2018. a
Vázquez, M., Alvarez-Socorro, G., Fernández-Alvarez, J. C., Nieto, R., and Gimeno, L.: Global FLEXPART–ERA5 simulations using 30 million atmospheric parcels since 1980, Zenodo [data set], https://doi.org/10.5281/zenodo.13682647, 2024. a, b
Wang, Q., Liao, Z., Zhai, P., and Peng, Y.: Record-breaking heatwave in North China during the midsummer of 2023, Int. J. Climatol., 44, 4206–4218, 2024. a, b, c, d, e, f
Wang, Y., Liu, X., Zhang, D., and Bai, P.: Tracking moisture sources of precipitation over China, J. Geophys. Res.-Atmos., 128, e2023JD039106, https://doi.org/10.1029/2023JD039106, 2023. a
Wernli, H. and Davies, H. C.: A Lagrangian-based analysis of extratropical cyclones. I: The method and some applications, Q. J. Roy. Meteor. Soc., 123, 467–489, 1997. a
Winschall, A., Pfahl, S., Sodemann, H., and Wernli, H.: Comparison of Eulerian and Lagrangian moisture source diagnostics – the flood event in eastern Europe in May 2010, Atmos. Chem. Phys., 14, 6605–6619, https://doi.org/10.5194/acp-14-6605-2014, 2014. a
Zhang, C., Tang, Q., Zhao, Y., Chen, D., Huang, J., Liu, Y., and Zhang, X.: Moisture source differences between the 2020 and 1998 super Meiyu-flood events in the Yangtze River Valley, Weather and Climate Extremes, 43, 100644, https://doi.org/10.1016/j.wace.2024.100644, 2024. a
Zhang, X., Wu, H., Wang-Erlandsson, L., Liu, Z., Jiang, H., Wang, Z., Jiang, L., Zhu, Y., Jiang, Y., Yao, Z., and Li, Z.: Significant shifts in continental precipitation sources in the 21st century, Water Resour. Res., 61, e2025WR040157, https://doi.org/10.1029/2025WR040157, 2025. a
Zschenderlein, P., Fink, A. H., Pfahl, S., and Wernli, H.: Processes determining heat waves across different European climates, Q. J. Roy. Meteor. Soc., 145, 2973–2989, 2019. a
- Abstract
- Introduction
- Methods
- Dataset usage
- Dataset limitations
- Code and data availability
- Conclusions
- Appendix A: FLEXPART-HAMSTER framework evaluation
- Appendix B: HAMSTER v2 updates and limitations
- Appendix C: Extra E2P climatology figures
- Author contributions
- Competing interests
- Disclaimer
- Acknowledgements
- Financial support
- Review statement
- References
- Abstract
- Introduction
- Methods
- Dataset usage
- Dataset limitations
- Code and data availability
- Conclusions
- Appendix A: FLEXPART-HAMSTER framework evaluation
- Appendix B: HAMSTER v2 updates and limitations
- Appendix C: Extra E2P climatology figures
- Author contributions
- Competing interests
- Disclaimer
- Acknowledgements
- Financial support
- Review statement
- References