the Creative Commons Attribution 4.0 License.
the Creative Commons Attribution 4.0 License.
 | 02 Jul 2026
HDM-Plot: a plot dataset of plant communities across three-dimensional zonal vegetation in the Hengduan Mountains and adjacent regions, southwestern China
Yili Jin
Liuyiyi Yang
Xiaofei Hu
Chen Yang
Haojun Xia
Ying Hou
Kai Wu
Shaolin Shi
Xingxing Mao
The Hengduan Mountains (HDM) constitute one of the world's richest biodiversity regions and are designated as a top-tier priority for ecological conservation. Vegetation investigation can help with the design and implementation of biodiversity conservation in this region. Here we present the HDM-Plot, a plot-based vegetation dataset compiled from 314 plots surveyed during four campaigns between 2022 and 2024 across the Hengduan Mountains and adjacent regions, across major vegetation types from lowland dry-hot valleys to alpine areas spanning altitudes of 754–4932 m. Each plot records detailed species-level information, including scientific name, growth form, life form, number of individuals or clumps, plant height, diameter at breast height or at base, crown width, and coverage, along with geographic coordinates and hierarchical vegetation classification. In total, the dataset comprises 14 113 individual records belonging to 1127 species from 379 genera and 117 families. The dominant families are Rosaceae (133 species), Ericaceae (93), Fabaceae (66), Asteraceae (63), and Fagaceae (37), and the dominant genera are Rhododendron (75), Berberis (34), Cotoneaster (30), Salix (24), and Quercus (22), with composition varying among vegetation types. Growth forms are mainly composed of shrubs (46.0 %), trees (27.3 %), and herbs (23.6 %). Herbs are dominated by perennial (92.1 %), shrubs are mainly deciduous broadleaf (59.7 %), and trees are primarily deciduous broadleaf (46.8 %) and evergreen broadleaf (41.6 %). Species richness, growth forms, and life forms show clear elevational changes within the HDM-Plot dataset. Floristically, genus-level areal-types in the HDM-Plot dataset are dominated by temperate elements (54.1 %), followed by tropical elements (35.4 %). 314 plots can be assigned to three vegetation formation groups, 18 vegetation formations, 142 alliance groups, 209 alliances, 238 association groups, and 299 associations. The HDM-Plot dataset provides an updated and standardized baseline for quantitative analyses of mountain vegetation, biodiversity assessment, and vegetation classification and mapping in southwestern China. Such information can be future used in the revisions of China's vegetation classification scheme and Vegegraphy of China. The dataset is available from Figshare (Jin et al., 2026a; https://doi.org/10.6084/m9.figshare.32706207) and through the National Tibetan Plateau/Third Pole Environment Data Center (Jin et al., 2026b; https://doi.org/10.11888/Terre.tpdc.303394).
- Article
(7483 KB) - Full-text XML
-
Supplement
(1322 KB) - BibTeX
- EndNote


The Hengduan Mountains (HDM) form the core mountainous region in southwestern China and are recognized as one of the world's richest biodiversity hotspots and a global priority area for ecological conservation (Myers et al., 2000; Sloan et al., 2014). Located at the junction between the Tibetan Plateau and the Yangtze Block, the HDM represents a young and rapidly evolving orogenic belt shaped by ongoing tectonic uplift associated with Indian–Eurasian collision (Xing and Ree, 2017). Long-term mountain uplift, together with intense river incision, has generated exceptional topographic complexity, characterized by closely spaced north–south–oriented high mountains and deeply incised valleys (Zhang et al., 1997). As an ecotonal region linking subtropical lowlands to alpine highlands, the HDM is affected by the southwest and southeast monsoons as well as mesoscale atmospheric systems (Wu et al., 2012; Zhang et al., 2024). These interacting geological and climatic processes create strong environmental heterogeneity, supporting abundant biodiversity, significant spatial differentiation of ecosystems, and complex vegetation distribution (Liang et al., 2018; Ding et al., 2020; He et al., 2020). Consequently, robust characterization of species composition, community structure, and vegetation zonation in the HDM is essential for biodiversity conservation and sustainable development, thereby providing key empirical support for advancing studies of global mountain biogeography and ecology.
Vegetation represents the most visible and distinctive ecological feature of a region, and plot-based plant community data provide the fundamental basis for documenting vegetation composition and distribution patterns, as well as for the compilation of the Vegegraphy – a series of monographs that describe detailed species composition, structures, functions, environmental settings, and distribution of a set of plant communities and/or their combinations for each vegetation type, using community data from vegetation survey (Fang et al., 2020; Wang et al., 2020; Sabatini et al., 2021). Over recent decades, extensive vegetation surveys have been conducted across the HDM and its adjacent mountains and plateaus, including those in the First (1970–1990) and Second (2018–2024) Tibetan Plateau Scientific Expeditions, and numerous regional surveys (the late 20th to the early 21st Century). These efforts have substantially advanced theoretical knowledge of floristic composition (Li, 1988; Shen et al., 2004; Xu et al., 2014; Yu et al., 2020), community structure (Sherman et al., 2008; Xu et al., 2008; Sun et al., 2017), vegetation distribution (Yao et al., 2010; Liang et al., 2018; Wu and Yu, 2020; Zhang et al., 2023), eco-geographical regionalization (Zheng and Yang, 1987; Yang and Zheng, 1989; Chi et al., 2019), and vegetation modeling (He et al., 2020; Yin et al., 2020), with sustained attention to dry-hot valley vegetation (Jin and Ou, 2000; Jin, 2002; Liu et al., 2016a, b; Yang et al., 2016a, b).
Existing plot surveys consistently indicate significant horizontal differentiation and elevational turnover in HDM vegetation (Editorial Committee of Vegetation Map of China, the Chinese Academy of Sciences, 2007a, b). In the vegetation regionalization scheme of China, the study region spans three vegetation regionalization units: the subtropical evergreen broadleaf forest region, the Qinghai-Xizang Plateau alpine vegetation region, and the tropical monsoon rain forest and rain forest region (Fig. 1a; Table S1 in the Supplement; Editorial Committee of Vegetation Map of China, the Chinese Academy of Sciences, 2007b). Across the region, from the southeast toward the northwest, vegetation types shift from subtropical evergreen broadleaf forests and dry-hot valley shrubby grasslands to subalpine needleleaf forests, subalpine shrublands, and alpine meadows (Fig. 1a; Table S1; Editorial Committee of Vegetation Map of China, the Chinese Academy of Sciences, 2007a). Along elevational gradients, vegetation belt spectra typically transition from the dry-hot valley shrubland belt through the belts of mountains evergreen broadleaf forest, mixed needleleaf and broadleaf forest, and needleleaf forest, to the belts of alpine shrubland and meadow, alpine meadow, and the nival (Fig. 1b; Zheng, 1988). Despite a large number of community plot data accumulated by earlier surveys, many datasets remain difficult to integrate for synthesis due to extended temporal spans, limited accessibility of original records, heterogeneous study designs, as well as inconsistent taxonomic and classification frameworks across campaigns. Meanwhile, vegetation on the Tibetan Plateau including the HDM has been reshaped under increasing climate change and human activities (Zhang et al., 2015; Piao et al., 2019), highlighting the need for updated, standardized, and openly available plot-based plant community data.
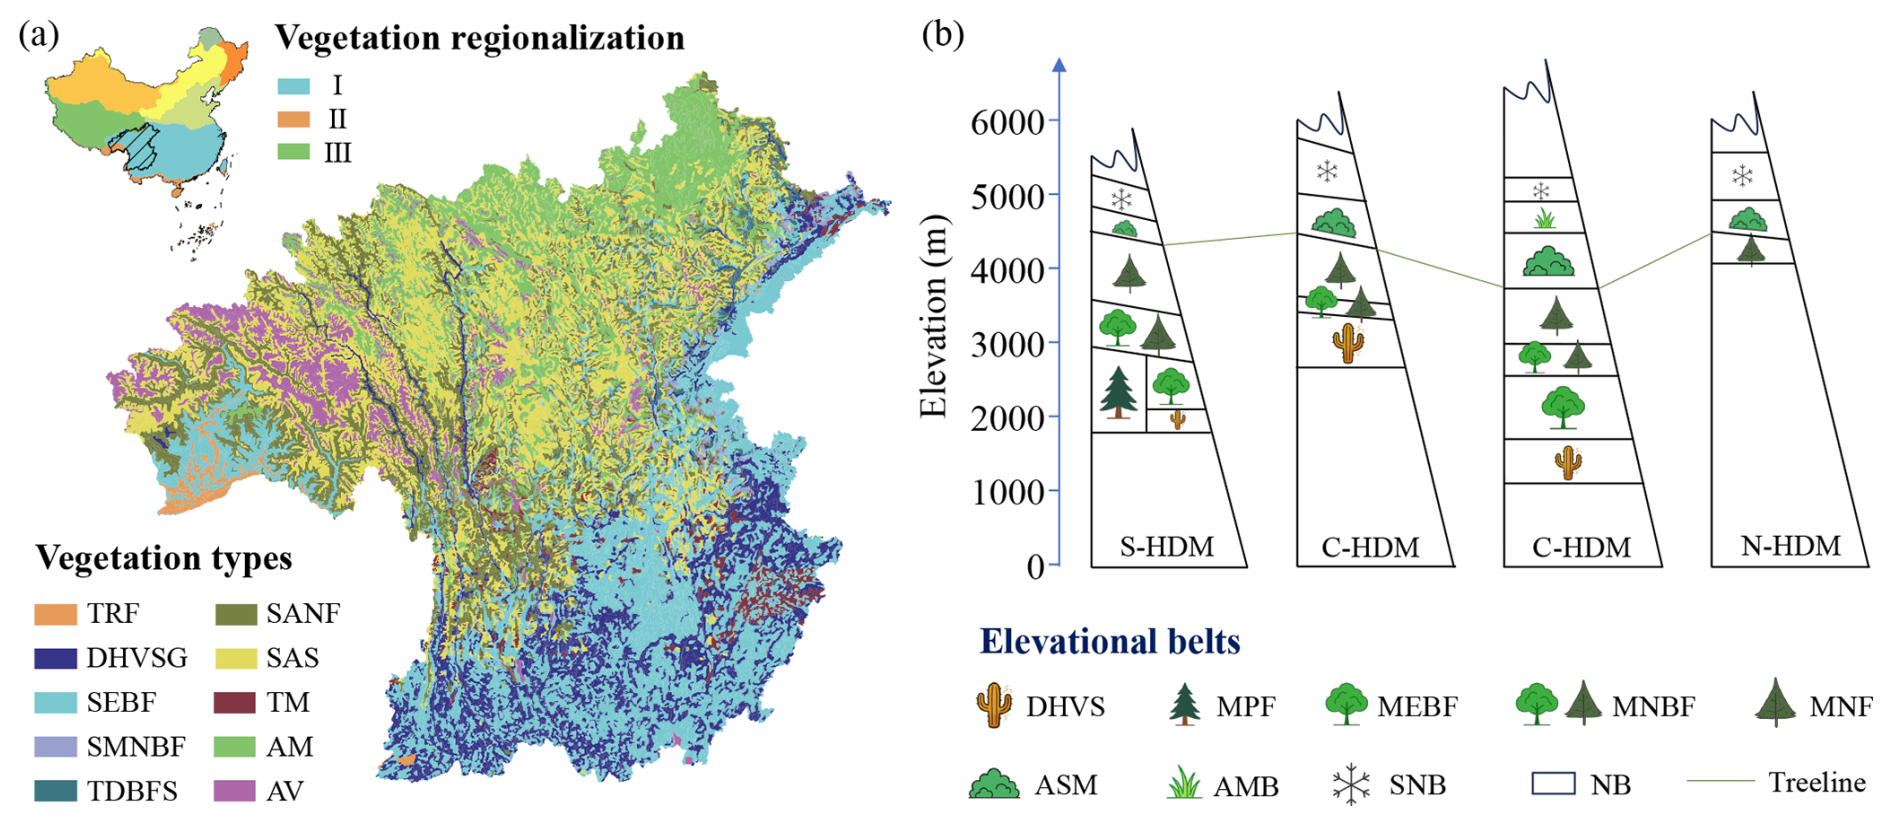
Figure 1Horizontal (a) and elevational (b) patterns of vegetation distribution in the Hengduan Mountains (HDM) and adjacent regions – the HDM-Plot study region. Vegetation regionalization was obtained from the Vegetation Regionalization Map of China (Editorial Committee of Vegetation Map of China, the Chinese Academy of Sciences, 2007b). (I) Subtropical evergreen broadleaf forest region; (II) tropical monsoon rain forest and rain forest region; and (III) Qinghai-Xizang Plateau alpine vegetation region. Vegetation types were extracted from the 1 : 1 000 000 Vegetation Map of the People's Republic of China (Editorial Committee of Vegetation Map of China, the Chinese Academy of Sciences, 2007a). The original 35 vegetation formations were aggregated into 10 categories based on climatic zone, community structure, and ecological function. TRF, tropical rain forest; DHVSG, dry-hot valley shrubby grassland; SEBF, subtropical evergreen broadleaf forest; SMNBF, subtropical mountains mixed needleleaf and broadleaf forest; TDBFS, temperate deciduous broadleaf forest and shrubland; SANF, subalpine needleleaf forest; SAS, subalpine shrubland; TM, temperate meadow; AM, alpine meadow; and AV, alpine cushion and sparse vegetation, and bare land. Elevational vegetation belt spectra for the southern (S-HDM), central (C-HDM), and northern (N-HDM) sectors of the Hengduan Mountains were revised after Zheng (1988). DHVS, dry-hot valley shrubland belt; MPF, mountains Pinus forest belt; MEBF, mountains evergreen broadleaf forest belt; MNBF, mountains mixed needleleaf and broadleaf forest belt; MNF, mountains needleleaf forest belt; ASM, alpine shrubland and meadow belt; AMB, alpine meadow belt; SNB, subnival belt; and NB, nival belt.
To provide an up-to-date baseline of vegetation composition and spatial patterns in the HDM and adjacent regions, we conducted four large-scale surveys between 2022 and 2024 along the major mountains and valleys, spanning tropical, subtropical, and temperate zones and extending into subalpine and alpine environments, in accordance with the horizontal and vertical zonation. We surveyed 314 plant community plots and integrated all field records into a standardized plot-based vegetation dataset, HDM-Plot. It documents plant species composition and taxonomic attributes and supports a consistent vegetation classification across the region. The HDM-Plot dataset provides a contemporary and standardized baseline for plant community study and long-term monitoring of vegetation, and serves as a vital reference for biodiversity conservation, vegetation restoration, and sustainable development. It also offers empirical support for the revision of China's vegetation classification scheme (Guo et al., 2020) and the compilation of the Vegegraphy of China (Fang et al., 2020).
The HDM covers a broad geographical extent, and their spatial boundaries can vary slightly among studies depending on research objectives. In this study, we use the HDM boundary (24.08–34.32° N, 93.13–l06.16° E, 119–7213 m; Fig. 2a) following Yu et al. (1989) and Zhang et al. (1997) as the geographical core of the study region. Because of the continuity of regional topography, the gradual transition of vegetation belts, and the practical arrangement of survey routes, the actual survey extent included adjacent regions along the southeastern and northwestern margins (Fig. 2a). These peripheral plots record important vegetation transitions from the HDM toward adjacent regions, and were therefore retained. Unless otherwise specified, the “HDM-Plot study region” in this manuscript refers to the HDM and adjacent regions covered by our field surveys, rather than to the HDM sensu stricto. The region exhibits an overall increase in elevation from the southeast toward the northwest and is characterized by a series of north–south–oriented mountains and deeply incised valleys. Climatically, the HDM-Plot study region spans tropical, subtropical, temperate, and alpine zones, with mean annual temperature ranging from −18.2 to 25.1° C. Warmer conditions are concentrated in the dry-hot valleys and lower subtropical mountains in the southeast, and in the tropical rainforests along the western margin, while much lower temperatures occur across the highlands toward the northwest. Mean annual precipitation across the region varies but is generally lower (0–1793 mm), and relatively humid conditions are mainly associated with the southwestern and southeastern margins (Fig. 2b).
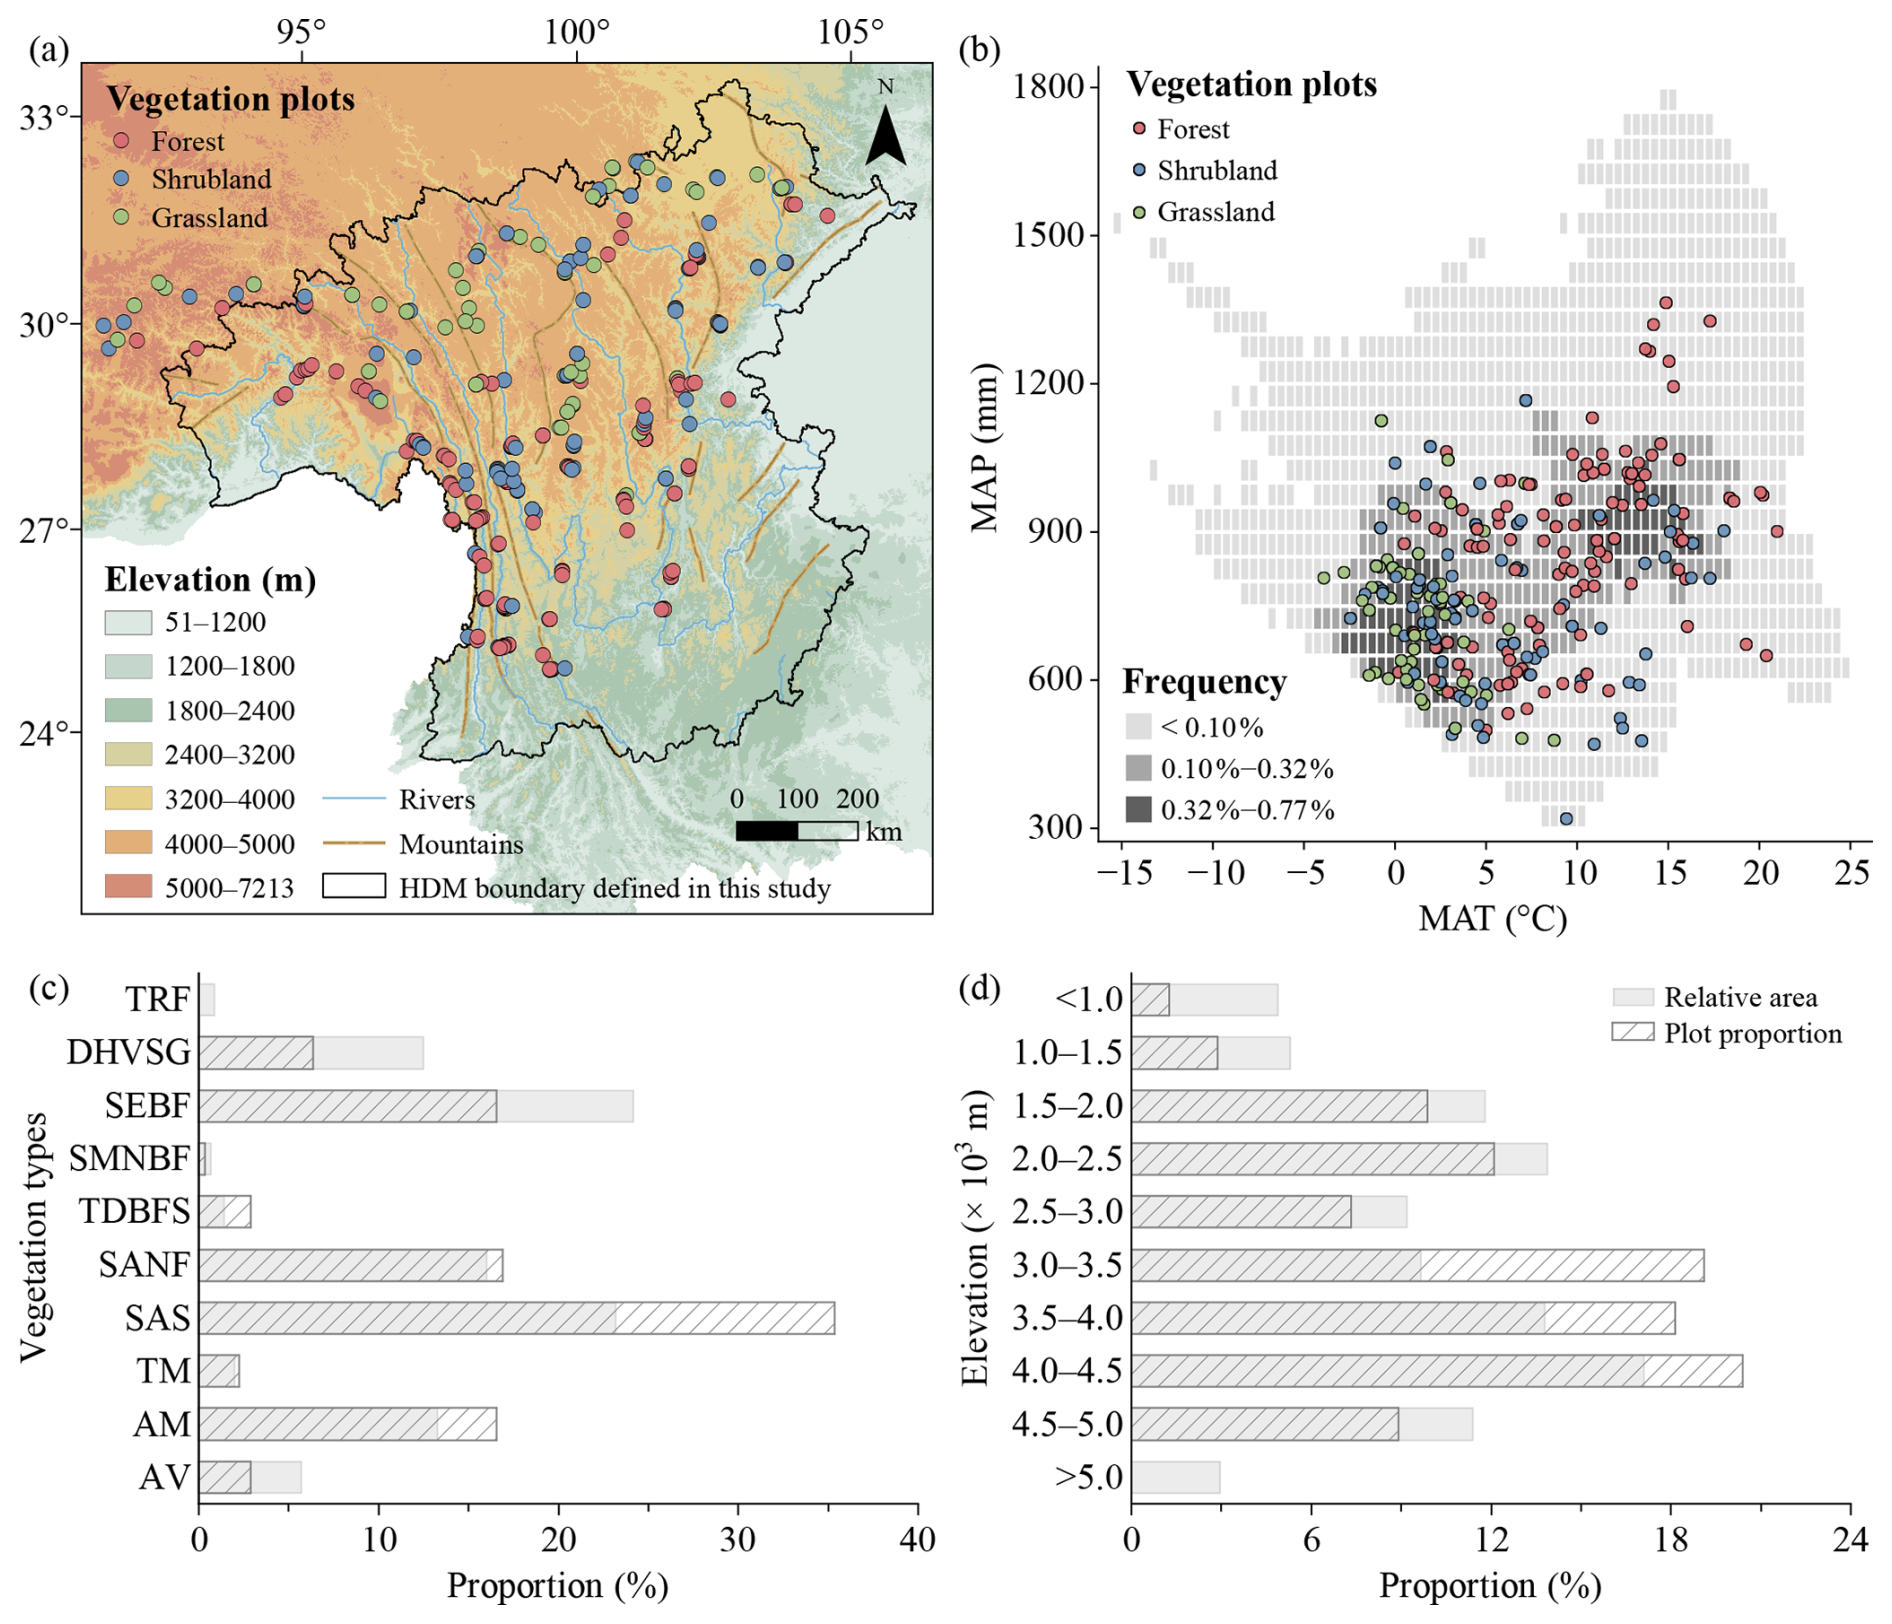
Figure 2Spatial (a), climatic (b), vegetation-type (c), and elevational (d) coverage of vegetation plots in the HDM-Plot dataset. Elevation data (m) were derived from the SRTM 90 m dataset (Farr et al., 2007) and resampled into 1 km grid cells. Mountain and river data were obtained from the Digital Mountain Map of China Dataset (Nan et al., 2022) and Natural Earth (https://www.naturalearthdata.com, last access: 12 March 2026), respectively. Mean annual temperature (MAT, °C) and mean annual precipitation (MAP, mm) were derived from a 1 km monthly climate dataset for China covering 1991–2020 (Hu et al., 2025). Grey cells in (b) indicate the frequency of MAT–MAP combinations among all 1 km grid cells within the study boundary, based on two-dimensional bins of 0.5 °C for MAT and 50 mm for MAP. In (c) and (d), grey bars indicate the relative area of each vegetation type and elevational belt within the study region, and hatched bars represent the proportion of surveyed plots within each group. Vegetation types were extracted from the 1 : 1 000 000 Vegetation Map of the People's Republic of China (Editorial Committee of Vegetation Map of China, the Chinese Academy of Sciences, 2007a). TRF, tropical rain forest; DHVSG, dry-hot valley shrubby grassland; SEBF, subtropical evergreen broadleaf forest; SMNBF, subtropical mountain mixed needleleaf and broadleaf forest; TDBFS, temperate deciduous broadleaf forest and shrubland; SANF, subalpine needleleaf forest; SAS, subalpine shrubland; TM, temperate meadow; AM, alpine meadow; and AV, alpine cushion vegetation, alpine sparse vegetation, and bare land.
3.1 Vegetation survey
Field surveys were conducted during four campaigns in March 2022, May–June 2022, May–June 2023, and June 2024. May–June was selected as the primary survey time because most species across elevational belts in the region have developed diagnostic vegetative structures and even many have begun flowering, enabling reliable identification. In addition, it coincides with the transition from the dry to the wet season when precipitation is still relatively low and field accessibility is generally high. An additional survey in March 2022 targeted dry-hot valley vegetation, where phenological development occurs earlier under warm and relatively arid conditions.
To capture the major vegetation belts and transition zones shaped by the regional mountain–valley and climatic gradients, we adopted a coverage-oriented field sampling design. Plots were set up across representative mountains and valleys of the HDM and adjacent regions along various longitudinal, latitudinal, and elevational gradients. The survey aimed to cover major vegetation physiognomic types, representative mountain–valley systems, and local transitions among forest, shrubland, and grassland communities. Field logistics, road accessibility, and terrain conditions were also considered during plot selection. Plot size was determined following community physiognomy and stand heterogeneity. The sizes of grassland plots were mainly 1 m × 1 m (91.9 % of grassland plots), of shrubland plots were mainly 5 m × 5 m (70.0 %), and of forest plots were mainly 10 m × 10 m (56.3 %) or 10 m × 20 m (29.6 %). Local adjustments in plot size were made because of terrain constraints, especially slope, and field operability in complex mountain environments. The dominant plot size covered broad spatial and elevational ranges within the surveyed distribution of their corresponding vegetation types (Fig. S1; Table S2 in the Supplement). In forest and shrubland plots, all woody species were recorded, including species name, growth form, phenological period, number of individuals or clumps, height, stem diameter, and crown width. Diameter was generally measured as diameter at breast height (DBH). For individuals <2 m tall or when DBH was not applicable, basal diameter (BD) was recorded. In forest plots, individuals with height ≥5 m were assigned to the tree layer, whereas shrubs and tree seedlings with height <5 m were classified into the shrub layer. In grassland plots, all herbaceous species were recorded, including species name, growth form, phenological period, number of individuals or clumps, maximum leaf-layer height, and coverage. The number of individuals or clumps was used as the count-based abundance measure. For species occurring as discrete individuals, each individual was counted separately. For clumped plants, distinguishable clumps were used as the counting unit, and the number of individuals within clumps was additionally noted when identifiable. In forest and shrubland plots, woody plants were recorded by individual or clump; therefore, the same species could have multiple records within a plot. In grassland plots, herbaceous plants were recorded by species, with each species represented by one record containing the total number of individuals or clumps within the plot.
For each plot, longitude, latitude, elevation, community height and total coverage, as well as disturbance intensity were recorded. The Global Positioning System was used to determine the geographic coordinates. Community height was defined as the maximum height of the dominant vegetation layer within a plot. Specifically, in forest plots, it referred to the visually estimated height of the tallest tree in the tree layer; in shrubland plots, it was measured or estimated as the height of the tallest shrub layer using a tape measure where possible; and in grassland plots, it was measured as the maximum height of the herbaceous leaf layer. Total coverage was visually estimated as the vertically projected percentage cover of all plant species within each plot. Disturbance intensity was assessed directly at four levels: none, weak, medium, and strong. These measurements and estimates followed the same field criteria throughout all survey campaigns and were conducted by experienced vegetation investigators to ensure consistency. In total, 314 plots were surveyed, belonging to 142 forest plots, 110 shrubland plots, and 62 grassland plots (Fig. 2; Table 1). These surveyed plots cover the major geographical space (Fig. 2a), climatic space (Fig. 2b), vegetation types (Fig. 2c), and elevational belts (Fig. 2d) of the study region.
Table 1Summary statistics of plots in the HDM-Plot dataset.
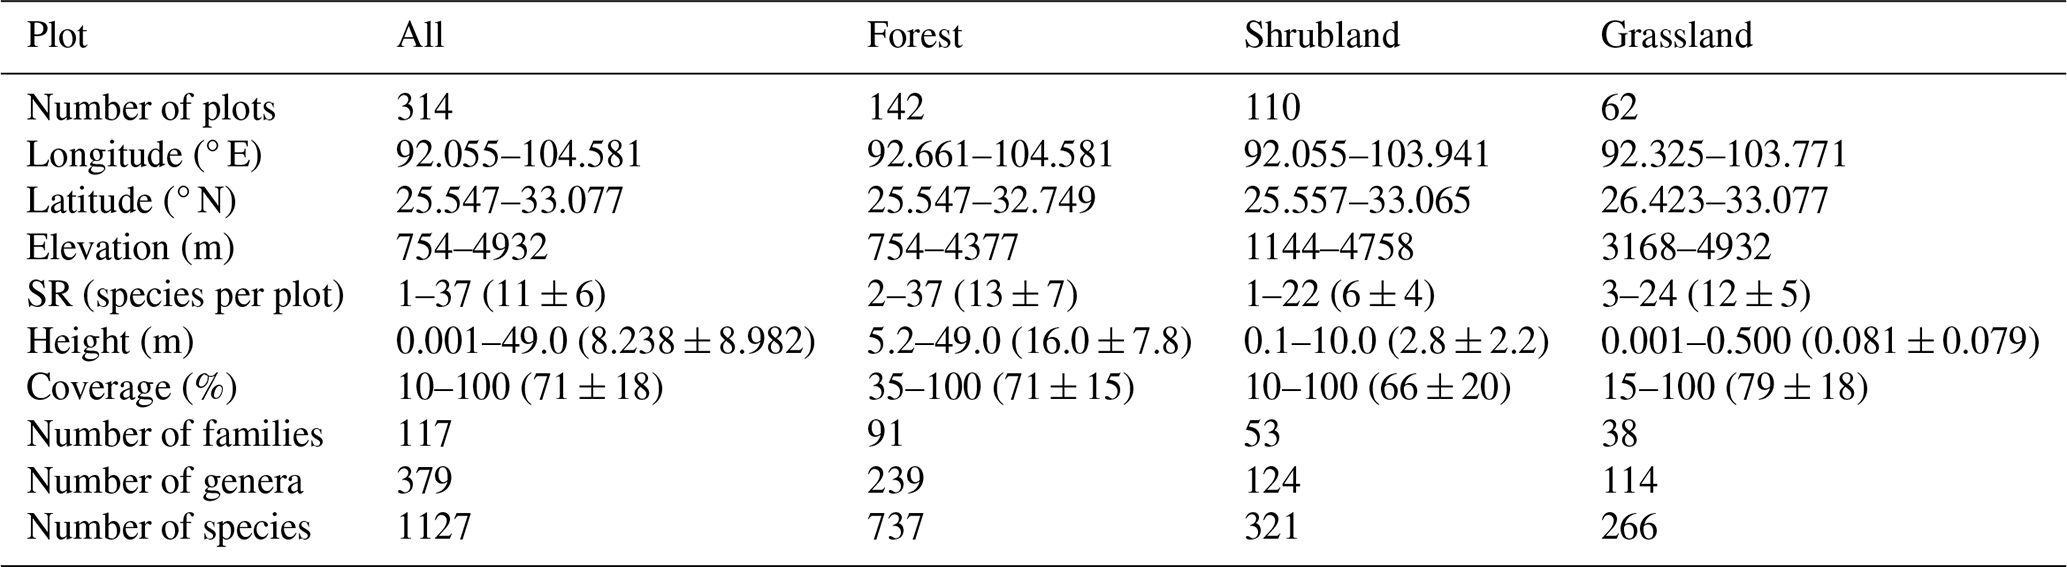
Values for species richness (SR), community height, and coverage are presented as ranges, with mean ± SD in parentheses.
3.2 Data processing and analysis
Species were identified following national and regional floras, including the Flora Republicae Popularis Sinicae (Editorial Committee of the Flora of China, Chinese Academy of Sciences, 1959–2004), Flora Yunnanica (Kunming Institute of Botany, Chinese Academy of Sciences, 1977–2006), Flora Xizangica (Integrated Scientific Expedition to Qinghai-Tibet Plateau, Chinese Academy of Sciences, 1983–1987), and Flora Sichuanica (Editorial Committee of Flora Sichuanica, 1981–2012). Final species names were then standardized and validated against the iPlant online taxonomic system (http://www.iplant.cn/, last access: 16 January 2026). In the most recent taxonomy system of Flora of Pan-Himalaya (Zhang, 2020), Kobresia is classified into Carex. Given the ecological importance of Kobresia in alpine zonal vegetation, and in order to maintain consistency with vegetation literatures, we retained Kobresia as a traditional genus name for data analyses, while the dataset provides both names.
Growth forms were classified from field observations following the definitions in Vegetation of China (Editorial Committee of the Vegetation of China, 1980) into tree, shrub, climber, semi-shrub, and herb. Some taxa (e.g., Quercus and Rhododendron) can show both shrubs and small trees, and they were recorded at the plot level according to the observed status. For regional summary analyses, each species was additionally assigned a single predominant growth form based on its most frequent form seen in the field across the dataset. Woody species were further divided by leaf type (needleleaf vs. broadleaf) and phenology (evergreen vs. deciduous). Herbaceous species were categorized into annual, biennial, and perennial life forms. Floristic areal-types of plant families and genera were assigned primarily based on the Areal-types of the World Families and Chinese Genera of Seed Plants (Wu, 1991; Wu et al., 2003), supplemented by the Floristic Statistics and Analyses of Seed Plant from China (Li, 1996) and Dictionary of the Families and Genera of Chinese Vascular Plants (iFlora Initiative of Kunming Institute of Botany, Chinese Academy of Sciences, 2018).
Vegetation classification followed the revised scheme of vegetation classification system of China (Guo et al., 2020), which adopted a three-level hierarchy (vegetation formation, alliance, and association) and emphasizes constructive and dominant species in reflecting the primary structural characteristics of plant communities. For each level, a corresponding supplementary classification unit was defined (vegetation formation group, alliance group, and association group). Dominance was identified using species importance value (IV, %) calculated following Fang et al. (2009): for tree-layer species, IV combined relative abundance, relative height, and relative basal area; for shrub-layer species, IV combined relative abundance and relative height; and for herb-layer species, relative abundance and relative coverage. Relative abundance was calculated from the number of individuals or clumps, and all relative metrics were expressed as percentages of the corresponding plot total. A community was assigned a single dominant species when one species had IV > 75 %. When multiple species showed IV between 10 % and 75 %, species were designated as dominant and sub-dominant in descending order of IV if interspecific IV differences exceeded 10 %, and as co-dominant when IV differences were ≤10 %. When all species had IV < 10 %, the community was treated as lacking a clear dominant species, and thereby species were simply ranked by IV (Wang et al., 2020). Vegetation formation groups were defined by community ecological physiognomy (e.g., forests), and vegetation formations by the life form of the constructive species (e.g., evergreen needleleaf forests). Alliance groups were divided by the genus of constructive species (e.g., Abies forest alliance group), and alliances by the constructive species (e.g., A. georgei forest alliance). Association groups were identified by the constructive species together with the life form of sub-dominant species (e.g., A. georgei – shrub forest association group), and associations were determined by the constructive species and sub-dominant species (A. georgei – Rubus amabilis forest association). In the naming convention, a “–” was used to connect species from different layers, and “+” was to connect multiple species within the same layer (Guo et al., 2020). In addition, two-way indicator species analysis (TWINSPAN) was further used as a complementary numerical classification of the vegetation plots. It is a divisive hierarchical classification method that progressively partitions plots according to differences in species composition and identifies indicator or diagnostic species associated with each split.
4.1 Species composition
The HDM-Plot dataset compiles 14 113 individual records from 314 plots, documenting 1127 plant species (including subspecies and varieties) belonging to 379 genera and 117 families (Table 1). The most species-rich families are Rosaceae (133 species), Ericaceae (93), Fabaceae (66), Asteraceae (63), and Fagaceae (37), occurring in 27.1 % to 71.3 % of plots (Fig. 3a; Table 2). Rosaceae is the most widely distributed family in the dataset, while Fabaceae is also broadly recorded but with a relatively lower plot frequency. Ericaceae and Fagaceae are mainly concentrated in the southern to central parts, and are less frequent toward the northern sector. Asteraceae is more frequently recorded in the central and northern areas, but is sparse in the southernmost part (Fig. 3a). Along the elevational range surveyed, Rosaceae and Ericaceae show broad elevational distributions, with most records concentrated at middle to high elevations. Fabaceae spans the widest elevational ranges, extending from low valleys to alpine areas, but its distribution is mainly centered at low to middle elevations. Asteraceae is distinctly concentrated at high elevations, with a relatively high median elevation. In contrast, Fagaceae is mainly distributed at low to middle elevations and shows a lower elevational distribution center than the other dominant families (Fig. 3c). The five richest genera are Rhododendron (75 species), Berberis (34), Cotoneaster (30), Salix (24), and Quercus (22) (Table 2). Rhododendron, Berberis, and Cotoneaster are broadly distributed across the region, although their records are denser in the southern and central sectors. Salix is more frequent in the northern sector, whereas Quercus is mainly concentrated in the southern to central parts and becomes less frequent toward the north (Fig. 3b). Rhododendron and Berberis are mainly concentrated at middle to high elevations, Cotoneaster occupies a relatively broad middle-elevation range, Salix is centered at higher elevations, and Quercus shows the lowest elevational distribution center among the dominant genera, mainly occurring at low to middle elevations (Fig. 3d).
Table 2Composition of dominant plant families and genera in the HDM-Plot dataset.
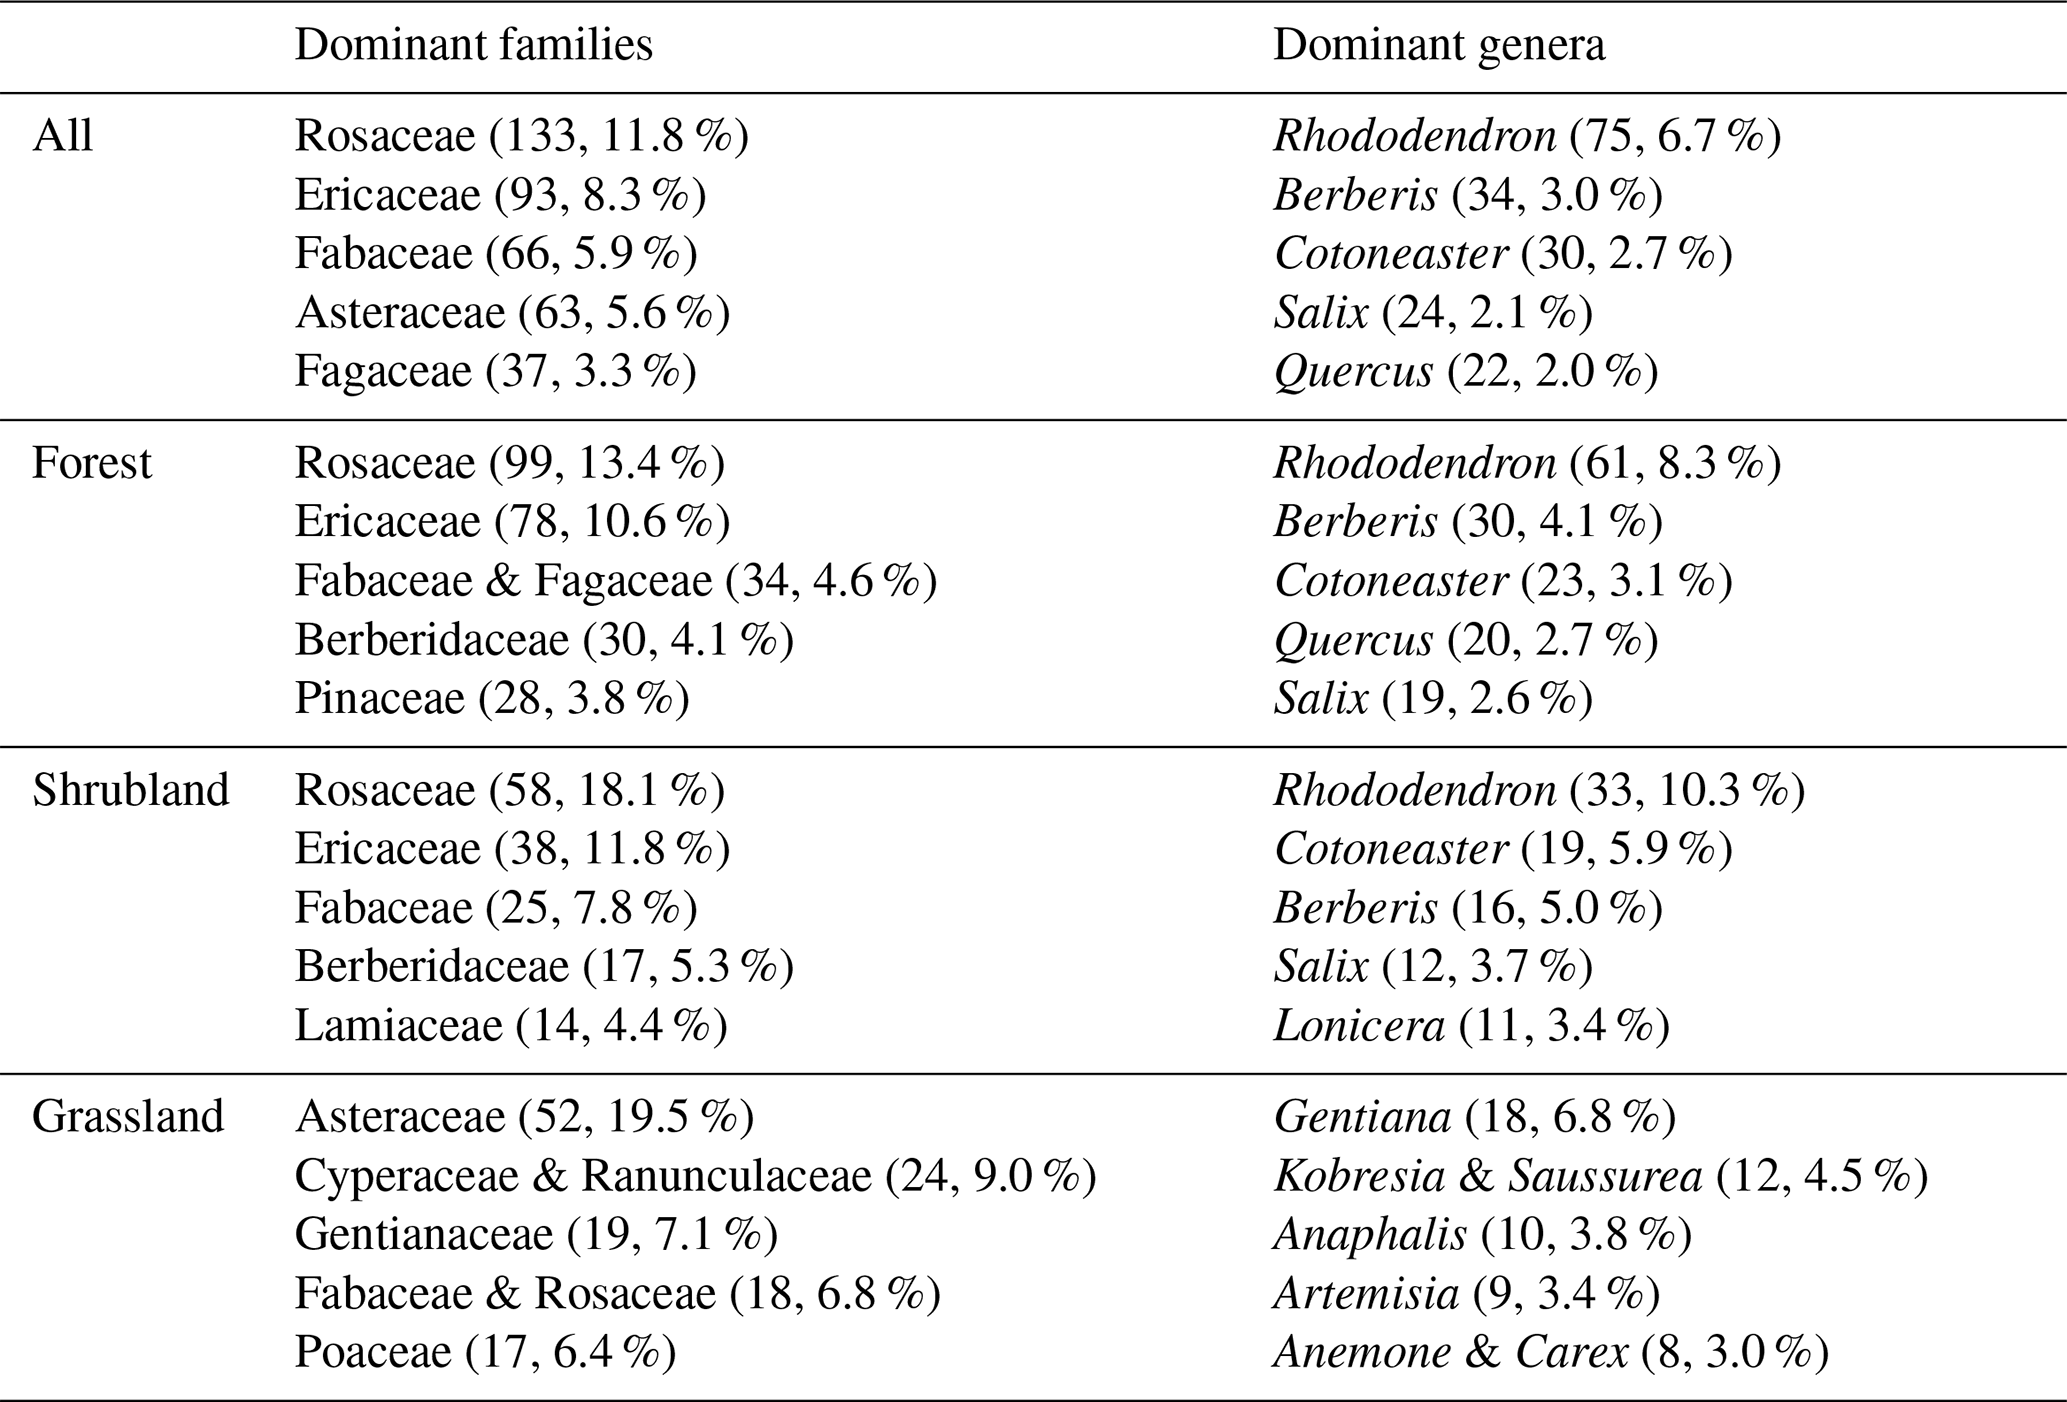
Dominant families and genera refer to the top five taxa ranked by number of species. An ampersand (&) connects families or genera with the same number of species. The values in parentheses indicate the number of species and its proportion of the total number of species in the corresponding category.
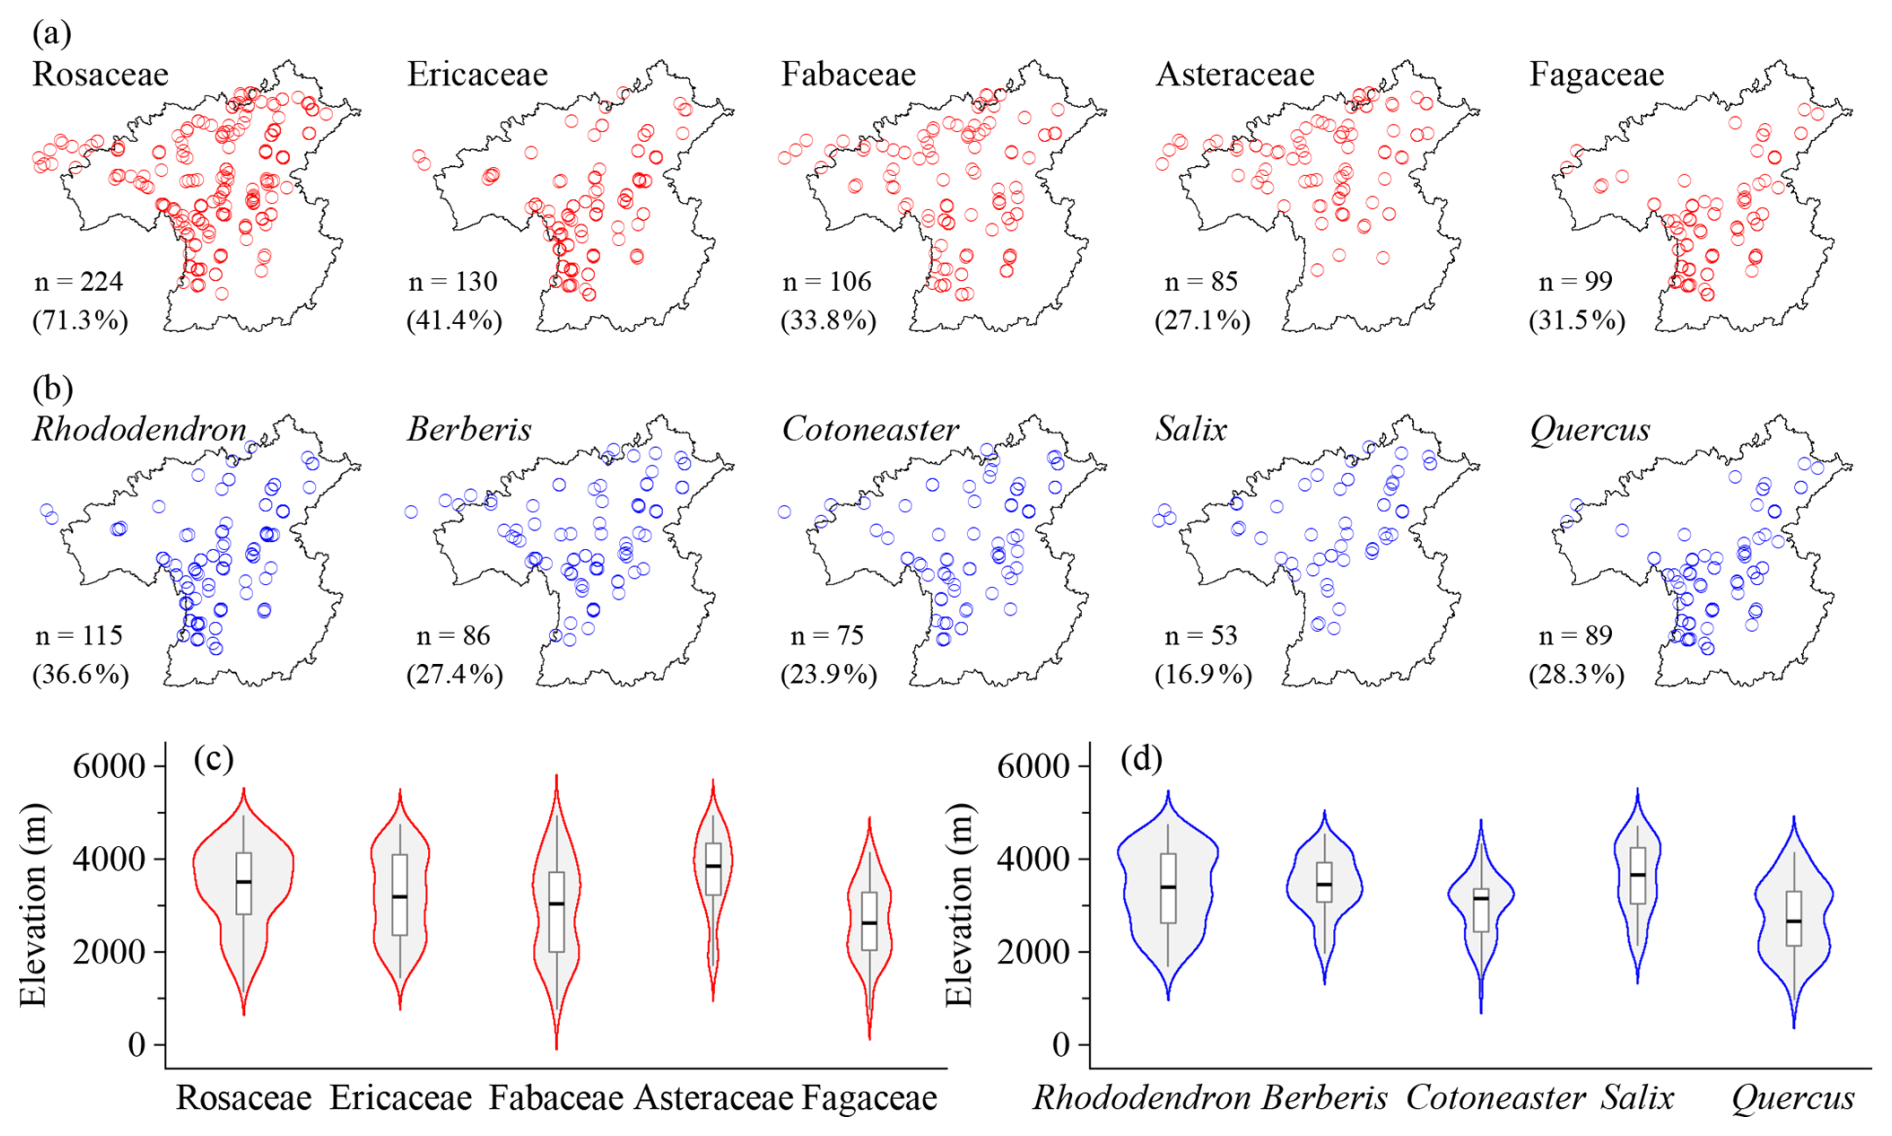
Figure 3Horizontal (a, b) and elevational (c, d) patterns of dominant plant families (a, c) and genera (b, d) in all vegetation plots in the HDM-Plot dataset. n denotes the number of plots in which each dominant family or genus was recorded, and values in parentheses indicate the proportion of the total survey plots.
Taxonomic composition differs among vegetation types (Table 2; Figs. 4–6). Forest plots include 737 species, 239 genera, and 91 families (Table 1). The dominant families are Rosaceae, Ericaceae, Fabaceae, Fagaceae, Berberidaceae, and Pinaceae (Table 2). Rosaceae is mainly represented by shrub genera such as Cotoneaster (23.2 %), Rubus (13.1 %), and Rosa (12.1 %), as well as tree genera such as Prunus (14.1 %). Ericaceae is dominated by Rhododendron (78.2 %), which is commonly shrubs and occasionally small trees. Fabaceae contains a wide range of growth forms, including shrub genera (e.g., Indigofera, Campylotropis, and Caragana), climbers (mostly single-species genera), and occasional tree taxa (e.g., Dalbergia). Fagaceae is composed of Quercus (58.8 %), Lithocarpus (20.6 %), and Castanopsis (20.6 %), and provides constructive species in nearly one-third of forest plots. Berberidaceae only records one genus Berberis and is a vital component of the shrub layer. Pinaceae offers the main needleleaf constructive species in needleleaf forests and mixed forests, dominated by Abies (35.7 %), Picea (28.6 %), Larix (10.7 %), and Pinus (10.7 %). Rosaceae, Ericaceae, Fagaceae, Berberidaceae, and Pinaceae are widely recorded in forest plots, whereas Fabaceae and Berberidaceae have lower plot frequencies and more restricted spatial distributions (Fig. 4a). Rosaceae and Pinaceae occur across a broad part of the region, while Ericaceae, Fabaceae, Fagaceae, and Berberidaceae are more concentrated in the southern to central sectors (Fig. 4a). Along the elevational gradient, Fabaceae and Fagaceae are mainly distributed at low to middle elevations, although both extend upward into middle-high elevational belts. Rosaceae and Ericaceae show broad middle-elevation distributions. Berberidaceae and Pinaceae have higher elevational distribution centers, with records mainly concentrated at middle to high elevations (Fig. 4c). The top five genera are Rhododendron, Berberis, Cotoneaster, Quercus, and Salix (Table 2). Rhododendron, Berberis, Cotoneaster, and Quercus are mainly recorded in the southern to central parts of the study region, whereas Salix is more frequently recorded toward the northern sector (Fig. 4b). Quercus has the lowest elevational distribution center and is mainly concentrated at low to middle elevations, Rhododendron and Cotoneaster occupy broad middle-elevation range. Berberis is more narrowly concentrated at middle to high elevations, while Salix is centered at relatively high elevations among the dominant forest genera (Fig. 4d).
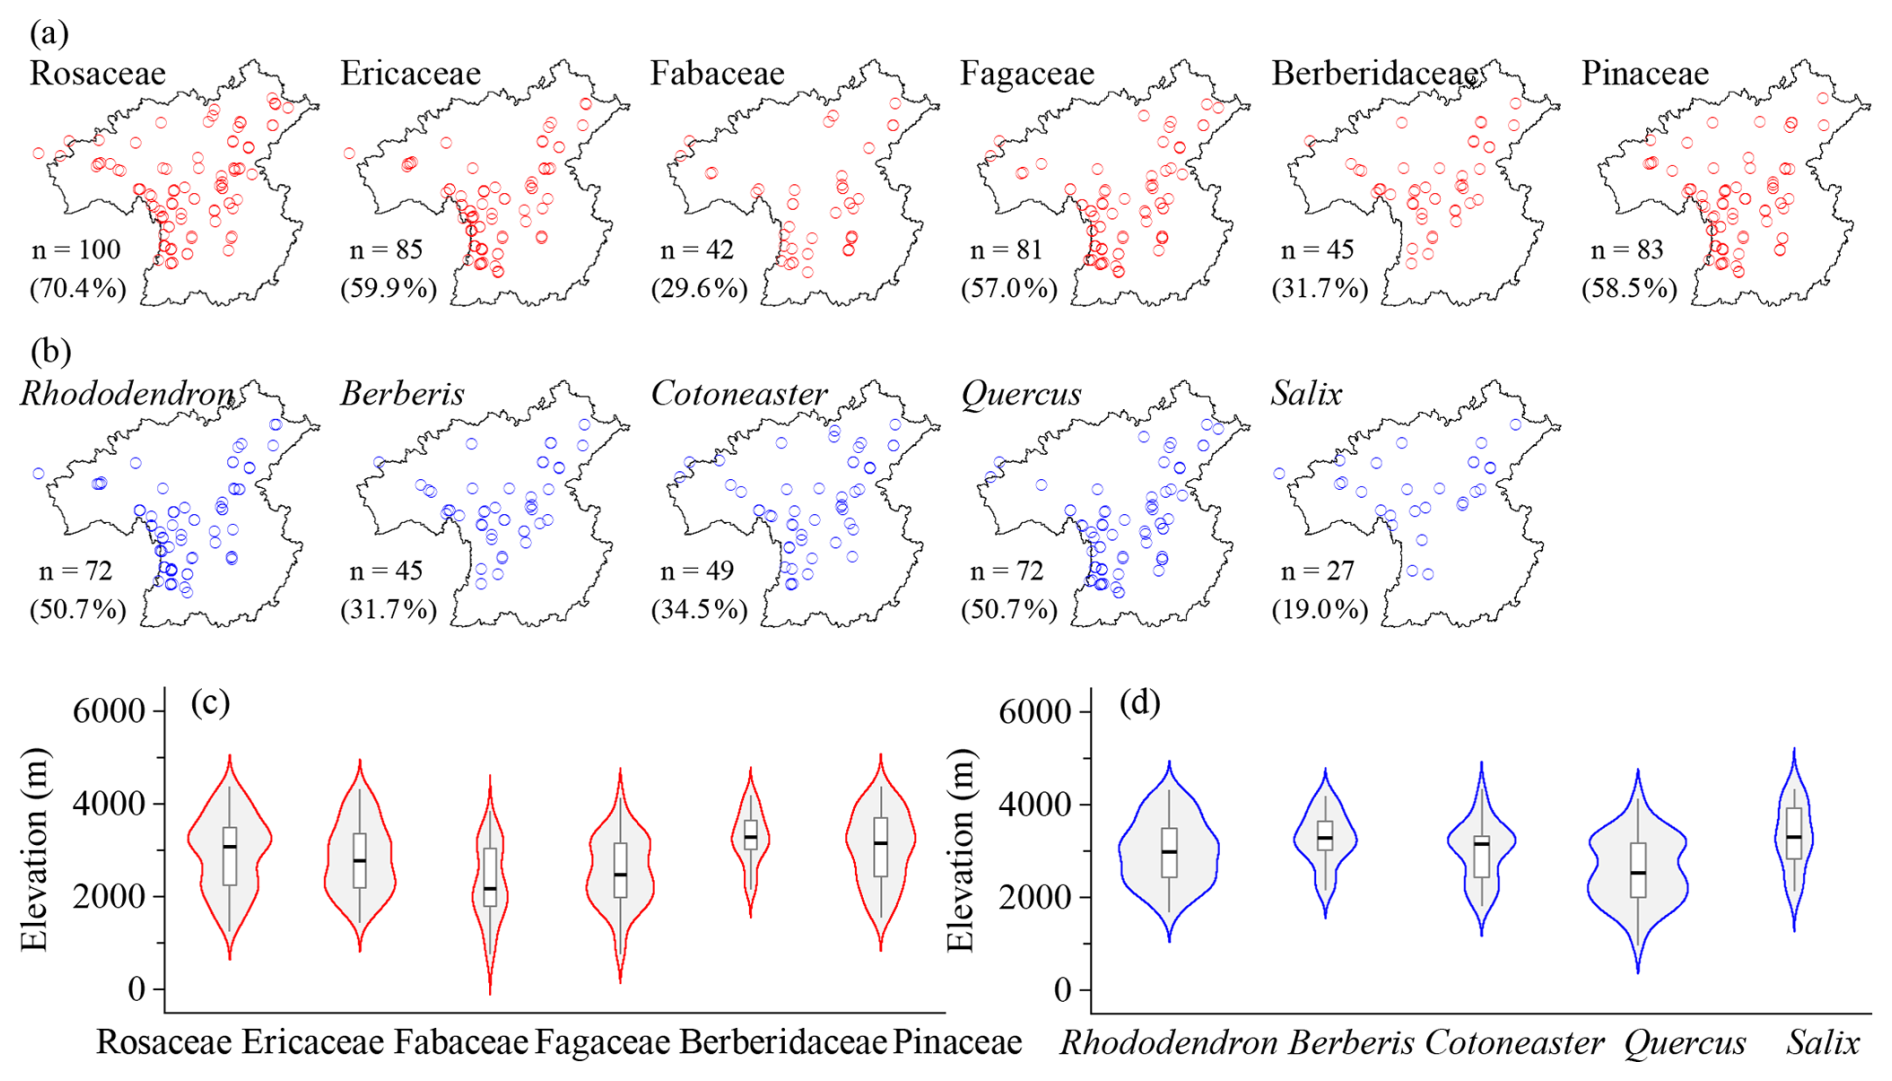
Figure 4Horizontal (a, b) and elevational (c, d) patterns of dominant plant families (a, c) and genera (b, d) in forest vegetation plots in the HDM-Plot dataset. n denotes the number of plots in which each dominant family or genus was recorded, and the values in parentheses indicate the proportion of all forest plots.
110 shrubland plots survey a total of 321 species from 124 genera and 53 families (Table 1). Dominant families largely overlap with those of forests, with Lamiaceae as a new component. Rosaceae consists of Cotoneaster (32.8 %), Rosa (15.5 %), and Spiraea (13.8 %) and forms the core of deciduous broadleaf shrublands. Ericaceae is strongly dominated by Rhododendron (86.8 %) and typically acts as the constructive species in evergreen broadleaf shrublands. Fabaceae includes Caragana (20.0 %), Campylotropis (16.0 %), and Indigofera (16.0 %), commonly recorded in the dry-hot valley shrublands. Berberidaceae is almost represented by Berberis (94.1 %), with Mahonia recorded but not in forest plots. Lamiaceae is characterized by typical dry-hot valley genera such as Caryopteris (28.6 %), Isodon (21.4 %), and Elsholtzia (21.4 %). Rosaceae is the most widely distributed shrubland family across the study region, whereas Fabaceae and Berberidaceae are also broadly recorded. Ericaceae is more concentrated in the southern to northwestern sectors, and Lamiaceae are mainly distributed in the north (Fig. 5a). Ericaceae has the highest elevational distribution center and is mainly concentrated in high elevations, and Berberidaceae is also mainly distributed at middle to high elevations. Rosaceae spans a broad elevational range but is denser at middle to high elevations, while Fabaceae and Lamiaceae have lower elevational distribution centers and are mainly concentrated at low to middle elevations (Fig. 5c). The top genera are Rhododendron, Cotoneaster, Berberis, Salix, and Lonicera (Table 2). Berberis and Lonicera are widely distributed across the region, whereas Rhododendron, Cotoneaster, and Salix are primarily aligned along a southwest–northeast direction (Fig. 5b). Their elevational distributions are also distinct. Rhododendron and Salix are concentrated at high elevations, with higher median elevations and relatively narrow central distributions. Berberis and Lonicera are mainly distributed at middle to high elevations. Cotoneaster has a lower elevational distribution center, and is mainly concentrated at middle elevations (Fig. 5d).
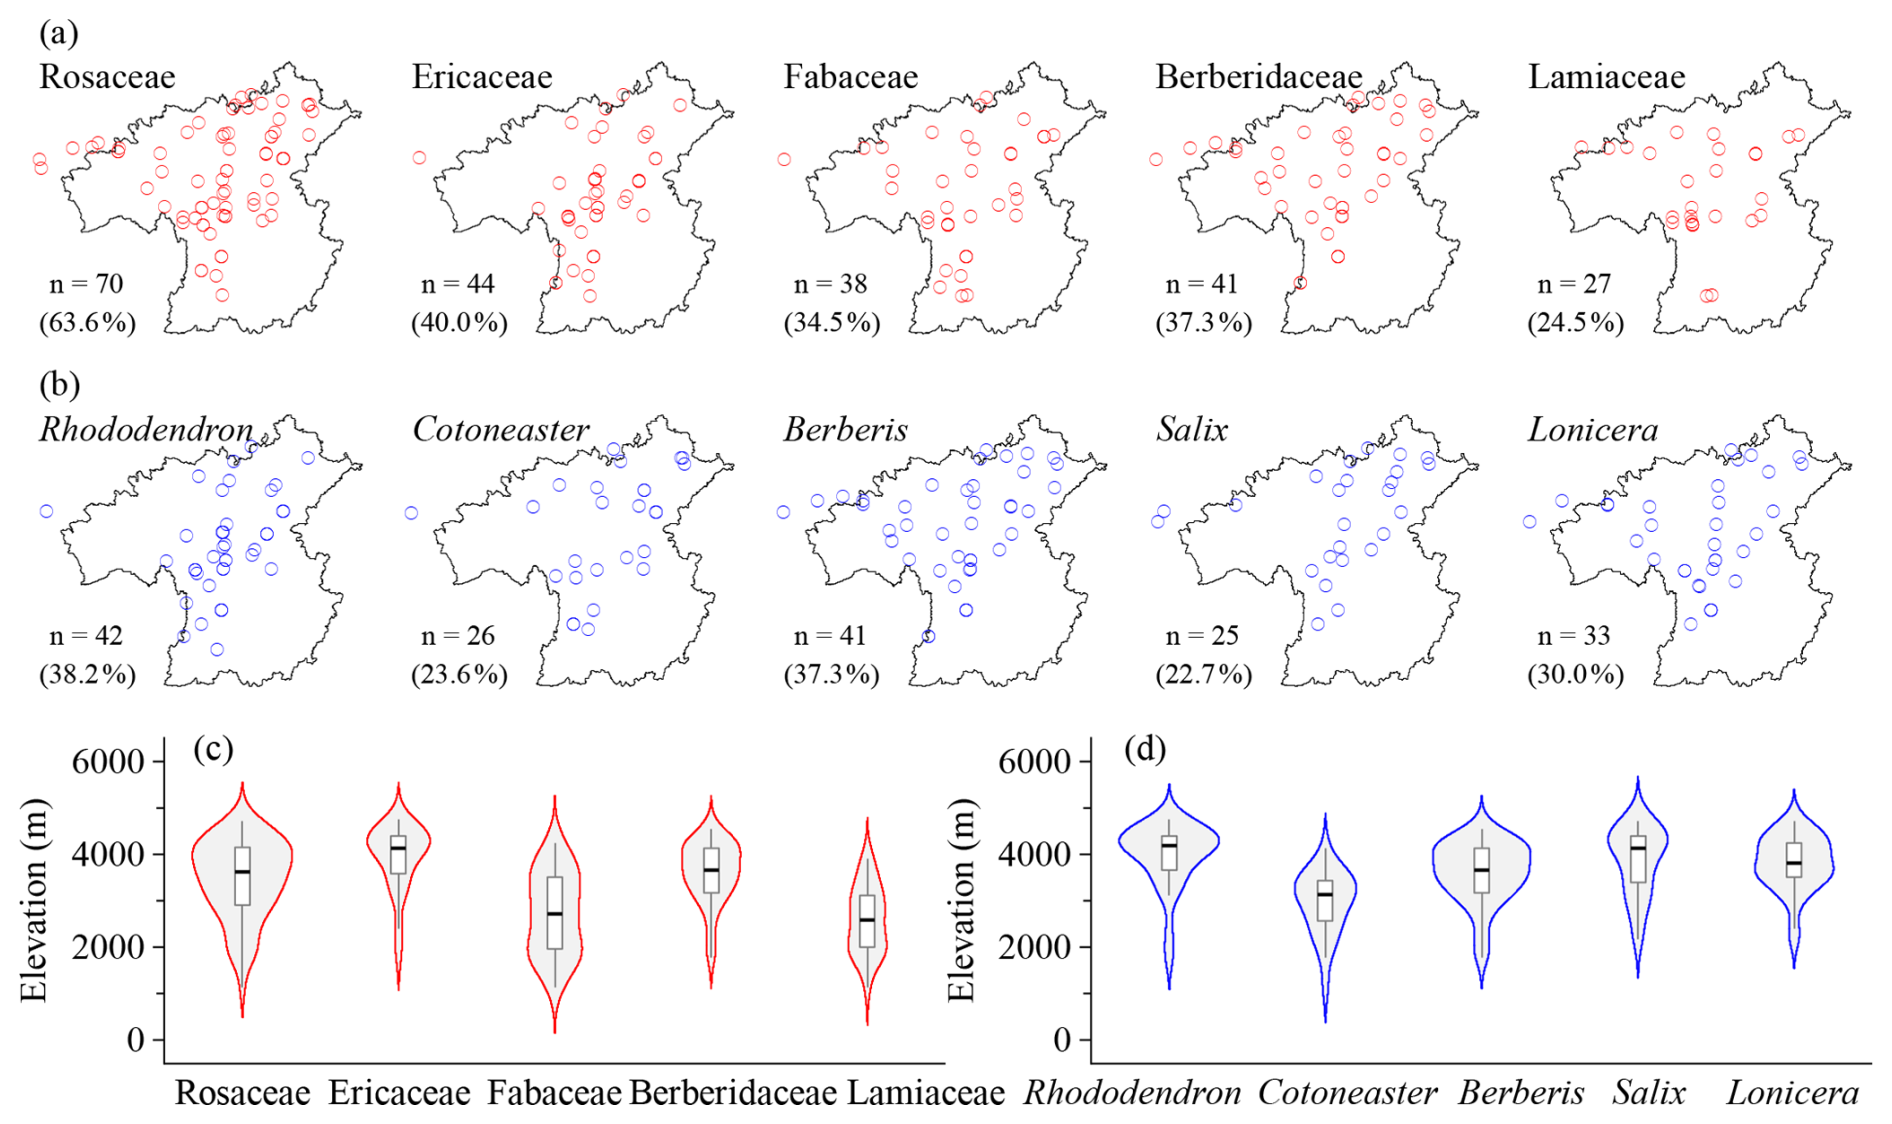
Figure 5Horizontal (a, b) and elevational (c, d) patterns of dominant plant families (a, c) and genera (b, d) in shrubland vegetation plots in the HDM-Plot dataset. n denotes the number of plots in which each dominant family or genus was recorded, and the values in parentheses indicate the proportion of all shrubland plots.
62 grassland plots investigate a total of 266 species belonging to 38 families and 114 genera (Table 1). The most species-rich families are Asteraceae, Cyperaceae, Ranunculaceae, Gentianaceae, Fabaceae, Rosaceae, and Poaceae (Table 2). Asteraceae is largely represented by Saussurea (23.1 %), Anaphalis (19.2 %), Artemisia (17.3 %), and Taraxacum (13.5 %), consisting of perennial forbs and semi-shrubs that contribute to forb grasslands. Cyperaceae is dominated by tussock Kobresia and rhizome Carex and provide the main constructive species in grassland vegetation (42 plots), especially the zonal species K. pygmaea. Ranunculaceae is represented by Anemone (33.3 %) and Ranunculus (20.8 %), Gentianaceae is strongly dominated by Gentiana (94.7 %), and Fabaceae is composed of Astragalus (33.3 %) and Oxytropis (27.8 %). Rosaceae consists of perennial herbs such as Argentina (33.3 %) and Potentilla (22.2 %) and dwarf shrub Dasiphora (11.1 %). Poaceae is dominated by tussock grasses, including Poa (17.6 %), Aristida (17.6 %), Stipa (11.8 %), and Festuca (11.8 %). The dominant grassland families are mainly distributed in the central and northern parts of the HDM-Plot study region (Fig. 6a). Asteraceae, Cyperaceae, Ranunculaceae, Rosaceae, and Poaceae are broadly recorded across grassland plots, whereas Gentianaceae and Fabaceae have relatively lower plot frequencies (Fig. 6a). Their elevational distributions are concentrated in high-elevation belts, but with slight differences in distribution centers and ranges (Fig. 6c). The dominant genera include Gentiana, Kobresia, Saussurea, Anaphalis, Artemisia, Anemone, and Carex (Table 2). Kobresia is the most broadly distributed dominant grassland genus across both horizontal space and the elevational gradient, consistent with its role as a major alpine meadow constructive genus (Fig. 6b, d). Gentiana, Saussurea, Anaphalis, Anemone, and Carex are also mainly concentrated in high-elevation grasslands, whereas Artemisia shows a relatively narrower and slightly lower elevational distribution compared with the other dominant genera (Fig. 6d).
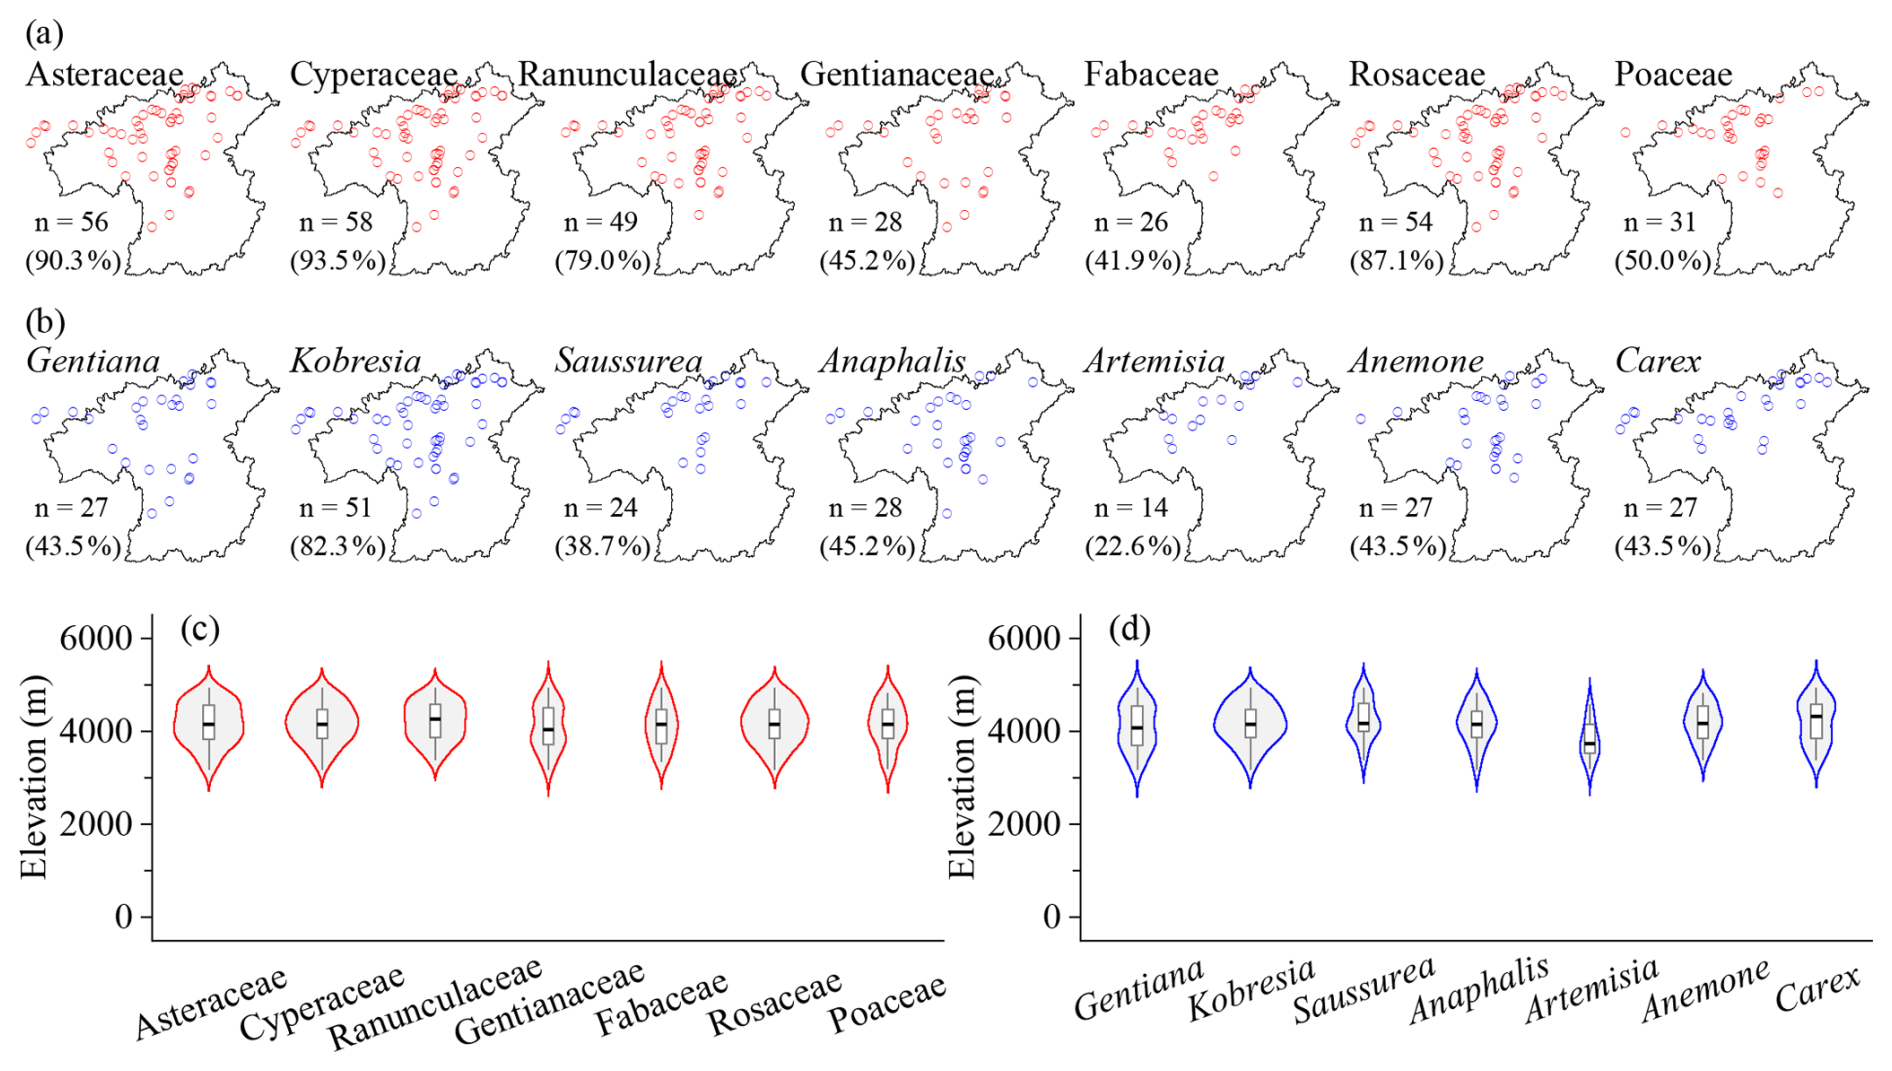
Figure 6Horizontal (a, b) and elevational (c, d) patterns of dominant plant families (a, c) and genera (b, d) in grassland vegetation plots in the HDM-Plot dataset. n denotes the number of plots in which each dominant family or genus was recorded, and the values in parentheses indicate the proportion of all grassland plots.
4.2 Growth forms and life forms
The 1127 species in the HDM-Plot dataset can be categorized into five growth forms (Fig. 7a). Shrubs comprise the largest proportion of recorded species (46.0 %), followed by trees (27.3 %) and herbs (23.6 %), while climbers (2.0 %) and semi-shrubs (1.2 %) contribute a small number of species (Fig. 7a). Among herbs, perennials dominate (92.1 %), while annuals (6.0 %) and biennials (1.9 %) are comparatively rare (Fig. 7b). Woody species show clear contrasts in leaf type and phenology (Fig. 7b). Shrubs are almost composed of broadleaf (98.7 %), with deciduous shrubs (59.7 %) more frequent than evergreen shrubs (40.4 %), whereas trees exhibit a higher proportion of needleleaf species (11.7 %) and a near balance between evergreen (52.3 %) and deciduous (47.8 %) species (Fig. 7b).
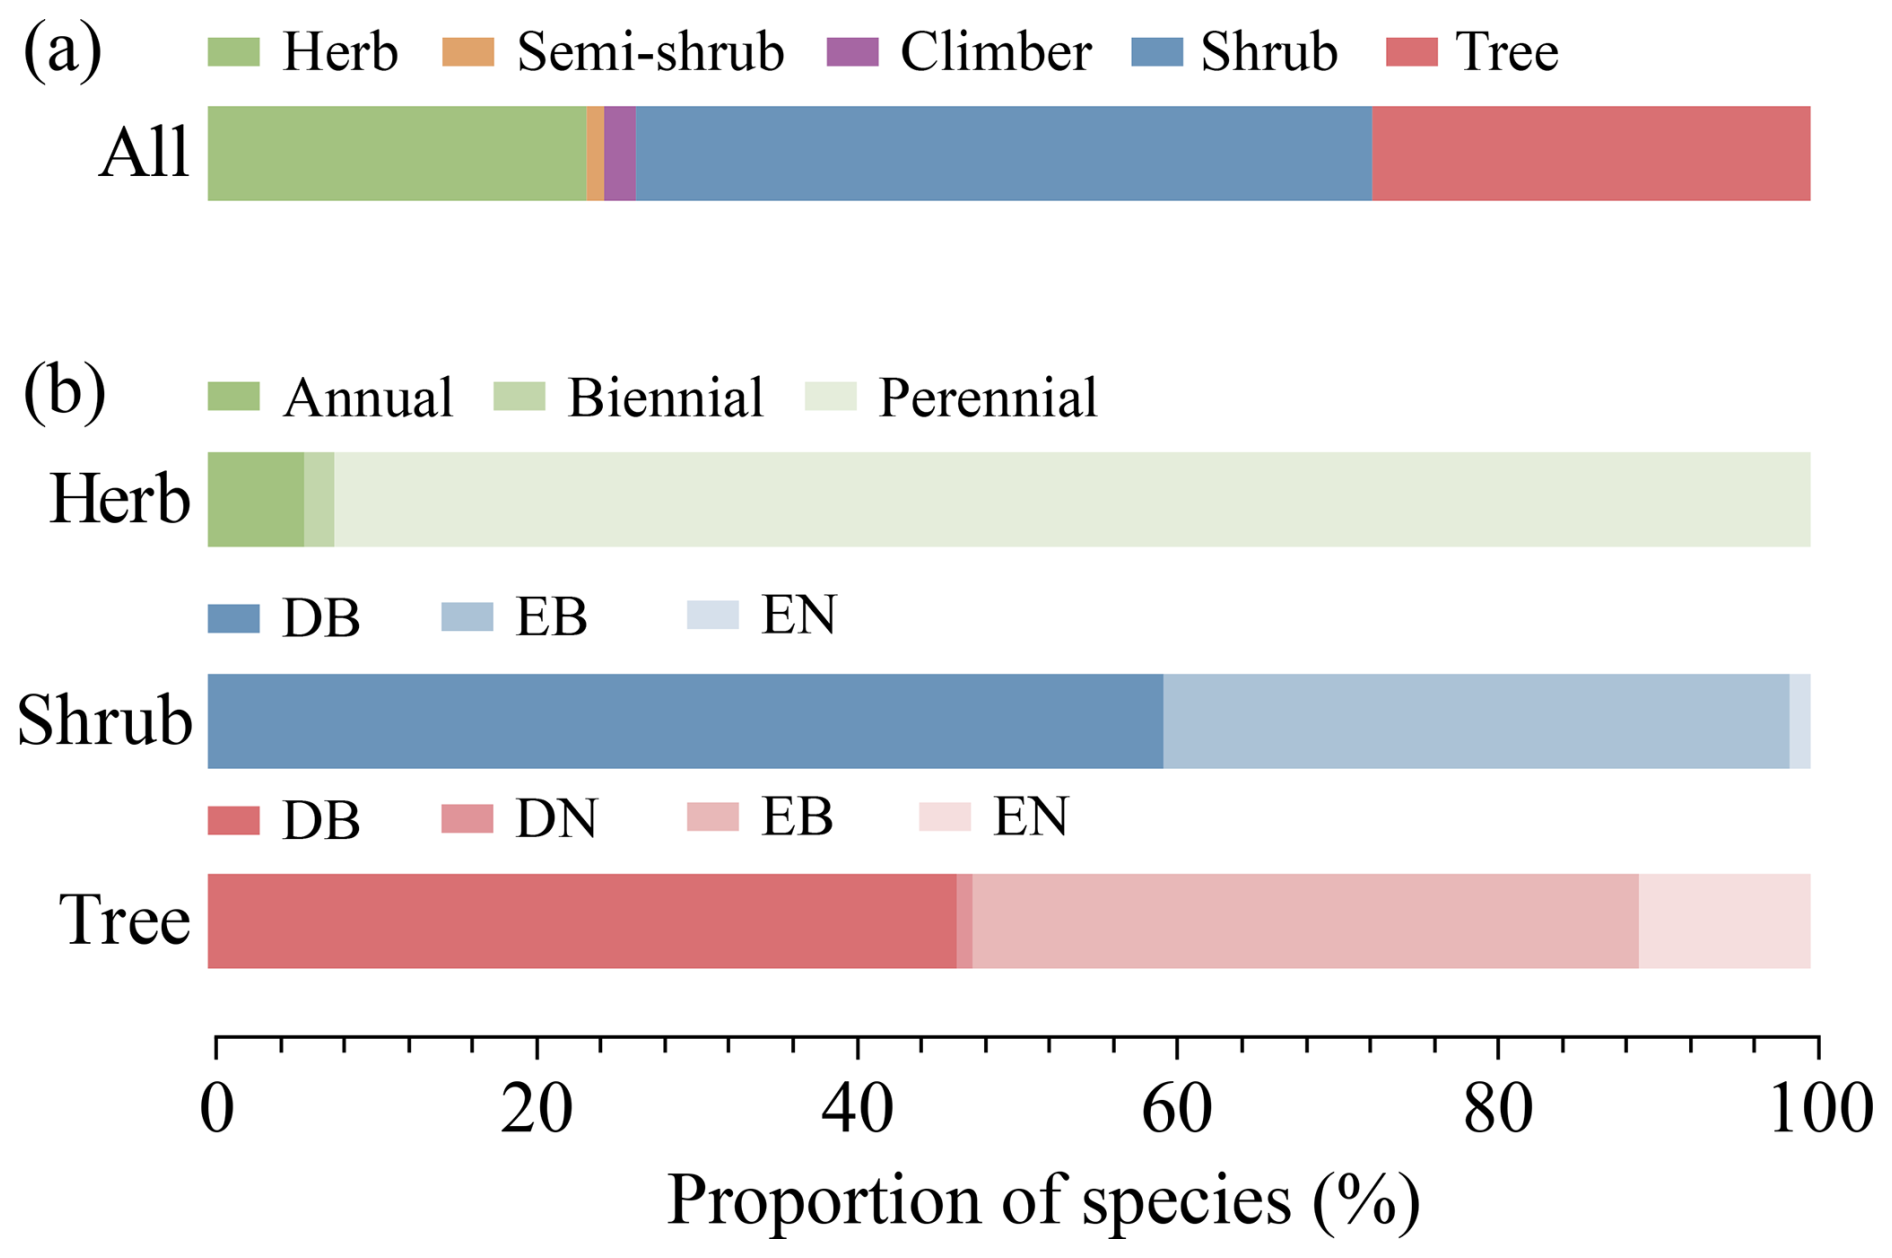
Figure 7Growth-form composition of all species (a) and life-form composition within herbaceous, shrub, and tree species (b) surveyed in the HDM-Plot dataset. Bars show the proportion of species in each category. DB, deciduous broadleaf; DN, deciduous needleleaf; EB, evergreen broadleaf; and EN, evergreen needleleaf.
In the HDM-Plot study region, plot-level species richness shows distinct elevational trends among vegetation types after accounting for plot area (Fig. 8a). Forest plots maintain relatively high species richness from low to middle elevations, followed by a decline toward higher elevations. Shrubland plots show a decreasing trend along the elevational gradient. Grassland plots are restricted to middle- and high-elevation belts, with relatively high richness at the lower part of their observed elevational range and a gradual decline toward higher elevations.
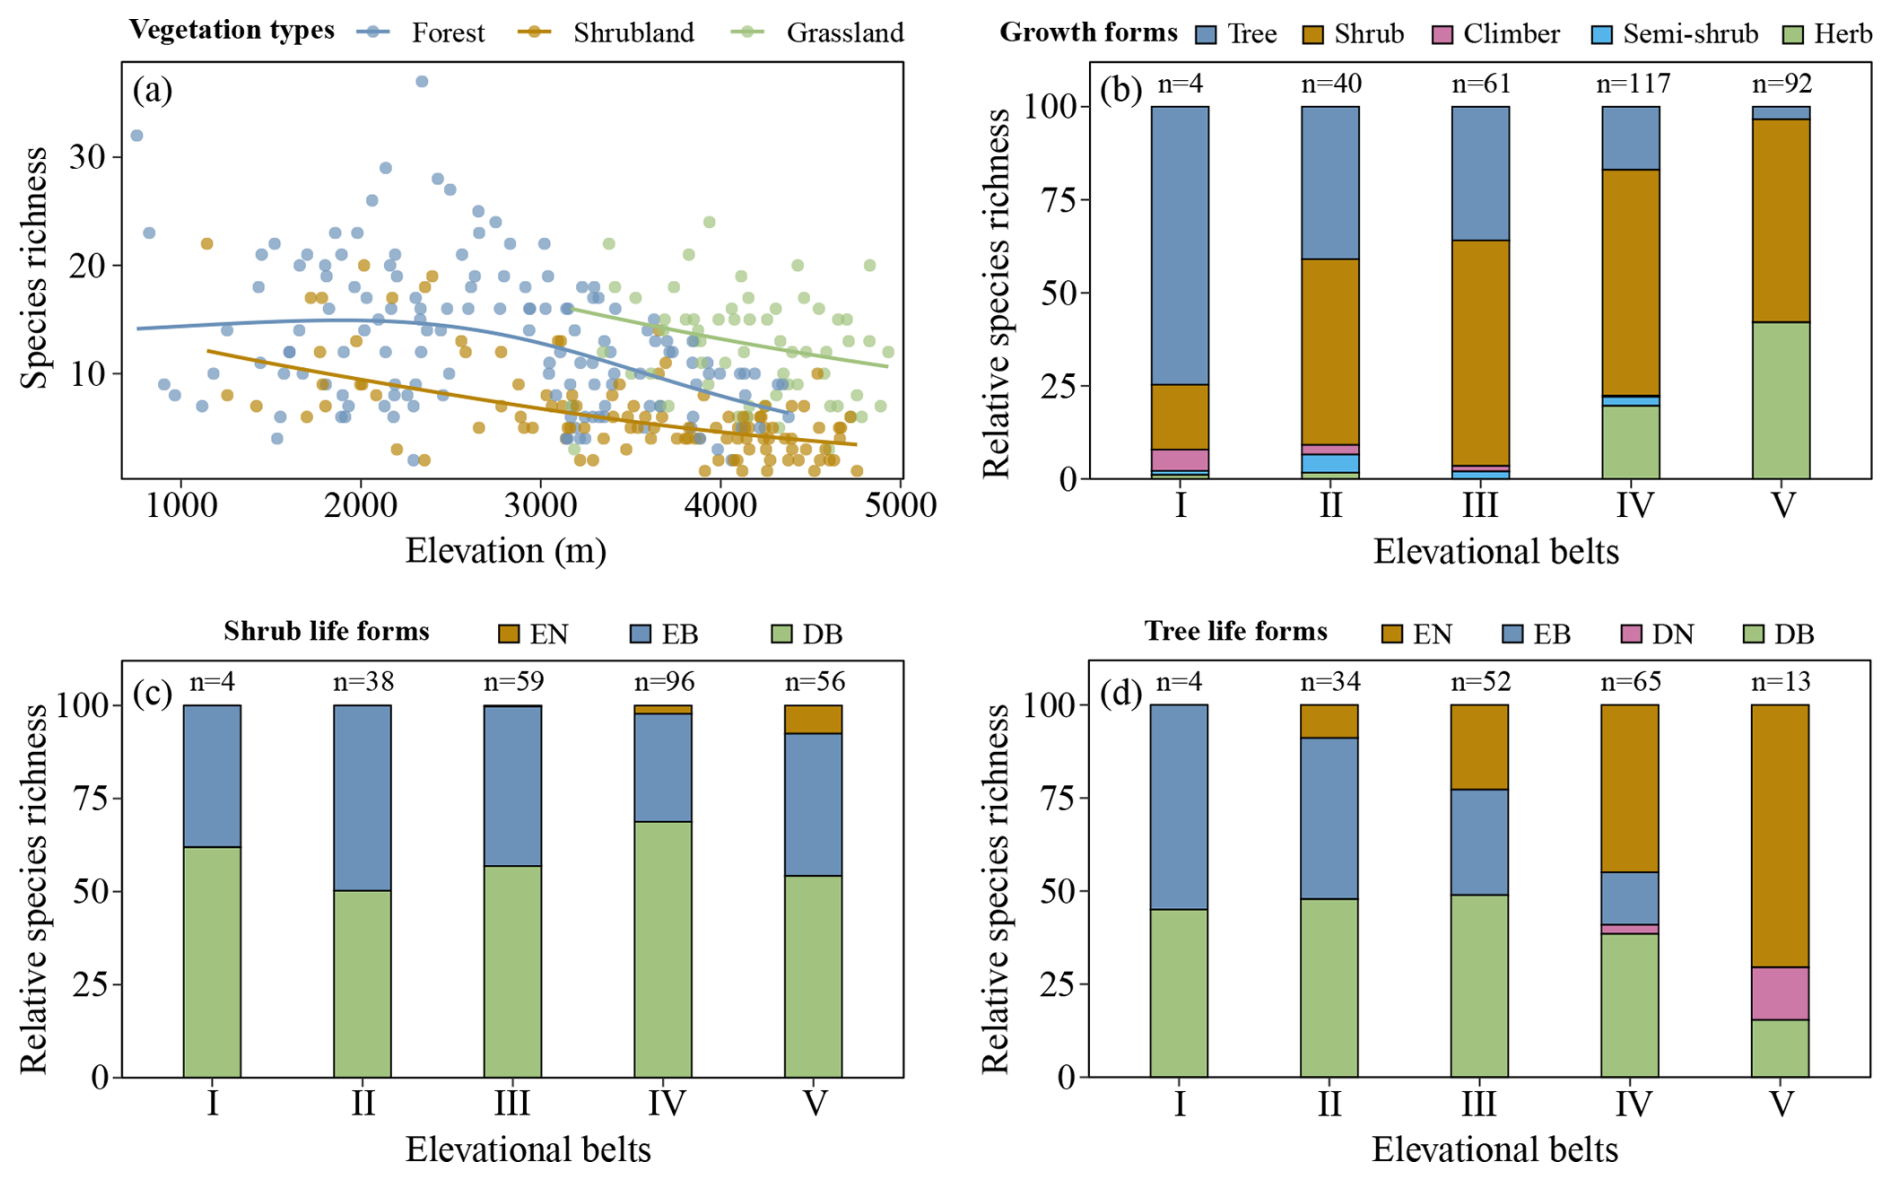
Figure 8Elevational patterns of plot-level species richness (a), growth forms (b), and woody life forms (c, d) in the HDM-Plot dataset. In (a), points represent observed species richness in individual plots, and fitted lines show elevational trends estimated using generalized additive models with plot area included as a covariate. Predictions were standardized to representative plot areas of 100 m2 for forests, 25 m2 for shrublands, and 1 m2 for grasslands. Panels (b)–(d) show mean plot-level proportions within each elevational belt. Elevational belts are defined as (I) 0–1000 m; (II) 1000–2000 m; (III) 2000–3000 m; (IV) 3000–4000 m; and (V) 4000–5000 m. n denotes the number of plots included in each elevational belt. DB, deciduous broadleaf; DN, deciduous needleleaf; EB, evergreen broadleaf; and EN, evergreen needleleaf.
Growth-form composition varies clearly across elevational belts in surveyed plots (Fig. 8b). Trees dominate the lowest elevational belt and decline with increasing elevation. Shrubs remain the major component from low-middle to high elevations and are especially prominent in the middle-elevation belts. Herbs increase strongly toward the highest elevational belt. Woody life-form composition also shifts with elevation (Fig. 8c, d). For shrubs, deciduous broadleaf shrubs dominate most elevational belts, whereas evergreen broadleaf shrubs contribute substantially across the elevational gradient, particularly from low to middle elevations. Evergreen needleleaf shrubs are absent or rare at lower elevations and occur mainly in the upper elevational belts (Fig. 8c). Tree life forms show stronger elevational turnover (Fig. 8d). Evergreen broadleaf trees are more common at low elevations and decrease sharply toward higher elevations. Deciduous broadleaf trees contribute substantially from low to middle-high elevations but decline in the highest belt. Evergreen needleleaf trees increase with elevation and become dominant in the upper belts. Deciduous needleleaf trees are largely restricted to high-elevation belts (Fig. 8d).
4.3 Floristic characteristics
At the family level, 117 families can be assigned to 10 areal-type categories (Fig. 9a). Cosmopolitan families account for 30.8 % of the total, tropical families for 39.3 %, and temperate families for 29.9 %. Pantropic families comprise the largest share within tropical families (63.0 %), with species-rich families including Lauraceae, Sapindaceae, Celastraceae, Euphorbiaceae, and Anacardiaceae. North temperate families account for 62.9 % of the temperate component, represented by Ericaceae, Fagaceae, Berberidaceae, Salicaceae, and Pinaceae. These patterns reflect that the floristic composition of the HDM-Plot study region retains tropical–subtropical elements while also incorporating temperate–alpine attributes.
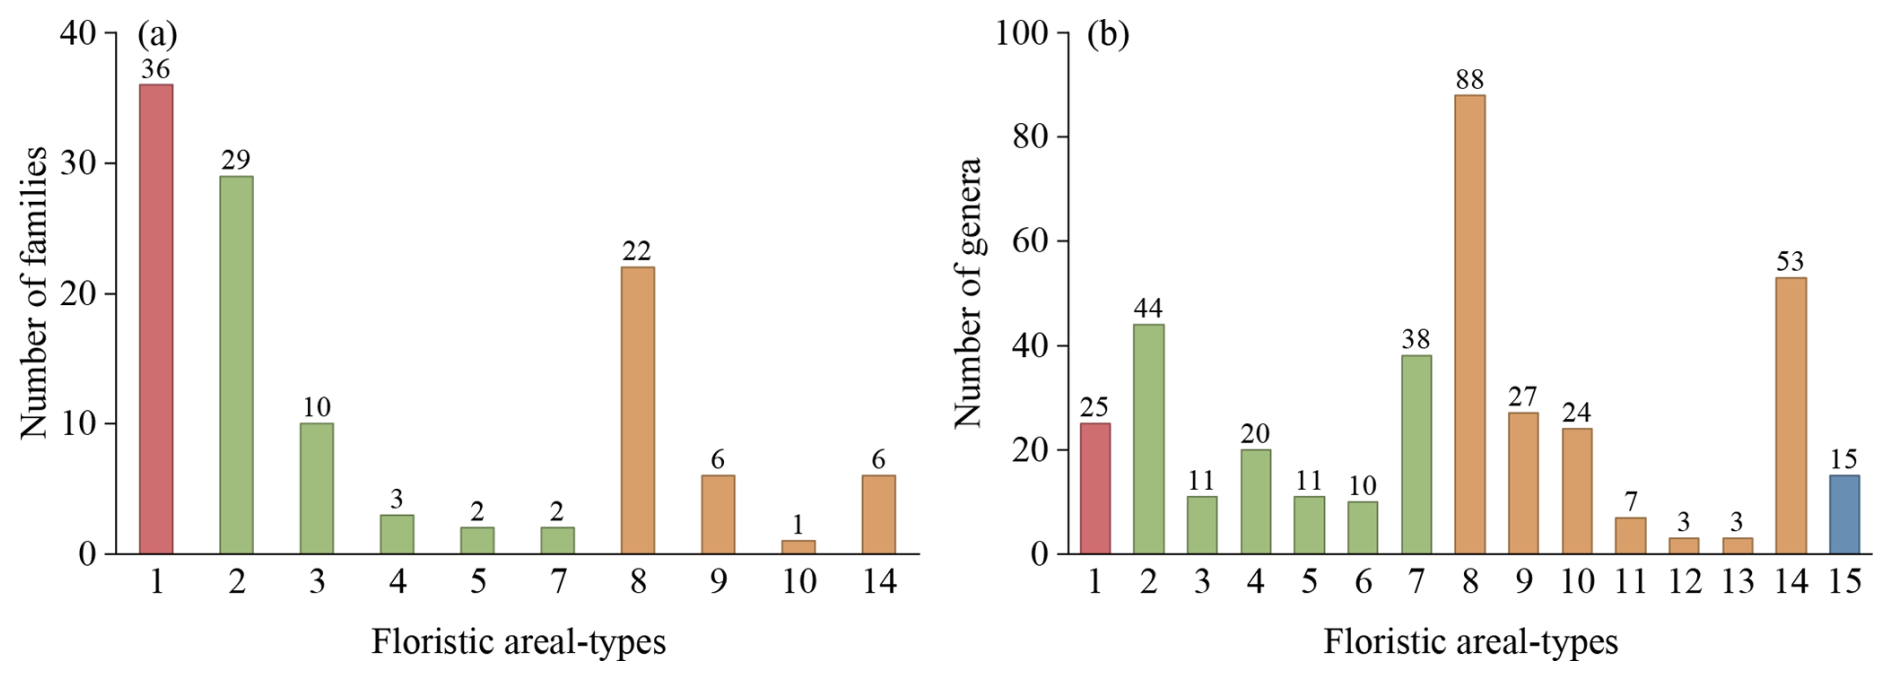
Figure 9Floristic areal-types of plant families (a) and genera (b) surveyed in the HDM-Plot dataset. (1) Cosmopolitan; (2) Pantropic; (3) Tropical Asia & Tropical America disjuncted; (4) Old World Tropics; (5) Tropical Asia & Tropical Australasia; (6) Tropical Asia to Tropical Africa; (7) Tropical Asia (Indo–Malaysia); (8) North Temperate; (9) East Asia & North America disjuncted; (10) Old World Temperate; (11) Temperate Asia; (12) Mediterranean, West Asia to Central Asia; (13) Central Asia; (14) East Asia; and (15) Endemic to China (Wu, 1991; Wu et al., 2003). Bar colors indicate four floristic areal-type groups: cosmopolitan (red), tropical (green), temperate (orange), and endemic to China (blue).
At the genus level, 379 genera can be assigned into 15 areal-type categories (Fig. 9b). Temperate genera dominate (54.1 %), followed by tropical genera (35.4 %), whereas cosmopolitan (6.6 %) and Chinese endemic genera (4.0 %) are less frequent. Temperate genera are mainly north temperate (42.9 %), represented by Rhododendron, Berberis, Cotoneaster, Salix, and Quercus. For tropical genera, pantropical (32.8 %) and tropical Asian (28.4 %) areal-types are most common, with Ilex and Indigofera as pantropical representatives and Fargesia, Leptodermis, Caryopteris, and Corylopsis as East Asian representatives. Compared with the family level, the genus level composition shows a clear shift toward temperate elements. However, when the number of species contained in each areal-type group is considered, temperate genera account for 66.7 % of the recorded species, whereas tropical genera account for 23.3 % (Table S2). A plot–genus occurrence analysis further shows that temperate genera dominate plot-level occurrence records and are mainly associated with high elevations, whereas tropical genera are more closely associated with low elevations (Fig. S2). Both temperate and tropical genera are spatially widespread within the study region, but the number of plot-level occurrence records of temperate genera is nearly four times that of tropical genera (Fig. S2). Therefore, the dataset records transitional floristic features across the Hengduan Mountains and adjacent regions, while temperate elements remain dominant when species representation and plot-level occurrence are considered.
4.4 Vegetation classification
Based on field surveys and the revised vegetation classification system of China (Guo et al., 2020), 314 plots can be classified into three vegetation formation groups, namely forest, shrubland, and grassland (Fig. 10; Table S4). These plots can be further classified into 18 vegetation formations, 142 alliance groups, 209 alliances, 238 association groups, and 299 associations (Table S4). Because these lower-level units are highly detailed and many are represented by only one plot, the full hierarchical classification is provided in Table S4 and in the published dataset, whereas the main text focuses on vegetation formation groups and vegetation formations (Fig. 10; Table 3).
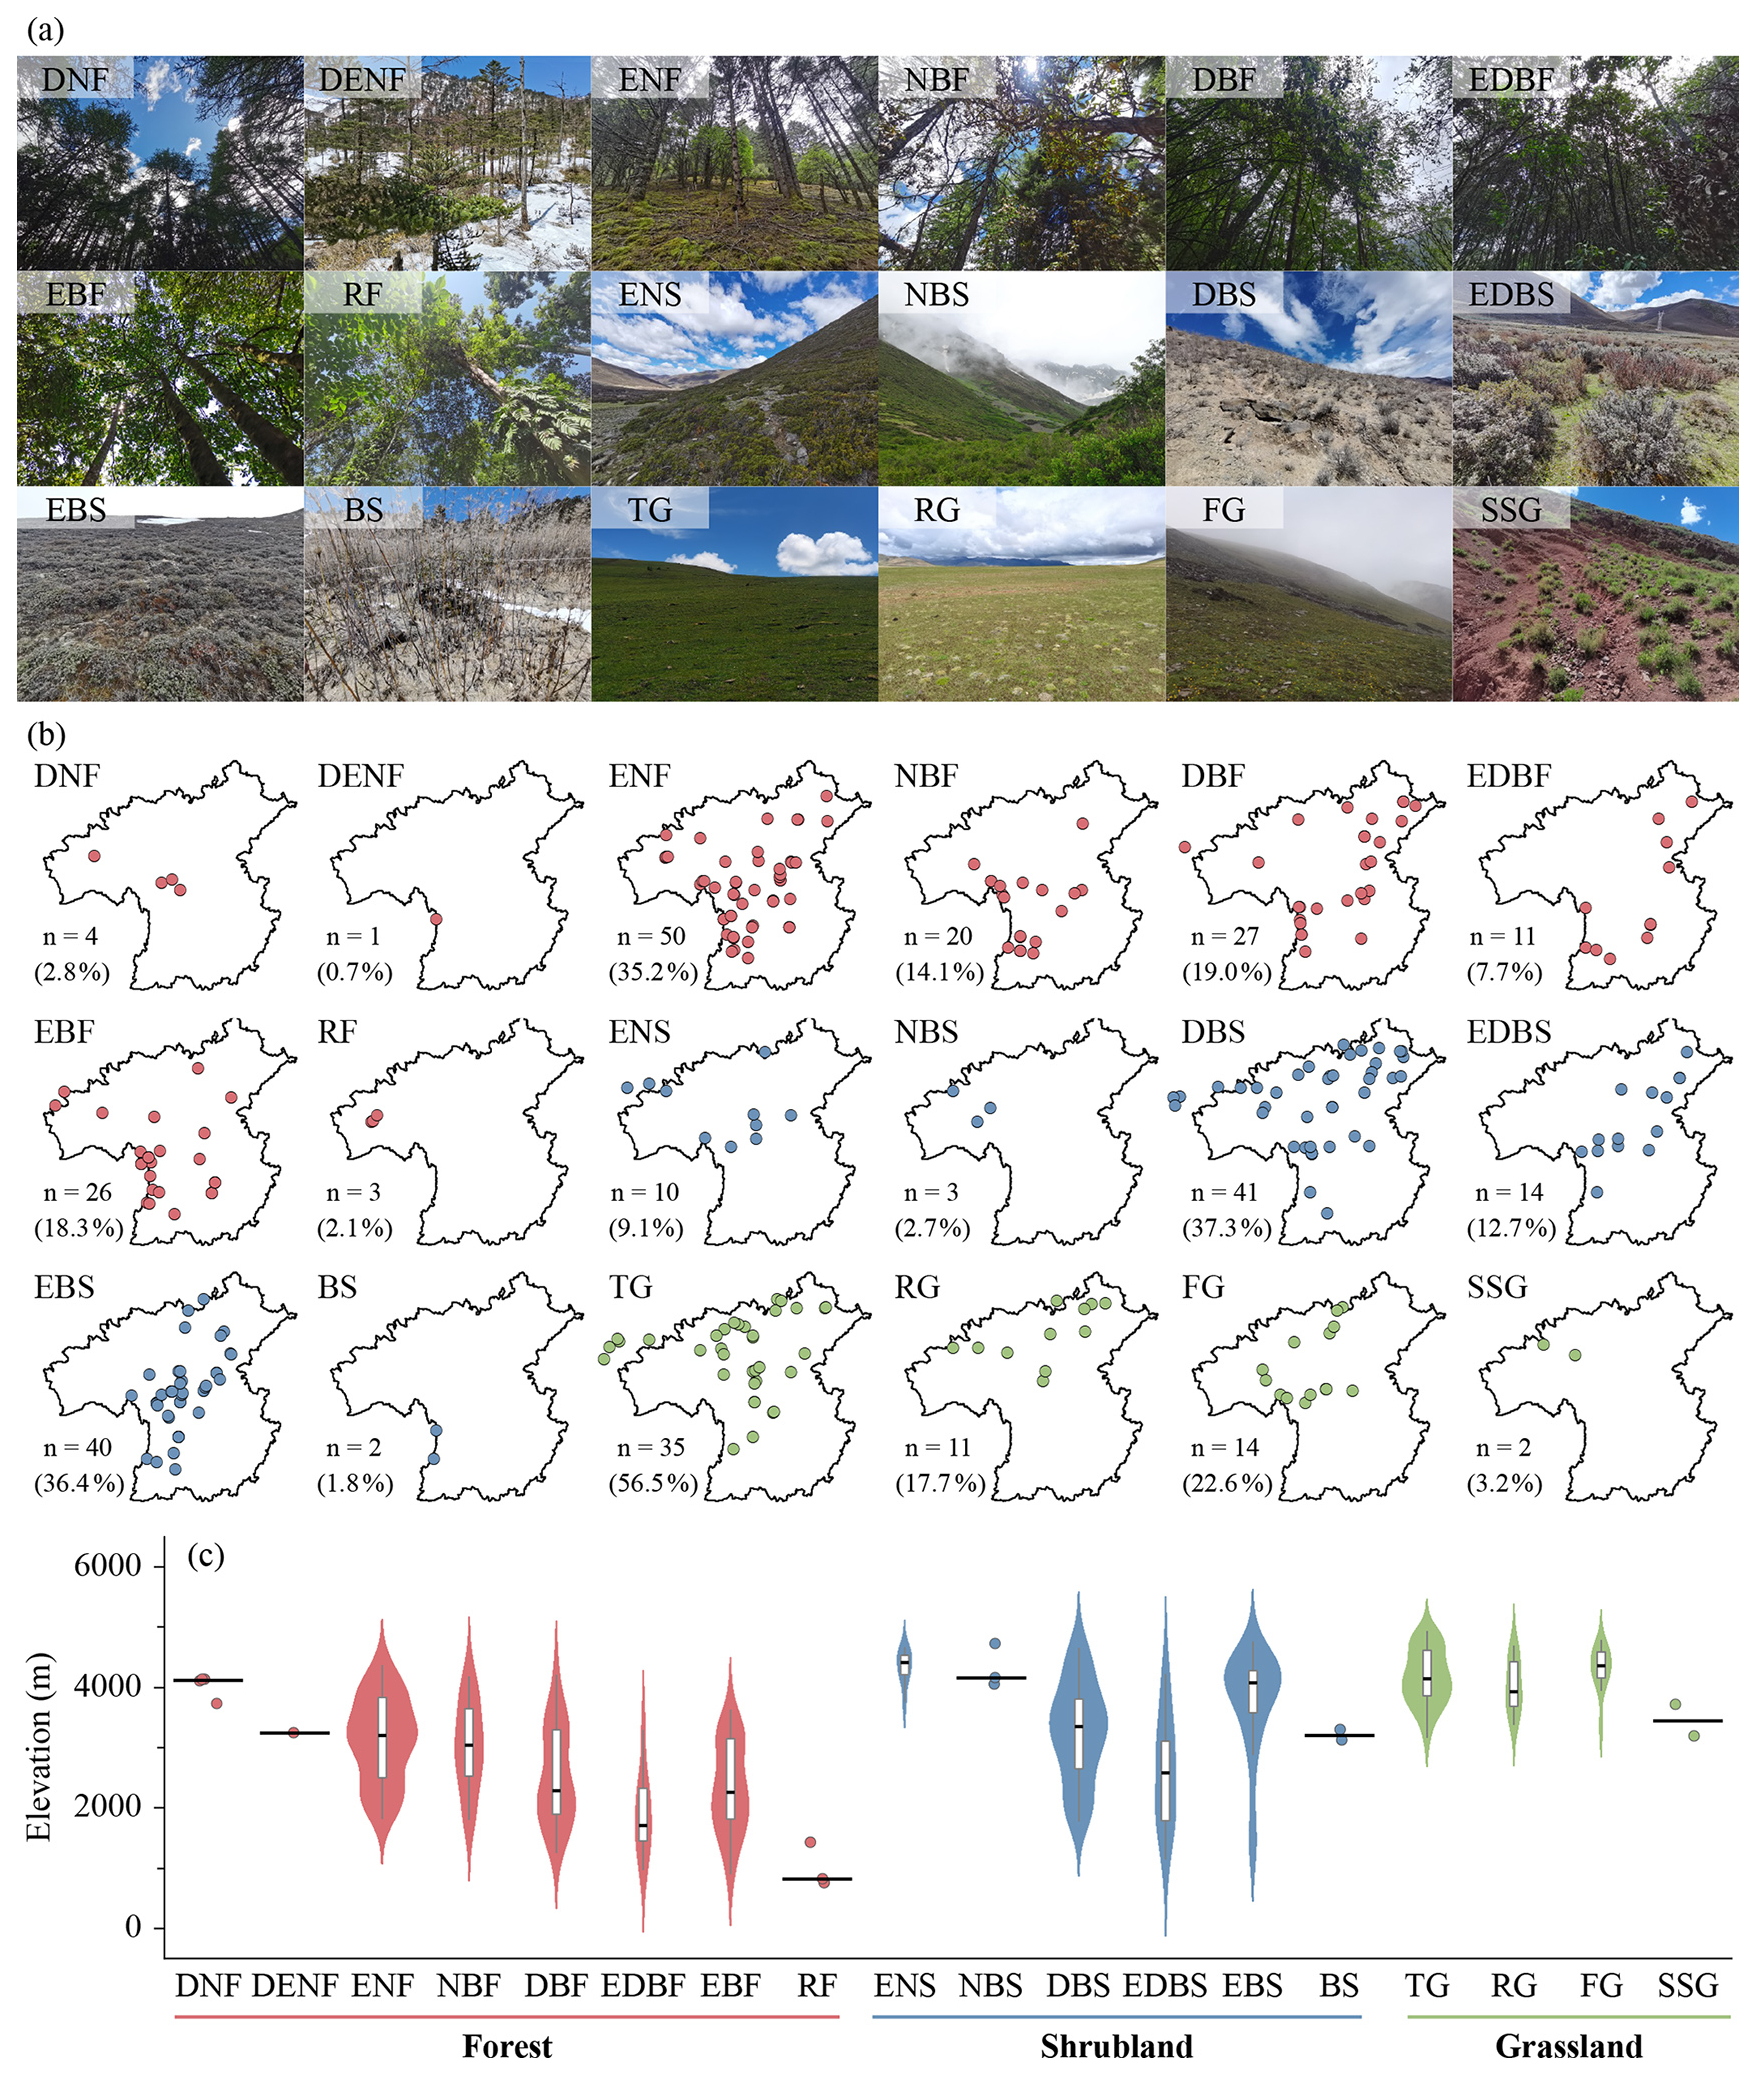
Figure 10Representative photographs (a), horizontal distribution (b), and elevational distribution (c) of vegetation formations in the HDM-Plot dataset. Red, blue, and green points represent forest, shrubland, and grassland formations, respectively. n denotes the number of plots for each vegetation formation, and values in parentheses indicate the proportion of the corresponding formation group. Violin plots with embedded boxplots are shown for vegetation formations represented by at least five plots, whereas formations with fewer than five plots are displayed as individual points only. Black horizontal lines reflect median elevation. DNF, deciduous needleleaf forest; DENF, mixed deciduous and evergreen needleleaf forest; ENF, evergreen needleleaf forest; NBF, mixed needleleaf and broadleaf forest; DBF, deciduous broadleaf forest; EDBF, mixed evergreen and deciduous broadleaf forest; EBF, evergreen broadleaf forest; RF, rainforest; ENS, evergreen needleleaf shrubland; NBS, needleleaf and broadleaf shrubland; DBS, deciduous broadleaf shrubland; EDBS, evergreen and deciduous broadleaf shrubland; EBS, evergreen broadleaf shrubland; BS, bamboo shrubland; TG, tussock grassland; RG, rhizome grassland; FG, forb grassland; and SSG, semi-shrubby grassland.
Table 3Summary of community characteristics and structure in the HDM-Plot dataset.
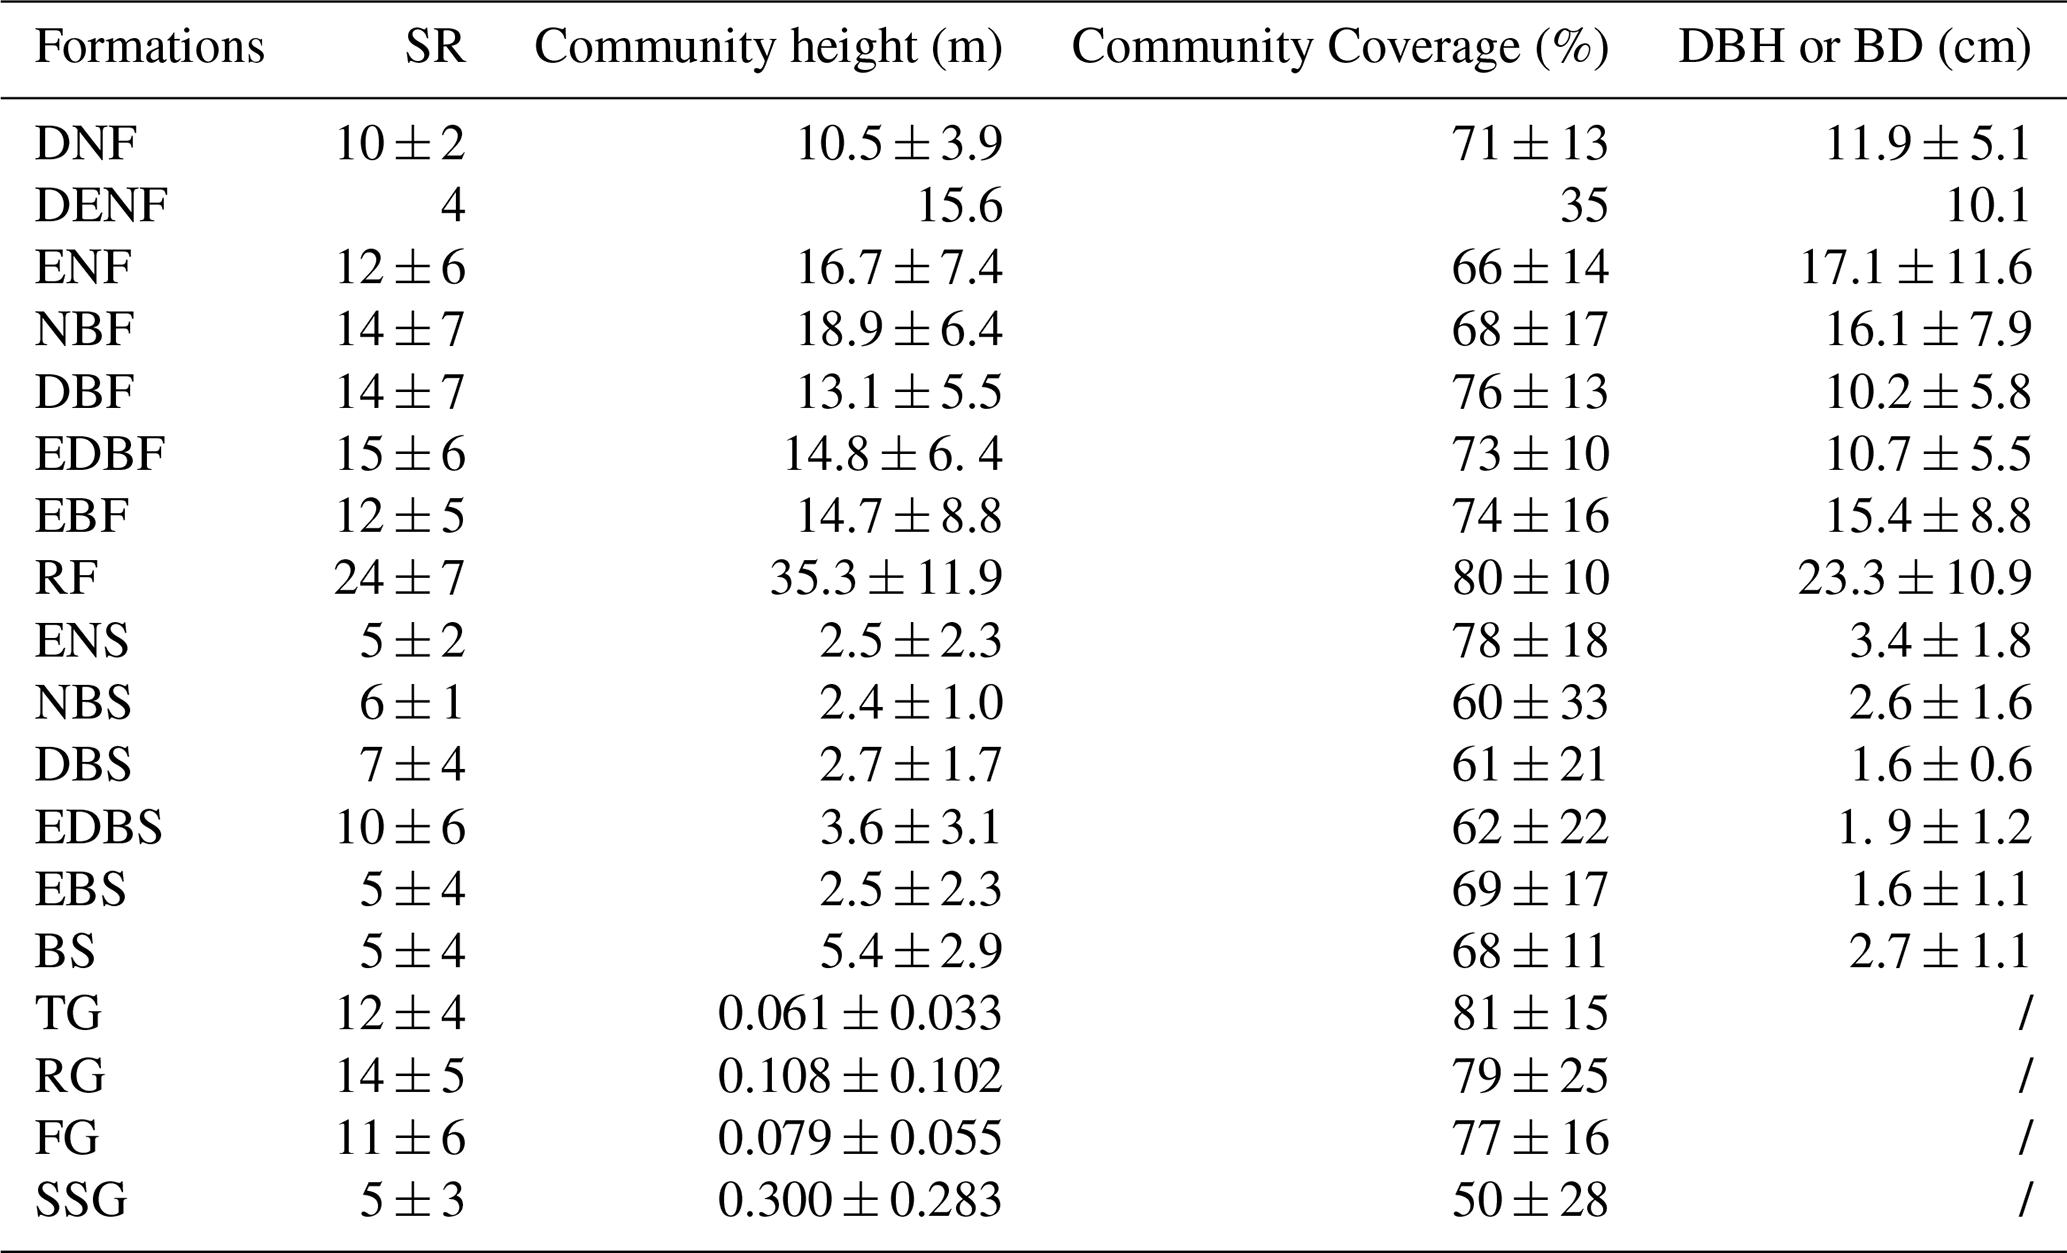
Values are summarized at the plot level within each vegetation formation and are shown as mean ± SD. SR denotes species richness per plot. DBH or BD represents the mean diameter at breast height or basal diameter of woody species within each plot.
Forest vegetation formation group includes eight vegetation formations: deciduous needleleaf forest (DNF), mixed deciduous and evergreen needleleaf forest (DENF), evergreen needleleaf forest (ENF), mixed needleleaf and broadleaf forest (NBF), deciduous broadleaf forest (DBF), mixed evergreen and deciduous broadleaf forest (EDBF), evergreen broadleaf forest (EBF), and rainforest (RF) (Table S4). DNF includes only one alliance (Larix potaninii var. macrocarpa) and appears at 3732–4136 m in the central and northwestern study region. It has 10 ± 2 species per plot, community height of 10.5 ± 3.9 m, coverage of 71 ± 13 %, and mean DBH of 11.9 ± 5.1 cm. DENF is also rare and was recorded from a single plot in Fugong (western border between China and Myanmar) at 3247 m. This plot contains 4 species, community height of 15.6 m, coverage of 35 %, and mean DBH of 10.1 cm. ENF is widespread throughout the study region at 1809–4377 m and is constructed by Pinus, Abies, Picea, Juniperus, and Tsuga. It includes 12 ± 6 species per plot, community height of 16.7 ± 7.4 m, coverage of 66 ± 14 %, and mean DBH of 17.1 ± 11.6 cm. NBF is concentrated in the southern study region at 1801–4189 m and typically combines Pinus, Abies and Picea with broadleaf trees such as Quercus, Alnus, and Lithocarpus. This formation records 14 ± 7 species per plot, community height of 18.9 ± 6.4 m, coverage of 68 ± 17 %, and mean DBH of 16.1 ± 7.9 cm. DBF is widely distributed at 1256–4217 m, excluding the northwestern study region, and is commonly constructed by Alnus, Betula, Quercus, and Populus. The corresponding plot-level values are 14 ± 7 species per plot, 13.1 ± 5.5 m in community height, 76 ± 13 % in coverage, and 10.2 ± 5.8 cm in mean DBH. EDBF occurs patchily from the southwestern to northeastern study region at 966–3298 m, where evergreen components mainly Quercus and Castanopsis co-occur with deciduous broadleaf taxa such as Alnus. It has 15 ± 6 species per plot, community height of 14.8 ± 6.4 m, coverage of 73 ± 10 %, and mean DBH of 10.7 ± 5.5 cm. EBF is widespread at low to middle elevations (906–3636 m) in the study region and is most frequently constructed by Quercus. This formation surveys 12 ± 5 species per plot, 14.7 ± 8.8 m in community height, 74 ± 16 % in coverage, and 15.4 ± 8.8 cm in mean DBH. RF is restricted to the lowest elevations in Medog, northwestern part of the study region (754–1431 m) and is characterized by tropical and subtropical trees. RF plots contain 24 ± 7 species per plot, community height of 35.3 ± 11.9 m, coverage of 80 ± 10 %, and mean DBH of 23.3 ± 10.9 cm (Fig. 10; Table 3).
Shrubland vegetation formation group can be further divided into six vegetation formations: evergreen needleleaf shrubland (ENS), needleleaf and broadleaf shrubland (NBS), deciduous broadleaf shrubland (DBS), evergreen and deciduous broadleaf shrubland (EDBS), evergreen broadleaf shrubland (EBS), and bamboo shrubland (BS) (Table S4). ENS consists of two alliances (Juniperus squamata and J. convallium) and occurs mainly along the central and northwestern margin of the study region at 3757–4668 m. ENS plots have 5 ± 2 species per plot, community height of 2.5 ± 2.3 m, coverage of 78 ± 18 %, and mean BD of 3.4 ± 1.8 cm. NBS is rare and was surveyed from high-elevational area (4044–4720 m) in Chamdo, northwestern part of the study region, where Juniperus co-occurs with broadleaf shrubs including Ribes, Salix, and Spiraea. Its plot-level values are 6 ± 1 species per plot, 2.4 ± 1.0 m in community height, 60 ± 33 % in coverage, and 2.6 ± 1.6 cm in mean BD. DBS is widespread across the study region at 1772–4662 m and is most frequently dominated by Berberis, Salix, Rosa, Cotoneaster, and Sibiraea. This formation includes 7 ± 4 species per plot, community height of 2.7 ± 1.7 m, coverage of 61 ± 21 %, and mean BD of 1.6 ± 0.6 cm. EDBS spans a broad elevational gradient (1144–4226 m) from the central to northeastern study region and features mixtures of evergreen (e.g., Rhododendron and Daphne) with deciduous components (e.g., Rosa and Zanthoxylum). EDBS plots contain 10 ± 6 species per plot, community height of 3.6 ± 3.1 m, coverage of 62 ± 22 %, and mean BD of 1.9 ± 1.2 cm. EBS is widely distributed from the southwestern to northeastern study region at 1257–4758 m and is commonly dominated by Rhododendron and Quercus. It has 5 ± 4 species per plot, community height of 2.5 ± 2.3 m, coverage of 69 ± 17 %, and mean BD of 1.6 ± 1.1 cm. BS is uncommon in the dataset and was found in Yunnan Province at 3120–3290 m and includes two alliances (Fargesia gongshanensis and F. melanostachys). BS plots record 5 ± 4 species per plot, community height of 5.4 ± 2.9 m, coverage of 68 ± 11 %, and mean BD of 2.7 ± 1.1 cm (Fig. 10; Table 3).
Grassland vegetation formation group comprises four vegetation formations: tussock grassland (TG), rhizome grassland (RG), forb grassland (FG), and semi-shrub grassland (SSG) (Table S4). TG is widespread across the study region at 3168–4932 m and is strongly dominated by Kobresia, especially the widespread alpine meadow species K. pygmaea (24 plots). This formation has 12 ± 4 species per plot, community height of 0.061 ± 0.033 m, and coverage of 81 ± 15 %. RG occurs mainly in the northern study region at 3379–4701 m and is represented by Carex, with C. enervis frequently recorded. It contains 14 ± 5 species per plot, community height of 0.108 ± 0.102 m, and coverage of 79 ± 25 %. FG is concentrated from the central to northern study region at 3345–4784 m and is characterized by forb constructed communities, with Argentina as a common genus. Its plot-level values are 11 ± 6 species per plot, 0.079 ± 0.055 m in community height, and 77 ± 16 % in coverage. SSG is rare and has a single alliance (Artemisia vestita), observed in dry-hot valleys in the northwestern study region at 3186–3710 m. The alliance has 5 ± 3 species per plot, community height of 0.300 ± 0.283 m, and coverage of 50 ± 28 % (Fig. 10; Table 3).
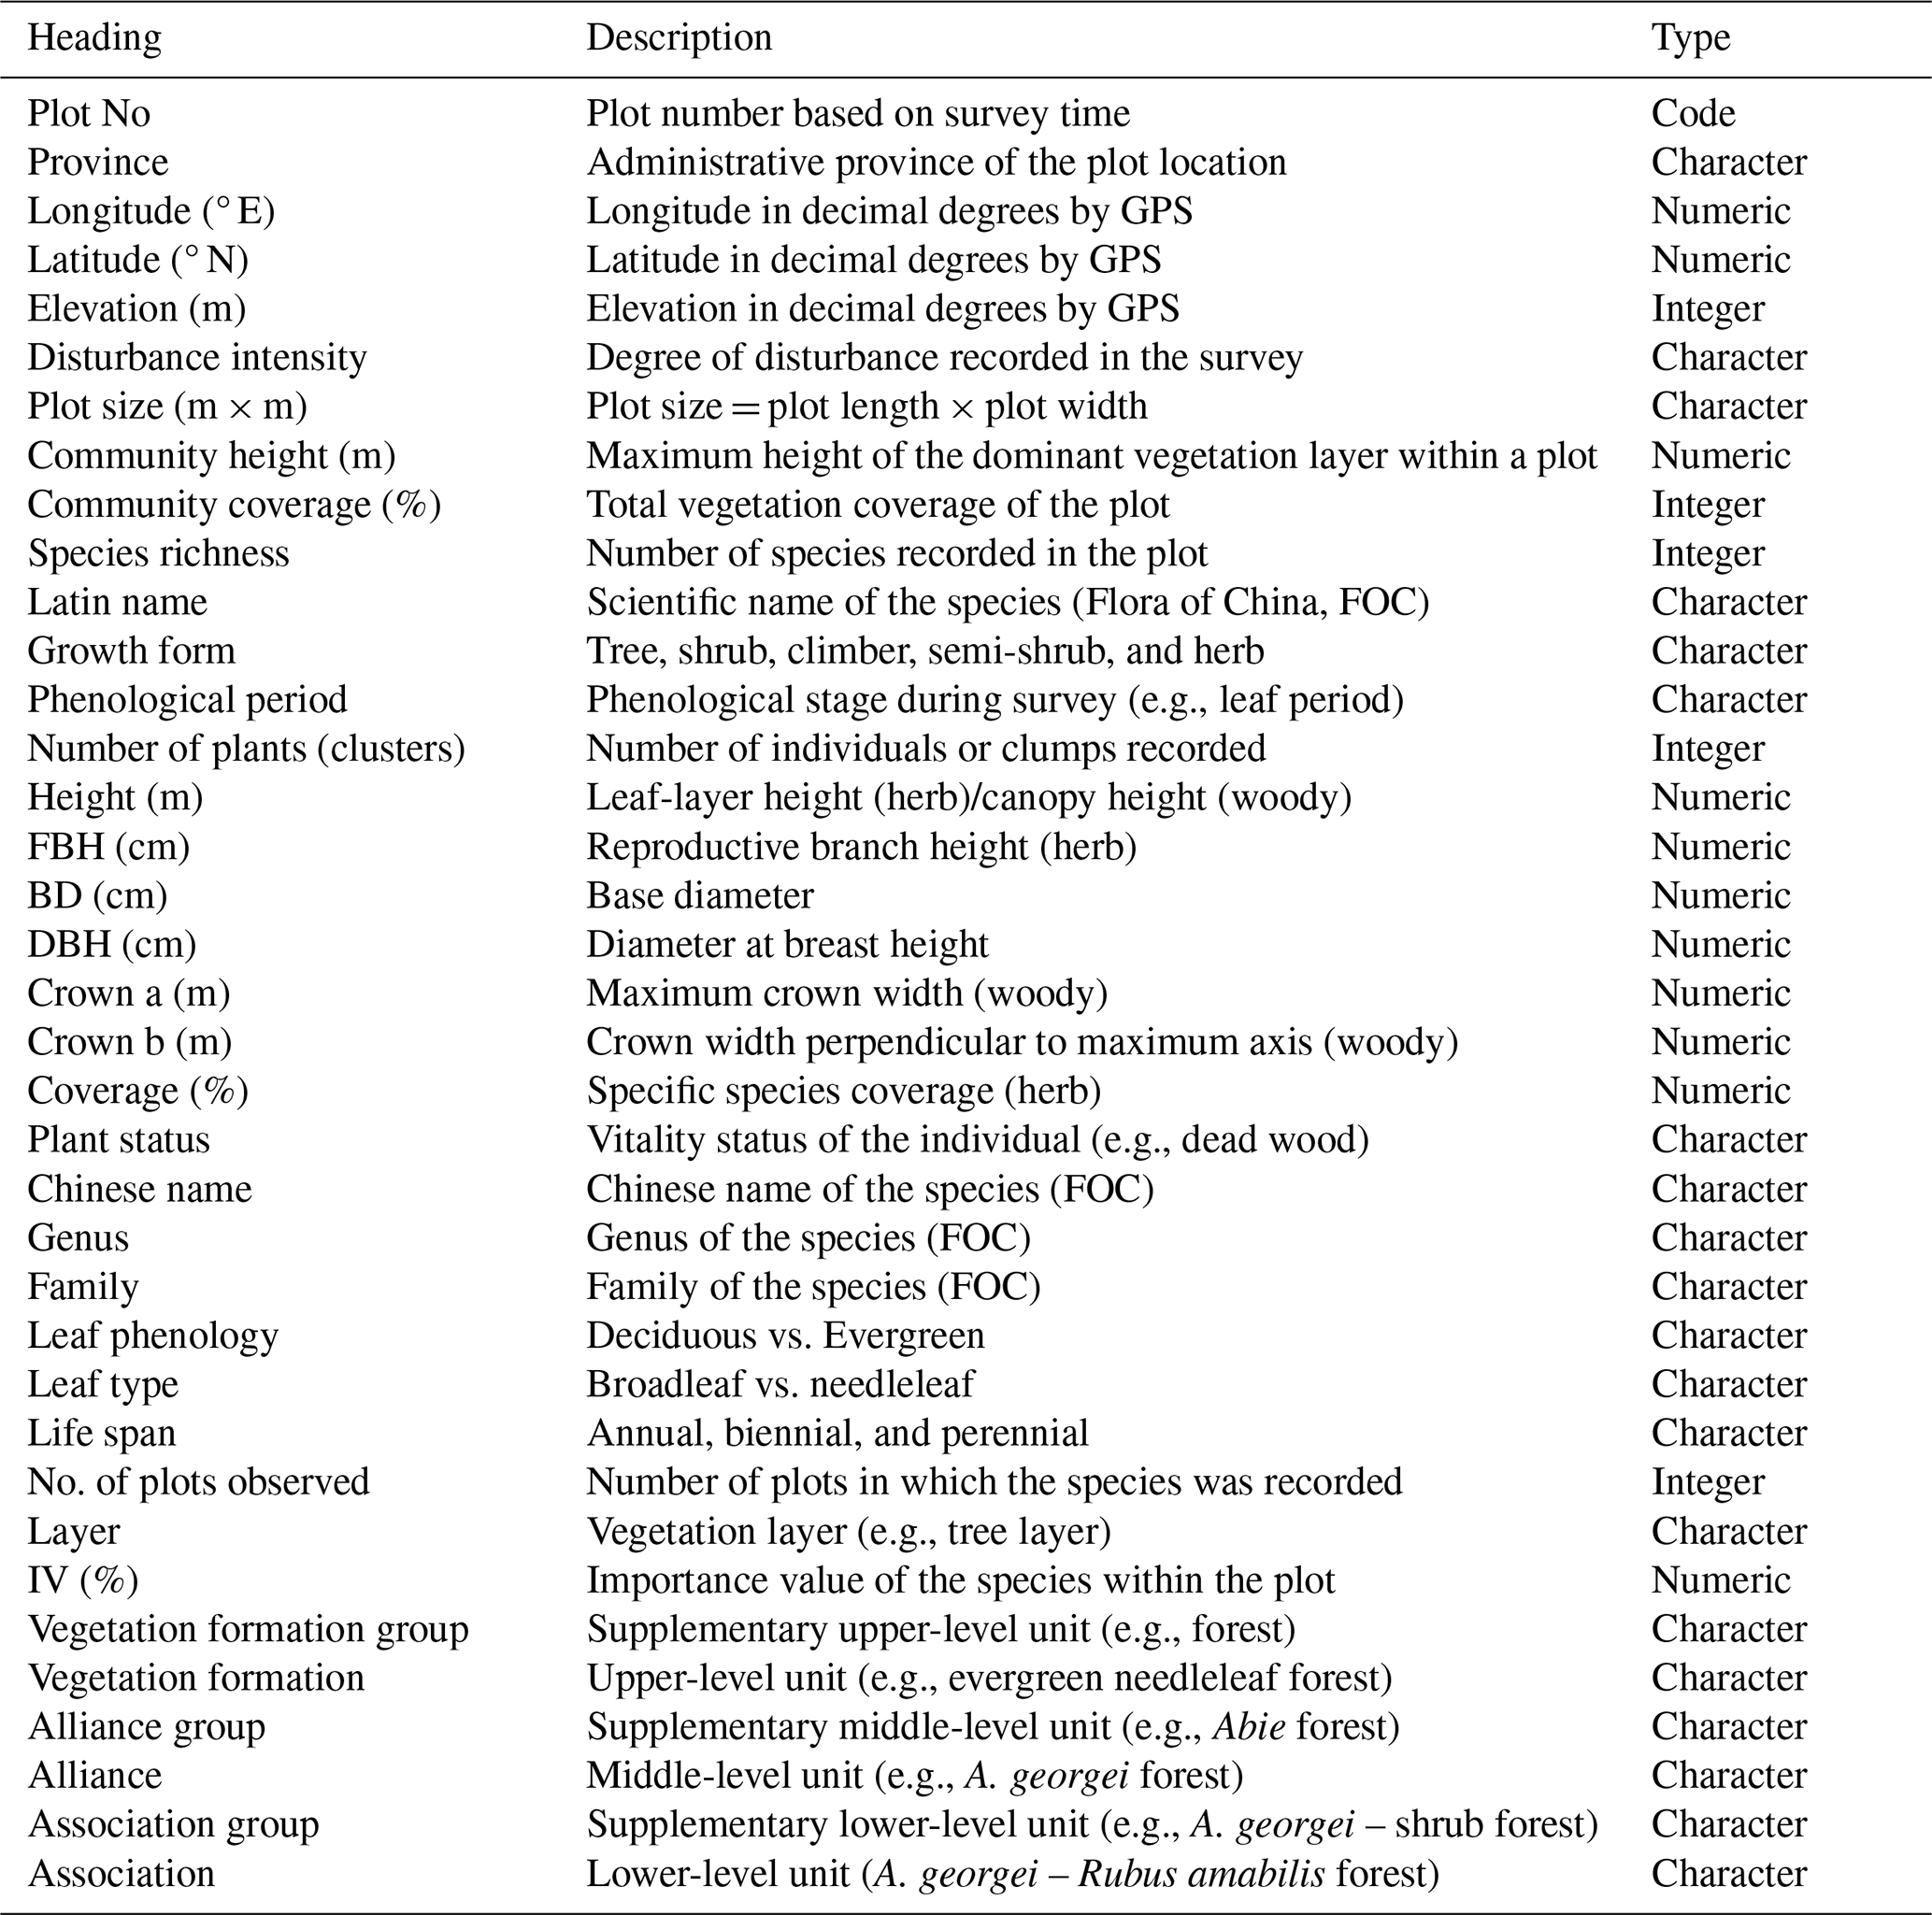
The HDM-Plot dataset includes two components: a plot dataset and a habitat photo dataset. The plot dataset is provided as a Microsoft Excel format containing six sheets: (1) summary (Table 4); (2) basic plot information; (3) raw plot survey data; (4) species list; (5) species importance values; and (6) vegetation classification. The habitat photo dataset is organized by survey period (i.e., 202203, 202205, 2023, and 2024). Photo files are provided in JPG format, named by plot ID, and correspond to the plots in the dataset. The dataset is publicly available from Figshare (Jin et al., 2026a; https://doi.org/10.6084/m9.figshare.32706207) and through the National Tibetan Plateau/Third Pole Environment Data Center (Jin et al., 2026b; https://doi.org/10.11888/Terre.tpdc.303394).
The HDM-Plot dataset was compiled from four extensive fieldworks conducted by our research group between 2022 and 2024. It provides detailed raw records from 314 vegetation plots spanning major vegetation types in the HDM and adjacent regions, from low-elevational dry-hot valleys to subalpine and alpine areas. The dataset offers a robust, standardized data for studies of vegetation ecology, conservation planning, and ecological restoration in this biodiversity hotspot, and provides an important regional complement to global vegetation plot compilations such as the sPlot (Sabatini et al., 2021), which rarely include the vegetation plots from southwestern China and the Tibetan Plateau. The localized vegetation plot dataset can be integrated into existing global plot database of sPlot, and further contributes to large-scale synthesis.
Several limitations remain due to the challenging field conditions and constraints in manpower and resources. First, although the surveyed plots cover broad vegetation types, climatic space, and elevational gradients (Fig. 2), the study region, especially the HDM has extremely complex topography and highly heterogeneous vegetation, and steep terrain often prevented the establishment of fully standardized plots. As a result, plot size could not always be kept uniform, and plot distribution may be uneven in some areas, which can affect representativeness and comparability. Second, given the high diversity and strong spatial turnover of species composition, individual plots may not fully capture the regional variability, potentially producing sampling bias. Third, some plot attributes, such as plant height, crown width, and coverage, were visually estimated in the field and may therefore be subject to observer uncertainty. Nevertheless, these limitations should be viewed in the context of field-based vegetation surveys in a topographically complex and highly heterogeneous mountain region. Assembling a large, structurally detailed plot dataset under harsh field conditions represents a vital contribution. More importantly, we believe that the dataset remains a valuable community resource for large-scale mountain vegetation studies, as it provides standardized and openly accessible plot-level records from highly heterogeneous and relatively underrepresented mountain region. We expect the HDM-Plot dataset to provide a valuable reference for ongoing and future efforts of vegetation reassessment and ecological research across the region.
Compared with our previously published dataset on the Tibetan Plateau (Jin et al., 2022), the HDM-Plot dataset fills a key geographic gap on the southeastern Plateau and demonstrates enhanced representativeness about plot distribution, species richness, and vegetation types. Plots are not restricted to areas along major roads, but also extend into accessible valleys and pathways. This is the first comprehensive vegetation plot dataset for the HDM and adjacent regions to our knowledge with broad spatial coverage and representation of diverse vegetation types. In addition to raw species composition records, the dataset provides standardized geographic coordinates, species list, and hierarchical vegetation classifications.
The vegetation classification in the HDM-Plot dataset follows the revised vegetation classification system of China (Guo et al., 2020), emphasizing field-based community physiognomy, vertical structure, constructive species, and species importance values. This approach provides a field-based and nationally consistent framework for vegetation classification and future comparison with the Vegegraphy of China. During vegetation classification, we observed shrubland communities in which co-constructive species differ in leaf type and phenology, analogous to mixed forests. For example, shrublands jointly dominated by Juniperus and Rhododendron combine needleleaf and broadleaf components and may include evergreen and deciduous elements. Accordingly, we introduced two shrubland vegetation formations within the Guo et al. (2020) scheme: (a) needleleaf and broadleaf shrubland, and (b) evergreen and deciduous broadleaf shrubland. Similarly, in grasslands, co-constructive species often belong to different functional groups (e.g., tussock, rhizome, and forb), which are not always clearly separated in the current classification framework. We therefore retained multiple co-constructive species in alliance naming, while identifying the vegetation formation according to the life form of the species with the highest IV. For example, Kobresia pygmaea + Potentilla saundersiana grassland alliance was classified as a tussock grassland vegetation formation.
As a complementary assessment, we further numerically classified vegetation from the HDM-Plot dataset based on species composition using TWINSPAN (Fig. S3). The first division broadly separated alpine grassland plots from non-alpine grassland plots, consistent with the major physiognomic contrast in the dataset. However, finer divisions did not always correspond to the field-based vegetation formations, probably reflecting local species turnover, rare taxa, and uneven sampling among vegetation types. Therefore, quantitative classification provides a useful complementary perspective, but the field-based classification following Guo et al. (2020) remains the primary framework for this data paper. These plot-based findings and standardized data provide support for the ongoing revision of China's vegetation classification system (Guo et al., 2020) and for the update of Vegegraphy of China (Fang et al., 2020). The ecological environment of southwestern China is highly fragile and increasingly exposed to human pressures, with limited capacity for natural recovery. Updated and standardized baseline data is therefore essential for guiding conservation, ecological planning, and restoration strategies, and for supporting biodiversity assessments and ecosystem management in this global hotspot under ongoing and future climate change. More broadly, the HDM-Plot dataset can also contribute to global vegetation ecology by improving the representation of Asian mountain ecosystems in plot-based research. Vegetation plots from southwestern China and the southeastern Tibetan Plateau remain relatively rare in global compilations, despite the high biodiversity and strong environmental heterogeneity of this region. By providing standardized field-based records from this underrepresented mountain system, the dataset can support cross-regional comparisons and large-scale syntheses of vegetation classification, biodiversity patterns, community structure, and ecosystem responses to environmental change.
The supplement related to this article is available online at https://doi.org/10.5194/essd-18-4489-2026-supplement.
JN conceived the study. JN and XM led the field works. YJ, LY, CY, XH, HX, YH, KW, and SS participated in vegetation survey. SS processed the climate maps. YJ and LY processed the dataset, performed the analyses and wrote the first draft. JN, XM and YJ improved the manuscript. All the authors approved the final version of the submitted manuscript.
The contact author has declared that none of the authors has any competing interests.
Publisher's note: Copernicus Publications remains neutral with regard to jurisdictional claims made in the text, published maps, institutional affiliations, or any other geographical representation in this paper. The authors bear the ultimate responsibility for providing appropriate place names. Views expressed in the text are those of the authors and do not necessarily reflect the views of the publisher.
The authors sincerely thank Qiuting Chen, Tingting Chen, Zhichao Chen, Tao Fang, Chuting Hu, Saijing Liu, Xiaoling Lu, Chenling Wang, Haoyan Wang, Jie Xia, Yang Yang, Pingqian Ye, Bohan Zheng, Yawen Zheng, and Yan Zhou from Zhejiang Normal University for their help in the field survey, Dashan He from Sichuan University for helping with specimen identification, and Ke Guo from Institute of Botany, the Chinese Academy of Sciences for providing assistance in vegetation classification.
This work was supported by the Second Tibetan Plateau Scientific Expedition and Research Program (grant no. 2019QZKK0402).
This paper was edited by Yuanzhi Yao and reviewed by three anonymous referees.
Chi, X. F., Zhang, F. Q., Gao, Q. B., Xing, R., and Chen, S. L.: Genetic structure and eco-geographical differentiation of Lancea tibetica in the Qinghai-Tibetan Plateau, Genes, 10, 97, https://doi.org/10.3390/genes10020097, 2019.
Ding, W. N., Ree, R. H., Spicer, R. A., and Xing, Y. W.: Ancient orogenic and monsoon-driven assembly of the world's richest temperate alpine flora, Science, 369, 578–581, https://doi.org/10.1126/science.abb4484, 2020.
Editorial Committee of Flora Sichuanica: Flora Sichuanica, 21 volumes, Sichuan People's Publishing House & Sichuan Science and Technology Press, Chengdu, 1981–2012.
Editorial Committee of the Flora of China: Reipublicae Popularis Sinicae, 80 volumes, Science Press, Beijing, 1959–2004.
Editorial Committee of the Vegetation of China: Vegetation of China, Science Press, Beijing, ISBN 7030024222, 1980.
Editorial Committee of Vegetation Map of China, Chinese Academy of Sciences: Vegetation of China and Its Geographical Pattern – Illustration of the Vegetation Map of the People's Republic of China (1:1,000,000), Geology Press, Beijing, ISBN 9787116051461, 2007a.
Editorial Committee of Vegetation Map of China, Chinese Academy of Sciences: Vegetation Map of the People's Republic of China (1:1,000,000), Geology Press, Beijing, ISBN 9787116045132, 2007b.
Fang, J. Y., Wang, X. P., Shen, Z. H., Tang, Z. Y., He, J. S., Yu, D., Jiang, Y., Wang, Z. H., Zheng, C. Y., Zhu, J. L., and Guo, Z. D.: Methods and protocols for plant community inventory, Biodiv. Sci., 17, 533–548, https://www.biodiversity-science.net/CN/10.3724/SP.J.1003.2009.09253 (last access: 30 June 2026), 2009.
Fang, J. Y., Guo, K., Wang, G. H., Tang, Z. Y., Xie, Z. Q., Shen, Z. H., Wang, R. Q., Qiang, S., Liang, C. Z., Da, L. J., and Yu, D.: Vegetation classification system and classification of vegetation types used for the compilation of vegetation of China, Chin. J. Plant Ecol., 44, 96–110, 2020.
Farr, T. G., Rosen, P. A., Caro, E., Crippen, R., Duren, R., Hensley, S., Kobrick, M., Paller, M., Rodriguez, E., Roth, L., Seal, D., Shaffer, S., Shimada, J., Umland, J., Werner, M., Oskin, M., Burbank, D., and Alsdorf, D.: The Shuttle Radar Topography Mission, Rev. Geophys., 45, RG2004, https://doi.org/10.1029/2005RG000183, 2007.
Guo, K., Fang, J. Y., Wang, G. H., Tang, Z. Y., Xie, Z. Q., Shen, Z. H., Wang, R. Q., Qiang, S., Liang, C. Z., Da, L. J., and Yu, D.: A revised scheme of vegetation classification system of China, Chin. J. Plant Ecol., 44, 111–127, https://doi.org/10.17521/cjpe.2019.0271, 2020.
He, Y. L., Xiong, Q. L., Yu, L., Yan, W. B., and Qu, X. X.: Impact of climate change on potential distribution patterns of alpine vegetation in the Hengduan Mountains region, China, Mt. Res. Dev., 40, R48–R54, https://doi.org/10.1659/MRD-JOURNAL-D-20-00010.1, 2020.
Hu, X. F., Shi, S. L., Zhou, B. R., and Ni, J.: A 1 km monthly dataset of historical and future climate changes over China, Sci. Data, 12, 436, https://doi.org/10.1038/s41597-025-04761-y, 2025.
iFlora Initiative of Kunming Institute of Botany, Chinese Academy of Sciences: A Dictionary of the Families and Genera of Chinese Vascular Plants, Science Press, Beijing, ISBN 9787030551207, 2018.
Integrated Scientific Expedition to Qinghai-Tibet Plateau, Chinese Academy of Sciences: Flora Xizangica, 5 volumes, Science Press, Beijing, 1983–1987.
Jin, Y. L., Wang, H. Y., Wei, L. F., Hou, Y., Hu, J., Wu, K., Xia, H. J., Xia, J., Zhou, B. R., Li, K., and Ni, J.: A plot-based dataset of plant community on the Qingzang Plateau, Chin. J. Plant Ecol., 46, 846–854, https://doi.org/10.17521/cjpe.2022.0174, 2022.
Jin, Y. L., Yang, L. Y. Y., Hu, X. F., Yang, C., Xia, H. J., Hou, Y., Wu, K., Mao, X. X., and Ni, J.: A plot-based plant community dataset in the Hengduan Mountains and adjacent regions (2022–2024), Figshare [data set], https://doi.org/10.6084/m9.figshare.32706207, 2026a.
Jin, Y. L., Yang, L. Y. Y., Hu, X. F., Yang, C., Xia, H. J., Hou, Y., Wu, K., Mao, X. X., and Ni, J.: A plot-based plant community dataset in the Hengduan Mountains (2022–2024), National Tibetan Plateau/Third Pole Environment Data Center [data set], https://doi.org/10.11888/Terre.tpdc.303394, 2026b.
Jin, Z. Z.: Floristic features of dry-hot and dry-warm valleys, Yunnan and Sichuan, Yunnan Science and Technology Press, Kunming, ISBN 9787541617379, 2002.
Jin, Z. Z. and Ou, X. K.: Yuanjiang, Nujiang, Jinshajiang, Lancangjiang Vegetation of Dry Valley, Yunnan University Press & Yunnan Science and Technology Press, Kunming, ISBN 9787810681421, 2000.
Kunming Institute of Botany, Chinese Academy of Sciences: Flora Yunnanica, 21 volumes, Science Press, Beijing, 1977–2006.
Li, D. J.: The primary characteristics of flora in the Hengduan Mountainous regions, Mt. Res., 6, 147–152, https://doi.org/10.16089/j.cnki.1008-2786.1988.03.003, 1988.
Li, X. W.: Floristic statistics and analyses of seed plants from China, Acta Bot. Yunnan, 18, 363–384, 1996.
Liang, Q. L., Xu, X. T., Mao, K. S., Wang, M. C., Wang, K., Xi, Z. X., and Liu, J. Q.: Shifts in plant distributions in response to climate warming in a biodiversity hotspot, the Hengduan Mountains, J. Biogeogr., 45, 1334–1344, https://doi.org/10.1111/jbi.13229, 2018.
Liu, Y., Li, P., Xu, Y., Shi, S. L., Ying, L. X., Zhang, W. J., Peng, P. H., and Shen, Z. H.: Quantitative classification and ordination for plant communities in dry valleys of Southwest China, Biodiv. Sci., 24, 378–388, https://doi.org/10.17520/biods.2015241, 2016a.
Liu, Y., Zhu, X. X., Shen, Z. H., and Sun, H.: Flora compositions and spatial differentiations of vegetation in dry valleys of Southwest China, Biodiv. Sci., 24, 367–377, https://doi.org/10.17520/biods.2015240, 2016b.
Myers, N., Mittermeier, R. A., Mittermeier, C. G., da Fonseca, G. A. B., and Kent, J.: Biodiversity hotspots for conservation priorities, Nature, 403, 853–858, https://doi.org/10.1038/35002501, 2000.
Nan, X., Li, A. N., and Deng, W.: Data set of “Digital Mountain Map of China” (2015), National Tibetan Plateau/Third Pole Environment Data Center, https://doi.org/10.11888/Terre.tpdc.272523, 2022.
Piao, S. L., Zhang, X. Z., Wang, T., Liang, E. Y., Wang, S. P., Zhu, J. T., and Niu, B.: Responses and feedback of the Tibetan Plateau's alpine ecosystem to climate change, Chinese Sci. Bull., 64, 2842–2855, https://doi.org/10.1360/TB-2019-0074, 2019.
Sabatini, F. M., Lenoir, J., Hattab, T., Arnst, E. A., Chytrý, M., Dengler, J., De Ruffray, P., Hennekens, S. M., Jandt, U., Jansen, F., Jiménez-Alfaro, B., Kattge, J., Levesley, A., Pillar, V. D., Purschke, O., Sandel, B., Sultana, F., Aavik, T., Aćić, S., Acosta, A. T. R., Agrillo, E., Alvarez, M., Apostolova, I., Arfin Khan, M. A. S., Arroyo, L., Attorre, F., Aubin, I., Banerjee, A., Bauters, M., Bergeron, Y., Bergmeier, E., Biurrun, I., Bjorkman, A. D., Bonari, G., Bondareva, V., Brunet, J., Čarni, A., Casella, L., Cayuela, L., Černý, T., Chepinoga, V., Csiky, J., Ćušterevska, R., De Bie, E., de Gasper, A. L., De Sanctis, M., Dimopoulos, P., Dolezal, J., Dziuba, T., El-Sheikh, M. A. E.-R. M., Enquist, B., Ewald, J., Fazayeli, F., Field, R., Finckh, M., Gachet, S., Galán-de-Mera, A., Garbolino, E., Gholizadeh, H., Giorgis, M., Golub, V., Alsos, I. G., Grytnes, J.-A., Guerin, G. R., Gutiérrez, A. G., Haider, S., Hatim, M. Z., Hérault, B., Hinojos Mendoza, G., Hölzel, N., Homeier, J., Hubau, W., Indreica, A., Janssen, J. A. M., Jedrzejek, B., Jentsch, A., Jürgens, N., Kącki, Z., Kapfer, J., Karger, D. N., Kavgacı, A., Kearsley, E., Kessler, M., Khanina, L., Killeen, T., Korolyuk, A., Kreft, H., Kühl, H. S., Kuzemko, A., Landucci, F., Lengyel, A., Lens, F., Lingner, D. V., Liu, H., Lysenko, T., Mahecha, M. D., Marcenò, C., Martynenko, V., Moeslund, J. E., Monteagudo Mendoza, A., Mucina, L., Müller, J. V., Munzinger, J., Naqinezhad, A., Noroozi, J., Nowak, A., Onyshchenko, V., Overbeck, G. E., Pärtel, M., Pauchard, A., Peet, R. K., Peñuelas, J., Pérez-Haase, A., Peterka, T., Petřík, P., Peyre, G., Phillips, O. L., Prokhorov, V., Rašomavičius, V., Revermann, R., Rivas-Torres, G., Rodwell, J. S., Ruprecht, E., Rūsiòa, S., Samimi, C., Schmidt, M., Schrodt, F., Shan, H., Shirokikh, P., Šibík, J., Šilc, U., Sklenář, P., Škvorc, Ž., Sparrow, B., Sperandii, M. G., Stančić, Z., Svenning, J.-C., Tang, Z., Tang, C. Q., Tsiripidis, I., Vanselow, K. A., Vásquez Martínez, R., Vassilev, K., Vélez-Martin, E., Venanzoni, R., Vibrans, A. C., Violle, C., Virtanen, R., von Wehrden, H., Wagner, V., Walker, D. A., Waller, D. M., Wang, H.-F., Wesche, K., Whitfeld, T. J. S., Willner, W., Wiser, S. K., Wohlgemuth, T., Yamalov, S., Zobel, M., and Bruelheide, H.: sPlotOpen – An environmentally balanced, open-access, global dataset of vegetation plots, Global Ecol. Biogeogr., 30, 1740–1764, https://doi.org/10.1111/geb.13346, 2021.
Shen, Z. H., Liu, Z. L., and Wu, J.: Altitudinal pattern of flora on the eastern slope of Mt. Gongga, Biodiv. Sci., 12, 89–98, https://doi.org/10.17520/biods.2004011, 2004.
Sherman, R., Mullen, R., Li, H. M., Fang, Z. D., and Wang, Y.: Spatial patterns of plant diversity and communities in alpine ecosystems of the Hengduan Mountains, northwest Yunnan, China, J. Plant Ecol., 1, 117–136, https://doi.org/10.1093/jpe/rtn012, 2008.
Sloan, S., Jenkins, C. N., Joppa, L. N., Gaveau, D. L. A., and Laurance, W. F.: Remaining natural vegetation in the global biodiversity hotspots, Biol. Conserv., 177, 12–24, https://doi.org/10.1016/j.biocon.2014.05.027, 2014.
Sun, H., Zhang, J. W., Deng, T., and Boufford, D. E.: Origins and evolution of plant diversity in the Hengduan Mountains, Plant Divers., 39, 161–166, https://doi.org/10.1016/j.pld.2017.09.004, 2017.
Wang, G. H., Fang, J. Y., Guo, K., Xie, Z. Q., Tang, Z. Y., Shen, Z. H., Wang, R. Q., Wang, X. P., Wang, D. L., Qiang, S., Yu, D., Peng, S. L., Da, L. J., Liu, Q., and Liang, C. Z.: Contents and protocols for the classification and description of vegetation formations, alliances and associations of vegetation of China, Chin. J. Plant Ecol., 44, 128–178, https://doi.org/10.17521/cjpe.2019.0272, 2020.
Wu, S. H., Pan, T., Cao, J., He, D. M., and Xiao, Z. N.: Barrier-corridor effect of longitudinal range-gorge terrain on monsoons in Southwest China, Geogr. Res., 31, 1–13, https://www.dlyj.ac.cn/CN/10.11821/yj2012010001 (last access: 30 June 2026), 2012.
Wu, X. J. and Yu, C. Y.: Vegetation distribution characteristics and diversity conservation in Habaxueshan Provincial Nature Reserve, Forest Inventory and Planning, 45, 47–51, 2020.
Wu, Z. Y.: The areal-types of Chinese genera of seed plants, Acta Bot. Yunnan, Suppl. IV, 1–139, https://www.integrativebiology.ac.cn/EN/abstract/abstract31833.shtml (last access: 30 June 2026), 1991.
Wu, Z. Y., Zhou, Z. K., Li, D. Z., Peng, H., and Sun, H.: The areal-types of the world families of seed plants, Acta Bot. Yunnan, 25, 245–257, https://www.integrativebiology.ac.cn/EN/abstract/abstract32639.shtml (last access: 30 June 2026), 2003.
Xing, Y. W. and Ree, R. H.: Uplift-driven diversification in the Hengduan Mountains, a temperate biodiversity hotspot, P. Natl. Acad. Sci. USA, 114, E3444–E3451, https://doi.org/10.1073/pnas.1616063114, 2017.
Xu, B., Li, Z. M., and Sun, H.: Plant diversity and floristic characters of the alpine subnival belt flora in the Hengduan Mountains, SW China, J. Syst. Evol., 52, 271–279, https://doi.org/10.1111/jse.12037, 2014.
Xu, C. D., Feng, J. M., Wang, X. P., and Yang, X.: Vertical distribution patterns of plant species diversity in northern Mt. Gaoligong, Yunnan Province, Chin. J. Ecol., 27, 323–330, 2008.
Yang, J. D., Zhang, Z. M., Shen, Z. H., Ou, X. K., Geng, Y. P., and Yang, M. Y.: Review of research on the vegetation and environment of dry-hot valleys in Yunnan, Biodiv. Sci., 24, 462–474, https://doi.org/10.17520/biods.2015251, 2016a.
Yang, Q. Y. and Zheng, D.: An outline of physico-geographic regionalization of the Hengduan Mountains region, Mt. Res., 7, 56–64, https://doi.org/10.16089/j.cnki.1008-2786.1989.01.010, 1989.
Yang, Y., Han, J., Liu, Y., Zhong-Yong, C. R., Shi, S. L., Si-Na, C. L., Xu, Y., Ying, L. X., Zhang, W. J., and Shen, Z. H.: A comparison of the altitudinal patterns in plant species diversity within the dry valleys of the Three Parallel Rivers region, northwestern Yunnan, Biodiv. Sci., 24, 440–452, https://doi.org/10.17520/biods.2015361, 2016b.
Yao, Y. H., Zhang, B. P., Han, F., and Pang, Y.: Diversity and geographical pattern of altitudinal belts in the Hengduan Mountains in China, J. Mt. Sci., 7, 123–132, https://doi.org/10.1007/s11629-010-1011-9, 2010.
Yin, L., Dai, E. F., Zheng, D., Wang, Y. H., Ma, L., and Tong, M.: What drives the vegetation dynamics in the Hengduan Mountain region, southwest China: climate change or human activity?, Ecol. Indic., 112, 106013, https://doi.org/10.1016/j.ecolind.2019.106013, 2020.
Yu, H. B., Miao, S. Y., Xie, G. W., Guo, X. Y., Chen, Z., and Favre, A.: Contrasting floristic diversity of the Hengduan Mountains, the Himalayas and the Qinghai-Tibet Plateau sensu stricto in China, Front. Ecol. Evol., 8, 136, https://doi.org/10.3389/fevo.2020.00136, 2020.
Yu, Y. D., Liu, L. H., and Zhang, J. H.: Vegetation regionalization of the Hengduan Mountains region, Mt. Res., 7, 47–55, https://doi.org/10.16089/j.cnki.1008-2786.1989.01.009, 1989.
Zhang, H. N., Zou, W., Chen, Z., He, L. J., Peng, X. F., Wang, G. Y., Peng, P. H., Li, J. J., and Shi, S. L.: Distribution pattern of plant communities and its relationship with environmental factors in eastern Xizang, China, Chin. J. Appl. Environ. Biol., 29, 1289–1297, https://doi.org/10.19675/j.cnki.1006-687x.2022.10037, 2023.
Zhang, R. Z., Zheng, D., Yang, Q. Y., and Liu, Y. H.: Physical Geography of Hengduan Mountains, Science Press, Beijing, ISBN 9787030055729, 1997.
Zhang, S. R.: Carex, in: Flora of Pan-Himalaya, edited by: Hong, D. Y., Sun, H., Watson, M., Wen, J., and Zhang, X. C., Vol. 12, Science Press, Beijing, ISBN 9787030623546, 2020.
Zhang, X. Q., Xu, X. M., Li, X., Cui, P., and Zheng, D.: A new scheme of climate-vegetation regionalization in the Hengduan Mountains region, Sci. China Earth Sci., 67, 751–768, https://doi.org/10.1007/s11430-023-1231-0, 2024.
Zhang, X. Z., Yang, Y. P., Piao, S. L., Bao, W. K., Wang, S. P., Wang, G. X., Sun, H., Luo, T. X., Zhang, Y. J., Shi, P. L., Liang, E. Y., Shen, M. G., Wang, J. S., Gao, Q. Z., Zhang, Y. L., and Ouyang, H.: Ecological change on the Tibetan Plateau, Chinese Sci. Bull., 60, 3048–3056, https://doi.org/10.1360/N972014-01339, 2015.
Zheng, D.: A comparative study on physico-geographic conditions between the Himalayas and Hengduan Mountainous regions, Mt. Res., 6, 137–144, 1988.
Zheng, D. and Yang, Q. Y.: Some problems on physicogeographic regionalization of the Hengduan Mountains region, Mt. Res., 5, 7–13, 1987.