the Creative Commons Attribution 4.0 License.
the Creative Commons Attribution 4.0 License.
 | 26 Jun 2026
CAMELS-GB v2: hydrometeorological time series and landscape attributes for 671 catchments in Great Britain
Yanchen Zheng
Rafael Barbedo
Hollie Cooper
Felipe Fileni
Hayley J. Fowler
Amy Green
Tom Gribbin
Helen Harfoot
Elizabeth Lewis
Germano Gondim Ribeiro Neto
Xiaobin Qiu
Saskia Salwey
Doris E. Wendt
Large-sample hydrological datasets containing data for tens to thousands of catchments are invaluable for hydrological process understanding and modelling. CAMELS (Catchment Attributes and MEteorology for Large-sample Studies) datasets provide hydro-meteorological timeseries, catchment attributes and catchment boundaries. Here, we present the second version of CAMELS-GB. CAMELS-GB v2 collates millions of observations from across Great Britain at hourly to monthly timescales, including quality-controlled daily river flows, catchment boundaries, and catchment characteristics from the UK National River Flow Archive. The new features include (1) extended daily hydro-meteorological timeseries from 1970–2022 including meteorological timeseries from new observed climate datasets, (2) hourly precipitation, river flow and level timeseries, (3) groundwater level timeseries and attributes for 55 groundwater wells, and (4) new catchment attributes characterising changing land cover, peak flows and human influences. These data are provided for 671 catchments across Great Britain spanning a diverse range of geophysical characteristics and human influences. CAMELS-GB v2 represents a step change for environmental and modelling analyses across Great Britain, particularly for the characterisation of sub-daily hydrological processes, and is made available as an open dataset (Coxon et al., 2025; https://doi.org/10.5285/9a46d428-958f-4ac1-86eb-94eee70c0955).
- Article
(5779 KB) - Full-text XML
- Companion paper
-
Supplement
(3673 KB) - BibTeX
- EndNote


Large-sample hydrological (LSH) datasets are invaluable for hydrological process understanding and modelling. LSH datasets provide data for tens to thousands of catchments over national (e.g. Australia, Fowler et al., 2021; Austria, Klingler et al., 2021; Brazil, Almagro et al., 2021; Chagas et al., 2020; Chile, Alvarez-Garreton et al., 2018; Great Britain, Coxon et al., 2020a; Haiti, Bathelemy et al., 2024; Iceland, Helgason and Nijssen, 2024; Spain, Senent-Aparicio et al., 2024; Sweden, Teutschbein, 2024; Switzerland, Höge et al., 2023; USA, Addor et al., 2017), continental (e.g. Europe, do Nascimento et al., 2024; North America, Arsenault et al., 2020) and global (e.g. CARAVAN, Kratzert et al., 2023; Global Streamflow, Indices and Metadata Archive; Do et al., 2018) scales. While the core data underpinning LSH datasets are streamflow data, LSH datasets also often include meteorological timeseries, simulated timeseries from hydrological models, catchment boundaries and catchment attributes at various spatial and temporal scales. This enables robust benchmarking of hydrological models across a diverse range of catchments (e.g. David et al., 2022; Lees et al., 2021), improved understanding of hydrological processes across environmental gradients (e.g. Addor et al., 2018; Coxon et al., 2024; McMillan et al., 2022), characterisation and prediction of extreme events (e.g. Chagas et al., 2022b; Rasheed et al., 2024) and assessment of the impacts of climate and land management on streamflow (e.g. Chagas et al., 2022a; Slater et al., 2024). Increasingly, LSH datasets have adopted FAIR (findable, accessible, interoperable, and reusable) principles to ensure (1) the large-sample dataset and their source datasets are open-access, and (2) the software tools used to create the large-sample hydrology datasets are open and accessible (Fowler et al., 2025). There is now a growing community of LSH datasets and these datasets are expanding rapidly. The Caravan dataset, which included data for 6830 catchments when published in 2023 (Kratzert et al., 2023) now contains data for more than 20 000 catchments.
CAMELS (Catchment Attributes and MEteorology for Large-sample Studies) datasets are a family of large-sample hydrology datasets that contain hydro-meteorological timeseries, catchment attributes and boundaries for large-samples of catchments for specific countries or regions. CAMELS-GB v1 was the first large-sample, open access dataset for Great Britain (Coxon et al., 2020a, b). It consists of hydro-meteorological time series (spatially aggregated to catchment boundaries), catchment attributes (describing topography, climate, hydrology, land cover, soils, hydrogeology, and human influences), and catchment boundaries for 671 catchments. It has been used to understand human impacts on river flows (Bloomfield et al., 2021; Coxon et al., 2024), analyse the spatial sensitivity of river flooding to changes in climate and land cover (Slater et al., 2024), calibrate and evaluate hydrological models (Kiraz et al., 2023) and to benchmark data-driven runoff models (Lees et al., 2021). It has also been incorporated into continental (do Nascimento et al., 2024) and global catchment datasets (Kratzert et al., 2023). While CAMELS-GB v1 is a valuable dataset, there are important gaps in the current dataset. Firstly, it only contains daily hydro-meteorological timeseries, when sub-daily timeseries are often needed for flood characterisation in small catchments across Great Britain. Secondly, it only contains static catchment attributes (i.e. one snapshot of a geophysical property in time) which makes it challenging to use for trend analyses. Thirdly, groundwater is an important resource in Great Britain, yet there are no timeseries available for groundwater levels in CAMELS-GB v1.
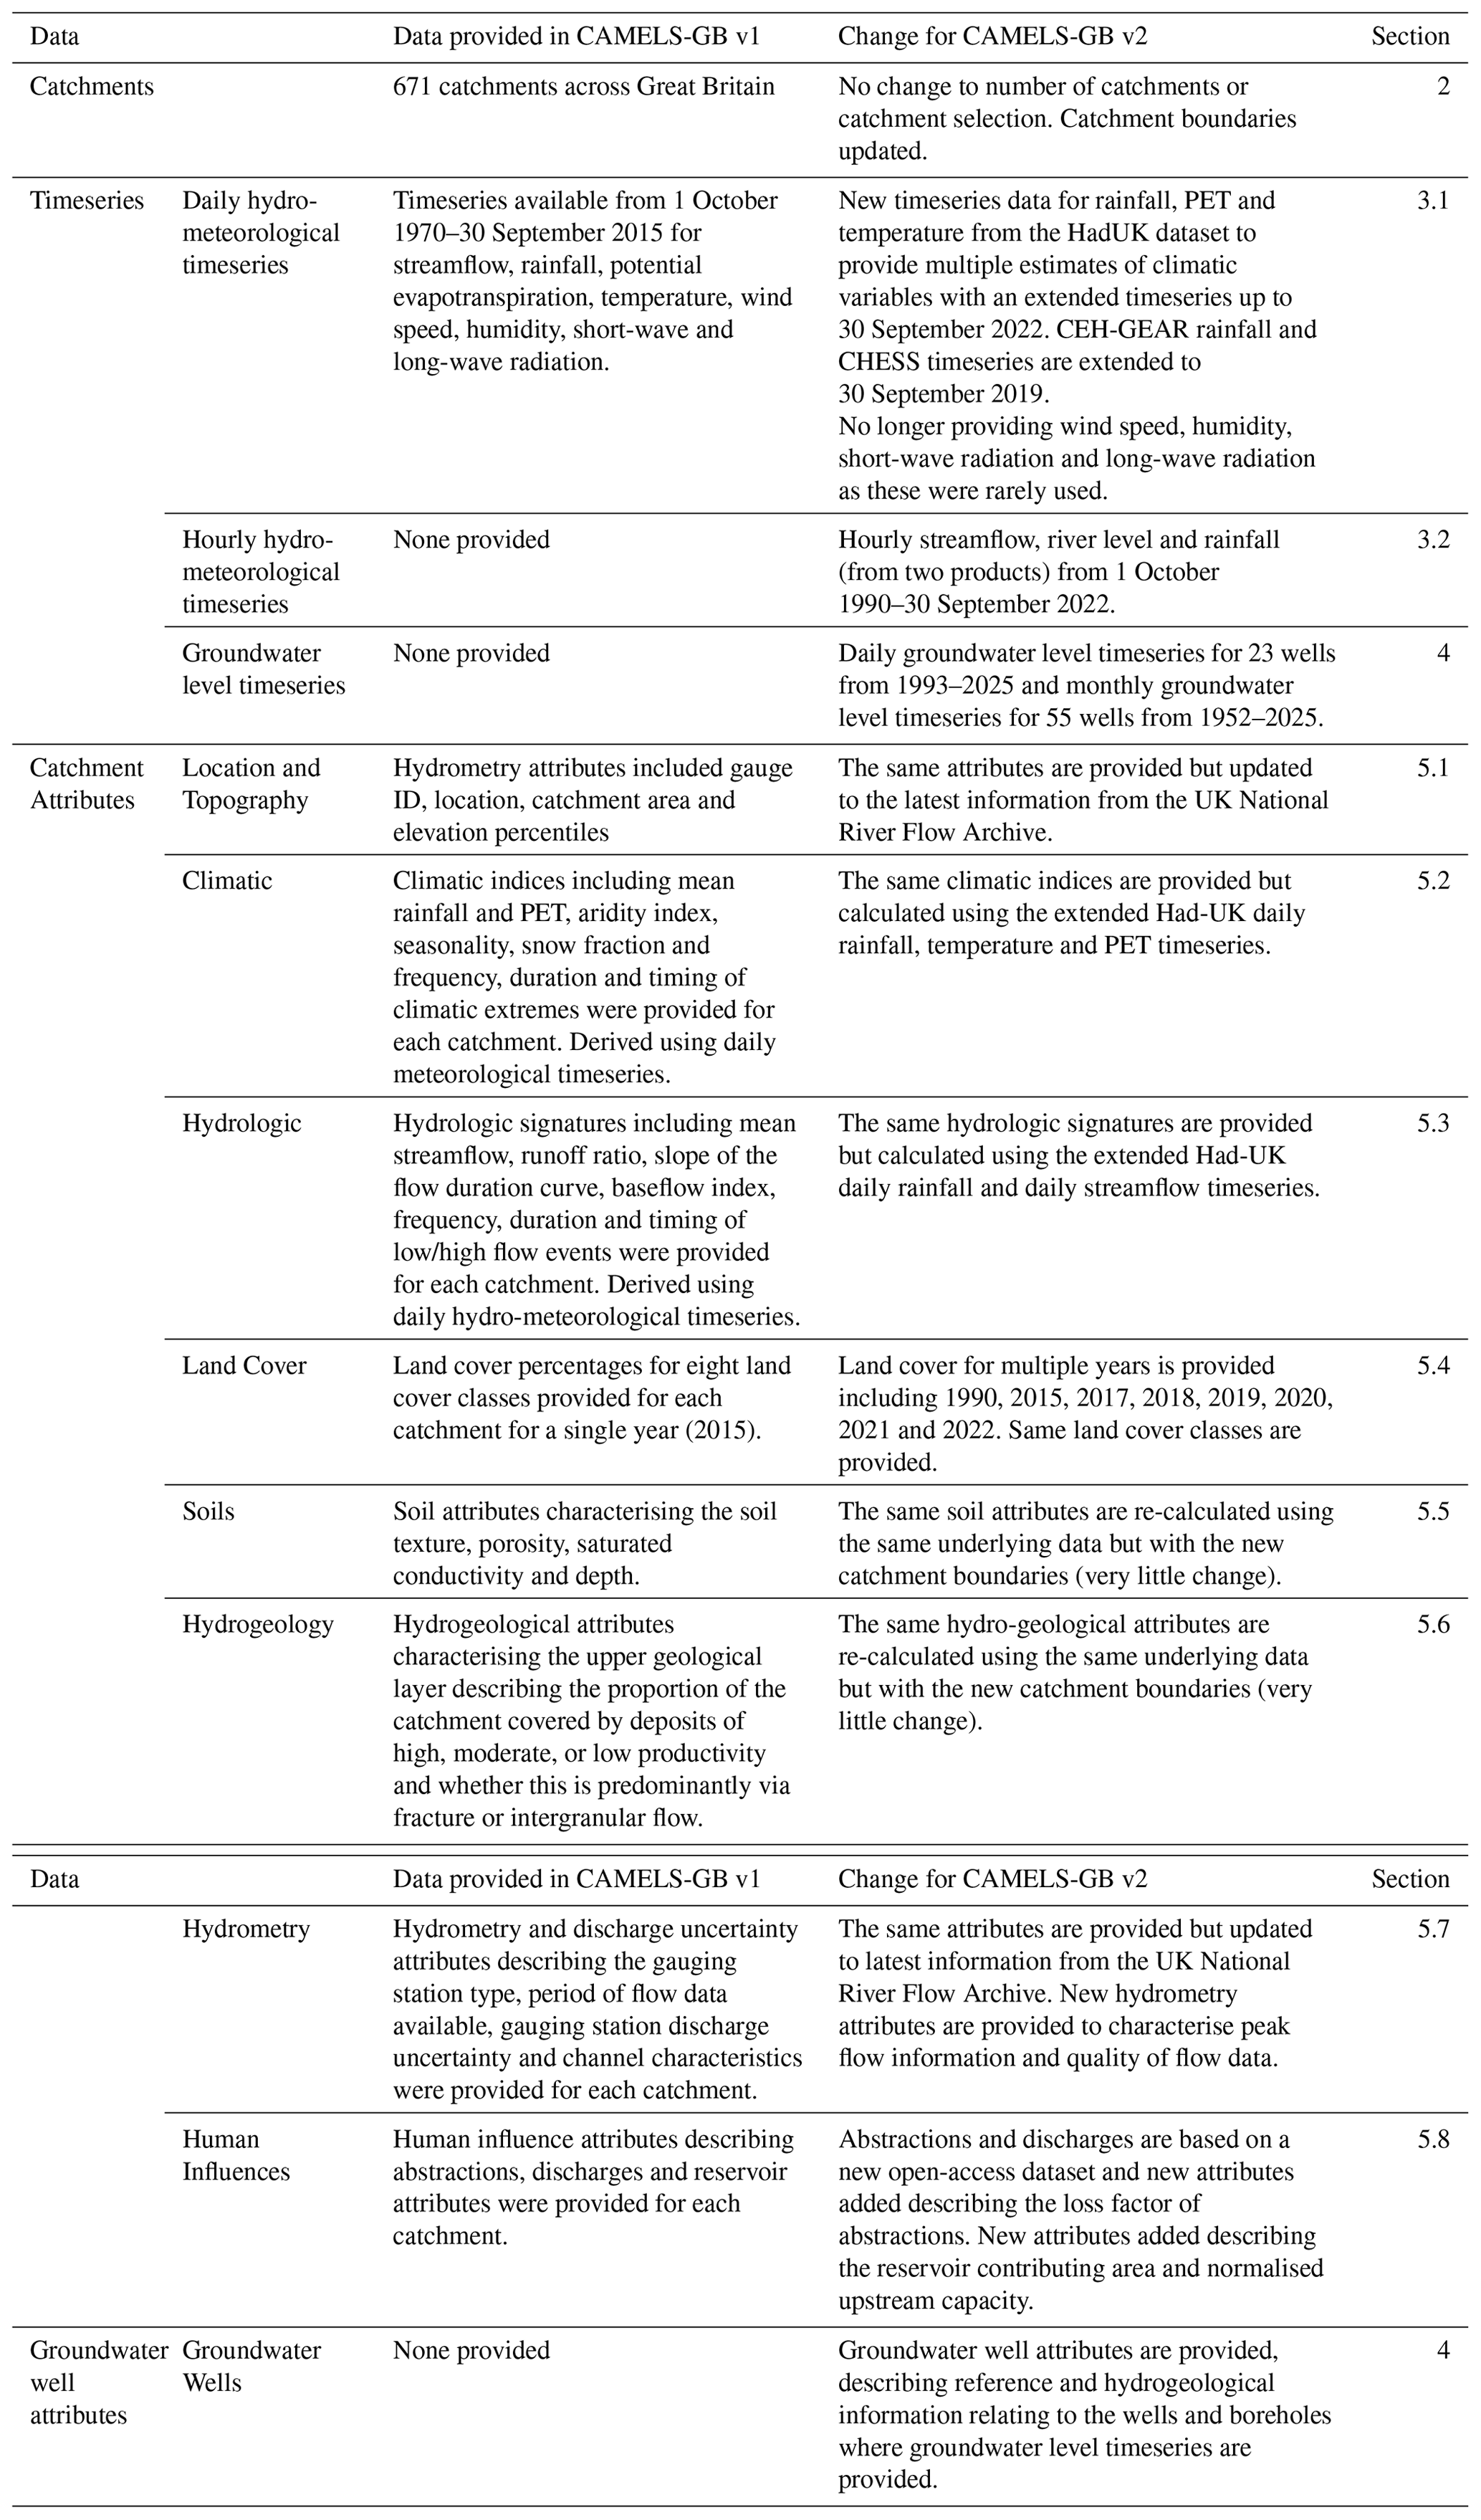
This paper addresses these data needs by providing a new version of CAMELS-GB. CAMELS-GB v2 contains new datasets including hourly hydro-meteorological timeseries, groundwater level timeseries, dynamic catchment attributes characterising changes in land cover and static catchment attributes characterising groundwater timeseries and reservoirs. We also update the existing data in CAMELS-GB to lengthen the daily hydro-meteorological timeseries and to include the latest precipitation and potential evapotranspiration data for Great Britain. Key differences between the two versions of CAMELS-GB are summarised in Table 1. CAMELS-GB v2 is open access and available on the Environmental Information Data Centre (EIDC). The remainder of the paper describes the changes between v1 and v2, a full description of any new data and advice for users of CAMELS-GB v2.
CAMELS-GB v2 contains data for the same 671 catchments as CAMELS-GB v1. These catchments were selected from the UK National River Flow Archive (NRFA) Service Level Agreement (SLA) network (see Dixon et al., 2013; Hannaford, 2004), excluding catchments from Northern Ireland (due to a lack of consistent climate and landscape datasets across the UK) and two gauges where no suitable catchment boundary could be derived. The SLA network ensures a core network of stations for long-term records that undergo additional quality control and validation on the NRFA (Dixon et al., 2013; Muchan and Dixon, 2014). The resulting 671 catchments span a diverse range of hydrological characteristics that represent rivers across GB.
As with CAMELS-GB v1, catchment boundaries are provided in CAMELS-GB v2 as shapefiles in the OSGB 1936 co-ordinate system (British National Grid). The catchment boundaries were derived using the same underlying data and method as for CAMELS-GB v1 (see Sect. 3 from Coxon et al., 2020a for more details) but updated to better reflect the accuracy of the stations' outlet locations, with minimal influence on the attributes of the final dataset. The catchment boundaries are mostly identical to those provided in CAMELS-GB v1; only two catchments have more than 1 % difference in catchment area, with a maximum difference of 1.5 %.
To calculate catchment areal averages for time series and catchment attributes, the exactextract Python package (Baston, 2024) was used to extract and spatially aggregate data from gridded datasets based on catchment boundary polygons. This tool computes catchment average values while accounting for grid cells that are only partially covered by a polygon. Precisely determining the fractional coverage of each grid cell within a catchment is especially important for small catchments, where coarse approximations can lead to significant differences in the extracted values.
Daily and hourly hydro-meteorological timeseries are provided for 671 catchments, alongside daily and monthly groundwater level timeseries for 55 boreholes. This section describes the CAMELS-GB v2 timeseries in detail including the source datasets and differences between products. Further details on quality flags, comparisons between datasets and identification of outliers can be found in the supplementary information (Figs. S1–S8, Sect. S1 and Tables S1–S4 in the Supplement).
3.1 Daily hydro-meteorological timeseries
Daily hydro-meteorological time series are provided for the 671 catchments (Table 2). The daily time series data includes key hydro-meteorological variables (streamflow, rainfall, potential evapotranspiration and temperature) from 1 October 1970–30 September 2022 to provide a valuable, long-term dataset as input and evaluation data for hydrological models, trend analysis and characterisation of hydrological processes.
Table 2Summary table of catchment daily hydro-meteorological timeseries available in CAMELS-GB v2.
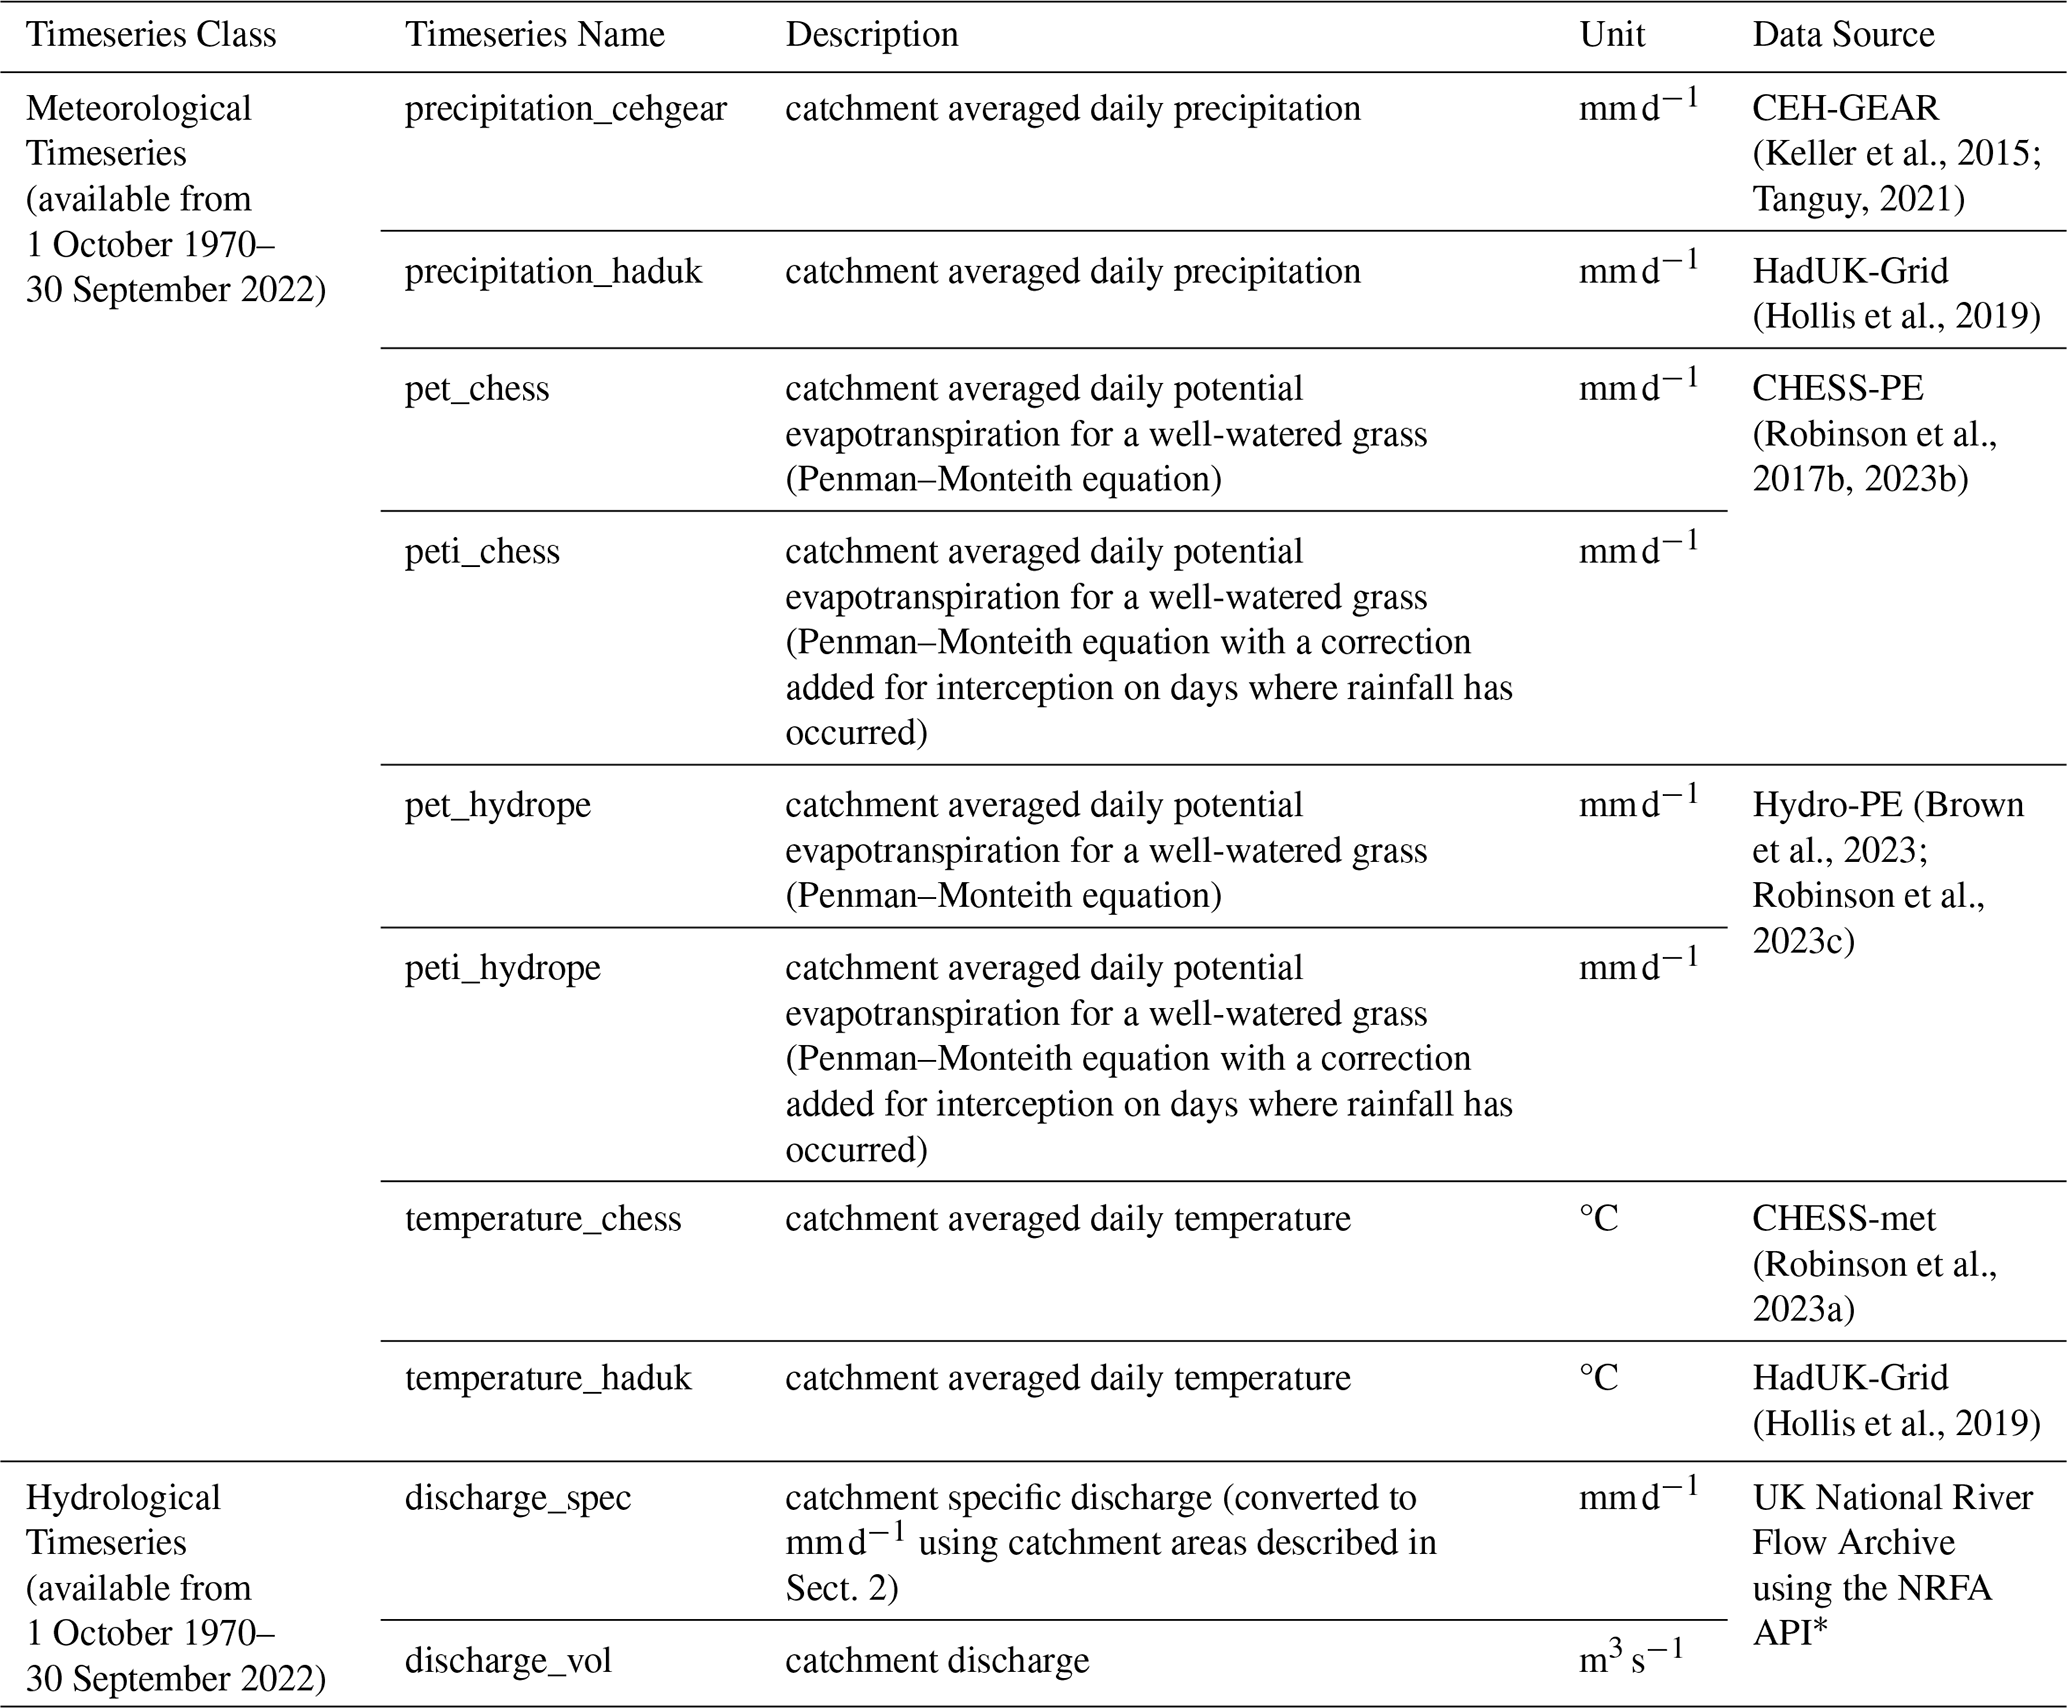
∗ https://nrfaapps.ceh.ac.uk/nrfa/nrfa-api.html, data downloaded on 7 January 2025, last access: 23 September 2025.
3.1.1 Daily meteorological timeseries
To provide consistency with CAMELS-GB v1, we derive the daily timeseries from the same underlying meteorological datasets; rainfall from UK Centre for Ecology & Hydrology Gridded Estimates of Areal Rainfall (CEH-GEAR) dataset, potential evapotranspiration and temperature from the Climate hydrology and ecology research support system (CHESS). These datasets were selected due to their high spatial resolution (1 km2), long temporal coverage (>50 years) and basis on the UK climate monitoring network. However, these meteorological datasets are no longer consistently updated and do not cover the full time period required. Consequently, in CAMELS-GB v2 we also provide meteorological timeseries of catchment average precipitation, potential evapotranspiration and temperature from a new UK dataset of gridded climate observations (HadUK-Grid; Hollis et al., 2019). A national comparison of the different products is shown in Fig. 1, while a more detailed comparison of the different products for two catchments can be found in Figs. S1 and S2.
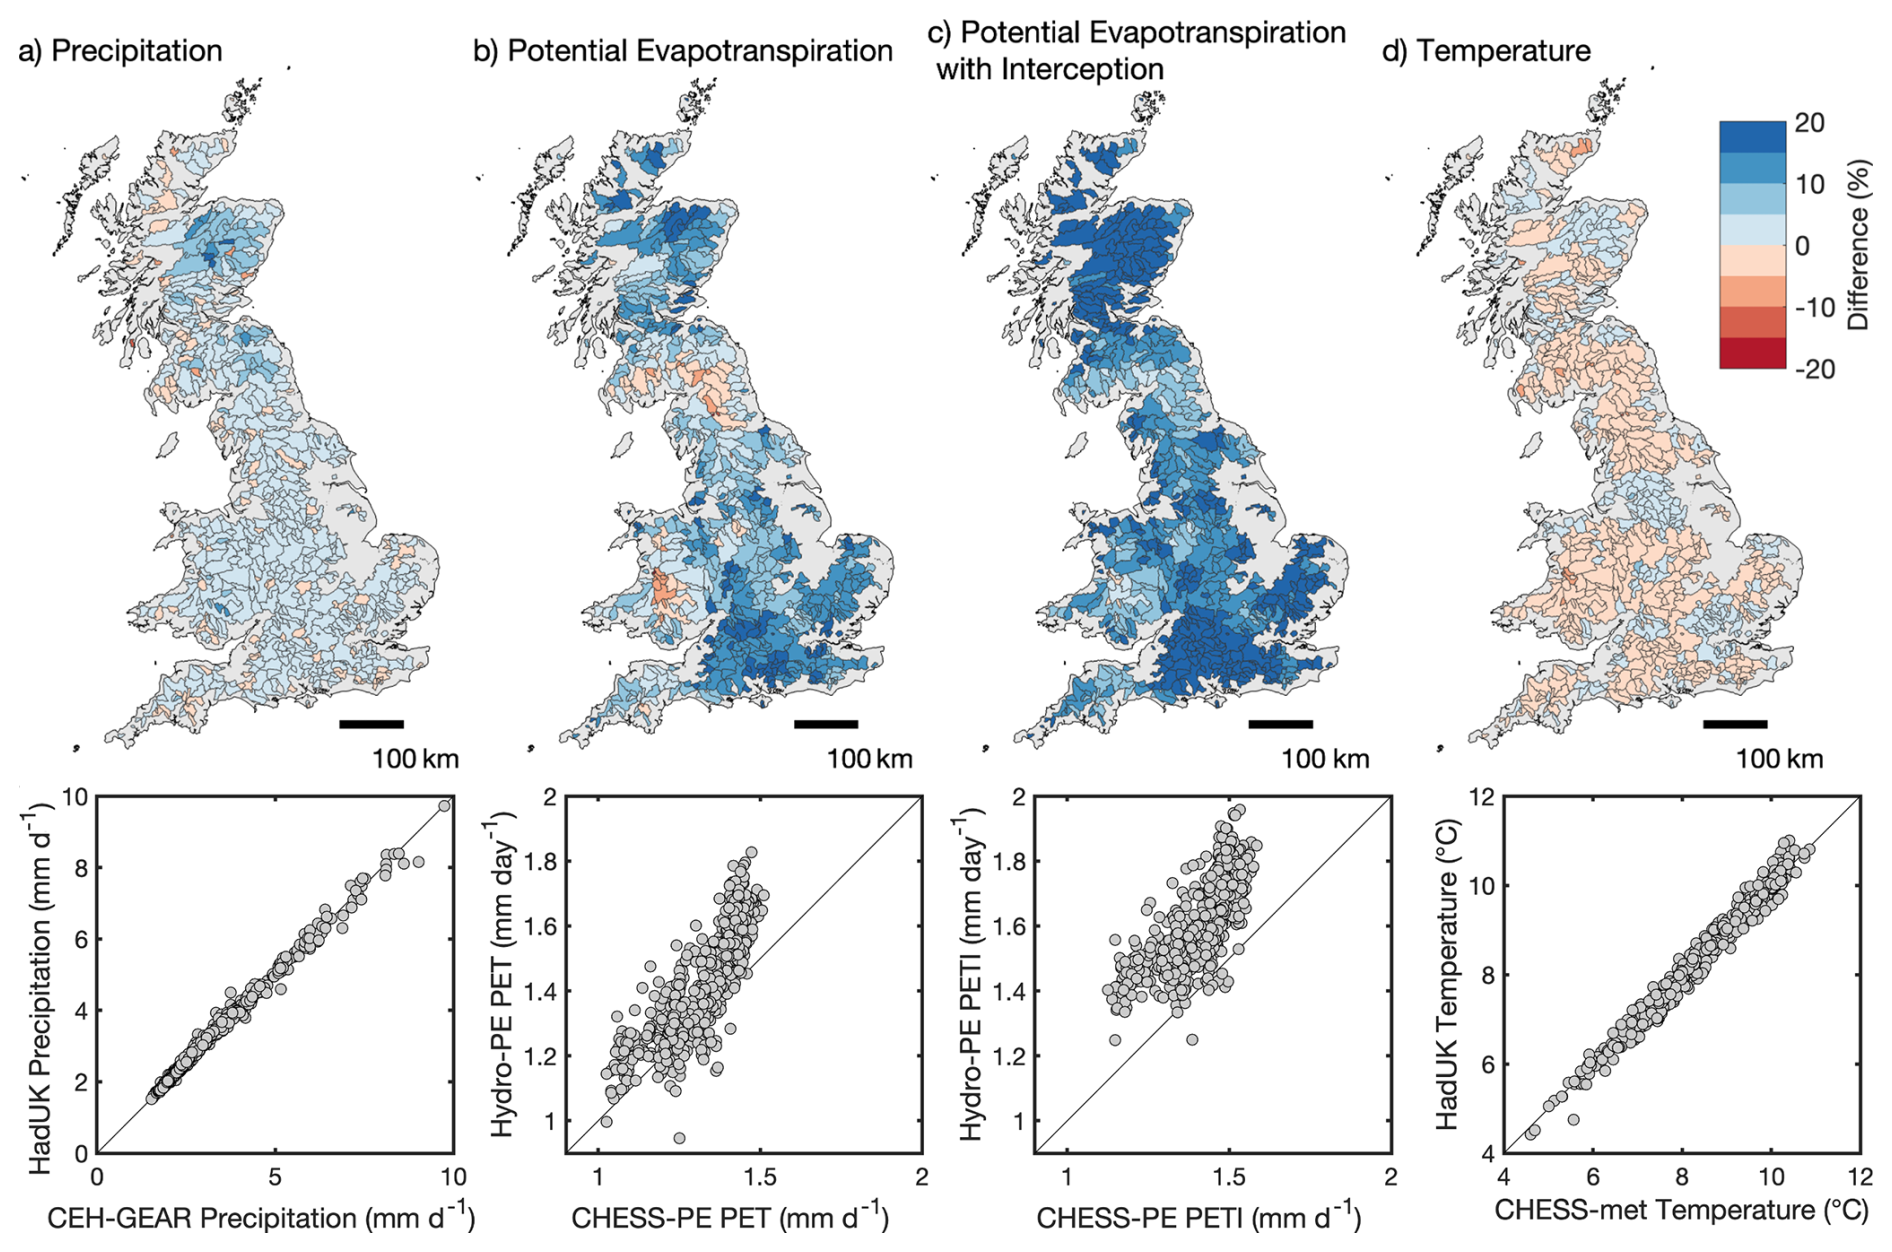
Figure 1National comparison of mean daily (a) precipitation (mm d−1) between HadUK-Grid and CEH-GEAR, (b) potential evapotranspiration (PET, mm d−1) between Hydro-PE and CHESS-PE PET products, (c) potential evapotranspiration with interception (PETI, mm d−1) between Hydro-PE and CHESS-PE PETI products and (d) temperature (°C) between HadUK-Grid and CHESS-met. The average of the mean daily flows are calculated from 1 October 1970–30 September 2022 for the 671 CAMELS-GB catchments. The blue colours indicate that the HadUK/Hydro-PE daily averages are higher than the CEH-GEAR/CHESS datasets, while the red colours indicate that the HadUK/Hydro-PE daily averages are lower than the CEH-GEAR/CHESS datasets, as a percentage of the CEH-GEAR/CHESS datasets. Contains OS data © Crown Copyright and database right 2025.
Daily rainfall timeseries were derived from two national products; the CEH Gridded Estimates of Areal Rainfall dataset (CEH-GEAR; Keller et al., 2015; Tanguy et al., 2021) and the HadUK-Grid dataset (Hollis et al., 2019). Both consist of 1 km2 gridded estimates of daily rainfall and are based on quality-controlled precipitation data from the Met Office UK rain gauge network. However, the two datasets cover different time periods and use different interpolation methods. CEH-GEAR covers 1890–2019 whereas HadUK-Grid rainfall is available from 1836–2023. The CEH-GEAR dataset uses natural neighbour interpolation, whereas HadUK-Grid uses inverse-distance weighted interpolation to generate the daily rainfall grids. Given the similarities in their underlying datasets, the difference between the two rainfall products is small for most CAMELS-GB catchments (Figs. 1a and S1). However, there can be differences of up to 20 % in mean annual rainfall totals and larger differences in daily totals for individual catchments (Fig. S2).
Daily temperature timeseries were derived from the Climate Hydrology and Ecology research Support System meteorology dataset (CHESS-met; Robinson et al., 2017a) and the HadUK-Grid dataset (Hollis et al., 2019). CHESS-met contains 1 km2 gridded estimates of daily mean air temperature (K) from 1961–2019 derived from the Met Office Rainfall and Evaporation Calculation System (MORECS) dataset (Hough and Jones, 1997). MORECS is a 40 km gridded dataset of daily temperature derived from Met Office synoptic stations. For the temperature data in CHESS-met, the MORECS temperature data was interpolated from 40 km resolution to 1 km resolution using a bicubic spline and then the temperatures were adjusted to the elevation of each 1 km grid using the same lapse rate. HadUK-Grid contains 1 km2 gridded estimates of daily maximum and minimum air temperature (°C) from 1960–2023 derived by interpolating temperature observations from climate observing stations in the Met Office's Integrated Data Archive System (MIDAS). In the HadUK-Grid daily climate variables, the maximum air temperature is measured between 09:00 UTC on day D and 09:00 UTC on day D+1, while the minimum air temperature is measured between 09:00 UTC on day D−1 and 09:00 UTC on day D (Robinson et al., 2023c). Therefore, daily mean temperatures have been calculated by averaging maximum air temperature on day D and minimum air temperature on day D+1 to ensure both values represent the same 24 h period for each day. On average, the difference in mean daily temperature between the two products is relatively small (0.14 °C; Fig. 1d); however, differences can be larger for individual timesteps (Figs. S1 and S2).
Daily potential evapotranspiration (PET) timeseries were derived from the Climate Hydrology and Ecology research Support System Potential Evapotranspiration dataset (CHESS-PE; Robinson et al., 2017b, 2023b) and the Hydro-PE HadUK-Grid dataset (Hydro-PE; Brown et al., 2023; Robinson et al., 2023c). Both datasets consist of daily 1 km2 gridded estimates of potential-evapotranspiration for Great Britain calculated using the Penman–Monteith equation for well-watered grass. They also both provide daily potential evapotranspiration with (PETI) and without (PET) an interception correction. Core differences between the datasets are that the PET datasets cover different time periods; 1969–2022 for Hydro-PE and 1961–2019 for CHESS-PE. They also provide different PET estimates, with the Hydro-PE HadUK-Grid dataset providing higher mean annual estimates of PET (on average 0.1 mm d−1 higher across the CAMELS-GB catchments) and PETI (on average 0.2 mm d−1 higher across the CAMELS-GB catchments) for most CAMELS-GB catchments (Fig. 1b and c). This is due to differences in the underlying data and methodologies used to derive the PET estimates. CHESS-PE is derived from CHESS-met variables (Robinson et al., 2017a) that have been downscaled from the Met Office Rainfall and Evaporation Calculation System (MORECS) dataset (Hough and Jones, 1997), whereas Hydro-PE is derived from HadUK-Grid meteorological data (Hollis et al., 2019). Wind speeds are higher and specific humidity is lower in the HadUK-Grid dataset, and many of the variables in the Hydro-PE HadUK-Grid dataset have been temporally downscaled from monthly to daily using a simple smooth interpolation (for a full discussion of the differences, see Sect. 5.1 in Robinson et al., 2023c). This leads to different estimates of daily PET and PETI between the different datasets across all CAMELS-GB catchments (Figs. S1 and S2, see Sect. 3.3 for guidance on dataset selection).
As the meteorological timeseries from HadUK-Grid covers the full time period, we use these data to derive the climate catchment attributes described in Sect. 5.2.
3.1.2 Daily hydrological timeseries
Daily streamflow data for the 671 gauges were taken from the UK NRFA on the 7 January 2025 (https://nrfaapps.ceh.ac.uk/nrfa/nrfa-api.html, last access: 22 January 2025). Streamflow data on the NRFA are provided by measuring authorities who operate the river flow monitoring network, including the Environment Agency (EA) in England, Natural Resources Wales (NRW) in Wales and Scottish Environmental Protection Agency (SEPA) in Scotland. The streamflow data undergo quality control by the measuring authorities and the UK NRFA before being uploaded to the NRFA site. This quality control process removes flow values that are perceived to be erroneous, while retaining as complete a series as possible through the use of a range of infilling techniques (Dixon et al., 2013). Streamflow data in CAMELS-GB v2 are provided as volumetric discharge (m3 s−1) and specific discharge (mm d−1).
Figure 2 shows the daily flow data availability for all gauges contained in the CAMELS-GB v2 dataset (Fig. 2a) and how this availability changes over time (Fig. 2c). Nearly all (666) of the gauges have at least 20 years of daily flow data, and 86 % (577) of the gauges have at least 40 years of daily flow data (Fig. 2a). Overall, there is good spatial coverage of long flow time series across Great Britain, with slightly shorter time series concentrated in the north, Midlands and south-east GB. Data availability increases over the time period with 60 % of the daily flow data available in 1970, peaking to 99 % in the early 2000's and slightly dropping to 96 % by 2022 (Fig. 2c).
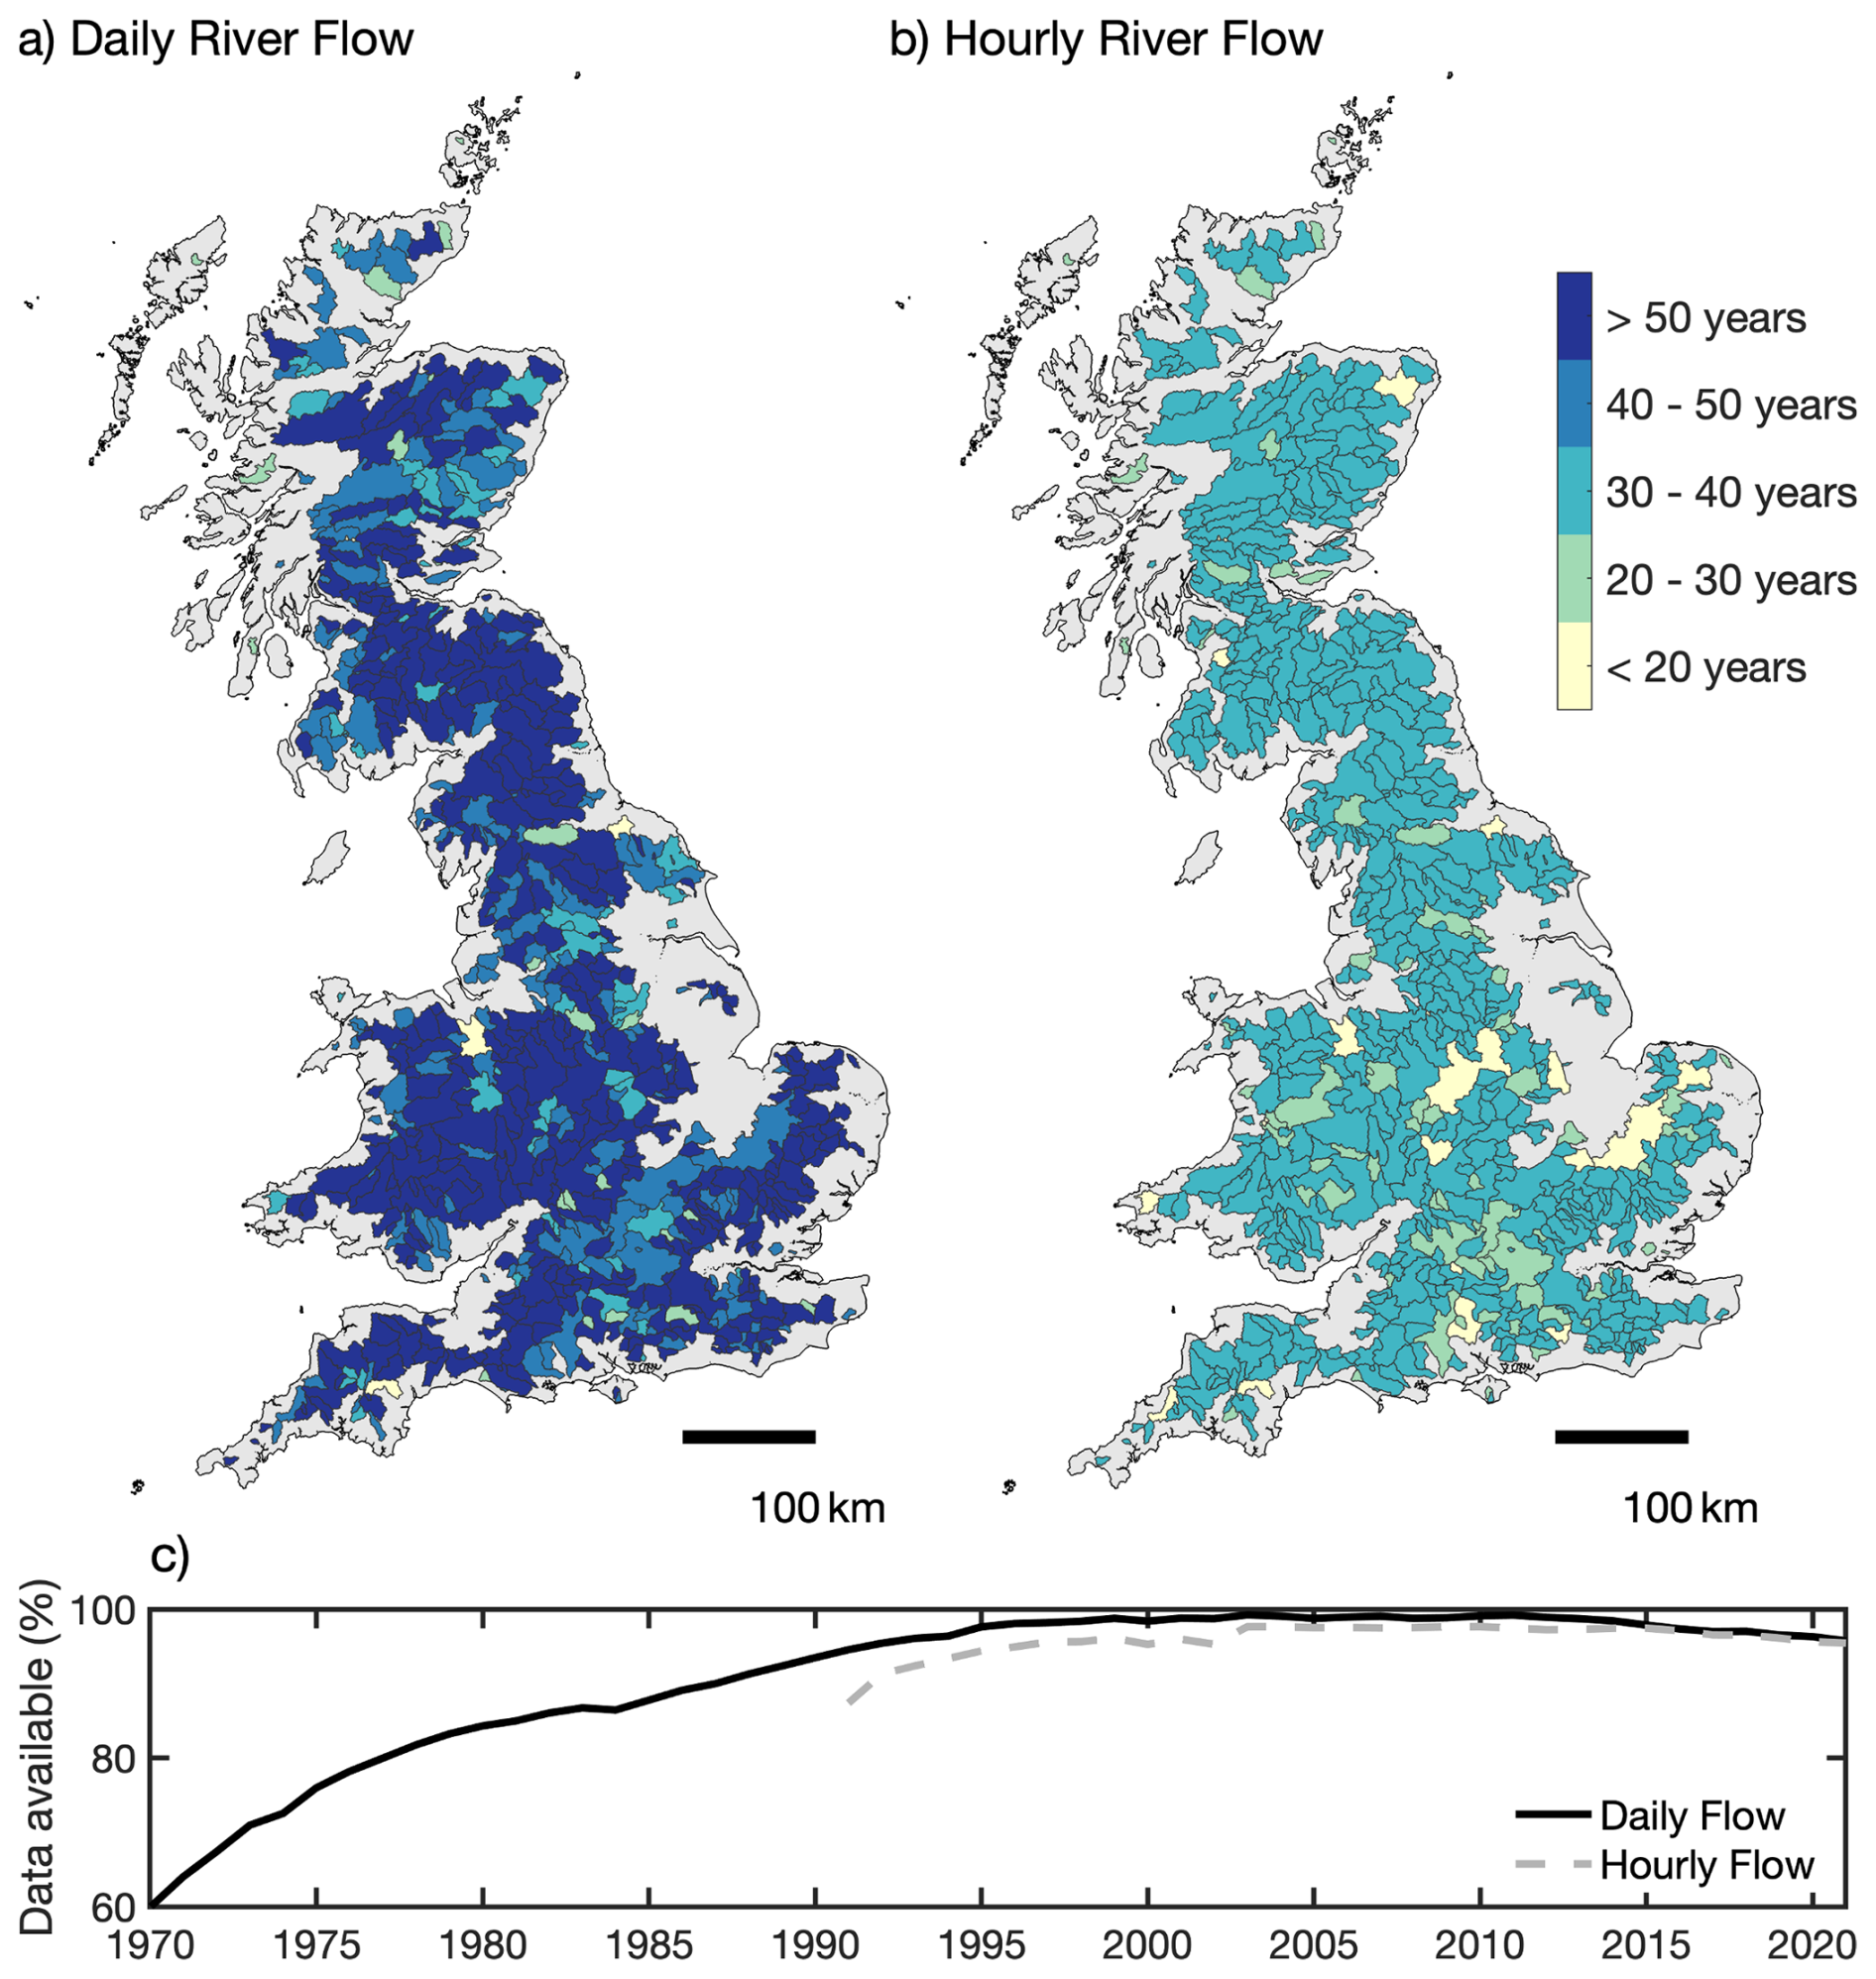
Figure 2Flow data availability (a) length of daily flow timeseries available for each catchment, (b) length of hourly flow timeseries available for each catchment, (c) percentage of daily and hourly data available for each year from 1970–2022 and 1990–2022. Contains OS data © Crown Copyright and database right 2025.
3.2 Hourly hydro-meteorological timeseries
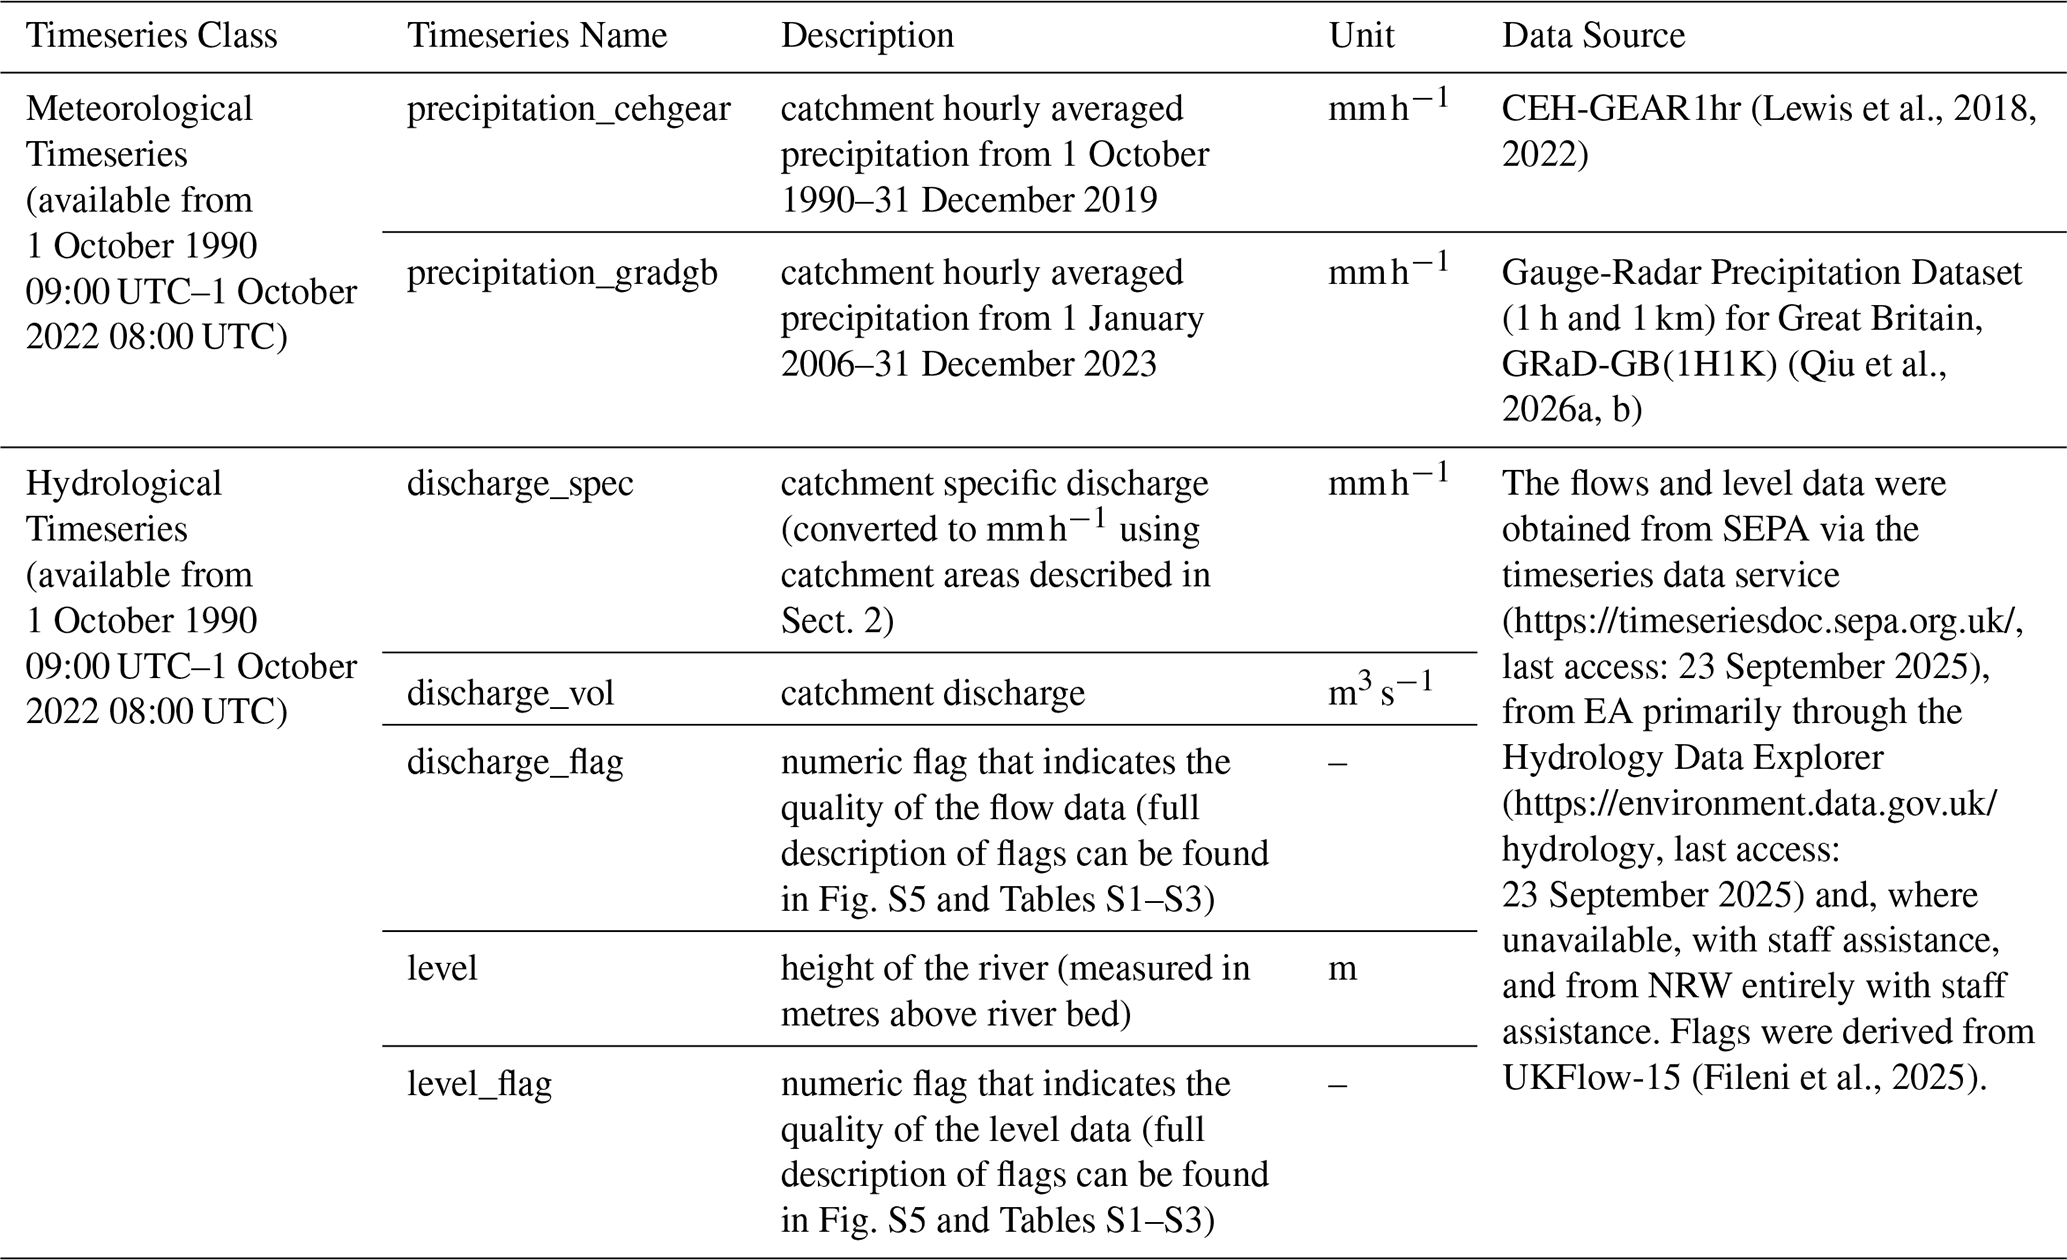
Hourly hydro-meteorological time series of rainfall, river flow and river level are provided for the 671 catchments from 1 October 1990 09:00 UTC to 1 October 2022 08:00 UTC (Table 3). All timeseries data in CAMELS-GB are reported in UTC with no daylight saving time adjustment. Rainfall on a given hour refers to the amount accumulated over the previous hour, whereas river level and flow are reported as hourly averages, representing the mean value over the previous hour.
Table 3Summary table of catchment hourly hydro-meteorological timeseries available in CAMELS-GB v2.
The hourly hydro-meteorological timeseries provide a long-term, high-temporal resolution dataset for model forcing and evaluation, catchment characterisation and analysis of extremes (particularly short-term flood events). Hourly PET is not included in the hourly hydro-meteorological timeseries due to a lack of hourly PET datasets and observed hourly climate variables to calculate hourly PET.
3.2.1 Hourly meteorological timeseries
Hourly rainfall timeseries are derived from two national products so users have the choice from multiple products.
The UK Centre for Ecology and Hydrology Gridded Estimates of hourly Areal Rainfall for Great Britain (CEH-GEAR1hr; Lewis et al., 2018, 2022) consists of 1 km2 gridded estimates of hourly rainfall from 1990–2016. The hourly rainfall estimates are derived from the temporal disaggregation of the CEH-GEAR daily data (described in Sect. 3.1.1) using hourly gauge data from the Met Office, EA, NRW and SEPA. The hourly gauge data are quality controlled to identify and reject erroneous hourly values in the gauge rainfall input dataset by comparing the gauge data with the CEH-GEAR daily dataset and by implementing a series of quality control tests (Lewis et al., 2018). The nearest neighbour interpolation methodology was used to generate the gridded hourly estimates which were subsequently used to disaggregate the daily data.
Hourly rainfall time series are also derived from the Gauge-Radar Precipitation Dataset (1 h and 1 km) for Great Britain, GRaD-GB(1H1K), which takes advantage of the accuracy of gauge rainfall and the spatial information of radar rainfall field (Qiu et al., 2026a). The dataset consists of 1 km2 gridded estimates of hourly rainfall for Great Britain from 1 January 2006 to 31 December 2023 and is produced by blending 5 min NIMROD composite radar rainfall (Met Office, 2024) with sub-hourly rainfall observations of ∼1800 rain gauge network from the UK Met Office, EA, NRW and SEPA. To produce the hourly rainfall dataset, the radar rainfall and sub-hour rainfall observations are first aggregated to hourly data. Then a quality control framework is applied to improve the underestimation (radar beam blockage) and overestimation (radar malfunction, ground clutter, and random noise) issues in the radar rainfall data (Qiu et al., 2026b). The quality control procedure that was employed in CEH-GEAR1hr (Lewis et al., 2018) is applied to the gauge rainfall data. A Gauss Blending method was then used to merge the radar rainfall with gauge rainfall. Maintenance work on the rainfall radars means that 3.5 % of the hourly timeseries are missing for the CAMELS-GB catchments due to missing radar data. Analysis of GraD-GB(1H1K) shows that the dataset can capture extreme rainfall events missed by rain-gauges (i.e. severe flash flooding in Coverack, Cornwall, 18 July 2017) (Qiu et al., 2026a).
A comparison of the hourly rainfall timeseries from CEH-GEAR1hr and GRaD-GB(1H1K) (Fig. 3) shows that on average, GRaD-GB(1H1K) hourly rainfall estimates are 10 % higher than CEH-GEAR1hr (range of −25 %–65 %) when calculating the average hourly rainfall using the full timeseries. There is more variability between the two products in the north of Great Britain (Fig. 3a). The higher average rainfall for the GRaD-GB(1H1K) dataset is partially explained by a higher proportion of wet hours (an hour with >0.1 mm of rainfall) in GRaD-GB(1H1K) (Fig. 3b), however, when the average hourly rainfall is calculated using only hours with >0.1 mm of rainfall, the relationship reverses and CEH-GEAR1hr has higher average hourly rainfall despite a lower proportion of wet hours (Fig. S3). The CEH-GEAR1hr data are based on gauge data corrected to the daily total and it specifically seeks to preserve intense sub-daily rainfall characteristics in the interpolation method it uses. Therefore, it has fewer wet hours and more intense hourly rainfall than GRaD-GB(1H1K). There is also a relationship with elevation where catchments with lower median elevation have higher average rainfall in the GRaD-GB(1H1K) dataset compared to catchments with higher median elevation (Fig. 3c). An example of the differences between the hourly rainfall datasets for individual catchments is shown in Figs. S4 and S5.
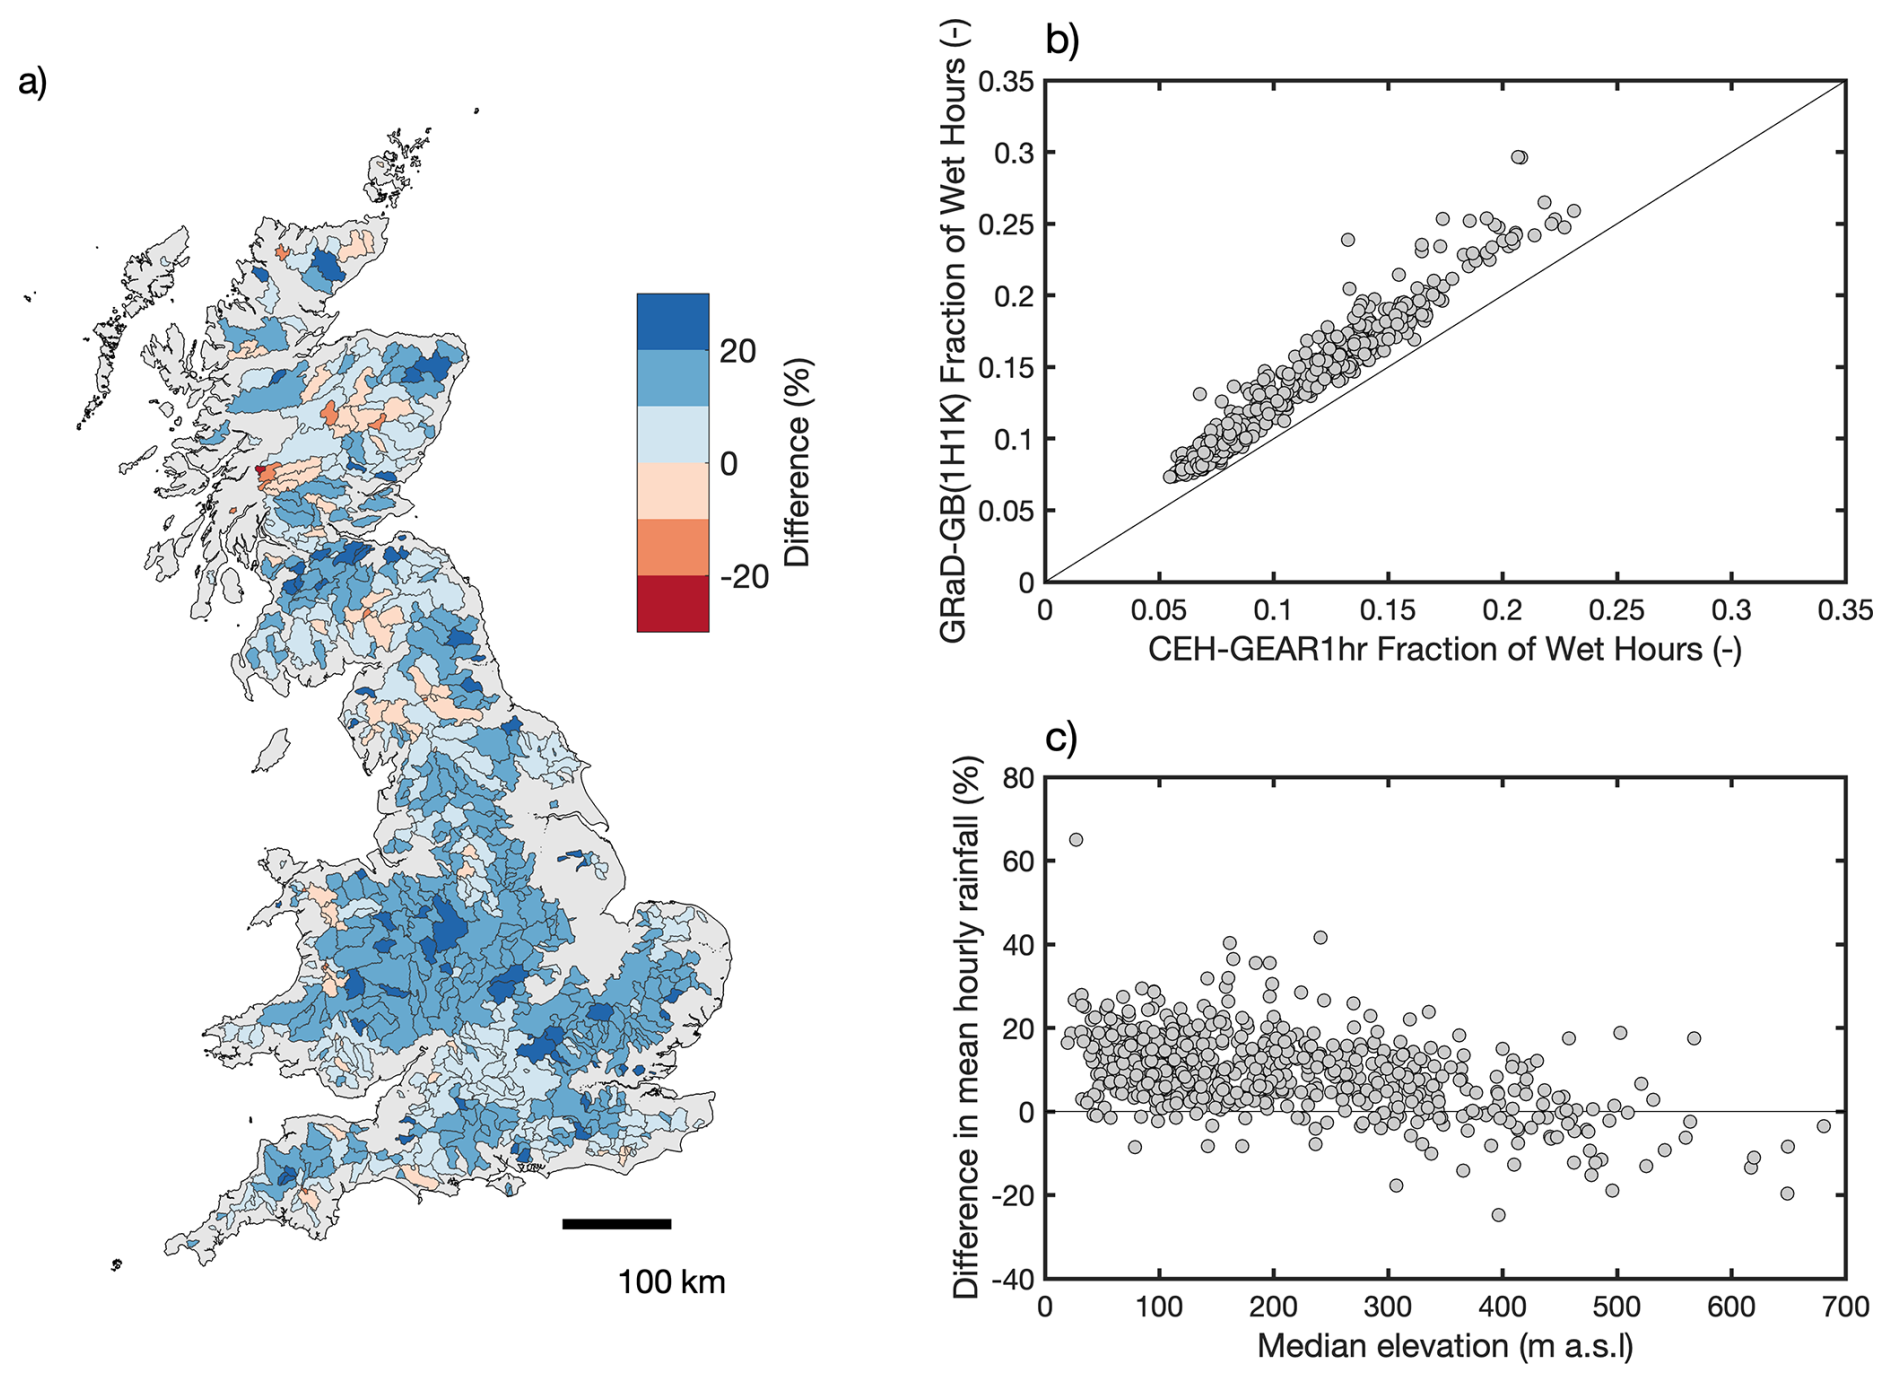
Figure 3National comparison of average hourly rainfall (mm h−1) from 1 January 2006 to 31 December 2016 between CEH-GEAR1hr and the GraD-GB(1H1K) datasets for the 671 CAMELS-GB catchments, (a) Difference in average hourly rainfall (average hourly rainfall calculated using all timesteps) (%), (b) Fraction of wet hours (wet hours are defined as any hour that recorded rainfall >0.1 mm), (c) Relationship between median elevation and difference in average hourly rainfall (%). The blue colours indicate that the GRaD-GB(1H1K) hourly rainfall averages are higher than the CEH-GEAR1hr hourly rainfall averages, while the red colours indicate that the GRaD-GB(1H1K) hourly rainfall averages are lower than the CEH-GEAR1hr hourly rainfall averages, as a percentage of the CEH-GEAR1hr dataset. Contains OS data © Crown Copyright and database right 2025.
3.2.2 Hourly hydrological timeseries
Hourly river flows and levels are provided for 664 and 570 gauges respectively in CAMELS-GB v2 from 1 October 1990–30 September 2022. These hourly river flow and level data combined with the hourly rainfall data provide a wealth of additional information beyond the daily data, particularly for flood analyses, convective storm responses, and other short-duration extremes. Below, we describe the source datasets of the hourly hydrological timeseries, how the timeseries were produced and the quality control applied to the dataset. Further details on the quality flags can be found in the Supplement (Sect. S1, Fig. S6 and Tables S1–S3).
Sub-daily river flows and levels are collected by the measuring authorities. The level data were obtained from SEPA via the timeseries data service (https://timeseriesdoc.sepa.org.uk/, last access: 23 September 2025), from EA primarily through the Hydrology Data Explorer (https://environment.data.gov.uk/hydrology, last access: 23 September 2025) and, where unavailable, with staff assistance, and from NRW entirely with staff assistance. The hourly flow data were obtained from the same sources but derived from the UK-Flow15 dataset (Fileni et al., 2025, 2026a). UK-Flow15 is a quality-controlled 15 min flow dataset for the UK, using records from over 1300 gauging stations including the EA, SEPA and NRW, in addition to the Department for Infrastructure in Northern Ireland and the UK Centre for Ecology & Hydrology.
Here, the 15 min flow and level data have been aggregated to hourly using a next-hour resample (e.g. 10:00 UTC flow value is the mean of flow recorded at 09:15, 09:30, 09:45 and 10:00 UTC). Most gauges (650) have at least 20 years of hourly flow data and 86 % (579) of the gauges have at least 30 years of hourly flow data (Fig. 2b). There is good spatial coverage of long hourly flow time series across Great Britain, with shorter time series concentrated in the Midlands and south-east of Great Britain. Similar to the daily data, there is greater missing flow data in the earlier part of the record (1990–1995, Fig. 2c). There is also good availability of level data where 80 % (542) of gauges have at least 20 years of hourly level data and 74 % (499) of gauges have at least 30 years of hourly level data.
The hourly flow and level timeseries are also provided with quality control flags. The hourly flow and level data have been quality controlled using both visual/manual inspection and automated quality control, including novel quality assessment techniques to assess the plausibility of extreme flow events (Fileni et al., 2026b). This quality control process is different to the quality control process applied to the daily flow data. Erroneous daily flow data are removed as part of the quality control process by measuring authorities and the UK NRFA, thus the daily flow data are the best estimate available and considered suitable for analysis and modelling without reference to flags. However, the quality control process for the hourly flow and level data acknowledges that some of these data may be incorrect and addresses this by applying flags to alert users of data issues, rather than removing data. It is therefore important that users use the flag-based system on the hourly flow and level data to identify, remove, or interpolate potentially problematic data as per their study requirements.
The quality flag for the corresponding hour in the flow and level data was selected according to an order of priority (i.e. which flag was deemed to be most important; see Sect. S1 and Fig. S6). No flow or level data have been removed or modified by the quality control process so users can decide which data they want to include as part of their analyses. The flags are grouped into three categories; (1) comparison with other data products (such as the daily NRFA data), (2) traditional QC checks (such as negative values, truncated low/high flows, spikes), and (3) high-flow QC checks (with comparison to antecedent rainfall and assessment of unrealistically high values) (see Tables S1–S3 for a full description of the quality control codes). The levels data underwent less extensive quality control than the flow dataset, and do not include quality control flags for some anomaly checks, comparisons with other UK hydrological products and hydrological similarity flags (see Sect. S1).
The most common flag for hourly river flow (Fig. S8) are where there is a mismatch of >5 % between the 15 min values recorded in UK-Flow15 (aggregated to daily) and the National River Flow Archive daily values – this flag is recorded in the timeseries of 539 stations and can appear for over 90 % of the timeseries for some gauging stations. The hourly flow data will not always be consistent with the daily NRFA flow data because of rating curve changes, version control inconsistencies, and station-specific issues.
The other flags typically affect a relatively small proportion of the timeseries (this is expected as many flags focus on extremes) but will be important for users to identify, remove, or interpolate potentially problematic data as per their study requirements.
Users seeking a simpler way to select a subset of stations that are suitable for a range of applications are recommended to use the “station quality” categorical information contained within the hydrometry attribute file (see Sect. 5.7).
3.3 Guidance on selection of hydro-meteorological datasets
CAMELS-GB v2 contains hydro-meteorological timeseries from different products, over different timescales and at different resolutions. Multiple products enable users to reflect some of the uncertainty in these data and make use of multiple forcing data at once (e.g. Kratzert et al., 2021). To help users to select the most appropriate dataset for their study, we have the following recommendations.
Firstly, timeseries from multiple meteorological products are used (where possible) in hydrological data and model analyses to reflect the uncertainty in these data. While differences between the two daily rainfall products (CEH-GEAR and HadUK rainfall) and the two daily temperature products (CHESS-met and HadUK-Grid air temperature) are generally small across most CAMELS-GB catchments, they can be larger for individual catchments or at specific timesteps (Figs. S1 and S2). Differences between the two daily PET products are larger, with Hydro-PE PET estimates, on average, 10 %–20 % higher than CHESS-PE. Differences between the two hourly rainfall products are also larger with GRaD-GB (1H1K) hourly rainfall estimates, on average, 10 % higher than CEH-GEAR1hr data.
Secondly, the HadUK-Grid daily meteorological timeseries are used in combination with the derived climatic signatures and hydrological indices (described in Sects. 5.2 and 5.3) from CAMELS-GB v2 as these timeseries were used to derive these attributes.
Thirdly, users should carefully consider which products they use for different applications. For long-term trend analyses, we recommend using the daily hydro-meteorological timeseries. If users are looking for the longest timeseries available, the HadUK-Grid and Hydro-PE datasets extend to 2022 in CAMELS-GB v2, whereas CEH-GEAR and CHESS-met are updated less frequently than the HadUK-Grid datasets and currently end in 2019. It is worth noting that many of the variables used to derive Hydro-PE daily PET and PETI were temporally downscaled from monthly to daily resolution. Therefore, these products may be more suitable for seasonal to long-term analyses, and less appropriate for event-scale or short-term applications. For analysis of short-term extremes (e.g. flood analyses), we recommend using the hourly hydro-meteorological timeseries.
Finally, users should carefully consider the quality of the hourly flow and level timeseries before use in studies. We recommend using the flag-based system on the hourly flow and level timeseries to identify, remove, or interpolate potentially problematic data as per their study requirements to ensure that only good-quality data are utilised (see Fileni et al., 2026b for a more detailed assessment of the quality control process). Users can also select stations based on the station quality information (see Sect. 5.7). For low flow studies, we would suggest the daily flow data are best to use as they provide a good representation of slowly changing low flows and has been given additional quality control by the UK National River Flow Archive. For mean flow analyses, we recommend removing any stations where major issues have been identified. For high flow analyses, we recommend only using stations that have good quality high-flow data and for flood event quantification and flood frequency analysis we recommend only using stations with the highest quality flow data (see Sect. 5.7).
Groundwater level time series for 55 boreholes across Great Britain were obtained from the British Geological Survey (BGS) (Table 4; Fig. 4). These boreholes were selected to fall within CAMELS-GB catchments and represent the main aquifers in Great Britain. Groundwater level data are provided by the measuring authorities (EA, NRW and SEPA) to the National Groundwater Level Archive (NGLA) maintained by the British Geological Survey. Data are measured in meters above Ordnance Datum Newlyn (mAOD), which indicates the groundwater level height at a particular site relative to mean sea level using the national height datum in Britain.
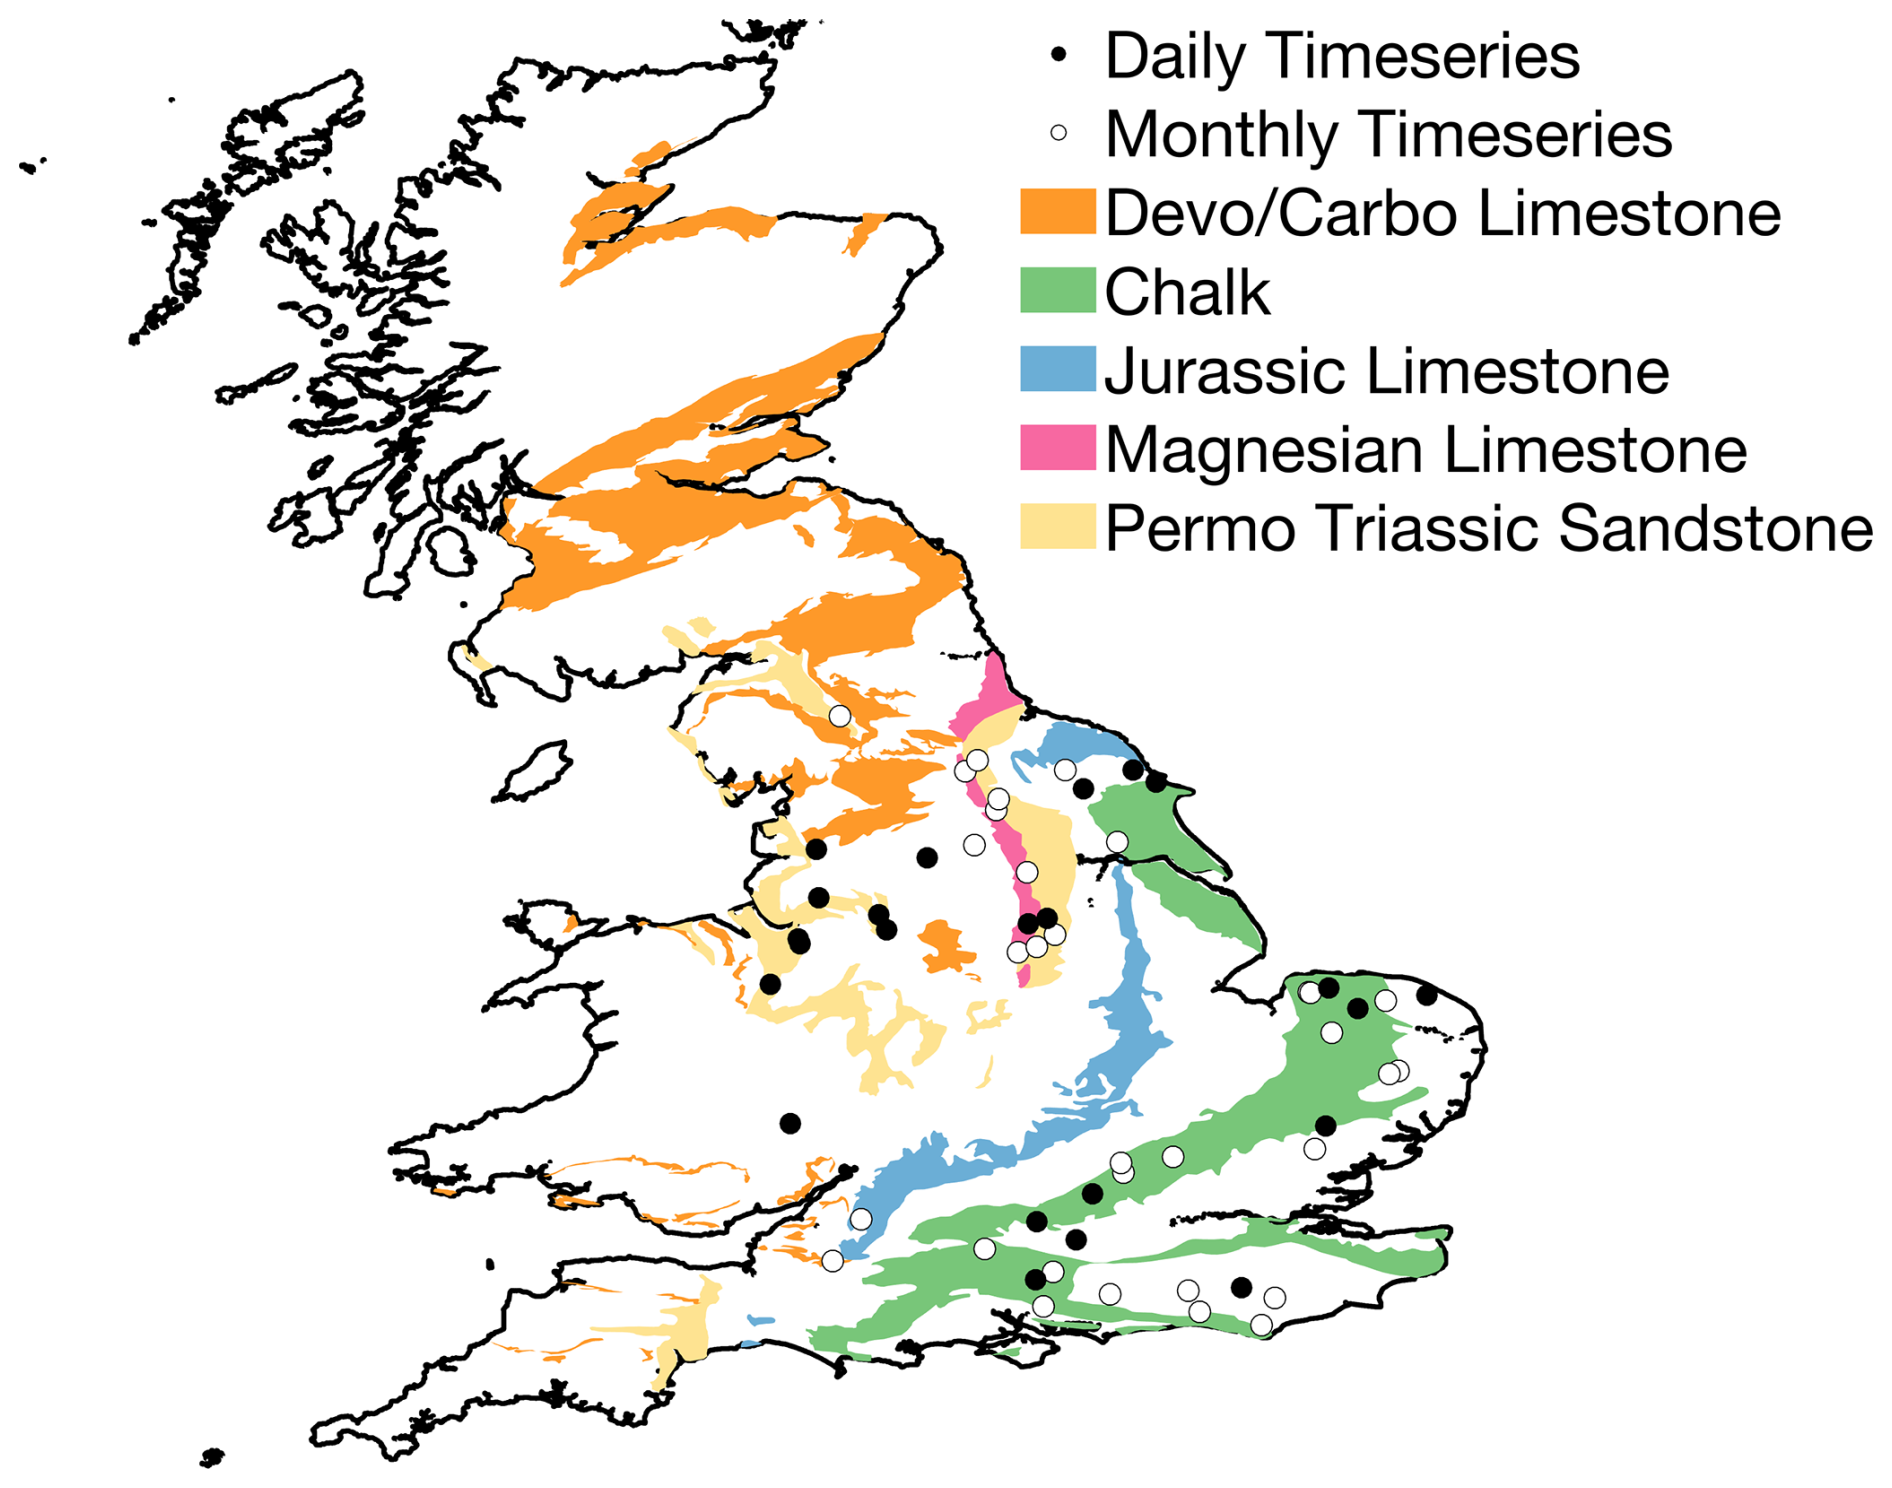
Figure 4Location of 55 groundwater level timeseries in CAMELS-GB v2. Underlying map shows main aquifers across Great Britain. Devo/Carbo is abbreviated from Devonian/Carboniferous. Contains British Geological Survey materials © UKRI [2025] and OS data © Crown Copyright and database right 2025.
Table 4Summary table of daily and monthly groundwater level timeseries available in CAMELS-GB v2.
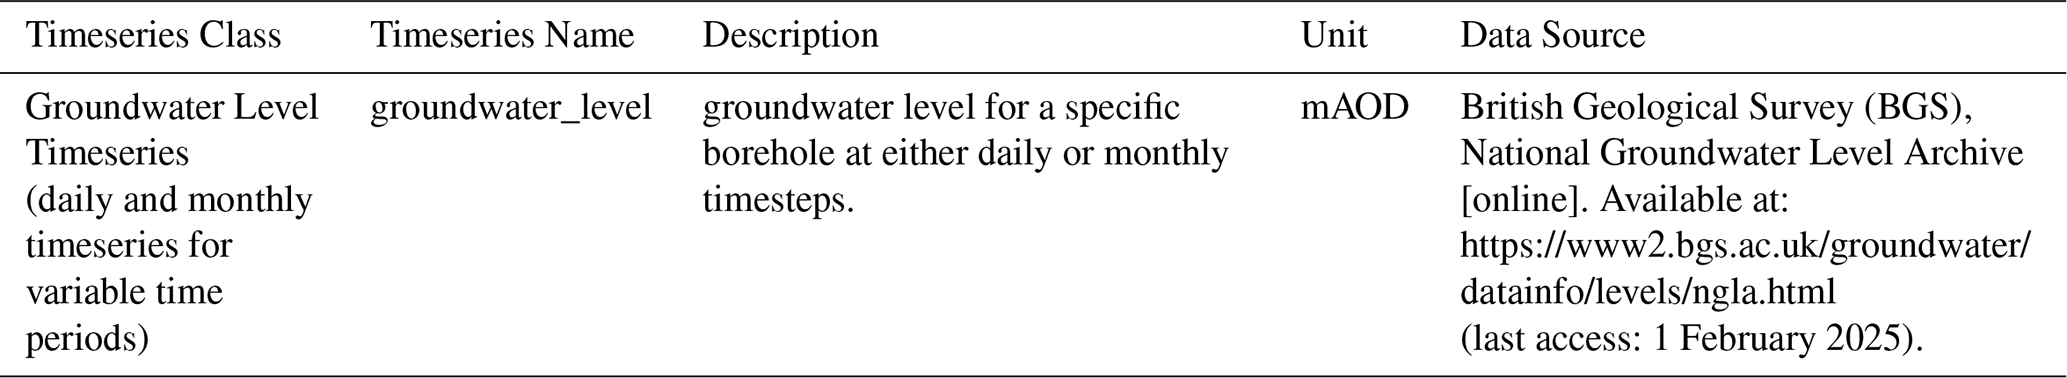
The groundwater level data were provided at irregular time intervals. To provide a standardised dataset for CAMELS-GB v2, the data were (1) aggregated to monthly values by taking an average of all measurements in each calendar month to provide monthly groundwater level timeseries for all boreholes, and (2) also provided at daily timescale where consistent daily or subdaily groundwater level observations were provided. Consequently, monthly groundwater level time series are provided for all 55 boreholes and daily groundwater time series are also provided for 23 of these boreholes. The monthly groundwater timeseries are available for 7–72 years with the earliest records beginning in the 1950s. The earliest daily groundwater timeseries start from 1993 and are occasionally averaged from subdaily data. For 23 of the boreholes, outliers in the monthly groundwater level timeseries were flagged as readings (1) diverted from the expected range, or (2) were close to the Datum (see Table S4).
Groundwater well attributes are also provided in CAMELS-GB v2, describing reference and hydrogeological information relating to the wells and boreholes where groundwater level timeseries are provided. For each groundwater well, the name, location (latitude, longitude, easting and northing), datum, depth and aquifer are provided. The start date, end date and percentage complete of the daily and/or monthly groundwater level timeseries provided in CAMELS-GB v2 are also provided.
Catchment attributes characterising location, topography, climate, hydrology, land cover, soils, hydrogeology, hydrometry and human influences are provided in CAMELS-GB v2. Most catchment attributes (location, topography, climate, hydrology, soils and hydrogeology) are the same as CAMELS-GB v1 and are re-calculated using the new catchment boundaries or re-extracted from the same source (to account for any changes) (Table 1). Key changes are made for (1) land cover, where changing land cover over multiple years are now provided, (2) hydrometry, where new peak flow information and station quality indicators are provided and (3) human influences, where new abstraction, discharge and reservoir attributes are provided (Table 1). This section describes the CAMELS-GB v2 catchment attributes including the source datasets, processing and limitations.
5.1 Location, area and topographic data
Catchment attributes describing the location and topography are kept consistent with CAMELS-GB v1 but are re-extracted for each catchment from the NRFA to ensure the latest version of these data. Catchment elevation (min, 10th, 50th, 90th, max) within the catchment mask is derived from CEH's 50 m Integrated Hydrological Digital Terrain Model. Mean elevation and mean drainage path slope (index of catchment steepness) are also provided based on methods developed for the Flood Estimation Handbook (Bayliss, 1999), except for two catchments (18011 and 26006) where catchment boundaries could not be automatically derived. For more information see Sect. 6.1 of Coxon et al. (2020a).
5.2 Climatic indices
The same suite of climatic indices is calculated as CAMELS-GB v1 (and other CAMELS datasets). These climatic indices characterise long-term (i.e. mean precipitation and PET, aridity index), seasonal (i.e. rainfall seasonality and fraction of snow), and short-term (i.e. frequency, duration and timing of high and low precipitation events) climate dynamics. The climatic indices in CAMELS-GB v2 are derived over the time period 1970–2022 using the HadUK-Grid catchment daily rainfall, potential evapotranspiration (without correction for interception as it has more consistency with other global and national PET products), and temperature time series described in Sect. 3.1.1 of this paper. These data were chosen (rather than the CEH-GEAR and CHESS-PE data) as the HadUK-Grid data cover the full timeseries available.
Climatic indices calculated from the hourly data are not provided as the long term and seasonal climate indices are very similar regardless of the temporal resolution of the data. While the short-term (i.e. frequency, duration and timing of high and low precipitation events) climatic indices would be different when calculated using hourly data for some catchments, analysis of the impacts of temporal resolution on catchment attributes (including careful consideration of choice of indices) is beyond the scope of this paper.
5.3 Hydrologic signatures
The same suite of hydrologic signatures is calculated as CAMELS-GB v1 (and other CAMELS datasets). The hydrologic signatures characterise long-term (i.e. mean flow, runoff ratio, streamflow elasticity, baseflow index), seasonal (i.e. the half flow date), and short-term (i.e. high and low flow percentiles, frequency and duration of high and low streamflow events) streamflow dynamics. Seven catchments have a runoff ratio greater than one; gauge ID 26006 and 27038 have the highest runoff ratios of 3.01 and 2.74 respectively. Catchments with a runoff ratio greater than one are either (1) groundwater dominated catchments where the groundwater catchment greatly exceeds the topographical catchment or (2) impacted by human activities with water being imported into the catchment for water supply or hydro-electricity.
The hydrologic signatures in CAMELS-GB v2 are derived using the HadUK-Grid catchment daily rainfall and streamflow time series from 1 October 1970 to 30 September 2022 (Sects. 3.1.1 and 3.1.2). Users should consider the availability of streamflow data (i.e. length and percentage missing) when comparing hydrologic signatures across catchments (McMillan et al., 2023).
5.4 Land cover attributes
Land cover for multiple years is provided in CAMELS-GB v2. Land cover attributes for each catchment were derived from the UK Land Cover Map 1990, 2015, 2017, 2018, 2019, 2020, 2021 and 2022 produced by UK CEH (Marston et al., 2022, 2024; Morton et al., 2020a, b, c, 2021; Rowland et al., 2017, 2020). While there are also land cover maps produced by UK CEH for 2000 and 2007, these do not use a consistent methodology for derivation of their land cover classes, preventing straightforward analysis of changes in land cover over time.
The land cover maps are derived by classifying satellite imagery into 21 classes based on the Joint Nature Conservation Committee (JNCC) broad habitats. Like CAMELS-GB v1, these 21 classes are mapped to eight land cover classes that describe deciduous woodland, evergreen woodland, grass and pasture, shrubs, crops, suburban and urban, inland water, bare soil, and rocks. For CAMELS-GB v2, we use the 25 m raster data from the range of LCM products consisting of the most likely land cover type for each grid cell. For each catchment, the percentage of the catchment covered by each of the eight land cover types was calculated and is provided in CAMELS-GB v2 for 1990, 2015, 2017, 2018, 2019, 2020, 2021 and 2022 (Table 5).
Users should be aware that while advances in methods means that land cover is more consistent between years, there are still issues around accuracy, stability between years and the strength of the change signal. This means that while some of the land cover change between years is real, there is also noise in the variability between years. This could be due to (1) the timing and quality of satellite imagery, particularly in high elevation catchments where there is often limited satellite imagery due to snowy/cloudy conditions, (2) differences in methods applied between years and (3) confusion in land cover classes (Rowland et al., 2024). As an example, we show changes in urban land cover for catchments in CAMELS-GB v2 in Fig. S9. While a trend of increasing urban land cover over time is apparent for many catchments, there is variability between years and most catchments experience a decrease in urban cover from 2021–2022 that is unlikely to be reflected in the real world. Consequently, we recommend users carefully consider how these data are incorporated in change detection analyses and consider pooling data for recent years together to reflect the uncertainty in the change signal.
5.5 Soil attributes
Soil attributes are the same as CAMELS-GB v1 but derived using the updated catchment boundaries described in Sect. 2. A brief summary of the underlying data is provided here, with a full summary provided in Sect. 6.5 of Coxon et al. (2020a).
Soil attributes of depth available to roots, percentage sand, silt and clay content, organic carbon content, bulk density, and total available water content for each catchment were calculated from the European Soil Database Derived Data product (Hiederer, 2013a, b). Saturated hydraulic conductivity and porosity (saturated volumetric water content) were also estimated from these variables using two pedo-transfer functions (based on Cosby et al., 1984, Wösten, 2000, and Wösten et al., 1999, 2001). A weighted mean of the topsoil and subsoil data was calculated for all 1 km grid cells and then used to calculate average soil properties for each catchment either by calculating the arithmetic mean or harmonic mean (for saturated hydraulic conductivity, Samaniego et al., 2010) of all 1 km grid cells within the catchment boundary. To capture the spatial heterogeneity and data availability of the soils data, the 5th, 50th, and 95th percentile and percentage of no-data values of all grid cell values falling within the catchment boundaries are also provided.
5.6 Hydrogeological attributes
Hydrogeological attributes are the same as CAMELS-GB v1 but derived using the updated catchment boundaries described in Sect. 2. A brief summary of the underlying data is provided here, with a full summary provided in Sect. 6.6 of Coxon et al. (2020a).
Hydrogeological attributes were derived from products produced by the British Geological Survey; the UK bedrock hydrogeological map (BGS, 2019) and a superficial deposit productivity map. These two datasets were merged to categorise the uppermost geological layer into nine classes that account for superficial deposits (where present) and bedrock (where superficial deposits are absent). The nine classes indicate how hydrogeology affects river flow behaviour by characterising the proportion of the catchment that is covered by deposits that have high, moderate, or low productivity, and whether the dominant water flow is through fractures or between grains (Table 5).
5.7 Hydrometry and discharge uncertainty attributes
The hydrometry and discharge uncertainty attributes describe the gauging station type (i.e. the type of weir, structure, or measurement device used to measure flows), period of flow data available (i.e. start date, end date and percentage complete), gauging station discharge uncertainty, peak flow information (i.e. the maximum gauged flow and percentage of extrapolation and channel characteristics (such as bankfull) (Table 5). Many of these attributes are the same as CAMELS-GB v1. The gauging station type was re-extracted from the NRFA with changes for a small number of stations where the gauging station type has changed since CAMELS-GB v1. The channel characteristics were also re-extracted from the NRFA with changes for a small number of stations. These data are useful for flood analyses, but it is worth noting there is a large proportion of missing data for these attributes as they (1) may not be relevant for some gauging stations (e.g. an open channel station has no structure and therefore no structure-full flow), and (2) are often modelled and this modelling may not have not been undertaken at many stations. Furthermore, these data are not routinely updated by the NRFA so may, in some cases, reflect older assessments that predate rating changes, and should therefore be used cautiously. The period of flow data were updated for the daily timeseries and new catchment attributes added to describe the period of hourly flow data. The gauging station discharge uncertainties were calculated using the same method from Coxon et al. (2015) but updated so that discharge uncertainties were calculated from flow percentiles from the longer streamflow timeseries. A full description of the discharge uncertainty attributes is provided in Sect. 6.7 of Coxon et al. (2020a).
New hydrometry attributes were added describing the quality of the flow data collected at each station. This includes categorical information from the UK NRFA to help understand the quality of high flow measurements and qualitative information on any issues found during analysis of the 15 min flow data (Fileni et al., 2026b). Stations that are suitable for QMED (station_quality_qmed) can be used for high-flow estimation; however, measurements are more likely to deviate from the true values, particularly for the largest flows, while stations that are suitable for pooling (station_quality_pooling) have the highest quality high-flow measurements and are recommended for flood event quantification and flood frequency analysis.
New hydrometry attributes were also added describing peak flow information; including the (1) maximum gauging flow (the highest manual measurement of flow taken at a gauging station) and the date this maximum gauging flow was taken, (2) the maximum daily/hourly flow recorded in the catchment timeseries in CAMELS-GB v2, and (3) the percentage of time (excluding NaNs) that the daily/hourly flow timeseries in CAMELS-GB v2 is higher than the maximum gauging flow. These new attributes contain important information about the uncertainty at high flows as users can identify where (and how often) the daily/hourly flow timeseries exceed the highest manual measurement of flow taken at a gauging station and therefore are based on extrapolation of the rating curve which can result in significant uncertainties (Juston et al., 2014). Figure 5 shows that for most gauges (70 % for daily and 69 % for hourly), the flow is extrapolated above the maximum flow gauging for a small proportion (<1 %) of the time series, with relatively few gauges exceeding 1 % of the timeseries (4 % of gauges for daily flow and 5 % for hourly). However, one gauge (NRFA gauge ID 40010) has more than 30 % of the flow timeseries extrapolated above the maximum flow gauging and for some gauges the highest hourly/daily flow can be more than 10× bigger than the maximum flow gauging (Fig. 5c). For 16 % (daily) and 36 % (hourly) of the gauges where maximum flow gauging is available, the maximum daily/hourly flow is 2× bigger than the maximum flow gauging. It is worth noting that (1) peak flow information is not available for 26 % of CAMELS-GB gauges as they have no maximum flow gauging recorded on the NRFA website, (2) the discharge uncertainty estimates provided in CAMELS-GB v2 are based on an older set of gaugings so there may be some inconsistencies between the maximum flow gauging and where uncertainty bounds can be calculated and (3) sometimes the maximum daily/hourly flow is lower than the maximum gauging flow because a higher flow has occurred at the gauging station outside of the time period provided in CAMELS-GB v2.
Figure 5Comparison of the maximum gauging flow with (a) maximum daily flow and (b) maximum hourly flow recorded in the catchment timeseries in CAMELS-GB v2, where dots are coloured by the percentage of time (excluding NaNs) that the daily/hourly flow timeseries in CAMELS-GB v2 is higher than the maximum gauging flow. (c) ratio of maximum flow gauging to maximum daily/hourly flow in flow timeseries in CAMELS-GB v2.
5.8 Human influence attributes
CAMELS-GB contains many catchments impacted by human activities, so we aim to provide attributes that help users quantify and characterise human influences in each of the catchments. CAMELS-GB v2 uses new, open-source datasets to quantify abstractions and discharges in each catchment, and provides new reservoir attributes characterising the size and location of the reservoirs.
5.8.1 Benchmark catchments
The UK Benchmark Network contains 146 catchments where human impacts on flow regimes are assumed to be minimal Harrigan et al., 2018). All CAMELS-GB catchments are flagged according to whether they belong to the UK Benchmark Network, providing users with an indication of which catchments are relatively near-natural and therefore more suitable for studies requiring minimal human impact. Users should be aware that to ensure coverage in the south and east of GB (where there are lots of human influences on river flows), some human impacts were accepted.
5.8.2 Abstraction and discharges
Average daily abstraction and discharge rates are provided again in CAMELS-GB v2 but based on a new dataset of abstractions and discharges (Rameshwaran et al., 2025). This new dataset is based on the same underlying data as used in CAMELS-GB v1 but underwent additional quality control and is now available open source.
The abstraction data consist of the total water quantity (in most cases measured using a water meter) that has been abstracted for each license and each month from 1999 to 2014 in England on a 1 km grid. These monthly abstraction data were averaged to provide a mean monthly abstraction from 1999 to 2014 for each abstraction licence and then aggregated for each catchment to provide a mean daily abstraction rate for all English catchments in CAMELS-GB v2 for groundwater and surface water sources. The use of the abstracted water (agriculture, amenities, environmental, industrial, energy, or water supply) is also provided and how much of the abstracted water is consumed/lost (high – 100 %, medium – 60 %, low – 3 % and very low – 0.3 %). For example, cress pond throughflow is described as very low loss, whilst farming and water supply is classed as medium loss, and trickle irrigation is classed as high. These loss factors are only used for billing purposes and are therefore indicative of the true water consumption.
The discharges data consist of recent actual discharges for England from the WRGIS (Water Resources Geographic Information System). These data represent discharges from sewage treatment works and other “significant” discharges (typically those >20 m3 d−1) using an estimate of recent actual summer discharge. For each catchment, we calculate a sum of all the discharges that fall within the catchment boundary and then convert into millimetres per day using catchment area to provide a mean daily discharges rate.
There are several limitations associated with these data. Firstly, these catchment attributes are only available for England and there are many catchments where either (1) no data are available (identified by “NaN”), (2) abstractions or discharges are recorded in zero when in reality they are not, or (3) only a proportion of the abstractions/discharges are accounted for, as the catchments lie on the border of England–Wales or England–Scotland. Secondly, the topographical catchment mask was used to define which abstraction returns were included in each catchment which will not be representative for groundwater abstractions that lie within the topographical catchment but do not have a direct impact on the catchment streamflow or those that lie outside the catchment but have an impact on that catchment's streamflow. Thirdly, this is not the full picture of human influences within each catchment. Not all licence types/holders are required to submit records to the Environment Agency; the abstraction data used here does not hold returns for abstractions less than 20 m3 d−1, and from 2008, abstraction licence-holders less than 100 m3 d−1 were no longer required to submit records of abstraction. Furthermore, there is large inter-annual and intra-annual variation in the abstraction and discharges data, and its impacts will be different across the flow regime. Finally, while abstractions represent water removed from surface water or groundwater sources, some of this water will be returned to catchment storages. This is partially represented by the loss factor and discharges information but the relationship between discharge consent data and water returned from abstractions will often be more complex than these simple attributes.
5.8.3 Reservoirs
For CAMELS-GB v2, several reservoir attributes are derived for each catchment by determining the reservoirs that lie within the catchment mask from the reservoir locations and then calculating (1) the number of reservoirs in each catchment; (2) their combined capacity; (3) the fraction of that capacity that is used for hydroelectricity, navigation, drainage, water supply, flood storage, and environmental purposes; (4) the year when the first and last reservoirs in the catchment were built, and (5) the contributing area and normalised upstream capacity.
The first four sets of reservoir attributes are the same as CAMELS-GB v1 and calculated from the open-source UK reservoir inventory (Durant and Counsell, 2018) supplemented with information from SEPA's publicly available controlled reservoirs register. For CAMELS-GB v2, we excluded 43 reservoirs from the inventory as they could not be placed on the river network largely because their outflow or inflow location was unclear (see Fig. S1 in Salwey et al., 2023) and therefore the new reservoir attributes could not be calculated. This leads to only minor differences with CAMELS-GB v1 (Fig. S10).
Two new reservoir attributes are included in CAMELS-GB v2; contributing area and normalised upstream capacity. These attributes were chosen due to previous studies finding clear links between the size and location of upstream reservoirs and the associated flow alteration for UK catchments (Salwey et al., 2023).
Contributing area describes the percentage of the overall catchment surface area that is drained through reservoirs:
In CAMELS-GB v2, the mean contributing area is 18 %, with a maximum of 100 %. The contributing area is complemented by the normalised upstream capacity, which compares the capacity of a reservoir to the average volume of precipitation received by the catchment in a year:
In CAMELS-GB v2, the average normalised upstream capacity is 0.08 (i.e. the reservoir is large enough to store 8 % of average annual rainfall) with a maximum of 2.5 (i.e. the reservoir is large enough to store 250 % of average annual rainfall). Twelve catchments have a normalised upstream capacity greater than 0.2 where the highest degree of alteration is typically found in the UK (Salwey et al., 2023).
The exactextract Python package (https://pypi.org/project/exactextract/0.2.0/, last access: 22 January 2026, Baston, 2024) is used to extract catchment average data from gridded datasets based on the catchment boundary polygons described in Sect. 2. The code from https://github.com/naddor/camels (naddor, 2025) was used to generate the climatic indices and hydrological signatures.
The CAMELS-GB v2 dataset is available under an Open Government License via the UK Centre for Ecology & Hydrology Environmental Information Data Centre (Coxon et al., 2025; https://doi.org/10.5285/9a46d428-958f-4ac1-86eb-94eee70c0955). The data contain catchment boundaries, hydro-meteorological and groundwater time series (at hourly, daily and monthly time-scales), catchment attributes and groundwater well attributes as described above.
The data format (including the file naming conventions) is described in the supporting documentation available on the UK Centre for Ecology & Hydrology Environmental Information Data Centre.
This paper presents the second version of CAMELS-GB. CAMELS-GB v2 collates millions of observations from across Great Britain at hourly to monthly timescales, including quality-controlled daily river flows, catchment boundaries, and catchment characteristics from the UK National River Flow Archive. The new features include (1) extended daily hydro-meteorological timeseries up to 2022 including meteorological timeseries from new observed climate datasets, (2) new hourly precipitation, river flows and level timeseries, (3) new groundwater level timeseries and attributes for 55 groundwater wells, and (4) new catchment attributes characterising changing land cover, peak flows and human influences.
CAMELS-GB v2 provides exciting new opportunities for environmental and modelling analyses across Great Britain. This includes enabling the development of common frameworks for model evaluation and benchmarking at regional to national scales and the analysis of hydrologic variability across the UK. The new sub-daily hydro-meteorological timeseries provide a wealth of additional information beyond the daily data, particularly for flood analyses, convective storm responses, and other short-duration extremes. The new catchment attributes enable users to explore how different catchment characteristics control river flow behaviour, particularly in human-influenced catchments. Future updates to the dataset will concentrate on greater spatial and temporal coverage of the groundwater level data and river network characteristics (e.g. Strahler Index).
The supplement related to this article is available online at https://doi.org/10.5194/essd-18-4345-2026-supplement.
GC led and produced CAMELS-GB v2 with the following contributions: (1) YZ derived all the catchment timeseries data from gridded datasets, (2) FF produced the hourly flow and level timeseries with contributions from HJF, EL, MF, HC and HH, (3) XQ produced the GRaD-GB(1H1K) with contributions from HJF, AG and EL, (4) MF and RB provided the daily streamflow data, catchment boundaries and all catchment attributes sourced from the National River Flow Archive, (5) TG provided the groundwater level timeseries, DEW processed these timeseries and produced the groundwater attributes, (6) GGRN derived the soils and abstraction attributes, (7) SaS derived the climatic attributes, hydrologic signatures, hydrogeology attributes and the reservoir attributes, (8) HC facilitated the upload of the dataset to the EIDC. All co-authors contributed to the design of the dataset. The manuscript was prepared by GC with contributions from all co-authors.
The contact author has declared that none of the authors has any competing interests.
Publisher's note: Copernicus Publications remains neutral with regard to jurisdictional claims made in the text, published maps, institutional affiliations, or any other geographical representation in this paper. The authors bear the ultimate responsibility for providing appropriate place names. Views expressed in the text are those of the authors and do not necessarily reflect the views of the publisher.
The authors would like to express their great appreciation to all the data collectors, processors, and providers who made this work possible, particularly at the UK Centre for Ecology & Hydrology, the National River Flow Archive, UK Met Office, Environment Agency, Natural Resources Wales, Scottish Environmental Protection Agency, British Geological Survey and the National Groundwater Level Archive. In particular, many thanks to the staff from the Environment Agency, Natural Resources Wales and Scottish Environmental Protection Agency involved in the provision of sub-daily flow/level and groundwater level data.
Many thanks to Louise Slater (University of Oxford) and Clare Rowland (UK Centre for Ecology & Hydrology) who provided valuable advice on the land cover data. Many thanks also to Rosanna Lane (UK Centre for Ecology & Hydrology) for valuable advice on the soil catchment attributes.
This work was supported by the Natural Environment Research Council (NERC-UKRI) as part of the Floods and Droughts Research Infrastructure (FDRI) project. The views and opinions expressed are those of the authors alone. NERC-UKRI is not responsible for any application of the data/information.
This work was made possible through the Environment Agency Flood Hydrology Improvement Programme.
Doris E. Wendt and Tom Gribbin publish with the permission of the Executive Director of the British Geological Survey (UKRI).
This research has been supported by the Medical Research Council (grant no. MR/V022857/1), the Natural Environment Research Council (grant nos. NE/X018865/1 and NE/S007512/1), the Science and Technology Facilities Council (grant no. ST/Y003713/1), and the European Research Council, HORIZON EUROPE European Research Council (grant no. 101075354).
This paper was edited by Dalei Hao and reviewed by Yi He, Alexander Dolich, Hörður Bragi Helgason, and Franziska Clerc-Schwarzenbach.
Addor, N., Newman, A. J., Mizukami, N., and Clark, M. P.: The CAMELS data set: catchment attributes and meteorology for large-sample studies, Hydrol. Earth Syst. Sci., 21, 5293–5313, https://doi.org/10.5194/hess-21-5293-2017, 2017.
Addor, N., Nearing, G., Prieto, C., Newman, A. J., Le Vine, N., and Clark, M. P.: A Ranking of Hydrological Signatures Based on Their Predictability in Space, Water Resour. Res., 54, 8792–8812, https://doi.org/10.1029/2018WR022606, 2018.
Almagro, A., Oliveira, P. T. S., Meira Neto, A. A., Roy, T., and Troch, P.: CABra: a novel large-sample dataset for Brazilian catchments, Hydrol. Earth Syst. Sci., 25, 3105–3135, https://doi.org/10.5194/hess-25-3105-2021, 2021.
Alvarez-Garreton, C., Mendoza, P. A., Boisier, J. P., Addor, N., Galleguillos, M., Zambrano-Bigiarini, M., Lara, A., Puelma, C., Cortes, G., Garreaud, R., McPhee, J., and Ayala, A.: The CAMELS-CL dataset: catchment attributes and meteorology for large sample studies – Chile dataset, Hydrol. Earth Syst. Sci., 22, 5817–5846, https://doi.org/10.5194/hess-22-5817-2018, 2018.
Arsenault, R., Brissette, F., Martel, J.-L., Troin, M., Lévesque, G., Davidson-Chaput, J., Gonzalez, M. C., Ameli, A., and Poulin, A.: A comprehensive, multisource database for hydrometeorological modeling of 14 425 North American watersheds, Sci. Data, 7, 243, https://doi.org/10.1038/s41597-020-00583-2, 2020.
Baston, D.: exactextract: Fast Extraction from Raster Datasets using Polygons, Python package, GitHub [code], https://isciences.github.io/exactextract/ (last access: 25 June 2026), 2024.
Bathelemy, R., Brigode, P., Andréassian, V., Perrin, C., Moron, V., Gaucherel, C., Tric, E., and Boisson, D.: Simbi: historical hydro-meteorological time series and signatures for 24 catchments in Haiti, Earth Syst. Sci. Data, 16, 2073–2098, https://doi.org/10.5194/essd-16-2073-2024, 2024.
Bayliss, A.: Flood estimation handbook: Catchment descriptors, Institute of Hydrology, https://www.ceh.ac.uk/sites/default/files/2021-11/Flood-Estimation Handbook-5-Catchment-Descriptors_Adrian-Bayliss.pdf (last access: 25 June 2026), 1999.
BGS hydrogeology 625k: https://www.bgs.ac.uk/products/hydrogeology/maps.html, last access: 8 October 2019.
Bloomfield, J. P., Gong, M., Marchant, B. P., Coxon, G., and Addor, N.: How is Baseflow Index (BFI) impacted by water resource management practices?, Hydrol. Earth Syst. Sci., 25, 5355–5379, https://doi.org/10.5194/hess-25-5355-2021, 2021.
Brown, M. J., Robinson, E. L., Kay, A. L., Chapman, R., Bell, V. A., and Blyth, E. M.: Potential evapotranspiration derived from HadUK-Grid 1 km gridded climate observations 1969–2022 (Hydro-PE HadUK-Grid), NERC EDS Environmental Information Data Centre [data set], https://doi.org/10.5285/beb62085-ba81-480c-9ed0-2d31c27ff196, 2023.
Chagas, V. B. P., Chaffe, P. L. B., Addor, N., Fan, F. M., Fleischmann, A. S., Paiva, R. C. D., and Siqueira, V. A.: CAMELS-BR: hydrometeorological time series and landscape attributes for 897 catchments in Brazil, Earth Syst. Sci. Data, 12, 2075–2096, https://doi.org/10.5194/essd-12-2075-2020, 2020.
Chagas, V. B. P., Chaffe, P. L. B., and Blöschl, G.: Climate and land management accelerate the Brazilian water cycle, Nat. Commun., 13, 5136, https://doi.org/10.1038/s41467-022-32580-x, 2022a.
Chagas, V. B. P., Chaffe, P. L. B., and Blöschl, G.: Process Controls on Flood Seasonality in Brazil, Geophys. Res. Lett., 49, e2021GL096754, https://doi.org/10.1029/2021GL096754, 2022b.
Cosby, B. J., Hornberger, G. M., Clapp, R. B., and Ginn, T. R.: A Statistical Exploration of the Relationships of Soil Moisture Characteristics to the Physical Properties of Soils, Water Resour. Res., 20, 682–690, https://doi.org/10.1029/WR020i006p00682, 1984.
Coxon, G., Freer, J., Westerberg, I. K., Wagener, T., Woods, R., and Smith, P. J.: A novel framework for discharge uncertainty quantification applied to 500 UK gauging stations, Water Resour. Res., https://doi.org/10.1002/2014WR016532, 2015.
Coxon, G., Addor, N., Bloomfield, J. P., Freer, J., Fry, M., Hannaford, J., Howden, N. J. K., Lane, R., Lewis, M., Robinson, E. L., Wagener, T., and Woods, R.: CAMELS-GB: hydrometeorological time series and landscape attributes for 671 catchments in Great Britain, Earth Syst. Sci. Data, 12, 2459–2483, https://doi.org/10.5194/essd-12-2459-2020, 2020a.
Coxon, G., Addor, N., Bloomfield, J. P., Freer, J., Fry, M., Hannaford, J., Howden, N. J. K., Lane, R., Lewis, M., Robinson, E. L., Wagener, T., and Woods, R.: Catchment attributes and hydro-meteorological timeseries for 671 catchments across Great Britain (CAMELS-GB), NERC Environmental Information Data Centre [data set], https://doi.org/10.5285/8344e4f3-d2ea-44f5-8afa-86d2987543a9, 2020b.
Coxon, G., McMillan, H., Bloomfield, J. P., Bolotin, L., Dean, J. F., Kelleher, C., Slater, L., and Zheng, Y.: Wastewater discharges and urban land cover dominate urban hydrology signals across England and Wales, Environ. Res. Lett., 19, 084016, https://doi.org/10.1088/1748-9326/ad5bf2, 2024.
Coxon, G., Zheng, Y., Barbedo, R., Cooper, H., Fileni, F., Fowler, H., Fry, M., Green, A., Gribbin, T., Harfoot, H., Lewis, E., Qiu, X., Salwey, S., Wendt, D. E., and Neto, G. G. R.: Catchment boundaries, daily and sub-daily hydrometeorological time series, groundwater level time series and attributes for 671 catchments in Great Britain (CAMELS-GB v2), NERC EDS Environmental Information Data Centre [data set], https://doi.org/10.5285/9a46d428-958f-4ac1-86eb-94eee70c0955, 2025.
David, P. C., Chaffe, P. L. B., Chagas, V. B. P., Dal Molin, M., Oliveira, D. Y., Klein, A. H. F., and Fenicia, F.: Correspondence Between Model Structures and Hydrological Signatures: A Large-Sample Case Study Using 508 Brazilian Catchments, Water Resour. Res., 58, e2021WR030619, https://doi.org/10.1029/2021WR030619, 2022.
Dixon, H., Hannaford, J., and Fry, M. J.: The effective management of national hydrometric data: experiences from the United Kingdom, Hydrolog. Sci. J., 58, 1383–1399, https://doi.org/10.1080/02626667.2013.787486, 2013.
Do, H. X., Gudmundsson, L., Leonard, M., and Westra, S.: The Global Streamflow Indices and Metadata Archive (GSIM) – Part 1: The production of a daily streamflow archive and metadata, Earth Syst. Sci. Data, 10, 765–785, https://doi.org/10.5194/essd-10-765-2018, 2018.
do Nascimento, T. V. M., Rudlang, J., Höge, M., van der Ent, R., Chappon, M., Seibert, J., Hrachowitz, M., and Fenicia, F.: EStreams: An integrated dataset and catalogue of streamflow, hydro-climatic and landscape variables for Europe, Sci. Data, 11, 879, https://doi.org/10.1038/s41597-024-03706-1, 2024.
Durant, M. J. and Counsell, C. J.: Inventory of reservoirs amounting to 90 % of total UK storage, NERC Environmental Information Data Centre [data set], https://doi.org/10.5285/f5a7d56c-cea0-4f00-b159-c3788a3b2b38, 2018.
Fileni, F., Fowler, H. J., Lewis, E., Fry, M., Cooper, H., Swain, O., Coxon, G., McLay, F., Bruce, E., Yang, L., and Archer, D.: Sub-hourly river flow data observations from 1369 river gauges in the UK, 1948–2023 (UK-Flow15), NERC EDS Environmental Information Data Centre [data set], https://doi.org/10.5285/211710ac-f01b-4b52-807f-373babb1c368, 2025.
Fileni, F., Fowler, H. J., Lewis, E., Fry, M., Cooper, H., Swain, O., McLay, F., Coxon, G., Bruce, E., Yang, L., and Archer, D.: UK-Flow15 Part 1: Development of a coherent national-scale 15-min flow dataset, Earth Syst. Sci. Data Discuss. [preprint], https://doi.org/10.5194/essd-2026-152, in review, 2026a.
Fileni, F., Fowler, H. J., Lewis, E., McLay, F., Coxon, G., Archer, D., Bruce, E., Yang, L., Fry, M., Cooper, H., and Swain, O.: UK-Flow15-QC: A quality control framework for better river flow data in hydrological research, EGUsphere [preprint], https://doi.org/10.5194/egusphere-2026-277, 2026b.
Fowler, H. J., Coxon, G., and White, C. J.: Hydrology in the 21st century: challenges in science, to policy and practice, Philos. T. Roy. Soc. A, 383, 20240299, https://doi.org/10.1098/rsta.2024.0299, 2025.
Fowler, K. J. A., Acharya, S. C., Addor, N., Chou, C., and Peel, M. C.: CAMELS-AUS: hydrometeorological time series and landscape attributes for 222 catchments in Australia, Earth Syst. Sci. Data, 13, 3847–3867, https://doi.org/10.5194/essd-13-3847-2021, 2021.
Gustard, A., Bullock, A., and Dixon, J. M.: Low flow estimation in the United Kingdom, http://nora.nerc.ac.uk/id/eprint/6050/ (last access: 22 June 2026), 1992.
Hannaford, J.: Development of a strategic data management system for a national hydrological database, the uk national river flow archive, in: Hydroinformatics, World Scientific Publishing Company, 637–644, https://web.archive.org/web/20200321115403id_/http://indiawrm.org/Website/Webpages/PDF/Development of a strategic data management system for a nati.pdf (last access: 25 June 2026), 2004.
Harrigan, S., Hannaford, J., Muchan, K., and Marsh, T. J.: Designation and trend analysis of the updated UK Benchmark Network of river flow stations: the UKBN2 dataset, Hydrol. Res., 49, 552–567, https://doi.org/10.2166/nh.2017.058, 2018.
Helgason, H. B. and Nijssen, B.: LamaH-Ice: LArge-SaMple DAta for Hydrology and Environmental Sciences for Iceland, Earth Syst. Sci. Data, 16, 2741–2771, https://doi.org/10.5194/essd-16-2741-2024, 2024.
Hiederer, R.: Mapping Soil Properties for Europe – Spatial Representation of Soil Database Attributes, Publications Office, Luxembourg, https://doi.org/10.2788/94128, 2013a.
Hiederer, R.: Mapping soil typologies: spatial decision support applied to the European Soil Database, Publications Office, Luxembourg, https://doi.org/10.2788/87286, 2013b.
Höge, M., Kauzlaric, M., Siber, R., Schönenberger, U., Horton, P., Schwanbeck, J., Floriancic, M. G., Viviroli, D., Wilhelm, S., Sikorska-Senoner, A. E., Addor, N., Brunner, M., Pool, S., Zappa, M., and Fenicia, F.: CAMELS-CH: hydro-meteorological time series and landscape attributes for 331 catchments in hydrologic Switzerland, Earth Syst. Sci. Data, 15, 5755–5784, https://doi.org/10.5194/essd-15-5755-2023, 2023.
Hollis, D., McCarthy, M., Kendon, M., Legg, T., and Simpson, I.: HadUK-Grid – A new UK dataset of gridded climate observations, Geosci. Data J., 6, 151–159, https://doi.org/10.1002/gdj3.78, 2019.
Hough, M. N. and Jones, R. J. A.: The United Kingdom Meteorological Office rainfall and evaporation calculation system: MORECS version 2.0 – an overview, Hydrol. Earth Syst. Sci., 1, 227–239, https://doi.org/10.5194/hess-1-227-1997, 1997.
Juston, J., Jansson, P.-E. and Gustafsson, D.: Rating curve uncertainty and change detection in discharge time series: case study with 44-year historic data from the Nyangores River, Kenya, Hydrol. Process., 28, 2509–2523, https://doi.org/10.1002/hyp.9786, 2014.
Keller, V. D. J., Tanguy, M., Prosdocimi, I., Terry, J. A., Hitt, O., Cole, S. J., Fry, M., Morris, D. G., and Dixon, H.: CEH-GEAR: 1 km resolution daily and monthly areal rainfall estimates for the UK for hydrological and other applications, Earth Syst. Sci. Data, 7, 143–155, https://doi.org/10.5194/essd-7-143-2015, 2015.
Kiraz, M., Coxon, G., and Wagener, T.: A Signature-Based Hydrologic Efficiency Metric for Model Calibration and Evaluation in Gauged and Ungauged Catchments, Water Resour. Res., 59, e2023WR035321, https://doi.org/10.1029/2023WR035321, 2023.
Klingler, C., Schulz, K., and Herrnegger, M.: LamaH-CE: LArge-SaMple DAta for Hydrology and Environmental Sciences for Central Europe, Earth Syst. Sci. Data, 13, 4529–4565, https://doi.org/10.5194/essd-13-4529-2021, 2021.
Kratzert, F., Klotz, D., Hochreiter, S., and Nearing, G. S.: A note on leveraging synergy in multiple meteorological data sets with deep learning for rainfall–runoff modeling, Hydrol. Earth Syst. Sci., 25, 2685–2703, https://doi.org/10.5194/hess-25-2685-2021, 2021.
Kratzert, F., Nearing, G., Addor, N., Erickson, T., Gauch, M., Gilon, O., Gudmundsson, L., Hassidim, A., Klotz, D., Nevo, S., Shalev, G., and Matias, Y.: Caravan – A global community dataset for large-sample hydrology, Sci. Data, 10, 61, https://doi.org/10.1038/s41597-023-01975-w, 2023.
Ladson, A. R., Brown, R., Neal, B., and Nathan, R.: A Standard Approach to Baseflow Separation Using The Lyne and Hollick Filter, Australasian Journal of Water Resources, 17, 25–34, https://doi.org/10.7158/13241583.2013.11465417, 2013.
Lees, T., Buechel, M., Anderson, B., Slater, L., Reece, S., Coxon, G., and Dadson, S. J.: Benchmarking data-driven rainfall–runoff models in Great Britain: a comparison of long short-term memory (LSTM)-based models with four lumped conceptual models, Hydrol. Earth Syst. Sci., 25, 5517–5534, https://doi.org/10.5194/hess-25-5517-2021, 2021.
Lewis, E., Quinn, N., Blenkinsop, S., Fowler, H. J., Freer, J., Tanguy, M., Hitt, O., Coxon, G., Bates, P., and Woods, R.: A rule based quality control method for hourly rainfall data and a 1 km resolution gridded hourly rainfall dataset for Great Britain: CEH-GEAR1hr, J. Hydrol., 564, 930–943, https://doi.org/10.1016/j.jhydrol.2018.07.034, 2018.
Lewis, E., Quinn, N., Blenkinsop, S., Fowler, H. J., Freer, J., Tanguy, M., Hitt, O., Coxon, G., Bates, P., Woods, R., Fry, M., Chevuturi, A., Swain, O., and White, S. M.: Gridded estimates of hourly areal rainfall for Great Britain 1990–2016 [CEH-GEAR1hr] v2, NERC EDS Environmental Information Data Centre [data set], https://doi.org/10.5285/fc9423d6-3d54-467f-bb2b-fc7357a3941f, 2022.
Marsh, T. J. and Hannaford, J.: UK Hydrometric Register, Centre for Ecology and Hydrology, Wallingford, UK, ISBN 9780955767227, 2008.
Marston, C., Rowland, C. S., O'Neil, A. W., and Morton, R. D.: Land Cover Map 2021 (25 m rasterised land parcels, GB), NERC EDS Environmental Information Data Centre [data set], https://doi.org/10.5285/a1f85307-cad7-4e32-a445-84410efdfa70, 2022.
Marston, C. G., Morton, R. D., O'Neil, A. W., and Rowland, C. S.: Land Cover Map 2022 (25 m rasterised land parcels, GB), NERC EDS Environmental Information Data Centre [data set], https://doi.org/10.5285/c9449bf5-b8f6-4a1c-b3eb-0d70575cba39, 2024.
McMillan, H., Coxon, G., Araki, R., Salwey, S., Kelleher, C., Zheng, Y., Knoben, W., Gnann, S., Seibert, J., and Bolotin, L.: When good signatures go bad: Applying hydrologic signatures in large sample studies, Hydrol. Process., 37, e14987, https://doi.org/10.1002/hyp.14987, 2023.
McMillan, H. K., Gnann, S. J., and Araki, R.: Large Scale Evaluation of Relationships Between Hydrologic Signatures and Processes, Water Resour. Res., 58, e2021WR031751, https://doi.org/10.1029/2021WR031751, 2022.
Met Office: Met Office Rain Radar Data from the NIMROD System, http://catalogue.ceda.ac.uk/uuid/82adec1f896af6169112d09cc1174499 (last access: 22 June 2026), 2024.
Morris, D. G. and Flavin, R. W.: A digital terrain model for hydrology, in: Vol. 1, Proc 4th International Symposium on Spatial Data Handling, Zürich, 250–262, 1990.
Morton, R. D., Marston, C. G., O'Neil, A. W., and Rowland, C. S.: Land Cover Map 2017 (25 m rasterised land parcels, GB), NERC Environmental Information Data Centre [data set], https://doi.org/10.5285/499212cd-d64a-43ba-b801-95402e4d4098, 2020a.
Morton, R. D., Marston, C. G., O'Neil, A. W., and Rowland, C. S.: Land Cover Map 2018 (25 m rasterised land parcels, GB), NERC Environmental Information Data Centre [data set], https://doi.org/10.5285/25c6451b-5c88-40da-9a63-c3ec473e4874, 2020b.
Morton, R. D., Marston, C. G., O'Neil, A. W., and Rowland, C. S.: Land Cover Map 2019 (25 m rasterised land parcels, GB), NERC Environmental Information Data Centre [data set], https://doi.org/10.5285/f15289da-6424-4a5e-bd92-48c4d9c830cc, 2020c.
Morton, R. D., Marston, C. G., O'Neil, A. W., and Rowland, C. S.: Land Cover Map 2020 (25 m rasterised land parcels, GB), NERC Environmental Information Data Centre [data set], https://doi.org/10.5285/6c22cf6e-b224-414e-aa85-900325baedbd, 2021.
Muchan, K. and Dixon, H.: Ensuring hydrometric data are fit-for-purpose through a national Service Level Agreement, in: Hydrology in a changing world: environmental and human dimensions, edited by: Daniell, T. M., International Association of Hydrological Sciences, Wallingford, UK, 323–329, http://nora.nerc.ac.uk/id/eprint/502971/ (last access: 22 June 2026), 2014.
naddor: camels, GitHub [code], https://github.com/naddor/camels (last access: 23 September 2025), 2025.
Pelletier, J. D., Broxton, P. D., Hazenberg, P., Zeng, X., Troch, P. A., Niu, G., Williams, Z. C., Brunke, M. A., and Gochis, D.: Global 1 km Gridded Thickness of Soil, Regolith, and Sedimentary Deposit Layers, ORNL DAAC, https://doi.org/10.3334/ORNLDAAC/1304, 2016.
Qiu, X., Green, A. C., Blenkinsop, S., and Fowler, H. J.: Developing a radar-rain gauge hourly blended precipitation dataset for Great Britain using the Gauss Blending Method, J. Hydrol., 668, 134954, https://doi.org/10.1016/j.jhydrol.2026.134954, 2026a.
Qiu, X., Green, A. C., Blenkinsop, S., and Fowler, H. J.: Quality control of the composite radar quantitative precipitation estimation product for Great Britain, J. Hydrol., 666, 134755, https://doi.org/10.1016/j.jhydrol.2025.134755, 2026b.
Rameshwaran, P., Bell, V. A., Davies, H. N., Sadler, P., Beverton, A., Thornton, R., and Rhodes-Smith, M.: Gridded actual groundwater, surface water and tidal water abstraction, discharge and Hands-off Flow datasets for England (1999 to 2014), https://doi.org/10.5285/18886F95BA84447F997EFAC96DF456AD, 2025.
Rasheed, Z., Aravamudan, A., Zhang, X., Anagnostopoulos, G. C., and Nikolopoulos, E. I.: Combining global precipitation data and machine learning to predict flood peaks in ungauged areas with similar climate, Adv. Water Resour., 192, 104781, https://doi.org/10.1016/j.advwatres.2024.104781, 2024.
Robinson, E. L., Blyth, E., Clark, D. B., Comyn-Platt, E., Finch, J., and Rudd, A. C.: Climate hydrology and ecology research support system meteorology dataset for Great Britain (1961–2015) [CHESS-met] v1.2, NERC Environmental Information Data Centre [data set], https://doi.org/10.5285/b745e7b1-626c-4ccc-ac27-56582e77b900, 2017a.
Robinson, E. L., Blyth, E. M., Clark, D. B., Finch, J., and Rudd, A. C.: Trends in atmospheric evaporative demand in Great Britain using high-resolution meteorological data, Hydrol. Earth Syst. Sci., 21, 1189–1224, https://doi.org/10.5194/hess-21-1189-2017, 2017b.
Robinson, E. L., Blyth, E. M., Clark, D. B., Comyn-Platt, E., Rudd, A. C., and Wiggins, M.: Climate hydrology and ecology research support system meteorology dataset for Great Britain (1961–2019) [CHESS-met], NERC EDS Environmental Information Data Centre [data set], https://doi.org/10.5285/835a50df-e74f-4bfb-b593-804fd61d5eab, 2023a.
Robinson, E. L., Blyth, E. M., Clark, D. B., Comyn-Platt, E., Rudd, A. C., and Wiggins, M.: Climate hydrology and ecology research support system potential evapotranspiration dataset for Great Britain (1961–2019) [CHESS-PE], NERC EDS Environmental Information Data Centre [data set], https://doi.org/10.5285/8651771d-aa6d-4d0f-8bcd-b3be1f733852, 2023b.
Robinson, E. L., Brown, M. J., Kay, A. L., Lane, R. A., Chapman, R., Bell, V. A., and Blyth, E. M.: Hydro-PE: gridded datasets of historical and future Penman–Monteith potential evaporation for the United Kingdom, Earth Syst. Sci. Data, 15, 4433–4461, https://doi.org/10.5194/essd-15-4433-2023, 2023c.
Rowland, C. E., Morton, D., Marston, C., and Maskell, L.: Recent Land Cover Change, https://www.theoep.org.uk/sites/default/files/reports-files/Recent Land Cover Change.pdf (last access: 22 June 2026), 2024.
Rowland, C. S., Morton, R. D., Carrasco, L., McShane, G., O'Neil, A. W., and Wood, C. M.: Land Cover Map 2015 (25 m raster, GB), NERC Environmental Information Data Centre [data set], https://doi.org/10.5285/bb15e200-9349-403c-bda9-b430093807c7, 2017.
Rowland, C. S., Marston, C. G., Morton, R. D., and O'Neil, A. W.: Land Cover Map 1990 (25 m raster, GB) v2, NERC Environmental Information Data Centre [data set], https://doi.org/10.5285/1be1912a-916e-42c0-98cc-16460fac00e8, 2020.
Salwey, S., Coxon, G., Pianosi, F., Singer, M. B., and Hutton, C.: National-Scale Detection of Reservoir Impacts Through Hydrological Signatures, Water Resour. Res., 59, e2022WR033893, https://doi.org/10.1029/2022WR033893, 2023.
Samaniego, L., Kumar, R., and Attinger, S.: Multiscale parameter regionalization of a grid-based hydrologic model at the mesoscale, Water Resour. Res., 46, https://doi.org/10.1029/2008WR007327, 2010.
Senent-Aparicio, J., Castellanos-Osorio, G., Segura-Méndez, F., López-Ballesteros, A., Jimeno-Sáez, P., and Pérez-Sánchez, J.: BULL Database – Spanish Basin attributes for Unravelling Learning in Large-sample hydrology, Sci. Data, 11, 737, https://doi.org/10.1038/s41597-024-03594-5, 2024.
Slater, L., Coxon, G., Brunner, M., McMillan, H., Yu, L., Zheng, Y., Khouakhi, A., Moulds, S., and Berghuijs, W.: Spatial Sensitivity of River Flooding to Changes in Climate and Land Cover Through Explainable AI, Earths Future, 12, e2023EF004035, https://doi.org/10.1029/2023EF004035, 2024.
Tanguy, V., Dixon, H., Prosdocimi, I., Morris, D., and Keller, V.: Gridded estimates of daily and monthly areal rainfall for the United Kingdom (1890–2019) [CEH-GEAR], NERC EDS Environmental Information Data Centre [data set], https://doi.org/10.5285/dbf13dd5-90cd-457a-a986-f2f9dd97e93c, 2021.
Teutschbein, C.: CAMELS-SE: Long-term hydroclimatic observations (1961–2020) across 50 catchments in Sweden as a resource for modelling, education, and collaboration, Geosci. Data J., https://doi.org/10.1002/gdj3.239, 2024.
Wösten, J. J. H.: The HYPRES database of hydraulic properties of European soils, in: Subsoil compaction; distribution, processes and consequences, edited by: R. Horn, J. J. H., van den Akker, and Arvidsson, J., 135–143, ISBN 3923381441, 2000.
Wösten, J. H. M., Lilly, A., Nemes, A., and Le Bas, C.: Development and use of a database of hydraulic properties of European soils, Geoderma, 90, 169–185, https://doi.org/10.1016/S0016-7061(98)00132-3, 1999.
Wösten, J. H. M., Pachepsky, Y. A., and Rawls, W. J.: Pedotransfer functions: bridging the gap between available basic soil data and missing soil hydraulic characteristics, J. Hydrol., 251, 123–150, https://doi.org/10.1016/S0022-1694(01)00464-4, 2001.