the Creative Commons Attribution 4.0 License.
the Creative Commons Attribution 4.0 License.
 | 16 Jun 2026
EuroCrops v2.0: multi-annual harmonized parcel level crop type data linked to European Union-wide survey, statistical, and Earth Observation products
Martin Claverie
Ayshah Chan
Linda See
Helena Ramos
Renate Koeble
Momchil Yordanov
Jon Olav Skøien
Ferdinando Urbano
Raphael d'Andrimont
Maja Schneider
Marco Körner
Marijn Van der Velde
As part of the Common Agricultural Policy (CAP) of the European Union (EU), farmers make annual declarations of the agricultural activities for which they receive subsidies. The declarations include the crops they grow at parcel level, referred to as Geo-Spatial Application (GSA) data. Paying Agencies (PA) of every EU Member State MS) use specific crop classifications in their native language, and not all provide access to the GSA data. In the past, the EuroCrops initiative harmonized openly available GSA data for a single year (2021) using the Hierarchical Crop and Agriculture Taxonomy (HCAT), but multiple years are available depending on the country. Harmonizing a time series of farmers' crop declarations at parcel level would allow for comparative spatiotemporal analysis across the EU, the development of indicators that can be used for CAP and other policy monitoring purposes, and would provide data for training and validation of remotely sensed products. Here we have collected the GSA crop type declarations and parcel geometries that are publicly available from 18 PAs, the administrative bodies managing GSA data, for a minimum of three years, but covering the period 2008–2023, where available. We have then harmonized the GSA data using HCAT4, a new version developed as part of this work. The data set includes nearly 47 million parcels covering 21 Mha. To facilitate integration and interoperability of the GSA data with other EU data sets containing spatial information on crops, we harmonized the crop classes used in the following data sets with HCAT4: (1) LUCAS, (2) the Integrated Farm Statistics/Farm Structure Survey, (3) the Farm Accountancy Data Network (FADN), and (4) the classification systems of the Copernicus High Resolution Layer on Crop Types. To demonstrate the potential of the multiannual, harmonised dataset presented in this paper, the GSA data were aggregated to NUTS 2 regions and compared with statistics on crop areas from Eurostat, showing good correspondence for many crops but also highlighting those crops and countries where the agreement is less good, providing possible reasons why. The data can also be used for mapping crop rotations, and a map showing maize monoculture illustrates this application. Farmers' declarations will increasingly become available as MS are required to publish these under the High-Value Dataset regulation. The EuroCrops v2.0 data set is registered and publicly available under https://doi.org/10.2905/b9fb9e67-78a9-4327-9d59-39a928d812d3 (European Commission. Joint Research Centre, 2026).
- Article
(8937 KB) - Full-text XML
-
Supplement
(1301 KB) - BibTeX
- EndNote


Agriculture in the European Union (EU) has evolved considerably since the first implementation of the Common Agriculture Policy (CAP) more than 60 years ago (Chantellier et al., 2022). Undergoing a continual reform process, the objectives of the CAP for the period 2023–2027 are to ensure that farmers receive a fair income while contributing to climate change mitigation, halting biodiversity loss, and fostering sustainable development while creating a vibrant rural economy (European Commission, 2023b).
The CAP reform introduced in 1992 stipulates that each Member State (MS) must implement an Integrated Administration and Control System (IACS) to manage the payments of agricultural subsidies and prevent fraud in the context of direct payments to farmers (European Commission, 2022). Presently the IACS consists of six interconnected components, including the Land Parcel Identification System (LPIS) containing all eligible agricultural land (reference parcels), the Geo-Spatial Application (GSA), which allows beneficiaries to make annual declarations of the parcels for which subsidies are requested (agricultural parcels), including the crops grown, the Area Monitoring System (AMS) to track agricultural activities, a system to register beneficiaries, a control and penalty system, and a system to register livestock (European Commission, 2021).
The GSA contains the spatial delineation of the agricultural land parcels where at least one crop has been grown (or a single crop group with the same payment eligibility) or permanent grassland. GSAs are operated by the Paying Agencies (PA) at the regional or country level in the EU-27. Since these infrastructures are set up independently in each area, the data are currently not interoperable, nor are the legends semantically harmonized. Furthermore, most GSA datasets are not publicly available, although several countries are increasingly opening the data for public use. For example, the Agri-food Data Portal from the Directorate General for Agriculture and Rural Development (DG-AGRI) provides links to individual MS Geoportals from which the data can be downloaded for some countries (https://agridata.ec.europa.eu/extensions/iacs/iacs.html, last access: 1 June 2026). Moreover, the recent INSPIRE regulation on high value data sets and the arrangements for their publication and re-use, which came into force in May 2024 (European Commission, 2023a) and includes GSA data, will support greater sharing of these data in the future.
In addition to their use as part of the CAP implementation, the GSA data sets represent a reliable and very high resolution source of data on what crops are grown each year in the EU at the parcel scale. The accuracy of the geometry of the parcels corresponds to a 1:5000 scale, i.e., better than 1 m (d'Andrimont et al., 2023). Hence, this information is valuable as training and validation data for remote sensing, having been used previously in the development of the World Cereal product (Van Tricht et al., 2023), in the examination of crop diversity and rotations (Reumaux et al., 2023), as a reference for the automatic identification of parcel boundaries (d'Andrimont et al., 2023), and in studies of farm dynamics (Barbottin et al., 2018), among many other applications (Jänicke et al., 2025). However, the GSA data are not consistent in terms of their crop type classifications nor in the additional parcel features that are reported by each MS, e.g., in Austria, they indicate the number of times a field is mowed. The crop names are also provided in native languages. This lack of harmonization of GSA data sets across the EU is a significant obstacle to making comparisons due to lack of interoperability.
A legend harmonization process has already been applied to GSA data for 16 countries in the EU as part of the EuroCrops initiative (Schneider et al., 2023). The GSA data sets were downloaded from national statistical websites, geoportals or by directly contacting ministries for the data. The crop types were then translated from native languages into English and harmonized using the Hierarchical Crop and Agriculture Taxonomy (HCAT), which has been developed by the EuroCrops team (Schneider et al., 2021). This taxonomy is sufficiently detailed to cover the diversity of crop types in the EU and can be easily updated to accommodate new crop types if necessary. This HCAT taxonomy is employed here with new improvements as outlined in the methodology section.
Although the EuroCrops initiative represents a good starting point for GSA data harmonization, the limitation is that the data are only available for a single year (for most MS this is 2021), which limits the types of analysis that can be undertaken with the data. Since GSA data are currently available for multiple years, which varies by MS, having a time series of harmonised crop type data would greatly extend the value of such a data set, facilitating different types of geospatial analysis and administrative workflows. Although other initiatives, such as Europe-LAND (Jänicke et al., 2025) and RapidCrops (Holden et al., 2025), have recently published GSA time series data set, the aim of this paper is to present an updated multi-annual version of EuroCrops. This data set was developed using the same methodology as outlined in Schneider et al. (2023) but with further improvements to the taxonomy and translation to other classification systems such as those employed by Eurostat in the AGRIPROD database (Eurostat, 2023a), the Land Use/Cover Area frame Survey (LUCAS) (d'Andrimont et al., 2020), the Farm Structure Survey (Eurostat, 2024b), the Farm Accountancy Data Network (FADN) (Eurostat, 2023b), and the classification system from the remotely sensed Copernicus High Resolution Layer (HRL) on Crop Types Yearly (CTY) as part of the HRLs on Vegetated Land Cover Characteristics (VLCC) (Wegscheider et al., 2024). This will help to further improve the interoperability of the GSA data while also providing the means to use GSA data more seamlessly with other European databases.
2.1 Data collection and sources
GSA data for multiple years were collected for the same 18 countries or regions provided that they included the year 2021 and there were a minimum of 3 consecutive years available so that they can be used for applications such as the determination of crop rotations, detecting changes in crop diversity over time and for applications that require a time series. A summary of the GSA data sets that form the basis of EuroCrops v2.0 is provided in Fig. 1. Note that the overseas regions of France, Portugal and Spain are not included in the data set. All the GSA data were in the same Lambert Azimuthal Equal Area (LAEA) coordinate system that uses the European Terrestrial Reference System 1989 (ETRS89), EPSG:3035.
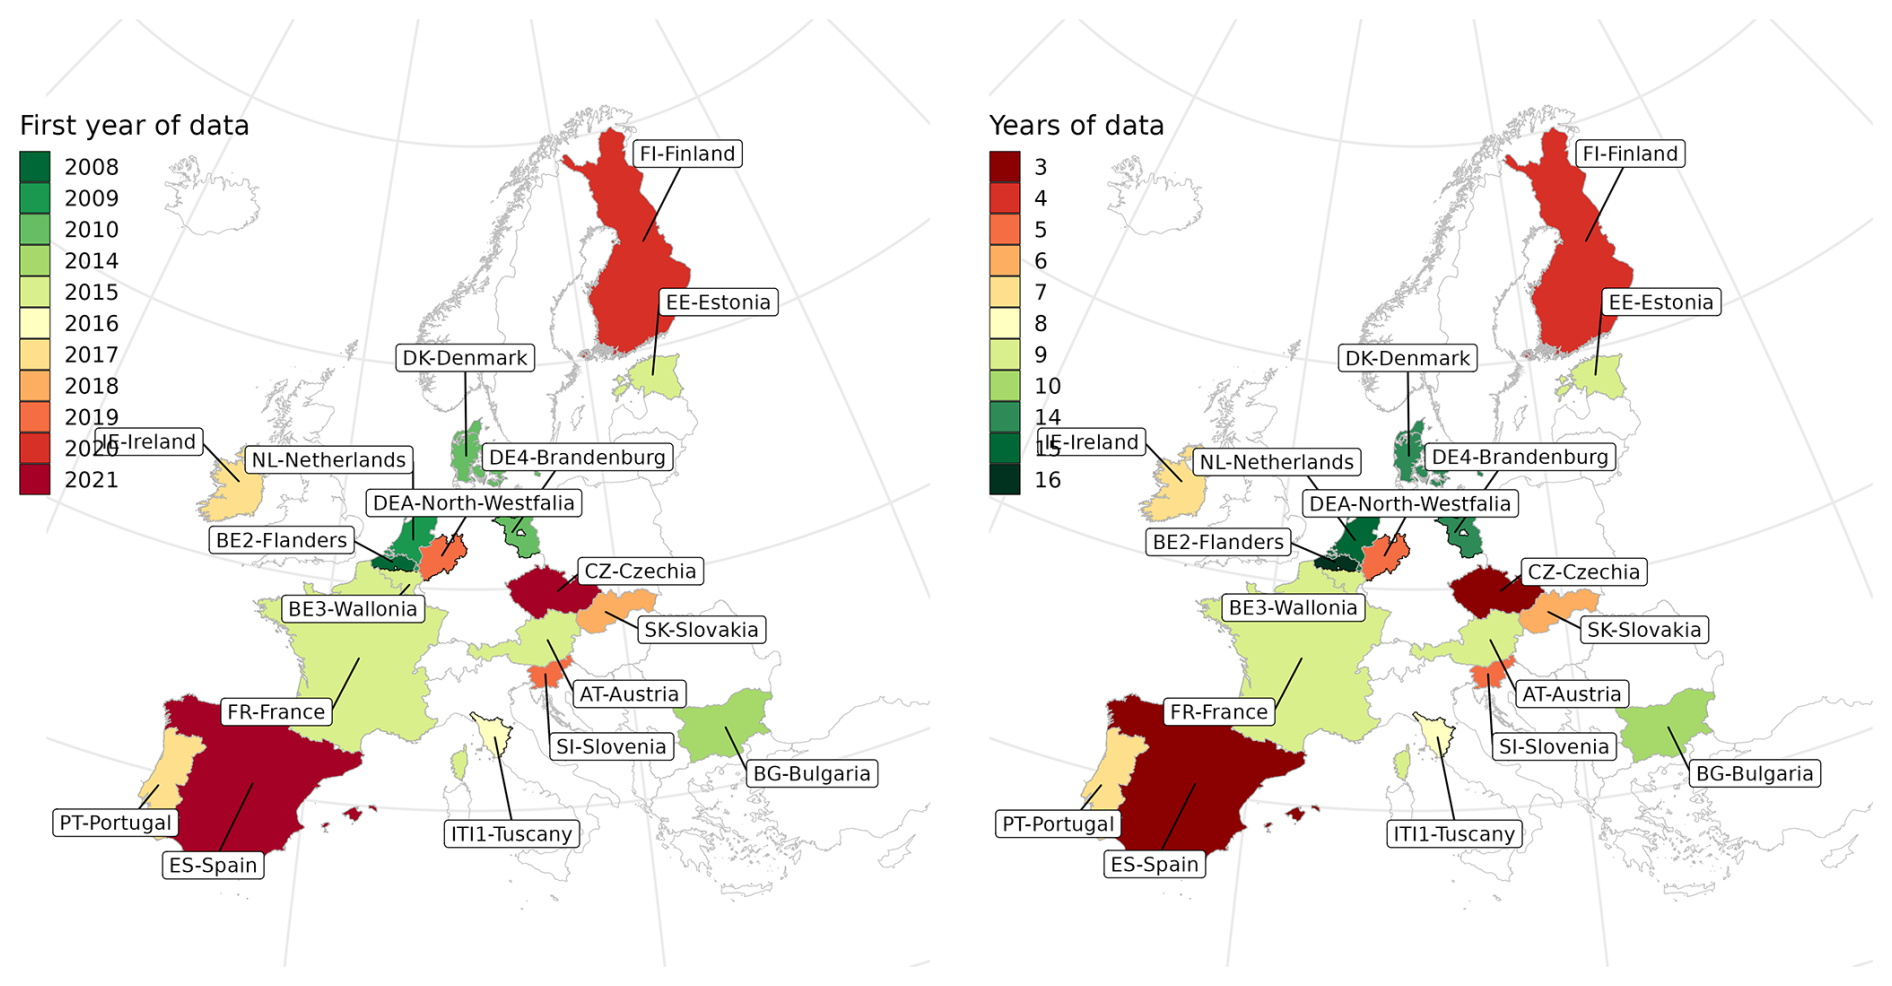
Figure 1An overview of the EuroCrops v2.0 data set by the first year in which the Geo-Spatial Application (GSA) data are available (left panel) and the total number of years by the Paying Agency (PA) region in the data set (right panel).
2.2 Data pre-processing
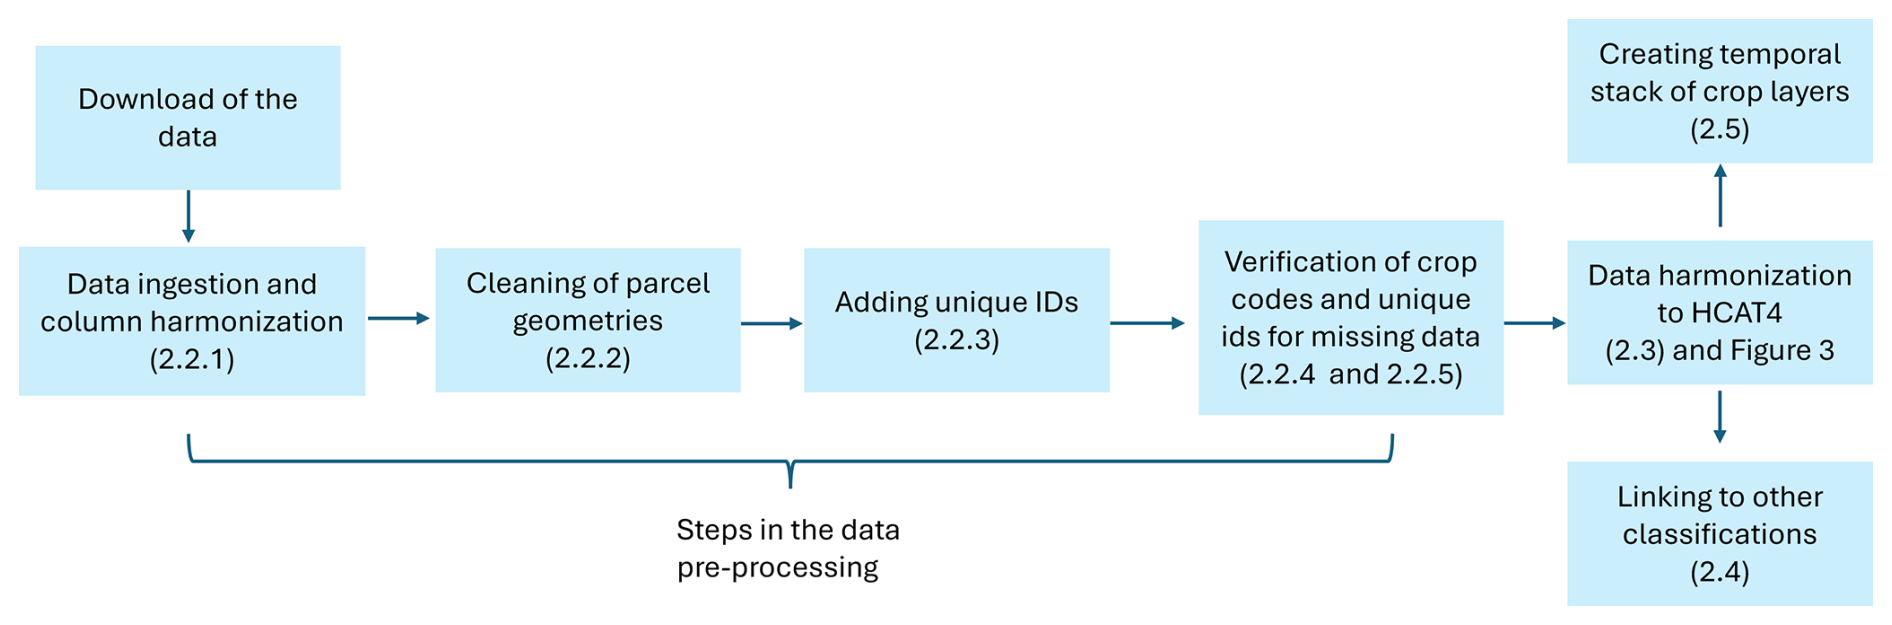
Figure 3 provides an overview of the data pre-processing.
2.2.1 Data ingestion
Once the GSA data were obtained from the different sources, they were ingested into a PostgreSQL/PostGIS database. The structure (Fig. 2) is a set of GSA tables for each region and year, using the following naming convention: “<nuts>_<year>” (where nuts is the Nomenclature of Territorial Units for Statistics or administrative level as defined by Eurostat, https://ec.europa.eu/eurostat/web/nuts (last access: 1 June 2026), using the 2021 version).
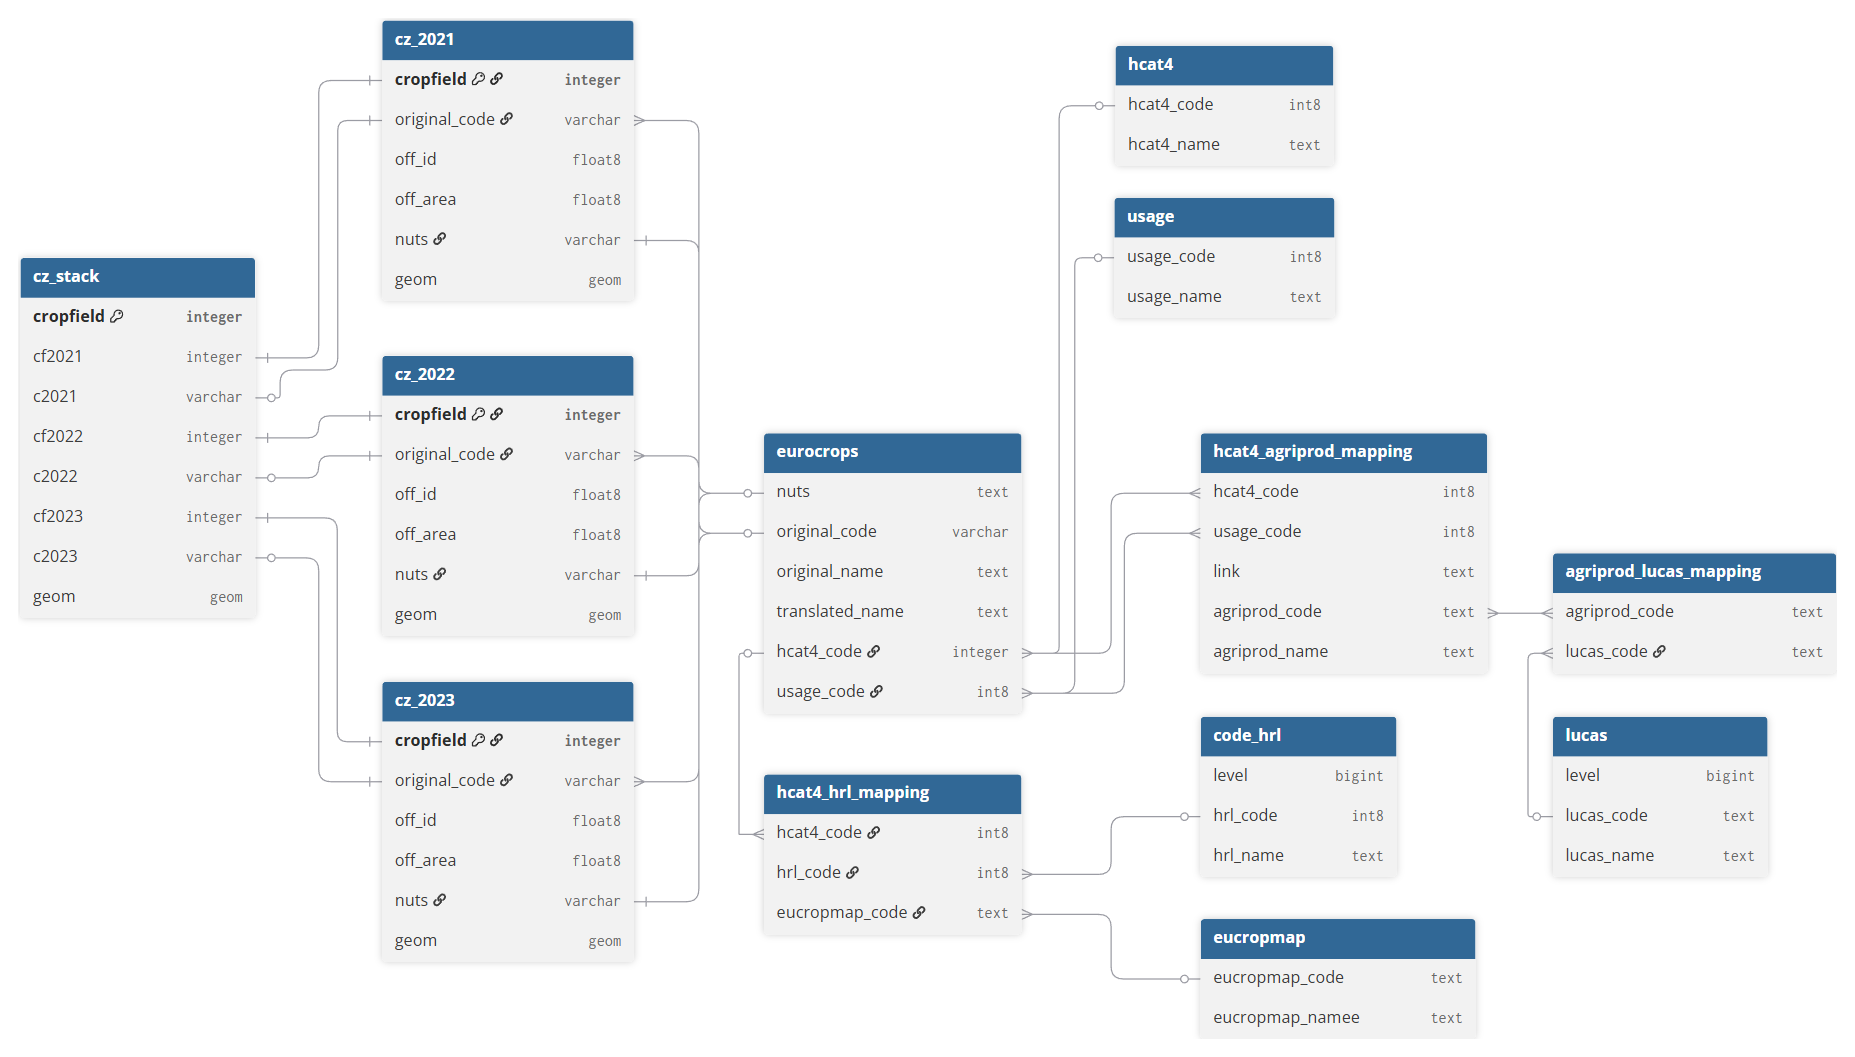
Figure 2Overview of the EuroCrops v2.0 Entity-Relationship diagram. On the left, three GSA tables for CZ and the stack layer are shown. However, the full data set includes 152 GSA tables and 18 stack layers.
2.2.2 Cleaning of the parcel geometries
In the next step, the parcel geometries were validated to identify and rectify any topological errors such as self-intersections, invalid ring structures, or improper winding orders in the original annual data sets that can compromise spatial analyses. Once the geometries were validated, the next step was to remove duplicate polygons or areas and eliminate any redundant features that overlap in space. The following criteria were then applied to determine which polygon was retained in the data set:
-
Dominant original_code: the polygon with the most frequently occurring crop code was retained when duplicates exceeded two instances.
-
Hierarchical crop code preference: Preference was given to polygons with the lowest hcat4_code, emphasizing cereals and major crops while giving less priority to unknown categories.
-
Random selection: If neither (1) nor (2). was satisfied, a declared crop type was then randomly chosen from the duplicates.
Additionally, to handle overlapping polygons, the overlapping area was removed from the data set. When overlaps occurred, precedence was given to the polygons with larger areas, and the overlapping area was subtracted from the smaller polygon. If the overlap was greater than 95 % of a polygon's total area, the polygon was then entirely removed from the data set. An example is shown in Fig. S1 in the Supplement.
2.2.3 Addition of a unique identifier to each table
A unique identifier was added to each GSA table “<nuts>_<year>” in the database to a column labeled as “cropfield”. This unique identifier ensures traceability and consistency across multiple data sets, facilitating efficient data management and integration.
2.2.4 Verification of the crop codes
Crop definitions do not always remain consistent over time as they can change, notably in relation to the change in CAP policy and its implementation. Hence, the same code can be associated with different crop definitions over time. For example, in the Flemish GSA (BE2), the code “1” was used for “Stallen en gebouwen” (“Stables and buildings”) from 2008 to 2014, but from 2015, the same code was called “Hoofdgebouwen” (“Main buildings”), indicating a change in phrasing but not in meaning. In other cases, the definition has undergone a complete change, which typically occurs in long time series where the code has not been used for many years and then reappears. For example, in the Dutch GSA (NL), code “1926” referred to “Aardappelen” (Potatoes) from 2009 to 2011, but starting in 2018, it was used to denote “Overige akkerbouwgewassen” (Other arable crops). Other codes were then used for potatoes.
To assess whether the semantic differences in crop descriptions are significant, we utilized a large language model (LLM). When the LLM identified clear discrepancies, which were then confirmed through a human review process, we assigned a new code (calculated as 10000 + original_code) to the less recent years. In total, 35 codes were affected as follows: 6 in Czechia, 23 in NUTS zone DE4 and 1 in NUTS zone DEA (Germany), and 6 in the Netherlands. Note that two crop names with the same meaning but different phrasing or codes will appear in the data set as two different crops.
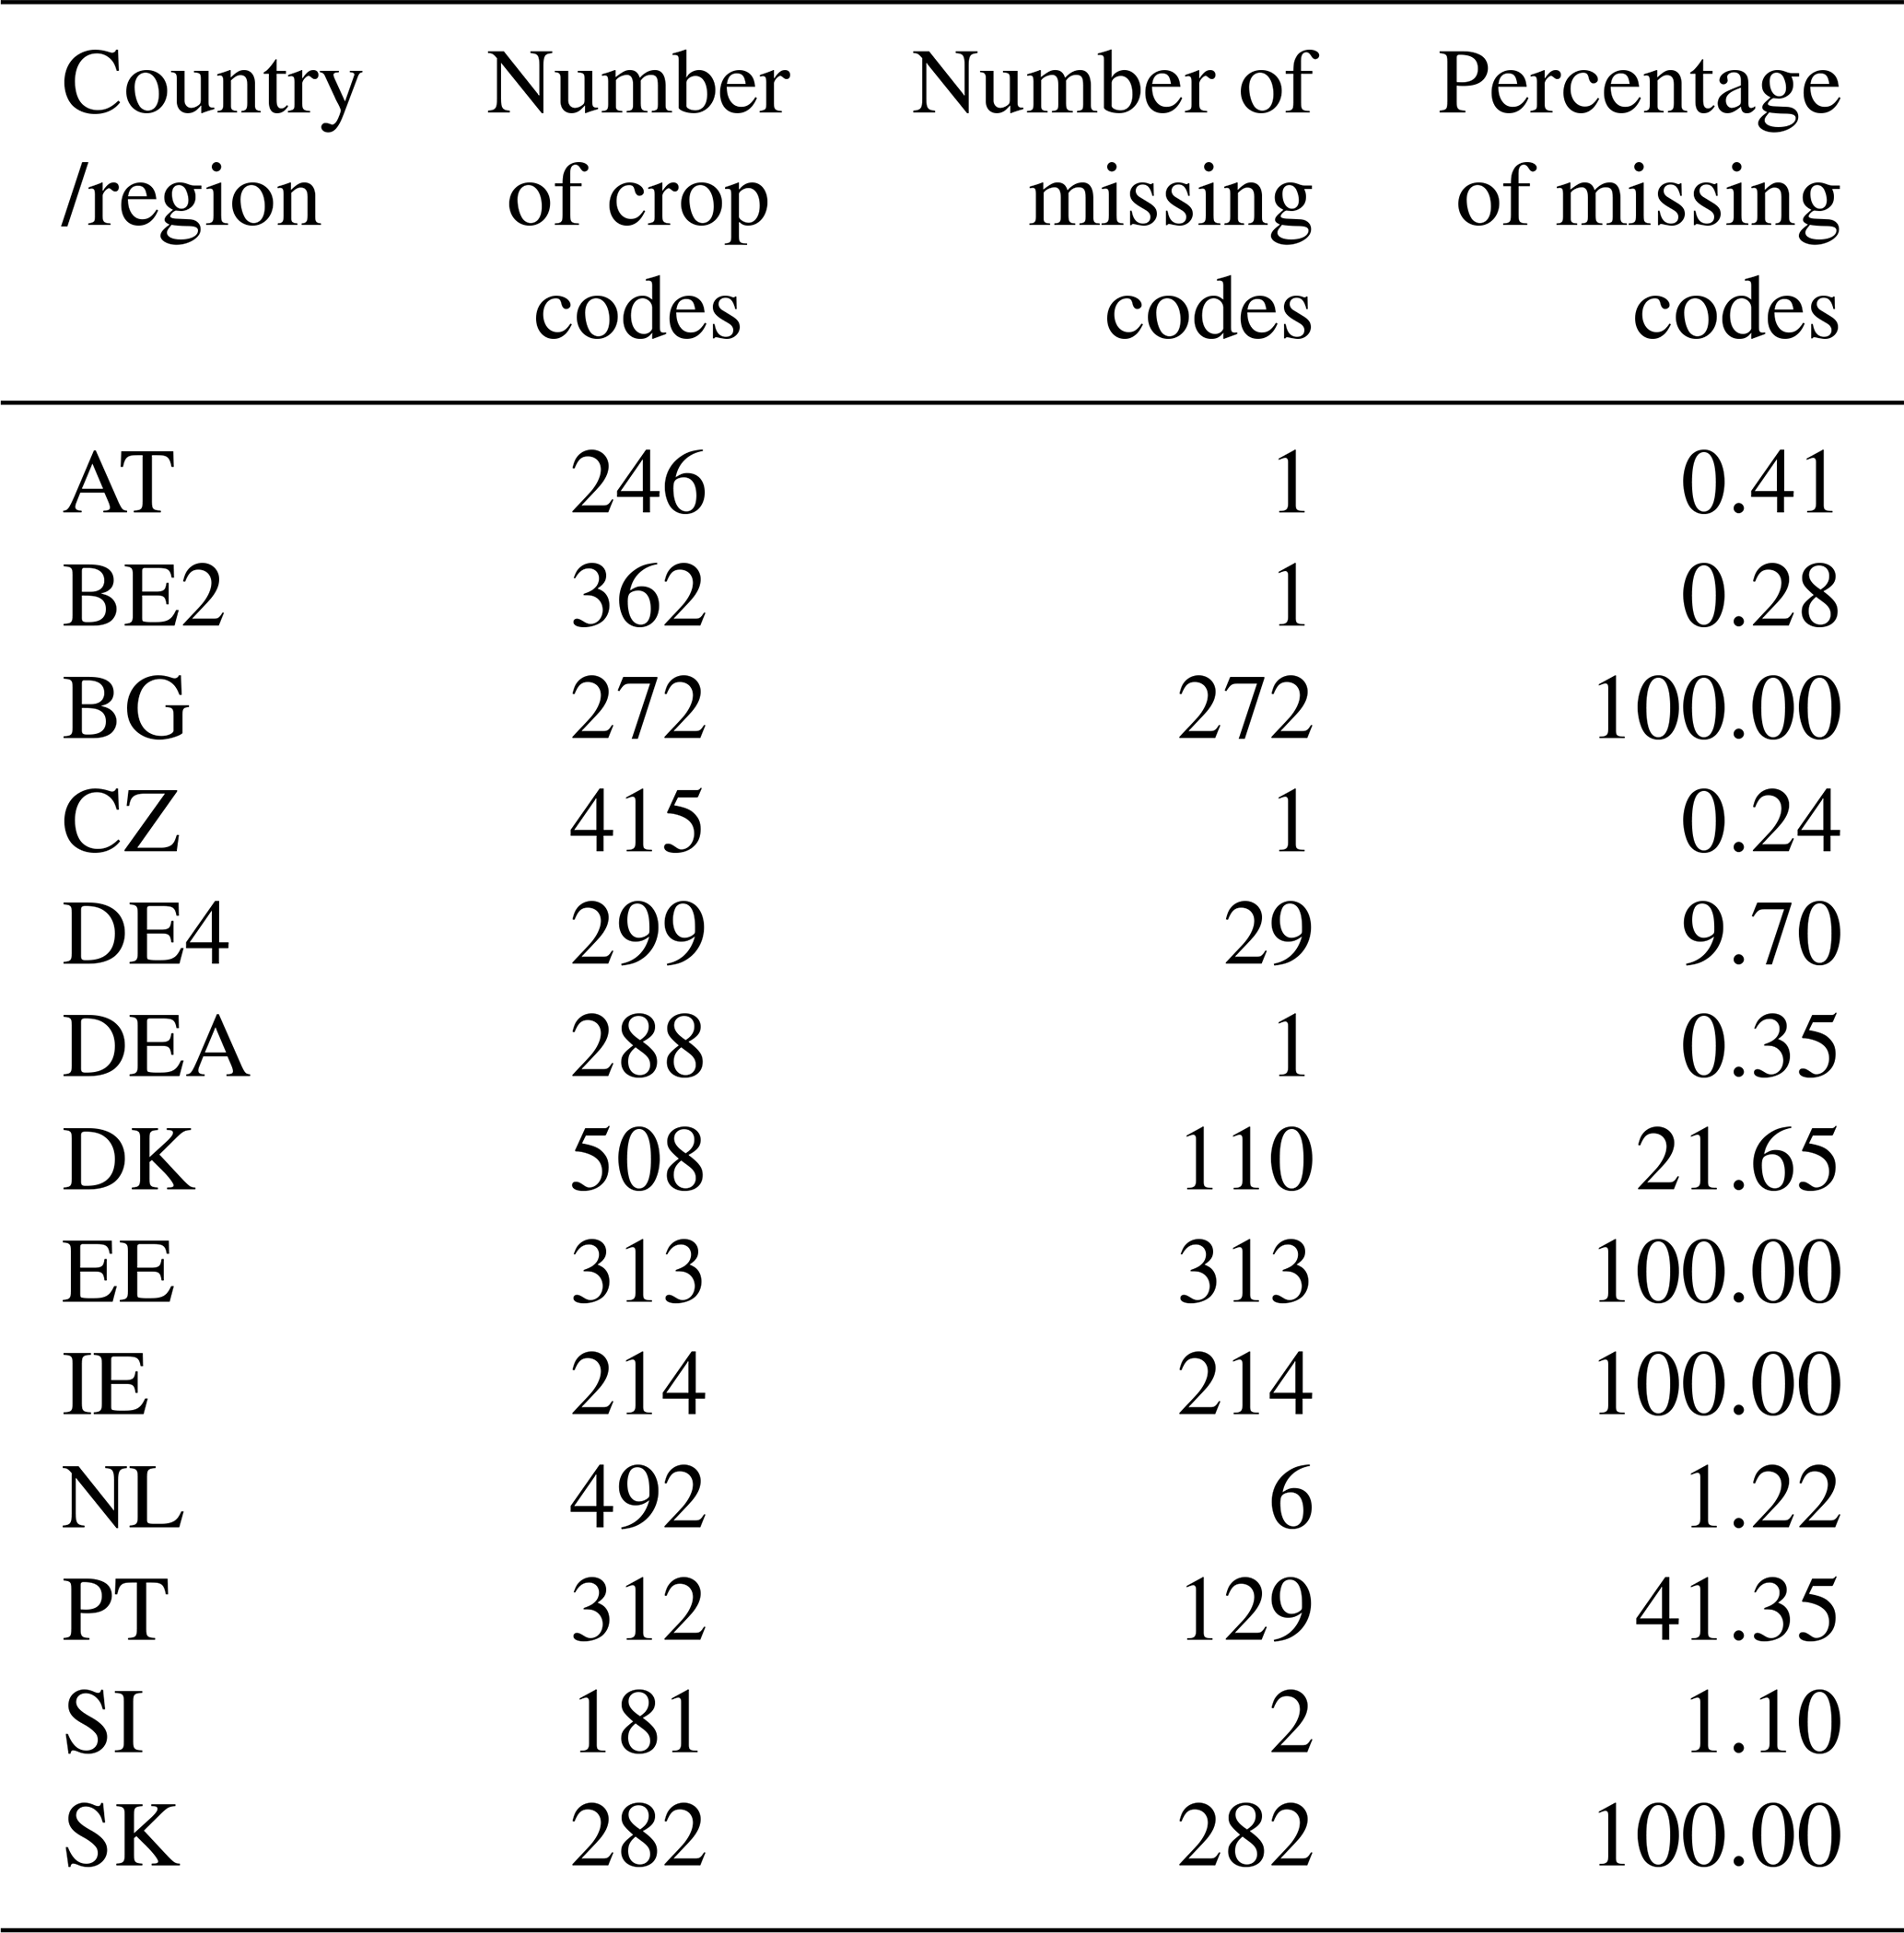
We then generated a list of unique crop codes and names for all GSA tables, which produced a total of 43 000 entries. These were then grouped by crop code, name and NUTS region, resulting in around 5000 entries. We then identified all parcels where a crop code was missing. For example, for some years, the full GSA table for Estonia (EE) and Ireland (IE) contained only crop names and not codes. In other cases, codes were only missing for some years. When a code was available using other year(s), we used the crop name and gap-filled the code where needed. When a code was missing, we provided a unique code, starting at 10 001 and then incremented by 1 each time a new code was needed. This ensured that all parcels in the database were associated with an original_code identifier. The table eurocrops in the github repository provides the consolidated list of original_code and original_name per nuts. Table 1 summarizes the occurrence of missing codes by country and region.
Table 1Missing codes by country/region that required assignment of a new unique code.
2.3 Data harmonization
Figure 4 provides an overview of the crop taxonomy harmonization process, starting with further developments in the HCAT taxonomy as described in more detail below.
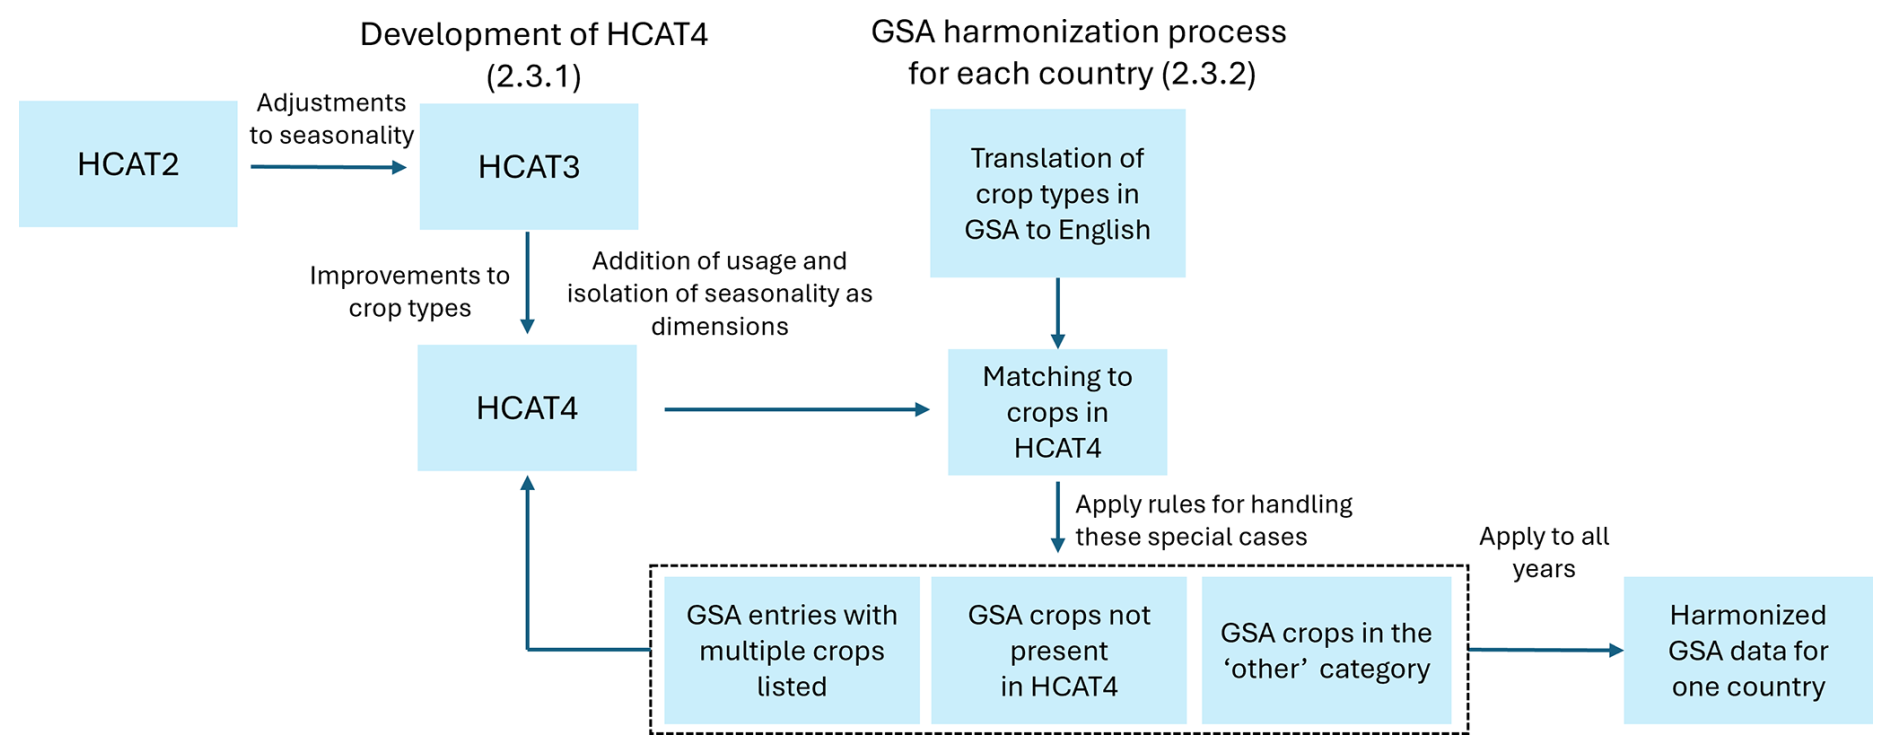
Figure 4Overview of the steps in the development of HCAT4 and the data harmonization process.
2.3.1 Development of HCAT4
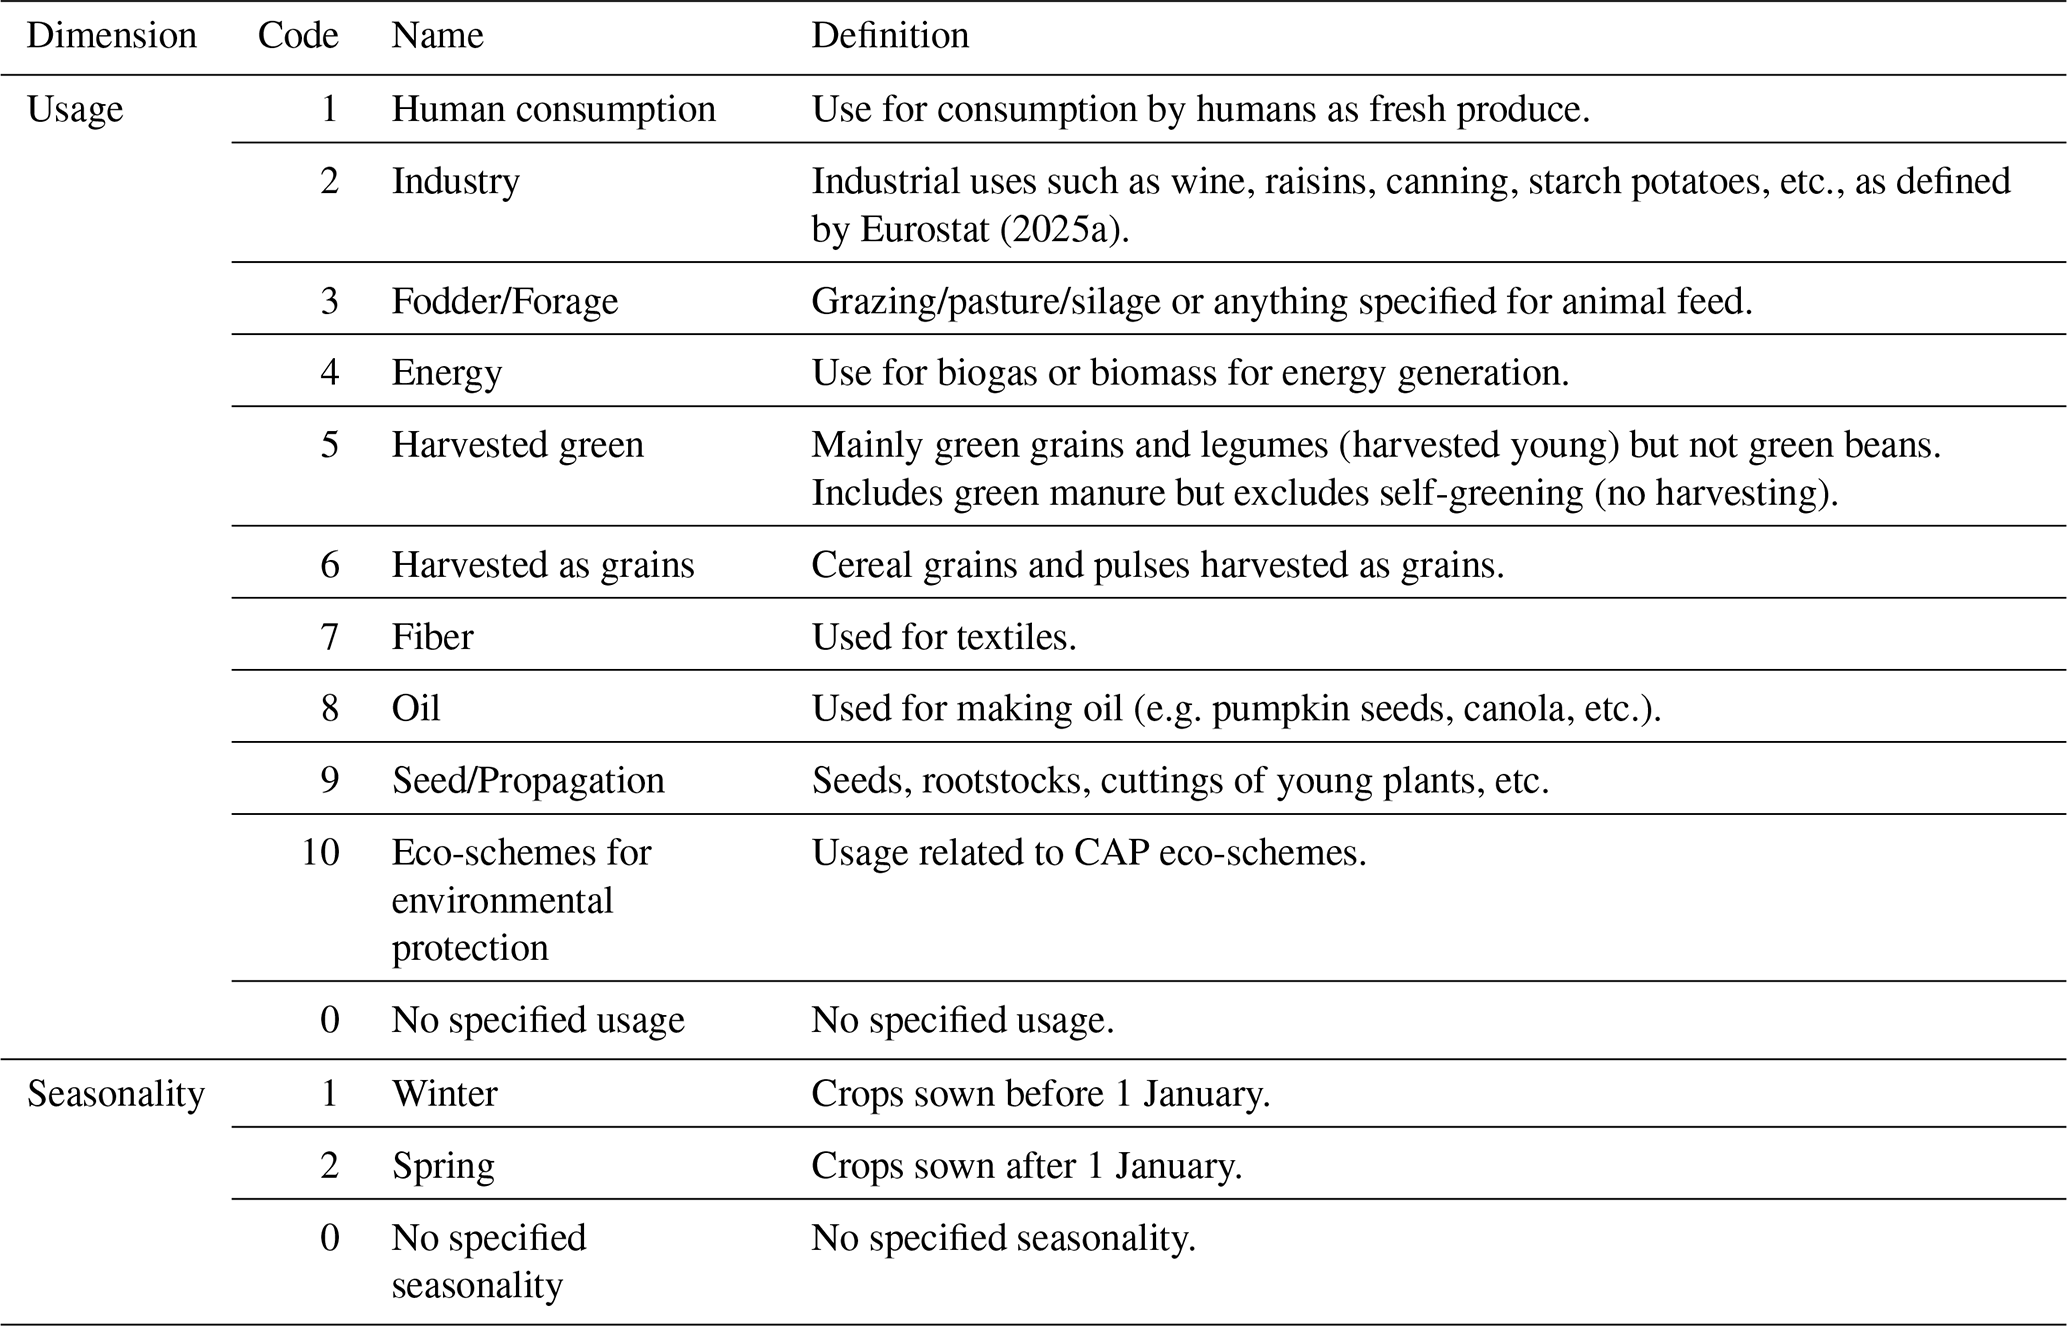
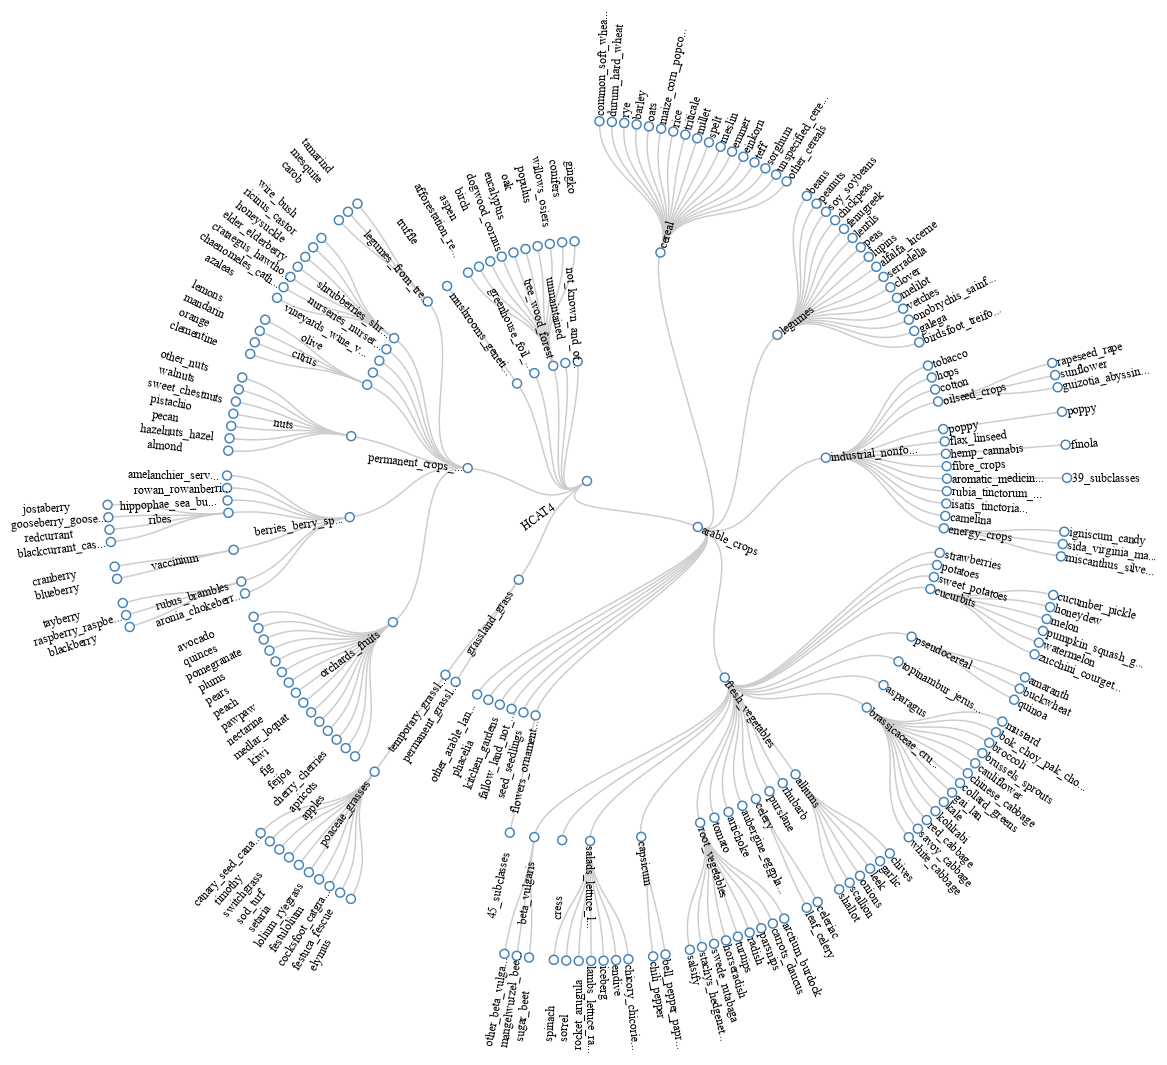
HCAT4 presented here is the latest version of the HCAT taxonomy (i.e., version 4, Fig. 15), which is a major update to HCAT2 (or version 2) that was used in the first version of EuroCrops (Schneider et al., 2023). In between HCAT2 and HCAT4, a minor update was made (which became HCAT3 or version 3) to make adjustments for seasonality, and it was used in the machine learning crop classification study of Barriere et al. (2024). Then HCAT4 was developed as part of this harmonization exercise. The first major change is that the crops were reorganized based on their botanical class. The reason for this is because previous versions of HCAT followed the EAGLE classification system (Arnold et al., 2013), which meant that the same crop could appear under different hierarchies, e.g., silage maize and grain maize appeared in different parts of HCAT. This modification for consistency with botanical class means that corn now appears only once in HCAT4. However, with this change, other information was then lost, including the seasonality (e.g., winter versus spring wheat) and usage (e.g., if intended for human consumption or fodder). Hence, the second major change was to add dimensions to the classification to indicate seasonality and usage, which are listed in Table 2 and described in more details in the two sections that follow.
Seasonality: depending on the GSA, some crops may have additional information on the season they were grown in. In such cases, the crops were assigned a code according to the season (Table 2). Such seasonal information is typically associated with cereals, which in Europe can be sown before or after the winter season. As the naming is not consistent among different MS, we assigned any autumn and winter cereals to winter (1) and spring and summer cereals to spring (2). The seasonality code 0 was assigned to crops for which no seasonality information was available. We observed discrepancies among MS regarding the use or non-use of seasonality information. These differences may stem from the marginal relevance of certain crops or from agro-meteorological conditions that preclude specific seasonal patterns. Hence, when comparing them at a European level, the common class should be the upper hierarchy. Figure 5 illustrates three different cases for the crop rye. The first shows examples of rye found in the GSA of Flanders (BE2), which specifies spring and winter rye but also has entries for cutting rye, which is then assigned to the HCAT4 class “rye”. The second entry is for Wallonia (BE3) where only spring and winter rye is found, illustrating differences in the crops recorded in the same country (Belgium). Finally, in Spain, the rye crops have no seasonality and both types of rye are assigned to the “rye” class in HCAT4. There is a also a special case for the “rape” class, which has three seasons in France.
Usage: we defined ten categories of usage that can be applied to crop types in the GSA as listed in Table 2. The usage information was extracted from the text embedded in the names of the crop types. For example, for the eco-schemes for environmental protection, specific mention of regulations, short forms of known eco-schemes or other keywords such as biodiversity, environmental protection, etc. were used to indicate this type of usage. Note that not all crops have usage information, in which case the code 0 is applied. Some crop types in the GSA have usage information embedded in the names of the crop types. When assigning these crops to HCAT4 classes, the usage is recorded separately using one of the codes between 1 and 10.
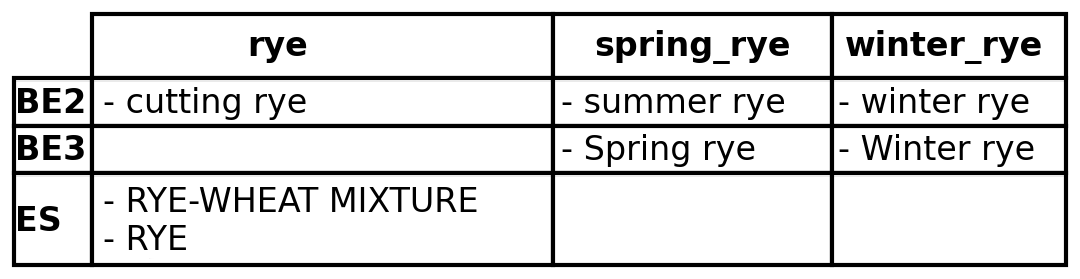
Figure 5An example showing how countries report different types of rye and how these are then assigned one of the three “rye” HCAT4 classes, including seasonality.
Table 2Dimension of usage and seasonality added as part of HCAT4 along with their codes, names and definitions.
Finally, the headings in the taxonomy were aligned with the major crop types in AGRIPROD (Eurostat, 2024a) to achieve greater consistency between HCAT4 and Eurostat labels.
2.3.2 GSA harmonization process by country
Once all the GSA data were pre-processed, the data harmonization process was applied. The first step involved extracting the names of the crops and automatically translating them into English using the Application Programming Interfaces (APIs) to the machine translation models of Google Translate, DeepL, and OPUS-MT. As Portuguese was not available on OPUS-MT, ChatGPT was also used to ensure that at least three different machine translations were available. The translations were then manually checked if the different machine translation applications did not agree on the translation or if a translation was provided that did not make sense. The translation accuracies range from 40.29 % in Spain to 76.42 % in Netherlands excluding Slovenia, which provided scientific names in English and Ireland, whose declarations are in English. The main reason for mistranslation was the poor translation capabilities of the machine translators in some cases. In previous iterations of EuroCrops, only two translators were used, which led to the mistranslations of some crops. For this reason, we used three translators in EuroCropsv2.0 but this meant more manual verification. In most cases, two translators would agree, and they were usually correct, while other times they were wrong and then OPUS-MT, which generally performed the worst of the three, produced the correct translation. This type of error accounted for 62.56 % of translation errors in Czechia and up to 92.16 % in Flanders Belgium (see Table S1 in the Supplement).
The next most common error is either extremely niche crop names or homonymy. The highest rate of this error was in Czechia (33 %), which contains a huge number of species level descriptions of different grasses. Italy, Bulgaria and Spain also have a high percentage of this type of error (i.e., 24 %, 25 %, 26 %, respectively), with niche descriptions such as Spirulina (a cyanobacteria), specific cultivars of tobacco or many specific tree species. Denmark is the exception, as despite many species level grasses, one description (helsæd) accounted for most of the other errors. This is a Danish specific word to describe the entire plant that was harvested for feed (whole crop silage).
Another common error is the use of abbreviations or truncations in the descriptions. These are typically associated with interventions or different grassland types. They are most common in Germany, Austria, Denmark and the Netherlands. Less common errors included the use of colloquial or regional terms, accounting for less than 3 % in the countries with this issue. Some countries like Portugal, Italy, Spain and Czechia have spelling errors in their descriptions, but in most cases these are only missing accents and accounted for up to 6 % of errors in each country. Estonia uses separable prefixes in their declarations and places these prefixes at the end of the description, leading to failures in translations. Fortunately, Estonia provides a database of most labels with its English translation. For manual checks, we either used Google to search for the crop description and to find its scientific name or we used the language specific Wikipedia page for that crop and changed to English to find the English name. However, this only worked if the description was for a crop and not some form of intervention with abbreviations or crops with spelling mistakes. In such cases, ChatGPT was very helpful in suggesting possible unabbreviated forms and alternatives, which were then easier to search for and verify. Further information on crop name translations and a table with the occurrence of errors by country/region can be found in the Supplement.
Once the English language translation was complete, the crop types were linked to the HCAT4 taxonomy through a partial matching process, where the results of this matching were again verified manually. Successful matching ranged from 42 % in Portugal to 69 % in Slovakia. The matching process relied on calculating weighted Levenshtein distances between different combinations of sub-strings from the translated terms and HCAT4. A series of rules were then applied as outlined in Fig. 4 to handle certain cases and exceptions as follows:
Multiple crops listed: in cases where there were multiple crops listed as part of a single label, we applied three main rules. First, we determined whether the crops fall with the same group in the hierarchy and if so, we applied that group. For example, both rye and wheat fall under cereals and would, therefore, be mapped under cereals. Secondly, if the crops do not fall under the same group in the hierarchy but contain extra information about what the major crop is, then we assigned the major crop to that parcel. For example, a mixture of legumes and cereals with more than 50 % legumes would be mapped to the class “legumes harvested green”. Finally, for any remaining labels, we took the first crop that was mentioned as the HCAT4 label.
New crop that is not mentioned in HCAT4: some countries have extremely detailed crop lists, while others do not. Differences in climate across Europe also allow for a different and a smaller or larger number of varieties of crops to be grown. Depending on how common the crop is in the country where it is cultivated, either a new HCAT4 code was assigned or it was mapped to a higher crop type in the hierarchy. The threshold for a new HCAT class to be created requires that the crop exceeds 1 % of the total area.
Mapping crops in the “other” category in the GSA to HCAT4: if a crop type is labeled as “other <crop type>” in the GSA, it is then mapped to the upper hierarchy in HCAT4. For example, the crop type “Other fruits” would be mapped to “orchards_fruits”. If, however, the fruit was specified but is not found in HCAT4 (e.g., other_orchards_fruits: Prickly Pear), then it would be specified as “Other fruits”.
This process was then repeated for each year in a given country and then for each of the countries in the data set. Note that this process was also iterative in that the data harmonization process led to further adjustments to HCAT4 such as adding new crop types. For example, the citrus family was expanded to clementines, oranges, mandarins and lemons due to the large amount of cultivated area of these crops in Spain (ES) and Portugal (PT). Another example is conifers that are used for Christmas trees, which is present in almost all countries.
2.4 Linking to other crop type classifications
Following data harmonization from GSA to HCAT4, the final step involved connecting HCAT4 to crop types defined in other classification systems. This required an additional alignment step in which crop classes were extracted from each classification system and linked to their HCAT4 equivalent. Therefore, some classes in HCAT4 may not be used depending on the crops grown in each MS. The main alignment concerns (AGRIPROD, https://op.europa.eu/en/web/eu-vocabularies/concept-scheme/-/resource?uri=http://data.europa.eu/3t3/agriprod/agriprod last access: 1 June 2026), which is used by Eurostat when disseminating farm and crop statistics.
2.4.1 AGRIPROD
AGRIPROD is a standardized list of codes for agricultural products, which is created and maintained by Eurostat and disseminated by the Publications Office of the European Union on the EU Vocabularies website (Eurostat, 2024a). Being a standardized code list means that it obeys rules for establishing meaningful code identifiers, which are short representations or expressions of the code labels. Standard code lists allow cross-domain use, which increases data comparability and interoperability and facilitates good database management. The standardization of code lists also increases their reuse. Another benefit of code list standardization, connected to database management and code list governance, is the reduction in the number of code lists in use, thereby facilitating their management (Eurostat, 2025b).
The crop classes of AGRIPROD are divided into major crop categories, generally coded using a letter followed by four zeroes (e.g., C0000 is the code for cereals). Within each major crop categories, there is a hierarchy that is reflected in the coding. For example, within cereals is the class C1000, which is “Cereals for the production of grain”. Within this class is “Barley”, which is coded as C1300, with two types of “Barley”: “Winter Barley” (C1310) and “Spring Barley” (C1320). Each element in the HCAT4 taxonomy has been matched to the AGRIPROD crop classes. The matching is provided in a mapping table included within the data set, and an simple example is presented in Fig. 6 for cereals with no usage assigned. An AGRIPROD class was attributed to every HCAT4 and usage occurrences in the data set. Although the matching was generally straightforward for most of the common crops, there is a loss of information in the classification of citrus and tropical fruits, which have fewer classes in HCAT4 compared to AGRIPROD, or where multiple uses are not reflected in HCAT4 but are present in AGRIPROD (e.g., hemp for fiber and hemp for oil).
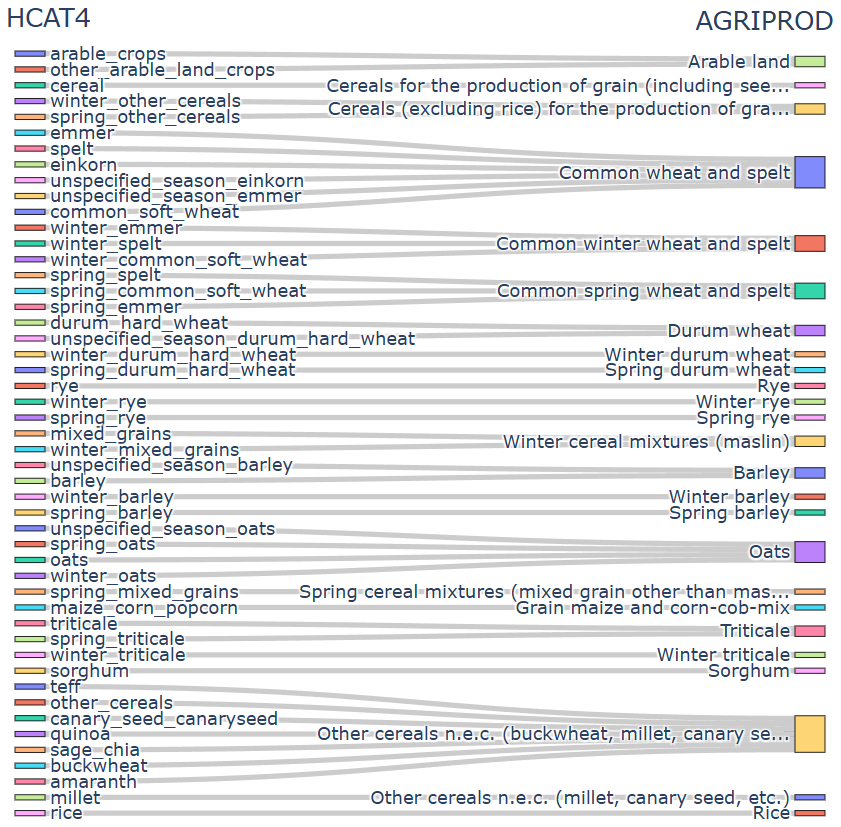
Figure 6The mapping between HCAT4 and AGRIPROD for cereals with “No specified usage” (see Table 2). An exhaustive and interactive version is provided at https://jeodpp.jrc.ec.europa.eu/ftp/jrc-opendata/DRLL/EuroCropsV2/sankey_classifs_hcat4_agriprod_usage_0.html (last access: 1 June 2026).
Eurostat collects and publishes annual crop statistics on crop area, production, and yield from the MS that obtain these from surveys, administrative data, and estimates based on expert observations. MS do not use the same sources but have to uphold quality standards defined by Regulation (EU) 2022/2379 (Eurostat, 2025d). In addition, Eurostat collects Integrated Farm Statistics (IFS), previously known as the Farm Structure Survey (FSS) from the MS following a harmonized protocol for a large set of agricultural statistics. MS use sample surveys every 3 to 4 years, agricultural census (which takes place every 10 years), and are encouraged to use a variety of data sources including registers and administrative sources to lower reporting burden, provided statistical quality requirements are met (Eurostat, 2024b). The 2020 agricultural census also included EFTA countries (Iceland, Norway and Switzerland) and surveyed more than 9 million farm holdings (Eurostat, 2024b). Collectively, these statistics are used for the evaluation of agricultural policies and for the monitoring and management of markets (Eurostat, 2023a). They are freely available from the Eurostat data browser (https://ec.europa.eu/eurostat/databrowser/explore/all/all_themes, last access: 1 June 2026) (Eurostat, 2025c). The aggregations traditionally range from NUTS 2 for the most detailed spatial resolution to data released only at national level for some NUTS regions (e.g., Estonia) or some crops (e.g., Grapes). Recently, Eurostat has also published a multi-resolution grid data set based on the 2020 census (Lampach et al., 2025; Skøien et al., 2025). The harmonized crop classes employed by Eurostat to disseminate these crop statistics are aligned to AGRIPROD and are described in more detail in Eurostat's Handbook on Crop Statistics (Eurostat, 2023a).
2.4.2 Link to other EU data sets
Links to two main data sets are described in this section. The first is the Land Use and Coverage Area frame Survey, LUCAS is a systematic survey that takes place every three or four years across the EU (Eurostat, 2021). Piloted in 2001, the most recent survey was completed in 2022. A harmonized LUCAS data set covering surveys from 2006 to 2018 has been compiled by d'Andrimont et al. (2020). For those locations that are surveyed in the field, a LUCAS protocol for data collection is provided in the Technical Reference Document C1 (Eurostat, 2022a). The protocol includes taking photographs at the sample point location and in four cardinal directions away from this point. The location is then classified by land cover and land use using the LUCAS nomenclature provided in the Technical Reference Document C3 (Eurostat, 2022b).
The LUCAS classification is organized into eight main land cover classes where class B is Cropland. This class contains five sub-classes: B10 “Cereals”, B20 “Root crops”, B30 “Non-permanent industrial crops”, B40 “Dry pulses, vegetables and flowers” and B50 “Fodder crops”. Within each of these sub-classes, specific crop types are identified in a hierarchy. For example, “Barley” is B13. Unlike HCAT4 and AGRIPROD, there is no further differentiation for spring and winter barley so the LUCAS classes are less detailed. However, this means that there was no information loss when linking the LUCAS classes to the HCAT4 taxonomy and the GSA data sets.
The second data set is the Farm Accountancy Data Network (FADN), which is a compilation of the results from annual surveys carried out by MS on farm income and business activities. Consisting of a sample of around 80 000 commercial farms across the EU, the FADN is used to monitor the income related to farming in the EU as well as the impacts of measures from the CAP (European Network for Rural Development, 2020). The FADN is being converted into the Farm Sustainability Data Network (FSDN) from 2025 to collect additional data on environmental and social dimensions (European Commission, 2023c) although the data will not become available before 2027.
Specifically in relation to crops, the FADN contains data on crop areas, yields, and other crop related information such as crops for farm use, farmhouse consumption, sales, etc. The crop types from the FADN have been matched with AGRIPROD and therefore with the HCAT4 taxonomy. The mapping tables for HCAT to LUCAS and FADN are available in the github repository.
2.4.3 EAGLE matrix
As part of the European Environment Information and Observation Network (Eionet), which is a partnership between the EEA and its 38 member countries, the EAGLE group (Eionet Action Group on Land monitoring in Europe) was set up. This group has developed a data model for land cover and land use monitoring that separates out land cover from land use (Arnold et al., 2013). The EAGLE Matrix, which is available from the Copernicus website (EU Copernicus, 2023a), is a tool that allows different classification systems to be compared and has three main components: land cover, land use and landscape characteristics. `Crop types' are one of the categories in the landscape characteristics table, which are then further broken down into Arable crops, Permanent crops, Meadow Grass, Mushrooms, Aquatic crops, Fallow land and Unspecified. Below Arable crops and Permanent crops, two additional levels in the hierarchy are specified, all of which has been matched to the HCAT4 taxonomy; the mapping table is available in the github repository.
2.4.4 Crop classification systems from remotely-sensed products
Crop type mapping is becoming more common with the availability of high resolution satellite imagery from multiple sensors and frequent revisit times. GSA data can provide valuable training and validation data for crop type mapping. The first EU-wide crop mapping exercise was undertaken by d'Andrimont et al. (2021) for the year 2018, and reproduced for 2022 (Ghassemi et al., 2024). The training of the model relies on LUCAS Copernicus data, and follows a classification system of 19 crop types defined by the LUCAS taxonomy, which enables matching to the HCAT taxonomy.
Another product is the new annual Copernicus Land Monitoring System (CLMS) High Resolution Layers (HRL) on Vegetated Land Cover Characteristics (VLCC) (EU Copernicus, 2023b), which includes HRL on Cropland including annual layers on Crop Types (CTY). This layer uses a crop classification system with 19 crop classes that have been matched to the HCAT taxonomy and has been validated using GSA data as one of the reference data sets (Claverie et al., 2024). The mapping table is available in the github repository.
2.5 Creating a temporal stack of crop layers
We analyzed the harmonized GSA time series for all countries and regions to produce data on crop rotations for any given agricultural parcel as part of the GSA. The analysis also considered parcels that were absent in certain yearly GSAs. Due to topological challenges encountered during the intersection process, each yearly GSA was converted to a raster grid with a spatial resolution of 2 m, assigning the parcel value to the pixel center. As a result of the rasterization, an inner buffer of approximately 2–3 m is present along the parcel boundaries (see right hand map in Fig. 7). Polygons with an area of less than 0.1 ha were excluded from the analysis. This can occur at parcel boundaries, where the limit can vary from year-to-year or because the intersection simply produces areas that are too small; an example is the parcel labeled E in the annual GSA as shown in the left hand map in Fig. 7, which is no longer present in the GSA stack (right hand map in Fig. 7). The crop rotations are presented in the tables named <NUTS>_stack, where each table includes columns cf<year> and c<year>, relating to respectively the cropfield and the original_code from the yearly GSA (<NUTS>_<year>). If a parcel was missing in a given year, the area was retained, and it was recorded with no entry (NULL) for that year.
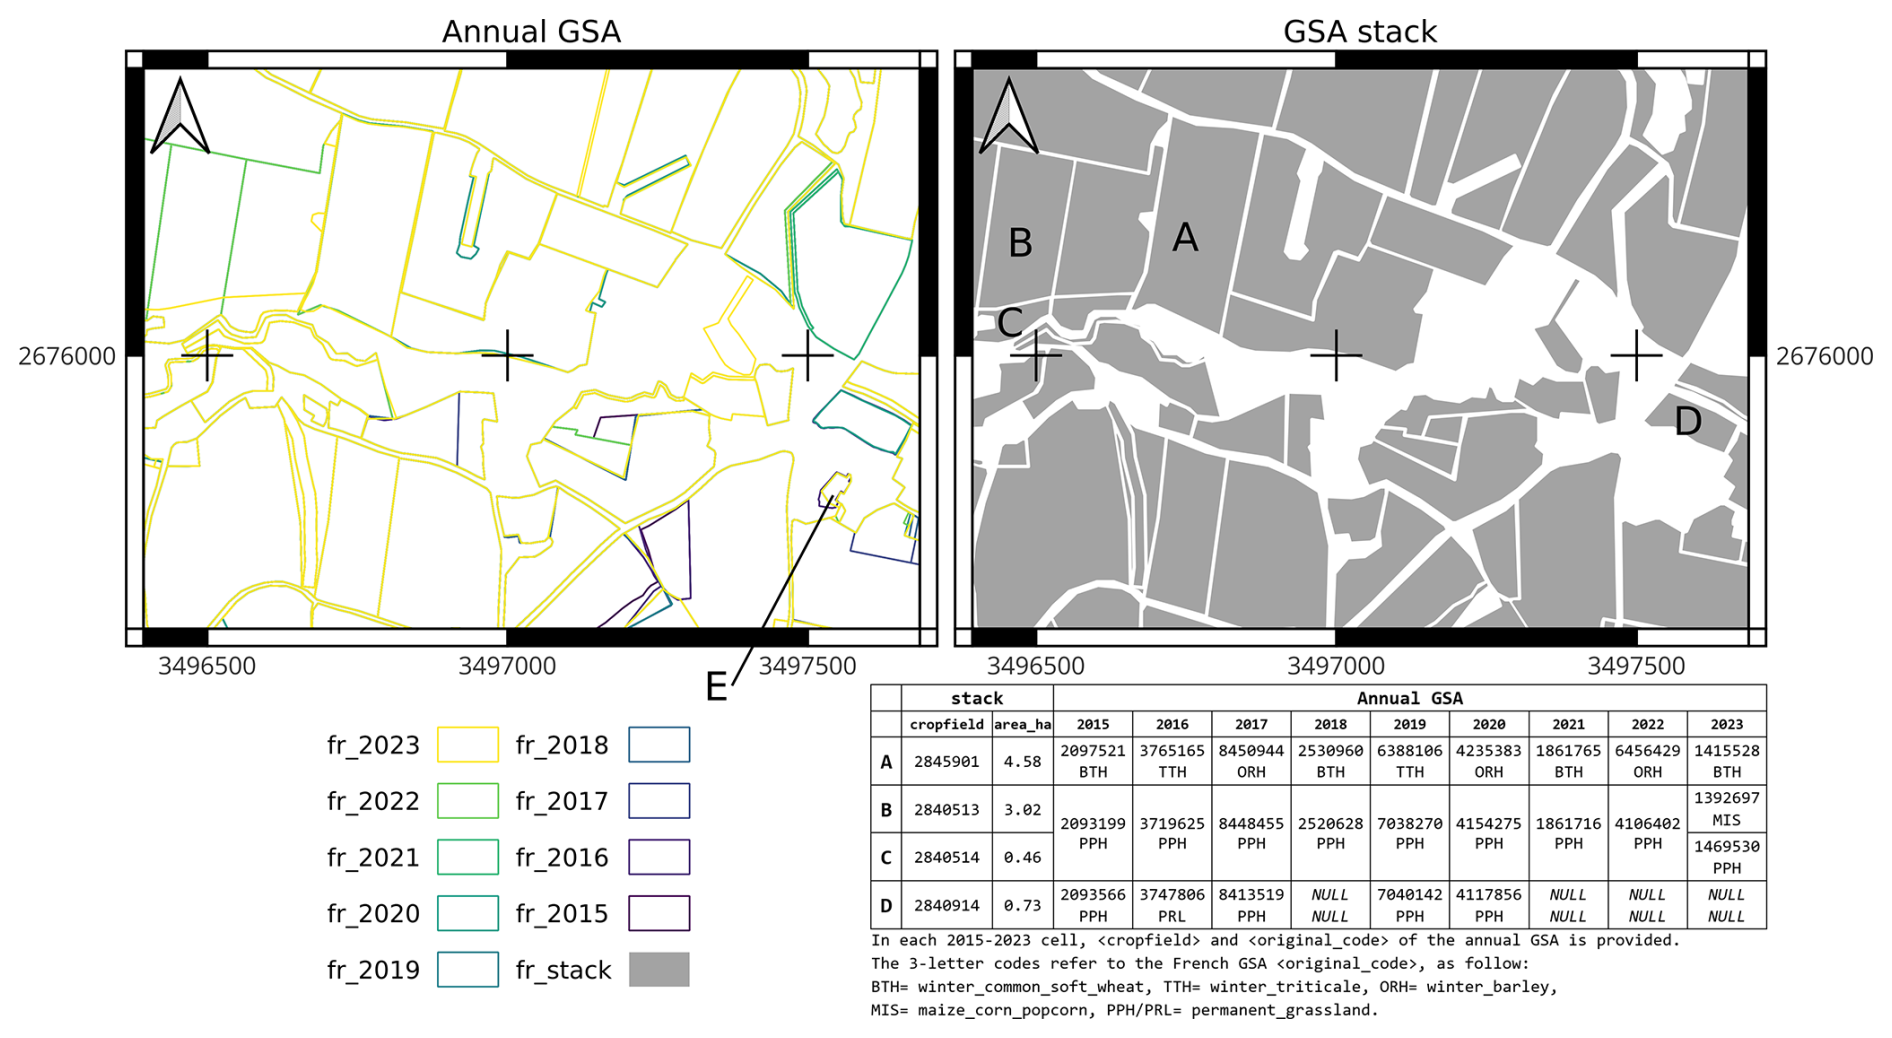
Figure 7Example of the annual French GSA layer (on the left) and the computed GSA stack layer (on the right). The attributes of the four stack polygons labeled A to D are reported in the sample table. Parcel A shows a typical crop rotation. Parcels B and C show two contiguous parcels that were merged from 2015–2022 and then split in 2023. Parcel D shows a parcel with no declarations in 2018 and 2021–2023. Parcel E (left panel) shows a polygon smaller than 0.1 ha, which was removed in the stack layer.
3.1 Description of the data set
Figure 8 shows the countries/regions and the years covered by the GSA data, displayed as normalized values for the annual number of parcels, the total area and the average parcel size per year. The countries/regions displayed in Fig. 8 are ranked by the total area, showing France on the far left with 28 million ha of declared cropland and Slovenia at the far right with the smallest area of 470 000 ha. Some countries have data for many years such as Denmark, the Netherlands and Flanders in Belgium while data are only available for a few years in the case of Estonia, Czechia and Finland. Several countries show an increase in the number of parcels but as the total area only changes very little, the mean parcel area decreases indicating smaller field sizes, while the opposite trend is evident in Denmark. The abrupt changes over time may reflect a change in policy and how the IACS is used. For instance, in 2023, the Netherlands had 2.6 million declarations while the average between 2009–2022 was 778 000 declarations (not shown in the figure because this latter number is below the 60 % limit of the plot). The most substantial increase occurred in the not_known_and_other HCAT4 class, increasing from fewer than 16 000 features before 2022 to more than 1 million in 2023, reflecting the inclusion of landscape features in the GSA.
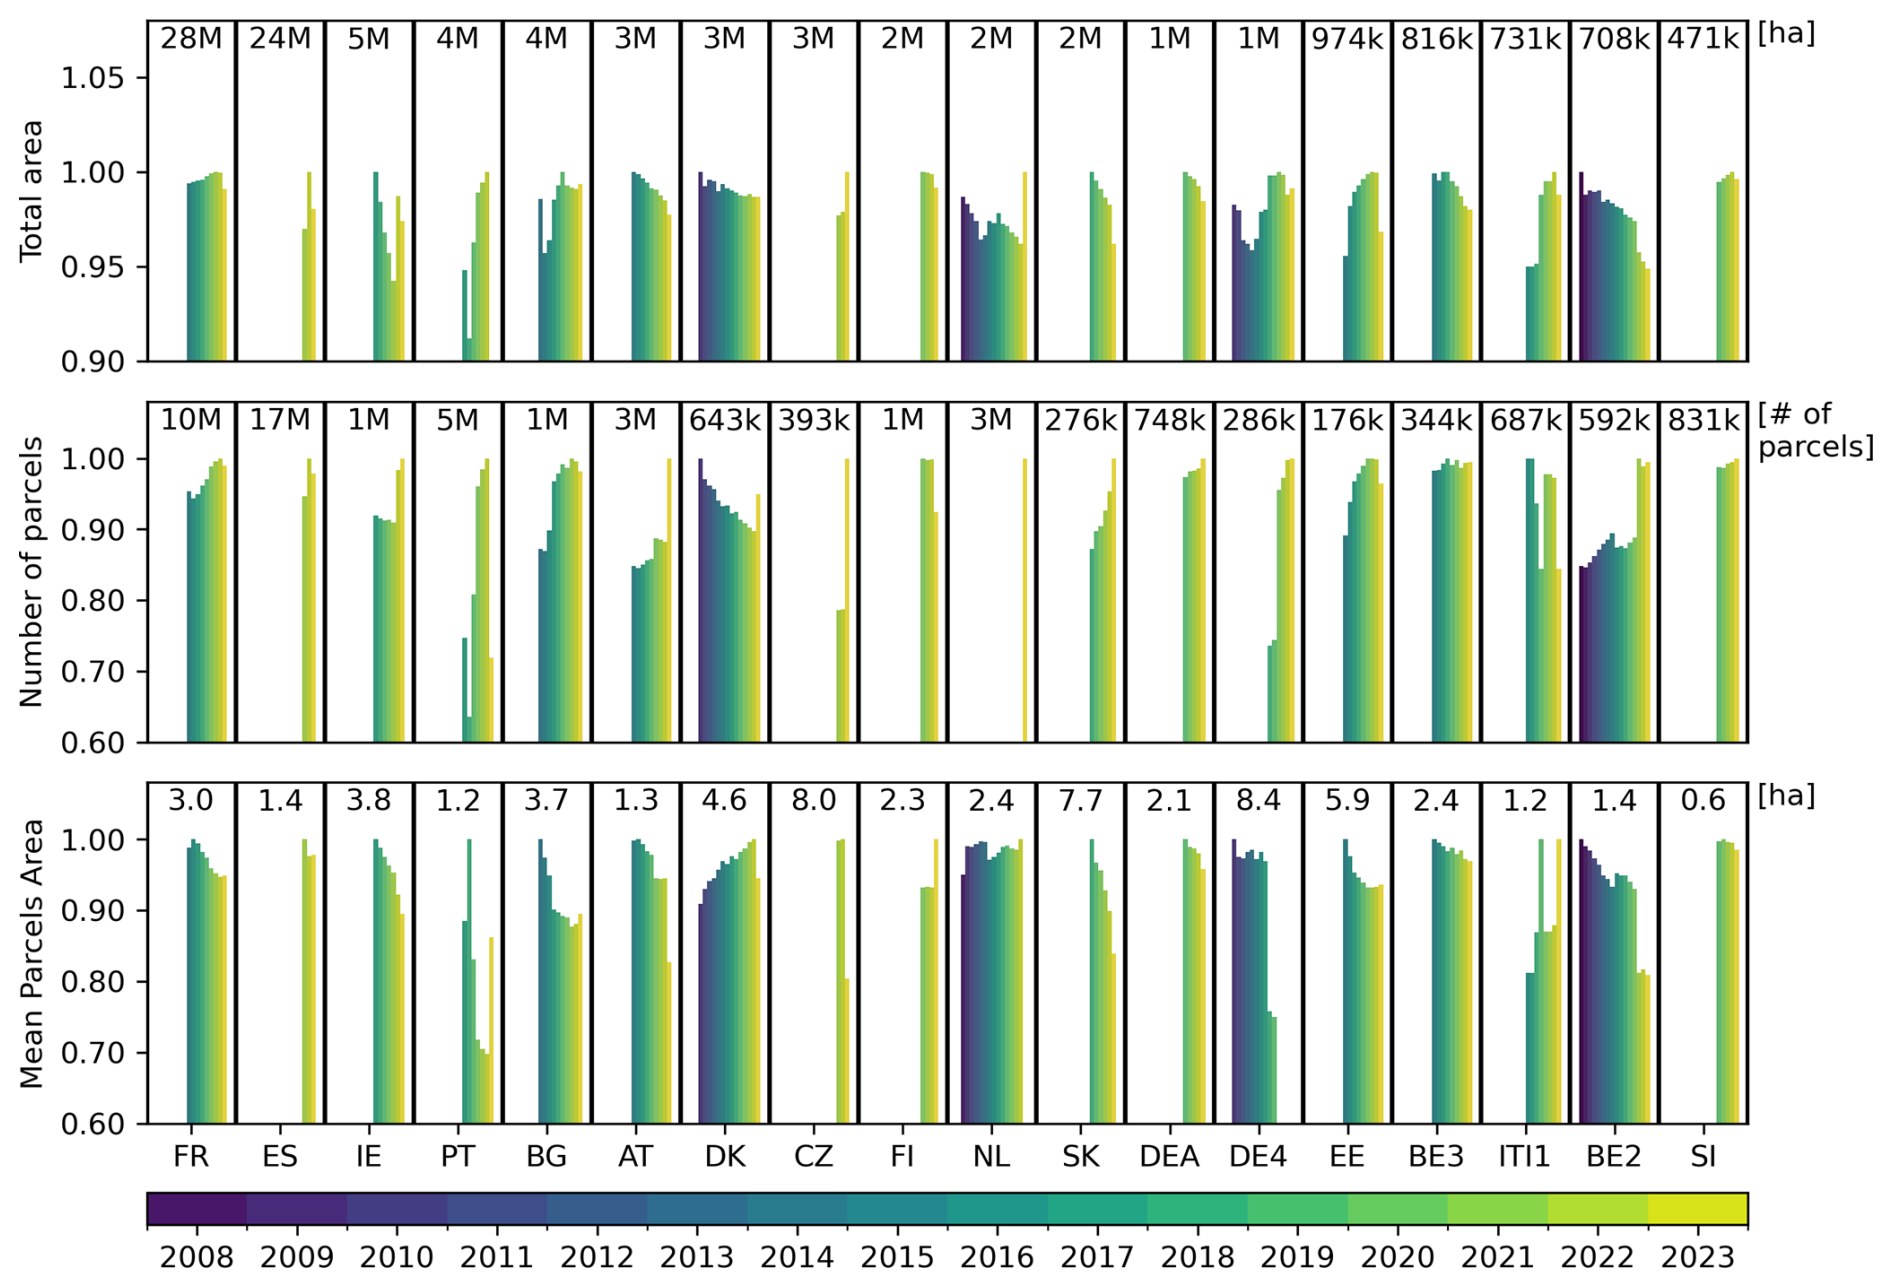
Figure 8Summary of the EuroCrops v2.0 database including the normalized values of the area of all parcels, the number of parcels and the mean parcel area from 2008 to 2023. The total area in ha, the total number of parcels and the mean parcel area in ha is given by country or region at the top of each set of bars. The countries are denoted by two letter country codes, DEA and DE4 are two regions in Germany and BE2 and BE3 are Flanders and Wallonia, respectively.
The data can also be viewed spatially, where Fig. 9 shows an example of the harmonized GSA data for parts of three bordering countries: Austria, Czechia and Slovakia, which now allows for direct comparison between countries and regions. The data can also be aggregated to level 1 in the HCAT4 hierarchy to show, for example, the percentage of arable crops, permanent crops and grassland reported in the GSA in each country/region as shown here in Fig. 10 as the percentage of total land in each 10 km grid cell.
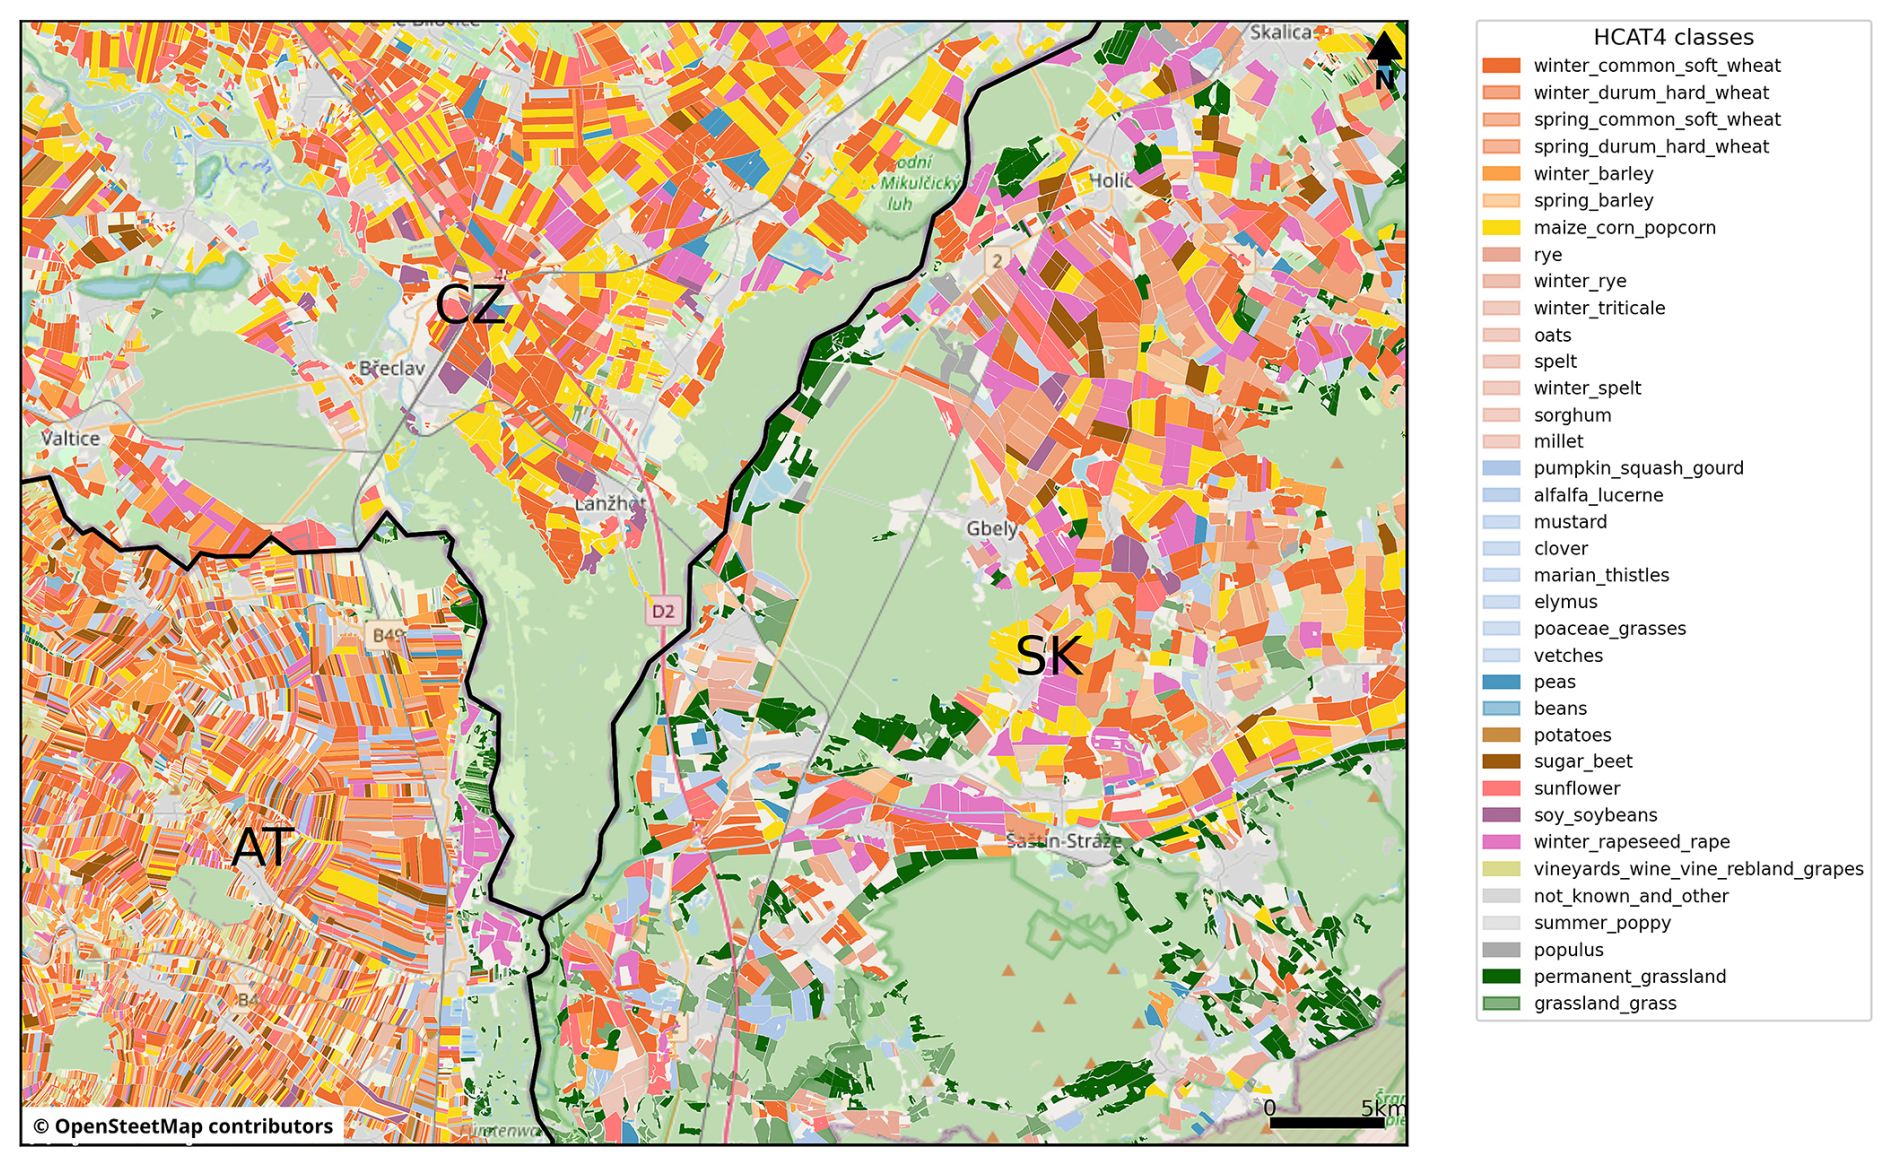
Figure 9The GSA data for 2023, harmonized using HCAT4 across three countries. The black lines represent the administrative boundaries. The map projection is EPSG:3857.
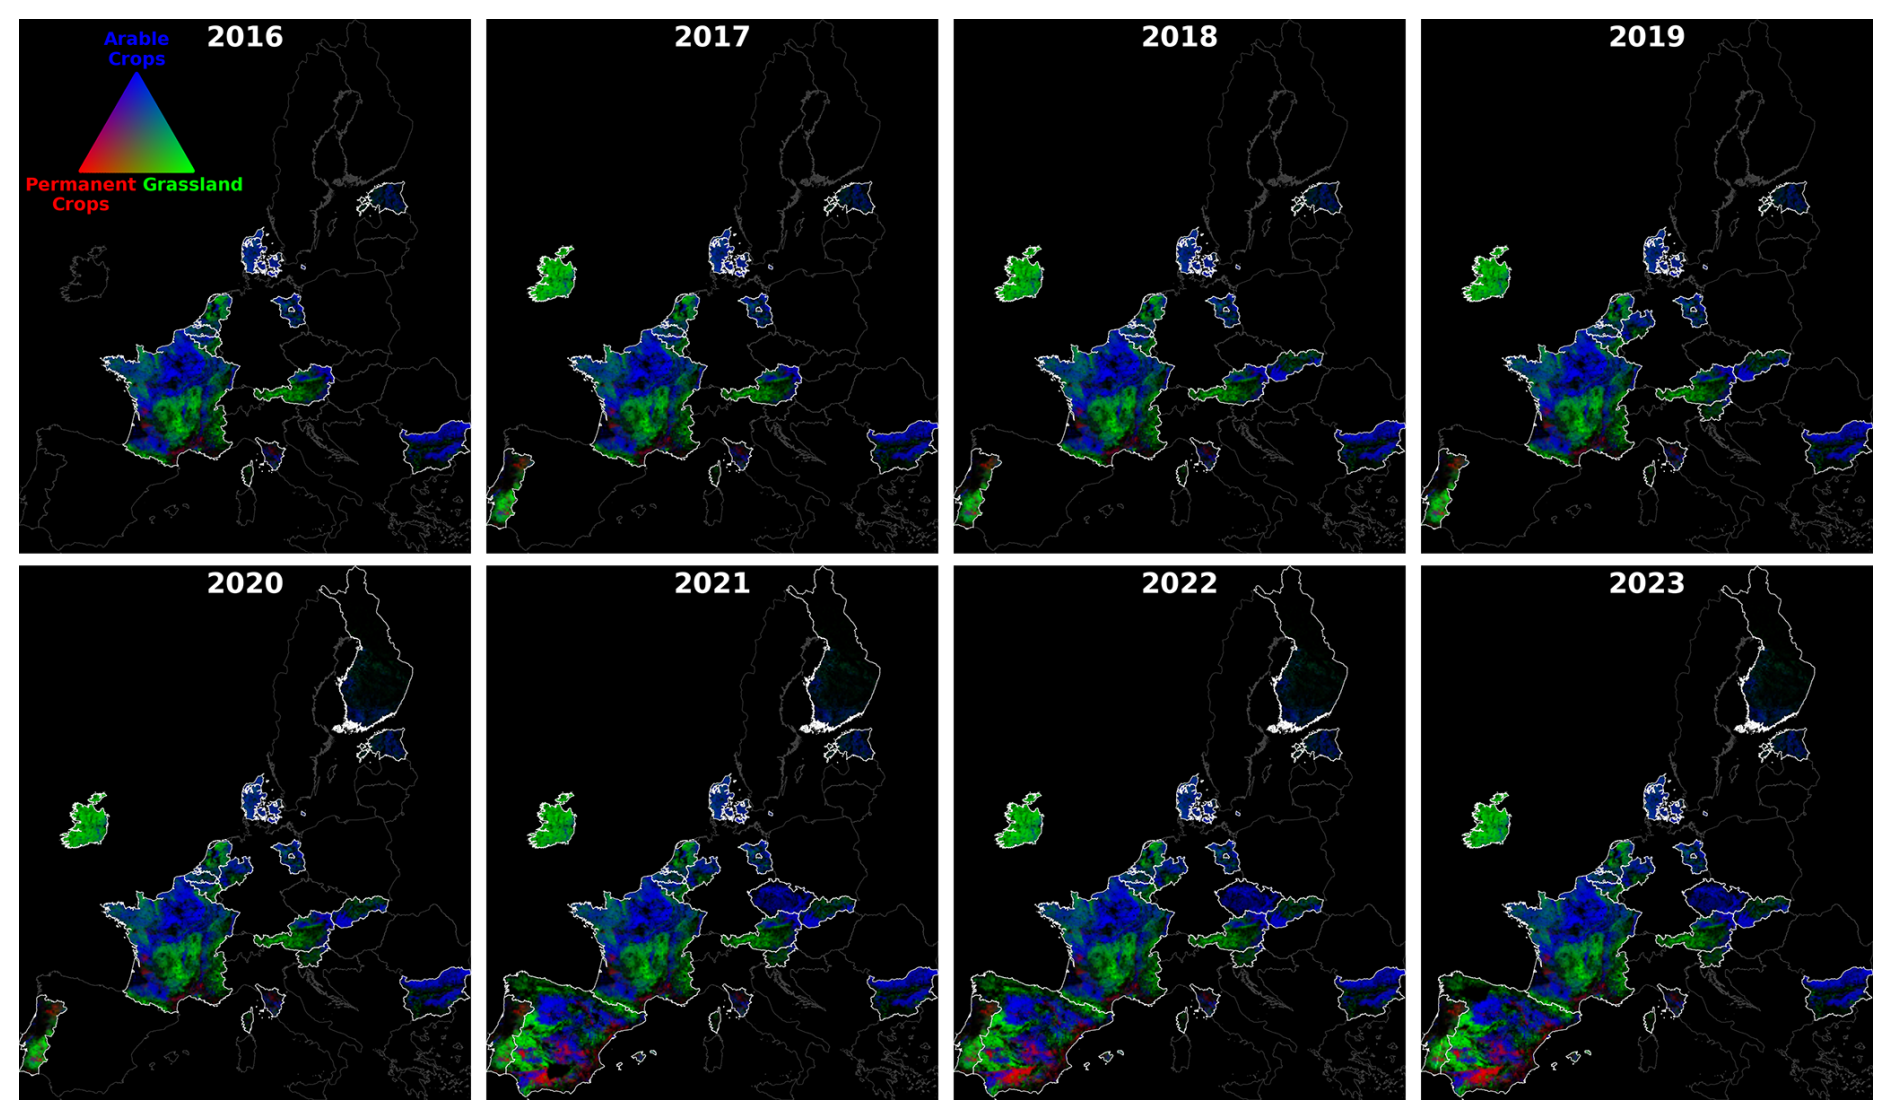
Figure 10The proportion of arable crops, permanent crops and grassland in the GSA at a 10 km resolution. Borders are shown in white. Maps for 2008 to 2015 are provided in Fig. S4.
3.2 Crop area comparisons with Eurostat statistics
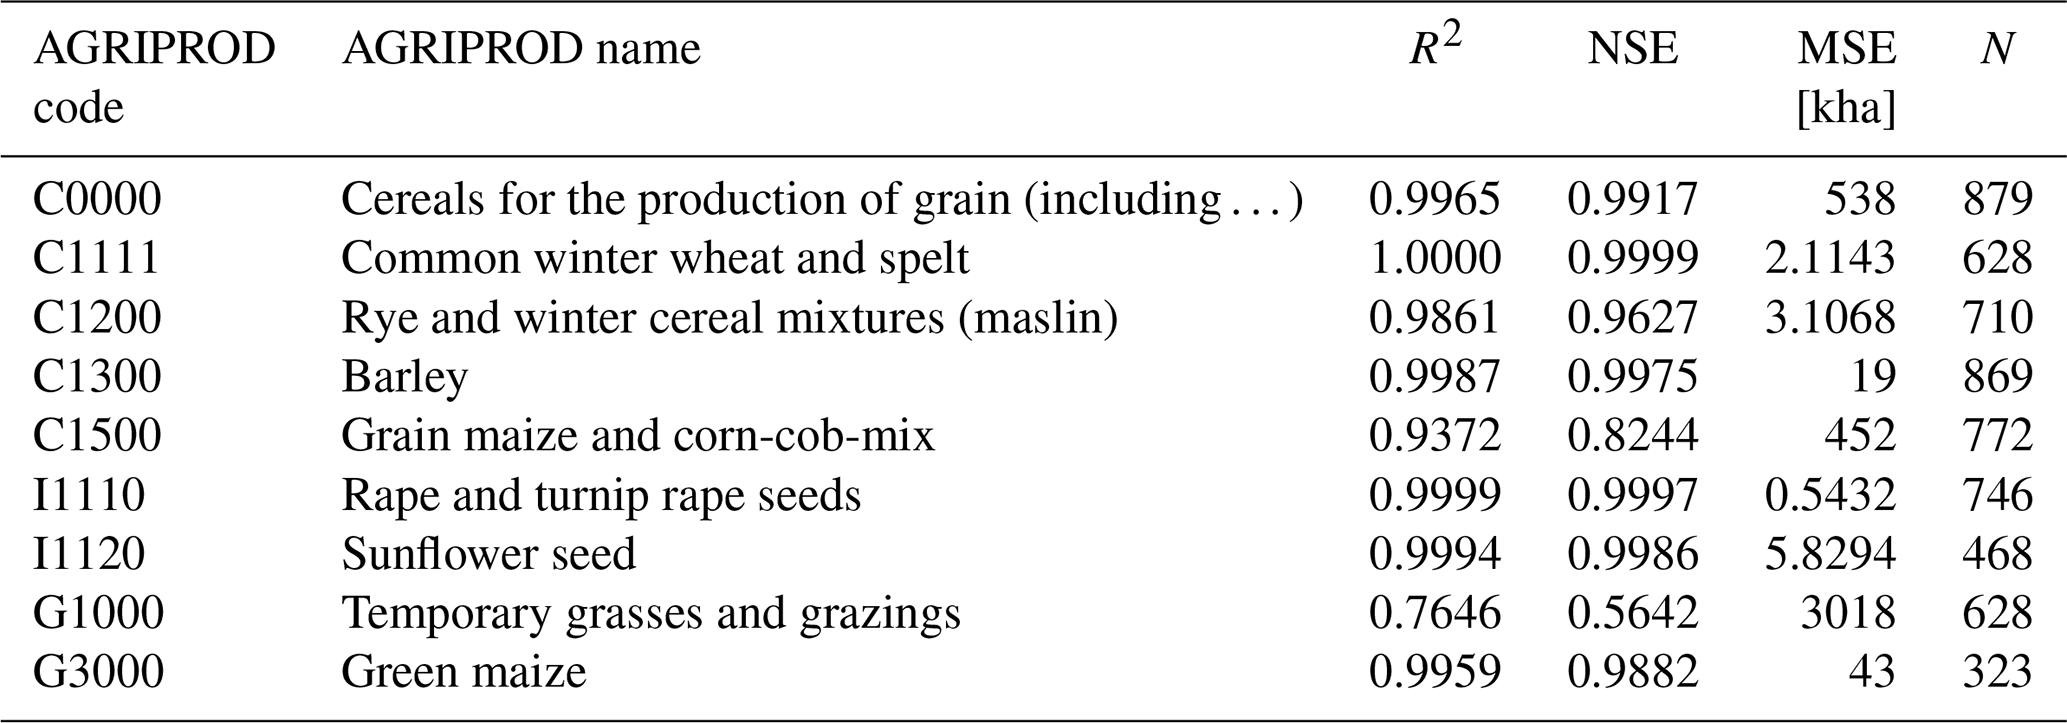
Annual crop statistics on area from Eurostat's database, which are available at NUTS 2 level, were compared with the EuroCrops v2.0 data aggregated to NUTS 2 level. The area comparisons for a selection of crops, following the AGRIPROD nomenclature, are provided in Fig. 11 including R-squared and Nash–Sutcliffe Efficiency (NSE) values, with a selection of crops summarized in Table 3. The full comparison is provided in the Supplement (Figs. S2 and S3 and Table S2). In general, the results show a good match between the two data sources, especially when the definitions are not ambiguous, e.g., for winter wheat (C1111) and rapeseed (I1110). The aggregated C0000 class (Cereals for the production of grain, including seed) also shows good agreement, except for some NUTS 2 regions in France and Spain. The class rye (C1200) shows good agreement, except in Spain where the crop was only introduced in 2023, belonging to two mixed classes: rye-wheat mixture and oat-rye mixture. Following the rules of HCAT4 for mixed classes (see Sect. 2.3.2), only the first class (representing 32 % of the two classes) was allocated to rye (C1200), and rye is, therefore, underestimated in the Spanish GSA compared to Eurostat. The class maize shows generally good agreement, although the distinction between grain and silage maize is not captured as well. The underestimation of sorghum (C1700) in France in the GSA is less expected, as the crop is recorded as a single class, which indicates some inconsistency in reporting. Crop types that are more heterogeneous or where they are harvested green show lower agreements, with a general trend towards higher amounts in the GSA compared to Eurostat. The over and underestimation in dry pulses and protein crops classes P1000 and P1200 (Fig. S2) indicates that crops may be recorded differently in the GSA compared to Eurostat. Conversely, underestimation in the GSA compared to Eurostat statistics may be linked to incomplete area reporting, as not all parcels are declared.
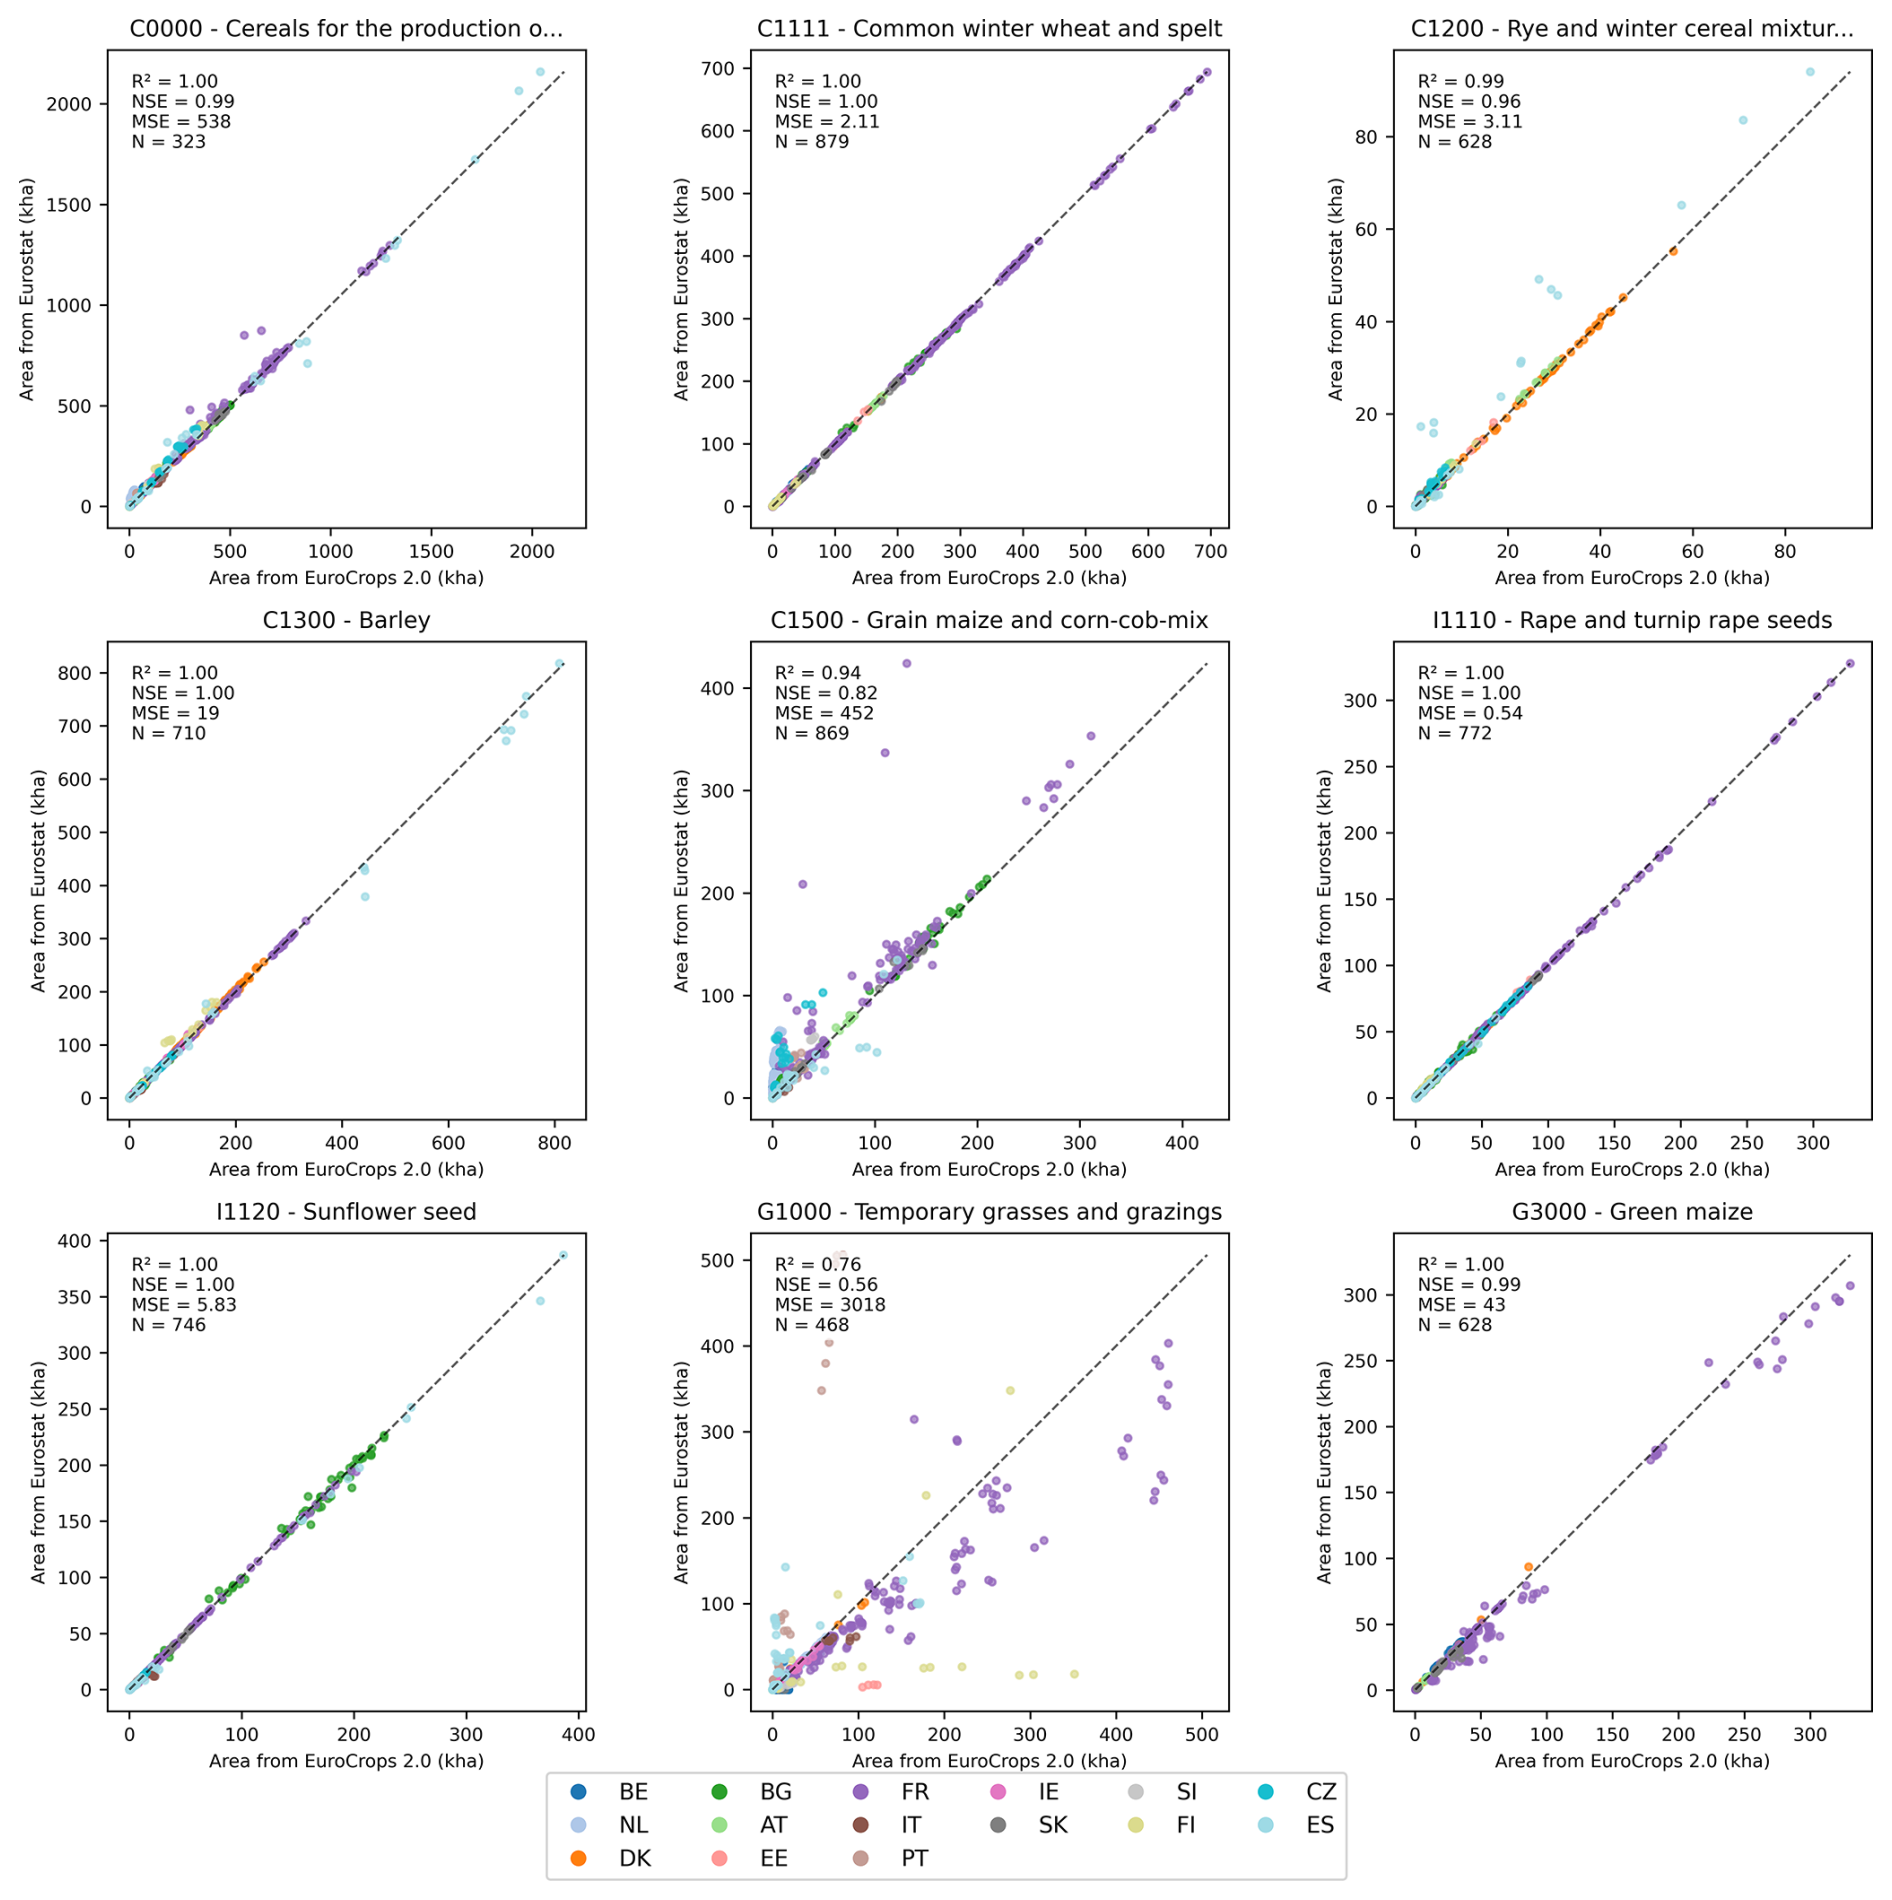
Figure 11Area comparison between crops in the EuroCrops v2.0 and Eurostat databases for a selection of crops extracted at NUTS 2 level and linked by AGRIPROD codes for all years available. Figures S1 to S4 provide this comparison for the complete set of crops.
Table 3Evaluation metrics for selected crops in Fig. 11. R2 is the R-squared value, NSE is the Nash–Sutcliffe Efficiency, MSE is the mean squared error and N is the number of NUTS2 zones.
3.2.1 Crop area comparison with gridded data from the IFS and FADN
Here we provide a first comparison between the gridded agricultural crop area data from the IFS and from the GSA. We used the gridded data set for barley (C1300) from Eurostat and aggregated the GSA data on barley to the same grid cell sizes for the year 2020. Only grid cells that are completely inside the regions with GSA data are included in these analyses.
Figure 12 shows maps of the area of barley within each grid cell for the two data sets. The patterns in this map are somewhat dependent on the grid cell size (since larger grid cells usually have more agricultural area). However, in both maps, we can easily identify high production areas in Central France, Slovakia, Estonia and Bulgaria. The panel to the right shows the difference between the maps in percentages (limited up to 50 %). The salt-and-pepper pattern in some regions indicates some issues with the geographical matching of the two data sets. This is most likely caused by the fact that the IFS data represent the administrative location of the holdings and not the actual locations of the parcels, which is the case in the GSA.
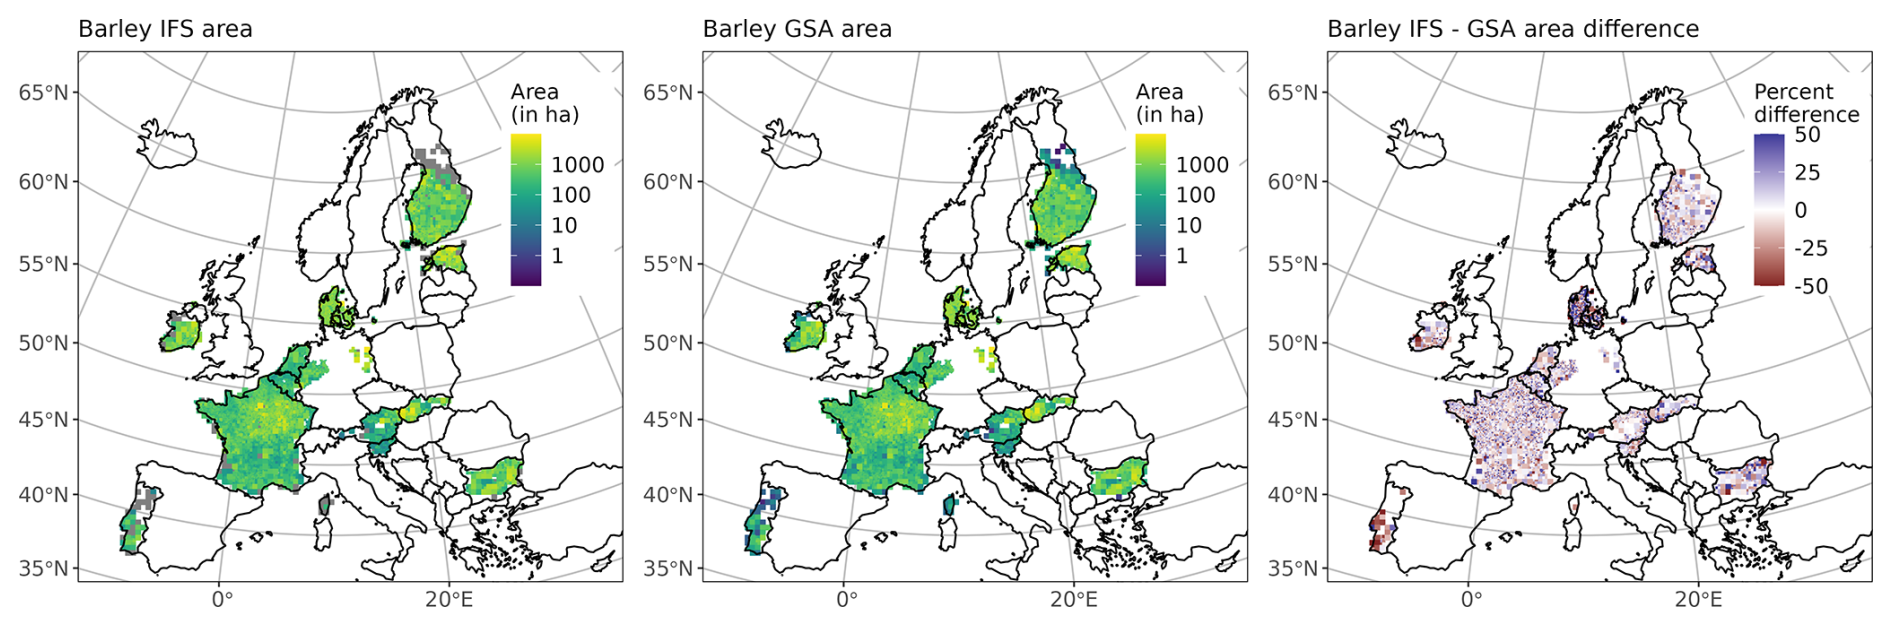
Figure 12Comparison of area within the IFS multi-resolution grid cells between Geo-Spatial Application (GSA) and the Integrated Farm Statistics (IFS) data for year 2020. The panel to the right shows the percent difference between the maps.
Figure 13 shows a scatterplot between the two data sets for each grid cell for different resolutions. We can see that there is quite a lot of scatter for the smallest grid cells (5 km), whereas the match is better for the larger grid cells (40 km). The correlation is 0.94, with an NSE of 0.87.
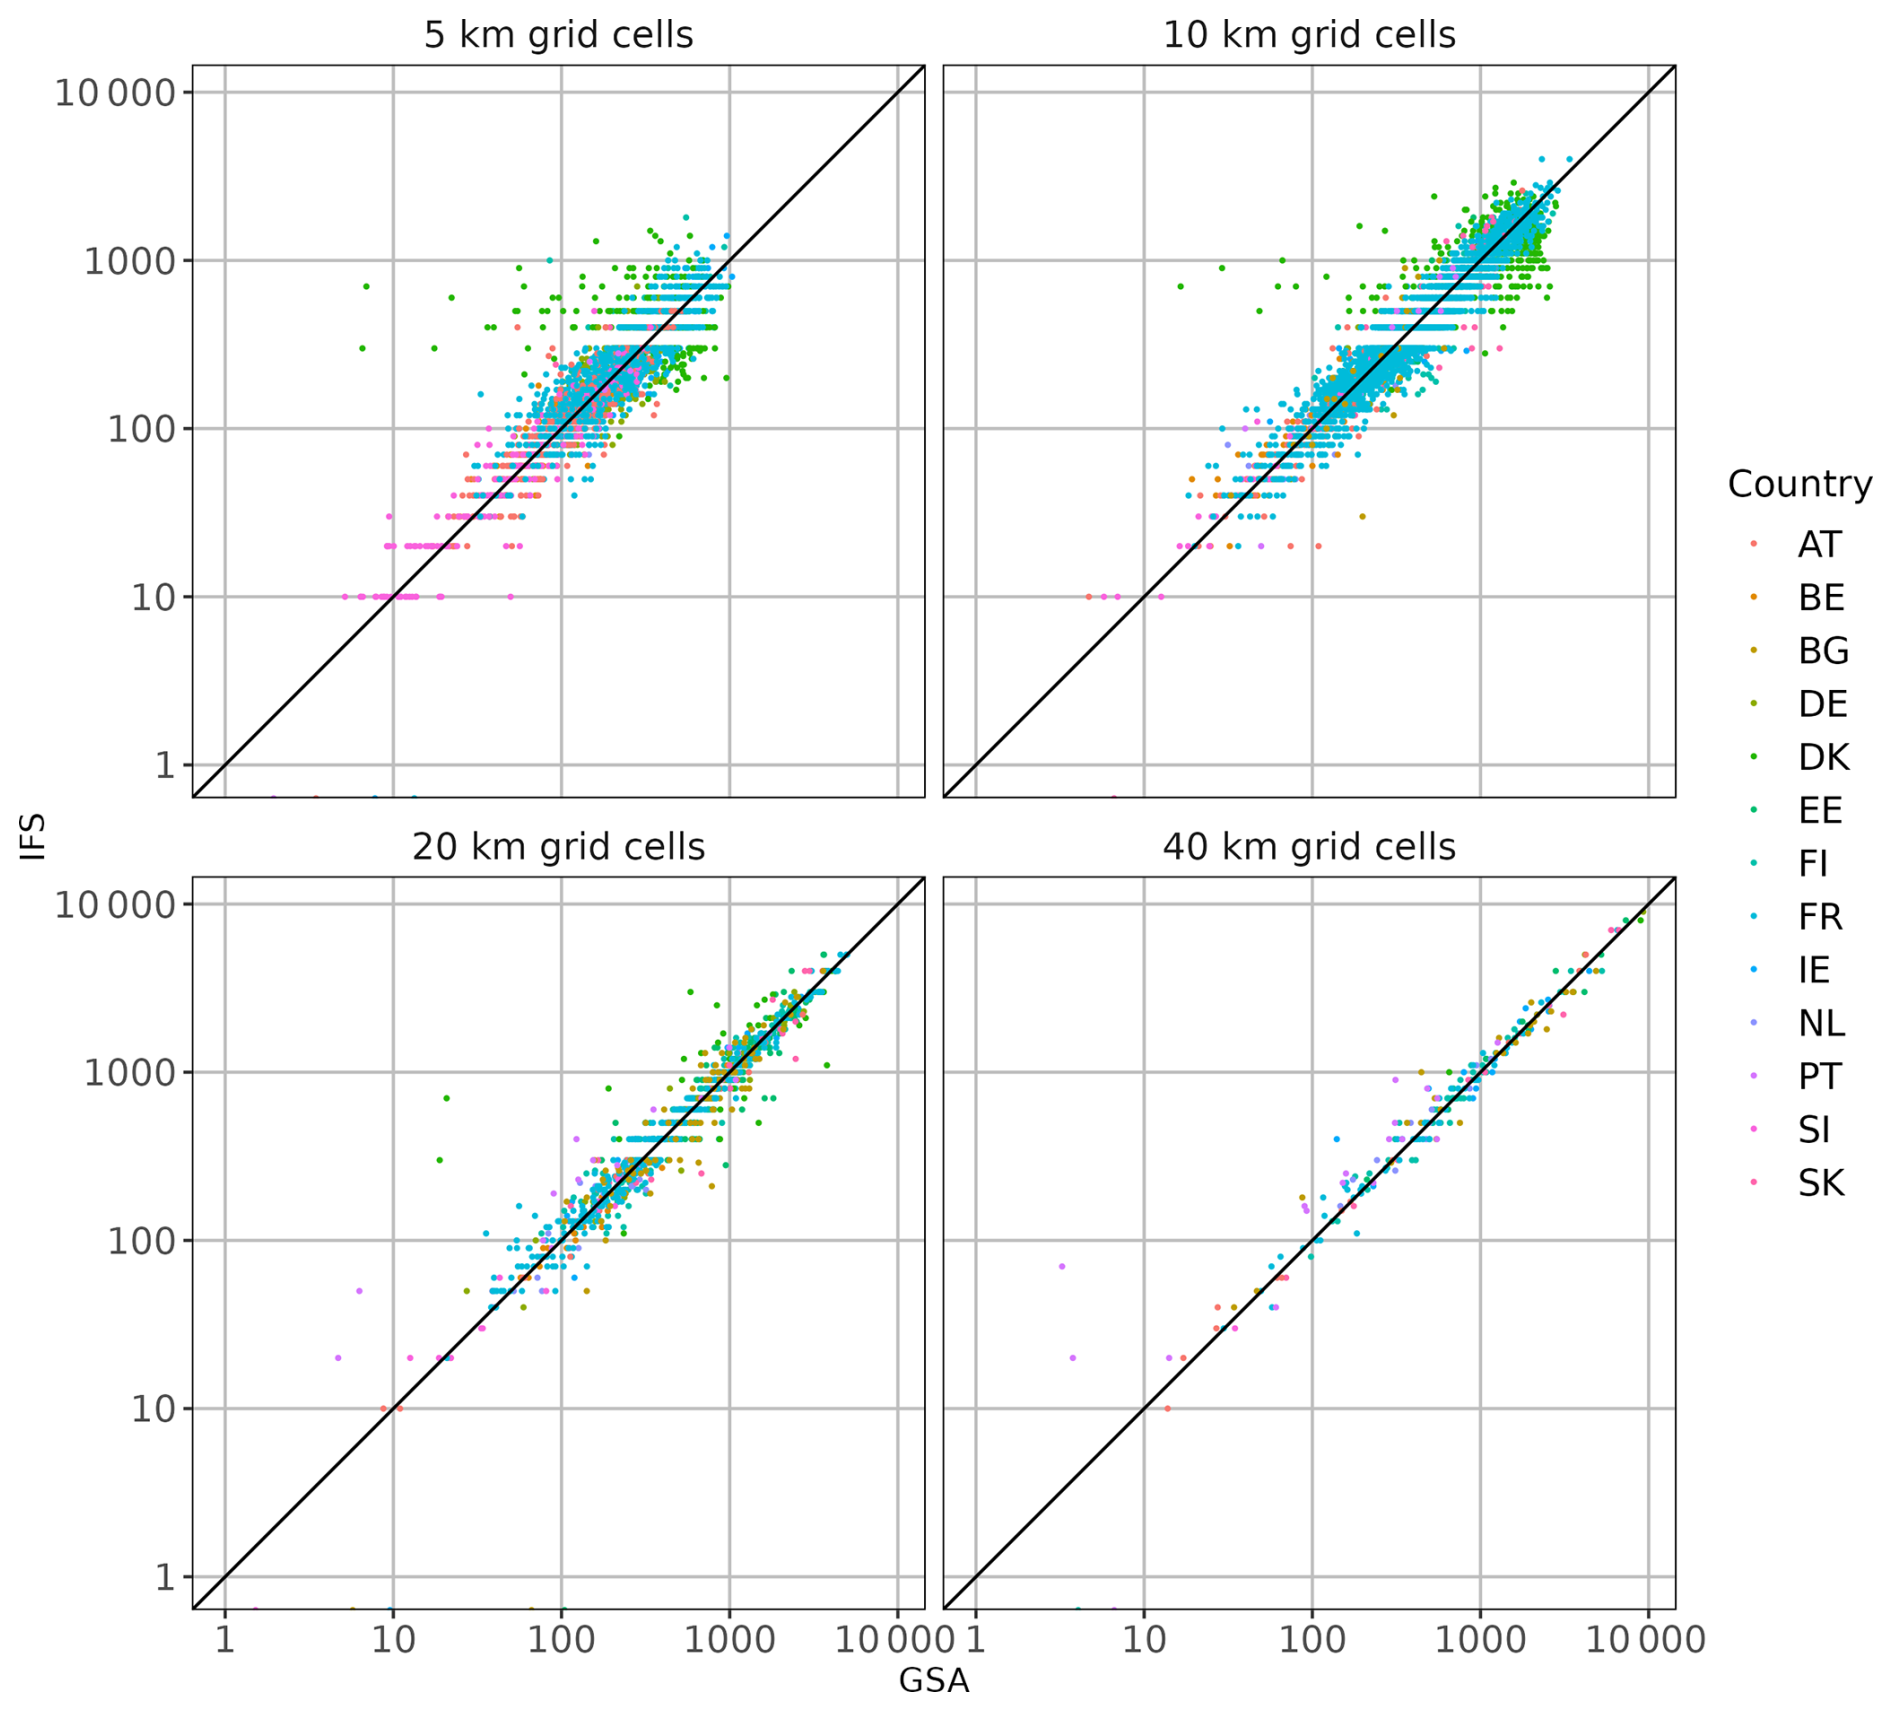
Figure 13Scatterplot of areas of barley from the Geo-Spatial Application (GSA) and the Integrated Farm Statistics (IFS) within four selected IFS multi-resolution grid cells (5, 10, 20, and 40 km) for the year 2020.
3.3 Mono-cropping and crop rotations
Since the EuroCrops v2.0 data set contains a time series of at least three years, it is possible to use the data to investigate where, for example, mono-cropping is occurring spatially for different types of crops. The analysis is based on the stacked layers which report the crop sequence for each declared area. Figure 14 provides an example using maize, where Fig. 14a shows some hotspots of higher maize monocropping in parts of France, Belgium, The Netherlands, Denmark and eastern Europe. However, by taking into account the areas where maize is grown in 2023 (Fig. 14b), the hotspots of maize monoculture in 2023 are more clearly highlighted (Fig. 14c), showing pockets in Ireland, Portugal, Spain, France, Denmark and eastern Europe.
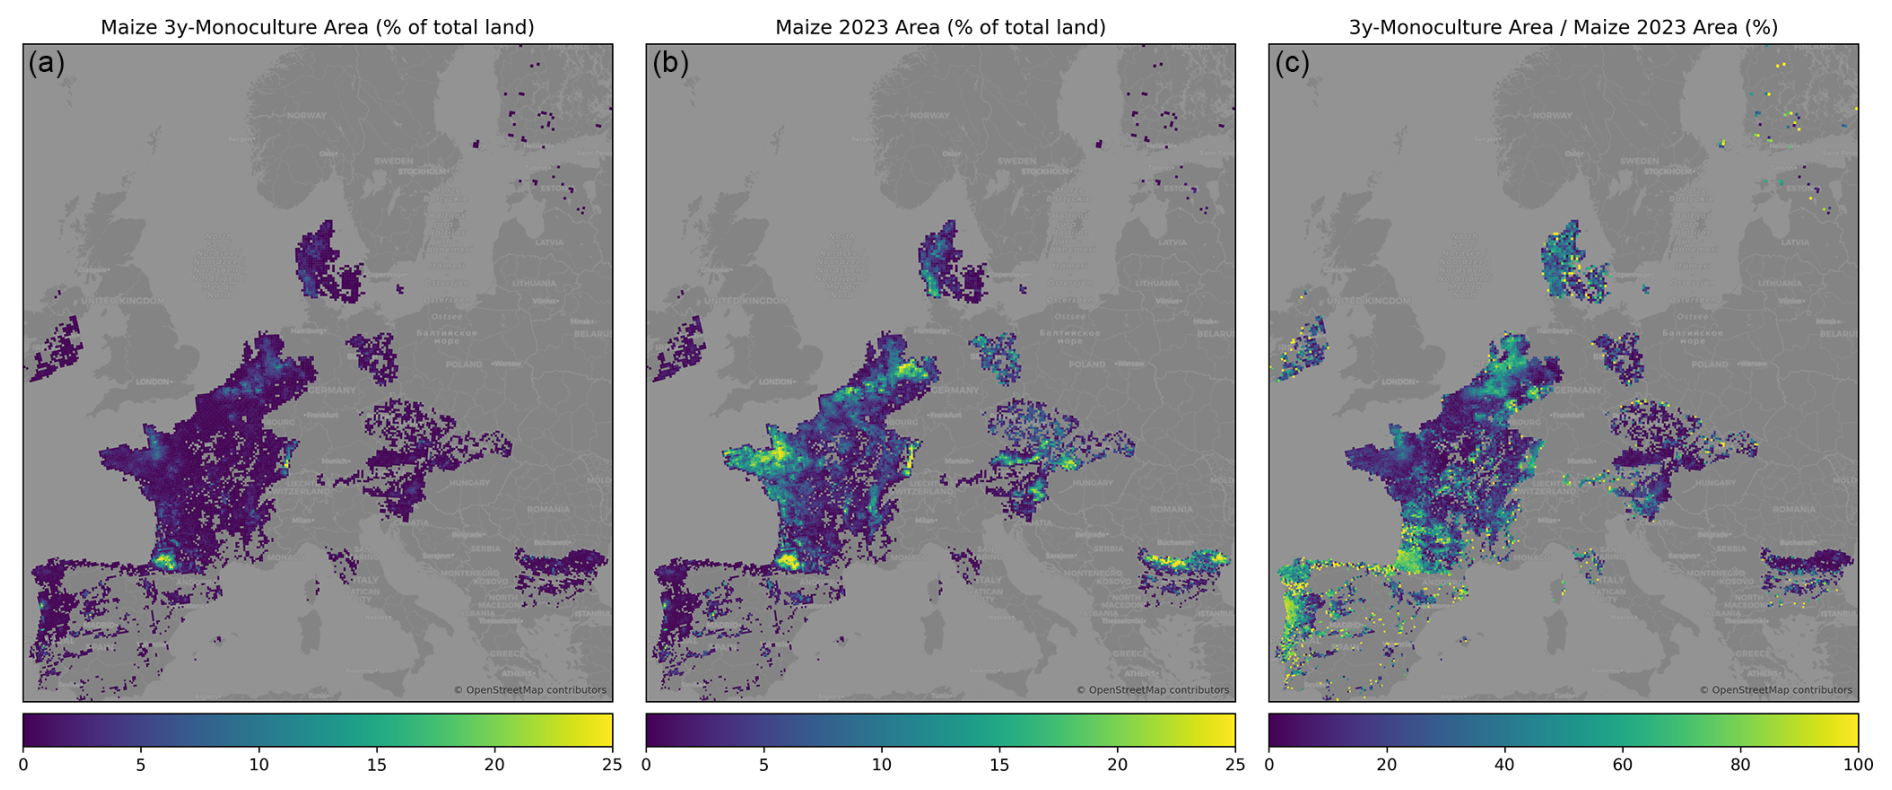
Figure 14The spatial distribution of maize monoculture for European countries in the EuroCrops v2.0 data set, aggregated to a 10 km grid. (a) The % of land with a 3-year maize monoculture for the period 2021–2023. (b) The % of maize cultivated in 2023. (c) The % of 3-year maize monoculture in areas cultivated with maize in 2023.
This paper provides an update to the previous EuroCrops data set (Schneider et al., 2023), which harmonized GSA data for 16 countries for the year 2021. In particular, we extended the temporal coverage to include GSA data available for a minimum of three years. The advantage of the temporal extension is for applications such as crop rotations as demonstrated in Sect. 3.3, which can be used to identify areas with highly intensive monocultural practices versus more soil friendly crop rotation schemes (Ouda et al., 2018). Temporal trends in crop diversity (Machefer et al., 2024) can also be determined, and the harmonized EuroCrops v2.0 data set can be used to verify crop rotation patterns from remote sensing such as those derived from the Copernicus VLCC (Wegscheider et al., 2024) crop type layers to which links have been made through HCAT4. It would also be possible to compare the data set to other crop data sets such as the coarser resolution CROPGRIDS, which is a global georeferenced data sets of 173 crops for 2020 (Tang et al., 2024).
Another advance in this paper has been the extension of HCAT2 (Schneider et al., 2025) and HCAT3 (Li et al., 2025) to HCAT4, where we introduced the concept of “dimension” with two use cases: usage and seasonality, although more dimensions could be added in the future. Note that usage was inferred from the translated crop names rather than full crop descriptions provided by EU MS. Morover, to keep this dimension manageable, we used 10 classes (and one class for no usage specified), which means that many different types of usage are merged under a single term, e.g., processing is used for both making raisins but also wine production. Nevertheless, the data set remains dynamic, which means that any changes to the mapping table can be easily applied to the full database.
HCAT was developed because each EU MS uses their own crop classification system, which is usually in their own native language (Schneider et al., 2025). In addition to the benefit of HCAT for harmonizing the GSA across EU MS, HCAT is now being used in other applications such as remotely sensed classification of crop type maps for France and the Netherlands (Barriere et al., 2024), classification of major vegetation types present during winter in Europe (Gackstetter et al., 2024) and the use of hyperspectral data to improve crop type mapping in France (Li et al., 2025).
In addition to EuroCrops v2.0, there are other similar initiatives worth noting that serve different purposes. One of them, the GSA Quality Assessment (GSA QA) refers to the annual quality checks that are done by the MS following a common methodology set by the European Commission (EC) to ensure the quality of the system. This process ensures that farmers' declared parcel boundaries and crop labels meet stringent accuracy and consistency criteria, yielding high data reliability for administrative purposes and allows claims for money to be audited. This data set includes GSA data from all MS and is not published openly.
In contrast, The SAIS (Spatial Agricultural Information System) pilot project seeks to foster discoverability and availability of the IACS data managed and curated in a subsidiary way by the Member States. To demonstrate efficient access and effective reuse of these data, SAIS harvests and harmonizes them into a unified schema (Wojda et al., 2023) and further develops soil-related use-cases. SAIS is designed to integrate additional datasets (e.g., soil and environmental data) to support policy analysis, aiming for broad EU coverage with a consistent data structure. While SAIS promises extensive coverage and improved interoperability, it is still under development, and the data availability, quality and harmonization will depend on the successful alignment of diverse national inputs. Finally, to improve IACS data availability and reuse, a first version of the Technical Guidelines were developed supporting the Member States in the IACS Data Sharing Process as proposed by DG AGRI in collaboration with DG ENV and DG CLIMA and DG JRC. Currently, to align with a dynamic policy context on data, the TG are under revision and will be streamlined and published soon.
Another initiative is the Europe-LAND project (Horizon Europe), which has already compiled a harmonized IACS inventory for many countries (Jänicke et al., 2025). It offers a multi-year coverage (up to 17 years for 18 countries in its public release) and employs the HCAT taxonomy. Europe-LAND’s strength lies in its large scale and inclusion of farm-level details (e.g., including farm identifiers and organic status) where available, but it also faces some limitations: not all country data could be openly shared due to GDPR and data-sharing restrictions, and an older version of HCAT was used that does not differentiate between crop usage. Moreover, we have implemented a temporal checking process to ensure consistency in boundaries over time to ensure uniqueness and with no overlapping. Nevertheless, the data set of Jänicke et al. (2025) provides another source of GSA data that can be used for different applications.
However, the EuroCrops v2.0 data set also has limitations that need to be acknowledged. First, data are missing for several EU MS and the number of years available varies between MS, with some having as many as 14 years while other MS have less than 3 years of openly available data and were therefore excluded. In addition, no overseas regions are currently included such as the Canary Islands, Madeira, French overseas islands, etc., and two NUTS3 regions were missing data in 2021: León (ES413) in 2023, Jaén (ES616). Secondly, the focus is mostly on European crops and does not cover tropical crops very well (e.g., the crop prickly pear was too uncommon to justify its own class in the taxonomy so was mapped to the “Other” class instead).
A third limitation is related to inconsistency in crop codes (e.g., in Czechia, Germany, and the Netherlands as shown in Sect. 2.2.4) or the absence of crop codes (e.g., in Slovakia) where new codes were created, which limits the interoperability with other data sets. In addition, we assigned only a single crop code to each parcel even though some countries like Portugal and Austria allow farmers to declare multiple crops in one parcel for double cropping, intercropping or crops grown at sub-parcel level (but the sub-parcel geometry is not available to make this separation). Some countries like Ireland had multiple declarations for the same parcel where the shares were not adjusted to reflect the sharing, which occurred in their GSA until 2022. From 2023 onward, the shares were adjusted properly. These types of issues had to be dealt with during the cleaning process.
We also harmonized the crop codes over time by selecting the most recent one and then applying this code historically to previous years. The changes in crop codes over time can be due to an error, e.g., a misspelling in the name or due to genuine changes made to the national nomenclature as a result of changes in CAP policy. These types of temporal inconsistencies occurred in less than 1 % of the data for AT, BE2, DEA, DK, ITI1, 1 %–5 % for CZ, DE4, ES, NL, 14 % for SI and 21 % for PT. Another type of temporal inconsistency that occurred in more recent GSA data is when MS added features related to eco-schemes, in particular, Landscape Features (LF). LF are not properly captured in EuroCrops v2.0 and are mostly assigned to the class “not_known_and_other” or “unmaintained”. LF can also be mixed in with other classes or even coded as NULL so this could be improved in the future.
Finally, the data set represents only declared parcels, which can be a limitation for some applications. In France, the non-declared agricultural areas have been determined using Earth Observation data (Cantelaube and Lardot, 2022). While the main agricultural areas show few non-declared areas, the gap can be larger for pastures and in protected areas such as Natura 2000 sites (Pointereau et al., 2010), or crops with high economic value. For instance in France, 25 % of the vineyard areas were missing in the 2022 GSA.
The EuroCrops v2.0 data set (European Commission. Joint Research Centre, 2026) is available under https://doi.org/10.2905/b9fb9e67-78a9-4327-9d59-39a928d812d3 and for downloading from the following site: https://jeodpp.jrc.ec.europa.eu/ftp/jrc-opendata/DRLL/EuroCropsV2/ (last access: 1 June 2026). The data are provided in geoparquet format for each country and each year in the CRS ESPG:3035. In addition, there are mapping tables that link HCAT4 to the other nomenclatures (AGRIPROD, HRL and EAGLE). See Fig. 2 for an example of the database structure.
The code for downloading the data, building the database, ingesting the data into a PostGIS database and for generating the output files is available in github at: https://github.com/Martincccc/EuroCropsV2 (Claverie et al., 2026).
EuroCrops v2.0 provides a highly curated, harmonized data set for parcel-level crop declarations, focusing on openly available GSA data. It covers 18 paying agencies with at least three consecutive years of data, using the latest HCAT4 taxonomy, which adds crop usage and seasonality as new dimensions and is an update to the crop taxonomy developed by Schneider et al. (2023). The data quality of the EuroCrops v2.0 data set has been enhanced by cleaning procedures (i.e., removing overlapping/duplicate parcels and ensuring consistent parcel boundaries over time) and by linking to other classification systems (e.g., LUCAS, the IFS (AGRIPROD), the FADN and classification systems from the newly released remotely sensed product Copernicus High Resolution Layer on Crop Types). EuroCrops v2.0 delivers semantic harmonization and is fully open access, but its coverage is limited to those countries that provide public data (leaving out many MS or years where data are unavailable).
HCAT4 is also contributing to the harmonization of crop code lists at the EU level, where the work began in 2024 by the reference data management coordination group, whose aim is to build consensus on a corporate reference data management policy, agree a set of principles for the management of reference data assets and to establish an initial set of reference data assets to be shared for common usage across the EC (European Commission, 2019). The current lack of formal alignment between relevant assets including agricultural products hampers interoperability. The work on EU wide crop code list harmonization is still ongoing.
Harmonized datasets like EuroCrops and Europe-LAND can also play a key role in supporting the evolution of the Performance Monitoring and Evaluation Framework (PMEF) under the CAP 2023–2027. The PMEF relies on consistent indicators and data to measure progress toward CAP objectives (such as crop diversity, sustainable practices, and environmental targets). EuroCrops v2.0 provides high-resolution, cross-country data on what crops are grown and where, which can be used to derive indicators for crop rotation frequency, landscape diversity, or organic farming coverage. By aggregating parcel-level information to regional or national scales, EuroCrops v2.0 data can help to validate and complement official statistics, thereby strengthening the evidence base for PMEF reporting. Similarly, the multi-annual harmonized data from Europe-LAND and insights from GSA QA (on the quality and completeness of declarations) can inform performance indicators by identifying trends and anomalies in farmers' land use over time. These data sets also align with new data requirements in EU agricultural policy. For instance, the establishment of the Farm Sustainability Data Network (FSDN) from 2025 will expand data collection on environmental and social aspects of farming (e.g., nutrient management, soil health, crop rotations). EuroCrops v2.0 and related harmonized IACS data sets can complement the FSDN by linking detailed crop-type information and parcel geometries with farm-level sustainability indicators, thus offering a more granular context for evaluating farm performance and agri-environmental measures.
As more data become available due to increased sharing by EU MS and/or the legal requirement for MS to release data sets of High Value, which includes GSA data, the data could be harmonized using the process outlined here and contribute to a growing time series of valuable in situ data on crops grown in the EU.
The supplement related to this article is available online at https://doi.org/10.5194/essd-18-4075-2026-supplement.
Conceptualization: MC, AC, MVdV; Data curation: MC, AC, RK; Formal analysis: MC, AC, JOS; Funding acquisition: MC, MVdV; Investigation: MC, AC; Methodology: MC, AC, MVdV; Project administration: MVdV; Resources: MC, AC; Software: MC, AC; Supervision: MC, MVdV; Validation: MC, AC; Visualization: MC, AC; Writing – original draft: MC, AC, RdA, HR, LS, MVdV; Writing – review & editing: All.
The contact author has declared that none of the authors has any competing interests.
Publisher's note: Copernicus Publications remains neutral with regard to jurisdictional claims made in the text, published maps, institutional affiliations, or any other geographical representation in this paper. The authors bear the ultimate responsibility for providing appropriate place names. Views expressed in the text are those of the authors and do not necessarily reflect the views of the publisher.
The authors would like to thank the Paying Agencies in the various Member States and regions that have made the Geo Spatial application data available. The authors look forward to seeing the GSA data published by the remaining Paying Agencies following the implementation of the High-Value Dataset regulation ((EU) 2023/138). The authors further acknowledge the JRC Big Data Analytics Platform (BDAP) for providing the computational infrastructure and processing capabilities that supported this research.
This paper was edited by Francesco N. Tubiello and reviewed by two anonymous referees.
Arnold, S., Kosztra, B., Banko, G., Smith, G., Hazeu, G., Bock, M., and Valcarcel, N.: The EAGLE concept – A vision of a future European Land Monitoring Framework, in: EARSeL Symposium Proceedings “Towards Horizon 2020”, https://www.earsel.org/symposia/2013-symposium-Matera/pdf_proceedings/EARSeL-Symposium-2013_10_2 _Arnold.pdf (last access: 1 June 2026), 2013. a, b
Barbottin, A., Bouty, C., and Martin, P.: Using the French LPIS database to highlight farm area dynamics: The case study of the Niort Plain, Land Use Policy, 73, 281–289, https://doi.org/10.1016/j.landusepol.2018.02.012, 2018. a
Barriere, V., Claverie, M., Schneider, M., Lemoine, G., and d'Andrimont, R.: Boosting crop classification by hierarchically fusing satellite, rotational, and contextual data, Remote Sens. Environ., 305, 114110, https://doi.org/10.1016/j.rse.2024.114110, 2024. a, b
Cantelaube, P. and Lardot, B.: Construction d'une base de données géographiques exhaustive à échelle fine sur l'occupation agricole du sol: le “RPG complété”, hal-03818008f, INRAE, https://hal.inrae.fr/hal-03818008v1 (last access: 1 June 2026), 2022. a
Chantellier, V., Détang-Dessendre, C., and Guyomard, H.: A brief history of the CAP, in: Evolving the Common Agricultural Policy for Tomorrow's Challenges, edited by: Détang-Dessendre, C. and Guyomard, H., editions Quae, Versailles, 21–35, https://library.oapen.org/bitstream/handle/20.500.12657/63165/9782759237159.pdf (last access: 1 June 2026), 2022. a
Claverie, M., D'Andrimont, R., Donezar, U., Forslund, L., and Van der Velde, M.: Assessing the quality of new HRL Crop Types: A comparative analysis with farmers' declarations across the European Union, in: EO for Agriculture Under Pressure Workshop 2024, ESA-ESRIN, Frascati, Italy, 2024. a
Claverie, M., Yordanov, M., Chan, A. and Ramos, H.: EuroCropsV2, GitHub [code], https://github.com/Martincccc/EuroCropsV2 (last access: 1 June 2026), 2026. a
d'Andrimont, R., Yordanov, M., Martinez-Sanchez, L., Eiselt, B., Palmieri, A., Dominici, P., Gallego, J., Reuter, H. I., Joebges, C., Lemoine, G., et al.: Harmonised LUCAS in-situ land cover and use database for field surveys from 2006 to 2018 in the European Union, Sci. Data, 7, 1–15, 2020. a, b
d'Andrimont, R., Verhegghen, A., Lemoine, G., Kempeneers, P., Meroni, M., and Van der Velde, M.: From parcel to continental scale – A first European crop type map based on Sentinel-1 and LUCAS Copernicus in-situ observations, Remote Sens. Environ., 266, 112708, https://doi.org/10.1016/j.rse.2021.112708, 2021. a
d'Andrimont, R., Claverie, M., Kempeneers, P., Muraro, D., Yordanov, M., Peressutti, D., Batič, M., and Waldner, F.: AI4Boundaries: an open AI-ready dataset to map field boundaries with Sentinel-2 and aerial photography, Earth Syst. Sci. Data, 15, 317–329, https://doi.org/10.5194/essd-15-317-2023, 2023. a, b
EU Copernicus: EAGLE Matrix, https://land.copernicus.eu/en/technical-library/eagle-matrix-3_2 (last access: 1 June 2026), 2023a. a
EU Copernicus: OBSERVER: Vegetated Land Cover Characteristics (VLCC): A New Era of Land Monitoring, https://www.copernicus.eu/en/news/news/observer-vegetated-land-cover-characteristics-vlcc-new-era-land -monitoring (last access: 1 June 2026), 2023b. a
European Commission: Corporate Reference Data Management policy in the European Commission, Publications Office of the European Union, https://op.europa.eu/en/web/eu-vocabularies/corporate-reference-data-management (last access: 1 June 2026), 2019. a
European Commission: Integrated Administration and Control System (IACS), https://agriculture.ec.europa.eu/common-agricultural-policy/financing-cap/assurance-and-audit/managing-payments_en#elements-of-the-iacs (last access: 1 June 2026), 2021. a
European Commission: Commission delegated regulation (EU) 2022/1172 of 4 May 2022 supplementing Regulation (EU) 2021/2116 of the European Parliament and of the Council with regard to the integrated administration and control system in the common agricultural policy and the application and calculation of administrative penalties for conditionality, https://eur-lex.europa.eu/eli/reg_del/2022/1172/oj (last access: 1 June 2026), 2022. a
European Commission: Commission implementing regulation (EU) 2023/138 of 21 December 2022 laying down a list of specific high-value datasets and the arrangements for their publication and re-use, https://eur-lex.europa.eu/eli/reg_impl/2023/138/oj (last access: 1 June 2026), 2023a. a
European Commission: The common agricultural policy: 2023-27, https://agriculture.ec.europa.eu/common-agricultural-policy/cap-overview/cap-2023-27_en (last access: 1 June 2026), 2023b. a
European Commission: Farm accountancy data network, https://agriculture.ec.europa.eu/data-and-analysis/farm-structures-and-economics/fadn_en (last access: 1 June 2026), 2023c. a
European Commission. Joint Research Centre: EuroCropsV2 [Dataset], European Commission. Joint Research Centre [data set], https://doi.org/10.2905/b9fb9e67-78a9-4327-9d59-39a928d812d3, 2026. a, b
European Network for Rural Development: The Farm Accountancy Data Network, https://ec.europa.eu/enrd/evaluation/back-basics/farm-accountancy-data-network_en.html (last access: 1 June 2026), 2020. a
Eurostat: Land cover statistics, https://ec.europa.eu/eurostat/statistics-explained/index.php?title=Land_cover_statistics (last access: 1 June 2026), 2021. a
Eurostat: LUCAS 2022 (Land Use/Cover Area Frame Survey), Technical reference document C1, Instructions for Surveyors, https://ec.europa.eu/eurostat/documents/205002/13686460/C1-LUCAS-2022.pdf (last access: 1 June 2026), 2022a. a
Eurostat: LUCAS 2022 (Land Use/Cover Area Frame Survey), Technical reference document C3 Classification (Land cover & Land use), Tech. rep., Eurostat, https://ec.europa.eu/eurostat/documents/205002/13686460/C3-LUCAS-2022.pdf (last access: 1 June 2026), 2022b. a
Eurostat: Annual crop statistics, Handbook, 2023 Edition, Tech. rep., Eurostat, https://circabc.europa.eu/ui/group/a9c5638c-8940-4e25-b6de-02ace3e161e7/library/af082921-76f3-4a3c-bdb8-484c4ed9afd2/details (last access: 1 June 2026), 2023a. a, b, c
Eurostat: Farm Accountancy Data Network, https://ec.europa.eu/eurostat/statistics-explained/index.php?title=Farm_structure_survey_-_administrative_sources (last access: 1 June 2026), 2023b. a
Eurostat: EU Vocabularies. Agricultural products (AGRIPROD), https://op.europa.eu/en/web/eu-vocabularies/concept-scheme/-/resource?uri=http://data.europa.eu/3t3/agriprod/agriprod (last access: 1 June 2026), 2024a. a, b
Eurostat: Farm structure survey – administrative sources, https://ec.europa.eu/eurostat/statistics-explained/index.php?title=Farm_structure_survey_-_administrative_sources (last access: 1 June 2026), 2024b. a, b, c
Eurostat: NACE Rev. 2.1 – Statistical classification of economic activities in the European Union, 2025 Edition, Manuals and Guidelines, Publications Office of the European Union, Luxembourg, https://ec.europa.eu/eurostat/web/products-manuals-and-guidelines/w/ks-gq-24-007 (last access: 1 June 2026), 2025a. a
Eurostat: Code lists, https://ec.europa.eu/eurostat/web/metadata/code-lists (last access: 20 February 2025), 2025b. a
Eurostat: Agriculture Database, https://ec.europa.eu/eurostat/web/agriculture/database (last access: 24 July 2024), 2025c. a
Eurostat: Reference metadata, Crop production (apro_cp), https://ec.europa.eu/eurostat/cache/metadata/en/apro_cp_esms.htm#shortsource_typeDisseminated (last access: 1 June 2026), 2025d. a
Gackstetter, D., Körner, M., and Yu, K.: Approaching holistic crop type mapping in Europe through winter vegetation classification and the Hierarchical Crop and Agriculture Taxonomy, Int. J. Appl. Earth Obs. Geoinf., 134, 104159, https://doi.org/10.1016/j.jag.2024.104159, 2024. a
Ghassemi, B., Izquierdo-Verdiguier, E., Verhegghen, A., Yordanov, M., Lemoine, G., Moreno Martínez, A., De Marchi, D., Van Der Velde, M., Vuolo, F., and d'Andrimont, R.: European Union crop map 2022: Earth observation's 10-meter dive into Europe's crop tapestry, Sci. Data, 11, 1048, https://doi.org/10.1038/s41597-024-03884-y, 2024. a
Holden, P., Davis, T., Holmes, C., Senaras, C., and Wania, A.: RapidCrops: A pan-European label dataset for large-scale crop classification, Zenodo [data set], https://doi.org/10.5281/zenodo.15166359, 2025. a
Jänicke, C., Petersen, K. A., Schmidts, P., Müller, D., and Jepsen, M. R.: Field and farm-level data on agricultural land use for the European Union, Sci. Data, 12, 1050, https://doi.org/10.1038/s41597-025-05210-6, 2025. a, b, c, d
Lampach, N., Skøien, J. O., Ramos, H., Gaffuri, J., Koeble, R., See, L., and Van Der Velde, M.: Statistical atlas of European agriculture: gridded data from the agricultural census 2020 and the spatial distribution of CAP contextual indicators, Earth Syst. Sci. Data, 17, 3893–3919, https://doi.org/10.5194/essd-17-3893-2025, 2025. a
Li, W., Liang, S., Zhang, Y., Liu, L., Chen, K., Chen, Y., Ma, H., Xu, J., Ma, Y., Guan, S., and Shi, Z.: Fine-grained hierarchical crop type classification from integrated hyperspectral EnMAP data and multispectral Sentinel-2 time series: A large-scale dataset and dual-stream transformer method, arXiv [perprint], arXiv:2506.06155 [cs], https://doi.org/10.48550/arXiv.2506.06155, 2025. a, b
Machefer, M., Zampieri, M., Van Der Velde, M., Dentener, F., Claverie, M., and d'Andrimont, R.: Earth Observation based multi-scale analysis of crop diversity in the European Union: First insights for agro-environmental policies, Agr. Ecosyst. Environ., 374, 109143, https://doi.org/10.1016/j.agee.2024.109143, 2024. a
Ouda, S., Zohry, A. E.-H., and Noreldin, T.: Crop Rotation: An Approach to Secure Future Food, Springer International Publishing, Cham, ISBN 978-3-030-05350-5, https://doi.org/10.1007/978-3-030-05351-2, 2018. a
Pointereau, P., Coulon, F., Jiguet, F., Doxa, A., Paracchini, M.-L., and Terres, J.-M.: Les systèmes agricoles à haute valeur naturelle en France métropolitaine, https://solagro.org/images/imagesCK/files/article_HVN_INRA.pdf (last access: 1 June 2026), 2010. a
Reumaux, R., Chopin, P., Bergkvist, G., Watson, C. A., and Öborn, I.: Land Parcel Identification System (LPIS) data allows identification of crop sequence patterns and diversity in organic and conventional farming systems, Eur. J. Agron., 149, 126916, https://doi.org/10.1016/j.eja.2023.126916, 2023. a
Schneider, M., Broszeit, A., and Körner, M.: EuroCrops: A pan-european dataset for time series crop type classification, in: Proceedings of the 2021 conference on Big Data from Space, edited by: Soille, P., Loekken, S., and Albani, S., Publications Office of the European Union, Luxembourg, https://data.europa.eu/doi/10.2760/125905 (last access: 1 June 2026), 2021. a
Schneider, M., Schelte, T., Schmitz, F., and Körner, M.: EuroCrops: The largest harmonized open crop dataset across the European Union, Sci. Data, 10, 612, https://doi.org/10.1038/s41597-023-02517-0, 2023. a, b, c, d, e
Schneider, M., Gackstetter, D., Prexl, J., Meyer, S. T., and Körner, M.: Advancing transnational assessments of biodiversity drivers in European agriculture with an updated hierarchical crop and agriculture taxonomy (HCAT), npj Sustain. Agricult., 3, 3, https://doi.org/10.1038/s44264-024-00037-x, 2025. a, b
Skøien, J. O., Lampach, N., Ramos, H., Seljak, R., Koeble, R., See, L., and van der Velde, M.: A flexible approach for statistical disclosure control in geospatial data, J. Geogr. Syst., 27, 341–367, https://doi.org/10.1007/s10109-025-00472-5, 2025. a
Tang, F. H. M., Nguyen, T. H., Conchedda, G., Casse, L., Tubiello, F. N., and Maggi, F.: CROPGRIDS: a global geo-referenced dataset of 173 crops, Sci. Data, 11, 413, https://doi.org/10.1038/s41597-024-03247-7, 2024. a
Van Tricht, K., Degerickx, J., Gilliams, S., Zanaga, D., Battude, M., Grosu, A., Brombacher, J., Lesiv, M., Bayas, J. C. L., Karanam, S., Fritz, S., Becker-Reshef, I., Franch, B., Mollà-Bononad, B., Boogaard, H., Pratihast, A. K., Koetz, B., and Szantoi, Z.: WorldCereal: a dynamic open-source system for global-scale, seasonal, and reproducible crop and irrigation mapping, Earth Syst. Sci. Data, 15, 5491–5515, https://doi.org/10.5194/essd-15-5491-2023, 2023. a
Wegscheider, S., Stumpf, A., Siegert, C., Acar, E., De Roo, B., Gasber, T., and Faucqueur, L.: Copernicus Land Monitoring Service – High Resolution Layer – Vegetated Land Cover Characteristics, D1.12 HRL VLCC Product User Manual, Tech. rep., European Environment Agency, Denmark, Copenhagen, https://library.land.copernicus.eu/products/High_Resolution_Layer_Croplands_2017-present_PUM_v2.html (last access: 1 June 2026), 2024. a, b
Wojda, P., Escrui Paradell, J., Minghini, M., Kotsev, A., Toth, K., Schillaci, C., Simoes Vieira, D., Matthews, F., De Rosa, D., Martin Jimenez, J., De Medici, D., Scarpa, S., and Jones, A.: IACS data sharing project, JRC Technical Report, JRC, European Commission, Ispra, Italy, https://publications.jrc.ec.europa.eu/repository/handle/JRC132427 (last access: 1 June 2026), 2023. a