the Creative Commons Attribution 4.0 License.
the Creative Commons Attribution 4.0 License.
 | 15 Jun 2026
An operational global L-band soil moisture and vegetation optical depth dataset from optimized 40° SMOS brightness temperatures for 2010–2024
Zanpin Xing
Frédéric Frappart
Gabrielle De Lannoy
Thomas Jagdhuber
Jian Peng
Lei Fan
Hongliang Ma
Lanka Karthikeyan
Xiangzhuo Liu
Mengjia Wang
Yongqin Liu
Jean-Pierre Wigneron
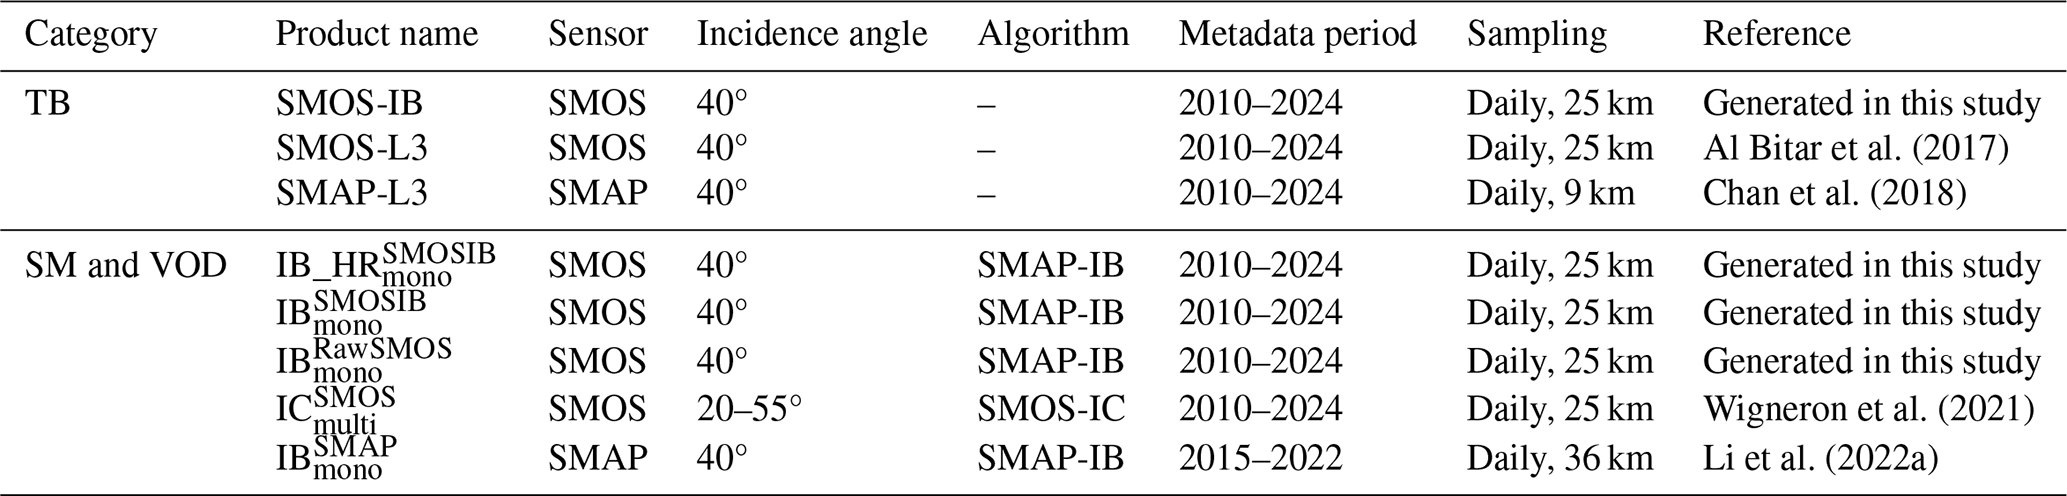
The Soil Moisture and Ocean Salinity (SMOS) mission delivers the first multi-angular L-band observations for retrieving global soil moisture (SM) and vegetation optical depth (VOD), two critical variables for understanding terrestrial water and carbon cycles. However, the combined effects of non-identical fields of view and aliasing in multi-angular SMOS brightness temperature (TB) observations can introduce noise and biases when the TBs are averaged to a nominal incidence angle, as done in the SMOS L3 dataset, thereby degrading land parameter retrievals. To address this issue, an optimized SMOS TB dataset was initially produced at a fixed 40° incidence angle, consistent with the Soil Moisture Active Passive (SMAP) mission. We then developed the first SMOS mono-angular SM and VOD products designed to achieve performance comparable to SMAP and improved relative to conventional multi-angle SMOS retrievals. The 40° TB optimization was performed using the L-band Microwave Emission of the Biosphere (L-MEB) model, and the inversion relied on the SMAP-INRAE-BORDEAUX (SMAP-IB) algorithm, yielding a global 40° SMOS TB record and associated SM and VOD products for 2010–2024 at 25 km spatial resolution, collectively referred to as SMOS-IB. Results showed that the optimized 40° TB reached a performance level comparable to SMAP and improved relative to SMOS-L3, both in its sensitivity to in-situ SM from the International Soil Moisture Network (ISMN) and in the reduction of global pixel-scale noise. When multiple evaluation metrics are considered, the SMOS-IB SM and VOD data, benefiting from the use of the optimized TB as input and a newly optimized soil roughness (Hr) parameterization, showed improved performance compared with those derived from SMOS L3 40° TB or from the multi-angular SMOS products. The SMOS-IB TB, SM and VOD products can be used for L-band algorithm development and SMAP harmonization, global drought monitoring, and studies of vegetation water and biomass dynamics. SMOS-IB is publicly available at https://doi.org/10.5281/zenodo.17647385 (Xing et al., 2025).
- Article
(27683 KB) - Full-text XML
- BibTeX
- EndNote


Large-scale, long-term datasets of soil moisture (SM) and vegetation optical depth (VOD) provide the core information needed to investigate how terrestrial water and carbon systems function. Accurate satellite-derived SM estimates are essential for various research domains, including predicting agricultural yields, assessing flood and drought conditions, managing local water resources, and analyzing worldwide hydrological processes (Al Bitar et al., 2017; Peng et al., 2021; Sadri et al., 2020). Meanwhile, VOD, a vegetation index that gauges the extinction of microwave radiation by vegetation, is a valuable parameter for tracking vegetation water status (Baur et al., 2024; Zotta et al., 2024; Wang et al., 2023) and biomass information (Fan et al., 2022b; Li et al., 2025; Wigneron et al., 2024). Due to their deep penetration through vegetation canopies and elevated sensitivity to surface dielectric properties, L-band (∼ 1.4 GHz) observations are widely considered as a preferred technique for large-scale monitoring of both SM and VOD. To date, the Soil Moisture and Ocean Salinity (SMOS) (Kerr et al., 2010; Wigneron et al., 2021) and Soil Moisture Active Passive (SMAP) (Entekhabi et al., 2010; O'Neill et al., 2021), remain two main operational satellite missions providing global passive L-band brightness temperature (TB) observations dedicated to SM and VOD retrieval.
Although the main objective of both SMOS and SMAP missions is to retrieve SM, they are based on very different types of microwave technology. The SMAP mission, launched at the beginning of 2015, is the latest operational L-band satellite mission. It acquires mono-angular TBs at a fixed 40° incidence angle, encompassing both V- and H- polarization channels (Entekhabi et al., 2010). This mono-angular configuration makes it more difficult to derive SM and VOD simultaneously, as the potential information overlap between H- and V-polarized TB can result in an ill-posed inversion issue. To address this, SMAP retrieval algorithms are generally categorized into two types based on the polarization input: single-channel algorithms (SCA) and dual-channel algorithms (DCA) (O'Neill et al., 2021; Jackson, 1993; Chan et al., 2016). Among the available DCA-type retrieval products (reviewed in Gao et al., 2021), a new mono-angular algorithm developed by INRAE Bordeaux (called SMAP-IB, hereafter referred to as ), is designed to jointly retrieve SM and VOD with high accuracy while minimizing reliance on auxiliary optical constraints (Li et al., 2022a). Evaluation has shown that the SM dataset performs comparably or favorably against other SMAP products under varying environmental conditions (Yi et al., 2023). Its VOD product also shows less saturation and stronger correlations with independent forest structure indicators (e.g., tree height, biomass) than optical-constrained VOD datasets (Li et al., 2022a; Peng et al., 2024).
Launched in late 2009, the SMOS mission was the first satellite specifically designed for L-band radiometry and has delivered continuous global observations since 2010. Through its large Y-shaped antenna, the SMOS mission measures dual-polarized and multi-angle TB across the land surface, with incidence angles spanning from 2.5 to 62.5°. This rich observational capability enables the simultaneous retrieval of SM and VOD via the L-MEB (L-band Microwave Emission of the Biosphere) model (Al Bitar et al., 2017; Wigneron et al., 2007; Wigneron et al., 2017). Currently, three primary physically-based retrieval datasets retrieved from SMOS TBs are widely used, including the Level 2 product (Kerr et al., 2012), the Level 3 product (Al Bitar et al., 2017), and SMOS-IC (hereafter referred to as ) (Fernandez-Moran et al., 2017a). Among them, is notable for its simplified algorithmic framework (Li et al., 2020) and optimized parameterizations for key radiative transfer variables (Konkathi et al., 2025; Wigneron et al., 2021), leading to demonstrated advantages in multiple comparative analyses (Al-Yaari et al., 2019; Colliander et al., 2023; Ma et al., 2019).
For both the SMOS and SMAP, the quality of the TBs is critical for the accuracy of land parameter retrievals (Martín-Neira et al., 2016; Kerr et al., 2016). SMAP, although a mono-angular instrument, is based on an advanced technology dedicated to filtering Radio-Frequency Interference (RFI) using a 40° incidence angle real-aperture radiometer (Entekhabi et al., 2010). Conversely, SMOS is based on a two-dimensional interferometric radiometer that acquires multi-angular observations but remains very sensitive to RFI effects (Oliva et al., 2016; Peng et al., 2023). Moreover, the incidence angles of SMOS vary with the distance from the swath center, ranging from 0–55° near the center to about 40–50° at the swath edges (Rodríguez-Fernández et al., 2015). At the swath edges, reconstruction noise and aliasing become more pronounced, particularly at low incidence angles within the “extended alias-free” region where sky-alias correction is applied (Martín-Neira et al., 2016). In addition, SMOS exhibits significant daily variations in its angular coverage. Aggregating multi-angular TBs into fixed 5° bins, a method used in the SMOS L3 product, can introduce considerable noise, a limitation noted in prior research (Schmitt and Kaleschke, 2018). Given these limitations, it remains unclear whether improved performance could be obtained by using improved mono-angular SMOS data rather than noisy multi-angular SMOS L3 TB data. This question is very difficult to address presently as all the SMOS products currently available differ in their retrieval algorithms, but they share one common feature: they all use multi-angular SMOS L3 TB measurements to retrieve SM and VOD, rather than using mono-angle TBs similar to SMAP's 40° incidence angle. Developing a mono-angular SMOS product is therefore of practical importance, as it would provide a consistent alternative to the current multi-angular products and enable more coherent cross-mission analyses with SMAP, particularly considering SMOS has far exceeded its initial design life.
In this context, this study aims to develop a mono-angular SMOS product focused on the simultaneous SM and VOD retrievals within the SMAP-IB algorithm framework. In parallel, we also attempted to address the following scientific questions: (i) Are SMOS retrievals based solely on 40° TB inherently less accurate than those based on multi-angle TB data? and (ii) Under a common algorithmic framework, how does the choice of TB inputs dictate the retrieval accuracy of both SM and VOD? To address these two main questions, we: (1) directly applied the SMAP-IB algorithm to SMOS L3 40° TB to retrieve ; (2) applied a fitting procedure to reduce noise in L3 40° TB (hereafter SMOS-IB TB), and then used it to generate ; (3) incorporated a refined soil roughness (Hr) scheme into SMAP-IB to obtain; (4) evaluated all resulting SM and VOD products against and , using International Soil Moisture Network (ISMN) (2016–2022) and four vegetation proxies. Comparative analyses revealed that both the TB optimization procedure and the refined Hr scheme significantly improved the retrieval performance of SM and VOD, making it comparable to SMAP. These improvements led to the development of a 25 km mono-angular SMOS-IB product suite, including optimized TB, SM, and VOD layers (i.e., ), spanning a 15-year period from 2010 to 2024. This is also the first study to generate global SM and VOD datasets simultaneously using only fitted 40° SMOS TB observations. Furthermore, the long-term optimized SMOS-IB dataset, including the harmonized TB, SM, and VOD layers, holds great potential for broader applications. The 40° TB data can be used for freeze–thaw monitoring, snow depth estimation, etc., while the consistent SM and VOD records can support long-term climate studies, large-scale hydrological modeling, and monitoring of global vegetation dynamics and carbon cycles.
2.1 SMOS Level 3 TB product
We used the SMOS Level-3 (SMOS-L3) TB product distributed by the Centre Aval de Traitement des Données (CATDS) for the years 2010–2024 (Table 1). SMOS-L3 TB provides multi-angle H- and V-polarized TBs recorded at the top of the atmosphere (Al Bitar et al., 2017). Despite the absence of atmospheric correction, the average atmospheric effect remains relatively mild globally, with ∼ 1 K (H-polarization) and ∼ 0.5 K (V-polarization) at 40° (De Lannoy et al., 2015). It should be noted that the SMOS L3 daily multi-angle TB data are obtained using a fixed 5° width binning method, with bin centers lie within the 2.5–62.5° interval. Previous studies have revealed that this approach may result in stronger short-term TB fluctuations at specific angles compared to alternative methods, such as two-step regression fitting. This ultimately increases the uncertainty in analyses or retrievals dependent on single-angle TB data (Li et al., 2022b; Peng et al., 2023; Schmitt and Kaleschke, 2018). This work employed the SMOS-L3 TB dataset (on a 25 km EASE-Grid 2.0), utilizing solely the ascending orbit (06:00 a.m. local time) TBs.
Table 1Summary of the three TB (brightness temperature) products and five SM (soil moisture) and VOD (vegetation optical depth) products used and generated in this study.
2.2 ISMN in-situ SM dataset
The ISMN in-situ SM measurements (https://ismn.geo.tuwien.ac.at/, last access: 1 October 2025) were used to evaluate the TB and satellite SM retrievals' accuracy. ISMN was considered to be the most reliable SM dataset and has been extensively utilized as a benchmark in satellite-based SM calibration and validation studies (Dorigo et al., 2021). Here, SM measurements from the 0–5 cm soil depth from 2016 to 2022 incorporating both sparse and dense in-situ networks were collected. Note that there is inherent scale mismatch between pixel-derived SM estimates and ground-based SM observation, particularly in the sparse observed networks. To maintain good data quality and minimize the issue of the spatial scale differences, only ISMN in-situ SM observations flagged as “Good” were spatially aggregated by averaging all available station observations within each respective 25 km EASE-Grid 2 cell. Ultimately, a total of 464 cells from 23 networks at a EASE-Grid 2.0 25 km scale were retained (Fig. 1 and Table A1 in the Appendix).
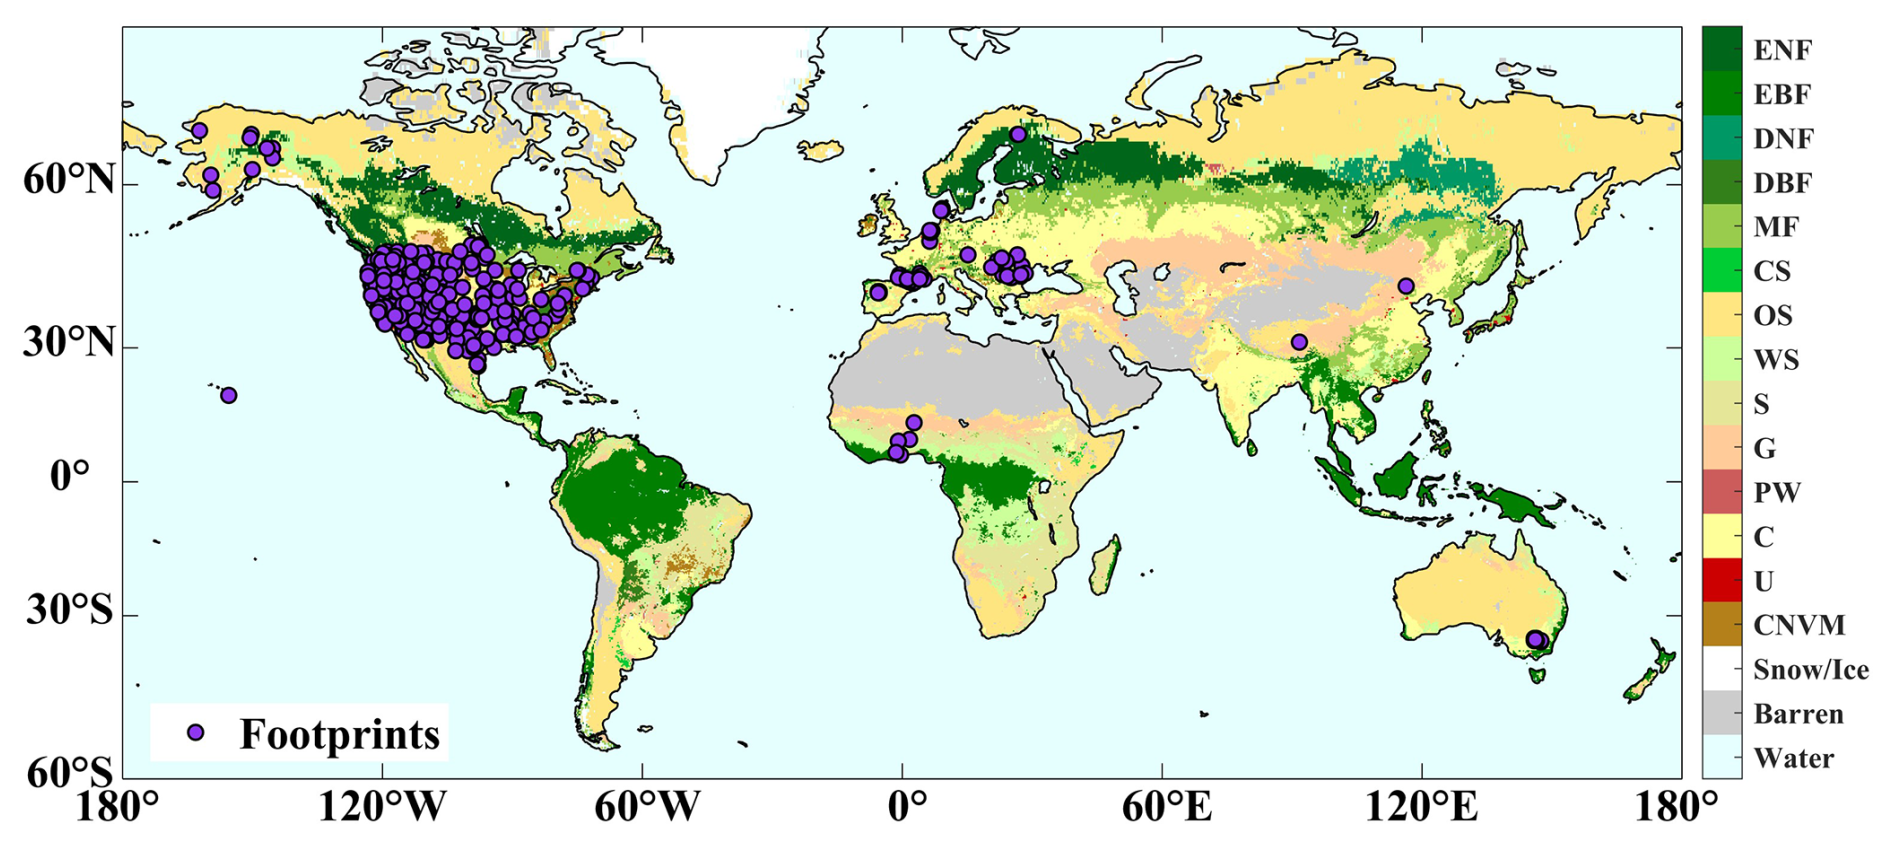
Figure 1Distribution of the SMOS (Soil Moisture and Ocean Salinity) footprints used for evaluation. The MODIS (Moderate Resolution Imaging Spectroradiometer) IGBP (International Geosphere-Biosphere Programme) land cover map was aggregated to the 25 km grid using the dominant land cover class, resulting in 17 categories: EBF (Evergreen Broadleaf Forest), ENF (Evergreen Needleleaf Forest), DNF (Deciduous Needleleaf Forest), MF (Mixed Forests), DBF (Deciduous Broadleaf Forest), OS (Open Shrublands), WS (Woody Savannas), CS (Closed Shrublands), S (Savannas), G (Grasslands), PM (Permanent Wetland), Water, CNVM (Cropland/Natural vegetation mosaics), C (Croplands), U (Urban), Snow/Ice and Barren. The locations of the ISMN (International Soil Moisture Network) in-situ sites are presented in purple dots.
2.3 Vegetation proxies for assessing VOD
Given that the validation of VOD products at large scales is hindered by the lack of a well-established reference dataset, three frequently used vegetation proxies were selected to assess the performance of the VOD retrievals (Wigneron et al., 2024), including the 1 km spatial resolution Saatchi aboveground biomass (AGB) map (Saatchi et al., 2011), 0.5° canopy height derived from Global Ecosystem Dynamics Investigation Level 1B LIDAR observations collected between April to July 2019 (Simard et al., 2011), and 1 km resolution 16 d MODIS NDVI data from 2016 to 2022 (Didan, 2021). The canopy height serves as an indicator of total vegetation biomass, and NDVI reflects the greenness and photosynthetic activity within the upper layer canopy (Li et al., 2021). To preserve high-quality observations, the pixels for MODIS NDVI data flagged as “good quality” were kept following the method of Grant et al. (2016).
In addition, this study was the first to use satellite canopy water content (CWC) data from 2016 to 2022 to validate the temporal behavior of VOD retrievals, since L-band VOD has been demonstrated to have a linear relationship with vegetation water content (Wigneron et al., 2024). The CWC product was newly developed by integrating data from Sentinel-2, Landsat-8, and MODIS satellites with a spatial resolution of 0.05° to monitor canopy vegetation water variations, which has been demonstrated to have good accuracy and reliability, thus providing a robust reference for assessing VOD data (Ma et al., 2025). The dataset was obtained through personal communication but will soon be publicly available via ESA data portal. These four vegetation parameters were standardized through projection onto the EASE-Grid 2.0 and spatially aggregated to 25 km using arithmetic mean resampling to match the SMOS grid spatial resolution. This same resampling method has also been employed in several earlier VOD studies (Li et al., 2021; Fan et al., 2019).
2.4 Additional microwave TB, SM, and VOD products used for inter-comparison
To evaluate the performance of optimized SMOS-IB TB (see method Sect. 3.1) and the , , SM and VOD retrievals, two other L-band TB data (i.e., SMOS-L3 TB and SMAP-L3 TB) and two other L-band satellite global SM and VOD datasets (i.e., and were collected (see Appendix A1).
The SMOS-L3 TB product has been detailed in Sect. 2.1. SMAP-L3 TBs were sourced from the Version 5 SMAP enhanced L3 radiometer SM product collected during the morning (06:00 a.m. local time) descending overpass for the period 2016–2022 (Chan et al., 2018). The SMAP-L3 TB observations were quality controlled based on corresponding quality flags and resampled to 25 km via weighted area averaging for consistency with the SMOS' grid resolution (Li et al., 2022b).
The and SM and VOD products at 25 km projected onto the EASE-Grid 2.0 from 2016 to 2022 were collected. (1) The corresponds to the SMOS-IC dataset, originally developed by Fernandez-Moran et al. (2017a, b), and is among the most recent SMOS products available. It was retrieved using the processed multi-angle SMOS-L3 TB dataset with quality filtering provided by the CATDS using the SMOS-IC version 2 algorithm. The 25 km SMOS-IC V2 SM and VOD data retrieved from the morning ascending orbit was utilized; (2) The was retrieved by applying the SMAP-IB algorithm to the 25 km SMAP-L3 TBs (resampled from the 9 km SMAP-L3 TB dataset) at 40° incidence angle (Li et al., 2022b). Readers refer to Wigneron et al. (2021) and Li et al. (2022a) for detailed information about the SMOS-IC and SMAP-IB algorithm.
All datasets were evaluated specifically at the 06:00 a.m. local overpass time to capitalize on optimal surface thermal equilibrium conditions characteristic of early morning periods (Entekhabi et al., 2010), following rigorous quality-controlled preprocessing that adhered to each product's specific flagging criteria. For example, the and unreliable retrievals were effectively removed based on two quality control thresholds: “Scene Flags” >1 and “TB-RMSE” >8 K (Wigneron et al., 2021).
2.5 Ancillary datasets
The MODIS IGBP land cover classification (Friedl and Sulla-Menashe, 2022) was employed to analyze SM comparison results across different land cover types. Daily precipitation data at a resolution of 0.1°, sourced from the ERA5-Land reanalysis dataset, was collected and applied to analyze seasonal variation of the SM and VOD datasets (Muñoz-Sabater et al., 2021).
To obtain robust evaluation results, we additionally employed Triple Collocation Analysis (TCA), which provides an independent error estimate and is not affected by the representativeness errors originating from the spatial discrepancy between site points and satellite footprints (see Sect. 3.1.3). For this purpose, the active microwave Advanced Scatterometer (ASCAT) surface SM product and the model-based Global Land Data Assimilation System (GLDAS-Noah) SM product from 2016 to 2022 were obtained (Rodell et al., 2004). (1) ASCAT, onboard the Meteorological Operation-A, -B and -C satellite, acquires C-band V-polarized backscatter measurements on both ascending and descending orbits (Wagner et al., 2006). The ASCAT SM product is generated from MetOp satellite backscatter measurements using a TU Wien algorithm (Wagner et al., 2013). The ASCAT CDR(Climate Data Record) v7-H119 SM dataset at 12.5 km resolution was used, with its relative SM values converted to volumetric units (m3 m−3) based on soil porosity from the Harmonized World Soil Database (HWSD). (2) The GLDAS-Noah SM product, with 3-hourly temporal and 0.25° spatial resolution, is derived from the Noah Land Surface Model within the Global Land Data Assimilation System (Rodell et al., 2004). The GLDAS-Noah SM (kg m−2) was then converted to volumetric unit (m3 m−3) following the method of Cui et al. (2018) by dividing by water density and the corresponding soil layer thickness, with daily average SM computed for analysis. Both the ASCAT and GLDAS-Noah SM were aggregated to 25 km resolution by applying the arithmetic mean resampling to match the SMOS grid resolution.
Figure 2 illustrates the methodological framework, encompassing three major components: SMOS-L3 multi-angle TB optimization, SM and VOD inversion, and performance evaluation.
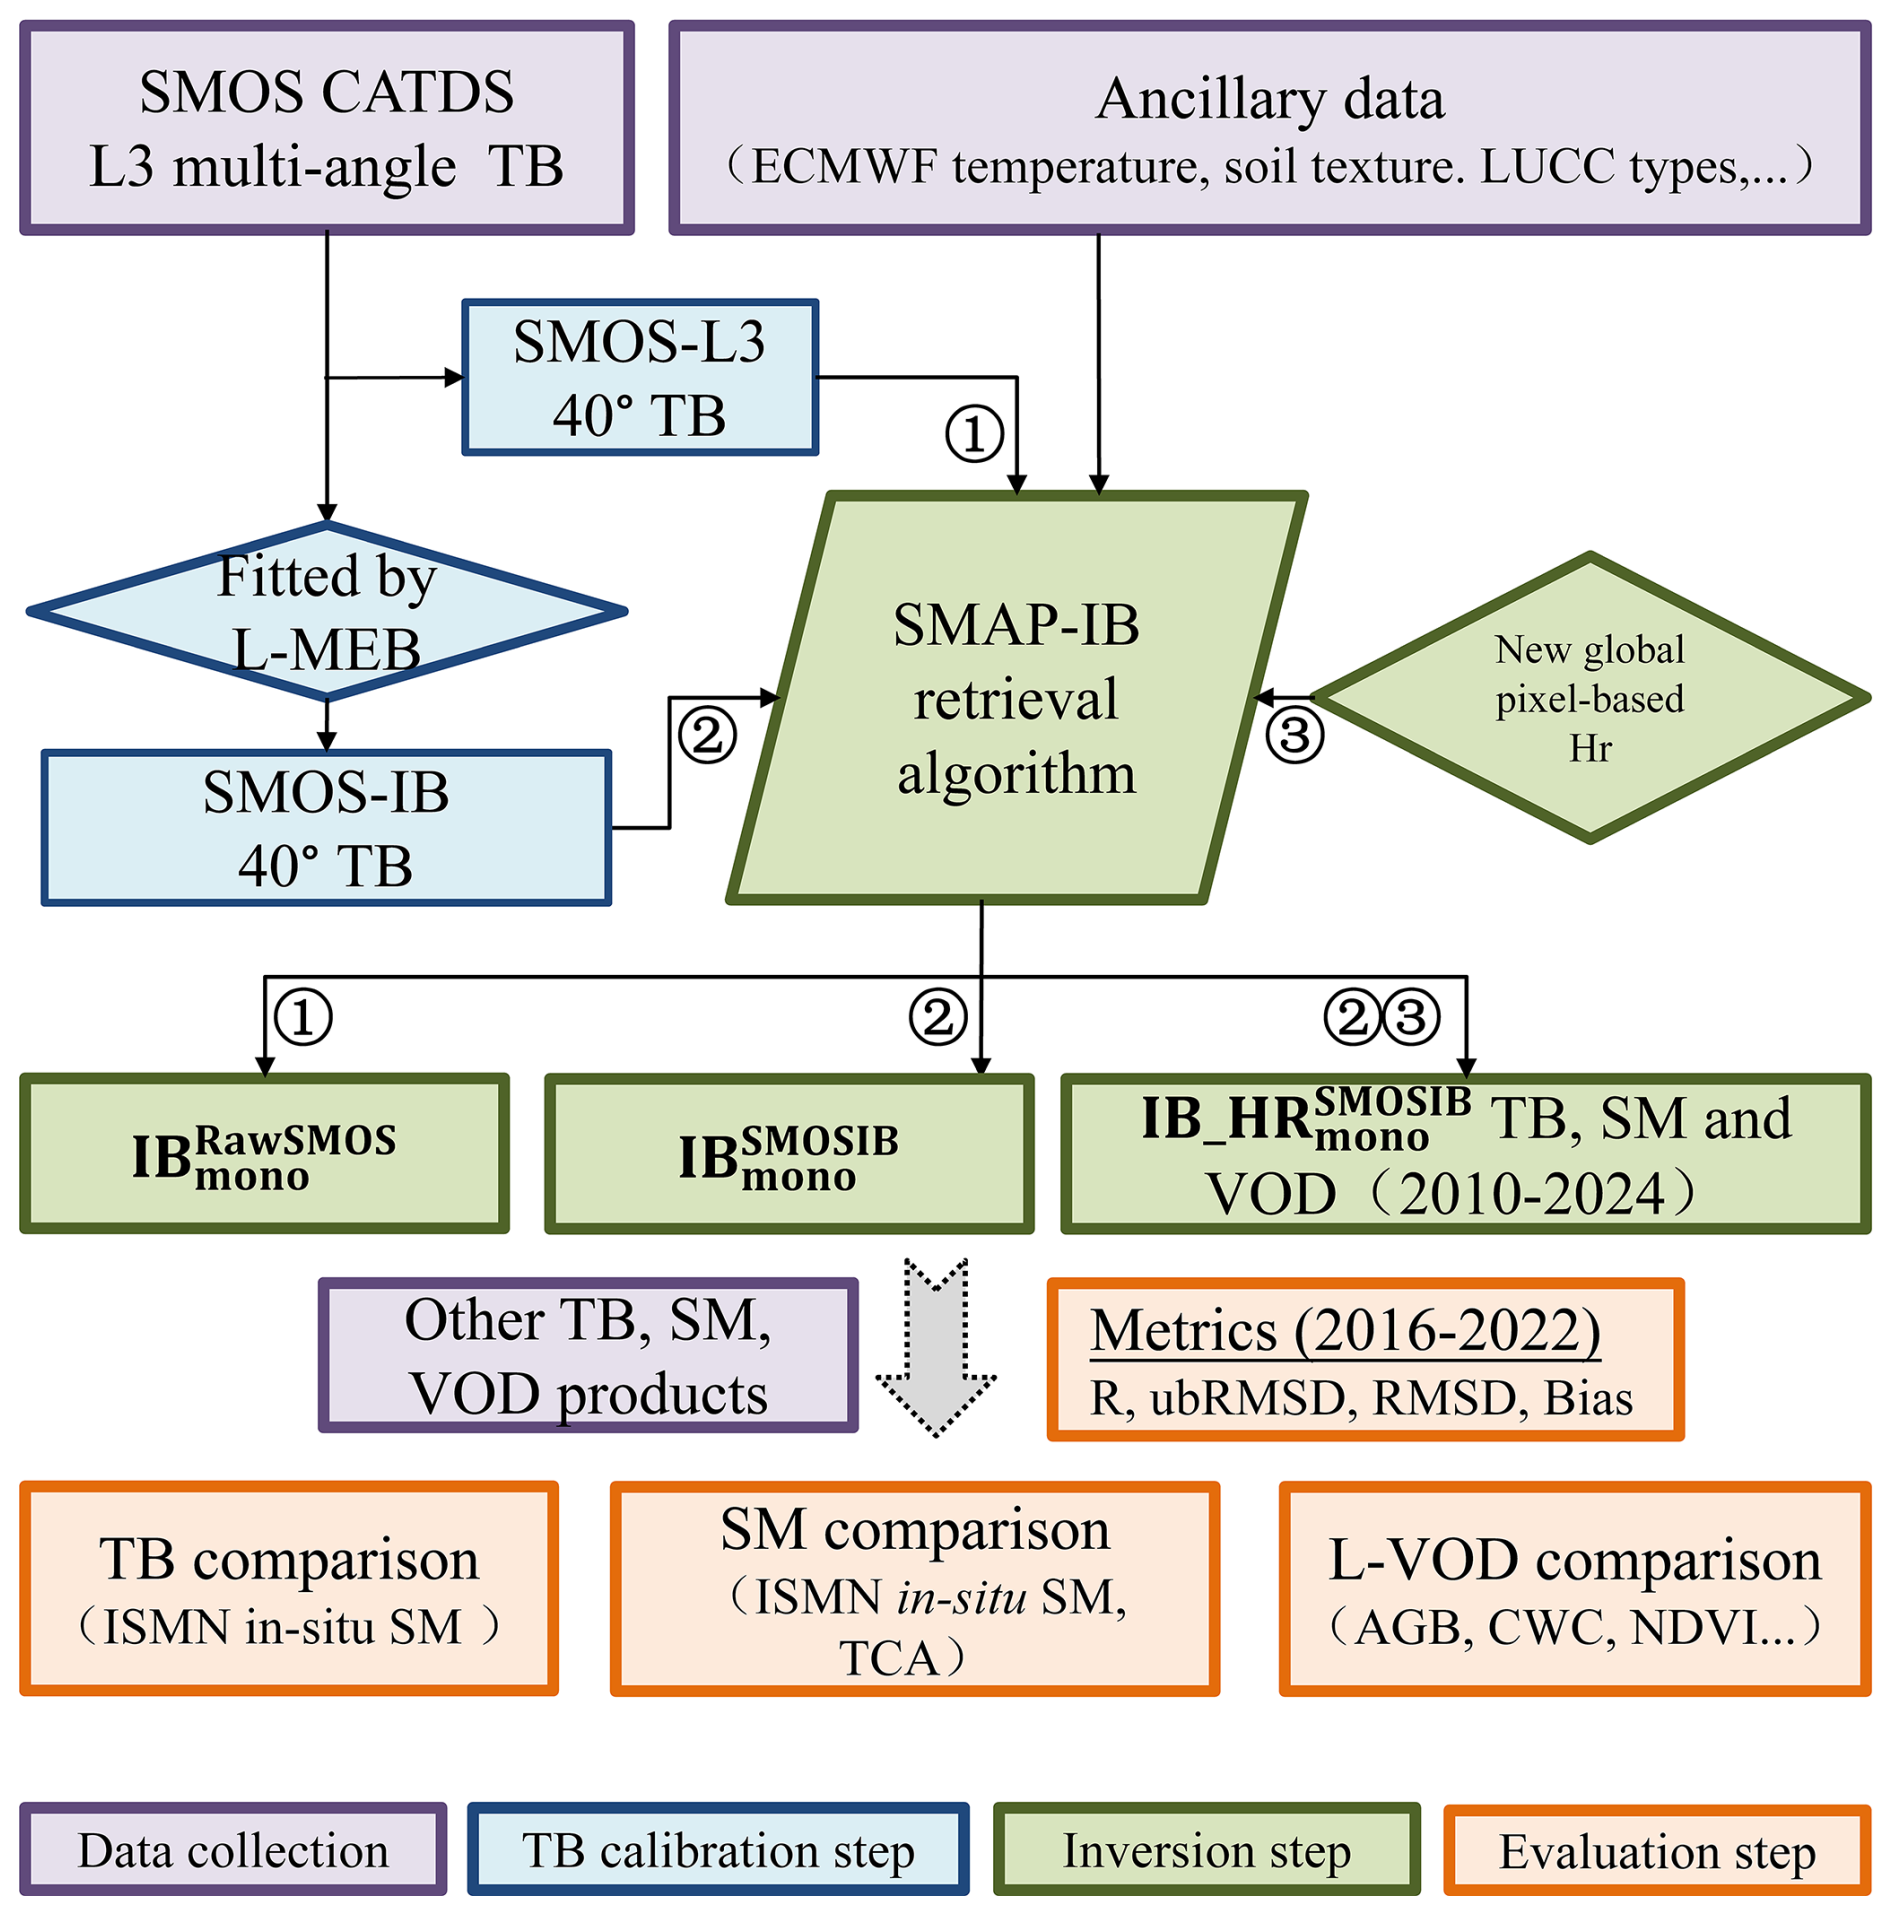
Figure 2Flow chart illustrating the workflow from data production and performance assessment of ① , ② and ③ : inputs (purple box outlines), SMOS-IB TB calibration (blue box outlines), SM (soil moisture) and VOD (vegetation optical depth) inversion (green box outlines) and performance assessment (orange box outlines).
3.1 Generation of SMOS-IB TB through optimization of SMOS-L3 multi-angle TB
To mitigate the angular-related noise and enhance the consistency of TBs, we adopted the L-MEB model, originally developed for the SMOS and shown to effectively reproduce SMOS TBs across varies land surface conditions (Wigneron et al., 2012). In our implementation, L-MEB was employed as a forward model, with multi-angular SMOS L3 TB as input. The optimal fitting results were obtained by minimizing the RMSE (root mean square error) between the L-MEB simulated and observed TB values. Figure 3 shows examples of the fitting results on 5 May, 15 June, 3 July, and 8 August 2024. It can be seen that the fitted TBs significantly reduce the irregularity and dispersion present in the raw L3 TBs, for both polarizations. The fitted TBs at 40° incidence angle, which is in line with SMAP observations, were used as the SMOS-IB product for subsequent applications. In addition, the fitted TB-RMSE for each pixel was retained in the dataset, as it has been shown to serve as a simple and effective indicator for assessing the real influence of RFI on SMOS TBs' quality (Wigneron et al., 2021; Li et al., 2021).
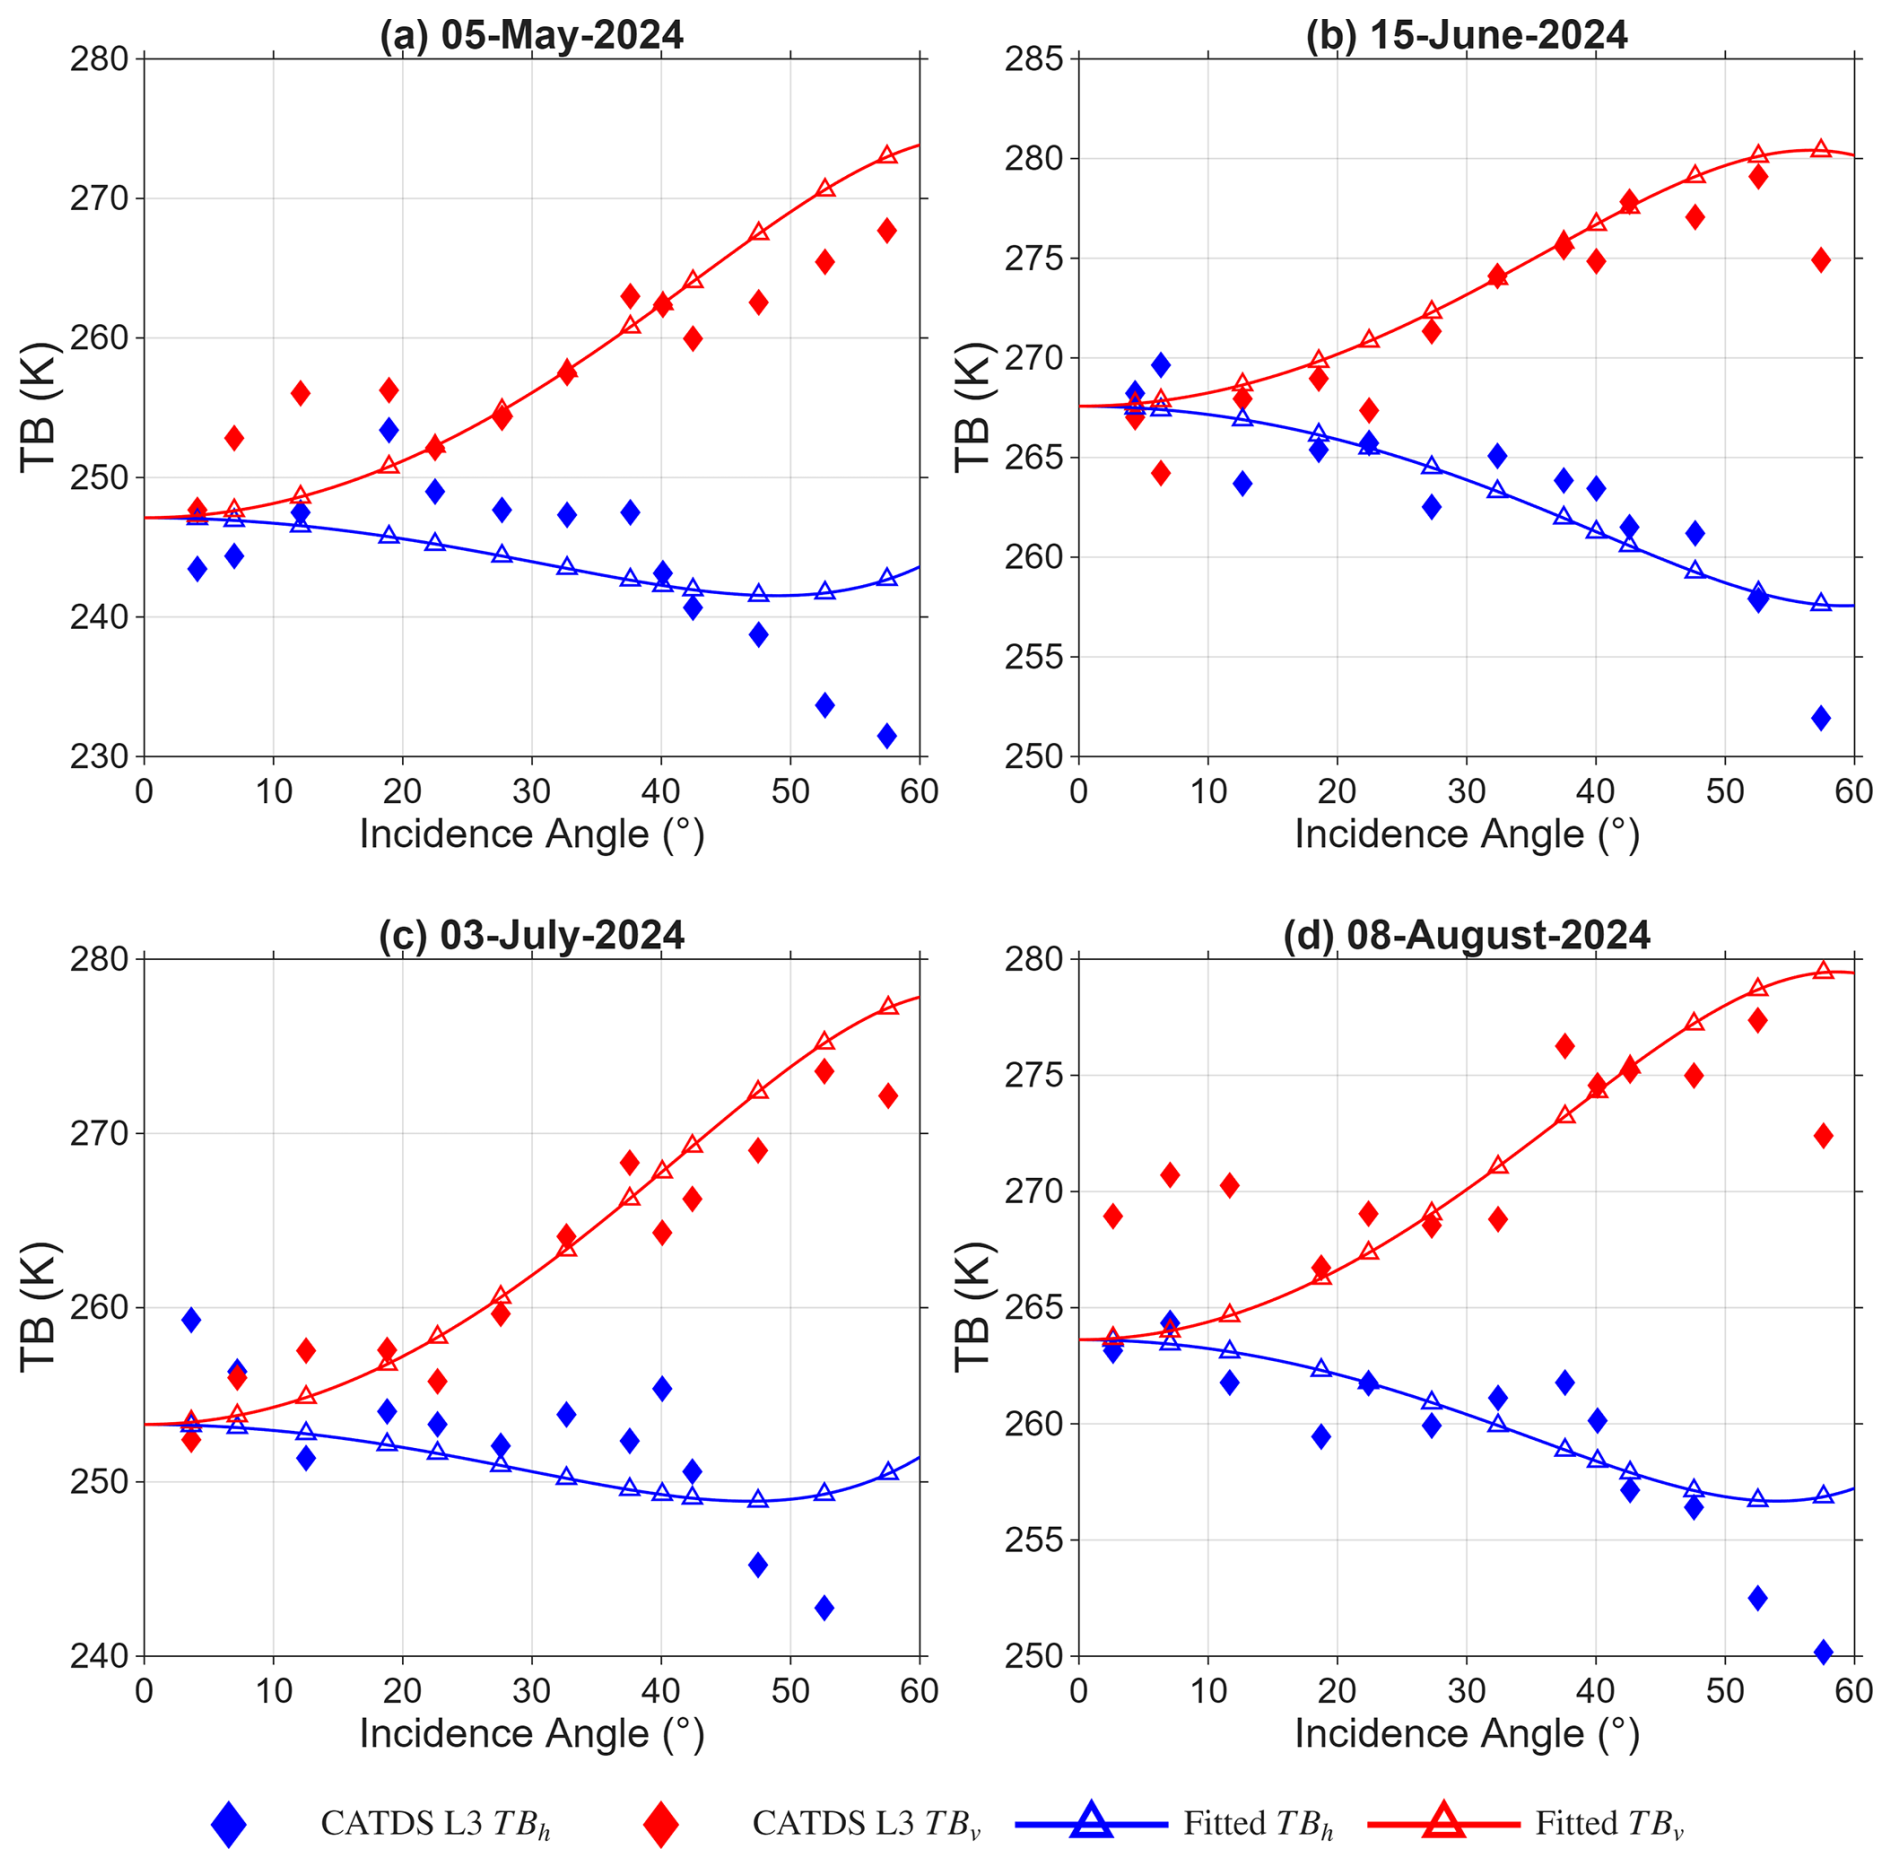
Figure 3Examples of L-MEB (L-band Microwave Emission of the Biosphere) model fitting to CATDS L3 TB (Centre Aval de Traitement des Données' level 3 brightness temperature) at a SMOS pixel located at 83.646° E, 31.661° N. Panels (a)–(d) correspond to 5 May, 15 June, 3 July, and 8 August 2024, respectively.
3.2 SM and VOD inversion using SMAP-IB algorithm
Note that three types of SM and VOD datasets were produced with the aim to address the key scientific questions of this study: ① : implementing the SMAP-IB to the raw SMOS-L3 40° TB; ② : implementing the SMAP-IB to the SMOS-IB 40° TB, and ③ : implementing the SMAP-IB algorithm that incorporated a refined soil roughness (Hr) parameterization scheme to the SMOS-IB 40° TB.
All three datasets used the Tau-Omega (τ-ω) radiative transfer approach to model microwave TB from soil-vegetation covered land surfaces (Mo et al., 1982). However, unlike and , used a novel globally calibrated pixel-level Hr data to represent soil roughness effects (Konkathi et al., 2025). Their approach moves beyond prior methods, which not only accounted for Hr differences between vegetation types, but also incorporating intra-type Hr differences through a methodology that synergistically combines radiative transfer modeling with machine learning.
The SM and VOD were jointly retrieved based on the optimized SMOS 40° incidence angle TBs using SMAP-IB algorithm, incorporating the values of a novel global calibrated Hr, to resolve the underdetermined problem of 2-Parameter retrieval from correlated SMOS TB observations, the SMAP-IB method implements an optimized least-squares iteration, which minimizes a cost function (CF) that accounts for prior knowledge of SM and VOD.
where () denote the measured and simulated TBs at both polarizations, respectively; σ(⋅) is the standard deviation operator; and the second and third terms are regularization functions that involve the retrieval parameters (SM∗, VOD∗) and their initial estimates (SMini, VODini). Please refer to Li et al. (2022a) for a detail description of these initial estimations of the SMAP-IB algorithm.
3.3 Evaluation of TB, SM and VOD
Four key metrics were applied to examine the performance of the retrieved dataset: (1) Pearson's correlation coefficient (R; Eq. 2), (2) systematic bias (Eq. 3), (3) RMSD (Eq. 4), and (4) unbiased RMSD (ubRMSD; Eq. 5) (Entekhabi et al., 2010).
where θRS is the satellite TB, SM or VOD dataset; θREF is the reference data; the overbar represents the temporal averaging operator (i.e., ). Since systematic biases between observations and satellite retrievals may distort RMSD, the ubRMSD and R typically provide more reliable metrics for validation (Xing et al., 2021).
3.3.1 TB and SM evaluation
The standard deviation of the high-frequency variations (SDHF)
To characterize the high-frequency variations of TB, SDHF was calculated on a pixel-by-pixel basis (Wigneron et al., 2021). First, the temporal trend of the TB time series was estimated using a 30 d moving average window. Subsequently, high-frequency anomalies were obtained by removing this low-frequency trend from the original TB observations. Finally, the SDHF was computed as the standard deviation of these high-frequency anomalies over time.
In-situ based metrics
The retrieved SM data were rigorously validated against the ISMN in-situ observations. Concurrently, the sensitivity of TB to in-situ SM was quantitatively evaluated. This analysis is based on the well-established physical principle of a negative TB-SM correlation: as SM increases, the consequent rise in the soil's dielectric constant reduces its microwave emissivity, leading to a decrease in observed TB. Following the method of early studies (Xing et al., 2023; Yi et al., 2023), a four-step procedure was applied to retain valid evaluation results to ensure fair comparisons: (1) all datasets were assessed over the common period from 2016 to 2022, (2) maximum 1 h temporal matching between in-situ data and satellite overpasses, (3) minimum 31 valid observations (i.e., 1 month) per station for statistical robustness, and (4) restriction to the same stations containing valid evaluation metrics for all TB or SM datasets. TB assessment focused on R to evaluate radiometric consistency, while SM evaluation employed four metrics (R, bias, RMSD, and ubRMSD). Note that we also performed paired t-tests to quantify whether the differences in each of the two TB or SM products' performance metrics are statistically significant (null hypothesis: equal means between product pairs; α=0.05).
TCA-based metrics
The direct validation of the SM retrievals using sparse in-situ networks may not be sufficient to obtain a robust evaluation result due to potential representativeness errors associated with the spatial discrepancy between point-based in-situ SM and satellite SM observations (Xing et al., 2021; Al-Yaari et al., 2019). The TCA method was employed as a secondary evaluation approach for global-scale evaluation of SM quality, owing to its applicability at both the footprint and pixel scales (Dong and Crow, 2017). Before conducting TCA, we preprocessed the SM data by removing the climatological seasonal signal from each product to avoid potential overestimation in TCA metrics that could arise from inter-product climatology correlations (Dong et al., 2020; Kim et al., 2020). The SM anomalies were computed as below:
where θanom(t) is the SM anomalies at day t and is the mean SM value via a 35 d moving window, following Gruber et al. (2020) and Fan et al. (2022a).
Given that the TCA method requires strictly independent error structures across its three collocated SM products, we adopted the conventional triplet configuration proposed by Gruber et al. (2020), including passive (i.e., , , , and ), active microwave product (i.e., ASCAT) and a model-based SM product (i.e., GLDAS-Noah). The analysis specifically examined the TCA-derived correlation coefficient (hereafter referred to as TCA-R) as the primary metric of product performance. Please refer to Fan et al. (2022a) and Dong and Crow (2017) for more information about the TCA method.
3.3.2 VOD evaluation
The performance of VOD was assessed using two complementary approaches: (1) spatial R (VOD vs. AGB/canopy height) and (2) temporal R (VOD vs. CWC) and R (VOD vs. NDVI), following previous studies (Chaparro et al., 2019; Zotta et al., 2024; Li et al., 2021). Daily VOD were composited into 16 d intervals in order to align with the NDVI data, while retaining only statistically significant R with a p-value < 0.05.
3.4 The dataset
The global dataset is archived in netCDF4 format and mapped to EASE-Grid 2.0, featuring a 584 × 1388 grid with a 25 km sampling resolution. The dataset contains 14 layers (Table 2), including TB, SM, and VOD, their associated uncertainty layers, expressed as the standard errors of SM and VOD, and the global soil roughness map. The RMSE values layer between the measured and modeled TB and the Scene_Flags layer are also included in the dataset. The RMSE layer, the optimal fitting results obtained by minimizing the RMSE between the L-MEB simulated and observed TB values, serves as a measure of RFI influence on the TBs and to filter out SM and VOD data substantially influenced by RFI. The Scene_Flags layer is used to filter out multiple impacts linked to specific climate or topographic conditions (Table 2). The datasets for the period 2010–2024 can be freely downloaded at website (https://doi.org/10.5281/zenodo.17647385, Xing et al., 2025) and will be continuously maintained on the INRAE Bordeaux Remote Sensing Product website (https://ib.remote-sensing.inrae.fr/, last access: 1 June 2026). Note that these SM, VOD, and TB products are intended to support large-scale applications, including global drought monitoring, studies of vegetation water and biomass dynamics, freeze-thaw monitoring, etc. However, low-quality observations should be screened before any application or validation analysis. In particular, users should first assess potential RFI contamination, which is especially critical for SMOS. Observations under frozen soil or snow-covered conditions should also be excluded, given the limited applicability of current dielectric models in frozen and snow/ice environments (Wigneron et al., 2017). In addition, pixels with a high fraction of open water, substantial urban land cover, or strong topographic heterogeneity should be screened out or treated separately prior to use. Accordingly, filtering criteria for with respect to the above influencing factors were recommended and summarized in Table A2.
Table 2Overview of the gridded data layers included in the dataset.
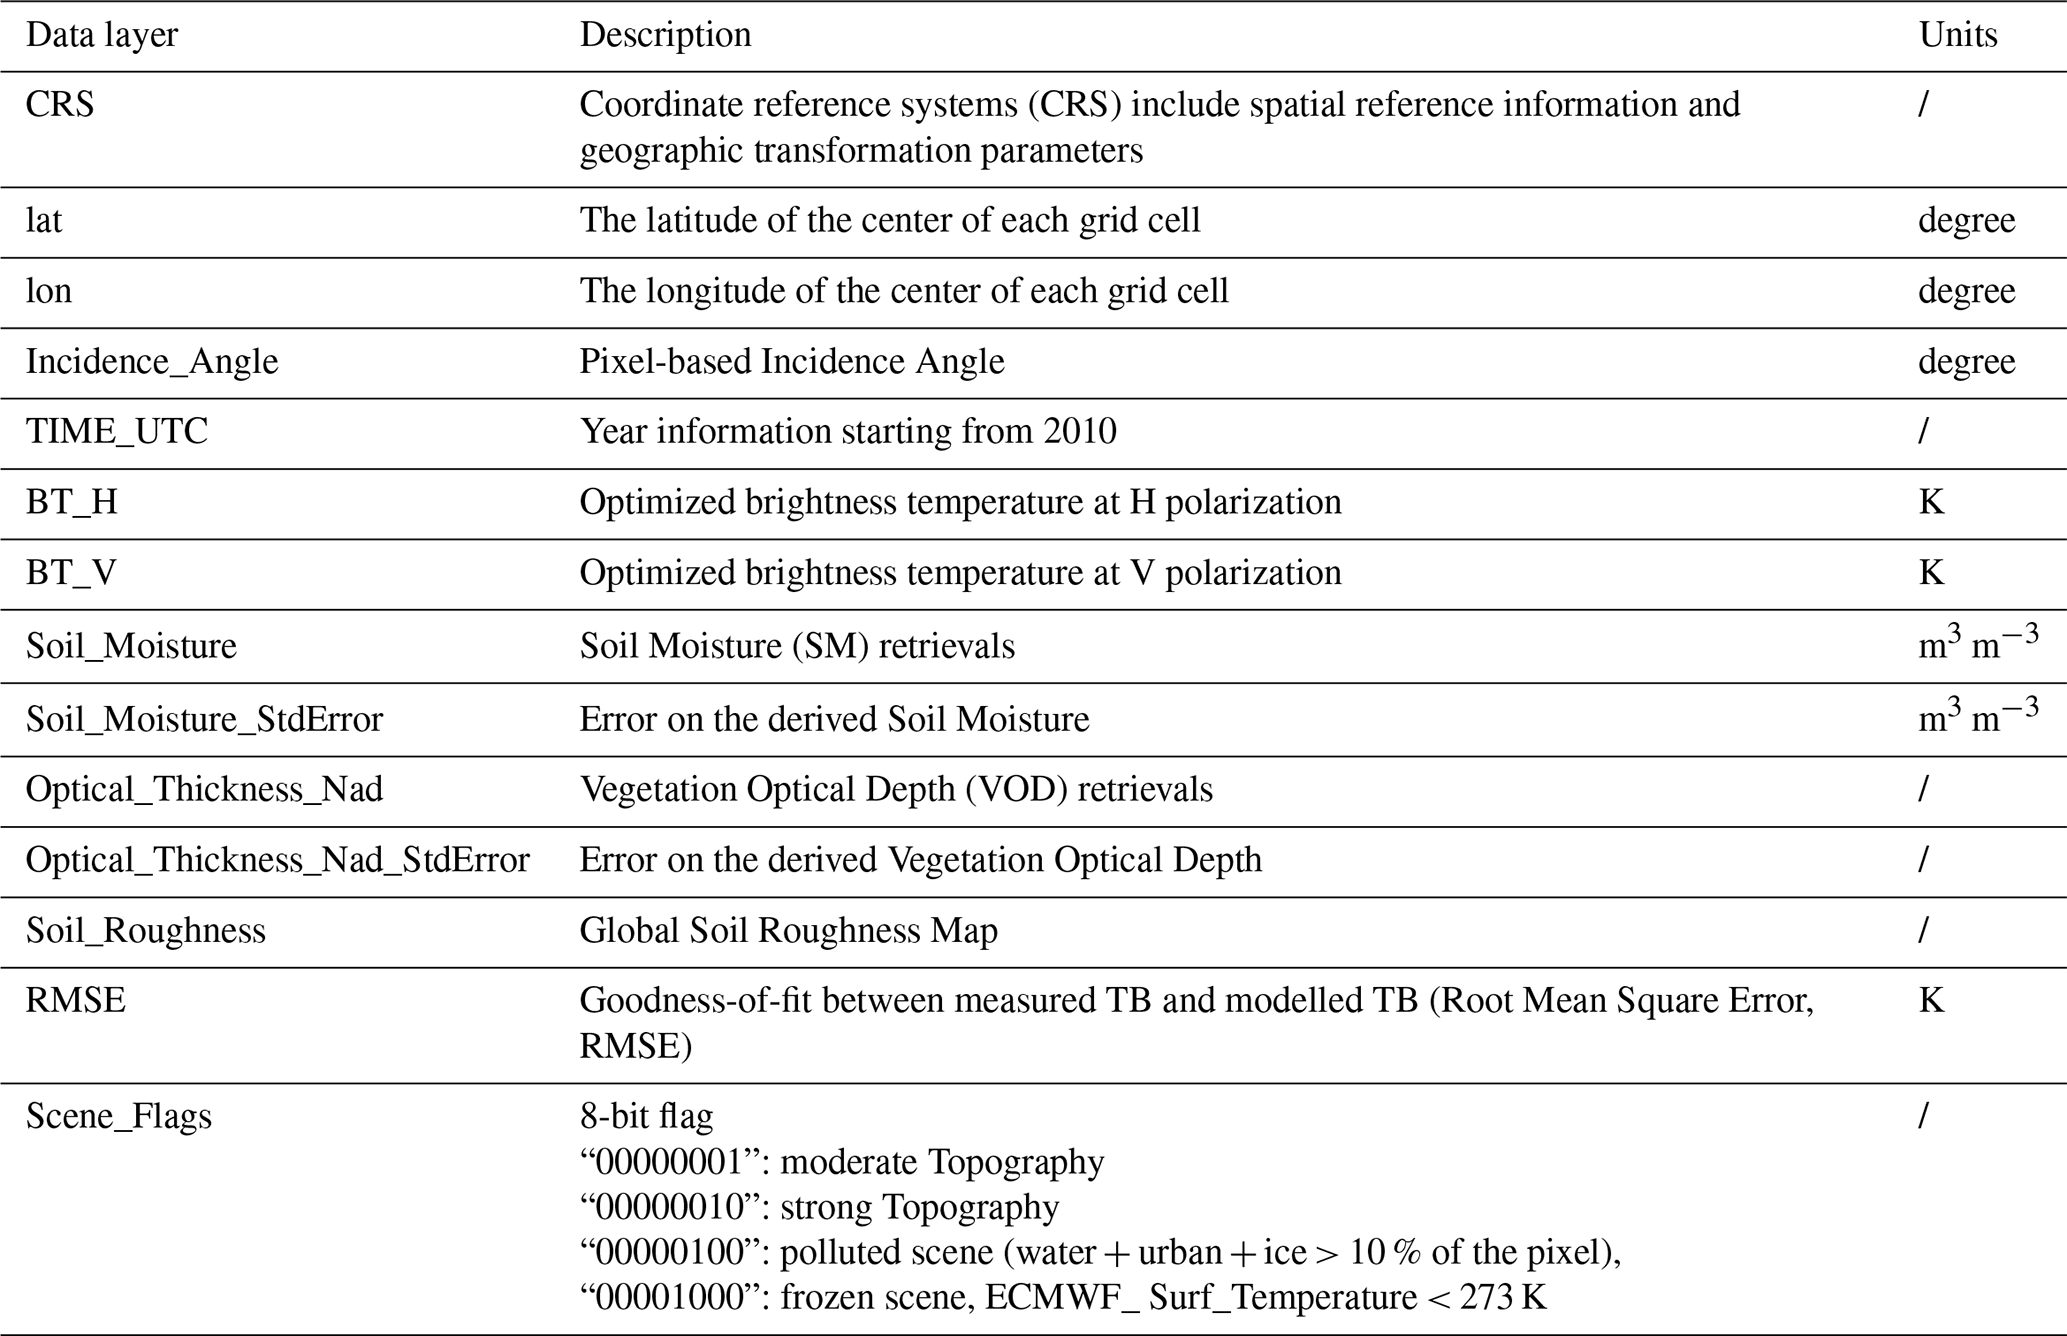
Note: The specific criteria for “moderate Topography” and “strong Topography” flags are defined pixel-by-pixel based on the methodology described in Mialon et al. (2008).
4.1 Evaluation of the optimized TB
The global spatial pattern of high-frequency TB variations was quantified by calculating the standard deviation (SDHF) of TB after removing seasonal cycle for SMOS-IB, SMAP-L3, and SMOS-L3 (Fig. 4). It was observed that the high-frequency variability was consistently higher in H-polarization than in V-polarization across all products, particularly in water-limited regions. Critically, the spatial median SDHF for both SMOS-IB and SMAP-L3 was low and comparable (<5.33 K), whereas SMOS-L3 exhibited markedly higher variability (>7.20 K). This demonstrated that SMOS-IB and SMAP-L3 shared similarly low noise levels, while SMOS-L3 retained the strongest high-frequency fluctuations. These differences reflected their distinct processing chains: unlike the top of atmosphere SMOS-L3 TB, SMAP-L3 included atmospheric correction and dedicated RFI mitigation, and SMOS-IB benefited from noise reduction via L-MEB model optimization, bringing its variability characteristics closer to those of SMAP-L3. Spatially, SMOS-L3 showed markedly higher SDHF than the other two products over central and northeastern Africa, central and eastern Asia, and parts of eastern Europe, regions that coincide with known RFI hotspots for SMOS (Wigneron et al., 2021; Al-Yaari et al., 2019). Pixel-wise SDHF differences further reinforced these patterns (Fig. A1 in the Appendix): deviations between SMOS-IB and SMAP-L3 were minimal (within ±0.02 over most regions), whereas SMOS-L3 showed systematically higher values, particularly over the above-mentioned RFI-affected areas where differences relative to both SMOS-IB and SMAP-L3 typically exceeded 5 K. These results confirmed that SMOS-L3 preserved substantial high-frequency noise, while SMOS-IB and SMAP-L3 provided cleaner temporal TB profiles (Fig. A2).
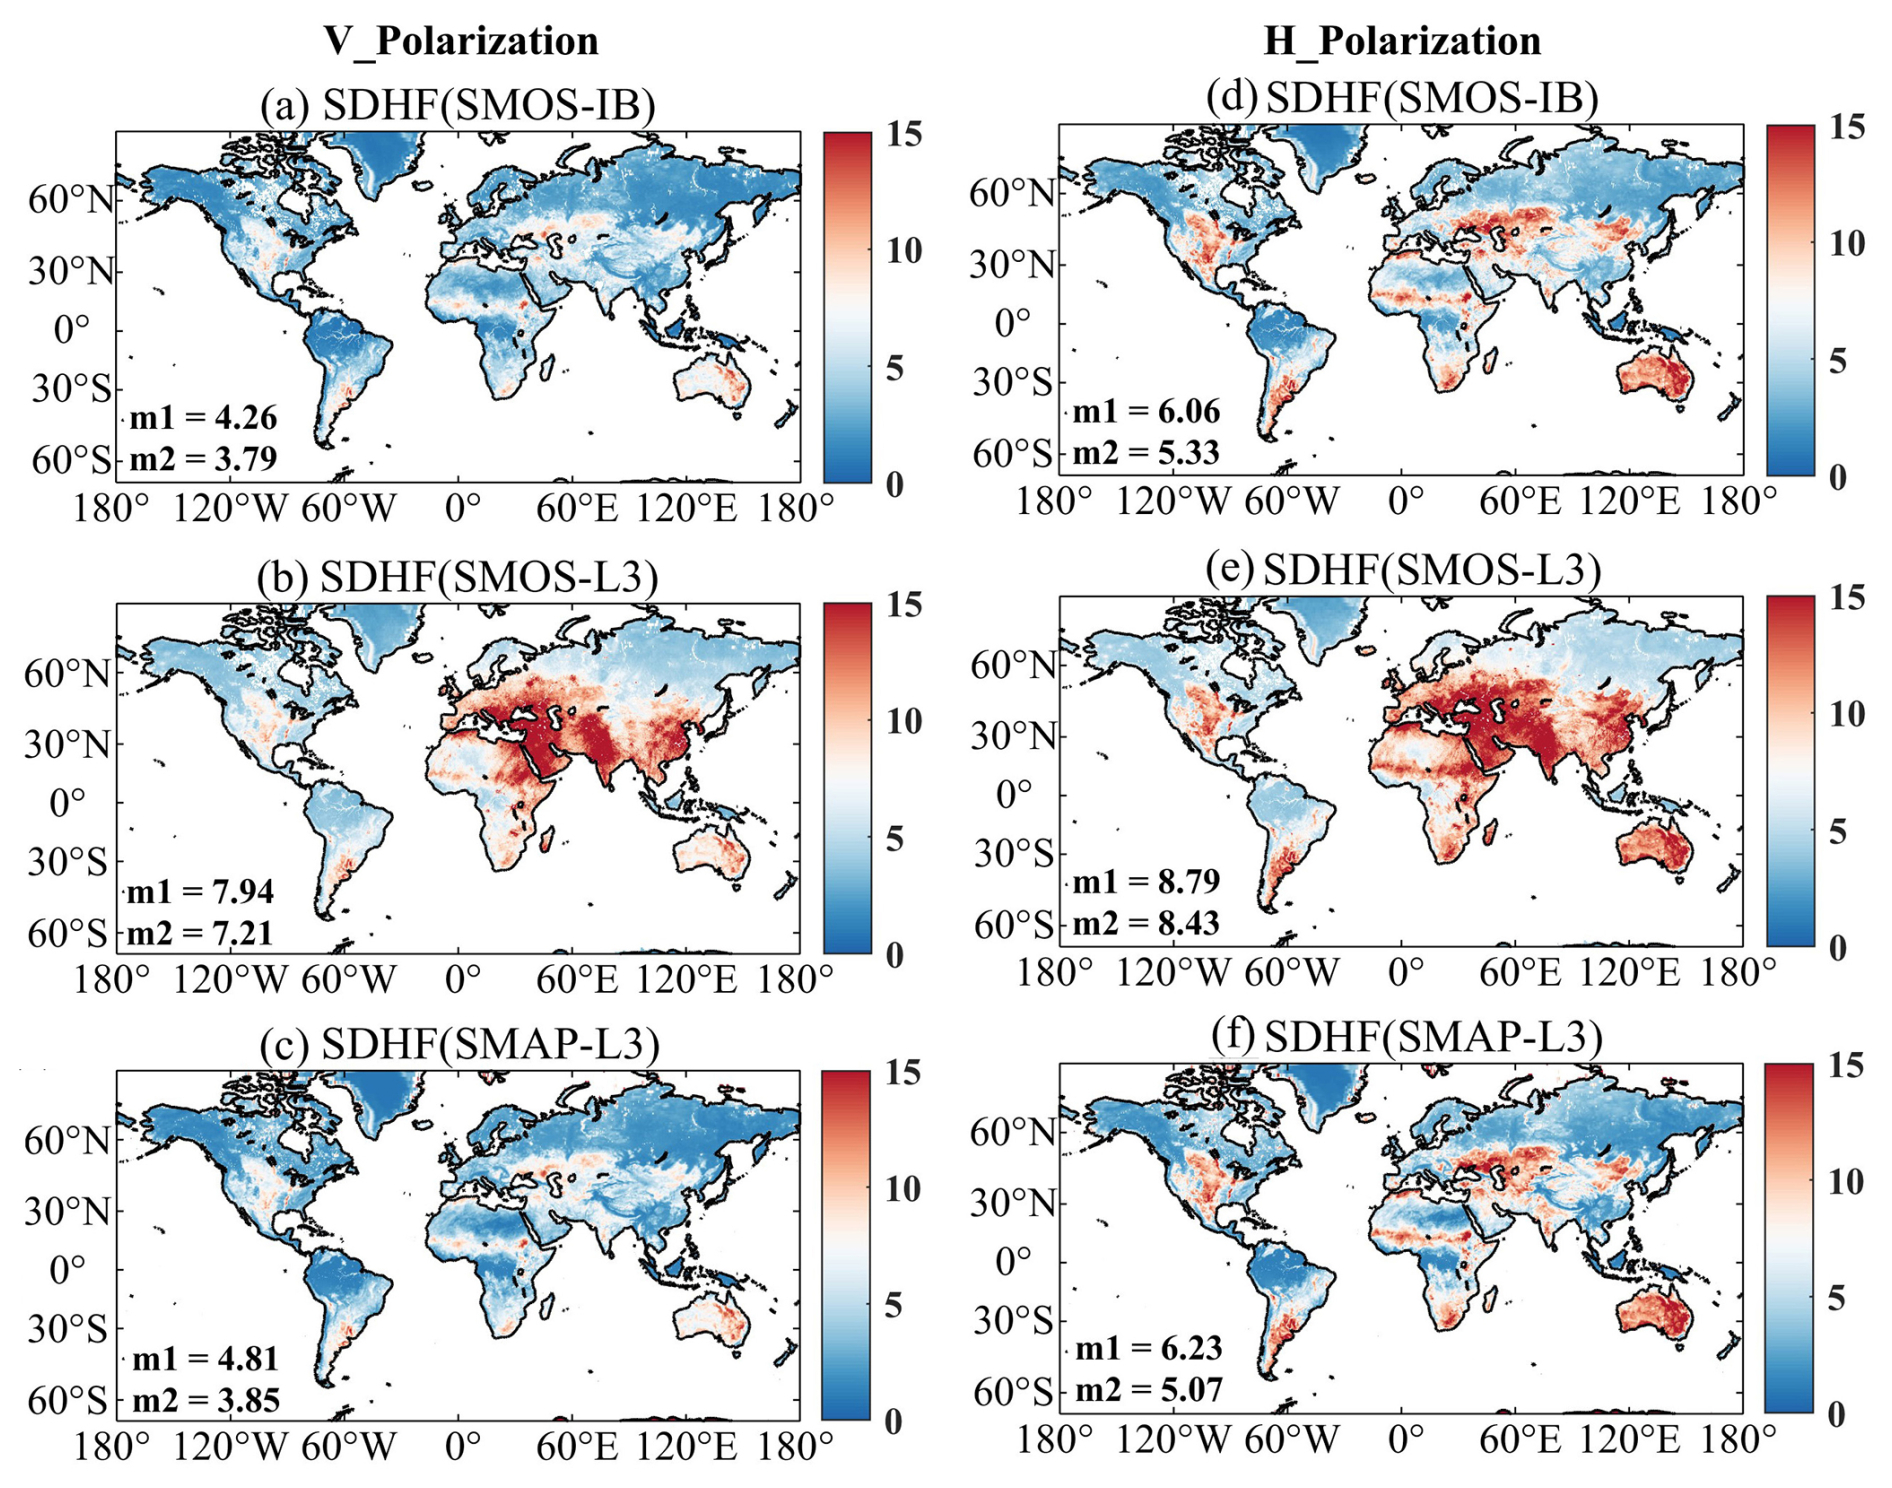
Figure 4Maps of the standard deviation of the high-frequency variations (SDHF) in the TB (brightness temperature) time series for (a) SMOS-IB, (b) SMOS-L3 and (c) SMAP-L3 TB in V-polarization, and (d–f) in H-polarization. SDHF was derived by removing the seasonal cycle, which was computed with a 30 d moving window average filter. m1 and m2 denote the spatial mean and median SDHF value (unit: K), respectively.
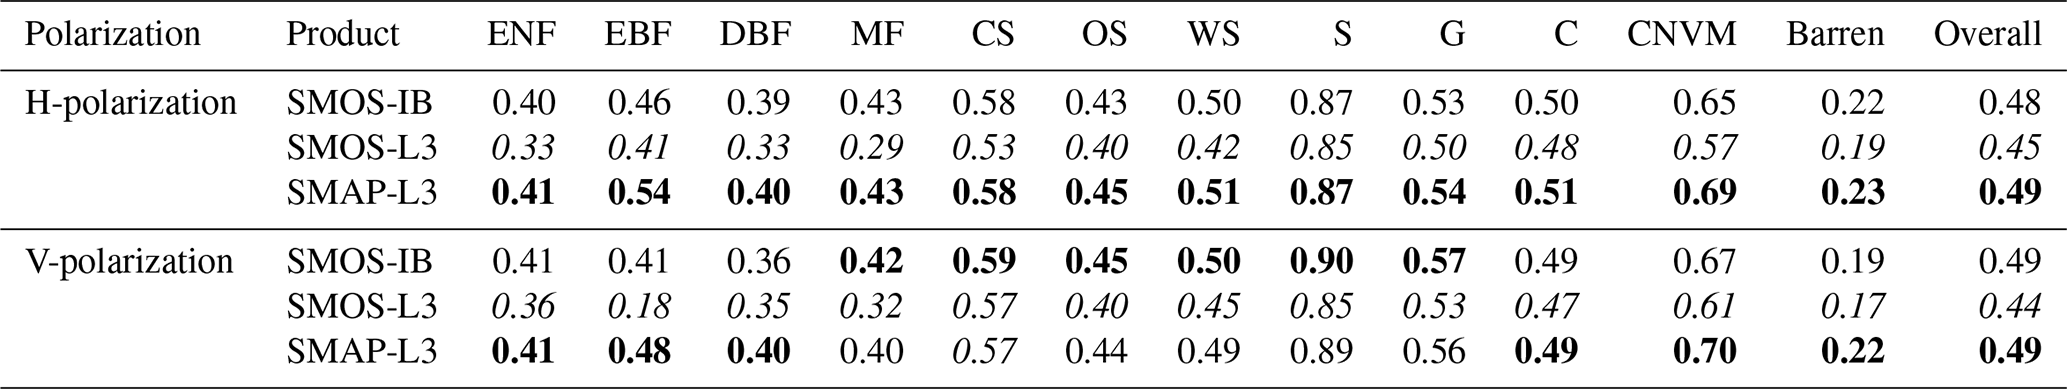
To further investigate how the three TB products respond to SM variations, we assessed their sensitivity to ISMN in-situ SM using the coefficient of determination (R2) across 12 MODIS IGBP land cover types (Table 3). Overall, all three products showed the strongest SM sensitivity in shrublands (S), with R2 values exceeding 0.80 for both polarizations, and the weakest sensitivity in barren or sparsely vegetated areas, where R2 values fell below 0.30, reflecting the reduced radiometric sensitivity of microwave observations in regions with low SM dynamics. The land cover-specific analysis confirmed and extended the overall patterns described above: SMAP-L3 TB generally presented the highest R2 values, followed closely by SMOS-IB TB, while SMOS-L3 TB showed the lowest sensitivity to ISMN in-situ SM data. This ranking pattern (SMAP-L3 > SMOS-IB > SMOS-L3 TB) showed complete consistency across all land cover types for H-polarization and in 7 of 12 cases for V-polarization, respectively. Particularly, SMOS-IB TB achieved slightly higher R2 than SMAP-L3 TB in MF, CS, OS, WS, S and G land cover types. These findings indicated that the proposed optimization process effectively enhanced the sensitivity of SMOS TB to SM and enabled SMOS-IB to achieve performance levels comparable to SMAP-L3 TB in most cases.
Table 3Coefficient of determination (R2) between ISMN (International Soil Moisture Network) in-situ measurements and the satellite-based TB (brightness temperature) products (SMOS-IB, SMOS-L3, and SMAP-L3) for both polarizations during 2016–2022, used to assess the sensitivity of TB to soil moisture across the 12 MODIS IGBP land cover types. To compare the performance across products, within each land cover type column (and Overall), the highest R2 value among the three products is highlighted in bold, and the lowest is indicated in italics. ENF (Evergreen Needleleaf Forest), EBF (Evergreen Broadleaf Forest), DBF (Deciduous Broadleaf Forest), MF (Mixed Forests), CS (Closed Shrublands), OS (Open Shrublands), WS (Woody Savannas), S (Savannas), G (Grasslands), C (Croplands), CNVM (Cropland/Natural vegetation mosaics).
4.2 Evaluation of the SM retrievals
4.2.1 ISMN in-situ SM-based comparison
Figure 5 presents the overall evaluation performance of SM against ISMN in-situ measurements, indicated by median values of R, ubRMSD, RMSD, and Bias, with comparative analysis of four other SM products (, , and ) from 2016 to 2022. Regarding R and ubRMSD, SM achieved similarly high performance with and , with all three products reaching a median R of 0.67 and a median ubRMSD of ∼ 0.059 m3 m−3. In comparison, and yielded lower median R of 0.65 and 0.64, respectively, and higher ubRMSD of 0.063 m3 m−3 (Fig. 5a–b). Particularly, the better performance of and SM products over SM demonstrated that high-quality TB data enabled more accurate SM retrievals. This was further supported by the time series comparison in Fig. A3, which showed that the SM product exhibited higher noise levels in its retrievals – a direct consequence of the noisier TB input. Since these products employed the same inversion method (i.e., SMAP-IB algorithm) but differed in SMOS TB inputs, the results underscored the critical role of pre-processed TB quality in enhancing SM estimation accuracy from the data side (leaving algorithm improvements aside). Besides, the , and performed better than the SM product, indicating that, when supported by a sufficiently robust retrieval algorithm, a mono-angular approach was not necessarily inferior to a multi-angular one. Regarding RMSD, the , , , and SM products (RMSD ranged from 0.093 to 0.097 m3 m−3) exhibited marginally lower errors compared to (RMSD = 0.100 m3 m−3) (Fig. 5c). All five SM datasets were dryer than observed SM, as illustrated by a negative bias (satellite SM minus in-situ SM), in which (Bias = −0.058 m3 m−3) had a lower bias compared to the other four SM products (Bias ranges from −0.067 to −0.061 m3 m−3) (Fig. 5d). These findings were in agreement with the evaluation results indicted in Li et al. (2022b).
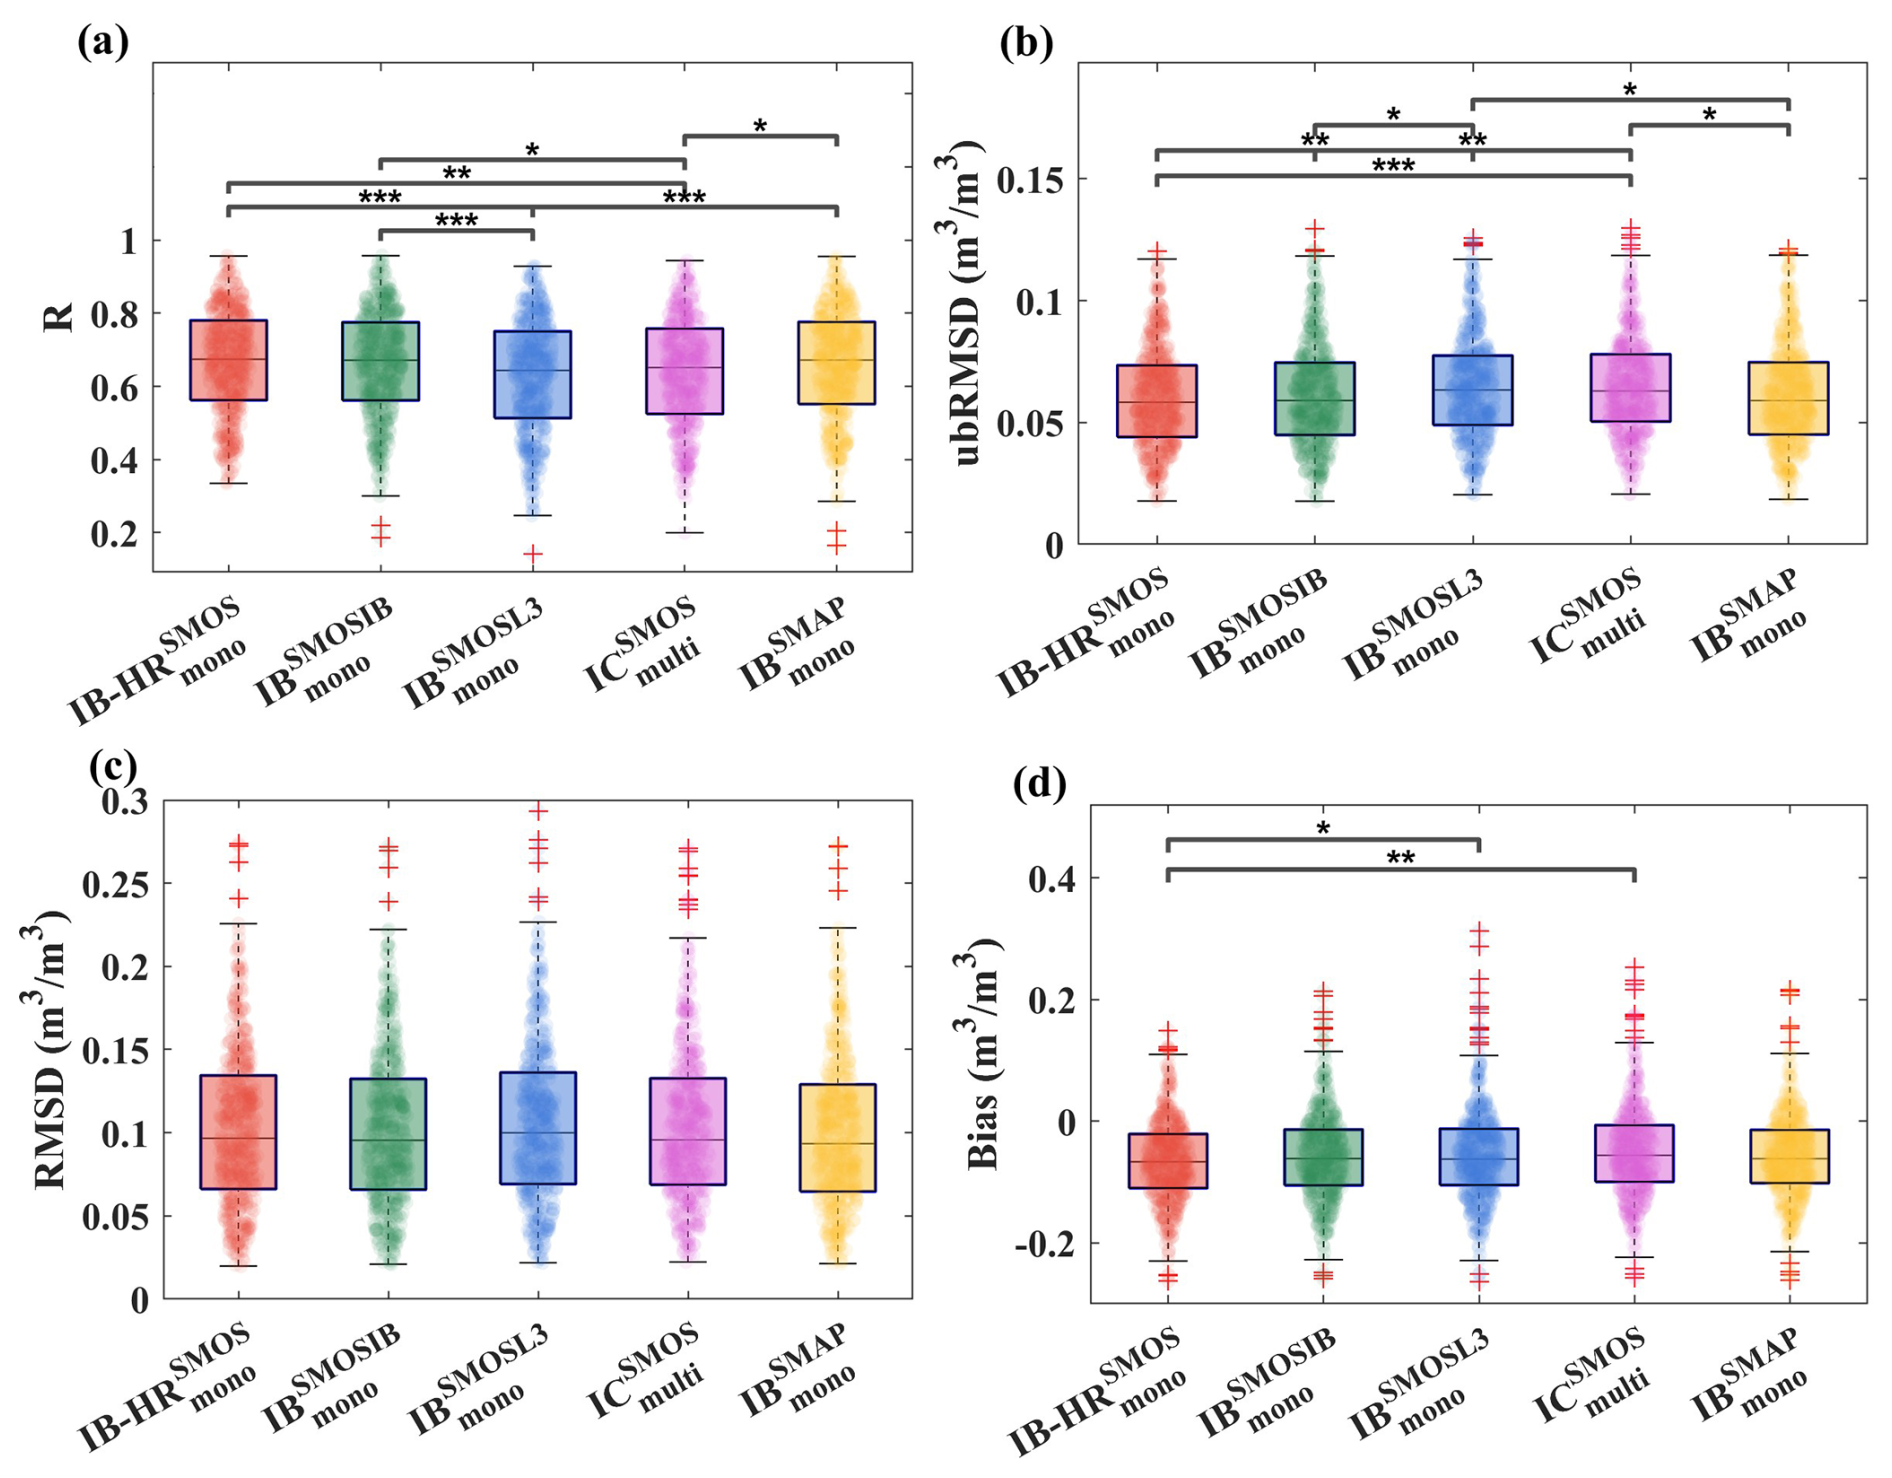
Figure 5Boxplots summarizing the overall metrics of , , , , and against ISMN (International Soil Moisture Network) in-situ SM (soil moisture) regarding (a) R, (b) ubRMSD (m3 m−3), (c) RMSD (m3 m−3) and (d) Bias (m3 m−3) from 2016 to 2022. The scatter points in the boxplot represent individual data points. The symbols *, , and indicate that the p-value computed from the two-sample t-test between the metrics of each two products is below 0.05, 0.01, and 0.001, respectively.
To systematically assess the accuracy of the SM dataest across diverse networks, we computed in-situ network-level median statistics for three statistical metrics including R, ubRMSD, and Bias (Table A3). In terms of ubRMSD, achieved the lowest error in 10 out of 23 networks, followed closely by with 9 out of 23, and they outperformed and in both the number of networks and their overall ubRMSD levels. Regarding R, acquired the highest accuracy over the other four SM products in 52 % of the networks, followed by and . Across networks, all five satellite SM products showed their strongest agreement with observation in the AMMA-CATCH network, where they achieved uniformly high R values (≥ 0.88) and low error metrics (ubRMSD ≤ 0.03 m3 m−3), meeting the typical L-band mission accuracy requirement of ∼ 0.04 m3 m−3. In contrast, the FMI network in-situ SM recorded the lowest R values (≤ 0.51), and the SNOTEL network in-situ SM showed the highest ubRMSD values (≥ 0.075 m3 m−3) for all products. However, the retrieval performance in these networks was not uniformly degraded across all metrics; for example, the FMI network still exhibited reasonable ubRMSD levels, while the SNOTEL network retained moderate R values. These patterns indicated that the limitations arose from different aspects of the retrieval, suggesting room for further improvement in these regions. acquired the lowest Bias of the five SM products over 11 observation networks, though all SM products exhibited similar median dry biases (−0.056 to −0.067 m3 m−3).
Figure 6 shows the site-level scatterplots of ΔR (difference in R) and ΔubRMSD (difference in ubRMSD) between each pair of SM products for the ISMN in-situ sites covered by non-forest and forest LUCC types. The purpose was to assess whether improvements in correlation and ubRMSD occured simultaneously at the site scale. Based on the number of sites showing concurrent gains in both metrics, consistently outperformed and SM across both forest and non-forest regions, as evidenced by pairwise metric differences: showed positive ΔR (higher correlation) and negative ΔubRMSD over 84 % and 78 % of non-forest in-situ sites, respectively. This advantage also persisted in forest regions with positive ΔR and negative ΔubRMSD over 84 % and 53 % of the in-situ sites (Fig. 6a, b, a1 and b1). These results demonstrated the robust performance of across diverse land cover types, reconfirming the advancements achieved by the advanced TB observations ( vs. and mono-angular algorithm ( vs. ). Notably, compared with , achieved absolute ubRMSD reductions greater than 0.01 m3 m−3 and R increased above 0.10 at several forest and non-forest sites, further confirming the effectiveness of the optimized TB fitting. Besides, a better performance of than (in 31.83 % and 41.75 % of the in-situ sites) and (in 48 % and 43 % of the in-situ sites) was also observed across both non-forest and forest regions (Fig. 6c, d, c1 and d1). This improvement underscored the benefit of the new Hr parameterization scheme, which further enhanced SM retrieval accuracy beyond what was achievable with optimized TB data alone. In addition, both and demonstrated lower accuracy than over 74 % and 79 % of the non-forest sites and 56 % and 74 % of the forest sites (Fig. 6e, f, e1 and f1). These findings also confirmed that algorithmic refinements – particularly in TB calibration and in the optimization of key radiative transfer parameters – can bridge the performance gap between SMOS and SMAP, making a reliable high-precision product for hydrological and climate applications. These results aligned with the finding of Colliander et al. (2022, 2023), who found that both SMOS and SMAP L-band radiometers exhibited comparable sensitivity to SM variations. We acknowledge the known non-uniform distribution of ISMN stations (Fig. 1), and the validation results in data-sparse regions should be interpreted with caution. This inherent limitation of direct validation motivates the subsequent application of TCA-based comparison and underscores the need for future installation of dense networks in under-represented regions.
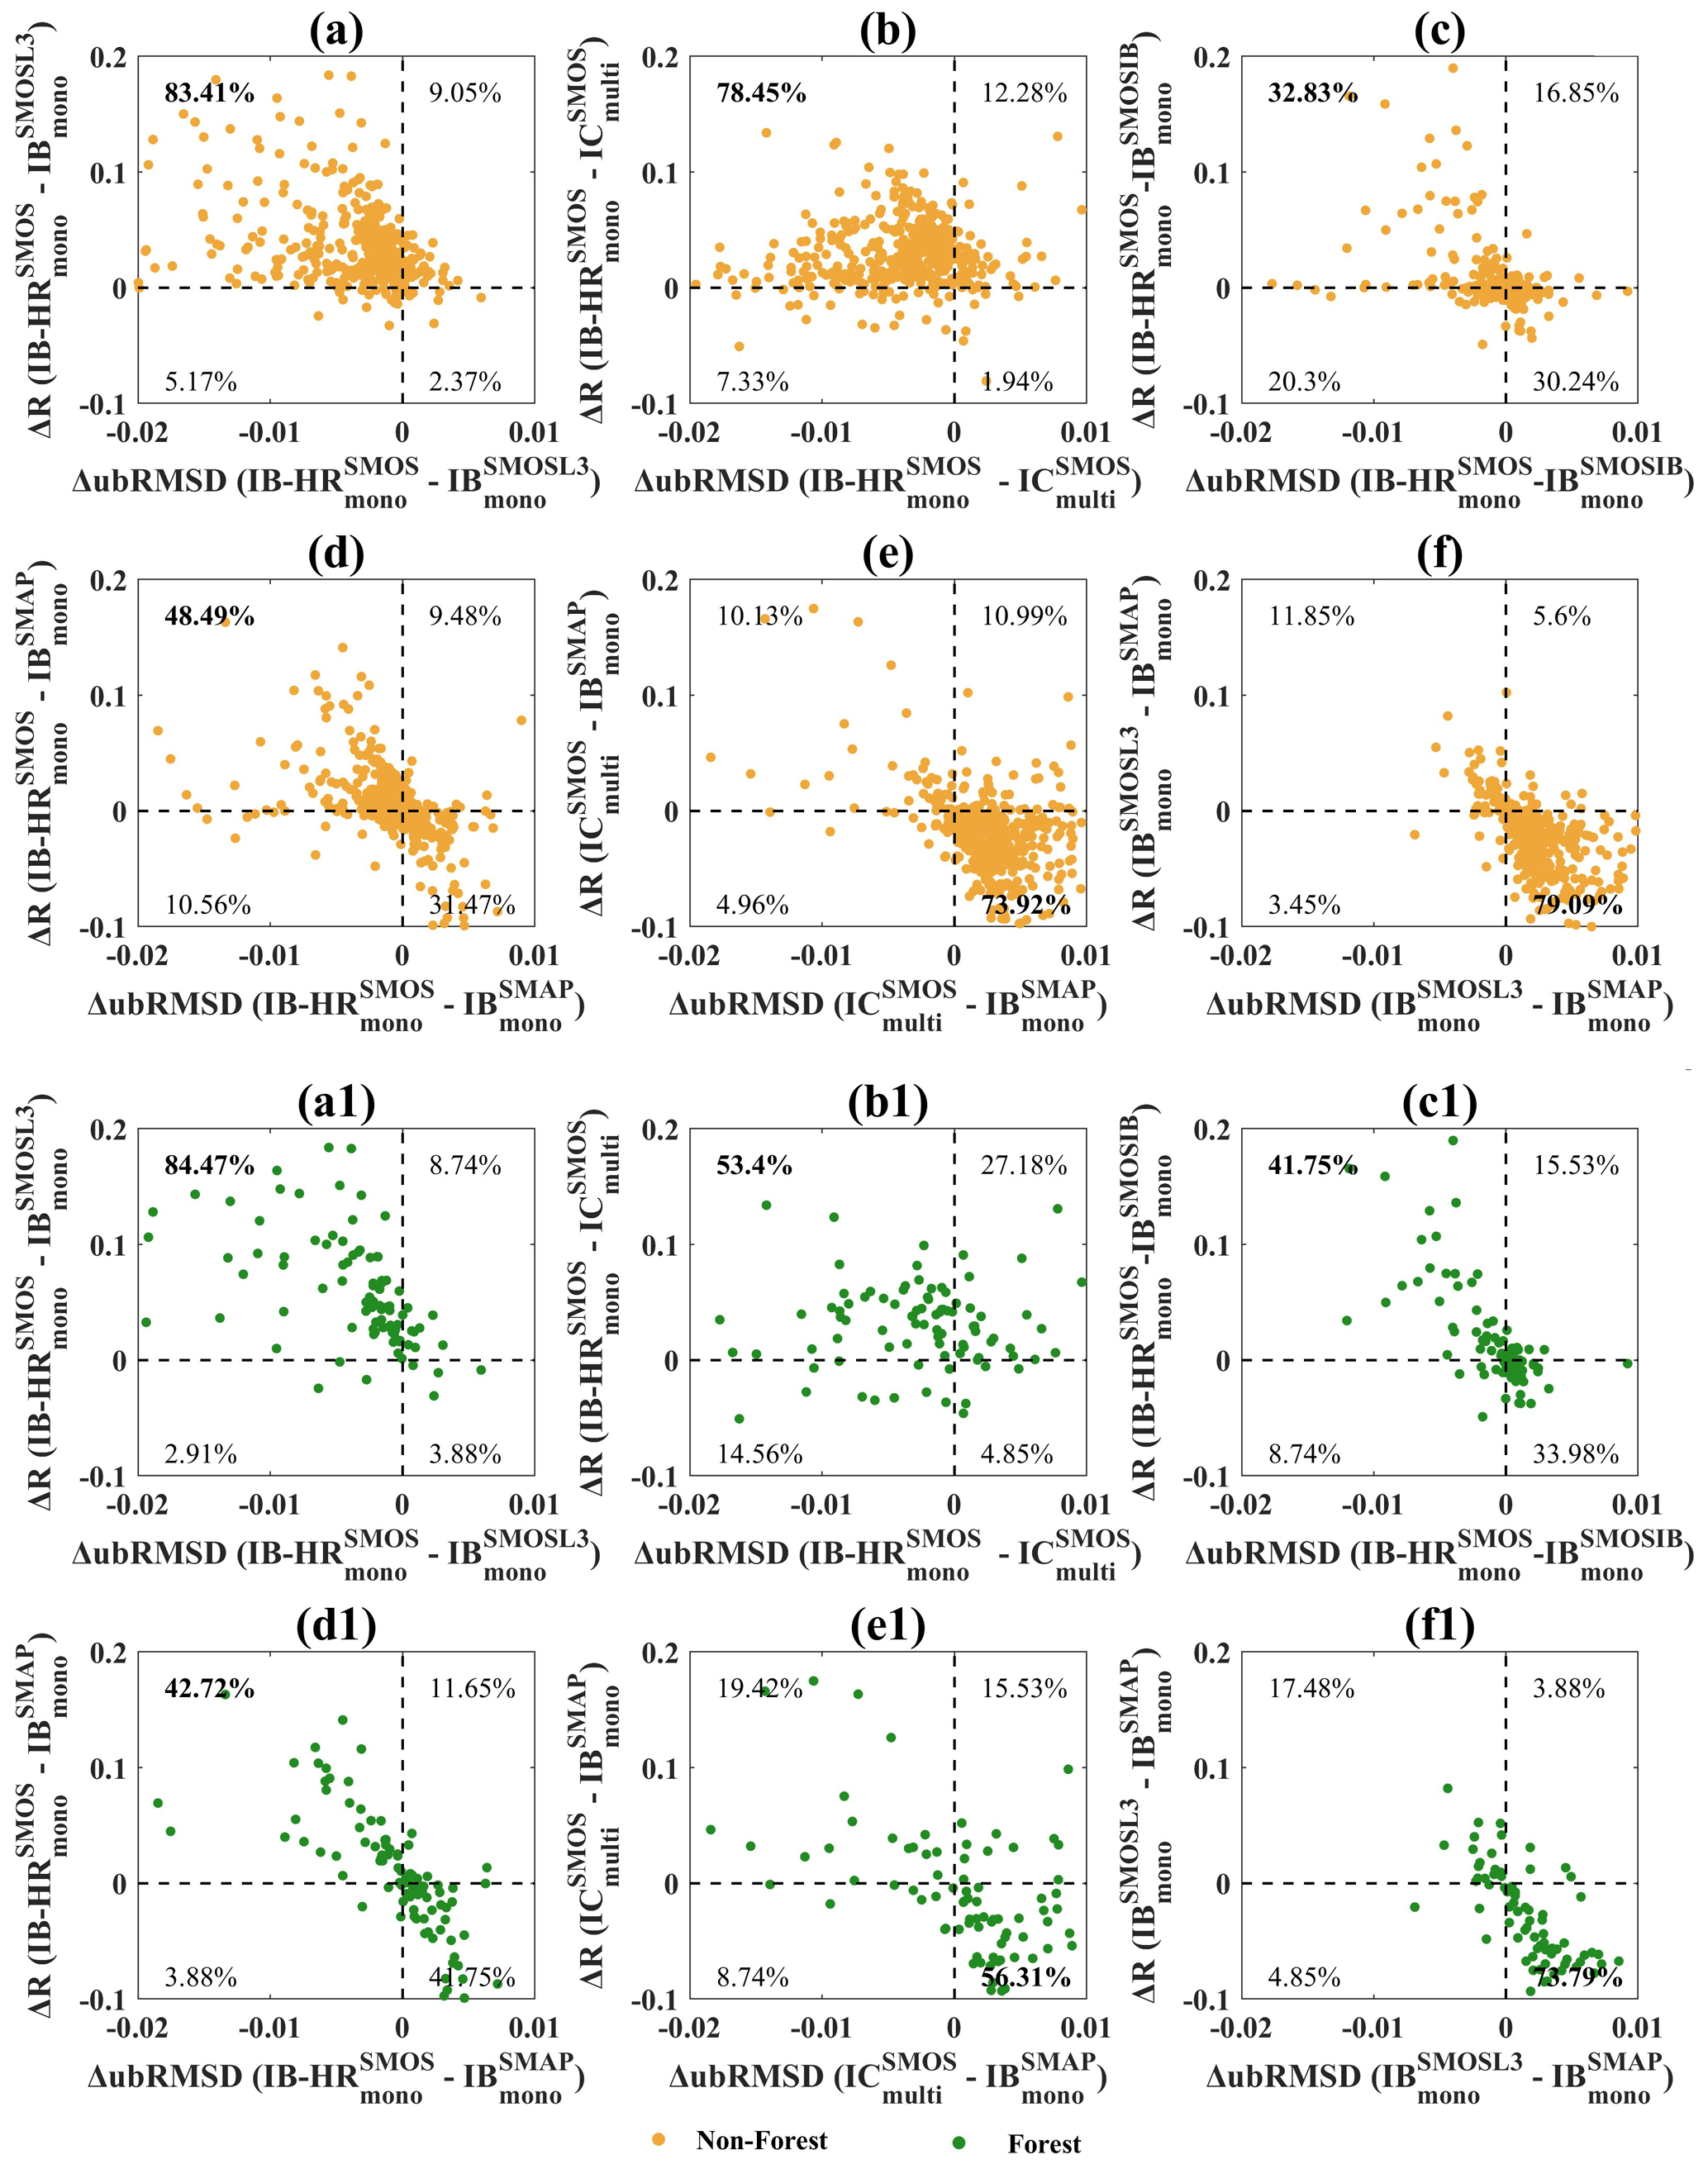
Figure 6Scatterplots of ΔR (difference in correlation coefficient) and ΔubRMSD (difference in unbiased RMSD) between paired soil moisture datasets for the ISMN (International Soil Moisture Network) in-situ sites. The colors of the symbols represent the (a–f) non-forest (orange) and (a1–f1) forest (green), aggregated based on MODIS IGBP (International Geosphere-Biosphere Programme) land cover types.
4.2.2 TCA-based comparison
We then used TCA-R to evaluate the pixel-scale performance of SM anomaly estimates from five satellite products (Figs. 7 and A4). Overall, the SM product performed the best with higher TCA-R values across most regions (spatial median TCA-R = 0.81), followed by , and with spatial median TCA-R ranging from 0.75 to 0.76 (Fig. A4a–d). In contrast, displayed lower accuracy, with a spatial median TCA-R of only 0.58, indicating a notable performance gap compared to the other four SM products (Fig. A4c). Similar to the ISMN in-situ measurements-based evaluation result, the performance ranking for the five SM products was maintained, suggesting robust consistency between the two independent SM evaluation approaches. The spatial patterns and histograms of the TCA-R differences between paired SM products showed absolute median spatial differences in TCA-R of 0.001 and 0.150 (Fig. 7a–l). Notably, the aligned evaluation results indicated that these performance differences for the five SM products originate from TB inputs and the inherent differences in SM retrieval algorithms. demonstrated a clear and consistent performance advantage over most other SM products, including , and , as illustrated in Fig. 7a–c and h–i.
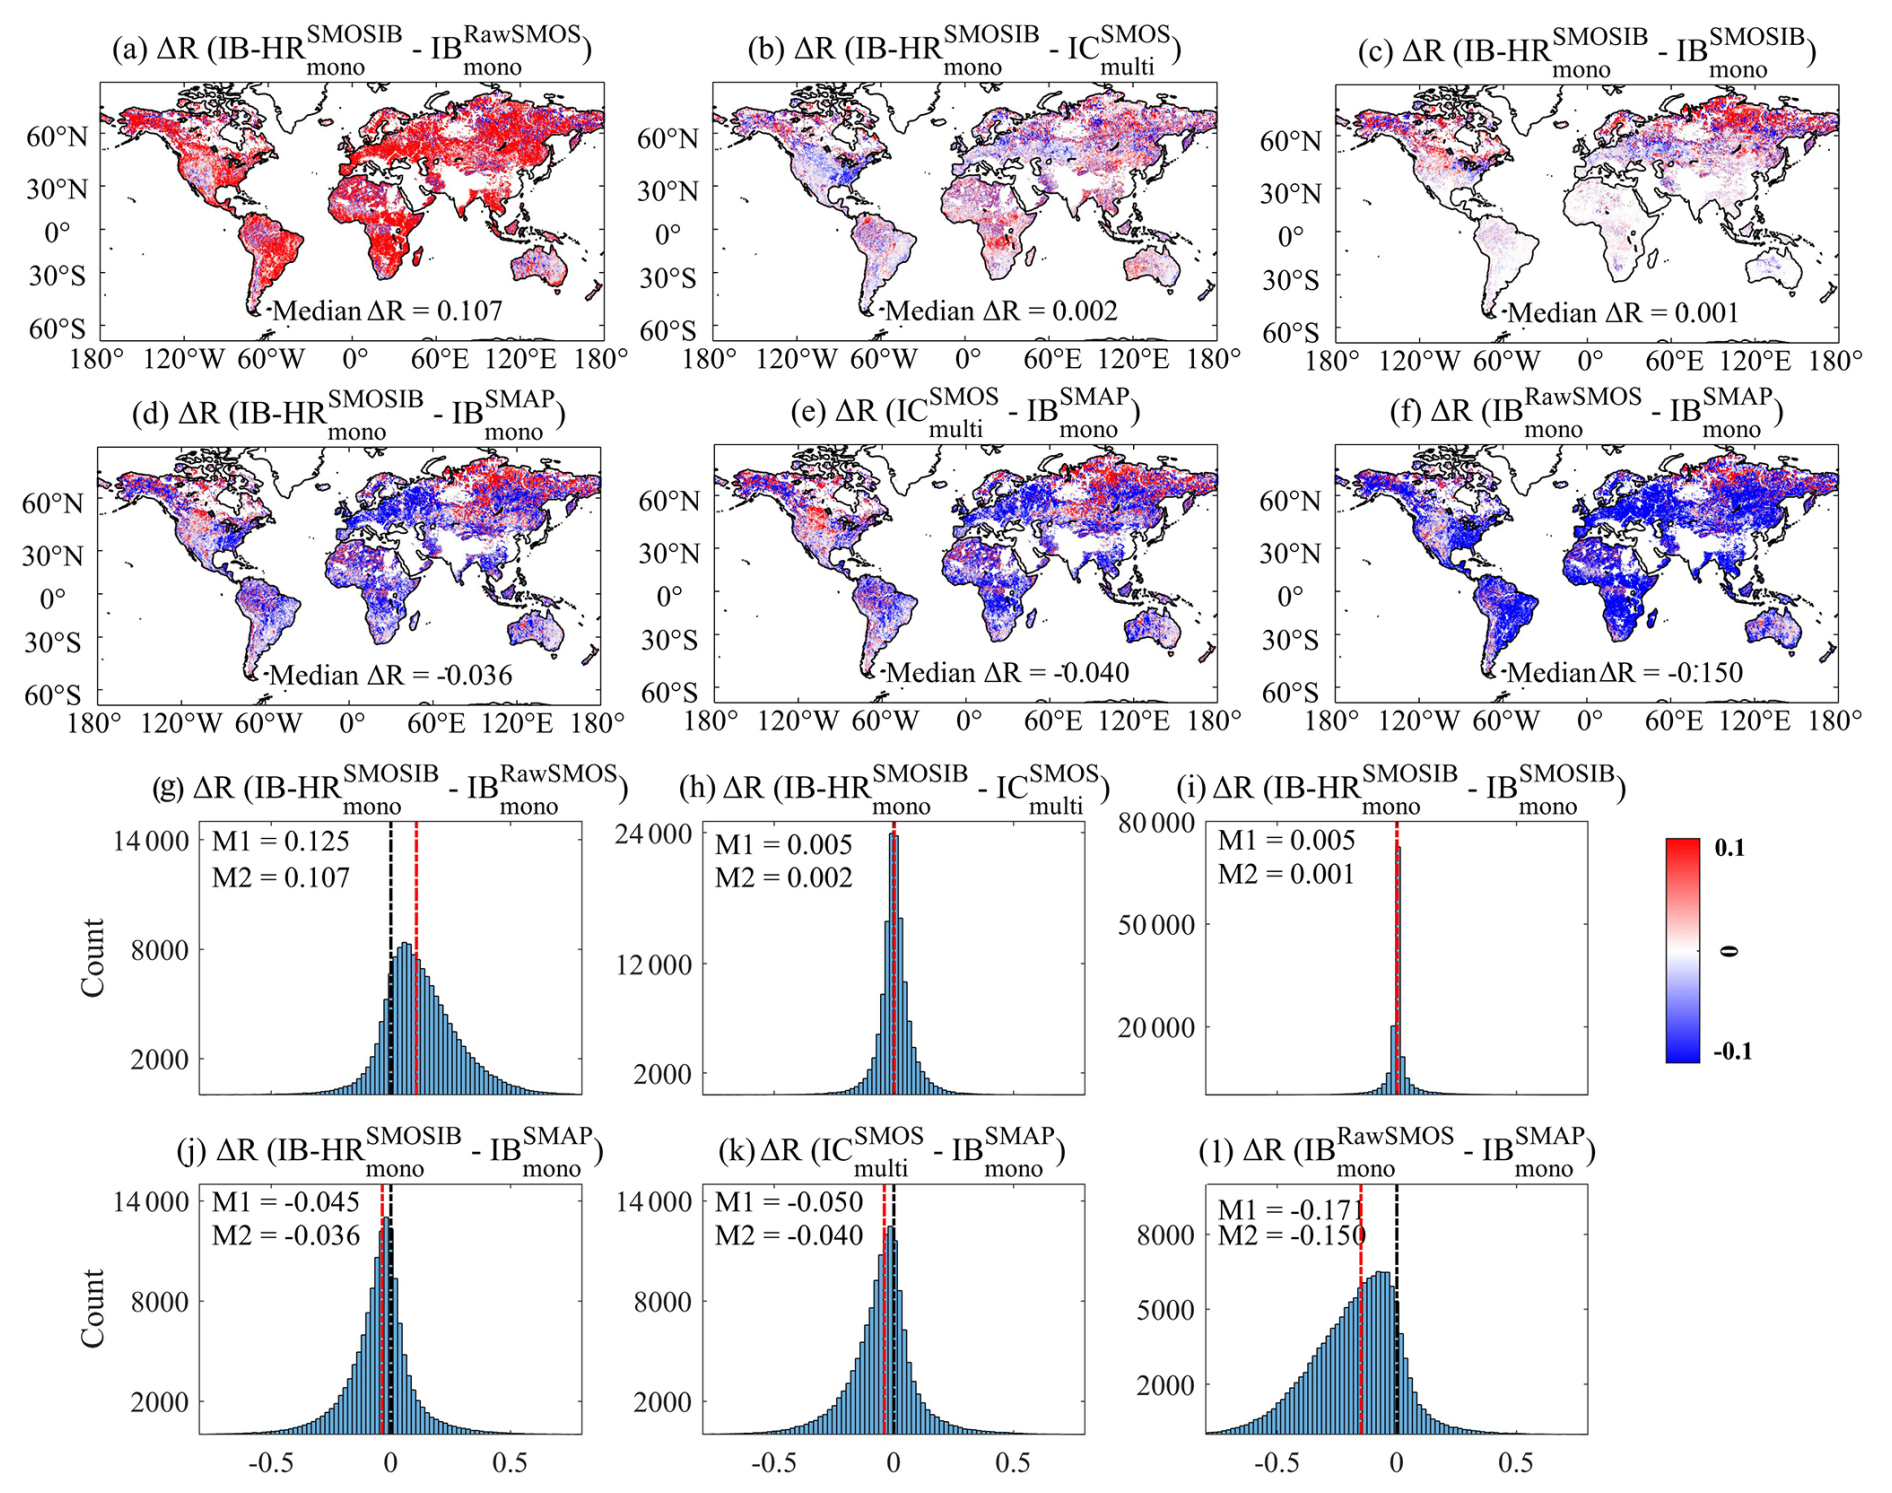
Figure 7Spatial distribution (a–f) and histograms (g–l) of TCA (Triple Collocation Analysis)-based correlation coefficient (R) differences between paired SM (soil moisture) anomaly products. m1 and m2 denote the mean and median (red line) difference value. A black vertical line marks the zero-difference reference.
The performance gap between and was particularly striking, evidenced by both an overwhelmingly red global map, which indicated widespread positive ΔR values, and high median ΔR of 0.107 (Fig. 7a and g). This pronounced visual and quantitative contrast reconfirmed our finding that robust TBs is fundamental to obtaining more accurate SM retrievals. Regarding the performance difference of vs. and , the differences in TCA-R values were distributed with a centroid near zero (absolute mean ΔR = 0.005, median ΔR<0.002), indicating generally consistent performance between these three SM products across most regions, while the extended tails of these distributions reveal non-negligible discrepancies in certain areas (Fig. 7h and i). It is noteworthy that exhibited a distinct deficiency in the northern high latitudes compared to . This resulted from the improved parameterization of surface roughness in the Northern Hemisphere in the new Hr scheme. Unlike the original Hr scheme, which prescribed generally low roughness values solely based on land cover type, the new Hr scheme used in more accurately captured the characteristically high per-pixel roughness there (Fig. A5). This improvement was primarily attributed to the scheme's ability to incorporate the significant influence of high soil organic carbon in the northern high latitude regions (Konkathi et al., 2025).
4.3 Evaluation of the VOD retrievals
Figure 8 presents the spatial density distributions of the five VOD datasets against the aboveground biomass (AGB) map. It was found that the four VOD products showed very similar R values, ranging only from 0.84 for and 0.85 for , and , whereas had the lowest R values of 0.80. Moreover, all five VOD products effectively captured the spatial gradients of AGB, yielding the same highest R values of 0.87 when comparing predicted and observed AGB (Fig. 8a–e). Similarly, the , and VOD products exhibited the same highest spatial R value (0.90) when correlated with forest canopy height, indicating a strong linear relationship – even for tall trees. Followed by and with spatial R of 0.89 and 0.87 (Fig. A6). This aligned with previous VOD validation studies (Li et al., 2021; Rodríguez-Fernández et al., 2018; Zotta et al., 2024), as L-band VOD responded to the full vertical structure of vegetation, encompassing woody components (Frappart et al., 2020). These findings suggested that, in terms of spatial patterns, it was difficult to distinguish clear advantages among the five products. Nevertheless, given the comparable influence of VOD and Hr in the τ–ω model and their strong coupling (Eq. 1), we plotted each VOD product against the corresponding Hr used in its retrieval (Fig. 8a1–e1). It was found that VOD demonstrated a notably weaker spatial correlation with its Hr (R=0.39) than the other VOD products using IGBP-based Hr schemes (R>0.70). This decoupling effect was particularly evident in forested areas, where the spatial R between VOD and Hr () was the lowest among all products, while the others showed R>0.57. These findings collectively indicate that the new Hr scheme effectively mitigated the coupling effect with VOD, leading to more physically independent VOD retrievals compared with the IGBP-based Hr schemes.
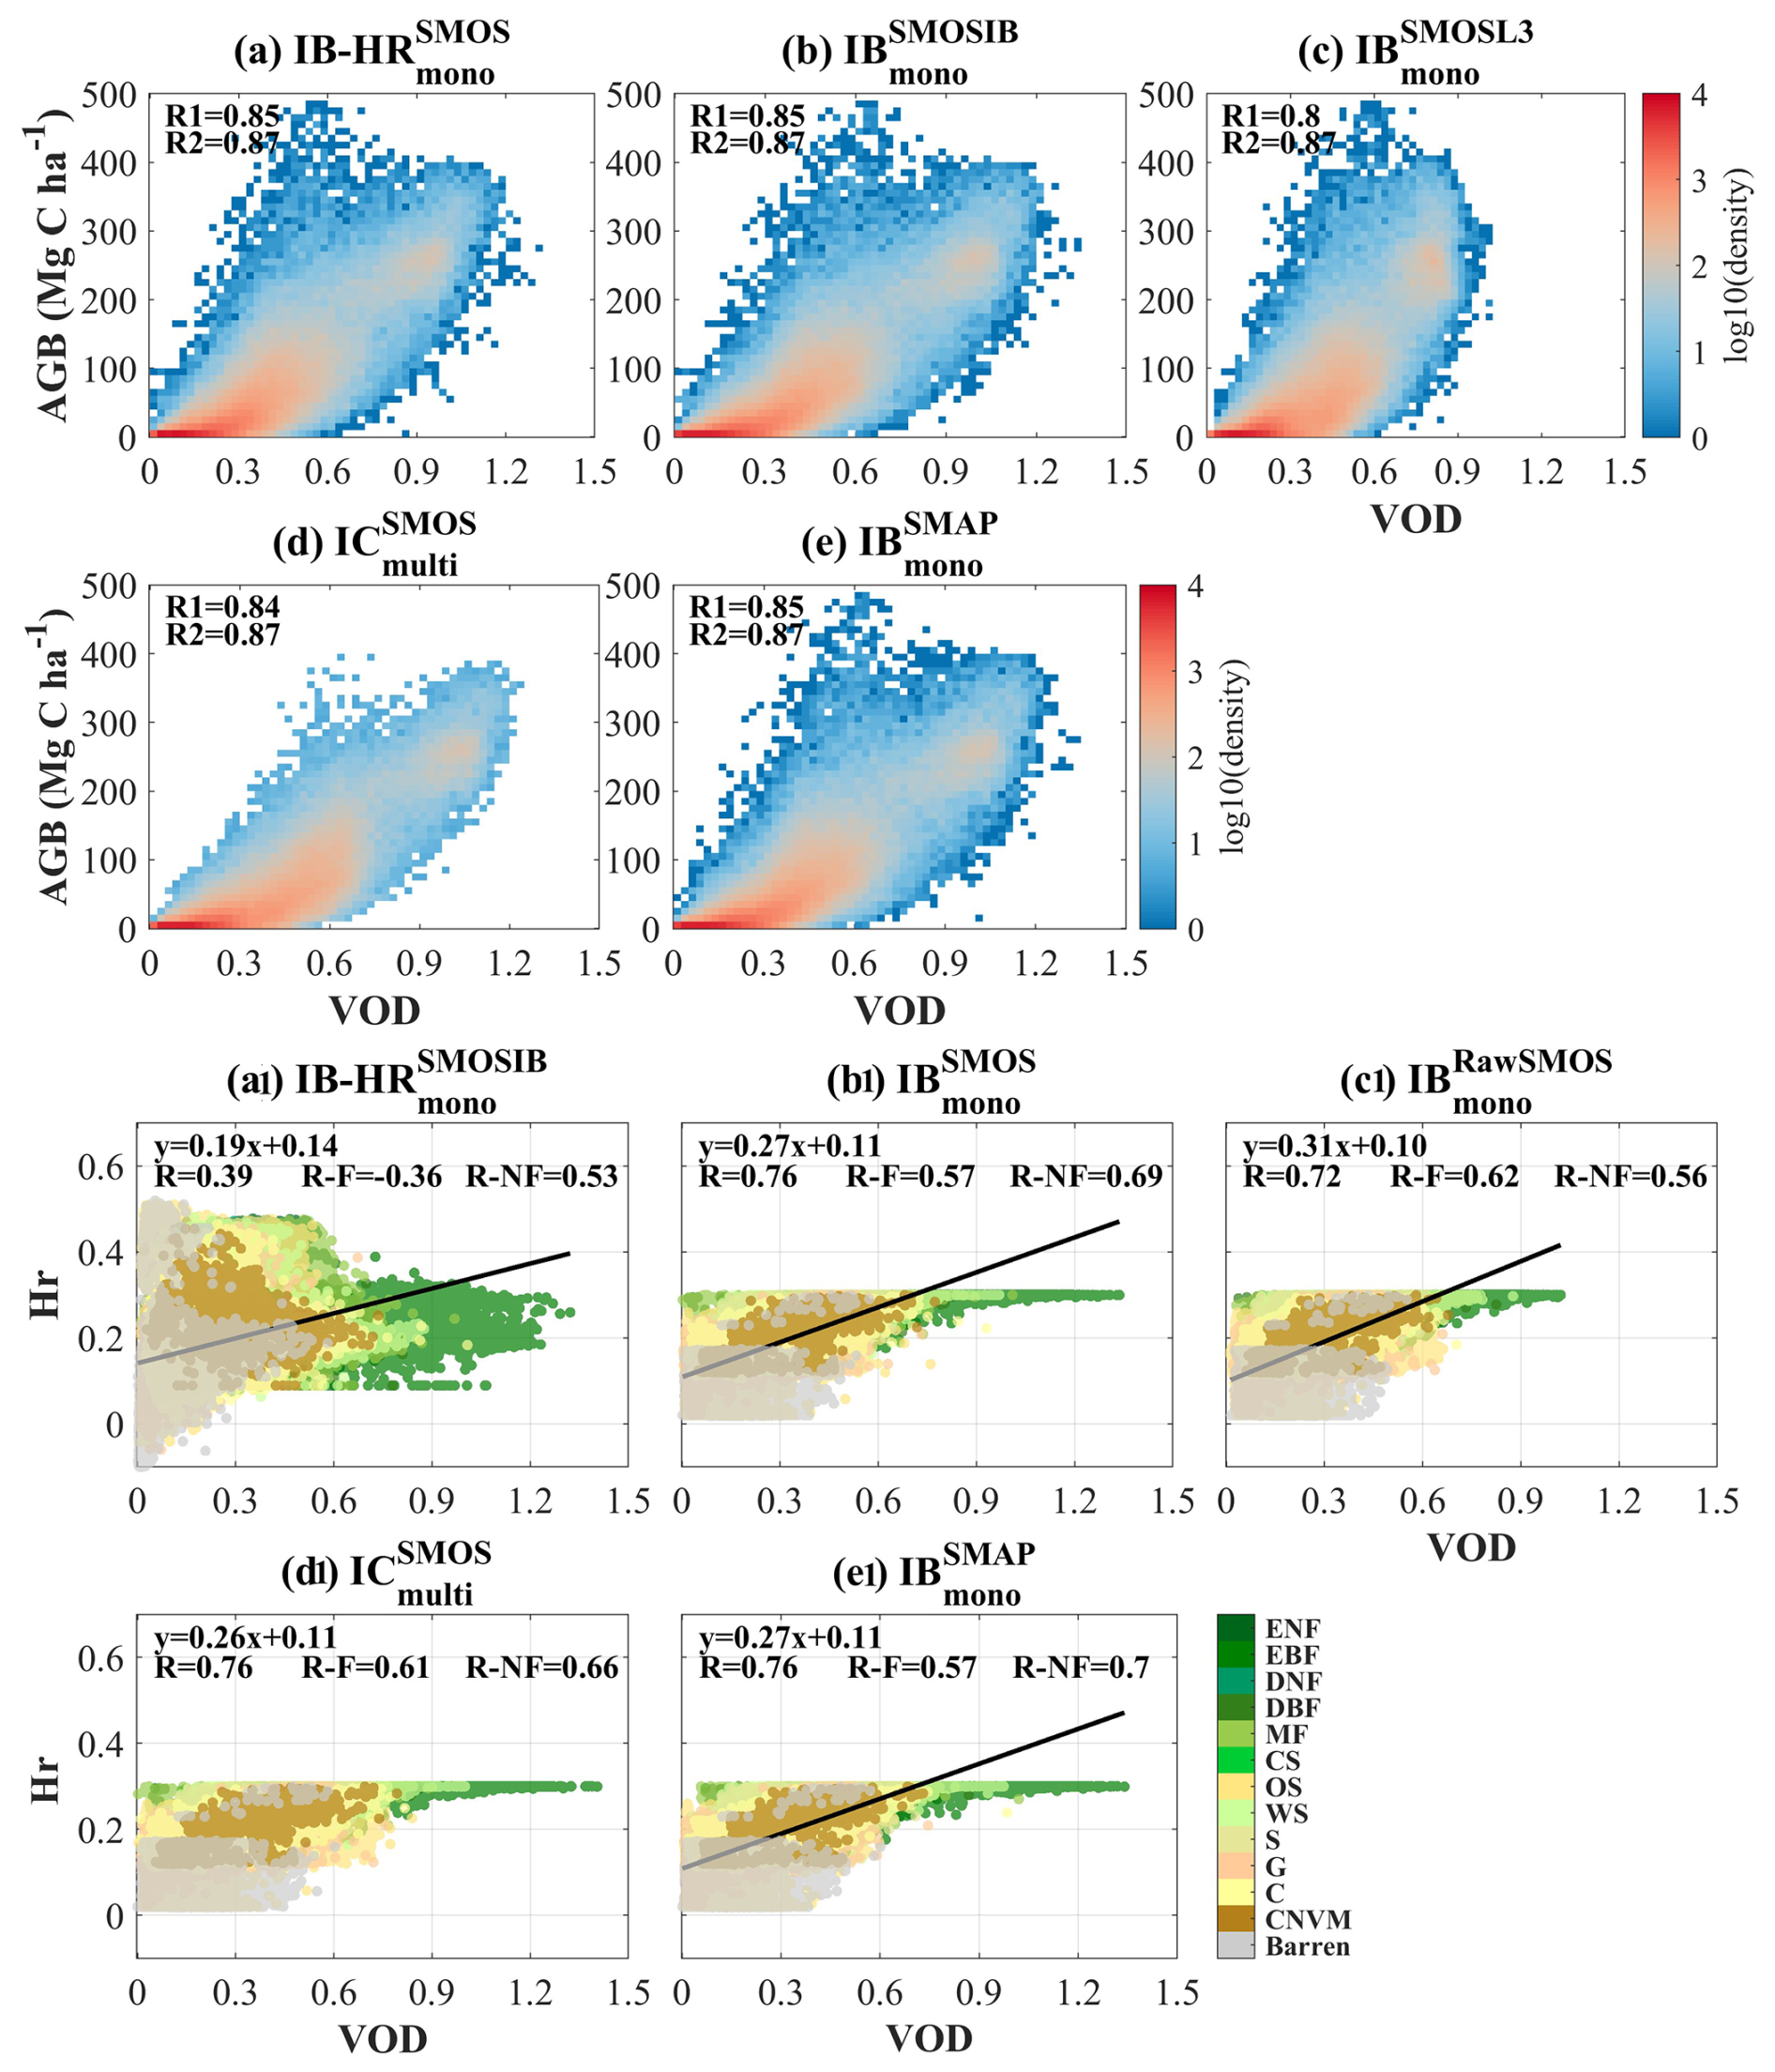
Figure 8Global density plots of VOD (vegetation optical depth) vs. AGB (aboveground biomass) for five products: (a) , (b) , (c) , (d) and (e) . R1 denotes the correlation coefficient (R) between VOD and AGB, and R2 denotes the R between VOD-predicted AGB and reference AGB. Panels (a1)–(e1) show VOD vs. Hr scatter plots for the same products, with spatial correlations reported for all pixels (R), forest pixels (R-F) and non-forest pixels (R-NF).
The per-pixel temporal correlation coefficient between the five VOD datasets and CWC were also calculated to examine the discrepancy of the temporal performances for the VOD datasets (Fig. 9). All VOD products exhibited consistent spatial patterns in their temporal R values with vegetation dynamics, particularly across eastern US, southern Africa, eastern Brazil, Siberia, and Australia (Fig. 9a–d), with the VOD product showing particularly widespread non-significant pixels across these biomes (Fig. 9e). Figure 9f identifies the VOD dataset with the strongest per-pixel temporal R values (absolute R difference >0.1) after excluding non-significant pixels. It was found that , and demonstrated highest R values with CWC across 41 %, 24 % and 21 % of the analyzed pixels, respectively, with these pixels mainly located in mid- to low-latitude regions (e.g., Australia, South, East and West Africa, and America). Similar findings were also obtained when NDVI was used as a reference (Fig. A7). It is noteworthy that the temporal R between and CWC was generally higher than that derived using across most regions globally, particularly in high vegetated regions (e.g., Australia, Central North America, Amazon, Central Africa, etc.). This finding underscored the advantage of incorporating optimized Hr inputs in VOD retrievals, because the key distinction between the two VOD products lied in the optimization of roughness inputs. Similarly, Konkathi et al. (2025) also showed that the improved VOD-NDVI correlation in these regions resulted from their refined Hr scheme, which mitigated SM and VOD compensations (Fig. A8).
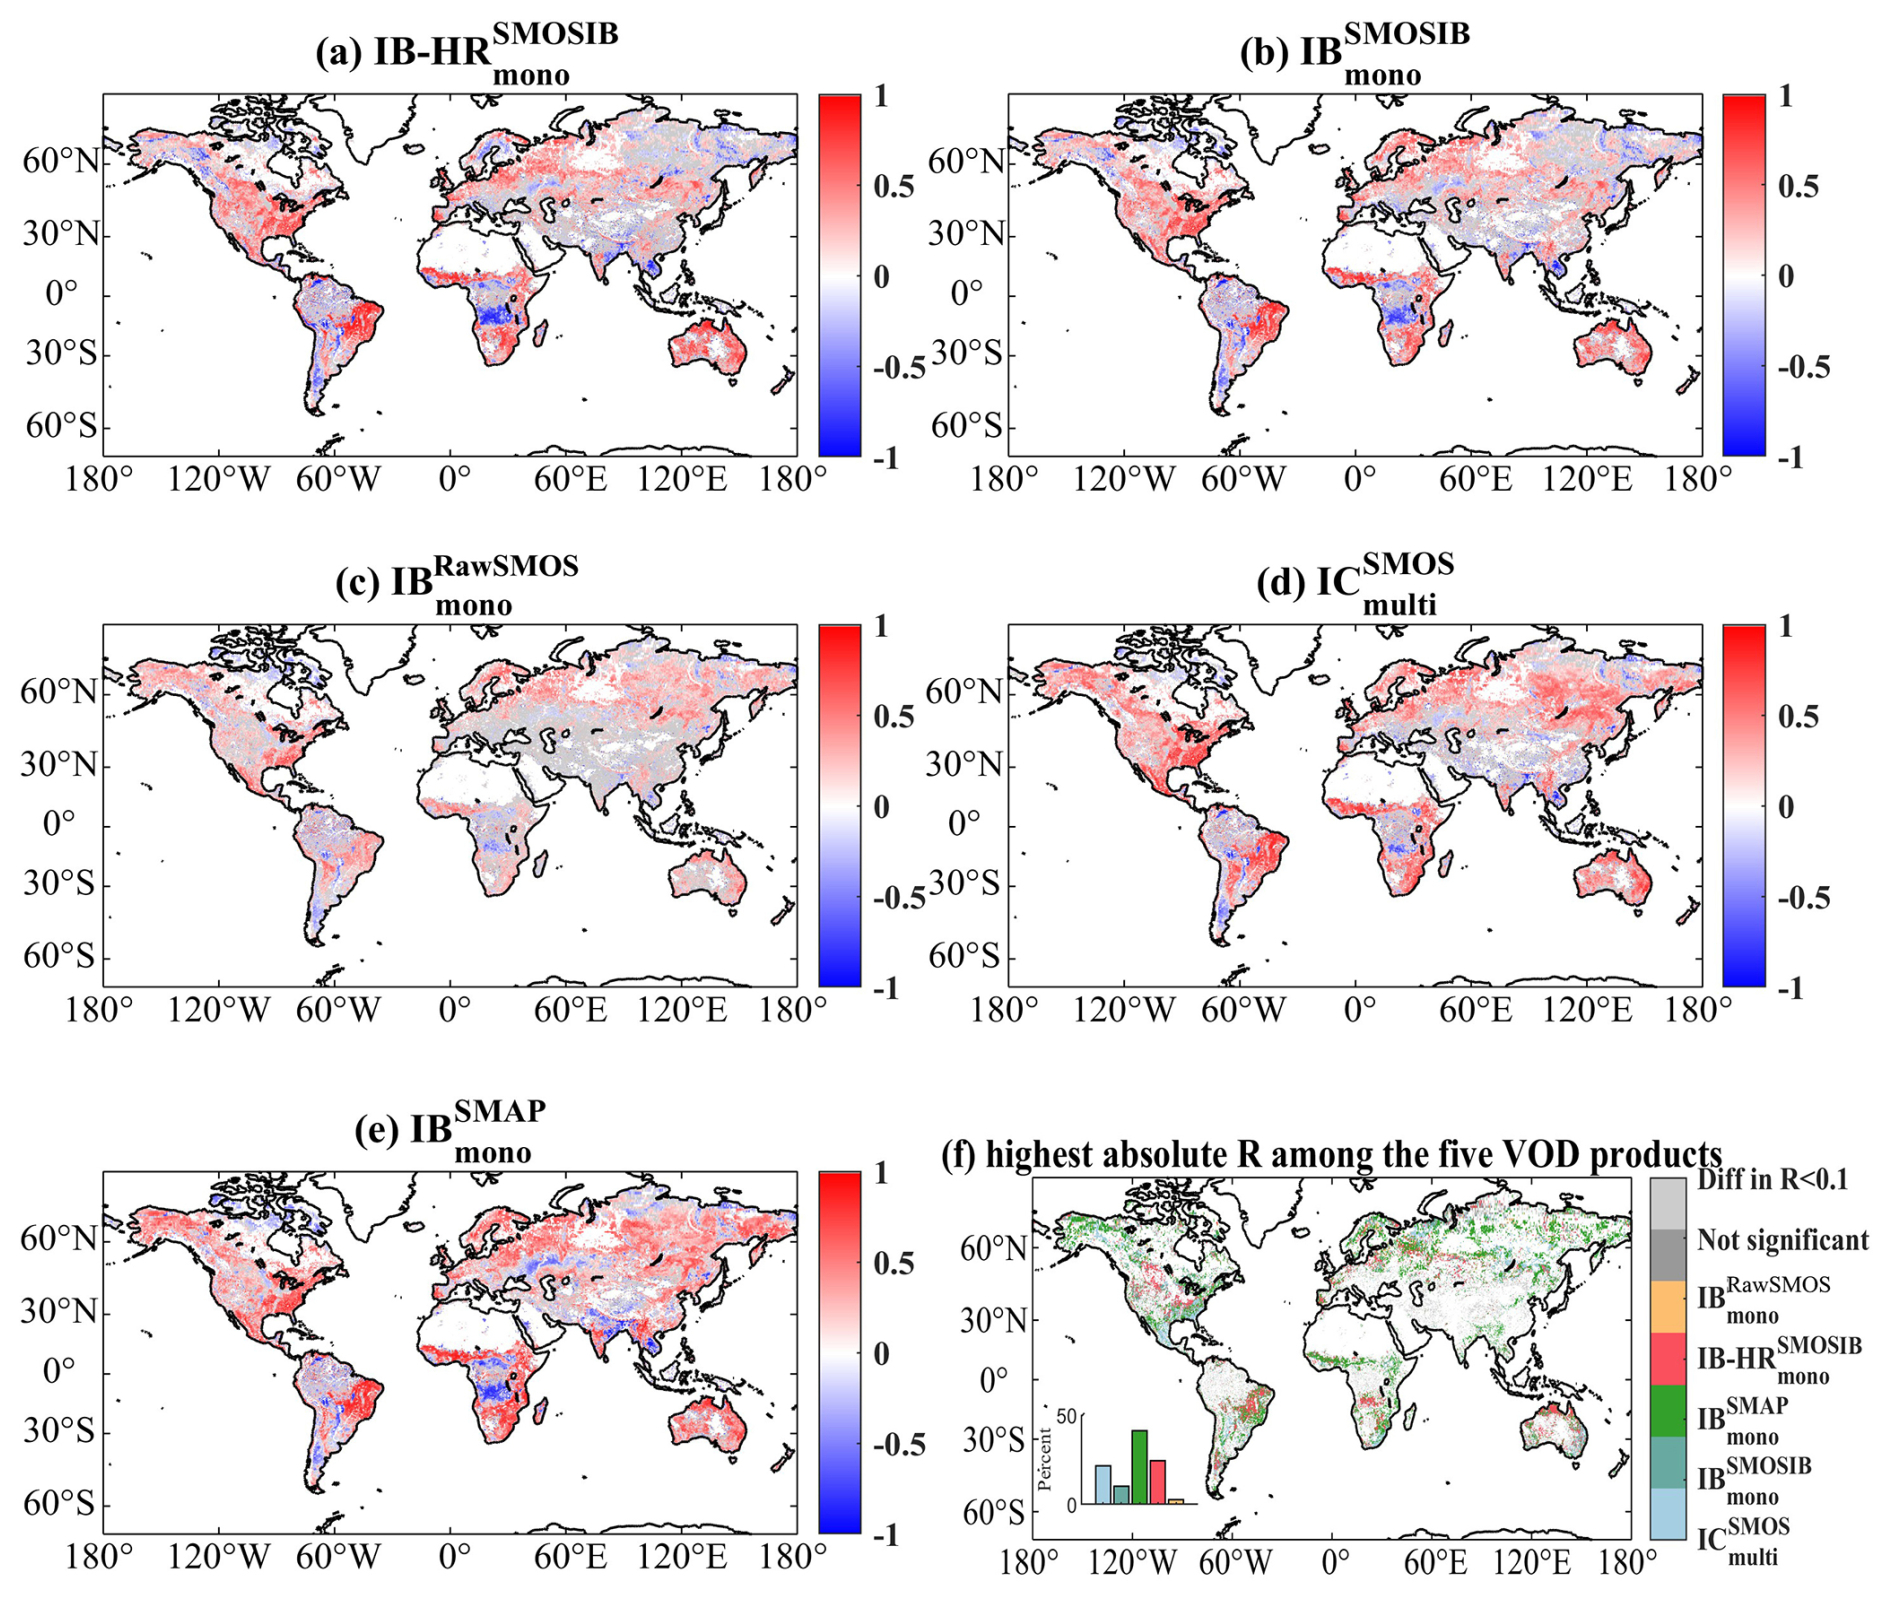
Figure 9Temporal correlation between VOD (vegetation optical depth) and CWC (canopy water content) (2016–2022) for (a) , (b) , (c) , (d) and (e) . (f) Maps of the above five VOD products with the highest absolute correlation coefficient (R) values with CWC. Non-significant R are represented by dark grey pixels (p>0.05), and the light grey color indicates pixels with R difference for each paired VOD product < 0.1. White areas represent “no valid data”.
The global SMOS-IB TB, SM and VOD datasets for the period 2010–2024 can be freely downloaded at https://doi.org/10.5281/zenodo.17647385 (Xing et al., 2025) and will be continuously maintained on the INRAE Bordeaux Remote Sensing Product website (https://ib.remote-sensing.inrae.fr/, last access: 1 June 2026).
In this study, we first generated an optimized global 40° SMOS TB dataset and then derived the corresponding mono-angular SM and VOD datasets using the SMAP-IB retrieval framework. This mono-angular approach was specifically designed to isolate and investigate the underlying causes of performance differences between existing SMOS and SMAP products retrieved from different algorithms and satellite observations. To achieve this, a comprehensive evaluation of TB, SM and VOD retrievals was conducted against ISMN in-situ SM data and four vegetation parameters (i.e., CWC, Saatchi AGB, canopy height, and MODIS NDVI), by inter-comparison with other four datasets (i.e., , , , and ). The following key conclusions are drawn:
Our evaluation showed that the newly developed dataset demonstrated robust performance for TB as well as SM and VOD retrievals. Specifically, the optimized 40° SMOS-IB TB had markedly lower noise than the SMOS-L3 TB and provided global accuracy comparable to SMAP-L3. Correspondingly, the SM product derived from SMOS-IB TB also achieved an accuracy (median R of 0.67, ubRMSD of 0.059 m3 m−3) comparable to . Moreover, it clearly outperformed (median R of 0.65, ubRMSD of 0.063 m3 m−3) and (median R of 0.64, ubRMSD of 0.063 m3 m−3).
Regarding VOD retrievals, although all five products exhibited similar spatial relationships with AGB (R ∼ 0.85), the new Hr scheme effectively decoupled surface roughness from vegetation contributions, thereby enabling more physically-based VOD retrievals. Consistently, the temporal correlation between and CWC was generally higher than that obtained using in moderate to high vegetated regions, further confirming the role of optimized Hr inputs in the VOD retrievals.
Under the same algorithmic framework, the better performance of and SM products over SM demonstrated that high-quality TB inputs enabled more accurate SM retrievals. Building on this, the refined Hr retrieval scheme further improved performance, as performed better than in many in-situ networks, with particularly enhanced accuracy in the northern high latitudes. Our results demonstrated that a mono-angular approach was not necessarily less effective than a multi-angular one. In particular, the combined use of optimized mono-angular observations and an advanced retrieval algorithm (e.g., SMAP-IB) can yield better results than multi-angle approaches (e.g., the SMOS-IC algorithm).
Our evaluation demonstrated that the mono-angular SMOS-IB TB, SM and VOD products achieved performance comparable to SMAP product, while outperforming multi-angular SMOS products in most cases. Therefore, SMOS-IB holds potential for broader applications, such as drought monitoring, assessing vegetation water dynamics for plant stress evaluation, and supporting eco-hydrological studies. This study also contributed to the longstanding issue about the relative importance of algorithm design versus instrument characteristics in L-band radiometry. Our findings provided evidence that future mission development should prioritize both the refinement and selection of suitable retrieval algorithms and improvements in TB observation quality. Taken together, these results offered valuable scientific insights for guiding future algorithm selection and supporting the continued advancement of upcoming satellite missions.
Table A1Summary of the in-situ networks from ISMN (International Soil Moisture Network) used in the study. The number of stations/pixels included in each MODIS (Moderate Resolution Imaging Spectroradiometer) IGBP (International Geosphere-Biosphere Programme) land cover type is also listed.
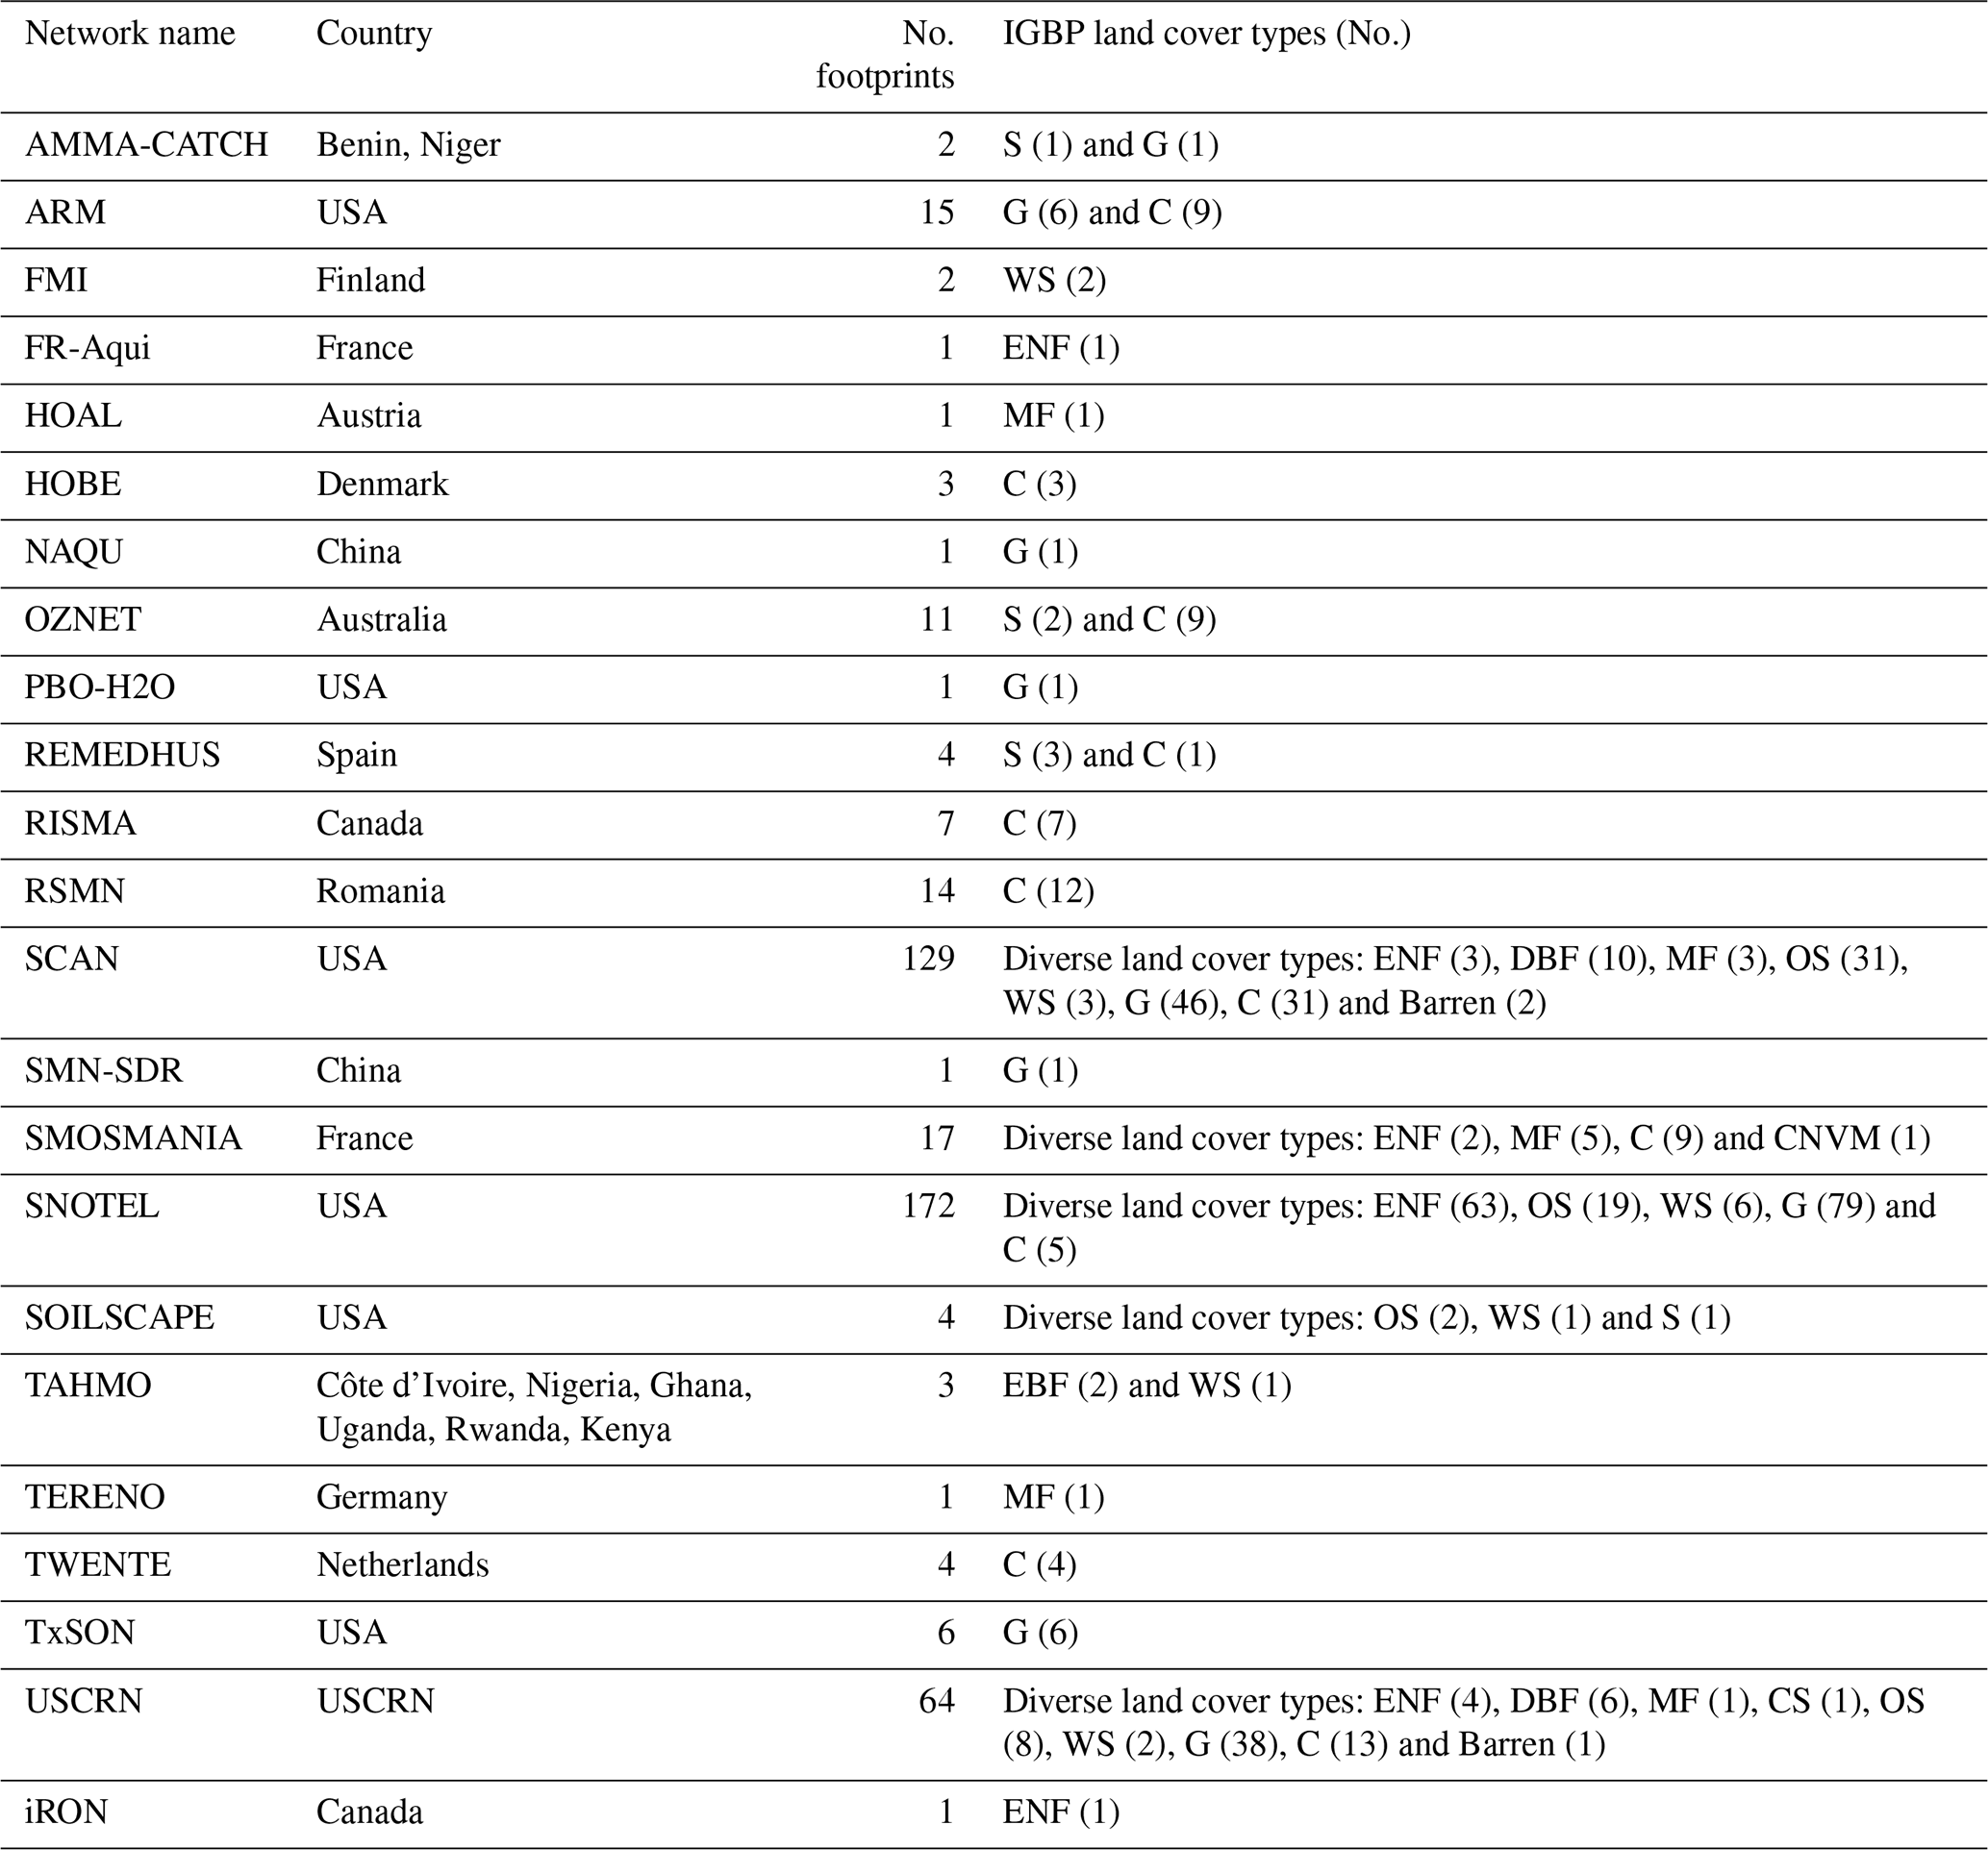
Table A2Summary of the SMOS-IB filtering procedures.
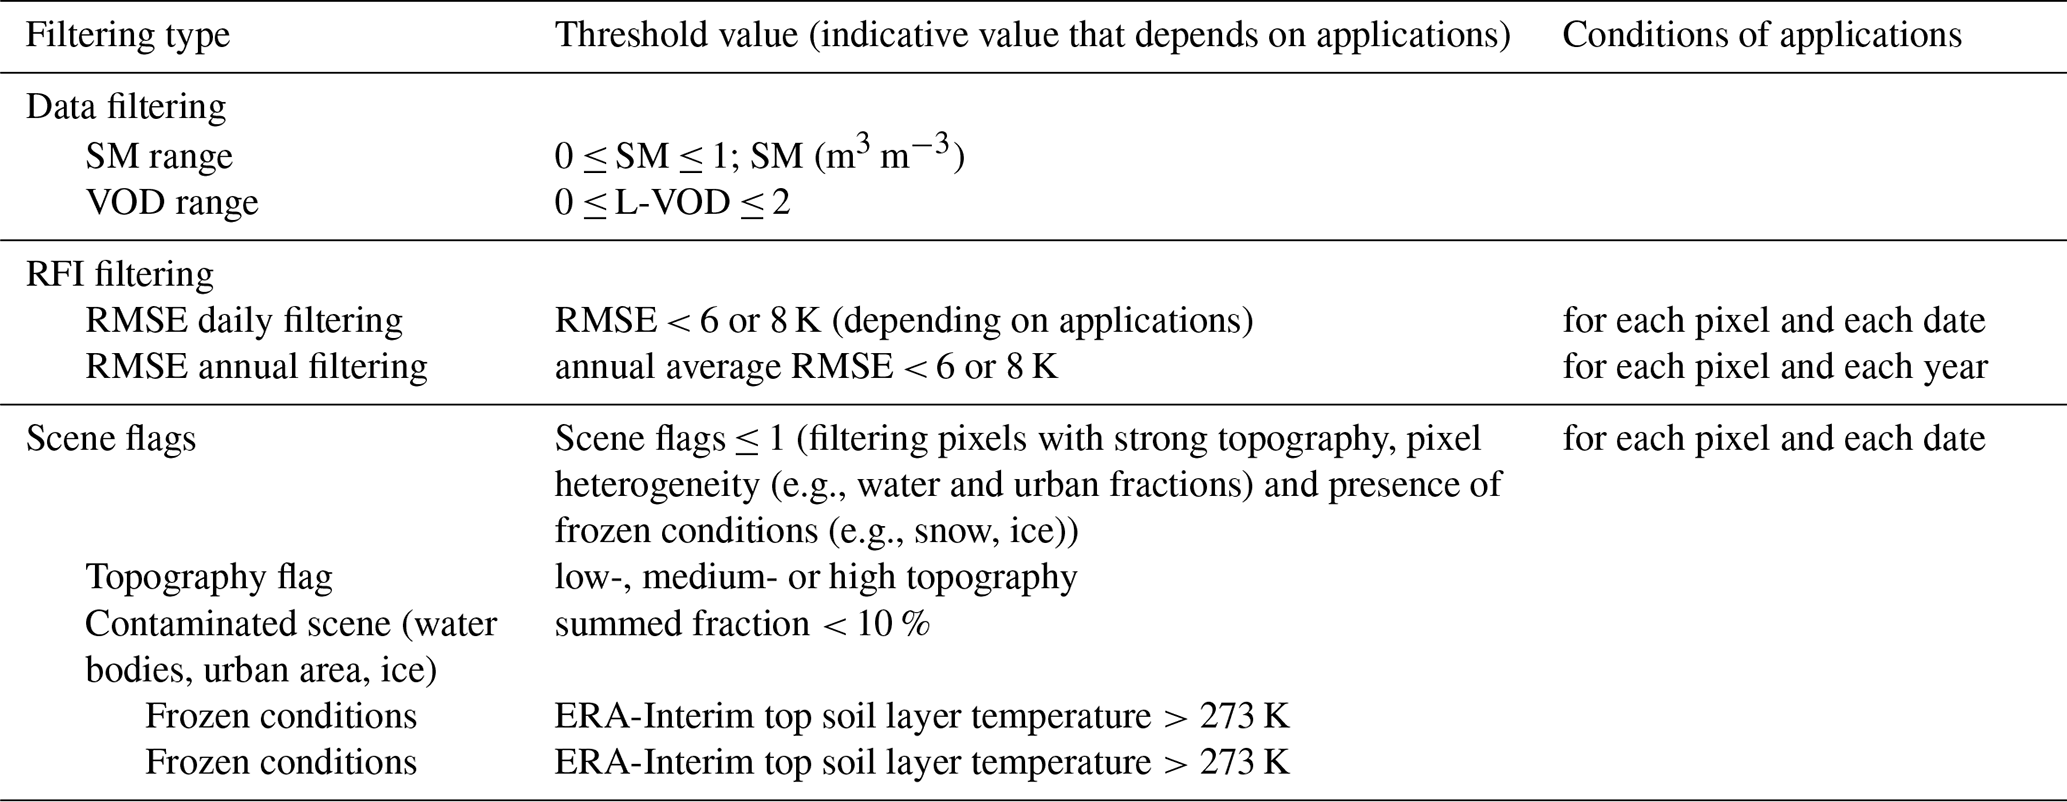
Note: Data filtering is done after computing yearly average, as negative daily SM (soil moisture) or VOD (vegetation optical depth) values are not physical but are numerically possible in arid areas and should not be deleted before computing yearly averages. RFI (Radio-Frequency Interference); RMSE (Root Mean Square Error value between the brightness temperature).
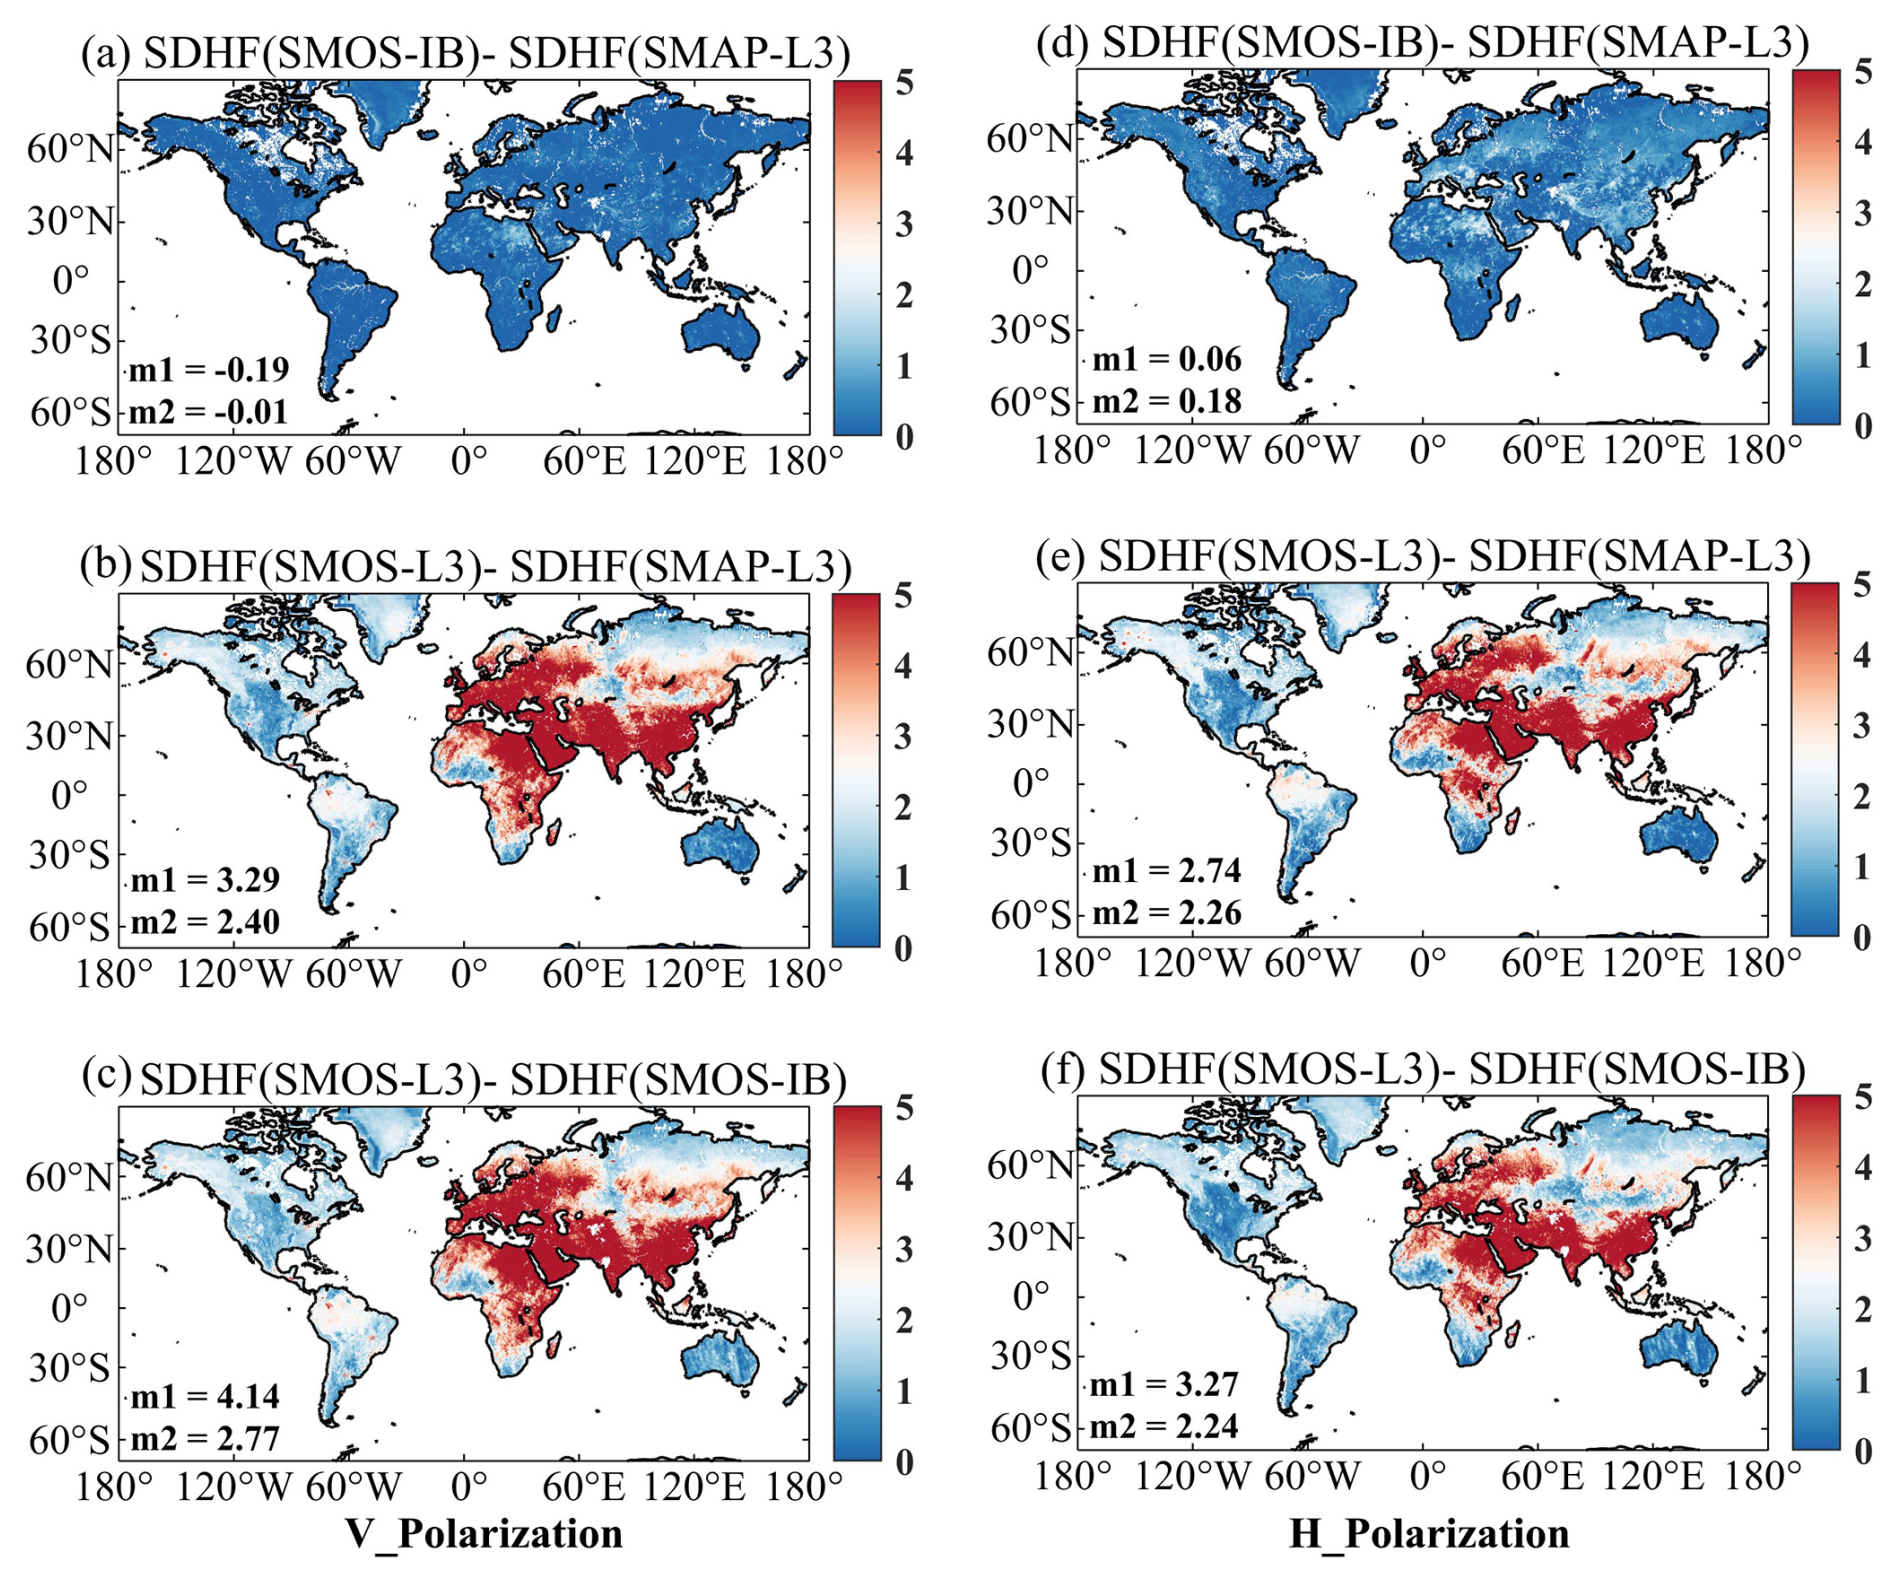
Figure A1Maps of the standard deviation of the high-frequency variations (SDHF) difference of the TB (brightness temperature) time series for each of the three TB products in V-polarization (a–c) and H-polarization (d–f). The TB SDHF were computed after removing the seasonal trend that was estimated with a 30 d moving window average filter. m1 and m2 denote the spatial mean and median SDHF difference value, respectively.
Table A3Statistics of validation results of , , , and against ISMN (International Soil Moisture Network) in-situ SM (soil moisture) data for 2016–2022. Best performance in terms of R, ubRMSD and Bias of the five SM retrievals in each network is typed in bold.
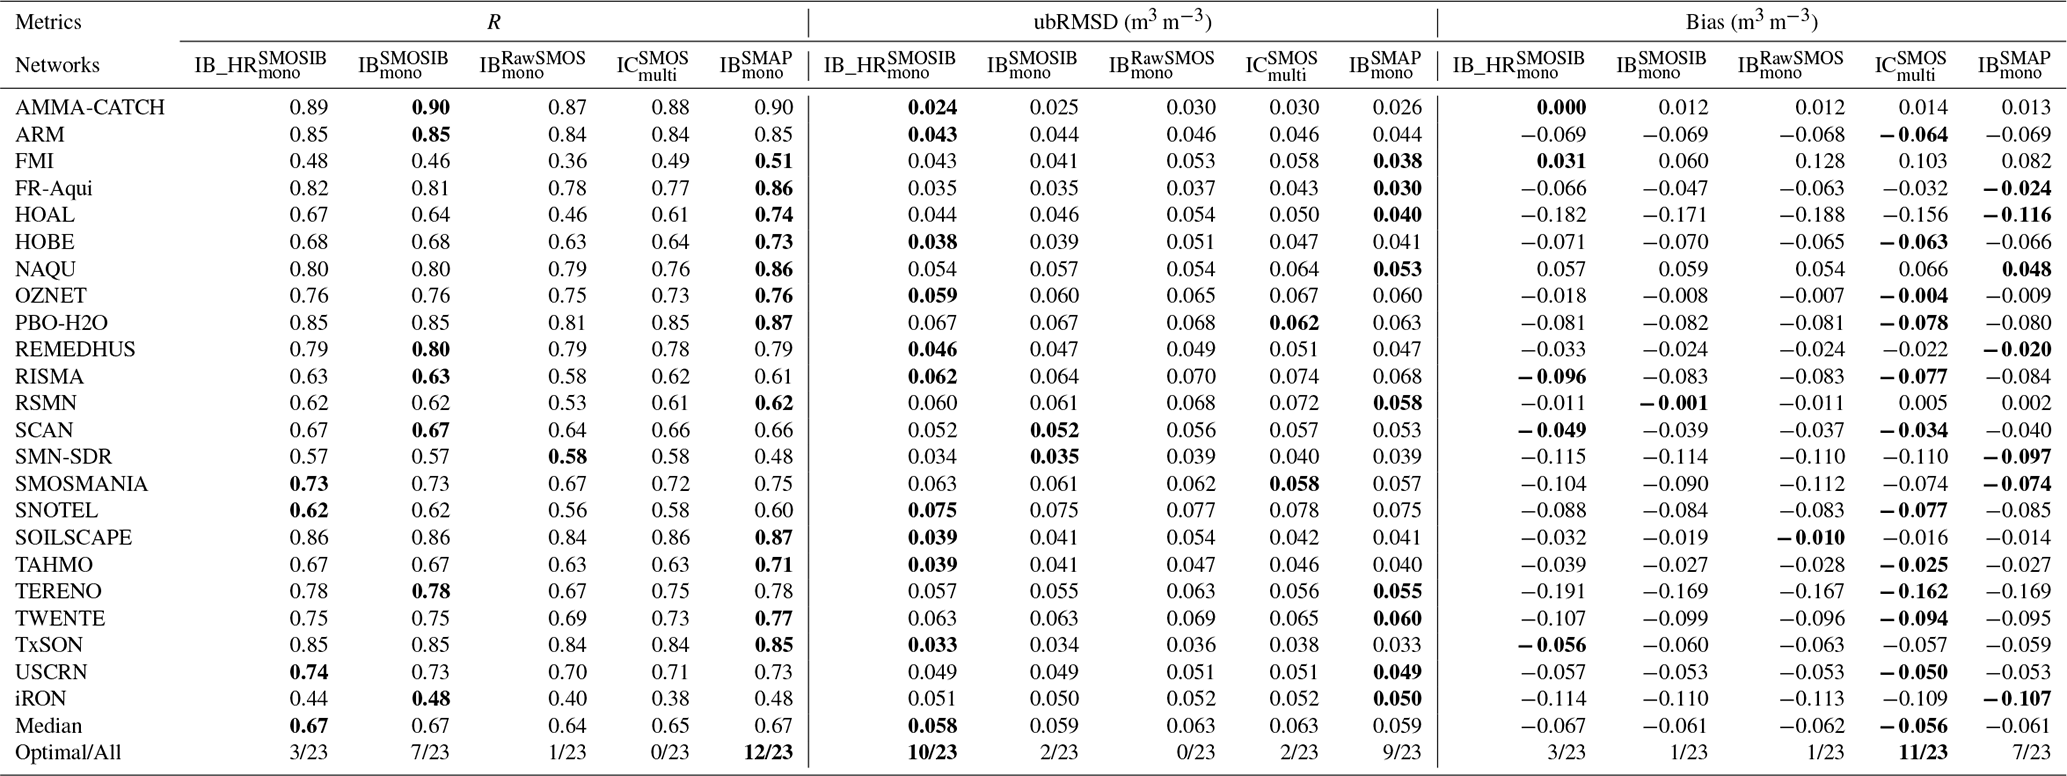
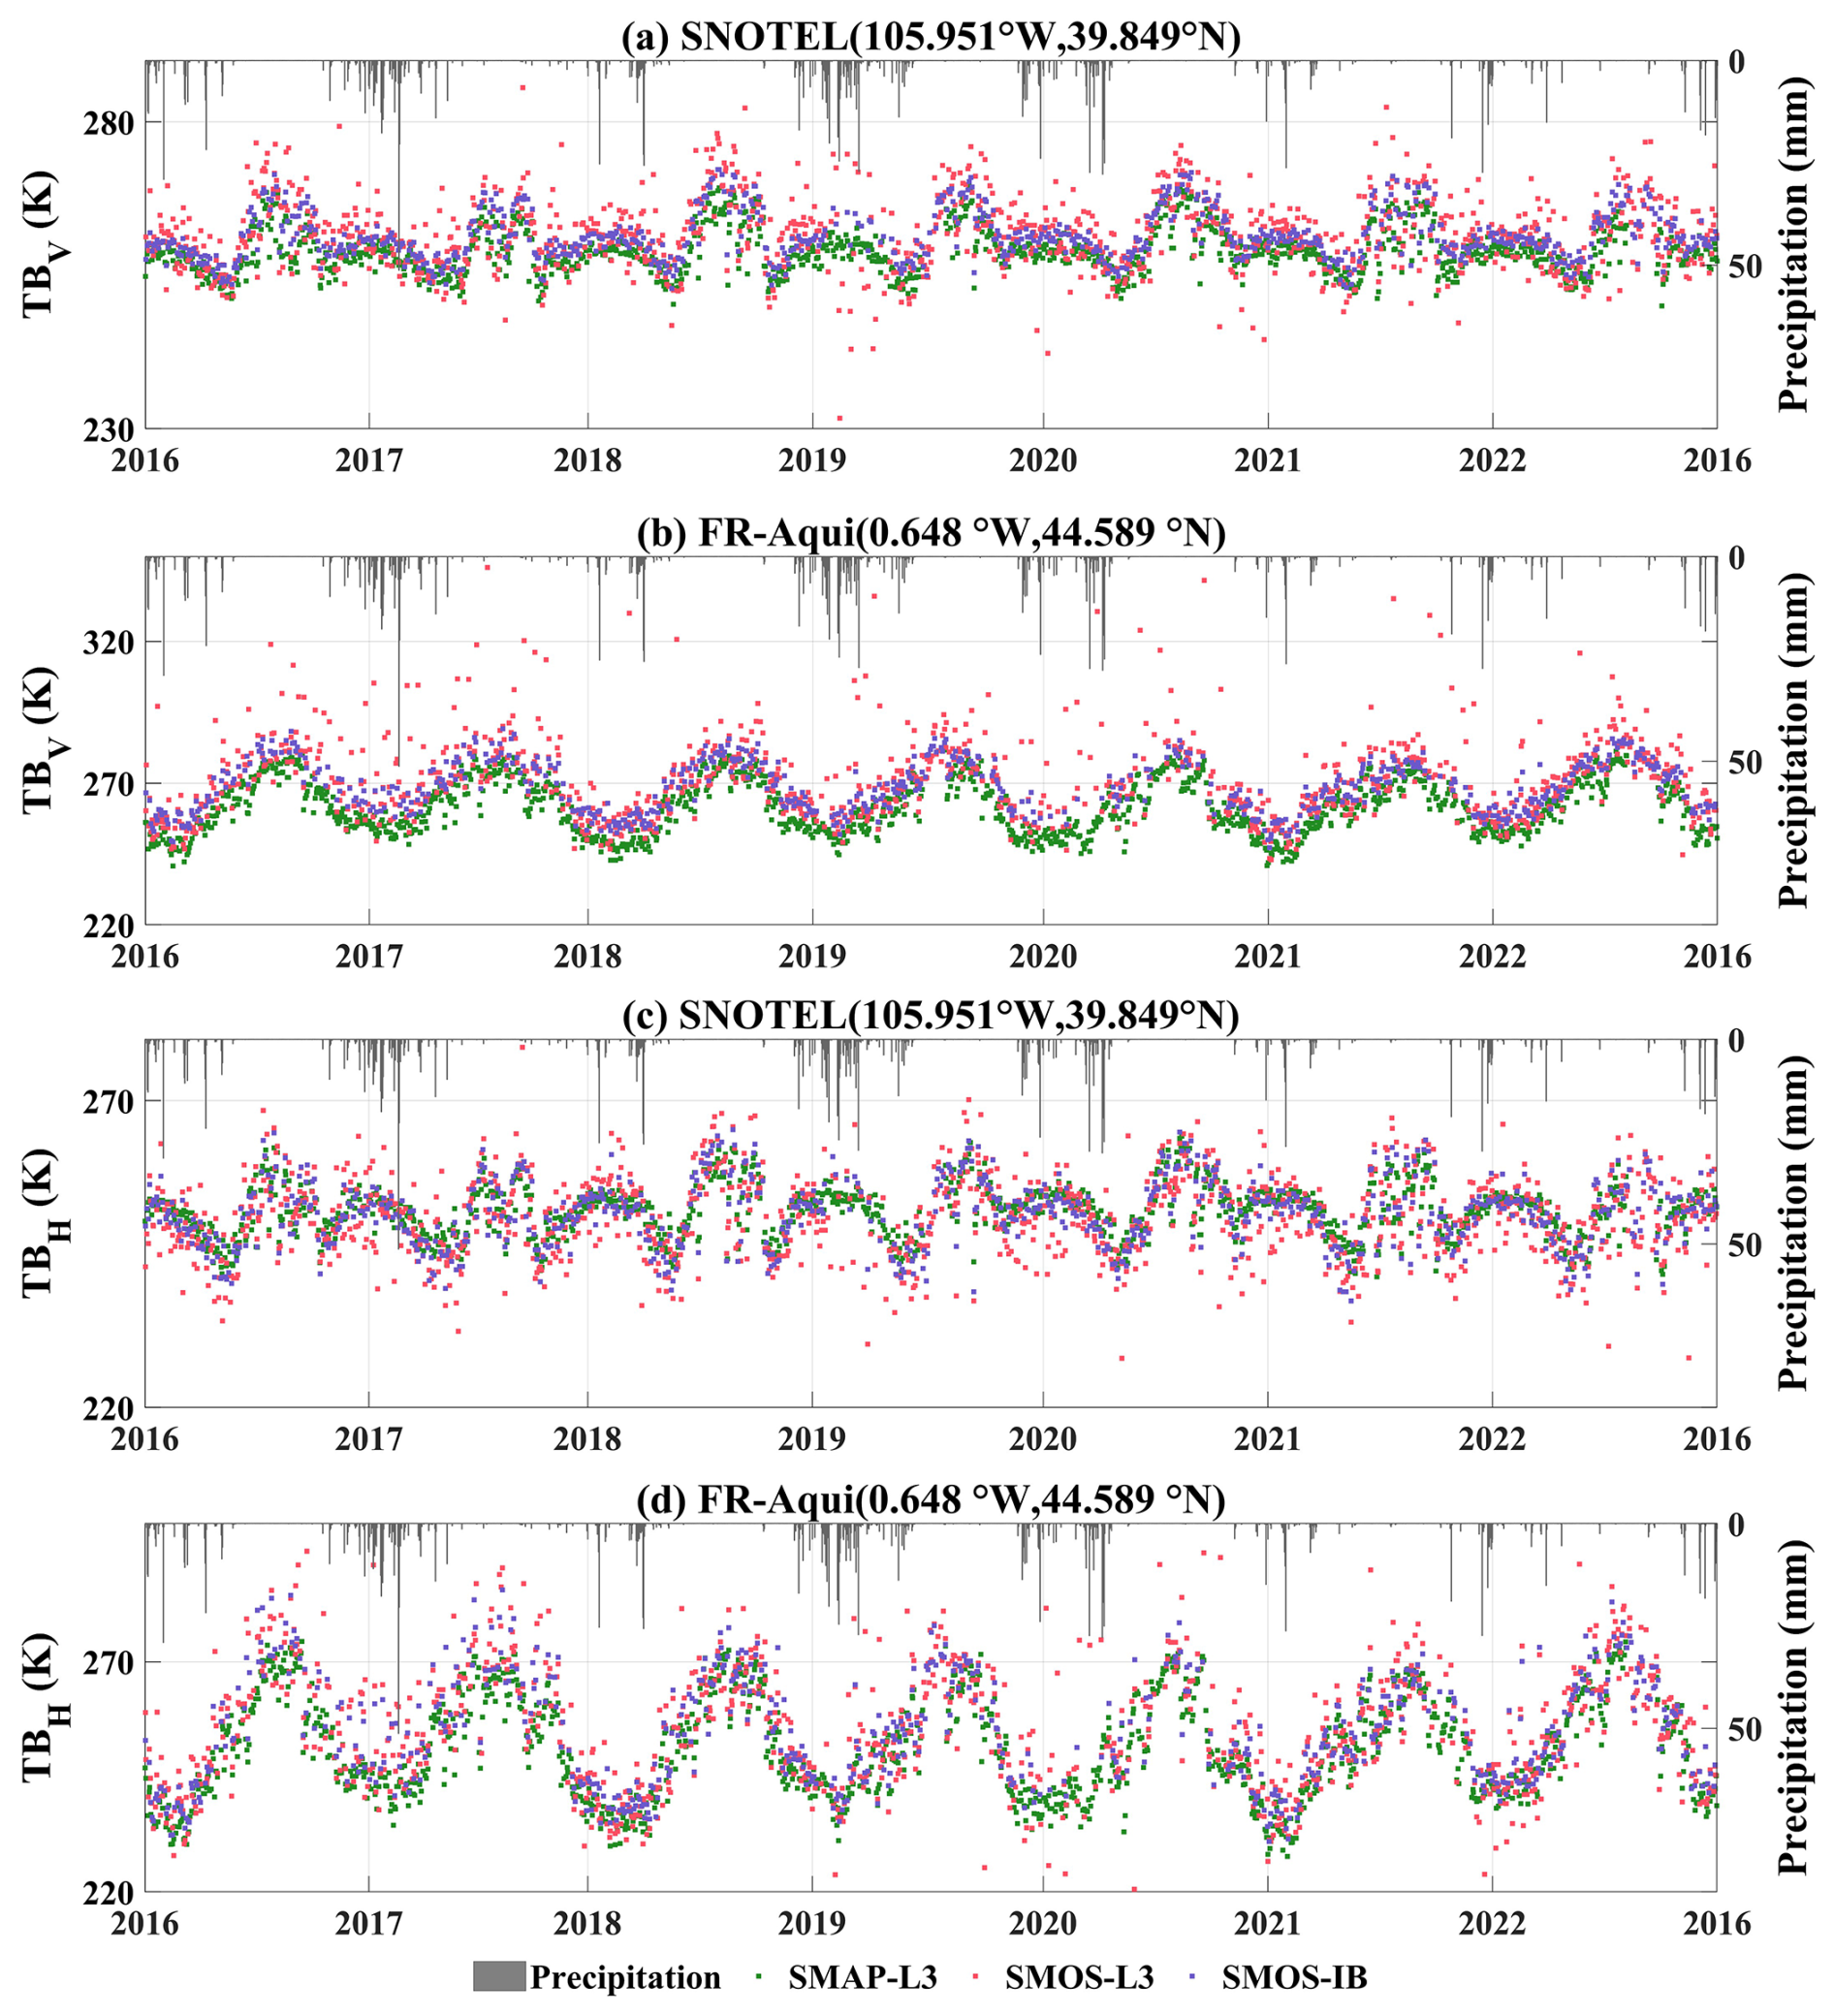
Figure A2Time series of the three TB (brightness temperature) products and in-situ measurements between 2016 and 2022 at two sites from (a) SCAN and (b) FR-Aqui network, respectively. Each plot also contains daily precipitation shown in the axis on the right side (grey bar).
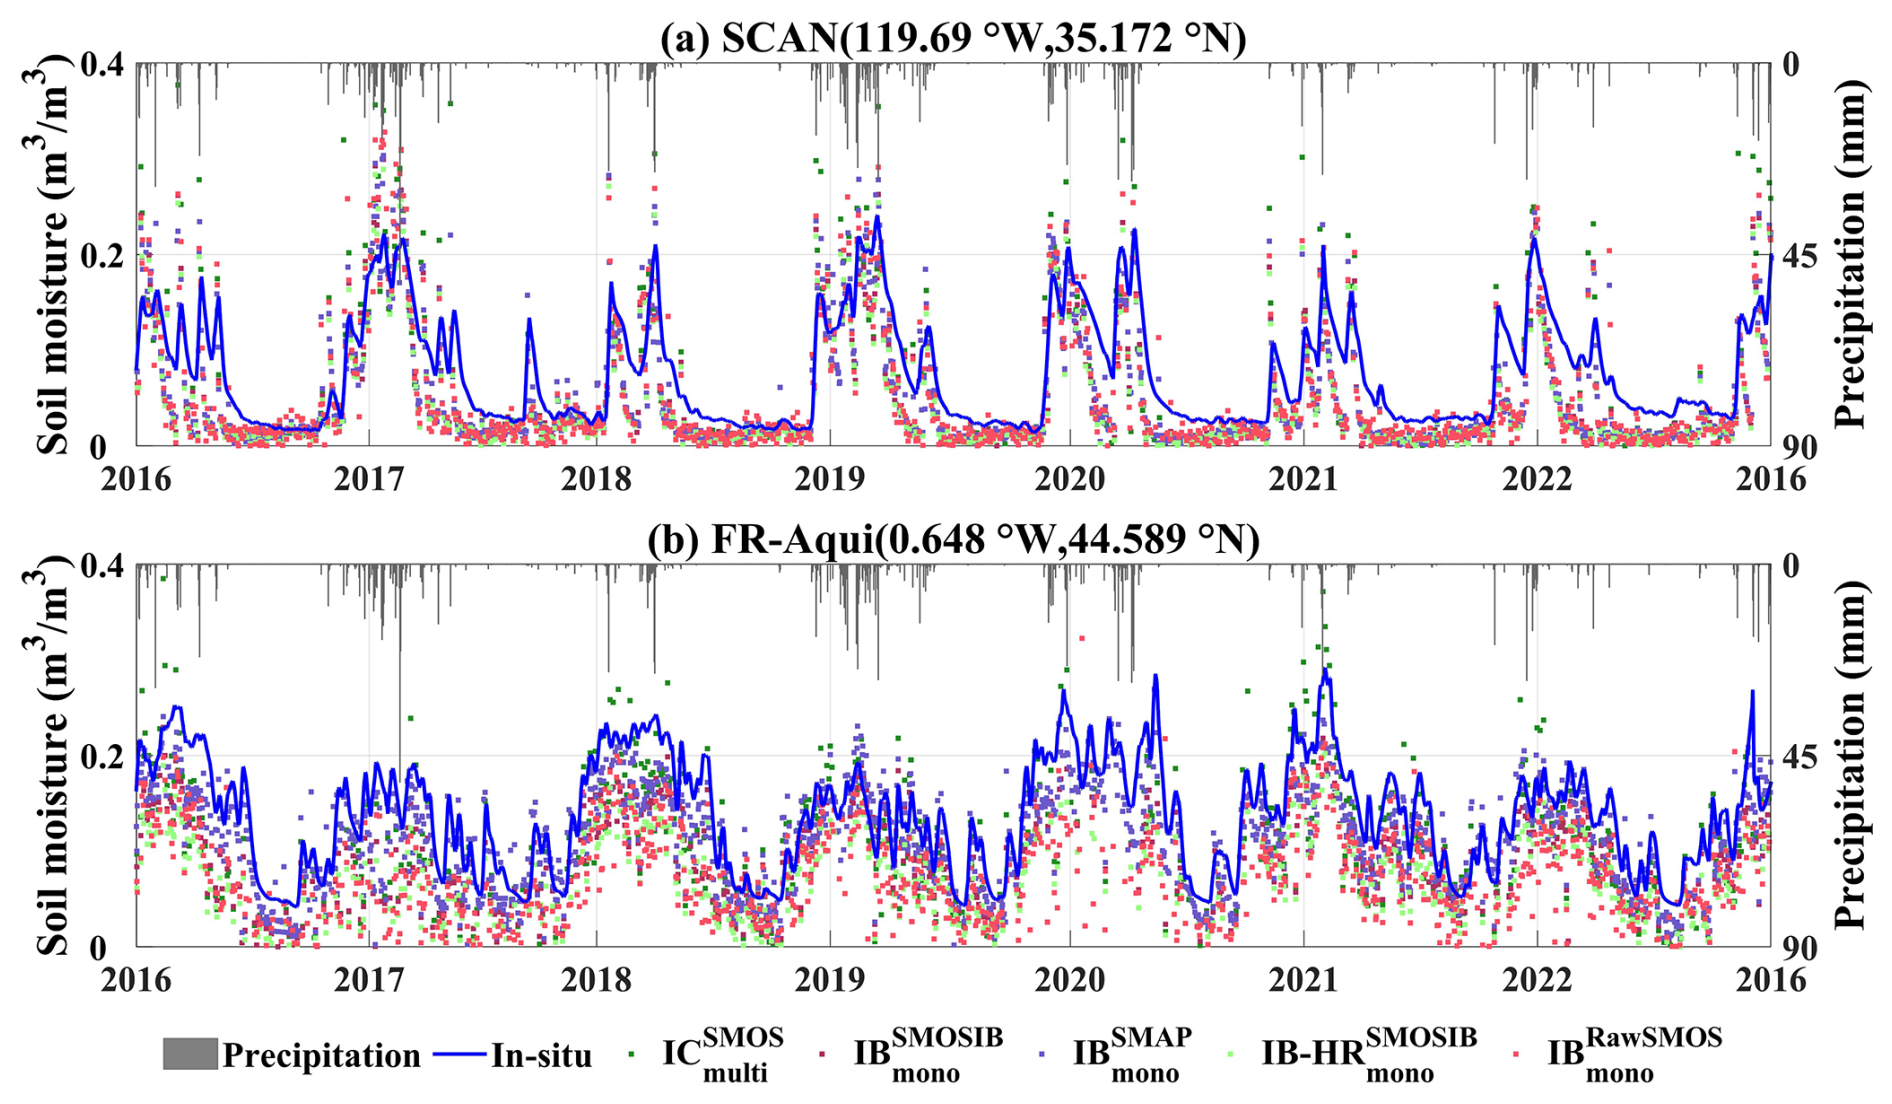
Figure A3Time series of the five SM (soil moisture) products and in-situ measurements between 2016 and 2022 at two sites from (a) SCAN and (b) FR-Aqui network, respectively. Each plot also contains daily precipitation shown in the axis on the right side (grey bar). Note that a 7 d moving window filter was applied to the in-situ observations to distinguish them from the satellite-based SM.
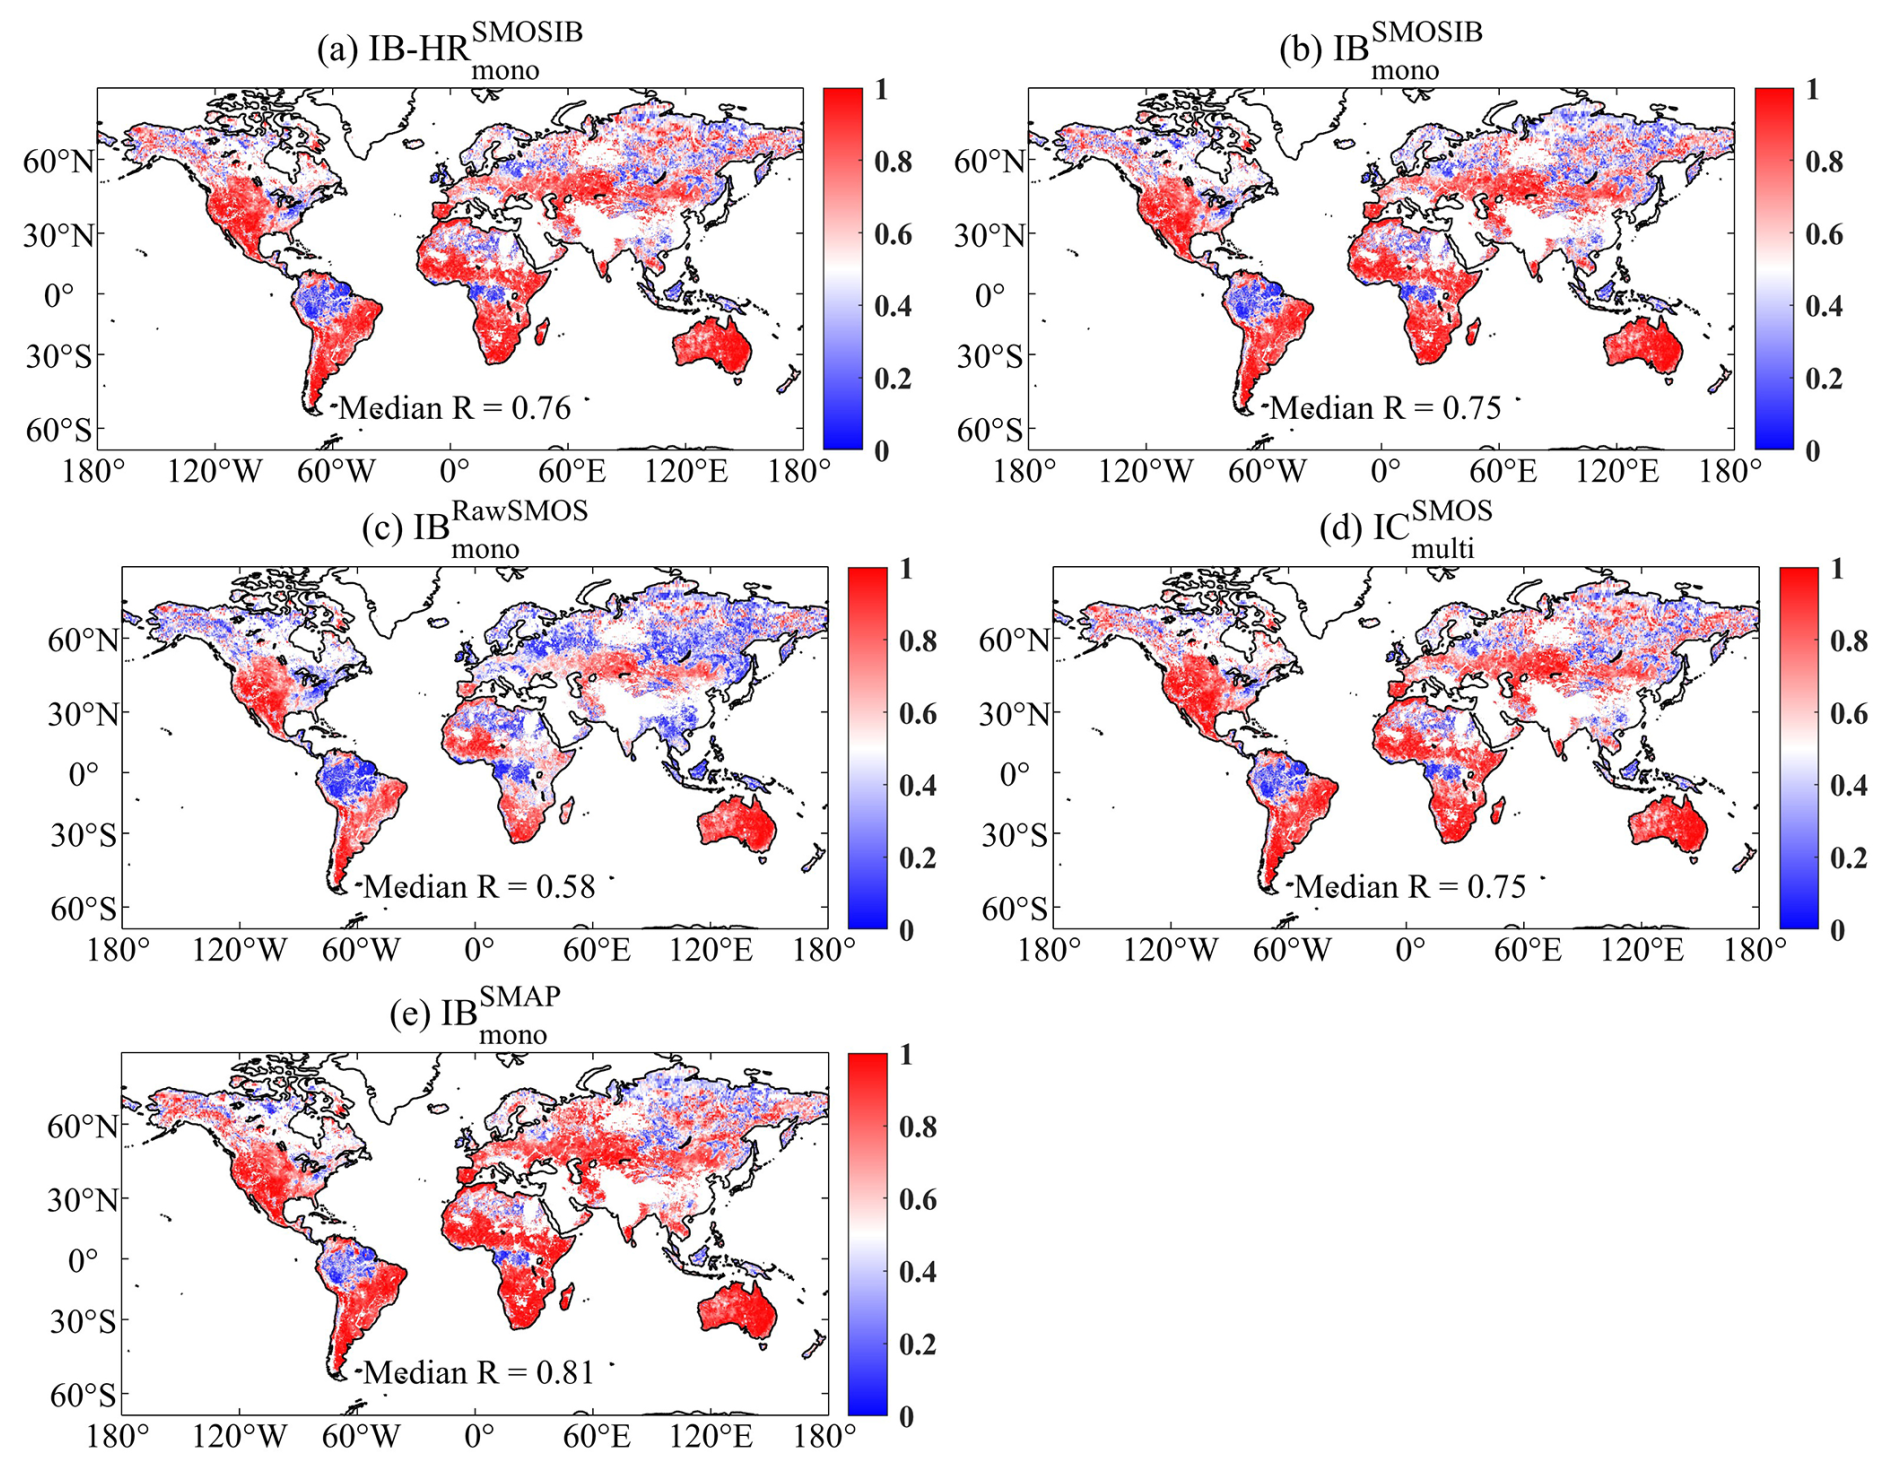
Figure A4The spatial distribution of the TCA (Triple Collocation Analysis)-based correlation coefficient (R) calculated by soil moisture anomaly estimates for (a) , (b) , (c) , (d) and (e) .
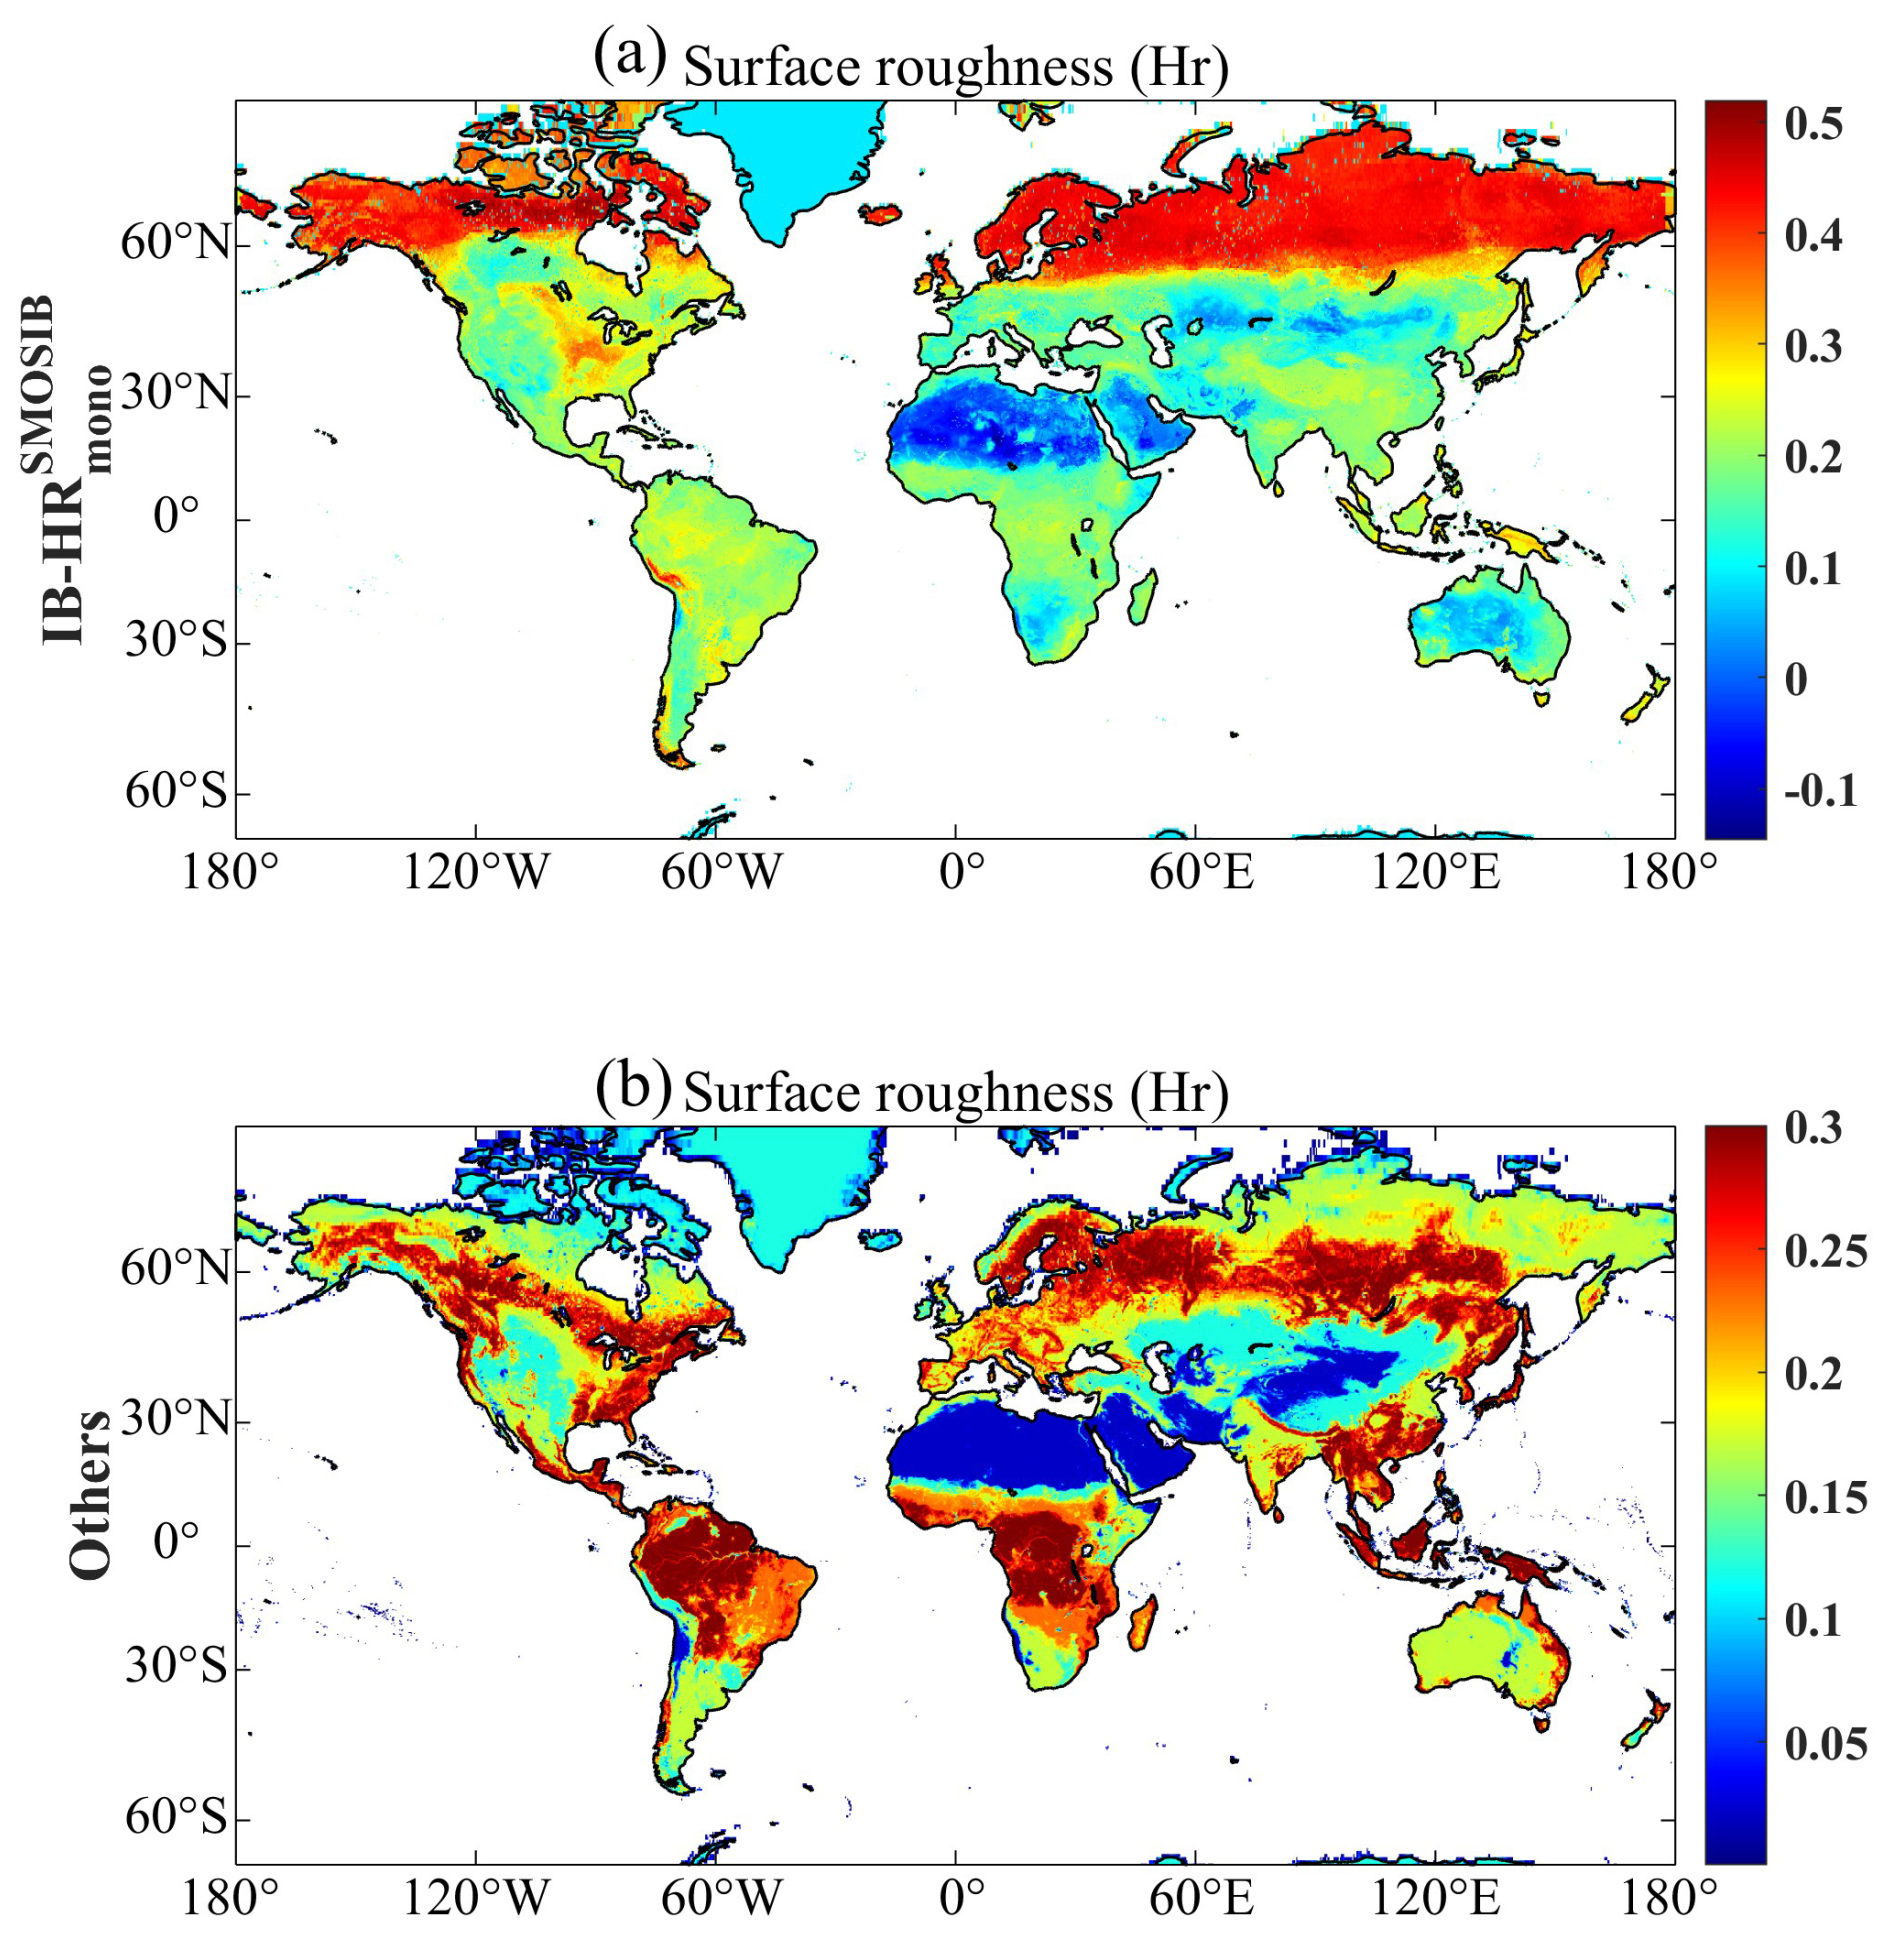
Figure A5The spatial distribution of input Hr (soil roughness) values for (a) and (b) other products (e.g., , , and ).
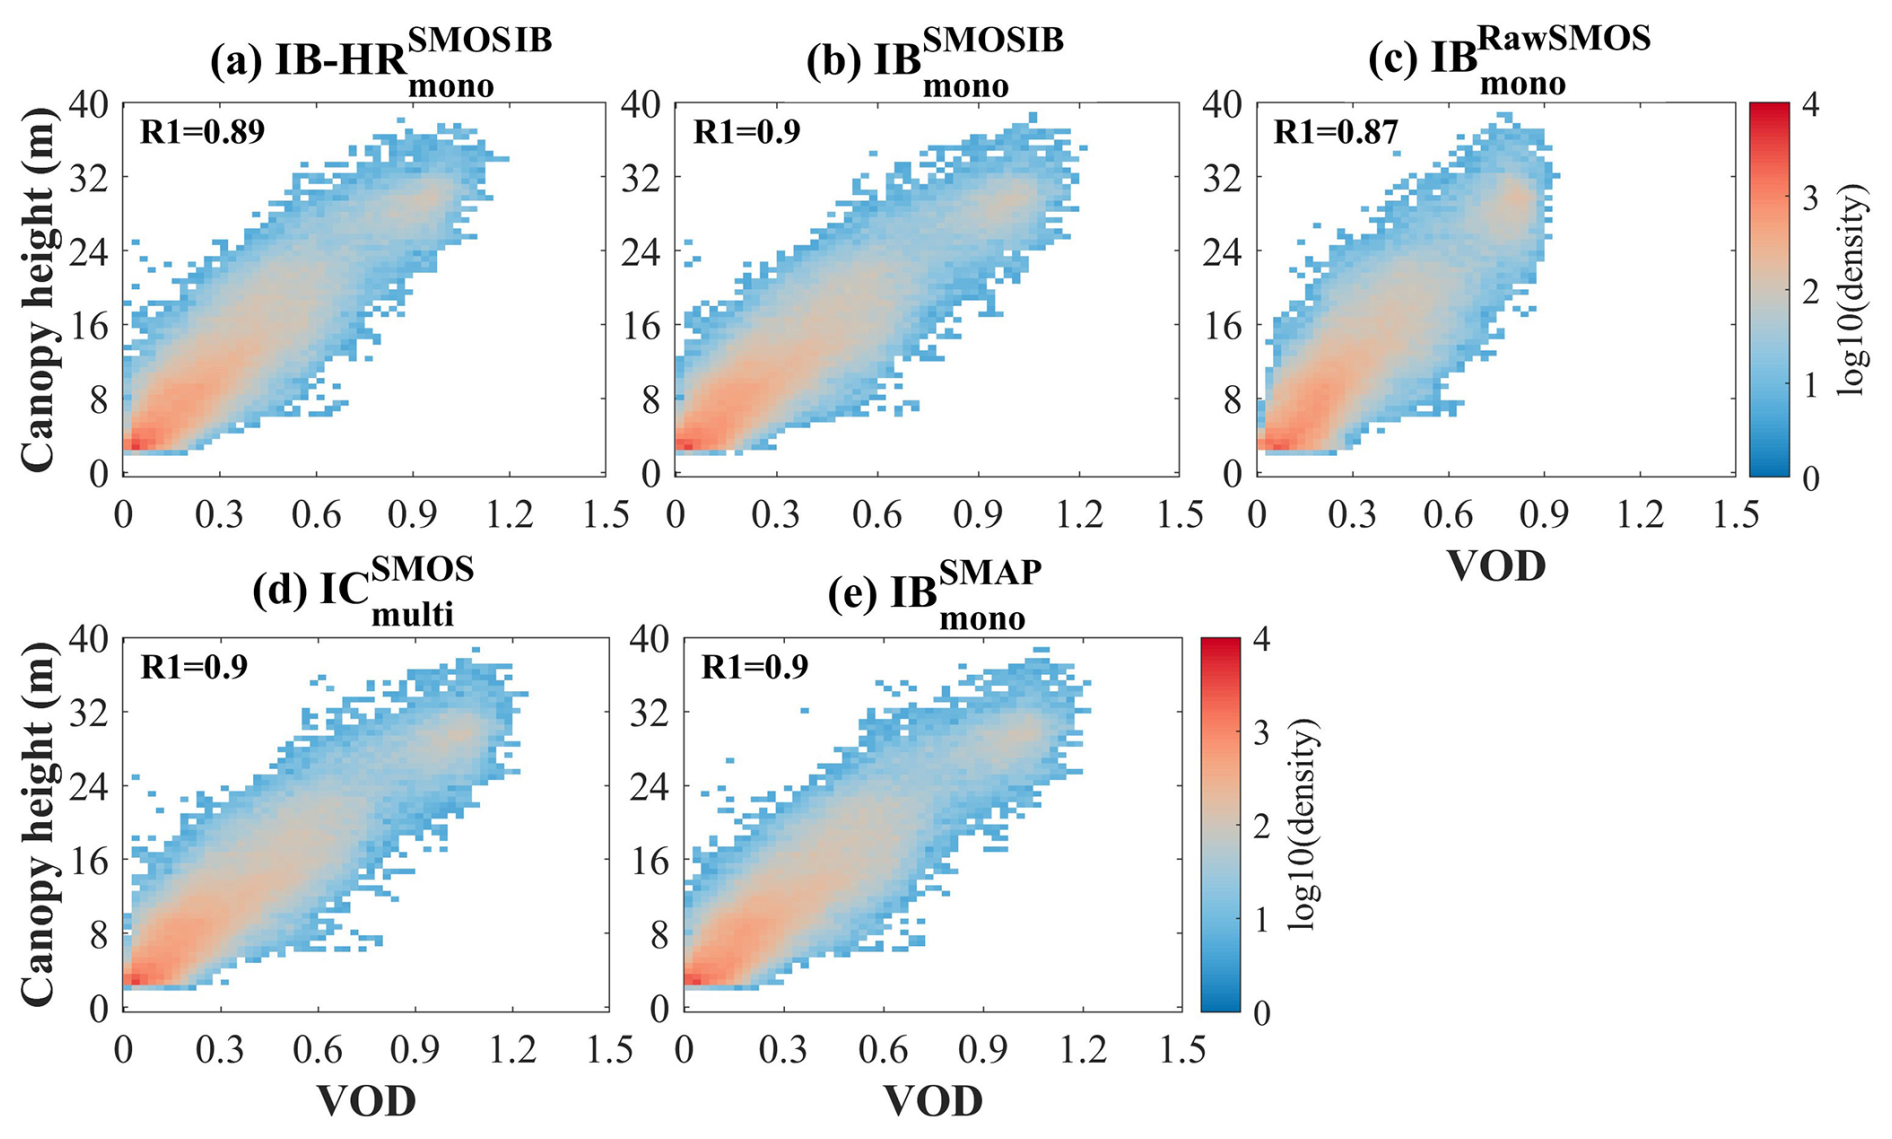
Figure A6Global density plots of VOD (vegetation optical depth) vs. canopy height (a–e) for five products: (a) , (b) , (c) , (d) and (e) . R1 denotes the correlation coefficient computed spatially between VOD and corresponding proxies.
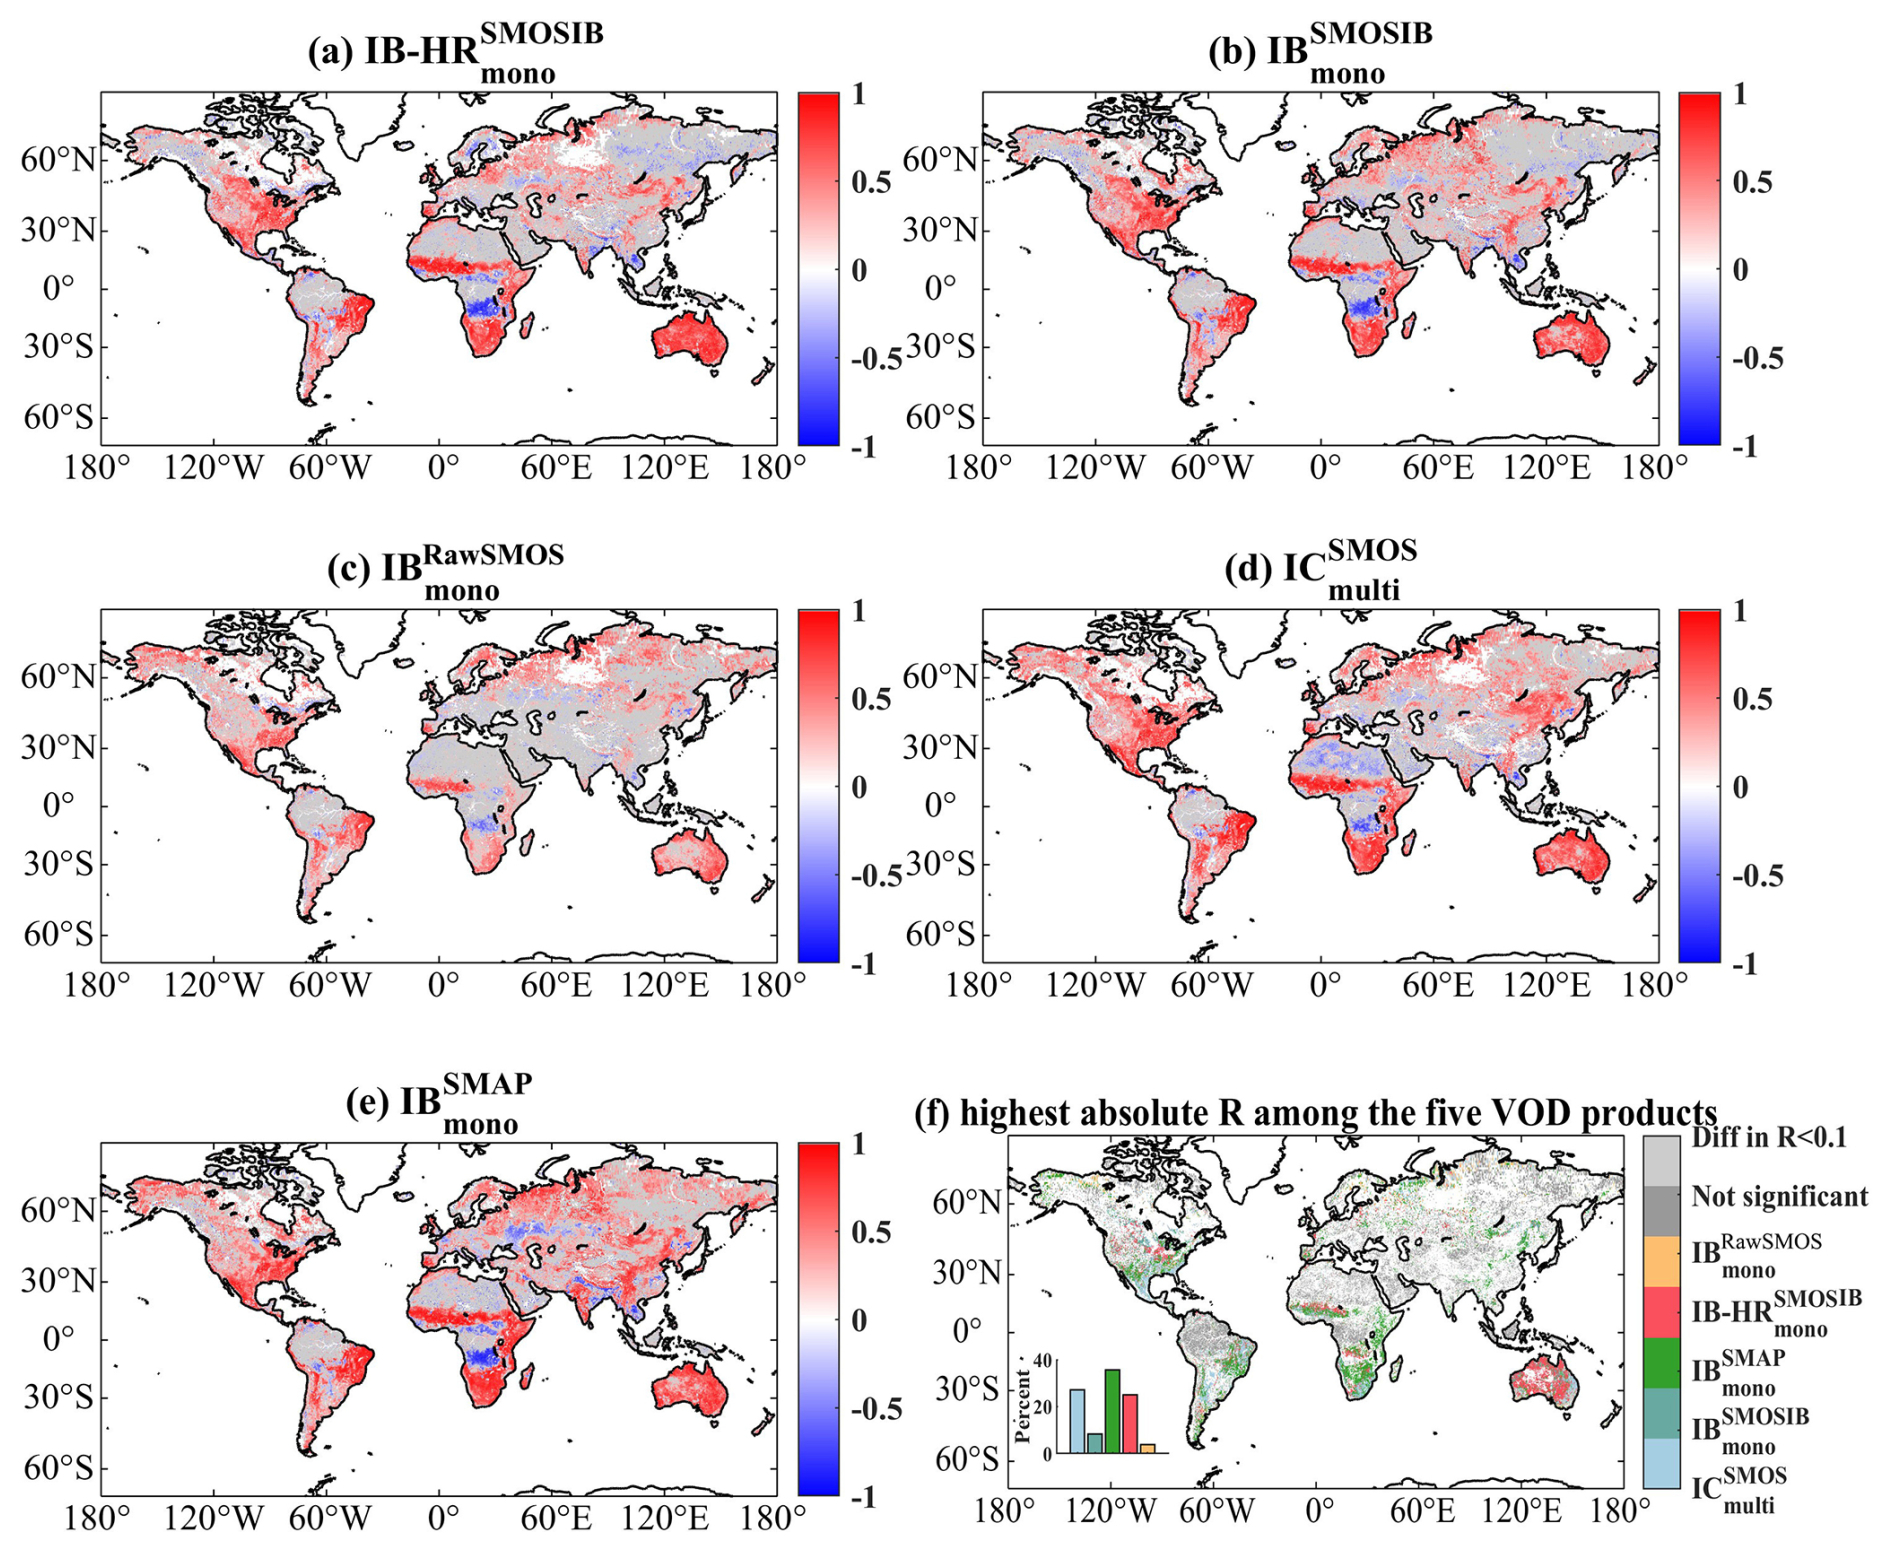
Figure A7Correlation coefficient (R) of the temporal relationship between 16 d composite of VOD (vegetation optical depth) and NDVI (Normalized Difference Vegetation Index) from 2016 to 2022 for (a) , (b) , (c) , (d) and (e) . (f) Maps of the above five VOD datasets with the highest absolute correlation coefficient (R) values with NDVI. The dark grey color indicates pixels with non-significant (p>0.05) R values, and the light grey color indicates pixels with R difference for each paired VOD product <0.1. White areas mean “no valid data”.
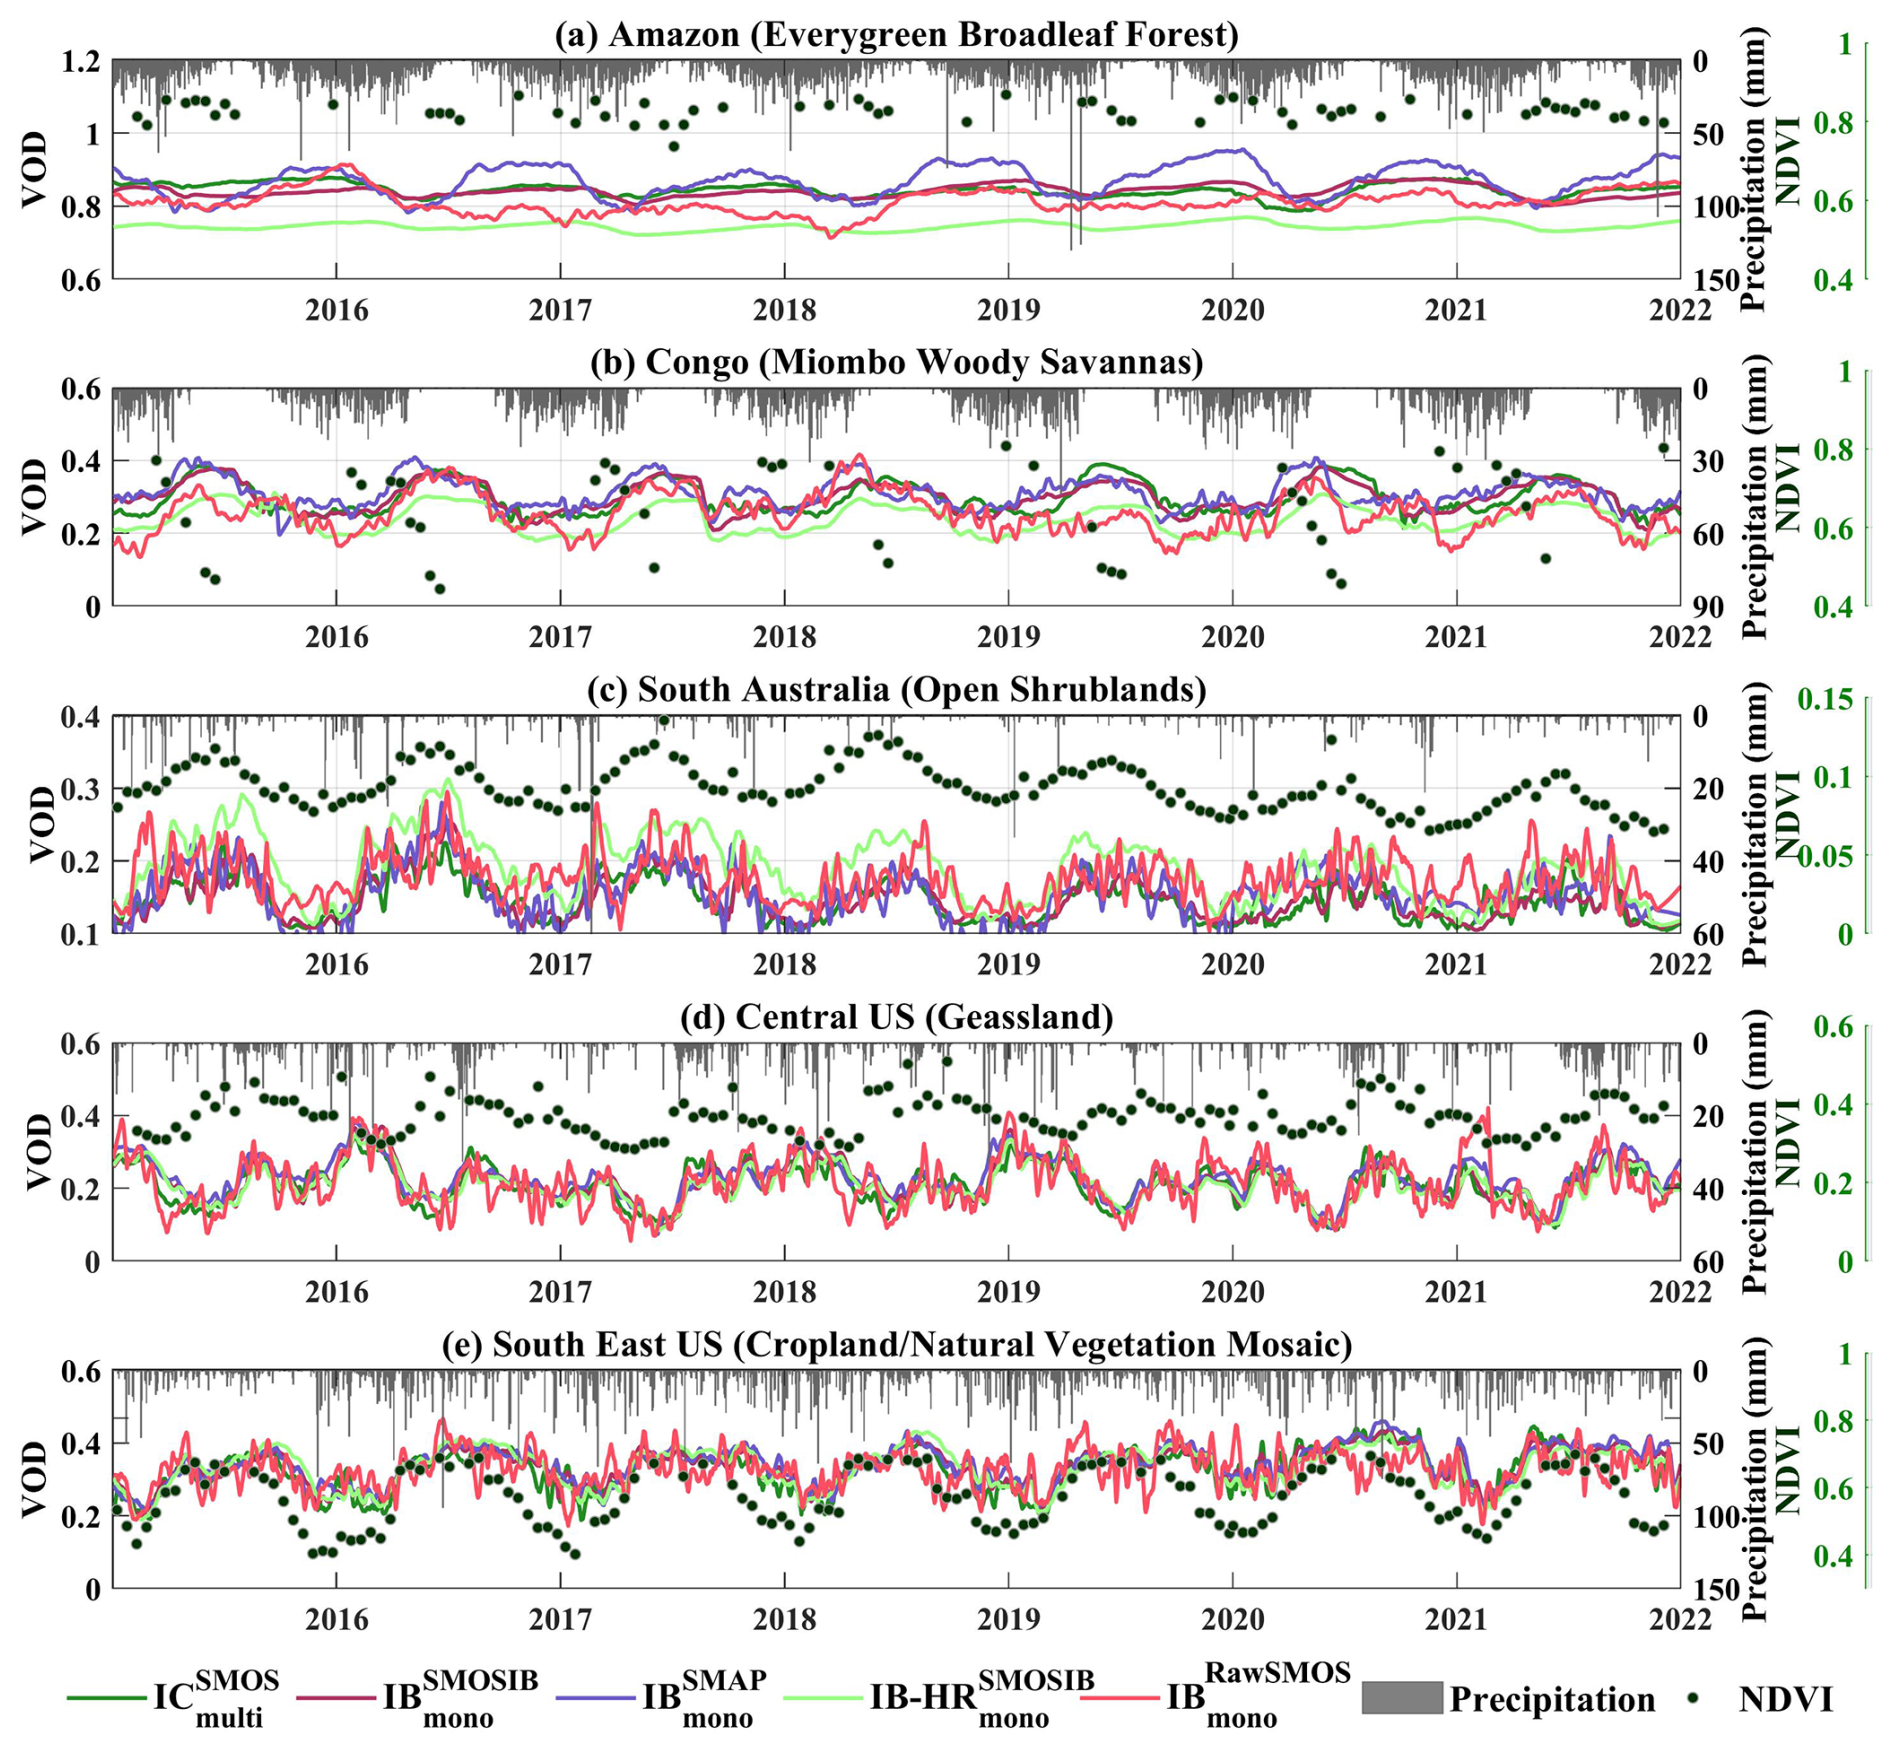
Figure A8Time series of the five VOD (vegetation optical depth) products over five pixels corresponding to (a) Evergreen broadleaf forest (64.79° W, 6.65° S), (b) Miombo woody savannas (23.71° E, 8.85° S), (c) Open shrublands (124.54° E, 30.31° S), (d) Grasslands (110.39° W, 34.31° N) and (e) Cropland/Natural vegetation mosaic (86.83° W, 35.34° N) between January 2016 and December 2022. Each plot also contains daily precipitation and NDVI (Normalized Difference Vegetation Index) information. Note that a 7 d moving window filter was applied to the VOD values of the five products to distinguish them from the NDVI values.
A1 List of key abbreviations
| Abbreviation | Definition |
| SMOS | Soil Moisture and Ocean Salinity |
| SMAP | Soil Moisture Active Passive |
| SM | Soil Moisture |
| VOD | Vegetation Optical Depth |
| TB | Brightness Temperature |
| SMOS-IC | A multi-angular SMOS algorithm developed by INRAE Bordeaux |
| SMAP-IB | A mono-angular SMAP algorithm developed by INRAE Bordeaux |
| SM and VOD products retrieved by applying the SMAP-IB algorithm to the fitted SMOS L3 40° TB and updated soil roughness map | |
| SM and VOD products retrieved by applying the SMAP-IB algorithm to the fitted SMOS L3 40° TB | |
| SM and VOD products retrieved by applying the SMAP-IB algorithm to the SMOS L3 40° TB | |
| SM and VOD products retrieved using the processed multi-angle SMOS-L3 TB dataset with quality filtering provided by the Centre Aval de Traitement des Données (CATDS) using the SMOS-IC version 2 algorithm | |
| SM and VOD products retrieved by applying the SMAP-IB algorithm to the 25km SMAP-L3 TBs |
XJL and JPW conceived the study. ZPX conducted the analyses and prepared the manuscript. XZL contributed to data preprocessing, and HLM provided the CWC dataset. All authors contributed to methodological discussions and offered feedback on both the manuscript and the data.
The contact author has declared that none of the authors has any competing interests.
Publisher's note: Copernicus Publications remains neutral with regard to jurisdictional claims made in the text, published maps, institutional affiliations, or any other geographical representation in this paper. The authors bear the ultimate responsibility for providing appropriate place names. Views expressed in the text are those of the authors and do not necessarily reflect the views of the publisher.
The authors would like to thank the topic editor Birgit Heim and two anonymous referees for their constructive comments which have helped us improve our study and manuscript. We gratefully acknowledge Prof. Marie Weiss for providing the valuable canopy water content dataset.
This research has been supported by the Foundation for Innovative Research Groups of the National Natural Science Foundation of China (Grant No. 42421001), the National Natural Science Foundation of China (Grant Nos. 42501480; 42501506), and the Natural Science Foundation of Science and Technology Department of Gansu Province (Grant No. 26JRRA249). J-P.W. is supported by the European Space Agency Climate Change Initiative (ESA-CCI) RECCAP2 project 1190 (contract no. 4000123002/18/I-NB) and CNES/TOSCA (SMOS project).
This paper was edited by Birgit Heim and reviewed by two anonymous referees.
Al Bitar, A., Mialon, A., Kerr, Y. H., Cabot, F., Richaume, P., Jacquette, E., Quesney, A., Mahmoodi, A., Tarot, S., Parrens, M., Al-Yaari, A., Pellarin, T., Rodriguez-Fernandez, N., and Wigneron, J.-P.: The global SMOS Level 3 daily soil moisture and brightness temperature maps, Earth Syst. Sci. Data, 9, 293–315, https://doi.org/10.5194/essd-9-293-2017, 2017.
Al-Yaari, A., Wigneron, J. P., Dorigo, W., Colliander, A., Pellarin, T., Hahn, S., Mialon, A., Richaume, P., Fernandez-Moran, R., Fan, L., Kerr, Y. H., and De Lannoy, G.: Assessment and inter-comparison of recently developed/reprocessed microwave satellite soil moisture products using ISMN ground-based measurements, Remote Sens. Environ., 224, 289–303, https://doi.org/10.1016/j.rse.2019.02.008, 2019.
Baur, M. J., Friend, A. D., and Pellegrini, A. F. A.: Widespread and systematic effects of fire on plant–soil water relations, Nat. Geosci., 17, 1115–1120, https://doi.org/10.1038/s41561-024-01563-6, 2024.
Chan, S. K., Bindlish, R., O'Neill, P. E., Njoku, E., Jackson, T., Colliander, A., Chen, F., Burgin, M., Dunbar, S., Piepmeier, J., Yueh, S., Entekhabi, D., Cosh, M. H., Caldwell, T., Walker, J., Wu, X., Berg, A., Rowlandson, T., Pacheco, A., McNairn, H., Thibeault, M., Martinez-Fernandez, J., Gonzalez-Zamora, A., Seyfried, M., Bosch, D., Starks, P., Goodrich, D., Prueger, J., Palecki, M., Small, E. E., Zreda, M., Calvet, J.-C., Crow, W. T., and Kerr, Y.: Assessment of the SMAP Passive Soil Moisture Product, IEEE T. Geosci. Remote Sens., 54, 4994–5007, https://doi.org/10.1109/tgrs.2016.2561938, 2016.
Chan, S. K., Bindlish, R., O'Neill, P., Jackson, T., Njoku, E., Dunbar, S., Chaubell, J., Piepmeier, J., Yueh, S., Entekhabi, D., Colliander, A., Chen, F., Cosh, M. H., Caldwel, T., Walker, J., Berg, A., McNairn, H., Thibeault, M., Martinez-Fernandez, J., Uldall, F., Seyfried, M., Bosch, D., Starks, P., Collins, C. H., Prueger, J., van der Velde, R., Asanuma, J., Palecki, M., Small, E. E., Zreda, M., Calvet, J. C., Crow, W. T., and Kerr, Y.: Development and Assessment of the SMAP Enhanced Passive Soil Moisture Product, Remote Sens. Environ., 204, 931–941, https://doi.org/10.1016/j.rse.2017.08.025, 2018.
Chaparro, D., Duveiller, G., Piles, M., Cescatti, A., Vall-llossera, M., Camps, A., and Entekhabi, D.: Sensitivity of L-band vegetation optical depth to carbon stocks in tropical forests: a comparison to higher frequencies and optical indices, Remote Sens. Environ., 232, https://doi.org/10.1016/j.rse.2019.111303, 2019.
Colliander, A., Reichle, R. H., Crow, W. T., Cosh, M. H., Chen, F., Chan, S., Das, N. N., Bindlish, R., Chaubell, J., Kim, S., Liu, Q., O'Neill, P. E., Dunbar, R. S., Dang, L. B., Kimball, J. S., Jackson, T. J., Al-Jassar, H. K., Asanuma, J., Bhattacharya, B. K., Berg, A. A., Bosch, D. D., Bourgeau-Chavez, L., Caldwell, T., Calvet, J.-C., Collins, C. H., Jensen, K. H., Livingston, S., Lopez-Baeza, E., Martinez-Fernandez, J., McNairn, H., Moghaddam, M., Montzka, C., Notarnicola, C., Pellarin, T., Greimeister-Pfeil, I., Pulliainen, J., Ramos, J. G., Seyfried, M., Starks, P. J., Su, Z., van der Velde, R., Zeng, Y., Thibeault, M., Vreugdenhil, M., Walker, J. P., Zribi, M., Entekhabi, D., and Yueh, S. H.: Validation of Soil Moisture Data Products From the NASA SMAP Mission, IEEE J. Sel. Top. Appl., 15, 364–392, https://doi.org/10.1109/jstars.2021.3124743, 2022.
Colliander, A., Kerr, Y., Wigneron, J. P., Al-Yaari, A., Rodriguez-Fernandez, N., Li, X., Chaubell, J., Richaume, P., Mialon, A., Asanuma, J., Berg, A., Bosch, D. D., Caldwell, T., Cosh, M. H., Holifield Collins, C., Martínez-Fernández, J., McNairn, H., Seyfried, M. S., Starks, P. J., Su, Z., Thibeault, M., and Walker, J. P.: Performance of SMOS Soil Moisture Products over Core Validation Sites, IEEE Geosci. Remote S., 1, https://doi.org/10.1109/lgrs.2023.3272878, 2023.
Cui, Y., Qin, J., Jing, W., and Tan, G.: Applicability evaluation of merged soil moisture in GLDAS and CLDAS products over Qinghai-Tibetan Plateau, Plateau Meteorol., 37, 123–136, https://doi.org/10.7522/j.issn.1000-0534.2017.00035, 2018.
De Lannoy, G. J. M., Reichle, R. H., Peng, J., Kerr, Y., Castro, R., Kim, E. J., and Qing, L.: Converting Between SMOS and SMAP Level-1 Brightness Temperature Observations Over Nonfrozen Land, IEEE Geosci. Remote S., 12, 1908–1912, https://doi.org/10.1109/lgrs.2015.2437612, 2015.
Didan, K.: MODIS/Aqua Vegetation Indices 16-Day L3 Global 1km SIN Grid V061, NASA Land Processes Distributed Active Archive Center, https://doi.org/10.5067/MODIS/MYD13A2.061, 2021.
Dong, J. and Crow, W. T.: An Improved Triple Collocation Analysis Algorithm for Decomposing Autocorrelated and White Soil Moisture Retrieval Errors, J. Geophys. Res.-Atmos., 122, 13081–13094, https://doi.org/10.1002/2017jd027387, 2017.
Dong, J., Crow, W. T., Tobin, K. J., Cosh, M. H., Bosch, D. D., Starks, P. J., Seyfried, M., and Collins, C. H.: Comparison of microwave remote sensing and land surface modeling for surface soil moisture climatology estimation, Remote Sens. Environ., 242, https://doi.org/10.1016/j.rse.2020.111756, 2020.
Dorigo, W., Himmelbauer, I., Aberer, D., Schremmer, L., Petrakovic, I., Zappa, L., Preimesberger, W., Xaver, A., Annor, F., Ardö, J., Baldocchi, D., Bitelli, M., Blöschl, G., Bogena, H., Brocca, L., Calvet, J.-C., Camarero, J. J., Capello, G., Choi, M., Cosh, M. C., van de Giesen, N., Hajdu, I., Ikonen, J., Jensen, K. H., Kanniah, K. D., de Kat, I., Kirchengast, G., Kumar Rai, P., Kyrouac, J., Larson, K., Liu, S., Loew, A., Moghaddam, M., Martínez Fernández, J., Mattar Bader, C., Morbidelli, R., Musial, J. P., Osenga, E., Palecki, M. A., Pellarin, T., Petropoulos, G. P., Pfeil, I., Powers, J., Robock, A., Rüdiger, C., Rummel, U., Strobel, M., Su, Z., Sullivan, R., Tagesson, T., Varlagin, A., Vreugdenhil, M., Walker, J., Wen, J., Wenger, F., Wigneron, J. P., Woods, M., Yang, K., Zeng, Y., Zhang, X., Zreda, M., Dietrich, S., Gruber, A., van Oevelen, P., Wagner, W., Scipal, K., Drusch, M., and Sabia, R.: The International Soil Moisture Network: serving Earth system science for over a decade, Hydrol. Earth Syst. Sci., 25, 5749–5804, https://doi.org/10.5194/hess-25-5749-2021, 2021.
Entekhabi, D., Njoku, E. G., O'Neill, P. E., Kellogg, K. H., Crow, W. T., Edelstein, W. N., Entin, J. K., Goodman, S. D., Jackson, T. J., Johnson, J., Kimball, J., Piepmeier, J. R., Koster, R. D., Martin, N., McDonald, K. C., Moghaddam, M., Moran, S., Reichle, R., Shi, J. C., Spencer, M. W., Thurman, S. W., Tsang, L., and Van Zyl, J.: The Soil Moisture Active Passive (SMAP) Mission, Proc. IEEE, 98, 704–716, https://doi.org/10.1109/jproc.2010.2043918, 2010.
Fan, L., Wigneron, J. P., Ciais, P., Chave, J., Brandt, M., Fensholt, R., Saatchi, S. S., Bastos, A., Al-Yaari, A., Hufkens, K., Qin, Y., Xiao, X., Chen, C., Myneni, R. B., Fernandez-Moran, R., Mialon, A., Rodriguez-Fernandez, N. J., Kerr, Y., Tian, F., and Penuelas, J.: Satellite-observed pantropical carbon dynamics, Nat. Plants, 5, 944–951, https://doi.org/10.1038/s41477-019-0478-9, 2019.
Fan, L., Xing, Z., Lannoy, G. D., Frappart, F., Peng, J., Zeng, J., Li, X., Yang, K., Zhao, T., Shi, J., Ma, H., Wang, M., Liu, X., Yi, C., Ma, M., Tang, X., Wen, J., Chen, X., Wang, C., Wang, L., Wang, G., and Wigneron, J.-P.: Evaluation of satellite and reanalysis estimates of surface and root-zone soil moisture in croplands of Jiangsu Province, China, Remote Sens. Environ., 282, https://doi.org/10.1016/j.rse.2022.113283, 2022a.
Fan, L., Wigneron, J.-P., Ciais, P., Chave, J., Brandt, M., Sitch, S., Yue, C., Bastos, A., Li, X., Qin, Y., Yuan, W., Schepaschenko, D., Mukhortova, L., Li, X., Liu, X., Wang, M., Frappart, F., Xiao, X., Chen, J., Ma, M., Wen, J., Chen, X., Yang, H., van Wees, D., and Fensholt, R.: Siberian carbon sink reduced by forest disturbances, Nat. Geosci., https://doi.org/10.1038/s41561-022-01087-x, 2022b.
Fernandez-Moran, R., Al-Yaari, A., Mialon, A., Mahmoodi, A., Al Bitar, A., De Lannoy, G., Rodriguez-Fernandez, N., Lopez-Baeza, E., Kerr, Y., and Wigneron, J.-P.: SMOS-IC: An Alternative SMOS Soil Moisture and Vegetation Optical Depth Product, Remote Sens., 9, https://doi.org/10.3390/rs9050457, 2017a.
Fernandez-Moran, R., Wigneron, J. P., De Lannoy, G., Lopez-Baeza, E., Parrens, M., Mialon, A., Mahmoodi, A., Al-Yaari, A., Bircher, S., Al Bitar, A., Richaume, P., and Kerr, Y.: A new calibration of the effective scattering albedo and soil roughness parameters in the SMOS SM retrieval algorithm, Int. J. Appl. Earth Obs., 62, 27–38, https://doi.org/10.1016/j.jag.2017.05.013, 2017b.
Frappart, F., Wigneron, J.-P., Li, X., Liu, X., Al-Yaari, A., Fan, L., Wang, M., Moisy, C., Le Masson, E., Aoulad Lafkih, Z., Vallé, C., Ygorra, B., and Baghdadi, N.: Global Monitoring of the Vegetation Dynamics from the Vegetation Optical Depth (VOD): A Review, Remote Sens., 12, https://doi.org/10.3390/rs12182915, 2020.
Friedl, M. and Sulla-Menashe, D.: MODIS/Terra+Aqua Land Cover Type Yearly L3 Global 500m SIN Grid V061 [Data set], NASA Land Processes Distributed Active Archive Center, https://doi.org/10.5067/MODIS/MCD12Q1.061, 2022.
Gao, L., Ebtehaj, A., Chaubell, M. J., Sadeghi, M., Li, X., and Wigneron, J.-P.: Reappraisal of SMAP inversion algorithms for soil moisture and vegetation optical depth, Remote Sens. Environ., 264, https://doi.org/10.1016/j.rse.2021.112627, 2021.
Grant, J. P., Wigneron, J. P., De Jeu, R. A. M., Lawrence, H., Mialon, A., Richaume, P., Al Bitar, A., Drusch, M., van Marle, M. J. E., and Kerr, Y.: Comparison of SMOS and AMSR-E vegetation optical depth to four MODIS-based vegetation indices, Remote Sens. Environ., 172, 87–100, https://doi.org/10.1016/j.rse.2015.10.021, 2016.
Gruber, A., De Lannoy, G., Albergel, C., Al-Yaari, A., Brocca, L., Calvet, J. C., Colliander, A., Cosh, M., Crow, W., Dorigo, W., Draper, C., Hirschi, M., Kerr, Y., Konings, A., Lahoz, W., McColl, K., Montzka, C., Muñoz-Sabater, J., Peng, J., Reichle, R., Richaume, P., Rüdiger, C., Scanlon, T., van der Schalie, R., Wigneron, J. P., and Wagner, W.: Validation practices for satellite soil moisture retrievals: What are (the) errors?, Remote Sens. Environ., 244, https://doi.org/10.1016/j.rse.2020.111806, 2020.
Jackson, T. J.: Measuring surface soil moisture using passive microwave remote sensing, Hydrol. Process., 7, 139–152, 1993.
Kerr, Y. H., Waldteufel, P., Wigneron, J.-P., Delwart, S., Cabot, F., Boutin, J., Escorihuela, M.-J., Font, J., Reul, N., Gruhier, C., Juglea, S. E., Drinkwater, M. R., Hahne, A., Martín-Neira, M., and Mecklenburg, S.: The SMOS Mission: New Tool for Monitoring Key Elements ofthe Global Water Cycle, Proc. IEEE, 98, 666–687, https://doi.org/10.1109/jproc.2010.2043032, 2010.
Kerr, Y. H., Waldteufel, P., Richaume, P., Wigneron, J. P., Ferrazzoli, P., Mahmoodi, A., Al Bitar, A., Cabot, F., Gruhier, C., Juglea, S. E., Leroux, D., Mialon, A., and Delwart, S.: The SMOS Soil Moisture Retrieval Algorithm, IEEE T. Geosci. Remote Sens., 50, 1384–1403, https://doi.org/10.1109/tgrs.2012.2184548, 2012.
Kerr, Y. H., Wigneron, J. P., Al Bitar, A., Mialon, A., and Srivastava, P. K.: Soil Moisture from Space, in: Satellite Soil Moisture Retrieval, Elsevier, 3–27, https://doi.org/10.1016/b978-0-12-803388-3.00001-2, 2016.
Kim, H., Wigneron, J.-P., Kumar, S., Dong, J., Wagner, W., Cosh, M. H., Bosch, D. D., Collins, C. H., Starks, P. J., Seyfried, M., and Lakshmi, V.: Global scale error assessments of soil moisture estimates from microwave-based active and passive satellites and land surface models over forest and mixed irrigated/dryland agriculture regions, Remote Sens. Environ., 251, https://doi.org/10.1016/j.rse.2020.112052, 2020.
Konkathi, P., Li, X., Fernandez-Moran, R., Liu, X., Xing, Z., Frappart, F., Piles, M., Karthikeyan, L., and Wigneron, J.-P.: A novel calibration of global soil roughness effects for SMOS-IC soil moisture and L-VOD products, Remote Sens. Environ., 329, https://doi.org/10.1016/j.rse.2025.114946, 2025.
Li, X., Al-Yaari, A., Schwank, M., Fan, L., Frappart, F., Swenson, J., and Wigneron, J. P.: Compared performances of SMOS-IC soil moisture and vegetation optical depth retrievals based on Tau-Omega and Two-Stream microwave emission models, Remote Sens. Environ., 236, https://doi.org/10.1016/j.rse.2019.111502, 2020.
Li, X., Wigneron, J.-P., Frappart, F., Fan, L., Ciais, P., Fensholt, R., Entekhabi, D., Brandt, M., Konings, A. G., Liu, X., Wang, M., Al-Yaari, A., and Moisy, C.: Global-scale assessment and inter-comparison of recently developed/reprocessed microwave satellite vegetation optical depth products, Remote Sens. Environ., 253, https://doi.org/10.1016/j.rse.2020.112208, 2021.
Li, X., Wigneron, J.-P., Fan, L., Frappart, F., Yueh, S. H., Colliander, A., Ebtehaj, A., Gao, L., Fernandez-Moran, R., Liu, X., Wang, M., Ma, H., Moisy, C., and Ciais, P.: A new SMAP soil moisture and vegetation optical depth product (SMAP-IB): Algorithm, assessment and inter-comparison, Remote Sens. Environ., 271, https://doi.org/10.1016/j.rse.2022.112921, 2022a.
Li, X., Wigneron, J.-P., Frappart, F., Lannoy, G. D., Fan, L., Zhao, T., Gao, L., Tao, S., Ma, H., Peng, Z., Liu, X., Wang, H., Wang, M., Moisy, C., and Ciais, P.: The first global soil moisture and vegetation optical depth product retrieved from fused SMOS and SMAP L-band observations, Remote Sens. Environ., 282, https://doi.org/10.1016/j.rse.2022.113272, 2022b.
Li, X., Ciais, P., Fensholt, R., Chave, J., Sitch, S., Canadell, J. G., Brandt, M., Fan, L., Xiao, X., Tao, S., Wang, H., Albergel, C., Yang, H., Frappart, F., Wang, M., Bastos, A., Maisongrande, P., Qin, Y., Xing, Z., Cui, T., Yu, L., He, L., Zheng, Y., Liu, X., Liu, Y., De Truchis, A., and Wigneron, J. P.: Large live biomass carbon losses from droughts in the northern temperate ecosystems during 2016–2022, Nat. Commun., 16, 4980, https://doi.org/10.1038/s41467-025-59999-2, 2025.
Ma, H., Zeng, J., Chen, N., Zhang, X., Cosh, M. H., and Wang, W.: Satellite surface soil moisture from SMAP, SMOS, AMSR2 and ESA CCI: A comprehensive assessment using global ground-based observations, Remote Sens. Environ., 231, 111215, https://doi.org/10.1016/j.rse.2019.111215, 2019.
Ma, H., Weiss, M., Malik, D., Berthelot, B., Yebra, M., Nolan, R. H., Mialon, A., Zeng, J., Quan, X., Tagesson, H. T., Olioso, A., and Baret, F.: Satellite canopy water content from Sentinel-2, Landsat-8 and MODIS: Principle, algorithm and assessment, Remote Sens. Environ., 326, https://doi.org/10.1016/j.rse.2025.114801, 2025.
Martín-Neira, M., Oliva, R., Corbella, I., Torres, F., Duffo, N., Durán, I., Kainulainen, J., Closa, J., Zurita, A., Cabot, F., Khazaal, A., Anterrieu, E., Barbosa, J., Lopes, G., Tenerelli, J., Díez-García, R., Fauste, J., Martín-Porqueras, F., González-Gambau, V., Turiel, A., Delwart, S., Crapolicchio, R., and Suess, M.: SMOS instrument performance and calibration after six years in orbit, Remote Sens. Environ., 180, 19–39, https://doi.org/10.1016/j.rse.2016.02.036, 2016.
Mialon, A., Coret, L., Kerr, Y. H., Secherre, F., and Wigneron, J. P.: Flagging the Topographic Impact on the SMOS Signal, IEEE T. Geosci. Remote Sens., 46, 689–694, https://doi.org/10.1109/tgrs.2007.914788, 2008.
Mo, T., Choudhury, B., Schmugge, T., Wang, J. R., and Jackson, T.: A model for microwave emission from vegetation-covered fields, J. Geophys. Res.-Oceans, 87, 11229–11237, 1982.
Muñoz-Sabater, J., Dutra, E., Agustí-Panareda, A., Albergel, C., Arduini, G., Balsamo, G., Boussetta, S., Choulga, M., Harrigan, S., Hersbach, H., Martens, B., Miralles, D. G., Piles, M., Rodríguez-Fernández, N. J., Zsoter, E., Buontempo, C., and Thépaut, J.-N.: ERA5-Land: a state-of-the-art global reanalysis dataset for land applications, Earth Syst. Sci. Data, 13, 4349–4383, https://doi.org/10.5194/essd-13-4349-2021, 2021.
Oliva, R., Daganzo, E., Richaume, P., Kerr, Y., Cabot, F., Soldo, Y., Anterrieu, E., Reul, N., Gutierrez, A., Barbosa, J., and Lopes, G.: Status of Radio Frequency Interference (RFI) in the 1400–1427 MHz passive band based on six years of SMOS mission, Remote Sens. Environ., 180, 64–75, https://doi.org/10.1016/j.rse.2016.01.013, 2016.
O'Neill, P. E., Chan, S., Njoku, E. G., Jackson, T., Bindlish, R., and Chaubell, J.: SMAP L3 Radiometer Global Daily 36 km EASE-Grid Soil Moisture, Version 8, Boulder, Colorado USA, NASA National Snow and Ice Data Center Distributed Active Archive Center [data set], https://doi.org/10.5067/OMHVSRGFX38O, 2021.
Peng, J., Tanguy, M., Robinson, E. L., Pinnington, E., Evans, J., Ellis, R., Cooper, E., Hannaford, J., Blyth, E., and Dadson, S.: Estimation and evaluation of high-resolution soil moisture from merged model and Earth observation data in the Great Britain, Remote Sens. Environ., 264, https://doi.org/10.1016/j.rse.2021.112610, 2021.
Peng, Z., Zhao, T., Shi, J., Kerr, Y. H., Rodriguez-Fernandez, N. J., Yao, P., and Che, T.: An RFI-suppressed SMOS L-band multi-angular brightness temperature dataset spanning over a decade (since 2010), Sci. Data, 10, 599, https://doi.org/10.1038/s41597-023-02499-z, 2023.
Peng, Z., Zhao, T., Shi, J., Hu, L., Rodríguez-Fernández, N. J., Wigneron, J.-P., Jackson, T. J., Walker, J. P., Cosh, M. H., Yang, K., Lu, H., Bai, Y., Yao, P., Zheng, J., and Wei, Z.: First mapping of polarization-dependent vegetation optical depth and soil moisture from SMAP L-band radiometry, Remote Sens. Environ., 302, 113970, https://doi.org/10.1016/j.rse.2023.113970, 2024.
Rodell, M., Houser, P. R., Jambor, U., Gottschalck, J., Mitchell, K., Meng, C.-J., Arsenault, K., Cosgrove, B., Radakovick, J., Bosilovich, M., Entin, J. K., Walker, J. P., Lohmann, D., and Toll, D.: THE Global Land Data Assimilation System, B. Am. Meteorol. Soc., 85, 381–394, 2004.
Rodríguez-Fernández, N. J., Aires, F., Richaume, P., Kerr, Y. H., Prigent, C., Kolassa, J., Cabot, F., Jimenez, C., Mahmoodi, A., and Drusch, M.: Soil Moisture Retrieval Using Neural Networks: Application to SMOS, IEEE T. Geosci. Remote Sens., 53, 5991–6007, https://doi.org/10.1109/tgrs.2015.2430845, 2015.
Rodríguez-Fernández, N. J., Mialon, A., Mermoz, S., Bouvet, A., Richaume, P., Al Bitar, A., Al-Yaari, A., Brandt, M., Kaminski, T., Le Toan, T., Kerr, Y. H., and Wigneron, J.-P.: An evaluation of SMOS L-band vegetation optical depth (L-VOD) data sets: high sensitivity of L-VOD to above-ground biomass in Africa, Biogeosciences, 15, 4627–4645, https://doi.org/10.5194/bg-15-4627-2018, 2018.
Saatchi, S. S., Harris, N. L., Brown, S., Lefsky, M., Mitchard, E. T., Salas, W., Zutta, B. R., Buermann, W., Lewis, S. L., Hagen, S., Petrova, S., White, L., Silman, M., and Morel, A.: Benchmark map of forest carbon stocks in tropical regions across three continents, P. Natl. Acad. Sci. USA, 108, 9899–9904, https://doi.org/10.1073/pnas.1019576108, 2011.
Sadri, S., Pan, M., Wada, Y., Vergopolan, N., Sheffield, J., Famiglietti, J. S., Kerr, Y., and Wood, E.: A global near-real-time soil moisture index monitor for food security using integrated SMOS and SMAP, Remote Sens. Environ., 246, https://doi.org/10.1016/j.rse.2020.111864, 2020.
Schmitt, A. U. and Kaleschke, L.: A Consistent Combination of Brightness Temperatures from SMOS and SMAP over Polar Oceans for Sea Ice Applications, Remote Sens., 10, https://doi.org/10.3390/rs10040553, 2018.
Simard, M., Pinto, N., Fisher, J. B., and Baccini, A.: Mapping forest canopy height globally with spaceborne lidar, J. Geophys. Res., 116, https://doi.org/10.1029/2011jg001708, 2011.
Wagner, W., Naeimi, V., Scipal, K., de Jeu, R., and Martínez-Fernández, J.: Soil moisture from operational meteorological satellites, Hydrogeol. J., 15, 121–131, https://doi.org/10.1007/s10040-006-0104-6, 2006.
Wagner, W., Hahn, S., Kidd, R., Melzer, T., Bartalis, Z., Hasenauer, S., Figa-Saldaña, J., de Rosnay, P., Jann, A., Schneider, S., Komma, J., Kubu, G., Brugger, K., Aubrecht, C., Züger, J., Gangkofner, U., Kienberger, S., Brocca, L., Wang, Y., Blöschl, G., Eitzinger, J., and Steinnocher, K.: The ASCAT Soil Moisture Product: A Review of its Specifications, Validation Results, and Emerging Applications, Meteorol. Z., 22, 5–33, https://doi.org/10.1127/0941-2948/2013/0399, 2013.
Wang, H., Wigneron, J.-P., Ciais, P., Yao, Y., Fan, L., Liu, X., Li, X., Green, J. K., Tian, F., Tao, S., Li, W., Frappart, F., Albergel, C., Wang, M., and Li, S.: Seasonal variations in vegetation water content retrieved from microwave remote sensing over Amazon intact forests, Remote Sens. Environ., 285, https://doi.org/10.1016/j.rse.2022.113409, 2023.
Wigneron, J. P., Kerr, Y., Waldteufel, P., Saleh, K., Escorihuela, M. J., Richaume, P., Ferrazzoli, P., de Rosnay, P., Gurney, R., Calvet, J. C., Grant, J. P., Guglielmetti, M., Hornbuckle, B., Mätzler, C., Pellarin, T., and Schwank, M.: L-band Microwave Emission of the Biosphere (L-MEB) Model: Description and calibration against experimental data sets over crop fields, Remote Sens. Environ., 107, 639–655, https://doi.org/10.1016/j.rse.2006.10.014, 2007.
Wigneron, J.-P., Schwank, M., Baeza, E. L., Kerr, Y., Novello, N., Millan, C., Moisy, C., Richaume, P., Mialon, A., Al Bitar, A., Cabot, F., Lawrence, H., Guyon, D., Calvet, J.-C., Grant, J. P., Casal, T., de Rosnay, P., Saleh, K., Mahmoodi, A., Delwart, S., and Mecklenburg, S.: First evaluation of the simultaneous SMOS and ELBARA-II observations in the Mediterranean region, Remote Sens. Environ., 124, 26–37, https://doi.org/10.1016/j.rse.2012.04.014, 2012.
Wigneron, J. P., Jackson, T. J., O'Neill, P., De Lannoy, G., de Rosnay, P., Walker, J. P., Ferrazzoli, P., Mironov, V., Bircher, S., Grant, J. P., Kurum, M., Schwank, M., Munoz-Sabater, J., Das, N., Royer, A., Al-Yaari, A., Al Bitar, A., Fernandez-Moran, R., Lawrence, H., Mialon, A., Parrens, M., Richaume, P., Delwart, S., and Kerr, Y.: Modelling the passive microwave signature from land surfaces: A review of recent results and application to the L-band SMOS & SMAP soil moisture retrieval algorithms, Remote Sens. Environ., 192, 238–262, https://doi.org/10.1016/j.rse.2017.01.024, 2017.
Wigneron, J.-P., Li, X., Frappart, F., Fan, L., Al-Yaari, A., De Lannoy, G., Liu, X., Wang, M., Le Masson, E., and Moisy, C.: SMOS-IC data record of soil moisture and L-VOD: Historical development, applications and perspectives, Remote Sens. Environ., 254, https://doi.org/10.1016/j.rse.2020.112238, 2021.
Wigneron, J.-P., Ciais, P., Li, X., Brandt, M., Canadell, J. G., Tian, F., Wang, H., Bastos, A., Fan, L., Gatica, G., Kashyap, R., Liu, X., Sitch, S., Tao, S., Xiao, X., Yang, H., Espinoza Villar, J. C., Frappart, F., Li, W., Qin, Y., De Truchis, A., and Fensholt, R.: Global carbon balance of the forest: satellite-based L-VOD results over the last decade, Front. Remote Sens., 5, https://doi.org/10.3389/frsen.2024.1338618, 2024.
Xing, Z., Fan, L., Zhao, L., De Lannoy, G., Frappart, F., Peng, J., Li, X., Zeng, J., Al-Yaari, A., Yang, K., Zhao, T., Shi, J., Wang, M., Liu, X., Hu, G., Xiao, Y., Du, E., Li, R., Qiao, Y., Shi, J., Wen, J., Ma, M., and Wigneron, J.-P.: A first assessment of satellite and reanalysis estimates of surface and root-zone soil moisture over the permafrost region of Qinghai-Tibet Plateau, Remote Sens. Environ., 265, https://doi.org/10.1016/j.rse.2021.112666, 2021.
Xing, Z., Li, X., Fan, L., Colliander, A., Frappart, F., de Rosnay, P., Fernandez-Moran, R., Liu, X., Wang, H., Zhao, L., and Wigneron, J.-P.: Assessment of 9 km SMAP soil moisture: Evidence of narrowing the gap between satellite retrievals and model-based reanalysis, Remote Sens. Environ., 296, https://doi.org/10.1016/j.rse.2023.113721, 2023.
Xing, Z., Li, X., and Wigneron, J.-P.: An operational global L-band soil moisture and vegetation optical depth dataset from optimized 40° SMOS brightness temperatures, Zenodo [data set], https://doi.org/10.5281/zenodo.17647385, 2025.
Yi, C., Li, X., Zeng, J., Fan, L., Xie, Z., Gao, L., Xing, Z., Ma, H., Boudah, A., Zhou, H., Zhou, W., Sheng, Y., Dong, T., and Wigneron, J.-P.: Assessment of five SMAP soil moisture products using ISMN ground-based measurements over varied environmental conditions, J. Hydrol., 619, https://doi.org/10.1016/j.jhydrol.2023.129325, 2023.
Zotta, R.-M., Moesinger, L., van der Schalie, R., Vreugdenhil, M., Preimesberger, W., Frederikse, T., de Jeu, R., and Dorigo, W.: VODCA v2: multi-sensor, multi-frequency vegetation optical depth data for long-term canopy dynamics and biomass monitoring, Earth Syst. Sci. Data, 16, 4573–4617, https://doi.org/10.5194/essd-16-4573-2024, 2024.