the Creative Commons Attribution 4.0 License.
the Creative Commons Attribution 4.0 License.
 | 02 Jun 2026
A 25 km daily gridded dataset of meteorological variables and high-impact weather events for new-type power systems in China
Kaixuan Bi
Xing Chen
Yi Yang
Fang Yang
Chenghai Wang
The new-type power system exhibits pronounced “weather dependency”, wherein high-impact weather events can significantly exacerbate operational security risks. A high-quality gridded dataset that involves both meteorological variables and high-impact weather events is of great significance for new-type power systems. In this study, a spatially adaptive optimal interpolation scheme is developed and applied to generate the China New-type Power Systems Meteorological (CNPS-Met) dataset. The CNPS-Met dataset covers the entire Chinese mainland, with a daily temporal resolution and a 25 km spatial resolution. It includes eight meteorological variables and eleven high-impact weather events, categorized from generation-side, grid-side and demand-side perspectives relevant to new-type power systems. Validation with existing datasets indicates that the CNPS-Met dataset generally exhibits superior performance in meteorological estimation. Specifically, the estimated mean relative errors for 2 m air temperature, 2 m specific humidity, 10 m wind speed, precipitation and surface pressure averaged over the Chinese mainland could be reduced by 1.7 %–18.5 %, 9.0 %–29.6 %, 1.9 %–8.5 %, 2.7 %–18 % and 4.9 %–5.2 %, respectively. On this basis, a series of high-impact weather events critical to the operation of new-type power system are identified. The spatial distribution of their frequency hotspots and intensity extremes are further analyzed. The CNPS-Met dataset (https://doi.org/10.12072/ncdc.nieer.db6972.2025, Zhang et al., 2025) is expected to benefit research and applications at the intersection of meteorology and new-type power systems.
- Article
(2552 KB) - Full-text XML
- BibTeX
- EndNote


A high-quality meteorological reanalysis dataset is of great significance for analyzing climate change, verifying climate simulations, identifying high-impact weather events, and predicting future climate change etc. (Qin et al., 2022; Wen et al., 2023). Over the past decades, China has built a large-scale ground-based meteorological observation network, with the total number of ground-based observation stations exceeding 2400 (Xu et al., 2019). However, in regions with complex terrain such as mountainous areas, the Tibetan Plateau, and the Gobi Desert, ground-based observation stations are relatively sparse. As a result, the climate variability at small geographic scales cannot be adequately represented (Wen et al., 2023; Jiang et al., 2023), which constrains the practical applications of ground-based observation stations. Recently, China has been building a new-type power system, with the core objective being to maximize the integration of renewable energy such as wind and solar energy (Xin, 2023). However, renewable energy integration is highly susceptible to weather and climate (D'Amico et al., 2024; Gao et al., 2025). Against the backdrop of global warming and the increasing frequency of extreme weather events (IPCC, 2021), significant challenges are expected for the development of the new-type power system. Therefore, to support both research and practical needs related to new-type power systems, it is essential and urgent to develop a high-quality gridded dataset that includes both meteorological variables and high-impact weather events relevant to power systems.
Apart from several global atmospheric reanalysis datasets such as the ECMWF (European Centre for Medium-Range Weather Forecasts) Reanalysis v5 (ERA5) (Hersbach et al., 2020), and Modern-Era Retrospective analysis for Research and Applications (MERRA) (Christensen et al., 2019) etc., several other widely used gridded meteorological datasets covering China have recently been developed, most of which are available at a daily scale. For instance, the gridded daily observation dataset across the China region (CN05.1) was developed based on approximately 2400 ground-based observation stations in China. It has a spatial resolution of 0.25° × 0.25° and covers the period from 1961 to 2020. This dataset was constructed using spatial interpolation methods (Wu and Gao 2013; Wu et al., 2017). The China Meteorological Forcing Data (CMFD) dataset, spanning from 1951 to 2020 with a temporal resolution of 3 h and a spatial resolution of 0.1° × 0.1°, was produced by integrating remote sensing products, ERA5 reanalysis, and approximately 400 ground-based observation stations in China. The methodology employed interpolation techniques based on the ANUSPLIN software and deep learning (He et al., 2020). More recently, the China Daily Meteorological Dataset (CDMet), covering 2000 to 2020, at a spatial resolution of 4 km × 4 km, was generated by merging ERA5 reanalysis with 699 ground-based meteorological stations across China. An adaptive interpolation scheme combining thin-plate spline interpolation and random forest algorithm was used in its production (Zhang et al., 2024b). These datasets provide useful basis for climate analysis, land surface and hydrology process study etc. (e.g., Qiu et al., 2024; Sutanto et al., 2024). Extreme weather and climate events can also be derived from these datasets, using indices released by the World Meteorological Organization (Heim, 2015). However, the definition of extreme weather and climate events in atmospheric sciences, typically conceptualized as low-probability events under large-sample assumptions, may not fully align with the operational needs of new-type power systems. In fact, there are currently no dedicated datasets of extreme or high-impact weather events categorized according to the generation-side, grid-side, and demand-side needs of new-type power systems. Furthermore, although both the CDMet and CMFD datasets incorporate diverse data sources, including satellite remote sensing and reanalysis products, their utilization of ground-based observation stations remains relatively limited. Over the complex terrain, ground-based observation stations have been shown to possess superior accuracy and representativeness compared to satellite-derived and reanalysis data (Wei et al., 2023; Rao et al., 2024; Jiang et al., 2025).
Another issue that requires attention is that the methodology employed in the aforementioned datasets relies heavily on spatial interpolation techniques. When limited ground-based observation stations are used to generate gridded dataset at finer resolution, the process effectively becomes extrapolation, meaning that estimates are made beyond the boundaries of the original data coverage. In contrast, data assimilation, a well-established technique in atmospheric modelling, aims to optimally combine observations with background model fields to produce a more accurate estimate of the true atmospheric state, while explicitly accounting for uncertainties in both the observations and the model (Talagrand, 1997). Additionally, data assimilation incorporates information about the influence of climate condition on the spatial distribution and relationships among meteorological variables (Kalnay, 2003). In practice, it has been widely used in operational numerical weather prediction and the construction of gridded datasets (e.g., Kalnay, 2003; Hunt et al., 2007; Bannister, 2008; Lee et al., 2013; Carrassi et al., 2018; Lindskog and Landelius, 2019; Zhao et al., 2024). The optimal interpolation (OI) is a classical data assimilation scheme known for its high computational efficiency and reliable accuracy. It has been shown to be fundamentally equivalent to more advanced methods such as the three-dimensional variational assimilation (Gandin, 1959; Akmaev, 1999; Eyre et al., 2022). A key factor influencing the performance of OI is the design of the observation operator (e.g., Daley, 1993; Uboldi et al., 2008; Girotto et al., 2020).
The Cressman interpolation method (Cressman, 1959), which establishes the relationship between observations and background field through a weight function, is commonly used as observation operator in OI (Liu et al., 2016). However, in the traditional Cressman interpolation, the influence radius in the weight function is assumed to be a fixed constant. This assumption is reasonable in idealized situations where observations are uniformly distributed. In cases of uneven observational coverage, however, the use of a fixed radius can introduce significant errors and uncertainties into the observation operator, thereby degrading the performance of the OI scheme (e.g., Alonso et al., 2018; Miatselskaya et al., 2022; Wang et al., 2023; Jiang et al., 2025). Therefore, dynamically adjusting the influence radius based on the spatial distribution and density of observations around each grid point in the background field would be a potential approach to improving observation operator and enhancing the overall performance of OI. Based on the aforementioned discussions, the motivation of this study is to develop an improved OI assimilation scheme, and to generate the China New-type Power Systems Meteorological (CNPS-Met) dataset. This dataset includes basic meteorological variables and high-impact weather events, categorized according to three critical vulnerability dimensions: generation-side, grid-side, and demand-side.
2.1 Modelling data
The CNPS-Met dataset is generated by fusing hourly ground-based observation stations with ERA5 reanalysis. The data from 2598 meteorological stations across China (Fig. 1a), spanning the period from 1980 to 2016, are used. These data include wind speed at 10 m, air temperature, relative humidity at 2 m, surface pressure, and precipitation, and can be obtained from China Meteorological Administration (https://data.cma.cn/, last access: 28 August 2025). Prior to publication, the observations underwent strict quality control. The meteorological stations are densely distributed in eastern and southern China (Fig. 1a) but are sparse in the northwestern regions and the Tibetan Plateau (Fig. 1a).
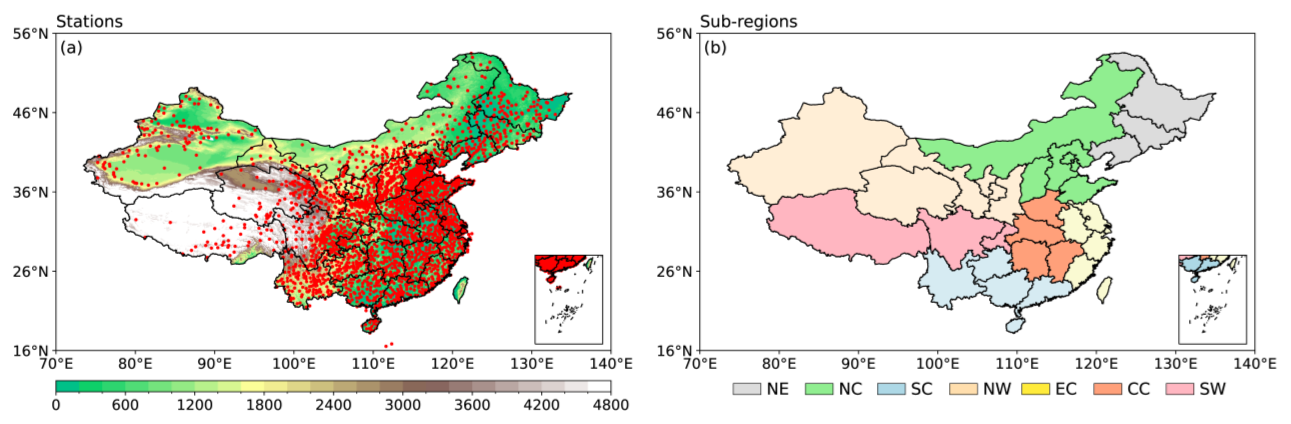
Figure 1Distribution of (a) ground-based meteorological stations (red dots) and terrain height (shaded colors), and (b) the seven sub-regions across Chinse mainland. The seven sub-regions include Northeast China (NE), North China (NC), South China (SC), Northwest China (NW), East China (EC), Central China (CC), and Southwest China (SW).
ERA5, the fifth generation of reanalysis data released by the ECMWF (https://cds.climate.copernicus.eu/datasets/reanalysis-era5-land?tab=overview, last access: 21 March 2025), exhibits robust performance in China (Hersbach et al., 2020; Jiang et al., 2021; Lavers et al., 2022). In this study, precipitation, surface pressure, wind speed at 10 m, air temperature and specific humidity at 2 m, at a horizontal resolution of 1° × 1° and a temporal resolution of 1 h, are used as background field in the assimilation. Specific humidity and relative humidity can be mutually converted through thermodynamic formulas that incorporate air temperature and pressure (Lovell-Smith and Pearson, 2005).
To improve the accuracy of the input data and ensure the integrity of the CNPS-Met dataset, we exclude the anomalous records by detecting records that are deviated significantly from their mean values using the three-sigma rule method (Oakland and Oakland, 2007). The three-sigma rule method was applied to the full time series. Approximately 0.18 % records were excluded.
2.2 Validation data
The daily CN05.1, CMFD and CDMet gridded datasets are used to validate the CNPS-Met dataset. Although the CMFD has the sub-daily (3-hourly) records, it is primarily derived from the ERA5 reanalysis and remote sensing products, rather than ground-based observation stations. Therefore, daily datasets are validated in this study. In addition, although the CMFD and CDMet have horizontal resolutions of 10 and 4 km, respectively, they are generated essentially by spatial interpolation rather than fusing additional observations. Hence, all datasets are interpolated to a common horizontal resolution of 0.25° × 0.25°.
2.3 Spatially adaptive optimal interpolation assimilation scheme
The Optimal Interpolation (OI) assimilation scheme is employed to generate the CNPS-Met dataset. This scheme estimates optimal values by minimizing the errors between the observations and the background fields. The objective function is defined as follows:
where xa is the analysis field (optimal field), xb is the background field (e.g., ERA5 reanalysis), they are both the matrix of m×n (grid points in the latitudinal and meridional directions, respectively); yo is the observations, which is the vector with a length of p (e.g., number of ground-based stations); the two-dimensional matrix H is the observation operator, which maps values from regularly gridded background fields to irregularly distributed ground-based station observations; W is the optimal weight matrix, which can be written as:
where superscript T denotes the matrix transpose operation; B is the background error covariance matrix, and R is the observation error covariance matrix, they can be written as:
where εb is the vector of grid points variances and covariances in the background filed over a given period (e.g., one month), while εo is the corresponding vector of variances and covariances for ground-based station observations over the same period; E represents a two-dimensional matrix. From the above equations, it is clear that given the observations (yo) and the background field (xb), the background error covariance matrix (B) and the observation error covariance matrix (R) are determined. Consequently, the performance of the OI assimilation scheme depends solely on the observation operator (H).
The observation operator (H), implemented here using Cressman interpolation, applies a distance-dependent weighting function to compute a weighted average of observations, with weights monotonically decreasing as a function of distance, thereby emphasizing the contribution of local observations to the final interpolated field. The observation operator can be determined via iterative updating as follows:
where denotes the difference between observation at kth ground-based station and grid point (i, j) at γth iteration; K denotes the number of total ground-based stations; denotes updated temporary background filed at γth iteration, which will be used to continuously update and Hγ, the ERA5 reanalysis will be used as first guess in the iteration; the iteration termination condition is , the resulting Hγ will be then used as the definitive observation operator (H) in Eqs. (1–2) to perform OI assimilation; wijk is the weight function in Cressman interpolation, its expression can be written as:
where dijk represents the spatial distance between grid point (i,j) and observation at kth ground-based station; Rc(i,j) represents the influence radius.
In the traditional Cressman interpolation, the influence radius is typically held constant. While this assumption is reasonable in regions with uniformly distributed observation stations, it would become problematic in practice due to the inherently uneven distribution of stations, especially over complex terrain. Such non-uniformity can degrade the performance of Cressman interpolation (Lin and Liu, 2012; Wang et al., 2023), and consequently impair the accuracy of OI assimilation scheme. To overcome this limitation, this study introduces a spatially adaptive influence radius that adjusts according to local observation density and distribution. This enhancement would improve the observation operator and optimizes the overall OI assimilation framework. The proposed method is referred to as the spatially adaptive OI assimilation scheme. The spatially varying influence radius Rc(i,j) is calculated as follows:
where denotes the number of observation stations within a circle of search radius R centered at grid point (i, j); the lower limit Rmin is 1 km, while the upper limit Rmax is set to 200 km; Nmin represents the preset minimum threshold for the number of observation stations within the search radius R. Here, this parameter is set to Nmin=5, meaning that for each grid point, the scheme dynamically expands the search radius until the number of available observation stations within the search region reaches at least 5. From Eq. (7), it is clear that when Nmin<5, in extremely data-sparse regions (e.g., Northwest China), the search radius remains too small, which may cause assimilation results based on only a few stations (e.g., 1–2 stations) to become not robust due to insufficient representativeness or accidental errors. When Nmin>5, this could lead to missing values of the influence radius in the data-sparse regions (not shown).
Figure 2 shows the spatial distribution of the influence radius Rc(i,j) in the spatially adaptive OI assimilation scheme across China. Results indicate that, the influence radius varies with the station density, that is, it is larger in data-sparse regions and is smaller in data-dense regions, which generally captures the spatial distribution of stations (Fig. 1a), suggesting that the spatially adaptive OI scheme proposed in this study could dynamically adjust the influence radius based on the density of local observations.
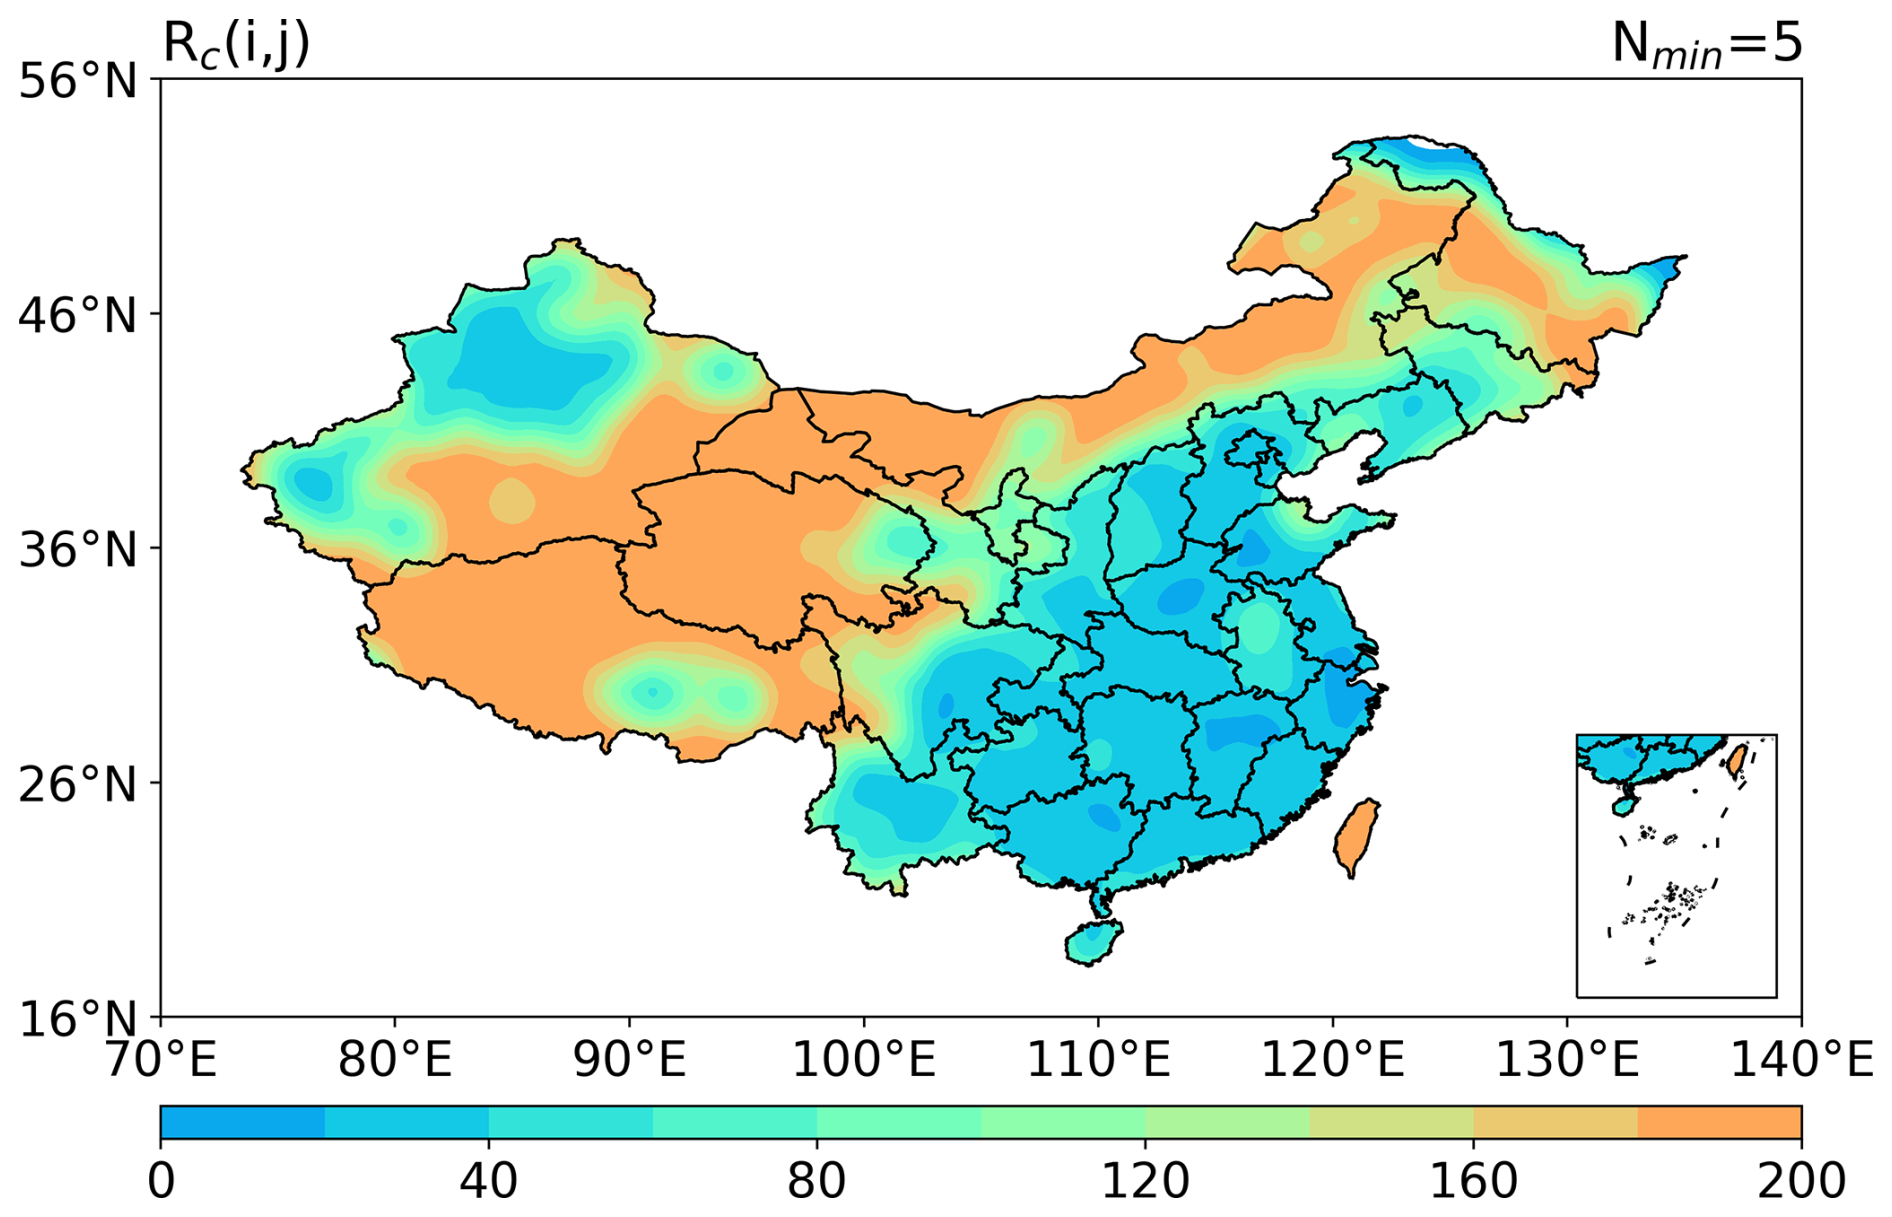
Figure 2Spatial distribution of the influence radius Rc(i,j) (unit: km) in the spatially adaptive OI assimilation scheme.
The assimilation performance of the new scheme and the traditional scheme is compared over the sample period from January to December 2013 (not shown). Results show that, compared with the traditional OI scheme (using a fixed influence radius), the new scheme proposed in this study (using a spatially adaptive influence radius) could obviously reduce the simulation errors for different regions, different months, and different meteorological variables across China. This indicates that the new scheme proposed in this study outperforms the traditional scheme.
2.4 Evaluation Metrics
The performance of the CNPS-Met dataset is evaluated using the statistics including the mean relative error (MRE), the root mean square error (RMSE), correlation coefficient (R2), and the modeling efficiency (EF):
where n denotes sample size; Oi and Pi are the observed and estimated values, respectively; and are the average of the observed and estimated values, respectively. Values of MRE and RMSE closer to 0, and R2 and EF closer to 1, indicate better estimation performance.
Apart from the above statistics, a more comprehensive statistic referred to as the global performance index (GPI; Despotovic et al., 2015), is introduced in this study:
where represents the median of the scaled values of indicator k (i.e., MRE, RMSE, R2 and EF); yk is scaled value of indicator k; αk=1 corresponds to MRE and RMSE, while corresponds to R2 and EF. The higher the GPI, the better performance of the overall estimation.
2.5 Identification of high-impact weather events for new-type power systems
Based on a comprehensive review of the existing literatures, the high-impact weather events for the generation-side, grid-side and demand-side of new-type power systems could be defined in Table 1. In the generation-side, cut-out wind speed is defined as hourly wind speed reaches or exceeds 25 m s−1, that is, wind turbine automatically shuts down to prevent equipment damage when wind speeds reach or exceed this threshold, resulting in an abrupt reduction of wind power output to zero (Jerez et al., 2015; Song et al., 2022). According to Jerez et al. (2015) and Song et al. (2022), cut-in wind speed is defined as hourly mean wind speeds ≤ 2.5 m s−1, that is, wind turbines would remain in standby or idle mode when wind speed is less than or equal to this threshold, resulting in effectively zero power output. The wind turbine hub height defined in this study is 70 m, when identifying cut-in and cut-out wind speed that are relevant to high-impact weather events, the wind speeds at 10 m are converted to 70 m using the empirical power law method, which can be expressed as:
where u2 and u1 represent wind speed at 70 and 10 m, respectively; h2 and h1 represent the target height (70 m) and the reference height (10 m), respectively; α is a prescribed constant, taken as 0.14.
Table 1Classification and definition of high-impact weather events for new-type power systems.
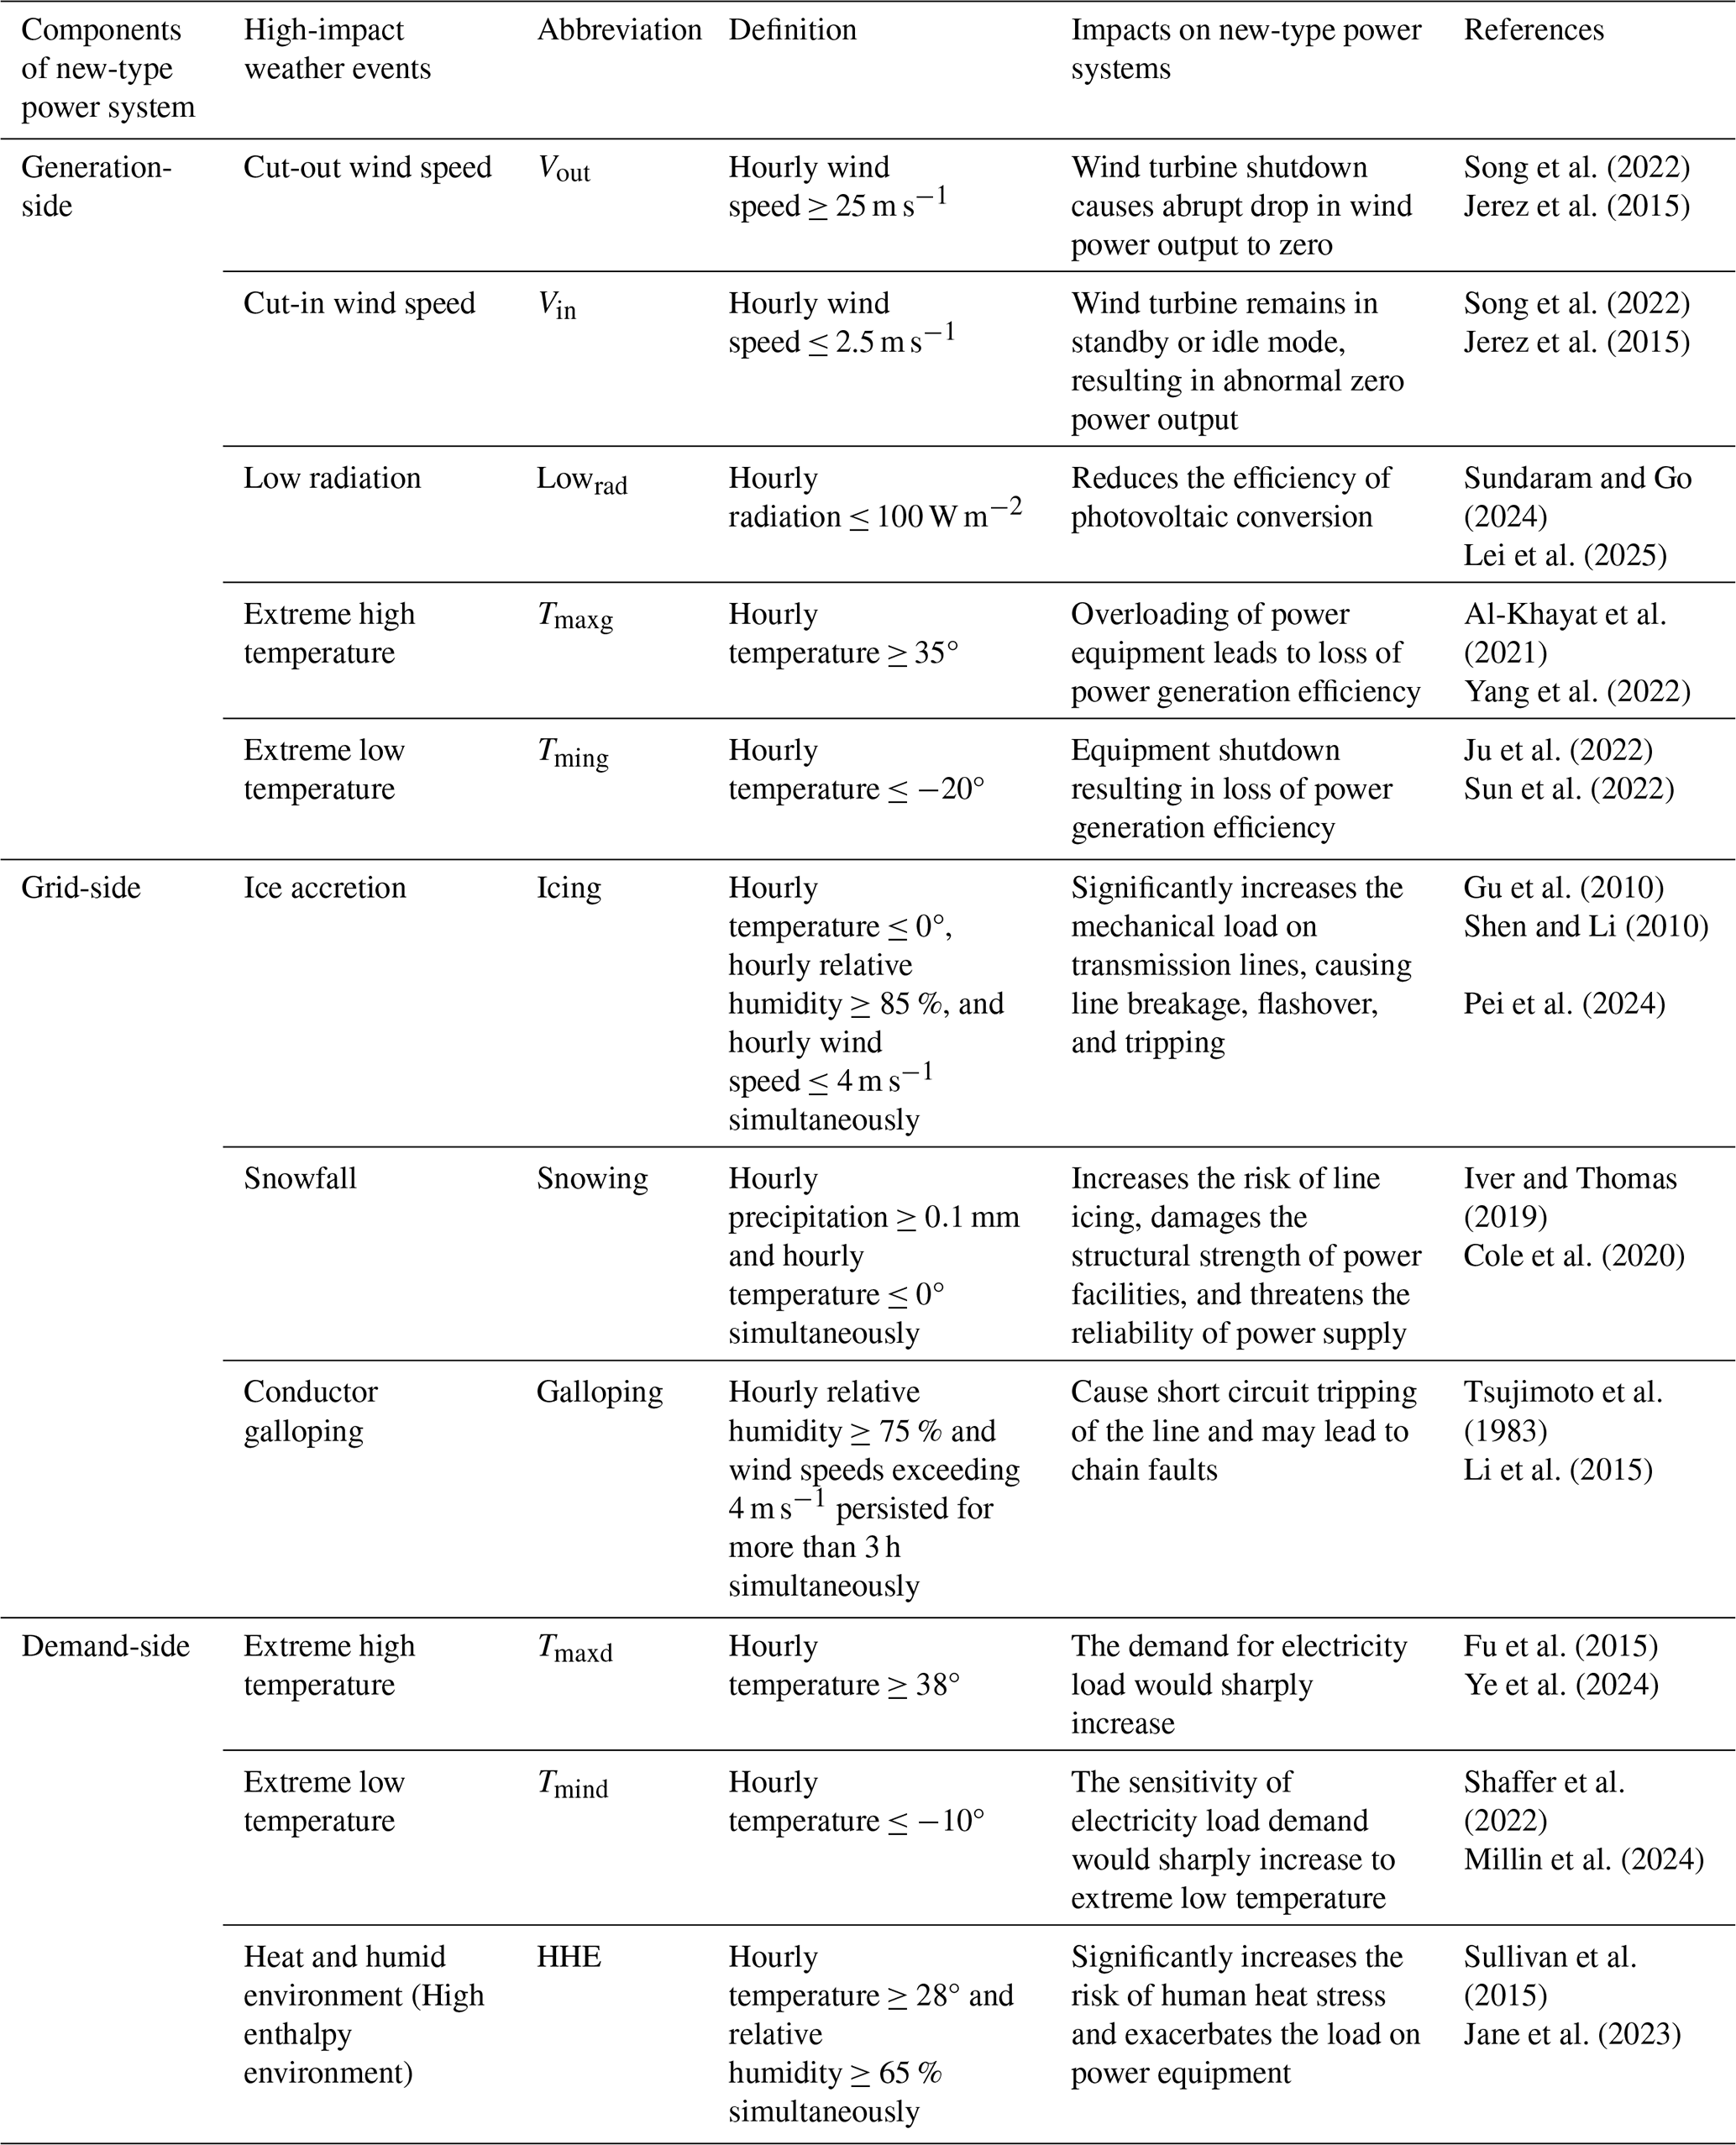
Based on the observations of hourly solar irradiance and power generation efficiency in large-scale photovoltaic power plants, Sundaram and Go (2024) demonstrated that photovoltaic conversion efficiency decreases significantly when hourly solar irradiance falls below 100 W m−2, with the performance ratio declining to critical levels; supporting this finding, Lei et al. (2025) established through comprehensive literature reviews that ≤ 100 W m−2 represents the standardized threshold for low-light conditions in photovoltaic systems; therefore, low radiation is defined as hourly solar irradiance ≤100 W m−2. Through systematic analysis of measurements and experiments (Oloufemi et al., 2016; Al-Khayat et al., 2021; Yang et al., 2022; Sun et al., 2022; Ju et al., 2022; Köster and Binder, 2023), Bi et al. (2025) derived a fitted relationship between power generation loss and air temperature; for operational definitions, extreme high temperature is specified as ≥35°, while extreme low temperature is defined as °.
In the grid-side, ice accretion is defined as hourly air temperature ≤0°, hourly relative humidity ≥85 % and hourly wind speed ≤4 m s−1; this definition is supported by three evidences: first, thermodynamic analysis by Gu et al. (2010) demonstrated through thermal equilibrium theory and wind tunnel experiments that the required Joule heating for anti-icing systems exhibits a sharp decline when temperatures fall below 0 °C, indicating a fundamental threshold for ice formation; second, comprehensive field observations by Shen and Li (2010) established the multi-parameter requirements for ice accretion on transmission lines, that are, the critical thermal window (temperature ≤0°, with optimal range between −10° and −1°), the moisture threshold (relative humidity ≥ 85 % for sufficient water vapor supply), and the aerodynamic constraint (wind speed ≤4 m s−1 to enable effective droplet impingement while preventing wind-driven shedding); third, these parameters are also codified in the Chinese Meteorological Industry Standard QX/T 355-2016 for wire icing risk assessment, which formally defines ice accretion as “the adherence of glaze, rime, or frozen wet snow to conductors” (Pei et al., 2024). Tsujimoto et al. (1983) found that conductor galloping typically occurs when wind speeds ≥4 m s−1 and persist for over 3 h; Li et al. (2015) further established meteorological thresholds by analyzing hourly weather variations during galloping events and considering galloping mechanisms and grid operation experience; based on these studies, the galloping criterion in this study is defined as: hourly relative humidity ≥75 % with sustained (≥3 h) wind speeds ≥4 m s−1. Snowfall is defined as hourly precipitation ≥0.1 mm with air temperature ≤0°, consistent with the standard definition adopted in community land surface models (Oleson et al., 2013).
In the demand-side, Fu et al. (2015) investigated the response of observed daily peak power load to temperature variations, identifying 38° as a critical threshold for peak power load, beyond which demand surges dramatically; observation analysis of Shaffer et al. (2022) found that power demand sensitivity increases sharply below −10°; similarly, Millin et al. (2024) observed significant load anomalies below −6° in the US Midwest; accordingly, we define extreme high and low temperature thresholds as: hourly temperature ≥38° and °, respectively. Baldwin et al. (2023) demonstrated through physiological experiments and observations that combined thermal stress (air temperature ≥30° with relative humidity ≥65 %) significantly increases human heat strain risks in power load sectors; Sullivan et al. (2015) further identified 28° as the critical temperature threshold for notable load growth through hourly load-temperature analysis; accordingly, heat and humid environment (high enthalpy environment) is defined as: hourly temperature ≥28° with relative humidity ≥65 %.
We need to explain that although these high-impact weather events are defined through literature reviews, their definitions are grounded in empirical evidence derived from observational studies, controlled laboratory experiments, or synthesis of established research findings. Therefore, the resulting classifications should be both scientifically reasonable and reliable. Furthermore, the CNPS-Met dataset is generated by assimilating hourly in-situ observations into hourly ERA5 reanalysis; therefore, the minimum temporal resolution of the meteorological variables is 1 h. On this basis, high-impact weather events are identified according to their respective definitions. After all such events are identified at hourly scale; they are aggregated to the daily scale. In other words, the CNPS-Met dataset supports both hourly and daily temporal scales. The hourly variables, including all meteorological elements and high-impact weather events, are subsequently stored and published online at daily scale. Moreover, the “frequency” in the following text refers to the number of days where the event occurred (i.e. the number of days where the event occurred at least once), rather than an estimate of the number of hours. For example, if a grid point experiences a high-impact weather event for at least 1 h on a certain day, then that day is marked as a high-impact weather event day for that grid point.
For high-impact weather events such as ice accretion, conductor galloping, and heat and humid environment in Table 1, as they involve multiple meteorological variables, the following composite weather index (CWI) is defined to characterize their occurrence and intensity:
where α represents a high-impact weather event composed of n meteorological variables, where the index of each variable is denoted by subscript k (). The threshold and the daily maximum value of the kth variable (αk) are denoted as th(αk) and max(αk), respectively. The max(αk) represents the multi-year daily maximum value of the kth variable in the corresponding different grid point.
To analyze high-impact weather events affecting new-type power systems across different regions of China, seven sub-regions (Fig. 1b) are defined according to the spatial distribution and organizational characteristics of the power grid in China (Zhuo et al., 2022).
Figure 3 shows the spatial distribution of differences in MREs of various meteorological variables between the CNPS-Met dataset and three other widely used datasets (CN05.1, CMFD and CDMet). Results show that the CNPS-Met dataset achieves lower MREs across different meteorological variables and over the majority region of China compared to the other datasets, indicating a generally higher accuracy of the meteorological estimates in CNPS-Met. Significant improvements are particularly evident in humidity, temperature and precipitation. However, exceptions are observed in some regions along the periphery of the Tibetan Plateau, where performance gains are less pronounced. Compared to the other datasets, the improvement in wind speed within CNPS-Met remains limited. Consistent results can also be found in different seasons (not shown). These discrepancies may be attributed to the following factors. First, the OI assimilation scheme employed in this study relies on background and observation error covariance matrices (Eqs. 3–4) derived from monthly-scale statistics. These matrices are static and may fail to adequately capture the rapid temporal variation characteristics of highly transient and intermittent variables such as wind speed. Second, regions where CNPS-Met exhibits larger errors are characterized by complex terrain and sparse observational coverage, the inherent uncertainties in the background field (e.g., ERA5) would diminish the effectiveness of the assimilation performance in these regions.
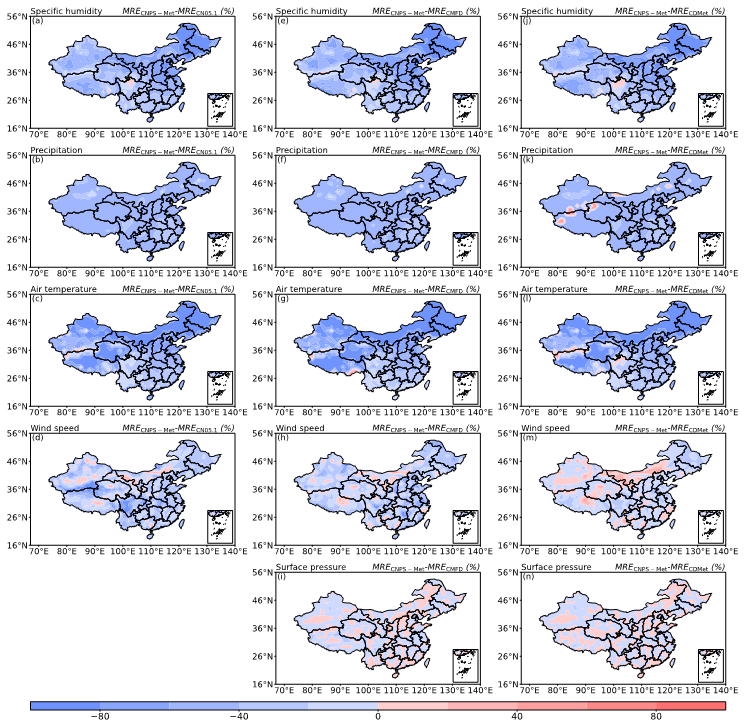
Figure 3Spatial distribution of the differences in the mean MREs (unit: %; averaged over 1980–2016) between three dataset pairs: (a–d) CNPS-Met and CN05.1 (MRE_CNPS-Met minus MRE_CN05.1), (e–i) between CNPS-Met and CMFD (MRE_CNPS-Met minus MRE_CMFD), and (j–n) between CNPS-Met and CDMet (MRE_CNPS-Met minus MRE_CDMet). The differences are shown for (a, e, j) 2 m specific humidity, (b, f, k) precipitation, (c, g, l) 2 m air temperature, (d, h, m) 10 m wind speed, and (i, n) surface pressure. Note that CN05.1 dataset does not include surface pressure.
Figure 4 displays box plots of the MREs and GPI values across different datasets and meteorological variables, averaged over China for the period 1980–2016. In comparison to the other datasets, CNPS-Met exhibits the lowest MREs with the narrowest range. Similarly, the GPI values in CNPS-Met are generally closest to 1.0 and show lower variability among the datasets. These results collectively indicate that the CNPS-Met dataset achieves superior performance over existing alternatives.
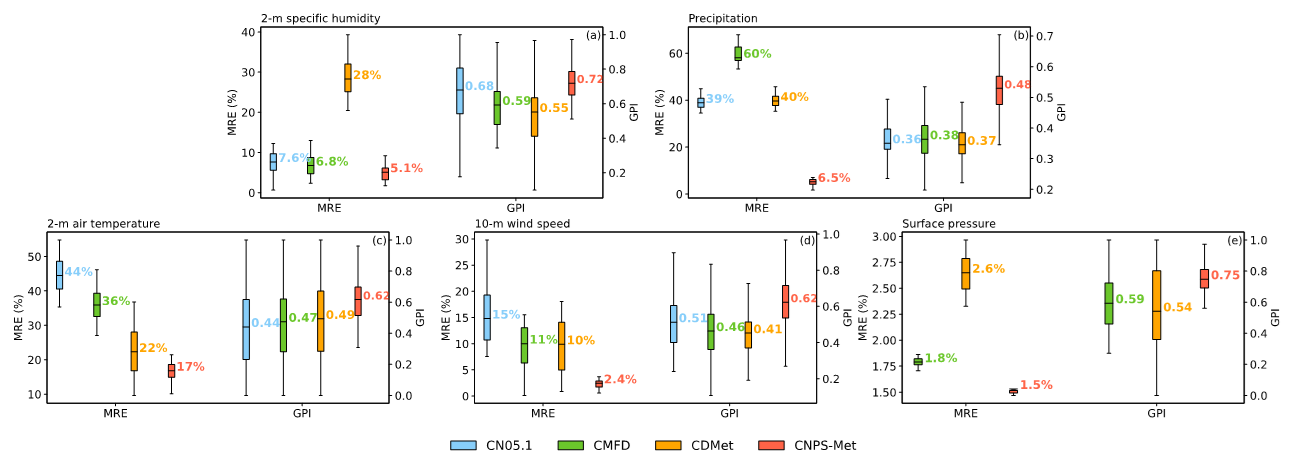
Figure 4The mean MREs (unit: %) and GPIs (unit: dimensionless) averaged over China from 1980 to 2016 in different datasets for (a) 2 m specific humidity, (b) precipitation, (c) 2 m air temperature, (d) 10 m wind speed, and (e) surface pressure.
To evaluate the effects of CNPS-Met at temporal scale, Fig. 5 compares the annual variations of MREs in China for different meteorological variables across different datasets. Results show that CNPS-Met generally outperforms other datasets in most years, especially for precipitation, wind speed and surface pressure. Exceptions occur for air temperature and specific humidity, where MREs from CNPS-Met are larger, such as near 1985 and between 2005 and 2010. The monthly MREs across different datasets and meteorological variables, averaged over China for the period 1980–2016, are further compared in Fig. 6. Consistent with the above results, CNPS-Met outperforms the other datasets in different months, exhibiting generally the lowest MREs and narrowest variability range. As noted earlier, the improvement effect of CNPS-Met on precipitation remains modest compared to that on other meteorological variables.
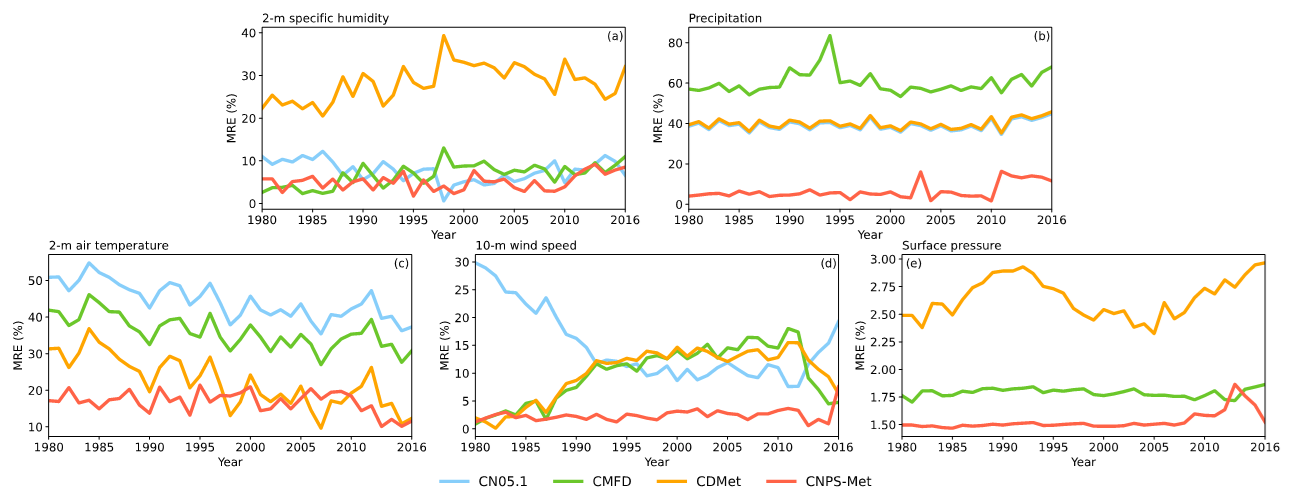
Figure 5The inter-annual variation of the mean MREs (unit: %; averaged over China) for (a) 2 m specific humidity, (b) precipitation, (c) 2 m air temperature, (d) 10 m wind speed and (e) surface pressure in different datasets.
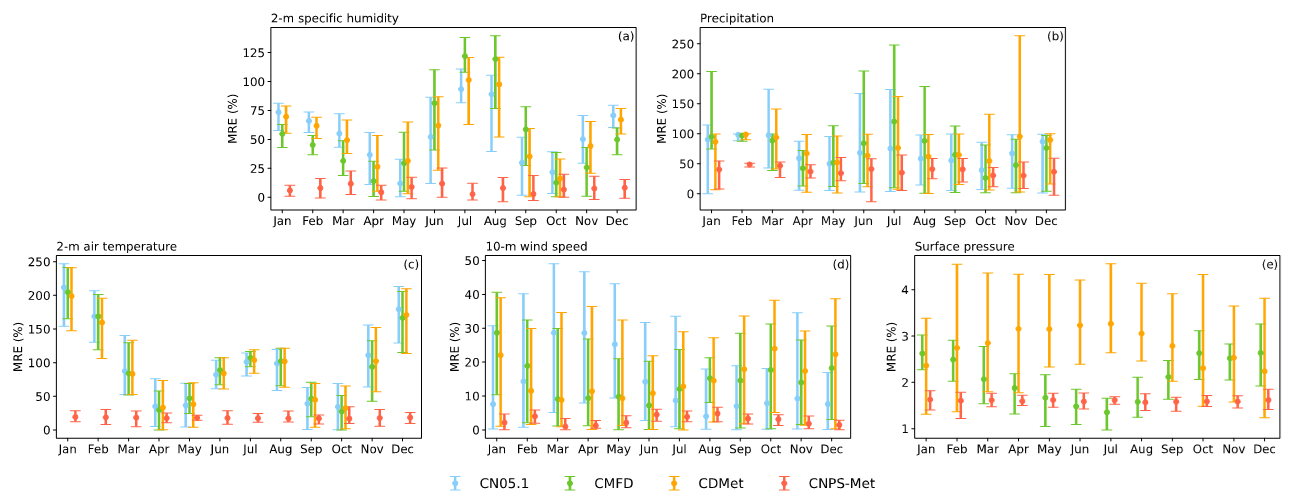
Figure 6Monthly variation of the mean MREs (unit: %; averaged in China from 1980 to 2016) for (a) 2 m specific humidity, (b) precipitation, (c) 2 m air temperature, (d) 10 m wind speed and (e) surface pressure in different datasets.
Given the apparent spatial heterogeneity of MREs across different datasets (Fig. 3), Fig. 7 presents the MREs averaged over the period from 1980 to 2016 for China and its seven sub-regions. Results show that among all datasets evaluated, CNPS-Met demonstrates the lowest MREs in various meteorological variables over both the entire China region and its seven sub-regions. In addition to the findings consistent with the analysis above, that are, the MREs for different meteorological variables in CNPS-Met are the smallest. Compared to the other three datasets, MREs of air temperature, specific humidity, wind speed, precipitation and surface pressure averaged over China for the past 40 years could be reduced by 1.7 %–18.5 %, 9.0 %–29.6 %, 1.9 %–8.5 %, 2.7 %–18 % and 4.9 %–5.2 %, respectively. For specific humidity, CNPS-Met exhibits relatively small MREs (7 %–9 %) in South China (SC), East China (EC), Central China (CC), and Northeast China (NE), whereas relatively large MREs (approximately 20 %) are observed in Northwest China (NW) and Southwest China (SW). For wind speed, the smallest MRE (4.1 %) occurs in Northeast China (NE), while the largest MRE (9.0 %) is found in North China (NC). In the case of air temperature, smaller MREs (below 3 %) are exhibited in East China (EC) and Central China (CC), contrasting with the largest MREs (14.1 %) in Northwest China (NW). For precipitation, the smallest MRE (9.6 %) is observed in Northwest China (NW), compared to the largest MRE (57.8 %) in East China (EC). For surface pressure, the smaller MRE (below 10 %) occurs in Northeast China (NE), North China (NC), Central China (CC), South China (SC) and East China (EC), while the larger MRE (9.0 %) is found in other regions. Noted that the improvement of CNPS-Met in wind speed is relatively modest compared to other datasets (see Fig. 3). However, wind speed in CNPS-Met exhibits the smallest MREs among all meteorological variables, similar phenomenon can also be observed in other datasets (see Figs. 5–7).
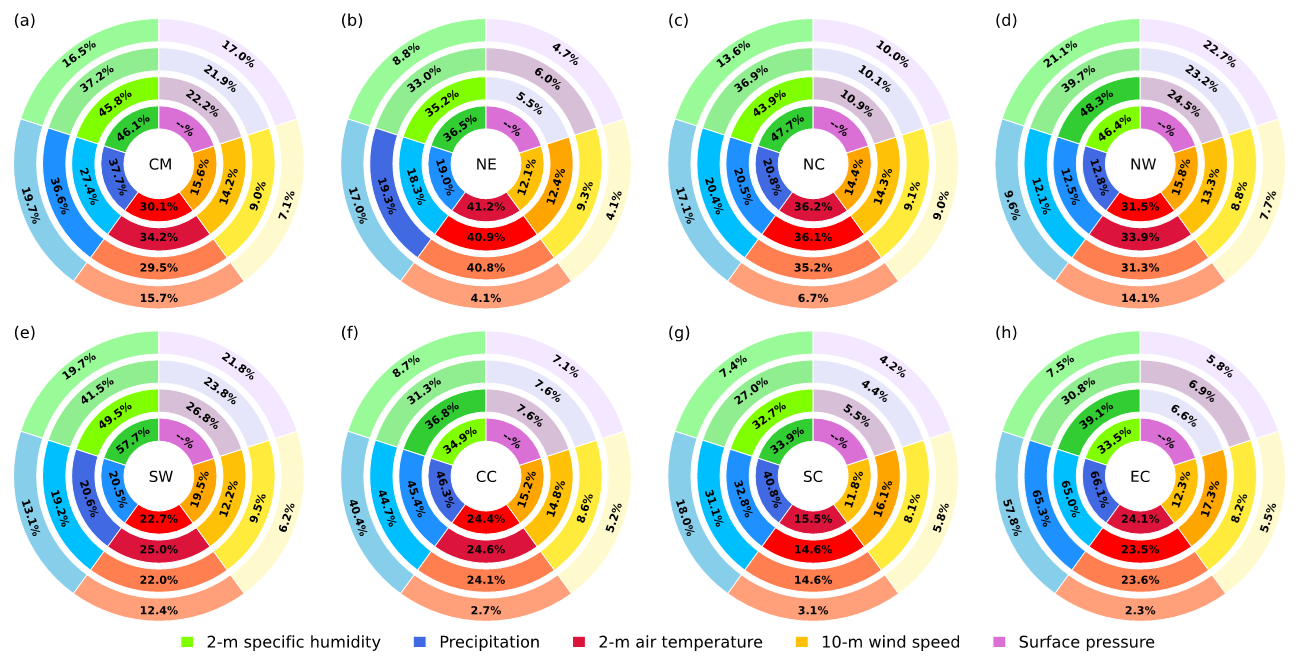
Figure 7The mean MREs (unit: %; averaged over 1980–2016) of different meteorological variables in (a) Chinese mainland (CM), (b) Northeast China, (c) North China, (d) Northwest China, (e) Southwest China, (f) Central China, (g) South China, and (h) East China. The concentric circles represent different datasets (from inner to outer: CN05.1, CMFD, CDMet and CNPS-Met). The lowest values of MREs are denoted as the lightest color. The mean MREs for surface pressure are denoted as –%, as it is not included in the CN05.1 dataset.
In this section, high-impact weather events from three critical dimensions of the new-type power system such as generation-side, grid-side, and demand-side will be identified from Table 1, followed by a discussion of their spatiotemporal characteristics in the past 40 years.
Figure 8 shows the spatial distribution of the multi-year averaged frequency hotspots and intensity extremes (90 % confidence level) of different high-impact weather events in China. The “intensity extreme” at the 90 % confidence level is obtained through T-test and refers to the 90th percentile of intensity of high-impact weather events. In the generation-side, cut-out wind speed predominantly occurs over the northern Tibetan Plateau, Eastern Inner Mongolia, and parts of Xinjiang known as the “Hundred-mile Wind Zone”, which is consistent with the regions of high wind energy potentials, as analyzed by Pan et al. (2012), Yao et al. (2018) and Gyatso et al. (2023). Cut-in wind speed is primarily observed in Southwest China, this spatial pattern aligns with existing research on sustained weak wind events in Chinese Mainland, which are known to severely impact generation-side reliability (Gao et al., 2025). Low radiation events are concentrated in the middle and lower reaches of the Yangtze River. This finding is consistent with Zhang et al. (2024a), who attribute the region's lower solar radiation to its higher cloud cover and humidity. Extreme high temperatures are primarily found in the desert regions of Xinjiang (i.e., Junggar and Tarim basins), as well as in Eastern Inner Mongolia, a pattern highly consistent with existing climate model simulation and observations and largely attributed to regional arid conditions (Meng et al., 2019; Dong et al., 2024). Extreme low temperatures occur most frequently in the Kunlun Mountains, the Qilian Mountains and Northeast China, which is consistent with Li et al. (2015) and Shi et al. (2016), who note that despite a general decline trend of extreme low temperatures, these regions remain prone to such events. In the grid-side, ice accretion primarily affects Northeast China, Northern Xinjiang and Kunlun Mountains, which is also reported by Chen et al. (2010). Snowfall events are most frequent across the Tibetan Plateau, Northeast China, and Northwest Xinjiang, this distribution pattern is consistent with the findings of Yang et al. (2019) and Wang et al. (2022) based on their analysis of observations and multi-source reanalysis datasets. Conductor galloping occurs mainly in Northeast China, northern Tibetan Plateau, and sporadic regions in southern China. The spatial distributions of extreme high- and low-temperature frequencies in the demand-side are similar to those in the generation-side. Heat and humid environments occur primarily in Central and Southern China, consistent with Li et al. (2025) regarding their impact on the demand-side. The spatial distributions of high-impact weather intensity and frequency are generally consistent, albeit with some exceptions. For example, in the generation-side, low solar radiation events are most frequent in the middle and lower reaches of the Yangtze River, yet they are relatively weak when they occur. In the grid-side, ice accretion is infrequent in Southern China but tends to be intense. In the demand-side, the extreme low temperatures in Northeast China are particularly severe.
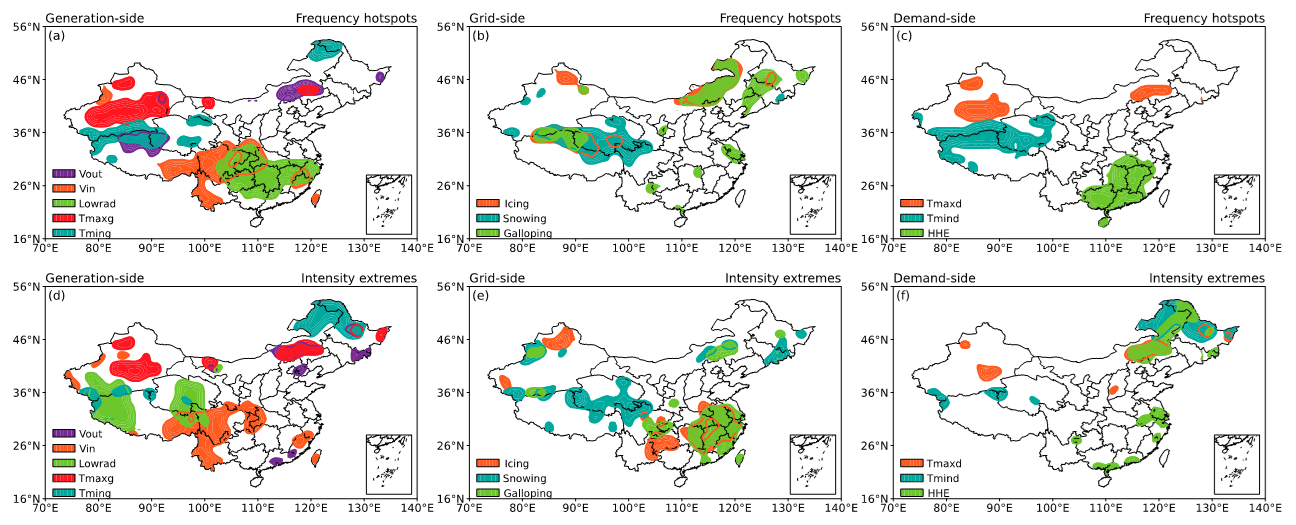
Figure 8Spatial distribution of frequency hotspots and intensity extremes (90 % confidence level) of different high-impact weather events in Chinese mainland during 1980–2016.
Figures 9–11 summarize the frequency and intensity of high-impact weather events in the generation-side, grid-side and demand-side in China and its sub-regions. In the generation-side, the highest frequency of cut-out wind speed occurs in North China, while its highest intensity is in East China. Cut-in wind speed is most frequent in Southwest and Central China. Low radiation occurs most frequently in East and Central China. Extreme high temperatures are relatively frequent in Northwest, Central, East and South China, with the greatest intensity observed in North China. Extreme low temperatures are most frequent and most intense in Northeast China. On average, the frequency and mean intensity of cut-out wind speed, cut-in wind speed, low radiation, extreme high temperature and extreme low temperature in China are 0.4 % and 37.3 m s−1, 58.9 % and 1.5 m s−1, 14.9 % and 30.1 W m−2, 2.5 % and 37.1°, 9.9 % and −23.1°, respectively. In the grid-side, ice accretion occurs most frequently in North China while its most severe events are observed in South China. Snowfall events are most frequent in Northeast China, while are most intense in Central China. Conductor galloping events are most common in Northeast China while their peak intensity is found in East China. On average, the frequency and mean intensity of ice accretion, snowfall and conductor galloping events in China are 2.36 % and 0.26, 1.03 % and 0.75 mm, and 12.18 % and 0.25, respectively. In the demand-side, both the frequency and intensity of extreme high temperature are relatively high in Northwest and South China. Extreme low temperature reach its highest frequency and intensity in Northeast China.
Similarly, heat and humid environment is most pronounced in South, East and Central China. On average, the frequency and mean intensity of extreme high temperature, extreme low temperature and heat and humid environment in China are 0.73 % and 40.94°, 24.84 % and −15.06°, and 6.07 % and 0.24, respectively.
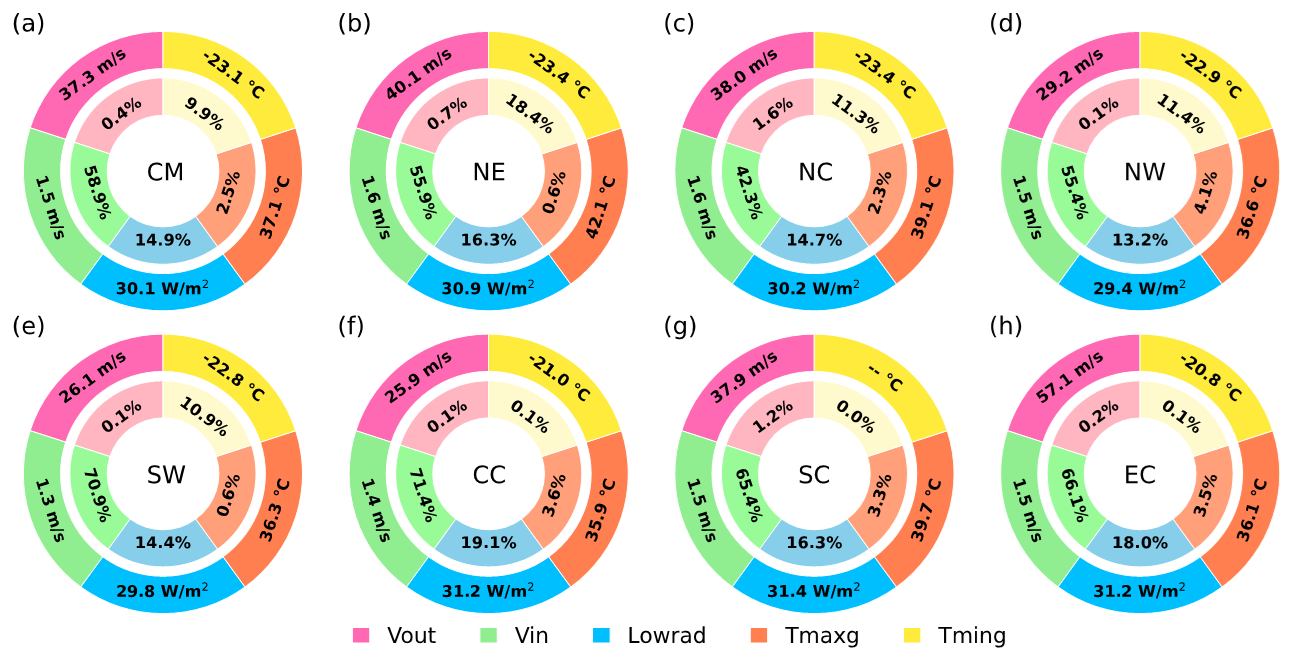
Figure 9The annual mean frequency (unit: % per annum) and intensity of high-impact weather events relevant to generation-side across different regions of China (1980 to 2016). The inner and outer circles correspond to the frequency and average intensity, respectively.
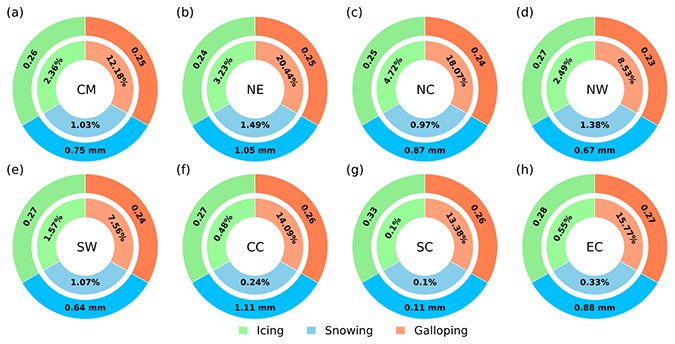
Figure 10Similar to Fig. 9, but for grid-side. Note that the intensity of ice accretion and conductor galloping events is calculated based on CWI indice, which is dimensionless.
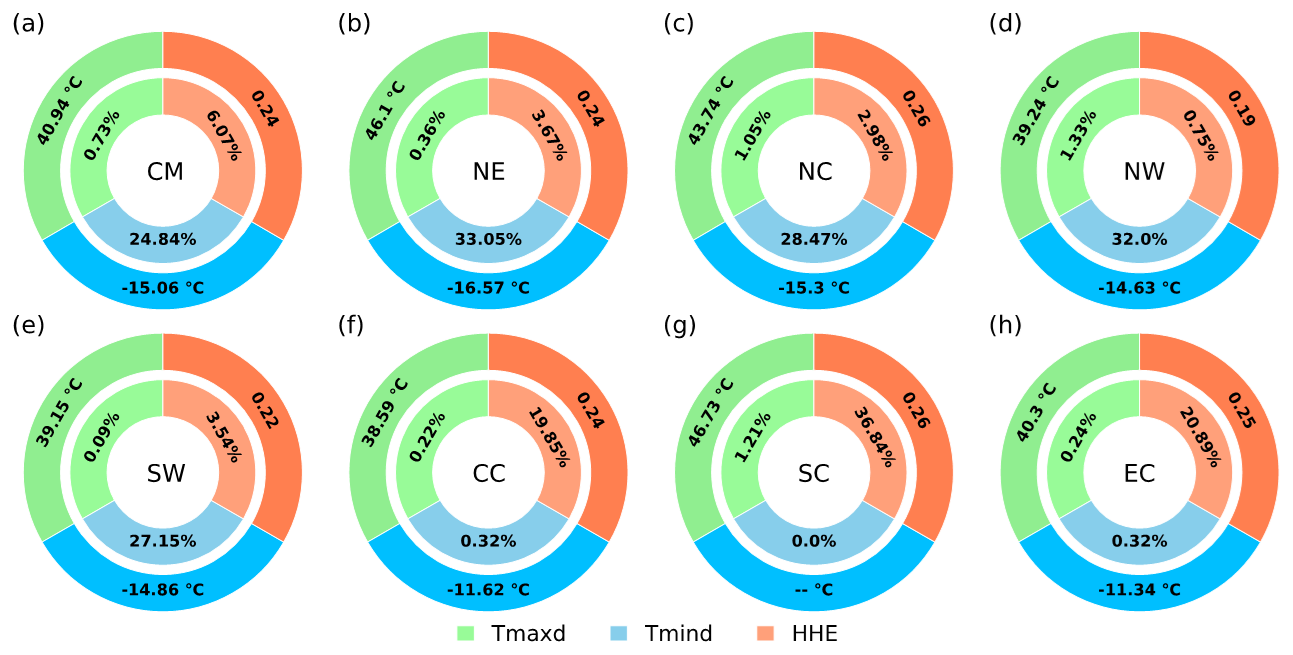
Figure 11Similar to Fig. 9, but for demand-side. Note that the intensity of heat and humid environment events is calculated based on CWI indice, which is dimensionless.
The CNPS-Met dataset is available in its most updated version from our public repository at https://doi.org/10.12072/ncdc.nieer.db6972.2025 (Zhang et al., 2025). Data are provided as standard NetCDF format. Unit conventions and detailed variable descriptions are included in the metadata and the paper.
In new-type power systems dominated by wind and solar energy, there is a pronounced “weather dependency” and “system vulnerability”, where high-impact weather events can amplify risks to operational security. Developing a high-quality gridded dataset that involves both meteorological variables and high-impact weather events is of great significance. In this study, the China New-type Power Systems Meteorological (CNPS-Met) dataset is developed, and the spatiotemporal characteristics of high-impact weather events affecting new-type power systems are analyzed. The main conclusions are summarized as follows:
An improved optimal interpolation assimilation scheme, herein referred to as the spatially adaptive optimal interpolation scheme, is employed to generate the CNPS-Met dataset. Unlike conventional optimal interpolation schemes that utilize a fixed influence radius in the observation operator, the improved scheme adaptively adjusts the influence radius based on the spatial density and distribution of observational stations, thereby providing the capability to effectively characterize local variations in meteorological variables.
The CNPS-Met dataset covers the entire Chinese mainland. It features a daily temporal resolution and a 25 km spatial resolution. The dataset includes eight meteorological variables and eleven high-impact weather events, categorized into generation-side, grid-side and demand-side perspectives. Evaluation results indicates that, the meteorological estimates from the CNPS-Met dataset generally demonstrate superior performance compared to the other three datasets (CN05.1, CMFD and CDMet). This advantage is consistent across various meteorological variables and throughout most regions of China, as evidenced by lower MREs and higher GPI values. Furthermore, CNPS-Met maintains higher accuracy in most years, seasons, and months. Compared to the other datasets, the estimated MREs of 2 m air temperature, 2 m specific humidity, 10 m wind speed, precipitation and surface pressure averaged over the Chinese mainland from 1980 to 2016 in CNPS-Met could be reduced by 1.7 %–18.5 %, 9.0 %–29.6 %, 1.9 %–8.5 %, 2.7 %–18 % and 4.9 %–5.2 %, respectively.
Based on the observation experiments, ideal experiments, and literature research, a series of high-impact weather events critical to the operation of new-type power systems are identified. In the generation-side, the frequency and mean intensity of cut-out wind speed, cut-in wind speed, low radiation, extreme high temperature and extreme low temperature in China are 0.4 % and 37.3 m s−1, 58.9 % and 1.5 m s−1, 14.9 % and 30.1 W m−2, 2.5 % and 37.1°, 9.9 % and −23.1°, respectively. In the grid-side, the frequency and mean intensity of ice accretion, snowfall and conductor galloping events in China are 2.36 % and 0.26, 1.03 % and 0.75 mm, and 12.18 % and 0.25, respectively. In the demand-side, the frequency and mean intensity of extreme high temperature, extreme low temperature and heat and humid environment in China are 0.73 % and 40.94°, 24.84 % and −15.06°, and 6.07 % and 0.24, respectively.
Results of this study are anticipated to establish a foundation for research and applications spanning meteorology and new-type power systems, and are expected to ultimately support the formulation of renewable energy policies in China. Our future work will focus on investigating the direct (e.g., damage to, failure of, and performance degradation in power generation equipment) and indirect (e.g., reduced power generation efficiency and increased operation and maintenance costs) impacts of meteorological conditions on the generation-side, grid-side, and demand-side of the new-type power system through field observations or idealized experiments, thereby establishing a more comprehensive and scientific identification for high-impact weather events, especially the compound weather events. Additionally, influences of high-impact weather events on wind and solar energy are different, which will also be investigated. Furthermore, our dataset is designed to be a living dataset that can be continuously extended, we shall update this dataset continuously and enhance the spatiotemporal resolution and quality of the CNPS-Met dataset by applying artificial intelligence methods (including image enhancement techniques etc.) and incorporating underlying surface characteristics and satellite data.
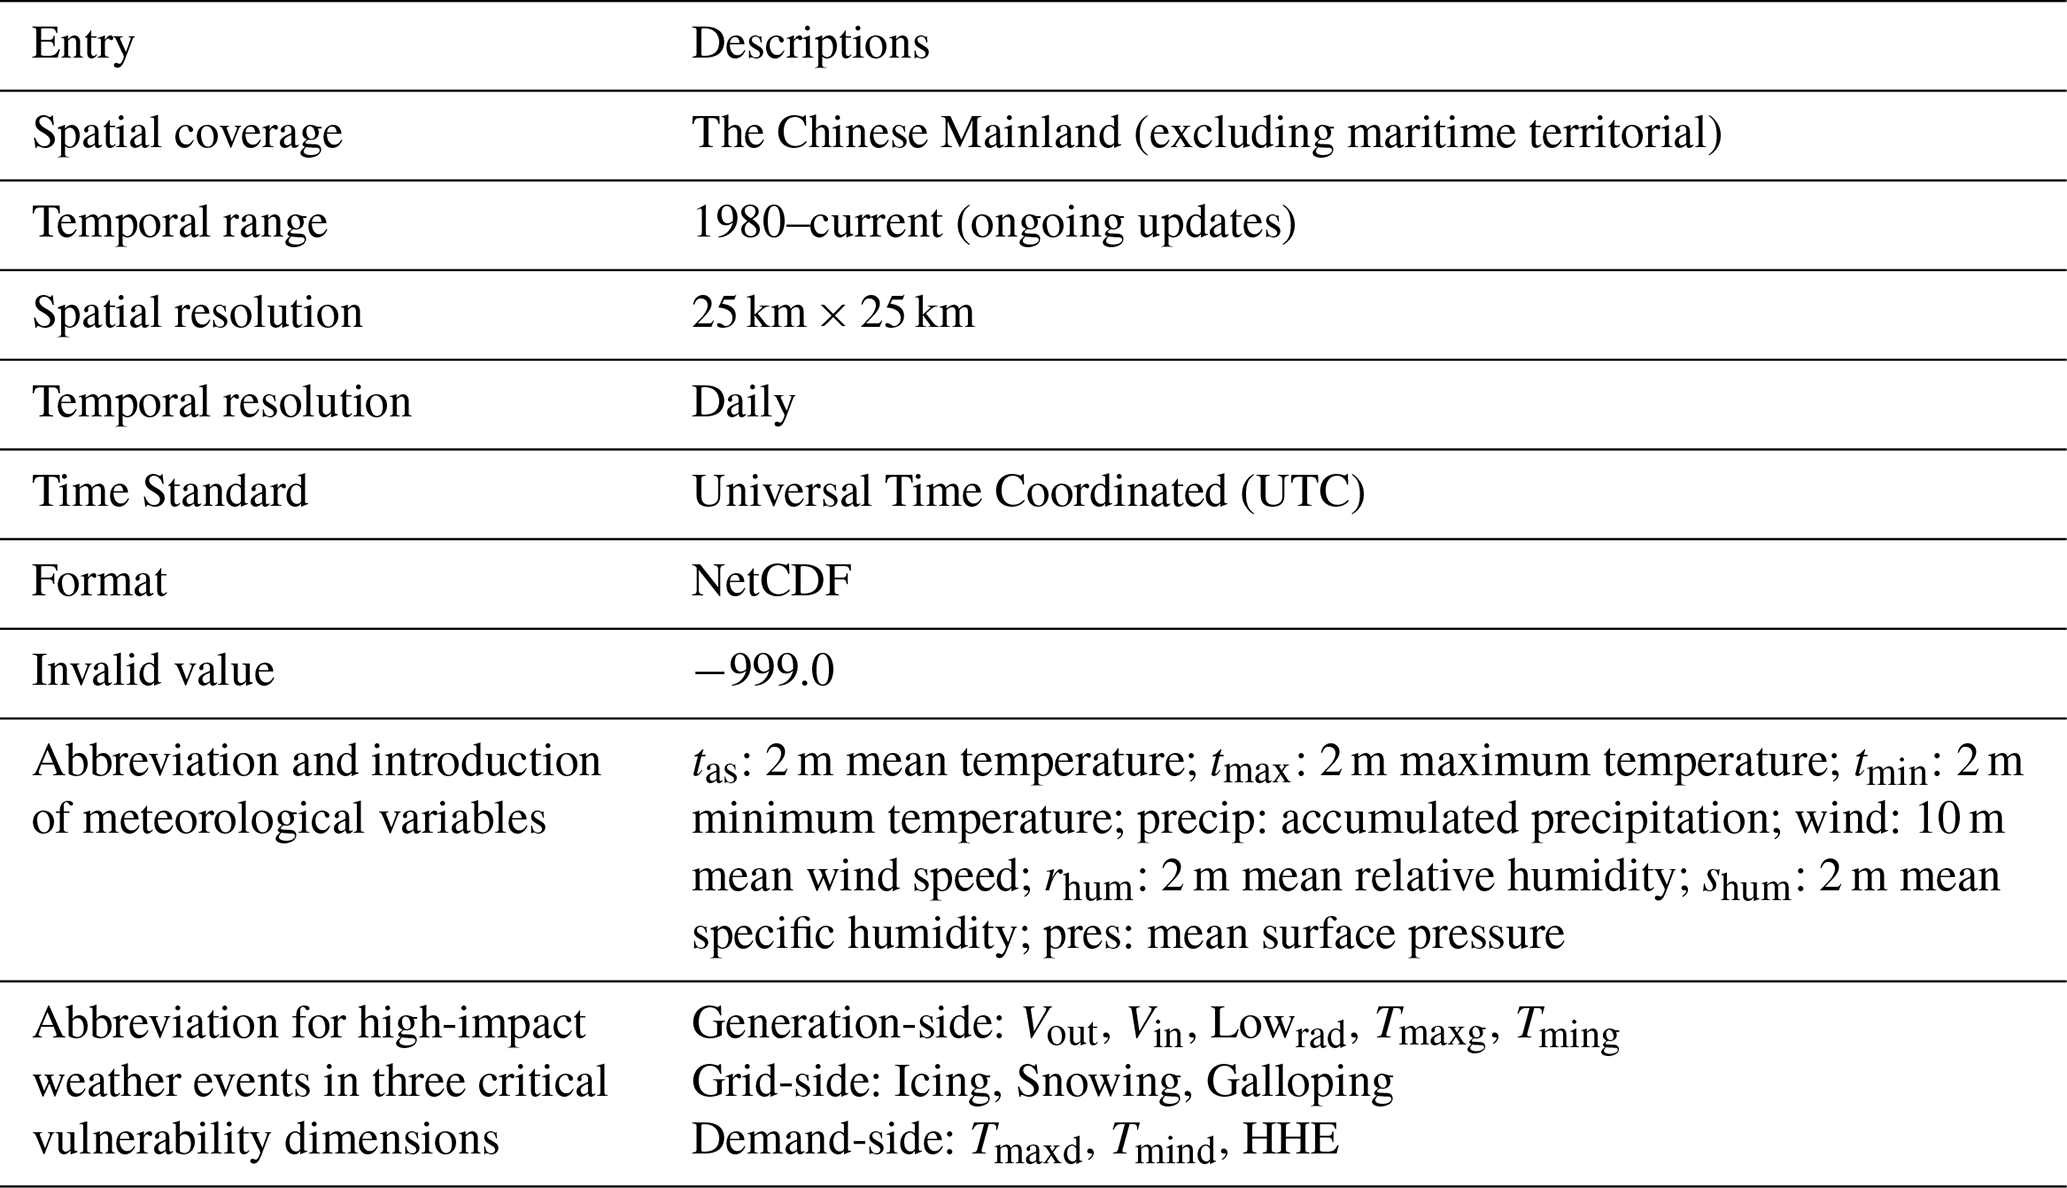
A detailed description of the CNPS-Met dataset is provided in Table 2.
The file name for CNPS-Met follows the pattern: CNPS_Type_History_Daily_Variable_CCYY.nc, and all times are in Coordinated Universal Time (UTC). In this naming convention: “Type” is an abbreviation for meteorological variables and for the generation side, grid side, and demand side of the new power system, represented respectively by “Meteo”, “Generation”, “Grid”, and “Demand”, respectively; “Variable” is an abbreviation for the variable name; “CCYY” represents the year (e.g., ).
The meteorological variables include: tas (2 m mean temperature), tmax (2 m maximum temperature), tmin (2 m minimum temperature), precip (accumulated precipitation), wind (10 m mean wind speed), rhum (2 m mean relative humidity), shum (2 m mean specific humidity), pres (mean surface pressure). The high-impact weather on the generation side includes: Vout (cut-out wind speed), Vin (cut-in wind speed), Lowrad (low radiation), Tmaxg (extreme high temperature), Tming (extreme low temperature). The high-impact weather on the grid-side includes: Icing (ice accretion), Snowing (snowfall), Galloping (conductor galloping). The high-impact weather on the demand-side includes Tmaxd (extreme high temperature), Tmind (extreme low temperature), and HHE (heat and humid environment).
FZ: data curation, conceptualization, methodology, writing – original draft, writing – review and editing. KB: methodology, data analysis and visualization, writing – review and editing. XC: project administration, funding acquisition, writing – review and editing. YY: supervision, writing – review and editing, project. FY: project administration, funding acquisition. CW: supervision, conceptualization, writing – review and editing.
The contact author has declared that none of the authors has any competing interests.
Publisher's note: Copernicus Publications remains neutral with regard to jurisdictional claims made in the text, published maps, institutional affiliations, or any other geographical representation in this paper. The authors bear the ultimate responsibility for providing appropriate place names. Views expressed in the text are those of the authors and do not necessarily reflect the views of the publisher.
This study is supported by the National Science Foundation of China (grant no. 42275004), the Key Research and Development Program of Gansu Province of China (grant no. 23YFFA0001), and the Fundamental Research Funds for the Central Universities (grant no. lzujbky-2024-ey08).
This paper was edited by Guanyu Huang and reviewed by two anonymous referees.
Akmaev, R. A.: A prototype upper-atmospheric data assimilation scheme based on optimal interpolation: 1, Theory, J. Atmos. Sol.-Terr. Phy., 61, 491–504, https://doi.org/10.1016/S1364-6826(99)00006-1, 1999.
Al-Khayat, M., Al-Rasheedi, M., Gueymard, C. A., Haupt, S. E., Kosović, B., Al-Qattan, A., and Lee, J. A.: Performance analysis of a 10-MW wind farm in a hot and dusty desert environment – Part 2: Combined dust and high-temperature effects on the operation of wind turbines, Sustain. Energy Technol. Assess., 47, 101461, https://doi.org/10.1016/j.seta.2021.101461, 2021.
Alonso, Y., Martinez, Y., Roque, A., Yu, W., and Borrajero, I.: A post-processing module based on Cressman's analysis to improve the Wind Energy Simulation Toolkit mapping system, Wind Engineering, 43, 277–298, https://doi.org/10.1177/0309524X18780400, 2018.
Baldwin, J. W., Benmarhnia, T., Ebi, K. L., Jay, O., Lutsko, N. J., and Vanos, J. K.: Humidity's role in heat-related health outcomes: a heated debate, Environ. Health Persp., 131, 055001, https://doi.org/10.1289/EHP11807, 2023.
Bannister, R. N.: A review of operational methods of variational and ensemble-variational data assimilation, Q. J. Roy. Meteor. Soc., 134, 1791–1816, https://doi.org/10.1002/qj.2982, 2008.
Bi, K., Chen, X., Cui, H., Zhang, F., Cui, Y., and Wang, C.: Influence of Extreme Climate events on wind and Solar Energy over the Gobi Desert Region of China in the future, Theor. Appl. Climatol., 156, 1–18, https://doi.org/10.1007/s00704-025-05362-w, 2025.
Carrassi, A., Bocquet, M., Bertino, L., and Evensen, G.: Data assimilation in the geosciences: An overview of concepts, issues, and perspectives, Wires Clim. Change, 9, e535, https://doi.org/10.1002/wcc.535, 2018.
Chen, P., Wang, Y., Wen, X. S., Lan, L., Wang C., Gan, Y., Zhang, L., Zhan, F., and Fu, P.: Overview of the destructive impact of low-temperature rain, snow, and freezing disasters on China’s power grid, Power Grid Technol., 34, 135–139, https://doi.org/10.13335/j.1000-3673.pst.2010.10.020, 2010.
Christensen, M. F., Heaton, M. J., Rupper, S., Reese, C. S., and Christensen, W. F.: Bayesian Multi-Scale Spatio-Temporal Modeling of Precipitation in the Indus Watershed, Front. Earth Sci., 7, https://doi.org/10.3389/feart.2019.00210, 2019.
Cole, W., Greer, D., Ho, J., and Margolis, R.: Considerations for maintaining resource adequacy of electricity systems with high penetrations of PV and storage, Appl. Energ., 279, 115795, https://doi.org/10.1016/j.apenergy.2020.115795, 2020.
Cressman, G. P.: An operational objective analysis system, Mon. Weather Rev., 87, 367–374, https://doi.org/10.1175/1520-0493(1959)087<0367:AOOAS>2.0.CO;2, 1959.
Daley, R.: Atmospheric data analysis, Cambridge University Press, https://doi.org/10.4267/2042/51948, 1993.
D'Amico, F., Collino, E., Viterbo, F., Bonanno, R., Talomo, S., Vergine, C., Pietrocola, F., and De Nigris, M.: Fire Danger Characterization in Italy: Mitigating the Impact on Real Time Operation of the Power System, 2024 AEIT International Annual Conference (AEIT), 1–6, https://doi.org/10.23919/AEIT63317.2024.10736821, 2024.
Despotovic, M., Nedic, V., Despotovic, D., and Cvetanovic, S.: Review and statistical analysis of different global solar radiation sunshine models, Renew. Sust. Energ. Rev., 52, 1869–1880, https://doi.org/10.1016/j.rser.2015.08.035, 2015.
Dong, D., Tao, H., Zhang, Z., and Mondal, S. K.: Projected heatwaves in Xinjiang Uygur autonomous region, China, Front. Earth Sci., 12, https://doi.org/10.3389/feart.2024.1286012, 2024.
Eyre, J. R., Bell, W., Cotton, J., English, S. J., Forsythe, M., Healy, S. B., and Pavelin, E. G.: Assimilation of satellite data in numerical weather prediction, Part II: Recent years, Q. J. Roy. Meteor. Soc., 148, 521–556, https://doi.org/10.1002/qj.4228, 2022.
Fu, G., You, F., Cao, X., and Jia, J.: Application and verification of accumulated temperature effect in daily peak and valley load of electricity, J. Appl. Meteorol., 26, 492–499, https://doi.org/10.11898/1001-7313.20150411, 2015.
Gandin, L. S.: The problem of optimal interpolation, Trudy Main Geophys. Obs., 99, 67–75, 1959.
Gao, Y., Shao, L., Meng, Y., Mao, S., Du, Y., Ma, S., Xiao, J., Yang, D., Miao, C., and Dong, G.: The temporal and spatial distribution of persistent low wind power events and their relationship with weather regimes in mainland China, Renew. Energ., 252, 123523, https://doi.org/10.1016/j.renene.2025.123523, 2025.
Girotto, M., Musselman, K. N., and Essery, R. L. H.: Data Assimilation Improves Estimates of Climate-Sensitive Seasonal Snow, Curr. Clim. Change Rep., 6, 81–94, https://doi.org/10.1007/s40641-020-00159-7, 2020.
Gu, X., Wang, H., Liu, H., Zhao, L., and Li, H.: Expert System of Ice Prevention on Overhead Transmission Lines, 2010 International Conference on Intelligent Computation Technology and Automation, 2, 273–276, https://doi.org/10.1109/ICICTA.2010.765, 2010.
Gyatso, N., Li, Y., Gao, Z., Wang, Q., Li, S., Yin, Q., Chen, J., Jin, P., Liu, Z., Ma, Z., Chen, X., and Feng, J.: Wind power performance assessment at high plateau region: A case study of the wind farm field test on the Qinghai-Tibet plateau, Appl. Energ., 336, 120789, https://doi.org/10.1016/j.apenergy.2023.120789, 2023.
He, J., Yang, K., Tang, W., Lu, H., Qin, J., Chen, Y., and Li, X.: The first high-resolution meteorological forcing dataset for land process studies over China, Sci. Data, 7, 1–11, https://doi.org/10.1038/s41597-020-0369-y, 2020.
Heim Jr., R. R.: An overview of weather and climate extremes – Products and trends, Weather Clim. Extrem., 10, 1–9, https://doi.org/10.1016/j.wace.2015.11.001, 2015.
Hersbach, H., Bell, B., Berrisford, P., Hirahara, S., Horányi, A., Muñoz-Sabater, J., Nicolas, J., Peubey, C., Radu, R., Schepers, D., Simmons, A., Soci, C., and Thépaut, J. N.: The ERA5 global reanalysis, Q. J. Roy. Meteor. Soc., 146, 1999–2049, https://doi.org/10.1002/qj.3803, 2020.
Hunt, B. R., Kostelich, E. J., and Szunyogh, T.: Efficient data assimilation for spatiotemporal chaos: A local ensemble transform Kalman filter, Physica D, 230, 112–126, https://doi.org/10.1016/j.physd.2006.11.008, 2007.
IPCC: Climate Change 2021: The Physical Science Basis, Cambridge University Press, https://doi.org/10.1017/9781009157896, 2021.
Iver, F. and Thomas, K. T.: A feasibility study of photovoltaic snow mitigation systems for flat roofs, Tech. Trans., 12, 81–96, https://doi.org/10.4467/2353737XCT.19.073.10724, 2019.
Jerez, S., Thais, F., Tobin, I., Wild, M., Colette, A., Yiou, P., and Vautard, R.: The CLIMIX model: A tool to create and evaluate spatially-resolved scenarios of photovoltaic and wind power development, Renew. Sust. Energ. Rev., 42, 1–15, https://doi.org/10.1016/j.rser.2014.09.041, 2015.
Jiang, C., Parteli, E. J., Xia, Q., and Shao, Y.: Evaluation of precipitation reanalysis products for regional hydrological modelling in the Yellow River Basin, Theor. Appl. Climatol., 155, 2605–2626, https://doi.org/10.1007/s00704-023-04758-w, 2023.
Jiang, Q., Li, W., Fan, Z., He, X., Sun, W., Chen, S., Wen, J., Gao, J., and Wang, J.: Evaluation of the ERA5 reanalysis precipitation dataset over Chinese Mainland, J. Hydrol., 595, 125660, https://doi.org/10.1016/j.jhydrol.2020.125660, 2021.
Jiang, X., Xiong, X., Wang, W., Ye, X., Chen, X., Wang, Y., and Zhang, F.: An Improved Interpolation Algorithm for Surface Meteorological Observations via Fuzzy Adaptive Optimisation Fusion, Atmosphere-Basel, 16, 1–22, https://doi.org/10.3390/atmos16070844, 2025.
Ju, G., Wang, J., and Cui, C.: Impact of extreme weather events on new energy power generation and power grid operation, Smart Power, 50, 77–83, 2022.
Kalnay, E.: Atmospheric modeling, data assimilation and predictability, Cambridge University Press, https://doi.org/10.1017/CBO9780511802270, 2003.
Köster, R. and Binder, A.: Optimum 7 MW HTS direct-drive wind turbine synchronous generator designs with different rotor and stator iron topologies, Electrotech. Inf. Tech., 140, 324–337, https://doi.org/10.1007/s00502-023-01127-3, 2023.
Lavers, D. A., Simmons, A., Vamborg, F., and Rodwell, M. J.: An evaluation of ERA5 precipitation for climate monitoring, Q. J. Roy. Meteor. Soc., 148, 3152–3165, https://doi.org/10.1002/qj.4351, 2022.
Lee, E. H., Ha, J. C., Lee, S. S., and Chun, Y.: PM10 data assimilation over South Korea to Asian dust forecasting model with the optimal interpolation method, Asia-Pac. J. Atmos. Sci., 49, 73–85, https://doi.org/10.1007/s13143-013-0009-y, 2013.
Lei, G., Shen, Y., Huang, R., Ding, Q., and Gong, M.,: Characteristics of small wind and low light climate in northern Ningxia and analysis of complementary wind and solar resources, Desert and Oasis Meteorology, 19, 18–25, 2025.
Li, J., Cheng, Y., Gong, J., Zhu, K., and Zhang, L.: Improvement and Application of Meteorological Geography Method in Drawing Dance Distribution Maps, China Electric Power, 48, 121–126, 2015.
Li, J., Gao, Y., Lei, A., Mei, Y., Tao, W., Wang, L., Li, T., Mei, Y., Zhao, Q., and Rao, R.: Analysis on spatial and temporal characteristics of energy supply load side affected by extreme high temperature weather in South China, J. Phys. Conf. Ser., 2993, 012019, https://doi.org/10.1088/1742-6596/2993/1/012019, 2025.
Li, Y., Wang, Y., Lv, X., Ye, Y., and Ji, Y.: The spatiotemporal pattern and changes of extreme climate events in the three provinces of Northeast China from 1961 to 2013, Resour. Sci., 37, 2501–2513, 2015.
Lin, S. and Liu, C.: Data assimilation of Island climate observations with large-scale re-analysis data to high-resolution grids, Int. J. Climatol., 33, 1228–1236, https://doi.org/10.1002/joc.3507, 2012.
Lindskog, M. and Landelius, T.: Short-Range Numerical Weather Prediction of Extreme Precipitation Events Using Enhanced Surface Data Assimilation, Atmosphere-Basel, 10, 587, https://doi.org/10.3390/atmos10100587, 2019.
Liu, Y., Yu, J., Shen, Y., and Lv, X.: A Modified Interpolation Method for Surface Total Nitrogen in the Bohai Sea, J. Atmos. Ocean. Tech., 33, 1509–1517, https://doi.org/10.1175/JTECH-D-15-0250.1, 2016.
Lovell-Smith, J. W. and Pearson, H.: On the concept of relative humidity, Metrologia, 43, 129–134, https://doi.org/10.1088/0026-1394/43/1/018, 2005.
Meng, C., Xu, Y., Li, Q., Ma, Y., Feng, Q., Ma, W., Pan, J., and Li, K.: Analyses of observed features and future trend of extreme temperature events in Inner Mongolia of China, Theor. Appl. Climatol., 139, 577–597, https://doi.org/10.1007/s00704-019-02969-8, 2019.
Miatselskaya, N., Milinevsky, G., Bril, A., Chaikovsky, A., Miskevich, A., and Yukhymchuk, Y.: Application of Optimal Interpolation to Spatially and Temporally Sparse Observations of Aerosol Optical Depth, Atmosphere-Basel, 14, 1–12, https://doi.org/10.3390/atmos14010032, 2022.
Millin, O. T., Furtado, J. C., and Malloy, C.: The impact of North American winter weather regimes on electricity load in the central United States, npj Clim. Atmos. Sci., 7, 1–8, https://doi.org/10.1038/s41612-024-00803-1, 2024.
Oakland, J. and Oakland, J. S.: Statistical process control, Routledge, https://doi.org/10.4324/9780080551739, 2007.
Oleson, K. W., Lawrence, D. M., Bonan, G. B., Fisher, R. A., Lawrence, P. J., and Muszala, S. P.: Technical description of version 4.5 of the Community Land Model (CLM), NCAR Technical Note NCAR/TN-503+STR, https://doi.org/10.5065/D6RR1W7M, 2013.
Oloufemi, F., Zoé, F., and Hussein, I.: Ice protection systems for wind turbines in cold climate: characteristics, comparisons and analysis, Renew. Sust. Energ. Rev., 65, 662–675, https://doi.org/10.1016/j.rser.2016.06.080, 2016.
Pan, X., Zhu, X., Huang, Z., Li X., and Chen, D.: The Relation Between the Strong Wind Region Along One Hundred Kilometer of Railway and the Topography in Xinjiang, Meteorology, 38, 234–237, https://doi.org/10.1007/s11783-011-0280-z, 2012.
Pei, S., Li, M., Shen, Y., Wang, C., and Ding, C.: Temporal and spatial pattern analysis of high impact weather in wind power systems, Meteorology and Environmental Science, 47, 54–64, https://doi.org/10.16765/j.cnki.1673-7148.2024.06.007, 2024.
Qin, R., Zhao, Z., Xu, J., Ye, J.-S., Li, F.-M., and Zhang, F.: HRLT: a high-resolution (1 d, 1 km) and long-term (1961–2019) gridded dataset for surface temperature and precipitation across China, Earth Syst. Sci. Data, 14, 4793–4810, https://doi.org/10.5194/essd-14-4793-2022, 2022.
Qiu, L., Shi, Z., Wu, Y., Wang, Y., Chen, J., Liu, S., Hui, Y., and Yin, X.: Vegetation restoration enhances the regional water vapor content by intensifying the inflow from the lower atmosphere on the Loess Plateau in China, Clim. Dynam., 62, 9431–9445, https://doi.org/10.1007/s00382-024-07401-0, 2024.
Rao, P., Wang, F., Yuan, X., Liu, Y., and Jiao, Y.: Evaluation and comparison of 11 sets of gridded precipitation products over the Qinghai-Tibet Plateau, Atmos. Res., 302, 107315, https://doi.org/10.1016/j.atmosres.2024.107315, 2024.
Shaffer, B., Quintero, D., and Rhodes, J.: Changing sensitivity to cold weather in Texas power demand, Iscience, 25, https://doi.org/10.1016/j.isci.2022.104173, 2022.
Shen, Q. and Li, X.: Method to Calculate the Critical Non-Icing Current on Transmission Line Considering the Impact of Humid Air Parameters, 2010 Asia-Pacific Power and Energy Engineering Conference, 1–4, https://doi.org/10.1109/APPEEC.2010.5448175, 2010.
Shi, J., Wen, K., and Cui, L.: Temporal and spatial variations of high-impact weather events in China during 1959–2014, Theor. Appl. Climatol., 129, 385–396, https://doi.org/10.1007/s00704-016-1793-y, 2016.
Song, W., Liu, Y., Wang, Z., Ding, S., Lin, X., Feng, Z., and Li, Z.: A novel wind turbine control strategy to maximize load capacity in severe wind conditions, Energy Rep., 8, 7773–7779, https://doi.org/10.1016/j.egyr.2022.06.005, 2022.
Sullivan, P., Colman, J., and Kalendra, E.: Predicting the response of electricity load to climate change, National Renewable Energy Laboratory (NREL), Golden, CO, United States, https://doi.org/10.2172/1215283, 2015.
Sun, R., Xu, H., Wu, L., Lin, G., and Qiao, Y.: Statistics on low temperature weather in China and its impact on wind power generation, Global Energy Internet, 5, 2–10, https://doi.org/10.19705/j.cnki.issn2096-5125.2022.01.002, 2022.
Sundaram, L. and Go, Y. I.: Correlations of System Degradation, Losses and Significant Parameters for 49 MW Large Scale Solar Plant with Real Site Data Validations, Clean Energy and Sustainability, 3, 10022, https://doi.org/10.70322/ces.2024.10022, 2024.
Sutanto, S. J., Syaehuddin, W. A., and De Graaf, I.: Hydrological drought forecasts using precipitation data depend on catchment properties and human activities, Commun. Earth Environ., 5, https://doi.org/10.1038/s43247-024-01295-w, 2024.
Talagrand, O.: Assimilation of observations, an introduction, J. Meteorol. Soc. Jpn. Ser. II, 75, 191–209, https://doi.org/10.2151/jmsj1965.75.1B_191, 1997.
Tsujimoto, K., Fujii, K., Iisaka, H., Kubokawa, H., Okumura, T., and Shimojima, K.: Report on experimental observation of galloping behaviour in 8-bundled conductors, IEEE T. Power Ap. Syst., 1193–1201, https://doi.org/10.1109/TPAS.1983.318060, 1983.
Uboldi, F., Lussana, C., and Salvati, M.: Three-dimensional spatial interpolation of surface meteorological observations from high-resolution local networks, Meteorol. Appl., 15, 331–345, https://doi.org/10.1002/met.76, 2008.
Wang, C., Zhang, W., Zou, S., Xu, B., and Zhang, Y.: Spatiotemporal Heterogeneity of Temperature and Precipitation in Complex Terrain along the Northeastern Margin of the Tibetan Plateau, Atmosphere-Basel, 14, 1–17, https://doi.org/10.3390/atmos14060988, 2023.
Wang, R., Fu, Y., He, Y., Tian, W., Zhang, J., Tian, H., and Luo, J.: Characteristics of extreme precipitation and related near surface atmospheric conditions in summer over the Tibetan Plateau from GPM observations and multi-source reanalysis datasets, Atmos. Res., 279, 106400, https://doi.org/10.1016/j.atmosres.2022.106400, 2022.
Wei, S., Wang, X., Wang, K., Liu, L., Liang, B., and Zhao, W.: Rethinking spatiotemporal variations in air temperature over the Qilian Mountains, Western China, from 1979 to 2018, Atmos. Res., 286, 106671, https://doi.org/10.1016/j.atmosres.2023.106671, 2023.
Wen, X., Zhu, X., Li, M., Chen, M., Zhang, S., Yang, X., Zheng, Z. Qin, Y., Zhang, Y., and Lv, S.: Creation and Verification of a High-Resolution Multi-Parameter Surface Meteorological Assimilation Dataset for the Tibetan Plateau for 2010–2020 Available Online, Remote Sens.-Basel, 15, 2906, https://doi.org/10.3390/rs15112906, 2023.
Wu, J. and Gao, X. J.: A gridded daily observation dataset over China region and comparison with the other datasets, Chinese J. Geophys.-Ch., 56, 1102–1111, https://doi.org/10.6038/cjg20130406, 2013.
Wu, J., Gao, X., Giorgi, F., and Chen, D.: Changes of effective temperature and cold/hot days in late decades over China based on a high-resolution gridded observation dataset, I. J. Climatol., 37, 788–800, https://doi.org/10.1002/JOC.5038, 2017.
Xin, B. A.: New Power System and New Energy System, China Electric Power Press, ISBN 9787519881047, 2023.
Xu, Y., Zhao, P., Si, D., Cao, L., Wu, X., Zhao, Y., and Liu, N.: Development and preliminary application of a gridded surface air temperature homogenized dataset for China, Theor. Appl. Climatol., 139, 505–516, https://doi.org/10.1007/s00704-019-02972-z, 2019.
Yang, T., Li, Q., Liu, W., Liu, X., Li, L., and De Maeyer, P.: Spatiotemporal variability of snowfall and its concentration in northern Xinjiang, Northwest China, Theor. Appl. Climatol., 139, 1247–1259, https://doi.org/10.1007/s00704-019-02994-7, 2019.
Yang, X., Huang, X., Gao, X., and Tao, Z.: High-temperature power reduction state identification for wind turbines using feature correlation analysis and deep learning methods, Forsch. Ingenieurwes., 86, 225–239, https://doi.org/10.1007/s10010-022-00586-y, 2022.
Yao, Z., Li, X., and Xiao, J.: Characteristics of daily extreme wind gusts on the Qinghai-Tibet Plateau, China, J. Arid Land, 10, 673–685, https://doi.org/10.1007/s40333-018-0094-y, 2018.
Ye, Q., Chen, W., Jiang, Z., Cai, Y., Xiao, Y., Jing, R., and Zhao, Y.: Multi-city industry level load profile and cooling load calculation for high temperatures in summer, Global Energy Int., 7, 25–36, https://doi.org/10.19705/j.cnki.issn2096-5125.2024.01.004, 2024.
Zhang, C., Ji, J., Wang, C., and Ke, W.: Annual analysis and comparison of the comprehensive performance of a CdTe PV ventilated window integrated with vacuum glazing in different climate regions, Renew. Energ., 223, 120029, https://doi.org/10.1016/j.renene.2024.120029, 2024a.
Zhang, F., Bi, K., Chen, X., Yang, F., Yang, Y., Wang, C., Zhao, Z., and Ma, Z.: A 25 km Daily Gridded Dataset of Meteorological Variables and High-Impact Weather Events for New-type Power Systems in China, National Cryosphere Desert Data Center [data set], https://doi.org/10.12072/ncdc.nieer.db6972.2025, 2025.
Zhang, J., Liu, B., Ren, S., Han, W., Ding, Y., and Peng, S.: A 4 km daily gridded meteorological dataset for China from 2000 to 2020, Sci. Data, 11, https://doi.org/10.1038/s41597-024-04029-x, 2024b.
Zhang, X., Song, Y., Nam, W. H., Huang, T., Gu, X., Zeng, J., Huang, S., Chen, N., Yan, Z., and Niyogi, D.: Data fusion of satellite imagery and downscaling for generating highly fine-scale precipitation, J. Hydrol., 631, 130665, https://doi.org/10.1016/j.jhydrol.2024.130665, 2024c.
Zhao, Y., He, Z., and Jiang, Y.: The Inversion of Three-Dimensional Ocean Temperature and Salinity Fields for the Assimilation of Satellite Observations, J. Mar. Sci. Eng., 12, 1–23, https://doi.org/10.3390/jmse12040534, 2024.
Zhuo, Z., Du, E., Zhang, N., Nielsen, C. P., Lu, X., Xiao, J., Wu, J., and Kang, C.: Cost increase in the electricity supply to achieve carbon neutrality in China, Nat. Commun., 13, 3172, https://doi.org/10.1038/s41467-022-30747-0, 2022.