the Creative Commons Attribution 4.0 License.
the Creative Commons Attribution 4.0 License.
 | 22 May 2026
Machine-learning-based estimates of global natural vegetated wetland methane emissions (2000–2025)
Robert B. Jackson
Marielle Saunois
Philippe Ciais
Ben Poulter
Josep G. Canadell
Prabir K. Patra
Hanqin Tian
Zhen Zhang
Etienne Fluet-Chouinard
Zutao Ouyang
Ting Zhang
David J. Beerling
Dmitry A. Belikov
Philippe Bousquet
Danilo Custodio
Naveen Chandra
Xinyu Dou
Nicola Gedney
Peter O. Hopcroft
Alison M. Hoyt
Kazuhito Ichii
Akihito Ito
Atul K. Jain
Katherine Jensen
Fortunat Joos
Thomas Kleinen
Masayuki Kondo
Fa Li
Tingting Li
Xiangyu Liu
Shamil Maksyutov
Avni Malhotra
Adrien Martinez
Kyle McDonald
Joe R. Melton
Jurek Müller
Yosuke Niwa
Shufen Pan
Shushi Peng
Changhui Peng
Zhangcai Qin
Peter Raymond
William Riley
Arjo Segers
Rona L. Thompson
Aki Tsuruta
Kunxiaojia Yuan
Wenxin Zhang
Qing Zhu
Qiuan Zhu
Qianlai Zhuang
Wetlands are the largest natural source of atmospheric methane (CH4), yet comprehensive global budgets are typically delayed by years, preventing a timely understanding of CH4 sources, sinks, and trends. To reduce this delay, we present a model emulator-driven framework and accompanying workflow that enable timely, continuous emission updates using a machine-learning emulator to reconstruct spatially explicit monthly emission fields at 1° × 1° resolution. We apply this framework to a global dataset of natural vegetated wetland CH4 emissions to extend the most recent Global Methane Budget (GMB; Saunois et al., 2025) record that covers the 2000–2020 emissions through 2025. In the test data (∼ 30 % of the total dataset), the emulator achieved a global R2 of 0.65 ± 0.003 (mean ± 95 % CI, hereafter) and an RMSE of Tg CH4 yr−1. The emulator is trained on 35 GMB model estimates, including 22 process-based models and 13 atmospheric inversions, paired with 10 ensemble realizations of 11 gridded climate predictor variables from atmospheric reanalyses. Our results show that the global mean predicted wetland CH4 emissions for 2021–2025 (157.8 ± 2.4 Tg CH4 yr−1) are not significantly higher (∼ 0.05 Tg CH4 yr−1) than the 2000–2020 baseline. However, this stability masks a significant hemispheric redistribution of emissions. We detect an increase in Northern Hemisphere (NH) emissions in 2021–2025, with mid- and high-latitudes increasing by 0.76 ± 0.07 and 0.35 ± 0.03 Tg CH4 yr−1, respectively, while the tropics and Southern Hemisphere (SH) extratropics show offsetting negative trends (−0.95 ± 0.19 and Tg CH4 yr−1, respectively). The predicted emissions are able to capture the low emissions in 2023 in South America linked to El Niño-related drought, as reported by recent studies (Ciais et al., 2026; Quinn et al., 2025). Furthermore, we identify a distinct seasonal amplification of global emission trends that peaks in late boreal summer. This new modeled dataset and operational framework bridge the gap between the latest updated budgets and low-latency monitoring, providing a scalable capacity to frequently update global emission estimates and critical early warnings of regional wetland feedback loops. The data are publicly available at https://doi.org/10.5281/zenodo.18870108 (Li et al., 2026).
- Article
(5939 KB) - Full-text XML
-
Supplement
(2452 KB) - BibTeX
- EndNote


Wetlands are the largest natural source of methane (CH4), a potent greenhouse gas, yet they remain one of the most uncertain components of the global CH4 budget (Saunois et al., 2025; Zhu et al., 2025). They account for 25 %–30 % of global CH4 emissions and strongly influence the global carbon cycle (Jackson et al., 2024; Li et al., 2026b; Peng et al., 2022; Saunois et al., 2025; Zhang et al., 2023). Quantifying how wetland CH4 emissions respond to climate variability is essential for interpreting interannual variability in the global CH4 budget and for understanding recent atmospheric CH4 changes (Ciais et al., 2026; Gedney et al., 2019a; Parker et al., 2018; Stavert et al., 2022). Community efforts such as the Global Methane Budget (GMB) synthesize process-based “bottom-up” (BU) models and atmospheric “top-down” (TD) inversions to estimate all CH4 emission sources and sinks (Saunois et al., 2020, 2025). However, the substantial effort required to assemble these products into a reliable ensemble typically leads to lags of multiple years. For instance, the most recent GMB published in 2025 (Saunois et al., 2025) covered the period 2000–2020. Although low-latency estimates exist for some individual models (Quinn et al., 2025), accelerating the assembly of a trustworthy multi-model synthesis would better support timely emission monitoring and evidence-based assessment of mitigation progress.
Wetland CH4 emissions combine biogeochemical and hydrometeorological controls that regulate CH4 production with oxidation processes within sediments and the water column. Temperature exerts a strong influence on microbial methanogenesis and ecosystem respiration (Knox et al., 2019; Bansal et al., 2023; Li et al., 2025; Yvon-Durocher et al., 2014), whereas soil thermal and freeze-thaw conditions can modulate growing-season length and cold-season CH4 dynamics (Hyvärinen et al., 2025; Zona et al., 2016). Hydrology, often summarized by water table depth, soil moisture content, and inundation extent, controls oxygen availability and redox conditions and influences wetland CH4 production and oxidation (Cui et al., 2024; He et al., 2025; Knox et al., 2021). Precipitation, lateral water transport, and surface energy fluxes jointly constrain water balance through inputs and evapotranspiration (Aalto et al., 2025; Helbig et al., 2020; Tyystjärvi et al., 2024). Furthermore, radiation and vegetation state provide proxies of substrate supply and plant-mediated transport pathways that connect below-ground CH4 production to the atmosphere (Helfter et al., 2022; McNicol et al., 2023).
Currently, global wetland CH4 emissions are primarily estimated using two approaches: BU and TD models. Process-based BU models explicitly simulate the complex biogeochemical mechanisms driven by environmental conditions (Zhang et al., 2025). TD atmospheric inversions estimate surface fluxes by optimising prior emission inventories to match observed atmospheric CH4 concentrations (Patra et al., 2018). Recent studies have increasingly turned to data-driven machine-learning models. For instance, McNicol et al. (2023) upscaled eddy covariance CH4 fluxes globally using random forest algorithms; Bernard et al. (2025) introduced a satellite observation-based model to simulate temporal emission variability. These machine-learning approaches offer some advantages, including rapid operational speeds and lower computational costs. However, they are constrained by the sparsity of training data, particularly in the tropics and high latitudes.
Building on these well-established controls and the advancements in data-driven modeling, we provide a low-latency continuation of the GMB gridded wetland CH4 emissions by extending monthly emissions from 2000–2020 through 2025 at 1° × 1° resolution. Our approach is supported by the fact that many key climate, hydrometeorological and vegetation drivers are routinely updated as global gridded datasets, enabling a practical emulator-based pathway for timely wetland CH4 emission estimates. In this study, wetlands are defined following the GMB natural vegetated wetland category, excluding lakes, rivers, reservoirs, coastal waters and managed sources (Saunois et al., 2025). We emulate each BU and TD ensemble member from GMB using machine-learning models trained on the 2000–2020 GMB wetland emission fields and climate predictor variables (e.g., soil temperature and precipitation) from ERA5 reanalysis to yield spatially explicit monthly emissions for 2000–2025 with uncertainty derived from both GMB ensemble spread (35 runs) and ERA5 monthly reanalysis (10 ensemble members). Using the resulting 2000–2025 wetland CH4 emission data, we then quantify recent emission changes in 2021–2025 relative to 2000–2020, characterize interannual variability in annual regional and latitudinal emission time series, and diagnose long-term growth rates and their seasonality.
Our proposed framework and dataset provide a lower-latency, scalable tool for spatially explicit wetland CH4 emission estimates. They provide support for early-warning diagnostics, attribution of recent atmospheric CH4 anomalies, and provision of timely priors for atmospheric inversions.
2.1 Input datasets
2.1.1 Wetland CH4 flux data
We used monthly net CH4 flux estimates for natural vegetated wetlands from the most recent Global Methane Budget (GMB) synthesis for 2000–2020, including both process-based BU models and atmospheric TD inversions (Saunois et al., 2025; Zhang et al., 2025). In this study, the natural vegetated wetland definition excludes lakes, rivers, reservoirs, coastal waters, and managed sources, following the underlying GMB definition (Saunois et al., 2025). Detailed descriptions of each model and inversion framework are provided in the cited GMB publications; here we summarize the key elements relevant to this study.
The BU wetland biogeochemical models (22 estimates, Table S1 in the Supplement) included in the analysis are from 11 models: CLASSIC (Arora et al., 2018; Melton and Arora, 2016), ELM-ECA (Riley et al., 2011), ISAM (Shu et al., 2020; Xu et al., 2021), JSBACH (Kleinen et al., 2020, 2021, 2023), JULES (Gedney et al., 2019b), LPJ-MPI (Kleinen et al., 2012), LPJ-WSL (Zhang et al., 2016), LPX-Bern (Spahni et al., 2011; Stocker et al., 2014), ORCHIDEE (Ringeval et al., 2011), SDGVM (Beerling and Woodward, 2001; Hopcroft et al., 2011, 2020), and VISIT (Ito and Inatomi, 2012). Each model was run under two global climate forcings (CRU and GSWP3-W5E5). All BU simulations are prognostic, i.e. each model computes wetland extent internally rather than relying on a shared wetland extent dataset. Differences in simulated wetland extent therefore contribute to inter-model spread in CH4 emissions and may explain a substantial fraction of discrepancies across regions.
The TD inversion products (13 estimates, Table S2) were constrained by surface or satellite observations over the 2000–2020 period and they are from six systems: CarbonTracker Europe-CH4 (Tsuruta et al., 2017), LMDz-CIF (Thanwerdas et al., 2022), LMDz-PYVAR (Zheng et al., 2018a, b, 2019), MIROC4-ACTM (Chandra et al., 2021; Patra et al., 2018), NISMON-CH4 (Niwa et al., 2022, 2025), and NIES-TM-FLEXPART (NFVAR) (Maksyutov et al., 2021; Wang et al., 2019). Two alternative anthropogenic prior inventories, EDGAR v6 (Crippa et al., 2021) and GAINS (Höglund-Isaksson et al., 2020), were used to represent anthropogenic emissions. Wetland and inland freshwater emissions were prescribed as separate prior fluxes in the inversion framework. Wetland priors were derived from the ensemble mean of dynamic process-based BU wetland models used in the GMB estimates, whereas inland freshwater emissions were based on independent BU estimates. We used posterior flux estimates throughout this study.
All BU and TD outputs provide monthly wetland CH4 flux as emission per grid cell area, typically at 1° × 1° resolution in the regridded GMB output products. Coarser products (CLASSIC models at 1.85° and JSBACH models at 2.8°) were remapped to a 1° × 1° grid for spatial consistency across datasets. In total, we included 22 BU estimates and 13 TD estimates (35 estimates overall). Tables S1 and S2 summarize the BU and TD estimates.
2.1.2 Predictor variables from ERA5 reanalysis
We assembled 10 ensemble members of global ERA5 monthly averaged data at 0.5° × 0.5° spatial resolution (Hersbach et al., 2023) for 11 climate predictor variables: t2m (near-surface air temperature), tp (total precipitation), ssrd (downward shortwave radiation at surface), slhf (surface latent heat flux), sshf (surface sensible heat flux), swvl1 (volumetric soil water in layers 1, 0–7 cm below surface), swvl2 (volumetric soil water in layers 2, 7–28 cm below surface), stl1 (soil temperature in layer 1, 0–7 cm below surface), stl2 (soil temperature in layer 2, 7–28 cm below surface), lai_hv (high-vegetation leaf area index), and lai_lv (low-vegetation leaf area index). LAI (leaf area index) from ERA5 is prescribed in the ECMWF land-surface model as a seasonally varying, monthly climatology derived from satellite LAI (Roberts et al., 2018). We chose ERA5 data in part because it is operationally updated regularly, which enables continuous extension of predictor fields and low-latency updating of emission reconstructions as new months become available. ERA5 data has also undergone extensive evaluation and is widely used due to its high spatiotemporal consistency and generally strong performance (Hersbach et al., 2020), but notably regional biases remain, for example, a weaker performance in parts of Asia/Africa for hydrology (Gebrechorkos et al., 2024) and temperature in the Arctic (Tian et al., 2024). The 10 ensemble members correspond to the ERA5 Ensemble of Data Assimilations, which provides multiple physically consistent realizations of the reanalysis by perturbing the data assimilation system to sample uncertainty in atmospheric and land-surface states. The ensemble spread can be interpreted as an indicator of reanalysis uncertainty.
The 11 variables included in this analysis represent first-order climatic and biophysical controls on wetland CH4 production, oxidation, and transport. Their relevance to wetland CH4 emissions is well established in the literature (Knox et al., 2021; Li et al., 2024, 2025; McNicol et al., 2023; Pu et al., 2024; Toet et al., 2011; Yuan et al., 2022, 2024; Zhang et al., 2025). To represent the ecosystem memory effect in response to environmental conditions (Chen et al., 2025), we also included 1-month and 2-month lagged versions of each variable. While introducing short lags would increase collinearity in the machine-learning model, the risk of overfitting is reduced by our model architecture (Sect. 2.2.2, including feature screening, regularization, subsampling, and early stopping). The data are regridded using bilinear interpolation to 1° × 1° resolution to match the wetland CH4 flux data from the regridded GMB models for further machine-learning modeling.
2.2 XGBoost model
2.2.1 Data assembly and filtering
For each of 350 model-ensemble pairs (35 GMB model estimates ×10 ERA5 ensemble members), we constructed gridded monthly time series pairing GMB data with a set of 35 predictor variables: 11 contemporaneous ERA5 variables, 22 lagged variables (1- and 2-month lags for each of the 11 ERA5 variables), and two seasonal encoding terms:
Where: m= month of year (1–12, 1 = January and 12 = December); π= the constant pi; msin and mcos are the sine/cosine transforms of m and represent seasonality.
We optimised our analyses to reduce noise and computational burden by retaining only grid cells with substantial wetland emissions, defined as those maintaining a mean flux of kg CH4 m−2 s−1 across all GMB model estimates over 2000–2020 (30 000 times lower than the global mean flux).
2.2.2 Model architecture
To systematically reconstruct wetland CH4 fluxes, we developed a machine-learning pipeline, training independent Extreme Gradient Boosting (XGBoost) models (Chen and Guestrin, 2016) for each grid cell and model-ensemble pair. XGBoost has been applied as a surrogate model for ensemble estimates of GMB BU models with high performance (Zhu et al., 2024). The overall modeling workflow consisted of four stages: (1) data splitting, (2) feature screening, (3) hyperparameter tuning, and (4) final model fitting and prediction. Each stage is introduced as follows.
Each model-ensemble pair dataset was temporally split into a training set and two testing sets to assess reconstruction capability across different climatic periods at monthly scale. The training data covers January 2003 to December 2017. The testing data covers two periods: January 2000–December 2002 and January 2018–December 2020. Two test windows were used only for out-of-sample evaluation and were not seen during fitting or tuning. The final 24 months of the training period (January 2016 to December 2017) were reserved as a validation set for early stopping and hyperparameter selection. This splitting strategy is to test the model's ability to capture long-term climate variabilities in early/late periods and reduce overfitting.
Prior to XGBoost training, we applied Boruta feature screening (Kursa and Rudnicki, 2010) on the training subset to reduce the effective dimensionality of the predictor set and mitigate overfitting risk arising from the relatively large number of candidate predictors. Boruta augments the predictor matrix with “shadow” features formed by randomly permuting each predictor across samples, thereby preserving each predictor's marginal distribution while separating its association with CH4 flux. A random forest regressor is fit to the combined real/shadow feature set and feature importances are compared. Predictor variables were retained if their random forest importance exceeded the maximum shadow-feature importance in more than 20 % of 10 iterations (Boruta-style screening), while seasonal terms were always retained. The resulting per-grid cell feature subset was then used for both XGBoost fitting and subsequent reconstructions, ensuring that training and prediction used an identical, cell-specific predictor variable set.
After the feature screening, we performed a grid search over six hyperparameter configurations (learning rate, maximum tree depth, minimum child weight, subsampling ratio, column subsampling per tree, and L2 regularization) (Table S3). For each configuration, training stopped if the validation Root Mean Squared Error (RMSE) did not improve for 50 consecutive boosting rounds. Once the optimal hyperparameter set was identified for a grid cell, the model was refitted on the full training data using the optimal number of boosting iterations selected during early stopping.
After that, the saved booster was then applied to predict wetland CH4 flux 2000–2025 (including 2021–2025, which extends beyond the most recent GMB estimates period). All the predicted wetland fluxes (unit of kg CH4 m−2 s−1) were converted to emissions (Tg CH4 per month) by multiplying the fluxes by grid-cell area (m2) and total number of seconds (s) in each month.
We recognize that many of these variables are multicollinear, an issue that XGBoost is considered robust against. Nevertheless, we minimized overfitting by constraining model complexity (feature screening, regularized trees with subsampling), using a held-out validation window with early stopping to select the optimal number of boosting iterations, and evaluating performance on temporally separated test periods (2000–2002, 2018–2020) not seen during training. In addition, using the 10 ERA5 ensemble members allows us to propagate reanalysis uncertainty in the predictor fields through the reconstruction.
2.2.3 Model evaluation
Model performance was evaluated for each grid cell per model-ensemble pair by computing the R2, RMSE, and NRMSE (normalised RMSE, computed by dividing the RMSE by the standard deviation of emissions) values on the withheld test periods. The mean R2, RMSE and NRMSE of pairs per grid cell are applied to evaluate model performance at the grid cell level (Fig. 1). To assess the model reconstruction skills for grid cells with different emission magnitudes, we grouped grid cells into (1) emission percentile bins based on their total wetland CH4 emissions during 2000–2020 from GMB estimates, (2) 18 geographical regions defined in Saunois et al. (2025) (they are USA, Canada, Central America, Northern South America, Brazil, Southwest South America, Europe, Northern Africa, Equatorial Africa, Southern Africa, Russia, Central Asia, Middle East, China, Korea-Japan, South Asia, Southeast Asia, and Australasia), and (3) five latitude bands: global, Northern Hemisphere (NH) high-latitudes (60–90° N), NH mid-latitudes (30–60° N), tropics (30° N–30° S), and Southern Hemisphere (SH) extratropics (30–90° S). We then compared the mean R2 and RMSE values of each emission bin (0 %–10 % denotes the highest emitting grid cells) and 18 geographical regions (Figs. S1, S2). Monthly mean R2 and RMSE at five latitude bands over test periods are presented to study the temporal variation of model performance (Figs. S3, S4). Detrended monthly global emissions from GMB and predictions were compared to assess the model performance in capturing interannual variability (Fig. S5). Detrended anomalies were calculated by fitting a linear least-squares trend to each monthly time series over 2000–2020 and subtracting the corresponding best-fit linear trend from the original series. We generated out-of-sample wetland CH4 emission predictions (CH4_pred) for the test periods to compare with the emissions from GMB models (CH4_GMB) (Fig. 2). This ensured that the model predicted CH4_pred based on the trained model without having seen the CH4_GMB in the test data.
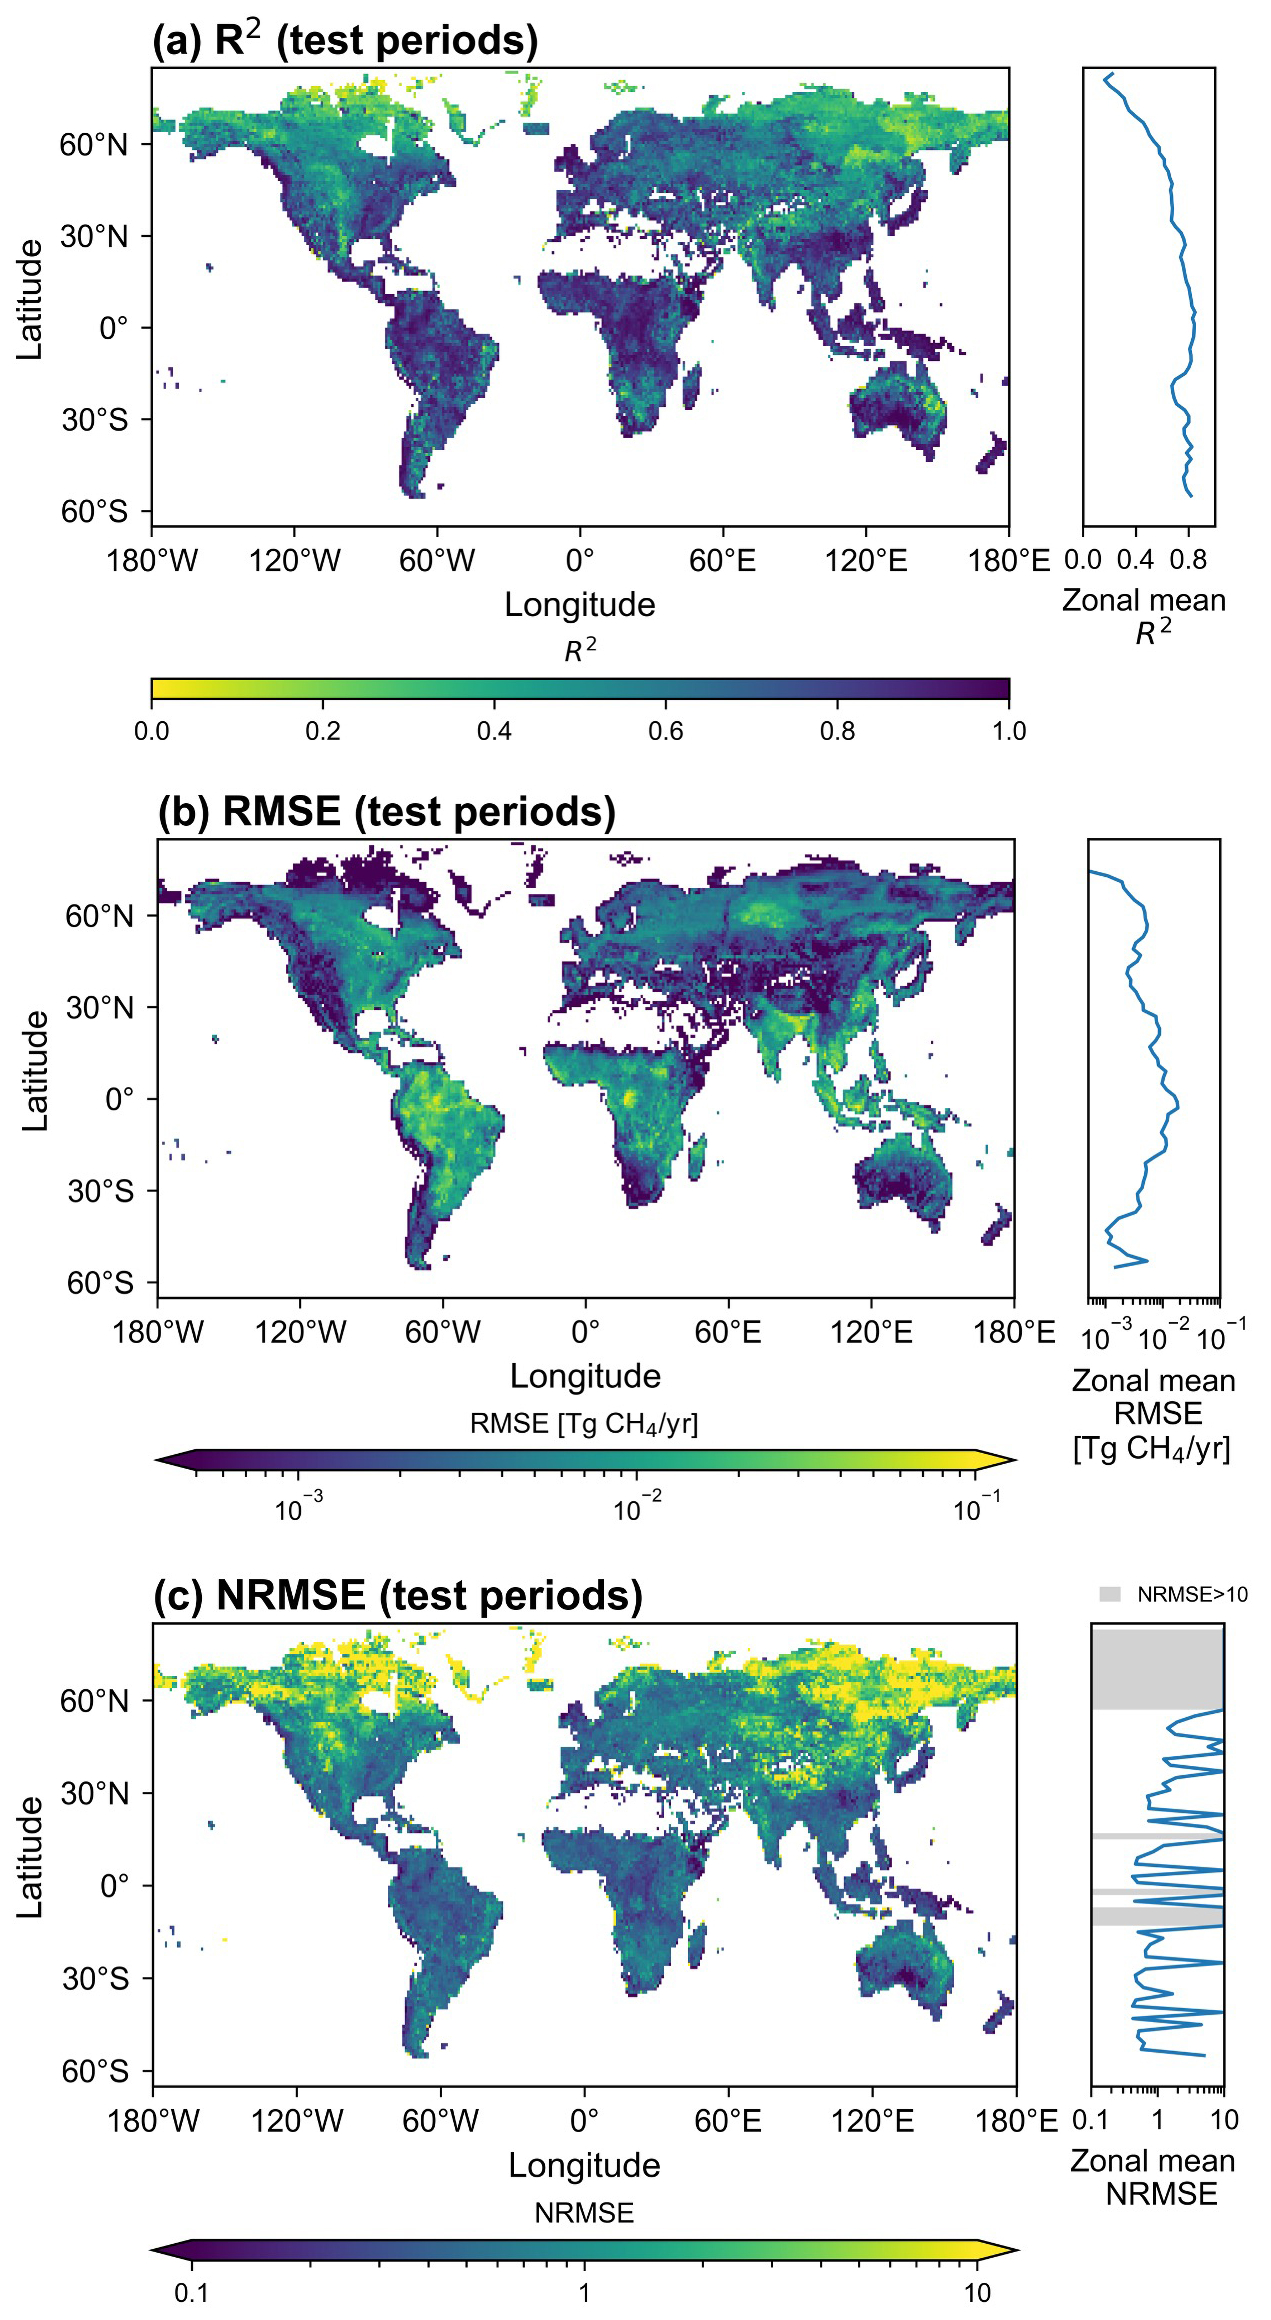
Figure 1Predictive skill of the XGBoost wetland CH4 model (per-grid-cell R2, RMSE, and NRMSE over the test periods). Insets indicate the zonal mean R2, RMSE and NRMSE in 2° latitude bands.
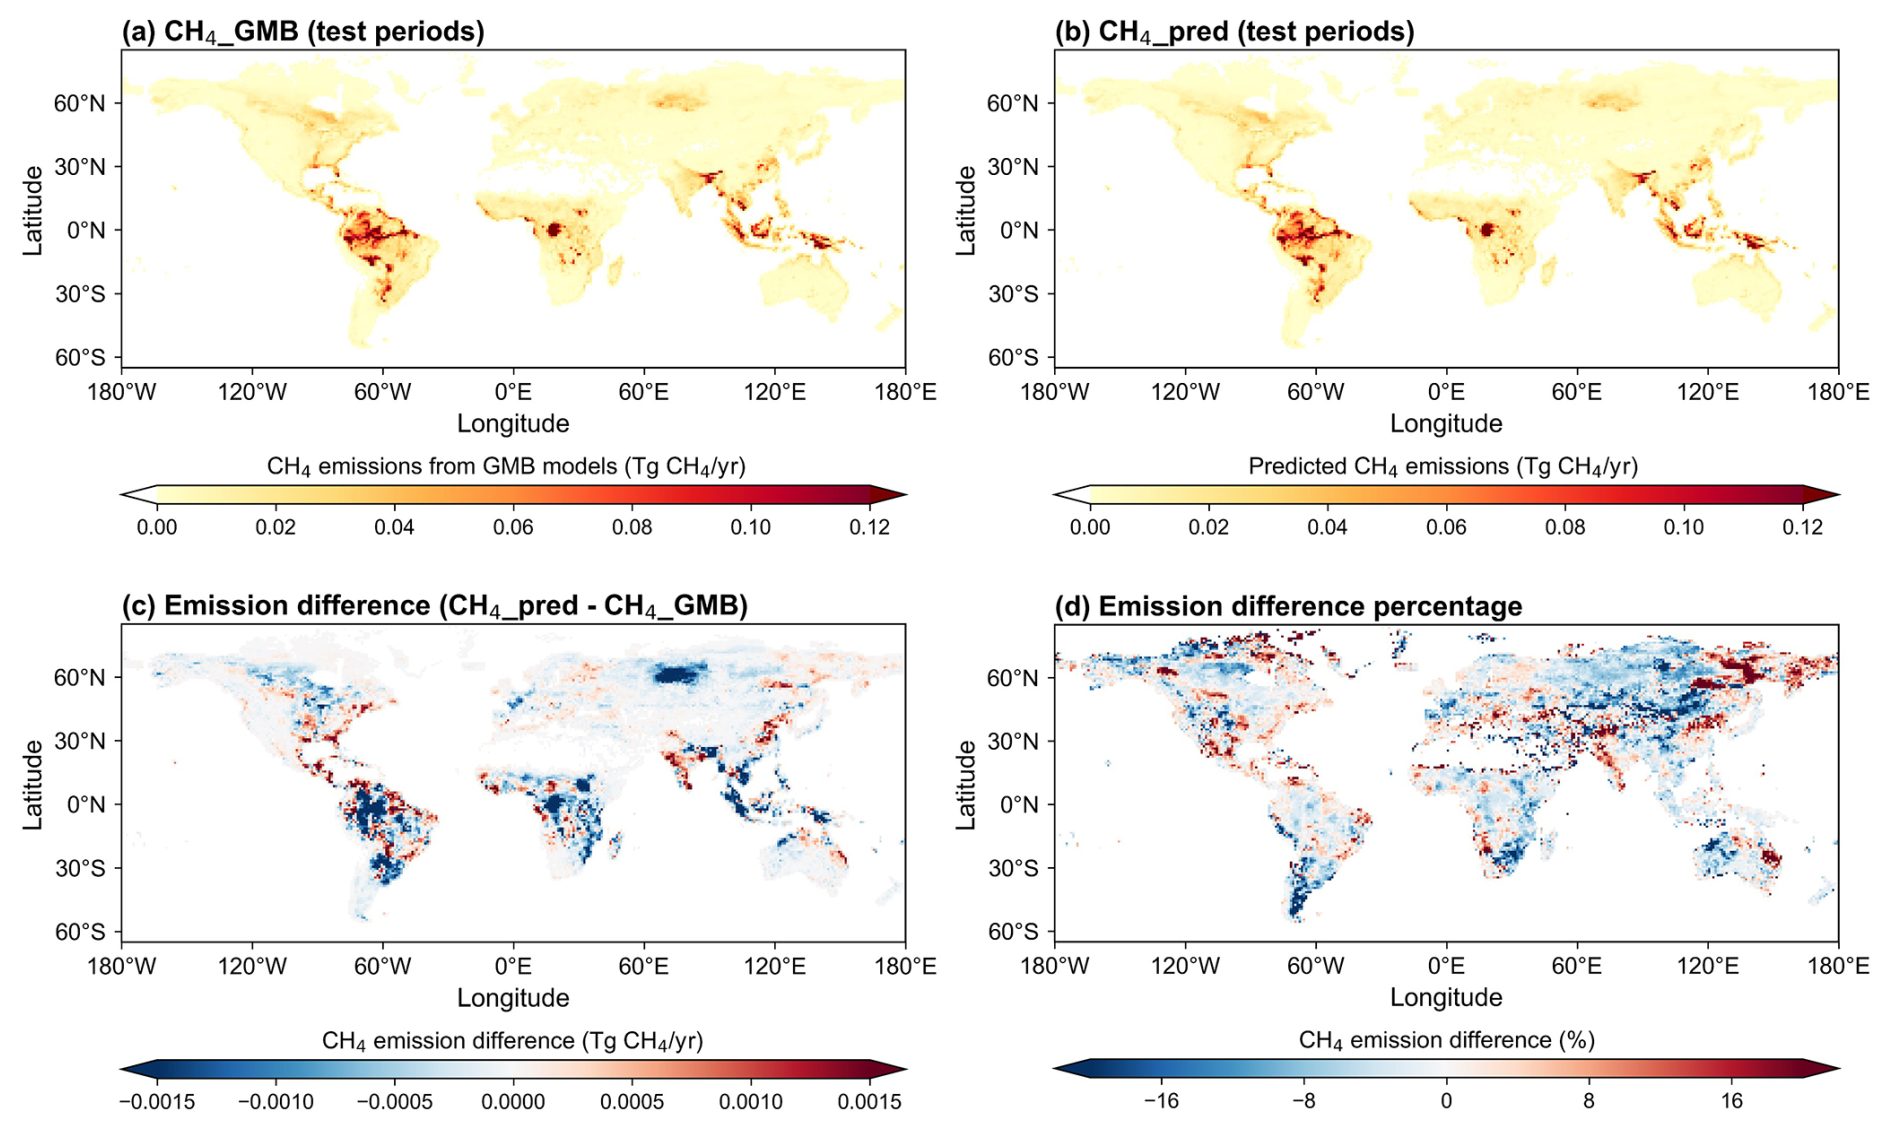
Figure 2Wetland CH4 emissions (per 1° × 1° grid cell) from GMB models and XGBoost predictions for two test periods combined. (a) Mean CH4_GMB (GMB emissions) over all test months. (b) Mean CH4_pred (XGBoost prediction) over all test months. (c) Differences in mean CH4_GMB and mean CH4_pred. (d) Percent emission difference between mean CH4_GMB and mean CH4_pred. Reds in (c) and (d) indicate higher emissions in CH4_pred, blues lower emissions.
2.3 Emission trend analyses
We quantified spatial patterns, regional aggregates and temporal emission trends in reconstructed wetland CH4 emissions for 2000–2025, and compared them with corresponding GMB estimates over 2000–2020. We performed analyses for 18 geographic regions and for five latitude bands.
We analyzed recent emission changes by comparing 2021–2025 against 2000–2020 baseline at both grid-cell and regional scales (Figs. 3, 4). For Fig. 3, gridded monthly emissions were aggregated to per-grid mean emissions for each period (2021–2025 and 2000–2020). Emissions presented in Fig. 4 were summed across grid cells within each region. Emission changes between the two periods were calculated as paired differences for each grid cell and model–ensemble pair. Therefore, the reported mean and 95 % confidence interval for emission changes reflect the uncertainty of the paired differences themselves. We examined interannual variability and long-term annual emission changes by aggregating monthly emissions to annual totals for both the latitude bands and 18 geographic regions (Figs. 5, S6, S8). Ordinary least squares regression was applied to monthly emissions over 2000–2025 to estimate emission trends (Fig. 6).
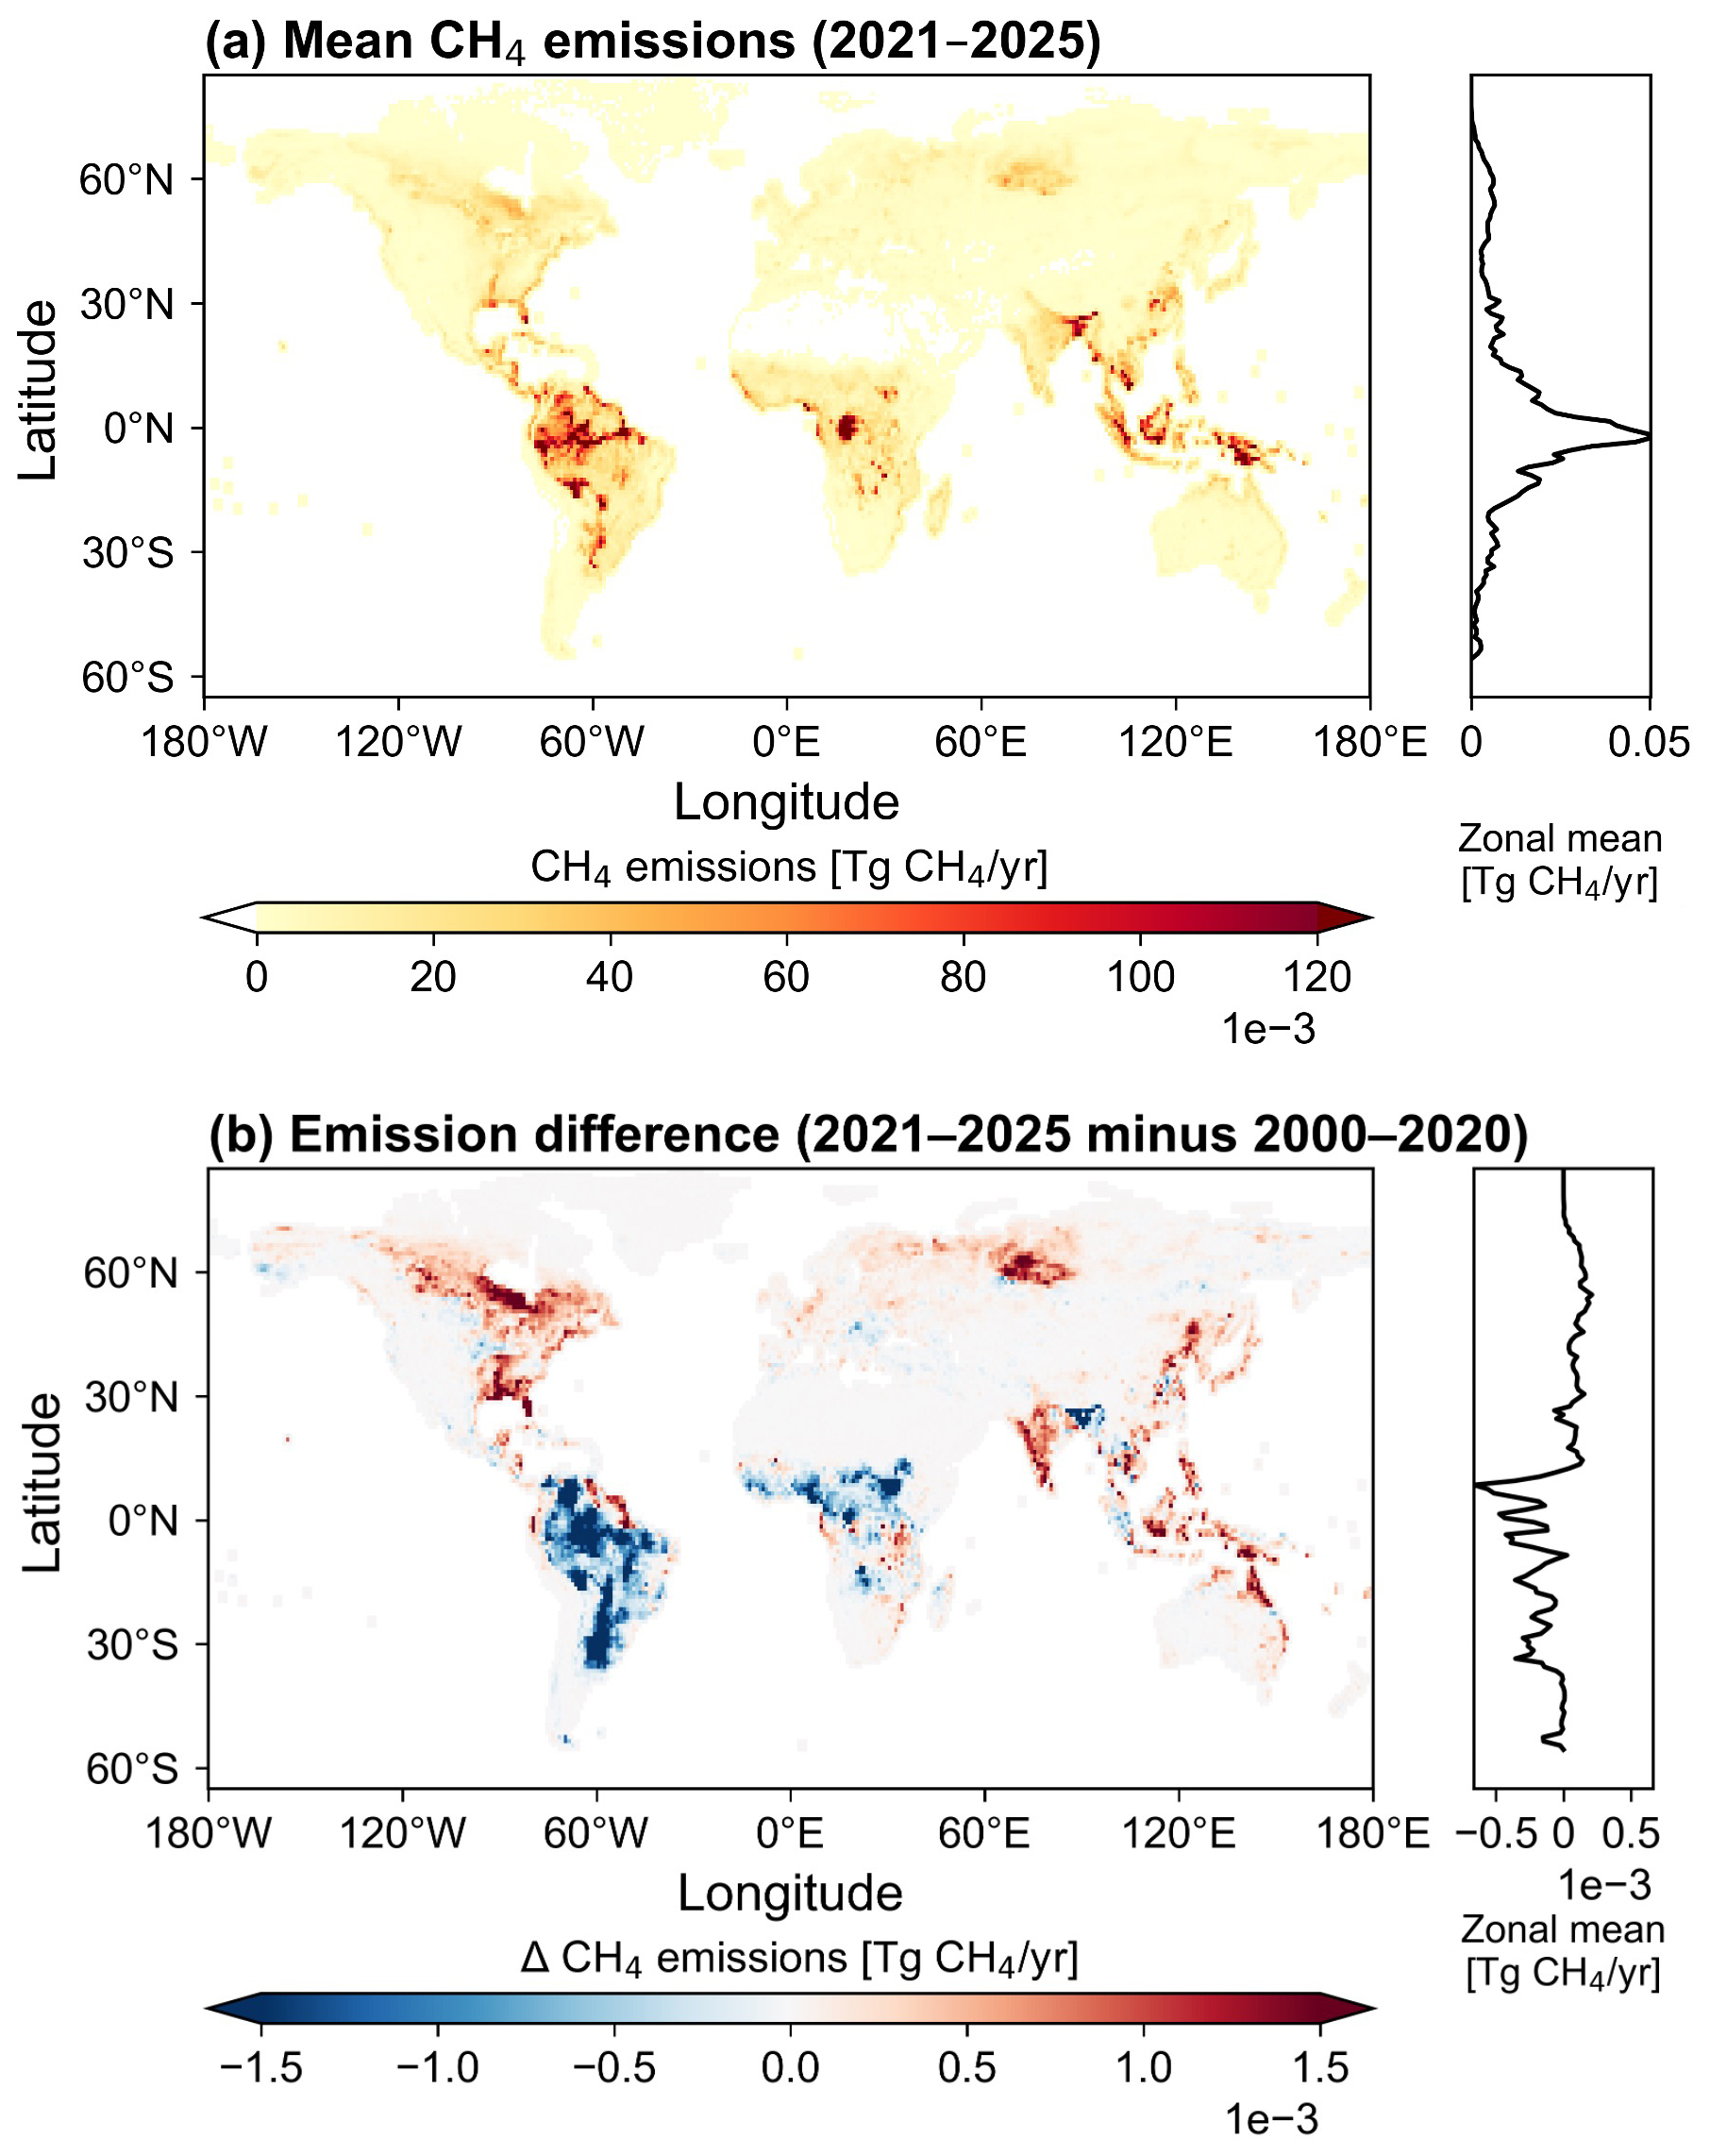
Figure 3(a) Mean XGBoost model predicted wetland CH4 emissions for 2021–2025. (b) Difference between mean emissions in 2021–2025 and 2000–2020. Reds indicate higher emissions in 2021–2025, blues lower. Insets indicate the zonal mean in 2° latitude bands.
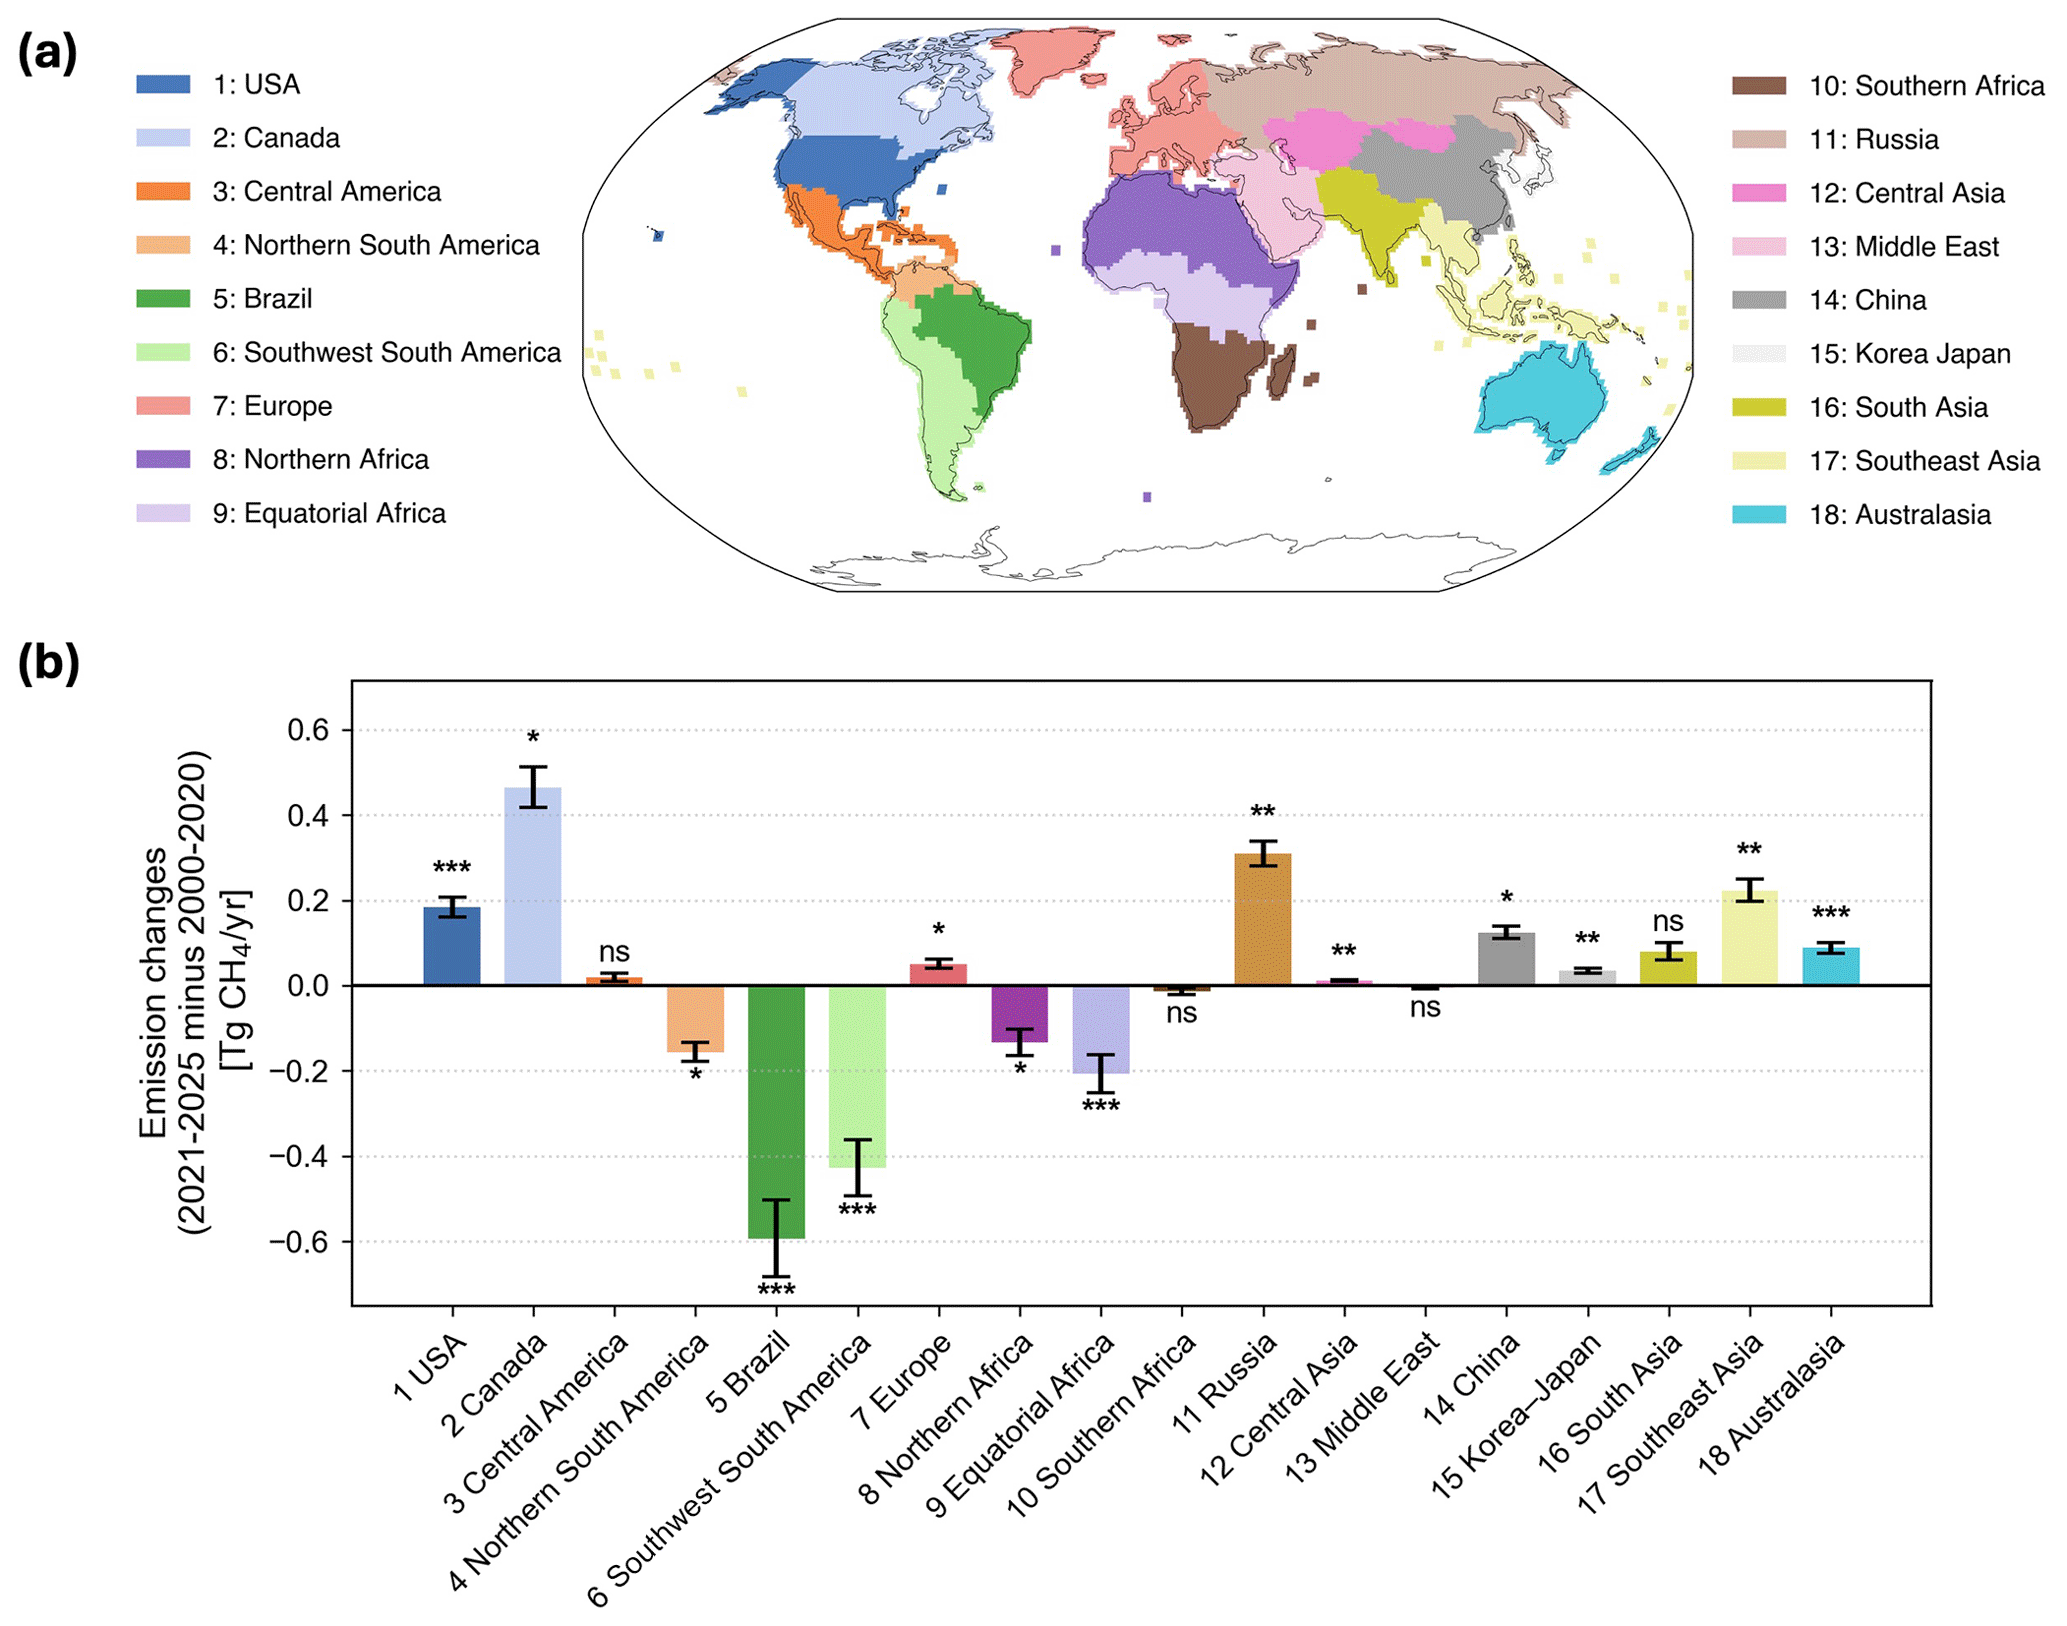
Figure 4(a) Spatial distribution of the 18 regions; (b) Regional wetland CH4 emission changes during 2021–2025 relative to 2000–2020 across 18 regions using XGBoost modeled emissions. Bars show regional mean emission changes (annual mean in 2021–2025 minus that in 2000–2020). Error bars indicate 95 % CI. A two-sided paired test was applied for each region to assess whether the 2021–2025 mean emission differs from the 2000–2020 mean. Regions with p≥0.05 are labelled “ns”. Asterisks above bars denote significance: *** for p<0.001, ** for p<0.01, * for p<0.05.
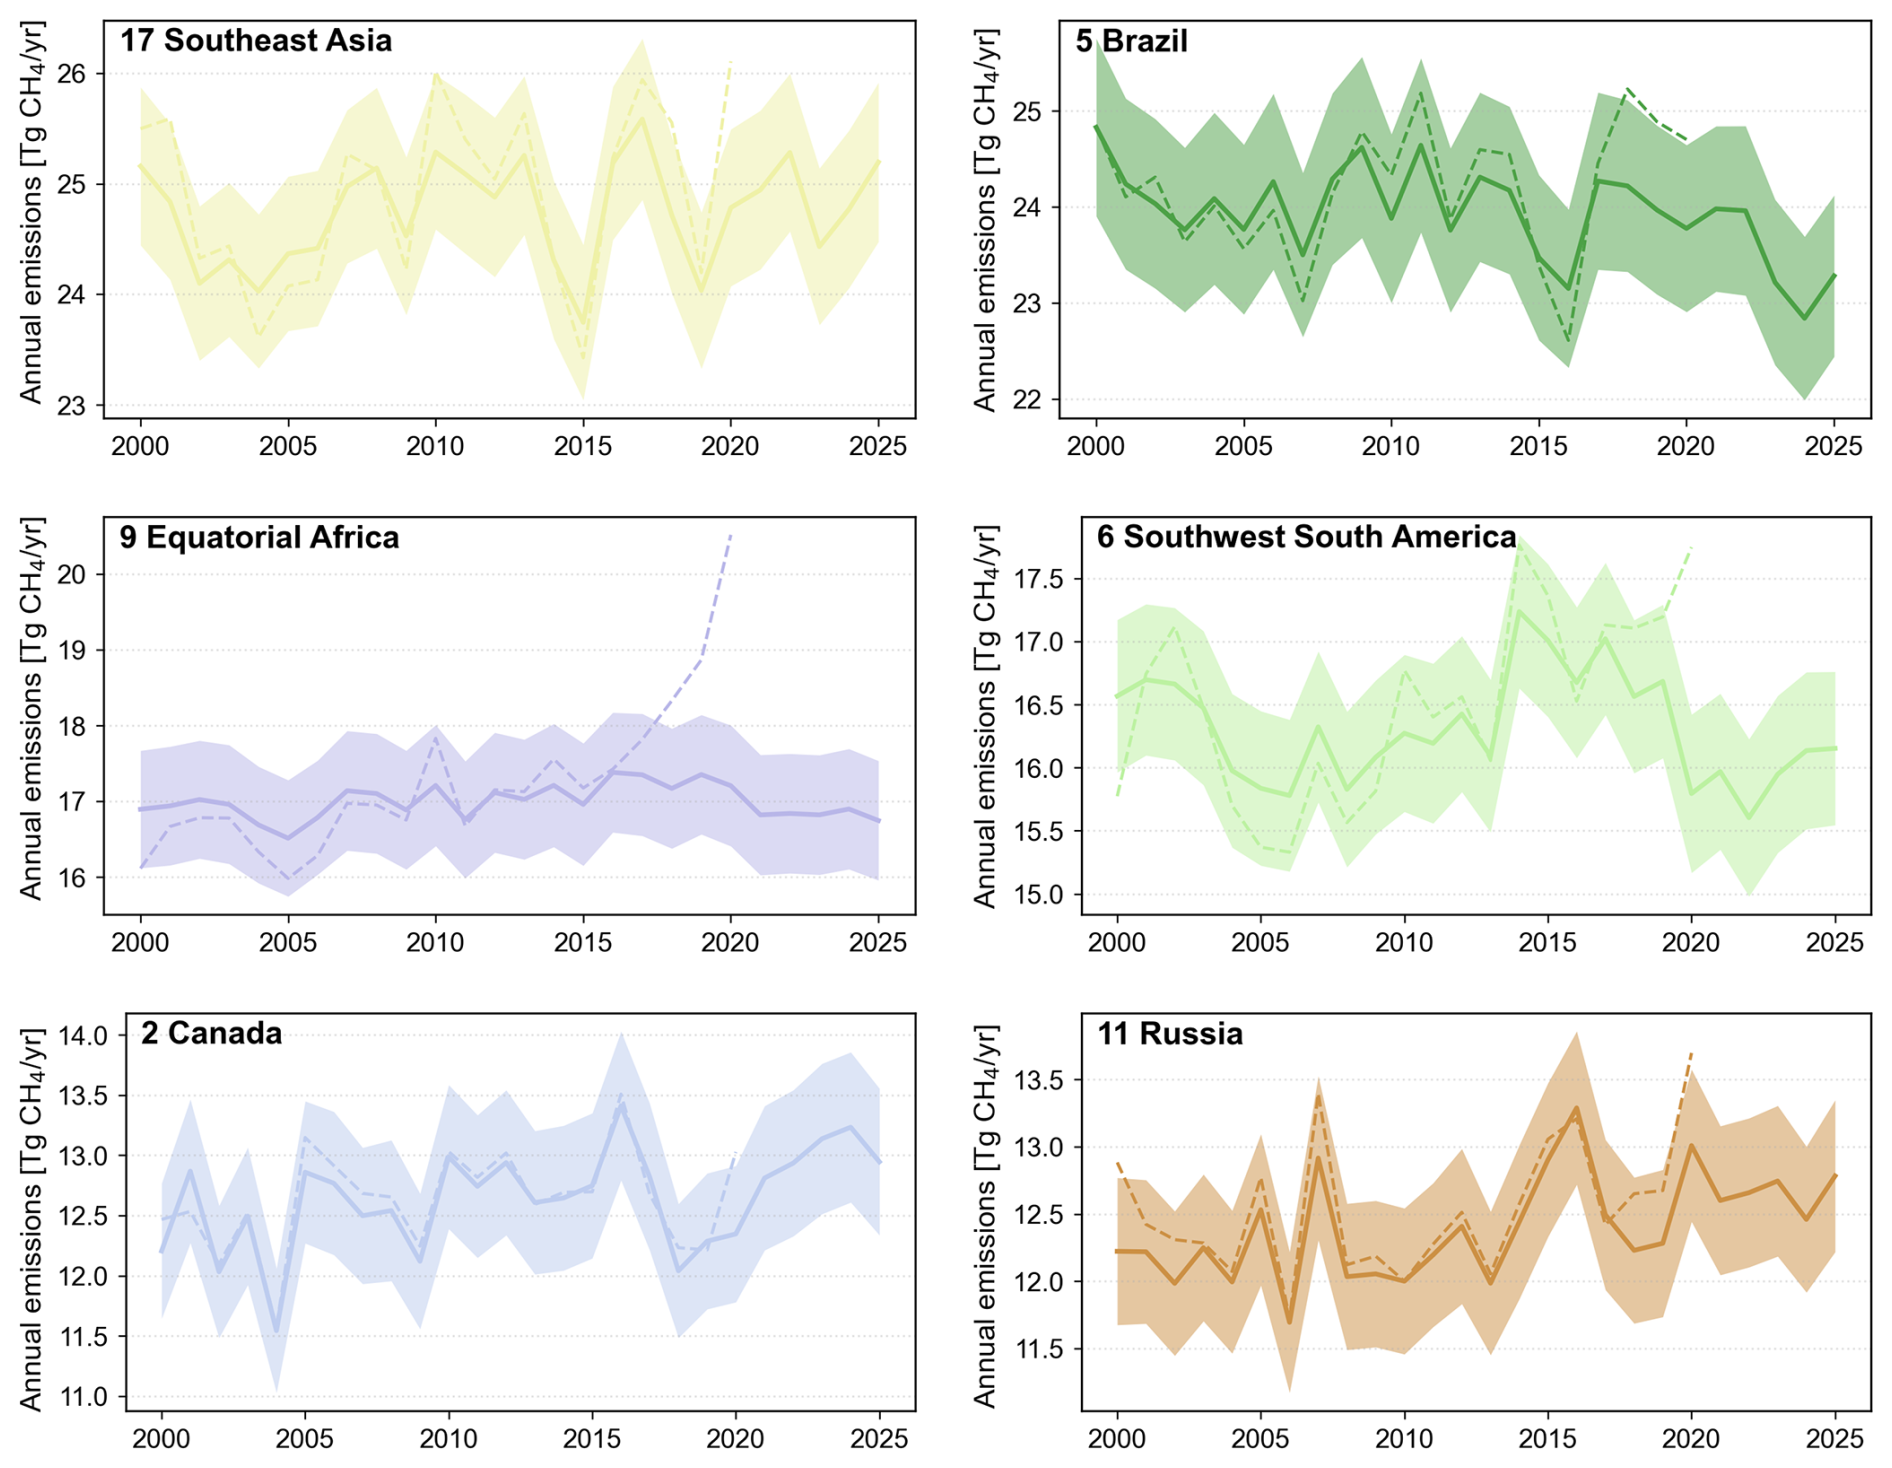
Figure 5Annual wetland CH4 emissions for the six top-emitting regions. Solid lines show model predictions of annual mean emissions, and shaded areas indicate 95 % CI. Dashed lines show GMB emission estimates (mean). Panel titles indicate the region code and region name, which correspond to the region definitions shown in Fig. 4.
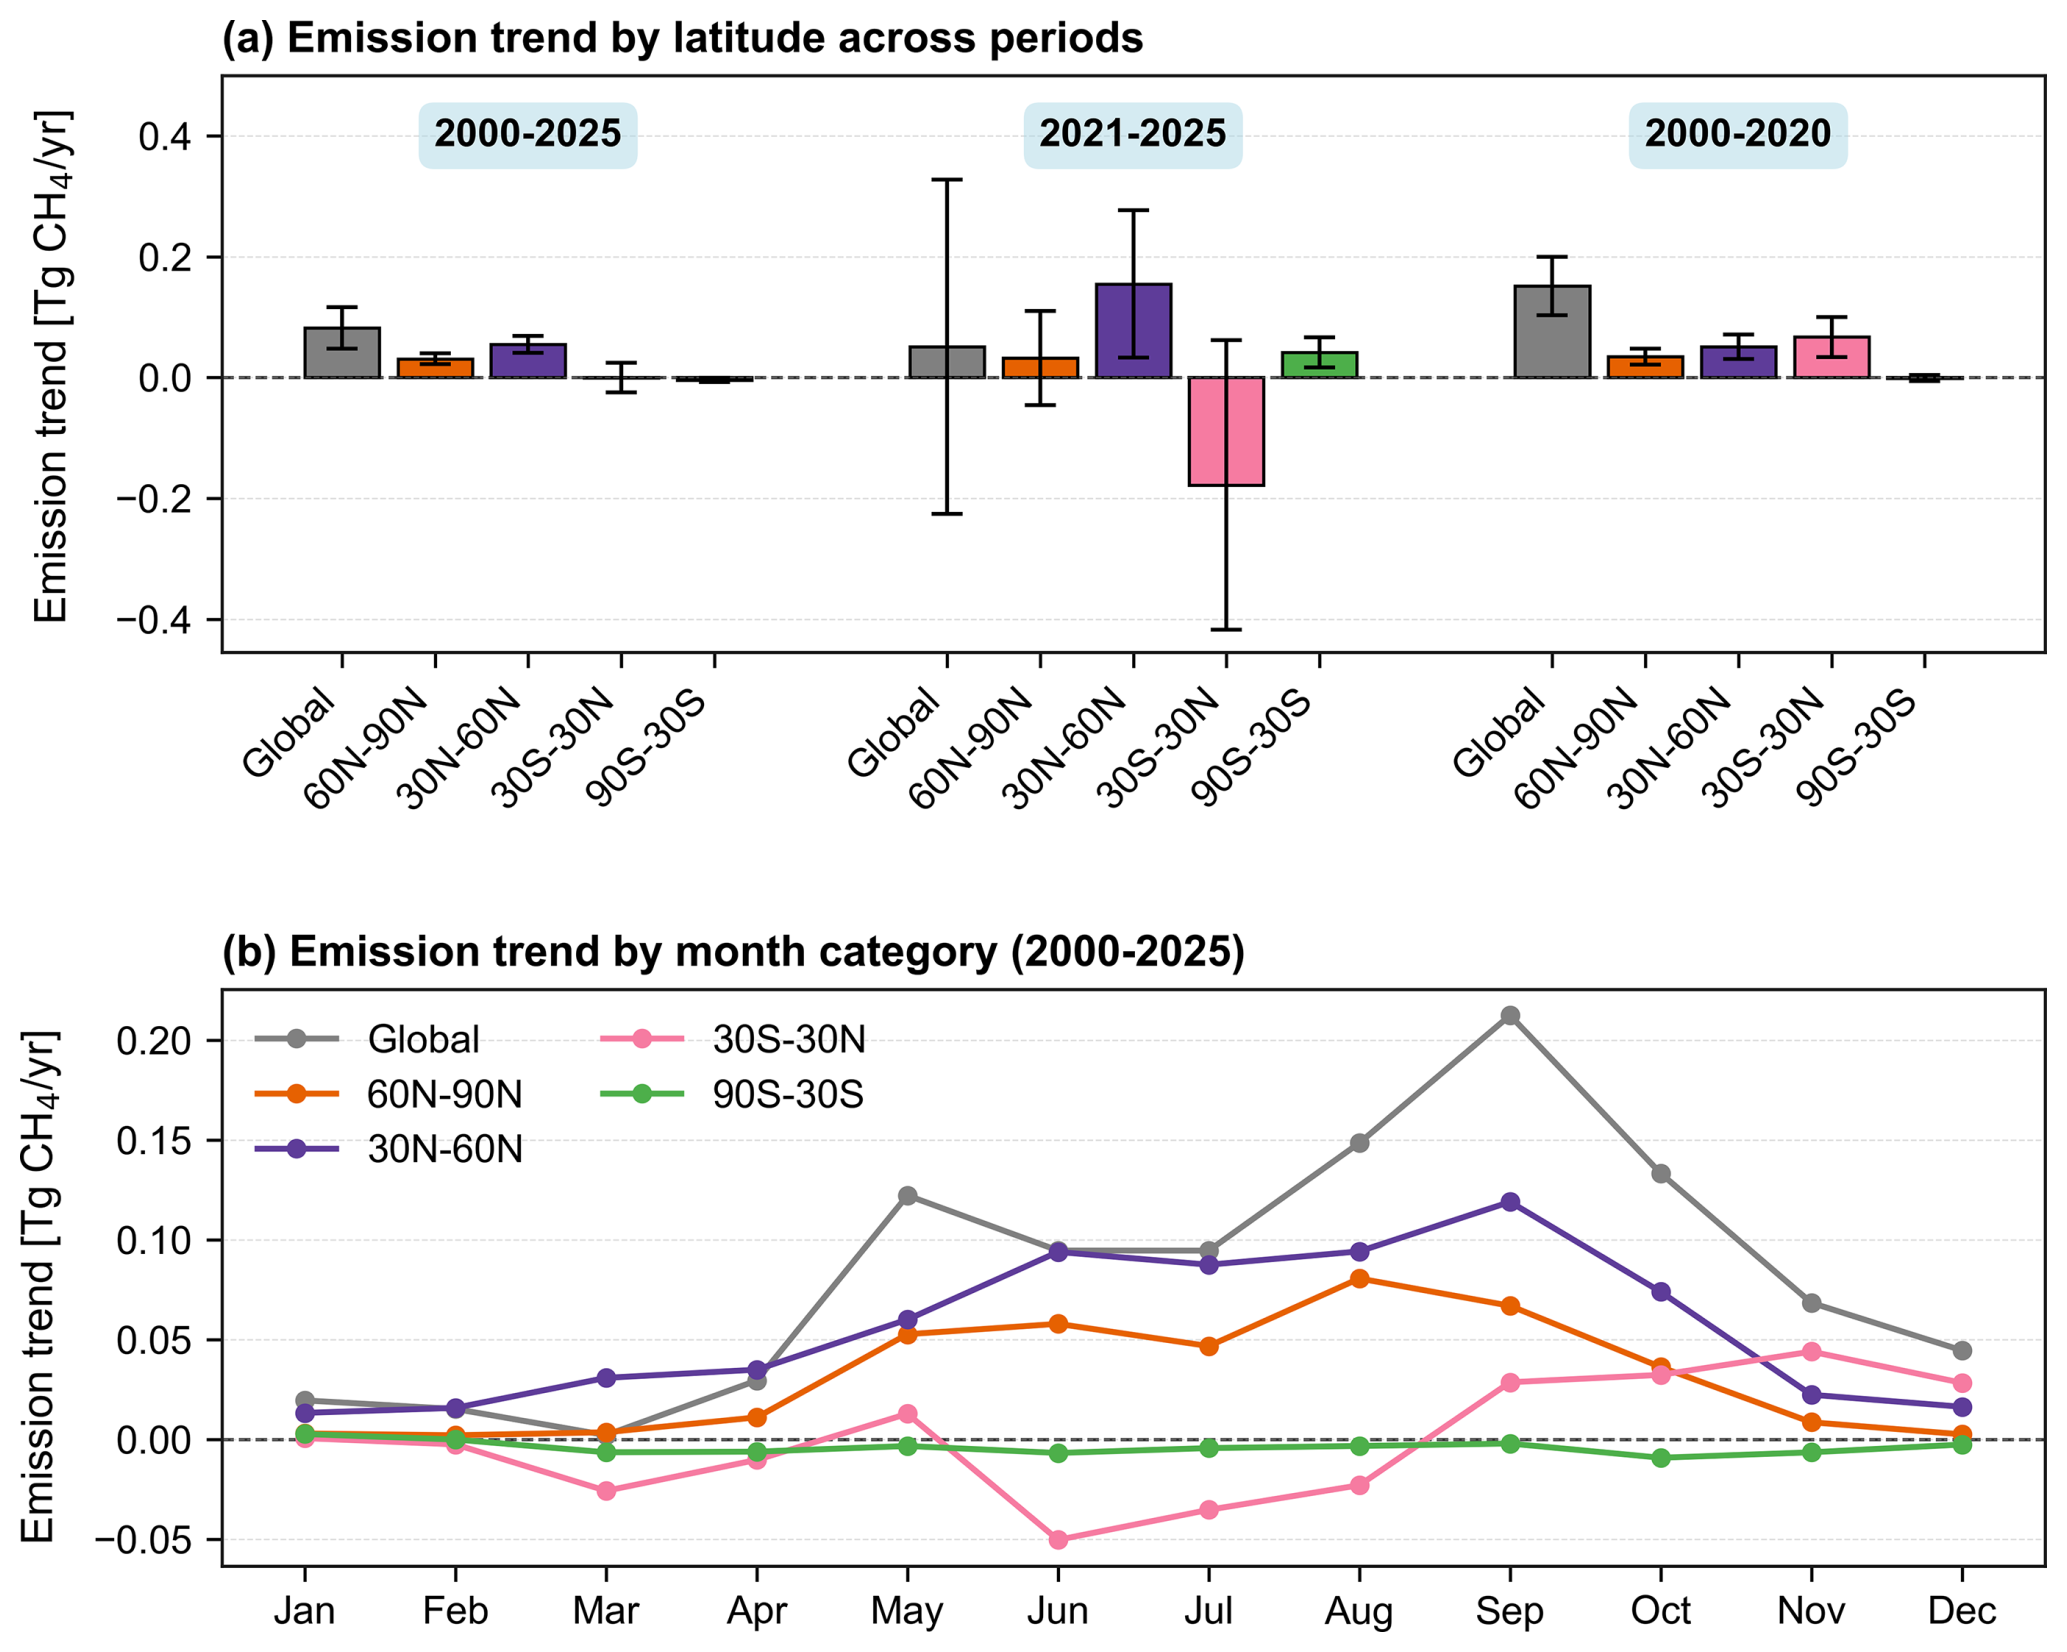
Figure 6Regional and seasonal trends (TgCH4 yr−1) in predicted wetland CH4 emissions. (a) Trends across five latitude bands across three time periods (2000–2025, 2021–2025, and 2000–2020). (b) Trends for each calendar month over 2000–2025. Positive trends indicate an increase in CH4 emissions, while negative values indicate a decrease. Error bars indicate 95 % CI.
2.4 Uncertainty analysis
Emulator skill uncertainty was evaluated using held-out test period R2, RMSE, NRMSE and prediction residuals relative to the GMB fields (Sects. 2.2.3 and 3.1). Uncertainty in reconstructed wetland CH4 emissions was estimated from the ensemble spread across all reconstructions generated from the 35 GMB estimates and 10 ERA5 ensemble members. This propagated two sources of uncertainty through the framework: (i) spread in the underlying GMB estimates and (ii) uncertainty in the predictors represented by the ERA5 ensemble. We use 95 % confidence interval (CI) to represent this emission uncertainty.
3.1 Model performance evaluation
We begin by evaluating model performance at the spatial scales most relevant to CH4 budgeting. Aggregated annual wetland CH4 emissions at the global and latitudinal-band scales show that the emulator reproduces the overall magnitude, temporal variability, and broad zonal structure of the GMB estimates over 2000–2020 (Fig. S6), providing a large-scale context for the finer grid-cell evaluation presented below.
Across the two test windows (2000–2002 and 2018–2020), the XGBoost model reproduces monthly wetland CH4 emissions well. Globally, the coefficient of determination was R2 of 0.65 ± 0.003 (mean ± 95 % CI, hereafter; Fig. 1a), which refers to the mean grid-cell R2 across all global land cells over the two test periods, with the 95 % confidence interval calculated across grid cells. This reported reconstructive skill indicates strong predictability from predictor variables. However, the model performance varies geographically. Mean R2 is higher in the Southern Hemisphere (SH) than in the Northern Hemisphere (NH) (0.77 ± 0.006 compared with 0.62 ± 0.004, respectively), and higher in the tropics than in the extratropics (0.78±0.004 and 0.58 ± 0.004, respectively). In the top emitting regions, mean R2 values are generally higher than in regions with lower emissions (Fig. S1a). Global RMSE over test periods is TgCH4 yr−1 (Fig. 1b). RMSE for the tropics is about twice that of the RMSE for the extratropics (9.37 ± 0.27 × 10⁻³ and 3.35 ± 0.08 × 10⁻³ Tg CH4 yr−1, respectively). Top emitting regions exhibit higher RMSE, e.g., RMSE doubled for top 10 % emitting regions compared with top 10 %–20 % emitting regions (Fig. S1b). Regionally, mean R2 values are highest in Southeast Asia and Korea-Japan (>0.8), and lowest in Russia and Canada (∼ 0.5) (Fig. S2a). Mean RMSE is highest in the Americas (Northern South America and Central America), and lowest in the Middle East and Central Asia. Generally, NRMSE is inversely correlated to R2, indicating a better performance of our model in top emitting regions (Fig. 1c). Temporal variation of model performance reveals the lowest R2 in January/February in NH high latitudes (Fig. S3), and the highest RMSE in July–September in the tropics (Fig. S4). We further evaluate how these spatial and temporal differences in model skill influence long-term variability in annual emissions in Sect. 3.3.
To examine predictive uncertainty, we compare wetland CH4 emissions from the GMB models (CH4_GMB; Fig. 2a) with XGBoost predictions (CH4_pred; Fig. 2b) over the two test periods. Globally, CH4_pred reproduces both the magnitude and spatial pattern of CH4_GMB, including the major hotspots concentrated in the tropics, such as Amazon Basin (central-western Amazon floodplains, Pantanal and Moxos plains), Congo Basin, the Sudd wetlands in South Sudan, and Southeast Asia (Sumatra, Borneo, Peninsular Malaysia, and New Guinea), with additional hotspots in NH high latitudes, such as West Siberian Plain and Hudson/James Bay Lowlands.
The differences in emissions (Fig. 2c) and the corresponding percent emission differences (Fig. 2d) between CH4_GMB and CH4_pred highlight spatial biases. During the test periods, the global mean predicted wetland CH4 emission is 158.5±2.1 Tg CH4 yr−1, which is 2.3 Tg CH4 yr−1 lower than the global mean of CH4_GMB (160.7 ± 2.2 Tg CH4 yr−1), corresponding to a 1.4 % underestimation (Fig. 2c). This difference is within the estimated uncertainty range of the two global means. Underestimation is strongest over high-emission systems, such as the central-western Amazon Basin, Southeast Asia, Congo Basin and West Siberian Plain (Fig. 2c), where our model predicted emissions are lower than GMB estimates, but percent differences are smaller because the denominator (CH4_GMB) is large. For example, in Southeast Asia, the mean bias is −0.44 TgCH4 yr−1, yet the relative bias is only −1.7 % given a high regional mean emission (CH4_GMB of 25.2 Tg CH4 yr−1). Monthly anomalies in global emissions reveal small disagreements between the predictions and GMB estimates ( Tg CH4 yr−1) (Fig. S5). Largest discrepancies occur in July/August 2020 (underestimation of 15 Tg CH4 yr−1).
3.2 Emission trends and predicted anomalies in recent years (2021–2025)
Figure 3 shows spatial maps of global predicted mean wetland CH4 emissions for 2021–2025 (Fig. 3a) and emission differences between 2021–2025 and 2000–2020. The 2021–2025 mean emission is 157.8 ± 2.4 TgCH4 yr−1 (z=3.72, with the z-score indicating how far each region's mean emission estimate deviates from the cross-region mean, measured in standard deviation units), representing a non-significant increase of 0.05 Tg CH4 yr−1 relative to the 2000–2020 mean. However, changes are more pronounced across latitudes. NH mid- and high-latitude wetland emissions increase during 2021–2025 by 0.76 ± 0.07 (from 29.9 ± 1.1 in 2000–2020 to 30.7 ± 1.2 in 2021–2025, z=2.21) and 0.35 ± 0.03 (from 11.0 ± 0.7 to 11.4±0.7 TgCH4 yr−1, z=1.01), respectively, compared with 2000–2020 emissions. These changes correspond to ∼ 2.5 % and ∼ 3.2 % increase. The continued growth in these regions in 2021–2025 (relative to 2000–2020), together with increases reported for 2010–2018 relative to 1981–1989 (Feron et al., 2024), suggests an increasing role of boreal and temperate wetlands in recent decades of global warming. In contrast, emissions decrease in the tropics and SH extratropics during 2021–2025. The tropics exhibit a 0.95 ± 0.19 TgCH4 yr−1 emission decrease (), from 113.9 ± 2.5 (2000–2020) to 112.9 ± 2.5 TgCH4 yr−1 (2021–2025), while SH extratropics emissions decline by 3.5 % (−0.11 ± 0.02 TgCH4 yr−1, ) from 3.1 ± 0.1 (2000–2020) to 3.0 ± 0.1 TgCH4 yr−1 (2021–2025).
We further assess regional wetland CH4 emission changes in 2021–2025 compared with 2000–2020 across 18 regions using XGBoost predictions (Fig. 4). Four regions show no significant change (p≥0.05 from two-sided paired significance test, labelled “ns”). Among the 14 regions with significant changes, nine regions show increases and five show decreases (Northern South America, Brazil, Southwest South America, Northern Africa, and Equatorial Africa). Notably, all regions with decreases are located in South America and Africa. The largest emission changes (2021–2025 relative to 2000–2020) occur in Brazil (−0.59 ± 0.09 TgCH4 yr−1), Canada (+0.46 ± 0.05 TgCH4 yr−1), Southwest South America (−0.43 ± 0.07 TgCH4 yr−1), Russia (+0.31 ± 0.03 TgCH4 yr−1), Southeast Asia (+0.22 ± 0.03 TgCH4 yr−1) and Equatorial Africa (−0.21 ± 0.04 TgCH4 yr−1). The pronounced decline over Brazil possibly reflects the exceptional drought conditions in the Amazon basin during 2022–2024, including record-low river levels and anomalously warm, dry conditions (Espinoza et al., 2024). Such hydroclimatic drying reduces floodplain inundation and lowers water tables, which suppresses anaerobic conditions and thereby limits wetland methane production and emissions (Cui et al., 2024).
3.3 26-year emission trends and anomalies (2000–2025)
The emission predictions enable an assessment of long-term trends and interannual variability in wetland emissions over 2000–2025. Annual emission time series show pronounced peaks in 2011 and 2016/2017 in the tropics, NH mid-latitudes, and globally (Fig. S6). Monthly emission anomalies in these regions (Fig. S7) indicate that the annual maxima are driven by sustained positive anomalies during August 2010–May 2011 and August 2016–December 2017, which coincide with La Niña conditions. This alignment is consistent with prior studies reporting La Niña-driven wetting and expanded inundation that enhance tropical wetland CH4 emissions (Hodson et al., 2011; Hasan et al., 2022; Nisbet et al., 2023; Lin et al., 2024; Murguia-Flores et al., 2023; Zhang et al., 2020, 2018; Zhu et al., 2017), and with the broader evidence that CH4 growth in 2020–2022 coincided with an unusual persistent La Niña event.
In the 2020s, global and tropical annual emissions reach a minimum in 2023 (Figs. S6, S7), coincident with a strong El Niño event. This is supported by two recent studies reporting a sharp decline in wetland emissions in South America (Ciais et al., 2026) and Amazonia (Quinn et al., 2025) in 2023 linked to El Niño-related drought. Our results further suggest that Brazil and Southwest South America are the key contributors, and both rank among the top six emitting regions globally (Fig. 5). Annual emissions in Brazil decline steadily across the study period, from 24.8±0.9 TgCH4 yr−1 in 2000 to 23.3 ± 0.9 TgCH4 yr−1 in 2025, with the lowest emission in 2024 (22.8 ± 0.9 TgCH4 yr−1) (Fig. 5). Emissions in Southwest South America are relatively stable during 2000–2014, decrease markedly during 2014–2023 (from 17.2 ± 0.6 to 15.6±0.6 TgCH4 yr−1), and show a modest recovery in 2024/2025 (Fig. 5).
The remaining four top emitting regions show contrasting behavior. Since 2019, Southeast Asia, Canada and Russia show increasing emissions, whereas Equatorial Africa emissions decrease slightly (Fig. 5). Southeast Asian emissions fluctuate around 24.7 ± 0.5 TgCH4 yr−1 over 2000–2025, with a minimum in 2015 (23.8 ± 0.7 TgCH4 yr−1) and a maximum in 2017 (25.6 ± 0.7 TgCH4 yr−1). Emissions in Canada are comparatively stable during 2005–2015, while variability is larger before 2005 and after 2015: the amplitude reaches ∼ 1.5 TgCH4 yr−1 in these periods, approximately double that during 2005–2015 (∼ 0.8 TgCH4 yr−1). Equatorial African emissions remain 17.0 ± 0.2 TgCH4 yr−1 during 2000–2025, despite two notable declines during 2002–2005 (−0.5 TgCH4 yr−1) and 2019–2025 (−0.6 TgCH4 yr−1).
For regions showing increasing emissions in our XGBoost predictions (e.g., Southeast Asia, Canada, and Russia), these changes are likely driven by wetter and/or warmer conditions that enhance inundation, substrate supply, and CH4 production. For instance, observed increases in Boreal-Arctic wetland CH4 emissions have been linked to warming and enhanced ecosystem productivity (Yuan et al., 2024), while inversion-based studies highlight the role of La Niña-driven inundation in enhancing emissions from Equatorial Asia (Qu et al., 2024; Lin et al., 2024; Feng et al., 2022). However, our emulator predictions diverge from recent atmospheric inversion literature regarding African wetland emissions. Multiple top-down studies indicate that enhanced emissions from tropical Africa contributed substantially to the global CH4 surge during 2020–2024 (Balasus et al., 2026; Qu et al., 2024). In contrast, our climate-driven emulator predicts that emissions across Northern, Equatorial, and Southern Africa remained relatively stable or slightly decreased during similar time periods (Figs. 4, 5, S8). We attribute this discrepancy to weaker performance and regional precipitation biases of ERA5 data over parts of Africa in capturing complex African hydrological dynamics (Gebrechorkos et al., 2024).
Regional emission time series (Figs. 5, S8) help explain the pronounced disagreement in 2019–2020 for global and tropical emissions, where predictions are substantially lower than the GMB estimates (Fig. S6). For 2019, the prediction mean emissions are 5.5 TgCH4 yr−1 below the GMB estimates for global emissions (∼ 3.5 % underestimation), while emission changes in Equatorial Africa, Brazil, USA, Southern Africa, and Southwest South America jointly account for 4.3 TgCH4 yr−1 of this discrepancy. In 2020, the modeled mean global emissions are 9.8 TgCH4 yr−1 lower than GMB (∼ 6 % underestimation). The discrepancies in the tropics explain 9.2 TgCH4 yr−1 of the underestimation, including major regions such as Eastern Africa, Southwest South America, Southeast Asia, Brazil, and Northern Africa. Notably, this disagreement in 2019–2020 is not evident in other latitude bands and does not persist outside these years. We cautiously interpret this mismatch as the limitations of the emulator and uncertainty in the underlying GMB ensemble. The climate predictors used in this study can only indirectly capture ENSO (El Niño-Southern Oscillation) effects. Although the training period includes several ENSO events, the unusual persistence of the 2020–2023 triple-dip La Niña may still be underrepresented. In addition, most TD estimates from GMB use a similar prescribed OH (hydroxyl radical) distribution, possibly causing OH-related uncertainty to be underrepresented, particularly during anomalous periods such as COVID.
Finally, we examine trends in predicted monthly wetland CH4 emissions across five latitude bands (Fig. 6a) and 12 calendar-month categories (Fig. 6b). Figure 6a compares these trends across three time periods (2000–2025, 2021–2025, and 2000–2020). Figure 6b shows the trends by 12 calendar-month categories for the 2000–2025 period. We summed predicted monthly emissions across all grid cells within each latitude band to form regional monthly time series, then computed monthly emission anomalies by subtracting the 2000–2025 climatological mean. We then estimated trends (Tg CH4 yr−1) using ordinary least squares linear regression of the anomaly time series. We calculated a z-score for each region and period by dividing the estimated trend by its standard error to assess the statistical significance of the trends.
The global wetland CH4 emission trend is three times lower in 2021–2025 compared with the 2000–2020 period (0.05 ± 0.28 and 0.15 ± 0.05 Tg CH4 yr−1, respectively) (Fig. 6a). However, the magnitude of changes in emission trends in NH mid-latitudes, the tropics and SH extratropics is greater in 2021–2025 than 2000–2020 level. Emission trends in NH mid-latitudes increased three times from 0.05 ± 0.02 TgCH4 yr−1 (z=4.94) in 2000–2020 to 0.16±0.12 TgCH4 yr−1 (z=2.49) during 2021–2025. The tropics exhibit a reversal of their emission trends from positive in 2000–2020 (0.07 ± 0.03 Tg CH4 yr−1, z=3.95) to negative in 2021–2025 (−0.18 ± 0.24 Tg CH4 yr−1, ). Emission trends in SH extratropics increased from nearly zero in 2000–2020 ( TgCH4 yr−1, ) to higher than the global average in 2021-2025 (0.04 ± 0.02 TgCH4 yr−1, z=3.30).
Evaluating emission trends over individual months (Fig. 6b), we find that the global trend peaks in late boreal summer, with the largest increases in August and September (0.15 ± 0.18 and 0.21 ± 0.13 TgCH4 yr−1, respectively). The strongest seasonal intensification occurs in NH mid-latitudes during June–September (0.09–0.12 Tg CH4 yr−1), consistent with the dominant contribution from boreal growing-season emissions. For both NH mid- and high-latitudes, growth rates are systematically higher during May–October (growing season) than during November–April. In the tropics, monthly growth reaches its highest in October–December and lowest in June–August (negative growth). SH extratropics show near-zero growth throughout the year (slightly negative).
3.4 Limitations
A limitation concerns source attribution in the TD estimates used for training. Although the TD inversions adopted BU wetland priors that exclude inland freshwater systems, the coarse spatial resolution of TD inversions can still limit the separation of natural vegetated wetland emissions from nearby open-water or inland-freshwater emissions in mixed floodplain environments. This uncertainty cannot be quantified explicitly in the present framework because no independent source-resolved posterior diagnostic is available. Future progress is likely to come from higher-resolution atmospheric inverse frameworks. Two recent studies performed 25 km resolution atmospheric inversions using satellite observations in regional and global applications and improved spatial attribution (East et al., 2025; Hancock et al., 2025).
Another limitation is that our framework predicts wetland emissions from climate predictors only. ENSO-related impacts can be captured only indirectly, while dynamic inundation and atmospheric chemistry perturbations are outside the predictor space of the model.
ERA5 monthly averaged data are available at Copernicus Climate Change Service Climate Data Store at https://cds.climate.copernicus.eu/datasets/reanalysis-era5-single-levels-monthly-means?tab=overview (last access: 22 January 2026) (https://doi.org/10.24381/cds.f17050d7) (Copernicus Climate Change Service, 2023). The global natural wetland methane emission dataset generated from this study is publicly available at https://doi.org/10.5281/zenodo.18870108 (Li et al., 2026).
This study presents a framework to extend global natural wetland CH4 emissions from 2000 through 2025 by applying a machine-learning emulator to provide a lower-latency release of GMB estimates to estimate wetland emissions and is intended for routine updates. The framework reproduces both spatial patterns and interannual variability of the GMB estimates. The extended wetland CH4 emission record shows that the magnitude of emission changes in 2021–2025 is substantially larger than the long-term trend over 2000–2020, even though the global mean emission change is relatively small.
A key emerging feature is accelerated emissions estimated in the NH mid-latitudes and high-latitudes. Seasonal trend analyses indicate that these increases are concentrated in the warm season (May–October), consistent with an amplification of the seasonal cycle and a strengthening of late-summer growth, highlighting Northern mid- and high-latitude wetlands as regions where intensifying trends are most evident in recent years.
In contrast, the tropics show a reversal in emission trend in the post-2020s, from an emission increase during 2000–2020 to a decline in 2021–2025. Nevertheless, the tropics still dominate interannual variability of global wetland emissions and can strongly influence the global CH4 budget through episodic hydroclimate extremes.
More broadly, this emulator framework may also apply to other low-latency Earth system applications beyond wetland CH4 emissions, particularly for environments and pollutants that can be constrained by routinely updated predictor fields. At the same time, the present results point to several opportunities for improvement, including better representation of dynamic inundation and improved separation of wetland and inland-freshwater emissions.
Overall, this work proposes an operational, low-latency emulator framework that provides a scalable pathway to track wetland CH4 emissions in response to climate anomalies by leveraging routinely updated Earth observation reanalysis data.
The supplement related to this article is available online at https://doi.org/10.5194/essd-18-3507-2026-supplement.
M.L.: conceptualization, methodology, workflow development, formal analysis, visualization, writing – original draft, supervision, funding acquisition. R.B.J.: conceptualization, methodology, data curation, supervision, funding acquisition. M.S.: conceptualization, methodology, data curation. P.C.: conceptualization, methodology. B.P.: conceptualization, methodology, data curation. J.G.C.: conceptualization, methodology, data curation. P.K.P.: conceptualization, methodology, data curation. H.T.: conceptualization, methodology, data curation. Z.Z.: methodology, data curation. E.F.-C.: methodology, data curation. Z.O.: methodology, data curation. T.Z.: visualization. D.J.B.: data curation. D.A.B.: data curation. P.B.: data curation. D.C.: data curation. N.C.: data curation. N.G.: data curation. P.O.H.: data curation. K.I.: data curation. A.I.: data curation. A.K.J.: data curation. K.J.: data curation. F.J.: data curation. T.K.: data curation. M.K.: data curation. T.L.: data curation. X.L.: data curation. S.M.: data curation. A.M.: data curation. A.M.H.: data curation. K.M.: data curation. J.R.M.: data curation. J.M.: data curation. Y.N.: data curation. S.Pan.: data curation. S.Peng: data curation. C.P.: data curation. Z.Q.: data curation. P.R.: data curation. W.R.: data curation. A.S.: data curation. R.L.T.: data curation. A.T.: data curation. X.Y.: data curation. W.Z.: data curation. B.Z.: data curation. Q.Zhu: data curation. Q.Zhuang: data curation. All authors contributed to writing – review & editing of the manuscript.
At least one of the (co-)authors is a member of the editorial board of Earth System Science Data. The peer-review process was guided by an independent editor, and the authors also have no other competing interests to declare.
Publisher's note: Copernicus Publications remains neutral with regard to jurisdictional claims made in the text, published maps, institutional affiliations, or any other geographical representation in this paper. The authors bear the ultimate responsibility for providing appropriate place names. Views expressed in the text are those of the authors and do not necessarily reflect the views of the publisher.
This research is supported by the National University of Singapore (NUS) (Start-Up grant). R.J. received support from the Gordon and Betty Moore Foundation (grant no. GBMF11519 to Stanford University), the Global Methane Office at the Stanford Doerr School of Sustainability, and the John Wesley Powell Center for Analysis and Synthesis of the U.S. Geological Survey (“Scaling tropical wetland methane fluxes regionally and globally” working group). D.B. and P.K. were supported by the Environment Research and Technology Development Fund (grant no. JPMEERF24S12205) of the Environmental Restoration and Conservation Agency of Japan. F.L. received support from startup funds provided by The University of Texas at Austin. A.M. was supported by an Early Career Award by the U.S. Department of Energy. A.M.H. received support from the National Science Foundation award 2406964. F.J. and J.M. received funding from the Swiss National Science Foundation (No. 200020_200511). N.G was funded by the Met Office Climate Science for Service Partnership (CSSP) Brazil project which is supported by the Department for Science, Innovation & Technology (DSIT). C.P. was supported by the Joint Fund for Regional Innovation and Development of the National Science Foundation (U22A20570). K.Y. was supported by UH Energy. This paper is a contribution to the League of geophysical research eXcellences for tropical Asia (LeXtra).
This paper was edited by Yuqiang Zhang and reviewed by three anonymous referees.
Aalto, T., Tsuruta, A., Mäkelä, J., Müller, J., Tenkanen, M., Burke, E., Chadburn, S., Gao, Y., Mannisenaho, V., Kleinen, T., Lee, H., Leppänen, A., Markkanen, T., Materia, S., Miller, P. A., Peano, D., Peltola, O., Poulter, B., Raivonen, M., Saunois, M., Wårlind, D., and Zaehle, S.: Air temperature and precipitation constraining the modelled wetland methane emissions in a boreal region in northern Europe, Biogeosciences, 22, 323–340, https://doi.org/10.5194/bg-22-323-2025, 2025.
Arora, V. K., Melton, J. R., and Plummer, D.: An assessment of natural methane fluxes simulated by the CLASS-CTEM model, Biogeosciences, 15, 4683–4709, https://doi.org/10.5194/bg-15-4683-2018, 2018.
Balasus, N., Jacob, D. J., Bloom, A. A., East, J. D., Estrada, L. A., Hancock, S. E., He, M., Mooring, T. A., Turner, A. J., and Worden, J. R.: 2019–2024 trends in African livestock and wetland emissions as contributors to the global methane rise, Atmos. Chem. Phys., 26, 4601–4617, https://doi.org/10.5194/acp-26-4601-2026, 2026.
Bansal, S., Post van der Burg, M., Fern, R. R., Jones, J. W., Lo, R., McKenna, O. P., Tangen, B. A., Zhang, Z., and Gleason, R. A.: Large increases in methane emissions expected from North America's largest wetland complex, Sci. Adv., 9, eade1112, https://doi.org/10.1126/sciadv.ade1112, 2023.
Beerling, D. and Woodward, F. I.: Vegetation and the Terrestrial Carbon Cycle: The First 400 Million Years, Cambridge University Press, Cambridge, U.K., New York, NY, 416 pp., ISBN 0-521-80196-6, 2001.
Bernard, J., Salmon, E., Saunois, M., Peng, S., Serrano-Ortiz, P., Berchet, A., Gnanamoorthy, P., Jansen, J., and Ciais, P.: Satellite-based modeling of wetland methane emissions on a global scale (SatWetCH4 1.0), Geosci. Model Dev., 18, 863–883, https://doi.org/10.5194/gmd-18-863-2025, 2025.
Chandra, N., Patra, P. K., Bisht, J. S. H., Ito, A., Umezawa, T., Saigusa, N., Morimoto, S., Aoki, S., Janssens-Maenhout, G., Fujita, R., Takigawa, M., Watanabe, S., Saitoh, N., and Canadell, J. G.: Emissions from the Oil and Gas Sectors, Coal Mining and Ruminant Farming Drive Methane Growth over the Past Three Decades, J. Meteorol. Soc. Jpn. Ser II, 99, 309–337, https://doi.org/10.2151/jmsj.2021-015, 2021.
Chen, T. and Guestrin, C.: XGBoost: A Scalable Tree Boosting System, in: Proceedings of the 22nd ACM SIGKDD International Conference on Knowledge Discovery and Data Mining, arXiv:1603.02754 [cs], 785–794, https://doi.org/10.1145/2939672.2939785, 2016.
Chen, S., Yuan, K., Li, F., Zhu, Q., and Zhuang, Q.: Hysteretic temperature sensitivity in wetland CH4 emission modeling, Agr. Forest Meteorol., 372, 110704, https://doi.org/10.1016/j.agrformet.2025.110704, 2025.
Ciais, P., Zhu, Y., Cai, Y., Lan, X., Michel, S. E., Zheng, B., Zhao, Y., Hauglustaine, D. A., Lin, X., Zhang, Y., Sun, S., Tian, X., Zhao, M., Wang, Y., Chang, J., Dou, X., Liu, Z., Andrew, R., Quinn, C. A., Poulter, B., Ouyang, Z., Yuan, W., Yuan, K., Zhu, Q., Li, F., Pan, N., Tian, H., Yu, X., Rocher-Ros, G., Johnson, M. S., Li, M., Li, M., Feng, D., Raymond, P., Yang, X., Canadell, J. G., Jackson, R. B., Yu, X., Li, Y., Saunois, M., Bousquet, P., and Peng, S.: Why methane surged in the atmosphere during the early 2020s, Science, 391, eadx8262, https://doi.org/10.1126/science.adx8262, 2026.
Copernicus Climate Change Service: ERA5 monthly averaged data on single levels from 1940 to present, Copernicus Climate Change Service (C3S) Climate Data Store (CDS) [data set], https://doi.org/10.24381/cds.f17050d7, 2023.
Crippa, M., Guizzardi, D., Pagani, F., Banja, M., Muntean, M., Schaaf, E., Becker, W., Monforti-Ferrario, F., Quadrelli, R., and Risquez Martin, A.: GHG emissions of all world countries – 2021 Report, Publ. Off. Eur. Union Luxemb., https://doi.org/10.2760/173513, 2021.
Cui, S., Liu, P., Guo, H., Nielsen, C. K., Pullens, J. W. M., Chen, Q., Pugliese, L., and Wu, S.: Wetland hydrological dynamics and methane emissions, Commun. Earth Environ., 5, 470, https://doi.org/10.1038/s43247-024-01635-w, 2024.
East, J. D., Jacob, D. J., Jervis, D., Balasus, N., Estrada, L. A., Hancock, S. E., Sulprizio, M. P., Thomas, J., Wang, X., Chen, Z., Varon, D. J., and Worden, J. R.: Worldwide inference of national methane emissions by inversion of satellite observations with UNFCCC prior estimates, Nat. Commun., 16, 11004, https://doi.org/10.1038/s41467-025-67122-8, 2025.
Espinoza, J.-C., Jimenez, J. C., Marengo, J. A., Schongart, J., Ronchail, J., Lavado-Casimiro, W., and Ribeiro, J. V. M.: The new record of drought and warmth in the Amazon in 2023 related to regional and global climatic features, Sci. Rep., 14, 8107, https://doi.org/10.1038/s41598-024-58782-5, 2024.
Feng, L., Palmer, P. I., Zhu, S., Parker, R. J., and Liu, Y.: Tropical methane emissions explain large fraction of recent changes in global atmospheric methane growth rate, Nat. Commun., 13, 1378, https://doi.org/10.1038/s41467-022-28989-z, 2022.
Feron, S., Malhotra, A., Bansal, S., Fluet-Chouinard, E., McNicol, G., Knox, S. H., Delwiche, K. B., Cordero, R. R., Ouyang, Z., Zhang, Z., Poulter, B., and Jackson, R. B.: Recent increases in annual, seasonal, and extreme methane fluxes driven by changes in climate and vegetation in boreal and temperate wetland ecosystems, Glob. Change Biol., 30, e17131, https://doi.org/10.1111/gcb.17131, 2024.
Gebrechorkos, S. H., Leyland, J., Dadson, S. J., Cohen, S., Slater, L., Wortmann, M., Ashworth, P. J., Bennett, G. L., Boothroyd, R., Cloke, H., Delorme, P., Griffith, H., Hardy, R., Hawker, L., McLelland, S., Neal, J., Nicholas, A., Tatem, A. J., Vahidi, E., Liu, Y., Sheffield, J., Parsons, D. R., and Darby, S. E.: Global-scale evaluation of precipitation datasets for hydrological modelling, Hydrol. Earth Syst. Sci., 28, 3099–3118, https://doi.org/10.5194/hess-28-3099-2024, 2024.
Gedney, N., Huntingford, C., Comyn-Platt, E., and Wiltshire, A.: Significant feedbacks of wetland methane release on climate change and the causes of their uncertainty, Environ. Res. Lett., 14, 084027, https://doi.org/10.1088/1748-9326/ab2726, 2019a.
Gedney, N., Huntingford, C., Comyn-Platt, E., and Wiltshire, A.: Significant feedbacks of wetland methane release on climate change and the causes of their uncertainty, Environ. Res. Lett., 14, 084027, https://doi.org/10.1088/1748-9326/ab2726, 2019b.
Hancock, S. E., Jacob, D. J., Chen, Z., Nesser, H., Davitt, A., Varon, D. J., Sulprizio, M. P., Balasus, N., Estrada, L. A., Cazorla, M., Dawidowski, L., Diez, S., East, J. D., Penn, E., Randles, C. A., Worden, J., Aben, I., Parker, R. J., and Maasakkers, J. D.: Satellite quantification of methane emissions from South American countries: a high-resolution inversion of TROPOMI and GOSAT observations, Atmos. Chem. Phys., 25, 797–817, https://doi.org/10.5194/acp-25-797-2025, 2025.
Hasan, N. A., Chikamoto, Y., and McPhaden, M. J.: The influence of tropical basin interactions on the 2020–2022 double-dip La Niña, Front. Clim., 4, https://doi.org/10.3389/fclim.2022.1001174, 2022.
He, K., Li, W., Zhang, Y., Zeng, A., de Graaf, I. E. M., Aguilos, M., Sun, G., McNulty, S. G., King, J. S., Flanagan, N. E., and Richardson, C. J.: Temperature and Water Levels Collectively Regulate Methane Emissions From Subtropical Freshwater Wetlands, Glob. Biogeochem. Cycles, 39, e2024GB008372, https://doi.org/10.1029/2024GB008372, 2025.
Helbig, M., Waddington, J. M., Alekseychik, P., Amiro, B. D., Aurela, M., Barr, A. G., Black, T. A., Blanken, P. D., Carey, S. K., Chen, J., Chi, J., Desai, A. R., Dunn, A., Euskirchen, E. S., Flanagan, L. B., Forbrich, I., Friborg, T., Grelle, A., Harder, S., Heliasz, M., Humphreys, E. R., Ikawa, H., Isabelle, P.-E., Iwata, H., Jassal, R., Korkiakoski, M., Kurbatova, J., Kutzbach, L., Lindroth, A., Löfvenius, M. O., Lohila, A., Mammarella, I., Marsh, P., Maximov, T., Melton, J. R., Moore, P. A., Nadeau, D. F., Nicholls, E. M., Nilsson, M. B., Ohta, T., Peichl, M., Petrone, R. M., Petrov, R., Prokushkin, A., Quinton, W. L., Reed, D. E., Roulet, N. T., Runkle, B. R. K., Sonnentag, O., Strachan, I. B., Taillardat, P., Tuittila, E.-S., Tuovinen, J.-P., Turner, J., Ueyama, M., Varlagin, A., Wilmking, M., Wofsy, S. C., and Zyrianov, V.: Increasing contribution of peatlands to boreal evapotranspiration in a warming climate, Nat. Clim. Change, 10, 555–560, https://doi.org/10.1038/s41558-020-0763-7, 2020.
Helfter, C., Gondwe, M., Murray-Hudson, M., Makati, A., Lunt, M. F., Palmer, P. I., and Skiba, U.: Phenology is the dominant control of methane emissions in a tropical non-forested wetland, Nat. Commun., 13, 133, https://doi.org/10.1038/s41467-021-27786-4, 2022.
Hersbach, H., Bell, B., Berrisford, P., Hirahara, S., Horányi, A., Muñoz-Sabater, J., Nicolas, J., Peubey, C., Radu, R., Schepers, D., Simmons, A., Soci, C., Abdalla, S., Abellan, X., Balsamo, G., Bechtold, P., Biavati, G., Bidlot, J., Bonavita, M., De Chiara, G., Dahlgren, P., Dee, D., Diamantakis, M., Dragani, R., Flemming, J., Forbes, R., Fuentes, M., Geer, A., Haimberger, L., Healy, S., Hogan, R. J., Hólm, E., Janisková, M., Keeley, S., Laloyaux, P., Lopez, P., Lupu, C., Radnoti, G., de Rosnay, P., Rozum, I., Vamborg, F., Villaume, S., and Thépaut, J.-N.: The ERA5 global reanalysis, Q. J. R. Meteorol. Soc., 146, 1999–2049, https://doi.org/10.1002/qj.3803, 2020.
Hersbach, H., Bell, B., Berrisford, P., Biavati, G., Horányi, A., Muñoz Sabater, J., Nicolas, J., Peubey, C., Radu, R., and Rozum, I.: ERA5 monthly averaged data on pressure levels from 1940 to present, Copernicus Climate Change Service (C3S) Climate Data Store (CDS) [data set], https://doi.org/10.24381/cds.f17050d7, 2023.
Hodson, E. L., Poulter, B., Zimmermann, N. E., Prigent, C., and Kaplan, J. O.: The El Niño–Southern Oscillation and wetland methane interannual variability, Geophys. Res. Lett., 38, https://doi.org/10.1029/2011GL046861, 2011.
Höglund-Isaksson, L., Gómez-Sanabria, A., Klimont, Z., Rafaj, P., and Schöpp, W.: Technical potentials and costs for reducing global anthropogenic methane emissions in the 2050 timeframe – results from the GAINS model, Environ. Res. Commun., 2, 025004, https://doi.org/10.1088/2515-7620/ab7457, 2020.
Hopcroft, P. O., Valdes, P. J., and Beerling, D. J.: Simulating idealized Dansgaard-Oeschger events and their potential impacts on the global methane cycle, Quat. Sci. Rev., 30, 3258–3268, https://doi.org/10.1016/j.quascirev.2011.08.012, 2011.
Hopcroft, P. O., Ramstein, G., Pugh, T. A. M., Hunter, S. J., Murguia-Flores, F., Quiquet, A., Sun, Y., Tan, N., and Valdes, P. J.: Polar amplification of Pliocene climate by elevated trace gas radiative forcing, P. Natl. Acad. Sci. USA, 117, 23401–23407, https://doi.org/10.1073/pnas.2002320117, 2020.
Hyvärinen, S., Tenkanen, M. K., Tsuruta, A., Erkkilä, A., Rautiainen, K., Aaltonen, H., Sasakawa, M., and Aalto, T.: Spring melting season methane emissions in northern high latitude wetlands are governed by the length of the season and presence of permafrost, EGUsphere [preprint], https://doi.org/10.5194/egusphere-2025-2794, 2025.
Ito, A. and Inatomi, M.: Use of a process-based model for assessing the methane budgets of global terrestrial ecosystems and evaluation of uncertainty, Biogeosciences, 9, 759–773, https://doi.org/10.5194/bg-9-759-2012, 2012.
Jackson, R. B., Saunois, M., Martinez, A., Canadell, J. G., Yu, X., Li, M., Poulter, B., Raymond, P. A., Regnier, P., Ciais, P., Davis, S. J., and Patra, P. K.: Human activities now fuel two-thirds of global methane emissions, Environ. Res. Lett., 19, 101002, https://doi.org/10.1088/1748-9326/ad6463, 2024.
Kleinen, T., Brovkin, V., and Schuldt, R. J.: A dynamic model of wetland extent and peat accumulation: results for the Holocene, Biogeosciences, 9, 235–248, https://doi.org/10.5194/bg-9-235-2012, 2012.
Kleinen, T., Mikolajewicz, U., and Brovkin, V.: Terrestrial methane emissions from the Last Glacial Maximum to the preindustrial period, Clim. Past, 16, 575–595, https://doi.org/10.5194/cp-16-575-2020, 2020.
Kleinen, T., Gromov, S., Steil, B., and Brovkin, V.: Atmospheric methane underestimated in future climate projections, Environ. Res. Lett., 16, 094006, https://doi.org/10.1088/1748-9326/ac1814, 2021.
Kleinen, T., Gromov, S., Steil, B., and Brovkin, V.: Atmospheric methane since the last glacial maximum was driven by wetland sources, Clim. Past, 19, 1081–1099, https://doi.org/10.5194/cp-19-1081-2023, 2023.
Knox, S. H., Jackson, R. B., Poulter, B., McNicol, G., Fluet-Chouinard, E., Zhang, Z., Hugelius, G., Bousquet, P., Canadell, J. G., Saunois, M., Papale, D., Chu, H., Keenan, T. F., Baldocchi, D., Torn, M. S., Mammarella, I., Trotta, C., Aurela, M., Bohrer, G., Campbell, D. I., Cescatti, A., Chamberlain, S., Chen, J., Chen, W., Dengel, S., Desai, A. R., Euskirchen, E., Friborg, T., Gasbarra, D., Goded, I., Goeckede, M., Heimann, M., Helbig, M., Hirano, T., Hollinger, D. Y., Iwata, H., Kang, M., Klatt, J., Krauss, K. W., Kutzbach, L., Lohila, A., Mitra, B., Morin, T. H., Nilsson, M. B., Niu, S., Noormets, A., Oechel, W. C., Peichl, M., Peltola, O., Reba, M. L., Richardson, A. D., Runkle, B. R. K., Ryu, Y., Sachs, T., Schäfer, K. V. R., Schmid, H. P., Shurpali, N., Sonnentag, O., Tang, A. C. I., Ueyama, M., Vargas, R., Vesala, T., Ward, E. J., Windham-Myers, L., Wohlfahrt, G., and Zona, D.: FLUXNET-CH4 Synthesis Activity: Objectives, Observations, and Future Directions, B. Am. Meteorol. Soc., https://doi.org/10.1175/BAMS-D-18-0268.1, 2019.
Knox, S. H., Bansal, S., McNicol, G., Schafer, K., Sturtevant, C., Ueyama, M., Valach, A. C., Baldocchi, D., Delwiche, K., Desai, A. R., Euskirchen, E., Liu, J., Lohila, A., Malhotra, A., Melling, L., Riley, W., Runkle, B. R. K., Turner, J., Vargas, R., Zhu, Q., Alto, T., Fluet-Chouinard, E., Goeckede, M., Melton, J. R., Sonnentag, O., Vesala, T., Ward, E., Zhang, Z., Feron, S., Ouyang, Z., Alekseychik, P., Aurela, M., Bohrer, G., Campbell, D. I., Chen, J., Chu, H., Dalmagro, H. J., Goodrich, J. P., Gottschalk, P., Hirano, T., Iwata, H., Jurasinski, G., Kang, M., Koebsch, F., Mammarella, I., Nilsson, M. B., Ono, K., Peichl, M., Peltola, O., Ryu, Y., Sachs, T., Sakabe, A., Sparks, J. P., Tuittila, E.-S., Vourlitis, G. L., Wong, G. X., Windham-Myers, L., Poulter, B., and Jackson, R. B.: Identifying dominant environmental predictors of freshwater wetland methane fluxes across diurnal to seasonal time scales, Glob. Change Biol., 27, 3582–3604, https://doi.org/10.1111/gcb.15661, 2021.
Kursa, M. B. and Rudnicki, W. R.: Feature Selection with the Boruta Package, J. Stat. Softw., 36, 1–13, https://doi.org/10.18637/jss.v036.i11, 2010.
Li, F., Zhu, Q., Yuan, K., Fluet-Chouinard, E., Zhang, X., Wang, J., Knox, S. H., You, H., Chen, M., Li, M., Stern, R., Hoyt, A. M., McNicol, G., Riley, W. J., Peng, S., Poulter, B., Malhotra, A., Cooley, S., Zhang, Z., Hong, S., Chen, Z., Zhu, Z., Raymond, P. A., Ciais, P., and Jackson, R. B.: The underappreciated importance of small wetlands in global methane emissions, Nat. Clim. Change, 1–5, https://doi.org/10.1038/s41558-026-02609-w, 2026b.
Li, M., Kort, E. A., Bloom, A. A., Wu, D., Plant, G., Gerlein-Safdi, C., and Pu, T.: Underestimated Dry Season Methane Emissions from Wetlands in the Pantanal, Environ. Sci. Technol., 58, 3278–3287, https://doi.org/10.1021/acs.est.3c09250, 2024.
Li, M., Li, F., Malhotra, A., Knox, S. H., Stern, R., and Jackson, R. B.: Key Environmental and Ecological Variables of Wetland CH4 and CO2 Fluxes Change With Warming, Earth's Future, 13, e2024EF005751, https://doi.org/10.1029/2024EF005751, 2025.
Li, M., Jackson, R. B., Saunois, M., Ciais, P., Poulter, B., Canadell, J. G., Patra, P. K., Tian, H., Zhang, Z., Fluet-Chouinard, E., Ouyang, Z., Zhang, T., Beerling, D. J., Belikov, D. A., Bousquet, P., Custodio, D., Chandra, N., Dou, X., Gedney, N., Hopcroft, P. O., Hoyt, A. M., Ichii, K., Ito, A., Jain, A. K., Jensen, K., Joos, F., Kleinen, T., Kondo, M., Li, F., Li, T., Liu, X., Maksyutov, S., Malhotra, A., Martinez, A., McDonald, K., Melton, J. R., Miller, P., Müller, J., Niwa, Y., Pan, S., Peng, S., Peng, C., Qin, Z., Raymond, P., Riley, W., Segers, A., Thompson, R. L., Tsuruta, A., Yi, X., Yuan, K., Zhang, W., Zheng, B., Zhu, Q., Zhu, Q., and Zhuang, Q.: Global natural wetland methane emissions (2000–2025) (Version v1), Zenodo [data set], https://doi.org/10.5281/zenodo.18870108, 2026.
Lin, X., Peng, S., Ciais, P., Hauglustaine, D., Lan, X., Liu, G., Ramonet, M., Xi, Y., Yin, Y., Zhang, Z., Bösch, H., Bousquet, P., Chevallier, F., Dong, B., Gerlein-Safdi, C., Halder, S., Parker, R. J., Poulter, B., Pu, T., Remaud, M., Runge, A., Saunois, M., Thompson, R. L., Yoshida, Y., and Zheng, B.: Recent methane surges reveal heightened emissions from tropical inundated areas, Nat. Commun., 15, 10894, https://doi.org/10.1038/s41467-024-55266-y, 2024.
Maksyutov, S., Oda, T., Saito, M., Janardanan, R., Belikov, D., Kaiser, J. W., Zhuravlev, R., Ganshin, A., Valsala, V. K., Andrews, A., Chmura, L., Dlugokencky, E., Haszpra, L., Langenfelds, R. L., Machida, T., Nakazawa, T., Ramonet, M., Sweeney, C., and Worthy, D.: Technical note: A high-resolution inverse modelling technique for estimating surface CO2 fluxes based on the NIES-TM–FLEXPART coupled transport model and its adjoint, Atmos. Chem. Phys., 21, 1245–1266, https://doi.org/10.5194/acp-21-1245-2021, 2021.
McNicol, G., Fluet-Chouinard, E., Ouyang, Z., Knox, S., Zhang, Z., Aalto, T., Bansal, S., Chang, K.-Y., Chen, M., Delwiche, K., Feron, S., Goeckede, M., Liu, J., Malhotra, A., Melton, J. R., Riley, W., Vargas, R., Yuan, K., Ying, Q., Zhu, Q., Alekseychik, P., Aurela, M., Billesbach, D. P., Campbell, D. I., Chen, J., Chu, H., Desai, A. R., Euskirchen, E., Goodrich, J., Griffis, T., Helbig, M., Hirano, T., Iwata, H., Jurasinski, G., King, J., Koebsch, F., Kolka, R., Krauss, K., Lohila, A., Mammarella, I., Nilson, M., Noormets, A., Oechel, W., Peichl, M., Sachs, T., Sakabe, A., Schulze, C., Sonnentag, O., Sullivan, R. C., Tuittila, E.-S., Ueyama, M., Vesala, T., Ward, E., Wille, C., Wong, G. X., Zona, D., Windham-Myers, L., Poulter, B., and Jackson, R. B.: Upscaling Wetland Methane Emissions From the FLUXNET-CH4 Eddy Covariance Network (UpCH4 v1.0): Model Development, Network Assessment, and Budget Comparison, AGU Adv., 4, e2023AV000956, https://doi.org/10.1029/2023AV000956, 2023.
Melton, J. R. and Arora, V. K.: Competition between plant functional types in the Canadian Terrestrial Ecosystem Model (CTEM) v. 2.0, Geosci. Model Dev., 9, 323–361, https://doi.org/10.5194/gmd-9-323-2016, 2016.
Murguia-Flores, F., Jaramillo, V. J., and Gallego-Sala, A.: Assessing methane emissions from tropical wetlands: Uncertainties from natural variability and drivers at the global scale, Global Biogeochem. Cy., 37, e2022GB007601, https://doi.org/10.1029/2022GB007601, 2023.
Nisbet, E. G., Manning, M. R., Dlugokencky, E. J., Michel, S. E., Lan, X., Röckmann, T., Denier van der Gon, H. A. C., Schmitt, J., Palmer, P. I., Dyonisius, M. N., Oh, Y., Fisher, R. E., Lowry, D., France, J. L., White, J. W. C., Brailsford, G., and Bromley, T.: Atmospheric Methane: Comparison Between Methane's Record in 2006–2022 and During Glacial Terminations, Glob. Biogeochem. Cycles, 37, e2023GB007875, https://doi.org/10.1029/2023GB007875, 2023.
Niwa, Y., Ishijima, K., Ito, A., and Iida, Y.: Toward a long-term atmospheric CO2 inversion for elucidating natural carbon fluxes: technical notes of NISMON-CO2 v2021.1, Prog. Earth Planet. Sci., 9, 42, https://doi.org/10.1186/s40645-022-00502-6, 2022.
Niwa, Y., Tohjima, Y., Terao, Y., Saeki, T., Ito, A., Umezawa, T., Yamada, K., Sasakawa, M., Machida, T., Nakaoka, S.-I., Nara, H., Tanimoto, H., Mukai, H., Yoshida, Y., Morimoto, S., Takatsuji, S., Tsuboi, K., Sawa, Y., Matsueda, H., Ishijima, K., Fujita, R., Goto, D., Lan, X., Schuldt, K., Heliasz, M., Biermann, T., Chmura, L., Necki, J., Xueref-Remy, I., and Sferlazzo, D.: Multi-observational estimation of regional and sectoral emission contributions to the persistent high growth rate of atmospheric CH4 for 2020–2022, Atmos. Chem. Phys., 25, 6757–6785, https://doi.org/10.5194/acp-25-6757-2025, 2025.
Parker, R. J., Boesch, H., McNorton, J., Comyn-Platt, E., Gloor, M., Wilson, C., Chipperfield, M. P., Hayman, G. D., and Bloom, A. A.: Evaluating year-to-year anomalies in tropical wetland methane emissions using satellite CH4 observations, Remote Sens. Environ., 211, 261–275, https://doi.org/10.1016/j.rse.2018.02.011, 2018.
Patra, P. K., Takigawa, M., Watanabe, S., Chandra, N., Ishijima, K., and Yamashita, Y.: Improved Chemical Tracer Simulation by MIROC4.0-based Atmospheric Chemistry-Transport Model (MIROC4-ACTM), SOLA, 14, 91–96, https://doi.org/10.2151/sola.2018-016, 2018.
Peng, S., Lin, X., Thompson, R. L., Xi, Y., Liu, G., Hauglustaine, D., Lan, X., Poulter, B., Ramonet, M., Saunois, M., Yin, Y., Zhang, Z., Zheng, B., and Ciais, P.: Wetland emission and atmospheric sink changes explain methane growth in 2020, Nature, 612, 477–482, https://doi.org/10.1038/s41586-022-05447-w, 2022.
Pu, T., Gerlein-Safdi, C., Xiong, Y., Li, M., Kort, E. A., and Bloom, A. A.: Berkeley-RWAWC: A New CYGNSS-Based Watermask Unveils Unique Observations of Seasonal Dynamics in the Tropics, Water Resour. Res., 60, e2024WR037060, https://doi.org/10.1029/2024WR037060, 2024.
Qu, Z., Jacob, D. J., Bloom, A. A., Worden, J. R., Parker, R. J., and Boesch, H.: Inverse modeling of 2010–2022 satellite observations shows that inundation of the wet tropics drove the 2020–2022 methane surge, P. Natl. Acad. Sci. USA, 121, e2402730121, https://doi.org/10.1073/pnas.2402730121, 2024.
Quinn, C. A., Colligan, T., Ward, E. J., East, J. D., Lim, Y., Lee, E., Koster, R. D., and Poulter, B.: Amazonia Wetland Methane Emission Decrease in 2023: Seasonal Forecasting of Global Wetlands Highlights Monitoring Targets in Critical Ecosystems, J. Adv. Model. Earth Syst., 17, e2025MS005510, https://doi.org/10.1029/2025MS005510, 2025.
Riley, W. J., Subin, Z. M., Lawrence, D. M., Swenson, S. C., Torn, M. S., Meng, L., Mahowald, N. M., and Hess, P.: Barriers to predicting changes in global terrestrial methane fluxes: analyses using CLM4Me, a methane biogeochemistry model integrated in CESM, Biogeosciences, 8, 1925–1953, https://doi.org/10.5194/bg-8-1925-2011, 2011.
Ringeval, B., Friedlingstein, P., Koven, C., Ciais, P., de Noblet-Ducoudré, N., Decharme, B., and Cadule, P.: Climate-CH4 feedback from wetlands and its interaction with the climate-CO2 feedback, Biogeosciences, 8, 2137–2157, https://doi.org/10.5194/bg-8-2137-2011, 2011.
Roberts, C. D., Senan, R., Molteni, F., Boussetta, S., Mayer, M., and Keeley, S. P. E.: Climate model configurations of the ECMWF Integrated Forecasting System (ECMWF-IFS cycle 43r1) for HighResMIP, Geosci. Model Dev., 11, 3681–3712, https://doi.org/10.5194/gmd-11-3681-2018, 2018.
Saunois, M., Stavert, A. R., Poulter, B., Bousquet, P., Canadell, J. G., Jackson, R. B., Raymond, P. A., Dlugokencky, E. J., Houweling, S., Patra, P. K., Ciais, P., Arora, V. K., Bastviken, D., Bergamaschi, P., Blake, D. R., Brailsford, G., Bruhwiler, L., Carlson, K. M., Carrol, M., Castaldi, S., Chandra, N., Crevoisier, C., Crill, P. M., Covey, K., Curry, C. L., Etiope, G., Frankenberg, C., Gedney, N., Hegglin, M. I., Höglund-Isaksson, L., Hugelius, G., Ishizawa, M., Ito, A., Janssens-Maenhout, G., Jensen, K. M., Joos, F., Kleinen, T., Krummel, P. B., Langenfelds, R. L., Laruelle, G. G., Liu, L., Machida, T., Maksyutov, S., McDonald, K. C., McNorton, J., Miller, P. A., Melton, J. R., Morino, I., Müller, J., Murguia-Flores, F., Naik, V., Niwa, Y., Noce, S., O'Doherty, S., Parker, R. J., Peng, C., Peng, S., Peters, G. P., Prigent, C., Prinn, R., Ramonet, M., Regnier, P., Riley, W. J., Rosentreter, J. A., Segers, A., Simpson, I. J., Shi, H., Smith, S. J., Steele, L. P., Thornton, B. F., Tian, H., Tohjima, Y., Tubiello, F. N., Tsuruta, A., Viovy, N., Voulgarakis, A., Weber, T. S., van Weele, M., van der Werf, G. R., Weiss, R. F., Worthy, D., Wunch, D., Yin, Y., Yoshida, Y., Zhang, W., Zhang, Z., Zhao, Y., Zheng, B., Zhu, Q., Zhu, Q., and Zhuang, Q.: The Global Methane Budget 2000–2017, Earth Syst. Sci. Data, 12, 1561–1623, https://doi.org/10.5194/essd-12-1561-2020, 2020.
Saunois, M., Martinez, A., Poulter, B., Zhang, Z., Raymond, P. A., Regnier, P., Canadell, J. G., Jackson, R. B., Patra, P. K., Bousquet, P., Ciais, P., Dlugokencky, E. J., Lan, X., Allen, G. H., Bastviken, D., Beerling, D. J., Belikov, D. A., Blake, D. R., Castaldi, S., Crippa, M., Deemer, B. R., Dennison, F., Etiope, G., Gedney, N., Höglund-Isaksson, L., Holgerson, M. A., Hopcroft, P. O., Hugelius, G., Ito, A., Jain, A. K., Janardanan, R., Johnson, M. S., Kleinen, T., Krummel, P. B., Lauerwald, R., Li, T., Liu, X., McDonald, K. C., Melton, J. R., Mühle, J., Müller, J., Murguia-Flores, F., Niwa, Y., Noce, S., Pan, S., Parker, R. J., Peng, C., Ramonet, M., Riley, W. J., Rocher-Ros, G., Rosentreter, J. A., Sasakawa, M., Segers, A., Smith, S. J., Stanley, E. H., Thanwerdas, J., Tian, H., Tsuruta, A., Tubiello, F. N., Weber, T. S., van der Werf, G. R., Worthy, D. E. J., Xi, Y., Yoshida, Y., Zhang, W., Zheng, B., Zhu, Q., Zhu, Q., and Zhuang, Q.: Global Methane Budget 2000–2020, Earth Syst. Sci. Data, 17, 1873–1958, https://doi.org/10.5194/essd-17-1873-2025, 2025.
Shu, S., Jain, A. K., and Kheshgi, H. S.: Investigating Wetland and Nonwetland Soil Methane Emissions and Sinks Across the Contiguous United States Using a Land Surface Model, Glob. Biogeochem. Cycles, 34, e2019GB006251, https://doi.org/10.1029/2019GB006251, 2020.
Spahni, R., Wania, R., Neef, L., van Weele, M., Pison, I., Bousquet, P., Frankenberg, C., Foster, P. N., Joos, F., Prentice, I. C., and van Velthoven, P.: Constraining global methane emissions and uptake by ecosystems, Biogeosciences, 8, 1643–1665, https://doi.org/10.5194/bg-8-1643-2011, 2011.
Stavert, A. R., Saunois, M., Canadell, J. G., Poulter, B., Jackson, R. B., Regnier, P., Lauerwald, R., Raymond, P. A., Allen, G. H., Patra, P. K., Bergamaschi, P., Bousquet, P., Chandra, N., Ciais, P., Gustafson, A., Ishizawa, M., Ito, A., Kleinen, T., Maksyutov, S., McNorton, J., Melton, J. R., Müller, J., Niwa, Y., Peng, S., Riley, W. J., Segers, A., Tian, H., Tsuruta, A., Yin, Y., Zhang, Z., Zheng, B., and Zhuang, Q.: Regional trends and drivers of the global methane budget, Glob. Change Biol., 28, 182–200, https://doi.org/10.1111/gcb.15901, 2022.
Stocker, B. D., Spahni, R., and Joos, F.: DYPTOP: a cost-efficient TOPMODEL implementation to simulate sub-grid spatio-temporal dynamics of global wetlands and peatlands, Geosci. Model Dev., 7, 3089–3110, https://doi.org/10.5194/gmd-7-3089-2014, 2014.
Thanwerdas, J., Saunois, M., Berchet, A., Pison, I., Vaughn, B. H., Michel, S. E., and Bousquet, P.: Variational inverse modeling within the Community Inversion Framework v1.1 to assimilate δ13C(CH4) and CH4: a case study with model LMDz-SACS, Geosci. Model Dev., 15, 4831–4851, https://doi.org/10.5194/gmd-15-4831-2022, 2022.
Tian, T., Yang, S., Høyer, J. L., Nielsen-Englyst, P., and Singha, S.: Cooler Arctic surface temperatures simulated by climate models are closer to satellite-based data than the ERA5 reanalysis, Commun. Earth Environ., 5, 111, https://doi.org/10.1038/s43247-024-01276-z, 2024.
Toet, S., Ineson, P., Peacock, S., and Ashmore, M.: Elevated ozone reduces methane emissions from peatland mesocosms, Glob. Change Biol., 17, 288–296, https://doi.org/10.1111/j.1365-2486.2010.02267.x, 2011.
Tsuruta, A., Aalto, T., Backman, L., Hakkarainen, J., van der Laan-Luijkx, I. T., Krol, M. C., Spahni, R., Houweling, S., Laine, M., Dlugokencky, E., Gomez-Pelaez, A. J., van der Schoot, M., Langenfelds, R., Ellul, R., Arduini, J., Apadula, F., Gerbig, C., Feist, D. G., Kivi, R., Yoshida, Y., and Peters, W.: Global methane emission estimates for 2000–2012 from CarbonTracker Europe-CH4 v1.0, Geosci. Model Dev., 10, 1261–1289, https://doi.org/10.5194/gmd-10-1261-2017, 2017.
Tyystjärvi, V., Markkanen, T., Backman, L., Raivonen, M., Leppänen, A., Li, X., Ojanen, P., Minkkinen, K., Hautala, R., Peltoniemi, M., Anttila, J., Laiho, R., Lohila, A., Mäkipää, R., and Aalto, T.: Future methane fluxes of peatlands are controlled by management practices and fluctuations in hydrological conditions due to climatic variability, Biogeosciences, 21, 5745–5771, https://doi.org/10.5194/bg-21-5745-2024, 2024.
Wang, F., Maksyutov, S., Tsuruta, A., Janardanan, R., Ito, A., Sasakawa, M., Machida, T., Morino, I., Yoshida, Y., Kaiser, J. W., Janssens-Maenhout, G., Dlugokencky, E. J., Mammarella, I., Lavric, J. V., and Matsunaga, T.: Methane Emission Estimates by the Global High-Resolution Inverse Model Using National Inventories, Remote Sens., 11, 2489, https://doi.org/10.3390/rs11212489, 2019.
Xu, X., Sharma, P., Shu, S., Lin, T.-S., Ciais, P., Tubiello, F. N., Smith, P., Campbell, N., and Jain, A. K.: Global greenhouse gas emissions from animal-based foods are twice those of plant-based foods, Nat. Food, 2, 724–732, https://doi.org/10.1038/s43016-021-00358-x, 2021.
Yuan, K., Zhu, Q., Li, F., Riley, W. J., Torn, M., Chu, H., McNicol, G., Chen, M., Knox, S., Delwiche, K., Wu, H., Baldocchi, D., Ma, H., Desai, A. R., Chen, J., Sachs, T., Ueyama, M., Sonnentag, O., Helbig, M., Tuittila, E.-S., Jurasinski, G., Koebsch, F., Campbell, D., Schmid, H. P., Lohila, A., Goeckede, M., Nilsson, M. B., Friborg, T., Jansen, J., Zona, D., Euskirchen, E., Ward, E. J., Bohrer, G., Jin, Z., Liu, L., Iwata, H., Goodrich, J., and Jackson, R.: Causality guided machine learning model on wetland CH4 emissions across global wetlands, Agric. For. Meteorol., 324, 109115, https://doi.org/10.1016/j.agrformet.2022.109115, 2022.
Yuan, K., Li, F., McNicol, G., Chen, M., Hoyt, A., Knox, S., Riley, W. J., Jackson, R., and Zhu, Q.: Boreal–Arctic wetland methane emissions modulated by warming and vegetation activity, Nat. Clim. Change, 14, 282–288, https://doi.org/10.1038/s41558-024-01933-3, 2024.
Yvon-Durocher, G., Allen, A. P., Bastviken, D., Conrad, R., Gudasz, C., St-Pierre, A., Thanh-Duc, N., and del Giorgio, P. A.: Methane fluxes show consistent temperature dependence across microbial to ecosystem scales, Nature, 507, 488–491, https://doi.org/10.1038/nature13164, 2014.
Zhang, Z., Zimmermann, N. E., Kaplan, J. O., and Poulter, B.: Modeling spatiotemporal dynamics of global wetlands: comprehensive evaluation of a new sub-grid TOPMODEL parameterization and uncertainties, Biogeosciences, 13, 1387–1408, https://doi.org/10.5194/bg-13-1387-2016, 2016.
Zhang, Z., Zimmermann, N. E., Calle, L., Hurtt, G., Chatterjee, A., and Poulter, B.: Enhanced response of global wetland methane emissions to the 2015–2016 El Niño-Southern Oscillation event, Environ. Res. Lett., 13, 074009, https://doi.org/10.1088/1748-9326/aac939, 2018.
Zhang, X., Xu, X., Jia, G., Poulter, B., and Zhang, Z.: Hiatus of wetland methane emissions associated with recent La Niña episodes in the Asian monsoon region, Clim. Dynam., 54, 4095–4107, 2020.
Zhang, Z., Poulter, B., Feldman, A. F., Ying, Q., Ciais, P., Peng, S., and Li, X.: Recent intensification of wetland methane feedback, Nat. Clim. Change, 13, 430–433, https://doi.org/10.1038/s41558-023-01629-0, 2023.
Zhang, Z., Poulter, B., Melton, J. R., Riley, W. J., Allen, G. H., Beerling, D. J., Bousquet, P., Canadell, J. G., Fluet-Chouinard, E., Ciais, P., Gedney, N., Hopcroft, P. O., Ito, A., Jackson, R. B., Jain, A. K., Jensen, K., Joos, F., Kleinen, T., Knox, S. H., Li, T., Li, X., Liu, X., McDonald, K., McNicol, G., Miller, P. A., Müller, J., Patra, P. K., Peng, C., Peng, S., Qin, Z., Riggs, R. M., Saunois, M., Sun, Q., Tian, H., Xu, X., Yao, Y., Xi, Y., Zhang, W., Zhu, Q., Zhu, Q., and Zhuang, Q.: Ensemble estimates of global wetland methane emissions over 2000–2020, Biogeosciences, 22, 305–321, https://doi.org/10.5194/bg-22-305-2025, 2025.
Zheng, B., Chevallier, F., Ciais, P., Yin, Y., and Wang, Y.: On the Role of the Flaming to Smoldering Transition in the Seasonal Cycle of African Fire Emissions, Geophys. Res. Lett., 45, 11998–12007, https://doi.org/10.1029/2018GL079092, 2018a.
Zheng, B., Chevallier, F., Ciais, P., Yin, Y., Deeter, M. N., Worden, H. M., Wang, Y., Zhang, Q., and He, K.: Rapid decline in carbon monoxide emissions and export from East Asia between years 2005 and 2016, Environ. Res. Lett., 13, 044007, https://doi.org/10.1088/1748-9326/aab2b3, 2018b.
Zheng, B., Chevallier, F., Yin, Y., Ciais, P., Fortems-Cheiney, A., Deeter, M. N., Parker, R. J., Wang, Y., Worden, H. M., and Zhao, Y.: Global atmospheric carbon monoxide budget 2000–2017 inferred from multi-species atmospheric inversions, Earth Syst. Sci. Data, 11, 1411–1436, https://doi.org/10.5194/essd-11-1411-2019, 2019.
Zhu, Q., Peng, C., Ciais, P., Jiang, H., Liu, J., Bousquet, P., Li, S., Chang, J., Fang, X., Zhou, X., Chen, H., Liu, S., Lin, G., Gong, P., Wang, M., Wang, H., Xiang, W., and Chen, J.: Interannual variation in methane emissions from tropical wetlands triggered by repeated El Niño Southern Oscillation, Global Change Biol., 23, 4706–4716, 2017.
Zhu, Q., Yuan, K., Li, F., Riley, W. J., Hoyt, A., Jackson, R., McNicol, G., Chen, M., Knox, S. H., Briner, O., Beerling, D., Gedney, N., Hopcroft, P. O., Ito, A., Jain, A. K., Jensen, K., Kleinen, T., Li, T., Liu, X., McDonald, K. C., Melton, J. R., Miller, P. A., Müller, J., Peng, C., Poulter, B., Qin, Z., Peng, S., Tian, H., Xu, X., Yao, Y., Xi, Y., Zhang, Z., Zhang, W., Zhu, Q., and Zhuang, Q.: Critical needs to close monitoring gaps in pan-tropical wetland CH4 emissions, Environ. Res. Lett., 19, 114046, https://doi.org/10.1088/1748-9326/ad8019, 2024.
Zhu, Q., Jacob, D. J., Yuan, K., Li, F., Runkle, B. R. K., Chen, M., Bloom, A. A., Poulter, B., East, J. D., Riley, W. J., McNicol, G., Worden, J., Frankenberg, C., and Halabisky, M.: Advancements and opportunities to improve bottom–up estimates of global wetland methane emissions, Environ. Res. Lett., 20, 023001, https://doi.org/10.1088/1748-9326/adad02, 2025.
Zona, D., Gioli, B., Commane, R., Lindaas, J., Wofsy, S. C., Miller, C. E., Dinardo, S. J., Dengel, S., Sweeney, C., Karion, A., Chang, R. Y.-W., Henderson, J. M., Murphy, P. C., Goodrich, J. P., Moreaux, V., Liljedahl, A., Watts, J. D., Kimball, J. S., Lipson, D. A., and Oechel, W. C.: Cold season emissions dominate the Arctic tundra methane budget, P. Natl. Acad. Sci. USA, 113, 40–45, https://doi.org/10.1073/pnas.1516017113, 2016.