the Creative Commons Attribution 4.0 License.
the Creative Commons Attribution 4.0 License.
 | 14 Jan 2026
A comprehensive rock glacier inventory for the Peruvian Andes (PRoGI): dataset, characterization and topoclimatic attributes
Katy Medina
Hairo León
Edwin Badillo-Rivera
Edwin Loarte
Xavier Bodín
José Úbeda
Rock glaciers are key periglacial landforms in high mountain systems, serving as indicators of permafrost, contributors to mountain hydrology, and sentinels of climate change. Despite their scientific and practical importance, detailed knowledge of their distribution, characteristics, and dynamics in the Peruvian Andes remains limited. This study presents the Peruvian Rock Glacier Inventory (PRoGI v1.0), – a comprehensive inventory of rock glaciers covering the entire Peruvian Andes, encompassing their spatial distribution, morphological attributes, and topoclimatic controls. Unlike previous local-scale studies, PRoGI v1.0 provides national-scale coverage using standardized methods aligned with International Permafrost Association (IPA) guidelines and updated data. Using sub-meter satellite imagery (Bing Maps 2024 and Google Earth 2017) and IPA classification standards, we mapped 2338 rock glaciers with a total area of 94.09 ± 0.05 km2. Approximately 31 % of these landforms were classified as active, 49 % as transitional, and 20 % as relict. They predominantly occur between ∼ 4416 and 5783 m a.s.l. (mean elevation ∼ 4999 m) on slopes averaging ∼ 20.7° (range 7–37°). Spatially, rock glaciers are concentrated in the southern Peruvian Andes, with sparse distribution in central and northern Peru. Most have a southern to southwestern aspect (predominantly S, SW, and SE-facing), and the lower limit of permafrost (indicated by the lowest active rock glacier fronts) is ∼ 3541 m a.s.l. Our inventory serves as a benchmark dataset that significantly advances the understanding and monitoring of mountain permafrost, and it provides a basis for assessing the hydrological importance of rock glaciers in the Peruvian Andes under climate change scenarios. The dataset is available at https://doi.org/10.1594/PANGAEA.983251 (Medina et al., 2025a).
- Article
(10451 KB) - Full-text XML
-
Supplement
(835 KB) - BibTeX
- EndNote


The periglacial environment, characterized by cold, non-glacial conditions, represents one of Earth's most dynamic and climate-sensitive landscapes. Dominated by freeze-thaw cycles, permafrost dynamics, and distinctive landforms such as patterned ground, solifluction lobes, and rock glaciers (French, 2017), these environments play a critical role in high-mountain hydrology, biodiversity, and geomorphology. Recent studies highlight their exceptional vulnerability to climate change, with rising temperatures driving permafrost degradation and destabilizing landforms across global mountain systems (Haeberli et al., 2017; IPCC, 2022). This warming trend is particularly evident in the tropical Andes, where elevations above 5000 m a.s.l. have warmed at ∼ 0.17 °C per decade since the mid-20th century (Aguilar-Lome et al., 2019), threatening water security and ecosystem stability.
Mountain permafrost, defined as ground remaining ≤ 0 °C for at least two consecutive years (Van Everdingen, 1998), underpins these systems. It stabilizes steep slopes, modulates groundwater flow, and sustains ecosystems (Gruber and Haeberli, 2007). However, mountain permafrost is highly sensitive to warming; rising temperatures lead to permafrost degradation and can trigger the release of stored greenhouse gases (Biskaborn et al., 2019). In the Andes, where glacial retreat has increased the relative importance of permafrost as a water resource, its hydrological role remains critical yet poorly quantified due to sparse observations in remote high-altitude areas.
Among periglacial landforms, rock glaciers serve as direct visual indicators of mountain permafrost, with their presence delineating the occurrence of ground ice and the approximate lower limits of discontinuous permafrost These ice-debris landforms, formed by the creep of ice-rich permafrost and shearing at depth, optionally exhibit steep fronts, lateral margins, and ridge-and-furrow surface topography (RGIK, 2023). Rock glaciers stand out as both geomorphological archives of past climate conditions and development history (Haeberli et al., 1999), and as vital water reservoirs. Comprising 15 %–70 % ice by volume (Halla et al., 2021; Haq and Baral, 2019), rock glaciers store substantial water equivalents in arid regions like the southern Peruvian Andes (Schaffer et al., 2019; Janke et al., 2017; Rangecroft et al., 2015). Their debris mantle confers thermal inertia through ventilation effects, buffering ground ice against short-term climate variability (Brighenti et al., 2021; Scapozza et al., 2011). This dual role as climate sentinels – providing insights into both contemporary climate change through velocity monitoring (Kääb et al., 2021) and Quaternary climate history through dating of their formation (Palacios et al., 2022) – and hydrological buffers makes rock glaciers indispensable for understanding long-term environmental change. It should be noted that while the origin of rock glaciers (permafrost creep vs. glacier-to-rock glacier transition) remains debated internationally, this paper focuses on their morphological characterization and distribution without addressing formation mechanisms.
Along the higher South American Andes (> 4000 m a.s.l.), studies in Argentina, Chile, and Bolivia have leveraged rock glacier inventories to map permafrost and assess water storage (Azócar and Brenning, 2010; Esper Angillieri, 2017; Falaschi et al., 2015; Rangecroft et al., 2015). However knowledge gaps still persist, in Peru: existing inventories are fragmented (Badillo-Rivera et al., 2021; León et al., 2021) and lacking standardized methods or detailed topoclimatic analyses. To address this, we present the Peruvian Rock Glacier Inventory (PRoGI v1.0), the first nationally comprehensive rock glacier dataset for the Peruvian Andes, compiled using the mapping standards of the International Permafrost Association's Action Group (IPA) on Rock Glacier Inventories and Kinematics (RGIK, 2023). By combining high-resolution remote sensing imagery with rigorous geospatial analysis, PRoGI v1.0 documents the distribution, morphology and climatic characteristics of rock glaciers across Peru.
This new dataset enables advances in permafrost modelling and can be integrated into water resources assessments and disaster risk management efforts in the Peruvian Andes by environmental authorities (e.g. National Water Authority (ANA), National Center for Estimation, Prevention, and Disaster Risk Reduction (CENEPRED). In addition, by adhering to standardized IPA criteria, the inventory is interoperable with other international databases, representing a significant step toward a global rock glacier database.
The Peruvian Andes (spanning ∼ 4 to 18° S and 80 to ∼ 69° W) are the central sector of the tropical Andes, a mountain range that plays a critical role in regional hydrology and climate regulation (Vuille et al., 2018). This region is characterized by dramatic topography, with elevations reaching 6757 m a.s.l. on Nevado Huascarán, over an area of approximately 308 124 km2 (about 30 % of Peru's territory; INAIGEM, 2023). The climate of the Peruvian Andes is highly heterogeneous shaped by global atmospheric circulation and local topography. The eastern (Amazon-facing) slopes of the Andes receive moist air masses from the Amazon Basin, resulting in steep precipitation gradients (up to ∼ 1100 mm yr−1 in windward areas) and generally humid conditions. In contrast, the western slopes are much drier and colder, often receiving less than ∼ 500 mm yr−1, due to the rain-shadow effect of the Andes (Garreaud, 2009). These sharp climatic gradients, combined with the extreme elevation range, create a mosaic of microclimates that influence the distribution and characteristics of periglacial landforms (including rock glaciers).
Bonshoms et al. (2020) divided the Peruvian Andes into four climatological subregions (Fig. 1) based on precipitation and temperature regimes. We adopt these four subregions as the basis for our analysis, identifying them as the Northern Wet Outer Tropics (NWOT), Northern Dry Outer Tropics (NDOT), Southern Wet Outer Tropics (SWOT) and Southern Dry Outer Tropics (SDOT). Each subregion encompasses the mountains covered by current glaciers as well as surrounding highland areas below the glaciers. It is important to emphasize that this regional framework is based solely on climatic criteria and does not incorporate other factors.
In addition, the four subregions have distinct lithological characteristics that influence the potential for rock glacier formation. The SDOT subregion is dominated by Miocene-Neogene volcanic-sedimentary sequences (Nm-vs), which produce abundant block debris for rock glacier development. The NWOT subregion is mainly characterized by Neoproterozoic schists and gneisses (NP-esq,gn), which break down into competent debris. The NDOT contains important Paleogene-Neogene volcanic and sedimentary formations (PN-vs), while the SWOT mainly sits on Ordovician metasedimentary rocks (O-ms).
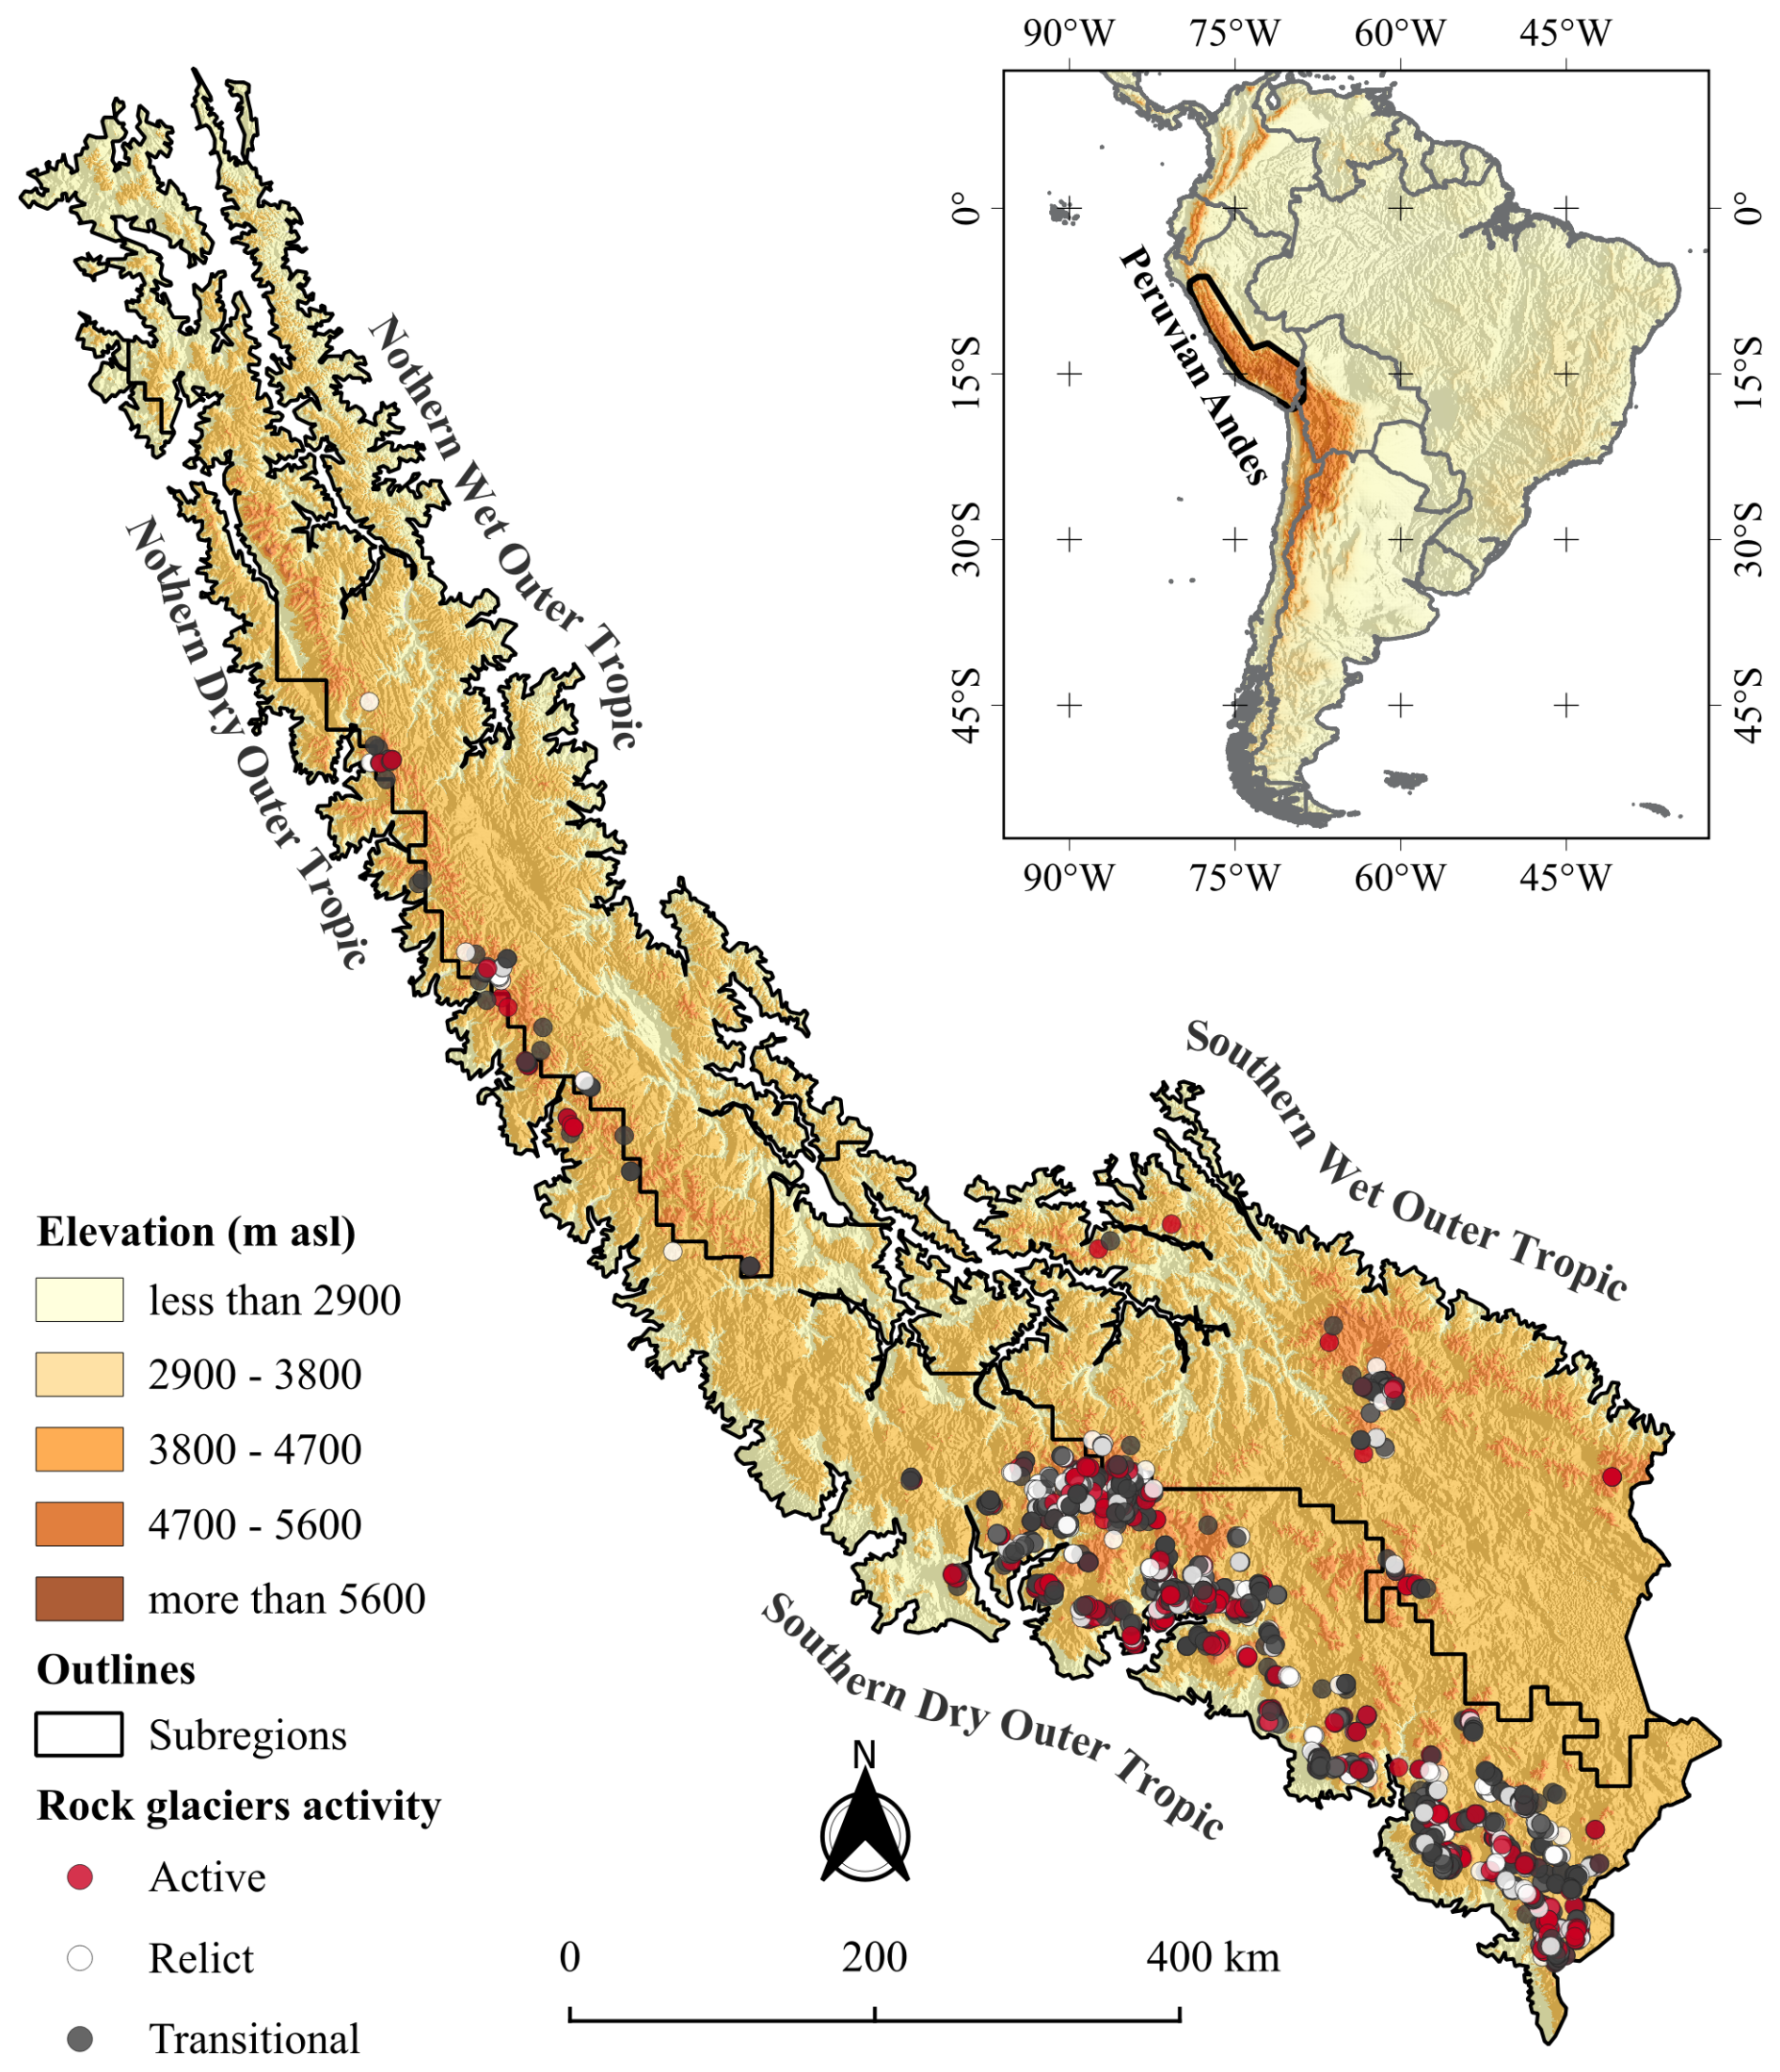
Figure 1Distribution of active, transitional and relict rock glaciers in the Peruvian Andes overlaid on a 30 m ALOS DEM. The inset map highlights the location of the study area in South America.
3.1 Data sources
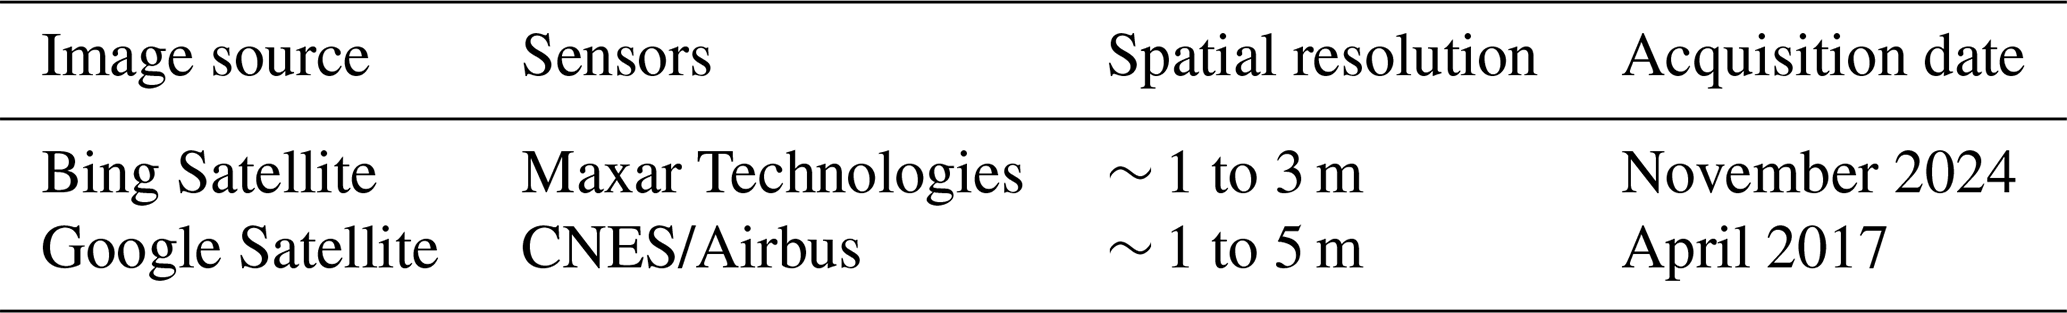
The rock glacier inventory was manually compiled using high-resolution satellite imagery. Bing Maps Aerial imagery served as the primary data source for mapping, accessed within QGIS 3.40 using the QuickMapServices plugin. Google Satellite imagery was used as a supplementary source in areas where Bing imagery was unavailable or affected by cloud cover, snow obstruction, or poor image quality. This combination ensured nearly complete high-resolution coverage of the Andes of Peru and facilitated consistent mapping and geodatabase creation (Rangecroft et al., 2014; Jones et al., 2018a, 2021). The imagery has high spatial resolution, allowing detailed identification of rock glacier features. In a few cases, we also consulted historical Google Earth images (from earlier dates or different seasons) to identify rock glaciers in locations where seasonal snow cover, cloud or shadows hid the landforms in the primary imagery (Pandey, 2019). Table 1 summarizes the main imagery sources and acquisition dates used for rock glacier mapping.
3.2 Topoclimatic datasets
To analyse the topographic and climatic context of rock glacier distribution, we compiled several datasets:
-
Digital Elevation Model (DEM): we used the 12.5 m-resolution ALOS PALSAR for Peru from Japan Aerospace Exploration Agency DEM (Rosenqvist et al., 2007) to derive topographic attributes (elevation, slope, aspect) for each rock glacier.
-
Climate data (temperature and precipitation): Mean Annual Air Temperature (MAAT) and Annual Precipitation (AP) were obtained from the CHELSA 2.1 climate dataset at 0.1° (∼ 10 km) resolution (Karger et al., 2017). We extracted the 1979–2013 climatology (CHELSA provides high-resolution modelled climate surfaces). The CHELSA data have been widely used for characterizing rock glaciers climates in regional studies and show good correlation with ground meteorological observations (Anderson-Teixeira et al., 2015). These temperature and precipitation values allowed us to approximate the climatic regime (e.g., cold-dry vs warm-wet) in each rock glacier's location (Drewes et al., 2018; Esper Angillieri, 2017; Haq and Baral, 2019; Rangecroft et al., 2014).
-
Permafrost model data: we included Mean Annual Ground Temperature (MAGT) data for the period 2000–2016 from Obu et al. (2019) as a supplementary descriptive variable. We acknowledge that this global model has not been validated for the tropical Andes and carries significant uncertainty in mountain regions due to unresolved local heterogeneity. The data were used for broad-scale context only; morphological classification took precedence when discrepancies occurred with modelled temperatures.
All spatial datasets were co-registered and clipped to the extent of the Peruvian Andes. We used these layers to extract topoclimatic attributes (elevation, slope, aspect, MAAT, AP, MAGT) for each rock glacier, which are analysed in Sect. 5.3.
3.3 Auxiliary data
To distinguish rock glaciers from other ice-related landforms, we also utilized existing inventories of glaciers in Peru. In particular, we employed data from the National Inventory of Glaciers and Glacial Lakes (INGLOG II) of Peru (INAIGEM, 2023), which provides outlines of both clean glaciers and debris-covered glaciers. By overlapping the glacier outlines from INGLOG II on the rock glaciers polygons, it allows avoid mistaking debris-covered glaciers for rock glaciers during mapping. This additional reference was especially useful in complex high-mountain environments where rock glaciers are often on the same slope as present-day glaciers. In the database, the cases where a rock glacier is immediately downstream of a glacier was flagged. to ensure no double-counting or misclassification occurred.
4.1 Identification and mapping of rock glaciers
The mapping approach followed the official guidelines of the International Permafrost Association (IPA) Action Group on Rock Glacier Inventories and Kinematics (RGIK) for inventorying rock glaciers (RGIK, 2023), with specific adaptations for the scale and context of our national inventory:
-
In accordance with the mandatory requirements of RGIK, we compiled two vectors (in *. gpkg format), the first containing the primary markers for each rock glacier unit or system and the second, the extended footprint of the polygonal delineation for each rock glacier including its associated attributes.
-
In the activity classification approach, while RGIK recommends six activity classes (including “uncertain” categories), we employed a simplified three-class system (active, transitional, and relict) due to the extensive spatial coverage required for a practically implemented system.
-
The scheme for the inventory attributes has been partially adopted from the RGIK guidelines, as they have been complemented with topoclimatic variables for hydrological and climatic applications.
To ensure thorough coverage and consistency, we implemented a systematic mapping workflow following the next steps (Sect. 4.1.1–4.1.3).
4.1.1 Grid-based systematic mapping
The entire study region was divided into a grid of 50 × 50 km cells to cover the Peruvian Andes uniformly. Each grid cell was examined in detail using the high-resolution satellite imagery described in Sect. 3.1, following the established protocol of primary Bing imagery with Google Earth supplementation for areas with visibility issues. This grid-based approach ensured that no areas were overlooked, and it helped organize the work among the mapping team. This grid-based approach ensured that no areas were overlooked, and it helped organize the work among the mapping team.
4.1.2 Digitization protocol
When a rock glacier was identified in the imagery, we delineated it as a polygon following a consistent digitization criteria follow RGIK guidelines. Each rock glacier was assigned a unique identifier derived from its geographic coordinates (specifically, an ID based on the centroid latitude and longitude, e.g., “RGU154384S0729196W” as illustrated in the data dictionary). We then manually digitized a polygon to capture the entire rock glacier landform. The mapping of each feature included:
-
Upslope extent: the rooting zone or talus contributing area, depending on the type of connection with the upslope, in the case of a rock glacier unit overlain by another, its upper boundary is shared with the extended footprint of the upper unit, and the same is true for a rock glacier that is partially covered by another relief form (e.g., a moraine system, a slope). In all other cases, the upper part of the lateral margins was taken as a reference.
-
Main body: the central part of the rock glacier characterized by its typical surface morphology (e.g., longitudinal/latitudinal ridges and furrows, or a lobate debris structure).
-
Frontal and lateral margins: the steep front (toe) and sides of the rock glacier, which often have sharper convex profiles or abrupt edges separating the landform from surrounding terrain.
For complex frontal and lateral margins morphology cases, we applied RGIK's conservative approach specifically for “exaggerated” fronts and lateral margins (RGIK, 2023), where the landform boundary was drawn along collapse features or the farthest ridge, limiting extension to 50 m beyond discernible boundaries. For “truncated” fronts, we draw the contour maintaining an almost constant distance from the restricted contour or as a continuation of the visible extended side margins to avoid overestimation. Figure 2 illustrates our mapping approach for both straightforward and challenging cases. Figure 2a shows a classical rock glacier with well-defined margins and typical morphology, while Fig. 2b presents a complex case where mapping uncertainties required careful interpretation. In challenging situations, where frontal morphology was ambiguous due to bedrock ledges or lateral margins crossed morphological flow lines, we acknowledged the mapping difficulty and applied conservative delineation based on visible geomorphological evidence. After delineation, the date and source of the imagery used for each polygon was recorded, to document the temporal coverage of the inventory. Table 2 includes an “Imagery Date/Source” attribute for each entry.
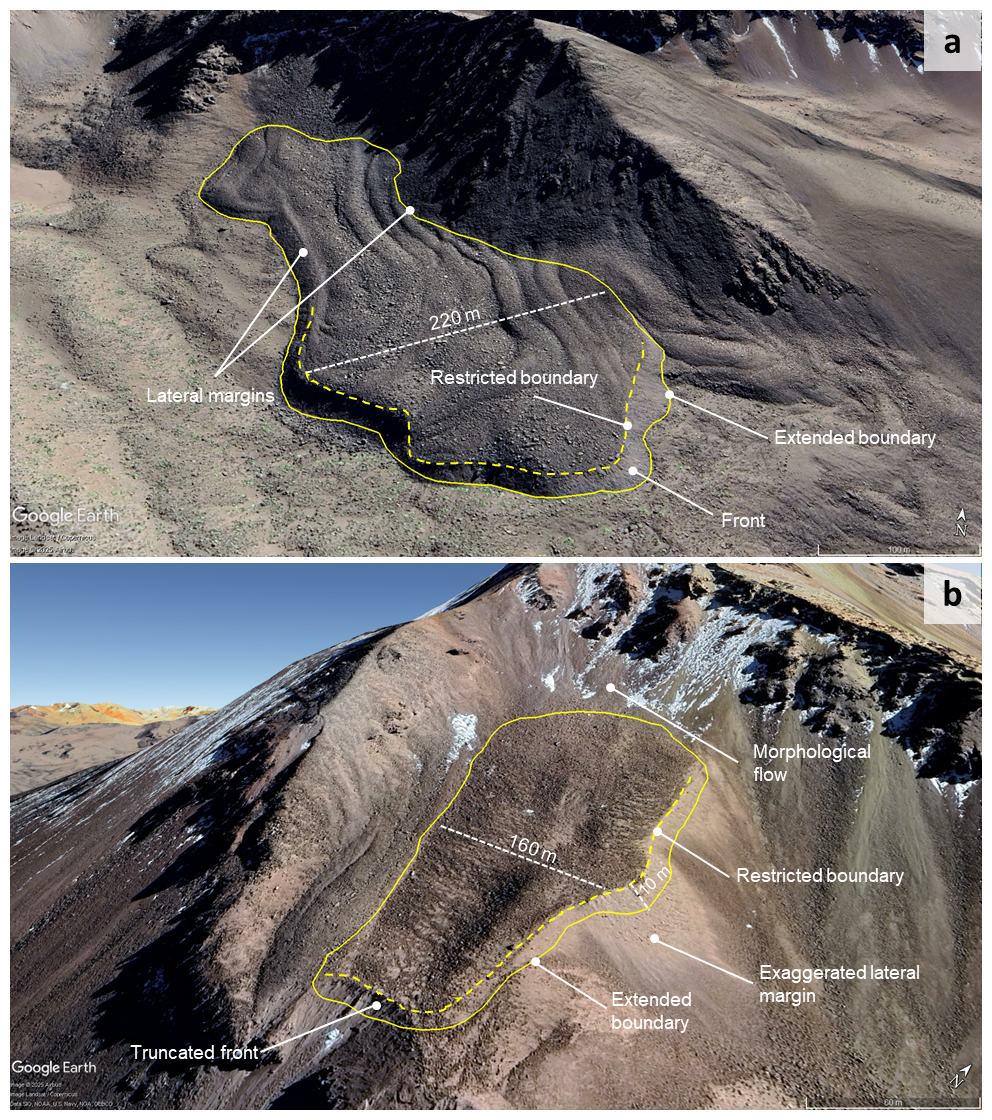
Figure 2Examples of rock glacier mapping: (a) Classical case with well-defined morphology ( S, W) showing clear frontal and lateral margins; Complex case with mapping challenges ( S, W) showing truncated frontal morphology and uncertain lateral boundaries. Imagery © 2025 CNES/Airbus.
4.1.3 Quality Control
After initial mapping, we undertook a quality control process to improve the accuracy and completeness of the inventory. First, we assigned a certainty level to each mapped polygon: “1” for high-confidence rock glaciers and “0” for features where identification was uncertain. Approximately 12 % of the polygons (281 features) were flagged as low certainty due to factors such as snow cover, shadows, or borderline morphology that made interpretation difficult. All low-certainty cases were subjected to careful review and resolution: features that could be confidently identified as rock glaciers after expert review were retained in the inventory, while those that remained ambiguous were excluded. This approach ensured that only confidently identified landforms were included in the final dataset.
To be applied during this quality control stage, four possible review operations were defined, similar to the procedure described by Sun et al. (2024):
-
Remain: no change needed – the polygon accurately delineates a rock glacier and is confirmed as correct.
-
Remove: delete polygon if it was determined not to be a rock glacier (e.g., a misidentified landform such as a solifluction lobe or a pronival rampart). These misidentified features are usually associated with the downslope margins of perennial or semi-permanent snow patches (Matthews et al., 2011) and can exhibit superficial ridge-like forms due to processes like snow push, solifluction, or rockfalls from nearby scarps, which slide over frozen snow and accumulate at the base of the slab. However, they lack the internal ice thickness and other diagnostic traits of rock glaciers (Colucci et al., 2016). We also cross-checked the national glacier inventory (INGLOG II) to ensure that any feature in question was not actually a debris-covered glacier.
-
Refine: modify the polygon if the feature is indeed a rock glacier but our original delineation missed part of it or included extraneous parts. This could involve adjusting boundaries to more closely match the visible geomorphological edges.
-
Retrieve: add a new polygon for any previously overlooked rock glacier. During the review, some subtle or small rock glaciers that had been missed in the first pass was discovered, particularly in areas of complex terrain or where imagery was less clear. In total, 32 rock glaciers were “retrieved” in this manner. Additionally, if a single mapped polygon was found to contain multiple adjacent rock glaciers (i.e., a compound feature), it was split into separate units when distinct lateral boundaries could be discerned in the imagery.
Each low-certainty or complex case was re-examined by the team, and the appropriate operation (remain, remove, refine, or retrieve) was applied. After this systematic check, a cleaned and verified set of rock glacier polygons was achieved. The final inventory includes only features that were confidently identified as rock glaciers after this rigorous quality control process. The quality control review significantly improved the inventory's reliability, reducing spurious inclusions and omissions.
4.2 Geomorphological identification and classification of rock glaciers
Our classification approach builds upon the RGIK (2023) framework while implementing a simplified three-class activity system suited to national-scale mapping. When classifying rock glaciers by activity state, we employed a morphological scheme based on Barsch (1996) and RGIK guidelines (RGIK, 2023), distinguishing three categories: active, transitional, and relict (Fig. 3).
This simplified system addresses the practical challenges of large-scale inventorying while maintaining scientific rigor through our consensus validation process. In the absence of kinematic data, active rock glaciers are defined as landforms containing interstitial ice (Roer et al., 2005; Wirz et al., 2016) and typically exhibit pronounced ridges and furrows (Charbonneau and Smith, 2018; Sattler, 2016), frontal slopes steeper than 30–35°, and generally lack vegetation (Tielidze et al., 2023). Transitional rock glaciers may still contain ice but have ceased moving, displaying gentler frontal slopes (< 30–35°), subdued microtopography (Kellerer-Pirklbauer et al., 2012), and may support some vegetation (Ahumada et al., 2014; Brenning, 2005). Relict rock glaciers show no evidence of recent movement, characterized by collapse structures, subtle micro-relief (Colucci et al., 2016), and often vegetated surfaces at lower elevations (Abdullah and Romshoo, 2024; RGIK, 2023; Scotti et al., 2013; Baroni et al., 2004).
We prioritized frontal slope characteristics and overall landform preservation as primary classification criteria, as these show the most consistent relationship with activity status across different environmental settings. Ridge and furrow topography was considered as supporting evidence where clearly visible, acknowledging that this feature is optional in RGIK guidelines but has demonstrated utility in Andean contexts. Vegetation presence was used cautiously as a secondary indicator, with recognition of its limited applicability in arid high-elevation environments where vegetation may be absent regardless of activity status (RGIK, 2023).
For activity classification uncertainties, we implemented a consensus-based approach where borderline cases were reviewed by at least three team members. This process effectively internalized the classification uncertainty that RGIK addresses through “uncertain” categories, providing a statistically robust alternative for large-scale inventories. This consensus approach specifically addressed the high inter-operator variability in activity classification reported in the literature (Brardinoni et al., 2019), ensuring consistent application of our modified three-class system across the entire inventory.
These criteria guided the visual interpretation of each landform and were consistently applied to ensure the classification of activity state and morphology in the inventory was as objective as possible. Any marginal cases were noted for further scrutiny (often with assistance from the external reviewers, as described below).
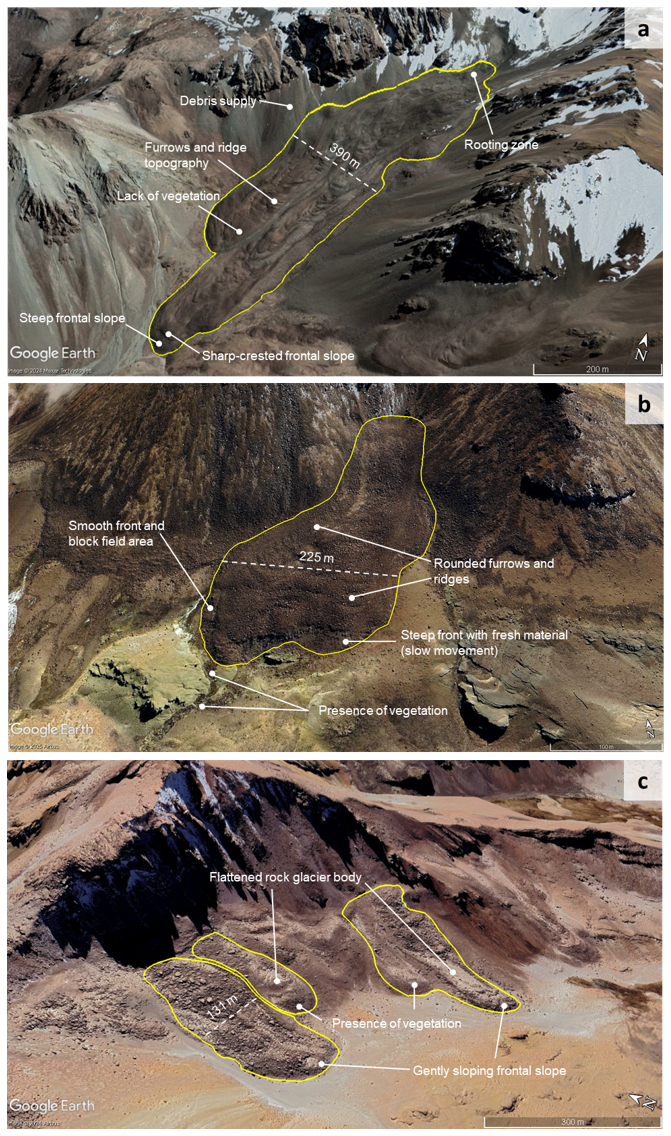
Figure 3Rock glacier mapping and classification examples (using images from Google Earth): (a) active rock glaciers ( S, W); (b) transitional rock glacier ( S, W); and (c) relict rock glacier ( S, W). Yellow outline indicates the rock glacier extent and dashes white line illustrates the width. Imagery © 2024 Maxar Technologies and © 2025 CNES/Airbus.
4.3 Topoclimatic features
For each rock glacier, a suite of topographic characteristics and climatic variables was extracted. Topographic attributes include geographic coordinates (latitude and longitude), minimum, mean and maximum elevations, and mean slope and aspect in the rock glacier centroid. These parameters were derived in QGIS by superimposing the mapped rock glacier polygons on a digital elevation model (DEM) and applying zonal statistics for each polygon. The minimum elevation corresponds to the lowest point within a rock glacier's outline (generally at the front), while the maximum elevation is the highest point (typically at the rooting zone). The mean elevation was calculated as the midpoint between these two extremes. Similarly, mean slope was obtained by averaging within each polygon the DEM-derived slope and aspect values. The mean aspect was calculated using a circular mean transformation (using sine and cosine components) rather than a simple arithmetic average. The surface area of each rock glacier (in km2) was computed using QGIS geometry tools. The smallest rock glacier included in the inventory has an area of 0.001 km2. While the RGIK (2023) guidelines suggest 0.01 km2 as a general minimum area threshold for global inventories, we included smaller features because these smaller rock glaciers (14 % of our inventory) provide crucial information on permafrost distribution at lower altitudinal limits and under marginal conditions. The climatic variables considered were mean annual air temperature (MAAT), mean annual ground temperature (MAGT), annual precipitation (AP), and potential incoming solar radiation (PISR). These data were obtained by overlaying the rock glacier polygons on the respective climate raster layers and extracting the mean value of all pixels within each polygon for each variable. Each rock glacier was thus attributed with an average MAAT, MAGT, AP and PISR based on its location. All the above topographic and climatic parameters were compiled into the rock glacier inventory's attribute table (Table 2).
Finally, it is important to mention that the MAGT values obtained from the Obu et al. (2019) model have a limited capacity to capture the small-scale heterogeneity of mountain permafrost distribution, particularly in the tropical Andes; the lack of regional validation and the scarce field verification imply that the modeled values should be considered indicative, not definitive.
4.4 Inventory compilation and validation
The mapping and review process was carried out by a team consisting of five primary cartographers (the core authors of this study) and sixteen independent expert reviewers with experience in rock glacier inventories. The inventory was divided into regional sub-areas, and one or more reviewers were assigned to each sub-area for an external check. A complete list of expert reviewers and their affiliations is provided in Table S1 (Supplement). The reviewers examined the draft inventory and provided feedback, marking any polygons that might require one of the four quality-control operations described above (remain, remove, refine, retrieve).
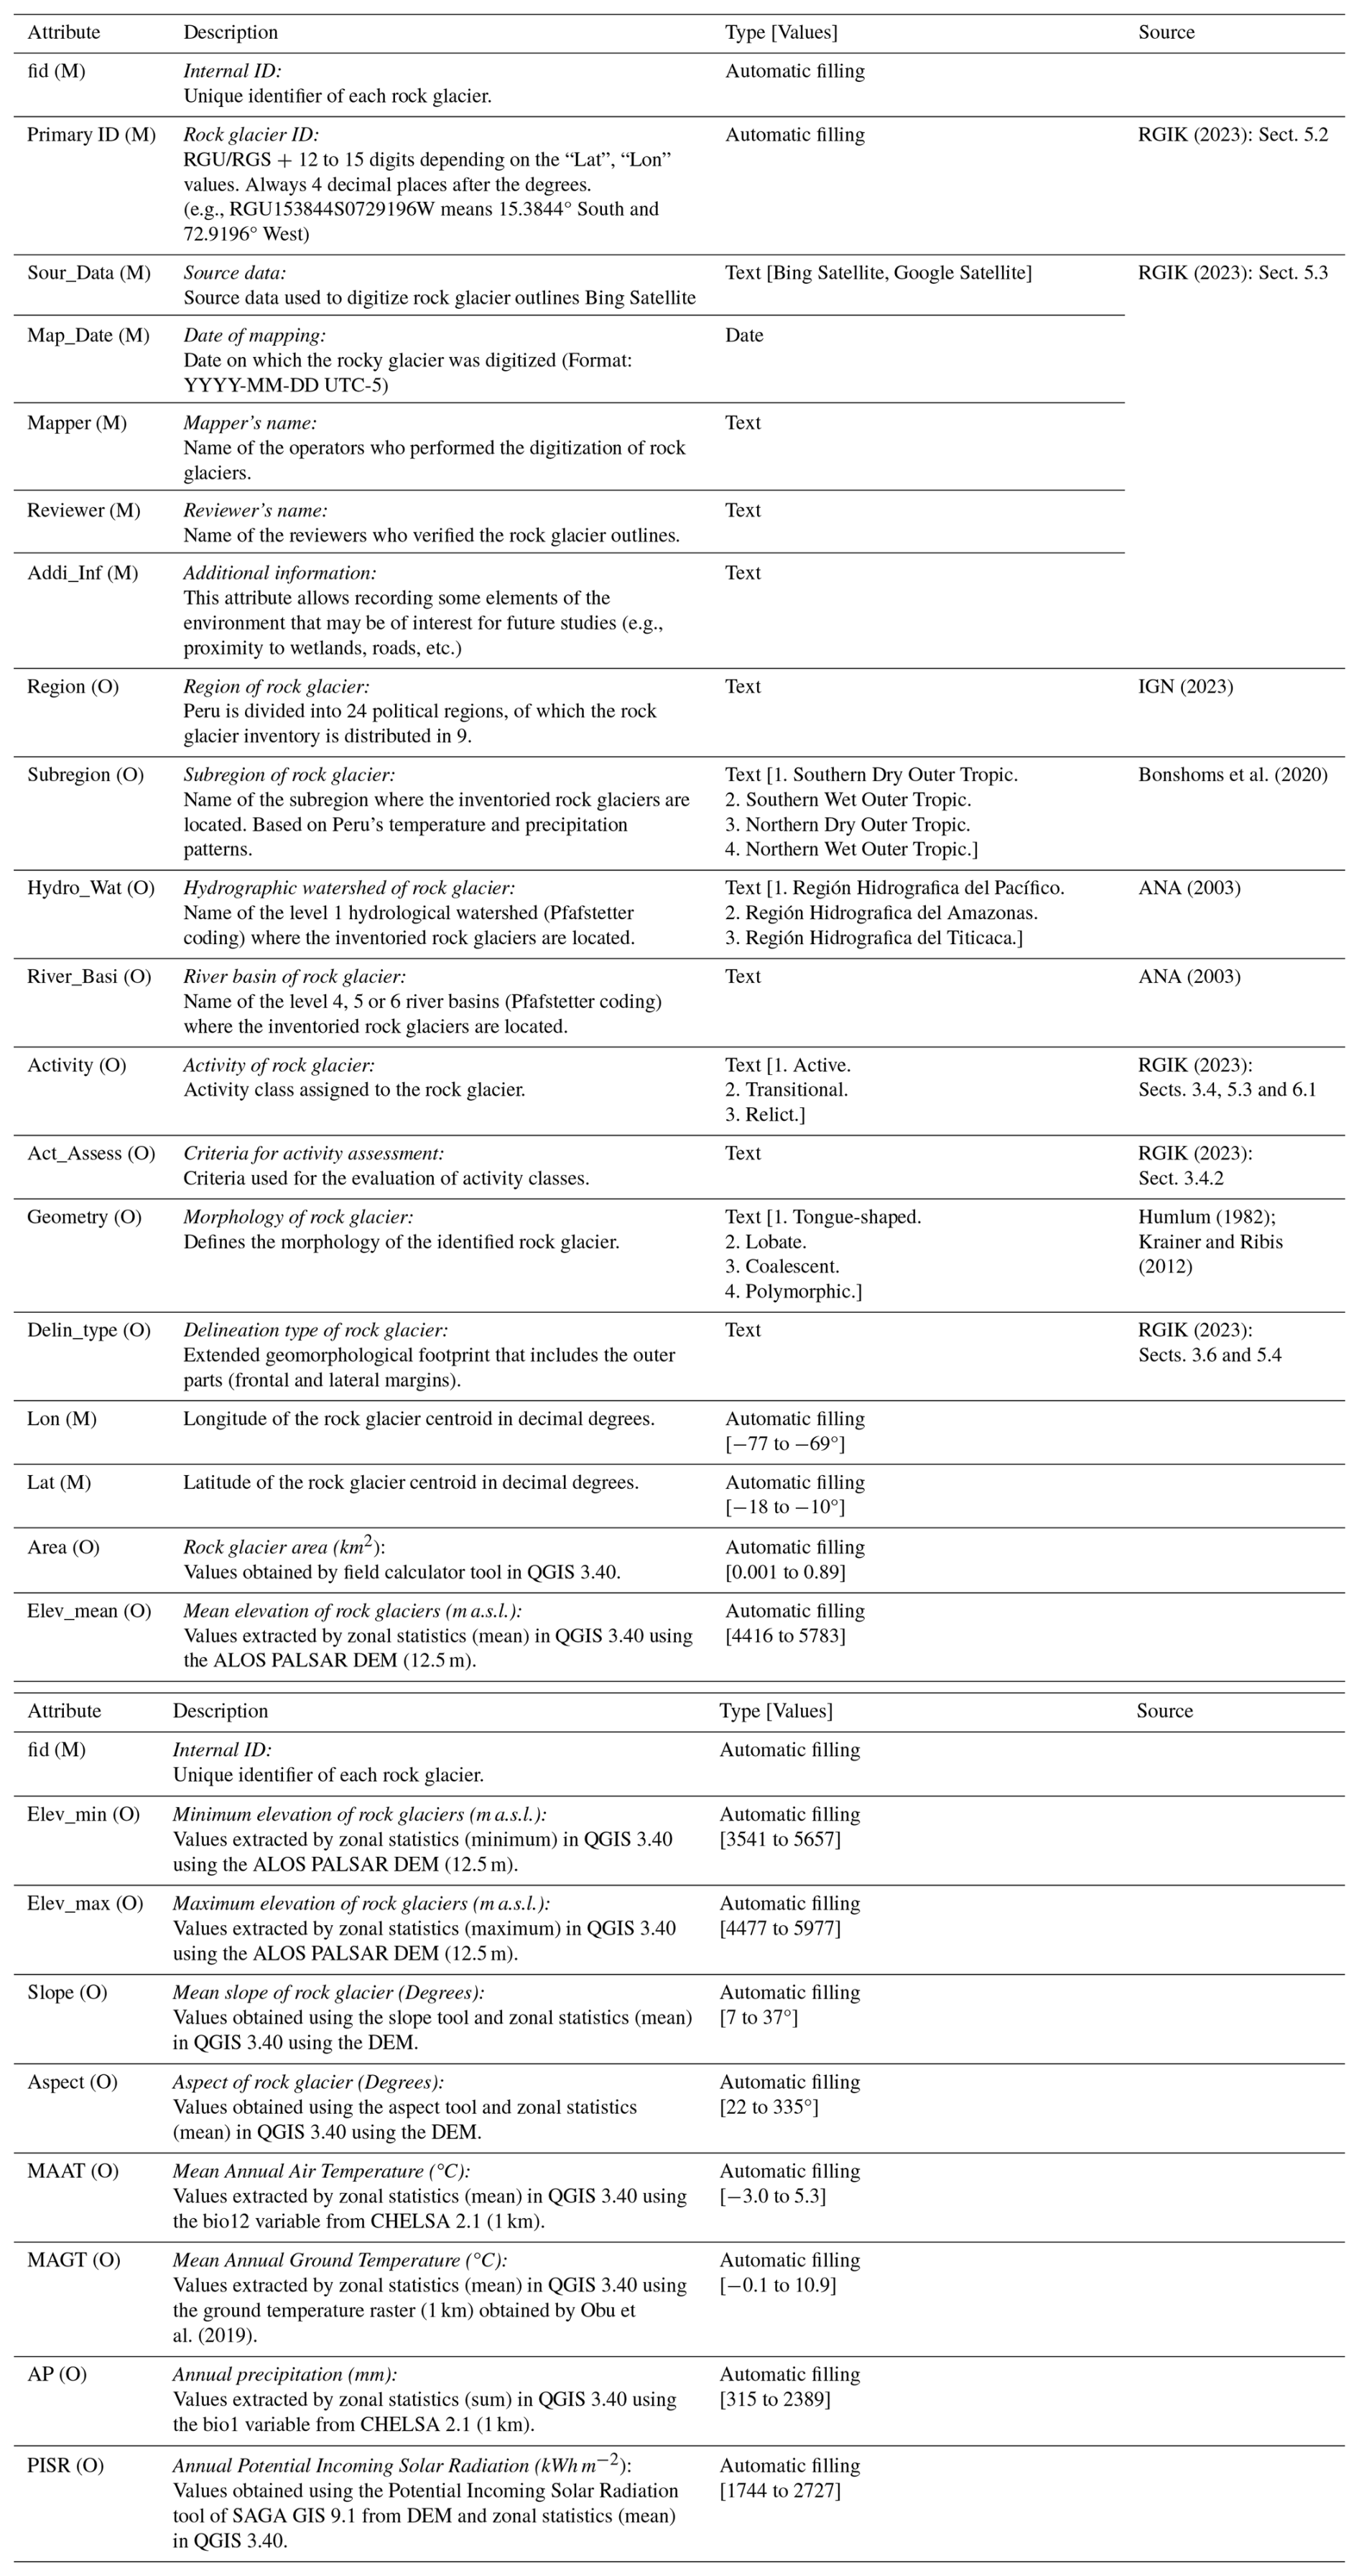
Each suggested change was discussed and then implemented by the mapping team, ensuring that the final decisions were internally consistent across the entire inventory. When the characteristics of a particular rock glacier were uncertain or ambiguous in Bing imagery, we used Google Earth's high-resolution imagery as a supplementary perspective to confirm features like flow structures or boundaries. After incorporating all reviewer comments and finalizing the polygon delineations, we compiled the attribute table for the inventory. For each rock glacier unit, we recorded a comprehensive set of attributes (see Table 3 for full definitions). All attributes were recorded in a GIS vector and cross-checked for consistency. The attribute schema is outlined in Table 3 for reference. This rich database structure ensures that PRoGI v1.0 is not just a collection of polygons, but a data-rich inventory that can be queried for spatial patterns, compared with other inventories, and used for quantitative analyses of Peru's rock glaciers.
Table 2Detailed attribute table of polygons representing rock glaciers. M: mandatory attribute and O: optional attribute.
4.5 Geometric classification
Our geometric classification aligns with the RGIK hierarchical framework, distinguishing between Rock Glacier Units (RGUs) representing individual landforms and Rock Glacier Systems (RGS) comprising multiple coalesced units. This approach addresses mapping consistency for complex morphologies while providing insights into debris supply patterns and topographic controls.
For simple/monomorphic landforms (RGUs), we classified geometry based on planform characteristics:
-
Tongue-shaped: length-to-width ratio > 1, indicating downslope-oriented flow (Harrison et al., 2008; Humlum, 1982).
-
Lobate: length-to-width ratio < 1, characteristic of cirque-floor or slope-base accumulation (Humlum, 1982).
For complex configurations (RGS), we identified:
-
Coalescent: composite features formed by convergence of multiple tongue-shaped lobes with discernible individual sources (Humlum, 1982).
-
Polymorphic: heterogeneous assemblages displaying multiple geometric forms within a single system, often indicating complex developmental histories (Falaschi et al., 2015).
The distinction between units and systems was based on the discernibility of individual frontal and lateral margins, debris source differentiation, and spatial separation of constituent lobes. This geometric classification, documented through our RGIK-compliant primary markers, provides insights into:
-
Debris supply mechanisms and source area characteristics
-
Topographic constraints on rock glacier development.
-
Spatial organization of periglacial processes in different Andean environments.
The specific criteria and illustrative examples for geometric classification are provided in Table 3.
Table 3Criteria for the classification of rock glaciers based on their geometry.
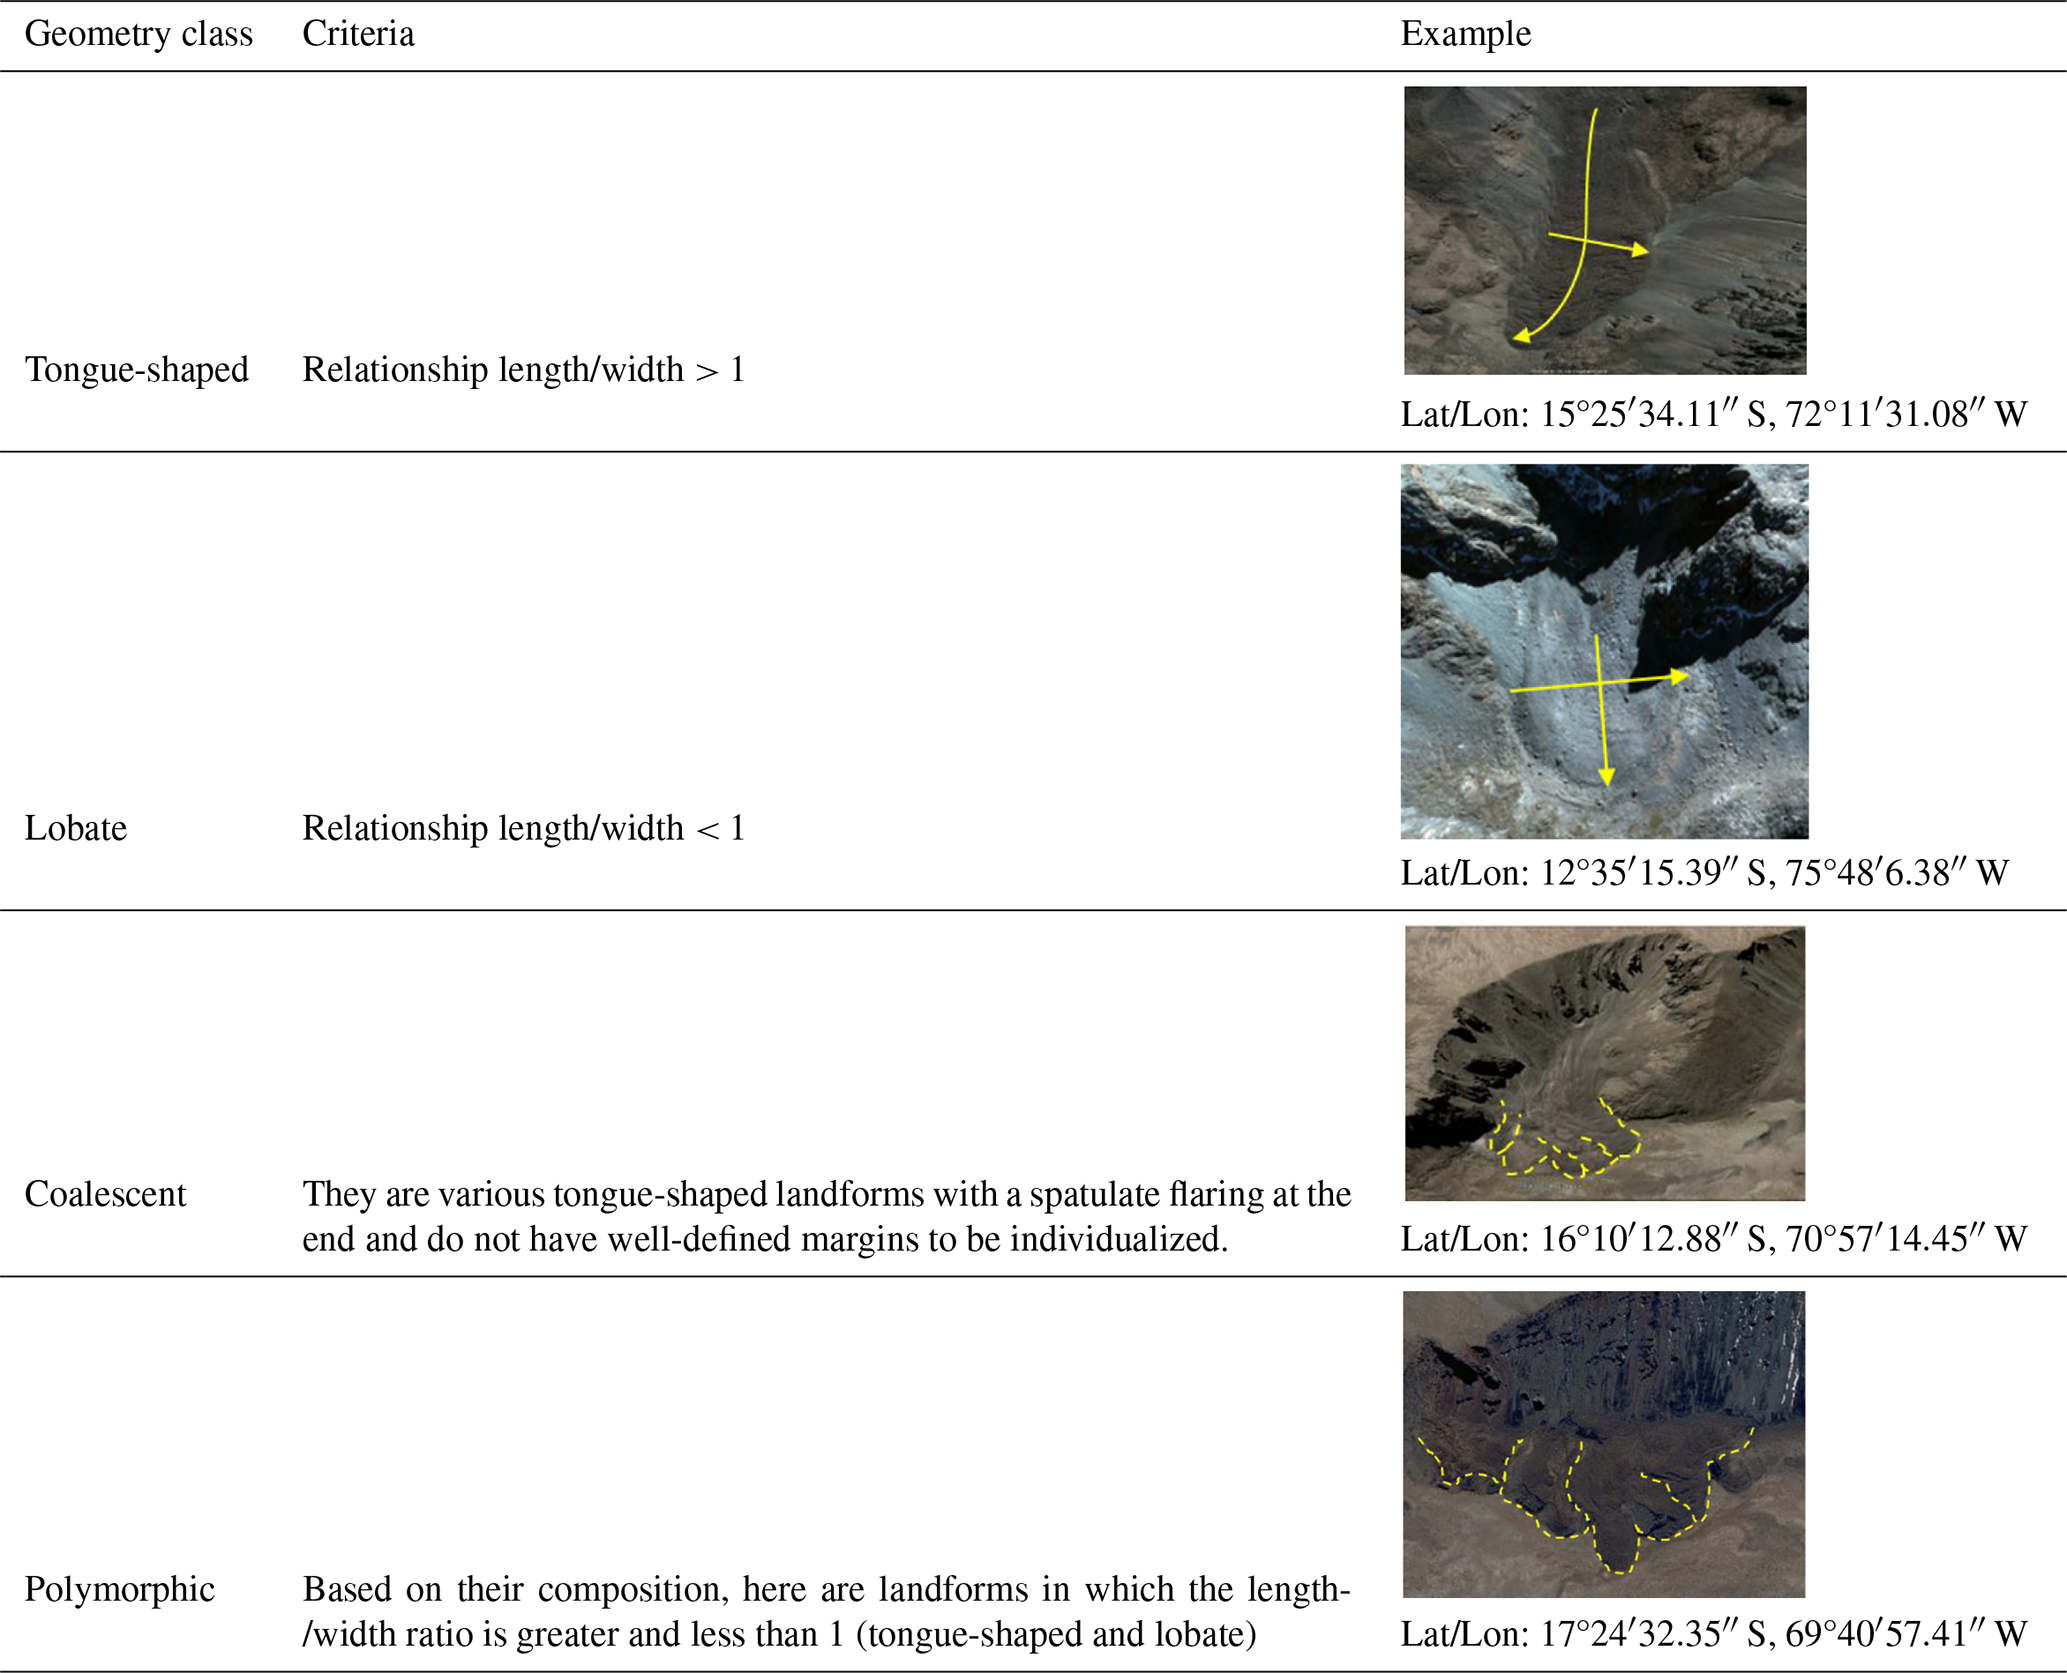
Note: Imagery © 2024 Microsoft Corporation, Map data © 2024 Bing Maps.
4.6 Uncertainty assessment
Mapping and interpreting rock glaciers present many challenges due to the inherently subjective nature of optical image analysis. This subjectivity can lead to significant variability in delineated rock glacier boundaries, as demonstrated by Brardinoni et al. (2019), who observed considerable differences when multiple analysts mapped the same rock glaciers on high-resolution imagery. To reduce mapping subjectivity and quantify the uncertainty in the rock glacier area estimates, an intercomparison experiment was carried out. Five different analysts independently mapped the outlines of a representative set of 400 rock glaciers (Fig. 4). Then the uncertainty in area for each rock glacier was quantified by calculating the standard deviation of the five area values obtained. Regarding the classification of activity reported in the literature, we specifically addressed this through our multi-level validation process. All rock glaciers initially classified as transitional (the most uncertain category) underwent independent review by at least two additional cartographers. Discrepancies in classification were resolved by consensus through discussions, and the final decisions were documented in the attribute table. In addition, how uncertainties in delineation translate into uncertainties in derived properties such as elevation and slope was assessed. For each rock glacier in the intercomparison set, we compared the minimum elevation, maximum elevation, and mean slope values derived from each analyst's mapping. The discrepancies in these parameters were analyzed using Bland–Altman plots (Bland and Altman, 1986) to evaluate any systematic biases or limits of agreement with adjustments for spatial data.
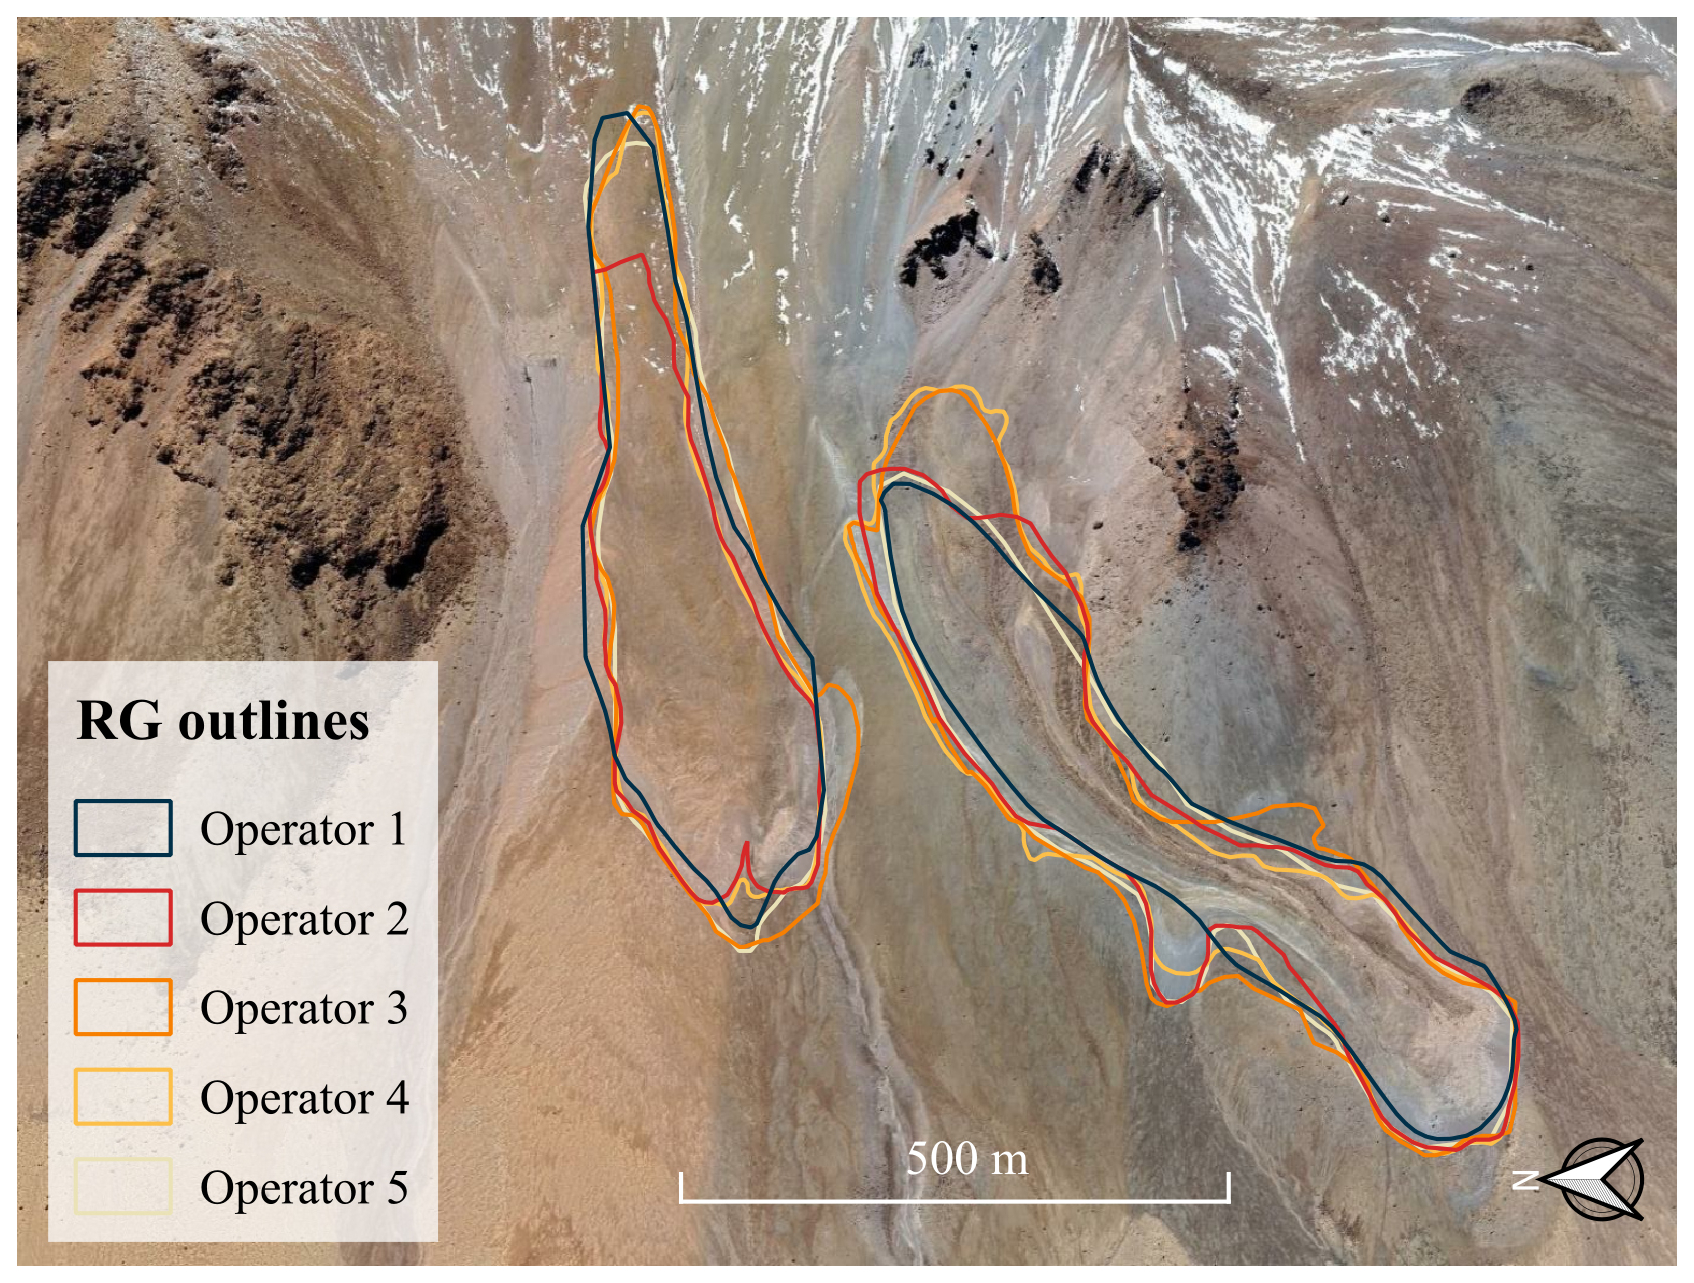
Figure 4Example of mapping variability: outlines of the same rock glacier delineated by five different analysts are superimposed. Each colored outline represents one analyst's mapping of the same landform. Basemap: © Microsoft Corporation. Bing Maps imagery (2024).
5.1 Inventory overview and spatial distribution
In total, 2338 rock glaciers (2095 from Bing and 243 from Google imagery) were identified in the Peruvian Andes, with a total mapped area of 94.09±0.05 km2. The size of individual rock glaciers ranges from very small features (∼ 0.001 km2) to large complexes (∼ 0.83 km2), with an average area of ∼ 0.04 km2 per rock glacier.
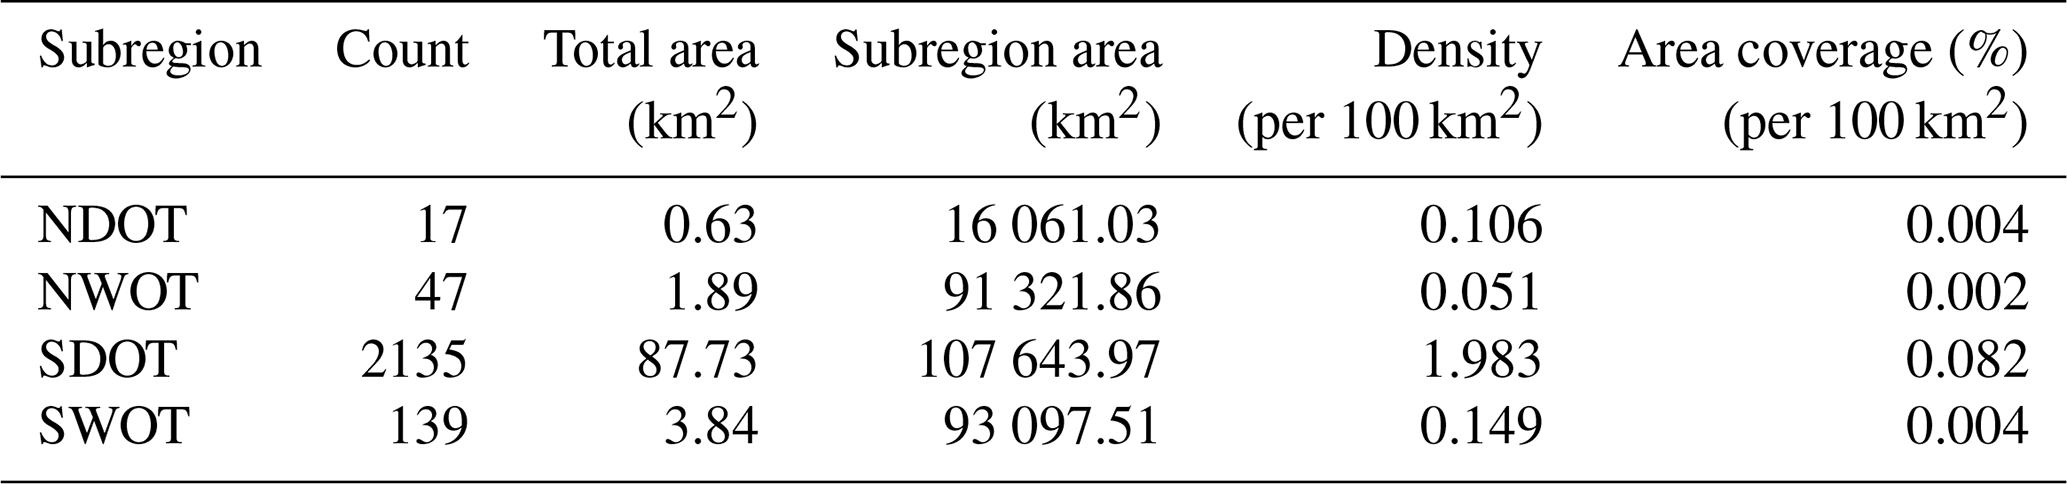
Spatially, the distribution of rock glaciers is highly uneven across the country. The analysis of rock glacier density (number per 100 km2) and area coverage ( %) reveals a stark contrast between the climatic subregions (Table 4). The Southern Dry Outer Tropics (SDOT) subregion contains a density of approximately 1.98 rock glaciers per 100 km2 , which is an order of magnitude higher than the densities found in the northern and wetter subregions (NDOT: 0.11, NWOT: 0.05, SWOT: 0.15 per 100 km2). Similarly, the percentage of land area covered by rock glaciers in SDOT (0.08 %) is substantially greater than in other parts of the Peruvian Andes (< 0.01 %), unequivocally confirming the Southern Dry Outer Tropics as the principal rock glacier zone of the country.
The inventory spans 35 distinct river basins across the Andes of Peru. Even within the rock glacier-rich south, their distribution varies by basin. For example, the Camaná basin (in SDOT) has the highest number of rock glaciers (507 features) covering a total area of ∼ 17.43 km2, with a mean rock glacier elevation around 5005 m a.s.l. In contrast, the neighboring Ocoña basin (also SDOT) contains slightly fewer rock glaciers (463), but those tend to be larger, yielding a greater total rock glacier area (∼ 23.08 km2) at a similar mean elevation (∼ 5001 m a.s.l.). A detailed breakdown of rock glacier counts and areas by river basin is provided in Supplement Table S2.
5.2 Rock glacier characteristics: activity and geometry
A majority (∼ 55 %) of the inventoried rock glaciers are tongue-shaped, meaning they have a single elongate lobe extending downslope. About 26 % are lobate forms, which are wider and shorter (often at the base of escarpments). Another 11 % have polymorphic or complex shapes (e.g., coalesced multi-lobate forms), and the remaining ∼ 8 % are classified as coalescent rock glaciers (where two or more units merge into a combined body).
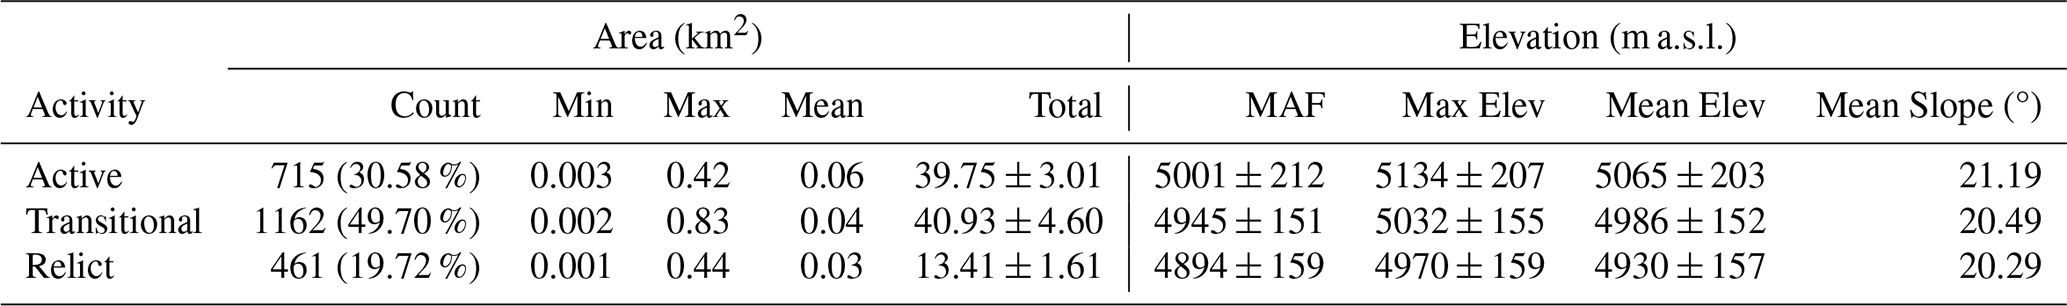
The inventory contains 715 active rock glaciers, 1162 transitional, and 461 relicts (Table 5). These correspond to roughly 31 % active, 49 % transitional, and 20 % relict of the total population. In terms of area, the active rock glaciers account for ∼ 42.0 % of the total mapped rock glacier area (39.75 km2 out of 94.09 km2). Transitional rock glaciers make up about 43.5 % of the area (approximately 40.9 km2), and relict rock glaciers constitute the remaining ∼ 14.5 % (∼ 13.4 km2). Relict rock glaciers have the smallest mean size (mean area ∼ 0.03 km2), compared to ∼ 0.04 km2 for transitional and ∼ 0.06 km2 for active rock glaciers. It is important to note that this classification, particularly for distinguishing transitional and relict forms, is associated with a well-documented degree of uncertainty in the absence of geophysical or InSAR data (e.g., Brardinoni et al., 2019).
The prevalence of active vs. relict rock glaciers varies by subregion. The SDOT subregion contains by far the most rock glaciers in all categories (active, transitional, relict), with transitional forms slightly outnumber active and relict being least common. The Minimum Altitude of rock glacier Fronts (MAF) is relatively uniform across subregions – differing by only on the order of 100 m. In both northern and southern subregions, active rock glacier fronts are found around 4800–5000 m a.s.l.
5.3 Topographic and climatic attributes
Figure 5 presents the spatial distribution and geomorphic characteristics of rock glaciers in the Peruvian Andes within 50 km grid cells. Rock glaciers are widespread and densely distributed in the SDOT subregion, whereas they are sparse in the other subregions (Fig. 5a). Rock glaciers in SDOT have larger areas (mean = 0.06 km2) than in the northern subregions (mean = 0.02 km2), as evident in Fig. 5b. It is worth mentioning that an increasing gradient in the minimum elevations of rock glaciers is observed, with higher elevations in the subregions located more towards the south (Fig. 5c). The average slopes of rock glaciers are greater in NDOT and NWOT, suggesting a tendency for rock glaciers to develop on steeper slopes in these areas (Fig. 5d).
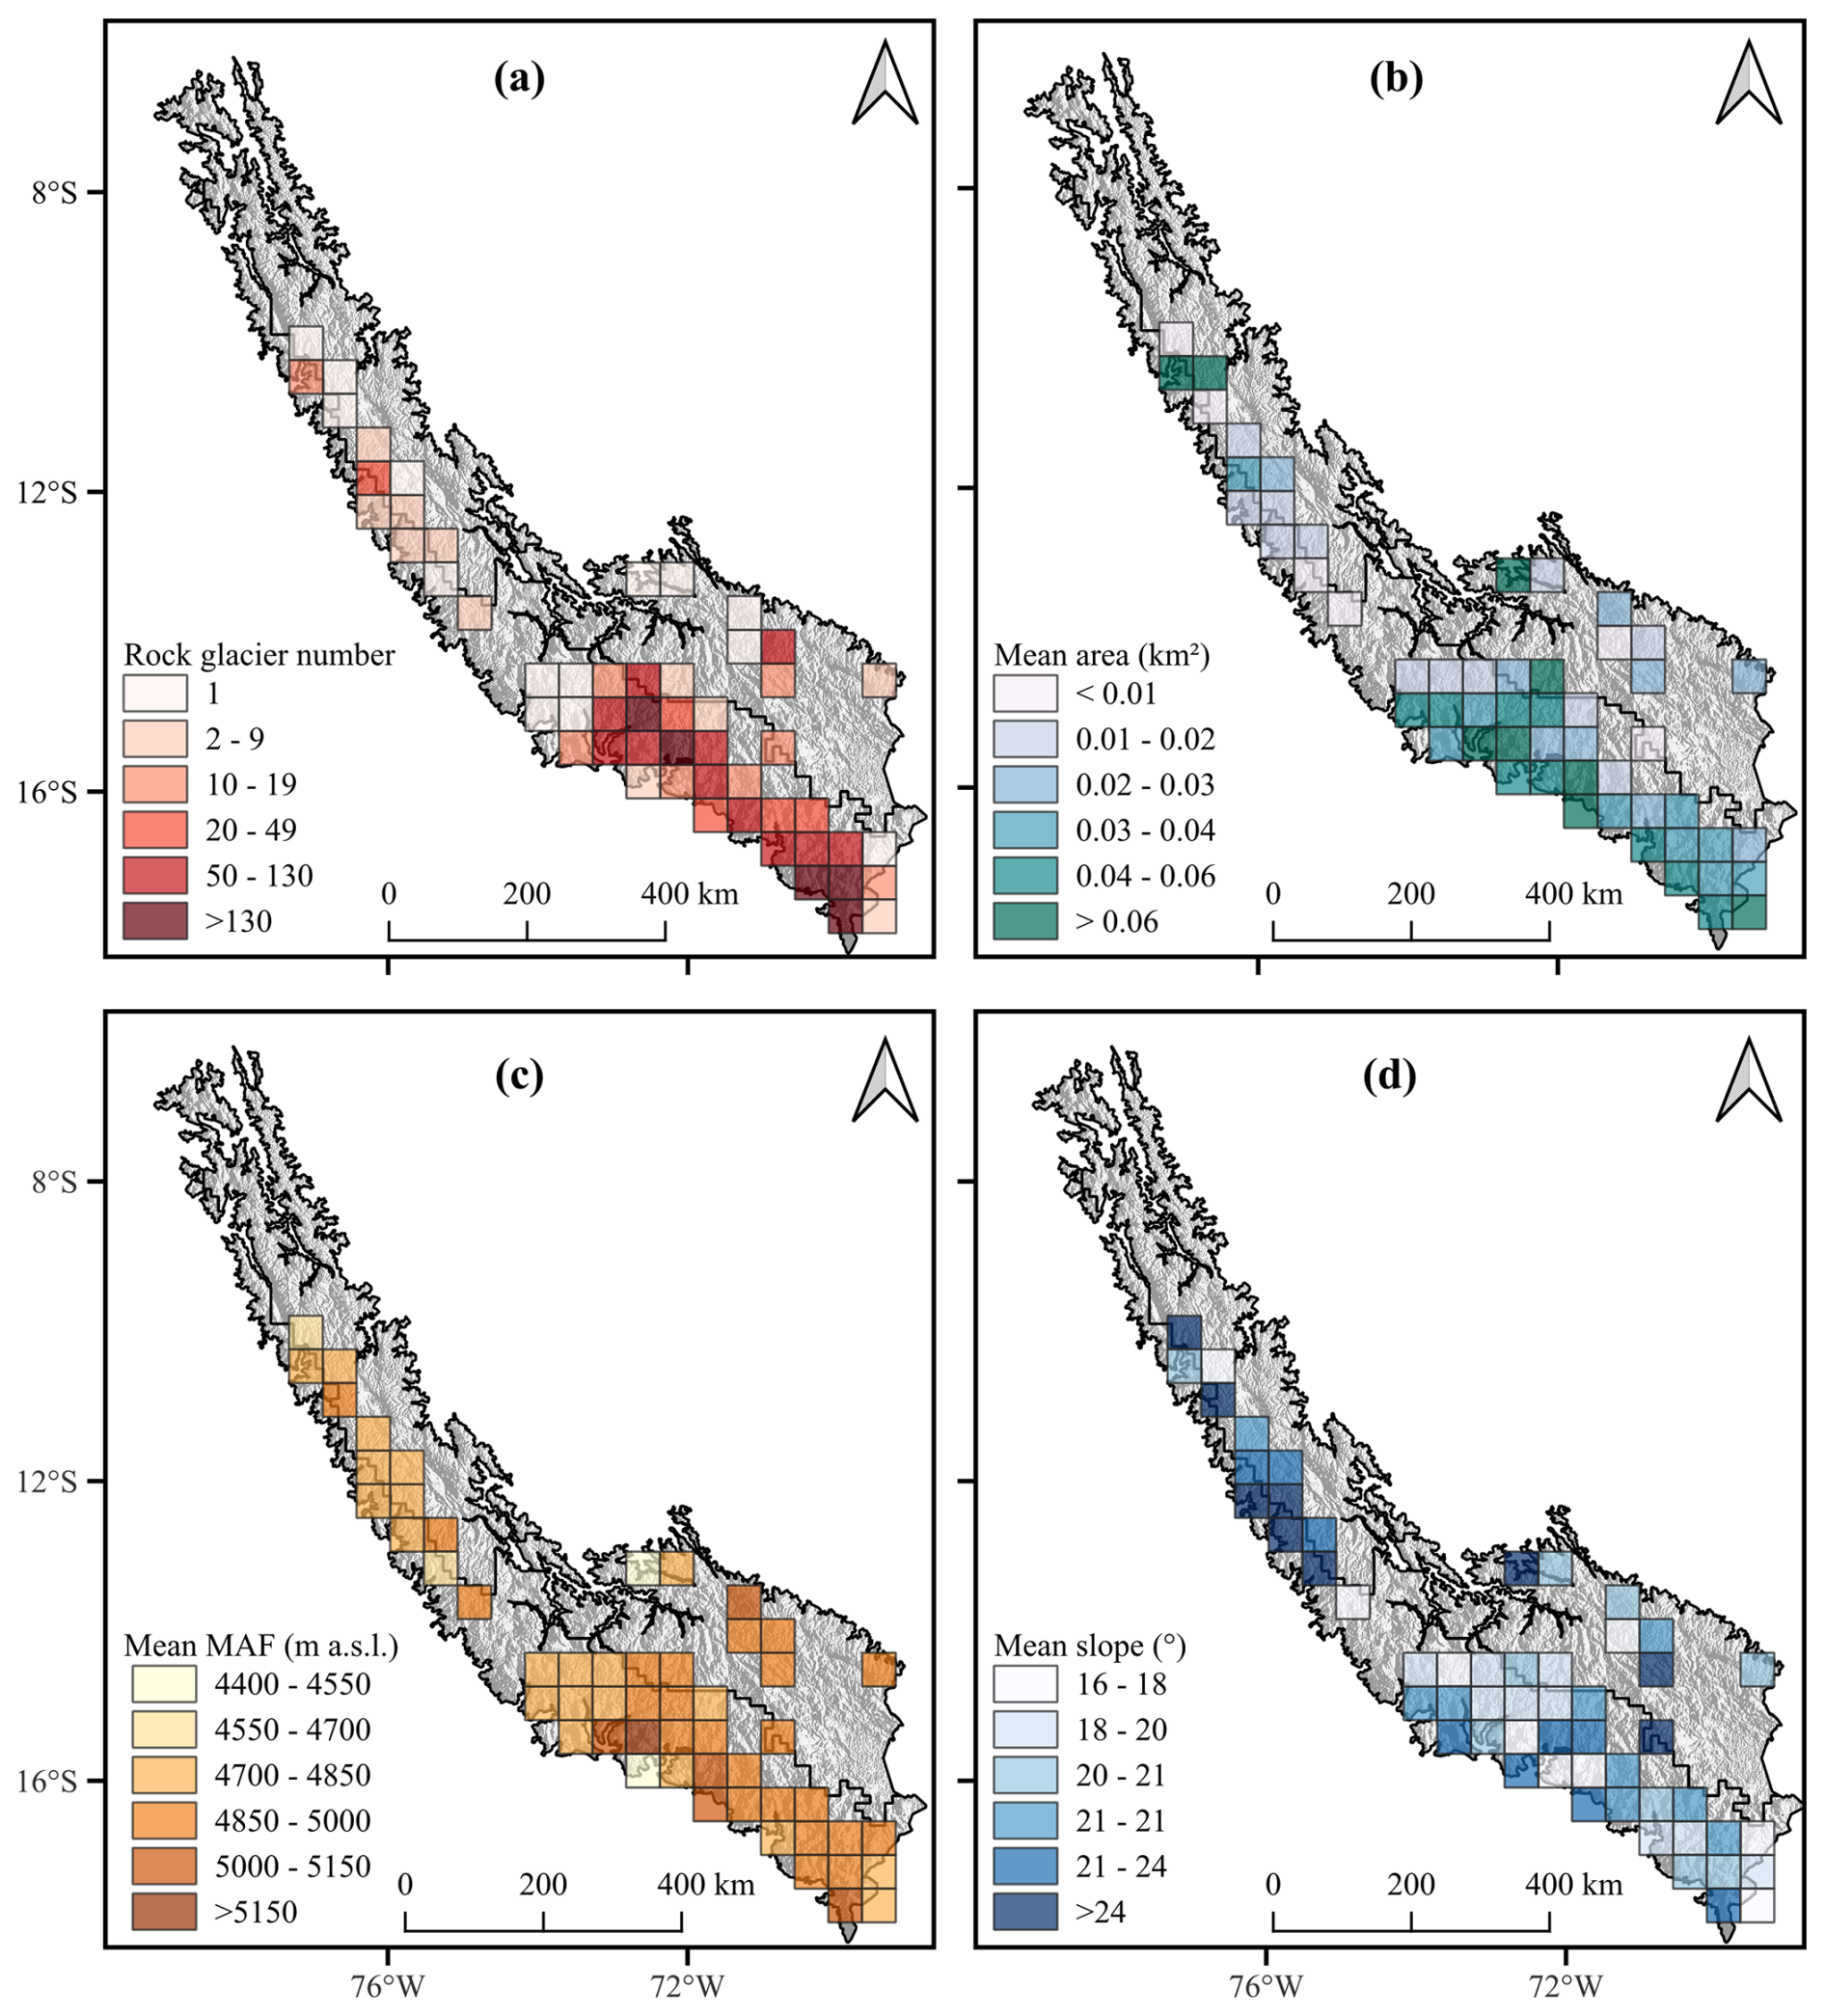
Figure 5Rock glacier (a) density, (b) area, (c) minimum elevation and (d) slope averaged over grid cells of 50 km × 50 km.
The elevational distribution of individual rock glaciers is constrained between 4400 and 5800 m a.s.l., with an average minimum elevation of ∼ 4951 m a.s.l. and an average maximum elevation of ∼ 5051 m a.s.l. Approximately 75 % of all rock glaciers are concentrated within a relatively narrow band between 4800 and 5200 m a.s.l. (Fig. 6). The total area covered by rock glaciers is nearly equally divided between the 4800–5000 m band (∼ 36.0 km2) and the 5000–5200 m band (∼ 34.8 km2).
The surface slopes of rock glaciers range from ∼ 7 to ∼ 38°, with a mean of ∼ 21°. The distribution of slopes is not uniform; the 15–20° class contains the largest number of individual rock glaciers (891) and the largest share of the total area (∼ 44 %, Fig. 7). This is followed by the 20–25° class (779 rock glaciers, ∼ 29 % of area) and the 25–30° class (354 rock glaciers, ∼ 8 % of area).
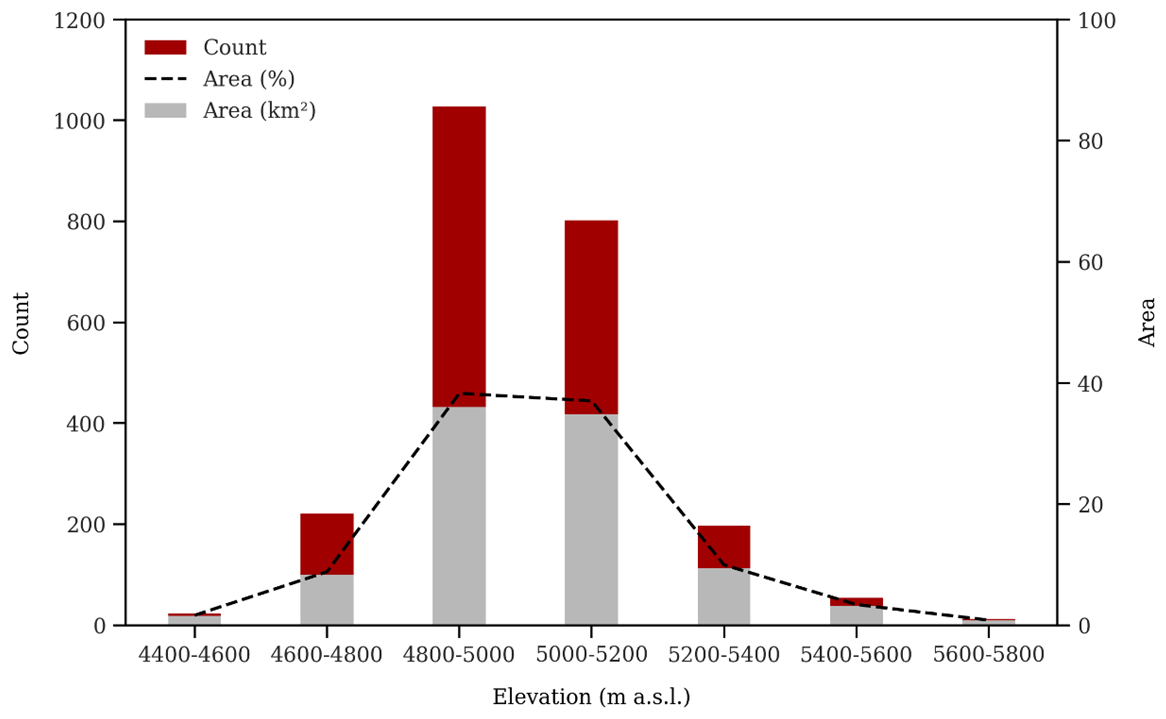
Figure 6Elevation distribution of rock glaciers. The histogram shows the number of inventoried rock glaciers within 200 m elevation intervals (based on mean elevation of each feature).
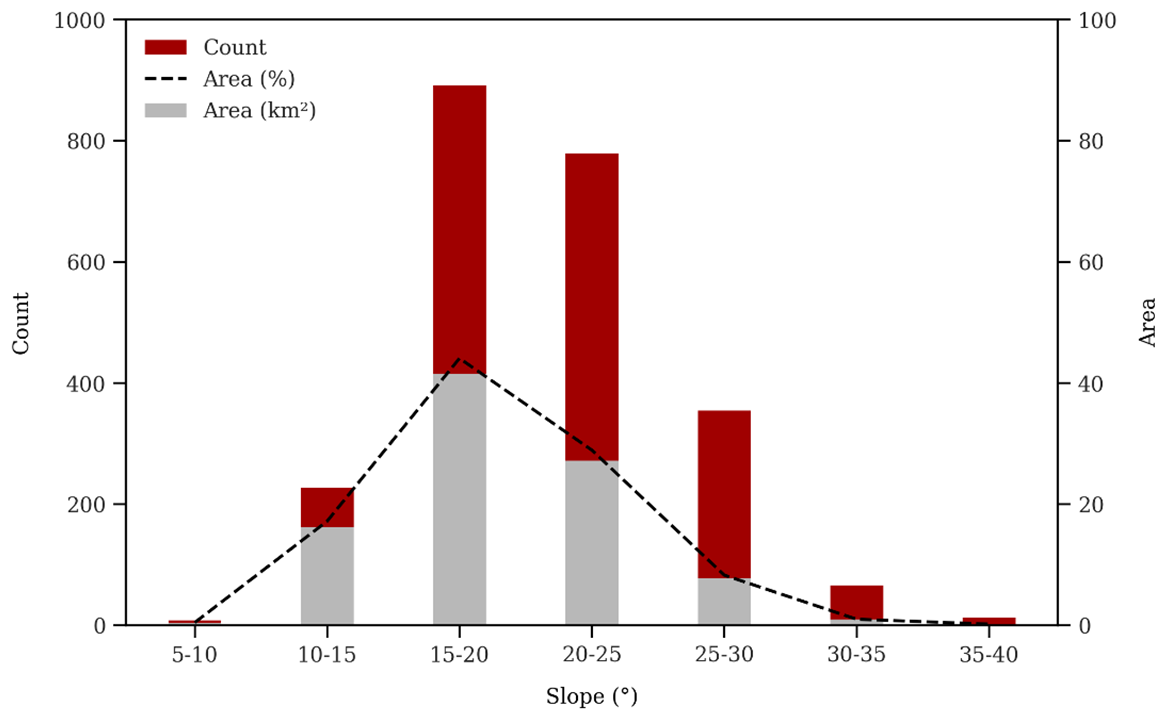
Figure 7Rock glacier frequency and area by slope. The inventory is binned into slope angle categories (e.g., 5–10, 10–25°, etc.), and the plot shows both the number of rock glaciers (left axis) and the total area (right axis) in each slope bin.
Aspect analysis confirms a strong preferential orientation of rock glaciers toward the southern half of the compass. Approximately 89.5 % of all inventoried rock glaciers have aspects between east-southeast and west-southwest. The most frequent orientations are due to south (∼ 36 %), southeast (∼ 28 %), and southwest (∼ 19 % of rock glaciers) as shown in Fig. 8.
Rock glaciers in the Peruvian Andes show different climatic dependencies between subregions, predominantly clustering within a MAAT range of −2 to 4 °C despite encompassing precipitation gradients of 500 to 2500 mm yr−1. The SDOT subregion shows the highest density of rock glaciers with intermediate precipitation (500 to 1000 mm yr−1), while other subregions show divergent patterns: NDOT and NWOT show predominantly occurrences of MAAT > 0 °C (including active forms), and SWOT reaches maximum precipitation (1500 to 2500 mm yr−1) without thermal extremes. Notably, transitional forms of SDOT dominate the entire MAAT spectrum, whereas relict glaciers are concentrated above 0 °C (Fig. 9).
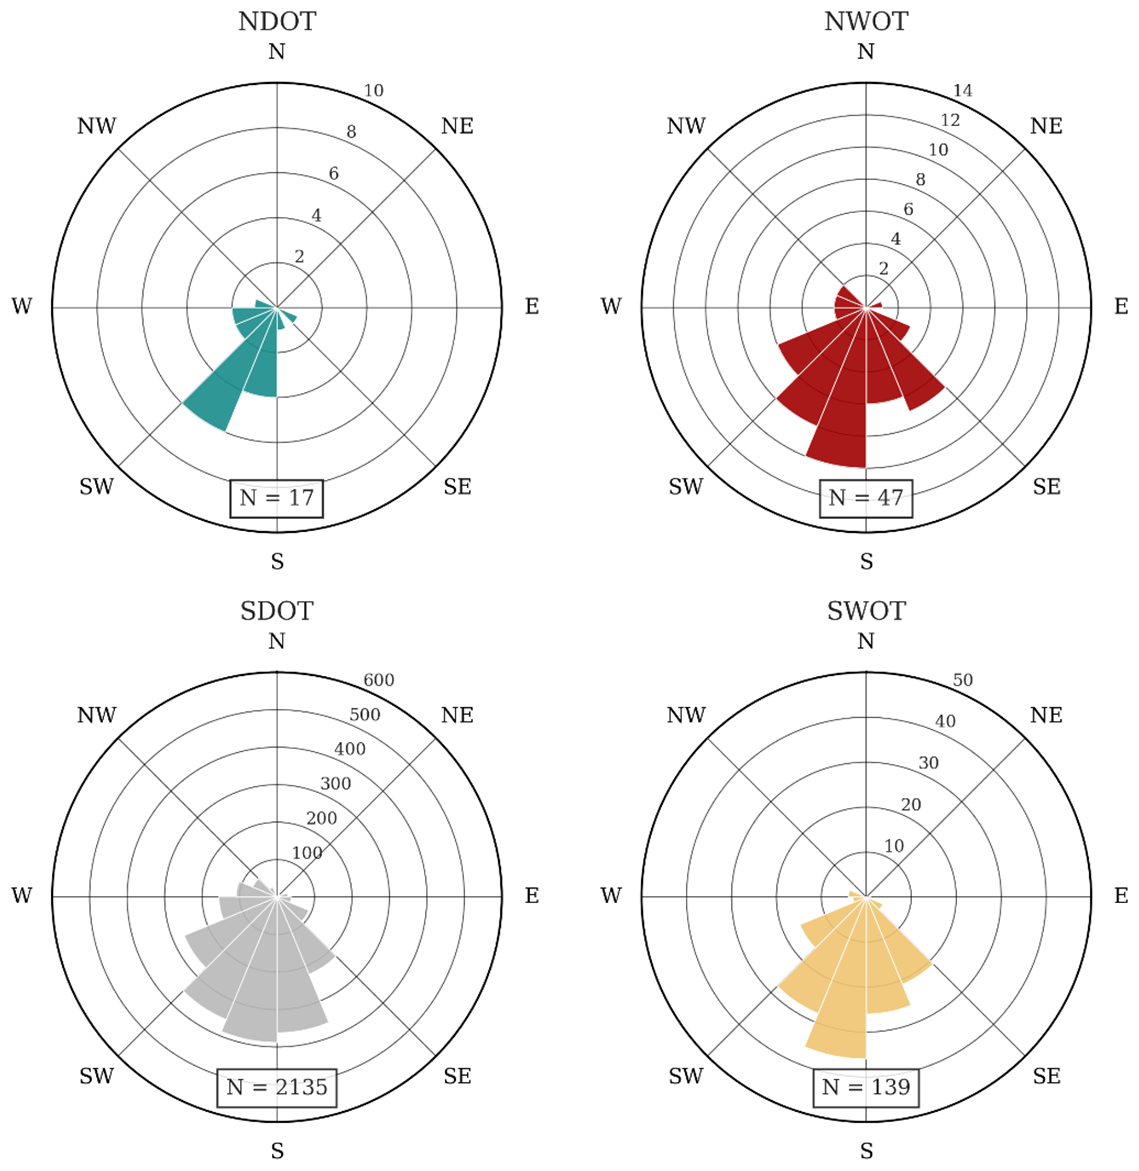
Figure 8Aspect distribution of rock glaciers by subregion. For each subregion (NWOT, NDOT, SWOT, SDOT), a rose diagram of rock glacier aspect is shown, indicating a strong preference for south-facing orientations.
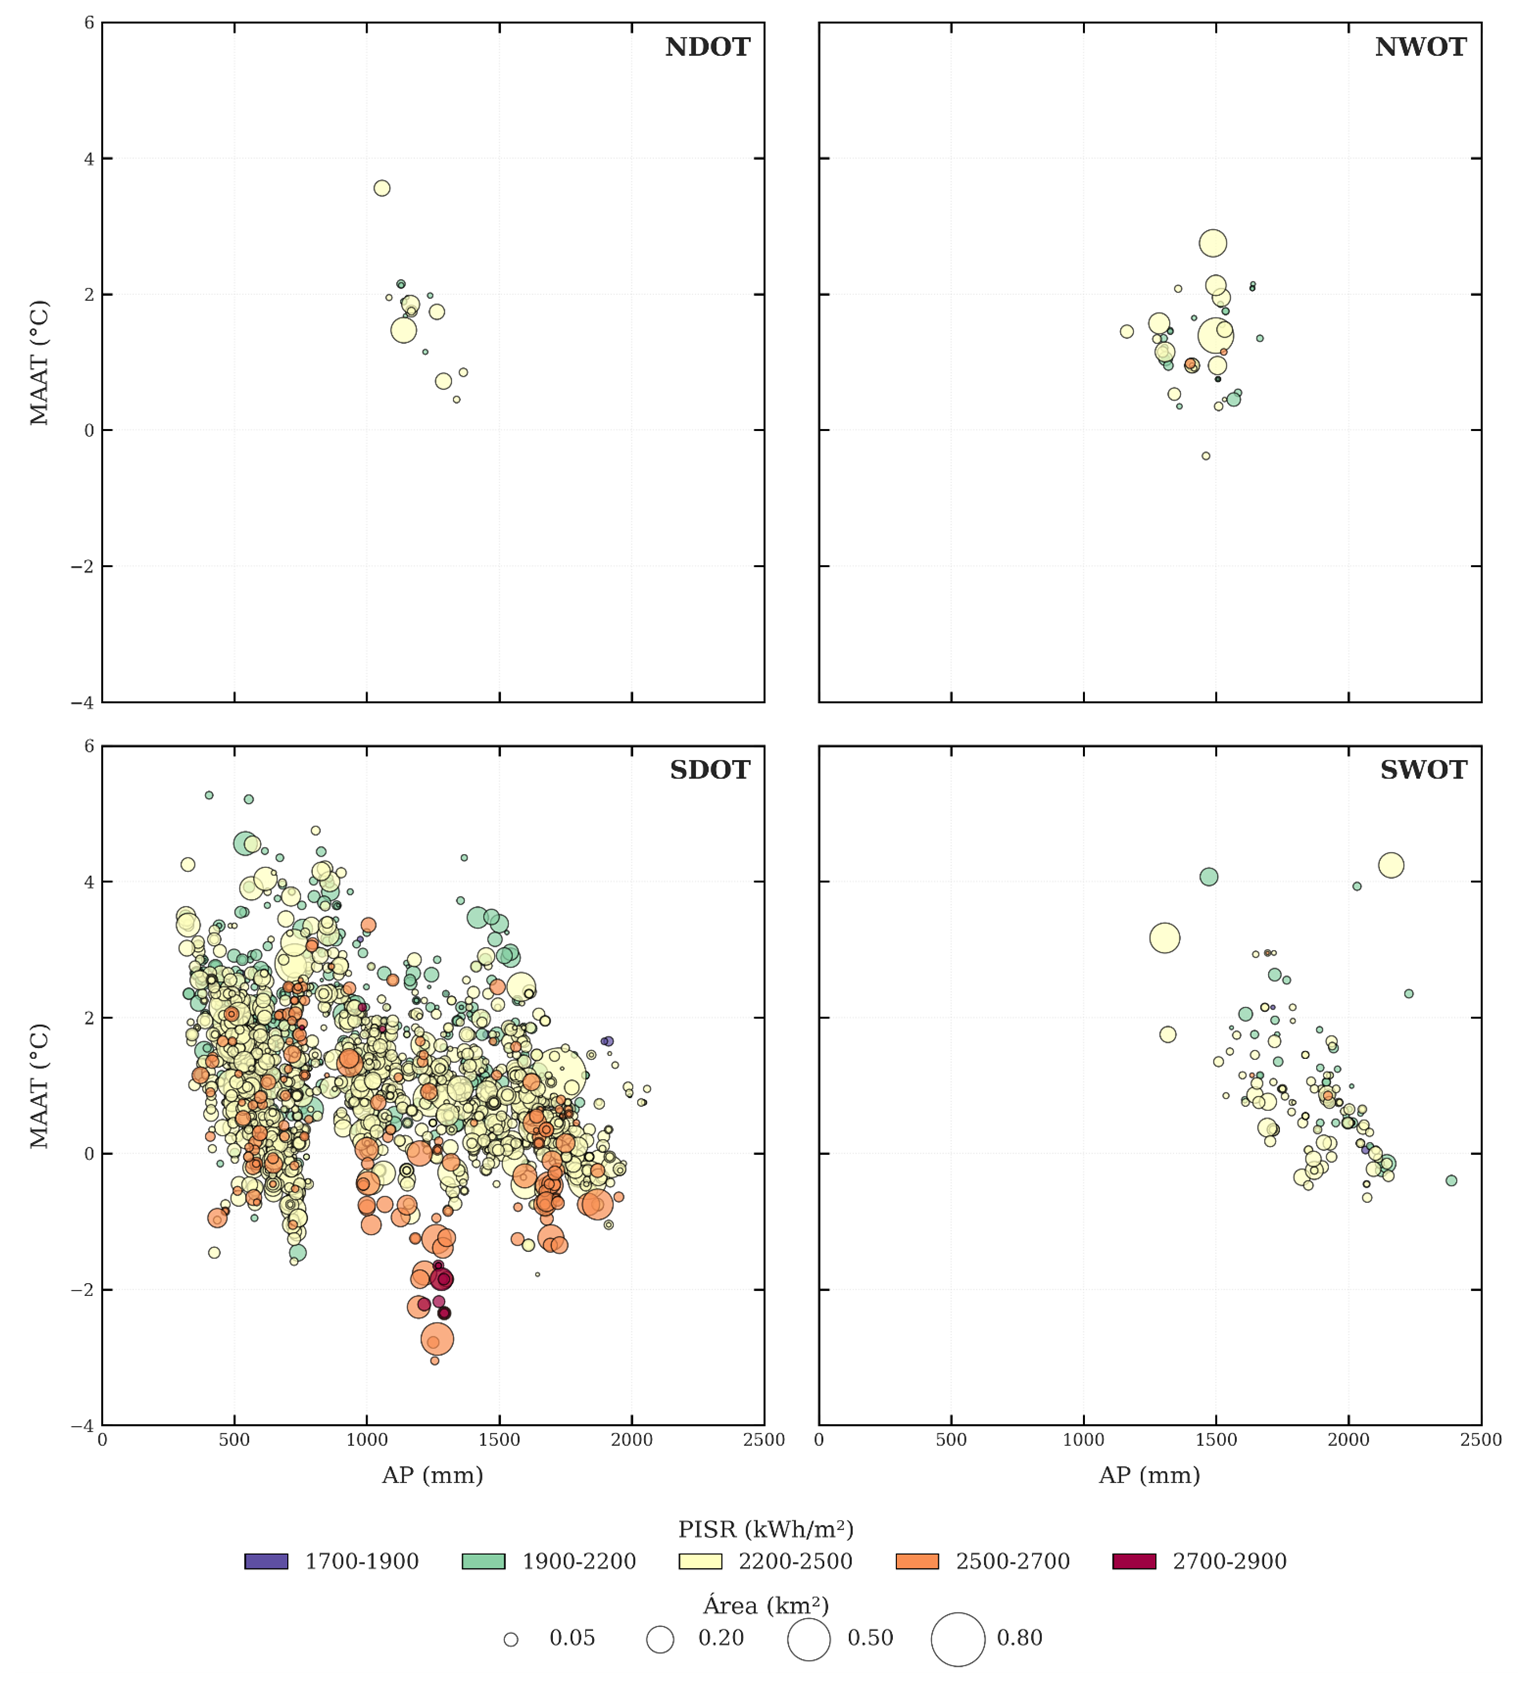
Figure 9Spatial distribution of rock glaciers analyzed according to Annual Precipitation (AP), Mean Annual Air Temperature (MAAT), Potential Incoming Solar Radiation (PISR), and Area in the four subregions.
5.4 Uncertainty analysis
The mapping uncertainty of the inventory was evaluated by comparing results among different mappers and considering potential delineation errors. The area of each rock glacier polygon comes with an uncertainty estimate based on multi-analyst mapping trials. Individual rock glacier area uncertainty was found to range from as low as ∼ 0.001 km2 for small, clearly defined features to up to ∼ 0.3 km2 for very large or diffuse features, with a mean uncertainty of ∼ 0.06 km2 (see Fig. S1 in the Supplement). This translates to an overall relative uncertainty of about 18 % in area on average. Notably, this level of uncertainty is low for a manual inventory of this scale, which, together with the high inter-mapper agreement confirmed by the Bland-Altman analysis and ICC scores, indicates the robustness of our methodological protocol.
To further quantify consistency, a Bland–Altman analysis was performed on a subset of rock glaciers independently mapped by five different team members. The results showed very high agreement: the mean difference (bias) in mapped area between operators was close to zero (dashed red line in Fig. S1), and the 95 % limits of agreement (±1.96 SD, dashed grey lines) were within acceptable ranges, even for the largest rock glaciers. For example, the average discrepancy in calculated mean elevation for a rock glacier between mappers was on the order of 10 m (0.2 %), and for mean slope it was ∼ 1.5° (4 % variance). The Intraclass Correlation Coefficients (ICC) for key attributes (area, elevation, slope) all exceeded 0.95, which confirms excellent consistency among mappers. A slight heteroscedastic trend was observed: larger rock glaciers showed proportionally a bit more variance in area mapped (as noted by a conical distribution in Fig. S1), but the effect is minor.
Overall, this uncertainty analysis gives confidence that errors in mapping are small relative to the size of landforms, and that our inventory is reproducible. The careful quality control (Sect. 4.1.3) further reduced uncertainty by removing or correcting dubious polygons. Some degree of subjectivity is inevitable in manual digitizing, but by documenting these uncertainties, transparency is achieved. Future work could apply semi-automated mapping or higher-resolution data to further reduce uncertainty, but for a national-scale manual inventory, an ∼ 18 % area uncertainty is within acceptable bounds and substantially improves upon previous knowledge, where uncertainties were effectively 100 % in unmapped regions.
The results provide the first comprehensive picture of rock glaciers in Peru. Below their significance in the context of regional permafrost and prior studies is discussed.
6.1 Peruvian rock glacier distribution in global context
The primary objective of this work was to create a comprehensive inventory of rock glaciers in the Peruvian Andes. The resulting PRoGI dataset, with 2338 rock glaciers, provides a much-needed baseline for understanding mountain permafrost in tropical South America. The strong clustering of rock glaciers in the southern (SDOT) subregion points to the importance of a drier, colder regional climate compared to the north, a pattern also observed in adjacent countries like Bolivia and northern Chile (Rangecroft et al., 2014; Perucca and Esper Angillieri, 2011). The role of lithology, particularly high-albedo volcanic rock surfaces, also appears to be a key contributing factor (Yoshikawa et al., 2020).
The average sizes of Peruvian rock glaciers are somewhat smaller than those reported in other Andean inventories. We found mean areas of ∼ 0.04 km2 overall, which is less than averages reported for the Bolivian Andes (∼ 0.13 km2 for active; Rangecroft et al., 2014) or the Patagonian Andes (∼ 0.09 km2 for intact; Falaschi et al., 2015). These discrepancies may arise from a combination of climatic and methodological factors, including our use of very high-resolution imagery leading to more conservative delineations.
A critical metric for comparison is the mean altitude of rock glacier fronts (MAF). In our inventory, the MAF for active rock glaciers is ∼ 5001 m a.s.l., aligning closely with independent estimates of the 0 °C MAAT isotherm in the Peruvian Andes (León et al., 2021) and confirming that active rock glacier fronts mark the current permafrost boundary. This limit is dramatically higher than in the extra-tropical Andes (e.g., ∼ 2660 m in the semi-arid Argentine Andes; Falaschi et al., 2016), illustrating the dominant effect of latitude.
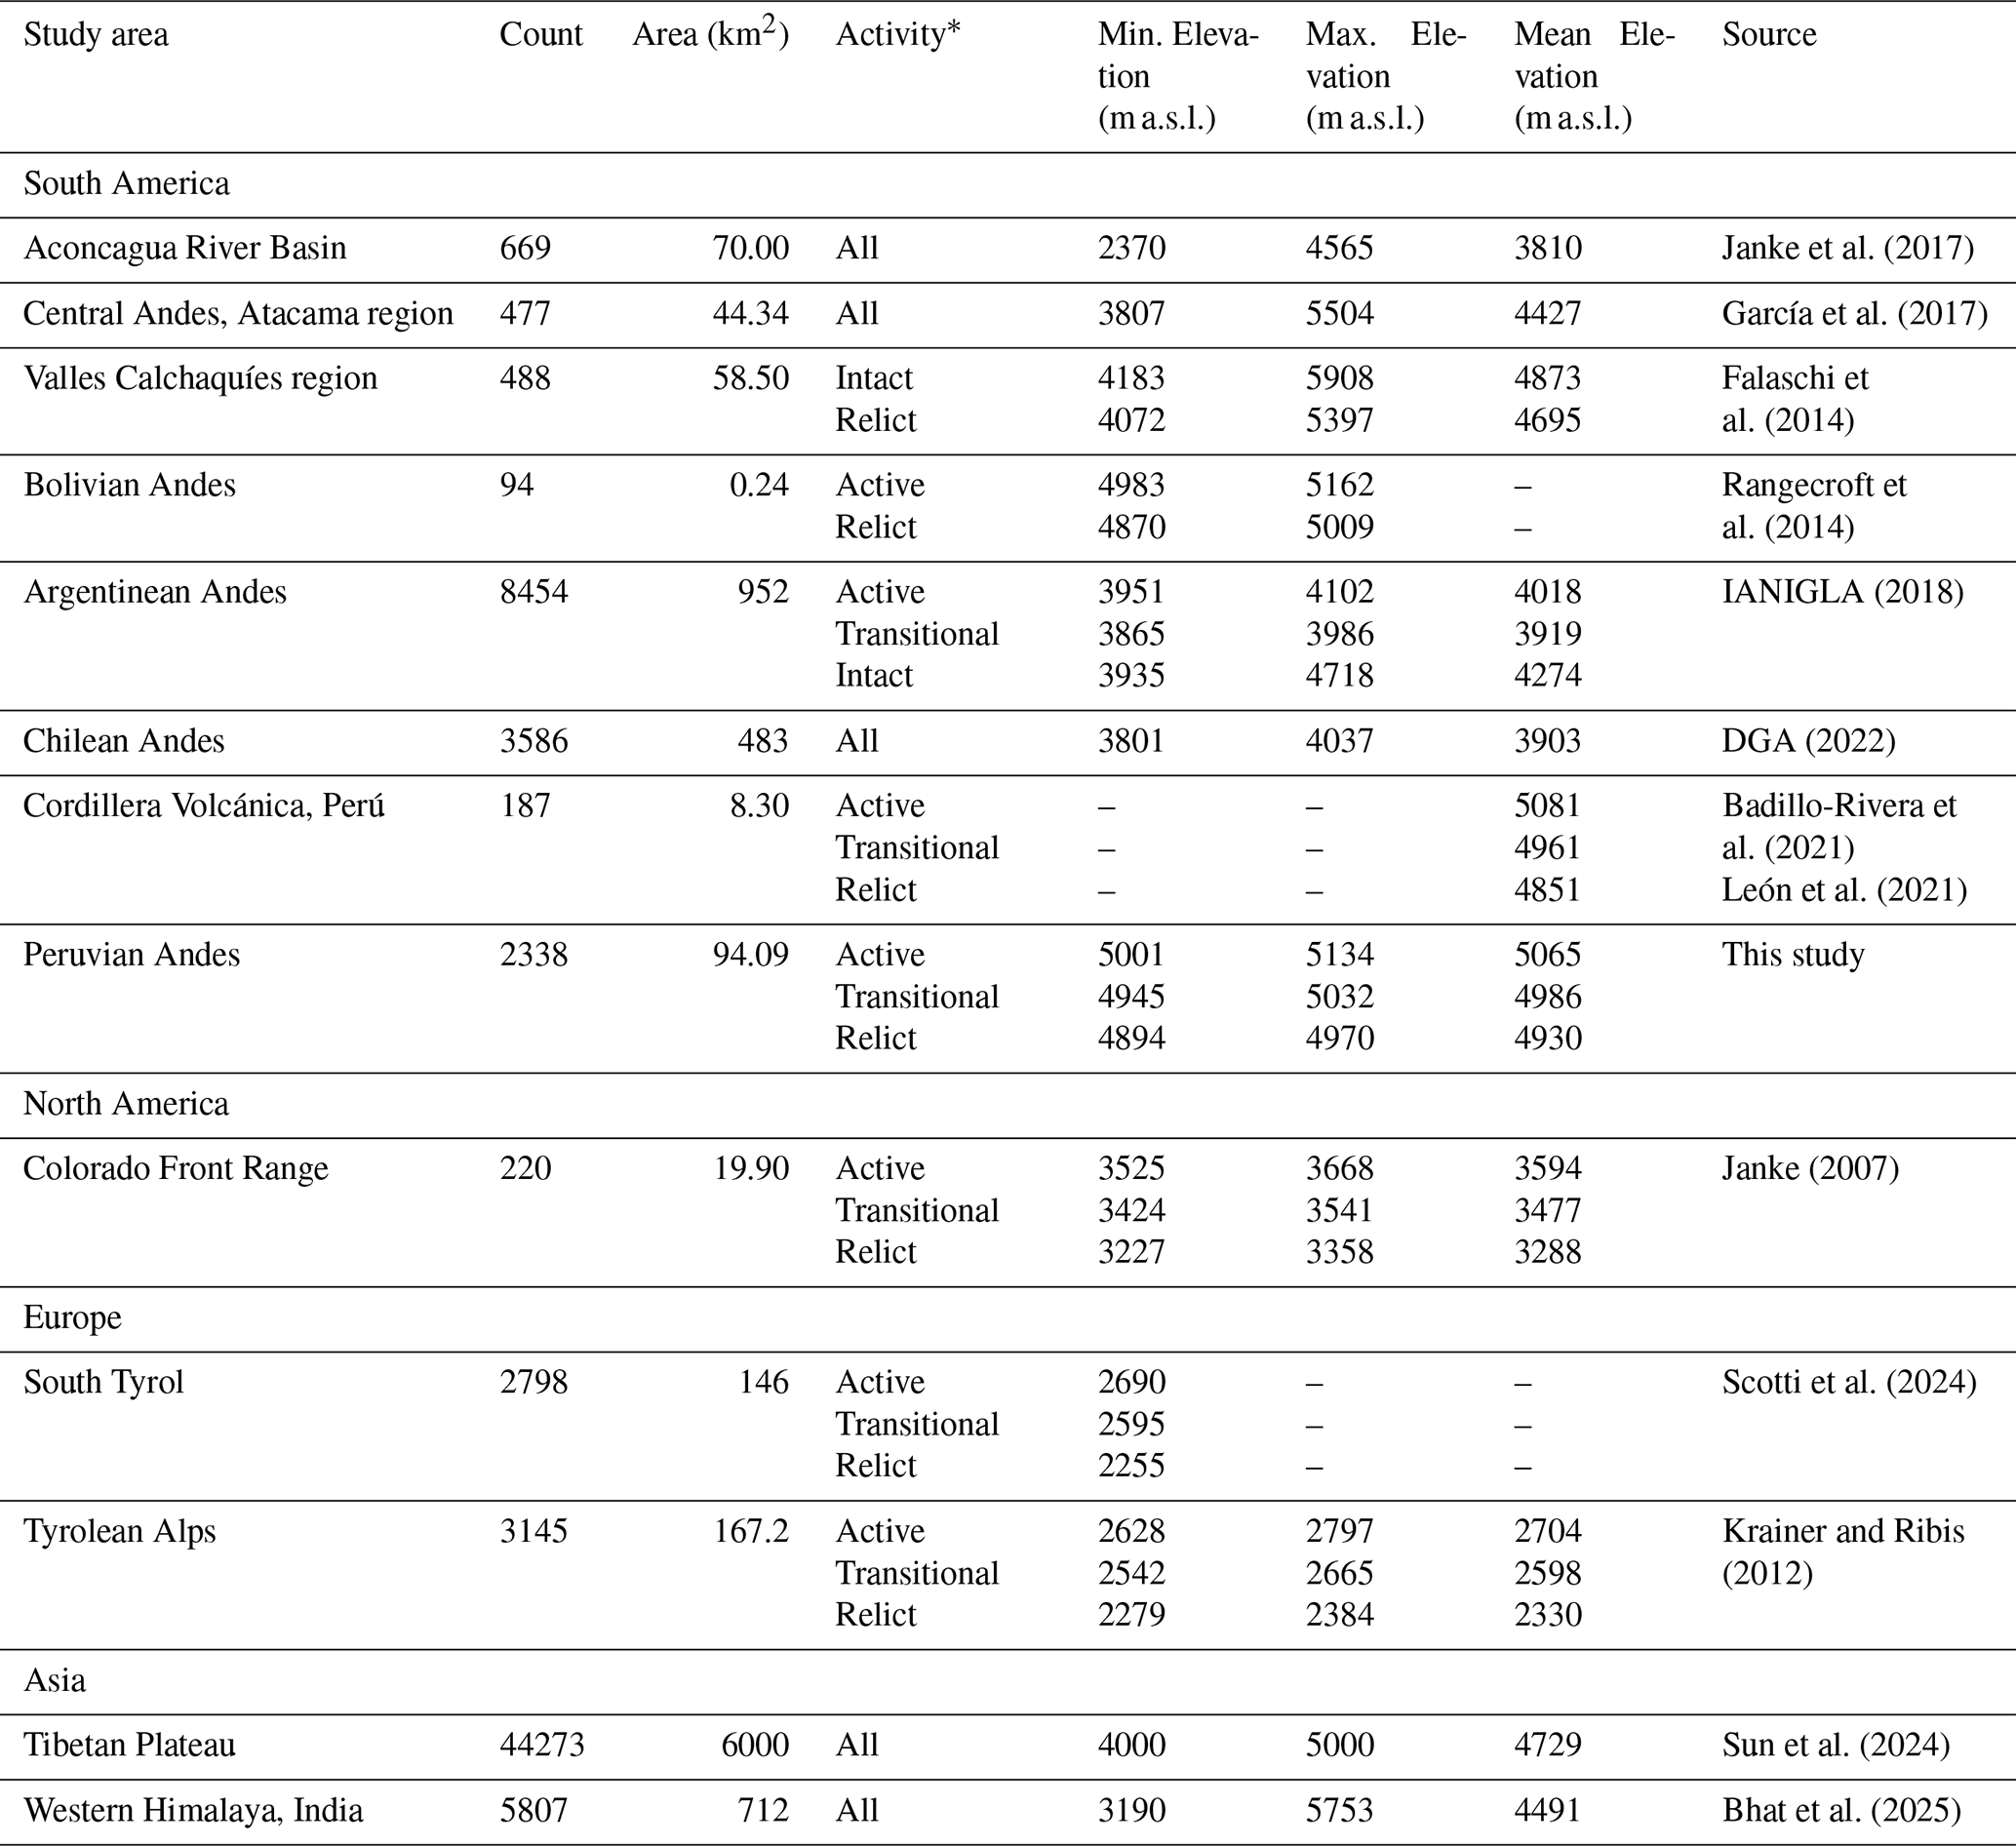
Beyond elevation (Table 6), other characteristics of Peruvian rock glaciers are broadly similar to global patterns. The mean slope of ∼ 21° is in line with typical values reported elsewhere (Robson et al., 2020), and the strong preference for southerly aspects is a universal trait in the Southern Hemisphere. Thus, while situated in an extreme tropical environment, the fundamental morphometric characteristics of Peruvian rock glaciers conform to global patterns.
Table 6Characteristics of rock glacier inventories reported from various regions of the world.
* “Inactive” class is the same to “Transitional” class and “Intact” class include “Active” and “Transitional (Inactive)” classes.
Nevertheless, this dataset is subject to several limitations. Factors such as seasonal snow cover, persistent cloudiness, and topographic shadowing, especially near ice glaciers or in high-relief areas, hindered consistent visual interpretation and may have led to the omission of some features. Although manual verification and cross-checks were conducted, the possibility of omissions due to image limitations or mistakes in the human interpretation cannot be fully excluded (Brardinoni et al., 2019; Pandey, 2019). Despite these limitations, the dataset presented here represents a significant advancement in the mapping and understanding of tropical periglacial landscapes. It offers a consistent and reproducible foundation for the study of cryospheric processes in the Peruvian Andes and supports transdisciplinary applications in water resources, ecosystem services, natural hazards, and climate monitoring. The inventory's harmonized format also facilitates future regional and global-scale comparisons, as well as integration into modeling frameworks assessing the role of rock glaciers in mountain hydrology under changing climatic conditions.
6.2 Environmental controls on rock glaciers
The analysis of this inventory highlights climate (temperature and precipitation) as the overarching control on rock glacier distribution in Peru. Rock glaciers are essentially absent in areas with higher mean annual air temperatures (MAAT) and abundant precipitation, such as the wetter northern Andes, and are prolific in cold, arid areas, such as the southern outer tropics. Low MAAT ensures the presence of permafrost, and low precipitation (with associated thin snow cover) reduces insulation of the ground and allows deeper winter cooling – both conditions are necessary for rock glaciers to develop and persist (Esper Angillieri, 2017).
In the subregional breakdown, the SDOT has the lowest average MAAT and a pronounced dry season, aligning with its dominance in rock glacier count. By contrast, NWOT and parts of SWOT have higher precipitation and more cloud cover, which likely limit permafrost despite some high elevations; accordingly, rock glaciers there are few or marginal (often transitional or relict). The remarkable concentration of rock glacier in SDOT, is best understood as the result of a geoclimatic synergy where geological predisposition amplifies the effects of climatic constraints. The abundance of rock glaciers aligns not only with regional aridity but also, critically, with the underlying Neogene volcano sedimentary lithologies (INGEMMET, 2022). These geological environments are crucial, as they are readily weathered by gelifraction processes, creating a highly permeable layer necessary to insulate and protect the interstitial ice core, or permafrost. Furthermore, the presence of high-albedo volcanic rock surfaces acts as a crucial positive feedback mechanism for ice preservation by reducing energy absorption (Yoshikawa et al., 2020).
An interesting observation is that within the zones where rock glaciers do exist, microclimatic variations (like slope aspect and shading) further control where active versus relict forms are found. For instance, in SWOT (southern, wet), rock glaciers tend to survive only on south-facing, well-shaded slopes at the highest elevations – conditions that locally offset the warmer/wetter climate. Transitional and relict rock glaciers in SWOT and NWOT indicate that permafrost likely existed more broadly during past colder periods (e.g., the Little Ice Age), but current conditions are only just sufficient to maintain a few active ones. In SDOT, even north-facing slopes largely lack rock glaciers, despite dryness, because solar radiation is too high – again underscoring that solar aspect is a key factor.
In summary, temperature (elevation/latitude) sets a relevant characteristic of rock glaciers (tropical permafrost is restricted to > ∼ 5000 m), whereas precipitation and related factors describe a priority distribution in dry and cold environments. These findings are consistent with regional studies in South America (e.g., Azócar and Brenning, 2010; García et al., 2017) that emphasize a “sweet spot” of cold and dry conditions for rock glacier prevalence, typically at higher elevations and latitudes (Veettil et al., 2018). Future climate changes (warming and changes in precipitation) will likely have complex effects: warming alone will reduce the climatic envelope for rock glaciers upwards, but increasing aridity (if it occurs) could offset some insulating effects of snow (Jorgenson et al., 2010). However, the overall smaller extent of rock glaciers in this inventory relative to other Andean regions may indicate the presence of discontinuous permafrost, which tends to be restricted to favorable microclimatic conditions, especially on south-facing slopes (Andrés et al., 2011). A clear latitudinal gradient is observed, with the number of rock glaciers increasing from north to south, consistent with decreasing MAAT and precipitation levels, except in the SWOT subregion, where precipitation increases due to moisture-laden winds from the Atlantic. In contrast, in northern subregions, the predominance of clean, debris-covered glaciers (INAIGEM, 2023), together with more temperate climates and higher precipitation levels (Bonshoms et al., 2020; Sagredo and Lowell, 2012), has likely inhibited widespread rock glacier formation. Compared to other regions of South America, the results of this work show that Peruvian rock glaciers are found in areas with relatively higher MAAT. For instance, Azócar and Brenning (2010) report rock glaciers in the semi-arid Andes of Chile occurring under MAATs of 0.5 to 1 °C, and Esper Angillieri (2017) notes −2 °C in Argentina, whereas the dataset of this inventory has an average MAAT of 1.1 °C. This relatively high value in Peru may be associated with the predominance of transitional rock glaciers, which are indicative of ongoing degradation. When analyzed by activity status, active rock glaciers occur under the coldest conditions, with a mean MAAT of 1.08 °C, followed by transitional (1.21 °C) and relict (1.58 °C) forms. This supports the notion that permafrost and internal ice can persist under slightly positive MAATs due to thermal insulation provided by the debris mantle or active layer (Barsch, 1996; Gruber and Haeberli, 2007). Precipitation values in the Peruvian Andes exceed those reported in comparable inventories. For instance, Rangecroft et al. (2014) reported 250–300 mm yr−1 in Bolivia, and Esper Angillieri (2017) found values as low as 6–37 mm yr−1 in Argentina. Despite these differences, the presence of rock glaciers at much higher precipitation levels (1000–2000 mm yr−1) has been documented in other high mountain environments, such as the Himalayas and the Caucasus (Abdullah and Romshoo, 2024; Tielidze et al., 2023). This supports the view that MAAT is a more critical control on rock glacier distribution than precipitation (Bhat et al., 2025).
The mean slope of rock glaciers in this study is 20.7°, with values ranging between 7 and 37°, which is consistent with those found in the Chilean Andes (mean 20.3°, range 0–68°; Janke et al., 2017). In terms of aspect, rock glaciers predominantly face south, southwest, and southeast – orientations generally opposite the sun's path – suggesting that reduced incoming solar radiation favors permafrost stability (Janke et al., 2017; Perucca and Esper Angillieri, 2011). Due to the lower latitude, potential incoming solar radiation (PISR) values for Peruvian rock glaciers are higher than those reported for the same landforms in the French Alps and Chilean Andes (Azocar, 2013; Marcer et al., 2017), yet they are comparable to those documented on the Tibetan Plateau (Sun et al., 2024), possibly reflecting the high elevations and steep slopes of the Peruvian Andes.
6.3 Inventory uncertainties and limitations
6.3.1 Delineation uncertainty and detection limits
Manual mapping, while providing high detail, inherently involves some subjectivity. As demonstrated by Brardinoni et al. (2019), different analysts can delineate boundaries with significant variability. To quantify this, our intercomparison experiment on a representative set of 400 rock glaciers revealed an average area uncertainty of approximately 18 % per mapped polygon. This uncertainty typically ranges from ∼ 0.001 km2 for small, well-defined features to ∼ 0.3 km2 for very large or diffuse ones. While this level of uncertainty is relatively low for a manual mapping product and demonstrates the robustness of our methods compared to some other inventories (e.g., Abdullah and Romshoo, 2024), it implies that very small rock glaciers (≤ 0.01 km2) are near our mapping's detection limit. Consequently, it is possible that some extremely small landforms or those heavily obscured by debris or seasonal snow were not captured.
Our rigorous quality control process (Sect. 4.1.3), which involved removing ∼ 281 low-certainty polygons and adding 32 missed ones, highlights that initial mapping can lead to both over- and under-estimation if not rigorously reviewed. Despite this, some subjective judgment calls remained, particularly in distinguishing relict rock glaciers from morainic or talus landforms when surface patterns were faint. We primarily relied on criteria such as the presence of a pronounced front and lateral margins but acknowledge that a “gray zone” exists in some cases. Users of the inventory should be aware that certain transitional vs. relict classifications might require revision with future ground truth or kinematic data.
Concordance analyses using Bland-Altman plots (Fig. S1) revealed a characteristic conical pattern in pairwise comparisons of operators, indicating that inter-rater variability was proportional to the magnitude of the measurements. The differences between operators were more pronounced in large glaciers (> 0.3 km2), mainly due to divergent interpretations of composite systems and secondary lobes. To homogenize the inventory, composite glaciers with clear boundaries (front, edges, and distinguishable flow patterns) were identified. Although these discrepancies reflect challenges inherent in manual mapping (Brardinoni et al., 2019), statistical analyses show general agreement: Bias < 0.02 km2, 95 % of differences within ±0.15 km2. This internal consistency is further supported by Intraclass Correlation Coefficients (ICC) exceeding 0.95 for key attributes (area, elevation, slope), confirming excellent consistency among mappers. Uncertainty associated with minimum, maximum, and mean elevation values was found to be very low, well within the limits recommended by the IPA (≤ 10 %). This suggests a robust and internally consistent mapping procedure, particularly for topographic attribute extraction.
6.3.2 Temporal limitations and activity classification
The PRoGI v1.0 inventory compiles rock glaciers observed in imagery primarily from 2017 through 2025 (most Bing images ∼ 2024, Google ∼ 2017; see Table 1 for details). Given ongoing climate warming during this period, it is possible that some rock glaciers classified as active based purely on their surface morphology may in fact be very sluggish or already transitional but not yet exhibiting those characteristics. Direct kinematic data (e.g., InSAR or GPS) would be necessary to definitively confirm current activity, and such analyses are planned for future work (see Conclusions). Our classification strategy adopted a conservative approach: if there was doubt, rock glaciers were classified as transitional (or relict) rather than active. Consequently, the count of “active” rock glaciers in this inventory should perhaps be considered a minimum estimate of truly ice-rich, moving landforms in Peru at the time of imagery acquisition.
6.3.3 Limitations of auxiliary data
The climate variables (MAAT, AP) used from CHELSA are model-based and at 0.1° resolution, which can smooth out important microclimates. For instance, a rock glacier located in a deeply shaded valley might experience colder conditions than the grid-averaged MAAT suggests. This discrepancy could introduce some noise in the climate correlation analysis, although the broad trends observed remain robust. Similarly, the Obu et al. (2019) MAGT data at 1 km resolution may not accurately capture small cold-air pools or the precise thermal state under thick debris. While general correlations between rock glaciers and these topoclimatic variables are reported, users should exercise caution against over-interpreting the absence or presence of any single rock glacier solely based on these grid values.
6.3.4 Two-dimensional mapping and volumetric estimates
This inventory is inherently two-dimensional, focusing on planform outlines. Direct measurements of ice thickness or volumetric content were beyond the scope of this study. As a result, PRoGI v1.0 alone cannot provide total ice volume or water equivalent estimates. For such applications, the inventory would need to be combined with assumptions or models of ice content (e.g., utilizing the empirical 15 %–70 % ice by volume range; Halla et al., 2021). This is recognized as an anticipated next step and a crucial future application of the inventory, but it falls outside the current scope of this data paper.
Despite the inherent challenges and documented uncertainties, the manually curated PRoGI v1.0 stands as a reliable and robust foundation for rock glacier research in the Peruvian Andes. The detailed uncertainty assessment, including the inter-analyst variability analysis, confirms the high consistency and reproducibility of our mapping procedure, particularly for topographic attribute extraction. While some degree of subjectivity is inevitable in manual digitizing, openly documenting these uncertainties ensures transparency and guides users in appropriate data application.
In comparison to similar inventories globally (e.g., in the Alps or High Mountain Asia), this Peruvian inventory is notable as one of the few covering an entire country in the tropics. It is anticipated that this dataset will be refined as new data and methodologies emerge. For instance, future work could explore the application of semi-automated mapping or deep learning techniques, such as those employed by Sun et al. (2024) on the Tibetan Plateau, to potentially further reduce subjectivity and detect even smaller landforms. For now, PRoGI v1.0 significantly improves upon previous knowledge, providing a critical baseline with quantified uncertainty bounds upon which future improvements can be built.
6.4 Significance of the inventory and future work
To our knowledge, PRoGI v1.0 is the most extensive rock glacier inventory compiled in the tropical Andes to date, and it is comparable in scope and detail to state-of-the-art inventories in other regions. By adhering to uniform mapping standards, it provides a coherent dataset that researchers and policymakers can use with confidence. The inventory not only fills a data gap for Peru but also serves as a benchmark for future monitoring: for instance, it establishes baseline extents and classifications against which changes (e.g., rock glacier retreat or activation/inactivation) can be measured in coming decades. One important implication of this work is the integration of Peruvian rock glaciers into global networks. Because we followed the IPA Rock Glacier Inventory (RGI) scheme, our data can feed into the Global Terrestrial Network for Permafrost (GTN-P) and related efforts to map permafrost features worldwide. This opens opportunities for interhemispheric-scale analyses, such as comparing rock glacier density and characteristics between the Andes and the Alps or Himalaya, to see how different climates yield different permafrost responses. The finding that Peruvian rock glaciers are among the highest in the world could be an interesting factor in this type of comparison, potentially useful for validating climate models and climate change indicators in high tropical mountains.
From an applied perspective, PRoGI v1.0 is also significant in Peru for natural resource management and hazard mitigation. Rock glaciers store water in frozen form and slowly release it, which can sustain baseflows in arid areas during dry seasons (Jones et al., 2018a). This inventory's maps of rock glacier locations and estimated extents allow hydrologists to include these landforms in water resource assessments, particularly for southern Peru where they may contribute non-trivial to streams dry-season flow (Schaffer et al., 2019).
Additionally, as climate warms, there is concern that destabilization of rock glaciers, through ice melt or permafrost thaw in adjacent steep rock walls, could pose risks in the form of landslides or debris flows. By identifying which rock glaciers are transitional or likely degrading, the inventory dataset helps pinpoint locations that might experience increased geomorphological activity. This information can support decision-making by agencies such as Emergency Operations Centers (COE) at the local, regional, and national levels, as well as public institutions like ANA and INAIGEM, by helping prioritize specific watersheds for detailed hazard assessments. This work has effectively been provided a country-wide inventory for climate adaptation planning, something that did not exist before.
-
Although it is unlikely in the current warming trend, perhaps small protalus features might start creeping. Also, the application of InSAR (Interferometric Synthetic Aperture Radar) data could directly measure surface velocities of rock glaciers. This would allow validation of the active vs. transitional classifications and might identify a subset of “active” rock glaciers with significant movement (> 1 cm yr−1). It is planned to use Sentinel-1 InSAR data as well as high-resolution DEM differencing in a follow-up study. Field validation: fieldwork is essential to truly confirm ice presence. Targeted field investigations are proposed on a few accessible rock glaciers in each subregion. Techniques such as Ground Penetrating Radar (GPR) or borehole drilling can confirm ice thickness. Field observations can also refine our understanding of surface characteristics (e.g., checking for springs at fronts, vegetation differences) that might distinguish transitional vs. relict in marginal cases. Such ground truth would improve interpretation of remote sensing data.
-
Climate/permafrost modelling: with this inventory, models of permafrost distribution in the tropical Andes can be calibrated. For example, one could run a permafrost model forced by observational data and see if it predicts permafrost where we see rock glaciers. Conversely, using the rock glacier locations as input, one can attempt to reconstruct paleoclimate conditions that would have allowed them to form in currently marginal areas (similar to what Rangecroft et al., 2014 did for Bolivia). This could yield insight into late Holocene climate fluctuations in Peru.
-
Expansion to a global inventory: finally, PRoGI v1.0 can contribute to the anticipated global rock glacier inventory that the IPA action group is working towards. By ensuring our data is formatted according to their specifications, we effectively add the tropical Andes piece to that puzzle. As global datasets (like the one by Sun et al., 2024 for Tibet) become available, comparative studies can assess, for instance, how tropical rock glaciers differ in average size or elevation from similar landforms in other ranges and latitudes.
Finally, the establishment of this dataset is a major step for Andean geoscience and cryosphere research. It creates a platform for diverse investigations – from basic permafrost science to practical applications in water management. We stress that the inventory is not static: it will be updated as new imagery and techniques arise, ensuring it remains a relevant and accurate resource. By doing so, we aim to keep the scientific community and decision-makers equipped with the latest knowledge on where and how much permafrost exists in the Peruvian Andes, and how it is evolving in our changing climate.
The PRoGI v1.0 dataset is available from the PANGAEA repository at:
-
Geopackages (footprint and Primary markers): https://doi.org/10.1594/PANGAEA.983251 (Medina et al., 2025a).
-
CSV file with Geomorphological and topoclimatic characteristics: https://doi.org/10.1594/PANGAEA.983295 (Medina et al., 2025b).
This study presents the first comprehensive inventory of rock glaciers in the Peruvian Andes – the Peruvian Rock Glacier Inventory v1.0 (PRoGI v1.0) – comprising 2338 rock glaciers across a total area of 94.09 ± 0.05 km2 . Developed following internationally recognized IPA guidelines, PRoGI v1.0 addresses a critical data gap in the tropical Andes and provides a standardized baseline for scientific and environmental applications.
Key contributions and implications:
-
Benchmark dataset. PRoGI v1.0 establishes a much-needed benchmark for mountain permafrost in Peru. The inventory reveals distinct spatial patterns: rock glaciers are heavily concentrated in the southern Peruvian Andes (SDOT and SWOT subregions) at elevations of ∼ 4800–5200 m a.s.l., predominantly on south- to southwest-facing slopes. These patterns reflect the sensitivity of periglacial features to the interplay of local climate (temperature and precipitation) and topography. The absence or scarcity of rock glaciers in the northern Andes highlights the climatic conditions necessary for their existence. This dataset thus provides insight into the current extent of permafrost-related landforms under ongoing climate conditions.
-
Global integration. By adhering to the standard protocols of the IPA Action Group, our inventory is fully interoperable with rock glacier inventories from other regions. This interoperability means Peruvian data can be directly compared or merged with data from, e.g., the European Alps or Himalayas. As a result, PRoGI v1.0 contributes to broader efforts like the Rock Glacier Inventory and Kinematics (RGIK) initiative. It enables researchers to include tropical Andean permafrost in comparative studies, improving our understanding of how rock glacier characteristics vary across different mountain systems and climatic zones.
-
Environmental management. The nationwide scope of the inventory has practical implications. For water resource management, PRoGI v1.0 pinpoints where hidden ice reserves exist in the Andes (outside of glaciers). This information can feed into hydrological models, especially in arid regions of southern Peru where rock glacier meltwater may sustain dry-season streamflow. For hazard assessment, the inventory identifies numerous steeps, ice-cored landforms; as climate warms, some of these could destabilize under continued warming, thus warranting monitoring. Government agencies (e.g., ANA, CENEPRED) can use this publicly available dataset as a decision-support tool to prioritize field investigations or adaptation measures in high mountain areas sensitive to permafrost changes.
While PRoGI v1.0 is a major step forward, we note that it represents a snapshot in time of rock glacier distribution. Given the continued climate warming, the state of some rock glaciers will evolve – for example, currently transitional rock glaciers may become relict in the coming decades. Therefore, we envisage the inventory as dynamic: it will be updated as new data and techniques become available. Future improvements will include the integration of InSAR-based kinematics to directly measure rock glacier movement, which will refine the activity classifications by providing independent velocity data (RGIK, 2023). We also plan to incorporate next-generation high-resolution optical datasets (e.g., Planet or forthcoming sub-meter satellites) to detect any smaller landforms and to improve boundary precision. Furthermore, periodic updates (e.g., PRoGI v2.0 in a few years) will document changes in rock glacier extent or activity, thereby serving as a monitoring tool for the effects of climate change on Peru's cryosphere. Field campaigns will complement these efforts by validating the presence of ice and monitoring ground temperatures at selected sites.
In conclusion, the PRoGI v1.0 dataset provides an essential foundation for advancing our understanding of permafrost in the tropical Andes. It delivers both the big-picture view (national distribution patterns) and the fine details (individual landform characteristics) needed for cross-disciplinary research. We expect that this inventory will spur new research on Andean permafrost dynamics, contribute valuable data to global assessments of mountain cryosphere, and inform local strategies for water resource management and hazard mitigation in a warming world.
The supplement related to this article is available online at https://doi.org/10.5194/essd-18-345-2026-supplement.
KM led the study and contributed to conceptualization, data curation, methodology design, visualization, and wrote the manuscript draft. HL co-led conceptualization performed data curation and GIS analyses and co-wrote the original draft. EL contributed to study design, supervised the project, and participated in writing – review and editing. EBR contributed to data curation (especially field data integration) and methodology and assisted with writing – review and editing. XB advised on methodology (especially regarding IPA standards) and supervision and contributed to writing – review and editing. JU provided expertise in analysis and interpretation, supervised aspects of the research, and contributed to writing – review and editing.
The contact author has declared that none of the authors has any competing interests.
Publisher's note: Copernicus Publications remains neutral with regard to jurisdictional claims made in the text, published maps, institutional affiliations, or any other geographical representation in this paper. The authors bear the ultimate responsibility for providing appropriate place names. Views expressed in the text are those of the authors and do not necessarily reflect the views of the publisher.
We thank all colleagues and institutions that supported this work. Sebastián Vivero, Guillermo Azócar, Christian Huggel, and Lidia Ferri are especially thanked for their valuable comments and suggestions during the development of the inventory. The research team is also grateful to Hildebrant Flores, Ricardo Valverde, and Alex Mendoza for their collaboration in field data collection and insights into local periglacial conditions. We also appreciate the constructive feedback from the 16 external reviewers (listed in Table S1) who rigorously evaluated the draft inventory; their input greatly improved the quality of the final dataset.
This research was supported by the project “Permafrost: rock walls and rock glaciers as water regulators and risk generators in Peru in a context of climate change (PermaPeru)”, which is funded by CONCYTEC-PROCIENCIA (Contract no. PE501089264-2024-PROCIENCIA). Additional support was provided by the Research Center for Environmental Earth Science and Technology (ESAT) of the Universidad Nacional Santiago Antúnez de Mayolo (UNASAM), through its Mountain Ecosystems and Permafrost Research Group (PAMEC).
This paper was edited by Achim A. Beylich and reviewed by Francesco Brardinoni and one anonymous referee.
Abdullah, T. and Romshoo, S. A.: A Comprehensive Inventory, Characterization, and Analysis of Rock Glaciers in the Jhelum Basin, Kashmir Himalaya, Using High-Resolution Google Earth Data, Water, 16, 2327, https://doi.org/10.3390/w16162327, 2024.
Aguilar-Lome, J., Espinoza-Villar, R., Espinoza, J. C., Rojas-Acuña, J., Willems, B. L., and Leyva-Molina, W. M.: Elevation-dependent warming of land surface temperatures in the Andes assessed using MODIS LST time series (2000–2017), Int. J. Appl. Earth Obs. Geoinf., 77, 119–128, https://doi.org/10.1016/j.jag.2018.12.013, 2019.
Ahumada, A., Ibáñez, G., Toledo, M., Carilla, J., and Páez, S.: El permafrost reptante, inventario y verificación en las cabeceras del río Bermejo, Geoacta, 39, 123–137, 2014.
ANA: Map of hydrographic basins of Peru, Lima, https://www.ana.gob.pe/normatividad/7-mapa-hidrografico-del-peru-0 (last access: 8 December 2025), 2003.
Anderson-Teixeira, K. J., Davies, S. J., Bennett, A. C., Gonzalez-Akre, E. B., Muller-Landau, H. C., Joseph Wright, S., Abu Salim, K., Almeyda Zambrano, A. M., Alonso, A., Baltzer, J. L., Basset, Y., Bourg, N. A., Broadbent, E. N., Brockelman, W. Y., Bunyavejchewin, S., Burslem, D. F. R. P., Butt, N., Cao, M., Cardenas, D., Chuyong, G. B., Clay, K., Cordell, S., Dattaraja, H. S., Deng, X., Detto, M., Du, X., Duque, A., Erikson, D. L., Ewango, C. E. N., Fischer, G. A., Fletcher, C., Foster, R. B., Giardina, C. P., Gilbert, G. S., Gunatilleke, N., Gunatilleke, S., Hao, Z., Hargrove, W. W., Hart, T. B., Hau, B. C. H., He, F., Hoffman, F. M., Howe, R. W., Hubbell, S. P., Inman-Narahari, F. M., Jansen, P. A., Jiang, M., Johnson, D. J., Kanzaki, M., Kassim, A. R., Kenfack, D., Kibet, S., Kinnaird, M. F., Korte, L., Kral, K., Kumar, J., Larson, A. J., Li, Y., Li, X., Liu, S., Lum, S. K. Y., Lutz, J. A., Ma, K., Maddalena, D. M., Makana, J. R., Malhi, Y., Marthews, T., Mat Serudin, R., Mcmahon, S. M., McShea, W. J., Memiaghe, H. R., Mi, X., Mizuno, T., Morecroft, M., Myers, J. A., Novotny, V., de Oliveira, A. A., Ong, P. S., Orwig, D. A., Ostertag, R., den Ouden, J., Parker, G. G., Phillips, R. P., Sack, L., Sainge, M. N., Sang, W., Sri-ngernyuang, K., Sukumar, R., Sun, I. F., Sungpalee, W., Suresh, H. S., Tan, S., Thomas, S. C., Thomas, D. W., Thompson, J., Turner, B. L., Uriarte, M., Valencia, R., Vallejo, M. I., Vicentini, A., Vrška, T., Wang, X., Wang, X., Weiblen, G., Wolf, A., Xu, H., Yap, S., and Zimmerman, J.: CTFS-ForestGEO: A worldwide network monitoring forests in an era of global change, Glob. Chang. Biol., 21, 528–549, https://doi.org/10.1111/gcb.12712, 2015.
Andrés, N., Palacios, D., Úbeda, J., and Alcalá, J.: Ground thermal conditions at Chachani volcano, southern Peru, Geogr. Ann. Ser. A Phys. Geogr., 93, 151–162, https://doi.org/10.1111/j.1468-0459.2011.00424.x, 2011.
Azocar, G.: Modeling of Permafrost Distribution in the Semi-arid Chilean Andes, University of Waterloo, 160 pp., https://uwspace.uwaterloo.ca/items/7d414b75-235c-4839-a40e-949e67afb4d1 (last access: 8 December 2025), 2013.
Azócar, G. F. and Brenning, A.: Hydrological and geomorphological significance of rock glaciers in the dry Andes, Chile (27° −33° S), Permafrost Periglac. Process., 21, 42–53, https://doi.org/10.1002/ppp.669, 2010.
Badillo-Rivera, E., Loarte, E., Medina, K., Bodin, X., Azócar, G., and Cusicanqui, D.: An Estimation of Past and Present Air Temperature Conditions, Water Equivalent, and Surface Velocity of Rock Glaciers in Cordillera Volcanica, Peru, in: Permafrost 2021, 105–116, https://doi.org/10.1061/9780784483589.010, 2021.
Baroni, C., Carton, A., and Seppi, R.: Distribution and behaviour of rock glaciers in the Adamello-Presanella massif (Italian Alps), Permafrost Periglac. Process., 15, 243–259, https://doi.org/10.1002/ppp.497, 2004.
Barsch, D.: Rockglaciers: Indicators for the present and former geoecology in high mountain environments, edited by: Douglas, I. and Marcus, M., Springer Series, Berlin, 175 pp., https://doi.org/10.1007/978-3-642-80093-1_11, 1996.
Bhat, I. A., Rashid, I., Ramsankaran, R., Banerjee, A., and Vijay, S.: Inventorying rock glaciers in the Western Himalaya, India, and assessing their hydrological significance, Geomorphology, 471, 109514, https://doi.org/10.1016/j.geomorph.2024.109514, 2025.
Biskaborn, B. K., Smith, S. L., Noetzli, J., Matthes, H., Vieira, G., Streletskiy, D. A., Schoeneich, P., Romanovsky, V. E., Lewkowicz, A. G., Abramov, A., Allard, M., Boike, J., Cable, W. L., Christiansen, H. H., Delaloye, R., Diekmann, B., Drozdov, D., Etzelmüller, B., Grosse, G., Guglielmin, M., Ingeman-Nielsen, T., Isaksen, K., Ishikawa, M., Johansson, M., Johannsson, H., Joo, A., Kaverin, D., Kholodov, A., Konstantinov, P., Kröger, T., Lambiel, C., Lanckman, J. P., Luo, D., Malkova, G., Meiklejohn, I., Moskalenko, N., Oliva, M., Phillips, M., Ramos, M., Sannel, A. B. K., Sergeev, D., Seybold, C., Skryabin, P., Vasiliev, A., Wu, Q., Yoshikawa, K., Zheleznyak, M., and Lantuit, H.: Permafrost is warming at a global scale, Nat. Commun., 10, 1–11, https://doi.org/10.1038/s41467-018-08240-4, 2019.
Bland, J. M. and Altman, D. G.: Statistical methods for assessing agreement between two methods of clinical measurement, Lancet, 327, 307–310, 1986.
Bonshoms, M., Álvarez-Garcia, F. J., Ubeda, J., Cabos, W., Quispe, K., and Liguori, G.: Dry season circulation-type classification applied to precipitation and temperature in the Peruvian Andes, Int. J. Climatol., 1–19, https://doi.org/10.1002/joc.6593, 2020.
Brardinoni, F., Scotti, R., Sailer, R., and Mair, V.: Evaluating sources of uncertainty and variability in rock glacier inventories, Earth Surf. Process. Landforms, 44, 2450–2466, https://doi.org/10.1002/esp.4674, 2019.
Brenning, A.: Geomorphological, hydrological and climatic significance of rock glaciers in the Andes of Central Chile (33-35° S), Permafrost Periglac. Process., 16, 231–240, https://doi.org/10.1002/ppp.528, 2005.
Brighenti, S., Hotaling, S., Finn, D. S., Fountain, A. G., Hayashi, M., Herbst, D., Saros, J. E., Tronstad, L. M., and Millar, C. I.: Rock glaciers and related cold rocky landforms: Overlooked climate refugia for mountain biodiversity, Glob. Change Biol., 27, 1504–1517, https://doi.org/10.1111/gcb.15510, 2021.
Charbonneau, A. A. and Smith, D. J.: An inventory of rock glaciers in the central British Columbia Coast Mountains, Canada, from high resolution Google Earth imagery, Arct. Antarct. Alp. Res., 50, https://doi.org/10.1080/15230430.2018.1489026, 2018.
Colucci, R. R., Boccali, C., Žebre, M., and Guglielmin, M.: Rock glaciers, protalus ramparts and pronival ramparts in the south-eastern Alps, Elsevier B.V., 112–121, https://doi.org/10.1016/j.geomorph.2016.06.039, 2016.
DGA: Inventario Público de Glaciares 2022, Santiago de Chile, https://dga.mop.gob.cl/inventario-publico-glaciares (last access: 8 December 2025), 2022.
Drewes, J., Moreiras, S., and Korup, O.: Permafrost activity and atmospheric warming in the Argentinian Andes, Geomorphology, 323, 13–24, https://doi.org/10.1016/j.geomorph.2018.09.005, 2018.
Esper Angillieri, M. Y.: Permafrost distribution map of San Juan Dry Andes (Argentina) based on rock glacier sites, J. South Am. Earth Sci., 73, 42–49, https://doi.org/10.1016/j.jsames.2016.12.002, 2017.
Falaschi, D., Castro, M., Masiokas, M., Tadono, T., and Ahumada, A. L.: Rock Glacier Inventory of the Valles Calchaquíes Region (∼ 25° S), Salta, Argentina, Derived from ALOS Data, Permafrost Periglac. Process., 25, 69–75, https://doi.org/10.1002/ppp.1801, 2014.
Falaschi, D., Tadono, T., and Masiokas, M.: Rock Glaciers in the Patagonian Andes: An Inventory for the Monte San Lorenzo (Cerro Cochrane) Massif, 47° S, Geogr. Ann. Ser. A Phys. Geogr., 97, 769–777, https://doi.org/10.1111/geoa.12113, 2015.
Falaschi, D., Masiokas, M., Tadono, T., and Couvreux, F.: ALOS-derived glacier and rock glacier inventory of the Volcán Domuyo region (∼ 36° S), southernmost Central Andes, Argentina, Z. Geomorphol., 60, 195–208, https://doi.org/10.1127/zfg/2016/0319, 2016.
French, H.: The Periglacial Environment, 4th Edn., John Wiley & Sons, Ltd, ISBN 978-1-119-13278-3, 2017.
García, A., Ulloa, C., Amigo, G., Milana, J. P., and Medina, C.: An inventory of cryospheric landforms in the arid diagonal of South America (high Central Andes, Atacama region, Chile), Quaternary Int., 438, 4–19, https://doi.org/10.1016/j.quaint.2017.04.033, 2017.
Garreaud, R. D.: The Andes climate and weather, Adv. Geosci., 22, 3–11, https://doi.org/10.5194/adgeo-22-3-2009, 2009.
Gruber, S. and Haeberli, W.: Permafrost in steep bedrock slopes and its temperature-related destabilization following climate change Permafrost in steep bedrock slopes and its temperature-related destabilization following climate change, J. Geophys. Res., 112, F02S18, https://doi.org/10.1029/2006JF000547, 2007.
Haeberli, W., Kääb, A., Wagner, S., Vonder Mühll, D., Geissler, P., Haas, J. N., Glatzel-Mattheier, H., and Wagenbach, D.: Pollen analysis and 14C age of moss remains in a permafrost core recovered from the active rock glacier Murtèl-Corvatsch, Swiss Alps: geomorphological and glaciological implications, Journal of Glaciology, 45, 1–8, https://doi.org/10.3189/S0022143000002975, 1999.
Haeberli, W., Schaub, Y., and Huggel, C.: Increasing risks related to landslides from degrading permafrost into new lakes in deglaciating mountain ranges, Geomorphology, 293, 405–417, https://doi.org/10.1016/j.geomorph.2016.02.009, 2017.
Halla, C., Blöthe, J. H., Tapia Baldis, C., Trombotto Liaudat, D., Hilbich, C., Hauck, C., and Schrott, L.: Ice content and interannual water storage changes of an active rock glacier in the dry Andes of Argentina, The Cryosphere, 15, 1187–1213, https://doi.org/10.5194/tc-15-1187-2021, 2021.
Haq, M. A. and Baral, P.: Study of permafrost distribution in Sikkim Himalayas using Sentinel-2 satellite images and logistic regression modelling, Geomorphology, 333, 123–136, https://doi.org/10.1016/j.geomorph.2019.02.024, 2019.
Harrison, S., Whalley, B., and Anderson, E.: Relict rock glaciers and protalus lobes in the British Isles: implications for Late Pleistocene mountain geomorphology and palaeoclimate, J. Quaternary Sci., 23, 287–304, https://doi.org/10.1002/jqs.1148, 2008.
Humlum, O.: Rock glacier types on Disko,Central West Greenland, Geogr. Tidsskr. J. Geogr., 82, 59–66, https://doi.org/10.1080/00167223.1982.10649152, 1982.
IANIGLA: Resumen ejecutivo de los resultados del Inventario Nacional de Glaciares, Buenos Aires, 27 pp., https://www.glaciaresargentinos.gob.ar/wp-content/uploads/resultados_finales/informe_resumen_ejecutivo_APN_11-05-2018.pdf (last access: 8 December 2025), 2018.
IGN: Límites departamentales referenciales, Lima, https://datosabiertos.gob.pe/dataset/limites-departamentales (last access: 8 December 2025, 2023.
INAIGEM: Memoria descriptiva del Inventario Nacional de Glaciares y Laguna de Origen Glaciar del Perú, Huaraz, 187 pp., https://repositorio.inaigem.gob.pe/items/7029db53-5118-4e93-8b2a-71e6e26db5f6 (last access: 10 November 2025), 2023.
INGEMMET: Mapa Geológico del Perú a escala 1:1 000 000, Lima, https://portal.ingemmet.gob.pe/web/guest/mapa-geologico-nacional (last access: 10 November 2025), 2022.
IPCC: Global Warming of 1.5 °C, edited by: Masson-Delmotte, V., Zhai, P., Pörtner, H. O., Roberts, D., Skea, P., Sukla, P. R., Pirani, A., Moufouma-Okia, W., Péan, C., Pidcock, R., Connors, S., Matthews, J. B. R., Chen, Y., Zhou, X., Gomis, M. I., Lonnoy, E., Maycock, T., Tignor, M., and Waterfield, T., Cambridge University Press, 631 pp., https://doi.org/10.1017/9781009157940, 2022.
Janke, J. R.: Colorado front range rock glaciers: Distribution and topographic characteristics, Arct. Antarct. Alp. Res., 39, 74–83, https://doi.org/10.1657/1523-0430(2007)39[74:CFRRGD]2.0.CO;2, 2007.
Janke, J. R., Ng, S., and Bellisario, A.: An inventory and estimate of water stored in firn fields, glaciers, debris-covered glaciers, and rock glaciers in the Aconcagua River Basin, Chile, Geomorphology, https://doi.org/10.1016/j.geomorph.2017.09.002, 2017.
Jones, D. B., Harrison, S., Anderson, K., and Betts, R. A.: Mountain rock glaciers contain globally significant water stores, Sci. Rep., 8, 2834, https://doi.org/10.1038/s41598-018-21244-w, 2018a.
Jones, D. B., Harrison, S., Anderson, K., Selley, H. L., Wood, J. L., and Betts, R. A.: The distribution and hydrological significance of rock glaciers in the Nepalese Himalaya, Glob. Planet. Change, 160, 123–142, https://doi.org/10.1016/j.gloplacha.2017.11.005, 2018b.
Jones, D. B., Harrison, S., Anderson, K., Shannon, S., and Betts, R. A.: Rock glaciers represent hidden water stores in the Himalaya, Sci. Total Environ., 145368, https://doi.org/10.1016/j.scitotenv.2021.145368, 2021.
Jorgenson, M. T., Romanovsky, V., Harden, J., Shur, Y., O'Donnell, J., Schuur, E. A. G., Kanevskiy, M., and Marchenko, S.: Resilience and vulnerability of permafrost to climate change, Can. J. For. Res., 40, 1219–1236, https://doi.org/10.1139/X10-060, 2010.
Kääb, A., Strozzi, T., Bolch, T., Caduff, R., Trefall, H., Stoffel, M., and Kokarev, A.: Inventory and changes of rock glacier creep speeds in Ile Alatau and Kungöy Ala-Too, northern Tien Shan, since the 1950s, The Cryosphere, 15, 927–949, https://doi.org/10.5194/tc-15-927-2021, 2021.
Karger, D. N., Conrad, O., Böhner, J., Kawohl, T., Kreft, H., Soria-Auza, R. W., Zimmermann, N. E., Linder, H. P., and Kessler, M.: Climatologies at high resolution for the earth's land surface areas, Sci. Data, 4, 170122, https://doi.org/10.1038/sdata.2017.122, 2017.
Kellerer-Pirklbauer, A., Lieb, G. K., and Kleinferchner, H.: A new rock glacier inventory of the eastern European Alps, Austrian J. Earth Sci., 105, 78–93, 2012.
Krainer, K. and Ribis, M.: A rock glacier inventory of the tyrolean alps (Austria), Austrian J. Earth Sci., 105, 32–47, 2012.
León, H., Medina, K., Loarte, E., Azócar, G., Iribarren, P., and Huggel, C.: Mountain Permafrost in the Tropical Andes of Peru: The 0 °C Isotherm as a Potential Indicator, in: Permafrost 2021, 117–129, https://doi.org/10.1061/9780784483589.011, 2021.
Marcer, M., Bodin, X., Brenning, A., Schoeneich, P., Charvet, R., and Gottardi, F.: Permafrost Favorability Index: Spatial Modeling in the French Alps Using a Rock Glacier Inventory, Front. Earth Sci., 5, 1–17, https://doi.org/10.3389/feart.2017.00105, 2017.
Matthews, J., Shakesby, R., Owen, G., and Vater, A.: Pronival rampart formation in relation to snow-avalanche activity and Schmidt-hammer exposure-age dating (SHD): Three case studies from southern Norway, Geomorphology, 130, 280–288, https://doi.org/10.1016/j.geomorph.2011.04.010, 2011.
Medina, K., León, H., Badillo-Rivera, E., Loarte, E., Bodin, X., and Úbeda, J.: Geomorphological and topoclimatic characteristics of the Peruvian Andes Rock Glacier Inventory (PRoGI), PANGAEA [data set], https://doi.org/10.1594/PANGAEA.983295, 2025a.
Medina, K., León, H., Badillo-Rivera, E., Loarte, E., Bodin, X., and Úbeda, J.: Peruvian Andes Rock Glacier Inventory (PRoGI) geopackage, PANGAEA [data set], https://doi.org/10.1594/PANGAEA.983251, 2025b.
Obu, J., Westermann, S., Kääb, A., and Bartsch, A.: Ground Temperature Map, 2000–2016, Andes, New Zealand and East African Plateau Permafrost, PANGEA [data set], https://doi.org/10.1594/PANGAEA.905512, 2019.
Palacios, D., Hughes, P. D., García-Ruiz, J. M., and Andrés, N.: The Quaternary ice ages, In European Glacial Landscapes, Elsevier, 9–18, https://doi.org/10.1016/B978-0-12-823498-3.00006-6, 2022.
Pandey, P.: Inventory of rock glaciers in Himachal Himalaya, India using high-resolution Google Earth imagery, Geomorphology, 340, 103–115, https://doi.org/10.1016/j.geomorph.2019.05.001, 2019.
Perucca, L. and Esper Angillieri, M. Y.: Glaciers and rock glaciers' distribution at 28° SL, Dry Andes of Argentina, and some considerations about their hydrological significance, Environ. Earth Sci., 64, 2079–2089, https://doi.org/10.1007/s12665-011-1030-z, 2011.
Rangecroft, S., Harrison, S., Anderson, K., Magrath, J., Castel, A. P., and Pacheco, P.: A First Rock Glacier Inventory for the Bolivian Andes, Permafrost Periglac. Process., 25, 333–343, https://doi.org/10.1002/ppp.1816, 2014.
Rangecroft, S., Harrison, S., and Anderson, K.: Rock Glaciers as Water Stores in the Bolivian Andes: An Assessment of Their Hydrological Importance, Arct. Antarct. Alp. Res., 47, 89–98, https://doi.org/10.1657/AAAR0014-029, 2015.
RGIK: Guidelines for inventorying rock glaciers: baseline and practical concepts (version 1.0), Friburgo, 26 pp., https://doi.org/10.51363/unifr.srr.2023.002, 2023.
Robson, B. A., Bolch, T., MacDonell, S., Hölbling, D., Rastner, P., and Schaffer, N.: Automated detection of rock glaciers using deep learning and object-based image analysis, Remote Sens. Environ., 250, 112033, https://doi.org/10.1016/j.rse.2020.112033, 2020.
Roer, I., Kääb, A., and Dikau, R.: Rockglacier acceleration in the Turtmann valley (Swiss Alps): Probable controls, Nor. Geogr. Tidsskr., 59, 157–163, https://doi.org/10.1080/00291950510020655, 2005.
Rosenqvist, A., Shimada, M., Ito, N., and Watanabe, M.: ALOS PALSAR: A Pathfinder Mission for Global-Scale Monitoring of the Environment, IEEE Trans. Geosci. Remote Sens., 45, 3307–3316, https://doi.org/10.1109/TGRS.2007.901027, 2007.
Sagredo, E. A. and Lowell, T. V.: Climatology of Andean glaciers: A framework to understand glacier response to climate change, Glob. Planet. Change, 86–87, 101–109, https://doi.org/10.1016/j.gloplacha.2012.02.010, 2012.
Sattler, K.: Periglacial preconditioning of debris flows in the Southern Alps, New Zealand, 276 pp., https://doi.org/10.1007/978-3-642-35133-4, 2016.
Scapozza, C., Lambiel, C., Baron, L., Marescot, L., and Reynard, E.: Internal structure and permafrost distribution in two alpine periglacial talus slopes, Valais, Swiss Alps, Geomorphology, 132, 208-221, https://doi.org/10.1016/j.geomorph.2011.05.010, 2011.
Schaffer, N., MacDonell, S., Réveillet, M., Yáñez, E., and Valois, R.: Rock glaciers as a water resource in a changing climate in the semiarid Chilean Andes, Reg. Environ. Chang., 19, 1263–1279, https://doi.org/10.1007/s10113-018-01459-3, 2019.
Scotti, R., Brardinoni, F., Alberti, S., Frattini, P., and Crosta, G. B.: A regional inventory of rock glaciers and protalus ramparts in the central Italian Alps, Geomorphology, 186, 136–149, https://doi.org/10.1016/j.geomorph.2012.12.028, 2013.
Scotti, R., Mair, V., Costantini, D., and Brardinoni F.: A high-resolution rock glacier inventory of South Tyrol: Evaluating lithologic, topographic, and climatic effects, in: 12th International Conference on Permafrost, 16-2-0 June 2024, International Permafrost Association, 382–389, https://doi.org/10.52381/ICOP2024.176.1
Sun, Z., Hu, Y., Racoviteanu, A., Liu, L., Harrison, S., Wang, X., Cai, J., Guo, X., He, Y., and Yuan, H.: TPRoGI: a comprehensive rock glacier inventory for the Tibetan Plateau using deep learning, Earth Syst. Sci. Data, 16, 5703–5721, https://doi.org/10.5194/essd-16-5703-2024, 2024.
Tielidze, L. G., Cicoira, A., Nosenko, G. A., and Eaves, S. R.: The First Rock Glacier Inventory for the Greater Caucasus, Geosciences, 13, 117, https://doi.org/10.3390/geosciences13040117, 2023.
Van Everdingen, R.: Multi-language glossary of permafrost and related ground-ice terms in Chinese, English, French, German, Icelandic, Italian, Norwegian, polish, Romanian, Russian, Spanish, and Swedish, International Permafrost Association, Terminology Working Group, https://ucalgary.primo.exlibrisgroup.com/permalink/01UCALG_INST/1j63de0/alma991003184839704336 (last access: 8 December 2025), 1998.
Veettil, B. K., Wang, S., Simões, J. C., Ruiz Pereira, S. F., and de Souza, S. F.: Regional climate forcing and topographic influence on glacier shrinkage: eastern cordilleras of Peru, Int. J. Climatol., 38, 979–995, https://doi.org/10.1002/joc.5226, 2018.
Vuille, M., Carey, M., Huggel, C., Buytaert, W., Rabatel, A., Jacobsen, D., Soruco, A., Villacis, M., Yarleque, C., Elison Timm, O., Condom, T., Salzmann, N., and Sicart, J.-E.: Rapid decline of snow and ice in the tropical Andes – Impacts, uncertainties and challenges ahead, Earth-Sci. Rev., 176, 195–213, https://doi.org/10.1016/j.earscirev.2017.09.019, 2018.
Wirz, V., Gruber, S., Purves, R. S., Beutel, J., Gärtner-Roer, I., Gubler, S., and Vieli, A.: Short-term velocity variations at three rock glaciers and their relationship with meteorological conditions, Earth Surf. Dynam., 4, 103–123, https://doi.org/10.5194/esurf-4-103-2016, 2016.
Yoshikawa, K., Úbeda, J., Masías, P., Pari, W., Apaza, F., Vasquez, P., Ccallata, B., Concha, R., Luna, G., Iparraguirre, J., Ramos, I., De la Cruz, G., Cruz, R., Pellitero, R., and Bonshoms, M.: Current thermal state of permafrost in the southern Peruvian Andes and potential impact from El Niño–Southern Oscillation (ENSO), Permafrost Periglac. Process., 1–12, https://doi.org/10.1002/ppp.2064, 2020.